Indexlaunched in 2006, as well as the Los Angeles Expansion Market that we expect to
Financial StatementsBUSINESS
MetroPCS
launch in the second or third quarter of 2007. During the year ended December 31, 2005, we had $266.5 million in capital expenditures. These capital expenditures were primarily for the expansion and improvement of our existing network infrastructure and costs associated with the construction of the Tampa/Sarasota, Dallas/Ft. Worth and Detroit Expansion Markets.
Other Acquisitions and Dispositions. On April 19, 2004, we acquired four PCS licenses for an aggregate purchase price of $11.5 million. The PCS licenses cover 15 MHz of spectrum in each of the basic trading areas of Modesto, Merced, Eureka, and Redding, California.
On October 29, 2004, we acquired two PCS licenses for an aggregate purchase price of $43.5 million. The PCS licenses cover 10 MHz of spectrum in each of the basic trading areas of Tampa-St. Petersburg-Clearwater, Florida, and Sarasota-Bradenton, Florida.
On November 28, 2004, we executed a license purchase agreement by which we agreed to acquire 10 MHz of PCS spectrum in the basic trading area of Detroit, Michigan and certain counties of the basic trading area of Dallas/Ft. Worth, Texas for $230.0 million pursuant to a two-step, tax-deferred, like-kind exchange transaction under Section 1031 of the Internal Revenue Code of 1986, as amended.
On December 20, 2004, we acquired a PCS license for a purchase price of $8.5 million. The PCS license covers 20 MHz of PCS spectrum in the basic trading area of Daytona Beach, Florida.
On May 11, 2005, we completed the sale of a 10 MHz portion of our 30 MHz PCS license in the San Francisco — Oakland — San Jose basic trading area for cash consideration of $230.0 million. The sale was structured as a like-kind exchange under Section 1031 of the Internal Revenue Code of 1986, as amended, through which our right, title and interest in and to the divested PCS spectrum was exchanged for the PCS spectrum acquired in Dallas/Ft. Worth, Texas and Detroit, Michigan through a license purchase agreement for an aggregate purchase price of $230.0 million. The purchase of the PCS spectrum in Dallas/Ft. Worth and Detroit was accomplished in two steps with the first step of the exchange occurring on February 23, 2005 and the second step occurring on May 11, 2005 when we consummated the sale of 10 MHz of PCS spectrum for the San Francisco — Oakland — San Jose basic trading area. The sale of PCS spectrum resulted in a gain on disposal of asset in the amount of $228.2 million.
On July 7, 2005, we acquired a 10 MHz F-Block PCS license for Grayson and Fannin counties in the basic trading area of Sherman-Denison, Texas for an aggregate purchase price of $0.9 million.
On August 12, 2005, we closed on the purchase of a 10 MHz F-Block PCS license in the basic trading area of Bakersfield, California for an aggregate purchase price of $4.0 million.
On December 21, 2005, the FCC granted Royal Street 10 MHz of PCS spectrum in each of the Los Angeles, California; Orlando, Lakeland-Winter Haven, Jacksonville, Melbourne-Titusville, and Gainesville, Florida basic trading areas. Royal Street, as the high bidder in Auction 58, had paid approximately $294.0 million to the FCC for these PCS licenses.
On August 7, 2006, we acquired a 10 MHz PCS license in the basic trading area of Ocala, Florida in exchange for a 10 MHz portion of our 30 MHz PCS license in the basic trading area of Athens, Georgia. We are amongpaid $0.2 million at the fastest growing wireless communications providersclosing of this agreement.
On November 29, 2006, we were granted AWS licenses as a result of FCC Auction 66, for a total aggregate purchase price of approximately $1.4 billion. These new licenses cover six of the 25 largest metropolitan areas in the United States. The east coast expansion opportunities include the entire east coast corridor from Philadelphia to Boston, including New York City, as well as the entire states of New York, Connecticut and Massachusetts. In the western United States, the new expansion opportunities include the San Diego, Portland, Seattle and Las Vegas metropolitan areas. The balance supplements or expands the geographic boundaries of our existing operations in Dallas/Ft. Worth, Detroit, Los Angeles, San Francisco and Sacramento.
87
Off-Balance Sheet Arrangements
We do not have any off-balance sheet arrangements.
Contractual Obligations and Commercial Commitments
The following table provides aggregate information about our contractual obligations as of December 31, 2006. See Note 10 to our annual consolidated financial statements included elsewhere in this offering circular.
| | | | | | | | | | | | | | | | | | | | | |
| | | Payments Due by Period | |
| | | | | | Less Than
| | | 1 - 3
| | | 3 - 5
| | | More Than
| |
| | | Total | | | 1 Year | | | Years | | | Years | | | 5 Years | |
| | | (In thousands) | |
| |
Contractual Obligations: | | | | | | | | | | | | | | | | | | | | |
| Long-term debt, including current portion | | $ | 2,596,000 | | | $ | 16,000 | | | $ | 32,000 | | | $ | 32,000 | | | $ | 2,516,000 | |
| Interest expense on long-term debt(1) | | | 1,601,613 | | | | 218,185 | | | | 436,370 | | | | 436,370 | | | | 510,688 | |
| Operating leases | | | 728,204 | | | | 88,639 | | | | 180,873 | | | | 179,277 | | | | 279,415 | |
| | | | | | | | | | | | | | | | | | | | | |
| Total cash contractual obligations | | $ | 4,925,817 | | | $ | 322,824 | | | $ | 649,243 | | | $ | 647,647 | | | $ | 3,306,103 | |
| | | | | | | | | | | | | | | | | | | | | |
| | |
| (1) | | Interest expense on long-term debt includes future interest payments on outstanding obligations under our senior secured credit facility and 91/4% senior notes. The senior secured credit facility bears interest at a floating rate tied to a fixed spread to the London Inter Bank Offered Rate. The interest expense presented in this table is based on the rates at December 31, 2006 which was 7.875% for the senior secured credit facility. |
Inflation
We believe that inflation has not materially affected our operations.
Effect of New Accounting Standards
In February 2006, the FASB issued SFAS No. 155,“Accounting for Certain Hybrid Financial Instruments — an amendment of FASB Statements No. 133 and 140”(“SFAS No. 155”). SFAS No. 155 permits fair value remeasurement for any hybrid financial instrument that contains an embedded derivative that otherwise would require bifurcation, clarifies which interest-only strips and principal-only strips are not subject to the requirements of SFAS No. 133, establishes a requirement to evaluate interests in securitized financial assets to identify interests that are freestanding derivatives or that are hybrid financial instruments that contain an embedded derivative requiring bifurcation, clarifies that concentrations of credit risk in the form of subordination are not embedded derivatives, and amends FASB Statement No. 140 to eliminate the prohibition on a qualifying special purpose entity from holding a derivative financial instrument that pertains to a beneficial interest other than another derivative financial instrument. SFAS No. 155 is effective for all financial instruments acquired or issued after the beginning of an entity’s first fiscal year that begins after September 15, 2006. The adoption of this statement did not have any impact on our financial condition or results of operations.
In March 2006, the FASB issued SFAS No. 156,“Accounting for Servicing of Financial Assets — an amendment ofFASBStatement No. 140”(“SFAS No. 156”). SFAS No. 156 amends SFAS No. 140 to require that all separately recognized servicing assets and servicing liabilities be initially measured at fair value, if practicable. SFAS No. 156 permits, but does not require, the subsequent measurement of separately recognized servicing assets and servicing liabilities at fair value. Under SFAS No. 156, an entity can elect subsequent fair value measurement to account for its separately recognized servicing assets and servicing liabilities. Adoption of SFAS No. 156 is required as of the beginning of the first fiscal year that begins after September 15, 2006. The adoption of this statement did not have any impact on our financial condition or results of operations.
88
In July 2006, the FASB issued Interpretation No. 48“Accounting for Uncertainty in Income Taxes,”(“FIN No. 48”), which clarifies the accounting for uncertainty in income taxes recognized in the financial statements in accordance with SFAS No. 109. FIN No. 48 provides guidance on the financial statement recognition and measurement of a tax position taken or expected to be taken in a tax return. FIN No. 48 also provides guidance on derecognition, classification, interest and penalties, accounting in interim periods, disclosures, and transition. FIN No. 48 is effective for fiscal years beginning after December 15, 2006. The adoption of this Interpretation did not have a material effect on our financial condition or results of operations.
In September 2006, the Securities and Exchange Commission (“SEC”) issued Staff Accounting Bulletin No. 108, “Consideringthe Effects of Prior Year Misstatements When Quantifying Misstatements in the Current Year Financial Statements,”(“SAB 108”), which addresses how the effects of prior year uncorrected misstatements should be considered when quantifying misstatements in current year financial statements. SAB 108 requires companies to quantify misstatements using a balance sheet and income statement approach and to evaluate whether either approach results in quantifying an error that is material in light of relevant quantitative and qualitative factors. When the effect of initial adoption is material, companies may record the effect as a cumulative effect adjustment to beginning of year retained earnings. SAB 108 is effective for annual financial statements covering the first fiscal year ending after November 15, 2006. We adopted this interpretation as of December 31, 2006. The adoption of this statement did not have any impact on our financial condition or results of operations.
In September 2006, the FASB issued SFAS No. 157,“Fair Value Measurements,”(“SFAS No. 157”), which defines fair value, establishes a framework for measuring fair value in GAAP and expands disclosure about fair value measurements. SFAS No. 157 is effective for fiscal years beginning after November 15, 2007 and interim periods within those fiscal years. We will be required to adopt SFAS No. 157 in the first quarter of fiscal year 2008. We have not completed our evaluation of the effect of SFAS No. 157.
In February 2007, the FASB issued SFAS No. 159,“The Fair Value Option for Financial Assets and Financial Liabilities — Including an amendment of FASB Statement No. 115,”(“SFAS No. 159”), which permits entities to choose to measure many financial instruments and certain other items at fair value. The objective of SFAS No. 159 is to improve financial reporting by providing entities with the opportunity to mitigate volatility in reported earnings caused by measuring related assets and liabilities differently without having to apply complex hedge accounting provisions. SFAS No. 159 is effective for fiscal years beginning after November 15, 2007. We will be required to adopt SFAS No. 159 on January 1, 2008. We have not completed our evaluation of the effect of SFAS No. 159.
Quantitative and Qualitative Disclosures about Market Risk
Market risk is the potential loss arising from adverse changes in market prices and rates, including interest rates. We do not routinely enter into derivatives or other financial instruments for trading, speculative or hedging purposes, unless it is required by our credit agreements. We do not currently conduct business internationally, so we are generally not subject to foreign currency exchange rate risk.
As of December 31, 2006, we had approximately $1.6 billion in outstanding indebtedness under our senior secured credit facility that bears interest at floating rates based on the London Inter Bank Offered Rate, or LIBOR, plus 2.50%. The interest rate on the outstanding debt under our senior secured credit facility as of December 31, 2006 was 7.875%. On November 21, 2006, to manage our interest rate risk exposure and fulfill a requirement of our senior secured credit facility, we entered into a three-year interest rate protection agreement. This agreement covers a notional amount of $1.0 billion and effectively converts this portion of our variable rate debt to fixed rate debt at an annual percentage growthrate of 7.419%. The quarterly interest settlement periods begin on February 1, 2007. The interest rate swap agreement expires in customers2010. If market LIBOR rates increase 100 basis points over the rates in effect at December 31, 2006, annual interest expense on the approximately $600.0 million in variable rate debt would increase approximately $6.0 million.
89
Change in Accountants
On June 13, 2005, PricewaterhouseCoopers LLP, or PwC, our independent auditor for 2002 and revenue. 2003, declined to stand for re-election as our independent registered public accounting firm. PwC’s tenure as our independent registered public accounting firm was to end upon completion of the financial statement audit for 2004. On January 4, 2006, PwC was dismissed by us from performing the audit for the year ended December 31, 2004. Our audit committee participated in and approved the decision to change its independent registered public accounting firm for the audit for the year ended December 31, 2004.
PwC’s reports on our consolidated financial statements as of and for the year ended December 31, 2003 did not contain any adverse opinion or disclaimer of opinion and were not qualified or modified as to uncertainty, audit scope, or accounting principle. During the fiscal year ended December 31, 2003 and through January 4, 2006, there were no disagreements with PwC on any matter of accounting principles or practices, financial statement disclosure, or auditing scope or procedure, which, if not resolved to the satisfaction of PwC, would have caused PwC to make reference thereto in their reports on the financial statements for such years.
As defined in Item 304(a)(1)(v) ofRegulation S-K of the SEC, there was a reportable event related to five material weaknesses in our internal control over financial reporting for the fiscal year ended December 31, 2004. The material weaknesses related to deficiencies in our information technology and accounting control environments, insufficient “tone at the top,” a lack of automation in the revenue reporting process and deficiencies in our accounting for income taxes. The subject matter of the material weaknesses was discussed with PwC by our management and audit committee of the board of directors. We authorized PwC to fully respond to the inquiries of our newly appointed independent auditor, Deloitte & Touche, LLP, or Deloitte.
In August 2005, Deloitte was appointed by the audit committee of MetroPCS Communications’ board of directors as its independent auditor for the audit of the fiscal year ending December 31, 2005. On January 4, 2006, Deloitte was appointed by the audit committee of MetroPCS Communications’ board of directors as its independent auditor for the audit of the fiscal year ended December 31, 2004.
90
BUSINESS
General
We offer wireless voice and databroadband personal communication services, or PCS, on a no-contract,no long-term contract, flat rate, unlimited usage basis in selected major metropolitan markets in the United States. Since we launched our wireless service in 2002 we have been among the fastest growing wireless broadband PCS providers in the United States as measured by growth in subscribers and revenues. We reached one million customers in January 2004, 1.5 million customers in February 2005, two million customers in February 2006, 2.5 million customers in August 2006 and three million customers in January 2007. We currently offer our services in the greater San Francisco, Miami, Tampa/Sarasota/Orlando, Atlanta, Sacramento, Dallas/Ft. Worth, and Detroit metropolitan areas, which include a total licensed population of approximately 43 million. We launched service in the Miami, Atlanta and Sacramento metropolitan areas which include a total population of 22.6 million people. We launched service in all of these areas in the first quarter of 2002, except for2002; in San Francisco in September 2002; in Tampa/Sarasota in October 2005; in Dallas/Ft. Worth in March 2006; in Detroit in April 2006; and, through a wholesale arrangement with Royal Street, in Orlando and portions of northern Florida in November 2006. In 2005, Royal Street Communications, a company in which we launched in September 2002. We recently acquired four additionalown a non-controlling 85% limited liability company member interest, but only elect two of the five members of the management committee, was granted licenses by the FCC for the Los Angeles basic trading area and various basic trading areas inthroughout northern California that have a total population of 1.2 million people. We areFlorida. Royal Street is in the process of planning network deploymentbuilding infrastructure in Los Angeles and have not begunexpects to providecommence commercial service in these areas.late second or most likely third quarter of 2007. We reported positive net income and adjusted EBITDA after four quarters of operations and one million customers after eight quarters of operations. As of March 31, 2004, we had approximately 1.2 million customers. We believehave a wholesale arrangement that we reached these growth and profitability milestones significantly faster than any other U.S. wireless carrier and that our no-contract, flat rate, unlimited usage service offering will allow us to continuesell MetroPCS-branded service to penetrate our existing markets and further drive our growth and profitability. In addition, we believe ourthe public on up to 85% of the service capacity provided by the Royal Street systems.
Our wireless services
can be successfully introduced in new markets, and we continue to assess attractive expansion opportunities.We provide wireless voice and data services to thetarget a mass market which we believe is largely underserved by traditional wireless carriers. We operate principally through two subsidiaries and hold PCS licenses in 15 subsidiaries. Our service, branded under the “metroPCS”“MetroPCS” name, allows our customers to place unlimited wirelesslocal calls from within a local callingour service area, and to receive unlimited calls from any area for awhile in our local service areas, under simple and affordable flat monthly rate plan of $35.plans starting at $30 per month. For an additional $5 to $20 per month, our customers may select a service plan that offers additional services, such as the ability to place unlimited long distance calls from within aour local service calling area to any number in the continental United States.States or unlimited voicemail, caller ID, call waiting, text messaging, mobile Internet browsing, pushe-mail and picture and multimedia messaging. For additional fees, we also provide caller ID, voicemail,international long distance and text messaging, camera functions,ringtones, ring back tones, downloads, of ringtones, games and content applications, international long distancemobile Internet browsing, unlimited directory assistance and other value-added services. Our callingcustomers also have access, on a prepaid basis, to nationwide roaming. Our rate plans differentiate usour service from the more complex plans and long-term contracts required by most other traditional wireless carriers. Our customers pay for our service in advance, eliminating any customercustomer-related credit exposure, and we do not require a long-term service contract. Ourexposure.
As of December 31, 2006, our customers
currently averagein all metropolitan areas averaged approximately
1,8002,000 minutes of use per month, compared to approximately
675875 minutes per month for customers of
traditionalthe national wireless carriers. We believe that average monthly usage by our customers also exceeds the average monthly usage for typical wireline customers. Average usage by our customers indicates that a
majoritysubstantial number of our customers use our services as their primary telecommunications service, and our customer surveys indicate that a significant number of our customers use us as their primary
telecommunications service provider, and our customer survey results indicate that approximately 35% of our customers use us as theiror sole telecommunications service provider.
Competitive StrengthsWe believe our
Our business
model has many competitive strengths that
we believe distinguish us from
otherour primary wireless
carriersbroadband PCS competitors and will allow us to
successfully execute our business strategy
successfully, including:
Our Flat RateFixed Price Unlimited Service Plans.. We believe our service offering that provides unlimited usage from within a local calling area represents a compelling value proposition for our customers that differs substantially from the offerings of the national wireless broadband PCS carriers and traditional wireline carriers. Our service model results in average per minute costs to our customers that are significantly lower than the average per minute costs of other traditional wireless broadband PCS carriers. We believe that many prospective customers
91
refrain from subscribing to, or extensively utilizing, traditional wireless communications services because of high prices, long-term contract requirements, confusing calling plans and wirelinesignificant cash deposit requirements for credit challenged customers. Our simple, cost-effective rate plans, combined with our pay in advance no long-term contract service model, allow us to attract many of these customers.
Our Densely Populated Markets. We believe the high relative population density of our markets results in increased efficiencies in network deployment, operations and product distribution. We believe we have one of the highest aggregate population densities of any major wireless carrier in the United States in our Core and Expansion Markets. The aggregate population density across the licensed areas we currently serve and plan to serve in our Core Markets and Expansion Markets is approximately 339 people per square mile, which is nearly four times higher than the national average of 84 people per square mile. Our high relative population density and efficient network design resulted in cumulative capital expenditures per covered person as of December 31, 2006 of approximately $41.00, which we believe enhances our overall return on capital. The opportunities on which we plan to focus initially in our Auction 66 Markets will have population density characteristics similar to our Core and Expansion Markets.
Our Cost Leadership Position. We believe we are one of the lowest cost providers of wireless broadband PCS services in the United States, which allows us to offer our services at affordable prices while maintaining cash profits per customer as a percentage of revenues per customer that are among the highest in the wireless industry. For the year ended December 31, 2006, our CPU was $19.65, which represents an average cost per minute of service on our network of approximately one cent. For the year ended December 31, 2006, our CPGA was $117.58, which we believe to be among the lowest in the industry. We believe our operating strategy, network design and rapidly increasing scale, together with the high relative population density of our markets, will continue to contribute to our cost leadership position. For a discussion of CPU and CPGA, and their respective reconciliations to cost of service and selling expenses, please read “Summary Historical Financial and Operating Data” and “Management’s Discussion and Analysis of Financial Condition and Results of Operations — Reconciliation of Non-GAAP Financial Measures.”
Our Spectrum Portfolio. We hold or have access to wireless licenses covering a population of approximately 140 million in the United States. These licenses cover nine of the top 12 and 14 of the top 25 most populous metropolitan areas in the United States, including New York (#1), Los Angeles (#2), San Francisco (#4), Dallas/Ft. Worth (#5), Philadelphia (#6), Atlanta (#9), Detroit (#10), Boston (#11), Miami (#12), Seattle (#15), San Diego (#16), Tampa (#20), Sacramento (#24) and Portland (#25), as well as Las Vegas (#31).
Our Advanced CDMA Network. We deploy an advanced CDMA network in each of our Core and Expansion Markets that is designed to provide the capacity necessary to satisfy the usage requirements of our customers. We believe CDMA technology provides us with substantially more voice and data capacity per MHz of spectrum than other commonly deployed wireless broadband PCS technology. We believe that the combination of our network technology, network design and spectrum depth will continue to allow us to serve efficiently the high usage demands of our rapidly growing customer base into the future.
Business Strategy
We believe the following components of our business strategy provide the foundation for our continued rapid growth:
Continue to Target Underserved Customer Segments in our Markets. We target a mass market which we believe is largely underserved by traditional wireless carriers. We believe that our rapid growth to over 3.0 million customers since our initial service launch in 2002 demonstrates the substantial demand in the United States for our innovative wireless services. We believe our rapid adoption rates and customer mix indicate that our service is expanding the overall size of the wireless market and better meeting the needs of many existing wireless users. Our average monthly usage by our customers for all markets is approximately 2,000 minutes per month, and our recent customer surveys indicate that over 80% of our customers use us as their primary phone service and that over 50% of our customers have eliminated their traditional landline
92
phone service. Approximately 65% of our customers are first time wireless users, while the balance have switched to our service from another wireless carrier.
Offer Affordable, Fixed Price Unlimited Service Plans With No Long-Term Service Contract Requirement. We plan to continue to offer our fixed price, unlimited wireless service plans, which we believe represent an attractive and differentiated offering to a large segment of the population. Our service is designed to provide mobile functionality while eliminating the gap between traditional wireless and wireline
pricing, which wepricing. We believe
this stimulates
usage ofthe demand for our wireless service,
contributes to the continuing growth of our subscriber base and will
contribute to drivingincrease the overall wireless adoption
levels in our
markets to levels comparable to the adoption rates currently experienced in Europe. We also believe that our ability to capture approximately 1.2 million customers to date demonstrates the substantial demand for our service offering.markets.
Our Focus on Densely Populated Markets. Our current service areas include fourRemain One of the
25 most populous metropolitan areasLowest Cost Wireless Service Providers in the United
States: San Francisco, Miami, Atlanta and Sacramento. We believe the high relative population density of our market clusters results in increased efficiencies in network deployment, operating costs and product distribution. As of March 31, 2004, our markets had an average population density of335 POPs per square mile, over four times the national average. In addition, the population of our markets is growing at an average of 1.5 times faster than the national average and the average household income in our markets is $5,000 above the national average according to the Paul Kagan Associates, Inc. Wireless Telecom Atlas & Databook 2002. Based on these statistics, we believe our market profile is the most attractive of any U.S. wireless carrier. We believe significant opportunities exist to expand into other markets with similar characteristics.
Our Cost Leadership PositionStates.. We believe our operating strategy, network design and high relative population density and spectrum positionin our markets have enabled us to become, and will enable us to continue to be, one of the lowest cost providerproviders of wireless broadband PCS services in the United States. We also believe our rapidly increasing scale will allow us to continue to drive our per customerper-customer operating costs down in the future. For the three months ended March 31, 2004, our cost per gross addition, or CPGA, was $97 compared to an average of $345 for our three largest national competitors. In addition, ourwe will seek to maintain operating costs per customer that are substantially below the serviceoperating costs of our national wireless broadband PCS competitors. We believe that our industry leading cost position provides us and will continue to provide us with a sustainable competitive advantage in our markets.
advantage.
Our State-of-the-Art CDMA 1XRTT NetworkExpand into Attractive Markets.. We have
deployedbeen successful in acquiring or gaining access to spectrum in a
100% code division multiple access radio transmission technology, or CDMA 1XRTT, network in eachnumber of new metropolitan areas which share the high relative population density and customer characteristics of our
markets that is designed specifically to provide the capacity necessary to satisfy the usage requirements of our customers. CDMA 1XRTT technology provides substantially more voice and data capacity than other commonly deployed wireless technologies and provides us with a network capacity advantage in our markets. Our CDMA 1XRTT network, which provides the most efficient use of spectrum, currently allows us to rapidly and cost-effectively add network capacity without adding incremental cell sites. We believe that the combination of our network technology, network design and spectrum depth will allow us to efficiently serve the high usage demands of our rapidly growing customer base into the future.Our Deep Spectrum Portfolio. We currently hold 30 MHz of spectrum in 13 of our 18 license areas even though our business plan generally requires only 20 MHz of spectrum in our major markets. This excess spectrum provides us with the flexibility to swap or sell 10 MHz or more of spectrum in selected markets to support future expansion or investment initiatives without materially impacting our business plan. For example, in February 2002, we completed our only spectrum sale to date, selling 10 MHz of excess spectrum in our Atlanta market for $290.0 million.
Business Strategy
We believe the following components of our business strategy will allow us to continue our rapid, profitable growth:
Continue to Target Underserved Customer Segments in OurCore Markets. We believe there is substantial demand in the United States for our affordable wireless services, as demonstrated by the fact that we have been among the leaders of the U.S. wireless industry in incremental market penetration in every quarter since we launched operations. Historically, approximately 40% of our gross customer additions have been first time wireless customers, while the remainder have switched from traditional wireless carriers. We believe our rapid adoption ratesearly experience in Tampa/Sarasota, Dallas/Ft. Worth and customer mix demonstrate thatDetroit, where, as of December 31, 2006, we have added approximately 640,000 new subscribers since the launch of service, demonstrates our ability to successfully expand our service is expanding the overall size of the wireless market as well as better meeting the needs of many existing wireless users.
Offer Affordable, Fixed Price Calling Plans Without Long-Term Service Contracts. We believe that our fixed price, unlimited service represents an attractive offering to a large segment of the population. Our service results in average per minute usage costs to our customers that are significantly lower than the average per minute rates of other wireless operators. We believe that many prospective customers refrain from subscribing to or extensively using traditional wireless communications services due to high prices or unattractive and confusing calling plans, and that our simple, cost- effective service will allow us to attract many of these customers and continue our rapid growth.
Maintain Our Positionas the Lowest Cost Wireless Telephone Services Provider in the United States. We are the lowest cost provider of wireless services in the United States, which allows us to offer our services at affordable prices while maintaining cash profit margins per customer that are among the highest in the industry. Our operating strategy, network design, spectrum portfolio and rapidly increasing scale, together with the population density of our markets, should allow us to continue to maintain our cost leadership position and further reduce our per customer operating costs in the future.
Expand into Attractive Markets Through Acquisitions and Spectrum Swaps. We believe the success of our business model can be replicated in markets outside of our existing footprint. We expect that attractive expansion opportunities will become available. We plan to target expansion markets that complement our existing footprint or can be operated as a stand alone cluster with growth and profitability characteristics similar to our existing markets. Part of the proceeds from this offering may be used to fund expansion into new markets, and we may also choose to swap a portion of our existing excess spectrum for spectrum in new markets.
metropolitan areas.
General Wireless, Inc., or GWI, was formed in 1994 for the purpose of bidding on, acquiring and operating broadband PCS licenses as a “small business”very small business under the FCC’s “designated entity”designated entity rules. In 1995, GWI formed GW1, Inc. as a wholly-owned subsidiary, and shortly afterwards changed GW1, Inc.’s name to GWI PCS, Inc., or GWI PCS. In 1996, weGWI PCS participated in the FCC’s C-Block auctions of broadband PCS spectrum licenses. Although the auctions in which we werelicenses and was declared the high bidder concludedon licenses for the Miami, Atlanta, Sacramento and San Francisco metropolitan areas. In 1999, GWI PCS changed its name to MetroPCS Wireless, Inc. and GWI changed its name to MetroPCS, Inc.
In March 2004, MetroPCS, Inc. formed MetroPCS Communications as a wholly-owned subsidiary of MetroPCS, Inc. and in
May 1996,July 2004 a wholly-owned subsidiary of MetroPCS Communications, Inc., MPCS Holdco Merger Sub, Inc., merged into MetroPCS, Inc. and MetroPCS, Inc. was the
FCC did not issue the licenses to us until January 1997, by which time the market value of PCS licenses had declined dramatically due to, among other things, the FCC’s intervening auction of licenses in the D-, E- and F-Blocks. In connection with the C-Block auction, each of our license holding subsidiaries had executed a separate promissory note payable to the FCC in an amount equal to the purchase price of that subsidiary’s FCC license. As a result, we were unable to obtain the financing necessary to service our debt to the FCC and build our networks.In October 1997, after repeated efforts to obtain a commercially viable restructuring of our debt to the FCC, the subsidiaries in which we hold our FCC licenses each filed voluntary petitions for relief under Chapter 11 of the United States Bankruptcy Code. In January 1998, we filed our own voluntary Chapter 11 petition, joining our license subsidiaries’ bankruptcy proceedings.
surviving corporation. As a result of proceedings commenced in the bankruptcy court, it was determined that, after crediting the $106.0 million we had paid to the FCC as down payments for our licenses, the total amount owed by us to the FCC was $60.0 million. In September 1998, the bankruptcy court confirmed our plan of reorganization and we emerged from bankruptcy in October 1998.
On July 13, 2004,this merger, MetroPCS, Inc. became a wholly ownedwholly-owned subsidiary of MetroPCS Communications, Inc. In August 2006, MetroPCS Communications, Inc. formed MetroPCS V, Inc., as a wholly-owned subsidiary which indirectly, through a series of no longer existing wholly-owned subsidiaries, held all of the common stock of MetroPCS Wireless, Inc.
In November 2006, as part of the restructuring associated with the issuance of the 91/4% senior notes and the senior secured credit facility, MetroPCS, Inc. was merged
into MetroPCS Wireless, Inc., with MetroPCS
Wireless, Inc.
such thatsurviving, and MetroPCS V, Inc. was renamed MetroPCS, Inc.
became a wholly owned subsidiaryMetroPCS Wireless, Inc.’s business constitutes substantially all of the business of MetroPCS Communications, Inc. and
all of the holders of capital stockits wholly- owned subsidiary, and parent of MetroPCS
Wireless, Inc., MetroPCS, Inc.
became holders of capital stock of(formerly known as MetroPCS
Communications,V, Inc.
), and we continue to conduct business under the MetroPCS brand.
Voice ServicesServices.. We provide affordable, reliable, and high-quality wireless communicationsbroadband PCS services which consists of two primary pricing plans.through the service plans detailed in the chart below. All service plans are“paid-in-advance” and do not require a long-term contract. Our basic $35lowest priced $30 per month service offeringplan allows our customers to place unlimited local calls within our calling area andbut without the ability to receive unlimited calls from anywhere in the world. In November 2003, we beganadd additional features. For an additional $5 to market a $40$20 per month, a
93
subscriber may select a service offering in allplan which provides more flexibility and options such as nationwide long distance calling, unlimited text messaging (domestic and international), voicemail, caller ID, call waiting, picture and multimedia messaging, mobile Internet browsing, pushe-mail, data and other a la carte options on a prepaid basis. Our most popular service plans currently are our unlimited $40 and $45 service plans which offer unlimited local and long distance calling, text and picture messaging, enhanced voice mail, caller ID, call waiting and 3-way calling. As of December 31, 2006, over 85% of our marketscustomers had selected either our $40 or $45 rate plans. On February 22, 2007 we introduced our new $50 service plan which includes unlimited mobile Internet browsing and pushe-mail in addition to the services included in our $45 service plan. It is too early to judge the impact that allowsthis new service plan will have on our customerscurrent service plan mix.
MetroPCS Service Plans
| | | | | | | | | | | | | | | | | | | | |
Product | | $30/Month | | | $35/Month | | | $40/Month | | | $45/Month | | | $50/Month | |
|
| Unlimited local calling | | | X | | | | X | | | | X | | | | X | | | | X | |
| Unlimited nationwide long distance calling(1) | | | | | | | | | | | X | | | | X | | | | X | |
| Unlimited domestic text messaging | | | | | | | | | | | | | | | X | | | | X | |
| Unlimited picture messaging | | | | | | | | | | | | | | | X | | | | X | |
| Enhanced voicemail | | | | | | | | | | | | | | | X | | | | X | |
| 3-way calling | | | | | | | | | | | | | | | X | | | | X | |
| Caller ID | | | | | | | | | | | | | | | X | | | | X | |
| Call waiting | | | | | | | | | | | | | | | X | | | | X | |
| Mobile Internet browsing | | | | | | | | | | | | | | | | | | | X | |
Pushe-mail | | | | | | | | | | | | | | | | | | | X | |
| Additional calling features available | | | | | | | X | | | | X | | | | X | | | | X | |
| | |
| (1) | | Includes only the continental United States. |
Currently, in our San Francisco, Sacramento, and Dallas/Ft. Worth metropolitan areas we have added to placethe $35 service plan unlimited calls from our coverage area to anywherelong distance in the continental United States, to the $40 service plan unlimited short message and multimedia message services, and to receivethe $45 service plan unlimited calls from anywhere in the world. Both plans are paid for in advancemobile Internet browsing and do not require a long-term service contract. international short message service.
Our
local outbound calling areas extend in most cases beyond the boundaries of our actual license
footprint.area. For example, customers in our San Francisco and Sacramento markets may place unlimited
local calls
while inside our service area to areas throughout
the majority of northern California
for which ourwithout incurring toll charges. Our wireline competitors generally would impose toll
charges.Customers oncharges for calls within this area, while our basic $35 per month plan desiring long distance and international calling service may choose a pre-paid option, allowing them to place calls anywhere in the world at favorable rates. Customers on our $40 per month plan who desire international calling service may also choose this pre-paid option for international calling service. treats these as local calls.
Customers who travel outside of theirour coverage area may roam onto other wireless networks in two ways. First, a customer may purchase service directly from a manual roaming provider in that area by providing the carrier on those networksprovider with a credit card number, thereby allowingwhich allows that carrierprovider to bill themthe customer directly for theirany roaming charges. WeIf the customer chooses this option, we incur no costs, nor do we receive any revenues,revenues. Second, a customer may subscribe to our nationwide roaming service, branded as “TravelTalk,” under which we provide voice roaming service through agreements with other wireless carriers. We launched our TravelTalk roaming service on a prepaid basis in April 2006. Under this option, the customer makes a deposit in a prepaid account and may access our nationwide roaming service when traveling outside our local service area. We incur costs for providing, and earn revenue from, this nationwide roaming service in excess of our costs. Due to charges imposed by our roaming suppliers, our nationwide roaming service is not cost effective for customers utilize these third-partywho travel frequently outside our local service area, but the ability to roam nationwide on a prepaid basis expands the market to those customers that may find occasional roaming services.beneficial.
94
Data ServicesServices.. Our data services include:
| | |
| | Ÿ | • | services provided through the binary runtime environmentBinary Runtime Environment for wireless,Wireless, or BREW, development platform, including ringtones, games and content applications; |
|
| | Ÿ | • | text messaging services (domestic and international), which allow the customer to send and receive alphanumeric messages which can be received, stored and displayed onthat the handset can receive, store and display on demand; and |
|
| | Ÿ | • | multimedia messaging services, which allow the customer to send and receive messages containing photographs.photographs; |
|
| • | mobile Internet browsing; and |
|
| • | pushe-mail. |
Custom Calling FeaturesFeatures.. We offer other custom calling features, including caller ID, call waiting, three-way calling, distinctive
ringtones, ring
back tones and voicemail.
Advanced HandsetsHandsets.. We sell a variety of handsets manufactured
primarily by
Nokia, Kyocera, Audiovox, LG and Sony Ericssonnationally recognized handset manufacturers for use on our network, including models that provide color screens, camera phones and other features
to facilitatefacilitating digital
data transmission.data. All of the handsets we offer are CDMA 1XRTT
compliant.compliant and are capable of providing the location data mandated by the FCC’s wirelessE-911 rules and regulations.
Core and Expansion Markets
Our strategy has been to offer our services in major metropolitan markets and their surrounding areas, which we refer to as clusters. Within our Core Markets we operate three separate clusters, which include Georgia (Atlanta), South Florida (Miami) and Northern California (San Francisco and Sacramento). We
continue to evaluate new productinitially launched our service in South Florida, Georgia and
service offerings in order to enhance customer satisfaction and attract new customers. For example, in March 2004, we launched, on a trial basis, a limited usage offering in which customers purchase 250 minutesthe Sacramento area of
local and long distance usage per month for $25 instead of our traditional unlimited usage offerings. We believe that this offering will help us to retain existing customers and attract new customers who do not require unlimited usage or who are unwilling or unable to pay for our traditional unlimited usage plans.FCC Licenses
Fourteen of our wholly-owned license subsidiaries each hold one 30 MHz PCS license, with the exception of one subsidiary that holds a license for 20 MHz as a result of the February 2002 sale of 10 MHz of spectrum in our Atlanta market. Six licenses permit wireless operationsNorthern California in the greaterfirst quarter of 2002 and launched the San Francisco and Sacramento metropolitan area in September of 2002. These Core Market clusters five permit wireless operations in the greater Miami metropolitan cluster and three permit wireless operations in the Atlanta metropolitan cluster. The licenses have an initial term of ten years after the initial grant date in January 1997, and, subject to applicable conditions, may be renewed. Each FCC license is essential to our ability to operate and conduct our business in the area covered by that license. See “Risk Factors—Risks Related to Our Business” and “Legislation and Government Regulations.”
On April 15, 2004, we acquired, through a wholly-owned subsidiary, four additional 15 MHz licenses for areas in northern California (Merced, Modesto, Eureka and Redding), with a totallicensed population of approximately 1.226 million people. Asof which our networks currently cover approximately 22 million. Our Core Market clusters have an average population density of 271 people per square mile, compared to the national average of 84, enjoy average annualized population growth of 1.8% compared to the national average of 1.1% and have a median household income of $53,000 compared to a national average of $47,000.
Beginning in the second half of 2004, we began to acquire licenses opportunistically for new markets that shared characteristics similar to our existing Core Markets. In addition to these acquisitions, we also entered into agreements with
our otherRoyal Street Communications, a company in which we own a non-controlling 85% limited liability company member interest, which was granted broadband PCS licenses
these licensesby the FCC in December 2005 following FCC Auction 58. For a discussion of Royal Street and Auction 58, please see “— Auction 58 and Royal Street.” We have
an initial terma wholesale agreement with Royal Street that allows us to purchase up to 85% of
ten years afterRoyal Street’s service capacity and sell it on a retail basis under the
initial grant dateMetroPCS brand in
January 1997geographic areas where Royal Street was granted FCC licenses. Our Expansion Markets include Tampa/Sarasota/Orlando, Dallas/Ft. Worth, Detroit, portions of Northern Florida, which are geographically complementary to our South Florida cluster, as well as Los Angeles, which is geographically complementary to our Northern California cluster. Within our Expansion Markets we operate or will operate four new separate clusters: Northern and
subjectCentral Florida, Dallas/Ft. Worth, Detroit and Southern California. As of November 2006, we had launched our service in all of our major Expansion Markets except for Los Angeles, which we expect to
applicable conditions, may be renewed. We paid an aggregate cash purchase price of $10.9 million for this acquisition. We arelaunch in the
processsecond or third quarter of
planning network deployment and have not begun to provide service in these areas.On July 8, 2004, we entered into an agreement2007 through our wholesale arrangement with NextWave Telecom, Inc. and certain of its affiliates to acquire two 10 MHz PCS licenses for the Tampa-St. Petersburg-Clearwater, Florida area, and the Sarasota-Bradenton, Florida area. These areasRoyal Street. Our Expansion Markets have a totallicensed population of approximately 3.340 million, people. These licenses
date, including our operations in Orlando and portions of northern Florida. Together, our Core and Expansion Markets have an initial termaverage population density of ten years after339 people per square mile, compared to the initial grant date in January 1997,national average of 84, enjoy average annualized population growth of 1.7% compared to the national average of 1.1% and subjecthave a median household income of $50,000 compared to applicable conditions, may be renewed. We agreed to pay a cash purchase pricenational average of $43.5 million for this acquisition. Consummation of this acquisition is subject to satisfaction of several conditions, including approval by the FCC and approval by the bankruptcy court in which NextWave’s Chapter 11 bankruptcy cases are pending.
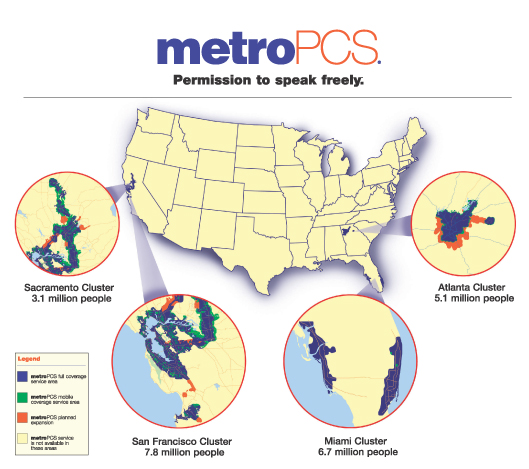
Markets
Our FCC licenses cover four clusters encompassing the greater metropolitan areas of San Francisco, Miami, Atlanta and Sacramento.$47,000. We believe our marketsall of these Expansion Markets are particularly attractive because of their high population densities, attractive customer demographics,
95
high historical and projected population growth rates, favorable business climates and long commuting times relative to national averages.
The table below provides a metropolitan area by metropolitan area overview of our Core and Expansion Markets (excluding Auction 66 Markets) including the FCC basic trading area (BTA) identification number, the number of people, or POPs, the POP density, the annualized POP growth rate, the spectrum depth and each metropolitan area’s actual or expected launch date. For our Expansion Markets we have noted whether we are the FCC license holder in each metropolitan area or if we will provide our services in that metropolitan area through our agreements with Royal Street, which holds the license. It should also be noted that all of the licensed spectrum shown below in our Core and Expansion Markets is in the 1900 MHz PCS band and that the metropolitan area classifications in the table below conform to the FCC’s basic trading area (BTA) geographic areas for PCS spectrum.
96
| | | | | | | | | | | | | | | | | | | | | | | | | |
| | | | | | | | | | | | Annualized
| | | | | | | |
| | | | | | POPs
| | | POP
| | | POP
| | | | | | Launch
| |
Metropolitan Area | | BTA | | | (’000s)(1) | | | Density(3) | | | Growth(4) | | | MHz | | | Date | |
| |
Core Markets: | | | | | | | | | | | | | | | | | | | | | | | | |
Georgia: | | | | | | | | | | | | | | | | | | | | | | | | |
| Atlanta, GA | | | 24 | | | | 5,213.8 | | | | 474 | | | | 2.53 | % | | | 20 | | | | Q1 2002 | |
| Gainesville, GA | | | 160 | | | | 304.9 | | | | 187 | | | | 3.15 | % | | | 30 | | | | Q1 2002 | |
| Athens, GA | | | 22 | | | | 232.1 | | | | 169 | | | | 1.70 | % | | | 20 | | | | Q1 2002 | |
South Florida: | | | | | | | | | | | | | | | | | | | | | | | | |
| Miami-Fort Lauderdale, FL | | | 293 | | | | 4,415.8 | | | | 1,051 | | | | 1.69 | % | | | 30 | | | | Q1 2002 | |
| West Palm Beach, FL | | | 469 | | | | 1,334.9 | | | | 483 | | | | 2.05 | % | | | 30 | | | | Q1 2002 | |
| Fort Myers, FL | | | 151 | | | | 748.5 | | | | 219 | | | | 2.61 | % | | | 30 | | | | Q1 2004 | |
Fort Pierce-Vero Beach, FL | | | 152 | | | | 497.3 | | | | 305 | | | | 2.13 | % | | | 30 | | | | Q1 2004 | |
| Naples, FL | | | 313 | | | | 322.2 | | | | 162 | | | | 3.63 | % | | | 30 | | | | Q1 2004 | |
Northern California: | | | | | | | | | | | | | | | | | | | | | | | | |
| San Fran.-Oak.-S.J., CA | | | 404 | | | | 7,501.4 | | | | 553 | | | | 0.57 | % | | | 20 | | | | Q3 2002 | |
| Sacramento, CA | | | 389 | | | | 2,388.0 | | | | 150 | | | | 2.65 | % | | | 30 | | | | Q1 2002 | |
| Stockton, CA | | | 434 | | | | 752.6 | | | | 309 | | | | 3.25 | % | | | 30 | | | | Q1 2002 | |
| Modesto, CA | | | 303 | | | | 604.2 | | | | 162 | | | | 2.79 | % | | | 15 | | | | Q1 2005 | |
| Salinas-Monterey, CA | | | 397 | | | | 434.2 | | | | 131 | | | | 1.21 | % | | | 30 | | | | Q1 2002 | |
| Redding, CA | | | 371 | | | | 304.3 | | | | 19 | | | | 1.47 | % | | | 30 | | | | Q4 2006 | |
| Merced, CA | | | 291 | | | | 269.3 | | | | 79 | | | | 2.53 | % | | | 15 | | | | Q1 2005 | |
| Chico-Oroville, CA | | | 79 | | | | 246.9 | | | | 83 | | | | 1.13 | % | | | 30 | | | | Q1 2002 | |
| Eureka, CA | | | 134 | | | | 155.8 | | | | 34 | | | | 0.18 | % | | | 15 | | | | TBD | |
| Yuba City-Marysville, CA | | | 485 | | | | 155.3 | | | | 125 | | | | 1.68 | % | | | 30 | | | | Q1 2002 | |
Expansion Markets: | | | | | | | | | | | | | | | | | | | | | | | | |
Central and Northern Florida: | | | | | | | | | | | | | | | | | | | | | | | | |
| Tampa-St. Petersburg, FL | | | 440 | | | | 2,915.0 | | | | 602 | | | | 1.59 | % | | | 10 | | | | Q4 2005 | |
| Sarasota-Bradenton, FL | | | 408 | | | | 708.0 | | | | 362 | | | | 1.97 | % | | | 10 | | | | Q4 2005 | |
| Daytona Beach, FL | | | 107 | | | | 559.1 | | | | 349 | | | | 1.92 | % | | | 20 | | | | TBD | |
| Ocala, FL | | | 326 | | | | 297.0 | | | | 184 | | | | 2.09 | % | | | 10 | | | | TBD | |
| Jacksonville, FL(2) | | | 212 | | | | 1,525.9 | | | | 192 | | | | 1.78 | % | | | 10 | | | | TBD | |
| Lakeland-Winter Haven, FL(2) | | | 239 | | | | 525.1 | | | | 288 | | | | 1.27 | % | | | 10 | | | | Q4 2006 | |
| Melbourne-Titusville, FL(2) | | | 289 | | | | 530.1 | | | | 533 | | | | 1.65 | % | | | 10 | | | | TBD | |
| Gainesville, FL(2) | | | 159 | | | | 339.6 | | | | 94 | | | | 0.92 | % | | | 10 | | | | TBD | |
| Orlando, FL(2) | | | 336 | | | | 2,010.0 | | | | 493 | | | | 2.54 | % | | | 10 | | | | Q4 2006 | |
Dallas/Ft. Worth: | | | | | | | | | | | | | | | | | | | | | | | | |
| Dallas/Ft. Worth, TX(5) | | | 101 | | | | 6,028.9 | | | | 727 | | | | 2.56 | % | | | 10 | | | | Q1 2006 | |
| Sherman-Denison, TX(6) | | | 418 | | | | 190.1 | | | | 70 | | | | 0.99 | % | | | 10 | | | | Q1 2006 | |
Detroit: | | | | | | | | | | | | | | | | | | | | | | | | |
| Detroit, MI | | | 112 | | | | 5,095.3 | | | | 826 | | | | 0.41 | % | | | 10 | | | | Q2 2006 | |
Southern California: | | | | | | | | | | | | | | | | | | | | | | | | |
| Los Angeles, CA(2) | | | 262 | | | | 18,261.0 | | | | 413 | | | | 1.66 | % | | | 10 | | | | Q2/Q3 2007 | |
| Bakersfield, CA | | | 28 | | | | 752.0 | | | | 92 | | | | 1.95 | % | | | 10 | | | | TBD | |
Source: Kagan 2005 Wireless Telecom Atlas and Databook.
| | |
| (1) | | POPs based on 2005 population data and increased based on annualized POP growth rates. |
|
| (2) | | License granted to Royal Street. |
|
| (3) | | Calculated as number of POPs divided by square miles. |
|
| (4) | | Estimatedaverage 2003-2008 annual population growth. |
|
| (5) | | The Dallas/Ft. Worth license is comprised of the counties which make up CMA9. |
|
| (6) | | Comprised of Grayson and Fannin counties only. |
97
Core and Expansion Market Launch Experience
When we launched our Core Markets in 2002 we had limited access to capital. As a result, as we prepared to launch each market, we limited our initial network coverage, pre and post launch expenditures on advertising and the number of distribution outlets. This strategy allowed us to protect our limited capital and closely regulate our post launch investments in both additional network coverage as well as our costs of customer acquisition. Our licensed population coverage at the time of launch across our Core Markets was between approximately 65% and 70%. In addition, the CDMA 1XRTT technology we deployed in our network was relatively new at the time we launched our Core Markets. As a result, at the time we launched each of our Core Markets, we were able to offer only a single handset and a single $35 per month rate plan which we believe limited the initial attractiveness of our service. In spite of these challenges, the demand for our service exceeded our initial expectations and the average customer penetration levels of our Core Markets at the end of 12 months of operations for each of our Core Markets as a percentage of covered population was approximately 4%. In the fourth quarter of 2003, we were able to raise additional capital, which allowed us to expand our network coverage and increase our distribution presence. As of December 31, 2006, our Core Market operations had achieved customer penetration levels as a percentage of covered population of 10.2%, representing an increase of 1.4% in incremental penetration over the marketsprior year. As of March 31, 2007, we currently servehad 2.5 million subscribers in our Core Markets which represented customer penetration as a percentage of covered population of 11.0%.
In early 2005, as we began to plan our network deployment and service launch in our Expansion Markets, we had sufficient liquidity to more effectively execute our build-out and launch strategy. We were also able to apply the lessons we learned from the launch and operations of our Core Markets to improve our execution plan for our Expansion Markets. As a result, we launched our Expansion Markets with higher initial population coverage of between approximately 80% and 90%. We also elected to deploy additional network equipment in certain high population areas in order to provide higher quality in-building coverage, increase by approximately 20% our average number of distribution locations per one million covered population at the time of launch, and offer a broader selection of monthly rate plans and handsets. These factors allowed us to initially target a larger population of potential customers and provide a more robust service offering at the launch dates. As a result of these changes, we are experiencing higher levels of initial customer penetration in our Expansion Markets than we experienced in our Core Markets, based on our performance to date in the Tampa/Sarasota/Orlando, Dallas, and Detroit metropolitan areas.
Los Angeles, California, the second most populous market in the United States, is growingthe only one of our major Expansion Markets that we have not yet launched. We plan to launch the Los Angeles metropolitan area in the second or third quarter of 2007. We anticipate covering a population of 11 to 12 million at launch and is expected to continue to grow atincrease population coverage over time. Los Angeles will represent the eighth top 25 metropolitan area launched by us. We believe that the Los Angeles metropolitan area could prove to be our most successful launch to date, based on its high population density and attractive demographics.
Auction 66 Markets
At the conclusion of FCC Auction 66 in September 2006, we were declared the high bidder on eight additional FCC licenses for total aggregate winning bids of approximately $1.4 billion, and, in November 2006, we were granted all eight of these licenses. The spectrum licenses granted as a result of Auction 66 are in the advanced wireless services, or AWS, band which includes the 1710 to 1755 MHz frequencies as well as the 2110 to 2155 MHz frequencies. These frequency ranges are near the PCS band in which we operate our Core and Expansion Markets, and we believe this spectrum to have similar technical properties to the PCS spectrum we are currently licensed to operate. We can offer the same PCS services on these AWS licenses as we offer on our other PCS spectrum and can offer additional advanced services. The AWS licenses awarded by the FCC in Auction 66 were divided into geographic areas which are different from the geographic areas associated with PCS licenses. The map below describes the geographic coverage of our Auction 66 licenses and shows the relationship between these new AWS licenses and our existing Core and Expansion Markets.
98
Our Auction 66 licenses cover a total unique population of approximately 117 million. New expansion opportunities in geographic areas outside of our Core and Expansion Markets represent approximately 69 million of the total covered population of our Auction 66 Markets, as described in the chart below. Our expansion opportunities as a result of Auction 66 cover six of the top 25 metropolitan market areas in the United States, including the entire east coast corridor from Philadelphia to Boston, including New York City, as well as the entire states of New York, Connecticut and Massachusetts. Together our east coast expansion opportunities cover a geographic area of approximately 50 million people. In the Western United States our new expansion opportunities cover a geographic area of approximately 19 million people, including the San Diego, Portland, Seattle and Las Vegas metropolitan areas.
The balance of our Auction 66 Markets, which covers a population of approximately 48 million, supplements or expands the geographic boundaries of our existing operations in Dallas/Ft. Worth, Detroit, San Francisco and Sacramento, and Royal Street’s license area in Los Angeles. Given our performance in the Core and Expansion Markets to date, we expect this additional spectrum to provide us with enhanced operating flexibility, reduced capital expenditure requirements in existing licensed areas and an averageexpanded service area relative to our position prior to Auction 66. We intend to focus our build-out strategy in our new Auction 66 Markets initially on licenses with a total population of 1.5 times faster thanapproximately 40 million in major metropolitan areas which we believe offer us the national averageopportunity to achieve financial results similar to our existing Core and Expansion Markets, with a primary focus on the New York, Philadelphia, Boston and Las Vegas metropolitan areas. Of the approximately 40 million total population, we are targeting launch of operations with an initial population of approximately 30 to 32 million by late 2008 or early 2009.
| | | | | | | | | | | | | | | |
| | | Purchase
| | | Spectrum
| | | | |
License | | Price $ | | | MHz | | | Population | |
| |
| REA 1 | | Northeast | | | 552,694,000 | | | | 10 | | | | 50,058,090 | |
| REA 6 | | West | | | 355,726,000 | | | | 10 | | | | 49,999,164 | |
| EA 10 | | New York-No. New Jer.-Long Island,
NY-NJ-CT-PA-MA-VT(1) | | | 363,945,000 | | | | 10 | | | | 25,712,577 | |
| EA 57 | | Detroit-Ann Arbor-Flint, MI | | | 50,317,000 | | | | 10 | | | | 6,963,637 | |
| EA 127 | | Dallas/Ft. Worth, TX-AR-OK | | | 49,766,000 | | | | 10 | | | | 7,645,530 | |
| EA 62 | | Grand Rapids-Muskegon-Holland, MI | | | 7,920,000 | | | | 10 | | | | 1,881,991 | |
| EA 153 | | Las Vegas, NV-AZ-UT(1) | | | 10,420,000 | | | | 10 | | | | 1,709,797 | |
| EA 88 | | Shreveport-Bossier City, LA-AR | | | 622,000 | | | | 10 | | | | 573,616 | |
99
Source: FCC Auction 66 Website
| | |
| (1) | | Licenses overlap other Auction 66 licenses |
The New York EA overlaps that portion of the Northeast REA surrounding the greater New York metropolitan area. The Las Vegas EA also overlaps that portion of the West REA that also covers Las Vegas. As a result, we have 20 MHz of spectrum in these metropolitan areas which we believe will facilitate a more efficient rollout and allow us to more effectively scale our operations.
There are incumbent governmental and non-governmental users in the AWS band. The relocation of incumbent governmental users will be funded by the proceeds of Auction 66, although certain governmental users will not be required to relocate. The non-governmental incumbent licensees will need to be relocated pursuant to the FCC’s approved spectrum relocation order, which may require us to pay for their relocation expenses which we currently estimate to be approximately $40 to $60 million, and which requires voluntary negotiation for the periodfirst three years before the commercial incumbents are subject to mandatory relocation.
Auction 58 and Royal Street
In January 2005, the FCC conducted Auction 58 for wireless broadband PCS spectrum. Auction 58 was the first significant FCC auction for wireless broadband PCS spectrum since Auction 35 in 2001. Auction 58, like other major auctions conducted by the FCC, was designed to allow small businesses, very small businesses and other so called designated entities, or DEs, to acquire spectrum and construct wireless networks to promote competition with existing carriers. To that end, the FCC designated certain blocks of 2001wireless broadband PCS spectrum for which only DEs could apply. Qualified DEs were able to bid on these restricted or “closed” licenses which were not available to other bidders who did not qualify as DEs. In addition, very small business DEs were permitted to apply for and bid on “open” licenses with a bidding credit of 25% of the gross bid price. We entered into a cooperative arrangement with an unaffiliated very small business entrepreneur and invested in Royal Street, a DE that qualified to bid on “closed” licenses and was eligible for the 25% bidding credit on “open” licenses. We own a non-controlling 85% limited liability company member interest in Royal Street and may elect only two of the five members to Royal Street Communications’ management committee, which has the full power to direct the management of Royal Street Communications. C9 Wireless, LLC, or C9, has control over the operations of Royal Street because it has the right to elect three of the five members of Royal Street Communications’ management committee. C9 has the right to put all or part of its ownership interest in Royal Street Communications to us, but due to regulatory restrictions, we have no corresponding right to call C9’s ownership interest in Royal Street Communications. The put right has been structured so that its exercise will not adversely affect Royal Street’s continued eligibility as a very small business designated entity during periods where such eligibility is required. If C9 exercises its put right, we will be required to pay a fixed return on C9’s invested capital in Royal Street Communications, which fixed return diminishes annually beginning in the sixth year following the grant of Royal Street’s FCC licenses. These put rights expire in June 2012.
Auction 58 was completed in February 2005, and Royal Street made its final payment to the FCC for the licenses it won in Auction 58 in March 2005. In December 2005, Royal Street was granted the following licenses on which it was the high bidder at the conclusion of Auction 58: Los Angeles, California; and Orlando, Jacksonville, Lakeland-Winter Haven, Melbourne-Titusville and Gainesville, Florida basic trading areas.
Royal Street Communications holds all of the Auction 58 licenses through 2006.its wholly-owned subsidiaries and has entered into certain cooperative agreements with us relating to the financing, design, construction and operation of the networks. The Royal Street agreements are based on a “wholesale model” in which Royal Street plans to sell up to 85% of its engineered service capacity on a wholesale basis to us, which we in turn will market on a retail basis under the MetroPCS-brand to our customers within the covered area. In addition, the Royal Street agreements contemplate that MetroPCS, at Royal Street’s request and at all times subject to Royal Street’s direction and control, will build-out the networks, provide information to Royal Street relating to the budgets and business plans as well as arrange for administrative, clerical, accounting, credit, collection,
100
operational, engineering, maintenance, repair, and technical services. We do not own or control the Royal Street licenses. However, pursuant to contractual arrangements with Royal Street, we have access, via the wholesale arrangement, to as much as 85% of the engineered service capacity of Royal Street’s network with the remaining 15% reserved by Royal Street to sell to other parties.
Also, pursuant to another of the Royal Street agreements, upon Royal Street’s request, we will provide financing for the acquisition and build-out of licenses won in Auction 58. As of December 31, 2006 the maximum amount that Royal Street may borrow from us under the loan agreement is approximately $500 million. As of December 31, 2006 Royal Street has borrowed $394 million from us under the loan agreement, approximately $294 million of which was used for the acquisition of new licenses. In March 2007, Royal Street borrowed an additional $70 million from us under the loan agreement. Interest accrues under the loan agreement at a rate equal to 11% per annum, compounded quarterly. Royal Street has commenced repayment of that portion of the loans related to the Orlando and Lakeland-Winter Haven markets. The following table sets forth information regardingproceeds from this loan are to be used by Royal Street to make payments for the licenses won in Auction 58, to finance the build-out and operation of the Royal Street network infrastructure, and to make payments under the loan until Royal Street has positive free cash flow.
License Term
All of the broadband PCS licenses held by us and by Royal Street have an initial term of ten years after the initial grant date (which varies by license, but the initial San Francisco, Sacramento, Miami and Atlanta licenses were granted in January 1997), and, subject to applicable conditions, may be renewed at the end of their terms. The AWS licenses granted in Auction 66 have an initial term of fifteen years after the initial grant of the license. Each FCC license is essential to our
licensed marketsand Royal Street’s ability to operate and conduct our and Royal Street’s business in the area covered by that license. We continue to file renewal applications for our broadband PCS licenses as
the windows to file renewal applications open. One application has been granted and one application is currently pending for those licenses that expire in April 2007 and the FCC has granted all of
March 31, 2004(1): | | | | | | | | | |
| | | 2002 POPs(2)
| | MHz in
Market
| | 2001-2006
Annual
Population
Growth
Rate(2)
| | | Population
Density(3)
|
| | | (In thousands) | | | | | | | |
San Francisco Cluster: | | | | | | | | | |
San Francisco—Oakland—San Jose | | 7,375.9 | | 30 | | 1.05 | % | | 544 |
Salinas—Monterey | | 410.1 | | 30 | | 1.03 | % | | 124 |
| | |
| | | | | | | |
Subtotals/Average | | 7,786.0 | | | | 1.05 | % | | 462 |
Miami Cluster: | | | | | | | | | |
Miami—Fort Lauderdale | | 4,073.0 | | 30 | | 1.62 | % | | 970 |
West Palm Beach | | 1,213.6 | | 30 | | 2.02 | % | | 439 |
Fort Myers | | 654.7 | | 30 | | 2.04 | % | | 191 |
Fort Pierce—Vero Beach | | 447.9 | | 30 | | 1.86 | % | | 274 |
Naples | | 268.1 | | 30 | | 3.01 | % | | 134 |
| | |
| | | | | | | |
Subtotals/Average | | 6,657.3 | | | | 1.81 | % | | 475 |
Atlanta Cluster: | | | | | | | | | |
Atlanta | | 4,612.8 | | 20 | | 2.31 | % | | 420 |
Gainesville | | 259.4 | | 30 | | 2.53 | % | | 159 |
Athens | | 214.7 | | 30 | | 1.85 | % | | 156 |
| | |
| | | | | | | |
Subtotals/Average | | 5,086.9 | | | | 2.30 | % | | 364 |
Sacramento Cluster: | | | | | | | | | |
Sacramento | | 2,059.0 | | 30 | | 1.45 | % | | 129 |
Stockton | | 619.6 | | 30 | | 1.31 | % | | 254 |
Chico—Oroville | | 233.4 | | 30 | | 0.96 | % | | 79 |
Yuba City—Marysville | | 141.9 | | 30 | | 1.09 | % | | 114 |
| | |
| | | | | | | |
Subtotals/Average | | 3,053.9 | | | | 1.37 | % | | 135 |
Totals/Average | | 22,584.1 | | | | 1.60 | % | | 335 |
U.S. Totals/Average | | 291,248.0 | | | | 1.06 | % | | 82 |
(1) | The data in the above table does not include the 15 MHz licenses we recently acquired for four areas in northern California (Merced, Modesto, Eureka and Redding), with a total population of 1.2 million people. We are in the process of planning network deployment and have not begun to provide service in these areas. |
(2) | Source: Paul Kagan Associates, Inc. Wireless Telecom Atlas & Databook 2002. |
(3) | Number of POPs per square mile as of December 31, 2001. |
the renewal applications for those licenses that expired in January 2007. For a discussion of general licensing requirements, please see “— General Licensing Requirements and Broadband Spectrum Allocations.”
Distribution and Marketing We offer our
wirelessproducts and services under the
“metroPCS”“MetroPCS” brand
bothindirectly through
indirectapproximately 2,000 independent retail outlets and directly to our customers through
company-operated95 Company-operated retail stores.
At May 31, 2004, our distribution outletsincluded approximately 1,370 indirect retailers and 50 MetroPCS retail locations. Our indirect distribution outlets include a range of local, regional and national mass market retailers and specialty stores. For 2003, approximately 76%A significant portion of our gross customer additions have been added through our indirect distribution outlets and for the twelve months ended December 31, 2006, 84% of our gross customer additions were added through indirect channels. We have over 2,000 locations where customers can make their monthly payments, and many of these locations also serve as distribution points for our products and services. Our cost to distribute through direct and indirect distribution outlets. Wechannels is substantially similar, and we believe our mix of indirect and direct distribution providesallows us with the ability to reach the largest number of potential customers in our markets at a low relative cost. We plan to increase our number of indirect distribution outlets and company-operated stores.
Company-operated stores in both Core and Expansion Markets and in new markets acquired in the future, such as the Auction 66 Markets.
We
engage in local advertising in orderadvertise locally to develop our brand and support our indirect and direct distribution channels. We
advertise primarily
advertise through
local radio, cable,
television, outdoor and local print media. In addition, we believe we have benefited from a significant number of
word-of-mouth customer referrals.
Customer Care, Billing and Support SystemsOur
We use several outsourcing solutions to efficiently deliver quality service and support to our customers as part of our strategy of establishing and maintaining our leadership position as a low cost telecommunications
101
provider while ensuring high customer satisfaction
levels, has led us to pursue several outsourcing solutions to efficiently deliver quality service and support to our customers.levels. We outsource some or all of the following back office and support functions to nationally recognized third-party providers:
| | |
| | Ÿ• | | Customer CareCare.. Our We have outsourcing contracts with two nationally recognized call center vendors. These call centers are staffed with professional and bilingual customer service personnel, who are available to assist our customers 24 hours a day, 365 days a year. We also provide automated voice response services to assist our customers with routine information requests. We believe providing quality customer service is an important element in overall customer satisfaction.satisfaction and retention, and we regularly review performance of our call center vendors. |
|
| | Ÿ• | | BillingBilling.. We utilize a nationally recognized third-party billing platform, that enables us to billbills, monitors and monitoranalyzes payments from our customers. We offer our customers the option of receiving web-based and short messaging service-basedbillsas well as traditional paper bills. We also offer our customers the option of automatic payment of their bills via credit or debit cards. Very few of our customers utilize paper bills and substantially all of our customers receive their bills through the mail. We believeshort message service included with our current billing arrangement will provide us with sufficient scale as our business continues to grow.wireless service. |
|
| | Ÿ• | | Payment ProcessingProcessing.. Customers may pay their bills by credit card, debit card, check or cash. We have over 1,0002,000 locations where our customers who chosechoosing to pay cash for their monthly service in cash can make their payments. Many of these locationsalsoserve as distribution points for our products and services and are therefore conveniently locatedmaking them convenient for our customers to makecustomer payments. In addition, customersCustomers may also make payments at any of the more than 3,000 Western Union locations throughout our markets.metropolitan service areas. |
|
| | Ÿ• | | LogisticsLogistics.. We outsource the logistics associated with the shipping of handsets and accessories to our distribution channels.channels to a nationally recognized logistics provider. |
We believe we were the first U.S. wireless
broadband PCS carrier to have 100% of our customers on a CDMA 1XRTT network. We began
to build outbuilding our network in 2001, shortly after other CDMA carriers began
to upgradeupgrading their networks to 1XRTT. As a result, we
were able to deploybelieve we deployed our network with third generation capabilities at a
fraction of themuch lower cost
that wasthan incurred by other carriers
who were forced to undergo a technology migration to deploy second generation CDMA networks.
AllSince all of our handsets are CDMA 1XRTT compliant,
and as a result we receive the full capacity and quality benefits
thatprovided by CDMA 1XRTT
provides across our entire network and customer base.
As of
MarchDecember 31,
2004,2006, our network
consistedconsists of
seven11 switches at
fiveeight switching centers and
1,0033,397 operating cell
sites in operation.sites. A switching center serves several purposes, including routing calls, managing call handoffs, managing access to the public telephone network and providing access to voicemail and other value-added services. Currently,
almost all of our cell sites are co-located, meaning our equipment is located on leased facilities that are owned by third parties
who retainretaining the right to lease
thesethe facilities to
other carriers as well. We utilize ouradditional carriers. Our switching
centers’ capabilities for centers and national operations center providearound-the-clock monitoring of our network base stations and switches.
Our switches connect to the public telephone network through fiber rings
leased from third-parties, which facilitate the first leg of
originationoriginating and
termination ofterminating traffic between our equipment and
both local exchange and long distance carriers. We have negotiated interconnection agreements with
ourrelevant local exchange
carriers.carriers in our service areas.
We use third-party providers for long distance services and
forthe majority of the backhaul services. Backhaul services are the telecommunications services that
other carriers providewe use to carry
our traffic
to and from our cell sites
toand our switching facilities.
Wireless digital signal transmission is accomplished through the use ofby using various forms of frequency management technology, or “air interface protocols.” The FCC has not mandated a universal air interface protocol for
102
wireless broadband PCS systems. Rather,systems; rather, wireless broadband PCS systems in the United States operate under one of three principaldominant principle air interface protocols: code division multiple access, or CDMA; time division multiple access, or TDMA; or global system for mobile communications, or GSM. TDMA and GSM communications are both time division multiple access systems butAll three air interface protocols are incompatible with each other. CDMA is incompatible with both GSM and TDMA systems. Accordingly, a customer of a system that utilizes CDMA technology is unable to use a CDMA handset when traveling in an area not served by a CDMA-based wireless carrier, unless the customer carries a dual- band/dual-band/dual-mode handset that permits the customer to use the analog cellularalternate wireless system in that area. TheIn addition, certain carriers also restrict customers from changing the programming of their phones to be used on other carriers’ networks using the same issue appliesair interface protocol.
We believe 10 MHz of spectrum to
usersbe sufficient to begin service in metropolitan areas using technology that divides the base station coverage area served by a transmitter receiver into three parts or “sectors” (segments of
TDMAthe circle representing the base station’s broadcast area). However, in metropolitan areas with only 10 MHz of spectrum we have a network design capable of subdividing the service area into six parts or
GSM systems.sectors and to deploy these six-sector cells in selected, high-demand areas. This will increase the capacity of the wireless base stations in these markets by doubling the number of sectors over which a base station’s antennas can handle calls simultaneously. Our vendors have informed us that cell sites using six sectors have been in operation for many years in the U.S., and we have obtained actual performance data on cell sites that have been operational for multiple years. We and Royal Street have commercially deployed six-sector cell sites in certain geographic areas in 2006, and we anticipate that Royal Street will deploy this technology in Los Angeles in 2007.
We believe that CDMA technology uses spectrum more efficiently than any alternative commonly used wireless technology in 10 MHz. We also intend to buy EVRC-B, or 4G vocoder, handsets when available. 4G vocoder handsets allow for greater capacity in the network. We believe these handsets will be available in 2007. We currently intend to further enhance network capacity by upgrading our networks with EV-DO Revision A withVoice-Over-Internet-Protocol, or VoIP, which we anticipate will be available in 2008. When combined withsix-sector technology, it is our expectation that new 4G vocoder and EV-DO Revision A with VoIP will more than double the effective available spectrum relative to three-sector, 1XRTT technology. Thus, we believe 10 MHz of spectrum has the effective capacity of 20 MHz using today’s technologies. We anticipate that spectral efficiency will continue to improve over the next several years, allowing us to keep up with the increased usage of third-generation services.
As a result of Auction 66, we were granted licenses for additional spectrum in some of our existing 10 MHz metropolitan areas. We acquired this spectrum because the price of the spectrum was attractive when considering the additional cost that would have been incurred to employ the technologies described above to more fully utilize the existing 10 MHz. In many cases, our Auction 66 spectrum will allow us to enlarge our existing geographic service area, which we believe will further enhance the attractiveness of our services.
Our decision to use CDMA
wasis based on several key advantages
relative toover other digital protocols, including the following:
Higher network capacitycapacity.. Cellular technology capitalizes on
frequency reuse perreusing discrete amounts of spectrum at a cell
site. CDMA has a reuse of one, meaningsite that
every frequency channel can be used
at another cell site in
each cell. TDMA and GSM have a frequency reuse of greater than one, meaning that every frequency channel cannot be reused in a cell. Therefore, CDMA uses the
entire frequency in each cell rather than using only a fraction of such frequency as is typically the case with TDMA and GSM technologies.system. We believe, based on studies by CDMA handset manufacturers, that our implementation of CDMA digital technology will eventually provide
system capacity that is approximately seven to ten times
greater than thatthe system capacity of analog technology and approximately three times
greater than thatthe system capacity of TDMA and GSM systems, resulting in significant operating and cost efficiencies. Additionally, we believe that CDMA technology provides network capacity and call quality that
areis superior to
that of other wireless technologies.
Longerhandset
battery lifelife.. TDMA and GSM system power control is less stringent by design than CDMA, whereas the power regulating nature of CDMA establishes a communication link with a customer handset at the lowest possible power level suitable for high-quality voice transmission. As a result, while While a digital handset using any of the three
technologiesdigital air interface protocols has a substantially longer battery life than an analog cellular handset,
battery life in CDMA handsets can
be proportionately extended to provide
even longer periods between
recharges.battery recharges than other commonly deployed digital PCS technologies.
Fewer dropped callscalls.. CDMA systems transfer calls throughout the CDMA network using a technique referred to as a soft“soft hand-off,” which connects a mobile customer’s call with a new base station while maintaining a connection with the base station currently in use.use, and “hard hand-off,” which disconnects the call from the current base station
103
when it connects to another base station. CDMA networks monitor the quality of the transmission received by multiple
neighbor base stations simultaneously to select
a betterthe best transmission path and to ensure that the
network doescall is not
disconnect the calldisconnected in one
cellbase station unless replaced by a stronger signal from
another base station.another. Analog, TDMA and GSM networks
only use a hard hand-off and disconnect the call from the current base station as it connects with a new one without any simultaneous connection to both base stations.
This characteristic ofSince CDMA
allows for both hard and soft hand-off, it results in fewer dropped calls compared to other
wireless technologies.
Simplified frequency planningplanning.. Frequency planning is the process by which wireless service providers analyze and test alternative patterns of frequency use within their systems to minimize interference and maximize capacity. Currently, TDMA and GSM service providers spend considerable time and money on frequency planning because
of the need tothey must reuse frequencies to maximize
capacity throughout a network. Withnetwork capacity. CDMA technology
however,allows reuse of the same subset of allocated frequencies
can be reused in every cell, substantially reducing the need for costly frequency planning.
Efficient migration pathpath.. CDMA 1XRTT technology can be
further upgraded easily and
cost effectively,cost-effectively for enhanced voice and data capabilities. The
technology requires relatively low incremental investment
infor each step along the migration path
is an advantage of this technology. Additional steps can be takenwith relatively modest incremental capital investment levels as demand for more robust data services or
need for additional capacity
develops at relatively modest capital investment levels. Handset compatibility is a primary objective of CDMA 2000, 1XRTT, IS-95A and IS-95B. Therefore, our 1XRTT system supports IS-95A, IS-95B and 1XRTT handsets.develops.
Privacy and securitysecurity.. CDMA uses
coding to isolate users, whereas TDMA and GSM use time slots to isolate the users. Furthermore, CDMA uses a very long code extending over multiple days whichtechnology that requires accurate time and code phase knowledge to
decode. Therefore, CDMA offers increaseddecode, increasing privacy and security.
We compete directly in each of our marketsmetropolitan areas with other wireless service providers, and with wireline providers ascompanies and increasingly with cable companies by providing a mobilewireless alternative to traditional landlinewireline service. The wireless industry is dominated by national carriers, such as Cingular Wireless, Verizon Wireless, Sprint Nextel andT-Mobile and their prepaid affiliates or brands, which have an estimated 84% of the national wireless market share as measured by number of subscribers, according to the Federal Communications Commission’s Annual Report and Analysis of Competitive Market Conditions with Respect to Commercial Mobile Services, FCC06-142, released September 29, 2006. National carriers typically offer post-paid plans that require long-term contracts and credit checks or deposits. Over the past few years, the wireless industry has seen an emergence of several new competitors that provide either pay-as-you-go or prepaid wireless services. Some of these competitors, such as Virgin Mobile USA, Amp’d Mobile and Tracfone, are non-facility based mobile virtual network operators, or MVNOs, that contract with wireless network operators to provide a separately branded wireless service. These MVNOs typically also charge by the minute rather than offering flat-rate unlimited service plans. In addition, several large satellite companies, computer companies, and Internet search and portal companies have indicated an interest in establishing next generation wireless networks and VoIP providers have indicated that they may offer wireless services over a Wi-Fi/Cellular network to compete directly with us. Some companies, such as Leap Wireless d/b/a Cricket and Sure West Wireless, are regional carriers with unlimited fixed-rate service plans similar to ours. Sprint Nextel recently announced that it will offer on a trial basis an unlimited local calling plan under its Boost brand in certain of the geographic areas in which we offer or plan to offer service. Thus, we compete with both the national carriers, the prepaid, pay-as-you-go service providers and in some cases regional and local carriers, and may face additional competition from new entrants with substantial resources in the future. We believe that competition for subscribers among wireless communications providers is based primarily uponmostly on price, service area, services and features, offered, call quality and customer service. The wireline industry is also dominated by large incumbent carriers, such as AT&T, Verizon, and BellSouth, and competitive local exchange orVoice-Over-Internet-Protocol, or VoIP, service providers, such as Vonage, McLeod USA, and XO Communications. The cable industry is also dominated by large carriers such as Time Warner Cable, Comcast and Cox Communications. These cable companies formed a joint venture along with Sprint Nextel and Bright House Networks called SpectrumCo LLC, or SpectrumCo, which bid on and acquired 20 MHz of AWS spectrum in a number of major metropolitan areas throughout the United States, including all of the major metropolitan areas which comprise our Core, Expansion and Auction 66 Markets.
Many of our competitors havewireless, wireline and cable competitors’ resources are substantially greater, resources and their market shares are larger, market share than we have,ours, which may affect our ability to compete successfully. Additionally, many of our
104
wireless competitors offer larger coverage areas or nationwide calling plans that do not
requiregive rise to additional
roaming charges,
for roaming, and the competitive pressures of the wireless communications industry have
caused other carriersled them to offer service plans with
increasingly largegrowing bundles of minutes of use at
increasingly low prices. These competitivelower per minute prices or price plans with unlimited nights and weekends. Our competitors’ plans could adversely affect our ability to maintain our pricing, market penetration,
growth and customer retention.
Furthermore,In addition, large national wireless carriers have been reluctant to enter into roaming agreements at attractive rates with smaller and regional carriers like us, which limits our ability to serve certain market segments. Moreover, the FCC
may pursueis pursuing policies
designed to make availablemaking additional spectrum for
the provision of wireless services
available in each of our markets, which may increase the number of
wireless competitors we face and enhance the ability of our wireless competitors
and enhance our wireless competitors’ ability to offer additional plans and services.
Further, since many of our competitors are large companies, they can require handset manufacturers to provide the newest handsets exclusively to them. Our competitors also can afford to heavily subsidize the price of the subscriber’s handset because they require long term contracts. These advantages may detract from our ability to attract customers from certain market segments.
We also compete with companies that useusing other communications technologies, including paging, and digital two-way paging, enhanced specialized mobile radio, and domestic and global mobile satellite service.service, and wireline telecommunications services. We also may face competition from providers of an emerging technology known as WiMax which is capable of supporting wireless transmissions suitable for mobility applications. Also, certain mobile satellite providers recently have received authority to offer ancillary terrestrial service and a coalition of companies which includes DIRECTTV Group, EchoStar, Google, Inc., Intel Corp. and Yahoo! has indicated its desire to establish next generation wireless networks and technologies in the 700 MHz band. These technologies may have advantages over theour technology we use andthat customers may ultimately befind more attractive to customers. Weattractive. Additionally, we may compete in the future with companies that offer new technologies and market other services that we do not offer.offer or may not be available with our network technology, from our vendors or within our spectrum. Some of our competitors do or may offerbundle these other services together with their wireless communications service, which customers may make their servicesfind more attractive to customers. In addition, energyattractive. Energy companies, utility companies, satellite companies and cable operators also are expanding their services to offer communicationstelecommunications services.
In the future, we may also face competition from mobile satellite service, or MSS, providers, as well as from resellers of these services. The FCC has granted to some MSS providers, and may grant others, the flexibility to deploy an ancillary terrestrial component to their satellite services. This added flexibility may enhance MSS providers’ ability to offer more competitive mobile services. In addition, we also may face competition from providers of WiMax, which is capable of supporting wireless transmissions suitable for mobility applications, using exclusively licensed or unlicensed spectrum. As competition develops, we may add additional features or services to our existing service plans, or make other changes to our service plans.
105
Seasonality
Net customer additions are typically strongest in the first and fourth calendar quarters of the year. Softening of sales and increased churn in the second and third calendar quarters of the year usually combine to result in fewer net customer additions during the second and third calendar quarters. The following table sets forth our net subscriber additions and total subscribers from the first quarter of 2004 through the fourth quarter of 2006.
| | | | | | | | | | | | | | | | | | | | | | | | | |
| | | MetroPCS Subscriber Statistics | |
| | | Net Additions | | | Subscribers | |
| | | Core
| | | Expansion
| | | | | | Core
| | | Expansion
| | | | |
| | | Markets | | | Markets | | | Consolidated | | | Markets | | | Markets | | | Consolidated | |
| | | (In 000s) | |
| |
2004 | | | | | | | | | | | | | | | | | | | | | | | | |
| Q1 | | | 174 | | | | — | | | | 174 | | | | 1,151 | | | | — | | | | 1,151 | |
| Q2 | | | 63 | | | | — | | | | 63 | | | | 1,214 | | | | — | | | | 1,214 | |
| Q3 | | | 66 | | | | — | | | | 66 | | | | 1,280 | | | | — | | | | 1,280 | |
| Q4 | | | 119 | | | | — | | | | 119 | | | | 1,399 | | | | — | | | | 1,399 | |
2005 | | | | | | | | | | | | | | | | | | | | | | | | |
| Q1 | | | 169 | | | | — | | | | 169 | | | | 1,568 | | | | — | | | | 1,568 | |
| Q2 | | | 77 | | | | — | | | | 77 | | | | 1,645 | | | | — | | | | 1,645 | |
| Q3 | | | 95 | | | | — | | | | 95 | | | | 1,740 | | | | — | | | | 1,740 | |
| Q4 | | | 132 | | | | 53 | | | | 185 | | | | 1,872 | | | | 53 | | | | 1,925 | |
2006 | | | | | | | | | | | | | | | | | | | | | | | | |
| Q1 | | | 184 | | | | 61 | | | | 245 | | | | 2,056 | | | | 114 | | | | 2,170 | |
| Q2 | | | 63 | | | | 186 | | | | 249 | | | | 2,119 | | | | 300 | | | | 2,419 | |
| Q3 | | | 55 | | | | 142 | | | | 198 | | | | 2,174 | | | | 442 | | | | 2,617 | |
| Q4 | | | 127 | | | | 198 | | | | 324 | | | | 2,301 | | | | 640 | | | | 2,941 | |
Inflation
We do not believe that inflation has had a material effect on our operations.
As of
MarchDecember 31,
2004,2006, we had
8592,046 employees. We believe
that our relationship with our employees is good. None of our employees is
covered by a collective bargaining agreement or represented by an employee union.
We
currently maintain our executive offices in Dallas, Texas, and regional offices in Alameda, California; Sunrise, Florida; Norcross, Georgia;
Folsom, California; Plano, Texas; Livonia, Michigan; Irvine, California; Tampa, Florida; and
Folsom, California. WeOrlando, Florida. As of December 31, 2006, we also
operate 50operated 95 retail stores throughout our
markets.metropolitan areas. All of our
regional offices, switch sites, retail stores and virtually all of our cell site facilities are
leased.Legal Proceedings
From time to time, weleased from unaffiliated third parties. We believe these properties, which are involved in litigation that we consider to be inbeing used for their intended purposes, are adequate and well-maintained.
Regulation
The government regulates the
normal course of business. We are not party to any pending legal proceedings that we believe would, individually or in the aggregate, have a material adverse effect on our financial condition or results of operations.LEGISLATION AND GOVERNMENT REGULATIONS
The wireless communicationstelecommunications industry is subject to extensive governmental regulation onextensively at both the federal level and, to varying degrees, onat the state level. The enactment of the Telecommunications Act of 1996 has had an effect on many aspects of this regulation. In addition, this regulation currently is the subject of administrativeand local levels. Administrative rulemakings, legislation and judicial proceedings that arecan affect this government regulation and may be significant to us. In recent years, the regulation of the communications industry has been in a state of flux as Congress, the FCC, state legislatures and state
106
regulators have passed laws and promulgated policies to foster greater competition in telecommunications markets.
Federal RegulationThe licensing, construction, modification, operation, ownership, sale
Wireless telecommunications systems and
interconnection arrangements of wireless communications systemsservices are subject to
regulations and policies adopted by the FCCextensive federal regulation under the Communications Act
of 1934, as amended, orand the
Communications Act.implementing regulations adopted thereunder by the FCC. These regulations and
associated policies govern, among other things, applications for
and renewals of licenses to construct and operate wireless communications systems, ownership of wireless licenses and the transfer of control or assignment of such licenses,
and the ongoing technical,
operational and
operationalservice requirements under which wireless licensees must
operate.operate, the rates, terms and conditions of service, the protection and use of customer information, roaming policies, the provision of certain services, such asE-911, and the interconnection of communications networks.
General Licensing Requirements and Broadband Spectrum Allocations The FCC
awardedawards certain broadband PCS licenses for
protected geographic service areas called
major trading areas,Major Trading Areas, or MTAs, and
basic trading areas,other broadband PCS licenses for Basic Trading Areas, or BTAs,
which are defined by Rand McNally & Company. Under
this scheme,the broadband PCS licensing plan, the United States and its possessions and territories are divided into 493 BTAs, all of which are included within 51 MTAs. The FCC
has allocatedallocates 120 MHz of radio spectrum in the 1.9 GHz band for licensed broadband PCS. The FCC divided the 120 MHz of spectrum into two 30 MHz blocks, known as the
AA- and
B blocks,B-Blocks, licensed for each of the 51 MTAs, one 30 MHz block, known as the
C block,C-Block, licensed for each of the 493 BTAs, and three 10 MHz blocks, known as the
D, ED-,E- and
F blocks,F-Blocks, licensed for each of the 493 BTAs, for a total of more than 2,000 licenses. Each
broadband PCS license authorizes operation on one of six frequency blocks allocated for broadband PCS.
However, licensees are given the flexibility to partition their service areas and to disaggregate their spectrum into smaller areas or spectrum blocks with the approval of the FCC. The FCC has adoptedalso awarded two cellular licenses on a metropolitan statistical area, or MSA, and rural service area, or RSA, basis with 25 MHz of spectrum for each license. There are 306 MSAs and 428 RSAs in the United States. Licensees of cellular spectrum can offer PCS services in competition with broadband PCS licensees. Many of our competitors utilize a combination of cellular and broadband PCS spectrum to provide their services.
In 2005, the FCC allocated an additional 90 MHz of spectrum to be used for AWS. Each AWS license authorizes operation on one of six frequency blocks. The FCC divided the 90 MHz of spectrum into two 10 MHz and one 20 MHz blocks licensed for each of 12 designated regional economic area groupings, or REAG, one 10 MHz and one 20 MHz block licensed for each of 176 designated economic areas, or EA, licenses, and a 20 MHz block licensed for each of 734 designated metropolitan statistical area/rural service area basis. The economic areas are geographic areas defined by the Regional Economic Analysis Division of the Bureau of Economic Analysis, U.S. Department of Commerce. Regional economic areas are collections of economic areas. Metropolitan statistical areas and rural service areas are defined by the Office of Management and Budget and the FCC, respectively. Licensees of AWS spectrum can offer PCS and cellular services in competition with broadband PCS and cellular licensees. The FCC auctioned the AWS spectrum in a single multiple round auction which commenced on August 9, 2006. In November 2006, the FCC granted us 10 MHz REAG licenses in the Northeast and West, and 10 MHz EA licenses in New York, Detroit-Ann Arbor, Dallas/Ft. Worth, Las Vegas, Grand Rapids-Muskegon-Holland, Michigan, and Shreveport-Bossier City, Louisiana. See “Business — Ownership Restrictions.”
On April 27, 2007, the FCC released a Report and Order and Further Notice of Proposed Rulemaking relating to the 700 MHz band. There is currently 60 MHz of spectrum available in the 700 MHz band. The FCC by statute is obligated to commence an auction for this spectrum in January 2008. In the FCC’s order, the FCC proposed alternative band plans, construction and performance build-out obligations, revisions to the 700 MHz guard bands, competitive bidding procedures, configuration of the public safety spectrum, and service rules with respect to the 700 MHz spectrum. We are participating in this proceeding and advocating a greater number of smaller license areas and relaxed performance build-out requirements, but cannot predict the likely outcome or whether it will benefit or adversely affect us. Furthermore, the FCC seeks comment on the
107
possible implementation of a nationwide broadband interoperable network in the 700 MHz band allocated for public safety use, which also could be used by commercial service providers on a secondary basis. On September 8, 2006, the FCC also sought comment on the existing licenses in the 700 MHz spectrum and the disposition of the 700 MHz spectrum returned by Nextel Communications. We are considering whether to participate in the auction for the 700 MHz spectrum.
The FCC sets construction benchmarks for
broadband PCS
and AWS licenses. All
30 MHz broadband PCS licensees,
holding licenses originally granted as 30 MHz licenses, must construct facilities
that offer coverage to
provide service covering one-third
of the population of their service
areaarea’s population within five years, and two-thirds of the population within ten years, of their initial license
grants.grant date. All
broadband PCS licensees holding licenses which originally were granted as, or disaggregated to become, 10 MHz and 15 MHz
block licenseeslicenses must
construct facilities to provide service to 25% of the
servicelicense area within five years of their initial license
grants,grant date, or make a showing of substantial service. While the FCC has granted limited extensions
to and waivers of these requirements, licensees
that failfailing to meet
thethese coverage requirements
maygenerally must forfeit their license. Either we or the previous licensee for each of our broadband PCS licenses has satisfied the applicable five-year coverage requirement for our licenses and the ten-year requirement for those licenses with license terms expiring in January 2007. All AWS licensees will be
subjectrequired to
forfeitureconstruct facilities to provide substantial service by the end of the
license. We have satisfiedinitial15-year license term. The FCC has proposed for the
initial five-year60 MHz to be auctioned in the 700 MHz band geographic construction requirements
for allwhich would require a licensee to construct 25% of the
PCS licenses we currently hold.geographic area in 3 years, 50% in 5 years and 75% in 8 years.
The FCC generally grants
broadband PCS licenses for
ten-year terms
of ten years that are renewable upon application to the FCC.
Near the conclusion of theAWS licenses are granted for an initial15-year term and then are renewable for successive ten-year terms. Our initial PCS license
term,terms ended in January 2007 and we
must filehave filed renewal applications for
renewal of licenses to obtain authority to operate for an additional ten-year
term.terms. All of these applications for our initial PCS licenses have been granted. We also are filing renewal applications for our other PCS licenses as the filing windows open and in some instances our applications already have been granted while others are still pending or waiting for the filing window to open. Our initial AWS license terms end in November 2021. The FCC may
revokedeny our
licensesbroadband PCS and
may deny ourAWS license renewal applications for cause after appropriate notice and hearing. The FCC will award a renewal expectancy to us
for our broadband PCS licenses if we meet specific
standards of past
performance. If we receive a renewal expectancy, it is very likely that the FCC will renew our existing PCS licenses so that they will not become subject to competing applications. The FCC has not yet issued any renewal expectancies for PCS licensees, and has clarified only the basic requirements and process.performance standards. To receive a renewal expectancy
for our broadband PCS licenses, we must show that we have provided substantial service during our past license term, and have substantially complied with applicable FCC rules and policies and the Communications Act. The FCC defines substantial service as service which is sound, favorable and substantially above a
level of mediocre service
that mightlevel only minimally
warrantwarranting renewal. If
we receive a
licensee doesrenewal expectancy, it is very likely that the FCC will renew our existing broadband PCS licenses. If we do not receive a renewal expectancy,
then the FCC
willmay accept competing applications for the license renewal period, subject to a comparative hearing, and
the FCC may award the
broadband PCS license for the
subsequentnext term to another entity.
We believe we will be eligible for a renewal expectancy for our broadband PCS licenses that will be renewed in the near term, but cannot be certain because the applicable FCC standards are not precisely defined.
The FCC may deny applications for FCC
authority,licenses, and in extreme cases revoke FCC licenses, if it finds
that an entitya licensee lacks the requisite
character qualifications to be a licensee. In making this determination, the FCC considers
whether an applicant or licensee has been the subject ofany adverse findings
against the licensee or applicant in a judicial or administrative proceeding involving felonies,
the possession or sale of
unlawfulillegal drugs, fraud, antitrust violations or unfair
competition, employment discrimination, misrepresentations to the FCC or other government agencies, or serious violations of the Communications Act or FCC regulations. We believe there are no activities and no judicial or administrative proceedings in which we are involvedinvolving us that would warrant such a finding by the FCC.
The FCC also regulateshas other broadband wireless spectrum allocation proceedings in process. In 2004, the FCC sought comment on service rules for an additional 20 MHz of AWS spectrum in the1915-1920��MHz,1995-2000 MHz,2020-2025 MHz and2175-2180 MHz bands and has indicated that it intends to initiate a further proceeding with regard to an additional 20 MHz of AWS spectrum in the2155-2175 MHz band in the future. These proposed allocations present certain unique spectrum clearing and interference issues, and we cannot predict with any certainty the likely timing of these proposed allocations. A company also has filed an application for 20 MHz of this spectrum to be licensed on an exclusive basis without an auction, which the
108
FCC put on public notice on March 9, 2007. A number of other aspectscompanies have also filed applications for this spectrum.
Transfer and Assignment of the wireless business. Federal legislation enacted in 1993 requires the FCC to reduce the disparities in the regulatory treatment of similar mobile services, such as cellular, PCS and enhanced specialized mobile radio, or ESMR, services. Under this regulatory structure, all of our PCS licenses are classified as Commercial Mobile Radio Services, or CMRS, licenses. The FCC regulates CMRS carriers as common carriers, and thus we are subject to many generally applicable common carrier requirements under the Communications Act and FCC rules and regulations. The FCC, however, has exempted cellular and PCS offerings from some typical common carrier regulations, such as tariff and interstate certification filings, thereby allowing us to respond more quickly to our competition in the marketplace. The 1993 federal legislation also preempted state rate and entry regulation.The FCC permits cellular, broadband PCS, paging and ESMR licensees to offer fixed services on a co-primary basis along with mobile services. This rule may facilitate the provision of wireless local loop service, which involves the use of wireless links to provide local telephone service by CMRS licensees, although the extent of lawful state regulation of such wireless local loop service is undetermined. While we do not presently have a fixed service offering, our network is fully capable of accommodating such a service. We continue to evaluate our service offerings which may include a fixed service plan at some point in the future.
Until April 4, 2005, the FCC requires that a PCS licensee ensure that its operations do not cause interference to incumbent licensees that operate fixed microwave systems within the PCS licensee’s license area. In an effort to balance the competing interests of existing microwave users and newly authorized PCS licensees, the FCC adopted a transition plan to relocate such microwave operators to other spectrum blocks and a cost sharing plan so that if the relocation of an incumbent benefits more than one PCS licensee, the benefiting PCS licensees will share the cost of the relocation. The transition and cost sharing plans expire on April 4, 2005, at which time remaining incumbents in the PCS spectrum will be responsible for their costs to relocate to alternate spectrum locations. We have fulfilled all of the relocation obligations (and related payments) we directly incurred in our PCS markets, and we have ongoing obligations of approximately $3.8 million that are payable to other carriers under cost sharing plans related to microwave relocation in our markets. The FCC allows “designated entities” to pay these shared relocation expenses over the same term as the applicable FCC license for the area. Each of these obligations has a ten-year term, with interest only payments through year six and principal payments commencing in year seven.
Ownership RestrictionsLicenses
Pursuant to a Report and Order released in December 2001, as of January 1, 2003, the FCC no longer enforces a particular limit on the amount of CMRS spectrum in which an entity may hold an attributable interest. The FCC now engages in a case-by-case review of transactions that would raise concerns similar to those that the CMRS spectrum cap was designed to address. By eliminating a hard cap in favor of the more flexible analysis, we believe the changes adopted by the FCC in the December 2001 Report and Order could further increase the ability of wireless operators to attract capital or to make investments in other wireless operators.
The FCC may prohibit or impose conditions on assignments and transfers of control of licenses.
The Communications Act requires prior FCC approval for assignments or transfers of control of any license or construction permit, with limited exceptions.
The FCC may prohibit or impose conditions on assignments and transfers of control of licenses. We have managed to secure the requisite approval of the FCC to a variety of assignment and transfer proposals without undue delay. Although we cannot assure you that the FCC will approve or act in a timely fashion
uponon any
of our future requests
for approval of assignmentsto approve assignment or transfer of control applications,
that we file, we have no reason to believe
that the FCC
wouldwill not approve or grant such requests or applications in due course. Because an FCC license is necessary to lawfully provide
PCSwireless broadband service,
if the FCC
were to disapprovedisapproval of any such
filingrequest would adversely affect our business
plans would be adversely affected.plans.
The FCC allows
broadband PCSFCC licenses and service areas to be
partitionedsubdivided geographically or
disaggregated by bandwidth, with each
partitioned or disaggregateddivided license covering a smaller service area
and/or less spectrum. Any such
partitioning or disaggregationdivision is subject to FCC approval, which cannot be guaranteed. In addition,
onin May
15, 2003, the FCC adopted a Report and Order to facilitate
the development of a secondary market for unused or underused wireless spectrum by imposing less restrictive standards
for the transferon transferring and
leaseleasing of spectrum to third parties.
The availability of these options providesThese policies provide us with
a flexible alternative
means to obtain additional spectrum or dispose of excess spectrum, subject to FCC approval and applicable FCC conditions. These alternatives also
are available as a means forallow our competitors to obtain additional spectrum or
for new competitors to enter our markets.
Ownership Restrictions
Before January 1, 2003, the FCC rules establishimposed a “spectrum cap” limiting to 55 MHz the amount of commercial mobile radio service, or CMRS, spectrum an entity could hold in a major market. The FCC now has eliminated the spectrum cap for CMRS in favor of acase-by-case review of transactions raising CMRS spectrum concentration issues. Previously decided cases under thecase-by-case approach indicate that the FCC will screen a transaction for competitive concerns if 70 MHz of cellular and broadband PCS spectrum in a single market is attributable to a party or affiliated group, or if there is a material change in the post-transaction market share concentrations as measured by the Herfindahl-Hirschman Index. The 70 MHz benchmark may change over time as more and more broadband spectrum is made available, and its applicability to AWS or 700 MHz spectrum is unclear. By eliminating a spectrum cap for CMRS in favor of a more flexible analysis, we believe the FCC’s changes will increase wireless operators’ ability to attract capital, acquire additional spectrum, and make investments in other wireless operators. We also believe that these changes allow our competitors to make additional acquisitions of spectrum and further consolidate the industry.
The FCC rules initially established specific ownership requirements for broadband PCS licenses obtained in the CC- and F blockF-Block auctions, which are known as the entrepreneur’s block auctions. OurWe were subject to these requirements until recently because our licenses were obtained in the C block auction and thus are subject to these requirements. For the C block auction in whichC-Block auction. When we acquired ourC-Block broadband PCS licenses, the FCC’s rules for the C-Block auction permitted entities to exclude the gross revenues and assets of an entity’s non-attributable investors in determining eligibility as a “designated entity”DE and small business, so long as the licensee employed one of two control group structural options. We elected to meet the 25% control group structural option which requiresrequired that, forduring the first ten years of the initial license term (which for us will endwould have ended on January 27, 2007), a licensee have an established group of investors that meetmeeting the requirements set forth for the entrepreneur blockC-Block auctions, holdholding at least 50.1% of the voting interests of the licensee, havepossessing actual and legal control of both the control group and the licensee, and electelecting or appointappointing a majority of the licensee’s board of directors. In addition, those qualifying investors arewere required to hold no less than a specified percentage of the equity: afterequity. After the first three years of the license term (which for us ended January 27, 2000), the qualifying investors must collectively retain at least 10% of the licensee’s equity interests in the licensee.interests. The 10% equity interest maycould be held in the form of options, provided that thesethe options arewere exercisable at any time, solely at the holder’s discretion, at an exercise price less than or equal to the current market valuationvalue of the underlying shares at the time ofon the short-form auction application filing date or, for options issued later, the date such options were issued.
109
options’ issue date. Finally, under the 25% control group
structural option, no investor or group of affiliated investors
that is not in the control group
maywas permitted to hold
more thatover 25% of the licensee’s overall equity during the initial license term.
Although
In August 2000, the FCC revised its control group requirements as they applied to DE licensees. The revised rules apply a control test that obligates the eligible very small business members of a DE licensee to maintainde facto (actual) andde jure(legal) control of the business. Because we had taken advantage of installment payments at the time we purchased the licenses in the C-Block auction, we were still required to comply with the control group requirements. In May 2005, we paid off the remaining installments we owed to the FCC on all of the licenses we acquired in the C-Block auction. In addition, none of the license acquisitions made by us after theC-Block auction required that we qualify as a DE. As a consequence, upon repayment of the installments to the FCC, we were no longer subject to the FCC rules and regulations pertaining to unjust enrichment or installment financing. Based on this change of circumstances, we were no longer required to maintain our previous status as an eligible DE or to abide by the ownership requirementsrestrictions applicable to DEs under the 25% control group option. In August 2005, we filed administrative updates with the FCC with respect to all of our FCC licenses, will expirewhich served to notify the FCC and all interested parties of this change of circumstances. Effective as of December 31, 2005, MetroPCS Communications, Inc.’s Class A Common Stock was converted into our common stock and the built-in control structures required to maintain our DE status were terminated with the consent of the FCC.
Royal Street is a DE which must meet and continue to abide by the FCC’s DE requirements, including the revised control group requirements. The FCC rules provide that if a license is transferred to a non-eligible entity, an entity which qualifies for a lesser credit on January 27, 2007,open licenses, or the tenth anniversaryDE ceases to be qualified, the licensee may lose all closed licenses which are not constructed, and may be required to refund to the FCC a portion of the datebidding credit received for all open licenses, based on which theya five-year straight-line basis and might lose its closed licenses or be required to pay an unjust enrichment payment on the closed licenses. In Auction 58, Royal Street received a bidding credit equal to approximately $94 million. If Royal Street were granted byfound to no longer qualify as a DE, it would be required to repay the FCC itthe amount of the bidding credit on a five-year straight-line basis. Any closed licenses which are transferred prior to the five-year anniversary may also be subject to an unjust enrichment payment. Royal Street also is possibleparty to certain grandfathered arrangements with us that we will acquirecannot be extended to new or additional FCClicenses due to recent changes in the DE rules. For this reason, the ability of Royal Street to own or control additional licenses in the aftermarket that are subjectfuture will be inhibited absent significant changes in the business relationship with us.
Specifically, in April 2006, the FCC adopted a Second Report and Order and Second Further Notice of Proposed Rulemaking relating to similar ownership restrictions. Depending on when such licenses were initially grantedits DE program. This Order was clarified by the FCC in orderits June 2006 Order on Reconsideration of the Second Report and Order, which largely upheld the rules established in the Second Report and Order but clarified that the FCC’s revised unjust enrichment rules would only apply to licenses initially granted after April 25, 2006 (the Second Report and Order, as clarified by the Order on Reconsideration, is referred to herein as the DE Order). First, the FCC found that an entity that enters into an impermissible material relationship will be eligibleineligible for award of designed entity benefits and subject to hold suchunjust enrichment on alicense-by-license basis. The FCC concluded that any arrangement whereby a DE leases or resells more than fifty percent of the capacity of its spectrum or network to third parties is an impermissible material relationship and will render the licensee ineligible for any DE benefits, including bidding credits, installment payments, and, as applicable, set-asides, and will subject the DE to unjust enrichment payments on alicense-by-license basis. Second, the FCC found that any entity which has a spectrum leasing or resale arrangement (including wholesale arrangements) with an applicant for more than 25% of the applicant’s total spectrum capacity on alicense-by-license basis will be considered to have an attributable interest in the applicant. Based on these revised rules, Royal Street will not be able to enter into the same relationship it currently has with us for any future FCC auctions and receive DE benefits, including bidding credits. In addition, Royal Street will not be able to acquire any additional DE licenses we couldin the future, and resell services to us on those licenses on the same basis as the existing arrangements, without making itself ineligible for DE benefits. The FCC, however, grandfathered otherwise impermissible material
110
relationships for existing licenses that were entered into or filed with the FCC before the release date of the FCC order.
Third, the FCC has revised the DE unjust enrichment rules to provide that a licensee which seeks to assign or transfer control of the license, enter into an otherwise impermissible material relationship, or otherwise loses its eligibility for a bidding credit for any reason, will be required to
continue to comply with the 25% control group structural option beyond January 27, 2007, unlessreimburse the FCC
has approved a different structural option for
us.Althoughany bidding credits received as follows: if the DE loses its eligibility or seeks to assign or transfer control of the license, the DE will have to reimburse the FCC terminated future application of its control group requirements in August 2000, allowing licensees to qualify as designated entities by meeting alternative controlling interests rules, the FCC held that existing licensees could continue to qualify under the rules in existence at the time they received their licenses. We met and continue to meet the 25% control group structural option. In order to meet the control group requirements, our certificate of incorporation provides that our Class A common stock, as a class, must constitute 50.1%for 100% of the aggregate voting power of all classes and series of our capital stock and electbidding credit plus interest if such loss, assignment or appoint a majority of our board of directors. In addition, our bylaws provide for restrictions on transfer relating to shares of our capital stock held by investors that are qualifying investors, and our certificate of incorporation includes redemption rights that allow us to redeem shares of our capital stock, as necessary, in order to ensure our continued compliance with the control group structural option rules for the purposes of C block license requirements.
FCC rules also allowed companies to qualify as a designated entity in the 1996 C Block auction where they met the FCC’s definition of a “Publicly Traded Corporation with Widely Dispersed Voting Power.” To qualify for this alternative structural option, a company had to demonstrate that no person or entity:
| Ÿ | | owned more than 15% of the company’s equity; |
| Ÿ | | possessed, either directly or indirectly, the power to control the election of more than 15% of the members of the company’s board of directors; or |
| Ÿ | | had de facto control over the company. |
We intend to request approval from the FCC to adopt this alternative structure without financial penalty after the consummation of this offering. Prior to the consummation of this offering, our certificate of incorporation will be amended to allow us to redeem shares of our capital stock to ensure that we are eligible for this structure.
FCC rules impose specific restrictions on the voluntary assignments or transfers of control of C block licenses. Duringoccurs within the first five years of the license term; 75% if during the sixth and seventh year of the license term; 50% if during the eighth and ninth of the license term; and 25% in the tenth year. In addition, to the extent that a DE enters into an impermissible material relationship, seeks to assign or transfer control of the license, or otherwise loses its eligibility for a bidding credit for any reason prior to the filing of the notification informing the FCC that the construction requirements applicable at the end of the license term (or untilhave been met, the licensee satisfiesDE must reimburse the FCC for 100% of the bidding credit plus interest. In its June 2006 Order on Reconsideration of the Second Report and Order, the FCC clarified its rules to state that its changes to the DE unjust enrichment rules would only apply to licenses initially issued after April 25, 2006. Licenses issued prior to April 25, 2006, including those granted to Royal Street from Auction 58, would be subject to the five-year unjust enrichment rules previously in effect. Likewise, the requirement that the FCC be reimbursed for the entire bidding credit amount owed if a DE loses its eligibility for a bidding credit prior to the filing of the notifications informing the FCC that the construction benchmark), assignments or transfersrequirements applicable at the end of control are permitted, butthe license term have been met applies only to entitiesthose licenses that meet specified qualifications,are initially granted on or after April 25, 2006. Fourth, the FCC has adopted rules requiring a DE to seek approval for any event in which it is involved that might affect its ongoing eligibility, such as entry into an impermissible material relationship, even if the event would not have triggered a reporting requirement under the FCC’s existing rules. In connection with this rule change, the FCC now requires DEs to file annual reports with the FCC listing and summarizing all agreements and arrangements that relate to eligibility for designated entity benefits. Fifth, the FCC indicated that it will step up its audit program of DEs and has stated that it will audit the eligibility of every DE that wins a license in the AWS auction at least once during the initial license term. Sixth, these changes will all be effective with respect to all applications filed with the FCC that occur after the effective date of the FCC’s revised rules, including the AWS auction.
Several interested parties filed a Petition for Expedited Reconsideration and a Motion for Expedited Stay Pending Reconsideration or Judicial Review of the DE Order. The Petitions challenged the DE Order on both substantive and procedural grounds. Among other claims, the Petitions contested the FCC’s effort to apply the revised rules to applications for the AWS auction and to apply the revised unjust enrichment payment schedule to existing DE arrangements. In the Motion for Stay, the petitioners requested that the FCC also stay the effectiveness of the rule changes, and stay the commencement of the AWS auction which commenced on June 29, 2006 and all associated pre-AWS auction deadlines. The FCC did not grant the stay, and the petitioners sought a court stay. On June 7, 2006, the petitioners filed an appeal of the DE Order with the Court of Appeals for the Third Circuit and sought an emergency stay of the DE Order. On June 29, 2006, the Court issued a decision denying the emergency stay motion. The parties to the appeal recently filed briefs in this case. The court has issued an order for oral argument, and the date for oral argument in connection with the DE Order has currently been set for May 25, 2007. We are unable at this time to predict the likely outcome of the appeals and unable to predict the impact on the licenses granted in Auction 66. We also are unable to predict whether the litigation will result in any changes to the DE Order or to the DE program, and, if there are changes, whether or not any such changes will be beneficial or detrimental to our interests. However, the original entity andrelief sought by the assignee or transferee have different entrepreneur or small business qualifications,petitioners includes overturning the assignment or transfer mayresults of Auction 66. If the petitioners are ultimately successful in getting this relief, any licenses granted to us as a result in an obligation to make additionalof Auction 66 would be revoked. Our payments to the FCC. AfterFCC for the first five years of the initial license term (which for us ended January 27, 2002), voluntary assignments and transfers of controllicenses would be refunded, but without interest. If our licenses are revoked we will have been required to entities not meeting the eligibility criteria for participation in the entrepreneurs’ block are permitted; however, if a license is being paid for in installments, as ours are, all unpaid principal and accruedpay interest to our lenders on the license must bemoney paid to the FCC for the AWS licenses, but would not receive interest. The interest expense, which could be substantial, may affect our results of operations and the loss of the Auction 66 licenses could affect our future prospects.
111
In connection with the changes to the DE rules, the FCC also adopted in April 2006 a Second Further Notice of Proposed Rulemaking seeking comment on whether additional restrictions should be adopted in its DE program relating to, among other things:
| | |
| • | relationships between designated entities and other communications enterprises based on class of services, financial measures, or spectrum interests; |
|
| • | the need to include other agreements within the definition of impermissible material relationships; and |
|
| • | prohibiting entities or persons with net worth over a particular amount from being considered a DE. |
There can be no assurance what additional changes, if any, to the DE program may be adopted as a
conditionresult of
this rulemaking. Based on the FCC’s latest rulings, we do not expect any
assignment or transfer of controlfuture changes in the DE rules to
be applied retroactively to Royal Street, but we cannot give any assurance that the FCC will not give any new rules retroactive effect. If additional changes are made to the program that are applied to the current arrangements between Royal Street, C9 Wireless and us, it could have a
non-qualifying entity.material adverse effect on our and Royal Street’s operations and financial performance.
The Communications Act includes provisions
that authorizeauthorizing the FCC to restrict
the level of ownership
thatlevels in us by foreign nationals or their representatives, a foreign government or its representative or any corporation organized under the laws of a foreign
country may have in us.country. The law permits
indirect foreign ownership of as much as 25% of our equity without the need for any action by the FCC. If the FCC determines
that it is in the best interest of the general public, the FCC may revoke licenses or require an ownership restructuring
in the event that suchif our foreign ownership exceeds the statutory 25% benchmark.
TheHowever, the FCC generally permits
however, additional
indirect foreign ownership in excess of the statutory 25% benchmark
whereparticularly if that interest is
to be held by an entity or entities from
member countries of the World Trade
Organization.Organization member countries. For investors from countries that are not members of the World Trade Organization, the FCC
will determine whetherdetermines if the home country
of the foreign investor extends reciprocal treatment, called “equivalent competitive
opportunities”opportunities,” to United States entities. If these opportunities do not exist, the FCC may not permit
such foreign investment beyond the 25% benchmark.
TheseWe have adopted internal procedures to assess the nature and extent of our foreign ownership, and we believe that the indirect ownership of our equity by foreign entities is below the benchmarks established by the Communications Act. If we have foreign ownership in excess of the limits, we have the right to acquire the portion of the foreign investment which places us over the foreign ownership restriction. Nevertheless, these foreign ownership restrictions could
adversely affect our ability to attract additional equity
financing. We have no knowledge that any foreign entity directly or indirectly owns a significant percentagefinancing and complying with the restrictions could increase our cost of
our capital stock.operations.
General Regulatory Obligations The Communications Act and the FCC’s rules impose a number of requirements upon wireless broadband PCS, and in many instances AWS, licensees. These requirements, which are summarized below, could increase our costs of doing business.
Federal legislation enacted in 1993 requires the FCC to reduce the disparities in the regulatory treatment of similar mobile services, such as cellular, PCS and Enhanced Specialized Mobile Radio, or ESMR, services. Under this regulatory structure, our wireless broadband PCS and AWS services are classified as CMRS. The FCC regulates providers of CMRS services as common carriers, which subjects us to many requirements under the Communications Act and FCC rules and regulations. The FCC, however, has exempted CMRS offerings from some typical common carrier regulations, such as tariff and interstate certification filings, which allows us to respond more quickly to competition in the marketplace. The 1993 federal legislation also preempted state rate and entry regulation of CMRS providers.
The FCC permits cellular, broadband PCS, AWS, paging and ESMR licensees to offer fixed services on aco-primary basis along with mobile services. This rule may facilitate the provision of wireless local loop service by CMRS licensees using wireless links to provide local telephone service. The extent of lawful state regulation of such wireless local loop service is undetermined. While we do not presently have a fixed service offering, our network can accommodate such a service. We continue to evaluate our service offerings, which may include a fixed service plan at some point in the future.
112
The spectrum allocated for broadband PCS was utilized previously by fixed microwave systems. To foster the orderly clearing of the spectrum, the FCC adopted a transition and cost sharing plan pursuant to which incumbent microwave users could be reimbursed for relocating out of the band and the costs of relocation were shared by the broadband PCS licensees benefiting from the relocation. Under the FCC regulations, DEs were able to pay microwave reimbursed clearing obligations through installment payments. We incurred various microwave relocation obligations pursuant to this transition plan. The transition and cost sharing plans expired in April 2005, at which time remaining microwave incumbents in the broadband PCS spectrum remained obligated to relocate to different spectrum but assumed responsibility for their costs to relocate to alternate spectrum. We have fulfilled all of the relocation obligations (and related payments) directly incurred in our broadband PCS markets. As a result of the offer to purchase made by Madison Dearborn Capital Partners IV, L.P. and certain affiliates of TA Associates, Inc. in 2005, we ceased being a DE and are in the process of paying off all remaining microwave clearing obligations to other carriers. This process has taken longer than we anticipated which could give rise to an objection by a carrier to which microwave clearing payments are due. As of December 31, 2006, we had no obligations related to our PCS licenses payable to other carriers under cost sharing plans for microwave relocation in our markets.
In addition, spectrum allocated for AWS currently is utilized by a variety of categories of commercial and governmental users. To foster the orderly clearing of the spectrum, the FCC adopted a transition and cost sharing plan pursuant to which incumbent non-governmental users could be reimbursed for relocating out of the band and the costs of relocation would be shared by AWS licensees benefiting from the relocation. The FCC has established a plan where the AWS licensee and the incumbent non-governmental user are to negotiate voluntarily for three years and then, if no agreement has been reached, the incumbent licensee is subject to mandatory relocation where the AWS licensee can force the incumbent non-governmental licensee to relocate at the AWS licensee’s expense. The spectrum allocated for AWS currently is utilized also by governmental users. The FCC rules provide that a portion of the money raised in Auction 66 will be used to reimburse the relocation costs of governmental users from the AWS band. However, not all governmental users are obligated to relocate and in some cases where they are obligated to relocate may not do so for some period of time. We estimate the costs we may incur to relocate the incumbent licensees in the areas where we have been granted AWS licenses in Auction 66 to be approximately $40 to $60 million, and the time it will take to clear the AWS spectrum in markets where we acquired licenses is uncertain.
We are obligated to pay
certain annual regulatory fees and assessments to support
the FCC’s regulation of theFCC wireless industry
regulation, as well as fees
necessary to supportsupporting federal universal service programs, number portability, regional database costs, centralized
administration of telephone numbering
administration, telecommunications relay service for the hearing-impaired and application filing fees.
These fees are subject to increase by the FCC periodically.
The FCC
has adopted requirements forrequires CMRS providers to implement basic
911 and enhanced,
911, or
E-911, emergency services. Our obligation to implement these services is incurred in stages on amarket-by-market basis as local emergency service providers requestE-911 services. These services
provideallow state and local emergency service providers
with the ability to better identify and locate callers using wireless services, including callers using special devices for the hearing impaired.
Our obligations to implement these services occur in stages, and on a market-by-market basis as emergency service providers request the implementation of E-911 services within their locales. In June 2002, the FCC extended the deadlines for meeting some of these requirements, specifically the Phase II capabilities whereby emergency service providers receive the 911 caller’s geographic location, until March 1, 2003 at the earliest (the actual date for implementing this capability in any given locale will be based on the readiness of public safety agencies to participate in E-911 services). We
are currently constructinghave constructed facilities to implement these capabilities in
several markets
althoughwhere we
do not currently know whetherhave had requests and are in the process of constructing facilities in the markets we
will be ablelaunched recently. The FCC also has rules that require us, because we employ a handset-based location technology, to
meet allensure that specified percentages of the
handsets in service on the system be location capable. As of December 31, 2005, 95% of our handsets were required to be location-capable and we met this requirement. There are proposals to require greater accuracy in establishing the location of our subscribers forE-911 emergency services. We can give no assurance that such requirements
imposed bythe FCC, whether some additional relief from these regulations will be required, or whether the FCC would grant such relief if we request that it do so. Absent a waiver, failurecomply. Failure to complymaintain compliance with the FCC’sE-911 requirements couldcan subject us to significant penalties. The extent to which we are required tomust deployE-911 services will affectaffects our capital spending obligations. TheIn 1999, the FCC in 1999 amended its rules to eliminate a requirement thatno longer require compensation by the state to carriers be compensated forE-911 costs and to expand the circumstances under which wireless carriers may be required to offerE-911 services. services to the public safety agencies. States in which we do business may limit or eliminate our ability to recover ourE-911 costs. Federal legislation enacted in 1999 may limit our liability for uncompleted 911 calls to a degree commensurate withsimilar level to wireline carriers in our markets.
113
Federal law
also requires
PCSCMRS carriers to provide law enforcement agencies with
capacity to support
for lawful
wiretaps and technical capabilities for wiretaps. Federal law also requires compliance with wiretap-related record-keeping and personnel-related obligations.
Maintaining complianceComplying with these
wireless 911E-911 and law enforcement wiretap requirements may
createrequire systems upgrades creating additional capital obligations for us
and additional personnel, a process which may cost us additional expense which we may not be able to
make necessary system upgrades.recover. Our customer base may be subject to a greater percentage of law enforcement requests than those of other carriers and that the resulting expenses incurred by us to cooperate with law enforcement are proportionately greater.
Because the availability of telephone numbers is dwindling, the FCC has adopted number pooling rules that govern
the way in whichhow telephone numbers
generally are allocated.
At present, numberNumber pooling is
only mandatory
withininside the wireline rate centers
in whichwhere we have drawn numbers and
whichthat are located in counties
thatincluded in the top 100 metropolitan statistical areas, or MSAs, as defined by FCC rules. We have implemented number pooling and support pooled number roaming in all of our markets which are included in the top 100
MSAs as defined by the FCC’s rules. Our markets are partially or wholly contained within the top 100 MSAs.
We have expended capital preparing for number pooling in these markets as well as preparing to support the roaming of pooled numbers into our markets. The FCC also has authorized states to
initiatestart limited numbering administration to supplement federal
requirements. Somerequirements and some of the states
in whichwhere we provide service have been
so authorized.authorized by the FCC to start limiting numbering administration.
In addition, the FCC has ordered all
telecommunications carriers, including
wirelessCMRS carriers, to
adopt a method for providing customers withprovide telephone number portability
or the abilityenabling subscribers to keep their telephone numbers when they change telecommunications carriers,
eitherwhether wireless to wireless or, in some instances, wireline to wireless, and vice versa. Under these local number portability rules, a CMRS carrier located in one of the top 100 MSAs must have the technology in place to allow its customers to
portkeep their telephone numbers when they switch to a new carrier. Outside of the top 100 MSAs, CMRS carriers
that receivereceiving a request to allow end users to
portkeep their telephone numbers must be capable of doing so within six months
after receivingof the request or within six months of November 24, 2003, whichever is later. In addition, all CMRS carriers
have beenare required
since November 24, 2002 to support
nationwide roaming
nationwide for customers
with ported or pooledretaining their numbers.
TheseWe currently support number portability
requirements are likely to result in
added capital expenditures for us to make necessary system changes.all of our markets.
FCC rules provide that all local exchange carriers must, upon request, enter into mutual or reciprocal compensation arrangements with CMRS carriers for the exchange of local traffic, wherebyunder which each carrier compensates the other for terminated local traffic that carrier terminates that originatedoriginating on the othercompensating carrier’s network. Local traffic is defined for purposes of the reciprocal compensation arrangement between local exchange carriers and CMRS carriers is defined as intra-MTA traffic, and thus the FCC’s reciprocal compensation rules apply to any local traffic originated by a CMRS carrier and terminated by a local exchange carrier within the same MTA and vice versa, even if such traffic is inter-exchange.interexchange. While these rules provide that local exchange carriers may not charge CMRS carriers for facilities used by CMRS carriers to terminate local exchange carriers’ traffic, local exchange carriers may charge CMRS carriers for facilities used to transport and terminate CMRS traffic and for facilities used for transit purposes to carry CMRS carrier traffic to a third carrier. FCC rules also provide that, on the CMRS carrier’s request, incumbent local exchange carriers must exchange local traffic with CMRS carriers at rates based on the FCC’s costing rules if the CMRS carrier so requests; suchrules; rates are set by state public utility commissions applying the FCC’s rules. Some competitive (non-incumbent)The rules governing CMRS interconnection are under review by the FCC in a rulemaking proceeding, and we cannot be certain whether or not there will be material changes in the applicable rules, and if there are changes, whether they will be beneficial or detrimental to us.
Before 2005, some local exchange carriers have claimed a right under existing FCC rulesby filing a state tariff to impose unilateral charges on CMRS carriers for the termination of suchCMRS carriers’ traffic basedon the local exchange carrier’s network, often at above-cost rates. In 2005, the FCC issued a Report and Order holding that, on a going forward basis, no local exchange carrier was permitted to unilaterally impose tariffed rates for the termination of a CMRS carrier’s traffic. This Report and have argued that they have noOrder imposed on CMRS carriers an obligation to negotiate mutual compensation arrangements orengage in voluntary negotiation and arbitration with incumbent local exchange carriers similar to those imposed on the incumbent local exchange carriers pursuant to Section 252 of the Communications Act. Further, the FCC found that its prior rules did not preclude incumbent local exchange carriers from imposing unilateral charges pursuant to tariff for the period prior to the effective date of the Report and Order. Finally, the Report and Order found that once an incumbent local exchange carrier requested negotiation of an interconnection arrangement both carriers are obligated to begin paying the FCC’s default rates for all traffic exchanged after the request for negotiation. Several CMRS carriers and incumbent local exchange carriers have appealed the Report and Order and we have sought clarification on certain aspects of the Report and Order. In the
114
meantime, a number of local exchange carriers and incumbent local exchange carriers have demanded that we pay bills for traffic exchanged in the past and we are evaluating those demands. We may pay some portion of these amounts, which may be material. Also, a number of local exchange carriers have requested that we enter into negotiations for interconnection agreements and, as a result of such negotiations, we may be obligated to pay
CMRS carriers for traffic transmitted indirectly over another carrier’s transit facilities. There are petitions for declaratory ruling pending at the FCC that these carriers’ positionsamounts to settle prior claims and
related practices are contrary to lawon a going forward basis, and
relevant FCC precedent. The FCC also is currently considering changes tosuch amounts may be material. Also, other local exchange
carrier-CMRS interconnection and other so-called intercarriercompanies have threatened to sue us if agreements governing termination compensation
schemes, and the outcome of the proceeding may affect the manner in which CMRS carriers are
charged or compensated for such traffic.not reached. We
generally have
generally been successful in negotiating arrangements with carriers with whichwhom we exchange traffic; however, our business could be adversely affected shouldif the rates some carriers charge us for terminating our customers’ traffic ultimately prove to be higher than anticipated.
In one case, a complaint has been filed by a CLEC against us before the FCC claiming a right to terminating compensation payments on a going forward basis and going backward basis at a rate that we consider to be excessive. We are vigorously defending against the complaint, but cannot predict the outcome at this time. An adverse outcome could be material.
The FCC has adopted rules
that requirerequiring interstate communications carriers, including
PCSCMRS carriers, to “make an equitable and non-discriminatory contribution” to a Universal Service Fund, or USF, that reimburses communications carriers
that provideproviding basic communications services to users
who receivereceiving services at subsidized rates. We have made
such payments, as the FCC has required.these FCC-required payments. The FCC recently
initiatedstarted a
rule makingrulemaking proceeding
in which it solicitsto solicit public comment on ways of reforming both
the manner by whichhow it assesses carrier
USF contributions
to the USF and
the way in whichhow carriers may recover their costs from
customers.customers and some of the proposals may cause the amount of USF contributions required from us and our customer to increase. Effective April 1, 2003, the FCC prospectively forbade carriers from recovering
administrative costs related to administering the required universal service assessments from customers as USF
charges their administrative costs associated with administering the universal service assessments that carriers are required to pay.charges. The FCC’s
new rules require
that carriers’ USF recovery charges to customers
may not exceed the assessment rate
that the carrier pays times the proportion of interstate telecommunications revenue on the bill. We are
working diligently to complycurrently in compliance with these
new requirements.
They may have an effect on our ability to recover our administrative costs for administering our participation in the program.Wireless
broadband carriers may be designated as
eligible telecommunications carriers,Eligible Telecommunications Carriers, or ETCs, and may receive universal service support for providing service to customers
that useusing wireless service in high cost areas. Other wireless
broadband carriers operating in states where we operate have obtained or applied for ETC status. Such other carriers’ receipt of universal service support funds may affect our competitive status in a particular market by allowing our competitors to offer service at a lower rate. We
are currently contemplating whether and wheremay decide in the future to apply for this designation in
the various jurisdictions in whichcertain qualifying high cost areas where we provide wireless
services to qualifying high cost areas.services. If
suchwe are approved, these payments
are made available to us, they would be an additional
revenue source
of revenue to us that
we could
be useduse to support the
serviceservices we provide in
the high cost areas.
PCS
CMRS carriers are exempt from the obligation to provide equal access to interstate long distance carriers. However, the FCC has the authority to impose rules
to requirerequiring unblocked access through carrier identification codes or 800/888 numbers
to long distance carriers so
that PCSCMRS customers are not denied access to
thetheir chosen long distance carrier,
of their choosing, if the FCC determines
that the public interest so requires. Our customers have access to alternative long distance carriers using toll-free numbers.
FCC rules also impose restrictions on a telecommunications carrier’s use of customer proprietary network information, or CPNI, without prior customer approval, including restrictions on the use of information related to a customer’s location. The FCC recently began an investigation into whether CMRS carriers are properly protecting the CPNI of their customers against unauthorized disclosure to third parties. In February 2006, the FCC requested that all CMRS carriers provide a certificate from an officer of the CMRS carrier based on personal knowledge that the CMRS carrier was in compliance with all CPNI rules. We have provided such a certificate. The FCC also has proposed substantial fines on certain wireless carriers for their failure to comply with the FCC’s CPNI rules. We believe that our current marketing approach ispractices are consistent with existing FCC rules on CPNI, and do not foresee new costs or limitations on our existing practices as a result of the current FCC rules in that area. On April 2, 2007, the FCC released a Report and Order and Further Notice of Proposed Rulemaking in which it adopted a number of changes to its existing CPNI rules. First, the new rules will require carriers to provide mandatory password protection that will restrict the release of call detail information during customer-initiated telephone contact and also will apply to online account access. Second, these rules will require carriers to notify customers immediately when a password, customer request to a
115
back-up means of authentication for lost or forgotten passwords, online account, or address of record is created or changed. Third, the new rules will provide for a process by which both law enforcement and customers are notified in the event of a CPNI breach. Fourth, these rules will require carriers to obtain opt-in consent from a customer before disclosing that customer’s CPNI to a carrier’s joint venture partners or independent contractors for the purpose of marketing communications-related services to that customer. Fifth, the new rules will require carriers to file with the FCC an annual certification, including an explanation of any actions taken against data brokers and a summary of all consumer complaints received in the previous year regarding the unauthorized release of CPNI. Sixth, the application of the FCC’s CPNI rules will be extended to include providers of interconnected VoIP services. Seventh, the new rules will require carriers to take reasonable measures to discover and protect against pretexting, and in enforcement proceedings, the FCC will infer from evidence of unauthorized disclosures of CPNI that reasonable protections were not taken. Eighth, these rules will permit carriers to bind themselves contractually to authentication regimes other than those adopted in this Report and Order for services they provide to their business customers that have a dedicated account representative and contracts that specifically address the carrier’s protection of CPNI. The above changes will take effect on the later of six months from the date of the Report and Order or the date on which approval for the new rules is obtained from the Office of Management and Budget.
In the Further Notice of Proposed Rulemaking that accompanies the Report and Order described above, the FCC seeks comment on: whether mandatory password protection should be included for other types of information, such as non-call detail CPNI or certain types of account changes; whether the FCC should adopt rules regarding audit trails; whether the FCC should adopt rules that govern the physical transfer of or access to CPNI by a carrier, its affiliates, or third parties; whether the FCC should adopt rules that require carriers to limit data retention; and what steps, if any, the FCC should take to secure the privacy of customer information secured on mobile communications devices. Compliance with the FCC’s new or proposed rules may impose additional costs on us or require us to make changes to our business processes or practices and customer service processes, which changes could have a material adverse impact on us.
Congress and state legislators also are in the process of enacting legislation which addresses the use and protection of CPNI which may impact our obligations. For example, Congress recently enacted the Telephone Records and Privacy Protection Act of 2006, which imposes criminal penalties upon persons who purchase without a customer’s consent, or use fraud to gain unauthorized access to, telephone records. The recent and pending legislation (if enacted) may require us to change how we protect our customer’s CPNI and could require us to incur additional costs or change our business practices or processes, which costs and changes may be material.
Telecommunications carriers are required to make their services accessible to persons with disabilities and the FCC’s rules implementing these requirements are in effect.disabilities. These FCC rules generally require service providers to offer equipment and services that are accessible to and usable by persons with disabilities, if readily achievable, and to comply with FCC-mandated complaint/grievance procedures for violations of these provisions.procedures. These rules are largely untested and are subject to interpretation through the FCC’s complaint process. While muchthese rules principally focus on the manufacturer of the focus of these rules is on the manufacture of equipment, we could be subject to the imposition ofhave costly new requirements imposed on us and, if we were found to have violated the rules, be subject to fines, as well.which fines could be material. As a related matter, on July 10, 2003, the FCC adoptedissued an order requiring digital wireless phone manufacturers and wireless service providers (including us) to take steps to ensureensuring the availability of hearing aid compatible digital wireless phones. Specifically, the FCC mandated that non-Tier 1 CMRS carriers, such as us, are required under the FCC’s current rules to offer to its customers at least two wireless digital phones for each air interface used by it that meet the FCC hearing aid-compatibility requirements. We currently are compatiblein compliance with these requirements. By February 18, 2008, half of the digital wireless handsets that we offer for each air interface must meet the FCC’s hearing aids, whichaid-compatibility requirements. Since there has been consolidation in the digital wireless handset manufacturers industry, we may have difficulty securing the necessary handsets in order to meet the FCC’s requirements. In addition, since we are required to offer these hearing aid-compatible wireless phones for each air interface we provide, this requirement may limit our ability to offer services using new air interfaces other than CDMA 1XRTT, may limit the number of handsets we can offer, or may increase the costs of handsets for those new air interfaces. Further, to the extent that the costs of such handsets are more than non-hearing aid-compatible digital wireless
116
handsets, it may decrease demand for our
services, decrease the number of wireless phones we can offer to our customers, or increase our selling costs
for handsetsif we
sell.choose to subsidize the cost of the hearing aid-compatible handsets.
The FCC has determined that
interexchange, or long distance
or interexchange service offerings
offrom CMRS providers are subject to
Communications Act rate averaging and rate integration
requirements of the Communications Act.requirements. Rate averaging requires us to average our intrastate long distance CMRS rates between rural and high cost areas and urban areas. The FCC has delayed implementation of
the rate integration requirements
with respect tofor wide area rate plans pending further reconsideration of its rules, and has
also delayed
thea requirement that CMRS carriers integrate their
rates among CMRS affiliates. Other aspects of the FCC’s rules have been vacated by the United States Court of Appeals for the District of Columbia Circuit, and are subject to further consideration by the FCC. There isThe FCC recently terminated a pending proceeding in which the FCC willto determine how rate integration requirements apply to CMRS offerings including singleafter concluding that, in light of the Court of Appeals’ vacatur of its prior order, there is no rate plans. Tointegration rule currently applicable to CMRS carriers. Our pricing flexibility is reduced to the extent that we offer services subject to these requirements, our pricing flexibility is reduced, and we cannot assure you that the FCC will decline to imposeimposing these requirements on us.
Antenna structures used by us and other wireless providers are subject to the FCC’sFCC rules implementing the National Environmental Policy Act and the National Historic Preservation Act. Under these rules, construction cannot begin on any structure that may significantly affect the human environment or that may affect historic properties may not be constructed until the wireless provider has filed an environmental assessment with and obtained approval from the FCC. Processing of environmental assessments can delay construction of antenna facilities, particularly if the FCC determines that additional information is required or if there is community opposition.opposition arises. In addition, several environmental groups have unsuccessfully have requested changes into the FCC’s environmental processing rules, challenged specific environmental assessments as inadequate to meetfailing statutory requirements and sought to have the FCC conduct a comprehensive assessment of the environmental effects of antenna tower construction. On February 13,construction environmental effects. The FCC also is considering the impact that communications facilities, including wireless towers and antennas, may have on migratory birds. In August of 2003, severalthe FCC initiated a rulemaking proceeding seeking information on whether rule changes should be adopted to reduce the risk of migratory bird collisions with commercial towers. The FCC released a Notice of Proposed Rulemaking in this proceeding on November 7, 2006, in which the FCC tentatively concludes that medium-intensity white strobe lights should be considered the preferred system in place of red obstruction lighting systems to the maximum extent possible without compromising safety. The FCC also seeks comments on the possible adoption of various other measures that might serve to mitigate the impact of communications towers on migratory birds. In the meantime, there are a variety of federal and state court actions in which citizen and environmental groups have sought to deny tower approvals based upon potential adverse impacts to migratory birds. Although we use antenna structures that are owned and maintained by third parties, the results of these FCC and court proceedings could have an impact on our efforts to secure access to particular towers, or the costs of access.
The location and construction of PCS antennas, base stations and towers also are subject to FCC and Federal Aviation Administration regulations, federal, state and local environmental regulation, and state and local zoning, land use and other regulation. Before we can put a system into commercial operation, we, or the tower owner in the case of leased sites, must obtain all necessary zoning and building permit approvals for the cell site and microwave tower locations. The time needed to obtain necessary zoning approvals and state permits varies from market to market and state to state and, in some cases, may materially delay our ability to provide service. Variations also exist in local zoning processes. Further, certain municipalities impose severe restrictions and limitations on the placement of wireless facilities which may impede our ability to provide service in that area. In 2002, the Board of Supervisors for the City and County of San Francisco, or the City of San Francisco, denied certain applications to construct three sites in the City of San Francisco. The City of San Francisco claimed that additional facilities were not necessary because adequate services are available from other wireless carriers. In July 2002, we filed suit against the City of San Francisco and its Board of Supervisors based on their denial of our applications. The trial was conducted in late March 2006 and early April 2006. In June 2006, the court found in favor of the City of San Francisco and denied our applications. The court clarified that a gap in coverage existed, but that we had not used the least restrictive means to provide service in the area. None of the parties to the proceeding have appealed and the time to bring an
117
appeal has expired. A failure or inability to obtain necessary zoning approvals or state permits, or to satisfy environmental rules may make construction impossible or infeasible on a particular site, might adversely affect our network design, increase our network design costs, require us to use more costly alternative technologies, such as distributed antenna systems, reduce the service provided to our customers, and affect our ability to attract and retain customers.
In 2004, the FCC initiated a proceeding to update and modernize its systems for distributing emergency broadcast alerts. Television stations, radio broadcasters and cable systems currently are required to maintain emergency broadcast equipment capable of retransmitting emergency messages received from a federal agency. As part of its attempts to modernize the emergency alert system, the FCC in its proceeding is addressing the feasibility of requiring wireless providers, such as us, to distribute emergency information through wireless networks. Unlike broadcast and cable networks, however, our infrastructure and protocols — like those of all other similarly-situated wireless broadband CMRS carriers — are optimized for the delivery of individual messages on apoint-to-point basis, and not for delivery of messages on apoint-to-multipoint basis, such as all subscribers within a defined geographic area. While multiple proposals have been discussed in the FCC proceeding, including limited proposals to use existing short messaging service capabilities on a short-term basis, the FCC has not yet ruled and therefore we are not able to assess the short- and long-term costs of meeting any future FCC requirements to provide emergency and alert service, should the FCC adopt such requirements. Adoption of such requirements, however, could require new components within our network and transmission infrastructure and also require consumers to purchase new handsets. Congress recently passed the Warning, Alert, and Response Network Act as part of the Security and Accountability For Every Port Act of 2006. In this Act, which was recently signed into law, Congress provided for the establishment, within 60 days of enactment, of an advisory committee to provide recommendations to the FCC regarding technical standards and protocols under which electing commercial mobile radio service, or CMRS, providers may offer subscribers the capability of receiving emergency alerts. The FCC is required to complete a proceeding to adopt relevant technical standards, protocols, procedures, and other technical requirements based on the recommendations of such Advisory Committee necessary to enable alerting capability for CMRS providers that voluntarily elect to transmit emergency alert. Under the Act, a CMRS carrier can elect not to participate in providing such alerting capability. If a CMRS carrier elects to participate, the carrier may not charge separately for the alerting capability and the CMRS carrier’s liability related to, or any harm resulting from, the transmission of, or failure to transmit, an emergency alert is limited. The FCC is obligated to complete its rulemaking implementing such rules within a relatively short period of time after receiving the recommendations from the advisory committee. Until the FCC promulgates rules, we do not know if they will adopt such requirements, and if it does, what their impact will be on our infrastructure and service.
The FCC historically has required that CMRS providers permit customers of other carriers to roam “manually” on their networks, for example, by supplying a credit card number, provided that the roaming customer’s handset is technically capable of accessing the roamed-on network. The FCC recently initiated a notice of proposed rulemaking seeking comments on whether automatic roaming services are considered common carrier services, whether CMRS carriers have an obligation to offer automatic roaming services to other carriers, whether carriers have an obligation to provide non-voice roaming services, and what rates a carrier may charge for roaming services. The FCC previously initiated roaming proceedings on similar issues but failed to resolve these issues. Roaming rights are important to us because we have a limited service area and must rely on other carriers in order to offer roaming outside our existing service areas. We have commented in this proceeding in support of an FCC rule requiring carriers to honor requests for automatic roaming at reasonable, non-discriminatory rates. However, we cannot predict the likely outcome of this proceeding or the likely timing of an FCC ruling. If the FCC decides not to require automatic roaming at reasonable non-discriminatory rates, or limits roaming to voice services only, we may have difficulty attracting and retaining certain groups filedof customers which could have an adverse impact on our business.
In September of 2004, the FCC issued a petition withReport and Order and Further Notice of Proposed Rulemaking and adopted several measures designed to increase carrier flexibility, reduce regulatory costs and to promote access to capital and spectrum for entities seeking to provide or improve wireless service to rural areas, including the relaxation of the FCC rule that prohibited a carrier from having any interest in both the Block A
118
and Block B cellular licenses in a common market. These rule changes create potential opportunities for us if we seek to extend our service to rural markets, but also could benefit our competitors.
On November 20, 2006, the Copyright Office of the Library of Congress, or the Copyright Office, released the final rules in its triennial review of the exemptions to the prohibition on circumvention of copyright protection systems for access control technologies, or Triennial Review, contained in the Digital Millennium Copyright Act, or DMCA. In 1998, Congress enacted the DMCA, which among other things amended the United States CourtCopyright Act to add a section prohibiting the circumvention of Appealstechnological measures employed to protect a copyrighted work, or access control. In addition, the Copyright Office has the authority to exempt certain activities which otherwise might be prohibited by that section for a period of three years when users are (or in the next three years are likely to be) adversely affected by the prohibition in their ability to make noninfringing uses of a class of copyrighted work. Many carriers, including us, routinely place software locks on their wireless handsets which prevent a customer from using a wireless handset sold by one carrier on another carrier’s system. In its Triennial Review, the Copyright Office determined that these software locks on wireless handsets are access controls which adversely affect the ability of consumers to make noninfringing use of the software on their wireless handsets. As a result, the Copyright Office found that a person could circumvent such software locks and other firmware that enable wireless handsets to connect to a wireless telephone network when such circumvention is accomplished for the sole purpose of lawfully connecting the wireless handset to another wireless telephone network. A wireless carrier has filed suit in the United States District Court in Florida to reverse the Copyright Office’s decision. This exemption is effective from November 27, 2006 through October 27, 2009 unless extended by the Copyright Office.
This ruling, if upheld, could allow customers to use their wireless handsets on the networks of Columbia Circuit seekingother carriers. Since many of our competitors generally subsidize their wireless handsets substantially more than we do, customers of our competitors may find it attractive to forcebring their phones to us for activation. This may result in us experiencing lower costs to add customers. This ruling may also allow our customers who are dissatisfied with our service to utilize the services of our competitors without having to purchase a new wireless handset. The ability of our customers to leave our service and use their wireless handsets to receive a competitor’s service may have an adverse material impact on our business. In addition, since our subsidy for handsets to our distribution partners is incurred in advance, we may experience higher distribution costs resulting from wireless handsets not being activated or maintained on our network, which costs may be material.
In a February 20, 2007, filing, a provider of VoIP services asked the FCC to modify its environmental processing rulesissue a declaratory ruling that would give wireless customers the right to address issuesutilize any device of their choice to access a wireless network as long as the device did not cause interference or network degradation. The FCC has placed this request on public notice and is seeking comment. This so-called “Carterfone Rule” is opposed by many wireless companies, including us, and the principal wireless industry association, but may be considered by the FCC. The proponent also requested that the FCC initiate proceedings to determine whether the current practices of wireless carriers comport with the Carterfone Rule. We can give no assurance that this rule will not be adopted or what impact an adoption of this rule may have on our services or business.
On March 23, 2007, the FCC released a declaratory ruling finding that wireless broadband Internet access service is an information service under the Migratory Bird TreatyCommunications Act of 1934, as amended, or the Communications Act. Although the parties have filed briefs, there is no schedule for court action on this petition. On May 1, 2003,In addition, the FCC announced its intent to developfound that the transmission component of wireless broadband Internet access service is telecommunications and that the offering of a strategic plan to address environmental and historic preservation issues, buttelecommunications transmission component as part of a functionally integrated Internet access service offering is not a telecommunications service under the Communications Act. Further, the FCC didfound that mobile wireless broadband Internet access service is not indicate when it will take actiona “commercial mobile service” under Section 332 of the Act. Finally, the FCC defined broadband Internet access for this purpose as service at speeds in excess of 200 kbps in at least one direction. This ruling eliminates any common carrier obligations with respect to adopt or implementthe provision of mobile wireless broadband Internet access services and could have a material impact on our ability to negotiate roaming agreements with other wireless carriers which include the provision of data and mobile wireless broadband Internet access services while roaming on the other carrier’s network. In addition, this plan.ruling could allow our competitors and us greater flexibility in the pricing and terms and conditions of this service.
119
State, Local and Other Regulation The Communications Act preempts state or local regulation of the market entry of, or the rates charged by any CMRS provider, which include cellular telephone service and PCS providers. The FCC denied the petitions of eight states to continue their rate regulation authority, including authority over cellular operators.provider. As a practical matter,result, we are free to establish rates and offer new products and serviceservices with a minimum of state regulatory requirements. The states in which we operate maintain nominal oversight jurisdiction, primarily focusing upon prior approval of acquisitions and transfers of licenses and resolution of customer complaints.regulation. However, states may continue to regulateregulating “other terms and conditions” of wireless service, and a numbercertain states where we operate maintain additional oversight jurisdiction, primarily focusing upon consumer protection issues and resolution of customer complaints. In addition, several state authorities have initiated actions or investigations of various wireless carrier practices. The outcome of these proceedings is uncertain and could require us to change our marketing practices, and ultimately increaseincreasing state regulatory authority over the wireless industry. State and local governments are also permitted tomay manage public rights of way and can require fair and reasonable compensation from telecommunications carriers, including PCSCMRS providers, for the use of such rights of any, so long as the compensation requiredgovernment publicly discloses such compensation.
A dispute exists between the FCC and certain state public utility commission advocates as to whether the FCC’s preemptive rights over rates allows the FCC to prevent states from prohibiting the use of separate line items on wireless bills for charges that are not mandated by federal, state or local law. The FCC ruled in 2005 that states were preempted from requiring or prohibiting the use of non-misleading line items on wireless bills. In 2006, the United States Court of Appeals for the Eleventh Circuit vacated the FCC decision. A similar case is
publicly disclosed bycurrently pending before the
government.United States Court of Appeals for the Ninth Circuit. Several parties have announced an intention to seek review of the issues in the U.S. Supreme Court. The location and constructionoutcome of these cases, which we are unable to predict at this time, could affect the extent to which our PCS antennas and base stations and the towers we lease on which such antennas are locatedCMRS services are subject to FCC and Federal Aviation Administrationstate regulations and arethat may cause us to incur additional costs.
The California Public Utilities Commission, or CPUC, in early 2006 adopted consumer protection rules replacing an earlier consumer bill of rights. The new consumer bill of rights applies to “telecommunications services” subject to
federal, statethe CPUC’s jurisdiction — they do not replace and
local environmental regulation, as well as state or local zoning, land use and other regulation. Before we can put a system into commercial operation, we must obtain all necessary zoning and building permit approvals for the cell site and microwave tower locations. The time needed to obtain zoning approvals and requisite state permits varies from market to marketonly supplement existing requirements that carriers have under federal and state
law, tariffs, other orders and decisions of the FCC or the CPUC, and FCC requirements. The consumer bill of rights establishes seven rights (freedom of choice, disclosure, privacy, public participation and enforcement, accurate bills and dispute resolution, nondiscrimination, and public safety) and also includes rules on CPUC staff requests for information; worker identification;E-911 access; slamming rules (e.g., change of a subscriber’s telecommunications service without authorization) with some modifications to
state. Likewise, variations exist in local zoning processes. Additionally, any proposed site must comply with the FCC’s environmental rules. If zoning approval or requisite state permits cannot be obtained, or if environmentalexisting slamming rules; and new cramming rules
make construction impossible or infeasible(e.g., placement of unauthorized charges on a
particular site,telecommunications bill) that apply to all charges on a telephone bill (and eliminates the interim opt-in rules for non-communications relating services). The cramming rules generally reiterate requirements that already exist under the law with some additions. The consumer bill of rights does not create a private right of action or liability that would not exist absent the rules. We have reviewed the consumer bill of rights and believe that we are in compliance. We cannot give any assurance that the consumer bill of rights will not cause us to spend additional funds or complicate our
network design might be adversely affected, network design costs could increasemarketing and
the service provided tosales programs which may have a material adverse impact on our
customers might be reduced.operations in California.
We cannot assure you that any state or local regulatory requirements currently applicable to our systems will not be changed in the future or that regulatory requirements will not be adopted in those states and localities which currently have none. Such changes could impose new obligations on us that would adversely affect our operating results.
From time to time, federal or state legislators propose legislation and federal or state regulators propose regulations that could affect us, either beneficially or adversely. We cannot assure you that federal or state legislationgovernments will not be enacted,enact legislation or that regulations will not be adopted or actions taken by the FCC or other federal or state regulatory authoritiesregulator will not adopt regulations or take other action that might adversely affect our business adversely.us. Changes such as the allocation by the FCC ofallocating additional radio spectrum for services that competecompeting with our business or granting existing licensees of other services flexibility to offer mobile wireless services could adversely affect our operating results.
120
Legal Proceedings
On June 14, 2006, Leap Wireless International, Inc. and Cricket Communications, Inc., or collectively Leap, filed suit against us in the United States District Court for the Eastern District of Texas, Marshall Division, Civil ActionNo. 2-06CV-240-TJW and amended on June 16, 2006, for infringement of U.S. Patent No. 6,813,497“Method for Providing Wireless Communication Services and Network and System for Delivering of Same,”or the ‘497 Patent, issued to Leap. The complaint seeks both injunctive relief and monetary damages for our alleged infringement of such patent. On August 3, 2006, we (i) answered the complaint, (ii) raised a number of affirmative defenses, and (iii) together with two related entities, counterclaimed against Leap and several related entities and certain current and former employees of Leap, including Leap’s CEO. We have also tendered Leap’s claims to the manufacturer of our network infrastructure equipment for indemnity and defense. In our counterclaims, we claim that we do not infringe any valid or enforceable claim of the ’497 Patent. Certain of the Leap defendants, including its CEO, answered our counterclaims on October 13, 2006. In its answer, Leap and its CEO denied our allegations and asserted affirmative defenses to our counterclaims. In connection with denying a motion to dismiss by certain individual defendants, the court concluded that our claims against those defendants were compulsory counterclaims. On April 3, 2007, the Court held a Scheduling Conference at which the Court set the date for the claim construction hearing for January 2008 and the trial date for August 2008. We plan to vigorously defend against Leap’s claims relating to the ’497 Patent.
If Leap were successful in its claim for injunctive relief, we could be enjoined from operating our business in the manner we currently operate, which could require us to expend additional capital to change certain of our technologies and operating practices, or could prevent us from offering some or all of our services using some or all of our existing systems. In addition, if Leap were successful in its claim for monetary damage, we could be forced to pay Leap substantial damages for past infringementand/or ongoing royalties on a portion of our revenues, which could materially adversely impact our financial performance.
On August 15, 2006, we filed a separate action in the California Superior Court, Stanislaus County, Case No. 382780, against Leap and others for unfair competition, misappropriation of trade secrets, interference with contracts, breach of contract, intentional interference with prospective business advantage, and trespass. In this suit we seek monetary and punitive damages and injunctive relief. Defendants responded to our complaint by filing demurrers on or about January 5, 2007 requesting that the Court dismiss the complaint. On February 1, 2007, the Court granted the demurrers in part and granted us leave to amend the complaint. We filed a First Amended Complaint on February 27, 2007. Defendant’s response to the First Amended Complaint was due March 28, 2007. Defendants responded by filing demurrers on March 28, 2007, requesting that the Court dismiss our First Amended Complaint. On May 1, 2007, the Court issued a tentative ruling granting its own motion to strike the First Amended Complaint and granted us leave to amend the First Amended Complaint by or before May 14, 2007 and held that Defendant’s demurrers and motions to strike were moot. We filed a Second Amended Complaint on May 14, 2007. We intend to vigorously prosecute this complaint.
On September 22, 2006, Royal Street filed a separate action in the United States District Court for the Middle District of Florida, Tampa Division, Civil ActionNo. 8:06-CV-01754-T-23TBM, seeking a declaratory judgment that Leap’s ‘497 Patent is invalid and not being infringed upon by Royal Street. Leap responded to Royal Street’s complaint by filing a motion to dismiss Royal Street’s complaint for lack of subject matter jurisdiction or, in the alternative, that the action be transferred to the United States District Court for the Eastern District of Texas, Marshall Division where Leap has brought suit against us under the same patent. Royal Street has responded to this motion. The Court has set a trial date in October 2008.
In addition, we are involved in litigation from time to time, including litigation regarding intellectual property claims, that we consider to be in the normal course of business. We are not currently party to any other pending legal proceedings that we believe would, individually or in the aggregate, have a material adverse effect on our financial condition or results adversely.of operations.
121
Directors and Executive Officers and DirectorsThe
following table sets forth information concerning our executive officers and directors,
of MetroPCS, andincluding their ages, as of
the date of this prospectus, are as follows:March 31, 2007. | | | | | | |
Name
| | Age
| | Position
| | Class
(Directors only)
|
Name | | Age | | | Position |
|
| Roger D. Linquist | | 66 | 68 | | | President, Chief Executive Officer Secretary and Chairman of the Board of Directors |
| J. Braxton Carter | | Class A | 48 | | | Senior Vice President and Chief Financial Officer |
Douglas S. Glen | | | 49 | | | Senior Vice President, Corporate Operations |
| Thomas C. Keys | | | 48 | | | Senior Vice President, Market Operations, West |
| Christine B. Kornegay | | | 43 | | | Vice President, Controller and Chief Accounting Officer |
| Malcolm M. Lorang | | 71 | 73 | | | Senior Vice President and Chief Technology Officer |
| John J. Olsen | | | 50 | | | Vice President and Chief TechnicalInformation Officer |
| Mark A. Stachiw | | — |
J. Lyle Patrick
45 | | 52 | Senior Vice President, General Counsel and Secretary |
| Keith D. Terreri | | | 42 | | | Vice President, Finance and Chief Financial OfficerTreasurer |
| Robert A. Young | | — |
Dennis G. Spickler
56 | | 53 | | Vice President of Business Development | | — |
Robert A. Young
| | 53 | | Executive Vice President, Market Operations, East |
| W. Michael Barnes | | — | 64 | | | Director |
J. Braxton Carter
C. Kevin Landry | | | 62 | | | Director |
| Arthur C. Patterson | | | 63 | | | Director |
| James N. Perry, Jr. | | | 46 | | Vice President of Corporate Operations | Director |
| John Sculley | | — |
Herbert “Chip” Graves, IV
67 | | 48 | | Vice President and General Manager, San Francisco | | — |
Albert S. Loverde
| | 64 | | Vice President and General Manager, Georgia | | — |
Corey A. Linquist
| | 42 | | Vice President and General Manager, Sacramento | | — |
Frank J. Bell
| | 49 | | Vice President and General Manager, Florida | | — |
Phillip R. Terry
| | 43 | | Vice President of Corporate Marketing | | — |
Michael N. Lavey
| | 46 | | Vice President and Controller | | — |
W. Michael Barnes
| | 62 | | Director | | Common |
Walker C. Boyden Gray Simmons | | 61 | 36 | | | Director | | Class A |
HarryJames F. Hopper, III
Wade | | 50 | 51 | | | Director | | Common |
Joseph T. McCullen, Jr.
| | 69 | | Director | | Class A |
Arthur C. Patterson
| | 60 | | Director | | Common |
John Sculley
| | 65 | | Director | | Class A |
Craig R. Stapleton
| | 59 | | Director | | Class A |
James F. Wade
| | 48 | | Director | | Common |
Roger D. Linquistco-founded
our companyMetroPCS Communications and has served as our President, Chief Executive Officer,
and chairman of the Board of Directors of MetroPCS Communications since its inception and its Secretary
and a director since our inception.from inception through October 2004. In 1989, Mr. Linquist founded PageMart Wireless (now
Metrocall)USA Mobility), a U.S. paging company. He served as PageMart’s Chief Executive Officer from 1989 to 1993, and as Chairman from 1989 through March 1994, when he resigned to form
MetroPCS, Inc. Prior to founding PageMart, Mr. Linquist was Chief Executive Officer of PacTel Personal Communications (which later became AirTouch) and of Communications Industries, covering the
time period from 1982 to 1989. Prior to 1982, Mr. Linquist was a management consultant with McKinsey & Co. and held various management positions with Texas Instruments.company. Mr. Linquist served as a director of PageMart
Wireless from June 1989 to September 1997, and was a founding director of the Cellular Telecommunications and Internet Association. Mr. Linquist
was an executive officer of MetroPCS, Inc. when it initiated its bankruptcy proceedings in October 1997. Mr. Linquist is the father of Corey A. Linquist, our Vice President and General Manager,
Sacramento,Sacramento; father of Todd C. Linquist, Staff Vice President of Wireless Data Services;father-in-law of Michelle Linquist, Director of Logistics; and
the father-in-law of Phillip R. Terry, our Vice President,
of Corporate Marketing.
Malcolm M. Lorang co-founded our company and has served as our Vice President and Chief Technical Officer since our inception. Mr. Lorang has a broad background in radio frequency communications systems and systems engineering, most recently serving as Vice President of Engineering for PageMart Wireless from 1989 to
1994. Mr. Lorang has authored numerous patents, including patents in the radio frequency communications systems area, and was involved in the development and testing of military applications for spread spectrum technology upon which CDMA is based. Mr. Lorang’s experience includes positions with Magnavox Research Laboratories from 1957 to 1972, and Texas Instruments from 1972 to 1988 as a senior design engineer and member of its technical staff. Mr. Lorang was an executive officer of MetroPCS, Inc. when it initiated its bankruptcy proceedings in October 1997.
J. Lyle PatrickBraxton Carter joined us asbecame MetroPCS Communications’ Senior Vice President and Chief Financial Officer in
May 2004. From 2001 until 2002,March 2005. In December 2005, Mr.
Patrick served as Vice PresidentCarter became a director of MetroPCS, Inc., MetroPCS Wireless, Inc. and
Chief Financial Officercertain of
Completel, an emerging telecommunications company headquartered in London. Prior to joining Completel, Mr. Patrick served at McLeodUSA Incorporated as Group Vice President and Chief Financial Officer from 1998 through 2001, and Executive Vice President-Telecom and Public Policy from 1997 until 1998. Subsequent to Mr. Patrick’s departure, McLeodUSA filed a voluntary petition for relief under Chapter 11 of the United States Bankruptcy Code on January 31, 2002. Civil suits alleging violations of the Securities Act and the Exchange Act have been filed against McLeodUSA and its
current and former officers, including Mr. Patrick. Mr. Patrick believes that these suits are without merit and intends to defend them vigorously. From 1988 until its 1997 merger into McLeodUSA, Mr. Patrick served as Chief Financial Officer, Vice President and Controller of Consolidated Communications Inc. Mr. Patrick was a partner at the accounting firm of Arthur Andersen & Co. prior to joining Consolidated Communications.Dennis G. Spickler became our Vice President of Business Development in March 2004.subsidiaries. Previously, Mr. SpicklerCarter served as our Vice President, of Finance and Chief Financial OfficerCorporate Operations from September 1996 throughFebruary 2001 to March 2004.2005. Prior to joining our company, he served as Vice President, Chief Financial and Information Technology Officer for PrimeCo PersonalMetroPCS Communications, from its inception in March 1995 through September 1996. Prior to joining PrimeCo, Mr. Spickler served in various management positions for Bell Atlantic including Managing Director, Mergers and Acquisitions from April 1991 to March 1995, and Vice President, Financial Operations for Bell Atlantic TriCon Leasing from 1988 to 1991. Mr. Spickler also served as General Manager—External Reporting and Professional Accounting Matters for Bell Atlantic and prior to that was an Audit Manager for Coopers & Lybrand (now PricewaterhouseCoopers LLP). Mr. Spickler was an executive officer of MetroPCS, Inc. when it initiated its bankruptcy proceedings in October 1997.
Robert A. Young joined us as Executive Vice President, Market Operations in May 2001. Previously, Mr. Young served as President of the Great Lakes Area of Verizon Wireless from February 2001 until April 2001, and as President of Verizon Wireless Messaging Services (previously known as AirTouch Paging) from April 2000 until January 2001. Prior to joining Verizon Wireless, Mr. Young held various positions with PrimeCo Personal Communications, including Vice President—Customer Care from April 1998 until April 2000, President—Independent Region from October 1997 until October 1998, and Vice President/General Manager—Houston from May 1995 until September 1997. He also chaired PrimeCo’s Information Technology Steering Committee and was a member of its Senior Leadership Team.
J. Braxton Carter joined us as Vice President of Corporate Operations in February 2001. Prior to joining our company, Mr. Carter was Chief Financial Officer and Chief Operating Officer of PrimeCo PCS, the successor entity of PrimeCo Personal Communications formed in March 2000. He held various senior management positions with PrimeCo Personal Communications, including Chief Financial Officer and Controller, from 1996 until March 2000. Mr. Carter also has extensive senior management experience in the retail industry and spent 10ten years in public accounting.
122
Herbert “Chip” Graves, IVDouglas S. Glen joinedbecame MetroPCS Communications’ Senior Vice President, Corporate Operations in June 2006. Prior to joining us, Mr. Glen served as the Vice President of Wireless Solutions and Business Development at BearCom from October 2004 to June 2006. He led the initiative at BearCom to launch new wireless broadband enterprise solutions through a national direct sales force. Before joining BearCom in 2004, from September 2002 to November 2003, Mr. Glen was the Senior Vice President and Chief Operating Officer of WebLink Wireless Inc. (formerly PageMart, Inc.) directing numerous operations of the company including sales, business development, network services, information technology, distribution, customer service, and marketing departments. From July 2001 to September 2002, Mr. Glen was Senior Vice President and Chief Network Officer of WebLink Wireless Inc., directing the planning, engineering and operations of the company’s wireless messaging network. From November 2000 to July 2001, he served as WebLink Wireless Inc.’s Vice President, Business Sales Division, overseeing the sales and customer care operations for many of the company’s strategic business units, including national accounts, field sales, resellers and telemetry.
Thomas C. Keysbecame MetroPCS Communications’ Senior Vice President, Market Operations, West in January 2007. Previously, Mr. Keys served as our Vice President and General Manager, San Francisco in March 2002.Dallas from April 2005 until January 2007. Prior to joining our company, Mr. Graves was employed by Sprint PCS, during which time heKeys served as Areathe President and Chief Operating Officer for VCP International Inc., a Dallas-based wholesale distributor of wireless products, from July 2002 to April 2005. Prior to joining VCP International Inc., Mr. Keys served as the Senior Vice President, Business Sales for Northern CaliforniaWebLink Wireless Inc. (formerly PageMart, Inc.) from August 1998 until September 2000,March 1999 to June 2002, which included leading and managing the national sales and distribution efforts, and in other senior management positions with WebLink Wireless Inc. from January 1993 to March 1999.
Christine B. Kornegayjoined MetroPCS Communications as Area Vice President, Controller and Chief Accounting Officer in January 2005. Previously, Ms. Kornegay served as Vice President of Finance and Controller for Southern CaliforniaAllegiance Telecom, Inc. from January 2001 to June 2004. Ms. Kornegay served as Vice President of Finance and Controller of Allegiance Telecom, Inc. when it initiated bankruptcy proceedings in May 2003. Prior to joining Allegiance Telecom, Inc. in January 2001, Ms. Kornegay held various accounting and finance roles with AT&T Wireless Services from June 1994 through January 2001 and is also a certified public accountant.
Malcolm M. Lorangco-founded MetroPCS Communications and became our Senior Vice President and Chief Technical Officer in January 2006. Previously, Mr. Lorang served as our Vice President and Chief Technical Officer from our inception to January 2006. Prior to joining MetroPCS Communications, Mr. Lorang served as Vice President of Engineering for PageMart Wireless from 1989 to 1994.
John J. Olsenjoined MetroPCS Communications as Vice President and Chief Information Officer in April 2006. Mr. Olsen was formerly the Vice President and Chief Technology Officer at GTESS Corporation and was responsible for GTESS’ core technology products and information technology services. Prior to joining GTESS in May 2004, Mr. Olsen held senior information technology positions with Sprint Corporation focused on Software/Product Development for Sprint’s consumer business and Sprint’s nationwide technology infrastructure. From December 1997 through August 2001, Mr. Olsen was Vice President of Information Services and Chief Information Officer at NEC Business Network Solutions. Mr. Olsen began his information technology career in the U.S. Air Force at the School of Aerospace Medicine and spent 2 years as a Senior Consultant at General Electric, Aerospace Division.
Mark A. Stachiwbecame MetroPCS Communications’ Senior Vice President, General Counsel and Secretary in January 2006. Previously, Mr. Stachiw served as our Vice President, General Counsel and Secretary from October 2004 until January 2006. Prior to joining MetroPCS Communications, Mr. Stachiw served as Senior Vice President and General Counsel, Allegiance Telecom Company Worldwide for Allegiance Telecom, Inc. from September
2000 until March 2002.Albert S. Loverde joined us2003 to June 2004, and as Vice President and General Manager, GeorgiaCounsel, Allegiance Telecom Company Worldwide from March 2002 to September 2003. Mr. Stachiw served as Vice President and General Counsel, Allegiance Telecom Company Worldwide for Allegiance Telecom, Inc., when it initiated bankruptcy proceedings in May 2003. Prior to joining Allegiance Telecom, Inc., from April 2001 through March 2002, Mr. Stachiw was Of Counsel at Paul, Hastings, Janofsky and Walker, LLP, and represented national and international telecommunications firms in regulatory and transactional matters. Before joining
123
Paul Hastings, Mr. Stachiw was the chief legal officer for Verizon Wireless Messaging Services (formerly known as AirTouch Paging and PacTel Paging) and was the Vice President and General Counsel from April 2000 through March 2001, and Vice President, Senior Counsel and Secretary from April 1995 through April 2000.
Keith D. Terrerijoined MetroPCS Communications as Vice President Finance and Treasurer in July 1996.2006. Prior to joining us, Mr. Terreri served as the Vice President, Finance and Treasurer of Valor Communications Group, Inc. from July 2001 to July 2006. Mr. Terreri was Vice President, Finance and Treasurer of RCN Corporation from December 1999 to June 2001 and Director of Finance from January 1998 to December 1999. Mr. Terreri has over 19 years experience in finance and nine in the telecommunications industry. Mr. Terreri originally began his career at Deloitte & Touche LLP, and is also a certified public accountant.
Robert A. Youngbecame MetroPCS Communications’ Executive Vice President, Market Operations, East in January 2007. Previously Mr. Young served as our Executive Vice President, Market Operations from May 2001 until January 2007. Prior to joining our company, Mr.
LoverdeYoung served as
DirectorPresident of
Engineering for PriCellularthe Great Lakes Area of Verizon Wireless from February
1995 toJuly 1996, as Director of Marketing at Haddcomm International from January 1995 to March 1995,2001 until April 2001, and as Vice President of Verizon Wireless Messaging Services (formerly known as AirTouch Paging and General Manager for Sterling CellularPacTel Paging) from August 1990 toApril 2000 until January 1995. Mr. Loverde also spent 25 years at Bell Laboratories in various positions. Mr. Loverde was an executive officer of MetroPCS, Inc. when it initiated its bankruptcy proceedings in October 1997.
Corey A. Linquist became our Regional Vice President and General Manager, Sacramento in January 2001. Previously, Mr. Linquist was Director of Strategic Planning for our company, a position he held since our inception in July 1994. Prior to joining us, Mr. Linquist served in a similar position at PageMart Wireless. Mr. Linquist is the son of Roger D. Linquist, our President, Chief Executive Officer, Secretary and Chairman of our Board of Directors.
Frank J. Bell joined us as Vice President and General Manager, Florida in June 2001. Prior to joining our company,Verizon Wireless Messaging Services, Mr. Bell was Area Vice President of Florida for Sprint PCS from February 1998 to March 2001. During his 16 years in the wireless industry, Mr. Bell hasYoung held various senior management positions with Pactel/AirTouch Paging and Dial Page.
Phillip R. Terry became our Vice President of Corporate Marketing in December 2003. Previously, Mr. Terry served as our Staff Vice President for Product Management and Distribution Services from April 2002 to December 2003, and as our Director of Field Distribution from April 2001 to April 2002. Prior to joining us, Mr. Terry was employed by WebLink Wireless where he was the Corporate Director of Carrier Services from January 1998 to March 2001, Southwest Regional Vice President from January 1995 through December 1997 and Area Vice President for Dallas/Fort Worth from January 1990 through December 1994. Mr. Terry is the son-in-law of Roger D. Linquist, our President, Chief Executive Officer, Secretary and Chairman of our Board of Directors.
Michael N. Lavey joined us as Vice President and Controller in January 2004 and also served as Interim Chief Financial Officer from March 2004 until May 2004. Prior to joining our company, Mr. Lavey served from May 2002 to November 2003 as Vice President – Controller for VarTec Telecom, a nationwide provider of long distance and local telephone service. Previously, Mr. Lavey served as Vice President – Corporate Controller for ExcelPrimeCo Personal Communications, from January 2000 until its acquisition by VarTec in April 2002. Prior to joining Excel, Mr. Lavey held various management positions with BancTec, including Vice President – Enterprise System Strategy— Customer Care from April 1998 until April 2000, President — Independent Region from October 1997 until October 1998, and Vice President/General Manager — Houston from May 1996 to January 2000, Vice President1995 until September 1997. He also chaired PrimeCo’s Information Technology Steering Committee and Controller – North American Operations from March 1995 to May 1996, and Treasurer from March 1994 to March 1995.
was a member of its Senior Leadership Team.
W. Michael Barnes, a director of
our companyMetroPCS Communications since May 2004, held several positions at Rockwell International Corporation (now Rockwell Automation, Inc.) between 1968 and 2001, including Senior Vice President, Finance & Planning and Chief Financial Officer from 1991 through 2001. Mr. Barnes also serves as a director of Advanced Micro Devices, Inc.
C. Boyden GrayKevin Landry, a director of
our companyMetroPCS Communications since
January 1997,August 2005, currently serves as the Chief Executive Officer of TA Associates, Inc. which through its funds, is an investor in MetroPCS Communications. TA Associates, founded in 1968, is one of the oldest and largest private equity firms in the world and focuses on investing in private companies and helping management teams build their businesses. Mr. Landry previously served
as Counsel to President George Bush from 1989 to 1993. From 1981 to 1988, he served in many capacities, including Counsel to then-Vice President Bush. In addition to his service to President Bush, he has been a partner at the law firm of Wilmer Cutler Pickering LLP since 1976, providing advice on a range of regulatory matters with emphasis on telecommunications, antitrust, food and drug and environmental issues. He also serves as a director
of four other privately held companies. Mr. Gray was a director of MetroPCS, Inc. when it initiated its bankruptcy proceedings in October 1997.Harry F. Hopper, III, a director of our company since May 2001, has been a managing member of Columbia Capital or its affiliates since 1994. Columbia Capital is a venture capital firm with an investment focus on communications services, media, network infrastructure and software. Mr. Hopper is currently a member of the board of directors of Affinity InternetAlex Brown Incorporated, Ameritrade Holding Corporation, Biogen, Continental Cablevision, Instinet Group, Keystone Group, SBA Communications, Standex International Corporation and was formerly a director of DSL.Net, Equinix and Pegasus Communications Inc. as well as a number of privately held companies.
Joseph T. McCullen, Jr., has been a director of our company since May 2001 and previously from December 1995 until November 2000. He has served as a Managing Director of McCullenthe National Venture Capital a venture capital and
advisory firm, since July 2001. He served as a Managing Director of Whitney & Co. from 1999 until 2001, and as a Managing Director of OneLiberty Ventures, a venture capital firm, from 1986 until 1999. Mr. McCullen also serves as a director of several privately held companies. Mr. McCullen’s public sector experience includes service as Assistant Secretary of the Navy from 1973 to 1977, and as Special Assistant to the President from 1971 to 1973. Mr. McCullen was a director of MetroPCS, Inc. when it initiated its bankruptcy proceedings in October 1997.
Association.
Arthur C. Patterson, a director of our companyMetroPCS Communications since its inception, is a foundingFounding General Partner of Accel Partners, a venture capital firm, which was establishedlocated in 1983.Palo Alto, California. Affiliates of Accel Partners are investors in MetroPCS Communications. Mr. Patterson also serves as a director of iPass, Actuate and several privately held companies. Mr. Patterson was
James N. Perry, Jr., a director of MetroPCS
Communications since August 2005, is a Managing Director ofMadisonDearborn Partners, Inc., a Chicago-based private equity investing firm, where he specializes in investing in companies in the communications industry. From January 1993 to January 1999, Mr. Perry was a Vice President of Madison Dearborn Partners, Inc.
when it initiated its bankruptcy proceedingsAn affiliate of Madison Dearborn Partners, Inc. is an investor in
October 1997.MetroPCS Communications. Mr. Perry also presently serves on the boards of directors of Band-X Limited, Cbeyond Communications, Inc., Cinemark, Inc., Intelstat Holdings Ltd., Madison River Telephone Company, LLC and Catholic Relief Services.
John Sculley, a director of our companyMetroPCS Communications since December 1995,its inception, has been a partner in Sculley Brothers, a private investment capital firm, since June 1994. Mr. Sculley is an investor in MetroPCS Communications. Mr. Sculley also serves on the boards of directors of InPhonic and several privately held companies. Mr. Sculley was
Walker C. Simmons, a director of MetroPCS Communications since June 2006, joined Wachovia Capital Partners in 2000 and has been a partner since 2002. Before joining Wachovia Capital Partners, he worked as a Vice President with Bruckmann, Rosser, Sherrill & Co., Inc. when it initiated its bankruptcy proceedings in October 1997.Mr. Simmons also presently serves on the Board
124
Craig R. Stapleton
of Directors of American Community Newspapers, Heartland Publications, LLC, IntraLinks, Inc.,
Sonitrol, Inc., Three Eagles Communications and TMW Systems, Inc. Mr. Simmons also previously served as a director of
our company since JuneMetroPCS Communications from December 2004
served as U.S. Ambassador to the Czech Republic from August 2001 to December 2003. Prior to assuming his duties in the Czech Republic,until March 2005, when he resigned. Mr.
StapletonSimmons’ resignation was
not caused by a
real estate executive, serving since 1982 as President of Marsh and McLennan Real Estate Advisors, Inc. Mr. Stapleton currently serves on the boards of directors of T.B. Woods and Allegany Properties, and previously served on the boards of Cornerstone Properties, Security Capital Corporation and Sonoma West.disagreement with MetroPCS Communications or management.
James F. Wade, a director of
our companyMetroPCS Communications since
November 2000,December 2006, has served as Managing Partner of M/C Venture Partners, a venture capital firm, since December 1998.
M/C Venture Partners is an investor in MetroPCS Communications. Mr. Wade
leads the investment process including determining sector focus, seeking out management teams, founding new companiespreviously served as a director of MetroPCS Communications from March 2005 until May 2006, when he resigned and
working with financial sources that provide debt and equity capital to grow companies. Hefrom November 2000 through December 2004 when he resigned. Mr. Wade currently serves on the boards of directors of
Attenda, Ltd., Cavalier Telephone,
City SignalCleveland Unlimited, NuVox Communications and
New South Communications.Texas 11 Acquisition LLC. Mr. Wade’s previous resignations were not caused by a disagreement with MetroPCS Communications or management.
Board of DirectorsCompositionOur certificate of incorporation provides for two classes of directors, those elected by holders of our Class A common stock and those elected by holders of our common stock. The certificate of incorporation provides for five Class A directors and a number of common directors determined as set forth in our bylaws.
We currently have fiveeight members and one vacancy on our board of directors. Our directors are divided into three classes serving staggered three-year terms. Class AI, Class II and Class III directors will serve until our annual meeting of stockholders in 2008, 2009 and three common2010, respectively. Messrs. Linquist and Simmons are our Class I directors; Messrs. Barnes, Sculley and Wade are our Class II directors; and Messrs. Landry, Patterson and Perry are our Class III directors. Each Class A director has one vote on each matter submittedUpon expiration of the term of a class of directors, directors in that class will be eligible to be elected for a votenew three-year term at the annual meeting of stockholders in the year in which their term expires. This classification of directors could have the effect of increasing the length of time necessary to change the composition of a majority of our board of directors, and each common director currently has one vote;provided,however, that if,directors. In general, at any time,least two annual meetings of stockholders will be necessary for stockholders to effect a change in a majority of the members of our board of directors has more than four common directors, each common director shall individually have a fractional vote such that the common directors collectively have four votes. directors.
Board Committees
The
designation of common directors and election of all directors is governed by the provisions of an amended and restated stockholders agreement. Allstanding committees of our
directors have been elected pursuant to the termsboard consist of
the stockholders agreement. See “Description of Capital Stock.”Committees of the Board of Directors
Our board of directors has established four standing committees: an audit committee, a nominating and corporate governance committee, a compensation committee and a finance committee. Upon the consummation of this offering, the composition of each board committee will comply with the requirements of the Nasdaq National Market and the Sarbanes-Oxley Act of 2002.
planning committee.
Audit Committee. Our board of directors has established an audit committee of the board of directors. The members of
ourthe audit committee are
currently Messrs.
Joseph T. McCullen, Jr., W. Michael Barnes,
as chairman, John Sculley and
Harry F. Hopper, III,Walker C. Simmons, each of whom has been affirmatively determined by our board of directors to be independent in accordance with applicable
NASD and SEC rules andrules. Each member of the
independence requirements of our audit
committee charter. Ourmeets the standards for financial knowledge for listed companies. In addition, the board of directors has determined that Mr.W. Michael Barnes is an “audit committee financial expert”expert,” as such term is defined in Item 401 ofRegulation S-K. Mr. W. Michael Barnes previously served as the Chief Financial Officer of Rockwell International Corporation. The responsibilities of the audit committee include:
of the board of directors include, among other things: | | |
| | Ÿ | • | overseeing, reviewing and evaluating our financial statements, the audits of our financial statements, our accounting and financial reporting processes, the integrity of our financial statements, our disclosure controls and procedures and our internal controlaudit functions; |
|
| | Ÿ | • | appointing, compensating, retaining and overseeing our independent registered public accounting firm;accountants; |
|
| | Ÿ | • | pre-approving permissible non-audit services to be performed by our independent registered public accounting firm,accountants, if any, and the fees to be paid in connection therewith; |
|
| | Ÿ• | overseeing our compliance with legal and regulatory requirements and compliance with ethical standards adopted by us; |
|
| • | establishing and maintaining whistleblower procedures; |
|
| | Ÿ | • | evaluating periodically our Code of Business Conduct and Ethics; and |
|
| | Ÿ | • | conducting an annual self-evaluation. |
125
Nominating and Corporate Governance Committee. The members of our nominating and corporate governance committee are Messrs.
James N. Perry, as chairman, Arthur C. Patterson,
and James F. Wade,
and Harry F. Hopper, III, each of whom has been affirmatively determined by our board of directors to be independent in accordance with
Nasdaqapplicable rules. The responsibilities of the nominating and corporate governance committee include:
| | |
| | Ÿ | • | assisting in the process of identifying, recruiting, evaluating and nominating candidates for membership on our board of directors and the committees thereof; |
|
| | Ÿ | • | developing processes regarding the consideration of director candidates recommended by stockholders and stockholder communications with our board of directors; and |
|
| | Ÿ | • | conducting an annual self-evaluation and assisting our board of directors and our other committees of the board committeesof directors in the conduct of their annual self-evaluations.self-evaluations; and |
|
| • | development and recommendation of corporate governance principles. |
Compensation Committee. The members of our compensation committee are Messrs.
Arthur C. Patterson, James F. Wade,
Joseph T. McCullen, Jr.as chairman, John Sculley and
Harry F. Hopper, III,C. Kevin Landry, each of whom has been affirmatively determined by our board of directors to be independent in accordance with
Nasdaqapplicable rules. The responsibilities of the compensation committee
of the board of directors include:
| | |
| | Ÿ | • | developing and reviewing general policy relating to compensation and benefits; |
|
| | Ÿ• | reviewing and evaluating the compensation discussion and analysis prepared by management; |
|
| | • | evaluating the performance of the chief executive officer and reviewing and making recommendations to our board of directors concerning the compensation and benefits of our chief executive officer, our directors and our directors;other corporate officers; |
|
| | Ÿ | • | overseeing our chief executive officer’s decisions concerning the performance and compensation of our other executive officers; |
|
| | Ÿ | • | administering our stock option and employee benefit plans; |
|
| | Ÿ | • | preparing an executive compensation report for publication in our annual proxy statement; and |
|
| | Ÿ | • | conducting an annual self-evaluation. |
Finance and Planning Committee. The members of our finance
and planning committee are Messrs. Arthur C. Patterson,
as chairman, C. Kevin Landry and James
F. Wade and Harry F. Hopper, III. Each of these members has been determined by our board of directors to be independent as defined by NASD and SEC rules.N. Perry. The responsibilities of the finance
and planning committee include:
| | |
| | Ÿ | • | monitoring our present and future capital requirements and business opportunities; |
|
| | Ÿ | • | overseeing, reviewing and evaluating our capital structure and our strategic planning and financial execution processes; and |
|
| | Ÿ | • | making recommendations to our board regarding acquisitions, dispositions and our short and long-term operating plans. |
EXECUTIVE COMPENSATION
Compensation Discussion and Analysis
We provide what we believe is a competitive total compensation package to our executive management team through a combination of base salary, an annual retainercash incentive plan, a long-term equity incentive compensation plan and broad-based benefits programs.
We place significant emphasis on pay for performance-based incentive compensation programs, which make payments when certain company/team and individual goals are achievedand/or when our common stock price appreciates. This Compensation Discussion and Analysis explains our compensation philosophy, policies and practices with respect to our chief executive officer, chief financial officer, and the other three most highly-compensated executive officers, which are collectively referred to as the named executive officers.
The Objectives of $20,000.Our non-employee directors receive an initial option grant of 40,000 shares and all non-employee directors will receive an annual option grant of 10,000 shares if they remain in office on the date of each annual stockholders meeting. Such grants will vest ratably over three years. The chairmen of our finance, compensation and nominating and governance committees receive an initial option grant of 43,000 shares and will receive an annual option grant of 12,000 shares if they remain in office on the date of each annual stockholders meeting. Our audit committee chairman receives an initial option grant of 50,000 shares and will receive an annual option grant of 15,000 shares if he remains in office on the date of each annual stockholders meeting.
Executive Compensation Committee Interlocks and Insider ParticipationProgram
Our compensation committee is currently comprisedresponsible for establishing and administering our policies governing the compensation for our executive officers. Our executive officers are elected by our board of Messrs. Arthur C. Patterson, James F. Wade, Joseph T. McCullen, Jr.directors. Our compensation committee is composed entirely of non-employee independent directors. See “Management — Board Committees — Compensation Committee.”
Our executive compensation programs are designed to achieve the following objectives:
| | |
| • | Attract and retain talented and experienced executives in the highly competitive and dynamic wireless telecommunications industry; |
|
| • | Motivate and reward executives whose knowledge, skills and performance are critical to our success; |
|
| • | Align the interests of our executive officers and stockholders by motivating executive officers to increase stockholder value and rewarding executive officers when stockholder value increases; |
|
| • | Provide a competitive compensation package which is weighted heavily towards pay for performance, and in which total compensation is primarily determined by company/team and individual results and the creation of stockholder value; |
|
| • | Ensure fairness among the executive management team by recognizing the contributions each executive makes to our success; |
|
| • | Foster a shared commitment among executives by coordinating their company/team and individual goals; and |
|
| • | Compensate our executives to manage our business to meet our long-range objectives. |
To assist management and Harry F. Hopper, III. Nonethe compensation committee in assessing and determining competitive compensation packages, the compensation committee engaged compensation consultants, Frederic W. Cook and Co, Inc. in 2005 and 2006 and Towers Perrin in 2006 and 2007.
Our compensation committee meets outside the presence of these individuals has been at any time anall of our executive officers, including the named executive officers, to consider appropriate compensation for our chief executive officer, or employeeCEO. For all other named executive officers, the committee meets outside the presence of all executive officers except our CEO and our general counsel, who recuses himself when the committee discusses his compensation. Mr. Linquist, our CEO, annually reviews each other named executive officer’s performance with the committee and makes recommendations to the compensation committee with respect to the appropriate base salary, cash performance awards to be made under our annual cash incentive plan, which was the Bonus Opportunity Plan in 2006 and the Amended and Restated MetroPCS Communications, Inc. 2004 Equity Incentive Compensation Plan, or 2004 Plan, for 2007, and the grants of long-term equity incentive awards for all executive officers, excluding himself. Based in part on these recommendations from our CEO and other considerations discussed below, the compensation committee approves the annual compensation package of our company. No member ofexecutive officers other than our CEO. Our finance and planning committee also annually establishes the compensation goals and
127
objectives for our CEO. The compensation committee serves as a memberevaluates our CEO’s performance in light of the compensation goals and objectives established for the CEO. Based on their evaluation, the compensation committee recommends to the board of directors orour CEO’s base salary, annual cash incentive and stock option awards based on its assessment of his performance with input from the committee’s consultants. The annual performance review of our executive officers are considered by the compensation committee when making decisions on setting base salary, targets for and payments under our annual cash incentive plan and grants of long-term equity incentive awards. When making decisions on setting base salary, targets for and payments under our annual cash incentive plan and initial grants of long-term equity incentive awards for new executive officers, the compensation committee considers the importance of the position to us, the past salary history of the executive officer and the contributions to be made by the executive officer to us. The compensation committee also reviews the analyses and recommendations of the executive compensation consultant retained by the committee and approves the recommendations with modifications as deemed appropriate by the compensation committee.
The compensation committee also reviews the annual performance of any entityofficers related to the CEO and considers the recommendations of the related person’s direct supervisor with respect to base salary, targets for and payments under our annual cash incentive plan and grants of long-term equity incentive awards. The compensation committee reviews and approves these recommendations with modifications as deemed appropriate by the compensation committee.
We use the following principles to guide our decisions regarding executive compensation:
Provide compensation opportunities targeted at market median levels.
To attract and retain executives with the ability and the experience necessary to lead us and deliver strong performance to our stockholders, we strive to provide a total compensation package that has oneis competitive with total compensation provided by our industry peer group.
We benchmark our salary and target incentive levels and practices as well as our performance results in relation to other comparable wireless telecommunications industry companies and telecommunications and general industry companies of similar size in terms of revenue and market capitalization. We believe that this group of companies provides an appropriate peer group because they consist of similar organizations against whom we compete for executive talent. We annually review the companies in our peer group and add or moreremove companies as necessary to insure that our peer group comparisons are meaningful. Specifically, we use the following market data to establish our salary and target annual cash and long-term incentive levels for 2007:
| | |
| • | Data in proxy statement filings from wireless telecommunications companies that we believe are comparable to us based on revenue and market capitalization or are otherwise relevant, including: |
| | |
| • | Alltel Corp; |
|
| • | Centennial Communications Corp.; |
|
| • | Dobson Communications Corp.; |
|
| • | Leap Wireless International Inc.; |
|
| • | Rural Cellular Corp; |
|
| • | SunCom PCS Holding; and |
|
| • | United States Cellular Corp. |
| | |
| • | Published survey data from public and private companies to determine appropriate compensation levels based on revenue levels in general industry and the telecommunications industry. |
We target base salaries to result in annual salaries equal to the market median (50th percentile) pay level. We target total compensation above the market median for our executives with outstanding performance achievement. To arrive at the 50th percentile for the base salaries of our named executive officers, servingwe consider
128
the median of the data gathered from proxy statements for the positions of the named executive officers in relation to the named executive officers of our peer group as well as the 50th percentile of data from published surveys for each position. If our performance on company/team and individual goals exceeds targeted levels, our executives have the opportunity, through our annual cash performance award and long-term equity incentive compensation plans, to receive total compensation above the median of market pay. We believe our executive compensation packages are reasonable when considering our business strategy, our compensation philosophy and the competitive market pay data.
For each executive officer, we consider the relevance of data of our peer group, considering:
| | |
| • | Our business need for the executive officer’s skills; |
|
| • | The contributions that the executive officer has made or we believe will make to our success; |
|
| • | The transferability of the executive officer’s managerial skills to other potential employers; |
|
| • | The relevance of the executive officer’s experience to other potential employers, particularly in the telecommunications industry; and |
|
| • | The readiness of the executive officer to assume a more significant role with another potential employer. |
Require performance goals to be achieved or common stock price to increase in order for the majority of the target pay levels to be earned.
Our executive compensation program emphasizes pay for performance. Performance is measured based on stockholder return as well as achievement of company/team and individual performance goals established by our board of directors relative to our board of director approved annual business plan. The goals for our company/team and individual measures are established so that target attainment is not assured. The attainment of payment for performance at target or above will require significant effort on the part of our executives.
The compensation package for our executive officers includes both cash and equity incentive plans that align an executive’s compensation with our short-term and long-term performance goals and objectives.
Annual cash incentive plan awards are earned based on performance measures that are aligned with our business strategy and are approved by the board of directors at the beginning of each fiscal year.
| | |
| • | For 2006, the annual cash incentive plan award under the Bonus Opportunity Plan award was based on the following performance measures: |
| | |
| • | Achievement of Operating Market Targets: |
| | |
| • | Gross margin; |
|
| • | Adjusted EBITDA per average subscriber; |
|
| • | Capital expenditures per ending subscriber at year-end; |
|
| • | New Markets % of Build; and |
|
| • | Discretionary component. |
| | |
| • | Implementation of financial controls and Sarbanes-Oxley Act compliance; and |
|
| • | Individual performance measures, such as achievement of strategic objectives, and demonstration of our core values. |
| | |
| • | For 2007, the annual cash incentive plan awards have been made as performance awards pursuant to the 2004 Plan and are based on the following performance measures: |
129
| | |
| • | Adjusted EBITDA per average subscriber; |
|
| • | Capital expenditures per ending subscriber at year-end; and |
|
| • | Discretionary component. |
| | |
| • | Construction/market readiness goals for new markets; and |
|
| • | Discretionary component. |
| | |
| • | Individual performance measures, such as achievement of strategic objectives, and demonstration of our core values. |
Gross margin is defined as gross revenues less Enhanced 911 revenues, Federal Universal Service Fund revenues and the total cost of equipment.
Adjusted EBITDA per average subscriber is determined by dividing Adjusted EBITDA by the sum of the average monthly number of customers during the year.
Capital expenditures per ending subscriber is determined by dividing the total balance of property, plant and equipment and microwave relocation costs at the end of the year by (b) the number of customers at the end of the year.
The construction/market readiness and new market percent of build goals are intended to provide focus on the successful launch of the new market for the management team during the market construction period. Each year, milestones are established specific to new markets such as number of cell sites constructed and payout is determined by percent achievement of these objectives across all new markets.
As noted above, the team performance measure has a memberdiscretionary component. This component is intended to capture how the market has performed in areas that are not quantified in the major metrics. The determination and payout of the discretionary component is based on general performance in other categories and provides recognition for contributions made to the overall health of the business.
Our long-term equity incentive program for 2006 and 2007 consists of awards of options to acquire our common stock which require growth in our common stock price in order for the executive officer to realize any value. We award stock options to align the interests of the executive officers to the interests of the stockholders through appreciation of our common stock price.
Offer the same comprehensive benefits package to all full-time employees.
We provide a competitive benefits package to all full-time employees which includes health and welfare benefits, such as medical, dental, vision care, disability insurance, life insurance benefits, and a 401(k) savings plan.
We have no structured executive perquisite benefits (e.g., club memberships or company vehicles) for any executive officer, including the named executive officers, and we currently do not provide any deferred compensation programs or supplemental pensions to any executive officer, including the named executive officers.
Provide fair and equitable compensation.
We provide a total compensation program that we believe will be perceived by both our executive officers and our stockholders as fair and equitable. In addition to conducting analyses of market pay levels and considering individual circumstances related to each executive officer, we also consider the pay of each executive officer relative to each other executive officer and relative to other members of the management team. We have designed the total compensation programs to be consistent for our executive management team.
130
Certain Policies of our Executive Compensation Program
We have adopted the following material policies related to our executive compensation program:
| | |
| • | Allocation between long-term and currently paid out compensation: The compensation we currently pay consists of base payandannual cash incentive compensation. The long-term compensation consists entirely of awards of stock options pursuant to our Second Amended and Restated 1995 Stock Option Plan of MetroPCS, Inc., as amended, or the 1995 Plan, and our 2004 Plan. The allocation between long-term and currently paid out compensation is based on an analysis of how our peer companies, telecommunication industry and general industry use long-term and currently paid compensation to pay their executive officers. |
|
| • | Allocation between cash and non-cash compensation: It is our policy to allocate all currently paid compensation and annual incentive pay in the form of cash and all long-term compensation in the form of awards of options to purchase our common stock. We consider competitive market analyses when determining the allocation between cash and non-cash compensation. |
|
| • | Return of incentive pay: We have implemented a policy for the adjustment or recovery of awards if performance measures upon which they are based are materially restated or otherwise adjusted in a manner that will reduce the size of an award or payment. This policy includes the return by any executive officer any compensation based upon performance measures that require material restatement which are caused by such executive’s intentional misconduct or misrepresentation. |
Our Executive Compensation Programs
Overall, our executive compensation programs are designed to be consistent with the objectives and principles set forth above. The basic elements of our executive compensation programs are summarized in the table below, followed by a more detailed discussion of each compensation program.
| | | | |
Element | | Characteristics | | Purpose |
|
| Base salary | | Fixed annual cash compensation; all executives are eligible for periodic increases in base salary based on performance; targeted at the median market pay level. | | Keep our annual compensation competitive with the market for skills and experience necessary to meet the requirements of the executive’s role with us. |
| Annual cash incentive awards | | Performance-based annual cash incentive earned based on company/team and individual performance against target performance levels; targeted above the market median for outstanding performance achievement. | | Motivate and reward for the achievement and over-performance of our critical financial and strategic goals. Amounts earned for achievement of target performance levels based on our annual budget is designed to provide a market-competitive pay package at median performance; potential for lesser or greater amounts are intended to motivate participants to achieve or exceed our financial and other performance goals and to not reward if performance goals are not met. Provides change in control protection. |
131
| | | | |
Element | | Characteristics | | Purpose |
|
| Long-term equity incentive plan awards (stock options) | | Performance-based equity award which has value to the extent our common stock price increases over time; targeted at the median market pay leveland/or competitive practices at peer companies. | | Align interest of management with stockholders; motivate and reward management to increase the stockholder value of the company over the long term.
Vesting based on continued employment will facilitate retention; amount realized from exercise of stock options rewards increases stockholder value of the company; provides change in control protection. |
| Retirement savings opportunity | | Tax-deferred plan in which all employees can choose to defer compensation for retirement. We provide no matching or other contributions; and we do not allow employees to invest these savings in company stock. | | Provide employees the opportunity to save for their retirement. Account balances are affected by contributions and investment decisions made by the employee. |
| Health & welfare benefits | | Fixed component. The same/comparable health & welfare benefits (medical, dental, vision, disability insurance and life insurance) are available for all full-time employees. | | Provides benefits to meet the health and welfare needs of employees and their families. |
All pay elements are cash-based except for the long-term equity incentive program, which is an equity-based (stock options) award. We consider market pay practices and practices of peer companies in determining the amounts to be paid, what components should be paid in cash versus equity, and how much of a named executive officer’s compensation should be short-term versus long-term.
Our executive officers, including the named executive officers, are assigned to pay grades, determined by comparing position-specific duties and responsibilities with the market pay data and the internal structure. Each pay grade has a salary range with corresponding annual and long-term incentive award opportunities. We believe this is a reasonable and flexible approach to achieve the objectives of the executive compensation program of appropriately determining the pay of our executives based on their skills, experience and performance.
Compensation opportunities for our executive officers, including our named executive officers, are designed to be competitive with peer companies. We believe that a substantial portion of each named executive officer’s compensation should be in performance-based pay.
In determining whether to increase or decrease compensation to our executive officers, including our named executive officers, we annually review, among other things, changes (if any) in market pay levels, the contributions made by the executive officer, the performance of the executive officer, the increases or decreases in responsibilities and roles of the executive officer, the business needs for the executive officer, the transferability of managerial skills to another employer, the relevance of the executive officer’s experience to other potential employers and the readiness of the executive officer to assume a more significant role with another organization. In addition, we consider the executive officer’s current base salary in relation to median pay levels so that for the same individual performance, an executive officer will generally receive larger increases when below median and smaller increases when at or above median.
In general, compensation or amounts realized by executives from prior compensation from us, such as gains from previously awarded stock options or options awards, are not taken into account in setting other elements of compensation, such as base pay, annual cash incentive plans, or awards of stock options under our
132
long-term equity incentive program. With respect to new executive officers, we take into account their prior base salary and annual cash incentive, as well as the contribution expected to be made by the new executive officer, the business needs and the role of the executive officer with us, and the pay of other executive officers. We believe that our executive officers should be fairly compensated each year relative to market pay levels and internal equity among executive officers. Moreover, we believe that our long-term incentive compensation program furthers our significant emphasis on pay for performance compensation.
Annual Cash Compensation
To attract and retain executives with the ability and the experience necessary to lead us and deliver strong performance to our stockholders, we provide a competitive total compensation package. Base salaries are targeted at the market median (50th percentile) pay level, while total compensation is targeted above market median for our executives with outstanding performance achievement, considering individual performance and experience, to ensure that each executive is appropriately compensated.
Base Salary
Annually we review salary ranges and individual salaries for our executive officers. We establish the base salary for each executive officer based on consideration of median pay levels in the market and internal factors, such as the individual’s performance and experience, and the pay of others on the executive team.
We consider market median pay levels among individuals in comparable positions with transferable skills within the wireless communications and telecommunications industry and comparable companies in general industry. When establishing the base salary of any executive officer, we also consider business requirements for certain skills, individual experience and contributions, the roles and responsibilities of the executive, the pay of other executive officers and other factors. We believe competitive base salary is necessary to attract and retain an executive management team with the appropriate abilities and experience required to lead us.
The base salaries paid to our named executive officers are set forth below in the Summary Compensation Table. See “— Summary of Compensation.” For the fiscal year ended December 31, 2006, base cash compensation to our named executive officers was approximately $1.5 million, with our chief executive officer receiving approximately $470,000 of that amount. We believe that the base salary paid to our executive officers during 2006 achieves our executive compensation objectives, compares favorably to market pay levels and is within our target of providing a base salary at the market median.
In 2007, adjustments to our executive officers’ total compensation were made based on an analysis of current market pay levels of peer companies and in published surveys. In addition to the market pay levels, factors taken into account in making any changes for 2006 included the contributions made by the executive officer, the performance of the executive officer, the role and responsibilities of the executive officer and the relationship of the executive officer’s base pay to the base salary of our other executives.
Annual Cash Incentive Plan Award
Consistent with our emphasis on pay for performance incentive compensation programs, we have established written annual cash incentive plans, specifically the Bonus Opportunity Plan for 2006 and a cash performance award under our 2004 Plan for 2007, pursuant to which our executive officers, including our named executive officers, are eligible to receive annual cash incentive awards based upon our performance against annual established performance targets, including financial measures and other factors, including individual performance. The annual cash incentive plan is important to focus our executive officer’s efforts and reward executive officers for annual operating results that help create value for our stockholders.
Incentive award opportunities are targeted to result in awards equal to the market median pay level assuming our target business objectives are achieved. If the target level for the performance goals is exceeded, executives have an opportunity to earn cash incentive awards above the median of the market pay levels. If the target levels for the performance goals are not achieved, executives may earn less or no annual cash incentive plan awards. In 2006, our named executive officers exceeded the target business objectives which result in
133
achieving 165.5% for the achievement of operating target components of the Bonus Opportunity Plan. The annual cash incentive plan targets are determined through our annual planning process, which generally begins in October before the beginning of our fiscal year.
For 2006 and 2007, the financial measures used to determine annual cash incentive awards included gross margin, adjusted EBITDA per average subscriber, capital expenditures per ending subscriber and construction/market readiness goals for new markets/new market % of build performance. See “— 2006 Pay Out Measures” and “— 2007 Pay Out Measures.” The gross margin measure is designed to reflect our strategy of developing new markets, growing top line revenue, and expanding our market share in existing markets. To ensure we efficiently develop and expand our markets, the Adjusted EBITDA per average subscriber measure motivates our executives to manage our costs and to take into account the appropriate level of expenses expected with our growth in number of subscribers. The capital expenditures per ending subscriber measure is designed to ensure that the appropriate level of investment is being made in our networks consistent with our growth. The construction/market readiness goals for new markets and new market percent of build measure exists to provide focus during the market construction period. The discretionary component provides recognition for contributions made to the overall health of the business and is intended to capture how the market has performed in areas that are not quantified in the major metrics.
A business plan which contains annual financial and strategic objectives is developed each year by management, reviewed and recommended by our finance and planning committee, presented to our board of directors with such changes that are deemed appropriate by the finance and planning committee of our board of directors, and are ultimately reviewed and approved by our board of directors with such changes that are deemed appropriate by the board of directors. The business plan objectives include our budgeted results for the annual cash incentive performance measures, such as penetrating existing markets and securing and developing new markets, and include all of our performance goals. The annual cash incentive plan awards and measures are presented to the compensation committee of our board of directors for review, and ultimately to our board of directors for their approval with such modifications deemed appropriate by our board of directors.
Annual cash incentive plan awards are determined at year-end based on our performance against the board of directors-approved annual cash incentive plan targets. The compensation committee also exercises discretion adjusting awards based on its consideration of each executive officer’s individual performance and for each executive officer other than the chief executive officer, based on a review of such executive’s performance as communicated to the compensation committee by the chief executive officer, and our overall performance during the year. Performance against the financial controls and Sarbanes-Oxley Act of 2002, or SOX, compliance portion of the 2006 goals was based on a review of controls across the organization and considered a number of factors, including, but not limited to, our failure to comply with Section 12(g) of the Exchange Act. The incentive plan award amounts of all executive officers, including the named executive officers, must be reviewed and recommended by our compensation committee for approval and ultimately must be approved by our board of directors before being paid. Our compensation committee and our board of directors may modify the annual cash incentive plan awards and payments prior to their payment.
134
2006 Pay Out Measures
Shown as a percentage of the total payment opportunity in the following table, is the weighting of the individual measures as well as the financial measures used to determine awards to the named executive officers for the fiscal year ended December 31, 2006.
| | | | | | | | | | | | | | | | | |
| | | | | | | | | EVP Market
| | | Other
| |
2006 Pay Out Measures/Annual Cash Incentive Plan Components | | CEO | | | CFO | | | Ops | | | NEOs | |
| |
Company/team performance | | | 70 | % | | | 60 | % | | | 70 | % | | | 70 | % |
| • Gross Margin | | | | | | | | | | | | | | | | |
| • Adjusted EBITDA per average subscriber | | | | | | | | | | | | | | | | |
| • Capital expenditures per ending subscriber | | | | | | | | | | | | | | | | |
| • New market % of build | | | | | | | | | | | | | | | | |
| • Discretionary | | | | | | | | | | | | | | | | |
Financial Controls/Sarbanes-Oxley Act compliance | | | 20 | % | | | 20 | % | | | 20 | % | | | 15 | % |
Individual performance | | | 10 | % | | | 20 | % | | | 10 | % | | | 15 | % |
In addition to changes to our financial measures from 2005 to 2006 to make our plan more straight-forward and easier to understand, the non-financial measures were adjusted in 2006 to reflect the change of focus on our internal initiatives from remediation of certain material weaknesses in financial reporting in 2005 to financial controls and voluntary Sarbanes-Oxley compliance. Likewise, individual performance measures of each executive officer were also reviewed and updated as deemed appropriate by our CEO and our compensation committee to reflect the focus of our 2006 initiatives.
2007 Pay Out Measures
Shown as a percentage of the total payment opportunity in the following table, is the weighting of the individual measures as well as the financial measures used to determine awards to the named executive officers for the fiscal year ended December 31, 2007.
| | | | |
| | All
| |
2007 Pay Out Measures/Annual Cash Incentive Plan Components | | NEOs | |
|
Company/team performance | | | 70 | % |
| • Operating Markets: | | | | |
| • Gross Margin | | | | |
| • Adjusted EBITDA per average subscriber | | | | |
| • Capital expenditures per ending subscriber | | | | |
| • Discretionary | | | | |
| • New market buildout: | | | | |
| • Construction/Market Readiness | | | | |
| • Discretionary Component | | | | |
Individual performance | | | 30 | % |
Individual performance measures of each executive officer are also reviewed and updated as deemed appropriate by our chief executive officer and our compensation committee to reflect the focus of our 2007 initiatives.
Annual Cash Incentive Plan Awards
We have developed goals for our performance measures that would result in varying levels of annual cash incentive plan awards. If the maximum performance on these goals is met, our executive officers have the opportunity to receive a maximum award equal to two times their target award. The target and maximum award opportunities under the 2006 and 2007 annual cash incentive compensation plans were set based on
135
competitive market pay levels and are shown as a percentage of annual base salary at corresponding levels of performance against our goals as shown in the following table:
| | | | |
| | 2006 and 2007 Annual Cash Incentive Plan Award
|
| | Level Based on Goal Achievement |
Officer | | At 100% (Target) | | Maximum Performance |
|
| CEO | | 100% of base salary | | 200% of base salary |
| SVP and CFO | | 75% of base salary | | 150% of base salary |
| EVP, Market Ops | | 75% of base salary | | 150% of base salary |
| SVP, General Counsel and Secretary | | 65% of base salary | | 130% of base salary |
| SVP and CTO | | 65% of base salary | | 130% of base salary |
In 2006, the annual cash incentive targets were adjusted from the 2005 levels for the named executive officers based on our analysis and observations of market pay levels. The annual cash incentive targets were adjusted from 75% to 100% for the CEO, from 55% to 75% for each of the SVP and CFO and EVP Market Operations, and from 45% to 65% for the SVP, General Counsel, and Secretary and the SVP and CTO, respectively.
The actual annual cash incentive awards made to our named executive officers pursuant to our Bonus Opportunity Plan for the fiscal year ended December 31, 2006 are set forth below in the Summary Compensation Table. See “— Summary of Compensation.” We believe that the annual cash incentive awards made to our named executive officers for the fiscal year ended December 31, 2006 achieved our executive compensation objectives, compare favorably to market pay levels and are within our target of providing total compensation above the median of market pay levels for executives with outstanding performance achievement.
Long-term Equity Incentive Compensation
We award long-term equity incentive grants to executive officers, including the named executive officers, as part of our total compensation package. These awards are consistent with our pay for performance principles and align the interests of the executive officers to the interests of our stockholders. Our compensation committee reviews and recommends to our board of directors the amount of each award to be granted to each named executive officer and our board of directors approves each award. Long-term equity incentive awards are made pursuant to our 1995 Plan, and in 2005, and after, our 2004 Plan. The 1995 Plan terminated in November 2005 and no further awards can be made under the 1995 Plan, but all options granted before November 2005 remain valid in accordance with their terms.
Our long-term equity incentive compensation is currently exclusively in the form of options to acquire our common stock. The value of the stock options awarded is dependent upon the performance of our common stock price. While the 2004 Plan allows for other forms of equity compensation, our compensation committee and management believe that currently stock options are the appropriate vehicle to provide long-term incentive compensation to our executive officers. Other types of long-term equity incentive compensation may be considered in the future as our business strategy evolves.
Stock option awards provide our executive officers with the right to purchase shares of our common stock at a fixed exercise price for a period of up to ten years under the 2004 Plan and between ten and fifteen years under the 1995 Plan. Stock options are earned on the basis of continued service to us and generally vest over a period of one to four years, and for multiyear awards, beginning with one-fourth vesting one year after the date of grant, then the balance pro-rata vesting monthly thereafter. See “— Employment Agreements, Severance Benefits and Change in Control Provisions” for a discussion of the change in control provisions related to stock options. Stock options under the 1995 Plan may be exercised any time after grant subject to repurchase by us if any stock is unvested at the time an employee ceases service with us.
The exercise price of each stock option granted in 2006 is based on the fair market value of our common stock on the grant date as determined by our board of directors based upon the recommendation of our finance and planning committee and of management based on certain data, including discounted cash flow analysis,
136
comparable company analysis and comparable transaction analysis, as well as contemporaneous valuation reports. With the exception of the grant in December 2006, the valuation in 2006 was performed quarterly. The award in December 2006 was based on a valuation performed in December 2006. We do not have any program, plan or practice of setting the exercise price based on a date or price other than the fair market value of our common stock on the grant date.
Our named executive officers receive an initial grant of stock options. Our executive officers are eligible to receive annual awards of stock options beginning in the year in which they reach their second anniversary of their hire date. Individual determinations are made with respect to the number of stock options granted to executive officers. In making these determinations, we consider our performance relative to the financial and strategic objectives set forth in the annual business plan, the previous year’s individual performance of each executive officer, the market pay levels for the executive officer, and the number of options granted to other executive officers. Annual grants are targeted at the median level of market pay practices and market pay levels for the executive officer, but may be adjusted based on individual performance. This analysis is also used to determine any new hire or promotion-related grants that may be made during the year. Based on individual performance and contributions to our overall performance, the 2006 stock option grants awarded to the named executive officers were at approximately the 75th percentile of market pay level for each named executive officer.
Like our other pay components, long-term equity incentive award grants are determined based on an analysis of competitive market levels. Long-term equity incentive grant ranges have been established which result in total compensation levels ranging from median to above median of market pay levels. The number of options granted to a named executive officer is intended to reward prior year’s individual performance.
Generally, we do not consider an executive officer’s stock holdings or previous stock option grants in determining the number of stock options to be granted. We believe that our executive officers should be fairly compensated each year relative to market pay levels and relative to our other executive officers. Moreover, we believe that our long-term incentive compensation program furthers our significant emphasis on pay for performance compensation. However, we undertook an analysis of executive officer stock holdings in determining the appropriate one-time stock option grant, as discussed below, made prior to our initial public offering. We do not have any requirement that executive officers hold a specific amount of our common stock or stock options.
Although the compensation committee is the plan administrator for the 2004 Plan, all awards of stock options under the 1995 Plan and the 2004 Plan were recommended by our compensation committee and approved by our board of directors. Beginning in 2007, our board of directors has delegated to the compensation committee the power to approve option grants to non-officers. For 2006, our board of directors made all annual option grants to eligible employees on a single date each year, with exceptions for new hires, promotions and special grants. Typically, the board of directors has granted annual awards at its regularly scheduled meeting in March. The timing of the grants is consistent each year and is not coordinated with the public release of nonpublic material information.
While the vast majority of stock option awards to our executive officers have been made pursuant to our annual grant program or in connection with their hiring or promotion, the compensation committee retains discretion to make stock option awards to executive officers at other times, including in connection with the hiring of a new executive officer, the promotion of an executive officer, to reward executive officers, for retention purposes or for other circumstances recommended by management or the compensation committee.
Indemnification The exercise price of Directorsany such grant is the fair market value of our stock on the grant date.
In December 2006, in recognition of efforts related to our pending initial public offering and
OfficersUnder Section 145to align executive ownership with us, we made a special stock option grant to our named executive officers and certain other eligible employees. We granted stock options to purchase an aggregate of 6,885,000 shares of our common stock to our named executive officers and certain other officers and employees. The purpose of the Delaware General Corporation Law,grant was also to provide retention of employees following our initial public offering as well as to motivate employees to return value to our stockholders through future appreciation of our common stock price. The exercise price for the option grants is $11.33, which is the fair market value of our common stock on the date
137
of the grant as determined by our board of directors after receiving a valuation performed by an outside valuation consultant and the recommendation of the finance and planning committee and management. The stock options granted to the named executive officers other than our CEO and our senior vice president and chief technical officer will generally vest on a four-year vesting schedule with 25% vesting on the first anniversary date of the award and the remainder pro-rata on a monthly basis thereafter. The stock options granted to our CEO will vest on a three-year vesting schedule with one-third vesting on the first anniversary date of the award and the remainder pro-rata on a monthly basis thereafter. The stock options granted to our senior vice president and chief technology officer will vest over a two-year vesting schedule with one-half vesting on the first anniversary of the award and the remainder pro-rata on a monthly basis thereafter.
For accounting purposes, we apply the guidance in Statement of Financial Accounting Standard 123 (revised December 2004), or SFAS 123(R), to record compensation expense for our stock option grants. SFAS 123(R) is used to develop the assumptions necessary and the model appropriate to value the awards as well as the timing of the expense recognition over the requisite service period, generally the vesting period, of the award.
Executive officers recognize taxable income from stock option awards when a vested option is exercised. We generally receive a corresponding tax deduction for compensation expense in the year of exercise. The amount included in the executive officer’s wages and the amount we may deduct is equal to the common stock price when the stock options are exercised less the exercise price multiplied by the number of stock options exercised. We do not pay or reimburse any executive officer for any taxes due upon exercise of a stock option.
In 2005, we determined that we had previously granted certain options to purchase our common stock under our 1995 Plan at exercise prices which we believed were below the fair market value of our common stock at the time of grant. In December 2005, we offered to amend the affected stock option grants of all affected employees by increasing the exercise price of such affected stock option grants to the fair value of our common stock as of the date of grant and awarding additional stock options which vested 50% on January 1, 2006 and 50% on January 1, 2007 at the fair market value of our common stock as of the award date provided that the employee remained employed on those dates.
Stock option grants are currently made only from the 2004 Plan. Under the 2004 Plan, an option repricing is only allowable with stockholder approval. We no longer grant options under the 1995 Plan, but options granted under the 1995 Plan remain in effect in accordance with their terms.
Overview of 2006 Compensation
We believe that the total compensation paid to our named executive officers for the fiscal year ended December 31, 2006 achieves the overall objectives of our executive compensation program. In accordance with our established overall objectives, executive compensation remained weighted heavily to pay for performance and was competitive with market pay levels. In alignment with our established executive compensation philosophy, we continue to move towards a market position above median for outstanding performance and achievement.
For 2006, our chief executive officer received total compensation of approximately $11.8 million, which includes a base salary of $466,923, stock option awards with a grant date value of approximately $10.6 million and non-equity incentive plan compensation of $815,300. Based on the market analysis, the base salary and total cash compensation paid to our chief executive officer for 2006 was below market median pay level. We believe that the total compensation paid to our chief executive officer satisfies the objectives of our executive compensation program. The total compensation and elements thereof paid to each of our named executive officers during 2006 is set forth below in the Summary Compensation Table. See “— Summary of Compensation.”
138
Other Benefits
Retirement Savings Opportunity
All employees may participate in our 401(k) Retirement Savings Plan, or 401(k) Plan. Each employee may make before-tax contributions of up to 60% of their base salary up to current Internal Revenue Service limits. We provide this plan to help our employees save some amount of their cash compensation for retirement in a tax efficient manner. We do not match any contributions made by our employees to the 401(k) Plan, nor did we make any discretionary contributions to the 401(k) Plan in the fiscal year ended December 31, 2006. We also do not provide an option for our employees to invest in our common stock in the 401(k) plan.
Health and Welfare Benefits
All full-time employees, including our named executive officers, may participate in our health and welfare benefit programs, including medical, dental and vision care coverage, disability insurance and life insurance.
Employment Agreements, Severance Benefits and Change in Control Provisions
We do not have any employment agreements in effect with any of our named executive officers.
We grant options, or have granted options, that remain outstanding under two plans, the 1995 Plan and the 2004 Plan. The 1995 Plan terminated in November 2005 and no further awards can be made under the 1995 Plan, but all options granted before November 2005 remain valid in accordance with their terms. The 1995 Plan and the 2004 Plan contain certain change in control provisions. We have these change in control provisions in our 1995 Plan and 2004 Plan to ensure that if our business is sold our executives and other employees who have received stock options under either plan will remain with us through the closing of the sale.
The 1995 Plan
Under our 1995 Plan, in the event of a “corporate transaction,” as defined in the 1995 Plan, the following occurs with respect to stock options granted under the 1995 Plan:
| | |
| • | Each outstanding option automatically accelerates so that each option becomes fully exercisable for all of the shares of the related class of common stock at the time subject to such option immediately before the corporation transaction; |
|
| • | All outstanding repurchase rights automatically terminate and the shares of common stock subject to those terminated rights immediately vest in full; |
|
| • | Immediately following a corporate transaction, all outstanding options terminate and cease to be outstanding, except to the extent assumed by the successor corporation and thereafter adjusted in accordance with the 1995 Plan; and |
|
| • | In the event of an “involuntary termination” of an optionee’s “service” with us within 18 months following a corporate transaction, any fully-vested options issued to such holder remain exercisable until the earlier of (i) the expiration of the option term, or (ii) the expiration of one year from the effective date of the involuntary termination. |
Corporate transactions for purposes of the 1995 Plan include either of the following stockholder-approved actions involving us:
| | |
| • | A merger or consolidation transferring greater than 50% of the voting power of our outstanding securities to a person or persons different from the persons holding those securities immediately prior to such transaction; or |
|
| • | The disposition of all or substantially all of our assets in a complete liquidation or dissolution; |
139
The 2004 Plan
Under our 2004 Plan, unless otherwise provided in an “award,” a “change of control,” as defined in the 2004 Plan, results in the following:
| | |
| • | All “options” and “stock appreciation rights” then outstanding become immediately vested and fully exercisable; |
|
| • | All restrictions and conditions of all “restricted stock” and “phantom stock” then outstanding are deemed satisfied, and the “restriction period” or other limitations on payment in full with respect thereto are deemed to have expired, as of the date of the change in control; and |
|
| • | All outstanding “performance awards” and any “other stock or performance-based awards” become fully vested, deemed earned in full and are to be promptly paid to the participants as of the date of the change in control. |
A change of control for purpose of the 2004 Plan is deemed to have occurred if:
| | |
| • | Any “person” (a) other than us or any of our subsidiaries, (b) any of our or our subsidiaries’ employee benefit plans, (c) any “affiliate,” (d) a company owned, directly or indirectly, by our stockholders, or (e) an underwriter temporarily holding our securities pursuant to an offering of such securities, becomes the “beneficial owner,” directly or indirectly, of more than 50% of our voting stock; |
|
| • | A merger, organization, business combination or consolidation of us or one of our subsidiaries transferring greater than 50% of the voting power of our outstanding securities to a person or persons different from the persons holding those securities immediately prior to such transaction; |
|
| • | The disposition of all or substantially all of our assets, other than to the current holders of 50% or more of the voting power of our voting securities; |
|
| • | The approval by the stockholders of a plan for the complete liquidation or dissolution; or |
|
| • | The individuals who constitute our board on the effective date of the 2004 Plan (or any individual who was appointed to the board of directors by a majority of the individuals who constitute our board of directors as of the effective date of the 2004 Plan) cease for any reason to constitute at least a majority of our board of directors. |
Additionally, under the 2004 Plan, if approved by our board of directors prior to or within 30 days after such a change in control, the board of directors has the right for a45-day period immediately following the change in control to require all, but not less than all, “participants” to transfer and deliver to us all “awards” previously granted to the participants in exchange for an amount equal to the “cash value” of the “awards.”
While we have broad powersno written severance plan for our executives, in practice, we have offered severance payments to terminated executives based on the position held and the time in the role. Generally, it has been our practice to provide twelve months of severance for executives, potentially adjusted for length of service, where the executive’s service has been severed by us. For a more detailed discussion of the 2004 Plan, see “— Discussion of Summary Compensation and Plan-Based Awards Tables — 2004 Equity Incentive Compensation Plan.”
Stock Ownership Guidelines
Stock ownership guidelines have not been implemented by the compensation committee for our executive officers or directors. Prior to our initial public offering, the market for our stock was limited to other stockholders and subject to a stockholders agreement that limited a stockholder’s ability to transfer their stock. We have chosen historically not to require stock ownership for our executive officers or directors given the limited market for our securities. We will continue to periodically review best practices and re-evaluate our position with respect to stock ownership guidelines.
140
Securities Trading Policy
Our securities trading policy states that executive officers, including the named executive officers, and directors may not purchase or sell puts or calls to sell or buy our stock, engage in short sales with respect to our stock, or buy our securities on margin.
Tax Deductibility of Executive Compensation
Limitations on deductibility of compensation may occur under Section 162(m) of the Internal Revenue Code which generally limits the tax deductibility of compensation paid by a public company to its chief executive officer and certain other highly compensated executive officers to $1 million in the year the compensation becomes taxable to the executive officer. There is an exception to the limit on deductibility for performance-based compensation that meets certain requirements.
Although deductibility of compensation is preferred, tax deductibility is not a primary objective of our compensation programs. We believe that achieving our compensation objectives set forth above is more important than the benefit of tax deductibility and we reserve the right to maintain flexibility in how we compensate our executive officers that may result in limiting the deductibility of amounts of compensation from time to time.
Summary of Compensation
The following table sets forth certain information with respect to compensation for the year ended December 31, 2006 and 2005 earned by or paid to our chief executive officer, chief financial officer, and our three other most highly compensated executive officers, which are referred to as the named executive officers.
Summary Compensation Table
| | | | | | | | | | | | | | | | | | | | | |
| | | | | | | | | | | | Non-Equity
| | | | |
| | | | | | | | | Option
| | | Incentive Plan
| | | | |
| | | | | | | | | Awards
| | | Compensation
| | | | |
Name & Principal Position | | Year | | | Salary | | | (3) | | | (4) | | | Total | |
| |
| Roger D. Linquist | | | 2006 | | | $ | 466,923 | | | $ | 1,184,793 | | | $ | 815,300 | | | $ | 2,467,016 | |
| — President and CEO | | | 2005 | | | $ | 435,833 | | | | — | | | $ | 527,840 | | | $ | 963,673 | |
| J. Braxton Carter | | | 2006 | | | $ | 287,404 | | | $ | 410,865 | | | $ | 379,000 | | | $ | 1,077,269 | |
| — SVP/CFO | | | 2005 | | | $ | 264,750 | | | | — | | | $ | 238,280 | | | $ | 503,030 | |
| Robert A. Young | | | 2006 | | | $ | 330,769 | | | $ | 583,738 | | | $ | 424,200 | | | $ | 1,338,707 | |
| — EVP Market Operations | | | 2005 | | | $ | 310,750 | | | | — | | | $ | 265,340 | | | $ | 576,090 | |
| Mark A. Stachiw | | | 2006 | | | $ | 223,173 | | | $ | 349,212 | | | $ | 251,700 | | | $ | 824,085 | |
| — SVP/General Counsel and Secretary(1) | | | 2005 | | | $ | 204,583 | | | | — | | | $ | 136,740 | | | $ | 341,323 | |
| Malcolm M. Lorang | | | 2006 | | | $ | 214,135 | | | $ | 247,300 | | | $ | 237,500 | | | $ | 698,935 | |
| — SVP/Chief Technology Officer(2) | | | 2005 | | | $ | 202,250 | | | | — | | | $ | 130,790 | | | $ | 333,040 | |
| | |
| (1) | | Mr. Stachiw became a Senior Vice President during 2006. |
|
| (2) | | Mr. Lorang became a Senior Vice President during 2006. |
|
| (3) | | The value of the option awards for 2006 is determined using the fair value recognition provisions of SFAS 123(R), which was effective January 1, 2006. For option awards during the year ended December 31, 2005, in accordance with APB 25, the following amounts were included as non-cash compensation expense in the 2005 audited consolidated financial statements for Messrs. Linquist, Carter, Young, and Lorang, respectively: $83,199, $6,521, $28,473 and $289,800. See Note 2 “Summary of Significant Accounting Policies” to the consolidated financial statements contained elsewhere in this offering circular for further discussion of the accounting treatment for these options. |
|
| (4) | | During 2005 and 2006, MetroPCS Communications awarded annual cash incentive bonuses pursuant to a written annual cash incentive plan. This plan provides for the award of annual cash bonuses based upon targets and maximum bonus payouts set by the board of directors at the beginning of each fiscal year. See “— Discussion of Summary Compensation and Plan-Based Awards Tables — Material Terms of Plan-Based Awards.” |
141
Grants of Plan-Based Awards
The following table sets forth certain information with respect to grants of plan-based awards for the year ended December 31, 2006 to the named executive officers.
Grants of Plan-Based Awards
| | | | | | | | | | | | | | | | | | | | | | | | | | | | | |
| | | | | | | | | | | | | | | | | | All Other
| | | | |
| | | | | | | | | | | | | | | | | | Option
| | | | |
| | | | | | | | | | | | | | | | | | Awards:
| | | Exercise
| |
| | | | | | | | | | | | | | | | | | Number of
| | | or Base
| |
| | | | | | | | | Estimated Future Payouts
| | | Securities
| | | Price of
| |
| | | | | | | | | Under Non-Equity Incentive
| | | Underlying
| | | Option
| |
| | | Grant
| | | Grant Date
| | | Plan Awards(4) | | | Options
| | | Awards
| |
Name & Principal Position | | Date | | | Fair Value(3) | | | Threshold | | | Target | | | Maximum | | | (#) | | | ($/Share) | |
| |
| Roger D. Linquist | | | | | | | | | | $ | 0 | | | $ | 480,000 | | | $ | 960,000 | | | | — | | | | — | |
| — President and CEO | | | 3/14/2006 | | | $ | 1,676,633 | | | | — | | | | — | | | | — | | | | 513,900 | | | | 7.15 | |
| | | | 12/22/2006 | | | $ | 8,907,975 | | | | — | | | | — | | | | — | | | | 2,250,000 | | | | 11.33 | |
| J. Braxton Carter | | | | | | | | | | $ | 0 | | | $ | 221,250 | | | $ | 442,500 | | | | — | | | | — | |
| — Senior VP/CFO | | | 3/14/2006 | | | $ | 446,319 | | | | — | | | | — | | | | — | | | | 136,800 | | | | 7.15 | |
| | | | 12/22/2006 | | | $ | 2,375,460 | | | | — | | | | — | | | | — | | | | 600,000 | | | | 11.33 | |
| Robert A. Young | | | | | | | | | | $ | 0 | | | $ | 255,000 | | | $ | 510,000 | | | | — | | | | — | |
| — Executive VP Market | | | 3/14/2006 | | | $ | 745,823 | | | | — | | | | — | | | | — | | | | 228,600 | | | | 7.15 | |
| Operations — East | | | 12/22/2006 | | | $ | 2,375,460 | | | | — | | | | — | | | | — | | | | 600,000 | | | | 11.33 | |
| Mark A. Stachiw | | | | | | | | | | $ | 0 | | | $ | 149,500 | | | $ | 299,000 | | | | — | | | | — | |
| — Senior VP/General Counsel | | | 3/14/2006 | | | $ | 61,663 | | | | — | | | | — | | | | — | | | | 18,900 | | | | 7.15 | |
| and Secretary(1) | | | 3/14/2006 | | | $ | 195,754 | | | | — | | | | — | | | | — | | | | 60,000 | | | | 7.15 | |
| | | | 12/22/2006 | | | $ | 1,781,595 | | | | — | | | | — | | | | — | | | | 450,000 | | | | 11.33 | |
| Malcolm M. Lorang | | | | | | | | | | $ | 0 | | | $ | 143,000 | | | $ | 286,000 | | | | — | | | | | |
| — Senior VP/Chief Technology | | | 3/14/2006 | | | $ | 178,136 | | | | — | | | | — | | | | — | | | | 54,600 | | | | 7.15 | |
| Officer(2) | | | 3/14/2006 | | | $ | 195,754 | | | | — | | | | — | | | | — | | | | 60,000 | | | | 7.15 | |
| | | | 12/22/2006 | | | $ | 593,865 | | | | — | | | | — | | | | — | | | | 150,000 | | | | 11.33 | |
| | |
| (1) | | Mr. Stachiw became a Senior Vice President during 2006. |
|
| (2) | | Mr. Lorang became a Senior Vice president during 2006. |
|
| (3) | | The value of the option awards for 2006 is determined using the fair value recognition provisions of SFAS 123(R) which was effective January 1, 2006. |
|
| (4) | | During 2005 and 2006 MetroPCS Communications awarded annual cash incentive bonuses pursuant to a written Bonus Opportunity Plan. This plan provides for the award of annual cash bonuses based upon targets and maximum bonus payouts set by the board of directors at the beginning of each fiscal year. See “— Discussion of Summary Compensation and Plan-Based Awards Tables — Material Terms of Plan-Based Awards.” The actual amount paid to each named executive officer pursuant to the Bonus Opportunity Plan for the fiscal year ended December 31, 2006 is set forth in the Summary Compensation Table under the column titled “Non-Equity Incentive Plan Compensation.” See “— Summary of Compensation.” |
Discussion of Summary Compensation and Plan-Based Awards Tables
Our executive compensation policies and practices, pursuant to which the compensation set forth in the Summary Compensation Table and the grants of Plan Based Awards table was paid or awarded, are described above under “Compensation Discussion and Analysis.” A summary of certain material terms of our compensation plans and arrangements is set forth below.
Employment and Indemnification Arrangements
We do not have any employment contracts in effect with any of our named executive officers.
We have entered into agreements with each director, each officer, and certain other employees which require us to indemnify ourand advance expenses to the directors, officers, and officers against liabilities they may incur in such capacities, including liability undercovered employees to the Securities Act. Our certificate of incorporation provides that, under specific conditions, we shall indemnify anyfullest
142
extent permitted by applicable law if the person who wasis or is a party or is threatened to be made a party to any threatened, pending or completed action, suit, proceeding, investigation, administrative hearing whether formal or proceeding by reasoninformal, governmental or non-governmental, civil, criminal, administrative, or investigative if he acted in good faith and in a manner he reasonably believed to be in, or not opposed to, the best interests of MetroPCS Communications or in a manner otherwise expressly permitted under our certificate of incorporation, the fact that heby-laws, or sheour stockholders agreement.
Bonus and Salary
Our board of directors has established a pay for performance approach for determining executive pay. Base salaries are targeted at the median market pay levels while total annual cash compensation is
or was our director, officer, employee or agent.targeted above the median of market pay levels for outstanding performance achievement. We have established a peer group of publicly traded companies in similar lines of business in similar geographies, as well as similar in size in terms of revenue and market capitalization. We have also
entered into separate indemnification agreements with eachutilized several well-established third-party surveys that are industry specific and focused on executive pay in the telecommunications and wireless industries. See “— The Objectives of our
directors and executive officers under which we have agreed to indemnify, and to advance expenses to, each director and executive officer to the fullest extent permitted by applicable law with respect to liabilities they may incur in their capacities as directors and officers.We maintain director and officer liability insurance to insure each person who was, is, or will be our director or officer against specified losses and wrongful acts of such director or officer in his or her capacity as such, including breaches of duty and trust, neglect, error and misstatement. In accordance with the director and officer insurance policy, each insured party will be entitled to receive advances of specified defense costs.
At present, there is no pending litigation or proceeding involving any of our directors, officers, employees or agents where indemnification would be required or permitted. We are not aware of any threatened litigation or proceeding that might result in a claim for such indemnification.
Executive Compensation
The following table sets forth the cash Program.”
Amended and non-cash compensation earned by, awarded toRestated MetroPCS Communications, Inc. 2004 Equity Incentive Compensation Plan
Our board of directors has adopted, and
paid to our
“named executive officers,” who arestockholders have approved, our
Chief Executive Officer and four other most highly compensated executive officers whose salary and bonus for the fiscal years ended December 31, 2003 were in excess of $100,000 for services rendered in all capacities to us for each such fiscal year:Summary Compensation Table
| | | | | | | | | | |
| | | | | | | | Long-term
Compensation
|
| | | | Annual Compensation (1)
| | Number of Shares
Underlying
Stock Options (2)(3)
|
Name and Principal Position
| | Year
| | Salary
| | Bonus
| |
Roger D. Linquist
President, Chief Executive Officer, Secretary and
Chairman of the Board
| | 2003
2002
| | $
| 331,293
313,125
| | $
| 232,600
280,600
| | 57,000
54,700
|
Robert A. Young
Executive Vice President, Market Operations
| |
2003
2002
| |
| 270,669
258,750 | |
| 153,600
116,607 | | 37,500
— |
Dennis G. Spickler
Vice President of Business Development (4)
| |
2003
2002
| |
| 208,459
198,625 | |
| 116,100
142,355 | | 28,500
26,400 |
Frank J. Bell
Vice President and General Manager, Florida
| |
2003
2002
| |
| 193,040
186,089 | |
| 110,000
63,173 | | 23,250
— |
Herbert “Chip��� Graves, IV
Vice President and General Manager, San Francisco
| |
2003
2002
| |
| 216,073
191,478 | |
| 80,000
— | | —
55,000 |
(1) | Perquisites and other personal benefits, securities or property, in the aggregate, are less than either $50,000 or 10% of the total annual salary and bonus reported for each named executive officer. |
(2) | Reflects the number of shares of common stock that each named executive officer may acquire upon the exercise of options granted under our 1995 stock option plan. See “—Equity Compensation Plans—1995 Stock Option Plan.” |
(3) | To date, all options granted under the 1995 stock option plan have been immediately exercisable. Shares underlying such options, however, vest over time according to the vesting schedule for each particular option grant. Although all listed options are fully exercisable, not all shares underlying such options are fully vested. To the extent that an option holder has exercised options for unvested shares and such option holder’s service with us is terminated, our 1995 stock option plan provides that we may repurchase any or all such unvested shares at a price equal to the aggregate exercise price paid for such shares. |
(4) | Mr. Spickler was appointed Vice President of Business Development in March 2004. Mr. Spickler served as our Vice President of Finance and Chief Financial Officer from September 1996 through March 2004. |
Option Grants in Last Fiscal Year
The following table contains additional information concerning the stock option grants made to each of the named executive officers during the fiscal year ended December 31, 2003.
| | | | | | | | | | | | | | | | | | | |
| | | Number of
Securities
Underlying
Options
Granted
(1) (2)
| | Individual Grants
| | Expiration
Date
| | Potential Realizable Value at Assumed Annual Rate of Stock Price
Appreciation for Option Term (3)(4)
|
Name
| | | % of Total
Options
Granted to
Employees
in Fiscal
Year
| | | Exercise
Price Per
Share
| | | 0%
| | 5%
| | 10%
|
Roger D. Linquist | | 57,000 | | 5.62 | % | | $ | 4.70 | | 9/16/2013 | | $ | 929,100 | | $ | 1,681,887 | | $ | 2,836,810 |
Robert A. Young | | 37,500 | | 3.70 | | | | 4.70 | | 6/24/2013 | | | 611,250 | | | 1,106,505 | | | 1,866,322 |
Dennis G. Spickler | | 28,500 | | 2.81 | | | | 4.70 | | 9/16/2013 | | | 464,550 | | | 840,943 | | | 1,418,405 |
Frank J. Bell | | 23,250 | | 2.29 | | | | 4.70 | | 9/16/2013 | | | 378,975 | | | 686,033 | | | 1,157,120 |
Herbert “Chip” Graves, IV | | — | | — | | | | — | | — | | | — | | | — | | | — |
(1) | Reflects the number of shares of common stock that each named executive officer may acquire upon the exercise of options granted under our 1995 stock option plan. See “—Equity Compensation Plans—1995 Stock Option Plan.” |
(2) | To date, all options granted under our 1995 stock option plan have been immediately exercisable. Shares underlying such options, however, vest over time according to the vesting schedule for each particular option grant. Although all listed options are fully exercisable, not all shares underlying such options are fully vested. To the extent that an option holder has exercised options for unvested shares and such option holder’s service with us is terminated, our 1995 stock option plan provides that we may repurchase any or all such unvested shares at a price equal to the aggregate exercise price paid for such shares. |
(3) | Based upon an initial fair market value equal to the initial public offering price. |
(4) | Amounts represent hypothetical gains that could be achieved for the listed options if exercised immediately prior to the expiration date. The 0%, 5% and 10% assumed annual rates of compounded stock price appreciation do not represent our estimates or projections of the future prices of our common stock. These amounts represent assumed rates of appreciation in the value of our common stock from the deemed fair market value for accounting purposes on the date of grant. Actual gains, if any, over stock option exercise prices are dependent on the actual fair market value of our common stock. The potential values reflected in this table may not be achieved. All amounts have been rounded to the nearest whole dollar. |
Aggregated Option Exercises in 2003 and Fiscal Year-End Option Values
The following table sets forth information concerning options exercised during the last fiscal year and held as of December 31, 2003 by each of the named executive officers. To date, all shares acquired pursuant to the exercise of options have been fully vested on the date of exercise.
| | | | | | | | | | | | | | | |
| | | Shares
Acquired on
Exercise
| | Value
Realized
(1)
| | Number of Shares Underlying
Unexercised Options at December 31, 2003
| | Value of Unexercised In-the-Money Options at
December 31, 2003 (1)
|
| | | | | Exercisable (2)
| | Unexercisable (3)
| | Exercisable
| | Unexercisable
|
Roger D. Linquist | | — | | $ | — | | 4,198,450 | | — | | $ | 46,383,493 | | $ | — |
Robert A. Young | | — | | | — | | 162,500 | | — | | | 1,088,750 | | | — |
Dennis G. Spickler | | 65,500 | | | 729,179 | | 499,400 | | — | | | 5,264,623 | | | — |
Frank J. Bell | | — | | | — | | 83,250 | | — | | | 557,775 | | | — |
Herbert “Chip” Graves, IV | | — | | | — | | 55,000 | | — | | | 368,500 | | | — |
(1) | Prior to this offering, there was no established trading market for any class of our capital stock. The fair market value of our common stock for accounting purposes, as determined by the administrator of our 1995 stock option plan pursuant to terms of the plan, was $11.40 per share as of December 31, 2003. |
(2) | Reflects the number of shares of common stock that each named executive officer may acquire upon the exercise of options granted under our 1995 stock option plan. See “—Equity Compensation Plans—1995 Stock Option Plan.” |
(3) | Although all listed options are fully exercisable, not all shares underlying such options are fully vested. To the extent that an option holder has exercised options for unvested shares and such option holder’s service with us is terminated, our 1995 stock option plan provides that we may repurchase any or all such unvested shares at a price equal to the aggregate exercise price paid for such shares. As of December 31, 2003, (i) 92,327 of Mr. Linquist’s option shares were unvested, (ii) 84,375 of Mr. Young’s option shares were unvested, (iii) 58,675 of Mr. Spickler’s option shares were unvested, (iv) 47,000 of Mr. Bell’s option shares were unvested, and (v) 30,937 of Mr. Graves’ option shares were unvested. |
Equity Compensation Plans
2004 Plan.
1995 Stock Option PlanAdministration.Our second amended and restated 1995 stock option plan, which we refer to as our 1995 stock option plan, provides for the grant of options to acquire shares of our common stock. Incentive and nonqualified options may be granted to our employees, directors, consultants and other independent advisors. The maximum number of shares of common stock that may be issued under our 1995 stock option plan2004 Plan is currently 12,321,500 shares, subject to adjustments upon specified corporate events. In the discretion of the compensation committee, the exercise price for options granted prior to the consummation of this offering may be less than, equal to or greater than the fair market value of the underlying common stock on the option grant date. However, the exercise price for options granted after the consummation of this offering may not be less than the fair market value of the underlying common stock on the option grant date. Options shall have such exercise and other terms as may be established by the compensation committee, but may not be granted for terms greater than 15 years. Options
may be granted for shares of common stock which will vest over time in accordance with schedules establishedadministered by the compensation committee of our board of directors. Option holders have the right to exercise these options immediately, even if the vesting criteria have not been met. If an option for unvested shares of common stock is exercised, the option holder is restricted from selling the unvested restricted shares prior to their vesting and if the option holder’s service with us is terminated, we may repurchase any and all of their unvested shares at a price equal to the aggregate exercise price paid for such shares. Our 1995 stock optionAs plan also provides thatadministrator, the compensation committee may, withhas full authority to (i) interpret the consent of the affected option holders, reprice outstanding options or cancel2004 Plan and regrant options onall awards thereunder, (ii) make, amend and rescind such termsrules as it deems appropriate. Stockholder approval is also required for any repricing.
2004 Equity Incentive Compensation Plan
Our 2004 equity incentive compensation plan providesnecessary for the administration of the 2004 Plan, (iii) make all determinations necessary or advisable for the administration of the 2004 Plan, and (iv) make any corrections to the 2004 Plan or an award deemed necessary by the compensation committee to effectuate the 2004 Plan. All awards under the 2004 Plan are granted by our compensation committee in its discretion, but historically all awards to executive officers are approved by our board of directors based on the recommendations of our compensation committee.
Eligibility. All of our and our affiliates’ employees, consultants and non-employee directors are eligible to be granted awards by our compensation committee under the 2004 Plan. An employee, consultant or non-employee director granted an award is a participant under our 2004 Plan. Our compensation committee also has the authority to grant awards to a third party designated by a non-employee director provided that (i) our board of incentivedirectors consents to such grant, (ii) such grant is made with respect to awards that otherwise would be granted to such non-employee director, and nonqualified(iii) such grant and subsequent issuance of stock options, purchased stock, bonus stock, phantom stock, stock appreciation rights, restricted stock, performance awards and other stock or performance-based awards. Grants may be made to our employees, directors and consultants.upon reliance of an exemption from the Securities Act.
Number of Shares Available for Issuance. The maximum number of shares of our common stock that may be issuedare authorized for issuance under our 2004 equity incentive compensation planPlan currently is currently 4,700,00040,500,000. Shares issued under the 2004 Plan may be treasury shares, authorized but unissued shares or, if applicable, shares acquired in the open market.
In the event the number of shares to be delivered upon the exercise or payment of any award granted under the 2004 Plan is reduced for any reason or in the event that any award (or portion thereof) can no longer be exercised or paid, the number of shares no longer subject to
adjustments upon specified corporate events.such award shall be released from such award and shall thereafter be available under the 2004 Plan for the grant of additional awards.
Upon the occurrence of a merger, consolidation, recapitalization, reclassification, stock split, stock dividend, combination of shares or the like, the administrator of the 2004 Plan may ratably adjust the aggregate number and affected class of securities available under the 2004 Plan.
Stock OptionsTypes of Awards.. The exercise price for options grantedcompensation committee may grant the following types of awards under our 2004 equityPlan: stock options; purchased stock; bonus stock; stock appreciation rights; phantom stock; restricted stock; performance awards; or other stock or performance-based awards. Stock options awarded under our 2004 Plan may be nonqualified stock options or incentive compensation plan may not be less than the fair market valuestock options under Section 422 of the underlying commonInternal Revenue Code of 1986, as amended, or the Code. With the exception of incentive stock on the option grant date. Options shall have such exercise and other terms as may be established by theoptions, our compensation committee but may notgrant, from time to time, any of the types of awards under our 2004 Plan to our employees, consultants
143
and non-employee directors. Incentive stock options may only be granted for terms greater than ten years. Optionsto our employees. Awards granted may be granted either alone or in addition to, in tandem with, or in substitution or exchange for, shares of common stock which will vest over time in accordance with schedules established by the compensation committeeany other award or any award granted under another of our boardplans, or any business entity to be acquired by us, or any other right of directors. Option holders havea participant to receive payment from us.
Stock Options. A stock option is the right to
exercise these options immediately, even if the vesting criteria have not been met. If an option for unvested shares of common stock is exercised, the option holder is restricted from selling the unvested restricted shares prior to their vesting and if the option holder’s service with us is terminated, we may repurchase any and all of their unvested shares at a price equal to the aggregate exercise price paid for such shares. The plan also provides that the compensation committee may, with the consent of the affected option holders, reprice outstanding options or cancel and regrant options on such terms as it deems appropriate. Stockholder approval is also required for any repricing.Purchased Stock. The plan provides that we may sellacquire shares of our common stock at a fixed price for a fixed period of time and generally are subject to a vesting requirement. A stock option will be in the form of a nonqualified stock option or an incentive stock options. The exercise price is set by our employees, directors and consultants on such terms as the compensation committee may establish. The price per share of common stock tobut cannot be purchased may be equal to or less than the fair market value of the common stock on the date of purchase.
Bonus Stock. We may grant shares of bonus stock under the plan to our employees, directors and consultants for the performance of services by such individuals without additional consideration except as may be required by the compensation committee.
Stock Appreciation Rights. The plan also provides that we may grant rights to receive, in either cash or shares of common stock, the excess100% of the fair market value of our common stock on the date of grant, or, in the case of incentive stock options granted to an employee who owns 10% or more of total combined voting power of our common stock, or a 10% owner, the exercise overprice cannot be less than 110% of the grant price as determined byfair market value of our common stock on the date grant. The term of a stock option may not exceed ten years or five years in the case of incentive stock options granted to a 10% owner. With stockholder approval, our compensation committee whichmay grant to the holder of outstanding nonqualified stock option a replacement options with lower (or higher with consent) exercise price shall notthan the exercise price of the replaced options.
Purchased Stock. Purchase stock awards entitle the participant to purchase our common stock at a price per share that may be less than, but not greater than, the fair market value per share at the time of purchase.
Bonus Stock. Bonus stock grants are made in consideration of performance or services by the participant with no additional consideration except as may be required by our compensation committee or the 2004 Plan.
Stock Appreciation Rights and Phantom Stock. Stock appreciation rights are awards that entitle the participant to receive a payment equal to the excess, if any, of the
common stockfair market value on the
exercise date of
grant. We refer to these rights as stock appreciation rights. The compensation committee shall determine at the date of grant the time or times at which and the circumstances under which a stock appreciation right may be exercised. The term of any stock appreciation right may not exceed ten years.Phantom Stock. Under the plan, we may grant rights to receive a specified number of shares of our common stock over a specified grant price. Phantom stock awards are rights to receive cash equal to the fair market value of a specified number of shares of our common stock or a combination thereof at the end of a specified deferral period. We refer to theseStock appreciation rights as phantom stock awards. Such awards may be subject togranted in tandem with options. All stock appreciation rights granted under our 2004 Plan must have a grant price per share that is not less than the achievementfair market value of performance goals and specified restrictions, including a risk of forfeiture, which restrictions may lapse at the expiration of the deferral period or at earlier specified times. The term of any phantom stock award may not exceed ten years.
Restricted Stock Awards. We may also grant awards in the form of restricted sharesshare of our common stock. Thesestock on date of the grant.
Restricted Stock. Restricted stock awards are
subject to such restrictions as the compensation committee may impose including forfeiture, transfer and repurchase restrictions. In no event may the term of any restricted stock award exceed ten years.Performance Awards. We may grant shares of our common stock cash or a combination thereofthat are subject to plan participants upon the attainment of certaincancellation, restrictions and vesting conditions, as determined by our compensation committee.
Performance Awards. Performance awards are awards granted based on business performance
goalscriteria measured over a period of not less than six months
norand not more than ten years.
After the end of each performance period, the compensation committee will determine the amount, if any, of performancePerformance awards
payable to each plan participant based upon the achievement of certain established business criteria.Other Stock or Performance-Based Awards. The plan also permits other stock or performance-based awards that are denominated ormay be payable in valued in whole or in part by reference to, or otherwise based on or related to our common stock (including units or securities convertible into shares of our common stock) or cash. The terms and conditions of any such awards will be determined by the compensation committee.
Employment Contracts and Change of Control Arrangements
We do not presently have any employment contracts in effect with any of our named executive officers.
Our equity compensation plans provide for the accelerated vesting of the shares of our common stock, subjectcash or any combination thereof as determined by our compensation committee.
Other Awards. Our compensation committee also may grant other forms of awards that generally are based on the value of our common stock, or cash, as determined by our compensation committee to outstandingbe consistent with the purposes of our 2004 Plan.
Section 162(m) Performance-Based Awards. The performance goals for performance awards under our 2004 Plan consist of one or more business criteria and a targeted level or levels of performance with respect to each of such criteria, as specified by our compensation committee. In the case of any award granted to our chief executive officer or one of our four most highly paid officers other than the chief executive officer, performance goals are designed to be objective and shall otherwise meet the requirements of Section 162(m) of the Code and regulations thereunder (including Treasury Regulationssection 1.162-27 and successor regulations thereto), including the requirement that the level or levels of performance targeted by our compensation committee are such that the achievement of performance goals is “substantially uncertain” at the time of grant. Our compensation committee may determine that such performance awards shall be grantedand/or settled upon achievement of any one performance goal or that two or more of the performance goals must be achieved as a condition to the grantand/or settlement of such performance awards. Performance goals may differ among performance awards granted to any one participant or for performance awards granted to different participants.
144
One or more of the following business criteria for us, on a consolidated basis,and/or for our specified subsidiaries, divisions or business or geographical units (except with respect to the total stockholder return and earnings per share criteria), may be used by our compensation committee in establishing performance goals for performance awards granted to a participant: (A) earnings per share; (B) increase in price per share; (C) increase in revenues; (D) increase in cash flow; (E) return on net assets; (F) return on assets; (G) return on investment; (H) return on equity; (I) economic value added; (J) gross margin; (K) net income; (L) pretax earnings; (M) pretax earnings before interest, depreciation and amortization; (N) pretax operating earnings after interest expense and before incentives, service fees, and extraordinary or special items; (O) operating income; (P) total stockholder return; (Q) debt reduction; (R) other company or industry specific measurements used in our management and internal or external reporting, including but not limited to, average revenue per user, cost per gross add, cash cost per user, adjusted earnings before interest, taxes, depreciation and amortization, capital expenditure per customer, etc., and (S) any of the above goals determined on the absolute or relative basis or as compared to the performance of a published or special index deemed applicable by the compensation committee including, but not limited to, the Standard & Poor’s 500 Stock Index or components thereof, or a group of comparable companies. For a discussion of our equity incentive compensation for 2006, see “— Long-term Equity Incentive Compensation.”
Exercise of Options. The exercise price is due upon the exercise of the option. The exercise price may be paid (1) in cash or by check, (2) with the consent of our compensation committee, in shares of our common stock held previously acquired by the optionee (that meet a holding period requirement) based on the shares fair market value as of the exercise date, or (3) with the consent and pursuant to the instructions of our compensation committee, by cashless exercise through a broker. Nonqualified stock options following specifiedmay be exercised at any time before the expiration of the option period at the discretion of our compensation committee. Incentive stock options must not be exercised more than three months after termination of employment for any reason other than death or disability and no more than one year after the termination of employment due to death or disability in order to meet the Code section 422 requirements.
Change of Control. For a discussion of the change of control events.provisions under our 2004 Plan, please see “— Employment Agreements, Severance Benefits and Change in Control Provisions.”
Amendment and Discontinuance; Term. Our board of directors may amend, suspend or terminate our 2004 Plan at any time, with or without prior notice to or consent of any person, except as would require the approval of our stockholders, be required by law or the requirements of the exchange on which our common stock is listed or would adversely affect a participant’s rights to outstanding awards without their consent. Unless terminated earlier, our 2004 Plan will expire on the tenth anniversary of its effective date.
Material Terms of Plan-Based Awards
Annual Cash Incentive Plan
We have established a written annual cash incentive plan for named executive officers which in 2006 was pursuant to the Bonus Opportunity Plan and for 2007 is pursuant to the 2004 Plan as a performance award. Full time employees who do not participate in a sales variable compensation plan and who are hired on or before October 31st of the applicable year are qualified to participate in the plan. Employees who are hired before October 31st will have their bonus amount prorated for time in the plan, calculated in whole month increments. Employees who enter the plan prior to the 15th of a month are credited with a whole month of service; those who enter after the 15th begin accruing service under the plan at the beginning of the next month.
This plan provides for the award of annual cash bonuses based upon targets and maximum bonus payouts set by the board of directors at the beginning of each fiscal year. The performance period for the annual cash incentive plan is the calendar year, and payouts under the plan are made in February following the plan year.
Target bonus levels under the annual cash incentive plan as a percentage of base salary are set based on each employee’s level. All officers (vice president and above) will have a target bonus opportunity set for their position ranging from 35% of base salary at the vice president level to 100% of base salary for the chief
145