
As filed with the Securities and Exchange Commission on September 27, 2004.August 29, 2005.
Registration No. 333-115434333-
SECURITIES AND EXCHANGE COMMISSION
Washington, D.C. 20549
AMENDMENT NO. 4
To
FORM S-1
REGISTRATION STATEMENT
UNDER
THE SECURITIES ACT OF 1933
HURON CONSULTING GROUP INC.
(Exact name of registrant as specified in its charter)
| Delaware | 8742 | 01-0666114 | ||
(State or other jurisdiction
| (Primary Standard Industrial Classification Code number) | (IRS Employer
|
550 West Van Buren Street
Chicago, Illinois 60607
(312) 583-8700
(Address, including zip code, and telephone number, including area code, of registrant’s principal executive offices)
Gary E. HoldrenNatalia Delgado
Chief Executive OfficerGeneral Counsel and PresidentCorporate Secretary
Huron Consulting Group Inc.
550 West Van Buren Street
Chicago, Illinois 60607
(312) 583-8700
(Name, address, including zip code, and telephone number, including area code, of agent for service)
Copies To:
| Charles W. Mulaney, Jr., Esq. | Herbert S. Wander, Esq. | |
Kimberly A. deBeers, Esq. | Adam R. Klein, Esq. | |
Skadden, Arps, Slate, Meagher & Flom LLP | Katten Muchin | |
333 West Wacker Drive | 525 West Monroe Street | |
Chicago, Illinois 60606 | Chicago, Illinois 60661 | |
(312) 407-0700 | (312) 902-5200 |
APPROXIMATE DATE OF COMMENCEMENT OF PROPOSED SALE TO THE PUBLIC: As soon as practicable after the effective date of this Registration Statement.
If any of the securities being registered on this form are to be offered on a delayed or continuous basis pursuant to Rule 415 under the Securities Act of 1933, check the following box. ¨
If this form is filed to register additional securities for an offering pursuant to Rule 462(b) under the Securities Act, check the following box and list the Securities Act registration statement number of the earlier effective registration statement number for the same offering. ¨
If this form is a post-effective amendment filed pursuant to Rule 462(c) under the Securities Act, check the following box and list the Securities Act registration statement number of the earlier effective registration statement for the same offering. ¨
If this form is a post-effective amendment filed pursuant to Rule 462(d) under the Securities Act, check the following box and list the Securities Act registration statement number of the earlier effective registration statement for the same offering. ¨
If delivery of the prospectus is expected to be made pursuant to Rule 434, check the following box. ¨
CALCULATION OF REGISTRATION FEE
| Title of Each Class of Securities to be Registered | Proposed Maximum Offering Price(1)(2) | Amount of Registration Fee | ||
Common stock, par value $.01 per share | $112,378,000 | $13,226.89 |
| (1) | Estimated solely for the purpose of computing the registration fee in accordance with Rule 457(c) of the Securities Act of 1933, as amended, based upon the average of the high and low reported sales prices of the common stock on the NASDAQ National Market on August 26, 2005. |
| (2) | Includes shares that may be sold, if any, pursuant to the underwriters’ overallotment option. |
The Registrant hereby amends this Registration Statement on such date or dates as may be necessary to delay its effective date until the Registrant shall file a further amendment which specifically states that this Registration Statement shall thereafter become effective in accordance with Section 8(a) of the Securities Act of 1933 or until the Registration Statement shall become effective on such date as the Securities and Exchange Commission, acting pursuant to said Section 8(a), may determine.
The information in this preliminary prospectus is not complete and may be changed. Neither we nor theThe selling stockholderstockholders may not sell these securities until the registration statement filed with the Securities and Exchange Commission is effective. This preliminary prospectus is not an offer to sell these securities and neither we nor the selling stockholderstockholders are not soliciting offers to buy these securities in any jurisdiction where the offer or sale is not permitted.
| PRELIMINARY PROSPECTUS | Subject to Completion |
5,000,0004,000,000 Shares
Common Stock
This isAll of the initial public offering of shares of our common stock of Huron Consulting Group Inc. Prior to thisin the offering there has been no public market for our common stock. We are offering 3,333,333 shares of common stock andbeing sold by the selling stockholderstockholders identified in this prospectus is offering 1,666,667 shares of common stock.prospectus. We will not receive any proceeds from the sale of any shares by the selling stockholder. The initial public offering price of our common stock is expected to be between $14.00 and $16.00 per share.in this offering.
We have applied for the quotation of ourOur common stock is quoted on the NASDAQ National Market under the symbol “HURN.” The last reported sale price of our common stock on August 26, 2005 was $24.59 per share.
Investing in our common stock involves a high degree of risk. Before buying any shares, you should carefully read the discussion of material risks of investing in our common stock in “Risk factors” beginning on page 1311 of this prospectus.
Neither the Securities and Exchange Commission nor any state securities commission has approved or disapproved of these securities or determined if this prospectus is truthful or complete. Any representation to the contrary is a criminal offense.
| Per Share | Total | |||||
| Public offering price | $ | $ | ||||
| Underwriting discounts and commissions | $ | $ | ||||
| Proceeds, before expenses, to the selling | $ | $ | ||||
The underwriters may also purchase up to an additional 750,000600,000 shares of common stock from HCG Holdings LLC, one of the selling stockholderstockholders, at the public offering price, less underwriting discounts and commissions, within 30 days from the date of this prospectus to cover over-allotments, if any. If the underwriters exercise this option in full, the total underwriting discounts and commissions will be $ and total proceeds, before expenses, to the selling stockholderstockholders will be $ .
The underwriters are offering the common stock as set forth under “Underwriting.” Delivery of the shares of common stock will be made on or about , 2004.2005.
Joint Book-Running Managers
| UBS Investment Bank | William Blair & Company | Deutsche Bank Securities |
William BlairRobert W. Baird & CompanyCo.
You should only rely on the information contained in this prospectus. Neither we, the selling stockholderstockholders nor the underwriters have authorized anyone to provide you with information different from that contained in this prospectus. We and theThe selling stockholderstockholders are offering to sell, and seeking offers to buy, shares of common stock only in jurisdictions where offers and sales are permitted. The information contained in this prospectus is current only as of the date of this prospectus.prospectus, regardless of the time of delivery of this prospectus or any sale of our common stock.
| 1 | ||
| 23 | ||
Management’s discussion and analysis of financial condition and results of operations | ||
| 78 | ||
Material U.S. federal tax considerations for non-U.S. holders of our common stock | ||
| 100 | ||
| F-1 |
Through and including , 2004 (the 25th day after commencement of this offering), federal securities law may require all dealers effecting transactions in our common stock, whether or not participating in this offering, to deliver a prospectus. This delivery requirement is in addition to the obligation of dealers to deliver a prospectus when acting as underwriters and with respect to their unsold allotments or subscriptions.
Huron Consulting Group Inc., Huron Consulting Group, our logo and certain other names of our services are our trademarks, trade names or service marks. Each trademark, trade name or service mark of any other company appearing in this prospectus belongs to its holder.
i
The following is a summary of some of the information contained in this prospectus. In addition to this summary, we urge you to read the entire prospectus carefully, especially the risks of investing in our common stock discussed under “Risk factors” and the consolidated financial statements and notes to those financial statements included elsewhere in this prospectus. In this prospectus, unless the context otherwise requires, the terms “Huron,” “company,” “we,” “us” and “our” refer to Huron Consulting Group Inc. and its subsidiaries.
OUR BUSINESS
We are an independent provider of financial and operational consulting services. Our highly experienced and credentialed professionals employ their expertise in accounting, finance, economics and operations to provide our clients with specialized analysis and customized advice and solutions that are tailored to address each client’s particular challenges and opportunities.
We provide our services through two segments: Financial Consulting and Operational Consulting. Our Financial Consulting segment helpsprovides services that help clients effectively address complex challenges that arise from litigation, disputes, investigations, regulation, financial distress and other sources of significant conflict or change. Our services in this segment include financial and economic analysis; forensic accounting; expert support and testimony services; restructuring, turnaround and bankruptcy advisory services; valuation analysis; and valuation analysis.interim management, organizational renewal and turnaround services and other crisis management services. Our Operational Consulting segment helpsprovides services that help clients improve the overall efficiency and effectiveness of their operations, reduce costs, manage regulatory compliance and maximize procurement efficiency. For the year ended December 31, 20032004 and the six months ended June 30, 2004,2005, we derived 68.9%57.9% and 62.3%56.0%, respectively, of our revenues from Financial Consulting and 31.1%42.1% and 37.7%44.0%, respectively, of our revenues from Operational Consulting.
We believe many organizations are facing increasingly large and complex business disputes and lawsuits, a growing number of regulatory and internal investigations and more intense public scrutiny. Concurrently, we believe increased competition and regulation are presenting significant operational and financial challenges for organizations. Distressed companies are responding to these challenges by restructuring and reorganizing their businesses and capital structures, while financially healthy organizations are striving to take advantage of business opportunities by improving operations, reducing costs and maximizing revenue. Many organizations have limited dedicated resources to respond effectively to these challenges and opportunities. Consequently, we believe these organizations will increasingly seek to augment their internal resources with experienced independent consultants like us.
We provide our services to a wide variety of both financially sound and distressed organizations, including Fortune 500 companies, medium-sized and large businesses, leading academic institutions, healthcare organizations and the law firms that represent these various organizations. Since commencing operations in May 2002, we have conducted over 1,0001,500 engagements for over 5001,000 clients, and we have worked on engagements with 3537 of the 40 largest U.S. law firms listed inThe American Lawyer 20042005 Am Law 100.
As of September 17, 2004,June 30, 2005, we had 604692 employees, including 486557 billable professionals, whom we refer to as consultants. In addition to our headquarters in Chicago, we have five other core offices located in Boston, Houston, New York City, San Francisco and Washington, D.C. and two smaller offices located in Charlotte and Los Angeles.
OUR HISTORY
Huron was formed in March 2002 and commenced operations in May 2002. We were founded by a core group of experienced financial and operational consultants that consisted primarily of former Arthur
1
Andersen LLP partners and professionals, including our chief executive officer,Chief Executive Officer, Gary E. Holdren, with
1
equity sponsorship from a group of investors led by Lake Capital Management LLC. For purposes of holding their investment in us, these investors formed our parent, HCG Holdings LLC, a Delaware limited liability company. HCG Holdings LLC, which is one of the selling stockholderstockholders in this offering, currently owns approximately 93%50.1% of our outstanding common stock. After giving effect to this offering (without giving effect to the underwriters’ over-allotment option) and the issuance of 769,700 shares of restricted common stock to our executive officers and certain of our employees on the date of this prospectus,, HCG Holdings LLC will own approximately 59%% of our outstanding common stock. As a result, HCG Holdings LLC will continue to have the power to controlsignificantly influence the outcome of all matters submitted to our stockholders for approval after the consummation of this offering. After giving effect to this offering (without giving effect to the underwriters’ over-allotment option), the issuance of 769,700 shares of restricted common stock to our executive officers and certain of our employees on the date of this prospectus and the grant to each of our four independent directors of options exercisable for 13,333 shares of common stock, assuming a public offering price of $15.00 per share, the mid-point of the range shown on the cover of this prospectus, our executive officers, board members and director nominees will collectively own approximately 6% of our outstanding common stock, assuming all outstanding options that will be vested at the time of consummation of this offering, including the options held by these persons, were exercised and that the exercise price was paid in cash. See “Prospectus summary—Background and certain transactions,HCG Holdings LLC,” “Certain relationships and related transactions” and “Principal and selling stockholders” for further information.
We created Huron because we believed that a financial and operational consulting business that is unaffiliated with a public accounting firm is better suited to serve its clients’ needs. As an independent consulting firm, Huron is not subject to the legal restrictions placed on public accounting firms that prohibit them from providing certain non-audit services to their audit clients. We also believedbelieve that many other consulting firms providedprovide only a limited scope of services and, therefore, a company such as ours with a wide array of services would be better positioned to serve the diverse and complex needs of various organizations.
In response to strong demand for our services, we began aggressively hiring consultants in the first quarter of 2003 and added over 200 new consultants during 2003. While this aggressive hiring negatively impacted our utilization rates (determined by dividing the number of hours all of our consultants worked on client assignments during a period by the total available working hours for all of our consultants during the same period, assuming a forty-hour work week, less paid holidays and vacation days) as we integrated our new hires, we believe the early results of this growth initiative are evident in our recent financial results. Revenues in 2002 totaled $35.1 million for our first eight months of operations and rose to $101.5 million in 2003, our first full year of operations. Revenues totaled $81.6 million in the six months ended June 30, 2004 compared to $46.9 million in the six months ended June 30, 2003, representing 74.0% year-over-year growth. We incurred a net loss of $4.2 million for the partial year ended December 31, 2002 and a net loss of $1.1 million for the year ended December 31, 2003 and generated net income of $7.2 million for the six months ended June 30, 2004 compared to $1.9 million for the six months ended June 30, 2003. At June 30,October 2004, we hadcompleted our initial public offering and our common stock began trading on the NASDAQ National Market.
In May 2005, we acquired Speltz & Weis LLC, a total stockholders’ deficitspecialized consulting firm consisting of $0.2 million.26 consultants, so that our Financial Consulting segment can provide interim management, organizational renewal and turnaround services and other crisis management services to distressed hospitals and other healthcare facilities.
OUR COMPETITIVE STRENGTHS
We believe our key competitive strengths include:
| Ø | Experienced and highly qualified consultants. Our consultants combine proficiency in accounting, finance, economics and operations with deep knowledge of specific industries. In addition, many of our consultants are highly credentialed and include certified public accountants, MBAs, accredited valuation specialists and forensic accountants. |
| Ø | Independent provider of financial and operational consulting services. We believe increased regulations, growing public scrutiny and concern regarding auditor conflicts of interests provide us with a competitive advantage over public accounting firms in securing consulting |
2
engagements. We also believe that the relatively small number of large public accounting firms |
| Ø | Complementary service offerings and integrated approach. We offer a broad array of financial and operational consulting services that can be delivered through teams of consultants from our different practices. Our integrated approach enables us to provide solutions tailored to specific client needs. In addition, our range of service offerings reduces our dependence on any one service offering or industry, provides a stimulating work environment for our consultants and enhances our flexibility in managing the utilization and career development of our directors, managers, associates and analysts. |
| Ø | Distinctive culture. We believe we have been successful in attracting and retaining top talent because of our distinctive culture, which combines the energy and flexibility of a high-growth company with the professionalism of a major professional services firm. We believe our performance-based compensation program, which both recognizes individual performance and reinforces teamwork, also contributes to our recruiting and retention success. |
2
OUR GROWTH STRATEGY
We have grown significantly since we commenced operations, more than doubling the number of our consultants from 213 on May 31, 2002 to 486557 on September 17, 2004.June 30, 2005. We believe there are a number of opportunities to continue to grow our business, including:
| Ø | Attracting additional highly qualified consultants. We believe our stimulating work environment, performance-based compensation program and distinctive culture will enable us to attract additional top talent from other consulting firms, accounting firms, targeted industries and on-campus recruiting. In the near term, our focus will primarily be on hiring and developing additional managers, associates and analysts to expand support for our existing practices and better leverage our managing directors and directors. We expect to have 600 consultants by the end of September 2005, including consultants of Speltz & Weis LLC. |
| Ø | Growing our existing relationships and developing new relationships. We work hard to maintain and grow our existing client and law firm relationships. The goodwill created from these relationships leads to referrals from satisfied clients and their law firms, which also enables us to secure engagements with new clients. We intend to focus on the following principal client areas: (1) lawyers and their law firms; (2) the general counsel of Fortune 1000 companies; (3) higher education and research institutions; (4) the healthcare sector (which includes providers, payors and pharmaceutical companies); (5) distressed companies and industries; and (6) the CFOs and COOs of companies with revenues of $1 billion to $20 billion. |
| Ø | Continuing to promote and deliver an integrated approach to service delivery. We will continue to utilize our experience with the financial and operational challenges facing our clients to identify and provide additional value-added services as part of an integrated solution. Frequently, a particular engagement is expanded or a new engagement secured with an existing client as a direct result of our quality work for that client. |
| Ø | Continuing to build our brand. We intend to continue to build our reputation and a common identity for the services we provide under the Huron brand name. We believe that using a common brand name and identity for our services enhances our visibility in the marketplace and improves our ability to compete for new business. |
| Ø | Expanding our service offerings. We believe there will be opportunities to expand our current capabilities or broaden the scope of our existing services, and we will evaluate these in response to client and general market demands. For example, given the challenges faced by general counsels regarding legal compliance and litigation management, we believe the general counsel market represents a large growth opportunity. |
| Ø | Pursuing strategic acquisitions. We intend to evaluate select acquisitions of complementary businesses as another means to broaden the scope or depth of our capabilities and expand our client base. |
RISKS RELATING TO OUR BUSINESS AND GROWTH STRATEGY
While we believe focusing on the key areas set forth above will provide us with opportunities to reach our goals, there are a number of risks and uncertainties that may limit our ability to achieve our goals, including that:
| Ø | our success depends largely on our ability to attract, develop, motivate and retain highly skilled individuals in an industry where there is great competition for talent; |
| Ø | growing our business places demands on our management and internal systems, processes and controls, and the increased costs associated with successfully managing these demands may adversely affect our profitability; |
3
| Ø | our profitability depends to a large extent on the utilization and billing rates for our consultants, which are affected by a number of factors, many of which are beyond our control; |
| Ø | our ability to maintain and attract new business depends upon our reputation, the professional reputation of our consultants and the quality of our services, and any factor that diminishes our reputation or that of our consultants or calls into question the quality of our services could make it substantially more difficult for us to attract new engagements and clients; |
| Ø | our ability to build our brand could be negatively impacted if another company were to successfully challenge our right to use the Huron name, or if we were unable to prevent a competitor from using a name that is similar to our name; and |
| Ø | our industry includes a large number of participants and is intensely competitive, and, if we are unable to compete successfully, our financial results will be adversely affected. |
For more information about these and other risks related to our business and an investment in our common stock, see “Risk factors” beginning on page 13.11. You should consider carefully all of these risks before making an investment in our common stock.
BACKGROUND AND CERTAIN TRANSACTIONSHCG HOLDINGS LLC
HCG Holdings LLC
HCG Holdings LLC, our parent andone of the selling stockholder,stockholders in this offering, currently owns approximately 50.1% of our outstanding common stock. After giving effect to this offering (without giving effect to the underwriters’ over-allotment option), HCG Holdings LLC will own approximately % of our outstanding common stock. HCG Holdings LLC is controlled by Lake Capital Partners LP and Lake Capital Management LLC. The remaining equity interests in HCG Holdings LLC are held by certain other institutional investors, some of our executive officers and 24 of our other managing directors, eachthree of our board members a director nominee and 31 other holders. Our executive officers and board members and the director nominee holding interests in HCG Holdings LLC are Gary Holdren, our Chief Executive Officer and a board member,include George Massaro, our Chief Operating OfficerVice Chairman and a board member, Gary Burge, our Chief Financial Officer, Daniel Broadhurst, our Vice President of Operations, James Rojas, our Vice President of Corporate Development, and John McCartney, a director nominee.board member. These individuals collectively hold 2.1%0.5% of the common interests and 2.3% of the preferred interests in HCG Holdings LLC. Paul Yovovich, whom we expectPrior to add to our board after the consummation of this offering, HCG Holdings LLC will redeem the 1.7% common membership interest formerly held by Gary Holdren, our Chief Executive Officer and a board member, in exchange for shares of our common stock owned by HCG Holdings LLC and certain cash consideration. These shares of common stock will not be sold in this offering. In addition, Paul Yovovich, a board member, is president and a member of Lake Capital Management LLC and controls Lake Capital Partners LP. Mr. Yovovich also directly holds 2.9%3.0% of the common interests and 1.0% of the preferred interests in HCG Holdings LLC.
In recognition of the substantial reduction in HCG Holdings LLC currently owns approximately 93% of our outstanding common stock and all of our outstanding 8% preferred stock and 8% promissory notes. Some of our executive officers, each ofLLC’s ownership percentage following this offering, Mr. Yovovich has advised us that he intends to resign from our board members and some of our current and former employees own the remaining approximately 7% of our outstanding common stock.
Equity compensation awards
On the date ofin connection with this prospectus, we intend to grant equity-based compensation awards to our executive officers and certain of our employees and each of our independent directors.offering.
4
All of the awards described above will be made under our 2004 Omnibus Stock Plan after we file a registration statement on Form S-8 relating to that plan. This Form S-8, which will also relate to our three other equity incentive plans, is expected to be filed on the date of this prospectus after the effectiveness of the registration statement of which this prospectus forms a part. The Form S-8 will become effective upon filing.
Redemption of 8% preferred stock and repayment of 8% promissory notes
As described in the section of this prospectus entitled “Use of proceeds,” we will use approximately $15.1 million of our net proceeds from this offering to redeem our outstanding 8% preferred stock and approximately $10.7 million to repay in full our outstanding 8% promissory notes. All of our 8% preferred stock and 8% promissory notes are owned by HCG Holdings LLC. We expect that HCG Holdings LLC will distribute substantially all of the proceeds it receives from the sale of the shares being offered by it in this offering, the redemption of the outstanding 8% preferred stock and the repayment by us of the 8% promissory notes to its members in accordance with its governing documents. Assuming that this offering is consummated at a public offering price of $15.00 per share, the mid-point of the range shown on the cover of this prospectus, and HCG Holdings LLC distributes the entire amount of its proceeds from the foregoing transactions, we estimate that Messrs. Holdren, Massaro, Burge, Broadhurst and McCartney will receive a payment of approximately $875,000, $87,500, $43,800, $43,800 and $43,800, respectively.
See “Use of proceeds,” “Certain relationships and related transactions,” “Principal and selling stockholders” and “Description of capital stock” for further information regarding the matters discussed above.
5
Post-offering corporate structure and ownershipPOST-OFFERING CORPORATE STRUCTURE AND OWNERSHIP
The following organizational chart sets forth the corporate structure and percentage ownership of preferred interests (“PI”) and common interests (“CI”) in HCG Holdings LLC and of our common stock after giving effect to this offering (without giving effect to the exercise of the underwriters’ over-allotment option).option. Our post-offering ownership structure gives effect to the issuance by us of the 769,700 shares of restricted common stock to be granted to our executive officers and certain of our employees on the date of this prospectus, but does not give effect to 1,670,0411,381,206 shares of common stock issuable upon the exercise of outstanding options at September 17, 2004, 75,800August 15, 2005 (including shares of common stock issuablethat will be issued upon the exercise of options to be granted to one of our executive officers andby certain of our employees on the date ofselling stockholders in connection with this prospectus or 53,332 shares of common stock issuable upon the exercise of options to be granted to our independent directors on the date of this prospectus.offering).
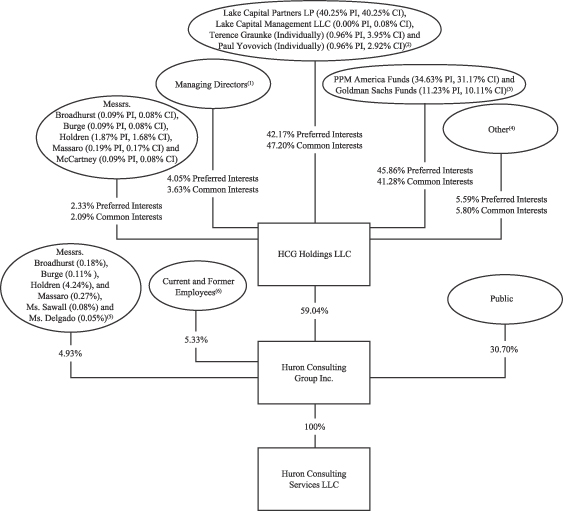

| (1) | The |
| (2) | Lake Capital Partners LP and Lake Capital Management LLC own 40.9% and 0.1%, respectively, of the common interests in HCG Holdings LLC and collectively have investment and voting control over the shares of our common stock held by HCG Holdings LLC. Lake Capital Investment Partners LP is the sole general partner of Lake |
(Footnotes continued on following page.)
65
| Capital Partners LP and Lake Partners LLC is the sole general partner of Lake Capital Investment Partners LP. Terence M. Graunke and Paul G. Yovovich are the members and managers of Lake Partners LLC as well as members of an investment committee of Lake Capital Investment Partners LP and, in such roles, these individuals have investment and voting control over, and may be deemed to be the beneficial owners of, the shares ultimately controlled by Lake Capital Investment Partners |
| LP. Mr. Graunke is also the controlling member of Lake Capital Management LLC and, pursuant to the Lake Capital Management LLC operating agreement, has investment and voting control over, and may be deemed to be the beneficial owner of, the shares controlled by that entity. Each of Mr. Graunke and Mr. Yovovich disclaims beneficial ownership of the shares of common stock owned by HCG Holdings LLC. Each of Mr. Graunke and Mr. Yovovich individually own |
| (3) | The PPM America Funds consist of PPM America Private Equity Fund, L.P. and a related fund, Old Hickory Fund I, LLC, which own |
| (4) | This group consists of 31 other investors holding the interests. None of the holders in this group own more than 1.0% of the |
| (5) | Mr. Holdren has been attributed for purposes of this chart ownership of |
CORPORATE INFORMATION
We were incorporated in Delaware in March 2002 and commenced operations in May 2002 and2002. We conduct all of our consulting activities through aour wholly-owned subsidiary,subsidiaries, Huron Consulting Services LLC and Speltz & Weis LLC. Our headquarters are located at 550 West Van Buren Street, Chicago, Illinois 60607 and our telephone number is (312) 583-8700. Our web site is www.huronconsultinggroup.com. Information contained on our web site is not incorporated by reference into this prospectus. You should not consider information contained on our web site as part of this prospectus.
76
The offering
| ||
Common stock offered by the selling | 4,000,000 shares | |
Common stock to be outstanding immediately after this offering | shares | |
Over-allotment option | 600,000 shares | |
| HURN | |
Use of proceeds | We will not receive any proceeds from the sale of shares by the selling |
Unless otherwise indicated, all information in this prospectus assumes the underwriters do not exercise their over-allotment option, which entitles them to purchase up to 600,000 additional shares of our common stock from HCG Holdings LLC, one of the selling stockholders.
The number of shares of our common stock outstanding immediately after this offering is based on the number of shares outstanding at September 17, 2004.August 15, 2005 and includes shares of common stock offered hereby and to be issued upon the exercise of stock options held by some of the selling stockholders. This number includes the 769,700 shares of restricted common stock that we intend to grant to our executive officers and certain of our employees on the date of this prospectus, but does not include:
| Ø |
| Ø |
8
Unless otherwise indicated, all information inWe have agreed to pay the expenses associated with this prospectus assumes:offering, other than the underwriting discounts and commissions.
97
Summary historical consolidated and pro forma financial and other operating data
We have derived the following summary historical consolidated financial data for the period from March 19, 2002 (inception) to December 31, 2002 and for the yearyears ended December 31, 2003 and 2004 from our audited consolidated financial statements except for the pro forma data.included elsewhere in this prospectus. We have derived the following summary historical consolidated financial data for the six months ended June 30, 20032004 and 20042005 and as of June 30, 20042005 from our unaudited interim consolidated financial statements except for the pro forma data.included elsewhere in this prospectus. In the opinion of management, this information containsthe unaudited interim consolidated financial statements reflect all adjustments consisting only of a normal recurring accruals,nature necessary for athe fair presentation of our results of operations and financial position for such periods.
The historical consolidated statements of operations and other operating data for the six months ended June 30, 2005 includes the results of operations and other operating data of Speltz & Weis LLC since May 9, 2005, the date of its acquisition. In order to present data that is useful for comparative purposes, we have provided pro forma statements of operations data for the year ended December 31, 2004 and the six months ended June 30, 2005, which gives pro forma effect to our May 2005 acquisition of Speltz & Weis LLC as if the acquisition was consummated at the beginning of the periods presented. The pro forma statements of operations data is not necessarily indicative of what actually would have occurred if the acquisition had been effective for the periods presented and should not be taken as representative of our future consolidated results of operations.
The summary informationhistorical consolidated and pro forma financial and other operating data set forth below is not necessarily indicative of the results of future operations and should be read in conjunction with “Selected consolidated financial and other operating data,” “Management’s discussion and analysis of financial condition and results of operations” and theoperations,” our consolidated financial statements and related notes, Speltz & Weis LLC’s financial statements and related notes and the unaudited pro forma financial statements and related notes, in each case, included elsewhere in this prospectus.
The pro forma as adjusted balance sheet data gives effect to the following transactions as if each had occurred on June 30, 2004:
For further information regarding the redemption of our 8% preferred stock and the repayment of our 8% promissory notes, see the section of this prospectus entitled “Use of proceeds.”
108
| March 19, 2002 (inception) to December 31, 2002 | Year ended December 31, 2003 | Six months June 30, | |||||||||||||
| Consolidated statements of operations data: | 2003 | 2004 | |||||||||||||
| (unaudited) | |||||||||||||||
| (in thousands, except per share and other operating data) | |||||||||||||||
Revenues and reimbursable expenses: | |||||||||||||||
Revenues | $ | 35,101 | $ | 101,486 | $ | 46,923 | $ | 81,604 | |||||||
Reimbursable expenses | 2,921 | 8,808 | 3,906 | 7,090 | |||||||||||
Total revenues and reimbursable expenses | 38,022 | 110,294 | 50,829 | 88,694 | |||||||||||
Direct costs and reimbursable expenses: | |||||||||||||||
Direct costs | 26,055 | 69,401 | 29,320 | 47,591 | |||||||||||
Reimbursable expenses | 2,921 | 8,929 | 3,917 | 7,065 | |||||||||||
Total direct costs and reimbursable expenses | 28,976 | 78,330 | 33,237 | 54,656 | |||||||||||
Gross profit | 9,046 | 31,964 | 17,592 | 34,038 | |||||||||||
Operating expenses: | |||||||||||||||
Selling, general and administrative expenses Depreciation and amortization expense | | 8,813 3,048 | | | 25,185 5,328 | | | 11,093 2,658 | | 17,840 1,075 | | ||||
Other operating expenses(1) | 3,715 | 1,668 | — | 2,139 | |||||||||||
Total operating expenses | 15,576 | 32,181 | 13,751 | 21,054 | |||||||||||
Operating (loss) income | (6,530 | ) | (217 | ) | 3,841 | 12,984 | |||||||||
Other expense: | |||||||||||||||
Interest expense | 332 | 856 | 418 | 516 | |||||||||||
Other | 1 | 112 | 112 | (1 | ) | ||||||||||
Total other expense | 333 | 968 | 530 | 515 | |||||||||||
(Loss) income before (benefit) provision for income taxes | (6,863 | ) | (1,185 | ) | 3,311 | 12,469 | |||||||||
(Benefit) provision for income taxes | (2,697 | ) | (122 | ) | 1,451 | 5,237 | |||||||||
Net (loss) income | (4,166 | ) | (1,063 | ) | 1,860 | 7,232 | |||||||||
Accrued dividends on 8% preferred stock | 646 | 1,066 | 516 | 558 | |||||||||||
Net (loss) income attributable to common stockholders | $ | (4,812 | ) | $ | (2,129 | ) | $ | 1,344 | $ | 6,674 | |||||
Net (loss) income attributable to common stockholders per share: | |||||||||||||||
Basic | $ | (0.41 | ) | $ | (0.18 | ) | $ | 0.05 | $ | 0.50 | |||||
Diluted | $ | (0.41 | ) | $ | (0.18 | ) | $ | 0.05 | $ | 0.47 | |||||
Weighted average shares used in calculating net (loss) income attributable to common stockholders per share: | |||||||||||||||
Basic | 11,803 | 11,871 | 11,806 | 12,011 | |||||||||||
Diluted | 11,803 | 11,871 | 12,357 | 13,005 | |||||||||||
Cash dividend per common share(2) | — | — | — | $ | 0.09 | ||||||||||
Unaudited pro forma net (loss) income attributable to common stockholders(3) | $ | (580 | ) | $ | 7,477 | ||||||||||
Unaudited pro forma net (loss) income attributable to common stockholders per share(3): | |||||||||||||||
Basic | $ | (0.04 | ) | $ | 0.50 | ||||||||||
Diluted | $ | (0.04 | ) | $ | 0.47 | ||||||||||
Unaudited pro forma weighted average shares outstanding used in calculating unaudited pro forma net (loss) income attributable to common stockholders per share(4): | |||||||||||||||
Basic | 14,787 | 14,981 | |||||||||||||
Diluted | 14,787 | 15,975 | |||||||||||||
| Other operating data (unaudited): | ||||||||||||||||
Number of consultants (at end of period)(5) | 262 | 477 | 355 | 499 | ||||||||||||
Utilization rate(6) | 57.3 | % | 66.1 | % | 72.4 | % | 72.6 | % | ||||||||
Average billing rate per hour(7) | $ | 206 | $ | 217 | $ | 224 | $ | 238 | ||||||||
Mar. 19, 2002 | Year Ended December 31, | Six Months Ended June 30, | ||||||||||||||||||||||||
| Pro Forma | Pro Forma | |||||||||||||||||||||||||
Consolidated statements of operations data: | 2003 | 2004 | 2004 | 2004 | 2005 | 2005 | ||||||||||||||||||||
| (unaudited) | (unaudited) | |||||||||||||||||||||||||
| (in thousands, except per share and other operating data) | ||||||||||||||||||||||||||
Revenues | $ | 35,101 | $ | 101,486 | $ | 159,550 | $ | 178,577 | $ | 81,604 | $ | 97,277 | $ | 105,559 | ||||||||||||
Reimbursable expenses | 2,921 | 8,808 | 14,361 | 16,024 | 7,090 | 9,061 | 9,846 | |||||||||||||||||||
Total revenues and reimbursable expenses | 38,022 | 110,294 | 173,911 | 194,601 | 88,694 | 106,338 | 115,405 | |||||||||||||||||||
Direct costs and reimbursable expenses (exclusive of depreciation and amortization shown in operating expenses)(1): | ||||||||||||||||||||||||||
Direct costs | 26,055 | 69,374 | 92,270 | 105,311 | 47,405 | 52,459 | 58,649 | |||||||||||||||||||
Stock-based compensation | — | 27 | 978 | 978 | 186 | 2,239 | 2,239 | |||||||||||||||||||
Intangible assets amortization | — | — | — | 1,900 | — | 385 | 1,342 | |||||||||||||||||||
Reimbursable expenses | 2,921 | 8,929 | 14,281 | 15,944 | 7,065 | 9,091 | 9,873 | |||||||||||||||||||
Total direct costs and reimbursable expenses | 28,976 | 78,330 | 107,529 | 124,133 | 54,656 | 64,174 | 72,103 | |||||||||||||||||||
Operating expenses: | ||||||||||||||||||||||||||
Selling, general and administrative | 8,813 | 25,171 | 40,425 | 40,736 | 17,780 | 22,962 | 23,033 | |||||||||||||||||||
Stock-based compensation | — | 14 | 433 | 433 | 60 | 867 | 867 | |||||||||||||||||||
Depreciation and amortization | 3,048 | 5,328 | 2,365 | 2,790 | 1,075 | 1,956 | 2,154 | |||||||||||||||||||
Restructuring charges | — | — | 3,475 | 3,475 | 2,139 | — | — | |||||||||||||||||||
Management and advisory fees paid to related parties | 2,750 | — | — | — | — | — | — | |||||||||||||||||||
Loss on lease abandonment | — | 1,668 | — | — | — | — | — | |||||||||||||||||||
Organization costs | 965 | — | — | — | — | — | — | |||||||||||||||||||
Total operating expenses | 15,576 | 32,181 | 46,698 | 47,434 | 21,054 | 25,785 | 26,054 | |||||||||||||||||||
Operating income (loss) | (6,530 | ) | (217 | ) | 19,684 | 23,034 | 12,984 | 16,379 | 17,248 | |||||||||||||||||
Other (income) expense: | ||||||||||||||||||||||||||
Interest (income) expense, net | 332 | 856 | 692 | 796 | 516 | (229 | ) | (192 | ) | |||||||||||||||||
Other (income) expense | 1 | 112 | — | — | (1 | ) | (1 | ) | (1 | ) | ||||||||||||||||
Total other (income) expense | 333 | 968 | 692 | 796 | 515 | (230 | ) | (193 | ) | |||||||||||||||||
Income (loss) before provision (benefit) for income taxes | (6,863 | ) | (1,185 | ) | 18,992 | 22,238 | 12,469 | 16,609 | 17,441 | |||||||||||||||||
Provision (benefit) for income taxes | (2,697 | ) | (122 | ) | 8,128 | 9,810 | 5,237 | 7,125 | 7,586 | |||||||||||||||||
Net income (loss) | (4,166 | ) | (1,063 | ) | 10,864 | 12,428 | 7,232 | 9,484 | 9,855 | |||||||||||||||||
Accrued dividends on 8% preferred stock | 646 | 1,066 | 931 | 931 | 558 | — | — | |||||||||||||||||||
Net income (loss) attributable to common stockholders | $ | (4,812 | ) | $ | (2,129 | ) | $ | 9,933 | $ | 11,497 | $ | 6,674 | $ | 9,484 | $ | 9,855 | ||||||||||
Net income (loss) attributable to common stockholders per share(2): | ||||||||||||||||||||||||||
Basic | $ | (0.41 | ) | $ | (0.18 | ) | $ | 0.77 | $ | 0.90 | $ | 0.50 | $ | 0.61 | $ | 0.63 | ||||||||||
Diluted | $ | (0.41 | ) | $ | (0.18 | ) | $ | 0.72 | $ | 0.84 | $ | 0.47 | $ | 0.57 | $ | 0.59 | ||||||||||
Weighted average shares used in calculating net income (loss) attributable to common stockholders per share(2): | ||||||||||||||||||||||||||
Basic | 11,803 | 11,871 | 12,820 | 12,820 | 12,011 | 15,597 | 15,597 | |||||||||||||||||||
Diluted | 11,803 | 11,871 | 13,765 | 13,765 | 13,005 | 16,725 | 16,725 | |||||||||||||||||||
Cash dividend per common share(3) | $ | — | $ | — | $ | 0.09 | $ | 0.09 | $ | — | $ | — | $ | — | ||||||||||||
(See footnotes on the following page.)
119
As of June 30, 2004 | |||||||
| Consolidated balance sheet data: | Actual | Pro forma as adjusted | |||||
| (unaudited) | |||||||
| (in thousands) | |||||||
Cash and cash equivalents | $ | 943 | $ | 18,461 | |||
Working capital | 16,838 | 34,759 | |||||
Total assets | 48,932 | 66,450 | |||||
Long-term debt (consisting of 8% promissory notes) | 10,076 | — | |||||
Total 8% preferred stock | 14,770 | — | |||||
Total stockholders’ (deficit) equity | (170 | ) | 42,597 | ||||
Mar. 19, 2002 2002 | Year Ended December 31, | Six Months Ended June 30, | ||||||||||||||||||
| Other operating data (unaudited): | 2003 | 2004 | 2004 | 2005 | ||||||||||||||||
Number of consultants (at end of period)(4) | 262 | 477 | 483 | 488 | 557 | |||||||||||||||
Average number of consultants (for the period) | 247 | 361 | 485 | 480 | 513 | |||||||||||||||
Utilization rate(5) | 57.3 | % | 66.1 | % | 72.2 | % | 72.6 | % | 76.3 | % | ||||||||||
Average billing rate per hour(6)(7) | $ | 206 | $ | 217 | $ | 239 | $ | 238 | $ | 252 | ||||||||||
| Consolidated balance sheet data: | As of June 30, 2005 | ||
(unaudited) (in thousands) | |||
Cash and cash equivalents | $ | 15,099 | |
Working capital | 38,963 | ||
Total assets | 100,156 | ||
Long-term debt(8) | 2,000 | ||
Total stockholders’ equity | 63,296 | ||
| (1) |
| (2) | Adjusted for |
| On May 12, 2004, we declared a special dividend on each outstanding share of our common stock and 8% preferred stock payable to holders of record on May 25, 2004. We paid the special dividend on June 29, 2004. The 8% preferred stock participated on an as converted basis. The aggregate amount of the dividend was $1.25 million, or $0.09 per share of common stock and |
| (4) |
| (5) |
| We calculate the utilization rate for our consultants by dividing the number of hours all of our consultants worked on client assignments during a period by the total available working hours for all of our consultants during the same period, assuming a forty-hour work week, less paid holidays and vacation days. |
| Average billing rate per hour is calculated by dividing revenues for a period by the number of hours worked on client assignments during the same period. |
| (7) | Included in the six months ended June 30, 2004 was a $1.6 million success fee related to the completion of a series of asset sales transactions managed on behalf of a single Financial Consulting segment client over a two-year period. Excluding this success fee, our average billing rate per hour for the six months ended June 30, 2004 and the year ended December 31, 2004 would have been $234 and $236, respectively. |
| (8) | Consists of notes payable, net of current portion, issued in connection with the acquisition of Speltz & Weis LLC. |
1210
Investing in our common stock involves a high degree of risk. You should carefully consider the risks below before making an investment decision. Our business, financial condition or results of operations could be materially adversely affected by any of these risks. In such an event, the trading price of our common stock could decline, and you may lose all or part of your investment.
RISKS RELATED TO OUR BUSINESS
Our inability to retain our senior management team and other managing directors would be detrimental to the success of our business.
We rely heavily on our senior management team, including Gary Holdren, our Chief Executive Officer, and George Massaro, our Vice Chairman, Daniel Broadhurst, our Vice President of Operations, Gary Burge, our Chief OperatingFinancial Officer and Treasurer, James Rojas, our Vice President of Corporate Development, and other managing directors, and our ability to retain them is particularly important to our future success. On or about January 1, 2006, Mr. Massaro intends to reduce his workload to a part time, or approximately one-third, basis and to dedicate his efforts to strategic initiatives for us, including major client assignments. Given the highly specialized nature of our services, these people must have a thorough understanding of our service offerings as well as the skills and experience necessary to manage an organization consisting of a diverse group of professionals. In addition, we rely on our senior management team and other managing directors to generate and market our business. Further, in light of our limited operating history, our senior management’s and other managing directors’ personal reputations and relationships with our clients are a critical element in obtaining and maintaining client engagements. Although we enter into non-solicitation agreements with our senior management team and other managing directors, we do not enter into non-competition agreements. Accordingly, members of our senior management team and our other managing directors are not contractually prohibited from leaving or joining one of our competitors, and some of our clients could choose to use the services of that competitor instead of our services. In addition, our executive officers holding interests in HCG Holdings LLC consist of Messrs. Massaro, Broadhurst, Burge and Rojas. These individuals collectively hold 0.4% of the common interests in HCG Holdings LLC. If any of the above-described individuals realize substantial financial benefits as a result of their securities ownership in HCG Holdings LLC, their financial incentive to stay with us may be reduced. If one or more members of our senior management team or our other managing directors leave and we cannot replace them with a suitable candidate quickly, we could experience difficulty in securing and successfully completing engagements and managing our business properly, which could harm our business prospects and results of operations.
Our senior management team and our other managing directors will receive substantial financial benefits as a result of this offering, which may reduce the financial incentive for them to stay with us.
Our senior management team and our other managing directors collectively hold options to purchase 1,502,630 shares of our common stock. Of these, options to purchase 145,608 shares are currently vested, options to purchase 420,659 shares will vest upon consummation of this offering pursuant to their terms and the remaining options to purchase 936,363 will fully vest at various times over the next four years. These options have exercise prices ranging from $0.02 to $1.96 per share. An individual may be more likely to leave us after their options fully vest, especially if the shares underlying the options have significantly appreciated in value relative to the option exercise price. In addition, a trust for the benefit of the family of Mr. Holdren, our Chief Executive Officer, holds 521,740 shares of restricted common stock that he purchased for $0.02 per share, of which 163,043 shares are currently vested and the remaining 358,697 will fully vest immediately prior to the consummation of this offering. On the date of this prospectus, we intend to grant 769,700 shares of restricted common stock to our executive officers and certain of our employees. The restricted shares will vest over a four year period, with 25% vesting on each anniversary of the grant date during that period. Our executive officers who will be granted shares of restricted common stock are Messrs. Holdren, Massaro, Burge and Broadhurst, Ms. Delgado and Ms. Sawall, who will be granted 158,700, 32,600, 10,900, 10,900, 8,700 and 6,500 shares of restricted common stock, respectively. In addition, we intend to grant options to purchase 75,800 shares of our common stock to certain of our employees on the date of this prospectus, including one of
1311
Risk factors
our executive officers, Ms. Delgado, who will receive options to purchase 13,100 shares of our common stock. These options will have a per share exercise price equal to the public offering price and will vest over a four-year period, with 25% vesting on each anniversary of the grant date during that period. We also intend to grant to each of our independent directors options exercisable for 13,333 shares of our common stock, assuming a public offering price of $15.00 per share, the mid-point of the range shown on the cover of this prospectus. These options will have a per share exercise price equal to the public offering price and will vest over a three-year period, with one-third vesting on the grant date and one-third vesting on the date of each of the next two annual meetings.
In addition, some of our executive officers and other managing directors, each of our board members and a director nominee are members of HCG Holdings LLC, which is our parent and the selling stockholder, and collectively hold 5.7% of the common interests and 6.4% of the preferred interests in HCG Holdings LLC. Our executive officers, board members and the director nominee holding interests in HCG Holdings LLC are Messrs. Holdren, Massaro, Burge, Broadhurst and McCartney. These individuals collectively hold 2.1% of the common interests and 2.3% of the preferred interests in HCG Holdings LLC. If any of the above-described individuals realize substantial financial benefits as a result of their securities ownership in us or HCG Holdings LLC, their financial incentive to stay with us may be reduced. These individuals already realized a financial benefit when HCG Holdings LLC used the proceeds it received from the special dividend that we paid on June 29, 2004 together with other funds of HCG Holdings LLC to redeem a portion of its outstanding preferred interests on a pro rata basis, including a portion of the preferred interests held by these people. In connection with this redemption, Messrs. Broadhurst, Burge, Holdren, Massaro and McCartney received an aggregate amount of approximately $4,540, $4,540, $90,788, $9,079 and $4,540, respectively, of which approximately $1,097, $1,097, $21,933, $2,193 and $1,097, respectively, was paid out of the proceeds of the dividend. These individuals will also realize a financial benefit if HCG Holdings LLC makes a distribution to its members of the proceeds it receives from (1) the sale of the shares being offered by it in this offering, (2) the redemption of the 8% preferred stock and (3) the repayment of the 8% promissory notes held by HCG Holdings LLC. Assuming that this offering is consummated at a public offering price of $15.00 per share, the mid-point of the range shown on the cover of this prospectus, and HCG Holdings LLC distributes the entire amount of its proceeds from the foregoing transactions, we estimate that Messrs. Broadhurst, Burge, Holdren, Massaro and McCartney will receive a payment of approximately $43,800, $43,800, $875,000, $87,500 and $43,800, respectively.
Our inability to hire and retain talented people in an industry where there is great competition for talent could have a serious negative effect on our prospects and results of operations.
Our business involves the delivery of professional services and is highly labor-intensive. Our success depends largely on our general ability to attract, develop, motivate and retain highly skilled consultants. The loss of a significant number of our consultants or the inability to attract, hire, develop, train and retain additional skilled personnel could have a serious negative effect on us, including our ability to manage, staff and successfully complete our existing engagements and obtain new engagements. Qualified consultants are in great demand, and we face significant competition for both senior and junior consultants with the requisite credentials and experience. Our principal competition for talent comes from other consulting firms, accounting firms and technical and economic advisory firms, as well as from organizations seeking to staff their internal professional positions. Many of these competitors may be able to offer significantly greater compensation and benefits or more attractive lifestyle choices, career paths or geographic locations than we do. Therefore, we may not be successful in attracting and retaining the skilled consultants we require to conduct and expand our operations successfully. Increasing competition for these consultants may also significantly increase our labor costs, which could negatively affect our margins and results of operations.
14
Risk factors
We have experienced net losses for mosta significant portion of our history, and our limited operating history makes evaluating our business difficult.
We have been operating since May 2002. For the period from March 19, 2002 (inception) through December 31, 2002 and for the year ended December 31, 2003, we experienced net losses of $4.2 million and $1.1 million, respectively. Although we generated net income of $7.2$10.9 and $9.5 million for the year ended December 31, 2004 and the six months ended June 30, 2004,2005, respectively, we may not sustain profitability in the future. For example, we generated net income of $1.9 million for the six months ended June 30, 2003, but experienced a net loss for the year ended December 31, 2003. Our net losses, among other things, have had, and should net losses occur in the future, will have, an adverse effect on our stockholders’ equity and working capital. As of June 30, 2004, we had a total stockholders’ deficit of $0.2 million. To sustain profitability, we must:
| Ø | attract, integrate, retain and motivate highly qualified consultants; |
| Ø | achieve and maintain adequate utilization and suitable billing rates for our consultants; |
| Ø | expand our existing relationships with our clients and identify new clients in need of our services; |
| Ø | maintain and enhance our brand recognition; and |
| Ø | adapt to meet changes in our markets and competitive developments. |
We may not be successful in accomplishing these objectives. Further, our limited operating history makes it difficult to evaluate our business and prospects. Our prospects must be considered in light of the risks, uncertainties, expenses and difficulties frequently encountered by companies in their early stages of development, particularly companies in highly competitive industries. The historical information in this prospectus may not be indicative of our future financial condition and future performance. For example, we expect that our future annual growth rate in revenues will moderate and likely be less than the growth rates experienced in 2003 and the first six months of 2004.
12
Risk factors
If we are unable to manage the growth of our business successfully, we may not be able to sustain profitability.
We have grown significantly since we commenced operations, more than doubling the number of our consultants from 213 on May 31, 2002 to 486557 as of September 17, 2004.June 30, 2005. As we continue to increase the number of our consultants, we may not be able to successfully manage a significantly larger workforce. Additionally, our significant growth has placed demands on our management and our internal systems, procedures and controls and will continue to do so in the future. To successfully manage growth, we must add administrative staff and periodically update and strengthen our operating, financial, accounting and other systems, procedures and controls, which will increase our costs and may adversely affect our gross profits and our ability to sustain profitability if we do not generate increased revenues to offset the costs. This need to augment our support infrastructure due to growth is compounded by our decision to becomebecoming a public reporting company and the increased expense that will ariseincurred in complying with existing and new regulatory requirements. As a public company, our information and control systems must enable us to prepare accurate and timely financial information and other required disclosure. If we discover deficiencies in our existing information and control systems that impede our ability to satisfy our reporting requirements, we must successfully implement improvements to those systems in an efficient and timely manner.
Our financial results could suffer if we are unable to achieve or maintain adequate utilization and suitable billing rates for our consultants.
Our profitability depends to a large extent on the utilization and billing rates of our consultants. Utilization of our consultants is affected by a number of factors, including:
| Ø | the number and size of client engagements; |
| Ø | the timing of the commencement, completion and termination of engagements, which in many cases is unpredictable; |
15
Risk factors
| Ø | our ability to transition our consultants efficiently from completed engagements to new engagements; |
| Ø | the hiring of additional consultants because there is generally a transition period for new consultants that results in a temporary drop in our utilization rate; |
| Ø | unanticipated changes in the scope of client engagements; |
| Ø | our ability to forecast demand for our services and thereby maintain an appropriate level of consultants; and |
| Ø | conditions affecting the industries in which we practice as well as general economic conditions. |
The billing rates of our consultants that we are able to charge are also affected by a number of factors, including:
| Ø | our clients’ perception of our ability to add value through our services; |
| Ø | the market demand for the services we provide; |
| Ø | introduction of new services by us or our competitors; |
| Ø | our competition and the pricing policies of our competitors; and |
| Ø | general economic conditions. |
If we are unable to achieve and maintain adequate overall utilization as well as maintain or increase the billing rates for our consultants, our financial results could materially suffer.
13
Risk factors
A significant portion of our revenues areis derived from a limited number of clients, and our engagement agreements, including those related to our largest clients, can be terminated by our clients with little or no notice and without penalty, which may cause our operating results to be unpredictable.
As a consulting firm, we have derived, and expect to continue to derive, a significant portion of our revenues from a limited number of clients. Our ten largest clients accounted for 36.3% of our revenues in the partial year ended December 31, 2002, 32.1% of our revenues in the year ended December 31, 2003, 27.8% of our revenues in the year ended December 31, 2004 and 32.5%38.8% of our revenues in the six months ended June 30, 2004.2005. One of our clients accounted for 12.6% of our revenues in the six months ended June 30, 2005 and represented 12.2% of our receivables and unbilled services balance as of June 30, 2005. Our clients typically retain us on an engagement-by-engagement basis, rather than under fixed-term contracts, and the volume of work performed for any particular client is likely to vary from year to year, and a major client in one fiscal period may not require or decide to use our services in any subsequent fiscal period. Accordingly, the failure to obtain new large engagements or multiple engagements from existing or new clients could have a material adverse effect on the amount of revenues we generate.
In addition, almost all of our engagement agreements can be terminated by our clients with little or no notice and without penalty. For example, in engagements related to litigation, if the litigation were to be settled, our engagement for those services would no longer be necessary and therefore would be terminated. In client engagements that involve multiple engagements or stages, there is a risk that a client may choose not to retain us for additional stages of an engagement or that a client will cancel or delay additional planned engagements. These terminations,For clients in bankruptcy, a bankruptcy court could elect not to retain our interim management consultants, terminate our retention or require us to reduce our fees for the duration of an engagement. For example, shortly after we acquired Speltz & Weis LLC, its largest client that accounted for approximately 82.8% of its 2004 revenues filed for bankruptcy, and the bankruptcy court could reject the motion to allow the retention of our services. Terminations, cancellations, delays or delaysreductions could result from factors unrelated to our services or the progress of the engagement. When engagements are terminated or reduced, we lose the associated future revenues, and we may not be able to recover associated costs or redeploy the affected employees in a timely manner to minimize the negative impact. In addition, our clients’ ability to terminate engagements with little or no notice and without penalty makes it difficult to predict our operating results in any particular fiscal period.
16
Risk factors
Our ability to maintain and attract new business depends upon our reputation, the professional reputation of our consultants and the quality of our services.
As a professional services firm, our ability to secure new engagements depends heavily upon our reputation and the individual reputations of our consultants. Any factor that diminishes our reputation or that of our consultants, including not meeting client expectations or misconduct by our consultants, could make it substantially more difficult for us to attract new engagements and clients. Similarly, because we obtain many of our new engagements from former or current clients or from referrals by those clients or by law firms that we have worked with in the past, any client that questions the quality of our work or that of our consultants could impair our ability to secure additional new engagements and clients.
The consulting services industry is highly competitive, and we may not be able to compete effectively.
The consulting services industry in which we operate includes a large number of participants and is intensely competitive. We face competition from other business operations and financial consulting firms, general management consulting firms, the consulting practices of major accounting firms, technical and economic advisory firms, regional and specialty consulting firms and the internal professional resources
14
Risk factors
of organizations. In addition, because there are relatively low barriers to entry, we expect to continue to face additional competition from new entrants into the business operations and financial consulting industries. We have six core offices and two smaller offices in the United States and do not have any international offices. Many of our competitors have a greater national presence and are also international in scope, as well as have significantly greater personnel, financial, technical and marketing resources. In addition, these competitors may generate greater revenues and have greater name recognition than we do. Our ability to compete also depends in part on the ability of our competitors to hire, retain and motivate skilled consultants, the price at which others offer comparable services and our competitors’ responsiveness to their clients. If we are unable to compete successfully with our existing competitors or with any new competitors, our financial results will be adversely affected.
Additional hiring and any acquisitions could disrupt our operations, increase our costs or otherwise harm our business.
Our business strategy is dependent in part upon our ability to grow by hiring individuals or groups of consultants and by potentially acquiring additional complementary businesses. However, we may be unable to identify, hire, acquire or successfully integrate new consultants and complementary businesses without substantial expense, delay or other operational or financial problems. Competition for future hiring and acquisition opportunities in our markets could increase the compensation we offer to potential consultants or the price we pay for businesses we wish to acquire. In addition, we may be unable to achieve the financial, operational and other benefits we anticipate from any hiring or acquisition.acquisition, including with respect to Speltz &Weis LLC. Hiring additional consultants or acquiring complementary businesses could also involve a number of additional risks, including:
| Ø | the diversion of management’s time, attention and resources from managing and marketing our company; |
| Ø | the failure to retain key acquired personnel; |
| Ø | potential impairment of existing relationships with our clients, such as client satisfaction or performance problems, whether as a result of integration or management difficulties or otherwise; |
| Ø | the creation of conflicts of interest that require us to decline or resign from engagements that we otherwise could have accepted; |
| Ø | the potential need to raise significant amounts of capital to finance a transaction or the potential issuance of equity securities that could be dilutive to our existing stockholders; |
17
Risk factors
| Ø | increased costs to improve, coordinate or integrate managerial, operational, financial and administrative systems; and |
| Ø | difficulties in integrating diverse backgrounds and experiences of consultants, including if we experience a transition period for newly hired consultants that results in a temporary drop in our utilization rates or margins. |
If we fail to successfully address these risks, our ability to compete may be impaired.
If the number of large bankruptcies continues to declinedeclines or other factors cause a decrease in demand for our corporate advisory services, our revenues and profitability could suffer.
Our corporate advisory services practice provides various turnaround, restructuring and bankruptcy services to companies in financial distress or their creditors or other stakeholders. This practice accounted for 30.7%23.4% and 27.0%11.7% of our revenues for the year ended December 31, 20032004 and the six months ended June 30, 2004,2005, respectively. We are typically engaged in connection with a bankruptcy
15
Risk factors
case when the bankruptcy is of the size and complexity that generally requires the debtor or other constituents to retain the services of financial advisors. A number of other factors also affect demand for this practice. These factors include:
| Ø | over-expansion by various businesses; |
| Ø | management’s inability to address critical operational and financial issues; |
| Ø | the level of lending activity and over-leveraging of companies; and |
| Ø | challenging general economic conditions in the United States, which have benefited our corporate advisory services practice since we commenced operations. |
If the number of large bankruptcies continues to declinedeclines or other factors cause a decrease in demand for our corporate advisory services, the revenues from our turnaround, restructuring and bankruptcy services could decline, which could harm our ability to sustain profitability.
We face an increased risk of fee nonpayment or reduced payment in our corporate advisory services practice.
Many of the clients in our corporate advisory services practice have engaged us because they are experiencing financial distress. These clients may not have sufficient funds to continue operations or to pay for our services. We usually do not receive retainers before we begin performing services on a client’s behalf in connection with our restructuring business, and we are not always able to obtain retainers from clients in bankruptcy as the bankruptcy court must approve our retainers for those clients. When we do receive retainers, the retainers may not adequately cover our fees for the services we perform on behalf of these clients. Even if a bankruptcy court approves our retainer or engagement, a bankruptcy court has the discretion to require us to return all, or a portion of, our fees or to reduce our fees for the duration of the engagement. Therefore, we face the risk of nonpayment or reduced payment, either of which can result in write-offs.
The profitability of our fixed-fee engagements with clients may not meet our expectations if we underestimate the cost of these engagements.
Fixed-fee engagements generated approximately 11.9%11.8% and 12.3%14.4% of our revenues for the year ended December 31, 20032004 and the six months ended June 30, 2004,2005, respectively. When making proposals for fixed-fee engagements, we estimate the costs and timing for completing the engagements. These estimates reflect our best judgment regarding the efficiencies of our methodologies and consultants as we plan to deploy them on engagements. Any increased or unexpected costs or unanticipated delays in connection with the performance of fixed-fee engagements, including delays caused by factors outside our control, could make these contracts less profitable or unprofitable, which would have an adverse effect on our profit margin.
18
Risk factors
Revenues from our performance-based engagements are difficult to predict, and the timing and extent of recovery of our costs is uncertain.
From time to time, primarily in our corporate advisory services and strategic sourcing practices, we enter into engagement agreements under which our fees include a significant performance-based component. Performance-based fees are contingent on the achievement of specific measures, such as our clients meeting cost-saving or other contractually defined goals. The achievement of these contractually-defined goals is often impacted by factors outside of our control, such as the actions of our client or third parties. Because performance-based fees are contingent, revenues on such engagements, which are recognized when all revenue recognition criteria are met, are not certain and the timing of receipt is difficult to predict and may not occur evenly throughout the year. While performance-based fees comprised 3.3%5.1% and 6.9%2.0% of our revenues for the year ended December 31, 20032004 and the six months ended June 30, 2004,2005, respectively, we intend to continue to enter into performance-based fee arrangements and these engagements may impact our revenues to a greater extent in the future. Should performance-based fee arrangements represent a greater percentage of our business in the future, we may experience increased volatility in our working capital requirements and greater variations in our quarter-to-quarter results, which could affect the price of our common stock. In addition, an increase in the proportion of performance-based fee arrangements may offset the positive effect on our operating results from increases in our utilization rate or average billing rate per hour.
Conflicts of interest could preclude us from accepting engagements thereby causing decreased utilization and revenues.
We provide services in connection with bankruptcy proceedings and litigation proceedings that usually involve sensitive client information and frequently are adversarial. In connection with bankruptcy proceedings, we are required by law to be “disinterested” and inmay not be able to provide multiple
16
Risk factors
services to a particular client. In litigation, we would generally be prohibited from performing services in the same litigation for the party adverse to our client. In addition, our engagement agreement with a client or other business reasons may preclude us from accepting engagements with our clients’ competitors or adversaries. As we increase the size of our operations, the number of conflict situations can be expected to increase. Moreover, in many industries in which we provide services, there has been a continuing trend toward business consolidations and strategic alliances. These consolidations and alliances reduce the number of companies that may seek our services and increase the chances that we will be unable to accept new engagements as a result of conflicts of interest. If we are unable to accept new engagements for any reason, our consultants may become underutilized, which would adversely affect our revenues and results of operations in future periods.
Expanding our service offerings or number of offices may not be profitable.
We may choose to develop new service offerings or open new offices because of market opportunities or client demands. Developing new service offerings involves inherent risks, including:
| Ø | our inability to estimate demand for the new service offerings; |
| Ø | competition from more established market participants; |
| Ø | a lack of market understanding; and |
| Ø | unanticipated expenses to recruit and hire qualified consultants and to market our new service offerings. |
In addition, expanding into new geographic areas and/or expanding current service offerings is challenging and may require integrating new employees into our culture as well as assessing the demand in the applicable market. For example, in August 2003, we established a small office in Palo Alto, California to service the SilconSilicon Valley marketplace and, in September 2003, we established a small office in Miami, Florida to deepen our corporate finance capabilities. These offices did not meet our expectations and, therefore, we subsequently closed those offices and incurred a restructuring charge of
19
Risk factors
$2.1 $2.1 million in the six months ended June 30, 2004. In SeptemberAlso in 2004, we decided to eliminate a service offering of a practice area in our operational consultingOperational Consulting segment that was not meeting our expectations. Additionally, inexpectations and incurred a continual effort to streamline our operations and allocate resources more appropriately, we reduced our headcount in certain other practice areas across both segments. In connection with these actions, we expect to record charges in the third quarterrestructuring charge of approximately $2.1 million for severance payments.$1.3 million. If we cannot manage the risks associated with new service offerings or new locations effectively, we are unlikely to be successful in these efforts, which could harm our ability to sustain profitability and our business prospects.
Our engagements could result in professional liability, which could be very costly and hurt our reputation.
Our engagements typically involve complex analyses and the exercise of professional judgment. As a result, we are subject to the risk of professional liability. If a client questions the quality of our work, the client could threaten or bring a lawsuit to recover damages or contest its obligation to pay our fees. Litigation alleging that we performed negligently or breached any other obligations to a client could expose us to significant legal liabilities and, regardless of outcome, is often very costly, could distract our management and could damage our reputation. We are not always able to include provisions in our engagement agreements that are designed to limit our exposure to legal claims relating to our services. Even if these limiting provisions are included in an engagement agreement, they may not protect us or may not be enforceable under some circumstances. In addition, we carry professional liability insurance to cover many of these types of claims, but the policy limits and the breadth of coverage may be inadequate to cover any particular claim or all claims plus the cost of legal defense. For example, we provide services on engagements in which the impact on a client may substantially exceed the limits of our errors and omissions insurance coverage. If we are found to have professional liability with respect to work performed on such an engagement, we may not have sufficient insurance to cover the entire liability.
17
Risk factors
Our intellectual property rights in our “Huron Consulting Group” name are important, and any inability to use that name could negatively impact our ability to build brand identity.
We believe that establishing, maintaining and enhancing the “Huron Consulting Group” name is important to our business. We are, however, aware of a number of other companies that use names containing “Huron.” There could be potential trade name or service mark infringement claims brought against us by the users of these similar names and marks and those users may have trade name or service mark rights that are senior to ours. If another company were to successfully challenge our right to use our name, or if we were unable to prevent a competitor from using a name that is similar to our name, our ability to build brand identity could be negatively impacted.
We or some of our consultants could be named in lawsuits because we were founded by former Arthur Andersen LLP partners and professionals and contracted with Arthur Andersen for releases from non-competition agreements.
We were founded by a core group of consultants that consisted primarily of former Arthur Andersen LLP partners and professionals, and we entered into a contract with Arthur Andersen to release these partners and professionals from non-competition agreements with Arthur Andersen. These circumstances might lead creditors of Arthur Andersen and other parties to bring claims against us or some of our managing directors or other consultants seeking recoveries for liabilities of Arthur Andersen and we may not be able to successfully avoid liability for such claims. In addition, litigation of this nature or otherwise could divert the time and attention of our managing directors and consultants, and we could incur substantial defense costs.
20
Risk factors
As a holding company, we are totally dependent on distributions from our operating subsidiarysubsidiaries to pay dividends or other obligations and there may also be other restrictions on our ability to pay dividends in the future.
We are a holding company with no business operations. Our only significant asset is the outstanding equity interestinterests of our two wholly-owned operating subsidiary.subsidiaries. As a result, we must rely on payments from our subsidiarysubsidiaries to meet our obligations. We currently expect that the earnings and cash flow of our subsidiarysubsidiaries will primarily be retained and used by itthem in itstheir operations, including servicing any debt obligations itthey may have now or in the future. Accordingly, although we do not anticipate paying any dividends in the foreseeable future, our subsidiarysubsidiaries may not be able to generate sufficient cash flow to distribute funds to us in order to allow us to pay future dividends on, or make any distribution with respect to, our common stock. Our future credit facilities, other future debt obligations and statutory provisions may also limit our ability to pay dividends or make any distribution in respect of our common stock.
RISKS ASSOCIATED WITH PURCHASING OUR COMMON STOCK IN THIS OFFERING
As a new investor, you will incur immediate and substantial dilution.
If you purchase shares of our common stock in this offering, you will experience an immediate and substantial dilution of $12.38$ in pro forma net tangible book value per share of your investment as described in the section of this prospectus entitled “Dilution.”(without giving effect to options exercised by any selling stockholders). This means that the price you pay for the shares you acquire in this offering will be significantly higher than their net tangible book value per share. If we issue additional shares of common stock in the future, you may experience further dilution in the net tangible book value of your shares. Likewise, you will incur additional dilution if the holders of outstanding options to purchase shares of our common stock at prices below our net tangible book value per share exercise their options after this offering. As of September 17, 2004,August 15, 2005, there were 1,670,0411,381,206 shares of common stock issuable upon the exercise of outstanding stock options, with a weighted average exercise price of $0.75$2.16 per share.share (including shares of common stock that will be issued to certain selling stockholders upon the exercise of outstanding stock options, with a weighted average exercise price of $ per share, in connection with this offering).
18
Risk factors
Sales of a substantial number of shares of our common stock following this offering may adversely affect the market price of our common stock, and the issuance of additional shares will dilute all other stockholdings.
Sales of a substantial number of shares of our common stock in the public market following this offering, or the perception that large sales could occur, could cause the market price of our common stock to decline or limit our future ability to raise capital through an offering of equity securities. After completion of this offering, there will be 16,285,960Of the shares of our common stock expected to be outstanding including the 769,700 shares of restricted common stock that we intended to grant on the dateupon consummation of this prospectus to our executive officers and certain of our employees. All of the shares of common stock sold in this offeringoffering: (1) approximately % will be freely tradable without restriction or further registration under the federal securities laws unless purchased by our “affiliates” within the meaning of Rule 144 under the Securities Act. All of the remaining 11,285,960and (2) approximately shares of outstanding common stock, representing approximately 69% of the outstanding common stock upon completion of this offering, will be “restricted securities” under the Securities Act, subject to restrictions on the timing, manner and volume of sales of those shares. UponAfter consummation of this offering, HCG Holdings LLC and Gary E. Holdren will continue to be entitled to certain registration rights with respect to 10,005,881 restricted securities. In addition, our certificate of incorporation permits the issuance of up to 500,000,000 shares of common stock. After this offering,As of August 15, 2005, we estimate that we will havehad an aggregate of approximately 483,714,040482,768,911 shares of our common stock authorized but unissued. Thus, we have the ability to issue substantial amounts of common stock in the future, which would dilute the percentage ownership held by the investors who purchase our shares in this offering.
The company,We, each member of our board of directors, each of our director nominees, each of our executive officers and managing directors and theeach selling stockholder have agreed for a period of at least 18090 days after the date of this prospectus, to not, without the prior written consent of UBS Securities
21
Risk factors
LLC, and Deutsche Bank Securities Inc., directly or indirectly, offer to sell, sell, pledge or otherwise dispose of any shares of our common stock, subject to certain permitted exceptions. Following the expiration of the lock-up period, 11,182,442 shares of common stock subject to these agreements, including shares issuable upon the exercise of vested options 18090 days after the date of this prospectus, will be available for sale in the public market, subject to the vesting of the restricted common stock during the lock-up period and the restrictions on sales of “restricted securities” under the Securities Act.
We have adopted threefour equity incentive plans, and,one of which was adopted immediately prior to the consummationcompletion of the offering, we intend to adopt a new equity incentive plan.our initial public offering. See “Management—Equity Incentive Plans” for further information regarding our equity incentive plans. Following the effectiveness of the registration statement of which this prospectus forms a part, we intend to fileWe filed a registration statement on Form S-8 under the Securities Act covering the 2,141,000 shares that will beare reserved for issuance under our newnewly adopted plan as well as the1,612,640 shares reserved for issuance upon the exercise of options outstanding under our three existing plans, which asother plans. As of September 17, 2004 was 1,670,041.August 15, 2005, there were 1,381,206 shares of common stock issuable upon the exercise of outstanding stock options. Accordingly, subject to applicable vesting requirements with respect to options and shares of restricted common stock, exercise with respect to options, the provisions of Rule 144 with respect to affiliates and, if applicable, expiration of the 180-day90 day lock-up agreements, shares registered under that registration statement will be available for sale in the open market. As soon as practicable following the filing of the Form S-8 registration statement, we intend to grant 769,700 shares of restricted common stock to certain of our executive officers and employees, options exercisable for 75,800 shares of our common stock, with a per share exercise price equal to the public offering price, to one of our executive officers and certain of our employees, and options exercisable for 13,333 shares of our common stock, with a per share exercise price equal to the public offering price and assuming a public offering price of $15.00 per share, the mid-point of the range shown on the cover of this prospectus, to each of our independent directors.
For a more detailed description of additional shares that may be sold in the future, see the sections of this prospectus captioned “Shares eligible for future sale” and “Underwriting.”
Because HCG Holdings LLC will have the ability to continue to controlsignificantly influence us after this offering, the influence of our public stockholders over significant corporate actions will be limited.
After the completion of this offering, HCG Holdings LLC will control approximately 59%% of our outstanding common stock, or approximately 54%% if the underwriters exercise their over-allotment option in full. As a result, after this offering, HCG Holdings LLC will continue to have the power to controlsignificantly influence all matters submitted to our stockholders, including the election of our directors and amendments to our certificate of incorporation, and will have the ability to approve or preventsignificantly influence any transaction that requires the approval of stockholders regardless of whether or not other stockholders believe that any such transactions are in their own best interests. So long as HCG Holdings LLC continues
19
Risk factors
to own a significant amount of the outstanding shares of our common stock, it will continue to be able to strongly influence or effectively control our decisions.
Conflicts of interests between HCG Holdings LLC and us or you could arise in the future.
Conflicts of interests between HCG Holdings LLC and us or you could arise in the future, and these conflicts may not be resolved in our or your favor. For instance,Lake Capital Partners LP and its affiliates, which control HCG Holdings LLC, are in the business of making investments in companies and have, and may from time to time acquire and hold, interests in businesses that compete directly or indirectly with us. These entities may also pursue acquisition opportunities that may be complementary to our business, and as a result, those acquisition opportunities may not be available to us. In addition, HCG Holdings LLC, through its significant ownership interest in us, may seek to cause us to take courses of action that, in its judgment, could enhance its investment in us, but which might involve risks to, or otherwise adversely affect, us or you.
22
Risk factors
In addition, after this offering, some of our executive officers and managing directors and a number of our board members will continue to be members of and hold equity interests in HCG Holdings LLC. These relationships with HCG Holdings LLC could create, or appear to create, potential conflicts of interests when these individuals are faced with decisions that could have different implications for our company and HCG Holdings LLC.
Our common stock does not have a trading history, and you may not be able to trade our common stock if an active trading market does not develop.
Prior to this offering, there has been no public market for our common stock. We have applied for quotation of our common stock on the NASDAQ National Market under the symbol “HURN.” Although the underwriters have informed us that they intend to make a market in our common stock, they are not obligated to do so, and any market-making may be discontinued at any time without notice. Therefore, an active trading market for our common stock may not develop or, if it does develop, may not continue. As a result, the market price of our common stock, as well as your ability to sell our common stock, could be adversely affected.
The value of your investment may be subject to sudden decreases due to the potential volatility of the price of our common stock.
The closing sales price of our common stock has ranged from a high of $28.30 per share to a low of $18.90 per share since our initial public offering in October 2004. The market price of our common stock may be highly volatile and subject to wide fluctuations in response to numerous factors, including the factors discussed in other risk factors, which could also cause variations in our quarterly results of operations, and the following factors:
| Ø | press releases or publicity relating to us or our competitors or relating to trends in the industry; |
| Ø | changes in the legal or regulatory environment affecting businesses to which we provide services; |
| Ø | changes in expectations as to our future financial performance, including financial estimates by securities analysts and investors; |
| Ø | the operating and stock performance of other companies that investors may deem comparable; |
| Ø | inability to meet quarterly or annual estimates or targets of our performance; and |
| Ø | general domestic or international economic, market and political conditions. |
These factors may adversely affect the trading price of our common stock, regardless of our actual operating performance, and could prevent you from selling your common stock at or above the initial public offering price. In addition, the stock markets from time to time experience extreme price and volume fluctuations that may be unrelated or disproportionate to the operating performance of companies.
In the past, some stockholders have brought securities class action lawsuits against companies following periods of volatility in the market price of their securities. We may in the future be the target of similar litigation. Securities litigation, regardless of whether we are ultimately successful, could result in substantial costs and divert management’s attention and resources.
Provisions of our certificate of incorporation and our bylaws could delay or prevent a takeover of us by a third party.
Our certificate of incorporation and bylaws could delay, defer or prevent a third party from acquiring us, despite the possible benefit to our stockholders, or otherwise adversely affect the price of our common stock. For example, our charter and bylaws will:bylaws:
| Ø | permit our board of directors to issue one or more series of preferred stock with rights and preferences designated by our board; |
| Ø | impose advance notice requirements for stockholder proposals and nominations of directors to be considered at stockholder meetings; |
23
Risk factors
| Ø | stagger the terms of our board of directors into three classes; |
| Ø | limit the ability of stockholders to remove directors; |
| Ø | prohibit stockholders from filling vacancies on our board of directors, unless the board of directors submits an election to fill a vacancy to a vote of stockholders; |
| Ø | prohibit stockholders from calling special meetings of stockholders and from taking action by written consent; |
20
Risk factors
| Ø | grant our board of directors the authority to amend and repeal our bylaws without a stockholder vote and require the approval of at least two-thirds of the voting power of all of the shares of our capital stock entitled to vote generally in the election of directors, voting together as a single class, for stockholders to amend or repeal our bylaws; and |
| Ø | require the approval of not less than two-thirds of the voting power of all of the shares of our capital stock entitled to vote, voting together as a single class, to amend any provision of our charter described in the third through seventh bullet |
These provisions may discourage potential takeover attempts, discourage bids for our common stock at a premium over market price or adversely affect the market price of, and the voting and other rights of the holders of, our common stock. These provisions could also discourage proxy contests and make it more difficult for you and other stockholders to elect directors other than the candidates nominated by our board. See “Description of capital stock” for additional information on the anti-takeover measures applicable to us.
We do not anticipate paying any dividends following the consummation of this offering.dividends.
Following the consummation of this offering, weWe currently expect that we will retain our future earnings, if any, for use in the operation and expansion of our business, and we do not anticipate paying any cash dividends. As a result, our stock may be less attractive to investors who seek dividend payments.
2421
Special note regarding forward-looking statements
Some of the statements under “Prospectus summary,” “Risk factors,” “Management’s discussion and analysis of financial condition and results of operations,” “Business” and elsewhere in this prospectus constitute forward-looking statements thatwithin the meaning of Section 27A of the Securities Act. These forward-looking statements reflect our current expectation about our future results, levels of activity, performance or achievements.achievements, including, without limitation, that our business continues to grow as currently expected, that we are able to expand our service offerings through our existing consultants and new hires, and that existing market conditions do not change from current expectations. In some cases, you can identify forward-looking statements by terminology such as “may,” “will,” “should,” “could,” “expects,” “plans,” “intends,” “anticipates,” “believes,” “estimates,” “predicts,“potential,” “potential” or “continue” or the negative of such terms or other comparable terminology. These statements involve known and unknown risks, uncertainties and other factors, including, among others, those described under “Risk factors” and elsewhere in this prospectus, that may cause actual results, levels of activity, performance or achievements to be materially different from any future results, levels of activity, performance or achievements expressed or implied by these forward-looking statements. Therefore, you should not place undue reliance on our forward-looking statements. Except to the extent required by applicable securities laws, we are under no duty and do not intend to update any of the forward-looking statements after the date of this prospectus.
2522
We estimate thatAll of the net proceeds that we will receive from our sale of 3,333,333 shares of common stock in this offering will be $42.8 million, assuming a public offering price of $15.00 per share, the mid-point of the range shown on the cover ofoffered by this prospectus and after deductingare being sold by the estimated underwriting discounts and commissions and estimated offering expenses payable by us.selling stockholders. We will not receive any proceeds from the sale of shares by the selling stockholder.
stockholders. We currently estimate that we will use our net proceeds from this offeringreceive approximately $ for the following:
The redemption amount of the 8% preferred stock is equaloptions to the original issuance price of $1,000 per share plus cumulative dividends that will have accrued on a daily basis from the date of investment through the date of the redemption at a rate of 8% per annum, compounded annually, together with a liquidation participation amount. The liquidation participation amount is calculated as if we were liquidated on the date of the redemption and the excess of our assets over our liabilities (with the liabilities including, for purposes of this calculation, the aggregate stated value of all outstandingpurchase shares of preferred stock and all accrued and unpaid interest) were distributed on a share for share basis among the holders of preferred stock and common stock. We expect the redemption date to be within two business days after the consummation of this offering.
The 8% promissory notes were issued at various times in 2002 and mature five years and six months from the date of issuance, subject to mandatory prepayment upon the occurrence of specified events, including the consummation of this offering. Interest on the promissory notes, which is payable annually, accrues at a rate of 8% per year.
Borrowings under the credit agreement bear interest at either the prime rate or LIBOR plus 2.75% and are secured by substantially all of our assets. Borrowings under the credit agreement are payable at the expiration of the agreement in February 2005, subject to our compliance with a covenant that requires that we have an uninterrupted 30-day period each year with no loans outstanding. There were no borrowings outstanding under the credit agreement as of June 30, 2004 and September 23, 2004.
HCG Holdings LLC, our parent and the selling stockholder in this offering, currently owns approximately 93% of our common stock and all of our outstanding 8% preferred stock and 8% promissory notes. HCG Holdings LLC is controlled by Lake Capital Partners LP and Lake Capital Management LLC. The remaining equity interests in HCG Holdings LLCthat are heldbeing sold by certain other institutional investors, some of our executive officers and 24 of our other managing directors, each of our board members, a director nominee and 31 other holders. Our executive officers, board members and the director nominee holding interests in HCG Holdings LLC are Messrs. Holdren, Massaro, Burge, Broadhurst and McCartney. If, as we expect, HCG Holdings LLC distributes to its members all of the proceeds it receives from the sale of the 1,666,667 shares of common stock being offered by itselling stockholders in this offering, assuming a public offering price of $15.00 per share, the mid-point of the range shown on the cover of this prospectus, the redemption of the 8% preferred stock and the repayment of the 8%
26
promissory notes,which we estimate that Messrs. Broadhurst, Burge, Holdren, Massaro and McCartney will receive a payment of approximately $43,800, $43,800, $875,000, $87,500 and $43,800, respectively.
We will retain broad discretion in the allocation of the net proceeds of this offering that are not used to redeem the 8% preferred stock, repay our outstanding 8% promissory notes and repay outstanding indebtedness, if any, under our credit agreement. We intend to use the balance of our net proceeds for general corporate purposes, including working capital. Should we determine to employ cash resourcespurposes.
Since October 13, 2004, our common stock has been trading on the NASDAQ National Market under the symbol “HURN.” The following table sets forth, on a per share basis and for the acquisition of complementary businesses or services,period indicated, the amounts availablehigh and low closing sales prices for general corporate purposes may be significantly reduced. Although we evaluate potential acquisitions inHuron’s common stock as reported by the ordinary course of business, we have no specific understandings, commitments or agreements with respect to any acquisition or investment at this time.NASDAQ National Market.
Until we use the net proceeds of this offering for general corporate purposes, we intend to invest the funds in short-term, investment-grade, interest-bearing securities. We cannot predict whether the proceeds invested will yield a favorable return.
| High | Low | |||||
2004: | ||||||
Fourth Quarter (from October 13, 2004) | $ | 23.95 | $ | 18.90 | ||
2005: | ||||||
First Quarter | 25.56 | 19.76 | ||||
Second Quarter | 25.25 | 19.46 | ||||
Third Quarter (through August 26, 2005) | 28.30 | 23.10 | ||||
27On August 26, 2005, the last reported sale price of our common stock as reported on the NASDAQ National Market was $24.59 per share. As of August 26, 2005, there were 72 holders of record of our common stock.
On May 12, 2004, we declared a special dividend on each outstanding share of our common stock and 8% preferred stock payable to holders of record on May 25, 2004. We paid the special dividend on June 29, 2004. The 8% preferred stock participated on an as converted basis. The aggregate amount of the dividend was $1.25 million, or $0.09 per share of common stock and $22.18$9.64 per share of 8% preferred stock. The payment of the special dividend was funded by our available cash balance and by borrowing availability under our credit agreement, which we repaid the following day. Other than the special dividend, we have not declared or paid any dividends on our common stock since our inception and do not intend to pay any dividends on our common stock in the foreseeable future. We currently expect that we will retain our future earnings, if any, for use in the operation and expansion of our business. Future cash dividends, if any, will be at the discretion of our board of directors and will depend upon, among other things, our future operations and earnings, capital requirements and surplus, general financial condition, contractual restrictions and other factors the board of directors may deem relevant. In addition, our bank credit agreement restricts dividends by requiring $45 million of permanent equity capital, which is defined as the sum of paid-in capital and net income less any distributions.
2823
The following table sets forth our capitalization as of June 30, 2004:
For further information regarding the redemption of our 8% preferred stock and the repayment of our outstanding 8% promissory notes, see the section of this prospectus entitled “Use of proceeds.”
29
Capitalization
2005. The information set forth below should be read in conjunction with “Selected consolidated financial and other operating data,” “Management’s discussion and analysis of financial condition and results of operations” and our consolidated financial statements and related notes included elsewhere in this prospectus.
| As of June 30, 2004 | ||||||||||||
| Actual | Pro forma | Pro forma as adjusted | ||||||||||
| (unaudited) | ||||||||||||
| (in thousands) | ||||||||||||
Cash and cash equivalents | $ | 943 | $ | 943 | $ | 18,461 | ||||||
Long-term debt (consisting of 8% promissory notes) | $ | 10,076 | $ | 10,076 | $ | — | ||||||
Total 8% preferred stock | 14,770 | 14,770 | — | |||||||||
Stockholders’ (deficit) equity: | ||||||||||||
Class A common stock (renamed “common stock” immediately prior to the consummation of this offering), par value $.01 per share; 500,000,000 shares authorized; 11,285,592 shares issued and outstanding at June 30, 2004, actual; 12,176,619 shares issued and outstanding, pro forma; and 16,279,652 shares issued and outstanding, pro forma as adjusted | 113 | 122 | 163 | |||||||||
Class B common stock; par value $.01 per share, 6,486,715 shares authorized and 891,027 shares issued and outstanding at June 30, 2004, actual; no shares authorized, issued and outstanding, pro forma and pro forma as adjusted | 9 | — | — | |||||||||
Restricted common stock | — | — | (11,546 | ) | ||||||||
Additional paid-in capital | 1,224 | 1,224 | 55,496 | |||||||||
Retained deficit | (1,516 | ) | (1,516 | ) | (1,516 | ) | ||||||
Total stockholders’ (deficit) equity | (170 | ) | (170 | ) | 42,597 | |||||||
Total capitalization | $ | 24,676 | $ | 24,676 | $ | 42,597 | ||||||
| As of June 30, 2005 | ||||
(unaudited) (in thousands) | ||||
Cash and cash equivalents | $ | 15,099 | ||
Long-term debt(1) | $ | 2,000 | ||
Stockholders’ equity: | ||||
Common stock, par value $.01 per share; 500,000,000 shares authorized; 17,122,661 shares issued and 17,077,211 shares outstanding | 171 | |||
Treasury stock, 45,450 shares, at cost | (750 | ) | ||
Additional paid-in capital | 73,166 | |||
Deferred stock-based compensation | (20,517 | ) | ||
Retained earnings | 11,226 | |||
Total stockholders’ equity | 63,296 | |||
Total capitalization | $ | 65,296 | ||
| (1) | Consists of notes payable, net of current portion, issued in connection with the acquisition of Speltz & Weis LLC. |
The outstanding share information as of June 30, 20042005 excludes 1,713,0411,415,129 shares of common stock issuable upon the exercise of outstanding stock options issued under our equity incentive plans, with a weighted average exercise price of $0.76$2.16 per share.
30
Purchasers of our common stock in this offering will suffer an immediate and substantial dilution in net tangible book value per share. Dilution is the amount by which the offering price paid by the purchasers of our common stock exceeds the pro forma as adjusted net tangible book value per share of our common stock after the offering. Pro forma net tangible book value per share is determined at any date by subtracting our total liabilities from the total book value of our tangible assets and dividing the difference by the number of shares of our common stock deemed to be outstanding on the date the book value is determined after giving effect to a 1 for 2.3 reverse stock split of our Class A common stock and Class B common stock, which will occur prior to the consummation of this offering.
At June 30, 2004, we had a net tangible book value of $(0.2) million, or $(0.01) per share of common stock. After giving effect to adjustments relating to this offering as if they had occurred on June 30, 2004, our pro forma as adjusted net tangible book value at June 30, 2004 would have been $42.6 million, or $2.62 per share of common stock. This represents an immediate increase in net tangible book value to existing stockholders of $2.63 per share and an immediate dilution to new investors of $12.38 per share. The adjustments made to determine pro forma as adjusted net tangible book value per share are:
For further information regarding the redemption of our 8% preferred stock and the repayment of our outstanding 8% promissory notes, see the section of this prospectus entitled “Use of proceeds.”
The following table illustrates this per share dilution:
Assumed public offering price per share | $ | 15.00 | |||||
Pro forma net tangible book value per share at June 30, 2004 before this offering | $ | (0.01 | ) | ||||
Increase in pro forma net tangible book value per share resulting from this offering | $ | 2.63 | |||||
Pro forma as adjusted net tangible book value per share at June 30, 2004 after this offering | $ | 2.62 | |||||
| �� | |||||||
Dilution per share to new investors | $ | 12.38 | |||||
31
Dilution
The following table summarizes on a pro forma as adjusted basis, as of June 30, 2004, the differences between existing stockholders and new investors with respect to the number of shares of common stock purchased from us, the total cash consideration paid to us and the average price per share paid by existing stockholders and by new investors purchasing common stock in this offering, assuming a public offering price of $15.00 per share, the mid-point of the range shown on the cover of this prospectus (before deducting the estimated underwriting discounts and commissions and estimated offering expenses payable by us):
| Shares purchased | Total cash consideration | Average price per share | ||||||||||||
| Number | % | Amount | % | |||||||||||
Existing stockholders | 12,176,619 | 79 | % | $ | 314,238 | 0.6 | % | $ | 0.03 | |||||
New investors | 3,333,333 | 21 | % | 49,999,995 | 99.4 | % | $ | 15.00 | ||||||
Total | 15,509,952 | 100 | % | $ | 50,314,233 | 100 | % | |||||||
The discussion and tables above exclude 1,713,041 shares of common stock issuable upon the exercise of outstanding stock options issued under our equity incentive plans as of June 30, 2004, with a weighted average exercise price of $0.76 per share, and 194,419 shares available for future issuance under our equity incentive plans as of June 30, 2004. To the extent that any of our outstanding options are exercised there will be further dilution to new investors.
3224
Selected consolidated financial and other operating data
We have derived the following selected consolidated financial data as of the end of and for the period from March 19, 2002 (inception) to December 31, 2002 and as of and for the yearyears ended December 31, 2003 and 2004 from our audited consolidated financial statements, except for the pro forma data.statements. We have derived the following selected consolidated financial data for the six months ended June 30, 20032004 and 2005 and as of June 30, 2005 from our unaudited interim consolidated financial statements. The historical consolidated statements of operations and other operating data for the six months ended June 30, 2004 from our unaudited interim consolidated financial statements, except for2005 includes the pro forma data.results of operations and other operating data of Speltz & Weis LLC since May 9, 2005, its date of acquisition. In the opinion of management, this information containsthe unaudited selected financial data presented below under the headings “Consolidated Statement of Operations Data” and “Consolidated Balance Sheet Data” reflect all adjustments consisting only of a normal recurring accruals,nature necessary for a fair presentation ofto present fairly our results of operations and financial position for such periods.and as of the periods presented. The information set forth below is not necessarily indicative of the results of future operations and should be read in conjunction with “Management’s discussion and analysis of financial condition and results of operations” and the consolidated financial statements and related notes included elsewhere in this prospectus.
3325
Selected consolidated financial and other operating data
| March 19, 2002 (inception) to December 31, 2002 | Year ended December 31, 2003 | Six months ended June 30, | |||||||||||||
| Consolidated statements of operations data: | 2003 | 2004 | |||||||||||||
| (unaudited) | |||||||||||||||
| (in thousands, except per share and other operating data) | |||||||||||||||
Revenues and reimbursable expenses: | |||||||||||||||
Revenues | $ | 35,101 | $ | 101,486 | $ | 46,923 | $ | 81,604 | |||||||
Reimbursable expenses | 2,921 | 8,808 | 3,906 | 7,090 | |||||||||||
Total revenues and reimbursable expenses | 38,022 | 110,294 | 50,829 | 88,694 | |||||||||||
Direct costs and reimbursable expenses: | |||||||||||||||
Direct costs | 26,055 | 69,401 | 29,320 | 47,591 | |||||||||||
Reimbursable expenses | 2,921 | 8,929 | 3,917 | 7,065 | |||||||||||
Total direct costs and reimbursable expenses | 28,976 | 78,330 | 33,237 | 54,656 | |||||||||||
Gross profit | 9,046 | 31,964 | 17,592 | 34,038 | |||||||||||
Operating expenses: | |||||||||||||||
Selling, general and administrative expenses Depreciation and amortization expense | | 8,813 3,048 | | | 25,185 5,328 | | | 11,093 2,658 | | 17,840 1,075 | | ||||
Other operating expenses(1) | 3,715 | 1,668 | — | 2,139 | |||||||||||
Total operating expenses | 15,576 | 32,181 | 13,751 | 21,054 | |||||||||||
Operating (loss) income | (6,530 | ) | (217 | ) | 3,841 | 12,984 | |||||||||
Other expense: | |||||||||||||||
Interest expense | 332 | 856 | 418 | 516 | |||||||||||
Other | 1 | 112 | 112 | (1 | ) | ||||||||||
Total other expense | 333 | 968 | 530 | 515 | |||||||||||
(Loss) income before (benefit) provision for income taxes | (6,863 | ) | (1,185 | ) | 3,311 | 12,469 | |||||||||
(Benefit) provision for income taxes | (2,697 | ) | (122 | ) | 1,451 | 5,237 | |||||||||
Net (loss) income | (4,166 | ) | (1,063 | ) | 1,860 | 7,232 | |||||||||
Accrued dividends on 8% preferred stock | 646 | 1,066 | 516 | 558 | |||||||||||
Net (loss) income attributable to common stockholders | $ | (4,812 | ) | $ | (2,129 | ) | $ | 1,344 | $ | 6,674 | |||||
Net (loss) income per share attributable to common stockholders: | |||||||||||||||
Basic | $ | (0.41 | ) | $ | (0.18 | ) | $ | 0.05 | $ | 0.50 | |||||
Diluted | $ | (0.41 | ) | $ | (0.18 | ) | $ | 0.05 | $ | 0.47 | |||||
Weighted average shares used in calculating net (loss) income attributable to common stockholders per share: | |||||||||||||||
Basic | 11,803 | 11,871 | 11,806 | 12,011 | |||||||||||
Diluted | 11,803 | 11,871 | 12,357 | 13,005 | |||||||||||
Cash dividend per common share(2) | — | — | — | $ | 0.09 | ||||||||||
Unaudited pro forma net (loss) income attributable to common stockholders(3) | $ | (580 | ) | $ | 7,477 | ||||||||||
Unaudited pro forma net (loss) income attributable to common stockholders per share(3): | |||||||||||||||
Basic | $ | (0.04 | ) | $ | 0.50 | ||||||||||
Diluted | $ | (0.04 | ) | $ | 0.47 | ||||||||||
Unaudited pro forma weighted average shares outstanding used in calculating unaudited pro forma net (loss) income attributable to common stockholders per share(4): | |||||||||||||||
Basic | 14,787 | 14,981 | |||||||||||||
Diluted | 14,787 | 15,975 | |||||||||||||
Mar. 19, 2002 2002 | Year Ended December 31, | Six Months Ended June 30, | |||||||||||||||||
| Consolidated statements of operations data | 2003 | 2004 | 2004 | 2005 | |||||||||||||||
| (unaudited) | |||||||||||||||||||
| (in thousands, except per share and other operating data) | |||||||||||||||||||
Revenues | $ | 35,101 | $ | 101,486 | $ | 159,550 | $ | 81,604 | $ | 97,277 | |||||||||
Reimbursable expenses | 2,921 | 8,808 | 14,361 | 7,090 | 9,061 | ||||||||||||||
Total revenues and reimbursable expenses | 38,022 | 110,294 | 173,911 | 88,694 | 106,338 | ||||||||||||||
Direct costs and reimbursable expenses (exclusive of depreciation and amortization shown in operating expenses)(1): | |||||||||||||||||||
Direct costs | 26,055 | 69,374 | 92,270 | 47,405 | 52,459 | ||||||||||||||
Stock-based compensation | — | 27 | 978 | 186 | 2,239 | ||||||||||||||
Intangible assets amortization | — | — | — | — | 385 | ||||||||||||||
Reimbursable expenses | 2,921 | 8,929 | 14,281 | 7,065 | 9,091 | ||||||||||||||
Total direct costs and reimbursable expenses | 28,976 | 78,330 | 107,529 | 54,656 | 64,174 | ||||||||||||||
Operating expenses: | |||||||||||||||||||
Selling, general and administrative | 8,813 | 25,171 | 40,425 | 17,780 | 22,962 | ||||||||||||||
Stock-based compensation | — | 14 | 433 | 60 | 867 | ||||||||||||||
Depreciation and amortization | 3,048 | 5,328 | 2,365 | 1,075 | 1,956 | ||||||||||||||
Restructuring charges | — | — | 3,475 | 2,139 | — | ||||||||||||||
Management and advisory fees paid to related parties | 2,750 | — | — | — | — | ||||||||||||||
Loss on lease abandonment | — | 1,668 | — | — | — | ||||||||||||||
Organization costs | 965 | — | — | — | — | ||||||||||||||
Total operating expenses | 15,576 | 32,181 | 46,698 | 21,054 | 25,785 | ||||||||||||||
Operating income (loss) | (6,530 | ) | (217 | ) | 19,684 | 12,984 | 16,379 | ||||||||||||
Other (income) expense: | |||||||||||||||||||
Interest (income) expense, net | 332 | 856 | 692 | 516 | (229 | ) | |||||||||||||
Other (income) expense | 1 | 112 | — | (1 | ) | (1 | ) | ||||||||||||
Total other (income) expense | 333 | 968 | 692 | 515 | (230 | ) | |||||||||||||
Income (loss) before provision (benefit) for income taxes | (6,863 | ) | (1,185 | ) | 18,992 | 12,469 | 16,609 | ||||||||||||
Provision (benefit) for income taxes | (2,697 | ) | (122 | ) | 8,128 | 5,237 | 7,125 | ||||||||||||
Net income (loss) | (4,166 | ) | (1,063 | ) | 10,864 | 7,232 | 9,484 | ||||||||||||
Accrued dividends on 8% preferred stock | 646 | 1,066 | 931 | 558 | — | ||||||||||||||
Net income (loss) attributable to common stockholders | $ | (4,812 | ) | $ | (2,129 | ) | $ | 9,933 | $ | 6,674 | $ | 9,484 | |||||||
Net income (loss) attributable to common stockholders per share(2): | |||||||||||||||||||
Basic | $ | (0.41 | ) | $ | (0.18 | ) | $ | 0.77 | $ | 0.50 | $ | 0.61 | |||||||
Diluted | $ | (0.41 | ) | $ | (0.18 | ) | $ | 0.72 | $ | 0.47 | $ | 0.57 | |||||||
Weighted average shares used in calculating net income (loss) attributable to common stockholders per share(2): | |||||||||||||||||||
Basic | 11,803 | 11,871 | 12,820 | 12,011 | 15,597 | ||||||||||||||
Diluted | 11,803 | 11,871 | 13,765 | 13,005 | 16,725 | ||||||||||||||
Cash dividend per common share(3) | $ | — | $ | — | $ | 0.09 | $ | — | $ | — | |||||||||
(See footnotes on the following page.)
3426
Selected consolidated financial and other operating data
| March 19, 2002 (inception) to December 31, 2002 | Year ended December 31, 2003 | Six months ended June 30, | Mar. 19, 2002 2002 | Year Ended December 31, | Six Months Ended, | |||||||||||||||||||||||||||||||
| Other operating data (unaudited): | 2003 | 2004 | 2003 | 2004 | 2004 | 2005 | ||||||||||||||||||||||||||||||
Number of consultants (at end of period) | 262 | 477 | 355 | 499 | 262 | 477 | 483 | 488 | 557 | |||||||||||||||||||||||||||
Utilization rate(6) | 57.3 | % | 66.1 | % | 72.4 | % | 72.6 | % | ||||||||||||||||||||||||||||
Average billing rate per hour(7) | $ | 206 | $ | 217 | $ | 224 | $ | 238 | ||||||||||||||||||||||||||||
Average number of consultants (for the period) | 247 | 361 | 485 | 480 | 513 | |||||||||||||||||||||||||||||||
Utilization rate(5) | 57.3 | % | 66.1 | % | 72.2 | % | 72.6 | % | 76.3 | % | ||||||||||||||||||||||||||
Average billing rate per hour(6)(7) | $ | 206 | $ | 217 | $ | 239 | $ | 238 | $ | 252 | ||||||||||||||||||||||||||
| As of December 31, | As of June 30, | |||||||||||
| Consolidated balance sheet data: | 2002 | 2003 | ||||||||||
| (unaudited) | ||||||||||||
| (in thousands) | ||||||||||||
Cash and cash equivalents | $ | 4,449 | $ | 4,251 | $ | 943 | ||||||
Working capital | 9,780 | 10,159 | 16,838 | |||||||||
Total assets | 26,583 | 39,889 | 48,932 | |||||||||
Long-term debt (consisting of 8% promissory notes) | 10,076 | 10,076 | 10,076 | |||||||||
Total 8% preferred stock | 13,146 | 14,212 | 14,770 | |||||||||
Total stockholders’ deficit | (4,543 | ) | (6,624 | ) | (170 | ) | ||||||
Dec. 31, 2002 | December 31, | June 30, 2005 | ||||||||||||
| Consolidated balance sheet data (in thousands): | 2003 | 2004 | ||||||||||||
| (unaudited) | ||||||||||||||
Cash and cash equivalents | $ | 4,449 | $ | 4,251 | $ | 28,092 | $ | 15,099 | ||||||
Working capital | $ | 9,780 | $ | 10,159 | $ | 42,898 | $ | 38,963 | ||||||
Total assets | $ | 26,583 | $ | 39,889 | $ | 83,219 | $ | 100,156 | ||||||
Long-term debt(8) | $ | 10,076 | $ | 10,076 | $ | — | $ | 2,000 | ||||||
Total 8% preferred stock(9) | $ | 13,146 | $ | 14,212 | $ | — | $ | — | ||||||
Total stockholders’ equity (deficit) | $ | (4,543 | ) | $ | (6,624 | ) | $ | 49,233 | $ | 63,296 | ||||
| (1) |
| (2) | Adjusted for |
| On May 12, 2004, we declared a special dividend on each outstanding share of our common stock and 8% preferred stock payable to holders of record on May 25, 2004. We paid the special dividend on June 29, 2004. The 8% preferred stock participated on an as converted basis. The aggregate amount of the dividend was $1.25 million, or $0.09 per share of common stock and |
| (4) |
| (5) |
| We calculate the utilization rate for our consultants by dividing the number of hours all of our consultants worked on client assignments during a period by the total available working hours for all of our consultants during the same period, assuming a forty-hour work week, less paid holidays and vacation days. |
| Average billing rate per hour is calculated by dividing revenues for a period by the number of hours worked on client assignments during the same period. |
| (7) | Included in the six months ended June 30, 2004 was a $1.6 million success fee related to the completion of a series of asset sales transactions managed on behalf of a single Financial Consulting segment client over a two-year period. Excluding this success fee, our average billing rate per hour for the six months ended June 30, 2004 and the year ended December 31, 2004 would have been $234 and $236, respectively. |
| (8) | Consists of 8% promissory notes at December 31, 2002 and 2003. Consists of notes payable, net of current portion, issued in connection with the acquisition of Speltz & Weis LLC at June 30, 2005. |
| (9) | On October 18, 2004, we used $15.1 million of the proceeds of the initial public offering to redeem all of the outstanding 8% preferred stock, plus cumulative dividends and a liquidation participation amount totaling $2.6 million. |
3527
Management’s discussion and analysis of financial condition and results of operations
This prospectus contains forward-looking statements that involve risks and uncertainties. Our actual results could differ materially from those anticipated in forward-looking statements for many reasons, including the risks described in “Risk factors” and elsewhere in this prospectus. You should read the following discussion with “Selected consolidated financial and other operating data” and our consolidated financial statements and related notes included elsewhere in this prospectus.
OVERVIEWOUR BUSINESS
We are an independent provider of financial and operational consulting services. We commenced operations in May 2002 with a core group of experienced financial and operational consultants, composed primarily of former Arthur Andersen LLP partners and professionals. We have grown significantly since we commenced operations, more than doubling the number of our consultants from 213 on May 31, 2002 to 486557 as of September 17, 2004.June 30, 2005. In response to strong demand for our services, we began aggressively hiring consultants in the first quarter of 2003 and added over 200 new consultants during 2003. While this aggressive hiring reduced our 2003 utilization rate (determined by dividing the number of hours all of our consultants worked on client assignments during a period by the total available working hours for all of our consultants during the same period, assuming a forty-hour work week, less paid holidays and vacation days) as we integrated our new hires, we believe the early results of this growth initiative are evident in our recent financial results. Revenues in 2002 totaled $35.1 million for our first eight months of operations and rose to $101.5 million in 2003, our first full year of operations. Revenues in 2004 totaled $159.6 million, a 57.2% increase from 2003. Revenues for the six months ended June 30, 20042005 totaled $81.6$97.3 million, a 74.0%19.2% increase from revenues of $46.9$81.6 million in the six months ended June 30, 2003.2004.
We provide our services through two segments: Financial Consulting and Operational Consulting. Our Financial Consulting segment provides services that help clients effectively address complex challenges that arise from litigation, disputes, investigations, regulation, financial distress and other sources of significant conflict or change. Our Operational Consulting segment provides services that help clients improve the overall efficiency and effectiveness of their operations, reduce costs, manage regulatory compliance and maximize procurement efficiency.
Revenues
We derive all of our revenues from providing financial and operational consulting services through three principal types of billing arrangements consisting of time-and-expense, fixed-fee and performance-based. We manage our business on the basis of revenues before reimbursable expenses. We believe this is the most accurate reflection of our consulting services because it eliminates the effect of reimbursable expenses that we bill to our clients at cost.
Since our inception, most of our revenues have been generated from time-and-expense engagements. In time-and-expense engagements, fees are based on the hours incurred at agreed upon billing rates. Time-and-expense engagements represented approximately 80.8%83.1% of our revenues in 2004 and 83.6% of our revenues for the six months ended June 30, 2004.2005.
In fixed-fee engagements, we agree to a pre-established fee in exchange for a pre-determined set of consulting services. We set the fees based on our estimates of the costs and timing for completing the fixed-fee engagements. It is the client’s expectation in these engagements that the pre-established fee will not be exceeded except in mutually agreed upon circumstances. For the six months ended June 30, 2004, fixed-fee engagements represented approximately 12.3% of our revenues.
3628
Management’s discussion and analysis of financial condition and results of operations
not be exceeded except in mutually agreed upon circumstances. For the year ended December 31, 2004 and the six months ended June 30, 2005, fixed-fee engagements represented approximately 11.8% and 14.4%, respectively, of our revenues.
Performance-based fee engagements generally tie fees to the attainment of contractually defined objectives. We enter into performance-based engagements in essentially two forms. First, we generally earn fees that are directly related to the savings formally acknowledged by the client as a result of adopting our recommendations for improving cost effectiveness in the procurement area. Second, we have performance-based engagements in which we earn a success fee when and if certain pre-defined outcomes occur. Often this type of success fee supplements time-and-expense or fixed-fee engagements. For example, our revenues for the second quarter of 2004 included a $1.6 million success fee earned on a time-and-expense engagement that included a performance-based component related to the completion of a series of asset sales transactions managed on behalf of a single financial consultingFinancial Consulting segment client over a two-year period. While performance-based fee revenues represented approximately 6.9%5.1% and 2.0% of our revenues in 2004 and the six months ended June 30, 2004,2005, respectively, such revenues in the future may cause significant variations in quarterly revenues and operating results due to the timing of achieving the performance-based criteria.
Our quarterly results are impacted principally by our utilization rate, the number of business days in each quarter and the number of our consultants who are available to work. Our utilization rate can be negatively affected by increased hiring because there is generally a transition period for new consultants that results in a temporary drop in our utilization rate. Our utilization rate can also be affected by seasonal variations in the demand for our services from our clients. For example, during the third and fourth quarters of the year, vacations taken by our clients can result in the deferral of spending on existing and new engagements, which would negatively affect our utilization rate. The number of business work days are also affected by the number of vacation days taken by our consultants and holidays in each quarter. We typically have 10% to 15% fewer business work days available in the third and fourth quarters of the year, which can impact revenues during those periods. The decline in the number of business work days in the third and fourth quarters of 2002 and 2003 was offset by the hiring of a substantial number of additional consultants during those periods, thereby resulting in an increase in sequential revenues by quarter during both years. We expect to continue to hire a meaningful number of new consultants in the future as demand for our various services continues to grow. The actual number and experience level of consultants to be hired will be in response to future market conditions.
Reimbursable expenses
Reimbursable expenses that are billed to clients, primarily relating to travel and out-of-pocket expenses incurred in connection with engagements, are included in total revenues and reimbursable expenses, and typically an equivalent amount of these expenses are included in total direct costs and reimbursable expenses. The amount of reimbursable expenses included in total revenues and reimbursable expenses may not always correspond with the amount of these expenses included in total direct costs and reimbursable expenses due to the fact that revenues from reimbursable expenses associated with performance-based engagements may be deferred and recognized at a later date when the revenue on these engagements is recognized. This treatment can result in a timing difference between when revenue from reimbursable expenses is recognized and when such expenses are recognized in the statement of operations. Such timing differences are eliminated when the performance-based engagement is completed, as total cumulative revenues from reimbursable expenses will equal the total cumulative reimbursable expenses incurred on the engagement.
DirectTotal direct costs
Our most significant expenses are costs classified as total direct costs. These total direct costs primarily include direct costs consisting of salaries, performance bonuses, payroll taxes and benefits for consultants, as well as fees paid to independent subcontractorscontractors that we retain to supplement consulting personnel, typically on an as needed basis for specific client engagements.
3729
Management’s discussion and analysis of financial condition and results of operations
Total direct costs also include stock-based compensation, which represents the cost of stock option and restricted stock awards granted to our consultants. Compensation expense for stock-based awards is amortized on a straight-line basis over the vesting period, which is generally four years. As a result of the grant of restricted common stock awards and anticipated future awards, annual stock-based compensation expense will increase in the future. Total direct costs also include intangible assets amortization relating to customer contracts.
Operating expenses
Our operating expenses include selling, general and administrative expenses, which consist primarily of salaries, performance bonuses, payroll taxes and benefits for non-billable professionals. Also included in this category are other sales and marketing related expenses, rent and other office related expenses, and professional fees andfees. Other operating expenses include certain depreciation and amortization expense.expenses not included in total direct costs and stock-based compensation, which represents the cost of stock option and restricted stock awards granted to our non-billable professionals. Compensation expense for stock-based awards is amortized on a straight-line basis over the vesting period, which is generally four years. As a result of the grant of restricted common stock awards and anticipated future awards, annual stock-based compensation expense will increase in the future.
Segment results
Segment operating income consists of the revenues generated by a segment, less the direct costs of revenue and selling, general and administrative costs that are incurred directly by the segment. Unallocated corporate costs include costs related to administrative functions that are performed in a centralized manner that are not attributable to a particular segment. These administrative function costs include corporate office support costs, all office facility costs, costs relating to accounting and finance, human resources, legal, marketing, information technology and company-wide business development functions, as well as costs related to overall corporate management.
Beginning January 1, 2005, the forensic technology and discovery services group was moved from the Financial Consulting segment to the Operational Consulting segment to improve marketing synergies with the legal business consulting practice. Previously reported segment information has been reclassified to reflect this change, except for the year ended December 31, 2002 as the effect was immaterial.
INITIAL PUBLIC OFFERING
On October 18, 2004, we completed our initial public offering. In the initial public offering, we sold 3,333,333 shares of common stock and HCG Holdings LLC, one of the selling stockholders in this offering, sold 1,666,667 shares of common stock at an offering price of $15.50 per share. On October 22, 2004, the underwriters exercised in full their over-allotment option to purchase an additional 750,000 shares of common stock from HCG Holdings LLC. The initial public offering generated gross proceeds to us of $51.7 million, or $48.0 million net of underwriting discounts. We did not receive any proceeds from the shares sold by HCG Holdings LLC. On October 18, 2004, we used $15.1 million of the net proceeds to redeem the outstanding 8% preferred stock, including cumulative dividends and a liquidation participation amount totaling $2.6 million. Also on October 18, 2004, the Company used $10.7 million of the net offering proceeds to repay the notes payable to HCG Holdings LLC, including accrued and unpaid interest of $0.6 million. The costs associated with the initial public offering, which totaled $3.3 million, were paid from the proceeds. On May 9, 2005, we used a portion of the remaining net proceeds from the initial public offering to pay the cash portion of the purchase price for our acquisition of Speltz & Weis LLC. We are using the remaining initial public offering proceeds for general corporate purposes, including working capital and potential business acquisitions.
30
Management’s discussion and analysis of financial condition and results of operations
ACQUISITION OF SPELTZ & WEIS LLC
On May 9, 2005, Huron Consulting Group, Inc. acquired 100% of the outstanding membership interests of Speltz & Weis LLC, a specialized consulting firm consisting of 26 consultants. With the acquisition of Speltz & Weis LLC, our Financial Consulting segment can provide interim management, organizational renewal and turnaround services and other crisis management services to distressed hospitals and other healthcare facilities.
The aggregate purchase price of the acquisition was $17.2 million, which consisted of $14.0 million cash paid at closing, notes payable totaling $3.0 million payable in three equal annual installments of $1.0 million (together with accrued interest at 4% per annum) beginning on May 8, 2006, and $0.2 million of transaction costs. Additional purchase consideration may be payable based on the performance of Speltz & Weis LLC during the three-year period beginning June 1, 2005 and ending May 30, 2008. Also, additional payments may be made based on the amount of revenues we receive from certain referrals made by Speltz & Weis LLC employees. The acquisition has been accounted for under the purchase method of accounting and the results of Speltz & Weis’ operations have been included within the Financial Consulting segment in our consolidated financial statements since the date of the acquisition.
CRITICAL ACCOUNTING POLICIES
Management’s discussion and analysis of financial condition and results of operations are based upon our consolidated financial statements, which have been prepared in accordance with accounting principles generally accepted in the United States, or GAAP. The notes to our consolidated financial statements include disclosure of our significant accounting policies. We annually review our financial reporting and disclosure practices and accounting policies to ensure that our financial reporting and disclosures provide accurate information relative to the current economic and business environment. The preparation of financial statements in conformity with GAAP requires management to make assessments, estimates and assumptions that affect the reported amount of assets and liabilities and disclosure of contingent assets and liabilities as of the date of the financial statements, as well as the reported amounts of revenues and expenses during the reporting period. Critical accounting policies are those policies that we believe present the most complex or subjective measurements and have the most potential to impact our financial position and operating results. While all decisions regarding accounting policies are important, we believe that there are fourfive accounting policies that could be considered critical. These critical policies, which are presented in detail in the notes to our financial statements, relate to revenue recognition, the provisionallowances for doubtful accounts and unbilled services, carrying value of goodwill and other intangible assets, valuation of net deferred tax assets and stock-based compensation.
Revenue recognition
We recognize revenues in accordance with Staff Accounting Bulletin, or SAB, No. 101, “Revenue Recognition in Financial Statements,” as amended by SAB No. 104, “Revenue Recognition.” Revenue is recognized when persuasive evidence of an arrangement exists, the related services are provided, the price is fixed and determinable and collectibility is reasonably assured. Our services are primarily rendered under engagements that require the client to pay on a time-and-expense basis. Fees are based on the hours incurred at agreed-upon rates and recognized as services are provided. Revenues related to fixed-fee engagements are recognized based on estimates of work completed versus the total services to be provided under the engagement. Losses, if any, on fixed-fee engagements are recognized in the period in which the loss first becomes probable and reasonably estimable. To date, such losses have not been significant. Revenues related to performance-based engagements are recognized when all performance-based criteria are met. We also have contracts with clients to deliver multiple services that are covered under both individual and separate engagement letters. These arrangements allow for our services to be
31
Management’s discussion and analysis of financial condition and results of operations
valued and accounted for on a separate basis. Reimbursable expenses related to time-and-expense and fixed-fee engagements are recognized as revenue in the period in which the expense is incurred. Reimbursable expenses subject to performance-based criteria are recognized as revenue when all
38
Management’s discussion and analysis of financial condition and results of operations
performance criteria are met. Direct costs incurred on all types of engagements, including performance-based engagements, are recognized in the period in which incurred.
Differences between the timing of billings and the recognition of revenue are recognized as either unbilled services or deferred revenue. Revenues recognized for services performed but not yet billed to clients are recorded as unbilled services. Amounts billed to clients but not yet recognized as revenues are recorded as deferred revenue. Client prepayments and retainers that are unearned are also classified as deferred revenue and recognized over future periods as earned in accordance with the applicable engagement agreement.
AllowanceAllowances for doubtful accounts and unbilled services
We maintain an allowanceallowances for doubtful accounts and for services performed but not yet billed for estimated losses based on several factors, including the historical percentages of fee adjustments and write-offs by practice group, an assessment of a client’s ability to make required payments and the estimated cash realization from amounts due from clients. The allowance isallowances are assessed by management on a quarterly basis. If the financial condition of a client deteriorates in the future, impacting the client’s ability to make payments, an increase to our allowance might be required or our allowance may not be sufficient to cover actual write-offs.
The provision for doubtful accounts and unbilled services is recorded as a reduction in revenue to the extent the provision relates to fee adjustments and other discretionary pricing adjustments. To the extent the provision relates to a client’s inability to make required payments, the provision is recorded in operating expenses.
Carrying value of goodwill and other intangible assets
Goodwill represents the excess of the cost of an acquired entity over the net of the amounts assigned to assets acquired and liabilities assumed. Our goodwill balance as of June 30, 2005 was $14.6 million, which resulted from the acquisition of Speltz & Weis LLC in the second quarter of 2005. Under the provisions of Statement of Financial Accounting Standards, or SFAS, No. 142, “Goodwill and Other Intangible Assets,” goodwill is required to be tested for impairment on an annual basis and between annual tests whenever indications of impairment exist. We have elected and will begin to perform this annual impairment test in the second quarter of 2006 or earlier if indications of impairment arise, such as loss of key personnel, unanticipated competition, or other unforeseen developments. Impairment exists when the carrying amount of goodwill exceeds its implied fair value, resulting in an impairment charge for this excess. An impairment test involves considerable management judgment and estimates regarding future operating results and cash flows.
Intangible assets represent purchased assets that lack physical substance but can be distinguished from goodwill. Our intangible assets balances, net of accumulated amortization, totaled $2.1 million at June 30, 2005 and consist of customer contracts and relationships relating to the Speltz & Weis LLC acquisition. We obtained a third party valuation to assist us in estimating the initial fair value of acquired intangible assets. These estimated fair values could change based on the finalization of the valuation. These valuations are primarily based on the present value of the estimated net cash flows expected to be derived from the client contracts and relationships, discounted for assumptions about future customer attrition. We evaluate our intangible assets for impairment whenever events or changes in circumstances indicate that the carrying amount of the assets may not be recoverable. Therefore, higher or earlier-than-expected customer attrition may result in higher future amortization charges or an impairment charge for customer-related intangible assets.
32
Management’s discussion and analysis of financial condition and results of operations
Valuation of net deferred tax assets
We have recorded net deferred tax assets as we expect to realize future tax benefits related to the utilization of these assets. Although we have experienced net losses sinceearly in our inception in 2002,history, no valuation allowance has been recorded relating to these deferred tax assets because we believe that it is more likely than not that future taxable income will be sufficient to allow us to utilize these assets. Should we determine in the future that we will not be able to fully utilize all or part of these deferred tax assets, we would need to establish a valuation allowance, which would be recorded as a charge to income in the period the determination was made. While utilization of these deferred tax assets will provide future cash flow benefits, they will not have an effect on future income tax provisions.
Stock-based compensation
The accounting for stock-based compensation is complex, and under certain circumstances, GAAP allows for alternative methods. As permitted, we account for stock-based compensation using the intrinsic value method prescribed in Accounting Principles Board, (“APB”)or APB, Opinion No. 25, “Accounting for Stock Issued to Employees,” and related interpretations and have elected the disclosure option of Statement of Financial Accounting Standards, or SFAS No. 123, “Accounting for Stock-Based Compensation.” SFAS No. 123 requires that companies either recognize compensation expense for grants of stock, stock options and other equity instruments based on fair value, or provide pro forma disclosure of net income and earnings per share in the notes to the financial statements. Accordingly, we have measured compensation expense for stock options that we have granted to employees as the excess, if any, of the estimated fair value of our common stock based upon the results of an independent appraiser, at the date of grant over the exercise price. The calculated stock-based compensation is included as a component of stockholders’ equity and is amortized on a straight-line basis by charges to earnings over the vesting period of the applicable options.
39
Management’s discussion and analysis of financial condition and results of operations
Given the lack of a public market for our common stock prior to our initial public offering, we established an estimated fair value of the common stock as well as the exercise price for the options to purchase this stock. At various dates during the year, weWe estimated the fair value of our common stock by evaluating our results of business activities and projections of our future results of operations. Based upon an estimated public offering price of $15.00, the mid-point of the range shown on the cover of this prospectus, the intrinsic value of the options outstanding at June 30, 2004 was $24.4 million, of which $2.2 million related to the vested options and $22.2 million related to the unvested options.See “Recent Accounting Pronouncements” below.
4033
Management’s discussion and analysis of financial condition and results of operations
RESULTS OF OPERATIONS
The following table sets forth selected segment and consolidated operating results and other operating data for the periods indicated:indicated.
Period from Dec. 31, 2002 | Year ended 2003 | Six months ended June 30, | Mar. 19, 2002 2002 | Year Ended December 31, | Six Months Ended June 30, | |||||||||||||||||||||||||||||||
| Segment and consolidated operating results: | 2003 | 2004 | 2003 | 2004 | 2004 | 2005 | ||||||||||||||||||||||||||||||
| (unaudited) | (unaudited) | |||||||||||||||||||||||||||||||||||
| (in thousands) | (in thousands, except other operating data) | |||||||||||||||||||||||||||||||||||
Revenues and reimbursable expenses: | ||||||||||||||||||||||||||||||||||||
Financial Consulting revenues | $ | 22,400 | $69,941 | $ | 33,518 | $ | 50,827 | $ | 22,400 | $ | 68,028 | $ | 92,378 | $ | 48,999 | $ | 54,443 | |||||||||||||||||||
Operational Consulting revenues | 12,701 | 31,545 | 13,405 | 30,777 | 12,701 | 33,458 | 67,172 | 32,605 | 42,834 | |||||||||||||||||||||||||||
Total revenues | 35,101 | 101,486 | 46,923 | 81,604 | 35,101 | 101,486 | 159,550 | 81,604 | 97,277 | |||||||||||||||||||||||||||
Total reimbursable expenses | 2,921 | 8,808 | 3,906 | 7,090 | 2,921 | 8,808 | 14,361 | 7,090 | 9,061 | |||||||||||||||||||||||||||
Total revenues and reimbursable expenses | $ | 38,022 | $ | 110,294 | $ | 50,829 | $ | 88,694 | $ | 38,022 | $ | 110,294 | $ | 173,911 | $ | 88,694 | $ | 106,338 | ||||||||||||||||||
Operating (loss) income: | ||||||||||||||||||||||||||||||||||||
Operating income (loss): | ||||||||||||||||||||||||||||||||||||
Financial Consulting | $ | 3,912 | $ | 22,011 | $ | 12,942 | $ | 20,288 | $ | 3,912 | $ | 20,601 | $ | 34,365 | $ | 19,182 | $ | 22,444 | ||||||||||||||||||
Operational Consulting | 3,527 | 5,383 | 3,033 | 10,238 | 3,527 | 6,793 | 23,009 | 11,344 | 15,988 | |||||||||||||||||||||||||||
Total segment operating income | 7,439 | 27,394 | 15,975 | 30,526 | 7,439 | 27,394 | 57,374 | 30,526 | 38,432 | |||||||||||||||||||||||||||
Unallocated corporate costs | 7,206 | 20,615 | 9,476 | 14,328 | 7,206 | 20,601 | 31,417 | 14,328 | 20,097 | |||||||||||||||||||||||||||
Depreciation and amortization expense | 3,048 | 5,328 | 2,658 | 1,075 | 3,048 | 5,328 | 2,365 | 1,075 | 1,956 | |||||||||||||||||||||||||||
Other operating expenses | 3,715 | 1,668 | — | 2,139 | 3,715 | 1,682 | 3,908 | 2,139 | — | |||||||||||||||||||||||||||
Total operating expenses | 13,969 | 27,611 | 12,134 | 17,542 | 13,969 | 27,611 | 37,690 | 17,542 | 22,053 | |||||||||||||||||||||||||||
Operating (loss) income | $ | (6,530 | ) | $ | (217 | ) | $ | 3,841 | $ | 12,984 | $ | (6,530 | ) | $ | (217 | ) | $ | 19,684 | $ | 12,984 | $ | 16,379 | ||||||||||||||
| Other operating data (unaudited): | ||||||||||||||||||||||||||||||||||||
Number of consultants (at period end)(1): | ||||||||||||||||||||||||||||||||||||
Number of consultants (at end of period)(1): | ||||||||||||||||||||||||||||||||||||
Financial Consulting | 172 | 285 | 269 | 276 | 284 | |||||||||||||||||||||||||||||||
Operational Consulting | 90 | 192 | 214 | 212 | 273 | |||||||||||||||||||||||||||||||
Total | 262 | 477 | 483 | 488 | 557 | |||||||||||||||||||||||||||||||
Average number of consultants (for the period): | ||||||||||||||||||||||||||||||||||||
Financial Consulting | 172 | 290 | 223 | 292 | 163 | 219 | 279 | 281 | 270 | |||||||||||||||||||||||||||
Operational Consulting | 90 | 187 | 132 | 207 | 84 | 142 | 206 | 199 | 243 | |||||||||||||||||||||||||||
Total | 262 | 477 | 355 | 499 | 247 | 361 | 485 | 480 | 513 | |||||||||||||||||||||||||||
Utilization rate(2): | ||||||||||||||||||||||||||||||||||||
Financial Consulting | 55.7 | % | 66.8 | % | 74.1 | % | 73.1 | % | 55.7 | % | 66.6 | % | 71.6 | % | 72.7 | % | 77.5 | % | ||||||||||||||||||
Operational Consulting | 60.5 | % | 65.0 | % | 69.3 | % | 72.0 | % | 60.5 | % | 65.3 | % | 73.0 | % | 72.5 | % | 75.0 | % | ||||||||||||||||||
Total | 57.3 | % | 66.1 | % | 72.4 | % | 72.6 | % | 57.3 | % | 66.1 | % | 72.2 | % | 72.6 | % | 76.3 | % | ||||||||||||||||||
Average billing rate per hour(3): | ||||||||||||||||||||||||||||||||||||
Financial Consulting | $ | 212 | $ | 233 | $ | 236 | $ | 252 | ||||||||||||||||||||||||||||
Financial Consulting(4) | 212 | 233 | 257 | 256 | 278 | |||||||||||||||||||||||||||||||
Operational Consulting | $ | 195 | $ | 189 | $ | 197 | $ | 219 | 195 | 191 | 218 | 216 | 226 | |||||||||||||||||||||||
Total | $ | 206 | $ | 217 | $ | 224 | $ | 238 | ||||||||||||||||||||||||||||
Total(4) | 206 | 217 | 239 | 238 | 252 | |||||||||||||||||||||||||||||||
| (1) | Consultants consist of our billable |
| (2) | We calculate the utilization rate for our consultants by dividing the number of hours all our consultants worked on client assignments during a period by the total available working hours for all of our consultants during the same period, assuming a forty-hour work week, less paid holidays and vacation days. |
(Footnotes continued on following page.)
34
Management’s discussion and analysis of financial condition and results of operations
| (3) | Average billing rate per hour is calculated by dividing revenues for a period by the number of hours worked on client assignments during the same period. |
41
Management’s discussion and analysis of financial condition and results of operations
| (4) | Included in the six months ended June 30, 2004 and the year ended December 31, 2004 was a $1.6 million success fee related to the completion of a series of asset sales transactions managed on behalf of a single Financial Consulting segment client over a two-year period. Excluding this success fee, the Financial Consulting average billing rate per hour for the six months ended June 30, 2004 and the year ended December 31, 2004 would have been $247 and $252, respectively. The total average billing rate per hour for the six months ended June 30, 2004 and the year ended December 31, 2004 would have been $234 and $236, respectively. |
Six months ended June 30, 20042005 compared to the six months ended June 30, 20032004
Revenues
Revenues increased $34.7$15.7 million, or 74.0%19.2%, to $97.3 million for the six months ended June 30, 2005 from $81.6 million for the six months ended June 30, 20042004. Revenues for the six months ended June 30, 2005 included $3.2 million of revenues generated by Speltz & Weis LLC. Revenues from $46.9time-and-expense engagements increased $15.3 million, or 23.2%, to $81.3 million for the six months ended June 30, 2003. Revenues2005 from time-and-expense engagements increased $25.6 million, or 63.4%, to $66.0 million for the six months ended June 30, 20042004. Revenues from $40.4fixed-fee engagements increased $4.0 million, or 40.0%, to $14.0 million for the six months ended June 30, 2003. Revenues2005 from fixed-fee engagements increased $4.7 million, or 88.7%, to $10.0 million for the six months ended June 30, 20042004. Revenues from $5.3performance-based engagements decreased $3.6 million, or 64.3%, to $2.0 million for the six months ended June 30, 2003. Revenues2005 from performance-based engagements increased $4.4 million, or 366.7%, to $5.6 million for the six months ended June 30, 2004 from $1.2 million for2004. Included in performance-based revenues in the six months ended June 30, 2003. Included in performance-based revenues for the 2004 period was a $1.6 million success fee recognized in the second quarter related to the completion of a series of asset sales transactions managed on behalf of a single financial consultingFinancial Consulting segment client over a two-year period.
The increase in revenues was reflective of accelerated hiring, an increase inOf the average billing rate per hour and a slight increase in our utilization rate. The overall $34.7$15.7 million increase in revenues, resulted from a $28.1$6.2 million increase in revenues attributable to an increase in billable hours associated with the hiring of additional consultants and a $6.6 million increase in revenueswas attributable to an increase in the average billing rate per hour. Thehour, $5.3 million was attributable to an increase in billable hours, and $4.2 million was attributable to an increase in our utilization rate. Our average number of consultantsbilling rate per hour increased 5.9% to 483$252 for the six months ended June 30, 20042005 from 299 for the six months ended June 30, 2003, as we added a substantial number of consultants during the third and fourth quarters of 2003 to meet growing demand for our services and position us for future growth. In addition, the average billing rate per hour increased to $238 for the six months ended June 30, 2004, from $224 foror $234 excluding the six months ended June 30, 2003.aforementioned success fee. Average billing rate per hour for any given period is calculated by dividing revenues for the period by the number of hours worked on client assignments during the same period. OurThe increase in billable hours was generated by new and existing client engagements, the hiring of additional consultants and increased usage of independent contractors. The average number of consultants increased to 513 for the six months ended June 30, 2005 from 480 for the six months ended June 30, 2004, as we added a substantial number of consultants in our Operational Consulting segment to meet growing demand for our services and 26 consultants through the Speltz & Weis LLC acquisition. Revenues generated by independent contractors increased $1.4 million, or 127.3%, to $2.5 million for the six months ended June 30, 2005 from $1.1 million for the same period last year. In addition, our utilization rate increased slightly to 76.3% for the six months ended June 30, 2005 from 72.6% for the six months ended June 30, 2004 from 72.4% for the six months ended June 30, 2003.2004.
DirectTotal direct costs
Our direct costs increased $18.3$5.1 million, or 62.5%10.7%, to $47.6$52.5 million in the six months ended June 30, 20042005 from $29.3$47.4 million in the six months ended June 30, 2003.2004. This increase in cost was primarily attributable to the increase in the average number of consultants described above.above and a $0.7 million increase in signing bonuses. We expect direct costs will increase in the near term as we focus primarily on hiring additional managers, associates and analysts to expand support for our existing practices and better leverage the managing directors and directors that we hiredhave hired.
Stock-based compensation expense increased to $2.2 million for the six months ended June 30, 2005 from $0.2 million for the same period last year due to the granting of restricted stock awards to our
35
Management’s discussion and analysis of financial condition and results of operations
consultants. On October 12, 2004, immediately prior to our initial public offering, we granted to our consultants a total of 489,500 shares of restricted common stock with an aggregate fair market value of $7.6 million. During the first six months of 2005, we granted to our consultants an additional 447,300 shares of restricted common stock with an aggregate fair market value of $9.1 million.
Total direct costs in 2003.the six months ended June 30, 2005 included $0.4 million of intangible assets amortization expense resulting from the Speltz & Weis LLC acquisition. Customer contracts valued at $1.9 million are being amortized over a weighted-average life of 8.4 months.
Operating expenses
Selling, general and administrative expenses increased $6.7$5.2 million, or 60.4%29.1%, to $23.0 million in the six months ended June 30, 2005 from $17.8 million in the six months ended June 30, 2004. The increase was due in part to an increase in the average number of non-billable professionals to 134 for the six months ended June 30, 2005 from 105 for the six months ended June 30, 2004 from $11.1and their related compensation and benefit costs of $10.4 million in the six months ended June 30, 2005 compared to $7.9 million in the six months ended June 30, 2004. We added a number of non-billable professionals during the past year in preparation for, and to continue to support, a public company infrastructure. The remaining increase in selling, general and administrative costs in the six months ended June 30, 2005 compared to the same period in the prior year was due to increases in training and recruiting costs, rent and other facility costs, promotion and marketing costs, and new costs associated with being a public company, including Sarbanes-Oxley compliance. This increase was partially offset by lower severance charges as compared to the six months ended June 30, 2004, when we recorded $0.6 million of such charges. We expect operating expenses will increase in the future in response to ongoing growth in our business activity. In addition, we expect to incur approximately $1.0 million in expenses during the third quarter of 2005 in connection with hosting two client development-oriented conferences.
Stock-based compensation expense totaled $0.9 million for the six months ended June 30, 2005 due to the granting of restricted stock awards to our non-billable professionals. On October 12, 2004, immediately prior to our initial public offering, we granted to our non-billable professionals a total of 278,200 shares of restricted common stock with an aggregate fair market value of $4.3 million. During the first six months of 2005, we granted to our non-billable professionals an additional 109,800 shares of restricted common stock with an aggregate fair market value of $2.3 million.
Depreciation expense increased $0.8 million, or 72.7%, to $1.9 million in the six months ended June 30, 2005 from $1.1 million in the six months ended June 30, 2004 as computers, network equipment, furniture and fixtures, and leasehold improvements were added to support our increase in employees. In the six months ended June 30, 2005, we recognized $0.1 million of intangible assets amortization. In conjunction with the Speltz & Weis LLC acquisition, we recorded $0.7 million of intangible assets representing customer relationships, which is being amortized over a weighted-average life of 15.1 months.
Operating expenses in the six months ended June 30, 2004 also included a $2.1 million pre-tax restructuring charge associated with the closing of two small, underperforming offices in Miami, Florida and Palo Alto, California. The charge consisted of approximately $2.0 million for severance payments for the ten employees formerly employed at these locations, which were paid by April 30, 2004, and $0.1 million for office lease payments, which were paid by August 31, 2004.
Operating income
Operating income increased $3.4 million, or 26.1%, to $16.4 million for the six months ended June 30, 2005 from $13.0 million for the six months ended June 30, 2004. Operating income for the six months ended June 30, 2004 included $1.3 million associated with the aforementioned $1.6 million success fee
36
Management’s discussion and analysis of financial condition and results of operations
recorded in the period. The increase in operating income was primarily due to the increase in revenues, partially offset by the increases in direct costs and operating expenses as discussed above. Operating margin, which is defined as operating income expressed as a percentage of revenues, increased to 16.8% in the six months ended June 30, 2005 compared to 15.9% in the six months ended June 30, 2004. The 2004 success fee had an approximately one percentage point favorable impact on operating margin.
Net income attributable to common stockholders
Net income attributable to common stockholders increased $2.8 million, or 42.1%, to $9.5 million for the six months ended June 30, 2005 from $6.7 million for the six months ended June 30, 2004. Diluted earnings per share increased 21.3% to $0.57 for the six months ended June 30, 2005 from $0.47 for the comparable period last year. Diluted earnings per share attributable to the Speltz & Weis LLC acquisition was $0.01 for the six months ended June 30, 2005, net of the amortization of intangible assets, which was $0.5 million pre-tax or $0.3 million after-tax, or $0.02 per share. The 21.3% increase in diluted earnings per share was primarily due to higher earnings, partially offset by additional shares issued during the initial public offering.
Pursuant to a registration rights agreement with HCG Holdings LLC, we are required to pay the expenses relating to this offering, excluding the underwriting discounts and commissions which will be borne by the selling stockholders. These expenses will have an approximately $ million impact on our net income, and will reduce our earnings per share, for the remainder of the year.
Segment results
Financial Consulting
Revenues
Financial Consulting segment revenues, which includes revenues generated by Speltz & Weis LLC since the date of the acquisition, increased $5.4 million, or 11.1%, to $54.4 million for the six months ended June 30, 2005 from $49.0 million for the six months ended June 30, 2004. Revenues from time-and-expense engagements increased $7.3 million, or 16.4%, to $51.7 million for the six months ended June 30, 2005 from $44.4 million for the six months ended June 30, 2004. Revenues from fixed-fee engagements decreased $0.3 million, or 10.0%, to $2.7 million for the six months ended June 30, 2005 from $3.0 million for the six months ended June 30, 2004. There were no revenues from performance-based engagements for the six months ended June 30, 2005 as compared to $1.6 million for the six months ended June 30, 2004, which consisted of fees recognized relating to the successful completion of a series of asset sales transactions managed on behalf of a single client over a two-year period.
Of the overall $5.4 million increase in revenues, $4.4 million was attributable to an increase in the average billing rate per hour and $3.1 million was attributable to an increase in our utilization rate, partially offset by a $2.1 million decrease in revenues attributable to a decrease in billable hours. The average billing rate per hour increased 8.6% to $278 for the six months ended June 30, 2005 from $256 for the six months ended June 30, 2004, or $247 excluding the aforementioned success fee. In addition, our utilization rate increased to 77.5% for the six months ended June 30, 2005 from 72.7% for the six months ended June 30, 2004. The decrease in billable hours was due to a decrease in the average number of consultants from 281 for the six months ended June 30, 2004 to 270 for the six months ended June 30, 2005. This decrease was partially offset by an increase in billable hours generated by independent contractors. Independent contractor revenues increased $0.7 million, or 350.0%, to $0.9 million for the six months ended June 30, 2005 from $0.2 million for the same period last year.
37
Management’s discussion and analysis of financial condition and results of operations
Operating income
Financial Consulting segment operating income increased $3.2 million, or 17.0%, to $22.4 million in the six months ended June 30, 2005 from $19.2 million in the six months ended June 30, 2004. Operating income associated with the $1.6 million success fee recognized in the second quarter of 2004 was $1.3 million. Segment operating margin, defined as segment operating income expressed as a percentage of segment revenues, increased to 41.2% in the six months ended June 30, 2005 from 39.1% in the six months ended June 30, 2004. The 2004 success fee had an approximately one percentage point favorable impact on operating margin.
Operational Consulting
Revenues
Operational Consulting segment revenues increased $10.2 million, or 31.4%, to $42.8 million for the six months ended June 30, 2005 from $32.6 million for the six months ended June 30, 2004. Revenues from time-and-expense engagements increased $7.9 million, or 36.6%, to $29.5 million for the six months ended June 30, 2005 from $21.6 million for the six months ended June 30, 2004. Revenues from fixed-fee engagements increased $4.3 million, or 61.4%, to $11.3 million for the six months ended June 30, 2005 from $7.0 million for the six months ended June 30, 2004. Revenues from performance-based engagements decreased $2.0 million, or 50.0%, to $2.0 million for the six months ended June 30, 2005 from $4.0 million for the six months ended June 30, 2004.
Of the overall $10.2 million increase in revenues, $7.4 million was attributable to an increase in billable hours, $1.8 million was attributable to an increase in the average billing rate per hour, and $1.0 million was attributable to an increase in our utilization rate. The increase in billable hours was generated by new and existing client engagements, the hiring of additional consultants and increased usage of independent contractors. The average number of consultants increased to 243 for the six months ended June 30, 2005 from 199 for the six months ended June 30, 2004, as we added a substantial number of consultants over the past year to meet growing demand for our services. Independent contractor revenues increased $0.9 million, or 112.5%, to $1.7 million for the six months ended June 30, 2005 from $0.8 million for the same period last year. The average billing rate per hour increased 4.6% to $226 for the six months ended June 30, 2005 from $216 for the same period last year. In addition, our utilization rate increased to 75.0% for the six months ended June 30, 2005 from 72.5% for the six months ended June 30, 2004.
Operating income
Operational Consulting segment operating income increased $4.7 million, or 40.9%, to $16.0 million for the six months ended June 30, 2005 from $11.3 million for the six months ended June 30, 2004. Segment operating margin increased to 37.3% in the six months ended June 30, 2005 compared to 34.8% in the same period last year.
Year ended December 31, 2004 compared to year ended December 31, 2003
Revenues
Revenues increased $58.1 million, or 57.2%, to $159.6 million for the year ended December 31, 2004 from $101.5 million for the year ended December 31, 2003. Revenues from time-and-expense engagements increased $46.5 million, or 54.0%, to $132.6 million for the year ended December 31, 2004 from $86.1 million for the year ended December 31, 2003. Revenues from fixed-fee engagements increased $6.7 million, or 55.4%, to $18.8 million for the year ended December 31, 2004 from $12.1
38
Management’s discussion and analysis of financial condition and results of operations
million for the year ended December 31, 2003. Revenues from performance-based engagements increased $4.9 million, or 148.5%, to $8.2 million for the year ended December 31, 2004 from $3.3 million for the year ended December 31, 2003.
The overall $58.1 million increase in revenues resulted from a $32.3 million increase in revenues attributable to an increase in billable hours associated with new and existing client engagements and the hiring of additional consultants, a $16.7 million increase in revenues attributable to an increase in the average billing rate per hour and a $9.1 million increase in revenues attributable to an increase in our utilization rate. The average number of consultants increased to 485 for the year ended December 31, 2004 from 361 for the year ended December 31, 2003 as we added a substantial number of consultants during the second half of 2003 to meet growing demand for our services and position us for future growth. The average billing rate per hour increased 10.1% to $239 for the year ended December 31, 2004 from $217 for the year ended December 31, 2003. In addition, our utilization rate increased to 72.2% for the year ended December 31, 2004 from 66.1% in the year ended December 31, 2003.
Total direct costs
Our direct costs increased $22.9 million, or 33.0%, to $92.3 million in the year ended December 31, 2004 from $69.4 million in the year ended December 31, 2003. This increase in cost was primarily attributable to the increase in the average number of consultants described above.
Stock-based compensation expense increased to $1.0 million primarily due to the issuance of employee stock option awards with a higher intrinsic value during the first quarter of 2004 and the granting of restricted common stock awards to our consultants. On October 12, 2004, immediately prior to our initial public offering, we granted to our consultants a total of 489,500 shares of restricted common stock with an aggregate fair market value of $7.6 million.
Operating expenses
Selling, general and administrative expenses increased $15.2 million, or 60.3%, to $40.4 million in the year ended December 31, 2004 from $25.2 million in the year ended December 31, 2003. The increase was due in part to an increase in the average number of non-billable professionals to 105113 for the six monthsyear ended June 30,December 31, 2004 from 6576 for the six monthsyear ended June 30,December 31, 2003 and their related compensation and benefit costs of $7.9$16.5 million in the six monthsyear ended June 30,December 31, 2004 compared to $4.2$9.0 million in the six monthsyear ended June 30,December 31, 2003. The six monthsSelling, general and administrative expenses in the year ended June 30,December 31, 2004 also included $0.6severance charges totaling $1.8 million in employee severanceas we eliminated the positions of certain managing directors and anticipated litigation settlementother senior level consultants. Severance charges recorded inincluded the second quarter.settling of contractual obligations with certain managing directors. The remaining increase in selling, general and administrative costsexpenses in the six months ended June 30, 2004 compared to the same period in the prior year2003 was due to increases in rent and other facility costs, promotion and marketing costs, and other administrative costs associated with the general growth in business activity. We expect operating expenses will increase in the future in response to ongoing growth inour business activity, and newas well as costs associated with beingincurred to establish an infrastructure to support a public company.
Stock-based compensation expense totaled $0.4 million for the year ended December 31, 2004 due to the granting of restricted stock awards to our non-billable professionals. On October 12, 2004, immediately prior to our initial public offering, we granted to our non-billable professionals a total of 278,200 shares of restricted common stock with an aggregate fair market value of $4.3 million.
Depreciation expense increased $0.8 million, or 50.0%, to $2.4 million in the year ended December 31, 2004 from $1.6 million in the year ended December 31, 2003 as computers, furniture and fixtures, and leasehold improvements were added to support our increase in employees. There was no amortization expense in 2004 compared to $3.7 million in the year ended December 31, 2003. The amortization
4239
Management’s discussion and analysis of financial condition and results of operations
Depreciation expense increased $0.5 million to $1.1 million in the six months ended June 30, 2004 from $0.6 million in the six months ended June 30, 2003 as computers and leasehold improvements were added to support our increase in employees. There was no amortization expense in the six months ended June 30, 2004 compared2003 related to $2.1 million in the six months ended June 30, 2003. The decrease in amortization expense in the six months ended June 30, 2004 was due to the amortization of the $5.5 million in intangible costs paid in 2002 to obtain the release of certain of our employees from non-competition agreements with Arthur Andersen LLP, their former employer, and the related assumption of $0.8 million in liabilities, both of which were fully amortized by December 31, 2003.
Other operatingOperating expenses in the six months ended June 30, 2004 consisted ofincluded a $2.1 million pre-tax restructuring charge associated with the closing of two small, underperforming offices in Miami, Florida and Palo Alto, California. The charge consisted of approximately $2.0 million for severance payments for the ten employees formerly employed at these locations, which were paid by April 30, 2004, and an accrual of $0.1 million for office lease payments, which were paid by August 31, 2004. Three of the ten employees had contracts guaranteeing them base salary and bonus if terminated under certain circumstances.
In September 2004,We also incurred a $1.3 million pre-tax restructuring charge as we decided to eliminate a service offering of a practice area in our operational consultingthe Operational Consulting segment that was not meeting our expectations. Additionally, in a continual effort to streamline our operations and allocate resources more appropriately, we reduced our headcount in certain other practice areas across both segments. As such, we expect third quarter 2004
Other operating expenses to include charges of approximately $2.1 million for severance payments. In connection with these actions, we expect to realize cost savings over the next twelve months of approximately $3.5 million principally from compensation savings beginning in the fourth quarteryear ended December 31, 2003 consisted of 2004. We expect that these cost savings will to some extent be offset by some related lost service offering revenue and additional costs as we increase headcount in other practice areas.a $1.7 million charge for the loss associated with the abandonment of an office lease.
Operating income (loss)
Operating income increased $9.2in the year ended December 31, 2004 was $19.7 million or 242.1%,compared to $13.0an operating loss of $0.2 million in the six monthsyear ended June 30, 2004 from $3.8 millionDecember 31, 2003. The increase in operating income was primarily due to revenue growing at a higher rate as compared to the six months ended June 30, 2003, primarily as a result of the changesgrowth in revenues, direct costs and operating expenses discussed above.expenses. Operating margin which is defined as operating income expressed as a percentage of revenues, increased to 15.9%was 12.2% in the six monthsyear ended June 30, 2004 from 8.1% in the six months ended June 30, 2003.December 31, 2004.
Segment results
Financial Consulting
Revenues
Financial Consulting segment revenues increased $17.3$24.4 million, or 51.6%35.8%, to $50.8$92.4 million for the six monthsyear ended June 30,December 31, 2004 from $33.5$68.0 million for the six monthsyear ended June 30,December 31, 2003. Revenues from time-and-expense engagements increased $15.6$22.5 million, or 51%36.2%, to $46.2$84.7 million for the six monthsyear ended June 30,December 31, 2004 from $30.6$62.2 million for the six monthsyear ended June 30,December 31, 2003. Revenues from fixed-fee engagements increased $0.4$1.1 million, or 15.4%22.4%, to $3.0$6.0 million for the six monthsyear ended June 30,December 31, 2004 from $2.6$4.9 million for the six monthsyear ended June 30,December 31, 2003. Revenues from performance-based engagements increased $1.3$0.8 million, or 433.3%88.9%, to $1.6$1.7 million for the six monthsyear ended June 30,December 31, 2004 from $0.3$0.9 million for the six monthsyear ended June 30,December 31, 2003. Performance-based fee revenues for the six monthsyear ended June 30,December 31, 2004 consisted of feesa $1.6 million success fee recognized in the second quarter of 2004 relating to the successful completion of a series of asset salessale transactions managed on behalf of a single client over a two-year period.
43
Management’s discussion and analysis of financial condition and results of operations
The overall $17.3$24.4 million increase in revenues resulted from a $14.4$10.8 million increase in revenues attributable to an increase in billable hours associated with new and existing client engagements and the hiring of additional consultants, and a $3.4$8.5 million increase in revenues attributable to an increase in the average billing rate per hour which were partially offset byand a $0.5$5.1 million decreaseincrease in revenues attributable to a decreasean increase in our utilization rate. The average number of consultants increased to 308279 for the six monthsyear ended June 30,December 31, 2004 from 206219 for the six monthsyear ended June 30,December 31, 2003 as we added a substantial number of consultants across all of our practices to meet growing demand for our services. The average billing rate per hour increased 10.3% to $252$257 for the six monthsyear ended June 30,December 31, 2004 from $236$233 for the six monthsyear ended June 30,December 31, 2003. The increased headcount and average billing rate per hour were partially offset by a decrease inIn addition, our utilization rate increased to 73.1%71.6% for the six monthsyear ended June 30,December 31, 2004 from 74.1%66.6% for the six monthsyear ended June 30,December 31, 2003.
40
Management’s discussion and analysis of financial condition and results of operations
Operating income
Financial Consulting segment operating income increased $7.4$13.8 million, or 57.4%66.8%, to $20.3$34.4 million in the six monthsyear ended June 30,December 31, 2004 from $12.9$20.6 million in the six monthsyear ended June 30,December 31, 2003. Operating income associated with the $1.6 million success fee recognized in the second quarter of 2004 was $1.3 million. Segment operating margin defined as segment operating income expressed as a percentage of segment revenues, increasedimproved to 39.9%37.2% in the six monthsyear ended June 30,December 31, 2004 from 38.6%30.3% in the six monthsyear ended June 30,December 31, 2003, primarily as a result of the increase in revenues discussed above, partially offset by an increase in direct costs and selling, general and administrative expenses.in 2004.
Operational Consulting
Revenues
Operational Consulting segment revenues increased $17.4$33.7 million, or 129.9%100.8%, to $30.8$67.2 million for the six monthsyear ended June 30,December 31, 2004 from $13.4$33.5 million for the six monthsyear ended June 30,December 31, 2003. Revenues from time-and-expense engagements increased $10.0$24.0 million, or 102.0%100.4%, to $19.8$47.9 million for the six monthsyear ended June 30,December 31, 2004 from $9.8$23.9 million for the six monthsyear ended June 30,December 31, 2003. Revenues from fixed-fee engagements increased $4.3$5.6 million, or 159.3%77.8%, to $7.0$12.8 million for the six monthsyear ended June 30,December 31, 2004 from $2.7$7.2 million for the six monthsyear ended June 30,December 31, 2003. Revenues from performance-based engagements increased $3.1$4.1 million, or 344.4%170.8%, to $4.0$6.5 million for the six monthsyear ended June 30,December 31, 2004 from $0.9$2.4 million for the six monthsyear ended June 30,December 31, 2003.
Of theThe overall $17.4$33.7 million increase in revenues $13.7resulted from a $21.5 million wasincrease in revenues attributable to an increase in billable hours associated with new and existing client engagements and the hiring of additional consultants, $3.2a $8.3 million wasincrease in revenues attributable to an increase in the average billing rate per hour and $0.5a $3.9 million wasincrease in revenues attributable to an increase in our utilization rate. The average number of consultants increased to 201206 for the six monthsyear ended June 30,December 31, 2004 from 112142 for the six monthsyear ended June 30, 2003 as we added a substantial number of consultants across all of our practices to meet growing demand for our services.December 31, 2003. The average billing rate per hour increased 14.1% to $219$218 for the six monthsyear ended June 30,December 31, 2004 from $197$191 for the six monthsyear ended June 30,December 31, 2003. In addition, ourOur utilization rate increased to 72.0%of 73.0% for the six monthsyear ended June 30,December 31, 2004 was up from 69.3%65.3% for the six monthsyear ended June 30,December 31, 2003.
Operating income
Operational Consulting segment operating income increased $7.2$16.2 million, or 240.0%238.7%, to $10.2$23.0 million in the six monthsyear ended June 30,December 31, 2004 from $3.0$6.8 million in the six monthsyear ended June 30,December 31, 2003. Segment operating margin increased to 33.3%34.3% in the six monthsyear ended June 30,December 31, 2004 from 22.6%20.3% in the six monthsyear ended June 30,December 31, 2003, primarily as a result ofdue to the increase in revenues discussed above, partially offset by an increase in direct costs in 2004, as well as investments made during 2003 to start a new practice and selling, general and administrative expenses.expand our capabilities in an existing practice in this segment.
44
Management’s discussion and analysis of financial condition and results of operations
Year ended December 31, 2003 compared to period from March 19, 2002 (inception) through December 31, 2002
Revenues
Revenues increased $66.4 million, or 189.2%, to $101.5 million for the year ended December 31, 2003 from $35.1 million for the partial year ended December 31, 2002. Revenues from time-and-expense engagements increased $55.6 million, or 182.3%, to $86.1 million for the year ended December 31, 2003 from $30.5 million for the partial year ended December 31, 2002. Revenues from fixed-fee engagements increased $8.0 million, or 195.1%, to $12.1 million for the year ended December 31, 2003 from $4.1 million for the partial year ended December 31, 2002. Revenues from performance-based engagements increased $2.8 million to $3.3 million for the year ended December 31, 2003 from $0.5 million for the partial year ended December 31, 2002.
41
Management’s discussion and analysis of financial condition and results of operations
The overall $66.4 million increase in revenues resulted from a $55.9 million increase in revenues attributable to an increase in billable hours associated with the hiring of additional consultants and 2003 having twelve months of operations versus the first eight months of our operations in the 2002 period, a $5.1 million increase in revenues attributable to an increase in the average billing rate per hour and a $5.4 million increase in revenues attributable to an increase in our utilization rate. The average number of consultants increased to 365361 for the year ended December 31, 2003 from 247 for the partial year ended December 31, 2002 as we added a substantial number of consultants across all of our practices to meet growing demand for our services. The average billing rate per hour increased to $217 for the year ended December 31, 2003 from $206 for the partial year ended December 31, 2002. In addition, our utilization rate increased to 66.1% for the year ended December 31, 2003 from 57.3% in the partial year ended December 31, 2002. Utilization for the year ended December 31, 2003 was influenced by two large time-sensitive engagements involving a large number of consultants.
DirectTotal direct costs
Our direct costs increased $43.3 million, or 165.9%, to $69.4 million in the year ended December 31, 2003 from $26.1 million in the partial year ended December 31, 2002. This increase in cost was primarily attributable to the increase in the average number of consultants described above.
Operating expenses
Selling, general and administrative expenses increased $16.4 million, or 186.4%, to $25.2 million in the year ended December 31, 2003 from $8.8 million in the partial year ended December 31, 2002. The increase was due in part to an increase in the average number of non-billable professionals to 76 for the year ended December 31, 2003 from 45 for the partial year ended December 31, 2002 and their related compensation and benefit costs of $9.0 million in the year ended December 31, 2003 compared to $3.2 million in the partial year ended December 31, 2002. Office and equipment rentals increased to $4.5 million in the year ended December 31, 2003 from $1.1 million in the partial year ended December 31, 2002 as a result of increased office space and other facility costs associated with our quickly growing consultant and administrative workforce.
Depreciation expense increased $1.2 million to $1.6 million in the year ended December 31, 2003 from $0.4 million in the partial year ended December 31, 2002 as we added computers and leasehold improvements during 2003 to support our increase in employees. Amortization expense increased $1.1 million to $3.7 million in the year ended December 31, 2003 from $2.6 million in the partial year ended December 31, 2002. The increase in amortization expense was due to the amortization of the $5.5 million in intangible costs paid in 2002 to obtain the release of certain of our employees from non-competition agreements with Arthur Andersen LLP, their former employer, and the related assumption of $0.8 million in liabilities, both of which were fully amortized by December 31, 2003.
45
Management’s discussion and analysis of financial condition and results of operations
Other operatingOperating expenses in the year ended December 31, 2003 consisted ofincluded a $1.7 million charge for the loss associated with the abandonment of an office lease whilelease. Operating expenses in the partial year ended December 31, 2002 consisted ofincluded a $2.5 million expense related to management fees paid to an affiliate of Lake Capital Partners LP, which along with Lake Capital Management LLC controls our parent, HCG Holdings LLC, a $0.2 million expense related to advisory fees paid to an affiliate of PPM America, Inc., which is a member of HCG Holdings LLC, and $1.0 million in other organization costs associated with the formation of our company.
Operating loss
The operating loss for the year ended December 31, 2003 amounted to $0.2 million as compared to an operating loss of $6.5 million for the partial year ended December 31, 2002.
42
Management’s discussion and analysis of financial condition and results of operations
Segment results
Financial Consulting
Revenues
Financial Consulting segment revenues increased $47.5$45.6 million, or 212.1%203.7%, to $69.9$68.0 million for the year ended December 31, 2003 from $22.4 million for the partial year ended December 31, 2002. Revenues from time-and-expense engagements increased $44.4$42.4 million, or 224.2%214.1%, to $64.2$62.2 million for the year ended December 31, 2003 from $19.8 million for the partial year ended December 31, 2002. Revenues from fixed-fee engagements increased $2.3 million, or 88.5%, to $4.9 million for the year ended December 31, 2003 from $2.6 million for the partial year ended December 31, 2002. Revenues from performance-based engagements were $0.8$0.9 million for the year ended December 31, 2003, and there were no revenues from performance-based engagements in 2002.
The overall $47.5$45.6 million increase in revenues resulted from a $36.9$35.2 million increase in revenues attributable to an increase in billable hours associated with the hiring of additional consultants and 2003 having twelve months of operations versus the first eight months of our operations in the 2002 period, a $6.1$6.0 million increase in revenues attributable to an increase in the average billing rate per hour and a $4.5$4.4 million increase in revenues attributable to an increase in our utilization rate. The average number of consultants increased to 227219 for the year ended December 31, 2003 from 163 for the partial year ended December 31, 2002 as we added a substantial number of consultants across all of our practices to meet growing demand for our services. The average billing rate per hour increased to $233 for the year ended December 31, 2003 from $212 for the partial year ended December 31, 2002. In addition, our utilization rate of 66.8%66.6% for the year ended December 31, 2003 was up from 55.7% for the partial year ended December 31, 2002.
Operating income
Financial Consulting segment operating income increased $18.1$16.7 million, or 464.1%426.6%, to $22.0$20.6 million in the year ended December 31, 2003 from $3.9 million in the partial year ended December 31, 2002. Segment operating margin improved to 31.5%30.3% in the year ended December 31, 2003 from 17.5% in the partial year ended December 31, 2002 due to increased revenues and improved utilization rates of 66.8%66.6% for the year ended December 31, 2003 from 55.7% for the partial year ended December 31, 2002.
Operational Consulting
Revenues
Operational Consulting segment revenues increased $18.8$20.8 million, or 148.0%163.4%, to $31.5$33.5 million for the year ended December 31, 2003 from $12.7 million for the partial year ended December 31, 2002.
46
Management’s discussion and analysis of financial condition and results of operations
Revenues from time-and-expense engagements increased $11.2$13.2 million, or 104.7%123.4%, to $21.9$23.9 million for the year ended December 31, 2003 from $10.5$10.7 million for the partial year ended December 31, 2002. Revenues from fixed-fee engagements increased $5.7 million to $7.2 million for the year ended December 31, 2003 from $1.5 million for the partial year ended December 31, 2002. Revenues from performance-based engagements increased $1.9 million to $2.4 million for the year ended December 31, 2003 from $0.5 million for the partial year ended December 31, 2002.
The overall $18.8$20.8 million increase in revenues resulted from an $18.8$20.4 million increase in revenues attributable to an increase in billable hours associated with the hiring of additional consultants and 2003 having twelve months of operations versus the first eight months of our operations in the 2002 period and a $1.0 million increase in revenues attributable to an increase in our utilization rate, which were partially offset by a $1.0$0.6 million decrease in revenues attributable to a decrease in the average billing rate per hour. The average number of consultants increased to 138142 for the year ended December 31, 2003
43
Management’s discussion and analysis of financial condition and results of operations
from 84 for the partial year ended December 31, 2002. Our utilization rate of 65.0%65.3% for the year ended December 31, 2003 was up from 60.5% for the partial year ended December 31, 2002. The average billing rate per hour decreased to $189$191 for the year ended December 31, 2003 from $195 for the partial year ended December 31, 2002.
Operating income
Operational Consulting segment operating income increased $1.9$3.3 million, or 54.3%92.6%, to $5.4$6.8 million in the year ended December 31, 2003 from $3.5 million in the partial year ended December 31, 2002. Segment operating margin decreased to 17.1%20.3% in the year ended December 31, 2003 from 27.8% in the partial year ended December 31, 2002 primarily due to investments made during 2003 to start a new practice and expand our capabilities in an existing practice in this segment. A total of 38 consultants were hired for the new and expanded practices during the course of 2003 and revenue generation lagged our investments in payroll and sales and marketing costs.
4744
Management’s discussion and analysis of financial condition and results of operations
Selected quarterly consolidated financial and other operating data
The following table sets forth selected unaudited quarterly operating information for each of the nineten quarters during the period from AprilJanuary 1, 20022003 to June 30, 2004. We did not have any operations during the period from March 19, 2002 (inception) to March 31, 2002.2005. The following quarterly consolidated financial data has been prepared on the same basis as, and should be read together with, the auditedconsolidated financial statements and related notes contained elsewhere in this prospectus and includesreflects all adjustments of a normal recurring adjustmentsnature necessary for the fair presentation of the information for the periods presented. Results for any fiscal quarter are not necessarily indicative of results for the full year or for any future quarter.
| Three months ended | ||||||||||||||||||||||||||||||||||||
| Consolidated quarterly financial data: | June 30, 2002 | Sep. 30, 2002 | Dec. 31, 2002 | Mar. 31, 2003 | June 30, 2003 | Sep. 30, 2003 | Dec. 31, 2003 | Mar. 31, 2004 | June 30, 2004 | |||||||||||||||||||||||||||
(unaudited) (in thousands, except other operating data amounts) | ||||||||||||||||||||||||||||||||||||
Revenues and reimbursable expenses: | ||||||||||||||||||||||||||||||||||||
Revenues | $ | 6,320 | $ | 12,994 | $ | 15,787 | $ | 23,212 | $ | 23,711 | $ | 25,549 | $ | 29,014 | $ | 40,101 | $ | 41,503 | ||||||||||||||||||
Reimbursable expenses | 478 | 1,063 | 1,380 | 2,069 | 1,837 | 2,105 | 2,797 | 3,443 | 3,647 | |||||||||||||||||||||||||||
Total revenues and reimbursable expenses | 6,798 | 14,057 | 17,167 | 25,281 | 25,548 | 27,654 | 31,811 | 43,544 | 45,150 | |||||||||||||||||||||||||||
Direct costs and reimbursable expenses: | ||||||||||||||||||||||||||||||||||||
Direct costs | 5,417 | 9,909 | 10,729 | 13,581 | 15,739 | 19,055 | 21,026 | 24,868 | 22,723 | |||||||||||||||||||||||||||
Reimbursable expenses | 478 | 1,063 | 1,380 | 2,069 | 1,848 | 2,138 | 2,874 | 3,523 | 3,542 | |||||||||||||||||||||||||||
Total direct costs and reimbursable expenses | 5,895 | 10,972 | 12,109 | 15,650 | 17,587 | 21,193 | 23,900 | 28,391 | 26,265 | |||||||||||||||||||||||||||
Gross profit | 903 | 3,085 | 5,058 | 9,631 | 7,961 | 6,461 | 7,911 | 15,153 | 18,885 | |||||||||||||||||||||||||||
Operating expenses: | ||||||||||||||||||||||||||||||||||||
Selling general and administrative expenses | 1,538 | 3,485 | 3,790 | 4,826 | 6,267 | 6,616 | 7,476 | 8,158 | 9,682 | |||||||||||||||||||||||||||
Depreciation and amortization expense | 602 | 1,166 | 1,280 | 1,290 | 1,368 | 1,492 | 1,178 | 603 | 472 | |||||||||||||||||||||||||||
Other operating expenses | 2,168 | 1,425 | 122 | — | — | 1,668 | — | 2,139 | — | |||||||||||||||||||||||||||
Total operating expenses | 4,308 | 6,076 | 5,192 | 6,116 | 7,635 | 9,776 | 8,654 | 10,900 | 10,154 | |||||||||||||||||||||||||||
Operating (loss) income | (3,405 | ) | (2,991 | ) | (134 | ) | 3,515 | 326 | (3,315 | ) | (743 | ) | 4,253 | 8,731 | ||||||||||||||||||||||
Other expense | — | 133 | 200 | 199 | 331 | 217 | 221 | 245 | 270 | |||||||||||||||||||||||||||
(Loss) income before (benefit) provision for income taxes | (3,405 | ) | (3,124 | ) | (334 | ) | 3,316 | (5 | ) | (3,532 | ) | (964 | ) | 4,008 | 8,461 | |||||||||||||||||||||
(Benefit) provision for income taxes | (1,362 | ) | (1,236 | ) | (99 | ) | 1,375 | 76 | (1,367 | ) | (206 | ) | 1,661 | 3,576 | ||||||||||||||||||||||
Net (loss) income | (2,043 | ) | (1,888 | ) | (235 | ) | 1,941 | (81 | ) | (2,165 | ) | (758 | ) | 2,347 | 4,885 | |||||||||||||||||||||
Accrued dividends on 8% preferred stock | 135 | 255 | 256 | 253 | 263 | 275 | 275 | 273 | 285 | |||||||||||||||||||||||||||
Net (loss) income attributable to common stockholders | $ | (2,178 | ) | $ | (2,143 | ) | $ | (491 | ) | $ | 1,688 | $ | (344 | ) | $ | (2,440 | ) | $ | (1,033 | ) | $ | 2,074 | $ | 4,600 | ||||||||||||
| Other operating data: | ||||||||||||||||||||||||||||||||||||
Number of consultants (at period end)(1) | 236 | 255 | 262 | 294 | 355 | 449 | 477 | 483 | 499 | |||||||||||||||||||||||||||
Utilization rate(2) | 49.6 | % | 53.7 | % | 64.6 | % | 75.8 | % | 69.4 | % | 60.6 | % | 62.7 | % | 73.4 | % | 71.8 | % | ||||||||||||||||||
Average billing rate per hour(3) | $ | 211 | $ | 207 | $ | 202 | $ | 228 | $ | 220 | $ | 215 | $ | 210 | $ | 229 | $ | 248 | ||||||||||||||||||
| Three months ended | ||||||||||||||||||||||||||||||||||||||||
Mar. 31, 2003 | June 30, 2003 | Sep. 30, 2003 | Dec. 31, 2003 | Mar. 31, 2004 | June 30, 2004 | Sep. 30, 2004 | Dec. 31, 2004 | Mar. 31, 2005 | June 30, 2005 | |||||||||||||||||||||||||||||||
| (unaudited) | ||||||||||||||||||||||||||||||||||||||||
| (in thousands, except other operating data) | ||||||||||||||||||||||||||||||||||||||||
Consolidated quarterly financial data: |
| |||||||||||||||||||||||||||||||||||||||
Revenues | $ | 23,212 | $ | 23,711 | $ | 25,549 | $ | 29,014 | $ | 40,101 | $ | 41,503 | $ | 37,109 | $ | 40,837 | $ | 46,760 | $ | 50,517 | ||||||||||||||||||||
Reimbursable expenses | 2,069 | 1,837 | 2,105 | 2,797 | 3,443 | 3,647 | 3,225 | 4,046 | 4,370 | 4,691 | ||||||||||||||||||||||||||||||
Total revenues and reimbursable expenses | 25,281 | 25,548 | 27,654 | 31,811 | 43,544 | 45,150 | 40,334 | 44,883 | 51,130 | 55,208 | ||||||||||||||||||||||||||||||
Direct costs and reimbursable expenses (exclusive of depreciation and amortization shown in operating expenses)(1): | ||||||||||||||||||||||||||||||||||||||||
Direct costs | 13,581 | 15,739 | 19,037 | 21,017 | 24,856 | 22,549 | 22,267 | 22,598 | 24,945 | 27,514 | ||||||||||||||||||||||||||||||
Stock-based compensation | — | — | 18 | 9 | 12 | 174 | 144 | 648 | 999 | 1,240 | ||||||||||||||||||||||||||||||
Intangible assets amortization | — | — | — | — | — | — | — | — | — | 385 | ||||||||||||||||||||||||||||||
Reimbursable expenses | 2,069 | 1,848 | 2,138 | 2,874 | 3,523 | 3,542 | 3,161 | 4,055 | 4,387 | 4,704 | ||||||||||||||||||||||||||||||
Total direct costs and reimbursable expenses | 15,650 | 17,587 | 21,193 | 23,900 | 28,391 | 26,265 | 25,572 | 27,301 | 30,331 | 33,843 | ||||||||||||||||||||||||||||||
Operating expenses: | ||||||||||||||||||||||||||||||||||||||||
Selling, general and administrative | 4,826 | 6,267 | 6,607 | 7,471 | 8,156 | 9,624 | 10,631 | 12,014 | 11,312 | 11,650 | ||||||||||||||||||||||||||||||
Stock-based compensation | — | — | 9 | 5 | 2 | 58 | 53 | 320 | 411 | 456 | ||||||||||||||||||||||||||||||
Depreciation and amortization | 1,290 | 1,368 | 1,492 | 1,178 | 603 | 472 | 607 | 683 | 847 | 1,109 | ||||||||||||||||||||||||||||||
Other operating expenses | — | — | 1,668 | — | 2,139 | — | 1,336 | — | — | — | ||||||||||||||||||||||||||||||
Total operating expenses | 6,116 | 7,635 | 9,776 | 8,654 | 10,900 | 10,154 | 12,627 | 13,017 | 12,570 | 13,215 | ||||||||||||||||||||||||||||||
Operating income (loss) | 3,515 | 326 | (3,315 | ) | (743 | ) | 4,253 | 8,731 | 2,135 | 4,565 | 8,229 | 8,150 | ||||||||||||||||||||||||||||
Other expense (income) | 199 | 331 | 217 | 221 | 245 | 270 | 220 | (43 | ) | (166 | ) | (64 | ) | |||||||||||||||||||||||||||
Income (loss) before provision (benefit) for income taxes | 3,316 | (5 | ) | (3,532 | ) | (964 | ) | 4,008 | 8,461 | 1,915 | 4,608 | 8,395 | 8,214 | |||||||||||||||||||||||||||
Provision (benefit) for income taxes | 1,375 | 76 | (1,367 | ) | (206 | ) | 1,661 | 3,576 | 805 | 2,086 | 3,568 | 3,557 | ||||||||||||||||||||||||||||
Net income (loss) | 1,941 | (81 | ) | (2,165 | ) | (758 | ) | 2,347 | 4,885 | 1,110 | 2,522 | 4,827 | 4,657 | |||||||||||||||||||||||||||
Accrued dividends on 8% preferred stock | 253 | 263 | 275 | 275 | 273 | 285 | 299 | 74 | — | — | ||||||||||||||||||||||||||||||
Net income (loss) attributable to common stockholders | $ | 1,688 | $ | (344 | ) | $ | (2,440 | ) | $ | (1,033 | ) | $ | 2,074 | $ | 4,600 | $ | 811 | $ | 2,448 | $ | 4,827 | $ | 4,657 | |||||||||||||||||
Other operating data: | ||||||||||||||||||||||||||||||||||||||||
Number of consultants (at period end) (2) | 289 | 344 | 446 | 477 | 480 | 488 | 489 | 483 | 498 | 557 | ||||||||||||||||||||||||||||||
Utilization rate (3) | 75.8 | % | 69.4 | % | 60.6 | % | 62.7 | % | 73.4 | % | 71.8 | % | 66.3 | % | 77.8 | % | 76.3 | % | 76.1 | % | ||||||||||||||||||||
Average billing rate per hour (4) | $ | 228 | $ | 220 | $ | 215 | $ | 210 | $ | 229 | $ | 248 | $ | 235 | $ | 243 | $ | 250 | $ | 254 | ||||||||||||||||||||
(See footnotes on the following page.)
45
Management’s discussion and analysis of financial condition and results of operations
| (1) | Intangible assets amortization relating to customer contracts is presented as a component of total direct costs. Depreciation, amortization of leasehold improvements and intangible assets amortization relating to customer relationships are presented as a component of operating expenses. |
| (2) | Consultants consist of our billable |
| We calculate the utilization rate for our consultants by dividing the number of hours all of our consultants worked on client assignments during a period by the total available working hours for all of our consultants during the same period, assuming a forty-hour work week, less paid holidays and vacation days. |
| Average billing rate per hour is calculated by dividing revenues for a period by the number of hours worked on client assignments during the same period. |
48
Management’s discussion and analysis of financial condition and results of operations
Our future operating results are difficult to predict and may vary significantly. Revenues and operating results fluctuate from quarter to quarter as a result of numerous factors, including the following:
| Ø | the size and number of client engagements commenced and completed during a quarter; |
| Ø | utilization rates, which in turn can be affected by increased hiring, as there is generally a transition period for new consultants that results in a temporary drop in utilization; |
| Ø | the number of business work days in a quarter; |
| Ø | the number of consultants; and |
| Ø | the achievement of milestones under performance-based engagements. |
Although our fee structure is variable, our direct costs, which include primarily consultant payroll costs, are fixed within the short-term. Consequently, a variation in the number or size of client engagements or the timing of the initiation or the completion of client engagements can cause significant variations in operating results from quarter-to-quarter.
LIQUIDITY AND CAPITAL RESOURCES
Our primary sources of liquidity are cash flows from operations, proceeds generated by our initial public offering and debt capacity available under our credit facilityfacility. Cash and available cash reserves. Our primary financing need has beenequivalents, consisting of demand deposits and short-term commercial paper, increased $23.8 million, from $4.3 million at December 31, 2003, to fund$28.1 million at December 31, 2004 primarily due to cash generated by our growth.initial public offering and growth in our business. Cash and cash equivalents decreased $13.0 million, from $28.1 million at December 31, 2004, to $15.1 million at June 30, 2005 primarily due to the acquisition of Speltz & Weis LLC.
Operating activities
Cash flows generated by operating activities totaled $0.9$3.6 million for the six months ended June 30, 20042005 and $0.1$0.9 million for the six months ended June 30, 2003.same period last year. Our operating assets and liabilities consist primarily of receivables from billed and unbilled services, accounts payable and accrued expenses, and accrued payroll and related benefits. The volume of billings and timing of collections and payments affect these account balances. The increase in cash provided by operations for the six months ended June 30, 20042005 was primarily attributable to higher net income, partially offset by increasesimproved financial results and moderation of the growth in working capital.our client receivables. Receivables from clients and unbilled services increased $12.2$7.5 million during the six months ended June 30, 2004 primarily2005 as a result of revenuecompared to $11.1 million during the same period last year. These increases in the latter portion of the second quarter of 2004 that were not billed prior to June 30, 2004. During the six months ended June 30, 2004, there was also a $1.1 million use of funds for other current assets, which included $0.5 million of prepaid costs associated with this offering, and a $0.4 million use of funds for the change in accrued interest payable relating to annual interest payments made on the $10.1 million in 8% promissory notes payable to our parent, HCG Holdings LLC. These uses of fundscash provided by operations were partially offset by a $2.3cash paid for payroll and related benefits and income taxes.
Cash flows generated by operating activities totaled $12.5 million reductionfor the year ended December 31, 2004 and $4.0 million for the year ended December 31, 2003. The increase in cash provided by operations for the year ended December 31, 2004 was primarily attributable to higher revenues and improved financial
46
Management’s discussion and analysis of financial condition and results of operations
results due to the general growth in our income tax receivablebusiness. Receivables from clients and unbilled services increased $11.4 million during the year ended December 31, 2004 primarily due to increased revenues generated and billed. This increase in client balances was substantially offset by a $0.7$11.3 million increase in our income taxaccounts payable in the first six months of 2004, as well as an increase in accounts payable,and accrued expenses and accrued payroll and related benefits.
As the result of the increase in cash provided by operations described above, offset by the uses of cash for investing Accrued payroll and financing activities noted below, cash and cash equivalents declined to $0.9 million at June 30, 2004 from $4.3 millionrelated benefits at December 31, 2003.2004 included $16.3 million of accrued bonuses, which we paid out in the first quarter of 2005.
Cash flow generated by operating activities totaled $4.0 million for the year ended December 31, 2003 compared to cash used in operating activities of $9.8 million for the partial year ended December 31, 2002. The increase in cash provided by operations for the year ended December 31, 2003 was primarily attributable to revenue growth in excess of the growth in operating expenses when compared to the partial year ended December 31, 2002, which had eight months of operations, and various start-up costs associated with the commencement of operations.
Our balance of cash and cash equivalents was $4.3 million at December 31, 2003, a decrease of $0.1 million, or 2.3%, from the $4.4 million balance at December 31, 2002.
49
Management’s discussion and analysis of financial condition and results of operations
Investing activities
Cash used byin investing activities was $3.0$16.7 million for the six months ended June 30, 20042005 and $2.1$3.0 million for the same period last year. During the six months ended June 30, 2005, we used $12.4 million to acquire Speltz & Weis LLC, net of cash acquired of $1.8 million. Use of cash in both periods also pertained to the purchase of computer hardware and software, furniture and fixtures and leasehold improvements needed to meet the ongoing needs relating to the hiring of additional employees and the expansion of office space. We estimate that our cash utilized for capital expenditures in 2005 will be approximately $8.0 million for the purchase of additional computers, network equipment, furniture and fixtures and leasehold improvements as our business continues to expand.
Cash used by investing activities was $6.9 million for the year ended December 31, 2004 and $4.2 million for the year ended December 31, 2003. Use of cash in both periods pertained to the purchase of computer hardware and software, furniture and fixtures and leasehold improvements needed to meet the ongoing needs relating to the hiring of additional employees and the expansion of office space.
Cash used by investing activities was $4.2 million for the year ended December 31, 2003 and $8.6 million for the partial year ended December 31, 2002. In the partial year ended December 31, 2002, we paid $5.5 million to obtain the release of certain employees from non-competition agreements with Arthur Andersen LLP, their former employer, and $0.8 million of certain related liabilities. In addition, we paid $2.3 million in the partial year ended December 31, 2002 for the purchase of computer hardware and software, furniture and fixtures and leasehold improvements relating to the hiring of employees and establishment of new offices. Capital expenditures for the purchase of property and equipment, including computer hardware and software, furniture and fixtures and leasehold improvements, were the primary use of cash in the year ended December 31, 2003, as business expansion and the hiring of new employees continued during the course of the year. We estimate that our capital expenditures in 2004 will be approximately $6.5 million for the purchase of additional computers, furniture and fixtures and leasehold improvements as our business continues to expand.
Financing activities
During the six months ended June 30, 2005, we issued notes payable totaling $3.0 million relating to our acquisition of Speltz & Weis LLC. The notes accrue interest at 4% per annum and are payable in three equal annual installments beginning on May 8, 2006.
Cash provided by financing activities was $18.3 million for the year ended December 31, 2004 primarily due to cash proceeds generated by our initial public offering, which we used a portion of to redeem the outstanding 8% preferred stock and repay the 8% promissory notes as discussed below. On June 29,
47
Management’s discussion and analysis of financial condition and results of operations
2004, we paid a special dividend to our stockholders. The special dividend was declared on May 12, 2004 for each outstanding share of common stock and 8% preferred stock payable to holders of record on May 25, 2004. The 8% preferred stock participated on an as converted basis. The aggregate amount of the dividend was $1.3 million, or $0.09 per share of common stock and $9.64 per share of 8% preferred stock. The payment of the special dividend was funded by our available cash balance and by borrowing availability under our credit agreement described below, which we repaid the following day.
Between April and June 2002, in connection with our initial capitalization, we issued to our parent, HCG Holdings LLC, an aggregate of 12,500 shares of our 8% preferred stock for an aggregate consideration of $12.5 million and an aggregate of approximately 11,281,243 shares of our common stock at a purchase price of $0.02 per share for an aggregate consideration of approximately $0.3 million. Proceeds of approximately $10.1 million were also received from the issuance of 8% promissory notes to HCG Holdings LLC. We had no other borrowings outstanding as of December 31, 2002.
The terms of the 8% preferred stock contain specific provisions regarding redemption. UponAfter the consummation of thisour initial public offering on October 18, 2004, we will exerciseused $15.1 million of our optionnet proceeds from the initial public offering to redeem ourthe outstanding 8% preferred stock, for approximately $15.1 million, which is equal to their original issuance price plus cumulative dividends that will have accrued from the date of investment through the date of this prospectus at a rate of 8% per annum, compounded annually, together withand a liquidation participation amount calculated as iftotaling $2.6 million. Also on October 18, 2004, we were liquidated as of the date of the redemption.
The terms of the 8% promissory notes require us to mandatorily prepay the outstanding principal immediately after a qualified public offering, including this offering. Accordingly, we will use approximatelyused $10.7 million of our net proceeds from thisthe initial public offering to repay the outstanding 8% promissory notes, including accrued and unpaid interest upon the consummation of this offering. For further information, see “Use of proceeds” and “Certain relationships and related transactions.”$0.6 million.
In 2003, our wholly-owned operating subsidiary, Huron Consulting Services LLC entered intohad a bank credit agreement that expired on February 10, 2005 that allowed it to borrow up to the lesser of $5.0$15.0 million or the sum of (a) 75% of eligible accounts receivable as defined byand (b) the termslesser of the agreement.30% of unbilled services and $3.0 million. Borrowings under the agreement are alsowere limited by any outstanding letters of credit. Borrowings under the credit agreement bearbore interest at either the prime rate or LIBOR, rounded up to the nearest whole percentage, plus 2.75%, and arewere secured by substantially all of Huron Consulting Services LLC’s assets. The bank credit agreement included covenants for minimum equity and maximum annual capital expenditures as well as covenants restricting our ability to incur additional indebtedness or engage in certain types of transactions outside of the ordinary course of business. As of December 31, 2004, we were in compliance with the bank credit agreement debt covenants and had no borrowings outstanding. The balance available under the agreement was $13.3 million after the calculation of eligible accounts receivable and unbilled services balances and a reduction of approximately $1.7 million for letters of credit outstanding.
Prior to the expiration of the bank credit agreement described above, we established a new facility. The new bank credit agreement, expiring on February 10, 2006, allows us to borrow up to the lesser of $25.0 million or the sum of (a) 85% of eligible accounts receivable and (b) the lesser of 40% of unbilled services and $5.0 million. Borrowings under the agreement will be limited by any outstanding letters of credit, will bear interest at LIBOR plus 1.75%, and will be secured by substantially all of our assets. We had no borrowings outstanding as of December 31, 2003; however, available borrowings under the agreement were limited to $4.0 million as of that date due to two outstanding letters of credit provided as security for our
50
Management’s discussion and analysis of financial condition and results of operations
Chicago and New York office leases and totaling $750,000 and $236,000, respectively. OurThe bank credit agreement includes covenants for minimum equity and maximum annual capital expenditures, as well as covenants restricting our ability to incur additional indebtedness or engage in certain types of transactions outside of the ordinary course of business. The minimum equity covenant originally required that the sumAs of paid-in capital and net income of Huron Consulting Services LLC, less any distributions made by Huron Consulting Services LLC, be at least $18.5 million at any time. The capital expenditures covenant originally prohibited Huron Consulting Services LLC from incurring expenditures for the acquisition of fixed assetsJune 30, 2005, we were in excess of $2.5 million in the aggregate in any fiscal year. The dollar amounts specified in these covenants have since been revised as described below.
During 2004, we received two separate waivers from the bank that extended by thirty days each the due date for the 2003 audited financial statements and one waiver that allowed Huron Consulting Services LLC to exceed its limitation on distributions to Huron Consulting Group Inc. Generally,compliance with the bank credit agreement limited the amount of distributions Huron Consulting Services LLC could make to 50% of its net income. Huron Consulting Services LLC made a $277,146 distribution to Huron Consulting Group Inc. in January 2004. Our bank credit agreement was amended in February 2004 to remove the limitations on distributions by Huron Consulting Services LLC. During 2003, we received a waiver from the bank that effectively increased the capital expenditure limit from $2.5 million to $4.5 milliondebt covenants and ultimately, by amendment, to $7.5 million. We also received a letter of compliance confirmation from the bank for the 30-day clean up provision, which requires that we have an uninterrupted 30-day period each year with no loans outstanding under the agreement.
Before expiring in January 2004, our bank credit agreement was amended to extend the term to February 10, 2005 and to increase the total availability to the lesser of $15.0 million or the sum of (a) 75% of eligible accounts receivable and (b) the lesser of 30% of unbilled services and $3.0 million. Borrowings under the agreement are also still limited by any outstanding letters of credit. The bank credit agreement was further amended in May 2004 to, among other things, clarify the minimum equity covenant and lower the minimum equity requirement to $10.5 million, and to permit certain asset sales outside the ordinary course of business.
As of June 30, 2004, we had no borrowings outstanding under our bank credit agreement and theoutstanding. The balance available under the credit agreement was $13.3$23.0 million after the calculation of eligible accounts receivable and unbilled services balances and a reduction of approximately $1.7 million for letters of credit outstanding. The increase in letters of credit outstanding resulted from the Chicago lease security deposit requirement increasing from $750,000 to $1.5 million. We intend to use a portion of our net proceeds from this offering to repay any borrowings outstanding under the credit agreement at the time this offering is consummated.
On May 12, 2004, we declared a special dividend on each outstanding share of our common stock and 8% preferred stock payable to holders of record on May 25, 2004. We paid the special dividend on June 29, 2004. The 8% preferred stock participated on an as converted basis. The aggregate amount of the dividend was $1.25 million, or $0.09 per share of common stock and $22.18 per share of 8% preferred stock. The payment of the special dividend was funded by our available cash balance and by borrowing availability under our credit agreement, which we repaid the following day.
Future needs
As indicated in “Business—Growth Strategy” below,Our primary financing need has been to fund our plans includegrowth. Our growth strategy includes hiring additional consultants and expanding our service offerings through existing consultants, new hires or acquisitions. We intend to fund such growth over the next twelve months with funds generated from operations, and borrowing availability under our credit agreement. For example, we used the $4.0 million of cash provided by operations in 2003 for capital expenditures to support our growing business. While our cash flows
5148
Management’s discussion and analysis of financial condition and results of operations
generated by operations decreasedproceeds from $4.0 million at December 31, 2003 to $0.9 million at June 30, 2004, this was primarily due to the timing of 2003 annual bonus payments of $7.7 millionour initial public offering and current year growth in revenues that increased working capital balances for receivables and unbilled services by $12.2 million.borrowing availability under our credit agreement. Because we expect that our future annual growth rate in revenues and related percentage increases in working capital balances will moderate, we believe our cash generated from operations and the initial public offering, supplemented as necessary by borrowings under our credit facility, and the proceeds from this offering, will be adequate to fund this growth.
Over the longer term, we expect that cash flow from operations, supplemented by shortshort- and longlong- term financing, and the proceeds from this offering, as necessary, will be adequate to fund day-to-day operations and capital expenditure requirements. Our ability to secure short-term and long-term financing in the future will depend on several factors, including our future profitability, the quality of our accounts receivable and unbilled services, our relative levels of debt and equity and overall condition of the credit markets. Following this offering, the net proceeds remaining after repayment of our 8% promissory notes, redemption of the 8% preferred stock and repayment of outstanding indebtedness under our credit facility will be invested in short-term, interest bearing investment grade securities.
CONTRACTUAL OBLIGATIONS
The following tables representtable represents our obligations and commitments to make future payments under contracts, such as lease agreements, and under contingent commitments as of December 31, 2003.2004 (in thousands).
| Less than 1 year | 1-3 years | 4-5 years | After 5 years | Total | ||||||||||||||||||||||||||
| (in thousands) | Less than 1 year | 1-3 years | 4-5 years | After 5 years | Total | |||||||||||||||||||||||||
Operating leases | $ | 3,322 | $ | 7,581 | $ | 6,820 | $ | 14,179 | $ | 31,902 | $ | 4,461 | $ | 9,149 | $ | 8,668 | $ | 14,601 | $ | 36,879 | ||||||||||
Long-term debt (consisting of 8% promissory notes) | — | — | 10,076 | — | 10,076 | |||||||||||||||||||||||||
Purchase obligations | 1,303 | 49 | 20 | — | 1,372 | |||||||||||||||||||||||||
Total contractual obligations | $ | 3,322 | $ | 7,581 | $ | 16,896 | $ | 14,179 | $ | 41,978 | $ | 5,764 | $ | 9,198 | $ | 8,688 | $ | 14,601 | $ | 38,251 | ||||||||||
We lease our facilities and certain equipment under operating lease arrangements expiring on various dates through 2014.2014, with various renewal options. We lease office facilities under noncancelable operating leases that include fixed or minimum payments plus, in some cases, scheduled base rent increases over the term of the lease and additional rents based on the Consumer Price Index.lease. Certain leases provide for monthly payments of real estate taxes, insurance and other operating expense applicable to the property. Some of the leases contain provisions whereby the future rental payments may be adjusted for increases in operating expenses above the specified amount. In addition, we lease equipment under noncancelable operating leases.
During 2002,Purchase obligations include information technology and telecommunication obligations, as well as other commitments to purchase services where we entered into promissory note agreementscannot cancel or would be required to pay a termination fee in the event of cancellation.
We also have fixed cash flow requirements relating to the notes payable we issued in conjunction with our parent, HCG Holdingsthe acquisition of Speltz & Weis LLC totaling $10.1 million. Interest onduring the promissory notes, which is payable annually, accrues at the rate of 8% per year.six months ended June 30, 2005. The notes mature five yearstotaled $3.0 million and six months from the date of issuance. The notes may be prepaidare payable in three equal annual installments beginning on May 8, 2006, together with accrued interest at any time without penalty and prepayment is mandatory upon the occurrence of specified events, including the consummation of this offering. Accordingly, upon the consummation of this offering, we will use approximately $10.7 million of our net proceeds from this offering to repay the outstanding 8% promissory notes, including accrued and unpaid interest.4% per annum.
OFF BALANCE SHEET ARRANGEMENTS
We have not entered into any off-balance sheet arrangements.
QUALITATIVE AND QUANTITATIVE DISCLOSURES ABOUT MARKET RISK
We are exposed to market risks related to interest rates and changes in the market value of our investments. We do not enter into interest rate swaps, caps or collars or other hedging instruments. Our
52
Management’s discussion and analysis of financial condition and results of operations
Our exposure to changes in interest rates is limited to borrowings under the bank credit agreement, which has a variable interest ratesrate tied to the LIBOR or prime rate. We had no borrowings outstanding
49
Management’s discussion and analysis of financial condition and results of operations
under our bank credit agreement as of December 31, 20032004 and June 30, 2004, and, as a result,2005; therefore, any change in interest rates would not have a material effect on our financial position or operating results.
At June 30, 2005, we had notes payable totaling $3.0 million that are payable in three equal annual installments beginning on May 8, 2006. We are not exposed to interest rate risks in respect to these notes as they bear a fixed interest rate at 4% per annum.
From time to time, we invest excess cash in marketable securities. These investments principally consist of overnight sweep accounts.accounts and short-term commercial paper. Due to the short maturity of our investments and debt obligations, we have concluded that we do not have material market risk exposure.
RECENT ACCOUNTING PRONOUNCEMENTS
In May 2003,December 2004, the Financial Accounting Standards Board or FASB, issued SFAS No. 150, “Accounting for Certain Financial Instruments with Characteristics123 (revised 2004), “Share-Based Payment,” (“SFAS No. 123R”). In April 2005, the SEC adopted a new rule that amends the effective date of both Liabilities and Equity.”SFAS No. 123R. Under the new rule, we must adopt SFAS No. 123R effective January 1, 2006. This statement establishes standardsrequires that the costs of employee share-based payments be measured at fair value on the awards’ grant date and be recognized in the financial statements over the requisite service period. SFAS No. 123R supersedes APB 25 and its related interpretations, and eliminates the alternative to use APB 25’s intrinsic value method of accounting, which we are currently using. Additionally, SFAS No. 123R amends SFAS No. 95, “Statement of Cash Flows,” to require that excess tax benefits be reported as a financing cash inflow rather than as a reduction of taxes paid.
SFAS No. 123R allows for how an issuer classifies and measures certain financial instruments with characteristicstwo alternative transition methods. The first method is the modified prospective application whereby compensation cost for the portion of both liabilities and equity. It requiresawards for which the issuer to classify a financial instrumentrequisite service has not yet been rendered that is within the scopeare outstanding as of the standardadoption date will be recognized over the remaining service period. The compensation cost for that portion of awards will be based on the fair value of those awards on the grant date as a liability ifcalculated for pro forma disclosures under SFAS No. 123, as originally issued. All new awards and awards that are modified, repurchased, or cancelled after the financial instrument embodies an obligation of the issuer. The adoption ofdate will be accounted for under the provisions of SFAS No. 150 did123R. The second method is the modified retrospective application, which requires that we restate prior period financial statements. The modified retrospective application may be applied either to all prior periods or only to prior interim periods in the year of adoption of this statement. We are currently determining which transition method we will adopt and do not expect the adoption of SFAS No. 123R to have anya material impact on our financial position, or results of operations.
In November 2002, the FASB reached a consensus on EITF Issue No. 00-21. EITF Issue No. 00-21 provides guidance on how to account for revenue arrangements that include multiple productsoperations, earnings per share or services to ensure that all standalone deliverables are tracked, valued and accounted for on an individual basis and in the proper periods. The guidance in EITF Issue No. 00-21 is effective for revenue arrangements entered into in fiscal periods beginning after June 15, 2003. We have contracts with clients to deliver multiple services that are covered under both individual and separate engagement letters. These arrangements allow for our services to be valued and accounted for on a separate basis. Therefore, the adoption of EITF Issue No. 00-21 did not have any impact on our consolidated financial position or result of operations.
In January 2003, the FASB issued Interpretation No. 46, “Consolidation of Variable Interest Entities and Interpretation of ARB No. 51,” which is effective immediately for all variable interest entities created after January 31, 2003 and for the first fiscal year or interim period beginning after June 15, 2003 for variable interest entities in which an enterprise holds a variable interest that it acquired before February 1, 2003. We do not have variable interest entities that fall within the scope of this pronouncement and therefore the adoption of this pronouncement did not have any impact on our financial statements.
In March 2004, the FASB issued an Exposure Draft on “Share-Based Payment, an amendment of FASB Statements No. 123 and 95.” In this proposed statement, the FASB believes that employee services received in exchange for equity instruments give rise to recognizable compensation cost as the services are used in the issuing entity’s operations. In addition, the proposed statement would require that public companies measure the compensation cost related to employee services received in exchange for equity instruments issued based on the grant-date fair value of those instruments. The FASB will also consider other items such as streamlining volatility assumptions and addressing the fair value measurement models. This proposed statement would neither change the accounting in SFAS No. 123, “Accounting for Stock-Based Compensation,” for transactions in which an enterprise exchanges its equity instruments for services of parties other than employees nor change the accounting for stock ownership plans, which are subject to American Institute of Certified Public Accountants Statement of Position 93-6, “Employer’s Accounting for Employee Stock Ownership Plans.” The FASB intends to reconsider the accounting for those transactions and plans in a later phase of its project on equity-based compensation. Our management will continue to assess the potential impact this statement will have on us.cash flows.
5350
OVERVIEW
We are an independent provider of financial and operational consulting services. Our highly experienced and credentialed professionals employ their expertise in accounting, finance, economics and operations to provide our clients with specialized analysis and customized advice and solutions that are tailored to address each client’s particular challenges and opportunities. Our financial consulting services help clients effectively address complex challenges that arise from litigation, disputes, investigations, regulation, financial distress and other sources of significant conflict or change. Our operational consulting services help clients improve the overall efficiency and effectiveness of their operations, reduce costs, manage regulatory compliance and maximize procurement efficiency.
Our financial consulting services include:
| Ø | offering financial and economic analysis, forensic accounting and expert support and testimony services for organizations and their law firms in connection with litigation, business disputes and regulatory and internal investigations; |
| Ø | providing restructuring, turnaround and bankruptcy advisory services for financially distressed organizations, creditors and other constituents; |
| Ø | performing valuations of businesses or assets to assist clients with financial reporting, tax compliance, damage or purchase price assessments and restructuring |
| Ø | performing interim management, organizational renewal and turnaround services and other crisis management services for distressed hospitals and other healthcare facilities. |
Our operational consulting services include:
| Ø | assisting research universities and academic medical centers with research administration opportunities and challenges; |
| Ø | assisting healthcare payors and providers to improve the effectiveness of operations and reduce costs; |
| Ø | helping in-house legal departments and law firms improve their operations and reduce their costs and providing forensic technology and discovery services; |
| Ø | developing and implementing procurement plans that provide savings throughout the sourcing process; and |
| Ø | helping large and middle-market organizations that have recently undergone a change in leadership, are integrating acquisitions or are coping with a change in competitive dynamics to address performance challenges and take advantage of |
WeHuron was formed in March 2002 and commenced operations in May 2002 with2002. We were founded by a core group of experienced financial and operational consultants that consisted primarily of former Arthur Andersen LLP partners and professionals, including our chief executive officer,Chief Executive Officer, Gary E. Holdren. Holdren, with equity sponsorship from a group of investors led by Lake Capital Management LLC.
We created Huron because we believed that a financial and operational consulting business that is unaffiliated with a public accounting firm is better suited to serve its clients’ needs. As an independent consulting firm, Huron is not subject to the legal restrictions placed on public accounting firms that prohibit them from providing certain non-audit services to their audit clients. We also believedbelieve that many other consulting firms providedprovide only a limited scope of services and, therefore, a company such as ours with a wide array of services would be better positioned to serve the diverse and complex needs of various organizations.
51
Business
We have grown significantly since we commenced operations, more than doubling the number of our consultants from 213 on May 31, 2002 to 486557 on September 17, 2004.June 30, 2005. We have hired experienced professionals from a variety of organizations, including the four largest public accounting firms, referred
54
Business
to as the Big Four, and other consulting firms. Our highly credentialed consultants include certified public accountants, MBAs, accredited valuation specialists and forensic accountants. As of September 17, 2004,June 30, 2005, we had 5971 managing directors who are consultants. These individuals have an average of 2021 years of business experience.
We provide our services to a wide variety of both financially sound and distressed organizations, including Fortune 500 companies, medium-sized and large businesses, leading academic institutions, healthcare organizations and the law firms that represent these various organizations. Since May 2002, we have conducted over 1,000 engagements for over 500 clients, and we have worked on engagements with 35 of the 40 largest U.S. law firms listed inThe American Lawyer2004 Am Law 100.In In addition to our headquarters in Chicago, we have five other core offices located in Boston, Houston, New York City, San Francisco and Washington, D.C. and two smaller offices located in Charlotte and Los Angeles.
In October 2004, we completed our initial public offering and our common stock began trading on the NASDAQ National Market. On May 9, 2005, we acquired 100% of the outstanding membership interests of Speltz & Weis LLC, a specialized consulting firm consisting of 26 consultants. Speltz & Weis LLC is now part of our Financial Consulting segment.
We provide our services to a wide variety of both financially sound and distressed organizations, including Fortune 500 companies, medium-sized businesses, leading academic institutions, hospitals and healthcare organizations and the law firms that represent these various organizations. Since May 2002, we have conducted over 1,500 engagements for over 1,000 clients, and we have worked on engagements with 37 of the 40 largest U.S. law firms listed in The American Lawyer 2005 Am Law 100.
INDUSTRY BACKGROUND
We believe many organizations are facing increasingly large and complex business disputes and lawsuits, a growing number of regulatory and internal investigations and more intense public scrutiny. Concurrently, we believe increased competition and regulation are presenting significant operational and financial challenges for organizations. Distressed companies are responding to these challenges by restructuring and reorganizing their businesses and capital structures, while financially healthy organizations are striving to capitalize on opportunities by improving operations, reducing costs and enhancing revenue. Many organizations have limited dedicated resources to respond effectively to these challenges and opportunities. Consequently, we believe these organizations will increasingly seek to augment their internal resources with experienced independent consultants like us.
We believe the demand for our services is driven by the following factors:
| Ø | SEC and internal investigations. The increased scrutiny of accounting practices, internal controls and disclosure has contributed to the large number of financial restatements by public companies. In response to a number of recent incidences of corporate malfeasance and accounting irregularities, the Securities and Exchange Commission, or SEC, has conducted an increasing number of public company investigations over the past few years. |
52
Business
| Ø | Litigation and |
55
Business
| Ø | Sarbanes-Oxley and stockholder |
| Ø | Operational challenges and |
| Ø | Improving economic conditions and merger and acquisition |
| Ø | Financial |
53
Business
debtors and other constituents to retain the services of financial advisors. Additionally, we believe there is an ongoing need for restructuring and turnaround consulting services to assist financially distressed, under-performing and debt-laden companies and their stakeholders outside of the bankruptcy process. |
OUR COMPETITIVE STRENGTHS
We believe the following key strengths will enable us to take advantage of the industry trends described above and help us compete effectively in the consulting marketplace:
| Ø | Experienced and highly qualified |
56
Business
|
| Ø | Independent provider of financial and operational consulting |
| Ø | Complementary service offerings and integrated |
| Ø | Distinctive culture. We believe we have been successful in attracting and retaining top talent because of our distinctive culture, which combines the energy and flexibility of a high-growth company with the professionalism of a major professional services firm. To preserve our distinctive culture, our |
54
Business
OUR GROWTH STRATEGY
Our strategy to increase our revenues and grow our company involves the following key elements:
| Ø | Attracting additional highly qualified consultants. From May 31, 2002 through |
57
Business
| Ø | Growing our existing relationships and developing new |
| Ø | Continuing to promote and deliver an integrated approach to service |
| Ø | Continuing to build our |
| Ø | Expanding our service |
55
Business
| Ø | Pursuing strategic acquisitions. We |
Our ability to implement our growth strategy is subject to a number of risks, including those described under the section of this prospectus entitled “Risk Factors” concerning our consultants, our reputation, new service offerings and our intellectual property.
OUR SERVICES
We provide our services through two segments: Financial Consulting and Operational Consulting. For the year ended December 31, 20032004 and the six months ended June 30, 2004,2005, we derived 68.9%57.9% and 62.3%56.0%, respectively, of our revenues from Financial Consulting and 31.1%42.1% and 37.7%44.0%, respectively, from Operational Consulting. For further financial information on our segment results, see the section of this prospectus entitled “Management’s discussion and analysis of financial condition and results of operations” and Note 12note 15, “Segment Information” in the notes to our audited consolidated financial statements included elsewhere in this prospectus.
Financial Consulting
Our Financial Consulting segment provides highly specialized financial and economic analysis and advice to help clients effectively address complex challenges that arise from litigation, disputes, investigations, regulation, financial distress and other sources of significant conflict or change. Our Financial Consulting segment consisted of 286284 consultants as of September 17, 2004.June 30, 2005. This segment’s practices and the services they offer include:
| Ø | Disputes and |
58
Business
inquiries or investigations, financial restatements and special accounting projects. We provide specialized accounting services to gather and analyze voluminous financial data and reconstruct complex transactions and events. In addition, we apply economic and econometric analyses in the areas of antitrust and anticompetitive practices, securities fraud, insurance claims and damages, as well as deliver or support independent expert testimony in such cases. |
| Ø | Corporate advisory |
56
Business
| Ø | Valuation |
– transactions:• Transactions: supporting clients’ financial and tax reporting, especially in the context of acquisitions and other corporate transactions;
– litigation• Litigation or disputes: valuing businesses or assets; and
– bankruptcies:• Bankruptcies: supporting the restructuring process or the sale of business assets.
| Ø | Interim management/Focused consulting. With our acquisition of Speltz and Weis LLC, we can provide additional services to distressed hospitals and other healthcare facilities. Our interim management/focused consulting practice typically provides the following services: |
• Interim management: serving as on-site senior management, including Chief Executive Officer, Chief Operating Officer and Chief Financial Officer, with a specialization in managing distressed hospital systems and facilities; also provide chief restructuring officers to facilities in bankruptcy;
•Focused consulting: the interim managers are supported by consultants that provide revenue cycle improvements, cost reduction initiatives, clinical support, revenue generation/business development, financial planning and analysis and litigation support; and
• Bankruptcies, workouts and restructuring: in addition to providing chief restructuring officers to facilities in bankruptcy, we provide creditor relations and facilitation and reorganization planning and out-of-court workouts.
Operational Consulting
Our Operational Consulting segment provides services designed to help clients improve the overall efficiency and effectiveness of their operations by enhancing revenue, reducing costs, managing regulatory compliance and maximizing procurement efficiencies. Our Operational Consulting segment consisted of 200273 consultants as of September 17, 2004.June 30, 2005. This segment’s practices and the services they offer include:
| Ø | Higher |
| Ø |
59
Business
designed to reduce costs and increase effectiveness. Our engagements typically focus on revenue cycle and cash acceleration, supply chain improvements, strategic growth and planning, financial planning and |
57
Business
Medicare Modernization Act. We |
| Ø | Legal business consulting. Our legal business consulting practice helps both in-house legal departments and outside counsel enhance the quality of legal services while reducing costs by more efficiently aligning strategy, people, processes and technology. We provide strategic advice to help legal departments and law firms improve their organizational design, business processes, and management of outside counsel and we work with organizations and law firms to provide solutions to enhance their discovery process management and electronic discovery needs. One area of emphasis is helping clients to choose and implement technology-powered solutions that improve legal department operations. We provide a full array of forensic technology and discovery services that include discovery process execution, electronic discovery services, computer forensics, data management, and program management, all aimed at reducing costs, coordinating matters and people and streamlining processes. We also have extensive experience in selecting, customizing and successfully rolling out matter management systems that help legal departments track and manage lawsuits and other legal matters. These systems are powerful tools for managing budgets, spending and resources. We provide similar services for document management systems, patent management applications and electronic billing systems. |
| Ø | Strategic |
| Ø | Performance |
OUR CLIENTS
We provide financial and operational consulting services to a wide variety of both financially sound and distressed organizations, including Fortune 500 companies, medium-sized and large businesses, academic institutions, healthcare organizations and the law firms that represent these various organizations. Our clients are in a broad array of industries, including education, professional services, transportation services, healthcare, telecommunications, financial services, electronics, consumer products, energy and utilities, industrial manufacturing and food and beverage. Since commencing operations in May 2002, we have conducted over 1,0001,500 engagements for over 500 clients.1,000 clients, and we have worked on engagements with 37 of the 40 largest U.S. law firms listed in The American Lawyer 2005 Am Law 100. Our top ten clients represented 32.1%27.8% and 38.8% of our revenues in the year ended December 31, 20032004 and 32.5% of our revenues in the six months ended June 30, 2004.2005. No single client accounted for more than 10% of our revenues in either2004. Revenues from one client represented 12.6% of those periods.our revenues in the six months ended June 30, 2005. The following are examples of engagements that we have performed for our clients.
6058
Business
Financial Consulting
| Client need | Huron solution | |||
| Disputes and investigations and valuation services | Assist legal counsel for an audit committee of a public software company in connection with an SEC investigation and class action litigation | Ø Forensic accounting experts conducted a large-scale, in-depth financial analysis of financial records and analyzed issues such as revenue recognition, acquisition accounting, capitalization of assets, complex transactions and goodwill impairment to identify accounting errors. | ||
Ø Consultants specializing in GAAP assisted the client with preparation of the restatement of its financial statements and presentations to the SEC. | ||||
| ||||
| Corporate advisory services | Assist with Chapter 11 bankruptcy proceedings of a healthcare provider | Ø Analyzed the operations of the company to predict revenue going forward to demonstrate the viability of the company. | ||
Ø With the involvement of our healthcare practice, | ||||
assisted in the evaluation of the company’s operating expenses during the bankruptcy proceedings and the negotiation of the terms of the debtor-in-possession financing. | ||||
Ø Served as the interface between creditors’ committees and their advisors by addressing information requests and managing meetings and other committee-related issues. | ||||
Ø Analyzed the feasibility of the company’s projections in the plan of reorganization with the assistance of the healthcare practice and provided written testimony on this analysis at the reorganization plan confirmation hearing. | ||||
Valuation services | Value assets of acquired company for purchase price allocation by a global media company | Ø Analyzed the fair market value of the assets of the acquired company, including tangible assets, customer relationships, favorable contracts, franchise value and goodwill. | ||
Ø Determined the remaining life of the assets as well as tested for impairment of the assets in other operating units to support financial reporting requirements. | ||||
6159
Business
| Practice | Client need | Huron solution | ||
Interim management/ Focused consulting | Provide interim management and performing focused consulting services for a large hospital system in the United States | Ø Provided experienced senior executive management, including the Chief Executive Officer, the Chief Financial Officer, the Chief Operating Officer and various department managers. | ||
Ø Made revenue cycle improvements by analyzing and correcting back-office operations, monitoring tools that report key metrics, improving coding and automation and analyzing and renegotiating payor contracts to improve performance including arranging for significant increases in cash flow, improved relations with trade creditors and system improvements for the long term. | ||||
Operational Consulting
| Client need | Huron solution | |||||
| Higher education and strategic sourcing | Assess research administration infrastructure of a leading university due to dramatic growth in research volume and increased scrutiny of federal | Ø Evaluated current operations and provided a plan for implementation of improvements to research administration infrastructure, including: | ||||
– | ||||||
– | ||||||
– | ||||||
– | ||||||
–personnel; | ||||||
– | ||||||
– | ||||||
Ø Evaluated the exposure of the primary research support units to financial and operational risks relating to research universities. | ||||||
Ø Assessed impact of plans to replace university-wide financial systems on research administration support services. | ||||||
Ø Our strategic sourcing practice | ||||||
60
Business
| Practice | Client need | Huron solution | ||||
| Healthcare | Improve operating margins of healthcare provider | Ø Comprehensive assessment of performance levels related to operating costs, supply costs, revenue cycle and organizational structure efficiency. | ||||
Ø Quantified and prioritized areas of potential opportunity for change, growth and/or improvement, including revenue management, use of supplies and efficiency of information systems. | ||||||
Ø Developed and implemented plans for | ||||||
–supply chain; | ||||||
–revenue cycle; and | ||||||
–organizational effectiveness. | ||||||
| Assist in recovering overpaid claims |
| |||||
| ||||||
| ||||||
62Ø Assisted a large health insurance organization perform a detailed analysis of its coordination of benefits programs.
Business
| ||||||
| Legal business consulting | Develop cost saving initiatives for pharmaceutical company’s recently expanded legal department | Ø Analyzed processing of legal matters through various phases and the distribution and management of legal work by internal and outside staff. | ||||
Ø Developed cost saving initiatives to improve organizational design, outside counsel management and business process. | ||||||
Ø Assisted with the implementation of an interim matter management system for litigation and the selection of a new department-wide matter management system that will be implemented over a period of time. | ||||||
| Implement an electronic discovery system and an enterprise-wide discovery management solution | Ø Evaluated existing electronic document and hard-copy/image-based discovery processes. Ø Recommended and implemented an electronic document discovery solution to successfully reprocess documents and provide a review and production platform. Ø Structured and managed the electronic review, including providing the on-site attorney training, system metrics and user reports. Ø Developed end-to-end company wide solution for all discovery management needs from issuance of legal holds through case archival and record retention. | |||||
61
Business
| Practice | Client need | Huron solution | ||
| Performance improvement | Devise an overarching strategy for the supply chain function for a large consumer products client | Ø Synthesized market research, customer feedback and industry benchmarks to provoke discussion about future direction and priorities in the supply chain arena. Ø Facilitated a process to build consensus among senior management from across major business units leading to the development of a long-range plan and a series of near-term initiatives. | ||
EMPLOYEES
Our ability to bring the right expertise together to address client issues requires a willingness to work and think outside the bounds of a single practice or specialty. Our success depends on our ability to attract and retain highly talented professionals by creating a work environment where both individuals and teams thrive and individuals are rewarded not only for their own contributions andbut also for the success of our successes.organization as a whole. To accomplish those goals and recognize performance, we have adopted a comprehensive rewards program incorporating compensation, training and development opportunities, performance management and special recognition programs.programs that motivates individual performance and promotes teamwork.
As of September 17, 2004,June 30, 2005, we had 604690 employees, consisting of 486557 consultants and 118133 non-billable professionals. The 486557 consultants consisted of 5971 managing directors, 7086 directors, 108135 managers and 249265 associates and analysts. Of these consultants, 129133 have a master’s degree in business administration, 7884 are certified public accountants and various others are accredited valuation specialists and forensic accountants. Our managing directors serve clients as advisors and engagement team leaders, originate revenue through new and existing client relationships, and work to strengthen our intellectual capital, develop our people and enhance our reputation. Our directors and managers manage day-to-day client relationships and oversee the delivery and overall quality of our work product. Our associates and analysts gather and organize data, conduct detailed analyses and prepare presentations that synthesize and distill information to support recommendations we deliver to clients. In addition to our consultants and non-billable professionals, in certain cases we also utilize independent contractors.
Our 118133 non-billable professionals at September 17, 2004June 30, 2005 consisted of 810 managing directors, 1929 directors, 1520 managers, 4339 associates and analysts and 3335 assistants. Our non-billable professionals include our senior management team, senior client relationship managers and legal, finance, information technology, marketing and human resource personnel.
We assimilate and support employees in their career progression through training and development programs. We have structured orientation and training programs for new analysts, “milestone” programs to help recently promoted employees quickly become effective in their new roles, and opportunities for self-directed training, including technical and consulting courses. We assign employees internal performance coaches to identify opportunities for development, formal training or certifications.
62
Business
Our compensation plan includes competitive base salary, incentives and benefits. Under our incentive plan, directors, managers, associates and analysts set goals each year with a performance coach. These
63
Business
goals are aligned with our business goals as well as individual interests and development needs. Managing directors set goals with their practice leader using a balanced scorecard. The incentive plan balances our value of teamwork with recognition of individual performance, and incentive compensation is tied to both team and individual performance. Incentives for managing directors are based on their individual performance and their contribution to their practice and to our business as a whole. Funding of the managing director incentive pool is based on our achievement of annual financial goals and each practice’s achievement of its financial goals. In addition, managing directors directors and managerscertain high-performing directors are eligible for long-term equity incentives.
BUSINESS DEVELOPMENT AND MARKETING
Business development
Our business development activities aim to build relationships and a strong brand reputation with key sources of business and referrals, especially top-tier law firms and the offices of the chief financial officer and general counsel of organizations. We believe that excellent service delivery to clients is critical to building relationships and our brand reputation, and we emphasize the importance of client service to all of our employees.
We generate most of our new business opportunities through relationships that our managing directors have with individuals working in corporations, academic institutions, existing or former clients and top-tier law firms. Although some managing directors spend more time on service delivery than new business development, all of our managing directors understand their important role in ongoing relationship and business development, which is reinforced through our compensation and incentive program. We actively seek to identify new business opportunities, and we frequently receive referrals and repeat business from past and current clients and from the law firms with which we have worked.
We also from time to time host conferences that facilitate client development opportunities. For example, in the third quarter of 2005 we are hosting a general counsel conference and a corporate advisory services summit.
In addition, to complement the business development efforts of our managing directors, we recently formedhave a group of senior client relationship managers, who are focused exclusively on developing client relationships and generating new business through their extensive network of contacts. We also have formed relationships with prominent academics, which we believe may generate new business opportunities.
Marketing
We have a centralized marketing department with a marketing professional assigned to each of our practices. The centralized department coordinates these professionals’ activities, and also develops and coordinates traditional marketing programs, such as participation in seminars, sponsorship of client events and publication of articles in industry publications to actively promote our name and capabilities. The marketing department also manages public relations activities, develops printed marketing materials and performs research and database management to support sales efforts.
COMPETITION
The consulting services industry is extremely competitive, highly fragmented and subject to rapid change. The industry includes a large number of participants with a variety of skills and industry expertise, including other business operations and financial consulting firms, general management consulting firms, the consulting practices of major accounting firms, technical and economic advisory firms, regional and
63
Business
specialty consulting firms and the internal professional resources of organizations. We compete with a large number of service providers in both of our segments. Our competitors often vary depending on the particular practice area. In addition, we also expect to continue to face competition from new entrants because the barriers to entry into consulting services are relatively low.
64
Business
We believe the principal competitive factors in our market include firm and consultant reputations, client and law firm relationships and referrals, the ability to attract and retain top consultants, the ability to manage engagements effectively and the ability to be responsive and provide high quality services. There is also competition on price, although to a lesser extent due to the critical nature of many of the issues that the types of services we offer address. Many of our competitors have a greater geographic footprint, including an international presence, and name recognition, as well as have significantly greater personnel, financial, technical and marketing resources than we do. We believe that our independence, experience, reputation, industry focus and broad range of professional services enable us to compete favorably and effectively in the consulting marketplace.
FACILITIES
Our principal executive offices are located in a leased facility in Chicago, Illinois, consisting of approximately 62,00082,668 square feet of office space, under a ten-year lease that expires in MaySeptember 2014. Total annual rent expense for this facility for 2004, including base rent, operating expenses and taxes, will equal $1.7 million. This lease contains scheduled base rent increases over the term of the lease. We have two five-year renewal options under the lease that will allow us to continue to occupy this office space until MaySeptember 2024. We also have an ongoing expansion option that allows us to lease additional space at such time as the additional space is available for lease, subject to specified notice and election provisions contained in the lease agreement. This facility accommodates our executive team and corporate departments, as well as consultants in each of our practices. We also occupy leased facilities for our five other core offices located in Boston, Houston, New York City, San Francisco and Washington, D.C., as well as smaller offices located in Charlotte and Los Angeles. We do not own any real property. We believe that our leased facilities are adequate to meet our current needs and that additional facilities are available for lease to meet future needs.
LEGAL PROCEEDINGS
From time to time, we are involved in legal proceedings and litigation arising in the ordinary course of business. As of the date of this prospectus, we are not a party to or threatened with any litigation or other legal proceeding that, in our opinion, could have a material adverse effect on our business, operating results or financial condition.
6564
EXECUTIVE OFFICERS AND DIRECTORS
The following table sets forth the names and positions of our executive officers and board members as well as our director nominees, and their ages as of September 22, 2004.
Prior to the consummation of this offering, we expect to appoint four new independent directors, consisting of DuBose Ausley, Deborah A. Bricker, James D. Edwards and John McCartney. They have consented to serve as directors. In addition, we anticipate that Paul G. Yovovich will be added to our board after the consummation of this offering.August 15, 2005.
| Name | Age | Position(s) | ||
Gary E. Holdren | Chairman of the Board, Chief Executive Officer | |||
George E. Massaro | Vice Chairman of the Board | |||
Daniel P. Broadhurst | 46 | Vice President of Operations and | ||
Gary L. Burge | Vice President, Chief Financial Officer and Treasurer | |||
| ||||
Natalia Delgado | General Counsel and Corporate Secretary | |||
James K. Rojas | 37 | Vice President of Corporate Development | ||
Mary M. Sawall | Vice President, Human Resources | |||
DuBose Ausley | Director | |||
Deborah A. Bricker | Director | |||
James D. Edwards | Director | |||
John McCartney | 52 | Director | ||
Paul G. Yovovich | 51 | Director |
The following is information regarding each of our executive officers and board members, director nominees and Mr. Yovovich.members:
Gary E. Holdren has served as our Chief Executive Officer and President and as a directorDirector since May 2004 and as Chief Executive Officer of Huron Consulting Services LLC our operating subsidiary, since June 2003 and President of Huron Consulting Services LLC since we commenced operations in May 2002. He was elected Chairman of the board of directors on November 3, 2004. Previously, he was a partner and the midwestMidwest director of global client services of Arthur Andersen LLP, where he also served on the U.S. management committee from 1991 to 1998, and the executive council of Andersen Worldwide from 1994 to 1998. Mr. Holdren has more than 30 years of experience consulting with corporations and legal counsels on complex financial and business matters as well as extensive experience serving as an expert witness. He has extensive consulting experience in international tax, antitrust and corporate civil damages and has testified as an accounting and industry expert in federal tax court and federal district courts. Mr. Holdren is a member of the board of directors of the Lyric Opera of Chicago and Cowboy Dreams, a Chicago-area charitable organization. He also serves on the executive committee and board of directors of The Joffrey Ballet of Chicago, and is a member of the Business Advisory Council of the Richard T. Farmer School of Business, Miami University-Ohio. Mr. Holdren is a certified public accountant.
George E. Massaro has served as our Chief Operating Officer and as a director since May 2004 and Vice Chairman since March 2005. He has served as Vice Chairman of Huron Consulting Services LLC since March 2005. On or about January 1, 2006, Mr. Massaro intends to reduce his workload to a part time, or approximately one-third, basis and dedicate his efforts to strategic initiatives for us, including major client assignments. He served as our Chief Operating Officer and as Chief Operating Officer of Huron Consulting Services LLC sincefrom June 2003.2003 until March 2005. Mr. Massaro joined Huron Consulting Services LLC in August 2002 as a managing director and subsequently became the leader of our disputes and investigationinvestigations and valuation services practices. Previously, he served as the managing partner of Arthur Andersen LLP’s 1,200 person New England practice from 1998 to 2002 and managing partner of the Boston office from 1995 to 1998. Mr. Massaro has served clients in the financial services and high technology industries. Mr. Massaro serves as a director of Charles River Laboratories, a provider of research products and preclinical services for the biomedical community, and of Eastern
66
Management
Bank Corporation, an independent mutual bank holding company in New England. He is a certified public accountant.
65
Management
Daniel P. Broadhurst has served as our Vice President of Operations since March 2005. He has served as Vice President and Assistant Secretary of Huron Consulting Services LLC since January 2004 and as a Managing Director of Huron Consulting Services LLC since May 2002. Mr. Broadhurst served as our Vice President, Quality and Corporate Development from May 2004 to March 2005 and as Assistant Secretary since May 2004. Mr. Broadhurst assists with the day-to-day operations and works closely with the Huron Consulting Services LLC practice group leaders regarding practice performance, resource planning and all other aspects of business planning. He also continues to serve as the Quality Officer for Huron Consulting Services LLC. His expertise covers large and complex accounting and litigation matters related to international and domestic tax law, regulatory issues, breach of contract, purchase price disputes, intellectual property, fraud, tort, environmental, and other claims against government agencies. Previously, Mr. Broadhurst served as managing partner of Arthur Andersen LLP’s 450 person Central Region economic and financial consulting group from 1998 through 2002 and managing partner for the Central Region litigation consulting group from 1996 through 1997. Mr. Broadhurst serves as Treasurer and is a board member of the Illinois CPA Society. He is a certified public accountant.
Gary L. Burge has served as our Vice President, Chief Financial Officer and Treasurer since May 2004 and as Vice President, Chief Financial Officer and Treasurer of Huron Consulting Services LLC since November 2002. Prior to joining us, he served as the chief financial officer for PrimeCo Wireless Communications from 2001 to 2002. From 1999 to 2001, Mr. Burge served as chief financial officer for Morningstar, Inc., a globally recognized provider of investment information and services to the individual and institutional marketplace. During his career, he has also held various senior management and leadership roles with 360° Communications Company, a wireless communications company, Sprint Corporation, a global communications company, and Centel Corporation, a telecommunications company, where he held positions in finance, information technology, engineering and mergers and acquisitions. Mr. Burge began his career in professional services with Deloitte & Touche LLP. He is a certified public accountant.
Daniel P. Broadhurst has served as our Vice President and Assistant Secretary since May 2004 and as Vice President and Assistant Secretarymember of Huron Consulting Services LLC since January 2004 and Managing Directorthe Department of Huron Consulting Services LLC since May 2002. He is responsible for quality and corporate development as well as providing business and financial consulting services. His expertise covers large and complex litigation matters related to international and domestic tax law, regulatory issues, breachAccountancy Advisory Board of contract, intellectual property, fraud, tort, environmental, and claims against government agencies. Previously,Northern Illinois University. Mr. Broadhurst was a partner at Arthur Andersen LLP and led the economic and financial consulting group from 1998 through 2002. HeBurge is a certified public accountant.
Natalia Delgado has served as our General Counsel and Corporate Secretary since September 2004. From January 1999 to September 2004, she was a principal at the law firm of Goldberg, Kohn, Bell, Black, Rosenbloom & Moritz, Ltd. Prior to that, Ms. Delgado was a partner at the law firm of Jenner & Block. For more than 23 years, Ms. Delgado has represented clients in securities and corporate matters, including public offerings, mergers and acquisitions and corporate restructurings. Her practice has also involved advising clients regarding compliance with securities laws and corporate governance. Ms. Delgado is a member of the board of directors of the National Women’s Law Center and is an active member of the Committee of Visitors of the University of Michigan Law School.
James K. Rojas, has served as our Vice President of Corporate Development since March 2005. He has served as a managing director of Huron Consulting Services LLC since May 2002. Mr. Rojas focuses his energies on managing alliances, joint ventures, acquisitions and workforce development. His expertise includes large and complex litigation matters related to international and domestic tax law, breach of contract, fraud, environmental issues, and antitrust. Mr. Rojas also has provided interim management services to clients, leading groups of over 300 finance and accounting professionals. Most recently, Mr. Rojas had administration responsibilities for our disputes and investigations practice in Chicago. Previously he was a partner at Arthur Andersen LLP from 2001 to 2002. Prior to that he was a senior manager in their economic and financial consulting group. He is a certified public accountant.
Mary M. Sawall has served as our Vice President, Human Resources since May 2004, as Vice President, Human Resources of Huron Consulting Services LLC since January 2004 and as Managing Director and head of Human Resources of Huron Consulting Services LLC since May 2002 when we commenced
66
Management
operations. Previously, she was executive vice president of human resources at Encore Development, a technology solutions provider, from 2000 to 2001,2002, and at Whittman-HartmarchFIRST Inc., a global business and technology solutions provider, from 1998 to 2000. She has also served as director of human resources for the Illinois practice of Deloitte & Touche LLP and has had financial and administrative management positions at Booz Allen Hamilton, a global strategy and technology consulting firm, and Cambridge Associates, a provider of investment and financial research and consulting services to nonprofit institutions.
DuBose Ausley is a nomineewas appointed to our board of directors and has consented to serve as a director.on October 12, 2004. He is an employee of Ausley & McMullen, a law firm in Tallahassee, Florida, where he was Chairman for more than 25 years prior to June 2002. Mr. Ausley is also a director of Capital City Bank Group, Inc., a financial services holding company, Tampa Electric Co., Inc. and TECO Energy, Inc., public utilities operating in the State of Florida and Blue Cross and Blue Shield of Florida, Inc. and Sprint Corporation. He was also Chairman of the Capital City Bank Group, Inc. from 1982 to 2003.
Deborah A. Bricker is a nomineewas appointed to our board of directors and has consented to serve as a director.on October 12, 2004. She has served as the President of Bricker Partners LLC, a private investment and management consulting
67
Management
company, since 1999. Ms. Bricker previously founded and was president of Bricker & Associates, Inc., an operational improvement consulting firm, from 1978 to 1999, when it was sold to Keane, Inc. She currently serves on the board of directors of Forsythe Technology, Inc., a national provider of technology infrastructure solutions, and on the boards of several not-for-profit institutions, including The Goodman Theatre, where she was the immediate past chairman, The Chicago Public Library Foundation, The University of Chicago Hospitals & Health System and The Chicago Public Education Fund.
James D. Edwardsis a nominee was appointed to our board of directors and has consented to serve as a director.on October 12, 2004. Mr. Edwards retired in 2002 as managing partner-global markets of Arthur Andersen LLP, a position he had held since 1998. Mr. Edwards began his career with Arthur Andersen LLP in 1964 and served in several positions after that time. Mr. Edwards is also a director of IMS Health Incorporated, a global provider of information solutions to the pharmaceutical and healthcare industries, and Transcend Services, Inc., a provider of medical transcription services to the healthcare industry.industry, and Crawford & Company, a global provider of claims management solutions. Mr. Edwards is a member of the American Institute of Certified Public Accountants.
John McCartney is a nomineewas appointed to our board of directors and has consented to serve as a director.on October 12, 2004. He has served as a director of Westcon Group, Inc., a specialty distributor of networking and communications equipment, for technology vendors, since August 1998 and was elected chairman of the board of directors in January 2001. Mr. McCartney served as vice chairman of the board of directors of Datatec Limited, a networking technology and services company, from October 1998 until MarchMay 2004. Since December 2003, he has served as chairman of the board of First Circle Medical, Inc., a privately heldprivately-held medical therapy company. Since 1998, Mr. McCartney has served as a director of A.M. Castle Corporation, a steel distributor, and he currently serves as lead director, chairman of the audit committee and a member of the governance committee. From June 1997 to March 1998, he held the position of president of 3Com Corporation’s Client Access Unit. He joined the executive management team of US Robotics in March 1984 as vice president and chief financial officer and served in various executive capacities until serving as president and chief operating officer of US Robotics from January 1996 until its merger with 3Com Corporation in June 1997. From 1981 to 1984, Mr. McCartney was vice president of operations of Dur-o-wal, Inc., a company that manufactures and supplies products to the masonry construction industry. From 1976 to 1981, he held the position of manager at Grant Thornton LLP, a public accounting firm. Mr. McCartney is a certified public accountant.
Paul G. Yovovich, 50, is anticipated to be added was appointed to our board after consummation of the offering. Hedirectors on November 2, 2004. Mr. Yovovich served as the Chief Executive Officer of Huron Consulting Group Inc. from our inception through April 2004. Mr. Yovovich has served as president of Lake Capital Management LLC since 1999. Previously, he held a varietyLake Capital Management LLC assisted in our formation and provided management services to us prior to our initial public offering. Lake Capital Management LLC is an affiliate of senior executive positions and was presidentHCG Holdings LLC, which is one of Advance Ross Corporation, an international financial services company, from 1993 to 1996.the
67
Management
selling stockholders in this offering. Mr. Yovovich serves on the boards of 3Com Corporation, a provider of voice and data networking products, services and solutions, several private companies and several private companies.not-for-profit entities. Mr. Yovovich is a certified public accountant. In recognition of the substantial reduction in HCG Holdings LLC’s ownership percentage following this offering, Mr. Yovovich has advised us that he intends to resign from our board in connection with this offering.
BOARD OF DIRECTORS
Our certificate of incorporation provides that our board of directors will consist of such number of directors as from time to time fixed by resolution of the board, whichboard. The number of directors is currently consistsfixed at seven. Each of two persons. We expect to increase the size of our board to include five additional members. Mr. Ausley, Ms. Bricker, Mr. Edwards and Mr. McCartney nominees to our board, will each beis an independent director in accordance with the independence requirements of the NASDAQ National Market and the rules of the SEC. We anticipate adding Mr. Yovovich to our board after consummation of the offering.
Prior to the completion of this offering, ourOur certificate of incorporation will be amended to dividedivides our board into three classes, with one class to be elected each year to serve for a three-year term. Class I directors will have an initiala term expiring in 2005,2008, Class II directors will have an initiala term expiring in 2006 and Class III directors will have an initiala term expiring in 2007.
It is expected that Class I will be comprisedis composed of Mr. YovovichMassaro and Mr. Massaro,Yovovich, Class II will be comprisedis composed of Ms. Bricker and Mr. Ausley and Class III will be comprisedis composed of Messrs. Edwards, Holdren and McCartney.
68
Management
BOARD COMMITTEES
Prior to the consummation of this offering, we plan to establishWe have three standing committees: an audit committee, a compensation committee and a nominating and corporate governance committee.
Audit committee
The audit committee will beis comprised of not fewer than three directors elected by a majority of the board. The audit committee will overseeoversees our accounting and financial reporting processes, as well as the audits of our financial statements, including retaining and discharging our auditors. Our audit committee will complycomplies with the independence requirements of the NASDAQ National Market and the rules of the SEC under the Securities Exchange Act of 1934, as amended. It is expected that theThe audit committee will beis comprised of Messrs. McCartney (Chairperson), Edwards and Ausley.
Compensation committee
The compensation committee will beis comprised of not fewer than three directors elected by a majority of the board. The compensation committee will overseeoversees the administration of our benefit plans, reviewreviews and administeradministers all compensation arrangements for executive officers and establishestablishes and reviewreviews general policies relating to the compensation and benefits of our officers and employees. Our compensation committee will complycomplies with the independence requirements of the NASDAQ National Market. It is expected that theThe compensation committee will beis comprised of Ms. Bricker (Chairperson) and Messrs. McCartney and Ausley.
Nominating and corporate governance committee
The nominating and corporate governance committee will beis comprised of not fewer than three directors elected by a majority of the board. The nominating and corporate governance committee’s responsibilities will include identifying and recommending to the board appropriate director nominee candidates and providing oversight with respect to corporate governance matters. Our nominating and corporate governance committee will complycomplies with the independence requirements of the NASDAQ National Market. It is expected that theThe nominating and corporate governance committee will beis comprised of Messrs. Edwards (Chairperson) and Ausley and Ms. Bricker.
68
Management
COMPENSATION COMMITTEE INTERLOCKS AND INSIDER PARTICIPATION
None of our executive officers will serve as a member of the board of directors or compensation committee of any entity that has one or more executive officers serving as a member of our board of directors or compensation committee.
Although we had no compensation committee during the year ended December 31, 2003, Mr. Holdren, Mr. Massaro, Ms. Sawall, Mr. Yovovich, our former Chief Executive Officer and president of Lake Capital Management LLC, and Edward A. Kovas, our former Vice President and vice president of Lake Capital Management LLC, participated in various stages of deliberation concerning executive officer compensation. See “Certain relationships and related transactions.”
COMPENSATION OF DIRECTORS
We do not currently compensate our directors for their service as members of our board of directors. After the consummation of this offering, we will pay each of our independentnon-employee directors $20,000$40,000 per year and $1,000 for each meeting of the board of directors or any committee of the board that he or she attends. Each new non-employee director receives a restricted stock award of 15,000 shares. Each non-employee director receives an additional 5,700 shares of restricted common stock annually. We also plan to pay a fee of $10,000 to the chairman of the audit committee and a fee of $7,500 to the chairs of each of the compensation committee and nominating and corporate governance committee for acting as a committee chair and to grant stock options and/or restricted common stock to independent directors under our Omnibus Stock Plan.chair. On the date of this prospectus,October 18, 2004, we intend to grant togranted each independent director options exercisable for 13,33312,903 shares of our
69
Management
common stock assuming a public offering price of $15.00 per share, the mid-point of the range shown on the cover of this prospectus.under our 2004 Omnibus Stock Plan. These options will have a per share exercise price equal to $15.50. One third of the public offering price. One-thirdoptions granted to directors vested on the grant date, one third vested on the date of these optionsour 2005 annual meeting and the final one third will vest on the grant date and one-third will vest on each of the next two2006 annual meetings. meeting.
All of our directors will beare reimbursed for out-of-pocket expenses for attending board and committee meetings.
COMPENSATION OF EXECUTIVE OFFICERS
The following table sets forth information ondiscloses the 2003 and 2004 annual and long-term compensation awarded to, earned by Mr. Holdren,or paid by us to our Chief Executive Officer and to each of our nextother four most highly compensatedhighest paid executive officers whose total compensation exceeded $100,000 for the fiscal year ended December 31, 2003.2004. We refer to these five executive officers in this prospectus as our named“named executive officers.”
Summary compensation table
| Annual compensation | Long-term compensation underlying options (#) (2) | All other compensation ($) (3) | ||||||
| Name and principal position | Salary ($) | Bonus ($) | ||||||
Gary E. Holdren(1) Chief Executive Officer and President | 750,000 | 500,375 | 43,479 | 23,878 | ||||
George E. Massaro Chief Operating Officer | 450,000 | 350,625 | 86,958 | 24,380 | ||||
Daniel P. Broadhurst Vice President and Assistant Secretary | 485,116 | 184,167 | 6,522 | 17,880 | ||||
Suzanne S. Bettman(4) Vice President, Chief Legal Officer and Secretary | 310,065 | 103,750 | 2,174 | 13,065 | ||||
Mary M. Sawall Vice President, Human Resources | 225,000 | 100,000 | 8,696 | 15,121 | ||||
| Annual compensation | Long-term compensation | All other ($)(3) | ||||||||||||
| Name and principal position | Year | Salary ($) | Bonus ($) | Other annual compensation ($)(1) | Securities underlying options/SARs (#) | Restricted stock award(s)(2) | ||||||||
Gary E. Holdren Chief Executive Officer(4) | 2004 2003 | 800,000 750,000 | 850,000 500,375 | 53,918 — | 43,479 43,479 | 158,700 — | 72,131 23,412 | |||||||
George E. Massaro Chief Operating Officer(5) | 2004 2003 | 600,000 450,000 | 300,000 350,625 | — — | 21,740 86,958 | 32,600 — | 46,957 22,980 | |||||||
Daniel P. Broadhurst Vice President and Assistant Secretary(6) | 2004 2003 | 485,000 485,000 | 142,000 184,167 | — — | 2,174 6,522 | 10,900 — | 21,866 18,963 | |||||||
Gary L. Burge Chief Financial Officer | 2004 2003 | 250,000 225,000 | 175,000 75,000 | — — | 6,522 2,174 | 10,900 — | 32,021 16,649 | |||||||
Mary M. Sawall Vice President, Human Resources | 2004 2003 | 250,000 225,000 | 150,000 100,000 | — — | 6,522 8,696 | 6,500 — | 24,617 15,540 | |||||||
(See footnotes on the following page.)
69
Management
| (1) | Other annual compensation consists of personal use of a corporate jet that we lease as needed. Other amounts, which are under the thresholds for reporting, were earned by Messrs. Massaro and Broadhurst in connection with the gross-up for taxes paid to multiple states and the payment for tax assistance services. |
| (2) | The aggregate holdings and market value of the unvested restricted common stock held as of December 31, 2004 by the individuals listed are: Mr. Holdren (158,700 shares, $3,523,140); Mr. Massaro (32,600 shares, $723,720); Mr. Broadhurst (10,900 shares, $241,980); Mr. Burge (10,900 shares, $241,980); and Ms. Sawall (6,500 shares, $144,300). The “value” is calculated according to SEC rules assuming all shares are vested as of December 31, 2004, which in fact, they have not. The shares vest 25% annually over four years from the grant date. |
| (3) | All other compensation consists of the following: |
| Mr. Holdren | Mr. Massaro | Mr. Broadhurst | Mr. Burge | Ms. Sawall | |||||||||||||
Long-term disability insurance premiums | 2004 2003 | $ | 8,336 7,382 | $ | 6,577 5,988 | $ | 4,833 4,594 | $ | 1,768 1,621 | $ | 1,669 1,496 | ||||||
Life insurance premiums | 2004 2003 | 4,030 4,030 | 5,052 4,992 | 2,369 2,369 | 3,049 3,028 | 2,065 2,044 | |||||||||||
Special payout for earned but unused paid time off | 2004 2003 | 47,465 — | 23,028 — | 2,364 — | 14,904 — | 8,583 | |||||||||||
401(k) match | 2004 2003 | 12,300 12,000 | 12,300 12,000 | 12,300 12,000 | 12,300 12,000 | 12,300 12,000 | |||||||||||
| (4) | Mr. Holdren has served as our Chief Executive Officer and President since May 2004 and as Chief Executive Officer of Huron Consulting Services LLC since June 2003 and President since we commenced operations in May 2002. During 2003, Paul G. Yovovich served as our named Chief Executive Officer, but received neither compensation nor equity grants from us. Mr. Yovovich resigned from his position as Chief Executive Officer in April 2004. |
| 401(k) match ($) | Life insurance premiums ($) | Long-term disability insurance premiums ($) | ||||
Mr. Holdren | 12,000 | 4,278 | 7,600 | |||
Mr. Massaro | 12,000 | 6,139 | 6,241 | |||
Mr. Broadhurst | 12,000 | 1,360 | 4,520 | |||
Ms. Bettman | 9,208 | 1,021 | 2,836 | |||
Ms. Sawall | 12,000 | 1,500 | 1,621 |
70
Management
Option grants in last fiscal year 2003
The following table sets forth information concerning the grant ofregarding stock options granted to each of the named executive officers during the last fiscal year. The potential realizable value is calculated based on assumed rates of2004 pursuant to our stock appreciation of 0%, 5% and 10% compounded annually from the date the options were granted until their expiration date. The assumed 0%, 5% and 10% rates of stock appreciation are based on an assumed public offering price of $15.00, the mid-point of the range shown on the cover of this prospectus. These numbers are calculated based on the requirements of the SEC and do not reflect our estimate of future stock price growth.option plans.
| Name | Number of securities underlying options granted(1) | Percent of total | Exercise or base price per share | Expiration date | Potential realizable value at assumed rates of stock price (10 years) | ||||||||||||||||||||||||||||||||
| Individual grants | |||||||||||||||||||||||||||||||||||||
| Number of securities underlying options granted(1) | % of Total options granted to employees in fiscal year | Exercise or base price ($/share) | Expiration date | Potential realizable value at assumed annual rates of stock | |||||||||||||||||||||||||||||||||
| Name | Number of securities underlying options granted(1) | Percent of total | Exercise or base price per share | Expiration date | 0% | 5% | 10% | 0% | 5% | 10% | |||||||||||||||||||||||||||
| $ | 627,185 | $ | 1,037,340 | $ | 1,666,600 | 43,479 | 7.92 | % | 1.9550 | 03/17/2014 | $ | 588,923 | $ | 1,012,843 | $ | 1,662,854 | |||||||||||||||||||||
George E. Massaro | 21,740 65,218 | 2.32 6.97 | % % | $ $ | 0.575 0.851 | 5/23/13 12/22/13 | | 313,600 922,769 | | 518,682 1,537,998 | | 833,319 2,481,880 | 21,740 | 3.96 | % | 1.9550 | 03/17/2014 | 294,468 | 506,433 | 831,446 | |||||||||||||||||
Daniel P. Broadhurst | 6,522 | 0.70 | % | $ | 0.575 | 5/23/13 | 94,080 | 155,605 | 249,996 | 2,174 | 0.40 | % | 1.9550 | 03/17/2014 | 29,447 | 50,643 | 83,145 | ||||||||||||||||||||
Suzanne S. Bettman(2) | 2,174 | 0.23 | % | $ | 0.575 | 5/23/13 | 31,360 | 51,868 | 83,332 | ||||||||||||||||||||||||||||
Gary L. Burge | 6,522 | 1.19 | % | 1.9550 | 03/17/2014 | 88,340 | 151,930 | 249,434 | |||||||||||||||||||||||||||||
Mary M. Sawall | 8,696 | 0.93 | % | $ | 0.575 | 5/23/13 | 125,440 | 207,473 | 333,328 | 6,522 | 1.19 | % | 1.9550 | 03/17/2014 | 88,340 | 151,930 | 249,434 | ||||||||||||||||||||
| (1) | All options vest 25% on each grant anniversary over four years, subject to the executive’s continued employment. |
| (2) |
Option70
Management
Aggregated option exercises in last fiscal year and fiscal year end option values at December 31, 2003
The following table sets forth information with respect to the named executive officers concerning the exercise of stock options during 2003 by eachfiscal 2004 and unexercised options held as of the named executive officers and the value at the end of our 2003 fiscal year of the unexercised options held by the named executive officers. The value realized upon exercise of stock options during 2003 and the value of unexercised in-the-money options are based on an assumed public offering price of $15.00, the mid-point of the range shown on the cover of this prospectus.2004.
| Name | Number of shares acquired on exercise | Value realized | Number of securities underlying unexercised options at December 31, 2004 | Value of unexercised in-the-money options at December 31, 2004(1) | ||||||||||||||||
| Shares acquired on exercise (#) | Value realized ($) | Number of securities underlying unexercised options exercisable/ | Value of unexercised in-the-money fiscal year end | Exercisable | Unexercisable | Exercisable | Unexercisable | |||||||||||||
Gary E. Holdren | 0 | 0 | 0/43,479 | 0/627,185 | 10,870 | 98,754 | 0 | 76,088 | 0 | 1,585,402 | ||||||||||
George E. Massaro | 10,870 | 162,800 | 0/119,568 | 0/1,724,769 | 0 | 0 | 54,349 | 86,959 | 1,188,798 | 1,836,987 | ||||||||||
Daniel P. Broadhurst | 8,153 | 122,107 | 0/30,978 | 0/460,357 | 9,784 | 93,388 | 16,303 | 7,065 | 361,552 | 149,781 | ||||||||||
Suzanne S. Bettman(1) | 0 | 0 | 10,870/34,783 | 162,796/519,749 | ||||||||||||||||
Gary L. Burge | 0 | 0 | 20,108 | 8,153 | 445,635 | 167,308 | ||||||||||||||
Mary M. Sawall | 6,251 | 93,621 | 0/27,446 | 0/406,259 | 0 | 0 | 20,924 | 13,044 | 462,832 | 273,076 | ||||||||||
| (1) |
71
Management
EMPLOYMENT AGREEMENTS
Holdren senior management agreement
Huron Consulting Services LLC has entered into a senior management agreement with Mr. Holdren. The agreement, which was effective as of May 13, 2002, has an initial term of three years and automatically renews for additional one-year periods on an annual basis unless, at least 60 days prior to the expiration of the then-current term, we or Mr. Holdren provide notice that the agreement shall not renew. The agreement provides that Mr. Holdren will report to our board of directors. Under the terms of the agreement, in 2004, Mr. Holdren’s minimum annual base salary is $800,000 and his annual performance bonus target is set by the compensation committee. In 2005, his target annual performance bonus is $850,000. His compensation is subject to annual review. Mr. Holdren has received a guaranteed minimum payment in anthe amount of $225,000$112,500 with respect to his annual bonus for the twelve months ended May 13, 2004 and will receive a minimum payment in an amount of $112,500 with respect2005. Additional bonus amounts for calendar 2005 may be paid to his annual bonus for the twelve months ending May 13, 2005, with such amounts being paid in four quarterly installments during the annual employment period to which they relate. The remaining amount of the annual bonus to be received by Mr. Holdren will be based on the achievement of performance goals set by our compensation committee. Mr. Holdren is also eligible for additional bonuses in the event that our annual earnings exceed targets set by the compensation committee, in amounts that the compensation committee determines to be appropriate.
Mr. Holdren’s agreement provides that if his employment is terminated by us without cause, if he resigns for good reason (as such terms are defined in the agreement) or if he is terminated in connection with a non-renewal of the agreement prior to the fifth anniversary of its execution, Mr. Holdren will be entitled to severance pay of $1,500,000, payable over the twelve-month period following termination, along with continuation of medical and dental benefits during such twelve-month period. All other company provided perquisites and benefits will be subject to the treatment provided under the terms of the applicable plans or programs. If Mr. Holdren is terminated by us without cause or if he resigns for good reason within twelve months of a qualified change of control, the $1,500,000 will be paid in a lump sum. Mr. Holdren or his estate is entitled to severance pay of six-months’six months’ base salary over the six-month period following his death or disability, along with continuation of medical benefits. In order to receive any of these severance payments, Mr. Holdren must execute a general release in favor of us. Mr. Holdren is also entitled to coverage under our directors and officers insurance policy for six years following his termination, subject to specified exceptions and limitations. Mr. Holdren has agreed to certain restrictive covenants that will survive for a period of one to three years following the termination of his employment pursuant to which he will not solicit our clients or interfere with our relationships with our employees or customers.
71
Management
Mr. Holdren’s agreement provided for the purchase by him of 391,305 shares of our common stock, on December 10, 2002, pursuant to a separate restricted shares award agreement under our 2002 Equity Incentive Plan. On December 10, 2002, Mr. Holdren purchased the 391,305All of these shares became fully vested upon consummation of our common stock, at a purchase price of $0.02 per share. The restricted shares award agreement provides us with repurchase rights with respect to these shares that, except in certain circumstances, lapse over a three-year vesting period, subject to acceleration upon the occurrence of certain specified events, including a qualifiedinitial public offering of shares of our common stock. Pursuant to the acceleration provision, Mr. Holdren’s unvested restricted shares will fully vest immediately prior to the consummation of this offering.in October 2004. In addition, Mr. Holdren will havehas the ability to exercise certain piggyback registration rights with respect to these shares. Pursuant to these piggyback registration rights, if following the consummation of this offering, we propose any underwritten public offering of our equity securities pursuant to an effective registration statement under the Securities Act (other than a registration statement relating to our employee benefit plans, exchange offers by us or a merger or acquisition of a business or assets by us), Mr. Holdren is entitled to include his shares of common stock in that registration, subject to certain limitations,cut back provisions in the event that, in connection with all registration expenses paid by us.
72
Management
Pursuant to a separate restricted shares award agreement under our 2002 Equity Incentive Plan, on December 31, 2002,an underwritten offering, the managing underwriter advises us and Mr. Holdren purchased an additional 130,435that the inclusion of all the securities sought to be included in the registration by us, Mr. Holdren, any persons who have sought to have shares registered thereunder pursuant to demand registration rights and any other proposed sellers would adversely affect the marketability of our common stock, at a purchase price of $0.02 per share. We have repurchase rights with respectthe securities sought to these shares.be sold pursuant thereto. Pursuant to the agreement, any unvested restricted common shares will fully vest immediately priorwe are obligated to pay all expenses incidental to our performance of, or compliance with, our obligations in connection with the consummation of this offering. Mr. Holdren does not havepiggyback registration rights with respect to these 130,435 restricted common shares.
Mr. Holdren has subsequently been granted options to acquire an additional 86,958 shares of our common stock under our 2003 Equity Incentive Plan.rights.
In September 2004, we adopted an amendment to Mr. Holdren’s senior management agreement that provides Mr. Holdren with certain change of control benefits. Pursuant to the amendment, if Mr. Holdren’s employment is terminated within the 24 months following a change of control, either by us without cause or by Mr. Holdren with good reason, which includes not being the chief executive officerChief Executive Officer of the successor entity, all of his unvested equity awards will immediately become vested and exercisable and he will be entitled to severance pay of three times the total of his then currentthen-current base salary and target annual bonus. In the event of such termination, he will also be entitled to a pro-rata bonus for the year during which his termination occurs, 36 months of benefit continuation, and, if necessary, an excise tax gross-up payment.
Massaro senior management agreement
Huron Consulting Services LLC has also entered into a senior management agreement with Mr. Massaro. Mr. Massaro’s agreement, which was effective August 12, 2002, has an initial three-year term and automatically renews for additional one-year periods on an annual basis unless, at least 60 days prior to the expiration of the then-current term, we or Mr. Massaro provide notice that the agreement shall not renew. Under the terms of the agreement, Mr. Massaro receives a minimum annual base salary, of $350,000which generally cannot be reduced once increased, and has anis eligible to participate in our annual performance bonus target during his initial three year term of $150,000.plan. His compensation is subject to annual review. For 2005, Mr. Massaro’s annual base salary has been set at $600,000 and his annual bonus target has been set at $300,000. Mr. Massaro has received a guaranteed minimum bonus payment of $75,000$37,500 with respect to his annual bonus for the twelve months ended August 12, 2004 and will receive a guaranteed minimum2005. Additional bonus payment of $37,500amounts for the twelve months ending August 12,calendar 2005 payable in quarterly installments during the annual employment period. The remaining amount of the annual bonusmay be paid to be received by Mr. Massaro will be based on the achievement of performance goals set by the compensation committee. Mr. Massaro is also eligible for additional bonuses in the event that our annual earnings exceed targets set by our compensation committee or the Chief Executive Officer, in amounts that the compensation committee determines to be appropriate.
Mr. Massaro was also granted options to acquire 21,740 shares of our common stock under our 2002 Equity Incentive Plan at the time his employment commenced. Mr. Massaro has subsequently been granted options to acquire an additional 21,740 shares of our common stock under our 2002 Equity Incentive Plan and options to acquire an additional 108,698 shares of our common stock under our 2003 Equity Incentive Plan. In accordance with the original terms of the grants under our 2002 Equity Incentive Plan, the options granted under that plan will vest in full in connection with thevested fully upon consummation of this offering.our initial public offering in October 2004.
Mr. Massaro’s agreement provides that if his employment is terminated by us without cause or if he resigns for good reason (as such terms are defined in the agreement), he will be entitled to severance pay
72
Management
equal to six months’ base salary and medical benefits, which amount is subject to offset for remuneration earned by Mr. Massaro during the six-month period following such a termination. In order to receive such severance payments, Mr. Massaro must execute a general release in favor of us. Mr. Massaro or his
73
Management
estate is entitled to severance pay of three monthsmonths’ base salary payable over the three-month period following his death or disability, along with continuation of medical benefits. Mr. Massaro has also agreed to certain restrictive covenants that will survive for one year following the termination of his employment pursuant to which, among other things, he will not solicit our clients or interfere with our relationships with our employees or customers.
In September 2004, we adopted an amendment to Mr. Massaro’s senior management agreement that provides Mr. Massaro with certain change in control benefits. Pursuant to the amendment, if Mr. Massaro’s employment is terminated within the 24 months following a change of control, either by us without cause or by Mr. Massaro for good reason (as provided in the agreement), all of his unvested equity awards that were granted prior to such change of control will immediately become vested and exercisable, and he will be entitled to severance pay of two times the total of his then currentthen-current base salary and target annual bonus. In the event of such a termination, he will also be entitled to a pro-rata bonus for the year during which his termination occurs and 24 months of medical benefit continuation. In certain situations, Mr. Massaro may be entitled to an excise tax gross-up payment, or his severance benefits may be reduced to limit his excise tax burden.
On or about January 1, 2006, Mr. Massaro intends to reduce his workload to a part time, or approximately one-third, basis and dedicate his efforts to strategic initiatives for us, including major client assignments. Prior to this occurring, we intend to adopt a second amendment to Mr. Massaro’s senior management agreement that will supersede all previous agreements. This second amendment to his agreement, which will have an effective date no later than December 31, 2005, allows for Mr. Massaro to work 60 hours per month on average during a calendar year. Effective as of the date of the second amendment, Mr. Massaro will receive a minimum annual base salary of $200,000 and will be eligible for a discretionary incentive. All stock options held as of the effective date of the agreement will continue to vest and the term of the awards will not change as long as Mr. Massaro remains employed by us or a member of the board. Unvested restricted stock from the October 12, 2004 grant will be cancelled on the agreement’s effective date and restricted stock granted March 17, 2005 will continue to vest as long as Mr. Massaro remains employed by us or a board member. Mr. Massaro will not be eligible for future equity grants unless he is working on a full-time basis as defined by the company.
Broadhurst senior management agreement
Huron Consulting Services LLC has also entered into a senior management agreement with Mr. Broadhurst. Mr. Broadhurst’s agreement, which was effective May 15, 2002, has an initial three-year term and automatically renews for additional one-year periods on an annual basis unless, at least 60 days prior to the expiration of the then-current term, we or Mr. Broadhurst provide notice that the agreement shall not renew. Under the terms of the agreement, Mr. Broadhurst receives an annual base salary of no less than $485,000 and an annual target bonus for the initial term of $260,000 and has$260,000. Mr. Broadhurst received a guaranteed minimum bonus payment of $130,000$65,000 with respect to such bonus for the twelve months ended May 15, 2004 and has a guaranteed minimum2005. Additional bonus payment of $65,000amounts for the twelve months ending May 15,calendar 2005 tomay be paid in quarterly installments during the annual employment period. The remaining amount of the annual bonus to be received by Mr. Broadhurst will be based on the achievement of performance goals set by the compensation committee.Chief Executive Officer. Mr. Broadhurst is also eligible for additional bonuses in the event that our annual earnings exceed targets set by theour compensation committee or the Chief Executive Officer, in amounts that the compensation committee determines to be appropriate.
73
Management
Mr. Broadhurst was also granted options to acquire 32,609 shares of our common stock under our 2002 Equity Incentive Plan at the time his employment commenced. In accordance with the original terms of the grant, these options will vest in full in connection with thevested fully upon consummation of this offering. Mr. Broadhurst has subsequently been granted options to acquire an additional 8,696 shares of our common stock under our 2003 Equity Incentive Plan, which will not vest as a result of the consummation of this offering.initial public offering in October 2004.
Mr. Broadhurst’s agreement provides that if his employment is terminated by us without cause or if he resigns for good reason (as such terms are defined in the agreement), he will be entitled to severance pay equal to six months’ base salary and medical benefits, which amount is subject to offset for remuneration earned by Mr. Broadhurst during the six-month period following such a termination. In order to receive such severance payments, Mr. Broadhurst must execute a general release in favor of us. Mr. Broadhurst or his estate is entitled to severance pay of three months’ base salary payable over the three-month period following his death or disability, along with continuation of medical benefits. Mr. Broadhurst has also agreed to certain restrictive covenants that will survive for one year following the termination of his employment pursuant to which, among other things, he will not solicit our clients or interfere with our relationships with our employees or customers.
74
Management
In September 2004, we adopted an amendment to Mr. Broadhurst’s senior management agreement that provides Mr. Broadhurst with certain change in control benefits. Pursuant to the amendment, if Mr. Broadhurst’s employment is terminated within the 24 months following a change of control, either by us without cause or by Mr. Broadhurst for good reason (as provided in the agreement), all of his unvested equity awards that were granted prior to such change of control will immediately become vested and exercisable, and he will be entitled to severance pay equal to the total of one year of his then currentthen-current base salary and his then current target annual bonus. In the event of such a termination, he will also be entitled to a pro-rata bonus for the year during which his termination occurs and 12 months of medical benefit continuation. In certain situations, these benefits may be reduced to limit Mr. Broadhurst’s excise tax burden.
BettmanBurge senior management agreement
Huron Consulting Services LLC hadhas also entered into a senior management agreement with Ms. BettmanMr. Burge. Mr. Burge’s agreement, which was effective November 25, 2002, has an initial one-year term and automatically renews for additional one-year periods on an annual basis unless, at least 60 days prior to her resignationthe expiration of the then-current term, we or Mr. Burge provide notice that the agreement will not renew. Under the terms of the agreement, Mr. Burge receives an annual base salary, which generally cannot be reduced once increased, and is eligible to participate in Februaryour annual performance bonus plan. For 2005, Mr. Burge’s annual base salary has been set at $275,000 and his annual bonus target has been set at $200,000. Mr. Burge is also eligible for additional bonuses in the event that our annual earnings exceed targets set by our compensation committee or the Chief Executive Officer, in amounts that the compensation committee determines to be appropriate.
Mr. Burge was also granted options to acquire 26,087 shares of our common stock under our 2002 Equity Incentive Plan at the time his employment commenced. In accordance with the original terms of the grants under our 2002 Equity Incentive Plan, options granted under that plan vested fully upon consummation of our initial public offering in October 2004. Ms. Bettman did not receive any
Mr. Burge’s agreement provides that if his employment is terminated by us without cause or if he resigns for good reason (as such terms are defined in the agreement), he will be entitled to severance pay equal to six months’ base salary, which amount is subject to offset for remuneration earned by Mr. Burge during the six-month period following such a termination, earned but unpaid annual bonus for the calendar year immediately preceding the termination, and continuation of medical benefits for six months. In order to receive such severance payments, Mr. Burge must execute a general release in connectionfavor of us. Mr. Burge or his estate is entitled to severance pay of three months’ base salary payable over the
74
Management
three-month period following his death or disability, along with her resignation. Certaincontinuation of medical benefits. Mr. Burge has also agreed to certain restrictive covenants of the agreementthat will survive for one year following her resignationtermination of his employment pursuant to which, among other things, she agreedhe will not to solicit our clients or interfere with our relationships with our employees or customers.
In September 2004, we adopted an amendment to Mr. Burge’s senior management agreement that provides Mr. Burge with certain change in control benefits. Pursuant to the amendment, if Mr. Burge’s employment is terminated within 24 months following a change of control, either by us without cause or by Mr. Burge for good reason (as provided in the agreement), all of his unvested equity awards that were granted prior to such change of control will immediately become vested and exercisable, and he will be entitled to severance pay equal to the total of one year of his then-current base salary and his then-current target annual bonus. In the event of such a termination, he will also be entitled to a pro-rata bonus for the year during which his termination occurs and 12 months of medical benefit continuation. In certain situations, these benefits may be reduced to limit Mr. Burge’s excise tax burden.
Sawall senior management agreement
Huron Consulting Services LLC has also entered into a senior management agreement with Ms. Sawall. Ms. Sawall’s agreement, which was effective May 1, 2002, hashad an initial one-year term and automatically renews for additional one-year periods on an annual basis unless, at least 60 days prior to the expiration of the then-current term, we or Ms. Sawall provide notice that the agreement shallwill not renew. Under the terms of the agreement, Ms. Sawall receives an annual base salary, of no less than $225,000which generally cannot be reduced once increased, and is eligible to participate in our annual performance bonus plan. For 2005, Ms. Sawall’s annual base salary has been set at $275,000 and her annual bonus target has been set at $150,000. Ms. Sawall is also eligible for additional bonuses in the event that our annual earnings exceed targets set by theour compensation committee or the Chief Executive Officer, in amounts that the compensation committee determines to be appropriate.
Ms. Sawall was also granted options to acquire 16,305 shares of our common stock under our 2002 Equity Incentive Plan at the time her employment commenced. Ms. Sawall has subsequently been granted options to acquire an additional 8,696 shares of our common stock under our 2002 Equity Incentive Plan and options to acquire an additional 15,218 shares of our common stock under our 2003 Equity Incentive Plan. In accordance with the original terms of the grants under our 2002 Equity Incentive Plan, the options granted under that plan will vest in full in connection with thevested fully upon consummation of this offering.our initial public offering in October 2004.
Ms. Sawall’s agreement provides that if her employment is terminated by us without cause or if she resigns for good reason (as such terms are defined in the agreement), she will be entitled to severance pay equal to six months’ base salary and medical benefits, which amount is subject to offset for remuneration earned by Ms. Sawall during the six-month period following such a termination. In order to receive such severance payments, Ms. Sawall must execute a general release in favor of us. Ms. Sawall or her estate is entitled to severance pay of three months’ base salary payable over the three-month period following her death or disability, along with continuation of medical benefits. Ms. Sawall has also agreed to certain restrictive covenants that will survive for one year following termination of her employment pursuant to which, among other things, she will not interfere with our relationships with our employees or customers.
In September 2004, we adopted an amendment to Ms. Sawall’s senior management agreement that provides Ms. Sawall with certain change in control benefits. Pursuant to the amendment, if Ms. Sawall’s employment is terminated within the 24 months following a change of control, either by us without cause or by Ms. Sawall for good reason (as provided in the agreement), all of her unvested equity awards
75
Management
that were granted prior to such change of control will immediately become vested and exercisable, and she will be entitled to severance pay equal to the total of one year of her then currentthen-current base salary and her then currentthen-current target annual bonus. In the event of such a termination, she will also be entitled to a pro-rata bonus for the year during which her termination occurs and 12 months of medical benefit continuation. In certain situations, these benefits may be reduced to limit Ms. Sawall’s excise tax burden.
75
Management
EQUITY INCENTIVE PLANS
Existing equity incentive plans
We have adopted three equity incentive plans (our 2003 Equity Incentive Plan, our 2002 Equity Incentive Plan and our Amended and Restated 2002 Equity Incentive Plan (California)). Our existing prior to our initial public offering. These equity incentive plans provide for the grant of equity options, equity appreciation rights and equity awards to our officers, employees, third-party consultants and advisors. Following the consummation of thisSince our initial public offering, no further awards have been or will be granted under these equity incentive plans. Since our initial public offering, we have and will continue to issue future stock-based awards only under our 2004 Omnibus Stock Plan, which we adopted immediately prior to the completion of our initial public offering, further described below.
We have reserved 2,802,828 shares of common stock for issuance under our three existing equity incentive plans.plans adopted prior to our initial public offering. Of that number, as of September 17, 2004,August 15, 2005, 521,740 shares have been issued as restricted stock awards, all of which are fully vested, and 379,936639,536 shares have been issued upon the exercise of options. As of September 17, 2004, 1,670,041August 15, 2005, 1,255,108 shares of common stock are issuable upon the exercise of outstanding options, with a weighted average exercise price of $0.75$0.78 per share. Following consummationAs of this offering, all 521,740 shares subject to restricted stock awards granted in 2002 will be fully vested andAugust 15, 2005, options exercisable for 485,320594,748 shares issued pursuant to our existingthese equity incentive plans will beare fully vested.
Our compensation committee will administer our existingadministers these equity incentive plans following the consummation of this offering.plans. Our compensation committee may amend, suspend or terminate the plans at any time. Additionally, our compensation committee may amend the terms of any outstanding awards, except that any award amendment that would adversely affect the rights of an award holder must be consented to by the award holder, unless the amendment is made either to avoid an expense charge to our company or to allow us take a deduction under the tax code.
2004 Omnibus Stock Plan
Prior to the consummation of thisIn connection with our initial public offering, we intend to adopt a newadopted our 2004 Omnibus Stock Plan, or the Omnibus Plan, which will replacereplaced our then existing plans for grants of equity-based compensation following the consummation of this offering.compensation. There are several types of awards that may be granted under the Omnibus Plan: stock options (including both incentive stock options, or ISOs, within the meaning of Section 422 of the Internal Revenue Code and nonqualified options, which are options that do not qualify as ISOs), stock appreciation rights, restricted stock, phantom stock, stock bonus awards, and other equity-based awards valued in whole or in part by reference to, or otherwise based on, our common stock. A total of 2,141,000 shares of common stock are reserved for issuance under the Omnibus Plan, subject to equitable adjustment upon certain corporate transactions or events. Of that number, as of August 15, 2005, 1,411,397 shares have been issued as restricted stock awards and are outstanding, none of which are vested, and no shares have been issued upon the exercise of options. As of August 15, 2005, 126,098 shares of common stock are issuable upon the exercise of outstanding options, with a weighted average exercise price of $15.94 per share. As of August 15, 2005, options exercisable for 34,408 shares issued pursuant to the Omnibus Stock Plan are fully vested. Shares subject to an award that remain unissued upon the cancellation or termination of the award will again become available for award under the Omnibus Plan, as shall any shares subject to an award that are retained by us as payment of the exercise price or tax withholding obligations and previously owned shares surrendered to us as payment of the exercise price of an option or to satisfy tax withholding obligations. In addition, to the extent an award is paid or settled in cash, the number of shares previously subject to the award shall again be available for grants pursuant to the Omnibus Plan.
76
Management
The Omnibus Plan will beis administered by our compensation committee. Our officers, employees and non-employee directors and third-party consultants are eligible to receive awards under the Omnibus Plan in the discretion of the compensation committee. The compensation committee will havehas the responsibility for
76
Management
interpreting the planOmnibus Plan and determining all of the terms and conditions of awards made under the plan,Omnibus Plan, including when they will become exercisable or otherwise vest. The compensation committee has the authority to accelerate the exercisability and/or vesting of any outstanding award at such times and under such circumstances as it deems appropriate. The Omnibus Plan may be amended by our board, subject to stockholder approval where necessary to satisfy legal or regulatory requirements. The Omnibus Plan will terminate not later than the tenth anniversary of its adoption. Awards granted before the termination of the Omnibus Plan may extend beyond that date in accordance with their terms.
The Omnibus Plan is intended to permit the grant of performance-based compensation within the meaning of Section 162(m) of the Internal Revenue Code, which generally limits the deduction that we may take for compensation of our five most senior executive officers. Under Section 162(m), certain compensation, including compensation based on the attainment of performance goals, will not be subject to this limitation if certain requirements are met. The vesting of awards that are intended to qualify as performance based compensation will be based upon business criteria as established by the compensation committee from time to time.
To date, no awards have been granted under the Omnibus Plan. Other than with respect to the shares of restricted common stock and options that we intend to grant on the date of this prospectus as described below and with respect to our contractual obligations to issue a total of 8,696 options per year to certain third-party consultants, inasmuch as awards under the Omnibus Plan will be granted at the sole discretion of our compensation committee, it is not possible at this time to determine either the persons who will receive awards under the Omnibus Plan or the amount of any such awards. On the date of effectiveness of the registration statement of which this prospectus forms a part, we intend to fileWe filed a registration statement on Form S-8 covering the shares of our common stock reserved for issuance under the Omnibus Plan and our existing equity incentive plans. On the date of this prospectus, we intend to grant pursuant to the Omnibus Plan 769,700 shares of restricted stock to our executive officers and certain of our employees, options exercisable for 75,800 shares of our common stock, with a per share exercise price equal to the public offering price, to one of our executive officers and certain of our employees and options exercisable for 13,333 shares of our common stock, with a per share exercise price equal to the public offering price and assuming a public offering price of $15.00 per share, the mid-point of the range shown on the cover of this prospectus, to each of our independent directors. See “Certain relationships and related transactions—Equity compensation awards to be granted on the date of this prospectus.”
77
Certain relationships and related transactions
The following organizational chart sets forth the corporate structure and percentage ownership of uscommon interests in HCG Holdings LLC and of our parent, HCG Holdings LLC,common stock after giving effect to this offering (without giving effect to the exercise of the underwriters’ over-allotment option). Our post-offering ownership structure gives effect to the issuance by us of 769,700 shares of restricted common stock to be granted to our executive officers and certain of our employees on the date of this prospectus, but does not give effect to 1,670,0411,381,206 shares of common stock issuable upon the exercise of outstanding options at September 17, 2004, 75,800August 15, 2005 (including shares of our common stock issuablethat will be issued upon the exercise of options to be granted to one of our executive officers andby certain of our employees on the date ofselling stockholders in connection with this prospectus or 53,332 shares of common stock issuable upon the exercise of options to be granted to our independent directors on the date of this prospectus.offering).
| (1) | The |
(Footnotes continued on following page.)
78
Certain relationships and related transactions
| (2) | Lake Capital Partners LP and Lake Capital Management LLC own 40.9% and 0.1%, respectively, of the common interests in HCG Holdings LLC and collectively have investment and voting control over the shares of our common stock held by HCG Holdings LLC. Lake Capital Investment Partners LP is the sole general partner of Lake |
(Footnotes continued on following page.)
78
Certain relationships and related transactions
| Capital Partners LP and Lake Partners LLC is the sole general partner of Lake Capital Investment Partners LP. Terence M. Graunke and Paul G. Yovovich are the members and managers of Lake Partners LLC as well as members of an investment committee of Lake Capital Investment Partners LP and, in such roles, these individuals have investment and voting control over, and may be deemed to be the beneficial owners of, the shares ultimately controlled by Lake Capital Investment Partners LP. Mr. Graunke is also the controlling member of Lake Capital Management LLC and, pursuant to the Lake Capital Management LLC operating agreement, has investment and voting control over, and may be deemed to be the beneficial owner of, the shares controlled by that entity. Each of Mr. Graunke and Mr. Yovovich disclaims beneficial ownership of the shares of common stock owned by HCG Holdings LLC. Each of Mr. Graunke and Mr. Yovovich individually own |
| (3) | The PPM America Funds consist of PPM America Private Equity Fund, L.P. and a related fund, Old Hickory Fund I, LLC, which own |
| (4) | This group consists of 31 other investors holding the interests. None of the holders in this group own more than 1.0% of the |
| (5) | Mr. Holdren has been attributed for purposes of this chart ownership of |
INCORPORATION TRANSACTIONS
Initial capitalization
On April 23, 2002, Lake Capital Management LLC, Lake Huron Investors LLC, PPM America Private Equity Fund, L.P., or PPM LP, and Old Hickory Fund I, LLC, or Old Hickory, organized our parent, HCG Holdings LLC, for the purpose of forming Huron Consulting Group Inc. with capital from these investors.
| Ø | Common stock. Between April and June 2002, HCG Holdings LLC acquired an aggregate of 11,281,243 shares of our common stock at a purchase price of $0.02 per share for an aggregate consideration of approximately $0.3 million. |
| Ø | 8% preferred stock. Between April and June 2002, HCG Holdings LLC acquired an aggregate of 12,500 shares of our 8% preferred stock for an aggregate consideration of $12.5 million. The 8% preferred stock |
| Ø | 8% promissory notes. Between June and September 2002, we also received proceeds of approximately $10.1 million from the issuance of 8% promissory notes to HCG Holdings LLC. Interest on the promissory notes, which |
HCG Holdings LLC currently owns approximately 93%50.1% of our outstanding common stock and all of our outstanding 8% preferred stock and 8% promissory notes.stock. HCG Holdings LLC is controlled by Lake Capital Partners LP and Lake Capital Management LLC. The remaining equity interests in HCG Holdings LLC are held by PPM LP, Old Hickory and seven related Goldman Sachs private equity funds, some of our executive officers and 24 of our other managing directors, eachthree of our board members a director nominee and 31 other holders. The executive officers and members or nominee of our board holding interests in HCG Holdings LLC are Messrs. Broadhurst, Burge, Holdren, Massaro, McCartney, Rojas and McCartney,Yovovich (with respect to his direct interest) who hold 0.1%0.09%,
79
Certain relationships 0.09%, 0.17%, 0.09%, 0.04% and related transactions
0.1%, 1.7%, 0.2% and 0.1%,3.0% respectively, of the common interests and 0.1%, 0.1%, 1.9%, 0.2% and 0.1%, respectively, of the preferred interests in HCG Holdings LLC. Mr. Yovovich whom we expect to add to our board after the consummation of this offering, is president and a member of Lake Capital Management LLC and controls Lake Capital Partners LP. Mr. Yovovich also directly holds 2.9% of the common interests and 1.0% of the preferred interests in HCG Holdings LLC.
Management agreement and services
On April 23, 2002, HCG Holdings LLC entered into a Management Agreement on our behalf with Lake Capital Management LLC, which led the group of investors that sponsored our formation. Pursuant to the agreement, Lake Capital Management LLC agreed to assist in our formation and provide general management services for us, including consultation, advice and assistance with respect to operations, strategic planning, financing and other aspects of our business. In 2002, Lake Capital Management LLC was paid fees of $1.5 million under this agreement, $0.5 million of which was paid by canceling a promissory note issued by Lake Capital Management LLC to HCG Holdings LLC on the date the management agreement was executed. The cancelled promissory note had a principal amount of $0.5 million, did not accrue interest and had a final maturity date of July 14, 2002. HCG Holdings LLC agreed to lend Lake Capital Management LLC the $0.5 million in order to induce Lake Capital Management LLC to enter into the agreement. In connection with the termination of the agreement in July 2002, HCG Holdings LLC agreed to lend Lake Capital Management LLC an additional $1.0 million pursuant to a promissory note issued by Lake Capital Management LLC to HCG Holdings LLC and to pay $1.0 million to Lake Capital Management LLC upon the consummation of the investment of Lake Capital Partners LP in HCG Holdings LLC. Upon Lake Capital Partners LP’s investment, the $1.0 million was paid by the cancellation of the promissory note. The cancelled promissory note had a principal amount of $1.0 million, did not accrue interest and had a final maturity date of January 5, 2003. HCG Holdings LLC agreed to lend Lake Capital Management LLC the $1.0 million in order to induce Lake Capital Management LLC to terminate the management agreement. The only provisions of the agreement surviving termination relate to the limitation of Lake Capital Management LLC’s liability to us for any and all losses arising out of the services performed under the agreement, except for liability related to unlawful conduct or a failure to act in good faith and in a manner reasonably believed to be in our best interests, and our obligation to indemnify Lake Capital Management LLC and persons related to it against such losses or liabilities, subject to specified exceptions. Mr. Yovovich has been a member and served as a president of Lake Capital Management LLC since 1999.
From time to time, Huron Consulting Services LLC reimburses Lake Capital Management LLC for its out-of-pocket expenses in connection with its provision of requested management advice. Under this arrangement, we paid approximately $195,600 for the partial year ended December 31, 2002, approximately $97,000 for the year ended December 31, 2003 and $84,000 for the six months ended June 30, 2004. Certain employees of Lake Capital Management LLC have served as officers and directors of Huron Consulting Group Inc. and Huron Consulting Services LLC until May 2004.
Advisory services agreement
On April 23, 2002, HCG Holdings LLC entered into an Advisory Services Agreement on our behalf with PPM LP, which owns approximately 31% of the equity interests in HCG Holdings LLC. Pursuant to the agreement, PPM LP agreed to provide general management and other corporate advisory services to us, including consultation, advice and assistance with respect to financing and other aspects of our business. In 2002, PPM LP was paid $0.3 million under this agreement. The agreement was terminated in July 2002. The only provision of the agreement surviving termination relates to the limitation of PPM LP’s liability to us for any and all losses arising out of the services performed under the agreement, except for liability related to unlawful conduct or a failure to act in good faith and in a manner reasonably believed to be in our best interests.
8079
Certain relationships and related transactions
OTHER ISSUANCES OF SECURITIES
Holdren restricted common stock
In December 2002, we issued a total of 521,740 shares of restricted common stock to Mr. Holdren at a purchase price of $0.02 per share for aggregate consideration of $12,000. Mr. Holdren has transferred these shares to a trust for the benefit of his family. 163,043 of Mr. Holdren’s shares of restricted common stock are currently vested and the remaining 358,697 shares will fully vest immediately prior to consummation of this offering. As described below, Mr. Holdren has been granted certain piggyback registration rights with respect to 391,305 of his shares of restricted common stock.
Stock options
Since August 2002, when we made our first grant of stock options, through September 17, 2004, we have issued to officers, employees and third-party consultants options to purchase 2,213,641 shares of common stock with per share exercise prices ranging from $0.02 to $1.96, and have issued 379,936 shares of common stock upon exercise of such options for an aggregate consideration of $44,185. As of September 17, 2004, options to purchase 163,664 shares of common stock have been forfeited or cancelled, and options to purchase 1,670,041 shares of common stock, with a weighted average exercise price of $0.75 per share, remain outstanding.
CLASS A COMMON STOCK OWNERSHIP AGREEMENTS
We have entered into a Stock Ownership Agreement with each of the holders of our Class A common stock, including HCG Holdings LLC, and each holder of options to purchase shares of our Class A common stocks. These agreements impose restrictions on transfers of shares of our Class A common stock, provide drag-along rights with respect to certain transfers of our securities and impose a 180-day lock-up agreement following the effectiveness of an underwritten offering of our equity securities. The transfer restrictions and drag-along rights terminate in connection with a qualified public offering, including this offering. Immediately prior to the consummation of this offering, we will terminate the Stock Ownership Agreement between us and HCG Holdings LLC.
EQUITY COMPENSATION AWARDS TO BE GRANTED ON THE DATE OF THIS PROSPECTUS
On the date of this prospectus, after the effectiveness of the registration statement of which this prospectus forms a part and after a registration statement on Form S-8 relating to our 2004 Omnibus Stock Plan is filed and becomes effective, we intend to grant equity-based compensation awards under that plan to our executive officers and certain of our employees and each of our independent directors, as follows:
Restricted stock awards
We intend to grant a total of 769,700 shares of restricted common stock to our executive officers and certain of our employees. These shares will vest over a four year period, with 25% vesting on each anniversary of the grant date during the period. Our executive officers who will be granted shares of restricted common stock are Messrs. Holdren, Massaro, Burge and Broadhurst, Ms. Delgado and Ms. Sawall, who will be granted 158,700, 32,600, 10,900, 10,900, 8,700 and 6,500 shares of restricted common stock, respectively. Based on a public offering price of $15.00 per share, the mid-point of the range shown on the cover of this prospectus, the aggregate value of the shares of restricted common stock to be granted to Messrs. Holdren, Massaro, Burge and Broadhurst, Ms. Delgado and Ms. Sawall is $2,380,500, $489,000, $163,500, $163,500, $130,500 and $97,500 respectively.
Employee stock option awards
We intend to grant options to purchase 75,800 shares of our common stock to certain of our employees on the date of this prospectus, including one of our executive officers, Ms. Delgado, who will receive
81
Certain relationships and related transactions
options to purchase 13,100 of these shares. These options will have a per share exercise price equal to the public offering price and will vest over a four year period, with 25% vesting on each anniversary of the grant date during the period.
Independent director stock option awards
We intend to grant to each of four independent directors options exercisable for 13,333 shares of our common stock, assuming a public offering price of $15.00 per share, the mid-point of the range shown on the cover of this prospectus. These options will have a per share exercise price equal to the public offering price. One-third of these options will vest on the grant date and one-third will vest on each of the next two annual meetings.
SPECIAL DIVIDEND
On May 12, 2004, we declared a special dividend on each outstanding share of our common stock and 8% preferred stock payable to holders of record on May 25, 2004. We paid the special dividend on June 29, 2004. The 8% preferred stock participated on an as converted basis. The aggregate amount of the dividend was $1.25 million, or $0.09 per share of common stock and $22.18$9.64 per share of 8% preferred stock. HCG Holdings LLC used the proceeds it received from the special dividend together with other funds of HCG Holdings LLC to redeem a portion of its outstanding preferred interests on a pro rata basis. In connection with this redemption, Messrs. Broadhurst, Burge, Holdren, Massaro, McCartney, Rojas and McCartneyYovovich (with respect to his direct interest) received an aggregate amount of approximately $4,540, $4,540, $90,788,$90,790, $9,079, $4,540, $2,270 and $4,540,$46,530, respectively, of which approximately $1,097, $1,097, $21,933, $2,193, $1,097, $548 and $1,097,$11,242, respectively, was paid out of the proceeds of the dividend. Prior to consummation of this offering, HCG Holdings LLC will redeem the 1.7% common membership interest formerly held by Mr. Holdren in exchange for shares of our common stock owned by HCG Holdings LLC and certain cash consideration.
REDEMPTION OF 8% PREFERRED STOCK AND REPAYMENT OF 8% PROMISSORY NOTES WITH INITIAL PUBLIC OFFERING PROCEEDS
Upon consummation of thisthe initial public offering, we will use approximatelyused $15.1 million of our estimated net proceeds to redeem our outstanding 8% preferred stock and approximately $10.7 million to repay our outstanding 8% promissory notes. See “Use of proceeds.” All of our 8% preferred stock and 8% promissory notes arewere owned by HCG Holdings LLC. We expect that HCG Holdings LLC will distributedistributed substantially all of the proceeds that it receivesreceived in connection with its investment in us to its members in accordance with its organizational documents, including the proceeds it receivesreceived from the sale of the shares being offered by it in thisour initial public offering, the redemption of the outstanding 8% preferred stock and the repayment by us of the 8% promissory notes. Assuming that this offering is consummated atAs a public offering price of $15.00 per share, the mid-point of the range shown on the cover of this prospectus, we redeem the 8% preferred stock and repay the 8% promissory notes, and HCG Holdings LLC distributes all of the proceeds received by it in connection with the foregoing transactions, we estimate thatresult, Messrs. Broadhurst, Burge, Holdren, Massaro, McCartney, Rojas and McCartney will receive a paymentYovovich received payments of approximately $43,800, $43,800, $875,000, $87,500$53,380, $53,380, $1,067,600, $106,760, $53,380, $26,690 and $43,800,$1,261,877, respectively.
INITIAL PUBLIC OFFERING EXPENSES
In connection with our initial public offering, in which HCG Holdings LLC participated as a selling stockholder, we paid all of the offering expenses of HCG Holdings LLC, other than underwriting discounts and commissions and transfer taxes with respect to the shares sold by HCG Holdings LLC.
MANAGEMENT AGREEMENT AND SERVICES
On April 23, 2002, HCG Holdings LLC entered into a Management Agreement on our behalf with Lake Capital Management LLC, which led the group of investors that sponsored our formation. Pursuant to the agreement, Lake Capital Management LLC agreed to assist in our formation and provide general management services for us, including consultation, advice and assistance with respect to operations, strategic planning, financing and other aspects of our business. In 2002, Lake Capital Management LLC was paid fees of $1.5 million under this agreement, $0.5 million of which was paid by canceling a promissory note issued by Lake Capital Management LLC to HCG Holdings LLC on the date the management agreement was executed. The cancelled promissory note had a principal amount of $0.5 million, did not accrue interest and had a final maturity date of July 14, 2002. HCG Holdings LLC agreed to lend Lake Capital Management LLC the $0.5 million in order to induce Lake Capital Management LLC to enter into the agreement. In connection with the termination of the agreement in July 2002, HCG Holdings LLC agreed to lend Lake Capital Management LLC an additional $1.0 million
80
Certain relationships and related transactions
pursuant to a promissory note issued by Lake Capital Management LLC to HCG Holdings LLC and to pay $1.0 million to Lake Capital Management LLC upon the consummation of the investment of Lake Capital Partners LP in HCG Holdings LLC. Upon Lake Capital Partners LP’s investment, the $1.0 million was paid by the cancellation of the promissory note. The cancelled promissory note had a principal amount of $1.0 million, did not accrue interest and had a final maturity date of January 5, 2003. HCG Holdings LLC agreed to lend Lake Capital Management LLC the $1.0 million in order to induce Lake Capital Management LLC to terminate the management agreement. The only provisions of the agreement surviving termination relate to the limitation of Lake Capital Management LLC’s liability to us for any and all losses arising out of the services performed under the agreement, except for liability related to unlawful conduct or a failure to act in good faith and in a manner reasonably believed to be in our best interests, and our obligation to indemnify Lake Capital Management LLC and persons related to it against such losses or liabilities, subject to specified exceptions. Mr. Yovovich has been a member and served as a president of Lake Capital Management LLC since 1999.
From time to time, Huron Consulting Services LLC reimburses Lake Capital Management LLC for its out-of-pocket expenses in connection with its provision of requested management advice. Under this arrangement, we paid approximately $195,600 for the partial year ended December 31, 2002, approximately $97,000 for the year ended December 31, 2003, approximately $105,000 for the year ended December 31, 2004. Certain employees of Lake Capital Management LLC served as officers and directors of Huron Consulting Group Inc. and Huron Consulting Services LLC until May 2004.
ADVISORY SERVICES AGREEMENT
On April 23, 2002, HCG Holdings LLC entered into an Advisory Services Agreement on our behalf with PPM LP, which owns approximately 31% of the equity interests in HCG Holdings LLC. Pursuant to the agreement, PPM LP agreed to provide general management and other corporate advisory services to us, including consultation, advice and assistance with respect to financing and other aspects of our business. In 2002, PPM LP was paid $0.3 million under this agreement. The agreement was terminated in July 2002. The only provision of the agreement surviving termination relates to the limitation of PPM LP’s liability to us for any and all losses arising out of the services performed under the agreement, except for liability related to unlawful conduct or a failure to act in good faith and in a manner reasonably believed to be in our best interests.
HOLDREN RESTRICTED COMMON STOCK
In December 2002, we issued a total of 521,740 shares of restricted common stock to Mr. Holdren at a purchase price of $0.02 per share for aggregate consideration of $12,000. Mr. Holdren has transferred these shares to a trust for the benefit of his family. All of Mr. Holdren’s shares of restricted common stock became vested as of the consummation of our initial public offering. As described below, Mr. Holdren has been granted certain piggyback registration rights with respect to 391,305 of his shares of restricted common stock.
REGISTRATION RIGHTS
Holdren registration rights
On December 10, 2002, Mr. Holdren purchased 391,305 shares of our common stock, at a purchase price of $0.02 per share, pursuant to a restricted shares award agreement under our 2002 Equity Incentive Plan. The restricted shares award agreement grants Mr. Holdren certain piggyback registration rights with respect to these shares. Pursuant to these piggyback registration rights, if following the consummation of this offering, we propose any underwritten public offering of our equity securities pursuant to an effective registration statement under the Securities Act (other than a registration statement relating to our employee benefit plans, exchange offers by us or a merger or acquisition of a business or assets by us), Mr. Holdren is entitled subject to certain limitations, to include his shares of restricted common stock in that registration with all registration expenses paid by us.
8281
Certain relationships and related transactions
his shares of restricted common stock in that registration, subject to cut back provisions in the event that, in connection with an underwritten offering, the managing underwriter advises us and Mr. Holdren that the inclusion of all the securities sought to be included in the registration by us, Mr. Holdren, any persons who have sought to have shares registered thereunder pursuant to demand registration rights and any other proposed sellers would adversely affect the marketability of the securities sought to be sold pursuant thereto. Pursuant to the agreement, we are obligated to pay all expenses incident to our performance of, or compliance with, our obligations in connection with the piggyback registration rights.
HCG Holdings LLC registration rights
Prior to the consummation of this offering, weWe and HCG Holdings LLC will enterhave entered into ana registration rights agreement pursuant to which we will provide HCG Holdings LLC is entitled to certain demand, piggyback and shelf registration rights with respect to the 9,614,5768,864,576 shares (8,864,576 shares if the underwriters’ over-allotment option is exercised in full) of our common stock held by it immediately following the consummation of this offering.it. These shares are referred to as registrable securities. Pursuant to the demand registration rights, HCG Holdings LLC may require us to prepare and file a registration statement under the Securities Act of 1933, as amended, at our expense, covering all or a portion of the registrable securities if the shares to be included in that registration will generate anticipated aggregate net proceeds to HCG Holdings LLC of at least $20.0 million. Under these demand registration rights, we are required to use our best efforts to cause the shares requested to be included in the registration statement, subject to customary conditions and limitations. We are not obligated to effect more than six demand registrations (though certain circumstances may cause a registration not to be counted as one of the six demand registrations). Once we become eligible to file a registration statement on Form S-3, HCG Holdings LLC may also require us to register all or a portion of the registrable securities on a registration statement on Form S-3, subject to specific conditions and limitations. We are not obligated to effect more than two of these shelf registrations on Form S-3 in any twelve-month period. Pursuant to the piggyback registration rights, HCG Holdings LLC also has the right to include the registrable securities in an unlimited number of other registrations of our common stock initiated by us or on behalf of other stockholders, subject to cut back provisions in certain situations. HCG Holdings LLC will have priority over any stockholder granted registration rights after the date of this offering in any subsequent registration statement. The registration rights may be transferred by HCG Holdings LLC to any transferee, subject to some conditions.
| Ø | Demand registrations. Pursuant to the demand registration rights, HCG Holdings LLC may require us to prepare and file a registration statement under the Securities Act of 1933, as amended, at our expense, covering all or a portion of the registrable securities if the shares to be included in that registration will generate anticipated aggregate net proceeds to HCG Holdings LLC of at least $20.0 million. Under these demand registration rights, we are required to use our best efforts to cause the shares requested to be included in the registration statement, subject to customary conditions and limitations. We are not obligated to effect more than six demand registrations. However, a registration will not count as one of the six permitted demand registrations unless HCG Holdings LLC is able to register and sell at least 70% of the registrable securities requested to be included in such registration. This offering constitutes a demand registration under the agreement. |
| Ø | Shelf registration rights. Once we become eligible to file a registration statement on Form S-3, HCG Holdings LLC may also require us to register all or a portion of the registrable securities on a registration statement on Form S-3, subject to specific conditions and limitations. We are not obligated to effect more than two of these shelf registrations on Form S-3 in any twelve-month period. |
| Ø | Piggyback registration rights. Pursuant to the piggyback registration rights, HCG Holdings LLC also has the right to include the registrable securities in an unlimited number of other registrations of our common stock initiated by us or on behalf of other stockholders, subject to cut back provisions in connection with an underwritten offering in the event the managing underwriters advise us that the number of securities requested to be included in such registration exceeds the number which can be sold in an orderly manner in such offering within a price range that is acceptable. HCG Holdings LLC will have priority over any stockholder granted registration rights after the date of our initial public offering in any subsequent registration statement. |
Under the registration rights agreement, we are obligated to pay all expenses incident to our performance of or compliance with the agreement, as well as certain expenses of HCG Holdings LLC. InUnder the agreement, in connection with this offering, we have agreed to paywill be responsible for all of the offering expenses, including the expenses of HCG Holdings LLC, other than underwriting discounts and commissions and transfer taxes with respect to the shares being sold by HCG Holdings LLC. Pursuant to the registration rights agreement, in connection with registrations thereunder, we and HCG Holdings LLC have agreed to indemnify each other against certain liabilities, including liabilities under the Securities Act, and to contribute to payments which may be required in respect thereof. The underwriting agreement related to this offering contains similar cross-indemnification provisions.
MANAGEMENT RIGHTS LETTER AGREEMENT
In connection with this offering, we will enterWe have entered into a management rights letter agreement with Lake Capital Partners LP. Under the terms of this agreement, for so long as Lake Capital Partners LP owns membership interests in HCG
82
Certain relationships and related transactions
Holdings LLC and thereafter if it owns shares of our stock, Lake Capital Partners LP will beis entitled to (1) receive copies of our periodic reports filed with the SEC under the Exchange Act as soon as they are available and such other information relating to our financial condition, business, prospects and corporate affairs as Lake Capital Partners LP may request, provided that we are not obligated to provide information that we deem to be a trade secret or similar confidential information, (2) consult with and advise us on significant business issues, (3) examine our books and records and inspect our facilities, provided that we need not provide access to confidential information and facilities unless Lake Capital Partners LP executes a non-disclosure agreement in a form acceptable to us and (4) receive all materials distributed to our board members and address our board regarding significant business issues, subject to our ability to exclude Lake Capital Partners LP’s access to materials or meetings as necessary to protect confidential information or for other similar reasons. Under the agreement, Lake Capital Partners LP will agreeagreed to customary confidentiality restrictions on the use of
83
information provided to or learned by it in connection with its rights under the agreement. We have not and will not pay any fees to, or receive any fees from, Lake Capital Partners LP in connection with the agreement.
OTHER RELATIONSHIPS AND RELATED TRANSACTIONS
HCG Holdings LLC
In connection with the initial public offering, in which HCG Holdings LLC participated as a selling stockholder, we paid all of the offering expenses of HCG Holdings, other than underwriting discounts and commissions and transfer taxes with respect to the shares sold by HCG Holdings LLC.
Lake Capital Management LLC
We have an arrangement whereby we share with Lake Capital Management LLC season tickets for a luxury suite at Soldier Field for home games of the Chicago Bears that we use to entertain current and prospective clients. Under this arrangement, we paid $65,000 for the 2003 season, $66,500 for the 2004 season and are responsible for $66,495$68,900 for the 20042005 season.
Family relationships
Mr. Massaro’s son-in-law, Marc Mercier, is currently employed by us as an associate.a manager. In this capacity, he received total salary and bonuscompensation of approximately $22,700, $61,250 and $22,700 in the year ended December 31, 2003 and$73,500 for the partial year ended December 31, 2002 and the years ended December 31, 2003 and 2004, respectively.
Highline Technology LLC
Huron Consulting Services LLC entered into an agreement, effective as of September 3, 2003, with Highline Technology LLC, an entity in which Mr. Yovovich owns 50%. Pursuant to the agreement, Highline Technology provides management of information technology services, including budgeting, network planning and management, purchasing and contract negotiation assistance, security and risk management and other requested information technology services. We pay quarterly fees of $31,250, plus expenses, during the term of the agreement. The agreement can be terminated by either party for any reason upon 30 days prior written notice to the other party. No payments were made under the agreement in 2003, and a total of approximately $143,300 has been$212,000 was paid in the first six months of 2004. We intend to internalizehave internalized the services performed for us by Highline Technology by hiring a ChiefDirector of Information Officer and expect that we will terminate theTechnology in November 2004. We have terminated our original agreement with Highline Technology in accordance with its terms in such event.and have entered into an agreement with Highline to provide limited consulting services to our information technology group on a time and materials basis. We have paid a total of $12,696 for the six months ended June 30, 2005 under the new agreement.
8483
Principal and selling stockholders
The following table sets forth, as of September 22, 2004,August 15, 2005, certain information regarding the beneficial ownership of our common stock by:
| Ø | each person known by us to beneficially own 5% or more of our common stock; |
| Ø | each member of our board of |
| Ø | each of our named executive officers; |
| Ø | all directors and executive officers as a group; and |
| Ø |
Beneficial ownership is determined according to the rules of the SEC, and generally means that a person has beneficial ownership of a security if he or she possesses sole or shared voting or investment power of that security, and includes options that are currently exercisable or exercisable within 60 days. Each director, officer, or 5% or more stockholder or selling stockholder, as the case may be, has furnished us with information with respect to beneficial ownership. Except as otherwise indicated, we believe that the beneficial owners of common stock listed below, based on the information each of them has given to us, have sole investment and voting power with respect to their shares, except where community property laws may apply.
The following table lists applicable percentage ownership based on 12,952,627 shares of common stock outstanding as of September 22, 2004, which gives effect to the issuance of 769,700 shares of restricted common stock, a 1 for 2.3 reverse stock split of our Class A common stock and Class B common stock, the conversion of all of our outstanding shares of Class B common stock into shares of our Class A common stock, on a one-for-one basis, and the renaming of our Class A common stock to “common stock,” each of which will occur prior to the completion of this offering. The following table also lists applicable percentage ownership based on 16,285,960 shares of common stock outstanding after completion of this offering. Options to purchase shares of our common stock that are exercisable within 60 days of September 22, 2004 are deemed to be beneficially owned by the persons holding these options, and outstanding, for the purpose of computing percentage ownership of that person, but are not treated as outstanding for the purpose of computing any other person’s ownership percentage. Except as noted below, this table does not take into account the underwriters’underwriters exercise of their over-allotment option.
Beneficial ownership prior to offering | Beneficial ownership after offering | |||||||||||
| Name of beneficial owner(1) | Shares | % | Shares offered | Shares | % | |||||||
HCG Holdings LLC(2) | 11,281,243 | 87.1 | % | 1,666,667 | 9,614,576 | 59.0 | % | |||||
Terence M. Graunke(2) | 11,281,243 | 87.1 | 1,666,667 | 9,614,576 | 59.0 | |||||||
Paul G. Yovovich(2) | 11,281,243 | 87.1 | 1,666,667 | 9,614,576 | 59.0 | |||||||
Gary E. Holdren(3) | 691,310 | 5.3 | — | 691,310 | 4.2 | |||||||
George E. Massaro(4) | 81,514 | * | — | 81,514 | * | |||||||
Daniel P. Broadhurst(5) | 45,142 | * | — | 45,142 | * | |||||||
Suzanne S. Bettman(6) | 10,870 | * | — | 10,870 | * | |||||||
Mary M. Sawall(7) | 33,675 | * | — | 33,675 | * | |||||||
DuBose Ausley(8) | 4,444 | * | — | 4,444 | * | |||||||
Deborah A. Bricker(8) | 4,444 | * | — | 4,444 | * | |||||||
James D. Edwards(8) | 4,444 | * | — | 4,444 | * | |||||||
John McCartney(8)(9) | 4,444 | * | — | 4,444 | * | |||||||
All directors and executive officers as a group (6 persons)(10) | 897,873 | 6.9 | % | — | 897,873 | 5.5 | % | |||||
(See footnotes on the following page.)
85
Principal and selling stockholders
| Beneficial ownership prior to offering | Beneficial ownership post offering | ||||||||||
| Name of beneficial owner(1) | Shares | % | Shares offered | Shares | % | ||||||
5% Holders, Directors and Executive Officers: | |||||||||||
HCG Holdings LLC(2) | 8,864,576 | 51.6 | % | 4,000,000 | 4,864,576 | % | |||||
Terence M. Graunke(2) | 8,864,576 | 51.6 | 4,000,000 | 4,864,576 | |||||||
Paul G. Yovovich(2) | 8,864,576 | 51.6 | 4,000,000 | 4,864,576 | |||||||
Gary E. Holdren(3) | 752,348 | 4.4 | — | ||||||||
George E. Massaro(4) | 120,139 | * | * | ||||||||
Daniel P. Broadhurst(6) | 62,314 | * | * | ||||||||
Gary L. Burge(5) | 61,304 | * | * | ||||||||
Mary M. Sawall(7) | 45,579 | * | * | ||||||||
DuBose Ausley(8) | 8,602 | * | — | * | |||||||
Deborah A. Bricker(8) | 18,202 | * | — | * | |||||||
James D. Edwards(8) | 11,802 | * | — | * | |||||||
John McCartney(8)(9) | 8,602 | * | — | * | |||||||
All directors and executive officers as a group (12 persons)(10) | 10,024,679 | 57.7 | % | % | |||||||
Other Selling Stockholders: | |||||||||||
| % | % | ||||||||||
| * | indicates less than 1% ownership. |
| (1) | The principal address of HCG Holdings LLC, Terence M. Graunke and Paul G. Yovovich is c/o Lake Capital Partners LP, 676 North Michigan Avenue, Suite 3900, Chicago, Illinois 60611. The principal address for each of the other stockholders listed below is c/o Huron Consulting Group Inc., 550 West Van Buren Street, Chicago, Illinois 60607. |
(Footnotes continued on following page.)
84
Principal and selling stockholders
| (2) | Lake Capital Partners LP and Lake Capital Management LLC are members of HCG Holdings LLC and collectively have investment and voting control over the shares of our common stock held by HCG Holdings LLC. Lake Capital Investment Partners LP is the sole general partner of Lake Capital Partners LP and Lake Partners LLC is the sole general partner of Lake Capital Investment Partners LP. Terence M. Graunke and Paul G. Yovovich are the members and managers of Lake Partners LLC as well as members of an investment committee of Lake Capital Investment Partners LP and, in such roles, these individuals have investment and voting control over, and may be deemed to be the beneficial owners of, the shares ultimately controlled by Lake Capital Investment Partners LP. Mr. Graunke is also the controlling member of Lake Capital Management LLC and, pursuant to the Lake Capital Management LLC operating agreement, has investment and voting control over, and may be deemed to be the beneficial owner of, the shares controlled by that entity. Each of Lake Capital Partners LP, Lake Capital Investment Partners LP, Lake Partners LLC, Lake Capital Management LLC, Mr. Graunke and Mr. Yovovich |
| If the underwriters’ over-allotment option is exercised in full, HCG Holdings LLC will sell an additional |
| (3) | Includes |
| (4) | Includes |
| (5) | Includes |
| (6) | Includes 18,477 shares issuable upon exercise of options that are exercisable currently or within 60 days of August 15, 2005. Also includes 21,100 shares of unvested restricted common stock. Does not include any shares in respect of |
| (7) | Includes |
| (8) |
| (9) | Does not include any shares in respect of Mr. McCartney’s ownership of |
| (10) | Includes an aggregate of |
HCG Holdings LLC represents that it has purchased the shares being registered for resale in the ordinary course of business, and that at the time of purchase of the shares, it did not have any agreements or understandings, directly or indirectly, with any person to distribute the shares.
8685
The following is a description of the material terms of our certificate of incorporation and bylaws as each is anticipated to be in effect upon the consummation of this offering, and of certain provisions of Delaware law. The following summary does not purport to be complete and is subject to, and is qualified in its entirety by, the provisions of our certificate of incorporation and bylaws, copies of which will be filedare incorporated by reference as exhibits to the registration statement of which this prospectus forms a part, and by the applicable provisions of Delaware law.
As of September 17, 2004,August 15, 2005, there were 11,285,75617,231,089 shares of our Class A common stock issued, andof which 17,175,239 were outstanding and held of record by six holders and 897,171 shares of our Class B common stock issued and outstanding and held of record by 66 holders, after giving effect to a 1 for 2.3 reverse stock split of our Class A common stock and Class B common stock that will occur prior to the consummation of this offering. The Class A common stock and Class B common stock are identical in all respects, except that the Class B common stock does not have any voting rights. Pursuant to the terms of our certificate of incorporation, immediately prior to the consummation of this offering, each share of our Class B common stock will automatically convert into one share of our Class A common stock and the Class B common stock will cease to exist as a separate class of stock and our Class A common stock will be renamed “common stock.”72 stockholders.
Immediately following the closing of this offering, ourOur authorized capital stock will consistconsists of:
| Ø | 500,000,000 shares of common |
| Ø | 50,000,000 shares of preferred stock. |
Upon the closing of this offering, we expect to have 16,285,960 shares of our common stock issued and outstanding, including 769,700 shares of restricted common stock that we intend to grant to our executive officers and certain of our employees on the date of this prospectus. We intend to use approximately $15.1 million of our net proceeds from this offering to optionally redeem all of our outstanding 8% preferred stock upon consummation of this offering, as described in the section of this prospectus entitled “Use of proceeds,” and upon full redemption, the 8% preferred stock will cease to exist as a separate class of capital stock. We have no shares of our preferred stock issued and outstanding, nor will any shares of our preferred stock be issued and outstanding upon the closing of this offering.
COMMON STOCK
Voting
The holders of our common stock are entitled to one vote for each share held of record on each matter submitted to a vote of stockholders, including the election of directors, and do not have any right to cumulate votes in the election of directors.
Dividends
Subject to the rights and preferences of the holders of any shares of our 8% preferred stock or any series of preferred stock which may at the time be outstanding, holders of our common stock are entitled to such dividends as our board of directors may declare out of funds legally available.
Liquidation rights
In the event of any liquidation, dissolution or winding-up of our affairs, after payment of all of our debts and liabilities and subject to the rights and preferences of the holders of any outstanding shares of our
87
Description of capital stock
8% preferred stock or any series of our preferred stock, the holders of our common stock will be entitled to receive the distribution of any of our remaining assets.
Other matters
Holders of our common stock have no conversion, preemptive or other subscription rights and there are no redemption rights or sinking fund provisions with respect to the common stock. All outstanding shares of our common stock are, and the shares of our common stock to be sold in this offering when issued and paid for will be, validly issued, fully paid and non-assessable.
8% PREFERRED STOCK
We intend to use approximately $15.1 million of our net proceeds from this offering to optionally redeem all of our outstanding 8% preferred stock, as described in the section of this prospectus entitled “Use of proceeds.”
Dividends
The 8% preferred stock accrues dividends on a daily basis at the rate of 8% per annum, compounded annually, on its stated value per share, from and including the earlier of the date of the contribution with respect to which such share was issued and the date of issuance of the share until the earlier of our liquidation, dissolution or the winding-up of our affairs or the redemption or conversion of the share in accordance with its terms. The 8% preferred stock has a stated value of $1,000 per share, subject to adjustment. Each share of 8% preferred stock is also entitled to receive any dividends paid on shares of our common stock as if each share of 8% preferred stock were equal to the number of shares of common stock determined by dividing (a) the stated value of the share of 8% preferred stock by (b) the market price of a share of common stock. Under our certificate of incorporation, the market price of a share of common stock is determined based upon the trading pricing of our common stock or, in the event our common stock is not listed for trading, as reasonable determined by our board.
At any time shares of 8% preferred stock are issued and outstanding, we will be prohibited from declaring or paying dividends on or making any distribution in respect of our common stock or any other capital stock ranking junior to the 8% preferred stock as to dividends or other distributions unless prior to or concurrently with such declaration, payment or distribution all accumulated and unpaid dividends on the 8% preferred stock shall have been fully paid or declared with funds irrevocably set apart for payment. HCG Holdings LLC has waived this condition in connection with the special dividend we declared on May 12, 2004 and paid on June 29, 2004. See “Dividend policy.”
Liquidation preference
In the event of any liquidation, dissolution or winding-up of our affairs, each holder of our 8% preferred stock will be entitled to receive, out of our assets available for distribution to stockholders, a liquidation preference in an amount of cash equal to the then current stated value of the shares of 8% preferred stock held plus all accrued and unpaid dividends. After the payment of the liquidation preference in full, our remaining assets available for distribution to stockholders will be distributed first to the holders of any securities that rank senior to our common stock as to liquidation and then ratably, on a share for share basis, to the holders of common stock and the holders of 8% preferred stock and any other holders of securities ranking on a parity with shares of our common stock as to liquidation. The liquidation preference and the pro rata portion of the 8% preferred stock’s liquidation participation amount are collectively referred to as the liquidation amount.
Redemption at our option
We may, at any time, redeem all or any portion of any outstanding shares of 8% preferred stock. If we elect to optionally redeem shares of 8% preferred stock, we will pay a price per share of 8% preferred
88
Description of capital stock
stock equal to the liquidation amount, calculated as if we were to be liquidated as of the date of the redemption. Any optional redemptions by us will be made to each holder of outstanding shares of 8% preferred stock pro rata based on the aggregate liquidation amount of the 8% preferred stock held by each holder.
PREFERRED STOCK
We are authorized to issue up to 50,000,000 shares of preferred stock. Our certificate of incorporation authorizes our board, without any further stockholder action or approval, to issue these shares in one or more classes or series, to establish from time to time the number of shares to be included in each class or series and to fix the rights, preferences and privileges of the shares of each wholly unissued class or series
86
Description of capital stock
and any of its qualifications, limitations or restrictions. Our board may authorize the issuance of preferred stock with voting or conversion rights that could adversely affect the voting power or other rights of the holders of our common stock. We currently have no plans to issue any shares of preferred stock.
ANTI-TAKEOVER EFFECTS OF VARIOUS PROVISIONS OF OUR CERTIFICATE OF INCORPORATION AND OUR BYLAWS
Provisions of our certificate of incorporation and bylaws, which are summarized below, may be deemed to have an anti-takeover effect and may delay, defer or prevent a tender offer or takeover attempt that a stockholder might consider in such stockholder’s best interest, including those attempts that might result in a premium over the market price for the shares held by stockholders.
Classified board of directors
Our certificate of incorporation provides for a board of directors divided into three classes, with one class to be elected each year to serve for a three-year term. The provision for a classified board will have the effect of making it more difficult for stockholders to change the composition of our board.
Number of directors; removal for cause; filling vacancies
Our certificate of incorporation and our bylaws provide that our board of directors will consist of not less than five nor more than fifteen members, the exact number of which will be fixed from time to time by our board. Upon the closing of this offering, the size of our board will be fixed at seven directors.
Under the General Corporation Law of the State of Delaware, or the DGCL, unless otherwise provided in our certificate of incorporation, directors serving on a classified board may be removed by the stockholders only for cause. Our certificate of incorporation provides that directors may be removed from office at any time, but only for cause and only by the affirmative vote of the holders of at least two-thirds of the voting power of the issued and outstanding shares of our capital stock entitled to vote in an election of directors. Our certificate of incorporation and bylaws also provide that any newly created directorships on our board may be filled by a majority of the board then in office, provided that a quorum is present, and any other vacancy occurring on the board may be filled by a majority of the board then in office, even if less than a quorum, or by a sole remaining director. Any director elected in accordance with the preceding sentence will hold office for the remainder of the full term of the class of directors in which the new directorship was created or the vacancy occurred and until such director’s successor shall have been elected and qualified. No decrease in the number of directors constituting the board of directors shall have the effect of removing or shortening the term of any incumbent director.
The director removal and vacancy provisions will make it more difficult for a stockholder to remove incumbent directors and simultaneously gain control of the board by filling vacancies created by such removal with its own nominees.
89
Description of capital stock
Special meetings of stockholders
Our certificate of incorporation and bylaws deny stockholders the right to call a special meeting of stockholders. Our certificate of incorporation and bylaws provide that a special meeting of stockholders may be called only by a majority of our entire board of directors, the chairman of our board or our President.
Stockholder action by written consent
Our certificate of incorporation requires all stockholder actions to be taken by a vote of the stockholders at an annual or special meeting, and denies the ability of stockholders to act by written consent without a meeting.
87
Description of capital stock
Stockholder proposals
At an annual meeting of stockholders, only business that is properly brought before the meeting will be conducted or considered. To be properly brought before an annual meeting of stockholders, business must be specified in the notice of the meeting (or any supplement to that notice), brought before the meeting by or at the direction of the board (or any duly authorized committee of the board) or properly brought before the meeting by a stockholder. For business to be properly brought before an annual meeting by a stockholder, the stockholder must:
| Ø | be a stockholder of record on the date of the giving of the notice for the meeting; |
| Ø | be entitled to vote at the meeting; and |
| Ø | have given timely written notice of the business in proper written form to our secretary. |
To be timely, a stockholder’s notice must be delivered to or mailed and received at our principal executive offices not less than 90 days nor more than 120 days prior to the anniversary date of the last annual meeting; provided, however, that in the event that the annual meeting is called for a date that is not within 30 days before or after the anniversary date, notice by the stockholder must be received not later than the close of business on the 10th day following the day on which notice of the date of the annual meeting was mailed or public disclosure of the date of the annual meeting was made, whichever first occurs.
To be in proper written form, a stockholder’s notice to the secretary must set forth as to each matter the stockholder proposes to bring before the annual meeting:
| Ø | a brief description of the business desired to be brought before the annual meeting and the reasons for conducting the business at the annual meeting; |
| Ø | the name and address, as they appear on our books, of the stockholder proposing such business; |
| Ø | the class or series and number of our shares which are owned beneficially or of record by the stockholder proposing the business; |
| Ø | a description of all arrangements or understandings between such stockholder and any other person or persons (including their names) in connection with the proposal of such business by such stockholder and any material interest of such stockholder in the business; and |
| Ø | a representation that the stockholder is a holder of record of our stock entitled to vote at the meeting and that the stockholder intends to appear in person or by proxy at the meeting to bring the business before the meeting. |
Similarly, at a special meeting of stockholders, only such business as is properly brought before the meeting will be conducted or considered. To be properly brought before a special meeting, business must
90
Description of capital stock
be specified in the notice of the meeting (or any supplement to that notice) given by or at the direction of a majority of the entire board of directors, the chairman of our board or our President.
Nomination of candidates for election to our board
Under our bylaws, only persons that are properly nominated will be eligible for election to be members of our board. To be properly nominated, a director candidate must be nominated at an annual meeting of the stockholders or any special meeting called for the purpose of electing directors by or at the direction of our board (or any duly authorized committee of the board) or properly nominated by a stockholder. To properly nominate a director, a stockholder must:
| Ø | be a stockholder of record on the date of the giving of the notice for the meeting; |
88
Description of capital stock
| Ø | be entitled to vote at the meeting; and |
| Ø | have given timely written notice in proper written form to our secretary. |
To be timely, a stockholder’s notice must be delivered to or mailed and received at our principal executive offices:
| Ø | in the case of an annual meeting, not less than 90 days nor more than 120 days prior to the anniversary date of the last annual meeting of our stockholders; provided, however, that in the event that the annual meeting is called for a date that is not within 30 days before or after the anniversary date of the last annual meeting, notice by the stockholder in order to be timely must be received not later than the close of business on the 10th day following the day on which notice of the date of the annual meeting was mailed or public disclosure of the date of the annual meeting was made, whichever first occurs; and |
| Ø | in the case of a special meeting of stockholders called for the purpose of electing directors, not later than the close of business on the 10th day following the day on which notice of the date of such meeting was mailed or public disclosure of the date of the annual meeting was made, whichever first occurs. |
To be in proper written form, a stockholder’s notice to the secretary must be accompanied by a written consent of each proposed nominee to being named as a nominee and to serve as a director if elected and must set forth:
| Ø | as to each person whom the stockholder proposes to nominate for election as a director: |
– the name, age, business address and residence address of the person;
– the principal occupation or employment of the person;
– the class or series and number of shares of our capital stock that are owned beneficially or of record by the person; and
– any other information relating to the person that would be required to be disclosed in a proxy statement or other filings required to be made in connection with solicitations of proxies for election of directors pursuant to Section 14 of the Securities Exchange Act of 1934, as amended, or the Exchange Act, and the rules and regulations promulgated thereunder; and
| Ø | as to the stockholder giving the notice: |
– the name and record address of such stockholder;
– the class or series and number of shares of our capital stock that are owned beneficially or of record by such stockholder;
91
Description of capital stock
– a description of all arrangements or understandings between such stockholder and each proposed nominee and any other person or persons (including their names) pursuant to which the nomination(s) are to be made by such stockholder;
– a representation that such stockholder is a holder of record of our stock entitled to vote at the meeting and that the stockholder intends to appear in person or by proxy at the meeting to nominate the persons named in its notice; and
– any other information relating to such stockholder that would be required to be disclosed in a proxy statement or other filings required to be made in connection with solicitations of proxies for election of directors pursuant to Section 14 of the Exchange Act and the rules and regulations promulgated thereunder.
89
Description of capital stock
Amendment of certificate of incorporation and bylaws
The DGCL provides generally that the affirmative vote of a majority of the outstanding shares entitled to vote is required to amend or repeal a corporation’s certificate of incorporation or bylaws, unless the certificate of incorporation requires a greater percentage. Our certificate of incorporation generally requires the approval of the holders of at least two-thirds of the voting power of the issued and outstanding shares of our capital stock entitled to vote in connection with the election of directors to amend any provisions of our certificate of incorporation described in this section. Our certificate of incorporation and bylaws provide that the holders of at least two-thirds of the voting power of the issued and outstanding shares of our capital stock entitled to vote in connection with the election of directors have the power to amend or repeal our bylaws. In addition, our certificate of incorporation grants our board of directors the authority to amend and repeal our bylaws without a stockholder vote in any manner not inconsistent with the laws of the State of Delaware or our certificate of incorporation.
LIMITATIONS ON LIABILITY AND INDEMNIFICATION OF DIRECTORS AND OFFICERS
We have adopted provisions in our certificate of incorporation that limit or eliminate the personal liability of our directors to the maximum extent permitted by the DGCL. The DGCL expressly permits a corporation to provide that its directors will not be liable for monetary damages for a breach of their fiduciary duties as directors, except for liability:
| Ø | for any breach of the director’s duty of loyalty to us or our stockholders; |
| Ø | for any act or omission not in good faith or that involves intentional misconduct or a knowing violation of law; |
| Ø | under Section 174 of the DGCL (relating to unlawful stock repurchases, redemptions or other distributions or payment of dividends); or |
| Ø | for any transaction from which the director derived an improper personal benefit. |
These limitations of liability do not generally affect the availability of equitable remedies such as injunctive relief or rescission. Our certificate of incorporation and bylaws also authorize us to indemnify our officers, directors and other agents to the fullest extent permitted under the DGCL and we may advance expenses to our directors, officers and employees in connection with a legal proceeding, subject to limited exceptions.
As permitted by the DGCL, our certificate of incorporation and bylaws provide that:
| Ø | we must indemnify our board members and officers to the fullest extent permitted by the DGCL, subject to limited exceptions; and |
92
Description of capital stock
| Ø | we may purchase and maintain insurance on behalf of our current or former board members, officers, employees or agents against any liability asserted against them and incurred by them in any such capacity, or arising out of their status as such. |
We may enter into separate indemnification agreements with each of our board members and officers that may be broader than the specific indemnification provisions contained in the DGCL. These indemnification agreements may require us, among other things, to indemnify our board members and officers against liabilities that may arise by reason of their status or service as board members and officers, other than liabilities arising from willful misconduct. These indemnification agreements may also require us to advance any expenses incurred by the board members and officers as a result of any proceeding against them as to which they could be indemnified and to obtain directors’ and officers’ insurance if available on reasonable terms.
90
Description of capital stock
The limited liability and indemnification provisions in our certificate of incorporation and bylaws and in any indemnification agreements we enter into may discourage stockholders from bringing a lawsuit against our board members for breach of their fiduciary duties and may reduce the likelihood of derivative litigation against our board members and officers, even though a derivative action, if successful, might otherwise benefit us and our stockholders. A stockholder’s investment in us may be adversely affected to the extent we pay the costs of settlement or damage awards against our directors and officers under these indemnification provisions.
At present, there is no pending litigation or proceeding involving any of our directors, officers, employees or agents in which indemnification by us is sought, nor are we aware of any threatened litigation or proceeding that may result in a claim for indemnification.
TRANSFER AGENT AND REGISTRAR
The transfer agent and registrar for our common stock is LaSalle Bank National Association.
LISTING
We have applied for the quotation of ourOur common stock is quoted on the NASDAQ National Market under the symbol “HURN.”
9391
Shares eligible for future sale
Prior to this offering there has been no public market for our common stock, and a significant public market for our common stock may never develop or be sustained after this offering. We cannot predict the effect, if any, that market sales of shares or the availability of shares for sale will have on the market price prevailing from time to time. As described below, only a limited number of shares will not be available for sale shortly after this offering due to contractual and legal restrictions on resale. However, sales of our common stock in the public market after the restrictions lapse, or the perception that these sales may occur, could cause the market price of our common stock to decline.
Upon completion of this offering, we expect to have 16,285,960an aggregate of outstanding shares of common stock, including the 769,7001,411,397 shares of unvested restricted common stock to be granted to certain of our executive officers and employees on the date of this prospectus, which vest over a four-year period.stock. As of September 17, 2004,August 15, 2005, we had outstanding stock options held by executive officers, employees, third-party consultants and board members for the purchase of an aggregate of 1,670,0411,381,206 shares of common stock.
The 5,000,000 shares of common stock being sold in this offering (or 5,750,000 shares if the underwriters exercise the over-allotment option in full) will be, and the 5,750,000 shares previously sold in our initial public offering are, freely tradable without restriction or further registration under the Securities Act, unless the shares are purchased by affiliates of our company, as that term is defined in Rule 144 of the Securities Act. AllExcept for shares issued pursuant to the Form S-8 we have on file, all remaining shares were issued and sold by us in private transactions or issued by us in reliance on Rule 701 of the Securities Act and are eligible for public sale if registered under the Securities Act, or sold in accordance with Rule 144 or Rule 701 thereunder.
LOCK-UP AGREEMENTS
We, each member of our board, each of our director nominees, each of our executive officers and managing directors and theeach selling stockholder havehas signed lock-up agreements under which, subject to certain permitted exceptions specified in the agreements, they will agree not to offer, sell, contract to sell, pledge, hedge or otherwise dispose of, directly or indirectly, any shares of our common stock or securities convertible into or exercisable or exchangeable for shares of common stock, for a period of 18090 days after the date of this prospectus. The 180-day90-day lock-up period may be extended under certain circumstances where we announce or pre-announce earnings or material news or a material event occurs within approximately 18 days before, or approximately 16 days after, the termination of the 180-day90-day period. UBS Securities LLC, and Deutsche Bank Securities Inc., in theirits sole discretion, may release some or all of these shares before the 180-day90-day lockup period ends.
Following the expiration of the lock-up period, 11,182,442 shares of common stock subject to these agreements, including shares issuable upon the exercise of vested options 18090 days after the date of this prospectus, will be available for sale in the public market, subject in some cases to the vesting of restricted common stock during the lock-up period and to the volume and other restrictions of compliance with Rule 144, Rule 144(k) or Rule 701.
ELIGIBILITY OF RESTRICTED SHARES FOR SALE IN THE PUBLIC MARKET
Rule 144
In general, under Rule 144, a person or persons whose shares are aggregated who has beneficially owned restricted securities for at least one year, including the holding period of any holder who is not an affiliate, and who files a Form 144 with respect to this sale, is entitled to sell within any three-month period commencing 90 days after the date of this prospectus a number of shares of common stock that does not exceed the greater of:
| Ø | 1% of the then outstanding shares of our common stock, or approximately |
| Ø | the average weekly trading volume during the four calendar weeks preceding the date of which notice of the sale is filed on Form 144. |
94
Shares eligible for future sale
Sales under Rule 144 are also subject to restrictions relating to manner of sale and the availability of current public information about us.
92
Shares eligible for future sale
Rule 144(k)
A person who is not deemed to have been our affiliate at any time during the 90 days immediately preceding a sale and who has beneficially owned his or her shares for at least two years, including the holding period of any prior owner who is not an affiliate, is entitled to sell these shares of common stock pursuant to Rule 144(k) without regard to the volume limitations, manner of sale provisions, public information or notice requirements of Rule 144. Affiliates must always sell pursuant to Rule 144, even after the applicable holding periods have been satisfied.
Rule 701
Rule 701 may be relied upon with respect to the resale of securities originally purchased from us by our employees, board members, officers, third-party consultants or advisers prior to the closing of thisour initial public offering and pursuant to written compensatory benefit plans or written contracts relating to the compensation of these persons. In addition, the SEC has indicated that Rule 701 will apply to stock options granted by us before thisour initial public offering, along with the shares acquired upon exercise of these options. Securities issued in reliance on Rule 701 are deemed to be restricted shares and beginning 90 days after the date of this prospectus, may be sold by persons other than affiliates subject only to the manner of sale provisions of Rule 144 and by affiliates under Rule 144 without compliance with the holding period requirements. As of September 17, 2004, 379,936August 15, 2005, 379,396 of our outstanding shares of common stock had been issued in reliance on Rule 701 as a result of exercise of stock options.
EQUITY COMPENSATION
We intend to filefiled a registration statement on Form S-8 under the Securities Act covering the 2,141,000 shares that will beare reserved for issuance under our Omnibus Stock Plan as well as the1,612,640 shares reserved for issuance upon the exercise of options outstanding under our three existing equity incentive plans, which as of September 17, 2004 was 1,670,041.plans. This Form S-8 registration statement is expected to be filed soon after the effectiveness of the registration statement of which this prospectus forms a part, and the Form S-8 will automatically becomebecame effective upon filing. Accordingly, shares registered under this registration statement will,are, subject to Rule 144 provisions applicable to affiliates, be available for sale in the open market, unless these shares are subject to vesting restrictions with us or are otherwise subject to the contractual restrictions described above. As soon as practicable following the filing of the Form S-8 registration statement relating to our Omnibus Plan, we intend to grant 769,700 shares of restricted common stock to certain of our executive officers and employees, options exercisable for 75,800 shares of our common stock, with a per share exercise price equal to the public offering price, to one of our executive officers and certain of our employees and options exercisable for 13,333 shares of our common stock, with a per share exercise price equal to the public offering price and assuming a public offering price of $15.00 per share, the mid-point of the range shown on the cover of this prospectus, to each of our four independent directors.
REGISTRATION RIGHTS
Pursuant to a restricted shares award agreement, Mr. Holdren has been granted certain piggyback registration rights with respect to the 391,305 shares of our common stock that he purchased under the agreement. For further information regarding these registration rights, see the section of this prospectus entitled “Management—Holdren senior management agreement.”
Prior to the consummation of this offering, weWe and our parent, HCG Holdings LLC will enterhave entered into ana registration rights agreement pursuant to which we will provide HCG Holdings LLC is entitled to certain demand, piggyback and shelf registration rights with respect to all of the 9,614,576 shares of our common stock (8,864,576 shares if the underwriters over-allotment option is exercised in full) held by it immediately followingit. For further information regarding these registration rights, see the consummationsection of this offering.prospectus entitled “Certain relationships and related transactions—Registration rights—HCG Holdings LLC registration rights.”
9593
Material U.S. federal tax considerations for non-U.S. holders of our common stock
The following is a general discussion of the material U.S. federal income and estate tax consequences of the ownership and disposition of our common stock by a “Non-U.S. Holder.” For purposes of this discussion, a “Non-U.S. Holder” is a beneficial owner of our stock who is treated for the relevant U.S. federal tax purposes as a non-resident alien individual, or a foreign partnership, foreign corporation, foreign estate, or foreign trust. Because U.S. federal tax law uses different tests in determining whether an individual is a non-resident alien for income and estate tax purposes, some individuals may be “Non-U.S. Holders” for purposes of the U.S. federal income tax discussion below, but not for purposes of the U.S. federal estate tax discussion, andvice versa.versa.
This discussion is based on current provisions of the U.S. Internal Revenue Code of 1986, as amended (the “Code”), judicial decisions, and administrative regulations and interpretations in effect as of the date of this prospectus, all of which are subject to change, possibly with retroactive effect. This discussion assumes that a Non-U.S. Holder holds our common stock as a capital asset as determined for U.S. federal income tax purposes (generally, property held for investment). This discussion does not address all aspects of U.S. federal income and estate taxation that may be relevant to Non-U.S. Holders in light of their particular circumstances, including, without limitation, Non-U.S. Holders that are controlled foreign corporations, passive foreign investment companies, pass-through entities, or U.S. expatriates; Non-U.S. Holders that hold their common stock through pass-through entities; Non-U.S. Holders that acquire their common stock through the exercise of employee stock options or otherwise as compensation; and Non-U.S. Holders who own, directly, indirectly or constructively, more than 5% of our common stock. This discussion also does not address any tax consequences arising under the laws of any U.S. state or local, or non-U.S., jurisdiction.
You should consult your own tax advisor regarding the U.S. federal income and estate tax consequences of holding and disposing of our common stock in light of your particular situation, as well as any consequences under state, local or non-U.S. law.
DIVIDENDS
Distributions on our common stock will constitute dividends for U.S. federal income tax purposes to the extent paid from our current or accumulated earnings and profits, as determined for U.S. federal income tax purposes. In general, we will be required to withhold U.S. federal income tax at a 30% rate, or such lower rate as may be specified by an applicable income tax treaty, on dividends paid to a Non-U.S. Holder. To obtain a reduced rate of withholding under a treaty, you must provide us with appropriate documentation (typically, a properly-executed IRS Form W-8BEN certifying your entitlement to benefits under the treaty). You will not be required to furnish a U.S. taxpayer identification number in order to claim treaty benefits with respect to our dividends if our common stock is traded on an “established financial market” for U.S. federal income tax purposes. Treasury Regulations provide special rules to determine whether, for purposes of determining the applicability of an income tax treaty, dividends paid to a Non-U.S. Holder that is an entity should be treated as paid to the entity or to those holding an interest in that entity.
We generally will not be required to withhold U.S. federal income tax from dividends that are effectively connected with your conduct of a trade or business within the United States, so long as you provide us with appropriate documentation (typically, a properly executed IRS Form W-8ECI, stating that the dividends are so effectively connected). Instead, such dividends will be subject to U.S. federal income tax
94
Material U.S. federal tax considerations for non-U.S. holders of our common stock
on a net income basis, generally in the same manner as if you were a resident of the United States. If you
96
Material U.S. federal tax considerations for non-U.S. holders of our common stock
are a foreign corporation, your effectively-connected dividends may also be subject to an additional “branch profits tax,” which is imposed under certain circumstances at a rate of 30% (or such lower rate as may be specified by an applicable treaty), subject to certain adjustments and exceptions.
GAIN ON SALE OR DISPOSITION OF COMMON STOCK
A Non-U.S. Holder generally will not be subject to U.S. federal income tax with respect to any gain realized on a sale or other disposition of our common stock. However, you will be taxed on such gain if (1) the gain is effectively connected with a trade or business that you conduct in the United States (in the event that certain tax treaty provisions apply, the gain must also be attributable to a permanent establishment in the United States (or, in the case of an individual, a fixed place of business) in order to be subject to tax), (2) you are a non-resident alien individual, you are present in the United States for 183 or more days in the taxable year of the sale or disposition and certain other conditions are met, or (3) our stock is treated as a United States real property interest in your hands, within the meaning of Section 897(c) of the Code.
Subject to the exception noted below, our stock will generally be treated as a U.S. real property interest if we are or have been a “United States real property holding corporation” within the meaning of Section 897(c) at any time that you held the stock within five years before the sale or disposition. We believe that we are not, and we do not anticipate becoming, a United States real property holding corporation. Moreover, even if we are treated as a United States real property holding corporation, so long as our common stock is “regularly traded on an established securities market” for U.S. federal income tax purposes, our common stock will not be treated as a U.S. real property interest in the hands of a Non-U.S. Holder who has owned no more than 5% of the common stock (assuming for this purpose that any options or shares of convertible preferred stock that you own have been exercised or converted and applying certain constructive ownership rules to determine your ownership) during the five years preceding a sale or disposition. If we are treated as a U.S. real property holding corporation and our common stock is not regularly traded on an established securities market, 10% of the amount realized by a Non-U.S. Holder on a sale or disposition of our common stock must be withheld by the purchaser and remitted to the U.S. Internal Revenue Service. The amount withheld may be applied to the Non-U.S. Holder’s U.S. federal income tax liability or, if in excess thereof, refunded provided that the required information is timely furnished to the U.S. Internal Revenue Service.
INFORMATION REPORTING REQUIREMENTS AND BACKUP WITHHOLDING
Generally, we must report to the U.S. Internal Revenue Service the amount of dividends we pay to you, your name and address, and the amount of any tax withheld. A similar report will be sent to you. Pursuant to tax treaties or other information-sharing agreements, the U.S. Internal Revenue Service may make its reports available to tax authorities in your country of residence.
We generally will not be required to apply backup withholding to dividends that we pay to you if you have provided an appropriate certification of your U.S. federal taxpayer identification number, or of the fact that you are not a U.S. person, unless we or our paying agent otherwise have actual knowledge that you are a U.S. person. Generally, you will provide such certification on an IRS Form W-8BEN.
Under current U.S. federal income tax law, information reporting and backup withholding imposed at a rate of 28% (increasing to 31% in 2011) will apply to the proceeds of a disposition of our common stock effected by or through a U.S. office of a broker unless the disposing holder certifies as to its non-U.S. status or otherwise establishes an exemption. Generally, U.S. information reporting and backup withholding will not apply to a payment of disposition proceeds where the transaction is effected outside
9795
Material U.S. federal tax considerations for non-U.S. holders of our common stock
withholding will not apply to a payment of disposition proceeds where the transaction is effected outside the United States through a non-U.S. office of a non-U.S. broker. U.S. federal information reporting requirements (but not backup withholding) generally will also apply to a payment of disposition proceeds by foreign offices of U.S. brokers or foreign brokers with certain types of relationships to the United States unless the Non-U.S. Holder establishes an exemption.
Backup withholding is not an additional tax. Rather, the amount of tax withheld will be treated as a payment against your actual U.S. federal income tax liability (if any), and if the withholding results in an overpayment of tax, a refund may be obtained, provided that the required information is timely furnished to the U.S. Internal Revenue Service.
Non-U.S. Holders should consult their own tax advisors regarding the application of information reporting and backup withholding to them, including the availability of and procedure for obtaining an exemption from backup withholding.
FEDERAL ESTATE TAX
An individual Non-U.S. Holder who at the time of his death is treated as the owner of an interest in our common stock will be required to include the value thereof in his gross estate for U.S. federal estate tax purposes, and may be subject to U.S. federal estate tax unless an applicable estate tax treaty provides otherwise. Legislation enacted in the spring of 2001 provides for reductions in the U.S. federal estate tax through 2009 and the elimination of the estate tax entirely in 2010. Under this legislation, the U.S. federal estate tax would be fully reinstated, as in effect prior to the reductions, in 2011.
9896
We and theThe selling stockholderstockholders are offering the shares of our common stock described in this prospectus through the underwriters named below. UBS Securities LLC, William Blair & Company, L.L.C. and Deutsche Bank Securities Inc. are acting as joint book-running managers and together with William BlairRobert W. Baird & Company, L.L.C.Co. Incorporated are the representatives of the underwriters. We and the selling stockholderstockholders have entered into an underwriting agreement with the representatives. Subject to the terms and conditions of the underwriting agreement, each of the underwriters has severally agreed to purchase the number of shares of common stock listed next to its name in the following table:
| Underwriters | Number of shares | |
UBS Securities LLC | ||
| ||
William Blair & Company, L.L.C. | ||
Deutsche Bank Securities Inc. | ||
Robert W. Baird & Co. Incorporated | ||
Total | ||
The underwriting agreement provides that the underwriters must buy all of the shares if they buy any of them. However, the underwriters are not required to take or pay for the shares covered by the underwriters’ over-allotment option described below.
Our common stock and theThe common stock of the selling stockholderstockholders is offered subject to a number of conditions, including:
| Ø | receipt and acceptance of our common stock by the underwriters; and |
| Ø | the underwriters’ right to reject orders in whole or in part. |
We have been advised by the representatives that the underwriters intend to make a market in our common stock, but that they are not obligated to do so and may discontinue making a market at any time without notice.
In connection with this offering, certain of the underwriters or securities dealers may distribute prospectuses electronically.
OVER-ALLOTMENT OPTION
TheHCG Holdings LLC, a selling stockholder, has granted the underwriters an option to buy up to 750,000600,000 additional shares of our common stock. The underwriters may exercise this option solely for the purpose of covering over-allotments, if any, made in connection with this offering. The underwriters have 30 days from the date of this prospectus to exercise this option. If the underwriters exercise this option, they will each purchase additional shares approximately in proportion to the amounts specified in the table above.
COMMISSIONS AND DISCOUNTS
Shares sold by the underwriters to the public will initially be offered at the public offering price set forth on the cover of this prospectus. Any shares sold by the underwriters to securities dealers may be sold at a
99
Underwriting
discount of up to $$0. per share from the public offering price. Any of these securities dealers may resell any shares purchased from the underwriters to other brokers or dealers at a discount of up to $$0. per share from the public offering price. If all the shares are not sold at the public offering price, the
97
Underwriting
representatives may change the offering price and the other selling terms. Sales of shares made outside of the United States may be made by affiliates of the underwriters. Upon execution of the underwriting agreement, the underwriters will be obligated to purchase the shares at the prices and upon the terms stated therein, and, as a result, will thereafter bear any risk associated with changing the offering price to the public or other selling terms. The underwriters have informed us that they do not expect discretionary sales to exceed 5% of the shares of common stock to be offered.offered.
The following table shows the per share and total underwriting discounts and commissions wethat the selling stockholders will pay to the underwriters assuming both no exercise and full exercise of the underwriters’ option to purchase up to an additional 750,000 shares.
| No exercise | Full exercise | |||||||||||||||||
Per Share | $ | $ | ||||||||||||||||
Total | $ | $ | ||||||||||||||||
We estimate thatPursuant to a registration rights agreement with HCG Holdings LLC, we are required to pay the total expenses ofrelating to this offering, payable by us, not includingexcluding the underwriting discounts and commissions which will be approximately $3.7 million. This amount includes expenses, other than underwriting discounts and commissions, incurredborne by the selling stockholder in connection with this offering, which westockholders. These expenses will have agreed to pay.an approximately $ million impact on our net income for the remainder of the year.
NO SALES OF SIMILAR SECURITIES
We, each member of our board, each of our director nominees, each of our executive officers and managing directors and theeach selling stockholder have entered into lock-up agreements with the underwriters. Under these agreements, we and each of these persons may not, without the prior written approval of UBS Securities LLC, and Deutsche Bank Securities Inc., subject to certain permitted exceptions specified in the agreements, sell, offer to sell, contract or agree to sell, hypothecate, pledge, hedge, grant any option to purchase or otherwise dispose of or agree to dispose of, directly or indirectly, our common stock or securities convertible into or exchangeable for our common stock. These restrictions will be in effect for a period of 18090 days after the date of this prospectus. The 180-day90-day lock-up period may be extended under certain circumstances where we announce or pre-announce earnings or material news or a material event occurs within approximately 18 days before, or approximately 16 days after, the termination of the 180-day90-day period. At any time and without public notice, UBS Securities LLC, and Deutsche Bank Securities Inc. may, in theirits sole discretion, release all or some of the securities from these lock-up agreements.
We and theeach selling stockholder have agreed to indemnify the underwriters against certain liabilities, including liabilities under the Securities Act. If we are unable to provide this indemnification, we have agreed to contribute to payments that the underwriters may be required to make in respect of those liabilities. We and the selling stockholderstockholders have also agreed to indemnify each other against certain liabilities, including liabilities under the Securities Act, and to contribute to payments which may be required in respect thereof.
We have applied for the quotation of ourNASDAQ NATIONAL MARKET QUOTATION
Our common stock is quoted on the NASDAQ National Market under the symbol “HURN.”
100
Underwriting
PRICE STABILIZATION, SHORT POSITIONS
In connection with this offering, the underwriters may engage in activities that stabilize, maintain or otherwise affect the price of our common stock including:
| Ø | stabilizing transactions; |
98
Underwriting
| Ø | short sales; |
| Ø | purchases to cover positions created by short sales; |
| Ø | imposition of penalty bids; and |
| Ø | syndicate covering transactions. |
Stabilizing transactions consist of bids or purchases made for the purpose of preventing or retarding a decline in the market price of our common stock while this offering is in progress. These transactions may also include making short sales of our common stock, which involves the sale by the underwriters of a greater number of shares of common stock than they are required to purchase in this offering, and purchasing shares of common stock on the open market to cover positions created by short sales. Short sales may be “covered” shorts, which are short positions in an amount not greater than the underwriters’ over-allotment option referred to above, or may be “naked” shorts, which are short positions in excess of that amount.
The underwriters may close out any covered short position by either exercising their over-allotment option, in whole or in part, or by purchasing shares in the open market. In making this determination, the underwriters will consider, among other things, the price of shares available for purchase in the open market as compared to the price at which they may purchase shares through the over-allotment option.
Naked short sales are in excess of the over-allotment option. The underwriters must close out any naked short position by purchasing shares in the open market. A naked short position is more likely to be created if the underwriters are concerned that there may be downward pressure on the price of the common stock in the open market that could adversely affect investors who purchased in this offering.
The underwriters also may impose a penalty bid. This occurs when a particular underwriter repays to the underwriters a portion of the underwriting discount received by it because the representatives have repurchased shares sold by or for the account of that underwriter in stabilizing or short covering transactions.
As a result of these activities, the price of our common stock may be higher than the price that otherwise might exist in the open market. If these activities are commenced, they may be discontinued by the underwriters at any time. The underwriters may carry out these transactions on the NASDAQ National Market, in the over-the-counter market or otherwise.
DETERMINATION OF OFFERING PRICE
Prior to this offering, there has been no public market for our common stock. The initial public offering price will be determined by negotiation by us and the representatives of the underwriters. The principal factors to be considered in determining the initial public offering price include:
101
Underwriting
DIRECTED SHARE PROGRAM
At our request, certain of the underwriters have reserved up to 5% of the common stock being offered by this prospectus for sale toour board members, officers,employees, strategic partners and otherindividuals associated with us and members of their families at the initial offering price. The sales will be made by an affiliate of UBS Securities LLC through a directed share program. We do not know if these persons will choose to purchase all or any portion of these reserved shares, but any purchases they do make will reduce the number of shares available to the general public. These persons must commit to purchase no later than the open of business on the day following the date of this prospectus. In addition, any person allocated more than $100,000 worth of shares under the directed share program must agree, as a condition to purchasing the shares, to enter into a lock-up agreement with the same terms as the agreements described above that we, each member of our board, each of our director nominees, each of our executive officers and managing directors and the selling stockholder have entered into.
AFFILIATIONS
The underwriters and their affiliates may, from time to time, provide certain commercial banking, financial advisory and investment banking services for us for which they will receive customary fees.
10299
European Economic Area
With respect to each Member State of the European Economic Area which has implemented Prospectus Directive 2003/71/EC, including any applicable implementing measures, from and including the date on which the Prospectus Directive is implemented in that Member State, the offering of our common stock in this offering is only being made:
| (a) | to legal entities which are authorized or regulated to operate in the financial markets or, if not so authorized or regulated, whose corporate purpose is solely to invest in securities; |
| (b) | to any legal entity which has two or more of (1) an average of at least 250 employees during the last financial year; (2) a total balance sheet of more than 43,000,000 and (3) an annual net turnover of more than 50,000,000, as shown in its last annual or consolidated accounts; or |
| (c) | in any other circumstances which do not require the publication by the Issuer of a prospectus pursuant to Article 3 of the Prospectus Directive. |
United Kingdom
Shares of our common stock may not be offered or sold and will not be offered or sold to any persons in the United Kingdom other than to persons whose ordinary activities involve them in acquiring, holding, managing or disposing of investments (as principal or as agent) for the purposes of their businesses and in compliance with all applicable provisions of the FSMA with respect to anything done in relation to shares of our common stock in, from or otherwise involving the United Kingdom. Without limitation to the other restrictions referred to herein, this offering circular is directed only at (1) persons outside the United Kingdom, (2) persons having professional experience in matters relating to investments who fall within the definition of “investment professionals” in Article 19(5) of the Financial Services and Markets Act 2000 (Financial Promotion) Order 2005; or (3) high net worth bodies corporate, unincorporated associations and partnerships and trustees of high value trusts as described in Article 49(2) of the Financial Services and Markets Act 2000 (Financial Promotion) Order 2005. Without limitation to the other restrictions referred to herein, any investment or investment activity to which this offering circular relates is available only to, and will be engaged in only with, such persons, and persons within the United Kingdom who receive this communication (other than persons who fall within (2) or (3) above) should not rely or act upon this communication.
Switzerland
Shares of our common stock may be offered in Switzerland only on the basis of a non-public offering. This prospectus does not constitute an issuance prospectus according to articles 652a or 1156 of the Swiss Federal Code of Obligations or a listing prospectus according to article 32 of the Listing Rules of the Swiss exchange. The shares of our common stock may not be offered or distributed on a professional basis in or from Switzerland and neither this prospectus nor any other offering material relating to shares of our common stock may be publicly issued in connection with any such offer or distribution. The shares have not been and will not be approved by any Swiss regulatory authority. In particular, the shares are not and will not be registered with or supervised by the Swiss Federal Banking Commission, and investors may not claim protection under the Swiss Investment Fund Act.
100
The validity of the shares of our common stock offered by this prospectus will be passed upon for us and the selling stockholder by Skadden, Arps, Slate, Meagher & Flom LLP, Chicago, Illinois, and for the underwriters by Katten Muchin Zavis Rosenman LLP, Chicago, Illinois. An investment partnership consisting of current and former partners of, and persons associated with, Skadden, Arps, Slate, Meagher & Flom LLP beneficially owns less than 1% of our common stock through an investment in Lake Capital Partners LP, a member of HCG Holdings LLC, which is the selling stockholder in this offering. From time to time, Katten Muchin Zavis Rosenman actsLLP has acted as our counsel on various matters unrelated to this offering.
The consolidated financial statements of Huron Consulting Group Inc. as of December 31, 20022003 and 20032004 and for the period from March 19, 2002 (inception) to December 31, 2002 and the years ended December 31, 2003 and 2004 included in this prospectus have been so included in reliance on the report of PricewaterhouseCoopers LLP, an independent registered public accounting firm, given on the authority of said firm as experts in auditing and accounting.
The financial statements of Speltz & Weis LLC as of December 31, 2004 and for the year ended December 31, 20032004 included in this prospectus have been so included in reliance on the report of PricewaterhouseCoopers LLP, an independent registered public accounting firm, given on the authority of said firm as experts in auditing and accounting.
Where you can find additional information
We file annual, quarterly and special reports, proxy statements and other information with the SEC. You are able to inspect and copy these reports, proxy statements and other information without charge at the Public Reference Room the SEC maintains at 100 F Street, NE, Room 1580, Washington, D.C. 20549. You may obtain copies of all or any part of these materials from the SEC upon the payment of certain fees prescribed by the SEC. You may obtain further information about the operation of the SEC’s Public Reference Room by calling the SEC at 1-800-SEC-0330. You may also inspect these reports and other information without charge at a website maintained by the SEC. The address of this site is http://www.sec.gov.
We have filed with the SEC a Registration Statement on Form S-1 under the Securities Act with respect to the common stock offered in this prospectus. This prospectus, filed as part of the registration statement, does not contain all of the information set forth in the registration statement and its exhibits and schedules, portions of which have been omitted as permitted by the rules and regulations of the SEC. For further information about us and our common stock, we refer you to the registration statement and to its exhibits and schedules. Statements in this prospectus about the contents of any contract, agreement or other document are not necessarily complete and, in each instance, we refer you to the copy of such contract, agreement or document filed as an exhibit to the registration statement, with each such statement being qualified in all respects by reference to the document to which it refers. Anyone may inspectobtain the registration statement and its exhibits and schedules without charge at the Public Reference Room the SEC maintains at 450 Fifth Street, N.W., Washington, D.C. 20549. You may obtain copies of all or any part of these materials from the SEC upon the payment of certain fees prescribed by the SEC. You may obtain further information about the operation of the SEC’s Public Reference Room by calling the SEC at 1-800-SEC-0330. You may also inspect these reports and other information without charge at a website maintained by the SEC. The address of this site is http://www.sec.gov.
Upon completion of this offering, we will become subject to the informational requirements of the Exchange Act and will be required to file reports, proxy statements and other information with the SEC. You will be able to inspect and copy these reports, proxy statements and other information at the Public Reference Room of the SEC as described above or inspect them without charge at the SEC’s website.
103101
| Page | |
Report of IndependentRegistered Public Accounting Firm | F-2 | |
Audited Consolidated Balance Sheets at December 31, | F-3 | |
| F-4 | ||
| F-5 | ||
| F-6 | ||
| F-7 | ||
Unaudited Consolidated Financial Statements of Huron Consulting Group, Inc. | ||
| F-21 | ||
| F-22 | ||
Unaudited Consolidated Statement of Stockholders’ Equity for the six months ended June 30, 2005 | F-23 | |
| F-24 | ||
| F-25 | ||
Financial Statements of Speltz & Weis LLC | ||
| F-31 | ||
Balance Sheets at December 31, 2004 (audited) and March 31, 2005 (unaudited) | F-32 | |
| F-33 | ||
| F-34 | ||
| F-35 | ||
| F-36 | ||
Huron Consulting Group, Inc. Unaudited Pro Forma Financial Information | ||
| F-39 | ||
Unaudited Pro Forma Consolidated Statement of Income for the year ended December 31, 2004 | F-40 | |
Unaudited Pro Forma Consolidated Statement of Income for the six months ended June 30, 2005 | F-41 | |
| F-42 | ||
F-1
Report of Independent Registered Public Accounting Firm
To the Board of Directors and Stockholders of
Huron Consulting Group Inc.:
The reverse stock split and increase in authorized shares of Class A Common Stock and Preferred Stock described in Note 14 to the financial statements have not been consummated at September 24, 2004. When they have been consummated, we will be in a position to furnish the following report:
“In our opinion, the accompanying consolidated balance sheets and the related consolidated statements of operations, stockholders’ deficitequity (deficit) and cash flows present fairly, in all material respects, the financial position of Huron Consulting Group Inc. and its subsidiary at December 31, 20022004 and 2003, and the results of their operations and their cash flows for the years ended December 31, 2004 and 2003 and the period from March 19, 2002 (inception) to December 31, 2002 and the year ended December 31, 2003 in conformity with accounting principles generally accepted in the United States of America. These financial statements are the responsibility of the Company’s management. Our responsibility is to express an opinion on these financial statements based on our audits. We conducted our audits of these statements in accordance with the standards of the Public Company Accounting Oversight Board (United States). Those standards require that we plan and perform the audit to obtain reasonable assurance about whether the financial statements are free of material misstatement. An audit includes examining, on a test basis, evidence supporting the amounts and disclosures in the financial statements, assessing the accounting principles used and significant estimates made by management, and evaluating the overall financial statement presentation. We believe that our audits provide a reasonable basis for our opinion.”
/s/ PricewaterhouseCoopers LLP
Chicago, Illinois
March 25, 2004
February 14, 2005, except as to Note 15 which is as of August 26, 2005
F-2
Huron Consulting Group Inc.
AUDITED CONSOLIDATED BALANCE SHEETS
| December 31, | June 30, 2004 | Pro Forma June 30, (note 2) | ||||||||||||||
| 2002 | 2003 | |||||||||||||||
| (unaudited) | ||||||||||||||||
| Assets | ||||||||||||||||
Current assets: | ||||||||||||||||
Cash and cash equivalents | $ | 4,448,806 | $ | 4,251,097 | $ | 943,054 | ||||||||||
Receivables from clients | 6,440,626 | 16,151,667 | 23,787,921 | |||||||||||||
Unbilled services | 6,505,714 | 8,704,057 | 13,306,668 | |||||||||||||
Allowance for doubtful accounts and unbilled services | (381,753 | ) | (1,791,720 | ) | (2,911,401 | ) | ||||||||||
Net receivables from clients and unbilled services | 12,564,587 | 23,064,004 | 34,183,188 | |||||||||||||
Income tax receivable | — | 2,286,015 | — | |||||||||||||
Deferred income taxes | 283,754 | 1,945,932 | 2,407,769 | |||||||||||||
Other current assets | 387,542 | 836,868 | 1,890,340 | |||||||||||||
Total current assets | 17,684,689 | 32,383,916 | 39,424,351 | |||||||||||||
Property and equipment, net | 1,898,954 | 4,498,251 | 6,458,123 | |||||||||||||
Other assets: | ||||||||||||||||
Deferred income taxes | 2,426,570 | 2,332,543 | 2,511,788 | |||||||||||||
Intangibles, net of accumulated amortization of $2,635,172, $6,384,415 and $0, at December 31, 2002 and 2003 and June 30, 2004 (unaudited), respectively | 3,689,243 | — | — | |||||||||||||
Deposits | 883,203 | 674,000 | 537,561 | |||||||||||||
Total other assets | 6,999,016 | 3,006,543 | 3,049,349 | |||||||||||||
Total assets | $ | 26,582,659 | $ | 39,888,710 | $ | 48,931,823 | ||||||||||
Liabilities and stockholders’ deficit | ||||||||||||||||
Current liabilities: | ||||||||||||||||
Accounts payable | $ | 221,759 | $ | 1,396,265 | $ | 1,939,799 | ||||||||||
Accrued expenses | 1,334,796 | 3,821,527 | 2,309,274 | |||||||||||||
Accrued payroll and related benefits | 4,625,401 | 13,914,391 | 14,589,379 | |||||||||||||
Deferred revenue | 1,379,741 | 2,272,886 | 2,596,441 | |||||||||||||
Income taxes payable | — | — | 747,966 | |||||||||||||
Interest payable to HCG Holdings LLC | 342,741 | 819,624 | 403,031 | |||||||||||||
Total current liabilities | 7,904,438 | 22,224,693 | 22,585,890 | |||||||||||||
Non-current liabilities: | ||||||||||||||||
Accrued expenses | — | — | 707,350 | |||||||||||||
Deferred lease incentives | — | — | 962,997 | |||||||||||||
Total non-current liabilities | — | — | 1,670,347 | |||||||||||||
Commitments and contingencies | ||||||||||||||||
Notes payable to HCG Holdings LLC | 10,075,764 | 10,075,764 | 10,075,764 | |||||||||||||
8% preferred stock, $1,000 per share stated value plus accrued 8% annual cumulative dividends; 106,840 shares authorized; 12,500 shares issued and outstanding at December 31, 2002 and 2003 and June 30, 2004 (unaudited) | 13,145,735 | 14,212,000 | 14,770,398 | |||||||||||||
Stockholders’ deficit: | ||||||||||||||||
Class A common stock*; $0.01 par value; 500,000,000 shares authorized; 11,281,243, 11,281,243 and 11,285,592 shares issued and outstanding at December 31, 2002 and 2003 and June 30, 2004 (unaudited), respectively; 12,176,619 shares issued and outstanding pro forma | 259,469 | 259,469 | 112,856 | $ | 121,766 | |||||||||||
Class B common stock*; $0.01 par value; 6,486,715 shares authorized; 521,740, 682,348 and 891,027 shares issued and outstanding at December 31, 2002 and 2003 and June 30, 2004 (unaudited), respectively; no shares authorized, issued and outstanding pro forma | 12,000 | 15,694 | 8,910 | — | ||||||||||||
Additional paid-in capital | — | 41,519 | 1,223,927 | 1,223,927 | ||||||||||||
Stock subscription receivable | (3,000 | ) | — | — | — | |||||||||||
Retained deficit | (4,811,747 | ) | (6,940,429 | ) | (1,516,269 | ) | (1,516,269 | ) | ||||||||
Total stockholders’ deficit | (4,543,278 | ) | (6,623,747 | ) | (170,576 | ) | $ | (170,576 | ) | |||||||
Total liabilities and stockholders’ deficit | $ | 26,582,659 | $ | 39,888,710 | $ | 48,931,823 | ||||||||||
(In thousands, except share and per share amounts)
| December 31, 2004 | December 31, 2003 | |||||||
Assets | ||||||||
Current assets: | ||||||||
Cash and cash equivalents | $ | 28,092 | $ | 4,251 | ||||
Receivables from clients, net | 21,750 | 15,118 | ||||||
Unbilled services, net | 10,830 | 7,946 | ||||||
Income tax receivable | 494 | 2,286 | ||||||
Deferred income taxes | 7,919 | 1,946 | ||||||
Other current assets | 3,053 | 837 | ||||||
Total current assets | 72,138 | 32,384 | ||||||
Property and equipment, net | 8,975 | 4,498 | ||||||
Other assets: | ||||||||
Deferred income taxes | 1,450 | 2,333 | ||||||
Deposits | 656 | 674 | ||||||
Total other assets | 2,106 | 3,007 | ||||||
Total assets | $ | 83,219 | $ | 39,889 | ||||
Liabilities and stockholders’ equity (deficit) | ||||||||
Current liabilities: | ||||||||
Accounts payable | $ | 2,809 | $ | 1,396 | ||||
Accrued expenses | 3,334 | 3,822 | ||||||
Accrued payroll and related benefits | 20,494 | 13,914 | ||||||
Deferred revenue | 2,603 | 2,273 | ||||||
Interest payable to HCG Holdings LLC | — | 820 | ||||||
Total current liabilities | 29,240 | 22,225 | ||||||
Non-current liabilities: | ||||||||
Accrued expenses | 598 | — | ||||||
Deferred lease incentives | 4,148 | — | ||||||
Total non-current liabilities | 4,746 | — | ||||||
Commitments and contingencies: | ||||||||
Notes payable to HCG Holdings LLC | — | 10,076 | ||||||
8% preferred stock, $1,000 per share stated value plus accrued 8% annual cumulative dividends; 106,840 shares authorized; 0 and 12,500 shares issued and outstanding at December 31, 2004 and December 31, 2003, respectively | — | 14,212 | ||||||
Stockholders’ equity (deficit) | ||||||||
Common stock (previously named Class A common stock)*; $0.01 par value; 500,000,000 shares authorized; 16,364,574 and 11,281,243 shares issued and outstanding at December 31, 2004 and December 31, 2003, respectively | 164 | 259 | ||||||
Class B common stock (retired in 2004)*; $0.01 par value; 6,486,715 shares authorized; 682,348 shares issued and outstanding at December 31, 2003 | — | 16 | ||||||
Additional paid-in capital | 59,608 | 42 | ||||||
Deferred stock-based compensation | (12,281 | ) | — | |||||
Retained earnings (deficit) | 1,742 | (6,941 | ) | |||||
Total stockholders’ equity (deficit) | 49,233 | (6,624 | ) | |||||
Total liabilities and stockholders’ equity | $ | 83,219 | $ | 39,889 | ||||
| * | Adjusted to reflect a 1 for 2.3 reverse stock split |
The accompanying notes are an integral part of the audited consolidated financial statements.
F-3
Huron Consulting Group Inc.
AUDITED CONSOLIDATED STATEMENTS OF OPERATIONS
| Period from March 19, 2002 (inception) to December 31, 2002 | Year ended December 31, 2003 | Six months ended June 30, | |||||||||||||
| 2003 | 2004 | ||||||||||||||
(unaudited) | |||||||||||||||
Revenues and reimbursable expenses: | |||||||||||||||
Revenues | $ | 35,100,712 | $ | 101,485,674 | $ | 46,923,345 | $ | 81,603,683 | |||||||
Reimbursable expenses | 2,921,301 | 8,808,455 | 3,906,477 | 7,090,384 | |||||||||||
Total revenues and reimbursable expenses | 38,022,013 | 110,294,129 | 50,829,822 | 88,694,067 | |||||||||||
Direct costs and reimbursable expenses: | |||||||||||||||
Direct costs | 26,054,642 | 69,400,274 | 29,319,485 | 47,591,392 | |||||||||||
Reimbursable expenses | 2,921,301 | 8,929,129 | 3,917,197 | 7,064,811 | |||||||||||
Total direct costs and reimbursable expenses | 28,975,943 | 78,329,403 | 33,236,682 | 54,656,203 | |||||||||||
Gross profit | 9,046,070 | 31,964,726 | 17,593,140 | 34,037,864 | |||||||||||
Operating expenses: | |||||||||||||||
Selling, general and administrative | 8,812,781 | 25,184,911 | 11,093,507 | 17,839,665 | |||||||||||
Depreciation and amortization | 3,047,914 | 5,328,484 | 2,657,997 | 1,074,842 | |||||||||||
Loss on lease abandonment | — | 1,668,000 | — | — | |||||||||||
Restructuring charge | — | — | — | 2,138,827 | |||||||||||
Management and advisory fees paid to related parties | 2,750,000 | — | — | — | |||||||||||
Organization costs | 965,489 | — | — | — | |||||||||||
Total operating expenses | 15,576,184 | 32,181,395 | 13,751,504 | 21,053,334 | |||||||||||
Operating (loss) income | (6,530,114 | ) | (216,669 | ) | 3,841,636 | 12,984,530 | |||||||||
Other expense: | |||||||||||||||
Interest expense | 331,784 | 856,252 | 418,570 | 516,015 | |||||||||||
Other | 1,113 | 111,513 | 111,513 | (724 | ) | ||||||||||
Total other expense | 332,897 | 967,765 | 530,083 | 515,291 | |||||||||||
Net (loss) income before (benefit) provision for income taxes | (6,863,011 | ) | (1,184,434 | ) | 3,311,553 | 12,469,239 | |||||||||
(Benefit) provision for income taxes | (2,696,999 | ) | (122,017 | ) | 1,451,382 | 5,236,680 | |||||||||
Net (loss) income | (4,166,012 | ) | (1,062,417 | ) | 1,860,171 | 7,232,559 | |||||||||
Accrued dividends on 8% preferred stock | 645,735 | 1,066,265 | 515,642 | 558,399 | |||||||||||
Net (loss) income attributable to common stockholders | $ | (4,811,747 | ) | $ | (2,128,682 | ) | $ | 1,344,529 | $ | 6,674,160 | |||||
Net (loss) income attributable to common stockholders per share:* | |||||||||||||||
Basic | $ | (0.41 | ) | $ | (0.18 | ) | $ | 0.05 | $ | 0.50 | |||||
Diluted | $ | (0.41 | ) | $ | (0.18 | ) | $ | 0.05 | $ | 0.47 | |||||
Weighted average shares used in calculating net (loss) income attributable to common stockholders per share:* | |||||||||||||||
Basic | 11,802,982 | 11,870,958 | 11,805,752 | 12,011,324 | |||||||||||
Diluted | 11,802,982 | 11,870,958 | 12,356,826 | 13,005,228 | |||||||||||
Unaudited pro forma net (loss) income attributable to common stockholders per share:* (Note 2) | |||||||||||||||
Basic | $ | (0.04 | ) | $ | 0.50 | ||||||||||
Diluted | $ | (0.04 | ) | $ | 0.47 | ||||||||||
(In thousands, except per share amounts)
| Year Ended December 31, | March 19, 2002 (inception) to December 31, 2002 | ||||||||||
| 2004 | 2003 | ||||||||||
Revenues and reimbursable expenses: | |||||||||||
Revenues | $ | 159,550 | $ | 101,486 | $ | 35,101 | |||||
Reimbursable expenses | 14,361 | 8,808 | 2,921 | ||||||||
Total revenues and reimbursable expenses | 173,911 | 110,294 | 38,022 | ||||||||
Direct costs and reimbursable expenses: | |||||||||||
Direct costs | 92,270 | 69,374 | 26,055 | ||||||||
Stock-based compensation expense | 978 | 27 | — | ||||||||
Reimbursable expenses | 14,281 | 8,929 | 2,921 | ||||||||
Total direct costs and reimbursable expenses | 107,529 | 78,330 | 28,976 | ||||||||
Operating expenses: | |||||||||||
Selling, general and administrative | 40,425 | 25,171 | 8,813 | ||||||||
Stock-based compensation expense | 433 | 14 | — | ||||||||
Depreciation and amortization | 2,365 | 5,328 | 3,048 | ||||||||
Restructuring charges | 3,475 | — | — | ||||||||
Management and advisory fees paid to related parties | — | — | 2,750 | ||||||||
Loss on lease abandonment | — | 1,668 | — | ||||||||
Organization costs | — | — | 965 | ||||||||
Total operating expenses | 46,698 | 32,181 | 15,576 | ||||||||
Operating income (loss) | 19,684 | (217 | ) | (6,530 | ) | ||||||
Other expenses: | |||||||||||
Interest expense, net | 692 | 856 | 332 | ||||||||
Other | — | 112 | 1 | ||||||||
Total other expenses | 692 | 968 | 333 | ||||||||
Net income (loss) before provision (benefit) for income taxes | 18,992 | (1,185 | ) | (6,863 | ) | ||||||
Provision (benefit) for income taxes | 8,128 | (122 | ) | (2,697 | ) | ||||||
Net income (loss) | 10,864 | (1,063 | ) | (4,166 | ) | ||||||
Accrued dividends on 8% preferred stock | 931 | 1,066 | 646 | ||||||||
Net income (loss) attributable to common stockholders | $ | 9,933 | $ | (2,129 | ) | $ | (4,812 | ) | |||
Net income (loss) attributable to common stockholders per share*: | |||||||||||
Basic | $ | 0.77 | $ | (0.18 | ) | $ | (0.41 | ) | |||
Diluted | $ | 0.72 | $ | (0.18 | ) | $ | (0.41 | ) | |||
Weighted average shares used in calculating net income (loss) attributable to common stockholders per share*: | |||||||||||
Basic | 12,820 | 11,871 | 11,803 | ||||||||
Diluted | 13,765 | 11,871 | 11,803 | ||||||||
| * | Adjusted to reflect a 1 for 2.3 reverse stock split |
The accompanying notes are an integral part of the audited consolidated financial statements.
F-4
Huron Consulting Group Inc.
Huron Consulting Group Inc.
AUDITED CONSOLIDATED STATEMENTSSTATEMENT OF STOCKHOLDERS’ DEFICITEQUITY (DEFICIT)
Class A common stock | Class B common stock | Stock subscription receivable | Additional paid-in capital | Retained deficit | Stockholders’ deficit | ||||||||||||||||||||||
| Shares* | Amount | Shares* | Amount | ||||||||||||||||||||||||
Balance at March 19, 2002 (inception) | — | $ | — | — | $ | — | $ | — | $ | — | $ | — | $ | — | |||||||||||||
Issuance of Class A common stock | 11,281,243 | 259,469 | — | — | — | — | — | 259,469 | |||||||||||||||||||
Issuance of Class B common stock | — | — | 521,740 | 12,000 | — | — | — | 12,000 | |||||||||||||||||||
Stock subscription receivable | — | — | — | — | (3,000 | ) | — | — | (3,000 | ) | |||||||||||||||||
Accrued dividends on 8% preferred stock | — | — | — | — | — | — | (645,735 | ) | (645,735 | ) | |||||||||||||||||
Net loss | — | — | — | — | — | — | (4,166,012 | ) | (4,166,012 | ) | |||||||||||||||||
Balance at December 31, 2002 | 11,281,243 | 259,469 | 521,740 | 12,000 | (3,000 | ) | — | (4,811,747 | ) | (4,543,278 | ) | ||||||||||||||||
Exercise of stock options | — | — | 160,608 | 3,694 | — | — | — | 3,694 | |||||||||||||||||||
Stock option compensation | — | — | — | — | — | 41,519 | — | 41,519 | |||||||||||||||||||
Stock subscription receivable | — | — | — | — | 3,000 | — | — | 3,000 | |||||||||||||||||||
Accrued dividends on 8% preferred stock | — | — | — | — | — | — | (1,066,265 | ) | (1,066,265 | ) | |||||||||||||||||
Net loss | — | — | — | — | — | — | (1,062,417 | ) | (1,062,417 | ) | |||||||||||||||||
Balance at December 31, 2003 | 11,281,243 | 259,469 | 682,348 | 15,694 | — | 41,519 | (6,940,429 | ) | (6,623,747 | ) | |||||||||||||||||
Exercise of stock options (unaudited) | 4,349 | 43 | 208,679 | 2,087 | — | 36,945 | — | 39,075 | |||||||||||||||||||
Stock option compensation (unaudited) | — | — | — | — | — | 245,897 | — | 245,897 | |||||||||||||||||||
Income tax benefit on stock options exercised (unaudited) | — | — | — | — | — | 744,039 | — | 744,039 | |||||||||||||||||||
Accrued dividends on 8% preferred stock (unaudited) | — | — | — | — | — | — | (558,399 | ) | (558,399 | ) | |||||||||||||||||
1 for 2.3 reverse stock split | — | (146,656 | ) | — | (8,871 | ) | — | 155,527 | — | — | |||||||||||||||||
Net income (unaudited) | — | — | — | — | — | — | 7,232,559 | 7,232,559 | |||||||||||||||||||
Dividends paid (unaudited) | — | — | — | — | — | — | (1,250,000 | ) | (1,250,000 | ) | |||||||||||||||||
Balance at June 30, 2004 (unaudited) | 11,285,592 | $ | 112,856 | 891,027 | $ | 8,910 | $ | — | $ | 1,223,927 | $ | (1,516,269 | ) | $ | (170,576 | ) | |||||||||||
(In thousands, except share amounts)
| Common Stock (previously Class A Common Stock) | Class B Common Stock (retired in 2004) | Stock Subscription Receivable | Additional Paid-In Capital | Deferred Stock-based Compensation | Retained Earnings (Deficit) | Stockholders’ Equity (Deficit) | ||||||||||||||||||||||||||
| Shares* | Amount | Shares* | Amount | |||||||||||||||||||||||||||||
Balance at March 19, 2002 (inception) | — | $ | — | — | $ | — | $ | — | $ | — | $ | — | $ | — | $ | — | ||||||||||||||||
Net loss | — | — | — | — | — | — | — | (4,166 | ) | (4,166 | ) | |||||||||||||||||||||
Issuance of Class A common stock | 11,281,243 | 259 | — | — | — | — | — | — | 259 | |||||||||||||||||||||||
Issuance of Class B common stock | — | — | 521,740 | 12 | — | — | — | — | 12 | |||||||||||||||||||||||
Stock subscription receivable | — | — | — | — | (2 | ) | — | — | — | (2 | ) | |||||||||||||||||||||
Accrued dividends on 8% preferred stock | — | — | — | — | — | — | — | (646 | ) | (646 | ) | |||||||||||||||||||||
Balance at December 31, 2002 | 11,281,243 | 259 | 521,740 | 12 | (2 | ) | — | — | (4,812 | ) | (4,543 | ) | ||||||||||||||||||||
Net loss | — | — | — | — | — | — | — | (1,063 | ) | (1,063 | ) | |||||||||||||||||||||
Exercise of stock options | — | — | 160,608 | 4 | — | — | — | — | 4 | |||||||||||||||||||||||
Stock option compensation | — | — | — | — | — | 42 | — | — | 42 | |||||||||||||||||||||||
Stock subscription receivable | — | — | — | — | 2 | — | — | — | 2 | |||||||||||||||||||||||
Accrued dividends on 8% preferred stock | — | — | — | — | — | — | — | (1,066 | ) | (1,066 | ) | |||||||||||||||||||||
Balance at December 31, 2003 | 11,281,243 | 259 | 682,348 | 16 | — | 42 | — | (6,941 | ) | (6,624 | ) | |||||||||||||||||||||
Net income | — | — | — | — | — | — | — | 10,864 | 10,864 | |||||||||||||||||||||||
Dividends paid | — | — | — | — | — | — | — | (1,250 | ) | (1,250 | ) | |||||||||||||||||||||
Issuance of common stock in connection with: | ||||||||||||||||||||||||||||||||
Initial public offering, net of offering costs | 3,333,333 | 33 | — | — | — | 44,696 | — | — | 44,729 | |||||||||||||||||||||||
Restricted stock awards, net of cancellations | 821,350 | 8 | — | — | — | 12,976 | (12,984 | ) | — | — | ||||||||||||||||||||||
Exercise of stock options | 29,846 | — | 216,454 | 2 | — | 51 | — | — | 53 | |||||||||||||||||||||||
Stock-based compensation | — | — | — | — | — | 709 | 703 | — | 1,412 | |||||||||||||||||||||||
Income tax benefit on stock-based compensation | — | — | — | — | — | 980 | — | — | 980 | |||||||||||||||||||||||
1 for 2.3 reverse stock split | — | (145 | ) | — | (9 | ) | — | 154 | — | — | — | |||||||||||||||||||||
Conversion of Class B common stock to common stock | 898,802 | 9 | (898,802 | ) | (9 | ) | — | — | — | — | — | |||||||||||||||||||||
Accrued dividends on 8% preferred stock | — | — | — | — | — | — | — | (931 | ) | (931 | ) | |||||||||||||||||||||
Balance at December 31, 2004 | 16,364,574 | $ | 164 | — | $ | — | $ | — | $ | 59,608 | $ | (12,281 | ) | $ | 1,742 | $ | 49,233 | |||||||||||||||
| * | Adjusted |
The accompanying notes are an integral part of the audited consolidated financial statements.
F-5
Huron Consulting Group Inc.
AUDITED CONSOLIDATED STATEMENTS OF CASH FLOWS
| Period from March 19, 2002 (inception) to December 31, 2002 | Year ended December 31, 2003 | Six months ended June 30, | ||||||||||||||
| 2003 | 2004 | |||||||||||||||
| (unaudited) | ||||||||||||||||
Cash flows from operating activities: | ||||||||||||||||
Net (loss) income | $ | (4,166,012 | ) | $ | (1,062,417 | ) | $ | 1,860,171 | $ | 7,232,559 | ||||||
Adjustments to reconcile net (loss) income to net cash (used in) provided by operating activities | ||||||||||||||||
Depreciation and amortization | 3,047,914 | 5,328,484 | 2,657,997 | 1,074,842 | ||||||||||||
Loss on long-term deposits | — | 111,085 | 111,085 | — | ||||||||||||
Deferred income taxes | (2,710,324 | ) | (1,568,151 | ) | (211,306 | ) | (641,082 | ) | ||||||||
Compensation expense related to stock option issuance | — | 41,519 | — | 245,897 | ||||||||||||
Tax benefit from stock options exercised | — | — | — | 744,039 | ||||||||||||
Allowance for doubtful accounts and unbilled services | 381,753 | 1,409,967 | 209,647 | 1,119,681 | ||||||||||||
Changes in operating assets and liabilities: | ||||||||||||||||
Increase in receivables from clients | (6,440,626 | ) | (9,711,041 | ) | (3,695,428 | ) | (7,636,254 | ) | ||||||||
Increase in unbilled services | (6,505,714 | ) | (2,198,343 | ) | (4,570,616 | ) | (4,602,611 | ) | ||||||||
(Increase) decrease in income tax receivable | — | (2,286,015 | ) | (2,026,561 | ) | 2,286,015 | ||||||||||
Increase in other current assets | (387,542 | ) | (449,326 | ) | (677,545 | ) | (1,053,472 | ) | ||||||||
(Increase) decrease in deposits | (883,203 | ) | 98,118 | 111,118 | 136,439 | |||||||||||
Increase in accounts payable and accrued expenses | 1,556,555 | 3,661,237 | 657,134 | 701,627 | ||||||||||||
Increase in accrued payroll and related benefits | 4,625,401 | 9,288,990 | 2,822,808 | 674,988 | ||||||||||||
Increase (decrease) in interest payable to HCG Holdings LLC | 342,741 | 476,883 | 64,896 | (416,593 | ) | |||||||||||
Increase in income taxes payable | — | — | — | 747,966 | ||||||||||||
Increase in deferred revenue | 1,379,741 | 893,145 | 2,791,867 | 323,555 | ||||||||||||
Net cash (used in) provided by operating activities | (9,759,316 | ) | 4,034,135 | 105,267 | 937,596 | |||||||||||
Cash flows from investing activities: | ||||||||||||||||
Purchase of property and equipment | (2,311,696 | ) | (4,178,538 | ) | (2,104,810 | ) | (3,034,714 | ) | ||||||||
Acquisition of intangibles | (6,324,415 | ) | (60,000 | ) | — | — | ||||||||||
Net cash used in investing activities | (8,636,111 | ) | (4,238,538 | ) | (2,104,810 | ) | (3,034,714 | ) | ||||||||
Cash flows from financing activities: | ||||||||||||||||
Proceeds from issuance of Class A common stock | 259,469 | — | — | — | ||||||||||||
Proceeds from issuance of Class B common stock | 9,000 | 3,000 | 3,000 | — | ||||||||||||
Proceeds from issuance of 8% preferred stock | 12,500,000 | — | — | — | ||||||||||||
Proceeds from exercise of stock options | — | 3,694 | 2,031 | 39,075 | ||||||||||||
Proceeds from borrowings under line of credit | — | 19,175,000 | 21,500,000 | 34,200,000 | ||||||||||||
Repayments on line of credit | — | (19,175,000 | ) | (21,500,000 | ) | (34,200,000 | ) | |||||||||
Proceeds from notes issued to HCG Holdings LLC | 10,075,764 | — | — | — | ||||||||||||
Dividends paid | — | — | — | (1,250,000 | ) | |||||||||||
Net cash provided by (used in) financing activities | 22,844,233 | 6,694 | 5,031 | (1,210,925 | ) | |||||||||||
Net increase (decrease) in cash and cash equivalents | 4,448,806 | (197,709 | ) | (1,994,512 | ) | (3,308,043 | ) | |||||||||
Cash and cash equivalents: | ||||||||||||||||
Beginning of the period | — | 4,448,806 | 4,448,806 | 4,251,097 | ||||||||||||
End of the period | $ | 4,448,806 | $ | 4,251,097 | $ | 2,454,294 | $ | 943,054 | ||||||||
Noncash transaction: | ||||||||||||||||
Accrued dividends on 8% preferred stock | $ | 645,735 | $ | 1,066,265 | $ | 515,642 | $ | 558,399 | ||||||||
Supplemental disclosure of cash flow information: | ||||||||||||||||
Cash paid for interest | $ | — | $ | 416,979 | $ | 377,127 | $ | 920,310 | ||||||||
Cash paid for taxes | $ | — | $ | 3,736,471 | $ | 3,688,450 | $ | 2,099,740 | ||||||||
(In thousands)
| Year ended December 31, | March 19, 2002 (inception) to December 31, 2002 | |||||||||||
| 2004 | 2003 | |||||||||||
Cash flows from operating activities: | ||||||||||||
Net income (loss) | $ | 10,864 | $ | (1,063 | ) | $ | (4,166 | ) | ||||
Adjustments to reconcile net income (loss) to net cash provided by (used in) operating activities: | ||||||||||||
Depreciation and amortization | 2,365 | 5,328 | 3,048 | |||||||||
Loss on long-term deposits | — | 111 | — | |||||||||
Deferred income taxes | (5,090 | ) | (1,568 | ) | (2,710 | ) | ||||||
Stock-based compensation expense | 1,412 | 42 | — | |||||||||
Tax benefit from stock options exercised | 980 | — | — | |||||||||
Allowances for doubtful accounts and unbilled services | 1,873 | 1,410 | 382 | |||||||||
Changes in operating assets and liabilities: | ||||||||||||
Increase in receivables from clients | (7,943 | ) | (9,711 | ) | (6,441 | ) | ||||||
Increase in unbilled services | (3,446 | ) | (2,198 | ) | (6,506 | ) | ||||||
Decrease (increase) in income tax receivable, net | 2,741 | (2,286 | ) | — | ||||||||
Increase in other current assets | (2,114 | ) | (449 | ) | (388 | ) | ||||||
Decrease (increase) in deposits | 18 | 98 | (883 | ) | ||||||||
Increase in accounts payable and accrued expenses | 4,721 | 3,661 | 1,557 | |||||||||
Increase in accrued payroll and related benefits | 6,580 | 9,289 | 4,625 | |||||||||
(Decrease) increase in interest payable to HCG Holdings LLC | (820 | ) | 477 | 343 | ||||||||
Increase in deferred revenue | 330 | 893 | 1,380 | |||||||||
Net cash provided by (used in) operating activities | 12,471 | 4,034 | (9,759 | ) | ||||||||
Cash flows from investing activities: | ||||||||||||
Purchase of property and equipment, net | (6,943 | ) | (4,179 | ) | (2,312 | ) | ||||||
Acquisition of intangibles | — | (60 | ) | (6,324 | ) | |||||||
Net cash used in investing activities | (6,943 | ) | (4,239 | ) | (8,636 | ) | ||||||
Cash flows from financing activities: | ||||||||||||
Proceeds from issuance of common stock (previously named Class A common stock), net of offering costs | 44,729 | — | 259 | |||||||||
Proceeds from issuance of Class B common stock | — | 3 | 9 | |||||||||
(Redemption of) proceeds from issuance of 8% preferred stock | (12,500 | ) | — | 12,500 | ||||||||
Payment of accrued dividends on 8% preferred stock | (2,643 | ) | — | — | ||||||||
Proceeds from exercise of stock options | 53 | 4 | — | |||||||||
Proceeds from borrowings under line of credit | 37,200 | 19,175 | — | |||||||||
Repayments on line of credit | (37,200 | ) | (19,175 | ) | — | |||||||
(Redemption of) proceeds from notes issued to HCG Holdings LLC | (10,076 | ) | — | 10,076 | ||||||||
Dividends paid on common stock | (1,250 | ) | — | — | ||||||||
Net cash provided by financing activities | 18,313 | 7 | 22,844 | |||||||||
Net increase (decrease) in cash and cash equivalents | 23,841 | (198 | ) | 4,449 | ||||||||
Cash and cash equivalents: | ||||||||||||
Beginning of the period | 4,251 | 4,449 | — | |||||||||
End of the period | $ | 28,092 | $ | 4,251 | $ | 4,449 | ||||||
Noncash transaction: | ||||||||||||
Accrued dividends on 8% preferred stock | $ | 931 | $ | 1,066 | $ | 646 | ||||||
Supplemental disclosure of cash flow information: | ||||||||||||
Cash paid for interest | $ | 1,647 | $ | 417 | $ | — | ||||||
Cash paid for taxes | $ | 9,497 | $ | 3,736 | $ | — | ||||||
The accompanying notes are an integral part of the audited consolidated financial statements.
F-6
Huron Consulting Group Inc.
Notes to audited consolidated financial statements
(Tabular amounts in thousands, except per share amounts)
1. Description of businessBusiness
Huron Consulting Group Inc. (the “Company”) was formed on March 19, 2002. The Company’s wholly-Huron Consulting Group Inc., together with its wholly owned subsidiary, Huron Consulting Services LLC, (“Huron LLC”(collectively the “Company”), is an independent provider of financial and operational consulting services, whose clients include Fortune 500 companies, medium-sized and largelarger businesses, leading academic institutions, healthcare organizations and the law firms that represent these various organizations. The Company is a majority owned subsidiary of HCG Holdings LLC. On October 18, 2004, the Company completed its initial public offering (“IPO”) of shares of its common stock (see Note 10).
2. Summary of significant accounting policiesSignificant Accounting Policies
Basis of presentationPresentation
The accompanying consolidated financial statements reflect the results of operations and cash flows for the years ended December 31, 2004 and 2003 and the period from March 19, 2002 (inception) to December 31, 2002, the year ended December 31, 2003, and the six months ended June 30, 2003 and 2004.2002.
Principles of consolidationConsolidation
The consolidated financial statements include the accounts of the CompanyHuron Consulting Group Inc. and its wholly-ownedwholly owned subsidiary, Huron Consulting Services LLC. All significantmaterial intercompany balances and transactions have been eliminated in consolidation.
Interim financial information
The interim consolidated financial statements as of June 30, 2004 and for the six months ended June 30, 2003 and 2004 and the financial data and the other information for these periods disclosed in the notes to the consolidated financial statements are unaudited. In the opinion of management, the interim consolidated financial statements have been prepared on the same basis as the audited consolidated financial statements and reflect all adjustments (consisting only of normal recurring adjustments) necessary for the fair presentation of the interim results. The results of operations for the interim periods are not necessarily indicative of the results to be expected for any future periods.
Unaudited pro forma consolidated balance sheet
The unaudited pro forma consolidated balance sheet as of June 30, 2004 reflects the conversion of all of the outstanding shares of Class B common stock into shares of Class A common stock and the renaming of the Class A common stock to “common stock,” pursuant to the terms of the Company’s certificate of incorporation, which will occur immediately prior to the consummation of the Company’s proposed initial public offering.
Unaudited pro forma net (loss) income attributable to common stockholders per share
The unaudited pro forma net (loss) income attributable to common stockholders per share and the pro forma weighted average shares outstanding reflect certain events that will occur upon the consummation of the Company’s proposed initial public offering of common stock, but do not reflect shares or proceeds from the offering. The pro forma adjustments to net (loss) income attributable to common stockholders include an adjustment of approximately $483,000 and $245,000 for the year ended December 31, 2003 and the six months ended June 30, 2004, respectively, to eliminate the interest expense, net of tax expense, related to the repayment of the Company’s outstanding notes payable to HCG Holdings LLC and an adjustment of approximately $1,066,000 and $558,000 for the year ended December 31, 2003 and the six months ended June 30, 2004, respectively, to eliminate the accrued dividends on 8% preferred stock associated with the redemption of the Company’s outstanding 8% preferred stock. The notes payable to HCG Holdings LLC will be repaid and the 8% preferred stock will be redeemed by the
F-7
Notes to consolidated financial statements
Company with a portion of the net proceeds from the initial public offering. The pro forma weighted average shares outstanding represents an increase of 2,915,996 and 2,969,718 weighted average shares as of December 31, 2003 and June 30, 2004, respectively, related to shares that would have been issued to repay the notes payable to HCG Holdings LLC and to redeem the 8% preferred stock (including the liquidation participation amount), as if these transactions occurred at the beginning of each period. The pro forma weighted average shares outstanding also include the issuance of 769,700 shares of restricted common stock as of December 31, 2003 and June 30, 2004 as if this transaction also occurred at the beginning of each period.
| Year ended December 31, 2003 | Six months ended June 30, 2004 | ||||||
| (unaudited) | |||||||
Net (loss) income attributable to common stockholders | $ | (2,128,682 | ) | $ | 6,674,160 | ||
Unaudited pro forma adjustment | 1,549,210 | 803,029 | |||||
Unaudited pro forma net (loss) income attributable to common stockholders | $ | (579,472 | ) | $ | 7,477,189 | ||
Unaudited pro forma net (loss) income attributable to common stockholders per share: | |||||||
Basic | $ | (0.04 | ) | $ | 0.50 | ||
Diluted | $ | (0.04 | ) | $ | 0.47 | ||
Unaudited pro forma weighted average shares outstanding used in calculating unaudited pro forma net loss (income) attributable to common shareholders per share: | |||||||
Basic | 14,786,954 | 14,981,043 | |||||
Diluted | 14,786,954 | 15,974,947 | |||||
Use of estimatesEstimates
The preparation of financial statements in conformity with accounting principles generally accepted in the United States of America requires management to make estimates and assumptions that affect the amounts that are reported in the consolidated financial statements and accompanying disclosures. Actual results may differ from these estimates.
Reclassifications
Certain amounts reported in previous years have been reclassified to conform to the 2004 presentation.
Revenue recognitionRecognition
The Company recognizes revenues in accordance with Staff Accounting Bulletin (“SAB”) No. 101, “Revenue Recognition in Financial Statements,” as amended by SAB No. 104, “Revenue Recognition” when persuasive evidence of an arrangement exists, the related services are provided, the price is fixed and determinable and collectibility is reasonably assured. These services are primarily rendered under arrangements that require the client to pay on a time-and-expense basis. Fees are based on the hours incurred at agreed-upon rates and recognized as services are provided. Revenues related to fixed-fee engagements are recognized based on estimates of work completed versus the total services to be provided under the engagement. Losses, if any, on fixed-fee engagements are recognized in the period in which the loss first becomes probable and reasonably estimable. The Company also earns revenues on a performance-based fee basis and recognizes such revenues when all performance criteria are met. The Company also has contracts with clients to deliver multiple services that are covered under both individual and separate engagement letters. These arrangements allow for the Company’s services to be valued and accounted for on a separate basis. Direct costs incurred on engagements, including performance-based fee engagements, are expensed in the period incurred.
F-8F-7
Notes to audited consolidated financial statements
Provisions are recorded for the estimated realization adjustments on all engagements, including engagements for which fees are subject to review by the bankruptcy courts. Expense reimbursements that are billable to clients are included in total revenues and reimbursable expenses, and typically an equivalent amount of reimbursable expenses are included in total direct costs and reimbursable expenses. Reimbursable expenses related to time-and-expense and fixed-fee engagements are recognized as revenue in the period in which the expense is incurred. Reimbursable expenses subject to performance-based criteria are recognized as revenue when all performance criteria are met.
Differences between the timing of billings and the recognition of revenue are recognized as either unbilled services or deferred revenue in the accompanying consolidated balance sheets. Revenues recognized for services performed but not yet billed to clients have been recorded as unbilled services. Client prepayments and retainers are classified as deferred (i.e., unearned) revenue and recognized over future periods as earned in accordance with the applicable engagement agreement.
AllowanceAllowances for doubtful accountsDoubtful Accounts and unbilled servicesUnbilled Services
The Company maintains an allowanceallowances for doubtful accounts and for services performed but not yet billed for estimated losses based on several factors, including the historical percentages of fee adjustments and write-offs by practice group, an assessment of a client’s ability to make required payments and the estimated cash realization from amounts due from clients. The allowance isallowances are assessed by management on a quarterlyregular basis.
The provision for doubtful accounts and unbilled services is recorded as a reduction in revenue to the extent the provision relates to fee adjustments and other discretionary pricing adjustments. To the extent the provision relates to a client’s inability to make required payments, the provision is recorded in operating expenses.
Direct costsCosts and reimbursable expensesReimbursable Expenses
Direct costs and reimbursable expenses consists primarily of billable employee compensation and their related benefit costs, the cost of outside consultants or subcontractors assigned to revenue generating activities and direct expenses to be reimbursed by clients.
Cash and cash equivalents
Cash and cash equivalents consist of cash deposited in demand deposits at banks and overnight investments.
F-9
Notes to consolidated financial statements
Earnings per shareEquivalents
The net (loss) income per share calculations for the period from March 19, 2002 (inception)Company considers all highly liquid investments, including overnight investments and commercial paper, with original maturities of three months or less to December 31, 2002, the year ended December 31, 2003 and the six months ended June 30, 2003 and 2004 is presented below:be cash equivalents.
Period from March 19, 2002 (inception) to December 31, 2002 | Year ended December 31, 2003 | Six months ended June 30, | ||||||||||||||
| 2003 | 2004 | |||||||||||||||
| (unaudited) | ||||||||||||||||
Basic net (loss) income attributable to common stockholders per share: | ||||||||||||||||
Net (loss) income | $ | (4,166,012 | ) | $ | (1,062,417 | ) | $ | 1,860,171 | $ | 7,232,559 | ||||||
Dividends accrued on 8% preferred stock | (645,735 | ) | (1,066,265 | ) | (515,642 | ) | (558,399 | ) | ||||||||
Amount allocated to preferred stockholders | — | — | (745,414 | ) | (622,336 | ) | ||||||||||
Net (loss) income attributable to common stockholders—basic | $ | (4,811,747 | ) | $ | (2,128,682 | ) | $ | 599,115 | $ | 6,051,824 | ||||||
Weighted average common stock outstanding | 11,802,982 | 11,870,958 | 11,805,752 | 12,011,324 | ||||||||||||
Basic net (loss) income attributable to common stockholders per share | $ | (0.41 | ) | $ | (0.18 | ) | $ | 0.05 | $ | 0.50 | ||||||
Diluted net (loss) income attributable to common stockholders per share: | ||||||||||||||||
Net (loss) income | $ | (4,166,012 | ) | $ | (1,062,417 | ) | $ | 1,860,171 | $ | 7,232,559 | ||||||
Dividends accrued on 8% preferred stock | (645,735 | ) | (1,066,265 | ) | (515,642 | ) | (558,399 | ) | ||||||||
Amount allocated to preferred stockholders | — | — | (745,414 | ) | (622,336 | ) | ||||||||||
Net (loss) income attributable to common stockholders—diluted | $ | (4,811,747 | ) | $ | (2,128,682 | ) | $ | 599,115 | $ | 6,051,824 | ||||||
Weighted average common stock outstanding | 11,802,982 | 11,870,958 | 11,805,752 | 12,011,324 | ||||||||||||
Weighted average common stock equivalents—options | — | — | 551,074 | 993,904 | ||||||||||||
Adjusted weighted average common stock | 11,802,982 | 11,870,958 | 12,356,826 | 13,005,228 | ||||||||||||
Diluted net (loss) income attributable to common stockholders per share | $ | (0.41 | ) | $ | (0.18 | ) | $ | 0.05 | $ | 0.47 | ||||||
Income, after the deduction for the accrued preferred dividends, has been allocated to the common and preferred stock based on their respective rights to share in dividends. The 8% preferred stock participates in any dividends paid to common stock on an as converted basis using the current period estimated fair market value of a share of common stock. Weighted average common stock equivalents of approximately 718,030 for the year ended December 31, 2003 were excluded from the computation of diluted loss per share, as they would have been anti-dilutive. There are no dilutive securities for the period from March 19, 2002 (inception) to December 31, 2002 as the estimated fair market value of the common stock was equal to the strike price of options granted.
F-10
Notes to consolidated financial statements
Concentrations of credit riskCredit Risk
To the extent receivables from customersclients become delinquent, collection activities commence. No single customerclient balance is considered large enough to pose a significant credit risk. The allowance for doubtful accounts and unbilled services is based upon the expected ability to collect accounts receivable and bill and collect unbilled services. Management does not anticipate incurring losses on accounts receivable in excess of established allowances.
Fair valueValue of financial instrumentsFinancial Instruments
Cash and cash equivalents are stated at cost, which approximates fair market value. The carrying values for receivables from clients, unbilled services, accounts payable, deferred revenue and other accrued liabilities reasonably approximate fair market value due to the nature of the financial instrument and the short term maturity of these items.
F-8
Notes to audited consolidated financial statements
Property and equipmentEquipment
Property and equipment is stated at cost, less accumulated depreciation. Depreciation of property and equipment is computed on a straight-line basis over the estimated useful life.life of the asset. Software, computers and related equipment are depreciated over an estimated useful life of 2 to 3 years. Furniture and fixtures are depreciated over 5 years. Leasehold improvements are amortized over the lesser of the estimated useful life of the asset or the initial term of the lease.
Property and equipment, net at December 31, 2002 and December 31, 2003, is composed of the following:
| December 31, | ||||||||||
| 2002 | 2003 | Useful life | ||||||||
Computers, related equipment and software | $ | 1,751,753 | $ | 3,943,357 | 2-3 years | |||||
Furniture and fixtures | 210,937 | 1,021,312 | 5 years | |||||||
Leasehold improvements | 349,006 | 1,525,339 | Shorter of lease term or useful life | |||||||
| 2,311,696 | 6,490,008 | |||||||||
Total accumulated depreciation and amortization | (412,742 | ) | (1,991,757 | ) | ||||||
| $ | 1,898,954 | $ | 4,498,251 | |||||||
Long-lived assetsLong-Lived Assets
Long-lived assets are reviewed for impairment whenever events or changes in circumstances indicate that the carrying amount of an asset may not be recoverable in accordance with Statement of Financial Accounting Standards (“SFAS”) No. 144, “Accounting for the Impairment of Long-Lived Assets,Assets.” which became effective for fiscal years beginning after December 15, 2001. No impairment charges were recorded in 20022004, 2003 and 2003.2002.
Intangible assetsAssets
The Company accounts for intangible assets underin accordance with SFAS No. 142, “Goodwill and Other Intangible Assets.” This standard requires that certain identifiable intangible assets be amortized over their expected useful lives.
Non-current liabilitiesNon-Current Liabilities
The Company records certain liabilities that are expected to be settled over a period that exceeds one year as non-current liabilities. The Company has recorded in accrued expenses the loss on abandonment of one of its leases as a non-current liability for the payments that are expected to exceed a one-year term. The Company has also recorded as non-current the portion of the deferred lease incentive liability that the Company expects to recognize over a period greater than one year. The deferred lease incentive liability at December 31, 2004 totaled $4.1 million and consists of $3.8 million of tenant improvement allowance. The remaining balance primarily represents rent abatement. Deferred lease incentives are amortized on a straight-line basis over the life of the lease. The payments that will be
F-11
Notes to consolidated financial statements
paid within twelve months of the balance sheet date related to the lease abandonment and the deferred lease incentive are classified as current liabilities. The Company monitors the classification of such liabilities based on the expectation of their utilization periods.
Advertising costs
Advertising costs are expensed as incurred. Advertising expenses for the period from March 19, 2002 (inception) to December 31, 2002 and the year ended December 31, 2003, totaled $143,813 and $300,849, respectively.
Income taxesTaxes
Current tax liabilities and assets are recognized for the estimated taxes payable or refundable on the tax returns for the current year. Deferred tax assets and liabilities are recognized for the future tax consequences attributable to differences between the financial statement carrying amounts of existing assets and liabilities and their respective tax bases. Deferred tax assets and liabilities are measured using enacted tax rates expected to apply to taxable income in the years in which those temporary differences are expected to be recovered or settled.
Comprehensive income
Comprehensive income consists solely of net income (loss). There are no other changes in stockholders’ deficit except those resulting from investments by owners.
Stock-based compensationStock-Based Compensation
The Company accounts for stock-based compensation using the intrinsic value method prescribed in Accounting Principles Board (“APB”) Opinion No. 25 (“APB 25”), “Accounting for Stock Issued to Employees,” and related interpretations and elects the disclosure option of SFAS No. 123, “Accounting for Stock-Based Compensation”Compensation,” as amended by SFAS No. 148, “Accounting for Stock-Based Compensation—Transition and Disclosure.” SFAS No. 123 requires that companies either recognize compensation expense for grants of stock, stock options and other equity instruments based on fair value, or provide pro forma disclosure of net income and earnings per share in the notes to the financial statements. Accordingly, the Company has measured compensation expense for stock options as the excess, if any, of the estimated fair market value of stock, based upon the results of an independent appraisal,Company’s stock at the date of grant over the exercise price.
F-12F-9
Notes to audited consolidated financial statements
The following table details the effect on net income (loss) income attributable to common stockholders and net income (loss) income attributable to common stockholders per share if compensation expense for the stock plans had been recorded based on the fair value method under SFAS No. 123.
Period from March 19, 2002 (inception) to December 31, 2002 | Year ended December 31, 2003 | Six months ended June 30, | Year Ended December 31, | March 19, 2002 (inception) to December 31, 2002 | ||||||||||||||||||||||||
| 2003 | 2004 | 2004 | 2003 | |||||||||||||||||||||||||
Net income (loss) attributable to common stockholders | $ | 9,933 | $ | (2,129 | ) | $ | (4,812 | ) | ||||||||||||||||||||
Add: Total stock-based employee compensation expense included in reported net income (loss) net of related tax effects | 844 | 25 | — | |||||||||||||||||||||||||
Deduct: Total stock-based employee compensation expense determined under the fair value method for all awards, net of related tax effect | (943 | ) | (28 | ) | — | |||||||||||||||||||||||
| (unaudited) | ||||||||||||||||||||||||||||
Net (loss) income attributable to common stockholders | $ | (4,811,747 | ) | $ | (2,128,682 | ) | $ | 1,344,529 | $ | 6,674,160 | ||||||||||||||||||
Add: Total stock-based employee compensation expense included in reported net (loss) income, net of related tax effects | — | 24,911 | — | 143,011 | ||||||||||||||||||||||||
Deduct: Total stock-based employee compensation expense determined under fair value method for all awards, net of related tax effects | (224 | ) | (27,775 | ) | (6,603 | ) | (149,710 | ) | ||||||||||||||||||||
Pro forma net income (loss) attributable to common stockholders | $ | 9,834 | $ | (2,132 | ) | $ | (4,812 | ) | ||||||||||||||||||||
Pro forma net (loss) income attributable to common stockholders | $ | (4,811,971 | ) | $ | (2,131,546 | ) | $ | 1,337,926 | $ | 6,667,461 | ||||||||||||||||||
Earnings per share: | ||||||||||||||||||||||||||||
Basic—as reported | $ | (0.41 | ) | $ | (0.18 | ) | $ | 0.05 | $ | 0.50 | $ | 0.77 | $ | (0.18 | ) | $ | (0.41 | ) | ||||||||||
Basic—pro forma | $ | (0.41 | ) | $ | (0.18 | ) | $ | 0.05 | $ | 0.50 | $ | 0.77 | $ | (0.18 | ) | $ | (0.41 | ) | ||||||||||
Diluted—as reported | $ | (0.41 | ) | $ | (0.18 | ) | $ | 0.05 | $ | 0.47 | $ | 0.72 | $ | (0.18 | ) | $ | (0.41 | ) | ||||||||||
Diluted—pro forma | $ | (0.41 | ) | $ | (0.18 | ) | $ | 0.05 | $ | 0.47 | $ | 0.71 | $ | (0.18 | ) | $ | (0.41 | ) | ||||||||||
Segment reportingReporting
SFAS No. 131, “Disclosures about Segments of an Enterprise and Related Information,” establishes annual and interim reporting standards for an enterprisesenterprise’s business segments and related disclosures about its products, services, geographic areas and major customers. The Company provides services through two segments: Financial Consulting and Operational Consulting. The Financial Consulting segment provides services that help clients effectively address complex challenges that arise from litigation, disputes, investigations, regulation, financial distress and other sources of significant conflict or change. The Operational Consulting segment provides services that help clients improve the overall efficiency and effectiveness of their operations by enhancing revenue, reducing costs managing regulatory compliance and maximizing procurement efficiency.
New accounting pronouncementsAccounting Pronouncement
In May 2003,December 2004, the Financial Accounting Standards Board (“FASB”) issued SFAS No. 150, “Accounting for Certain Financial Instruments with Characteristics of both Liabilities and Equity.123 (revised 2004), “Share-Based Payment,” This statement establishes standards for how an issuer classifies and measures certain financial instruments with characteristics of both liabilities and equity. It requires(“SFAS No. 123R”). In April 2005, the issuer to classifySEC adopted a financial instrumentnew rule that is withinamends the scope of the standard as a liability if the financial instrument embodies an obligation of the issuer. The adoption of the provisionseffective date of SFAS No. 150 did not have any impact123R. Under the new rule, the Company must adopt SFAS No. 123R effective January 1, 2006. This statement requires that the costs of employee share-based payments be measured at fair value on the Company’sawards’ grant date and be recognized in the financial position or resultsstatements over the requisite service period. SFAS No. 123R supersedes APB 25 and its related interpretations, and eliminates the alternative to use APB 25’s intrinsic value method of operations.accounting, which we are currently using. Additionally, SFAS No. 123R amends SFAS No. 95, “Statement of Cash Flows,” to require that excess tax benefits be reported as a financing cash inflow rather than as a reduction of taxes paid.
In November 2002,SFAS No. 123R allows for two alternative transition methods. The first method is the FASB reached a consensus on Emerging Issues Task Force (“EITF”) Issue No. 00-21. EITF Issue No. 00-21 provides guidance on how to accountmodified prospective application whereby compensation cost for revenue arrangements that include multiple products or services to ensure that all standalone deliverables are tracked, valued and
F-13
Notes to consolidated financial statements
accountedthe portion of awards for on an individual basis and inwhich the proper periods. The guidance in EITF Issue No. 00-21 is effective for revenue arrangements entered into in fiscal periods beginning after June 15, 2003. The Companyrequisite service has contracts with clients to deliver multiple servicesnot yet been rendered that are covered under both individual and separate engagement letters. Such arrangements allow for the Company’s services to be valued and accounted for on a separate basis. Therefore,outstanding as of the adoption of EITF Issue No. 00-21 did not have any impact ondate will be recognized over the Company’s consolidated financial position or results of operations.
In January 2003, the FASB issued Interpretation No. 46, “Consolidation of Variable Interest Entities and Interpretation of ARB No. 51,” which is effective immediately for all variable interest entities created after January 31, 2003 and for the first fiscal year or interim period beginning after June 15, 2003 for variable interest entities in which an enterprise holds a variable interest that it acquired before February 1, 2003.remaining service period. The Company does not have variable interest entities that fall within the scope of this pronouncement and therefore the adoption of this pronouncement did not have any impact on its financial statements.
In March 2004, the FASB issued an Exposure Draft on “Share-Based Payment, an amendment of FASB Statements No. 123 and 95.” In this proposed Statement, the FASB believes that employee services received in exchange for equity instruments give rise to recognizable compensation cost as the services are used in the issuing entity’s operations. In addition, the proposed statement would requirefor that public companies measure the compensation cost related to employee services received in exchange for equity instruments issuedportion of awards will be based on the grant-date fair value of those instruments. This proposed statement would neither change the accounting in FASB Statementawards as calculated for pro forma disclosures under SFAS No. 123, “Accountingas originally issued. All new awards and awards that are modified, repurchased, or cancelled after the adoption date will be accounted for Stock-Based Compensation,” for transactionsunder the provisions of SFAS No. 123R. The second method is the modified
F-10
Notes to audited consolidated financial statements
retrospective application, which requires that the Company restates prior period financial statements. The modified retrospective application may be applied either to all prior periods or only to prior interim periods in the year of adoption of this statement. The Company is currently determining which an enterprise exchangestransition method it will adopt and does not expect the adoption of SFAS No. 123R to have a material impact on its equity instruments for servicesfinancial position, results of parties other than employees nor change the accounting for stock ownership plans, which are subject to American Institute of Certified Public Accountants Statement of Position 93-6, “Employer’s Accounting for Employee Stock Ownership Plans.” The FASB intends to reconsider the accounting for those transactions and plans in a later phase of its project on equity-based compensation. The FASB will also consider other items such as streamlining volatility assumptions and addressing the fair value measurement models. The Company’s management will continue to assess the potential impact this statement will have on the Company.operations, EPS or cash flows.
3. Earnings Per Share
Basic earnings per share (EPS) excludes dilution and is computed by dividing net income by the weighted average number of common shares outstanding for the period. Diluted EPS reflects the potential reduction in EPS that could occur if securities or other contracts to issue common stock were exercised or converted into common stock. EPS under the basic and diluted computation are as follows:
| Year ended December 31, | Mar. 19, 2002 (inception) to Dec. 31, 2002 | |||||||||||
| 2004 | 2003 | |||||||||||
Net income (loss) | $ | 10,864 | $ | (1,063 | ) | $ | (4,166 | ) | ||||
Dividends accrued on 8% preferred stock | (931 | ) | (1,066 | ) | (646 | ) | ||||||
Net income (loss) attributable to common stockholders | $ | 9,933 | $ | (2,129 | ) | $ | (4,812 | ) | ||||
Weighted average common shares outstanding basic | 12,820 | 11,871 | 11,803 | |||||||||
Weighted average common stock equivalents | 945 | — | — | |||||||||
Weighted average common shares outstanding diluted | 13,765 | 11,871 | 11,803 | |||||||||
Basic net income (loss) attributable to common stockholders per share | $ | 0.77 | $ | (0.18 | ) | $ | (0.41 | ) | ||||
Diluted net income (loss) attributable to common stockholders per share | $ | 0.72 | $ | (0.18 | ) | $ | (0.41 | ) | ||||
Prior to the redemption of the 8% preferred stock in 2004, the 8% preferred stockholders participated in any dividends paid to common stockholders on an as converted basis using the current period estimated fair market value of a share of common stock. Net loss is not allocated to preferred stockholders.
The computation of diluted EPS for the period from March 19, 2002 (inception) to December 31, 2002 excluded outstanding stock options of 842,826 because the strike prices for those securities were equal to the estimated average market price of the common shares. The computation of diluted EPS for the year ended December 31, 2003 excluded 1,599,185 outstanding stock options because the effect of these securities would have been anti-dilutive as the Company incurred a net loss for the year.
4. Restructuring Charges
In March 2004, the Company incurred a $2.1 million pre-tax restructuring charge associated with the closing of two offices. The charge included approximately $2.0 million for severance payments, which were paid by April 30, 2004, and $0.1 million for office lease payments, which were paid by August 31, 2004.
In September 2004, the Company decided to eliminate a service offering of a practice area in the operational consulting segment that was not meeting its expectations and recorded a pre-tax restructuring charge of $1.3 million in the third quarter of 2004. As of December 31, 2004, the Company has substantially utilized the restructuring reserve through cash payments for severance.
F-11
Notes to audited consolidated financial statements
5. Property and Equipment
Property and equipment at December 31, 2004 and 2003, are detailed below:
| December 31, | ||||||||
| 2004 | 2003 | |||||||
Computers, related equipment and software | $ | 5,746 | $ | 3,944 | ||||
Furniture and fixtures | 2,925 | 1,021 | ||||||
Leasehold improvements | 4,520 | 1,525 | ||||||
Property and equipment | 13,191 | 6,490 | ||||||
Accumulated depreciation and amortization | (4,216 | ) | (1,992 | ) | ||||
Property and equipment, net | $ | 8,975 | $ | 4,498 | ||||
6. Intangible assetsAssets
During 2002, the Company obtained a release of certain employees from non-competition agreements with Arthur Andersen LLP, their former employer, in exchange for a payment of $5,502,500$5.5 million and the assumption of certain related liabilities in the amount of $821,915.$0.8 million. The Company estimates that the value received as a result of the employees’ release from these agreements has a useful life of eighteen months, the length of the restrictive covenants in the agreements with Arthur Andersen LLP.
Aggregate amortization expense for the year ended December 31, 2003 and the period from March 19, 2002 (inception) to December 31, 2002 was $3.7 million and the year ended December 31, 2003 was $2,635,172 and $3,749,243,$2.6 million, respectively. The remaining net book value of the intangible asset was fully amortized during the year ended December 31, 2003.
4.7. Employee benefit planBenefit Plan
The Company sponsors a qualified defined contribution 401(k) plan covering substantially all of its employees. Under the plan, employees are entitled to make pre-tax contributions. The Company matches an amount equal to the employees’ contributions up to 6% of the employees’ salaries. The Company’s matching contributions for the years ended December 31, 2004, 2003 and the period from March 19, 2002 (inception) to December 31, 2002 were $3.3 million, $2.3 million and $0.9 million, respectively.
8. Notes Payable to HCG Holdings LLC
At various times during 2002, the year endedCompany entered into promissory note agreements with HCG Holdings LLC. The total principal amount borrowed under the promissory note agreements as of December 31, 2003 were $887,466was $10.1 million. Interest accrued daily on the promissory notes at a rate of 8% per year and $2,330,542, respectively.aggregated $0.8 million at December 31, 2003.
Upon the consummation of the IPO on October 18, 2004, the Company used $10.7 million of the net proceeds from the IPO to repay its notes payable to HCG Holdings LLC, including accrued and unpaid interest of $0.6 million.
9. Line of Credit and Guarantee
Huron Consulting Services LLC had a bank credit agreement that expired on February 10, 2005 that allowed it to borrow up to the lesser of $15.0 million or the sum of (a) 75% of eligible accounts receivable and (b) the lesser of 30% of unbilled services and $3.0 million. Borrowings under the agreement were limited by any outstanding letters of credit. Borrowings bore interest at either the prime
F-12
Notes to audited consolidated financial statements
rate or LIBOR, rounded up to the nearest whole percentage, plus 2.75%, and were secured by substantially all of Huron Consulting Services LLC’s assets. The borrowing facility was unused as of December 31, 2004 and 2003. At both December 31, 2004 and 2003, Huron Consulting Services LLC was in compliance with or obtained waivers for its debt covenants.
Prior to the expiration of the bank credit agreement described above, the Company established a new facility. The new bank credit agreement, expiring on February 10, 2006, allows the Company to borrow up to the lesser of $25.0 million or the sum of (a) 85% of eligible accounts receivable and (b) the lesser of 40% of unbilled services and $5.0 million. Borrowings under the agreement will be limited by any outstanding letters of credit, will bear interest at LIBOR plus 1.75%, and will be secured by substantially all of the Company’s assets. The bank credit agreement includes covenants for minimum equity and maximum annual capital expenditures, as well as covenants restricting the Company’s ability to incur additional indebtedness or engage in certain types of transactions outside of the ordinary course of business.
Guarantees in the form of letters of credit of $1.7 million and $1.0 million were outstanding at December 31, 2004 and 2003, respectively, to support certain office lease obligations.
10. Capital Structure and Initial Public Offering
Prior to its IPO, the Company’s capital structure consisted of 8% preferred stock, preferred stock and Class A and Class B common stock.
8% Preferred Stock
The 8% preferred stock had a stated value of $1,000 per share and accrued dividends on a daily basis, compounded annually, at the rate of 8% per annum on the stated value. Between April and June 2002, in connection with the Company’s initial capitalization, the Company issued to HCG Holdings LLC an aggregate of 12,500 shares of the Company’s 8% preferred stock for an aggregate consideration of $12.5 million. Upon the consummation of the Company’s IPO on October 18, 2004, the Company used $15.1 million of the IPO proceeds to redeem all outstanding 8% preferred stock, plus cumulative dividends and a liquidation participation amount totaling $2.6 million.
Preferred Stock
The Company is expressly authorized to issue up to 50,000,000 shares of preferred stock. The Company’s certificate of incorporation authorizes the Company’s board of directors, without any further stockholder action or approval, to issue these shares in one or more classes or series, to establish from time to time the number of shares to be included in each class or series, and to fix the rights, preferences and privileges of the shares of each wholly unissued class or series and any of its qualifications, limitations or restrictions. As of December 31, 2004 and 2003, no such preferred stock have been approved or issued.
Common Stock
Prior to the IPO, the Company had issued and outstanding Class A voting and Class B nonvoting common stock. Pursuant to the terms of the Company’s certificate of incorporation, each share of the Company’s Class B common stock was automatically converted into one share of Class A common stock immediately prior to the consummation of the IPO and the Company’s Class A common stock was renamed to “common stock.”
The holders of common stock are entitled to one vote for each share held of record on each matter submitted to a vote of stockholders. Subject to the rights and preferences of the holders of any series of
F-13
Notes to audited consolidated financial statements
preferred stock that may at the time be outstanding, holders of common stock are entitled to such dividends as the Company’s board of directors may declare. In the event of any liquidation, dissolution or winding-up of the Company’s affairs, after payment of all of the Company’s debts and liabilities and subject to the rights and preferences of the holders of any series of preferred stock that may at the time be outstanding, holders of common stock will be entitled to receive the distribution of any of the Company’s remaining assets.
Dividends
On May 12, 2004, the Company declared a special dividend for each outstanding share of common stock and 8% preferred stock payable to holders of record on May 25, 2004. The 8% preferred stock participated on an as converted basis. The aggregate amount of the dividend was $1.3 million, or $0.09 per share of common stock and $9.64 per share of 8% preferred stock, and was paid on June 29, 2004.
Initial Public Offering
On October 18, 2004, the Company completed its IPO. In the IPO, the Company sold 3,333,333 shares of common stock and a selling stockholder, HCG Holdings LLC, sold 1,666,667 shares of common stock at an offering price of $15.50 per share. On October 22, 2004, the underwriters exercised in full their over-allotment option to purchase an additional 750,000 shares of common stock from the selling stockholder. The IPO generated gross proceeds to the Company of $51.7 million, or $48.0 million net of underwriting discounts. The Company did not receive any proceeds from the shares sold by the selling stockholder.
11. Equity Incentive Plans
In 2002, the Huron Consulting Group Inc. 2002 Equity Incentive Plan and the Huron Consulting Group Inc. 2002 Equity Incentive Plan (California) were established pursuant to which up to 1,316,740 Class B non-voting and 108,696 Class A voting shares, respectively, may be granted. In 2003, the Huron Consulting Group Inc. 2003 Equity Incentive Plan was established pursuant to which up to 1,377,392 Class B non-voting shares may be granted.
Prior to the completion of the IPO, the Huron Consulting Group Inc. 2004 Omnibus Stock Plan (the “Omnibus Plan”) was established. The plans described in the paragraph above were terminated and no further awards will be granted under these plans. The Omnibus Plan provides for the issuance of stock options and other equity-based awards valued in whole or in part by reference to, or otherwise based on, the Company’s common stock. A total of 2,141,000 shares of common stock are reserved for issuance under the Omnibus Plan, of which 1,194,088 remain available for future issuance at December 31, 2004. Subject to acceleration under certain conditions, stock options generally vest annually, pro rata over 4 years. All options expire ten years after the grant date.
F-14
Notes to audited consolidated financial statements
5. Related party transactionsThe stock option activity under the Company’s various equity incentive plans is as follows (number of options in thousands):
| 2004 | 2003 | 2002 | |||||||||||||||||||
| Number of Options | Weighted Average Exercise Price | Number of Options | Weighted Average Exercise Price | Number of Options | Weighted Average Exercise Price | ||||||||||||||||
Outstanding, beginning of year | 1,599 | $ | 0.36 | 843 | $ | 0.02 | — | $ | — | ||||||||||||
Granted: | |||||||||||||||||||||
Exercise price = fair market value | 127 | 15.50 | 935 | 0.60 | 856 | 0.02 | |||||||||||||||
Exercise price < fair market value | 422 | 1.96 | — | — | — | — | |||||||||||||||
Exercised | (246 | ) | 0.22 | (161 | ) | 0.02 | — | — | |||||||||||||
Canceled | (237 | ) | 0.85 | (18 | ) | 0.18 | (13 | ) | 0.02 | ||||||||||||
Outstanding, end of year | 1,665 | $ | 1.86 | 1,599 | $ | 0.36 | 843 | $ | 0.02 | ||||||||||||
Exercisable, end of year | 614 | $ | 0.58 | 47 | $ | 0.02 | — | $ | — | ||||||||||||
Weighted average fair value of options granted during the year: | |||||||||||||||||||||
Exercise price = fair market value | $ | 7.34 | $ | 0.69 | $ | — | |||||||||||||||
Exercise price < fair market value | $ | 6.50 | $ | — | $ | — | |||||||||||||||
The fair value of each stock option is estimated (on the date of grant) based on the Black-Scholes option-pricing model with the following weighted average assumptions:
| December 31, | |||||||||
| 2004 | 2003 | 2002 | |||||||
Expected dividend yield | 0 | % | 0 | % | 0 | % | |||
Expected volatility | 12 | % | 1 | % | 1 | % | |||
Risk-free interest rate | 2.6 | % | 2.3 | % | 3.3 | % | |||
Expected option life (in years) | 4 | 4 | 5 | ||||||
Options outstanding and exercisable at December 31, 2004 are as follows (number of options in thousands):
| Options Outstanding | Options Exercisable | |||||||||||
| Range of Exercise Prices | Number of Options | Weighted Average Remaining Contractual Life (in years) | Weighted Average Exercise Price | Number of Options | Weighted Exercise Price | |||||||
$0.00 to $0.02 | 571 | 7.8 | $ | 0.02 | 492 | $ | 0.02 | |||||
$0.03 to $0.85 | 593 | 8.5 | $ | 0.69 | 105 | $ | 0.74 | |||||
$0.86 to $1.96 | 375 | 9.1 | $ | 1.96 | — | — | ||||||
$1.97 to $15.50 | 126 | 9.7 | $ | 15.50 | 17 | $ | 15.50 | |||||
Total | 1,665 | 8.5 | $ | 1.86 | 614 | $ | 0.58 | |||||
The Company’s Omnibus Plan also provides for granting restricted stock awards to certain employees and officers. Restricted stock awards are restricted from sale and generally vest over a three-year or four-year period. On April 23, 2002, HCG Holdings LLC,October 12, 2004, immediately prior to the IPO, the Company granted a total of 767,700 shares of restricted common stock to certain employees and officers. On November 2, 2004, the Company granted an additional 68,850 shares of restricted common stock. Total compensation expense
F-15
Notes to audited consolidated financial statements
relating to these restricted common stock awards of $13.2 million, which is based on behalfthe market value of the Company, entered into an agreement with Lake Capital Management LLC,shares awarded at the date of grant, will be amortized on a related party, under which Lake Capital Management LLC agreedstraight-line basis over the vesting period. For the year ended December 31, 2004, amortization expense relating to provide certain management services to the Company in exchange for a $1,500,000 payment. The Company paid an additional $1,000,000 fee upon termination of the agreement in July 2002. Lake Capital Management LLC is an interest holder of HCG Holdings LLC.
In connection with an Advisory Services Agreement, dated April 23, 2002, between HCG Holdings LLC, on behalf of the Company, and PPM America Private Equity Fund, L.P., or PPM LP, a member of HCG Holdings LLC, the Company paid PPM LP $250,000 for certain advisory services. The advisory services agreement was terminated in July 2002.these restricted common stock awards totaled $0.7 million.
6.12. Income taxesTaxes
The income tax benefitexpense (benefit) for the years ended December 31, 2004 and 2003 and for the period from March 19, 2002 (inception) to December 31, 2002 and the year ended December 31, 2003 consists of the following:
| Year ended December 31, | Mar. 31, 2002 (inception) to Dec. 31, 2002 | |||||||||||||||||||
Period from 2002 | Year ended December 31, 2003 | 2004 | 2003 | |||||||||||||||||
Current: | ||||||||||||||||||||
Federal | $ | — | $ | 1,139,525 | $ | 9,592 | $ | 1,139 | $ | — | ||||||||||
State | 13,325 | 306,609 | 2,647 | 307 | 13 | |||||||||||||||
| 13,325 | 1,446,134 | |||||||||||||||||||
Total current | 12,239 | 1,446 | 13 | |||||||||||||||||
Deferred: | ||||||||||||||||||||
Federal | (2,170,956 | ) | (1,256,082 | ) | (3,162 | ) | (1,256 | ) | (2,171 | ) | ||||||||||
State | (539,368 | ) | (312,069 | ) | (949 | ) | (312 | ) | (539 | ) | ||||||||||
Total deferred | (4,111 | ) | (1,568 | ) | (2,710 | ) | ||||||||||||||
| (2,710,324 | ) | (1,568,151 | ) | |||||||||||||||||
Income tax expense (benefit) | $ | 8,128 | $ | (122 | ) | $ | (2,697 | ) | ||||||||||||
Total benefit | $ | (2,696,999 | ) | $ | (122,017 | ) | ||||||||||||||
ReconciliationA reconciliation of the U.S. statutory income tax rate to the Company’s effective tax rate is as follows. The 2003 tax rate effects of meals and entertainment and other non-deductible items are due to the ratio of non-deductible expense relative low amount ofto the pretax loss in 2003.
Period from 2002 | Year ended 2003 | |||||
Percent of pretax income: | ||||||
At U.S. statutory tax rate—expense (benefit) | (35.0 | )% | (35.0 | )% | ||
State income taxes | (5.1 | )% | (5.2 | )% | ||
Meals and entertainment | 0.8 | % | 17.9 | % | ||
Other non deductible items | — | 12.0 | % | |||
Effective tax benefit rates | (39.3 | )% | (10.3 | )% | ||
for the year. Other non deductiblenon-deductible items include taxes not deductible for Federalfederal income tax purposes.
| Year ended December 31, | Mar. 19, 2002 (inception) to Dec. 31, | ||||||||
| 2004 | 2003 | ||||||||
Percent of pretax income: | |||||||||
At U.S. statutory tax rate expense (benefit) | 35.0 | % | (35.0 | )% | (35.0 | )% | |||
State income taxes | 5.2 | (5.2 | ) | (5.1 | ) | ||||
Meals and entertainment | 2.5 | 17.9 | 0.8 | ||||||
Other non-deductible items | 0.1 | 12.0 | — | ||||||
Effective income tax expense (benefit) rate | 42.8 | % | (10.3 | )% | (39.3 | )% | |||
F-15F-16
Notes to audited consolidated financial statements
Deferred tax assets at December 31, 20022004 and 2003 consist of the following:
| December 31, | Year ended December 31, | ||||||||||||||
| 2002 | 2003 | 2004 | 2003 | ||||||||||||
Deferred tax assets: | |||||||||||||||
Accrued payroll and other liabilities | $ | 4,757 | $ | 1,144 | |||||||||||
Amortization of intangibles | 2,064 | 2,283 | |||||||||||||
Revenue recognition | 1,787 | 720 | |||||||||||||
Deferred lease incentives | 1,374 | 69 | |||||||||||||
Stock-based compensation | 537 | — | |||||||||||||
Net operating loss carryforward | $ | 1,369,293 | $ | 407,903 | 194 | 408 | |||||||||
Amortization of intangibles | 947,013 | 2,282,498 | |||||||||||||
Allowance for doubtful accounts and unbilled services | 153,465 | 720,271 | |||||||||||||
Accrued liabilities | 130,289 | 1,143,965 | |||||||||||||
Property, plant and equipment | — | (300,869 | ) | ||||||||||||
Prepaid expenses | — | (132,194 | ) | ||||||||||||
Other | 110,264 | 156,901 | 61 | 87 | |||||||||||
Deferred income tax assets | $ | 2,710,324 | $ | 4,278,475 | |||||||||||
Total deferred assets | 10,774 | 4,711 | |||||||||||||
Deferred tax liabilities: | |||||||||||||||
Property and equipment | (967 | ) | (300 | ) | |||||||||||
Prepaid expenses | (438 | ) | (132 | ) | |||||||||||
Total deferred liabilities | (1,405 | ) | (432 | ) | |||||||||||
Net deferred tax asset | $ | 9,369 | $ | 4,279 | |||||||||||
At December 31, 2003,2004, the Company had a net operating loss carryforward for U.S. federal income tax purposes of approximately $1.1$0.5 million that begins to expire in 2023. The income tax loss carryforward may be subject to certain limitations based upon changes in ownership that could impair the ability to utilize the benefits of this loss in the future. Although realization of the net deferred tax asset is not assured, management believes, based upon current estimates, that it is more likely than not that all of the net deferred tax assets will be realized. Accordingly, athe Company determined that no valuation allowance has not been recorded as ofagainst deferred tax assets at December 31, 2002 or 2003.2004 and 2003 was necessary.
7. Notes payable to13. Related Party Transactions
On April 23, 2002, HCG Holdings LLC,
At various times during 2002, on behalf of the Company, entered into promissory note agreementsan agreement with Lake Capital Management LLC, a related party, under which Lake Capital Management LLC agreed to provide certain management services to the Company in exchange for a $1.5 million payment. The Company paid an additional $1.0 million fee upon termination of the agreement in July 2002. Lake Capital Management LLC is an interest holder of HCG Holdings LLC. The total principal amount borrowed under the promissory note agreements as of December 31, 2002 and 2003 is $10,075,764. Interest accrues daily on the promissory notes at a rate of 8% per year and aggregated $342,741 and $819,624 at December 31, 2002 and 2003. Interest is payable annually beginning on January 2, 2003. The notes mature five years and six months from the date of issuance as follows:
2007 | $ | 100,502 | |
2008 | 9,975,262 | ||
| $ | 10,075,764 | ||
The Company may prepay the principal at any time without penalty. Prepayment of the notes is mandatory upon a fundamental change, change of control or qualified public offering, as defined in the promissory note agreements.
8. Line of credit and guarantee
Huron LLC had a committed borrowing facility amounting to the lesser of $5.0 million or 75% of eligible accounts receivable that was unused as of December 31, 2003, the term expiring on January 31, 2004. Before expiring, the borrowing facility was amended to extend the term to February 10, 2005 and increase the total availability to the lesser of $15.0 million or the sum of (a) 75% of eligible accounts receivable and (b) the lesser of 30% of unbilled services and $3.0 million. As of June 30, 2004, there were no borrowings under the credit agreement. Borrowings under the credit agreement bear interest at either the prime rate or LIBOR, rounded up to the nearest whole percentage, plus 2.75%. Borrowings are secured by substantially all of Huron LLC’s assets. At December 31, 2003, Huron LLC was in compliance with or obtained waivers for its debt covenants.
F-16
Notes to consolidated financial statements
Guarantees in the form of letters of credit of $1.0 million and $1.7 million were outstanding at December 31, 2003 and June 30, 2004, respectively, to support certain office lease obligations.
9. Capital structure
The Company’s capital structure consists of 8% Preferred Stock, Preferred Stock and Class A and Class B Common Stock.
8% preferred stock
The 8% preferred stock has a stated value of $1,000 per share and accrues dividends on a daily basis, compounded annually, at the rate of 8% per annum on the stated value. In the event of a liquidation, dissolution or winding up of the Company, the holders of the 8% preferred stock will be entitled to be paid an amount equal to the stated value plus all cumulative accrued and unpaid dividends (the “Liquidation Preference”) before any distributions are made with respect to Preferred Stock or Class A and Class B Common Stock. Remaining assets for distribution will be distributed on a share for share basis, to the holders of the Class A and Class B Common Stock and the holders of the 8% preferred stock. The Liquidation Preference and the pro rata portion of the 8% preferred stock’s liquidation participation amount are collectively referred to as the “Liquidation Amount.”
At any time after April 23, 2008, holders of the 8% preferred stock may require the Company to redeem all or a portion of their stock at the Liquidation Amount, calculated as if the Company were to be liquidated as of the date of such redemption, provided that during the one-year prior to April 23, 2009, the Company is not required to redeem more than 50% of the 8% preferred stock from any holder. At any time, the Company may redeem the 8% preferred stock at the Liquidation Amount, calculated as if the Company were to be liquidated as of the date of such redemption.
In the event of a qualified public offering, holdersconnection with an Advisory Services Agreement, dated April 23, 2002, between HCG Holdings LLC, on behalf of the 8% preferred stock haveCompany, and PPM America Private Equity Fund, L.P., or PPM LP, a member of HCG Holdings LLC, the right to either (i) convert each share of 8% preferred stock into Class A Common Stock, based on the Liquidation Amount less accrued but unpaid dividends, as well as receive payment of the accrued but unpaid dividends; (ii) convert each share of 8% preferred stock into Class A Common Stock, based on the Liquidation Amount; or (iii) continue to hold all of the 8% preferred stock.Company paid PPM LP $0.3 million for certain advisory services. The conversion rate is based on the Liquidation Amount (less accrued and unpaid dividends, if applicable) divided by the mid-range offering price of a share of common stock to be sold to the publicadvisory services agreement was terminated in a qualified public offering.July 2002.
Preferred stock
The Company is expressly authorized to provide for the issuance of all or any of the 50,000,000 authorized Preferred Stock in one or more classes or series, and to fix for each such class or series such voting powers and such distinctive designations or other special rights and restrictions as shall be stated and expressed in the resolutions adopted by the Company’s Board of Directors. As of December 31, 2002 and 2003, no such Preferred Stock have been approved or issued.
Common stock
Subject to the rights of the holders of the 8% preferred stock and any series of Preferred Stock, holders of voting Class A and nonvoting Class B Common Stock shall be entitled to receive dividends declared by the Company’s Board of Directors.
Upon a change in control or qualified public offering, all issued and outstanding Class B Common Stock will be converted into Class A Common Stock and the Class B Common Stock will cease to exist.
F-17
Notes to consolidated financial statements
Under the Huron Consulting Group Inc. 2002 Equity Incentive Plan, an officer of Huron LLC purchased 521,740 shares of Class B Common Stock during 2002, which are subject to vesting and forfeiture provisions, at a cost of $0.023 per share. In limited circumstances, the Company has repurchase rights with respect to vested and unvested shares.
10. Equity incentive plan
In 2002, the Huron Consulting Group Inc. 2002 Equity Incentive Plan and the Huron Consulting Group Inc. 2002 Equity Incentive Plan (California) were established pursuant to which up to 1,316,740 Class B non-voting and 108,696 Class A voting shares, respectively, may be granted. In 2003, the Huron Consulting Group Inc. 2003 Equity Incentive Plan was established pursuant to which up to 1,377,392 Class B nonvoting shares may be granted. The equity incentive plans (the “Plans”) provide for the issuance of equity options, equity appreciation rights and equity awards to employees, officers, directors, consultants or advisors to the Company.
The equity option activity under the Plans is as follows:
| Common shares | Weighted average exercise price | |||||
Balance at March 19, 2002 (inception) | — | $ | — | |||
Granted | 855,890 | 0.02 | ||||
Exercised | — | — | ||||
Forfeited | (13,044 | ) | 0.02 | |||
Expired | — | — | ||||
Balance at December 31, 2002 | 842,846 | 0.02 | ||||
Granted | 935,302 | 0.60 | ||||
Exercised | (160,608 | ) | 0.02 | |||
Forfeited | (18,267 | ) | 0.18 | |||
Expired | — | — | ||||
Balance at December 31, 2003 | 1,599,273 | 0.36 | ||||
Granted (unaudited) | 422,449 | 1.96 | ||||
Exercised (unaudited) | (213,028 | ) | 0.18 | |||
Forfeited (unaudited) | (95,653 | ) | 0.57 | |||
Expired (unaudited) | — | — | ||||
Balance at June 30, 2004 (unaudited) | 1,713,041 | $ | 0.76 | |||
During the eighteen-month period ended June 30, 2004, the Company granted options with exercise prices as follows:
Grants Made During Quarter Ended | Number of Options Granted | Weighted- Average Exercise | Weighted- Average Fair Value Per Share | Intrinsic Value Per Share | ||||
March 31, 2003 | 64,130 | $0.07 | $0.85 | $0.78 | ||||
June 30, 2003 | 598,346 | 0.53 | 0.85 | 0.32 | ||||
September 30, 2003 | 66,304 | 0.85 | 0.85 | — | ||||
December 31, 2003 | 206,522 | 0.85 | 2.05 | 1.20 | ||||
March 31, 2004 (unaudited) | 422,449 | 1.96 | 8.28 | 6.32 | ||||
June 30, 2004 (unaudited) | — | — | — | — |
F-18
Notes to consolidated financial statements
The intrinsic value per share is being recorded as compensation expense over the applicable vesting period. Given the lack of a public market for the Company’s common stock, the Company established an estimated fair value of the common stock as well as the exercise price for the options to purchase this stock. At various dates during the year, the Company estimated the fair value of the common stock by evaluating the results of business activities and projections of future results of operations.
The characteristics of outstanding and of exercisable stock options under the Company’s Plans at December 31, 2003 were as follows:
December 31, 2003 | ||||||||
Options outstanding | Options exercisable | |||||||
Having a Per share exercise | Weighted average remaining life | Number of shares | Weighted average remaining life | Number of shares | ||||
$0.00–0.02 | 8.6 | 794,199 | 8.7 | 46,847 | ||||
$0.03–0.58 | 9.4 | 466,797 | — | — | ||||
$0.59–0.74 | 9.4 | 43,703 | — | — | ||||
$0.75–0.85 | 9.9 | 294,574 | — | — | ||||
Total | 9.1 | 1,599,273 | 8.7 | 46,847 | ||||
As of December 31, 2003, there were exercisable equity options of 46,847, with a weighted average exercise price of $0.02. There were no options exercisable at December 31, 2002. Subject to acceleration under certain conditions, all equity options vest and become fully exercisable after 4 years from the date of grant so long as the employee remains employed by the Company. All options expire ten years after the grant date.
The fair value of each equity option is estimated (on the date of grant) based on the Black-Scholes option pricing model with the following weighted-average assumptions used for grants for the years ended December 31, 2002 and 2003:
| December 31, | ||||||
| 2002 | 2003 | |||||
Dividend yield | None | None | ||||
Risk-free interest rate | 3.3 | % | 2.3 | % | ||
Expected option life (in years) | 5 | 4 | ||||
See Note 2 for compensation expense for the Plans using the fair value-based method, consistent with SFAS No. 123.
11.14. Commitments and contingenciesContingencies
Litigation
From time to time, the Company is involved in various legal matters arising out of the ordinary course of business. Although the outcome of these matters cannot presently be determined, in the opinion of management, disposition of these matters will not have a material adverse effect on the financial position or results of operations of the Company.
F-19F-17
Notes to audited consolidated financial statements
Lease commitmentsCommitments
The Company hasleases office space and certain equipment under noncancelable operating lease arrangements, expiring on various lease agreements, principally for office space,dates through 2014, with various renewal options. The Company’s principal executive offices located in Chicago, Illinois are under a lease that expires in September 2014, with two five-year renewal options, and accounts for approximately 70% of the Company’s future minimum rental commitments. Office facilities under operating leases include fixed or minimum payments plus, in some cases, scheduled base rent increases over the term of the lease. Certain leases provide for monthly payments of real estate taxes, insurance and other operating expenses applicable to the property. Some of the leases contain provisions whereby the future rental payments may be adjusted for increases in operating expenses above the specified amount. Rental expense, including operating costs and taxes, for the period from March 19, 2002 (inception) to December 31, 2002 and the yearyears ended December 31, 2003 and 2004 was $1,152,595$1.2 million, $3.0 million and $2,993,462,$4.1 million, respectively. Future minimum rental commitments under non-cancelable operating leases and sublease income as of December 31, 2003,2004, are as follows:
2004 | $ | 3,322,034 | |||||||
| Minimum Rental Commitment | Sublease Income | ||||||||
2005 | 3,962,048 | $ | 4,461 | $ | 268 | ||||
2006 | 3,618,413 | 4,419 | 299 | ||||||
2007 | 3,586,258 | 4,730 | 182 | ||||||
2008 | 3,233,891 | 4,380 | |||||||
2009 | 4,288 | ||||||||
Thereafter | 14,179,372 | 14,601 | |||||||
Total minimum lease commitments | $ | 31,902,016 | |||||||
Total | $ | 36,879 | $ | 749 | |||||
12.15. Segment Information
Segments are defined by SFAS No. 131, “Disclosures about Segments of an Enterprise and Related Information,” as components of a company in which separate financial information is available and is evaluated regularly by the chief operating decision maker, or decision-making group, in deciding how to allocate resources and in assessing performance.
The Company provides services through two segments: Financial Consulting and Operational Consulting. The Financial Consulting segment provides services that help clients effectively address complex challenges that arise from litigation, disputes, investigations, regulation, financial distress and other sources of significant conflict or change. The Operational Consulting segment provides services that help clients improve the overall efficiency and effectiveness of their operations by enhancing revenue, reducing costs, managing regulatory compliance and maximizing procurement efficiency.
Effective January 1, 2005, the Forensic Technology and Discovery Services group within the Financial Consulting segment was moved into the Operational Consulting segment to improve marketing synergies with the Legal Business Consulting practice. Previously reported segment information has been reclassified to reflect this change except for the year ended December 31, 2002 as the effect was immaterial. This reclassification had no impact on previously reported net income (loss).
Segment operating income consists of the revenues generated by a segment, less the direct costs of revenue and selling, general and administrative costs that are incurred directly by the segment. Unallocated corporate costs include costs related to administrative functions that are performed in a centralized manner that are not attributable to a particular segment. These administrative function costs include costs for corporate office support, all office facility costs, costs relating to accounting and finance, human resources, legal, marketing, information technology and company-wide business development functions, as well as costs related to overall corporate management.
F-18
Notes to audited consolidated financial statements
The following table presents information about reported segments along with the items necessary to reconcile the segment information to the totals reported in the accompanying consolidated financial statements:
| Year ended December 31, | Mar. 19, 2002 (inception) to Dec. 31, 2002 | |||||||||||
| 2004 | 2003 | |||||||||||
Financial Consulting: | ||||||||||||
Revenues | $ | 92,378 | $ | 68,028 | $ | 22,400 | ||||||
Segment operating income | $ | 34,365 | $ | 20,601 | $ | 3,912 | ||||||
Segment operating income as a percent of segment revenues | 37.2 | % | 30.3 | % | 17.5 | % | ||||||
Operational Consulting: | ||||||||||||
Revenues | $ | 67,172 | $ | 33,458 | $ | 12,701 | ||||||
Segment operating income | $ | 23,009 | $ | 6,793 | $ | 3,527 | ||||||
Segment operating income as a percent of segment revenues | 34.3 | % | 20.3 | % | 27.8 | % | ||||||
Total Company: | ||||||||||||
Revenues | $ | 159,550 | $ | 101,486 | $ | 35,101 | ||||||
Reimbursable expenses | 14,361 | 8,808 | 2,921 | |||||||||
Total revenues and reimbursable expenses | $ | 173,911 | $ | 110,294 | $ | 38,022 | ||||||
Statement of operations reconciliation: | ||||||||||||
Segment operating income | $ | 57,374 | $ | 27,394 | $ | 7,439 | ||||||
Charges not allocated at the segment level: | ||||||||||||
Other selling, general and administrative expenses | 31,417 | 20,601 | 7,206 | |||||||||
Stock-based compensation expense | 433 | 14 | — | |||||||||
Depreciation and amortization expense | 2,365 | 5,328 | 3,048 | |||||||||
Restructuring charges | 3,475 | — | — | |||||||||
Loss on lease abandonment | — | 1,668 | — | |||||||||
Management and advisory fees paid to related parties and organization costs | — | — | 3,715 | |||||||||
Interest expense, net | 692 | 856 | 332 | |||||||||
Other (income) expense | — | 112 | 1 | |||||||||
Net income (loss) before provision (benefit) for income taxes | $ | 18,992 | $ | (1,185 | ) | $ | (6,863 | ) | ||||
Segment assets: | ||||||||||||
Financial Consulting | $ | 18,921 | $ | 15,961 | $ | 8,727 | ||||||
Operational Consulting | 13,659 | 7,103 | 3,837 | |||||||||
Unallocated assets | 50,639 | 16,825 | 14,019 | |||||||||
Total assets | $ | 83,219 | $ | 39,889 | $ | 26,583 | ||||||
All long-lived assets are in the United States. During 2004, 2003 and 2002, no client in either segment accounted for 10% or more of total revenues of the Company.
F-19
Notes to audited consolidated financial statements
16. Valuation and Qualifying Accounts
The following summarizes the activity of the allowance for doubtful accounts and unbilled services:
| Beginning balance | Additions charged to income | Deductions* | Ending balance | |||||||
Period from March 19, 2002 (inception) to December 31, 2002: | ||||||||||
Allowance for doubtful accounts and unbilled services | $ | — | 841 | 459 | $ | 382 | ||||
Year ended December 31, 2003: | ||||||||||
Allowance for doubtful accounts and unbilled services | $ | 382 | 5,335 | 3,925 | $ | 1,792 | ||||
Year ended December 31, 2004: | ||||||||||
Allowance for doubtful accounts and unbilled services | $ | 1,792 | 9,051 | 7,178 | $ | 3,665 | ||||
| * | Deductions include write-offs of accounts receivable, fee adjustments related to estimated overruns on fixed and capped fee engagements and other discretionary pricing adjustments. |
17. Selected Quarterly Financial Data (unaudited)
| Quarter Ended | |||||||||||||||
| 2004 | Mar. 31, | Jun. 30, | Sep. 30 | Dec. 31 | |||||||||||
Revenues | $ | 40,101 | $ | 41,503 | $ | 37,109 | $ | 40,837 | |||||||
Reimbursable expenses | 3,443 | 3,647 | 3,225 | 4,046 | |||||||||||
Total revenues and reimbursable expenses | 43,544 | 45,150 | 40,334 | 44,883 | |||||||||||
Gross profit | 15,153 | 18,885 | 14,762 | 17,582 | |||||||||||
Operating income | 4,253 | 8,731 | 2,135 | 4,565 | |||||||||||
Net income attributable to common stockholders | 2,074 | 4,600 | 811 | 2,448 | |||||||||||
Net income attributable to common stockholders per share*: | |||||||||||||||
Basic | $ | 0.16 | $ | 0.35 | $ | 0.06 | $ | 0.16 | |||||||
Diluted | $ | 0.15 | $ | 0.32 | $ | 0.06 | $ | 0.15 | |||||||
Weighted average shares used in calculating net income attributable to common stockholders per share*: | |||||||||||||||
Basic | 11,974 | 12,050 | 12,180 | 15,061 | |||||||||||
Diluted | 12,747 | 13,044 | 13,149 | 16,101 | |||||||||||
| Quarter Ended | |||||||||||||||
| 2003 | Mar. 31, | Jun. 30, | Sep. 30 | Dec. 31 | |||||||||||
Revenues | $ | 23,212 | $ | 23,711 | $ | 25,549 | $ | 29,014 | |||||||
Reimbursable expenses | 2,069 | 1,837 | 2,105 | 2,797 | |||||||||||
Total revenues and reimbursable expenses | 25,281 | 25,548 | 27,654 | 31,811 | |||||||||||
Gross profit | 9,631 | 7,961 | 6,461 | 7,911 | |||||||||||
Operating income (loss) | 3,515 | 326 | (3,315 | ) | (743 | ) | |||||||||
Net income (loss) attributable to common stockholders | 1,688 | (344 | ) | (2,440 | ) | (1,033 | ) | ||||||||
Net income (loss) attributable to common stockholders per share*: | |||||||||||||||
Basic | $ | — | $ | (0.03 | ) | $ | (0.20 | ) | $ | (0.09 | ) | ||||
Diluted | $ | — | $ | (0.03 | ) | $ | (0.20 | ) | $ | (0.09 | ) | ||||
Weighted average shares used in calculating net income (loss) attributable to common stockholders per share*: | |||||||||||||||
Basic | 11,803 | 11,809 | 11,927 | 11,946 | |||||||||||
Diluted | 11,803 | 11,809 | 11,927 | 11,946 | |||||||||||
| * | Adjusted to reflect a 1 for 2.3 reverse stock spilt effected on October 5, 2004. |
F-20
Huron Consulting Group Inc.
UNAUDITED CONSOLIDATED BALANCE SHEET
(In thousands, except share and per share amounts)
| June 30, 2005 | ||||
Assets | ||||
Current assets: | ||||
Cash and cash equivalents | $ | 15,099 | ||
Receivables from clients, net | 25,682 | |||
Unbilled services, net | 14,626 | |||
Income tax receivable | 803 | |||
Deferred income taxes | 9,664 | |||
Other current assets | 3,305 | |||
Total current assets | 69,179 | |||
Property and equipment, net | 11,413 | |||
Other assets: | ||||
Deferred income taxes | 2,246 | |||
Deposits | 641 | |||
Intangible assets, net | 2,123 | |||
Goodwill | 14,554 | |||
Total assets | $ | 100,156 | ||
Liabilities and stockholders’ equity | ||||
Current liabilities: | ||||
Accounts payable | $ | 2,221 | ||
Accrued expenses | 3,364 | |||
Accrued payroll and related benefits | 18,877 | |||
Income tax payable | 230 | |||
Deferred revenue | 4,524 | |||
Current portion of notes payable | 1,000 | |||
Total current liabilities | 30,216 | |||
Non-current liabilities: | ||||
Accrued expenses | 444 | |||
Deferred lease incentives | 4,200 | |||
Notes payable, net of current portion | 2,000 | |||
Total non-current liabilities | 6,644 | |||
Commitments and contingencies | — | |||
Stockholders’ equity | ||||
Common stock; $0.01 par value; 500,000,000 shares authorized; 17,122,661 shares issued and 17,077,211 shares outstanding | 171 | |||
Treasury stock, 45,450 shares, at cost | (750 | ) | ||
Additional paid-in capital | 73,166 | |||
Deferred stock-based compensation | (20,517 | ) | ||
Retained earnings | 11,226 | |||
Total stockholders’ equity | 63,296 | |||
Total liabilities and stockholders’ equity | $ | 100,156 | ||
The accompanying notes are an integral part of the unaudited consolidated financial statements.
F-21
Huron Consulting Group Inc.
UNAUDITED CONSOLIDATED STATEMENTS OF OPERATIONS
(In thousands, except share and per share amounts)
| Six Months Ended June 30, | ||||||||
| 2005 | 2004 | |||||||
Revenues and reimbursable expenses: | ||||||||
Revenues | $ | 97,277 | $ | 81,604 | ||||
Reimbursable expenses | 9,061 | 7,090 | ||||||
Total revenues and reimbursable expenses | 106,338 | 88,694 | ||||||
Direct costs and reimbursable expenses (exclusive of depreciation and amortization shown in operating expenses): | ||||||||
Direct costs | 52,459 | 47,405 | ||||||
Stock-based compensation expense | 2,239 | 186 | ||||||
Intangible assets amortization | 385 | — | ||||||
Reimbursable expenses | 9,091 | 7,065 | ||||||
Total direct costs and reimbursable expenses | 64,174 | 54,656 | ||||||
Operating expenses: | ||||||||
Selling, general and administrative | 22,962 | 17,780 | ||||||
Stock-based compensation expense | 867 | 60 | ||||||
Depreciation and amortization | 1,956 | 1,075 | ||||||
Restructuring charges | — | 2,139 | ||||||
Total operating expenses | 25,785 | 21,054 | ||||||
Operating income (loss) | 16,379 | 12,984 | ||||||
Other (income) expense: | ||||||||
Interest (income) expense, net | (229 | ) | 516 | |||||
Other income | (1 | ) | (1 | ) | ||||
Total other (income) expenses | (230 | ) | 515 | |||||
Income before provision for income taxes | 16,609 | 12,469 | ||||||
Provision for income taxes | 7,125 | 5,237 | ||||||
Net income | 9,484 | 7,232 | ||||||
Accrued dividends on 8% preferred stock | — | 558 | ||||||
Net income attributable to common stockholders | $ | 9,484 | $ | 6,674 | ||||
Net income attributable to common stockholders per share: | ||||||||
Basic | $ | 0.61 | $ | 0.50 | ||||
Diluted | $ | 0.57 | $ | 0.47 | ||||
Weighted average shares used in calculating net income attributable to common stockholders per share: | ||||||||
Basic | 15,597 | 12,011 | ||||||
Diluted | 16,725 | 13,005 | ||||||
The accompanying notes are an integral part of the unaudited consolidated financial statements.
F-22
Huron Consulting Group Inc.
UNAUDITED CONSOLIDATED STATEMENT OF STOCKHOLDERS’ EQUITY
(In thousands, except share and per share amounts)
| Common Stock | Treasury Stock | Additional Paid-In Capital | Deferred Stock-based Compensation | Retained Earnings (Deficit) | Stockholders’ Equity (Deficit) | |||||||||||||||||
| Shares | Amount | |||||||||||||||||||||
Balance at December 31, 2004 | 16,364,574 | $ | 164 | $ | — | $ | 59,608 | $ | (12,281 | ) | $ | 1,742 | $ | 49,233 | ||||||||
Net income | — | — | — | — | — | 9,484 | 9,484 | |||||||||||||||
Issuance of common stock in connection with: | ||||||||||||||||||||||
Restricted stock awards, net of cancellations | 557,117 | 5 | (750 | ) | 11,676 | (10,931 | ) | — | — | |||||||||||||
Exercise of stock options | 209,620 | 2 | — | 102 | — | — | 104 | |||||||||||||||
Stock-based compensation | — | — | — | 411 | 2,695 | — | 3,106 | |||||||||||||||
Income tax benefit on stock-based compensation | — | — | — | 1,369 | — | — | 1,369 | |||||||||||||||
Balance at June 30, 2005 | 17,131,311 | $ | 171 | $ | (750 | ) | $ | 73,166 | $ | (20,517 | ) | $ | 11,226 | $ | 63,296 | |||||||
The accompanying notes are an integral part of the unaudited consolidated financial statements.
F-23
Huron Consulting Group Inc.
UNAUDITED CONSOLIDATED STATEMENTS OF CASH FLOWS
(In thousands)
| Six Months Ended June 30, | ||||||||
| 2005 | 2004 | |||||||
Cash flows from operating activities: | ||||||||
Net income | $ | 9,484 | $ | 7,232 | ||||
Adjustments to reconcile net income to net cash provided by operating activities: | ||||||||
Depreciation and amortization | 2,341 | 1,075 | ||||||
Deferred income taxes | (2,541 | ) | (641 | ) | ||||
Stock-based compensation expense | 3,106 | 246 | ||||||
Tax benefit from stock-based compensation | 1,369 | 744 | ||||||
Allowances for doubtful accounts and unbilled services | 145 | 1,120 | ||||||
Changes in operating assets and liabilities: | ||||||||
Increase in receivables from clients | (2,928 | ) | (7,636 | ) | ||||
Increase in unbilled services | (4,698 | ) | (4,603 | ) | ||||
(Increase) decrease in income tax receivable | (309 | ) | 2,286 | |||||
Decrease (increase) in other current assets | 2 | (1,053 | ) | |||||
Decrease in deposits | 17 | 136 | ||||||
(Decrease) Increase in accounts payable and accrued expenses | (1,184 | ) | 702 | |||||
(Decrease) increase in accrued payroll and related benefits | (1,618 | ) | 675 | |||||
(Decrease) increase in income tax payable | (720 | ) | 748 | |||||
Decrease in interest payable to HCG Holdings LLC | — | (417 | ) | |||||
Increase in deferred revenue | 1,088 | 324 | ||||||
Net cash provided by operating activities | 3,554 | 938 | ||||||
Cash flows from investing activities: | ||||||||
Purchase of property and equipment, net | (4,285 | ) | (3,035 | ) | ||||
Purchase of business, net of cash acquired | (12,366 | ) | — | |||||
Net cash used in investing activities | (16,651 | ) | (3,035 | ) | ||||
Cash flows from financing activities: | ||||||||
Proceeds from exercise of stock options | 104 | 39 | ||||||
Proceeds from borrowings under line of credit | — | 34,200 | ||||||
Repayments on line of credit | — | (34,200 | ) | |||||
Dividends paid | — | (1,250 | ) | |||||
Net cash provided by (used in) financing activities | 104 | (1,211 | ) | |||||
Net decrease in cash and cash equivalents | (12,993 | ) | (3,308 | ) | ||||
Cash and cash equivalents: | ||||||||
Beginning of the period | 28,092 | 4,251 | ||||||
End of the period | $ | 15,099 | $ | 943 | ||||
Noncash transaction: | ||||||||
Issuance of notes payable for purchase of business | $ | 3,000 | $ | — | ||||
Accrued dividends on 8% preferred stock | $ | — | $ | 558 | ||||
Supplemental disclosure of cash flow information: | ||||||||
Cash paid for interest | $ | 63 | $ | 920 | ||||
Cash paid for taxes | $ | 9,327 | $ | 2,100 | ||||
The accompanying notes are an integral part of the unaudited consolidated financial statements
F-24
Notes to unaudited consolidated financial statements
(Tabular amounts in thousands, except per share amounts)
1. Description of Business
Huron Consulting Group Inc. was formed on March 19, 2002. Huron Consulting Group Inc., together with its wholly owned subsidiaries, Huron Consulting Services LLC and Speltz & Weis LLC, (the “Company”), is an independent provider of financial and operational consulting services, whose clients include Fortune 500 companies, medium-sized businesses, leading academic institutions, healthcare organizations and the law firms that represent these various organizations. The majority of the issued and outstanding common stock of the Company is held by HCG Holdings LLC.
2. Basis of Presentation
The accompanying unaudited consolidated financial statements of the Company have been prepared in accordance with the rules and regulations of the Securities and Exchange Commission (“SEC”). In the opinion of management, these financial statements reflect all adjustments of a normal, recurring nature necessary for the fair presentation of the Company’s financial position, results of operations and cash flows for the interim periods presented in conformity with accounting principles generally accepted in the United States of America. These financial statements should be read in conjunction with the consolidated financial statements and notes thereto for the year ended December 31, 2004 included elsewhere in this prospectus. The Company’s results for any interim period are not necessarily indicative of results for a full year or any other interim period.
3. New Accounting Pronouncement
In December 2004, the Financial Accounting Standards Board issued Statement of Financial Accounting Standards (“SFAS”) No. 123 (revised 2004), “Share-Based Payment,” (“SFAS No. 123R”). In April 2005, the SEC adopted a new rule that amends the effective date of SFAS No. 123R. Under the new rule, the Company must adopt SFAS No. 123R effective January 1, 2006. This statement requires that the costs of employee share-based payments be measured at fair value on the awards’ grant date and be recognized in the financial statements over the requisite service period. SFAS No. 123R supersedes Accounting Principles Board Opinion No. 25 (“APB 25”), “Accounting for Stock Issued to Employees,” and its related interpretations, and eliminates the alternative to use APB 25’s intrinsic value method of accounting, which the Company is currently using. Additionally, SFAS No. 123R amends SFAS No. 95, “Statement of Cash Flows,” to require that excess tax benefits be reported as a financing cash inflow rather than as a reduction of taxes paid.
SFAS No. 123R allows for two alternative transition methods. The first method is the modified prospective application whereby compensation cost for the portion of awards for which the requisite service has not yet been rendered that are outstanding as of the adoption date will be recognized over the remaining service period. The compensation cost for that portion of awards will be based on the grant-date fair value of those awards as calculated for pro forma disclosures under SFAS No. 123, as originally issued. All new awards and awards that are modified, repurchased, or cancelled after the adoption date will be accounted for under the provisions of SFAS No. 123R. The second method is the modified retrospective application, which requires that the Company restate prior period financial statements. The Company is currently determining which transition method it will adopt and does not expect the adoption of SFAS No. 123R to have a material impact on its financial position, results of operations, earnings per share or cash flows.
4. Stock-based Compensation
The Company accounts for stock-based compensation using the intrinsic value method prescribed in APB 25 and related interpretations and elects the disclosure option of SFAS No. 123 as amended by
F-25
Notes to unaudited consolidated financial statements
SFAS No. 148, “Accounting for Stock-Based Compensation—Transition and Disclosure.” SFAS No. 123 requires that companies either recognize compensation expense for grants of stock, stock options and other equity instruments based on fair value, or provide pro forma disclosure of net income and earnings per share in the notes to the financial statements. Accordingly, the Company has measured compensation expense for stock options as the excess, if any, of the estimated fair market value of the Company’s stock at the date of grant over the exercise price.
The following table details the effect on net income attributable to common stockholders and net income attributable to common stockholders per share if compensation expense for the stock plans had been recorded based on the fair value method under SFAS No. 123.
| Six Months Ended June 30, | ||||||||
| 2005 | 2004 | |||||||
Net income attributable to common stockholders | $ | 9,484 | $ | 6,674 | ||||
Add: Total stock-based employee compensation expense included in reported net income, net of related tax benefits | 1,857 | 143 | ||||||
Deduct: Total stock-based employee compensation expense determined under the fair market value method for all awards, net of related tax effects | (1,946 | ) | (150 | ) | ||||
Pro forma net income attributable to common stockholders | $ | 9,395 | $ | 6,667 | ||||
Earnings per share: | ||||||||
Basic—as reported | $ | 0.61 | $ | 0.50 | ||||
Basic—pro forma | $ | 0.60 | $ | 0.50 | ||||
Diluted—as reported | $ | 0.57 | $ | 0.47 | ||||
Diluted—pro forma | $ | 0.56 | $ | 0.47 | ||||
The Company also grants restricted stock awards to certain employees and officers. Expense relating to restricted stock awards is amortized on a straight-line basis over the vesting period. Restricted stock information is as follows:
| Six Months Ended June 30, 2005 | |||
Restricted shares granted (in thousands) | 557 | ||
Weighted-average market price of shares granted | $ | 21.07 | |
Restricted shares outstanding (at period end, in thousands) | 1,333 | ||
Restricted shares amortization expense | $ | 2,695 | |
5. Business Combination
On May 5, 2005, Huron Consulting Group Inc. entered into a Membership Interest Purchase and Sale Agreement to acquire 100% of the outstanding membership interests of Speltz & Weis LLC. The acquisition was consummated on May 9, 2005. The results of Speltz & Weis LLC’s operations have been included within the Financial Consulting segment since that date. Speltz & Weis LLC is a specialized consulting firm consisting of 26 consultants. With the acquisition of Speltz & Weis LLC, the Company can provide interim management, organizational renewal and turnaround services, and other crisis management services to distressed hospitals and other healthcare facilities.
The aggregate purchase price of the acquisition was $17.2 million, which consisted of $14.0 million cash paid at closing, notes payable totaling $3.0 million payable in three equal installments of $1.0 million
F-26
Notes to unaudited consolidated financial statements
(together with accrued interest at 4% per annum) beginning on May 8, 2006, and $0.2 million of transaction costs. Additional purchase consideration may be payable based on the performance of Speltz & Weis LLC during the three-year period beginning June 1, 2005 and ending May 30, 2008. Such amounts will be recorded as an adjustment to goodwill if payable. Also, additional payments may be made based on the amount of revenues the Company receives from certain referrals made by Speltz & Weis LLC employees. Such amounts will be recorded as an expense if payable.
The following table summarizes the estimated fair values of the assets acquired and liabilities assumed at the date of acquisition. The Company is in the process of obtaining a third-party valuation of certain intangible assets; thus, the allocation of the purchase price is subject to refinement.
| May 9, 2005 | |||
Assets Acquired: | |||
Current assets | $ | 2,291 | |
Equipment | 16 | ||
Intangible assets | 2,600 | ||
Goodwill | 14,554 | ||
| 19,461 | |||
Liabilities Assumed: | |||
Current liabilities | 2,307 | ||
Net Assets Acquired | $ | 17,154 | |
The $14.6 million of goodwill was assigned to the Financial Consulting segment, all of which is deductible for tax purposes.
The $2.6 million of acquired intangible assets have a weighted-average useful life of approximately 10.2 months, which consisted of customer contracts of $1.9 million (8.4 months weighted-average useful life) and customer relationships of $0.7 million (15.1 months weighted-average useful life). The Company assigned relatively short lives to the customer contracts and customer relationships due to the short-term nature of the services and relationships provided under these contracts, which primarily consist of interim management services.
The following unaudited pro forma financial data gives effect to the acquisition of Speltz & Weis LLC as if it had been completed at the beginning of the period. This unaudited pro forma financial data is not necessarily indicative of the operating results that would have been achieved if the acquisition had occurred on the dates indicated, nor are they necessarily indicative of future results.
| Six Months Ended June 30, | ||||||
| 2005 | 2004 | |||||
Revenues, net of reimbursable expenses | $ | 105,559 | $ | 89,289 | ||
Operating income | $ | 17,248 | $ | 13,557 | ||
Income before provision for income taxes | $ | 17,441 | $ | 12,987 | ||
Net income attributable to common stockholders | $ | 9,855 | $ | 6,857 | ||
Net income attributable to common stockholders per share: | ||||||
Basic | $ | 0.63 | $ | 0.52 | ||
Diluted | $ | 0.59 | $ | 0.48 | ||
6. Goodwill and Intangible Assets
The carrying amount of goodwill at June 30, 2005 was $14.6 million, which is attributable to the Financial Consulting segment and resulted from the acquisition of Speltz & Weis LLC as discussed in
note 5 above.
F-27
Notes to unaudited consolidated financial statements
Intangible assets as of June 30, 2005 consisted of the following:
| Gross Carrying Amount | Accumulated Amortization | |||||
Customer contracts | $ | 1,900 | $ | 385 | ||
Customer relationships | 700 | 92 | ||||
Total | $ | 2,600 | $ | 477 | ||
Intangible assets amortization expense was $0.5 million for the three and six months ended June 30, 2005. Estimated intangible assets amortization expense is $2.1 million for 2005 and $0.5 million for 2006.
These amounts are based on the estimated fair values of the assets acquired and liabilities assumed at the date of the Speltz & Weis LLC acquisition. Such estimated fair values could change based on the finalization of a third-party valuation of certain intangible assets.
7. Earnings Per Share
Basic earnings per share (EPS) excludes dilution and is computed by dividing net income by the weighted average number of common shares outstanding for the period. Diluted EPS reflects the potential reduction in EPS that could occur if securities or other contracts to issue common stock were exercised or converted into common stock. EPS under the basic and diluted computation are as follows:
| Six Months Ended June 30, | |||||||
| 2005 | 2004 | ||||||
Net income | $ | 9,484 | $ | 7,232 | |||
Dividends accrued on 8% preferred stock | — | (558 | ) | ||||
Amount allocated to preferred stockholders | — | (622 | ) | ||||
Net income attributable to common stockholders | $ | 9,484 | $ | 6,052 | |||
Weighted average common shares outstanding—basic | 15,597 | 12,011 | |||||
Weighted average common stock equivalents | 1,128 | 994 | |||||
Weighted average common shares outstanding—diluted | 16,725 | 13,005 | |||||
Basic net income attributable to common stockholders per share | $ | 0.61 | $ | 0.50 | |||
Diluted net income attributable to common stockholders per share | $ | 0.57 | $ | 0.47 | |||
Prior to the redemption of the 8% preferred stock in October 2004, the 8% preferred stockholders participated in any dividends paid to common stockholders on an as converted basis using the current period estimated fair market value of a share of common stock. There were no anti-dilutive securities for the six months ended June 30, 2005 and 2004.
8. Restructuring Charges
In March 2004, the Company incurred a $2.1 million pre-tax restructuring charge associated with the closing of two offices. The charge included approximately $2.0 million for severance payments, which were paid by April 30, 2004, and $0.1 million for office lease payments, which were paid by August 31, 2004.
F-28
Notes to unaudited consolidated financial statements
9. Line of Credit and Guarantee
The Company has a bank credit agreement, expiring on February 10, 2006, that allows it to borrow up to the lesser of $25.0 million or the sum of (a) 85% of eligible accounts receivable and (b) the lesser of 40% of unbilled services and $5.0 million. Borrowings under the agreement are limited by any outstanding letters of credit, bear interest at LIBOR plus 1.75%, and are secured by substantially all of the Company’s assets. The bank credit agreement includes covenants for minimum equity and maximum annual capital expenditures, as well as covenants restricting the Company’s ability to incur additional indebtedness or engage in certain types of transactions outside of the ordinary course of business. The Company had no borrowings outstanding under the bank credit agreement as of June 30, 2005. At June 30, 2005, the Company was in compliance with its debt covenants.
Guarantees in the form of letters of credit of $1.7 million were outstanding at June 30, 2005 to support certain office lease obligations.
10. Commitments and Contingencies
From time to time, the Company is involved in various legal matters arising out of the ordinary course of business. Although the outcome of these matters cannot presently be determined, in the opinion of management, disposition of these matters will not have a material adverse effect on the financial position or results of operations of the Company.
11. Segment Information
Segments are defined by SFAS No. 131, “Disclosures about Segments of an Enterprise and Related Information,” as components of a company in which separate financial information is available and is evaluated regularly by the chief operating decision maker, or decision-making group, in deciding how to allocate resources and in assessing performance.
The Company provides services through two segments: Financial Consulting and Operational Consulting. The Financial Consulting segment provides services that help clients effectively address complex challenges that arise from litigation, disputes, investigations, regulation, financial distress and other sources of significant conflict or change. The Operational Consulting segment provides services that help clients improve the overall efficiency and effectiveness of their operations by enhancing revenue, reducing costs, managing regulatory compliance and maximizing procurement efficiency.
Segment operating income consists of the revenues generated by a segment, less the direct costs of revenue and selling, general and administrative costs that are incurred directly by the segment. Unallocated corporate costs include costs related to administrative functions that are performed in a centralized manner that are not attributable to a particular segment. These administrative function costs include costs for corporate office support, all office facility costs, costs relating to accounting and finance, human resources, legal, marketing, information technology and company-wide business development functions, as well as costs related to overall corporate management.
The Company may reclassify certain revenues and expenses among the segments to align them with the changes in the Company’s internal organizational structure. Beginning January 1, 2005, the Forensic Technology and Discovery Services group within the Financial Consulting segment was moved into the Operational Consulting segment to improve marketing synergies with the Legal Business Consulting practice. Previously reported segment information has been reclassified to reflect this change. This reclassification had no effect on previously reported net income.
F-20F-29
Notes to unaudited consolidated financial statements
The following table presents information about reported segments along with the items necessary to reconcile the segment information to the totals reported in the accompanying consolidated financial statements:
Period from 2002 | Year ended 2003 | Six months ended June 30, | ||||||||||||||||||||||
| 2003 | 2004 | Six Months Ended June 30, | ||||||||||||||||||||||
| (unaudited) | 2005 | 2004 | ||||||||||||||||||||||
Financial Consulting: | ||||||||||||||||||||||||
Revenues | $ | 22,399,602 | $ | 69,941,301 | $ | 33,518,731 | $ | 50,826,200 | $ | 54,443 | $ | 48,999 | ||||||||||||
Segment operating income | 3,911,894 | 22,011,032 | 12,941,764 | 20,287,829 | $ | 22,444 | $ | 19,182 | ||||||||||||||||
Segment operating income as a percent of segment revenues | 17.5 | % | 31.5 | % | 38.6 | % | 39.9 | % | 41.2 | % | 39.1 | % | ||||||||||||
Operational Consulting: | ||||||||||||||||||||||||
Revenues | $ | 12,701,110 | $ | 31,544,373 | $ | 13,404,614 | $ | 30,777,483 | $ | 42,834 | $ | 32,605 | ||||||||||||
Segment operating income | 3,527,188 | 5,383,260 | 3,033,381 | 10,237,687 | $ | 15,988 | $ | 11,344 | ||||||||||||||||
Segment operating income as a percent of segment revenues | 27.8 | % | 17.1 | % | 22.6 | % | 33.3 | % | 37.3 | % | 34.8 | % | ||||||||||||
Total Company: | ||||||||||||||||||||||||
Revenues | $ | 35,100,712 | $ | 101,485,674 | $ | 46,923,345 | $ | 81,603,683 | $ | 97,277 | $ | 81,604 | ||||||||||||
Reimbursable expenses | 2,921,301 | 8,808,455 | 3,906,477 | 7,090,384 | 9,061 | 7,090 | ||||||||||||||||||
Total revenues and reimbursable expenses | $ | 38,022,013 | $ | 110,294,129 | $ | 50,829,822 | $ | 88,694,067 | $ | 106,338 | $ | 88,694 | ||||||||||||
Statement of operations reconciliation: | ||||||||||||||||||||||||
Segment operating income | $ | 7,439,082 | $ | 27,394,292 | $ | 15,975,145 | $ | 30,525,516 | $ | 38,432 | $ | 30,526 | ||||||||||||
Charges not allocated at the segment level: | ||||||||||||||||||||||||
Other selling, general and administrative expenses | 7,205,793 | 20,614,477 | 9,475,512 | 14,327,317 | 19,230 | 14,268 | ||||||||||||||||||
Stock-based compensation expense | 867 | 60 | ||||||||||||||||||||||
Depreciation and amortization expense | 3,047,914 | 5,328,484 | 2,657,997 | 1,074,842 | 1,956 | 1,075 | ||||||||||||||||||
Loss on lease abandonment | — | 1,668,000 | — | — | ||||||||||||||||||||
Restructuring charge | — | — | — | 2,138,827 | ||||||||||||||||||||
Management and advisory fees paid to related parties and organization costs | 3,715,489 | — | — | — | ||||||||||||||||||||
Interest expense | 331,784 | 856,252 | 418,570 | 516,015 | ||||||||||||||||||||
Other expense | 1,113 | 111,513 | 111,513 | (724 | ) | |||||||||||||||||||
Restructuring charges | — | 2,139 | ||||||||||||||||||||||
Other (income) expense | (230 | ) | 515 | |||||||||||||||||||||
Net (loss) income before (benefit) provision for income taxes | $ | (6,863,011 | ) | $ | (1,184,434 | ) | $ | 3,311,553 | $ | 12,469,239 | ||||||||||||||
Income before provision for income taxes | $ | 16,609 | $ | 12,469 | ||||||||||||||||||||
| December 31, | June 30, | |||||||||||||||||||||||
| 2002 | 2003 | 2004 | ||||||||||||||||||||||
| (unaudited) | ||||||||||||||||||||||||
Segment assets: | ||||||||||||||||||||||||
Financial Consulting | $ | 8,727,367 | $ | 15,960,872 | $ | 21,419,176 | ||||||||||||||||||
Operational Consulting | 3,837,219 | 7,103,108 | 12,755,714 | |||||||||||||||||||||
Unallocated assets | 14,018,073 | 16,824,730 | 14,756,933 | |||||||||||||||||||||
Total assets | $ | 26,582,659 | $ | 39,888,710 | $ | 48,931,823 | ||||||||||||||||||
All long-lived assets areDuring the six months ended June 30, 2005, revenues from one client represented greater than 10.0% of the Company’s consolidated revenues as presented in the table below. This client’s total receivables and unbilled services balance at June 30, 2005 represented 12.2% of the Company’s total receivables and unbilled services balance.
| Six Months Ended June 30, 2005 | ||||
Financial Consulting | $ | 10,343 | ||
Operational Consulting | 1,879 | |||
Total | $ | 12,222 | ||
Percentage of Consolidated Revenues | 12.6 | % | ||
12. Subsequent Event
One of the Company’s clients filed for bankruptcy on July 5, 2005. That client is seeking to retain the Company’s services, which is subject to approval by the bankruptcy court. An application to retain the Company’s services is pending in the bankruptcy court. To date, no decision has been made by the bankruptcy court and the Company cannot provide any assurance as to when a decision will be made.
F-30
Report of Independent Auditors
To the Members’ of Speltz & Weis LLC:
In our opinion, the accompanying balance sheet and the related statement of income, of members’ equity and of cash flows present fairly, in all material respects, the financial position of Speltz & Weis LLC at December 31, 2004, and the results of its operations and its cash flows for the year then ended in conformity with accounting principles generally accepted in the United States. DuringStates of America. These financial statements are the responsibility of the Company’s management. Our responsibility is to express an opinion on these financial statements based on our audit. We conducted our audit of these statements in accordance with auditing standards generally accepted in the United States of America. Those standards require that we plan and perform the audit to obtain reasonable assurance about whether the financial statements are free of material misstatement. An audit includes examining, on a test basis, evidence supporting the amounts and disclosures in the financial statements, assessing the accounting principles used and significant estimates made by management, and evaluating the overall financial statement presentation. We believe that our audit provides a reasonable basis for our opinion.
/S/ PricewaterhouseCoopers LLP
Chicago, Illinois
July 15, 2005
F-31
Speltz & Weis LLC
(In whole dollars)
December 31, 2004 | March 31, 2005 | ||||||
Assets | (unaudited | ) | |||||
Current assets: | |||||||
Cash and cash equivalents | $ | 675,921 | $ | 1,664,690 | |||
Receivables from clients | — | 38,009 | |||||
Unbilled services | 153,386 | 71,913 | |||||
Prepaid expenses | 11,416 | — | |||||
Total current assets | 840,723 | 1,774,612 | |||||
Fixed assets, net | 32,752 | 33,889 | |||||
Total assets | $ | 873,475 | $ | 1,808,501 | |||
Liabilities and members’ equity | |||||||
Accounts payable | $ | 169,046 | $ | 344,240 | |||
Accrued expenses | 15,784 | 277,973 | |||||
Deferred revenues | — | 69,318 | |||||
Retainers | 24,866 | 25,500 | |||||
Total liabilities | 209,696 | 717,031 | |||||
Contingencies | — | — | |||||
Members’ equity | 663,779 | 1,091,470 | |||||
Total liabilities and members’ equity | $ | 873,475 | $ | 1,808,501 | |||
The accompanying notes are an integral part of the financial statements.
F-32
Speltz & Weis LLC
(In whole dollars)
Year Ended December 31, | Three Months Ended March 31, 2005 | Three Months Ended March 31, 2004 | |||||||
| (unaudited) | (unaudited) | ||||||||
Revenues and reimbursable expenses: | |||||||||
Revenues | $ | 19,027,084 | $ | 6,469,307 | $ | 3,408,225 | |||
Reimbursable expenses | 1,663,338 | 636,526 | 222,058 | ||||||
Total revenues and reimbursable expenses | 20,690,422 | 7,105,833 | 3,630,283 | ||||||
Direct costs and reimbursable expenses: | |||||||||
Direct costs (exclusive of depreciation and amortization shown separately below) | 13,040,854 | 4,449,067 | 2,060,404 | ||||||
Reimbursable expenses | 1,663,338 | 636,526 | 222,058 | ||||||
Total direct costs and reimbursable expenses | 14,704,192 | 5,085,593 | 2,282,462 | ||||||
Operating expenses: | |||||||||
Selling, general and administrative | 311,010 | 10,443 | 24,007 | ||||||
Depreciation and amortization | 6,604 | 753 | — | ||||||
Total operating expenses | 317,614 | 11,196 | 24,007 | ||||||
Operating income | 5,668,616 | 2,009,044 | 1,323,814 | ||||||
Interest income | 15,615 | 5,869 | 723 | ||||||
Net income | $ | 5,684,231 | $ | 2,014,913 | $ | 1,324,537 | |||
The accompanying notes are an integral part of the financial statements.
F-33
Speltz & Weis LLC
(In whole dollars)
Members’ Equity | ||||
Balance at December 31, 2003 | $ | 388,265 | ||
Net income | 5,684,231 | |||
Distributions to members | (5,408,717 | ) | ||
Balance at December 31, 2004 | $ | 663,779 | ||
Net income (unaudited) | 2,014,913 | |||
Distributions to members (unaudited) | (1,587,222 | ) | ||
Balance at March 31, 2005 (unaudited) | $ | 1,091,470 | ||
The accompanying notes are an integral part of the financial statements.
F-34
Speltz & Weis LLC
(In whole dollars)
Year Ended December 31, 2004 | Three Months Ended March 31, 2005 | Three Months Ended March 31, 2004 | ||||||||||
| (unaudited) | (unaudited) | |||||||||||
Cash flows from operating activities: | ||||||||||||
Net income | $ | 5,684,231 | $ | 2,014,913 | $ | 1,324,537 | ||||||
Adjustments to reconcile net income to net cash provided by operating activities: | ||||||||||||
Depreciation and amortization | 6,604 | 753 | — | |||||||||
Changes in operating assets and liabilities: | ||||||||||||
Decrease (increase) in receivables from clients | 8,472 | (38,009 | ) | (360,706 | ) | |||||||
(Increase) decrease in unbilled services | (152,329 | ) | 81,473 | (5,645 | ) | |||||||
(Increase) decrease in prepaid expenses | (11,416 | ) | 11,416 | — | ||||||||
Increase in accounts payable | 156,681 | 175,194 | 173,527 | |||||||||
Increase in accrued expenses | 14,727 | 262,189 | 13,456 | |||||||||
(Decrease) increase in deferred revenues | (2,100 | ) | 69,318 | 123,174 | ||||||||
Increase in retainers | 23,366 | 634 | 34,000 | |||||||||
Net cash provided by operating activities | 5,728,236 | 2,577,881 | 1,302,343 | |||||||||
Cash flows from investing activities: | ||||||||||||
Purchases of fixed assets | (18,458 | ) | (1,890 | ) | — | |||||||
Net cash used in investing activities | (18,458 | ) | (1,890 | ) | — | |||||||
Cash flows from financing activities: | ||||||||||||
Distributions to members | (5,408,717 | ) | (1,587,222 | ) | (16,102 | ) | ||||||
Net cash used in financing activities | (5,408,717 | ) | (1,587,222 | ) | (16,102 | ) | ||||||
Net increase in cash and cash equivalents | 301,061 | 988,769 | 1,286,241 | |||||||||
Cash and cash equivalents: | ||||||||||||
Beginning of the period | 374,860 | 675,921 | 374,860 | |||||||||
End of the period | $ | 675,921 | $ | 1,664,690 | $ | 1,661,101 | ||||||
The accompanying notes are an integral part of the financial statements.
F-35
1. Description of Business
Speltz & Weis, LLC (the “Company”), a New Hampshire limited liability company formed in 2002, is a specialized consulting firm providing interim management and 2003, no customerother crisis management services to the healthcare provider sector. The Company works to help hospitals and other healthcare facilities improve their financial, operational and market performance through organizational renewal.
2. Summary of Significant Accounting Policies
Basis of Presentation
The accompanying financial statements reflect the results of operations and cash flows for the year ended December 31, 2004 and the three months ended March 31, 2004 and 2005.
Interim Financial Information
The interim financial statements as of March 31, 2005 and for the three months ended March 31, 2004 and 2005 and the other information for this period disclosed in the notes to the financial statements are unaudited. In the opinion of management, the interim financial statements have been prepared on the same basis as the audited financial statements and reflect all adjustments (consisting only of normal recurring adjustments) necessary for the fair presentation of the interim results. The results of operations for the interim periods are not necessarily indicative of the results to be expected for any future periods.
Use of Estimates
The preparation of financial statements in conformity with accounting principles generally accepted in the United States of America requires management to make estimates and assumptions that affect the amounts that are reported in the financial statements and accompanying disclosures. Actual results may differ from these estimates.
Revenue Recognition
The Company recognizes revenues in accordance with Staff Accounting Bulletin (“SAB”) No. 101, “Revenue Recognition in Financial Statements,” as amended by SAB No. 104, “Revenue Recognition” when persuasive evidence of an arrangement exists, the related services are provided, the price is fixed and determinable and collectibility is reasonably assured. These services are rendered under arrangements that require the client to pay on a time-and-expense basis. Fees are based either segment accounted for 10%on agreed upon fixed contract monthly rates or more ofon the hours incurred at agreed-upon hourly rates and recognized as services are provided. Direct costs incurred on engagements are expensed in the period incurred.
Expense reimbursements that are billable to clients are included in total revenues and reimbursable expenses, and typically an equivalent amount of reimbursable expenses are included in total direct costs and reimbursable expenses. Reimbursable expenses are recognized as revenue in the period in which the expense is incurred.
Differences between the timing of billings and the recognition of revenue are recognized as unbilled services or deferred revenues. Revenues recognized for services performed but not yet billed to clients have been recorded as unbilled services in the accompanying balance sheet. Client prepayments are classified as deferred (i.e., unearned) revenues and recognized over future periods as earned in accordance with the applicable engagement agreement. There were no deferred revenues at December 31, 2004.
F-36
Notes to financial statements
Direct Costs and Reimbursable Expenses
Direct costs (exclusive of depreciation and amortization) and reimbursable expenses consists primarily of billable employee compensation and their related benefit costs, the cost of outside consultants or subcontractors assigned to revenue generating activities and direct expenses to be reimbursed by clients. Direct costs also reflect contractual compensation for members of the Company.
Allowances for Accounts Receivables and Unbilled Services
The Company typically bills its clients at the beginning of each month or week based on an estimated number of hours of services to be provided that month or week. Accounts receivable and unbilled services are valued at management’s estimate of the amount that will ultimately be collected. The Company had no accounts receivable at December 31, 2004 and no allowance was deemed necessary at both December 31, 2004 and March 31, 2005.
Customer Concentration
A small number of clients account for the Company’s revenues. During 2004, the Company had six clients of whom one generated $15.8 million, or 82.8%, of the Company’s revenues. This client generated $5.7 million, or 80.5%, of the Company’s revenues during the three months ended March 31, 2005 (unaudited).
Cash and Cash Equivalents
The Company considers all highly liquid investments with original maturities of three months or less to be cash equivalents.
Fixed Assets
Fixed assets are stated at cost, less accumulated depreciation and amortization totaling $6,604 at December 31, 2004. Fixed assets consist of computers and capitalized website development costs, which are depreciated on a straight-line basis over an estimated useful life of three years.
Retainers
Retainers represent cash received in advance from clients and not yet earned in accordance with client agreements. The liability is reduced by applying retainers to revenues as services are rendered.
Income Taxes
The Company is organized as a limited liability company whereby its taxable income is included with that of its members for purposes of determining federal, state and local income taxes. Therefore, no income tax expense has been recorded in the accompanying financial statements.
Fair Value of Financial Instruments
Cash and cash equivalents are stated at cost, which approximates fair market value. The carrying values for unbilled services, accounts payable and other accrued liabilities reasonably approximate fair market value due to the nature of the financial instrument and the short-term maturity of these items.
Segment Reporting
The Company operates under one segment that provides interim management and other crisis management services to the healthcare provider sector. Accordingly, segment information is not applicable.
F-21F-37
Notes to consolidated financial statements
13. Valuation3. Members’ Equity
The Company is organized as a limited liability company. Under the terms of the limited liability agreement, the Company is authorized to establish a capital account for each member equal to the member’s initial capital contribution. The member’s capital account is adjusted by any additional contributions made by the member and qualifyingthe member’s share of the Company’s income. The amounts and timing of distributions, if any, are determined by joint agreement of the members.
4. Contingencies
From time to time, the Company is involved in various legal matters arising out of the ordinary course of business. Although the outcome of these matters cannot presently be determined, in the opinion of management, disposition of these matters will not have a material adverse effect on the financial position or results of operations of the Company.
5. Subsequent Events
On May 9, 2005, Huron Consulting Group Inc. (“Huron”) acquired all of the outstanding membership interests of the Company for $17.2 million, of which $14.0 million was paid in cash at closing and $3.0 million will be paid in three equal annual installments of $1.0 million (together with accrued interest at 4% per annum) beginning on May 8, 2006. In addition, Huron will pay the Company additional amounts based on certain performance targets in accordance with the Membership Interest Purchase and Sale Agreement.
The Company’s largest client filed for bankruptcy on July 5, 2005. A motion to allow the retention of the Company’s interim management team has been filed and is subject to acceptance by the bankruptcy court. If the retention motion is denied, the Company expects it could have a material adverse effect on the Company’s future financial position, results of operations and cash flows until such time as Huron is able to redirect the Company’s resources to other Huron assignments, as well as new assignments. As of December 31, 2004 and June 30, 2005, there were no uncollected accounts receivable or unbilled services relating to this client.
F-38
Huron Consulting Group Inc.
On May 9, 2005, Huron Consulting Group Inc. (the “Company”) acquired 100% of the outstanding membership interests of Speltz & Weis LLC. The aggregate purchase price of the acquisition was $17.2 million, which consisted of $14.0 million cash paid at closing, notes payable totaling $3.0 million payable in three equal annual installments of $1.0 million (together with accrued interest at 4% per annum) beginning on May 8, 2006, and $0.2 million of transaction costs. Additional purchase consideration may be payable based on the performance of Speltz & Weis LLC during the three-year period beginning June 1, 2005 and ending May 30, 2008. Such amounts will be recorded as an adjustment to goodwill if payable. Also, additional payments may be made based on the amount of revenues the Company receives from certain referrals made by Speltz & Weis LLC employees. Such amounts will be recorded as an expense if payable.
The following summarizesunaudited pro forma financial information reflects the activityestimated effect of the allowance for doubtful accounts and unbilled services:acquisition of Speltz & Weis LLC by the Company.
| Balance at beginning of period | Additions charged to income | Deductions | Balance at end of period | |||||||
Period from March 19, 2002 (inception) to December 31, 2002: | ||||||||||
Allowance for doubtful accounts and unbilled services | $ | — | 841,104 | 459,351 | $ | 381,753 | ||||
Year Ended December 31, 2003: | ||||||||||
Allowance for doubtful accounts and unbilled services | $ | 381,753 | 5,334,767 | 3,924,800 | $ | 1,791,720 | ||||
The pro forma consolidated statements of income for the year ended December 31, 2004 and the six months ended June 30, 2005 combines the respective statements of the Company and Speltz & Weis LLC as if the acquisition was consummated at the beginning of the period.
These unaudited pro forma consolidated statements of income are based on the assumptions and adjustments as described in the accompanying notes and are based upon the purchase method of accounting. The Company is in the process of obtaining a third-party valuation of certain intangible assets; thus, the allocation of the purchase price is subject to refinement. The unaudited pro forma financial information should be read in conjunction with Speltz & Weis LLC’s audited financial statements and notes thereto for the year ended December 31, 2004, as well as the Company’s consolidated financial statements and notes thereto for the year ended December 31, 2004 and the six months ended June 30, 2005, which are included elsewhere in this prospectus.
The unaudited pro forma consolidated financial information is not necessarily indicative of what actually would have occurred if the acquisition had been effective for the periods presented and should not be taken as representative of our future consolidated results of operations or financial position.
F-39
Huron Consulting Group Inc.
UNAUDITED PRO FORMA CONSOLIDATED STATEMENT OF INCOME
FOR THE YEAR ENDED DECEMBER 31, 2004
(In thousands, except per share amounts)
| Company | Speltz & Weis LLC | Pro Forma Adjustments | Pro Forma Consolidated | ||||||||||||
Revenues and reimbursable expenses: | |||||||||||||||
Revenues | $ | 159,550 | $ | 19,027 | $ | 178,577 | |||||||||
Reimbursable expenses | 14,361 | 1,663 | 16,024 | ||||||||||||
Total revenues and reimbursable expenses | 173,911 | 20,690 | 194,601 | ||||||||||||
Direct costs and reimbursable expenses (exclusive of depreciation and amortization shown in operating expenses): | |||||||||||||||
Direct costs | 92,270 | 13,041 | 105,311 | ||||||||||||
Stock-based compensation | 978 | — | 978 | ||||||||||||
Intangible assets amortization | — | — | $ | 1,900 | (1) | 1,900 | |||||||||
Reimbursable expenses | 14,281 | 1,663 | 15,944 | ||||||||||||
Total direct costs and reimbursable expenses | 107,529 | 14,704 | 1,900 | 124,133 | |||||||||||
Operating expenses: | |||||||||||||||
Selling, general and administrative | 40,425 | 311 | 40,736 | ||||||||||||
Stock-based compensation | 433 | — | 433 | ||||||||||||
Depreciation and amortization | 2,365 | 7 | 418 | (1) | 2,790 | ||||||||||
Restructuring charges | 3,475 | — | 3,475 | ||||||||||||
Total operating expenses | 46,698 | 318 | 418 | 47,434 | |||||||||||
Operating income | 19,684 | 5,668 | (2,318 | ) | 23,034 | ||||||||||
Other income (expense) | (692 | ) | 16 | (120 | )(2) | (796 | ) | ||||||||
Income before provision for income taxes | 18,992 | 5,684 | (2,438 | ) | 22,238 | ||||||||||
Provision for income taxes | 8,128 | — | (1,046 | )(3) | 9,810 | ||||||||||
| 2,728 | (4) | ||||||||||||||
Net income | 10,864 | 5,684 | (4,120 | ) | 12,428 | ||||||||||
Accrued dividends on 8% preferred stock | 931 | — | — | 931 | |||||||||||
Net income attributable to common stockholders | $ | 9,933 | $ | 5,684 | $ | (4,120 | ) | $ | 11,497 | ||||||
Net income attributable to common stockholders per share: | |||||||||||||||
Basic | $ | 0.77 | $ | 0.90 | |||||||||||
Diluted | $ | 0.72 | $ | 0.84 | |||||||||||
Weighted average shares used in calculating net income attributable to common stockholders per share: | |||||||||||||||
Basic | 12,820 | 12,820 | |||||||||||||
Diluted | 13,765 | 13,765 | |||||||||||||
The accompanying notes are an integral part of the unaudited pro forma financial information.
F-40
Huron Consulting Group Inc.
UNAUDITED PRO FORMA CONSOLIDATED STATEMENT OF INCOME
FOR THE SIX MONTHS ENDED JUNE 30, 2005
(In thousands, except per share amounts)
| Company | Speltz & Weis LLC Jan. 1-May 8, 2005 | Pro Forma Adjustments | Pro Forma Consolidated | ||||||||||
Revenues and reimbursable expenses: | |||||||||||||
Revenues | $ | 97,277 | $ | 9,149 | $ | (867 | )(5) | $ | 105,559 | ||||
Reimbursable expenses | 9,061 | 907 | (122 | )(5) | 9,846 | ||||||||
Total revenues and reimbursable expenses | 106,338 | 10,056 | (989 | ) | 115,405 | ||||||||
Direct costs and reimbursable expenses (exclusive of depreciation and amortization shown in operating expenses): | |||||||||||||
Direct costs | 52,459 | 8,300 | (2,110 | )(5) | 58,649 | ||||||||
Stock-based compensation | 2,239 | — | 2,239 | ||||||||||
Intangible assets amortization | 385 | — | 957 | (1) | 1,342 | ||||||||
Reimbursable expenses | 9,091 | 904 | (122 | )(5) | 9,873 | ||||||||
Total direct costs and reimbursable expenses | 64,174 | 9,204 | (1,275 | ) | 72,103 | ||||||||
Operating expenses: | |||||||||||||
Selling, general and administrative | 22,962 | 172 | (101 | )(6) | 23,033 | ||||||||
Stock-based compensation | 867 | — | 867 | ||||||||||
Depreciation and amortization | 1,956 | 1 | 197 | (1) | 2,154 | ||||||||
Restructuring charges | — | — | — | ||||||||||
Total operating expenses | 25,785 | 173 | 96 | 26,054 | |||||||||
Operating income | 16,379 | 679 | 190 | 17,248 | |||||||||
Other income (expense) | 230 | 6 | (43 | ) | 193 | ||||||||
Income before provision for income taxes | 16,609 | 685 | 147 | 17,441 | |||||||||
Provision for income taxes | 7,125 | — | 132 | (3) | 7,586 | ||||||||
| 329 | (4) | ||||||||||||
Net income | $ | 9,484 | $ | 685 | $ | (314 | ) | $ | 9,855 | ||||
Net income attributable to common stockholders per share: | |||||||||||||
Basic | $ | 0.61 | $ | 0.63 | |||||||||
Diluted | $ | 0.57 | $ | 0.59 | |||||||||
Weighted average shares used in calculating net income attributable to common stockholders per share: | |||||||||||||
Basic | 15,597 | 15,597 | |||||||||||
Diluted | 16,725 | 16,725 | |||||||||||
The accompanying notes are an integral part of the unaudited pro forma financial information.
F-41
Notes to unaudited pro forma financial information
| 2. | In connection with the acquisition, the Company issued notes payable totaling $3.0 million payable in three equal annual installments of |
| 3. | This adjustment is to record the tax effects of the pro forma adjustments. |
14. Subsequent events (unaudited)
| 4. | This adjustment is to record an income tax provision as if Speltz & Weis LLC had filed its income tax returns on a consolidated basis with the Company. |
Restructuring charge
In March 2004, the Company incurred a $2.1 million pre-tax restructuring charge associated with the closing of two offices. The charge included approximately $2.0 million for severance payments, all of which were paid in April 2004, and an accrual of approximately $0.1 million for office lease payments, which were paid by August 31, 2004.
| 5. | This adjustment is to eliminate intercompany revenues and expenses and to reverse the bonuses paid to Speltz & Weis LLC’s employees at closing. |
Dividend
On May 12, 2004, the Company declared a special dividend on each outstanding share of Class A and Class B Common Stock and 8% preferred stock payable to holders of record on May 25, 2004. The 8% preferred stock participated on an as converted basis. The aggregate amount of the dividend totaled $1.25 million and was paid on June 29, 2004.
Line of credit
At June 30, 2004, Huron LLC was in compliance with or obtained waivers for its debt covenants.
Severance charges
In September 2004, the Company decided to eliminate a service offering of a practice area in the operational consulting segment that was not meeting its expectations. Additionally, in a continual effort to streamline operations and allocate resources more appropriately, the Company reduced headcount in certain other practice areas across both segments. In connection with these actions, the Company expects to record charges in the third quarter of 2004 of approximately $2.1 million for severance payments.
Authorized shares; reverse stock split
Prior to the consummation of the Company’s proposed initial public offering, the Company intends to amend and restate its certificate of incorporation to, among other things, increase the authorized number of shares of Class A Common Stock from 32,433,573 to 500,000,000 and Preferred Stock from 200,000 to 50,000,000 and to effect a 1 for 2.3 reverse stock split of the Company’s outstanding shares of Class A and Class B common stock. All references to share and per share amounts have been adjusted retroactively for all periods presented to reflect the foregoing.
| 6. | This adjustment is to reverse legal fees incurred by Speltz & Weis that related to the acquisition. |
F-22F-42
Part II
Information not required in prospectus
ITEM 13. OTHER EXPENSES OF ISSUANCE AND DISTRIBUTION.
The following table sets forth the costsfees and expenses, other than underwriting discounts and commissions, payable by us in connection with the sale of common stock being registered. All such fees and expenses, other than underwriting discounts and commissions, will be borne by us. All amounts, other than the SEC registration fee and the NASD filing fee, are estimates.
SEC registration fee | $ | 14,571 | $ | 13,227 | ||
NASD Filing fee | 12,000 | 11,738 | ||||
NASDAQ National Market listing fee | 100,000 | |||||
Printing and engraving expenses | 225,000 | * | ||||
Legal fees and expenses | 1,600,000 | * | ||||
Accounting fees and expenses | 800,000 | * | ||||
Transfer agent and registrar fees and expenses | 15,000 | * | ||||
Premium for directors and officers insurance | 700,000 | |||||
Miscellaneous fees and expenses | 250,000 | * | ||||
Total | $ | 3,716,571 | $ | * | ||
| * | To be completed by amendment. |
ITEM 14. INDEMNIFICATION OF DIRECTORS AND OFFICERS
Section 102 of the General Corporation Law of the State of Delaware (the “DGCL”) allows a corporation to eliminate the personal liability of directors to a corporation or its stockholders for monetary damages for a breach of a fiduciary duty as a director, except where the director breached his duty of loyalty, failed to act in good faith, engaged in intentional misconduct or knowingly violated a law, authorized the payment of a dividend or approved a stock repurchase or redemption in violation of Delaware corporate law or obtained an improper personal benefit.
Section 145 of the DGCL empowers a Delaware corporation to indemnify any person who was or is a party or is threatened to be made a party to any threatened, pending or completed action, suit or proceeding, whether civil, criminal, administrative or investigative (other than an action by or in the right of such corporation) by reason of the fact that such person is or was a director, officer, employee or agent of such corporation, or is or was serving at the request of such corporation as a director, officer, employee or agent of another corporation, partnership, joint venture, trust or other enterprise. The indemnity may include expenses (including attorneys’ fees), judgments, fines and amounts paid in settlement actually and reasonably incurred by such person in connection with such action, suit or proceeding, provided that such person acted in good faith and in a manner such person reasonably believed to be in or not opposed to the best interests of the corporation and, with respect to any criminal action or proceeding, had no reasonable cause to believe such person’sperson s conduct was unlawful. A Delaware corporation may indemnify directors, officers, employees and other agents of such corporation in an action by or in the right of a corporation under the same conditions against expenses (including attorneys’ fees) actually and reasonably incurred by the person in connection with the defense and settlement of such action or suit, except that no indemnification is permitted without judicial approval if the person to be indemnified has been adjudged to be liable to the corporation. Where a present or former director or officer of the corporation is successful on the merits or otherwise in the defense of any
II-1
Part II
action, suit or proceeding referred to above or in defense of any claim, issue or matter therein, the corporation must indemnify such person against the expenses (including attorneys’ fees) which he or she actually and reasonably incurred in connection therewith.
Section 174 of the DGCL provides, among other things, that a director who willfully or negligently approves of an unlawful payment of dividends or an unlawful stock purchase or redemption, may be held liable for such actions. A director who was either absent when the unlawful actions were approved or dissented at the time, may avoid liability by causing his or her dissent to such actions to be entered into the books containing the minutes of the meetings of the board of directors at the time such action occurred or immediately after such absent director receives notice of the unlawful acts.
The Registrant’s Certificate of Incorporation contains provisions that provide for indemnification of officers and directors and their heirs and representatives to the full extent permitted by, and in the manner permissible under, the DGCL.
As permitted by Section 102(b)(7) of the DGCL, the Registrant’s Certificate of Incorporation contains a provision eliminating the personal liability of a director to the Registrant or its stockholders for monetary damages for breach of fiduciary duty as a director, subject to some exceptions.
The Registrant maintains, at its expense, a policy of insurance which insures its directors and officers, subject to exclusions and deductions as are usual in these kinds of insurance policies, against specified liabilities which may be incurred in those capacities.
The Underwriting Agreement, contained in Exhibit 1.1 hereto, provides for indemnification by the underwriters of the Registrant, its directors and officers, HCG Holdings LLC (the selling stockholder), its directors,contains provisions indemnifying our officers and members and any person who controls the Registrant or HCG Holdings LLC within the meaningdirectors against some types of Section 15 of the Securities Act or Section 20 of the Exchange Act against certain liabilities, including liabilities under the Securities Act. The underwriting agreement also provides for similar cross-indemnification by the Registrant and HCG Holdings LLC.liabilities.
The Restricted Shares Award Agreement, contained in Exhibit 10.5, provides for cross-indemnification by the Registrant and Gary E. Holdren in connection with registration of the Registrant’s common stock on behalf of Mr. Holdren.
The Registration Rights Agreement, contained in Exhibit 10.20, provides for cross-indemnification by the Registrant and HCG Holdings LLC in connection with registration of the Registrant’s common stock on behalf of HCG Holdings LLC.
ITEM 15. RECENT SALES OF UNREGISTERED SECURITIES.
The transactions described in this Item 15 with respect to the Registrant’s Class A and Class B common stock and options exerciseable therefor give effect to a 1 for 2.3 reverse stock split of the Registrant’s Class A and Class B common stock, which will occur prior to the consummation of the offering described in the prospectus contained in this Registration Statement.
1. Between April and June 2002, in connection with our initial capitalization, we issued to HCG Holdings LLC an aggregate of 12,500 shares of our 8% preferred stock for an aggregate consideration of $12.5 million and an aggregate of approximately 25.9 million shares of our common stock at a purchase price of $0.01 per share for an aggregate consideration of approximately $0.3 million.
II-2
Part II
2. In December 2002, the Registrant issued a total of 521,740 shares of Class B common stock to Gary E. Holdren, the Registrant’s Chief Executive Officer, for aggregate consideration of $12,000.
3. Since August 2002 through September 17, 2004,inception, the Registrant has issued to officers, employees and third-party consultants options to purchase 2,102,7582,213,641 shares of Class B common stock under its incentive compensation plans adopted prior to the Registrant’s initial public offering with per share exercise prices ranging from $0.02$.02 to $1.96. The Registrant did not issue any shares of Class B common stock in respect of theseOf the options in 2002. In 2003, the Registrantgranted, 639,536 share have been issued 160,608 shares of Class B common stock upon exercise of such options for an aggregate exercise price of $3,694. In 2004 (through September 17, 2004), the Registrant issued 214,815 shares of Class B common stock upon exercise of such options for an aggregate exercise price of $37,170. As of September 17, 2004, 146,671 of these$171,147 and 318,997 options have been cancelledforfeited or forfeited and 1,580,574 remain outstanding.cancelled.
4. Since August 2002 through September 17, 2004, the Registrant has issued to officers, board members, employees and third-party consultants options to purchase 110,883 shares of Class A common stock with per share exercises prices ranging from $0.02 to $1.96. The Registrant did not issue any shares of Class A common stock in respect of these options in 2002 or 2003. In 2004 (through September 17, 2004), the Registrant has issued 4,513 shares of Class A common stock upon exercise of such options for an aggregate exercise price of $3,322. As of September 17, 2004, 16,903 of these options have been cancelled or forfeited and 89,467 remain outstanding.
II-2
Part II
The issuances of securities describeddescribe in paragraph 1 of this Item 15 were deemed to be exempt from registration under the Securities Act in reliance on Section 4(2) or Rule 701 of the Securities Act as transactions by an issuer not involving any public offering. The issuances of securities described in paragraphs 2 through 4 of this Item 15 were deemed to be exempt from registration under the Securities Act in reliance on Section 4(2) of the Securities Act and Rule 701 promulgated thereunder as offers and sales of securities pursuant to compensatory benefit plans and contracts relating to compensation.
The recipients of securities in each such transaction described in this Item 15 represented their intention to acquire the securities for investment only and not with a view to or for sale in connection with any distribution thereof and appropriate legends were affixed to the share certificates and other instruments issued in such transactions. The transactions described in this Item 15sale of these securities were made without general solicitation or advertising and no underwriter was employed in connection with any of such transactions.advertising.
ITEM 16. EXHIBITS AND FINANCIAL STATEMENT SCHEDULES.
a) The following documents are exhibits to the Registration Statement.
| Exhibit | Exhibit Description | |
| Form of Underwriting | ||
| 3.1** | Third Amended and Restated Certificate of Incorporation of Huron Consulting Group Inc. | |
| 3.2* | ||
| 4.1* | ||
| Opinion of Skadden, Arps, Slate, Meagher & Flom LLP | ||
| 10.1* | Office Lease, dated December 2003, between Union Tower, LLC and Huron Consulting Services LLC (formerly known as Huron Consulting Group LLC). | |
| 10.2* | Senior Management Agreement, effective as of May 13, 2002, between Huron Consulting Services LLC (formerly known as Huron Consulting Group LLC) and Gary E. Holdren. | |
II-3
Part II
| 10.3* | First Amendment to Senior Management Agreement between Huron Consulting Services LLC (formerly known as Huron Consulting Group LLC) and Gary E. Holdren. | |
| Second Amendment to Senior Management Agreement between Huron Consulting Services LLC (formerly known as Huron Consulting Group LLC) and Gary E. Holdren. | ||
| 10.5* | Restricted Shares Award Agreement, dated December 10, 2002, between Huron Consulting Group Inc., Huron Consulting Services LLC (formerly known as Huron Consulting Group LLC), HCG Holdings LLC and Gary E. Holdren. | |
| 10.6* | Restricted Shares Award Agreement, dated December 31, 2002, between Huron Consulting Group Inc. and Gary E. Holdren. | |
| 10.7* | Senior Management Agreement, effective as of August 12, 2002, between Huron Consulting Services LLC (formerly known as Huron Consulting Group LLC) and George E. Massaro. | |
| First Amendment to Senior Management Agreement between Huron Consulting Services LLC (formerly known as Huron Consulting Group LLC) and George E. Massaro. | ||
| 10.9* | Senior Management Agreement, effective as of May 15, 2002, between Huron Consulting Services LLC (formerly known as Huron Consulting Group LLC) and Daniel Broadhurst. | |
| First Amendment to Senior Management Agreement between Huron Consulting Services LLC (formerly known as Huron Consulting Group LLC) and Daniel Broadhurst. | ||
| 10.11* | Senior Management Agreement, effective as of May 1, 2002, between Huron Consulting Services LLC (formerly known as Huron Consulting Group LLC) and Mary Sawall. | |
II-3
Part II
| Exhibit Number | Exhibit Description | |
| First Amendment to Senior Management Agreement between Huron Consulting Services LLC (formerly known as Huron Consulting Group LLC) and Mary Sawall. | ||
| 10.13* | Huron Consulting Group Inc. 2002 Equity Incentive Plan and form of | |
| 10.14* | Amendment No. 1 to Huron Consulting Group Inc. 2002 Equity Incentive Plan. | |
| 10.15* | Amended and Restated Huron Consulting Group Inc. 2002 Equity Incentive Plan (California) and form of | |
| 10.16* | Huron Consulting Group Inc. 2003 Equity Incentive Plan and form of | |
| 10.18* | Second Amended and Restated Secured Revolving Line of Credit Note, dated February 11, 2004, between Huron Consulting Services LLC (formerly known as Huron Consulting Group LLC) and LaSalle Bank, N.A. | |
| 10.19* | Loan and Security Agreement, dated January 31, 2003, between Huron Consulting Services LLC (formerly known as Huron Consulting Group LLC) and LaSalle Bank, N.A., including amendments thereto, dated as of January 28, 2004, February 11, 2004 and May 7, 2004. | |
| 10.21** | Management rights letter agreement, dated October 12, 2004, between Huron Consulting Group Inc. and Lake Capital Partners LP. | |
| 10.22** | Senior Management Agreement, effective as of November 25, 2002, between Huron Consulting Services LLC (formerly known as Huron Consulting Group LLC) and Gary L. Burge. | |
| 10.23** | First Amendment to Senior Management Agreement between Huron Consulting Services LLC (formerly known as Huron Consulting Group LLC) and Gary L. Burge. | |
| 10.24** | Executive Officers’ Compensation for 2004 and 2005 Summary Sheet | |
| 10.25** | Directors’ Compensation for 2005 Summary Sheet | |
| 10.26** | Third Amended and Restated Secured Revolving Line of Credit Note, dated February 10, 2005, between Huron Consulting Group Inc., Huron Consulting Services LLC and LaSalle Bank, N.A. | |
| 10.27** | Amended and Restated Loan and Security Agreement between Huron Consulting Group Inc., Huron Consulting Services LLC and LaSalle Bank, N.A., dated as of February 10, 2005 | |
| 10.28 | Senior Management Agreement, effective as of May 15, 2002, between Huron Consulting Group LLC and James Rojas (filed herewith). | |
| 10.29 | First Amendment to Senior Management Agreement between Huron Consulting Group LLC and James Rojas (filed herewith). | |
| 10.30 | Senior Management Change of Control Agreement, effective as of November 2, 2004, between Huron Consulting Services LLC, Huron Consulting Group Inc. and Natalia Delgado (filed herewith). | |
| 21.1* | List of Subsidiaries of Huron Consulting Group Inc. | |
II-4
Part II
| Exhibit | Exhibit Description | |
| 23.1 | Consent of PricewaterhouseCoopers | |
| Consent of Skadden, Arps, Slate, Meagher & Flom LLP | ||
| Power of Attorney (included on signature page) | ||
| ** |
b) Financial Statement Schedules
All schedules have been omitted because the information required to be set forth in the schedules is not applicable or is shown in the consolidated financial statements or notes thereto.
| *** | Incorporated by reference to the same number exhibit filed with the Registrant’s Current Report on Form 8-K, filed with the SEC on May 10, 2005 (File No. 0-050976). |
ITEM 17. UNDERTAKINGS.
The undersigned Registrant hereby undertakes to provide to the underwriters at the closing specified in the Underwriting Agreement, certificates in such denominations and registered in such names as required by the underwriters to permit prompt delivery to each purchaser.
Insofar as indemnification for liabilities arising under the Securities Act may be permitted to directors, officers and controlling persons of the Registrant pursuant to the foregoing provisions, or otherwise, the Registrant has been advised that in the opinion of the Securities and Exchange CommissionSEC such indemnification is against public policy as expressed in the Securities Act and is, therefore, unenforceable. In the event that a claim for indemnification against such liabilities (other than the payment by the Registrant of expenses incurred or paid by a director, officer or controlling person of the Registrant in the successful defense of any action, suit or proceeding) is asserted by such director, officer or controlling person in connection with the securities being registered, the Registrant will, unless in the opinion of its counsel the matter has been settled by controlling precedent, submit to a court of appropriate jurisdiction the question whether such indemnification by it is against public policy as expressed in the Securities Act and will be governed by the final adjudication of such issue.
The undersigned Registrant hereby undertakes that:
(1) For purposes of determining any liability under the Securities Act, the information omitted from the form of prospectus filed as part of this Registration Statement in reliance upon Rule 430A and contained in a form of prospectus filed by the Registrant pursuant to Rule 424(b)(1) or (4) or 497(h) under the Securities Act shall be deemed to be part of this Registration Statement as of the time it was declared effective.
(2) For the purpose of determining any liability under the Securities Act, each post-effective amendment that contains a form of prospectus shall be deemed to be a new Registration Statement relating to the securities offered therein, and the offering of such securities at that time shall be deemed to be the initial bona fide offering thereof.
II-5
Part II
SIGNATURESSignatures
Pursuant to the requirements of the Securities Act of 1933, the Registrant has duly caused this Amendment No. 4 to Registration Statement to be signed on its behalf by the undersigned, thereunto duly authorized, in the City of Chicago, State of Illinois, on September 27, 2004.August 29, 2005.
HURON CONSULTING GROUP INC. | ||
By: | /S/ GARY E. HOLDREN | |
Name: | Gary E. Holdren | |
Title: | President and Chief Executive Officer | |
POWER OF ATTORNEY
We, the undersigned directors and officers of Huron Consulting Group Inc., a Delaware corporation, do hereby constitute and appoint Gary L. Burge and Natalia Delgado, and each of them, our true and lawful attorney-in-fact and agent, to do any and all acts and things in our names and on our behalf in our capacities as directors and officers and to execute any and all instruments for us and in our name in the capacities indicated below, which said attorney and agent may deem necessary or advisable to enable said Registrant to comply with the Securities Act of 1933 and any rules, regulations and requirements of the Securities and Exchange Commission, in connection with the registration statements, or any registration statement for this offering that is to be effective upon filing pursuant to Rule 462 under the Securities Act of 1933, including specifically, but without limitation, power and authority to sign for us or any of us in our names in the capacities indicated below, any and all amendments (including post-effective amendments) hereof; and we do hereby ratify and confirm all that said attorneys and agents shall do or cause to be done by virtue thereof.
Pursuant to the requirements of the Securities Act of 1933, this Amendment No. 4 to Registration Statement has been signed by the following persons in the capacities indicated below on September 27, 2004.August 29, 2005.
| Signature | Title | |
/S/ GARY E. HOLDREN Gary E. Holdren |
( | |
George E. Massaro |
| |
/S/ GARY L. BURGE Gary L. Burge | Vice President, Chief Financial Officer and Treasurer ( | |
DuBose Ausley | Director | |
/S/
| Director | |
/S/ JAMES D. EDWARDS James D. Edwards | Director | |
/S/ JOHN MCCARTNEY John McCartney | Director | |
/S/ PAUL G. YOVOVICH Paul G. Yovovich | Director | |
II-6
Exhibit indexIndex
| Exhibit | Exhibit Description | |
| | Form of Underwriting | |
| | ||
| 3.1** | Third Amended and Restated Certificate of Incorporation of Huron Consulting Group Inc. | |
| 3.2* | ||
| 4.1* | ||
| | Opinion of Skadden, Arps, Slate, Meagher & Flom LLP | |
| 10.1* | Office Lease, dated December 2003, between Union Tower, LLC and Huron Consulting Services LLC (formerly known as Huron Consulting Group LLC). | |
| 10.2* | Senior Management Agreement, effective as of May 13, 2002, between Huron Consulting Services LLC (formerly known as Huron Consulting Group LLC) and Gary E. Holdren. | |
| 10.3* | First Amendment to Senior Management Agreement between Huron Consulting Services LLC (formerly known as Huron Consulting Group LLC) and Gary E. Holdren. | |
| Second Amendment to Senior Management Agreement between Huron Consulting Services LLC (formerly known as Huron Consulting Group LLC) and Gary E. Holdren. | ||
| 10.5* | Restricted Shares Award Agreement, dated December 10, 2002, between Huron Consulting Group Inc., Huron Consulting Services LLC (formerly known as Huron Consulting Group LLC), HCG Holdings LLC and Gary E. Holdren. | |
| 10.6* | Restricted Shares Award Agreement, dated December 31, 2002, between Huron Consulting Group Inc. and Gary E. Holdren. | |
| 10.7* | Senior Management Agreement, effective as of August 12, 2002, between Huron Consulting Services LLC (formerly known as Huron Consulting Group LLC) and George E. Massaro. | |
| First Amendment to Senior Management Agreement between Huron Consulting Services LLC (formerly known as Huron Consulting Group LLC) and George E. Massaro. | ||
| 10.9* | Senior Management Agreement, effective as of May 15, 2002, between Huron Consulting Services LLC (formerly known as Huron Consulting Group LLC) and Daniel Broadhurst. | |
| First Amendment to Senior Management Agreement between Huron Consulting Services LLC (formerly known as Huron Consulting Group LLC) and Daniel Broadhurst. | ||
| 10.11* | Senior Management Agreement, effective as of May 1, 2002, between Huron Consulting Services LLC (formerly known as Huron Consulting Group LLC) and Mary Sawall. | |
| First Amendment to Senior Management Agreement between Huron Consulting Services LLC (formerly known as Huron Consulting Group LLC) and Mary Sawall. | ||
| 10.13* | Huron Consulting Group Inc. 2002 Equity Incentive Plan and form of | |
| 10.14* | Amendment No. 1 to Huron Consulting Group Inc. 2002 Equity Incentive Plan. | |
| 10.15* | Amended and Restated Huron Consulting Group Inc. 2002 Equity Incentive Plan (California) and form of |
| 10.16* | Huron Consulting Group Inc. 2003 Equity Incentive Plan and form of |
1
| Exhibit Number | ||
| 10.17* | Huron Consulting Group Inc. 2004 Omnibus Stock Plan and form of option and restricted stock agreement thereunder. | |
| 10.18* | Second Amended and Restated Secured Revolving Line of Credit Note, dated February 11, 2004, between Huron Consulting Services LLC (formerly known as Huron Consulting Group LLC) and LaSalle Bank, N.A. | |
| 10.19* | Loan and Security Agreement, dated January 31, 2003, between Huron Consulting Services LLC (formerly known as Huron Consulting Group LLC) and LaSalle Bank, N.A., including amendments thereto, dated as of January 28, 2004, February 11, 2004 and May 7, 2004. | |
| 10.22** | Senior Management Agreement, effective as of November 25, 2002, between Huron Consulting Services LLC (formerly known as Huron Consulting Group LLC) and Gary L. Burge (filed herewith). | |
| 10.23** | First Amendment to Senior Management Agreement between Huron Consulting Services LLC (formerly known as Huron Consulting Group LLC) and Gary L. Burge (filed herewith). | |
| 10.24** | Executive Officers’ Compensation for 2004 and 2005 Summary Sheet | |
| 10.25** | Directors’ Compensation for 2005 Summary Sheet | |
| 10.26** | Third Amended and Restated Secured Revolving Line of Credit Note, dated February 10, 2005, between Huron Consulting Group Inc., Huron Consulting Services LLC and LaSalle Bank, N.A. | |
| 10.27** | Amended and Restated Loan and Security Agreement between Huron Consulting Group Inc., Huron Consulting Services LLC and LaSalle Bank, N.A., dated as of February 10, 2005 | |
| 10.28 | Senior Management Agreement, effective as of May 15, 2002, between Huron Consulting Group LLC and James Rojas (filed herewith). | |
| 10.29 | First Amendment to Senior Management Agreement between Huron Consulting Group LLC and James Rojas (filed herewith). | |
| 10.30 | Senior Management Change of Control Agreement, effective as of November 2, 2004, between Huron Consulting Services LLC, Huron Consulting Group Inc. and Natalia Delgado (filed herewith). | |
| 21.1* | List of Subsidiaries of Huron Consulting Group Inc. | |
| 23.1 | Consent of PricewaterhouseCoopers | |
| Consent of Skadden, Arps, Slate, Meagher & Flom LLP | ||
| Power of Attorney (included on signature page) | ||
| To be filed by amendment. |
| * | Incorporated by reference to the same number exhibit filed with the Registrant’s Registration Statement on Form S-1 (File No. 333-115434). |
| ** |
| *** | Incorporated by reference to the same number exhibit filed with the Registrant’s Current Report on Form 8-K, filed with the SEC on May 10, 2005 (File No. 0-050976). |
2