

As filed with the Securities and Exchange Commission on September 4, 2008May 25, 2011
Registration No. 333-152397333-
UNITED STATES SECURITIES AND EXCHANGE COMMISSION
WASHINGTON, D.C. 20549
AMENDMENT NO. 1 TO
FORM S-1
REGISTRATION STATEMENT
UNDER
THE SECURITIES ACT OF 1933
REXNORD HOLDINGS, INC.CORPORATION
(Exact name of registrant as specified in its charter)
| Delaware | 3560 | 20-5197013 | ||
(State or Other Jurisdiction of Incorporation or Organization) | (Primary Standard Industrial Classification Code Number) | (IRS Employer Identification No.) |
Rexnord Holdings, Inc.
4701 West Greenfield Avenue
Milwaukee, WI 53214
(414) 643-3000
(Address, including zip code, and telephone number, including area code, of Registrant’sregistrant’s principal executive offices)
Robert A. HittPatricia M. Whaley
Vice President, General Counsel and Chief Executive OfficerSecretary
Rexnord Holdings, Inc.Corporation
4701 West Greenfield Avenue
Milwaukee, WI 53214
(414) 643-3000
(Name, address, including zip code, and telephone number, including area code, of agent for service)
Copies to:
O’Melveny & Myers LLP 7 Times Square New York, New York 10036 (212) 326-2000 |
Quarles & Brady LLP
(414) 277-5000 |
New York, New York (212) |
Approximate date of commencement of proposed sale to the public: As soon as practicable after the effective date of this registration statement.
If any of the securities being registered on this Form are to be offered on a delayed or continuous basis pursuant to Rule 415 under the Securities Act of 1933, check the following box. ¨
If this Form is filed to register additional securities for an offering pursuant to Rule 462(b) under the Securities Act, check the following box and list the Securities Act registration statement number of the earlier effective registration statement for the same offering. ¨
If this Form is a post-effective amendment filed pursuant to Rule 462(c) under the Securities Act, check the following box and list the Securities Act registration statement number of the earlier effective registration statement for the same offering. ¨
If this Form is a post-effective amendment filed pursuant to Rule 462(d) under the Securities Act, check the following box and list the Securities Act registration statement number of the earlier effective registration statement for the same offering. ¨
Indicate by check mark whether the registrant is a large accelerated filer, an accelerated filer, a non-accelerated filer, or a smaller reporting company. See the definitions of “large accelerated filer,” “accelerated filer” and “smaller reporting company” in Rule 12b-2 of the Exchange Act.
Large accelerated filer | ¨ | Accelerated filer | ¨ | |||
| Non-accelerated filer (Do not check if a smaller reporting company) | x | Smaller reporting company | ¨ | |||
CALCULATION OF REGISTRATION FEE
| Title of each Class of Securities to be Registered | Proposed Maximum Aggregate Offering Price (a) (b) | Amount of Registration Fee (c) | Title of each Class of Securities to be Registered | Proposed Maximum Aggregate Offering Price (a)(b) | Amount of Registration Fee (c) | |||||||
Common stock, $0.01 par value per share | $ | 750,000,000 | $ | 29,475 | Common stock, $0.01 par value per share | $700,000,000 | $81,270 | |||||
| (a) | Estimated solely for the purpose of calculating the registration fee in accordance with Rule 457(o) promulgated under the Securities Act of 1933. |
| (b) | Including shares of common stock which may be purchased by the underwriters to cover over-allotments, if any. |
| (c) | Previously paid $29,475 by wire transfer on July 9, 2008 in connection with the Registrant’s Form S-1, Registration No. 333-152397 filed on July 18, 2008. |
The Registrantregistrant hereby amends this registration statement on such date or dates as may be necessary to delay its effective date until the Registrantregistrant shall file a further amendment which specifically states that this registration statement shall thereafter become effective in accordance with Section 8(a) of the Securities Act of 1933, or until the registration statement shall become effective on such date as the Commission, acting pursuant to said Section 8(a), may determine.
The information in this prospectus is not complete and may be changed. We may not sell these securities until the registration statement filed with the Securities and Exchange Commission is effective. This prospectus is not an offer to sell these securities, and it iswe are not soliciting an offer to buy these securities in any state where the offer or sale is not permitted.
Subject to Completion
Preliminary Prospectus dated September 4, 2008May 25, 2011
PROSPECTUS
Shares
Rexnord Holdings, Inc.Corporation
Common Stock
This is Rexnord Holdings, Inc.’sCorporation’s initial public offering. Rexnord Holdings, Inc.Corporation is selling all of the shares being offered hereby.
We expect the public offering price to be between $ and $ per share. Currently, no public market exists for our common stock. We intend to apply to list our common stock on the New York Stock Exchange under the symbol “RXN.” Following the public offering, Rexnord Holdings, Inc. will remain a “controlled company” as defined under the New York Stock Exchange listing rules, and Apollo Management, L.P. and its affiliates will beneficially own % of its outstanding shares of common stock assuming the underwriters do not exercise their over-allotment option.
Investing in our common stock involves risks that are described in the “Risk Factors” section beginning on page 1816 of this prospectus.
| Per Share | Total | |||||||
Public offering price | $ | $ | ||||||
Underwriting | $ | $ | ||||||
Proceeds, before expenses, to Rexnord | $ | $ | ||||||
The underwriters may also purchase up to an additional shares from Rexnord Holdings, Inc.us at the public offering price, less the underwriting discount, within 30 days from the date of this prospectus to cover over-allotments.
The shares will be ready for delivery on or about , 2008.2011.
Neither the Securities and Exchange Commission nor any state securities commission has approved or disapproved of these securities or determined if this prospectus is truthful or complete. Any representation to the contrary is a criminal offense.
The date of this prospectus is , 2011.
TABLE OF CONTENTS
| ||||
| ||||
| ||||
|
|
| ||||
The date of this prospectus is , 2008.
| 1 | ||||
| 16 | ||||
| 32 | ||||
| 34 | ||||
| 35 | ||||
| 36 | ||||
| 38 | ||||
| 40 | |||
| 42 | ||||
| 59 | ||||
| 77 | ||||
| 83 | |||
| 100 | ||||
| 102 | |||
| 105 | ||||
| 109 | ||||
| 115 | ||||
| 117 | |||
| 120 | ||||
| 125 | ||||
| 125 | ||||
| 125 |
You should rely only on the information contained in this prospectus or to which we have referred you. We have not authorized any other person to provide you with different information. If anyone provides you with different or inconsistent information, you should not rely on it. We are not making an offer to sell these securities in any jurisdiction where the offer or sale is not permitted. You should assume that the information appearing in this prospectus is accurate only as of the date on the front cover of this prospectus. Our business, financial condition, results of operations and prospects may have changed since that date.
Dealer Prospectus Delivery Obligations
Until , 2008,2011 (25 days after the date of this prospectus), all dealers that effect transactions in these securities, whether or not participating in this offering, may be required to deliver a prospectus. This is in addition to the dealer’sdealers’ obligation to deliver a prospectus when acting as an underwriter and with respect to their unsold allotments or subscriptions.
i
MARKET AND INDUSTRY DATA AND FORECASTS
This prospectus includes estimates ofindustry data that we obtained from periodic industry publications and internal company surveys. This prospectus includes market share and industry data and forecasts that we obtained fromprepared primarily based on management’s knowledge of the industry publications and surveys and internal company sources.industry data. Industry publications and surveys and forecasts generally state that the information contained therein has been obtained from sources believed to be reliable, but there can be no assurance as to the accuracy or completeness of included information. We have not independently verified any of the data from third-party sources, nor have we ascertained the underlying economic assumptions relied upon therein.reliable. Unless otherwise noted, all information regardingstatements as to our market share isand market position relative to our competitors are approximated and based on management estimates using the latest marketabove-mentioned latest-available third-party data currently availableand our internal analyses and estimates.
i
While we are not aware of any misstatements regarding any industry data presented herein, our estimates, in particular as they relate to us, and all market share data isand our general expectations, involve risks and uncertainties and are subject to change based on net salesvarious factors, including those discussed under “Risk Factors,” “Cautionary Notice Regarding Forward-Looking Statements” and “Management’s Discussion and Analysis of Financial Condition and Results of Operations” in the applicable market.this prospectus.
TRADEMARKS
The following terms used in this prospectus are our power transmissionProcess & Motion Control trademarks: Falk® Rexnord®, Rex®, Falk™Prager™, MBRenew®, DuralonFlatTop™, Steelflex®, Thomas®, Omega®, Viva®, Wrapflex®, Lifelign®, True Torque®, Addax®, Shafer®, PSI®, Cartriseal®, Planetgear™, Drive One®, Steelflex®, Lifelign®, A+Plus®, Stearns®, Berg® and Highfield®, Prager™, Renew®, Stephan™, Wrapflex®, True Torque®, Freedom™, ModulFlex™, TableTop®, Mat Top®, RexnordAutogard®. The following terms used in this prospectus are our water managementWater Management trademarks: Zurn®, Wilkins®, Aquaflush®, AquaspecAquaSense®, AquaVantage®, Zurn One®, Zurn One Systems®, AquasenseEcoVantage®, AquavantageHydroVantage™, AquaSpec®, Aquavantage AV®, Ecovantage®, ChecktronicRodney Hunt® , Cam-Seal®, Zurn PEX®, Flo Thru®, Hi-Cap®, Pressure-Tru®, Aqua-Gard®, Golden Anderson™ and Rodney HuntFontaine®. All other trademarks appearing in this prospectus are the property of their holders.
ii
The following summary highlights information contained elsewhere in this prospectus and is qualified in its entirety by the more detailed information and consolidated financial statements included elsewhere in this prospectus. This summary is not complete and may not contain all of the information that may be important to you. You should read the entire prospectus, including the “Risk Factors” section and our consolidated financial statements and notes to those statements, before making an investment decision.
On July 21, 2006 (the “Merger Date”), affiliates of Apollo Management, L.P. (“Apollo”), George M. Sherman and certain members of management acquired RBS Global, Inc. (“RBS Global”) through the merger of Chase Merger Sub, Inc., an indirect, wholly-owned subsidiary of an Apollo affiliate, Rexnord Holdings, Inc. (“Rexnord Holdings”), with and into RBS Global (the “Merger”), and RBS Global became an indirect, wholly-owned subsidiary of Rexnord Holdings. Unless otherwise noted, “Rexnord,” “we,” “us,” “our” and the “Company” mean Rexnord Corporation (formerly known as Rexnord Holdings, Inc.) and its predecessors and consolidated subsidiaries, including RBS Global, Inc. (“RBS Global”) and Rexnord LLC, and “Rexnord Holdings”Corporation” means Rexnord Holdings, Inc.Corporation and its predecessors but not its subsidiaries. As used in this prospectus, “fiscal year” refers to our fiscal year ending March 31 of the corresponding calendar year (for example, “fiscal year 2008”2011” or “fiscal 2008”2011” means the period from April 1, 20072010 to March 31, 2008)2011).
Unless otherwise indicated, the information contained in this prospectus assumes that (i) the underwriters’ over-allotment option iswill not be exercised, (ii) the number of our authorized shares of capital stock iswill have been increased to shares of common stock and shares of preferred stock pursuant to our amended and restated certificate of incorporation, and (iii) each share of common stock then outstanding isimmediately prior to the for one stock split will have been split into shares of common stock.
Our Company
We believe we areRexnord is a leading, globalgrowth-oriented, multi-platform industrial company strategically positioned withinwith what we believe are leading market shares and highly trusted brands that serve a diverse array of global end-markets. Our heritage of innovation and specification have allowed us to provide highly engineered, mission critical solutions to customers for decades and affords us the marketsprivilege of having long-term, valued relationships with market leaders. We operate our company in a disciplined way and industries we serve. Currently,the Rexnord Business System (“RBS”) is our business is comprisedoperating philosophy. Grounded in the spirit of two strategic platforms: (i) Power Transmission, which produces gears, couplings, industrial bearings, aerospace bearingscontinuous improvement, RBS creates a scalable, process-based framework that focuses on driving superior customer satisfaction and seals, flattop, special components and industrial chain and conveying equipment, and (ii) Water Management, which produces professional grade specification plumbing, water treatment and waste water control products. financial results by targeting world-class operating performance throughout all aspects of our business.
Our strategy is to build the Company around multi-billion dollar,multiple, global strategic platforms that participate in end marketsend-markets with above averagesustainable growth characteristics where we are, or have the opportunity to become, the industry leader. We have successfully completeda track record of acquiring and integrated several acquisitionsintegrating companies and expect to continue to pursue strategic acquisitions within our existing platforms that will expand our geographic presence, broaden our product lines and allow us to move into adjacent markets. Over time, we anticipate adding additional strategic platforms to our Company. Currently, our business is comprised of two platforms, Process & Motion Control and Water Management.
We believe that we have one of the broadest portfolios of highly engineered, mission and project critical Process & Motion Control products in the industrial and aerospace end-markets. Our Process & Motion Control product portfolio includes gears, couplings, industrial bearings, aerospace bearings and seals, FlatTop™ modular belting, engineered chain and conveying equipment. Our Water Management platform is a leader in the multi-billion dollar, specification-driven, non-residential construction market for water management products. Through recent acquisitions, we have gained entry into the municipal water and wastewater treatment markets. Our Water Management product portfolio includes professional grade specification drainage products, flush valves and faucet products, backflow prevention pressure release valves, Pex piping and engineered valves and gates for the water and wastewater treatment market.
1
Our products are generally “specified” or requested by end-users across both of our strategic platforms as a result of their reliable performance in demanding environments, our custom application engineering capabilities and our ability to provide global customer support. Typically, our Process & Motion Control products are initially incorporated into products sold by original equipment manufacturers (“OEMs”) or sold to end-users as critical components in large, complex systems where the cost of failure or downtime is high and thereafter replaced through industrial distributors as they are consumed or require replacement.
The demand for our Water Management products is primarily driven by new infrastructure, the retro-fit of existing structures to make them more energy and water efficient, commercial construction and, to a lesser extent, residential construction. We believe we have become a market leader in the industry by meeting the stringent third party regulatory, building and plumbing code requirements and subsequently achieving specification of our products into projects and applications.
We are led by an experienced, high caliberhigh-caliber management team that employs RBS as a proven operating system, the Rexnord Business System, or RBS, modeled after the Danaher Business System of the Danaher Corporation. RBS was established by George Sherman, our Non-Executive Chairman of the Board and the former CEO of the Danaher Corporation from 1990 to 2001. RBS is designedphilosophy to drive excellence and world class performance in all aspects of our business by focusing on customer satisfaction or the “Voice of the Customer,” while seekingCustomer” process and ensuring superior customer satisfaction. Our global footprint encompasses 36 principal Process & Motion Control manufacturing, warehouse and repair facilities located around the world and 23 principal Water Management manufacturing and warehouse facilities which allow us to continuously improvemeet the needs of our growth, quality, delivery and cost.increasingly global customer base as well as our distribution channel partners.
We believe we have a sustainable competitive advantage in both of our platforms as a result of the following attributes:
We are a leading designer, manufacturer and marketer of highly-engineered, end userend-user and/or third-party specified products that are missionmission- or project-critical for applications where the cost of failure or downtime is high;high or there is a requirement to provide and enhance water quality, safety, flow control and conservation.
We believe our portfolio includes premier and widely known brands in the Power TransmissionProcess & Motion Control and Water Management markets in which we participate, as well as one of the broadest and most extensive product offerings;offerings.
We estimate that over 85% of our total net sales come from products in which we have leading market share positions;positions.
We believe we have established a sustainable revenue profile. Within our Process & Motion Control platform, we have an extensive installed base of our products that provides us the opportunity to capture significant, recurring aftermarket revenues at attractive margins as a result of a “like-for-like” replacement dynamic;dynamic. Within our Water Management platform, we pursue the retrofit of existing structures to improve water conservation and efficiency, thereby reducing our exposure to the new construction cycle.
We have extensive distribution networks in both of our platforms – platforms—in Power TransmissionProcess & Motion Control, we have over 4002,600 distributor customers with nearly 2,500 brancheslocations serving our customers globally and, in Water Management, we have more than 5501,100 independent sales representatives across approximately 170210 sales agencies that work directly with our in-house technical team to drive specification of our products.
Our global footprint encompasses 28 Power Transmission manufacturing, four Power Transmission repair facilities located around the world, 21 Water Management manufacturing and warehouse facilities in North America and an engineering and sourcing center in Zhuhai, China, which allow us to meet the needs of our increasingly global customer base as well as our distribution channel partners. We employ approximately 7,4006,300 employees andacross 59 locations around the world. For the fiscal year ended March 31, 2011, we generated net sales of $1.9$1.7 billion, income from operations of $219.1 million and a net loss of $51.3 million. Fiscal 2011 results reflect the effect of a $100.8 million loss on debt extinguishment recorded during the year as a result of the early repayment of debt pursuant to cash tender offers. We generated net sales of $1.5 billion, income from operations of $161.4 million and net income of $0.3$88.1 million for the fiscal year ended March 31, 20082010. Fiscal 2010 results reflect the effect of a $167.8 million gain on debt extinguishment recorded during the year as a result of a repurchase and net salesextinguishment of $496.1 milliondebt and a debt exchange offer.
2
In addition to net income of $0.2 million for the three months ended June 28, 2008. We had(loss), we believe Adjusted EBITDA (as defined on page 14is an important measure under “Summary Historicalour senior secured credit facilities, as our ability to incur certain types of acquisition debt or subordinated debt, make certain types of acquisitions or asset exchanges, operate our business and Unaudited Financial and Other Data”)make dividends or other distributions, all of $389.6 million forwhich will impact our financial performance, is impacted by our Adjusted EBITDA, as our lenders measure our performance by comparing the twelve months ended June 28, 2008, and net income for the same twelve-month periodratio of $7.9 million.our senior secured bank debt to our Adjusted EBITDA. Adjusted EBITDA for the twelve months ended June 28, 2008 includes: $6.8 million of pro forma adjustments to give full year effect toMarch 31, 2011 was $335.7 million. For the acquisition of GA on Januarytwelve months ended March 31, 2008 and $8.3 million of out of period business interruption recoveries that relate to fiscal 2007 but are required to be reported in the period the proceeds were received, which was fiscal 2008. For a description of why we believe2010, Adjusted EBITDA is important to an understandingwas $285.0 million. For more information on these and other adjustments and the limitations of our performance,Adjusted EBITDA, see footnote 7“Management’s Discussion and Analysis of “Summary HistoricalFinancial Condition and Unaudited Financial and Other Data.Results of Operations—Covenant Compliance.”
Our Strategic Platforms
An overview of our two existing strategic platforms is outlined below:
Power TransmissionProcess & Motion Control
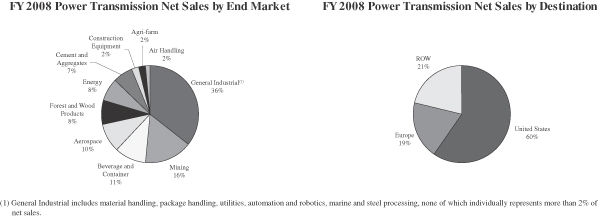
Our Power Transmission productsProcess & Motion Control platform designs, manufactures, markets and services specified, highly-engineered mechanical components used within complex systems where our customers’ reliability requirements and cost of failure or downtime is high. The Process & Motion Control product portfolio includes gears, couplings, industrial bearings, aerospace bearings and seals, FlatTop™ modular belting, engineered chain and conveying equipment and are marketed and sold globally under several brands, such asincluding Rexnord®, Rex®, Falk™® and Link-Belt®. We sell our Power TransmissionProcess & Motion Control products into a diverse group of attractive end market industries. Over the past several years, both our customer base, as well as many of our end markets have grown faster than the underlying economic growth in the United States. Our international net sales (as measured on a destination basis) have grown from 34% of Power Transmission net sales in fiscal 2006 to 40% in fiscal 2008.end-markets, including mining, general industrial applications, cement and aggregate, agriculture, forest and wood products, petrochemical, energy, food and beverage, aerospace and wind energy.
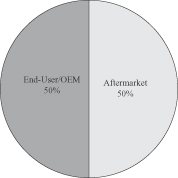
FY2011 Process & Motion Control Net Sales by End-Market | FY2011 Process & Motion Control Net Sales End-User/OEM vs. Aftermarket | |
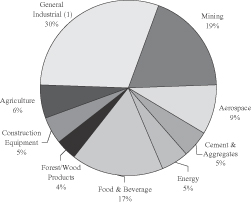 |  |
| (1) | General Industrial includes, but is not limited to, material handling, package handling, utilities, automation and robotics, marine and steel processing, none of which individually represented more than 2% of fiscal 2011 net sales. |
Set forth below are our Power Transmission net sales for fiscal 2008 by end market and by geographic destination:
Over the past century, weWe have established long-term relationships with original equipment manufacturers, or OEMs and end usersend-users serving a wide variety of industries. As a result of our long-term relationshiprelationships with OEMs and end users,end-users, we have created a significant installed base for our Power TransmissionProcess & Motion Control products, which are consumed or worn out in use and have a relatively predictable replacement cycle. We believe this replacement dynamic drives recurring aftermarket demand for our products through our distribution customers, which weproducts. We estimate account forthat approximately 45%50% of our North American Power TransmissionProcess & Motion Control net sales.sales are to distributors, who primarily serve the end-user/OEM aftermarket demand for our products.
3
Most of our products are critical components in large scale manufacturing processes, where the cost of component failure and resulting down-time is high. We believe our reputation for superior quality, productsapplication expertise and our ability to meet lead times as short as one daytime expectations are highly valued by our customers, as demonstrated by their strong preference to replace their worn Rexnord products forwith new Rexnord products, or “like-for-like” product replacements. We believe this replacement dynamic for our customers’ preference to replace “like-for-like” products, combined with our significant installed base, enables us to achieve premium pricing, generategenerates a source of recurring revenue and provides us with a competitive advantage. We believe the majority of our products are purchased by customers as part of their regular maintenance budgetsbudget, and in many cases do not represent significant capital expenditures.
Water Management
Our Water Management platform designs, procures, manufactures and markets products that provide and enhance water quality, safety, flow control and conservation. The Water Management product portfolio includes professional grade specification drainage products, flush valves and faucet products, engineered valves and gates for the water and wastewater treatment market and Pex piping and are marketed and sold through widely recognized brand names, including Zurn®, Wilkins®, Aquaflush®, Aquasense®, Aquavantage®, Zurn One Systems®, Ecovantage®, Aquaspec®, Zurn PEX®, Checktronic® , Cam-Seal®, Rodney Hunt® and Golden Anderson™Fontaine®.
Set forth below are our Water Management net sales for fiscal 2008 by end market:
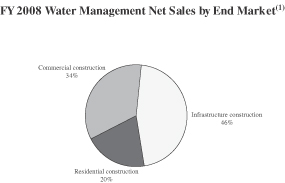
Over the past century, we believethe businesses that comprise our Water Management platform hashave established itselfthemselves as an innovatorinnovators and leading designer, manufacturerdesigners, manufacturers and distributordistributors of highly engineered water products and solutions that deliver water conservation, safety & hygiene,control the flow, delivery, treatment and control & comfort. The demand for our Water Management productsconservation of water to the infrastructure construction (which is primarily driven by new infrastructure,comprised of various segments, including those identified as “Water Supply and Treatment” in the chart below), commercial construction and, to a lesser extent, the residential construction.
construction end-markets. Segments of the infrastructure end marketend-market include: municipal water and wastewater, transportation, government, health care and education. Segments of the commercial construction end marketend-market include: lodging, retail, dining, sports arenas, and warehouse/office. In addition to our broader growth strategy, we believe there is a significant opportunityThe demand for future growth in our Water Management platformproducts is primarily driven by sellingnew infrastructure, the retro-fit of existing structures to make them more energy and distributingwater efficient, commercial construction and, to a number of our products into the expanding renovation and repair market.lesser extent, residential construction.
FY2011 Water Management Net Sales by End-Market | FY2011 Water Management Net Sales New Construction vs. Retrofit | |
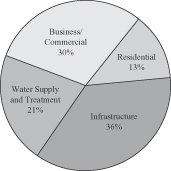 | 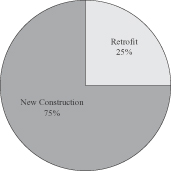 |
Our Water Management products are principally specification-driven and project-critical and typically account forrepresent a low percentage of the overall project cost. We believe these characteristics, coupled with our extensive distribution network, create a high level of end-user loyalty for our products and allow us to maintain leading market shares in the majority of our product lines andlines. We believe we have become a market leader in the industry by meeting the stringent third party regulatory, building and plumbing code requirements and subsequently achieving specification of our products into projects and applications. The majority of these stringent testing and regulatory
Through
4
approval processes are completed through the University of Southern California (“USC”), the International Association of Plumbing and Mechanical Codes (“IAPMO”), the National Sanitation Foundation (“NSF”), the Underwriters Laboratories (“UL”), Factory Mutual (“FM”), or the American Waterworks Association (“AWWA”), prior to the commercialization of our products.
Our Water Management platform has an extensive network of more than 550approximately 1,100 independent sales representatives across 170approximately 210 sales agencies in North America we maintain high product availability for our customers andwho work closely together with local engineers, contractors, builders and architects to specify, or “spec in”,“spec-in,” our Water Management products for use in construction projects. ItApproximately 85% of our Water Management platform net sales come from products that are specified for use in projects by engineers, contractors, owners or architects. Specifically, it has been our experience that, once an architect, engineer, contractor builder or architectowner has specified our productsproduct with satisfactory results, theythat person will generally continue to use our products in future projects. We derive approximately 80%The inclusion of our Water Management platform net sales from “spec-in” products and believe that the combination of our “spec-in” business model, our extensive distribution network andwith project specifications, combined with our ability to innovate, engineer and deliver superior quality products and systems that save time and money for engineers, contractors, builders and architects, has resulted in growing demand for our Water Management products andproducts. Our distribution model is predicated upon maintaining high product availability near our customers. We believe that this model provides us with a sustainable competitive advantage.advantage as we are able to meet our customer demand with local inventory at significantly reduced lead times as compared to others in our industry.
Our Markets
We evaluate our competitive position in our markets based upon the markets we serve.on available market data, relevant benchmarks compared to our relative peer group and industry trends. We generally do not participate in segments of our served markets that are thought of as commodities or in applications that do not require differentiation based on product quality, reliability and innovation. In both of our platforms, we believe the end marketsend-markets we serve span a broad and diverse array of commercial and industrial end marketsend-markets with solid fundamental long-term growth characteristics.
Power TransmissionProcess & Motion Control Market
According to Industrial Market Information, Inc.,Within the North American Power Transmissionoverall Process & Motion Control market, generates approximately $103 billion in annual net sales. Of this overall estimated Power Transmission market,we estimate that the relevant or servedaddressable North American market for our current product offerings is approximately $5$5.0 billion in net sales per year. Globally, we estimate our servedaddressable market to be approximately $12$12.0 billion in net sales per year. The Power Transmission market for Process & Motion Control products is relativelyvery fragmented with most participants having single or limited product lines and serving specific geographic markets. While there are numerous competitors with limited product offerings, there are only a few national and international competitors of a size comparable to us. While we compete with certain domestic and international competitors across a portion of our product lines, we do not believe that any one competitor directly competes with us on all of our product lines. The industry’s customer base is broadly diversified across many sectors of the economy. We believe that growth in the Power TransmissionProcess & Motion Control market is closely tied to overall growth in industrial production,
which fundamentally, we believe has significant long-term growth fundamentals.potential. In addition, we believe that Power TransmissionProcess & Motion Control manufacturers who innovate to meet the changes in customer demands and focus on higher growth end marketsend-markets can grow at rates faster than overall U.S.United States industrial production.
Our Power Transmission products are generally critical components in the machinery or plant in which they operate, yet they typically account for a low percentage of an end user’s total production cost. We believe, because the costs associated with Power Transmission product failure to the end user can be substantial, end users in most of the markets we serve focus on Power Transmission products with superior quality, reliability and availability, rather than considering price alone, when making a purchasing decision.
The Power TransmissionProcess & Motion Control market is also characterized by the need for sophisticated engineering experience, the ability to produce a broad number of niche products with very little lead time and long-standing customer relationships. We believe entry into our markets by competitors with lower labor costs, including foreign competitors, will be limited due to the fact that we manufacture highly specialized niche products that are critical components in large scale manufacturing processes, where the cost of component failure and resulting downtime is high. In addition, we believe there is an industry trend of customers increasingly consolidating their vendor bases, which we believe should allow suppliers with broader product offerings, like us, to capture additional market share.
5
Water Management Market
According toWithin the U.S. Census Bureau, U.S. non-residential construction expenditures were approximately $637.5 billion in 2007. Weoverall Water Management market, we estimate that the relevantaddressable North American market within U.S. non-residential construction for all of our Water Managementcurrent product offerings is approximately $4.5 billion.
$2.3 billion in net sales per year. Globally, we estimate our addressable market to be approximately $3.0 billion in net sales per year. We believe the segmentmarkets in which our Water Management platform participates isare relatively fragmented and that most of our competitors offer more limited product lines. While we compete with certain of our competitors across a portionbroad range of industries and product lines. Although competition exists across all of our product lines,Water Management businesses, we do not believe that any one competitor directly competes with us across all of our product lines. We believe that, by focusing our efforts and resources towards end-markets that have above average growth characteristics, we can continue to grow our platform at rates above the growth rate of the overall market and the growth rate of our competition.
We believe the areas of the water managementWater Management industry in which we compete are tied to growth in infrastructure and commercial construction, which we believe have significant long-term growth fundamentals. Historically, the infrastructure and commercial construction industry has been more stable and less vulnerable to down-cycles than the residential construction industry. Compared to residential construction cycles, downturns in infrastructure and commercial construction have been shorter and less severe, than in residential construction, and upturns have lasted longer and had higher peaks in terms of spending as well as units and square footage. In addition, through successful new product innovation, we believe that water management manufacturers are able to grow at a faster pace than the broader infrastructure and commercial construction markets, as well as mitigate downturns in the cycle.
The Water management products tend to be project-critical, highly engineered and high value-add and typically are a low percentage of overall project cost. We believe the combination of these features creates a high level of end user loyalty. Demand for these products is influenced by regulatory, building and plumbing code requirements. Many water management products must be tested and approved by the University of Southern California (“USC”), the National Sanitation Foundation (“NSF”) or the American Waterworks Association (“AWWA”) before they may be sold. In addition, many of these products must meet detailed specifications set by water management engineers, contractors, builders and architects.
The water managementManagement industry’s specification-driven end marketsend-markets require manufacturers to work closely with engineers, contractors, builders and architects in local markets across the United States to design specific applications on a project-by-project basis. As a result, building and maintaining a network of relationships with architects, engineers, contractors builders and architectsbuilders who specify or “spec-in” products for use in construction projects and having the flexibility in design and product innovation isare critical to compete effectively.effectively in the market. Companies with a strong network of such relationships have a competitive advantage. Specifically, it has been our experience that, once an engineer, contractor, builder or architect has specified our product with satisfactory results, that person often will continue to use our products in future projects.
Our Competitive Strengths
Key characteristics of our business that we believe provide us with a competitive advantage and position us for future growth include the following:
The Rexnord Business System.We manageoperate our company within a managementdisciplined way. The Rexnord Business System is our operating philosophy we call RBS.and it creates a scalable, process-based framework that focuses on driving superior customer satisfaction and financial results by targeting world-class operating performance. RBS is based on the following principles: (1) a culture that embraces Kaizen, the Japanese philosophy of continuous improvement; (2) strategy deployment—a long-term strategic planning process that determines annual improvement priorities and the actions necessary to achieve those priorities; (2) measuring our performance based on customer satisfaction, or the “Voice of the Customer;” (3) involvement of all of our associates in the execution of our strategy; and (4) developinga culture that embraces Kaizen, the Japanese philosophy of continuous improvement. We believe applying RBS can yield superior growth, quality, delivery and resourcing “break-throughs”—potential new products or other initiatives that drive organic sales growth opportunities;cost positions relative to our competition, resulting in enhanced profitability and (5) measuring our performance based on “Voiceultimately the creation of the Customer.”stockholder value. As we have applied RBS over the past fiveseveral years, we have experienced significant improvements in growth, productivity, cost reduction and asset efficiency and believe there are substantial opportunities to continue to improve our performance as we continue to apply RBS.
Experienced, High-Caliber Management Team. Our management team is led by Bob Hitt,Todd Adams, President and Chief Executive Officer and Director.Officer. George Sherman, our Non-Executive Chairman of the Board and, formerfrom 1990 to 2001, the CEO of the Danaher Corporation, from 1990 to 2001, oversees thiscollaborates with the management team and plays a key role in establishingto establish the strategic
6
direction of the Company. Other members of the management team include Todd Adams, SeniorMichael Shapiro, Vice President and Chief Financial Officer, Praveen Jeyarajah, Executive Vice President—Corporate and Business Development and George Moore, Executive Vice President, and Alex P. Marini, who became the President of our Water Management Group upon completion of the Zurn acquisition and previously served as the President and Chief Executive Officer for Jacuzzi Brands, Inc. (“JBI”).President. We believe the overall talent level within our organization is a competitive strength, and we have added a number of experienced key managers across our platforms over the past several years. George M.Mr. Sherman and the management team currently maintain a significant equity investment in the Company. As of March 31, 2008,2011, their ownership interest represented approximately 20% of our common stock on a fully diluted basis.
Strong Financial Performance and Free Cash Flow.Since implementing RBS, we have established a solid track-record of delivering strong financial performance measured in terms of net sales growth, margin expansion and free cash flow conversion (cash flow from operations less capital expenditures compared to net income). Since fiscal 2004, net sales have grown at a compound annual growth rate or CAGR, of 27%13% inclusive of acquisitions, and Adjusted EBITDA margins (Adjusted EBITDA divided by net sales) have expanded to 20.6%19.8%. Additionally, we have consistently delivered strong free cash flow over the past fiveseveral years by improving working capital performance and reducingmaintaining capital expenditures through productivity and capacity improvements.at reasonable levels. By continually focusing on improving our overall operating performance and free cash flow conversion, we believe we can create substantial long-term shareholderstockholder value by using our cash flows to manage our leverage, as well as to drive growth through acquisitions over time.
Leading Market Positions in Diversified End Markets.End-Markets.Our high-margin performance is driven by industry leading positions in the diversified end marketsend-markets in which we compete. We estimate that greater than 85% of our net sales are derived from products in which we have leading market share positions. We believe we have achieved leadership positions in these markets because ofthrough our focus on customer satisfaction, extensive offering of quality products, ability to service our customers globally, positive brand perception, highly engineered product lines, extensive specification workefforts and market/application experience. We serve a diverse set of end marketsend-markets with our largest single end market,end-market, mining, accounting for 11%13% of consolidated net sales in fiscal 2008.2011.
Broad Portfolio of Highly Engineered, Specification-Driven Products.We believe we offer one of the broadest portfolios of highly engineered, specification-driven, project-critical products in the end marketsend-markets we serve. Our array of product applications, knowledge and expertise applied across our extensive portfolio of products allows us to work closely with our customers to design and develop solutions tailored to their individual specifications. Within our Water Management platform, our representatives work directly with engineers,
contractors, builders and architects to “spec-in” our Water Management products early in the design phase of a project. We have found that once these customers have specified a company’s product with satisfactory results, they will generally use that company’s products in future projects. Furthermore, we believe our strong application engineering and new product development capabilities have contributed to our reputation as an innovator in each of our end markets.end-markets.
Large Installed Base, Extensive Distribution Network and Strong Aftermarket Revenues.Over the past century we have established relationships with OEMs and end users servingend-users across a wide varietydiverse group of Power Transmission industries,end-markets, creating a significant installed base for our Power TransmissionProcess & Motion Control products. This installed base generates significant aftermarket sales for us, becauseas our Power TransmissionProcess & Motion Control products are consumed in use and must be replaced in relatively predictable cycles. In order to provide our customers with superior service, we have cultivated relationships with over 400 distributors worldwide who sell Power Transmission products through nearly 2,500 branches. This distribution network is essential to2,600 distributor locations serving our success in meeting lead times as short as one day. We believe our installed Power Transmission base, end user preference and product line breadth make our product portfolio an attractive package to distributors in the Power Transmission industry.customers globally. Our Water Management platform has 2123 manufacturing and warehouse facilities and uses approximately 7090 third-party distribution facilities at which it maintains inventory. This broad distribution network provides us with a competitive advantage and drives demand for our Water Management products by allowing quick delivery of project-critical Water Management products to our customers facing short lead times. In addition, we believe this extensive distribution network also provides us with an opportunity to capitalize on the expanding renovation and repair market as building owners begin to upgrade existing commercial and institutional bathroom fixtures with high efficiency systems.
7
Significant Experience Identifying and Integrating Strategic Acquisitions.We have successfully completed and integrated several acquisitions from May 2005 to the presentin recent years totaling more than $1.3 billion of total transaction value.value, including our $942.5 million acquisition of Zurn. These strategic acquisitions have allowed us to establish and expand our Water Management platform, widen our geographic presence, broaden our product lines and, in other instances, to move into adjacent markets. In the past three fiscal years,Since 2005, we have completed four strategic acquisitions that have significantly expanded our Power TransmissionProcess & Motion Control platform and established and expanded our Water Management platform. TheseWe believe these acquisitions have created significant shareholderstockholder value through the implementation of RBS operating principles, which has resulted in identifying and achieving cost synergies, as well as driving growth and operational and working capital improvements.
Our Business Strategy
We strive to create shareholderstockholder value by seeking to deliver sales growth, profitability and asset efficiency, which we believe will result in upper quartilesuperior financial performance and free cash flow generation when compared to other leading multi-platform industrial companies by driving the following key strategies:
Continue to Apply the Rexnord Business System. The core of our business strategy is to continue to apply RBS to strive for world class performance in quality, delivery and cost throughout our platforms. We believe that as we pursue world class performance throughout all aspects of our business and listen to the “Voice of the Customer,” we can deliver significant organic net sales growth, continued margin expansion and significant free cash flow generation while improving customer satisfaction.
Drive Profitable Growth. Our key growth strategies are:
| • | Accelerate Growth in Key Vertical |
| • | Product Innovation and Resourcing “Break-throughs”—We intend to continue to invest in strong application engineering and new product development capabilities |
| • | Drive Specification for Our Products—We intend to increase our installed base and grow aftermarket revenues by continuing to partner with OEMs to specify our |
| • | Expand Internationally—We believe there is substantial growth potential outside the United States for many of our existing products by expanding distribution, further penetrating key vertical |
| • | Pursue Strategic Acquisitions—We believe the fragmented nature of our |
Platform Focused Strategies. We intend to build our business around leadership positions in platforms that participate in multi-billion dollar, global, growing end markets.end-markets. Within our two existing platforms, we expect to continue to leverage our overall market presence and competitive position to provide further growth and diversification and increase our market share.
Acquisition History
8
The Rexnord Business System.We have successfully completed and integrated several acquisitions and expect to continue to pursue strategic acquisitions insideoperate our existing platforms to expand our geographic presence, broaden our product lines or allow us to move into adjacent markets. In the past three fiscal years we have completed four acquisitions that have significantly expanded our Power Transmission platform and established our Water Management platform. In May 2005, whilecompany in a disciplined way through the Rexnord companies were still ownedBusiness System. RBS is our operating philosophy and it creates a scalable, process-based framework that focuses on driving superior customer satisfaction and financial results by targeting world-class operating performance. We believe applying RBS can yield superior growth, quality, delivery and cost positions relative to our competition, resulting in enhanced profitability and ultimately the creation of stockholder value.
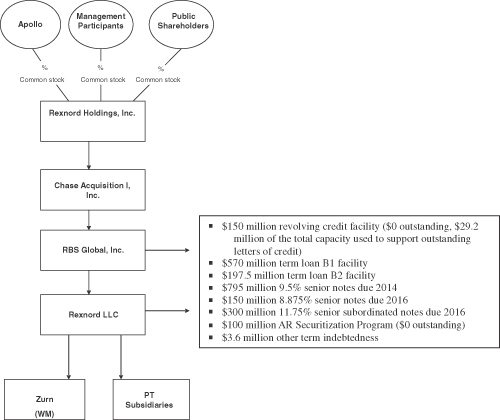
Our Ownership Structure
The Carlyle Group, Rexnord LLC acquired Falk for approximately $300 million. Falk significantly enhancedchart below is a summary of our position as a leading manufacturerorganizational structure after giving effect to this offering and the redemption and prepayment of highly engineered Power Transmission products. By combiningall of our leadership positions in flattop chain, industrial bearings, non-lubricated couplings and industrial chain with Falk’s complementary leadership positions in gears and lubricated couplings, as well as a growing gear repair business, the Falk acquisition resulted in a comprehensive, market-leading product portfolio that we believePIK toggle senior indebtedness, which is expected to be one of the broadestcompleted in the Power Transmission industry. Our Power Transmission group also acquiredfirst quarter of fiscal 2012 as described in “Capitalization.” Unless otherwise indicated, the Dalong Chain Company, located in China, in May 2006 for approximately $6 million. The acquisitionindebtedness information below is as of Dalong has provided us manufacturing capabilities in Asia with respect to flattop chain, conveying equipment and industrial chain. In February 2007, approximately seven months after Apollo acquired the Rexnord companies from The Carlyle Group in the Merger, we established our Water Management platform through the acquisition of Zurn for approximately $940 million. Zurn is a leader in the multi-billion dollar non-residential construction and replacement market for plumbing fixtures and fittings. Zurn designs and manufactures plumbing products used in industrial and commercial construction, renovation and facilities maintenance markets in North America and holds a leading market position across most of its businesses. Our Water Management platform was then expanded through ourMarch 31, 2011.
| (1) | Includes investment funds affiliated with, or co-investment vehicles managed by, Apollo Management VI, L.P., an affiliate of Apollo Management, L.P., which, as of March 31, 2011, collectively beneficially owned 93.8% of our common stock, with the balance beneficially owned by the management stockholders. |
| (2) | As of March 31, 2011, $761.5 million was outstanding. |
| (3) | As of March 31, 2011, $1,147.0 million was outstanding. |
| (4) | As of March 31, 2011, $300.0 million was outstanding. We intend to use a portion of the proceeds of this offering to redeem $300.0 million in principal amount of the 11.75% senior subordinated notes due 2016. |
| (5) | As of March 31, 2011, $12.4 million was outstanding. Primarily consists of foreign borrowings and capitalized lease obligations. |
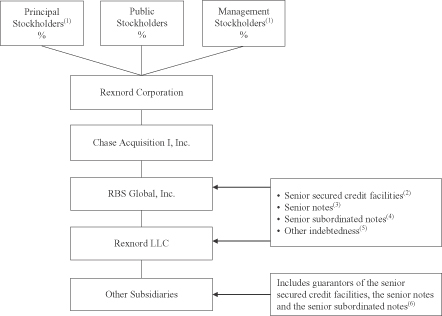
| (6) | Guarantors of the senior secured credit facilities, the senior notes and the senior subordinated notes include substantially all of the domestic operating subsidiaries of RBS Global as of the date of this prospectus other than Rexnord LLC, which is a co-issuer of the notes, but do not include any of its foreign subsidiaries. |
9
acquisition of GA Industries, Inc. in January 2008 for approximately $74 million. This acquisition expanded our Water Management platform into the water and wastewater markets, specifically in municipal, hydropower and industrial environments.
Our Principal StockholderStockholders
Our principal stockholders are investment funds affiliated with, or co-investment vehicles managed by, Apollo Management L.P., including Apollo Investment Fund VI, L.P., an affiliate of Apollo Management, L.P., which we collectively refer to herein as “Apollo” (unless the context otherwise indicates) and which prior to this offering collectively beneficially own 93.7%owned 93.8% of our common stock and will beneficially own % or shares of our common stock after this offering, assuming the underwriters do not exercise their over-allotment option. Apollo Investment Fund VI, L.P., which is the sole member of one of our principal stockholders, is an investment fund with committed capital, along with its co-investment affiliates, of over $11approximately $10.1 billion. Apollo Management, L.P., is an affiliate of Apollo Global Management, LLC, a leading global alternative asset manager with offices in New York, Los Angeles, London, Frankfurt, ParisLuxembourg, Singapore, Hong Kong and Singapore.Mumbai. As of March 31, 2011, Apollo Global Management, LLC hasand its subsidiaries have assets under management in excess of $40approximately $70 billion in private equity, hedge funds, distressed debt and mezzanine funds invested across a core group of industries where Apollo Global Management, LLC has considerable knowledge and resources.
We currently have a management consulting agreement with Apollo for advisory and consulting services. Since entering into the agreement through March 31, 2008, we have paid or accrued $4.4 million in fees plus out-of-pocket expenses under the agreement, which Apollo intends to terminate upon completion of this offering. Upon termination of the agreement, Apollo will receive $20.0 million. Apollo also currently holds a portion of our PIK toggle senior indebtedness due 2013, which we intend to repay with a portion of the proceeds of this offering. As of the date of this prospectus, Apollo and its affiliates held approximately $40.0 million of this PIK toggle senior indebtedness. See “Related Party Transactions” for more detail regarding our arrangements with Apollo.
Risk Factors
Investing in our common stock involves substantial risk. Our ability to execute our strategy is also is subject to certain risks. The risks described under the heading “Risk Factors” immediately following this summary may cause us not to realize the full benefits of our strengths or may cause us to be unable to successfully execute all or part of our strategy. These risks include, among others:
Our substantial indebtedness could have a material adverse effect on our operations, which could prevent us from satisfying our debt obligations and have a material adverse effect on the value of our common stock. Our business may not generate sufficient cash flow from operations to meet our debt service and other obligations, and currently anticipated cost savings and operating improvements may not be realized on schedule, or at all.
Our business and financial performance depend on general economic conditions and other market factors beyond our control. Any sustained weakness in demand or downturn or uncertainty in the economy generally would materially reduce our net sales and profitability.
We face significant competition from numerous companies both on the international and national level.levels. Some of our competitors have achieved substantially more market penetration in certain of the markets in which we operate, and some of our competitors have greater financial and other resources than we do. We cannot provide assurance that we will be able to maintain or increase the current market share of our products successfully in the future.
Our business depends on general economic conditions and other market factors beyond our control. Our financial performance depends, in large part, on conditions in the markets that we serve in the U.S. and the global economy generally. Any sustained weakness in demand or downturn or uncertainty in the economy generally would materially reduce our net sales and profitability.
Some of the industries we serve are highly cyclical, such as the aerospace, energy and industrial equipment industries. Any declines in commercial, institutional or residential construction starts or demand for replacement building and home improvement products may impact us in a material adverse manner, and there can be no assurance that any such adverse effects would not continue for a prolonged period of time.
|
If any of the foregoing risks or the risks described under the heading “Risk Factors” were to occur, you may lose part or all of your investment. You should carefully consider all the information in this prospectus, including matters set forth under the heading “Risk Factors” on page 16 before making an investment decision.
Corporate Structure
The following diagram sets forth our corporate structure and pro forma indebtedness assuming that we had completed this offering and used a portion of the net proceeds to repay Rexnord Holdings’ indebtedness on June 28, 2008.
Additional Information
Rexnord HoldingsCorporation is a Delaware corporation. Our principal executive offices are located at 4701 West Greenfield Avenue, Milwaukee, Wisconsin 53214. Our telephone number is (414) 643-3000. Our website is located at www.rexnord.com; however, the information on our website is not part of this document, and you should rely only on the information contained in this document and the documents to which we refer you.
11
The Offering
Issuer | Rexnord |
Common stock offered by us | shares. |
Common stock to be outstanding immediately after the offering | shares. |
Underwriters’ option to purchase additional shares of common stock in this offering | We have granted to the underwriters a 30-day option to purchase up to additional shares |
Common stock voting rights | Each share of our common stock will entitle its holder to one vote. |
Dividend policy | We currently intend to retain all future earnings, if any, for use in the operation of our business and to fund future growth. |
Use of proceeds | We estimate that our net proceeds from this offering |
NYSE symbol | “ |
Risk factors | You should carefully read and consider the information set forth under “Risk Factors” beginning on page 16 of this prospectus and all other information set forth in this prospectus before deciding to invest in our common stock. |
12
Except as otherwise indicated, all of the information in this prospectus assumes:
a for one stock split described below has been completed;
no exercise of the underwriters’ over-allotment option to purchase up to additional shares of common stock to cover over-allotments of shares;
thean initial offering price of $ per share, the midpoint of the range set forth on the cover page of this prospectus; and
our amended and restated certificate of incorporation and amended and restated bylaws are in effect, pursuant to which the provisions described under “Description of Capital Stock” will become operative.
Prior to completion of this offering, we will effect a stock split whereby holders of our outstanding shares of common stock will receive shares of common stock for each share they currently hold. The number of shares of common stock to be outstanding after completion of this offering is based on shares of our common stock to be sold in this offering and, except where we state otherwise, the information with respect to our common stock we present in this prospectus:
does not give effect to shares of our common stock issuable upon the exercise of outstanding options as of , 2008,2011, at a weighted-average exercise price of $ per share; and
does not give effect to shares of common stock reserved for future issuance under the Rexnord HoldingsCorporation’s 2006 Stock Option Plan.
13
Summary Historical and Unaudited Financial and Other Data
The summary historical financial data for the fiscal years ended March 31, 2006, 20072009, 2010 and 20082011 have been derived from our consolidated financial statements and related notes thereto which have been audited by Ernst & Young LLP, an independent registered public accounting firm and are included elsewhere in this prospectus. The summary historical financial data for the three months ended June 30, 2007 and June 28, 2008 have been derived from our unaudited consolidated financial statements included elsewhere in this prospectus. Results for the three months ended June 30, 2007 and June 28, 2008 are not necessarily indicative of the results that may be expected for the entire year. The period from April 1, 2006 to July 21, 2006 includes the accounts of RBS Global prior to the Merger. The period from July 22, 2006 to March 31, 2007 includes the accounts of RBS Global after the Merger. The two periods account for our fiscal year ended March 31, 2007. We refer to the financial statements prior to the Merger as “Predecessor.”
The following data should be read in conjunction with “Risk Factors,” “Selected Financial Information,” “Management’s Discussion and Analysis of Financial Condition and Results of Operations” and our consolidated financial statements and related notes thereto included elsewhere in this prospectus.
| Predecessor (1) | Successor | |||||||||||||||||||||||||
| Year Ended March 31, 2006 (2) | Period from April 1, 2006 through July 21, 2006 | Period from July 22, 2006 through March 31, 2007 (3) | Year Ended March 31, 2008 (4) | Three Months Ended June 30, 2007 | Three Months Ended June 28, 2008 | |||||||||||||||||||||
| (in millions, except per share amounts) | ||||||||||||||||||||||||||
Statement of Operations Data: | ||||||||||||||||||||||||||
Net sales | $ | 1,081.4 | $ | 334.2 | $ | 921.5 | $ | 1,853.5 | $ | 448.2 | $ | 496.1 | ||||||||||||||
Cost of sales (5) | 742.3 | 237.7 | 628.2 | 1,250.4 | 306.2 | 334.2 | ||||||||||||||||||||
Gross profit | 339.1 | 96.5 | 293.3 | 603.1 | 142.0 | 161.9 | ||||||||||||||||||||
Selling, general and administrative expenses | 187.8 | 63.1 | 159.3 | 312.2 | 78.1 | 86.1 | ||||||||||||||||||||
Restructuring and other similar costs | 31.1 | — | — | — | — | — | ||||||||||||||||||||
Curtailment gain | — | — | — | — | — | — | ||||||||||||||||||||
Loss on divestiture | — | — | — | 11.2 | — | — | ||||||||||||||||||||
(Gain) on Canal Street accident, net | — | — | (6.0 | ) | (29.2 | ) | (8.1 | ) | — | |||||||||||||||||
Transaction-related costs | — | 62.7 | — | — | — | — | ||||||||||||||||||||
Amortization of intangible assets | 15.7 | 5.0 | 26.9 | 49.9 | 12.9 | 12.5 | ||||||||||||||||||||
Income (loss) from operations | 104.5 | (34.3 | ) | 113.1 | 259.0 | 59.1 | 63.3 | |||||||||||||||||||
Non-operating income (expense): | ||||||||||||||||||||||||||
Interest expense, net (6) | (61.5 | ) | (21.0 | ) | (109.8 | ) | (254.3 | ) | (64.1 | ) | (58.2 | ) | ||||||||||||||
Other income (expense), net | (3.8 | ) | (0.4 | ) | 5.7 | (5.3 | ) | (2.9 | ) | (2.2 | ) | |||||||||||||||
Income (loss) before income taxes | 39.2 | (55.7 | ) | 9.0 | (0.6 | ) | (7.9 | ) | 2.9 | |||||||||||||||||
Provision (benefit) for income taxes | 16.3 | (16.1 | ) | 9.2 | (0.9 | ) | (0.5 | ) | 2.7 | |||||||||||||||||
Net income (loss) | $ | 22.9 | $ | (39.6 | ) | $ | (0.2 | ) | $ | 0.3 | $ | (7.4 | ) | $ | 0.2 | |||||||||||
(dollars in millions) | Year Ended March 31, 2009 (1)(2) | Year Ended March 31, 2010 (1) | Year Ended March 31, 2011 | |||||||||
Statement of Operations: | ||||||||||||
Net Sales | $ | 1,882.0 | $ | 1,510.0 | $ | 1,699.6 | ||||||
Cost of Sales | 1,290.1 | 994.4 | 1,102.8 | |||||||||
Gross Profit | 591.9 | 515.6 | 596.8 | |||||||||
Selling, General and Administrative Expenses | 467.8 | 297.7 | 329.1 | |||||||||
Intangible Impairment Charges | 422.0 | — | — | |||||||||
Restructuring and Other Similar Costs | 24.5 | 6.8 | — | |||||||||
Amortization of Intangible Assets | 48.9 | 49.7 | 48.6 | |||||||||
(Loss) Income from Operations | (371.3 | ) | 161.4 | 219.1 | ||||||||
Non-Operating Income (Expense): | ||||||||||||
Interest Expense, net | (230.4 | ) | (194.2 | ) | (180.8 | ) | ||||||
Gain (Loss) on debt extinguishment | 103.7 | 167.8 | (100.8 | ) | ||||||||
Other (Expense) Income, net | (3.0 | ) | (16.4 | ) | 1.1 | |||||||
(Loss) Income Before Income Taxes | (501.0 | ) | 118.6 | (61.4 | ) | |||||||
(Benefit) Provision for Income Taxes | (72.0 | ) | 30.5 | (10.1 | ) | |||||||
Net (Loss) Income | $ | (429.0 | ) | $ | 88.1 | $ | (51.3 | ) | ||||
Other Data: | ||||||||||||
Net Cash (Used for) Provided by: | ||||||||||||
Operating Activities | 155.0 | 155.5 | 164.5 | |||||||||
Investing Activities | (54.5 | ) | (22.0 | ) | (35.5 | ) | ||||||
Financing Activities | 36.6 | (161.5 | ) | (6.9 | ) | |||||||
Depreciation and Amortization of Intangible Assets | 109.6 | 109.3 | 106.1 | |||||||||
Capital Expenditures | 39.1 | 22.0 | 37.6 | |||||||||
14
| Predecessor (1) | Successor | |||||||||||||||||||||
| Year Ended March 31, 2006 (2) | Period from April 1, 2006 through July 21, 2006 | Period from July 22, 2006 through March 31, 2007 (3) | Year Ended March 31, 2008 (4) | Three Months Ended June 30, 2007 | Three Months Ended June 28, 2008 | |||||||||||||||||
| (in millions, except per share amounts) | ||||||||||||||||||||||
Net income (loss) per share: | ||||||||||||||||||||||
Basic | ||||||||||||||||||||||
Diluted | ||||||||||||||||||||||
Weighted-average number of shares outstanding: | ||||||||||||||||||||||
Basic | ||||||||||||||||||||||
Effect of dilutive stock options | ||||||||||||||||||||||
Diluted | ||||||||||||||||||||||
Other Data: | ||||||||||||||||||||||
Net cash provided by (used for): | ||||||||||||||||||||||
Operating activities | 91.9 | (4.4 | ) | 63.4 | 232.7 | 33.1 | 19.0 | |||||||||||||||
Investing activities | (336.1 | ) | (15.7 | ) | (1,925.5 | ) | (121.6 | ) | (8.3 | ) | (10.1 | ) | ||||||||||
Financing activities | 240.6 | 8.2 | 1,909.0 | (15.6 | ) | (12.4 | ) | (0.1 | ) | |||||||||||||
Depreciation and amortization of intangible assets | 58.7 | 19.0 | 63.0 | 104.1 | 27.0 | 27.1 | ||||||||||||||||
Capital expenditures | 37.1 | 11.7 | 28.0 | 54.9 | 8.3 | 11.0 | ||||||||||||||||
| Twelve Months Ended June 28, 2008 | ||||||||||||||||||||||
Adjusted EBITDA (7) | $ | 389.6 | ||||||||||||||||||||
| As of June 28, 2008 | ||||||||||||||||||||||
| Actual (4) | As Adjusted (10) | |||||||||||||||||||||
Balance Sheet Data: | ||||||||||||||||||||||
Cash | $ | 165.5 | $ | |||||||||||||||||||
Working capital (8) | 476.3 | |||||||||||||||||||||
Total assets | 3,839.0 | |||||||||||||||||||||
Total debt (9) | 2,550.1 | |||||||||||||||||||||
Stockholders’ equity | 280.8 | |||||||||||||||||||||
| March 31 | ||||||||||||
(dollars in millions) | 2009 | 2010 | 2011 | |||||||||
Balance Sheet Data: | ||||||||||||
Cash and Cash Equivalents | $ | 287.9 | $ | 263.9 | $ | 391.0 | ||||||
Working Capital (3) | 555.2 | 481.9 | 483.6 | |||||||||
Total Assets | 3,218.8 | 3,016.5 | 3,099.7 | |||||||||
Total Debt (4) | 2,526.1 | 2,215.5 | 2,314.1 | |||||||||
Stockholders’ Equity (Deficit) | (177.8 | ) | (57.5 | ) | (88.2 | ) | ||||||
| (1) | Financial data for fiscal 2009 and 2010 has been adjusted for our voluntary change in accounting for actuarial gains and losses related to our pension and other postretirement benefit plans. See Note 2 to our audited consolidated financial statements included elsewhere in this prospectus. |
| (2) | Consolidated financial data as of and for |
| (in millions) | Three Months Ended June 30, 2007 | Year Ended March 31, 2008 | Three Months Ended June 28, 2008 | Twelve Months Ended June 28, 2008 | ||||||||||
Net income | $ | (7.4 | ) | $ | 0.3 | $ | 0.2 | $ | 7.9 | |||||
Interest expense, net | 64.1 | 254.3 | 58.2 | 248.4 | ||||||||||
Provision (benefit) for income taxes | (0.5 | ) | (0.9 | ) | 2.7 | 2.3 | ||||||||
Depreciation and amortization | 27.0 | 104.1 | 27.1 | 104.2 | ||||||||||
EBITDA | $ | 83.2 | $ | 357.8 | $ | 88.2 | $ | 362.8 | ||||||
| (in millions) | Three Months Ended June 30, 2007 | Year Ended March 31, 2008 | Three Months Ended June 28, 2008 | Twelve Months Ended June 28, 2008 | ||||||||
Adjustments to EBITDA: | ||||||||||||
(Gain) on Canal Street facility accident, net | (8.1 | ) | (29.2 | ) | — | (21.1 | ) | |||||
Business interruption insurance recoveries related to fiscal 2008 (a) | 2.5 | 2.8 | — | 0.3 | ||||||||
Loss on divestiture (b) | — | 11.2 | — | 11.2 | ||||||||
Stock option expense | 1.8 | 7.4 | 1.8 | 7.4 | ||||||||
Impact of inventory fair value adjustment (c) | 19.0 | 20.0 | 1.6 | 2.6 | ||||||||
LIFO income (d) | (14.3 | ) | (9.5 | ) | 1.9 | 6.7 | ||||||
CDSOA recovery (e) | — | (1.4 | ) | — | (1.4 | ) | ||||||
Other expense, net (f) | 2.9 | 6.7 | 2.2 | 6.0 | ||||||||
Subtotal (g) | $ | 374.5 | ||||||||||
Other senior secured facility adjustments: | ||||||||||||
Business interruption insurance recoveries related to fiscal 2007 (h) | — | 8.3 | — | 8.3 | ||||||||
Pro forma adjustments to give full year effect to the acquisition of GA (i) | 1.8 | 8.6 | — | 6.8 | ||||||||
Adjusted EBITDA | $ | 389.6 | ||||||||||
| Three Months Ended June 30, 2007 | Year Ended March 31, 2008 | Three Months Ended June 28, 2008 | Twelve Months Ended June 28, 2008 | |||||||||||||
Management fee expense | $ | 0.8 | $ | 3.0 | $ | 0.8 | $ | 3.0 | ||||||||
Losses on sales of fixed assets | 0.1 | 0.3 | 0.3 | 0.5 | ||||||||||||
Foreign currency transaction losses | 2.5 | 5.1 | 1.1 | 3.7 | ||||||||||||
Equity in earnings of unconsolidated subsidiaries | (0.2 | ) | (1.1 | ) | 0.2 | (0.7 | ) | |||||||||
Miscellaneous income | (0.3 | ) | (0.6 | ) | (0.2 | ) | (0.5 | ) | ||||||||
| $ | 2.9 | $ | 6.7 | $ | 2.2 | $ | 6.0 | |||||||||
| Represents total current assets less total current liabilities. |
| Total debt represents long-term debt plus the current portion of long-term debt. |
In addition to net (loss) income, we believe Adjusted EBITDA is an important measure under our senior secured credit facilities, as our ability to incur certain types of acquisition debt or subordinated debt, make certain types of acquisitions or asset exchanges, operate our business and make dividends or other distributions, all of which will impact our financial performance, is impacted by our Adjusted EBITDA, as our lenders measure our performance by comparing the ratio of our net senior secured bank debt to our Adjusted EBITDA. We reported Adjusted EBITDA of $335.7 million in fiscal 2011. See “Management’s Discussion and Analysis of Financial Condition and Results of Operations—Covenant Compliance.”
15
Investing in our common stock involves a high degree of risk. You should carefully consider the risk factors set forth below as well as the other information contained in this prospectus before investing in our common stock. The risks described below are not the only risks facing us. Additional risks and uncertainties not currently known to us or those we currently view to be immaterial may also materially and adversely affect our business, financial condition, results of operations or cash flows. Any of the following risks could materially and adversely affect our business, financial condition, results of operations or cash flows. In such a case, you may lose part or all of your original investment.
Risks Related to Our Business
Our substantial leverage exposes us to interest rate risk andindebtedness could adversely affect our ability to raise additional capital to fund our operations, limit our ability to react to changes in the economy or our industry and prevent us from meeting our obligations under our indebtedness.making debt service payments.
We are a highly leveraged company. As of March 31, 2008 and June 28, 2008 we had $2,536.8 million and $2,550.1 million of outstanding indebtedness, respectively, and our fiscal 2009 debt service payment obligations at March 31, 2008 were $175.2 million (including approximately $125.1 million of debt service on fixed rate obligations). Interest on our PIK Toggle senior indebtedness is currently paid in kind and this interest is not included in the debt service payment obligations. As of June 28, 2008, after giving pro forma effect to this offering and the use of the net proceeds therefrom, we would have had $2,024.1 million of outstanding indebtedness. Our ability to generate sufficient cash flow from operations to make scheduled payments on our debt will depend on a range of economic, competitive and business factors, many of which are outside our control. Our business may not generate sufficient cash flow from operations to meet our debt service and other obligations, and currently anticipated cost savings and operating improvements may not be realized on schedule, or at all. If we are unable to meet our expenses and debt service and other obligations, we may need to refinance all or a portion of our indebtedness on or before maturity, sell assets or raise equity. Furthermore, Apollo has no obligation to provide us with debt or equity financing and we therefore may be unable to generate sufficient cash to service all of our indebtedness. We may not be able to refinance any of our indebtedness, sell assets or raise equity on commercially reasonable terms or at all, which could cause us to default on our obligations and impair our liquidity. Our inability to generate sufficient cash flow to satisfy our debt obligations or to refinance our obligations on commercially reasonable terms would have a material adverse effect on our business, financial condition, results of operations or cash flows.
Our substantial indebtedness could also have other important consequences with respect to our ability to manage our business successfully, including the following:
it may limit our ability to borrow money for our working capital, capital expenditures, debt service requirements, strategic initiatives or other purposes;
it may make it more difficult for us to satisfy our obligations with respect to our indebtedness, and any failure to comply with the obligations of any of our debt instruments, including restrictive covenants and borrowing conditions, could result in an event of default under our senior secured credit facilities, the indentures governing our senior notes, senior subordinated notes and our other indebtedness;
a substantial portion of our cash flow from operations will be dedicated to the repayment of our indebtedness and so will not be available for other purposes;
it may limit our flexibility in planning for, or reacting to, changes in our operations or business;
we are and will continue to be more highly leveraged than some of our competitors which may place us at a competitive disadvantage;
it may make us more vulnerable to further downturns in our business or the economy;
it may restrict us from making strategic acquisitions, introducing new technologies or exploiting business opportunities; and
it, may limit, along with the financial and other restrictive covenants in the documents governing our indebtedness, among other things, may limit our ability to borrow additional funds or dispose of assets.
16
Furthermore, our interest expense could increase if interest rates increase because a portion of the debt under our senior secured credit facilities is unhedged variable-rate debt. For the last several quarters, interest rates have been subject to extreme volatility which may intensify this risk. Also, we may still incur significantly more debt, which could intensify the risks described above. See “DescriptionFor more information, see Note 10 to our audited consolidated financial statements included elsewhere in this prospectus.
Weak economic and financial market conditions have impacted our business operations and may adversely affect our results of Certain Indebtedness.”operations and financial condition.
Weak global economic and financial market conditions in recent years have affected our business operations and continuing weakness or a further downturn may adversely affect our future results of operations and financial condition. Economic conditions in the end-markets, businesses or geographic areas in which we sell our products could reduce demand for these products and result in a decrease in sales volume for a prolonged period of time which would have a negative impact on our future results of operations. Also, a weak recovery could prolong, or resume, the negative effects we have experienced in the past.
For example, sales to the construction industry are driven by trends in commercial and residential construction, housing starts and trends in residential repair and remodeling. Consumer confidence, mortgage rates, credit standards and availability and income levels play a significant role in driving demand in the residential construction, repair and remodeling sector. A prolonged or further drop in consumer confidence, continued restrictions in the credit market or an increase in mortgage rates, credit standards or unemployment could delay the recovery of commercial and residential construction levels and have a material adverse effect on our business, financial condition, results of operations or cash flows. This may express itself in the form of substantial downward pressure on product pricing and our profit margins, thereby adversely affecting our financial results.
Additionally, many of our products are used in the energy, mining and cement and aggregate markets. With the recent increases and volatility in commodity prices, certain customers may defer or cancel anticipated projects or expansions until such time as these projects will be profitable based on the underlying cost of commodities compared to the cost of the project. Volatility and disruption of financial markets, like in recent years, could limit the ability of our customers to obtain adequate financing to maintain operations and may cause them to terminate existing purchase orders, reduce the volume of products they purchase from us in the future or impact their ability to pay their receivables. Adverse economic and financial market conditions may also cause our suppliers to be unable to meet their commitments to us or may cause suppliers to make changes in the credit terms they extend to us, such as shortening the required payment period for outstanding accounts receivable or reducing or eliminating the amount of trade credit available to us.
Demand for our Water Management products depends on availability of financing.
Many customers who purchase our Water Management products depend on third-party financing. There have been significant disruptions in the availability of financing on reasonable terms. Fluctuations in prevailing interest rates affect the availability and cost of financing to our customers. Given recent market conditions, some lenders and institutional investors have significantly reduced, and in some cases ceased to provide, funding to borrowers. The lack of availability or increased cost of credit could lead to decreased construction which would result in a reduction in demand for our products and have a material adverse effect on our Water Management business, financial condition, results of operations or cash flows.
The markets in which we sell our products are highly competitive.
We operate in highly fragmented markets within the Power Transmission industry.Process & Motion Control. As a result, we compete against numerous companies. Some of our competitors have achieved substantially more market penetration in certain of the markets in which we operate, and some of our competitors have greater financial and other
17
resources than we do. Competition in our business lines is based on a number of considerations including product performance, cost of transportation in the distribution of our Power TransmissionProcess & Motion Control products, brand reputation, quality of client service and support, product availability and price. Additionally, some of our larger, more sophisticated customers are attempting to reduce the number of vendors from which they purchase in order to increase their efficiency. If we are not selected to become one of these preferred providers, we may lose access to certain sections of the markets in which we compete. Our customers increasingly demand a broad product range and we must continue to develop our expertise in order to manufacture and market these products successfully. To remain competitive, we will need to invest continuously in manufacturing, customer service and support, marketing and our distribution networks. We may also have to adjust the prices of some of our Power TransmissionProcess & Motion Control products to stay competitive. We cannot assure you that we will have sufficient resources to continue to make these investments or that we will maintain our competitive position within each of the markets we serve.
Within the Water Management platform, we compete against both large international and national rivals, as well as many regional competitors. Some of our competitors have greater resources than we do. Significant competition in any of the markets in which the Water Management platform operates cancould result in substantial downward pressure on product pricing and our profit margins, thereby adversely affecting the Water Management financial results. Furthermore, we cannot provide assurance that we will be able to maintain or increase the current market share of our products successfully in the future.
Our business depends upon general economic conditions and other market factors beyond our control, and we serve customers in cyclical industries. As a result, our operating results could further be negatively affected during any continued or future economic downturns.
Our financial performance depends, in large part, on conditions in the markets that we serve in the U.S. and the global economy generally. Some of the industries we serve are highly cyclical, such as the aerospace, energy and industrial equipment industries. We have undertaken cost reduction programs as well as diversified our markets to mitigate the effect of downturns in economic conditions; however, such programs may be unsuccessful in the event such a downturn occurs.unsuccessful. Any sustained weakness in demand or downturn or uncertainty in the economy generally, such as the recent unprecedented volatility in the capital and credit markets, would materially reduce our net sales and profitability.
The demand in the water management industry is influenced by new construction activity, both residential and non-residential, and the level of repair and remodeling activity. The level of new construction and repair and remodeling activity is affected by a number of factors beyond our control, including the overall strength of the U.S. economy (including confidence in the U.S. economy by our customers), the strength of the residential and commercial real estate markets, institutional building activity, the age of existing housing stock, unemployment rates and interest rates. Any declines in commercial, institutional or residential construction starts or demand for replacement building and home improvement products may impact us in a material adverse manner and there can be no assurance that any such adverse effects would not continue for a prolonged period of time.
Demand for our Water Management products may depend on availability of financing.
Many customers who purchase our Water Management products depend on third-party financing. In recent months there have been significant disruptions in the availability of financing at reasonable terms. Fluctuations in prevailing interest rates affect the availability and cost of financing to our customers. The lack of availability or increased cost of credit could lead to decreased construction which would result in a reduction in demand for our products and have a material adverse effect on our Water Management business, financial condition, results of operations or cash flows.
The loss of any significant customer could adversely affect our business.
We have certain customers that are significant to our business. During fiscal 2008,2011, our top 20 customers accounted for approximately 35%32% of our consolidated net sales, and our toplargest customer Motion Industries, Inc., accounted for 8.1%8% of our consolidated net sales. Our competitors may adopt more aggressive sales policies and devote greater resources to the development, promotion and sale of their products than we do, which could result in a loss of customers. The loss of one or more of our major customers or deterioration in our relationship with any of them could have a material adverse effect on our business, financial condition, results of operations or cash flows.
18
Increases in the cost of our raw materials, in particular bar steel, brass, castings, copper, forgings, high-performance engineered plastic, plate steel, resin, sheet steel and zinc, as well as petroleum products, or the loss of a substantial number of our suppliers, could adversely affect our financial health.condition.
We depend on third parties for the raw materials used in our manufacturing processes. We generally purchase our raw materials on the open market on a purchase order basis. In the past, these contracts generally have had one-to-fiveone to five year terms and have contained competitive and benchmarking clauses intended to ensure competitive pricing. While we currently maintain alternative sources for raw materials, our business is subject to the risk of price fluctuations, and delays in the delivery of and potential unavailability of our raw materials. Any such price fluctuations or delays, if material, could harm our profitability or operations. In addition, the loss of a substantial number of suppliers could result in material cost increases or reduce our production capacity. We are
In addition, prices for petroleum products and other carbon-based fuel products have also significantly affected byincreased recently. These price increases, and consequent increases in the cost of natural gaselectricity and for products for which petroleum-based products are components or used in part of the process of manufacture, may substantially increase our costs for transportation, fuel, component parts and manufacturing. We may not be able to recoup the costcosts of electricity. Natural gas and electricity prices have historically been volatile, particularly in California where we have a significant manufacturing presence.these increases by adjusting our prices.
We do not typically enter into hedge transactions to reduce our exposure to price risks and cannot assure you that we would be successful in passing on any attendant costs if these risks were to materialize. In addition, if we are unable to continue to purchase our required quantities of raw materials on commercially reasonable terms, or at all, or if we are unable to maintain or enter into our purchasing contracts for our larger commodities, our business operations could be disrupted and our profitability could be impacted in a material adverse manner.
We rely on independent distributors. Termination of one or more of our relationships with any of those independent distributors or an increase in the distributors’ sales of our competitors’ products could have a material adverse effect on our business, financial condition, results of operations or cash flows.
In addition to our own direct sales force, we depend on the services of independent distributors to sell our Power TransmissionProcess & Motion Control products and provide service and aftermarket support to our customers.OEMs and end-users. We rely on an extensive distribution network, with nearly 2,2002,600 distributor locations nationwide; however, for fiscal 2008,2011, approximately 20%21% of our Power TransmissionProcess & Motion Control net sales were generated through sales to three of our key independent distributors, the largest of which accounted for 11.1%12% of Power TransmissionProcess & Motion Control net sales. Rather than serving as passive conduits for delivery of product, our industrial distributors are active participants in the overall competitive dynamic in the Power TransmissionProcess & Motion Control industry. Industrial distributors play a significant role in determining which of our Power TransmissionProcess & Motion Control products are stocked at the branch locations, and hence are most readily accessible to aftermarket buyers, and the price at which these products are sold. Almost all of the distributors with whom we transact business also offer competitors’ products and services to our customers. Within
Water Management, we depend on a network of several hundred independent sales representatives and approximately 7090 third-party warehouses to distribute our products; however, for fiscal 2008,2011, our three key independent distributors generated approximately 31%28% of our Water Management net sales with the largest accounting for 22%20% of Water Management net sales.
We are in the process of renewing our Power Transmission distributor agreements with our domestic distributorsOur Process & Motion Control and we currently operate in accordance with the terms of our previous, expired, agreements. We believe these terms to be ‘market standard’ providing that the applicable distributor be (i) authorized to sell certain products into certain geographic areas, (ii) obligated to comply with minimum stocking requirements (15% of annual purchases), and (iii) entitled to certain very limited inventory return rights. None of our distributors have exclusive geographic rights. Our Water Management distributor agreementsdistributorship sales are on similar ‘market standard’ terms, however, they provide for automatic annual renewal.“market standard” terms. In addition, certain key distributors are on rebate programs, including our top three Water Management distributors. For more information on our rebate programs, see “Management’s Discussion and Analysis of Financial Condition and Results of Operations-Revenue Recognition.”
The loss of one of our key distributors or of a substantial number of our other distributors or an increase in the distributors’ sales of our competitors’ products to our customers could have a material adverse effect on our business, financial condition, results of operations or cash flows.
19
We could be adversely affected if any of our significant customers default in their obligations to us.
Our contracted backlog is comprised of future orders for our products from a broad number of customers. Defaults by any of the customers that have placed significant orders with us could have a significant adverse effect on our net sales, profitability and cash flow. Our customers may in the future default on their obligations to us due to bankruptcy, lack of liquidity, operational failure or other reasons deriving from the current general economic environment. More specifically, the recession and tightening of credit have led to an increased level of commercial and consumer delinquencies, lack of customer confidence, increased market volatility and widespread reduction of business generally. Accordingly, the recession and tightening of credit increases the risks associated with our backlog. If a customer defaults on its obligations to us, it could have a material adverse effect on our business, financial condition, results of operations or cash flows. Approximately 5% of our backlog at March 31, 2011 is currently scheduled to ship beyond fiscal 2012.
We are subject to risks associated with changing technology and manufacturing techniques, which could place us at a competitive disadvantage.
The successful implementation of our business strategy requires us to continuously evolve our existing products and introduce new products to meet customers’ needs in the industries we serve. Our products are characterized by stringent performance and specification requirements that mandate a high degree of manufacturing and engineering expertise. If we fail to meet these requirements, our business could be at risk. We believe that our customers rigorously evaluate their suppliers on the basis of a number of factors, including product quality, price competitiveness, technical and manufacturing expertise, development and product design capability, new product innovation, reliability and timeliness of delivery, operational flexibility, customer service and overall management. Our success will depend on our ability to continue to meet our customers’ changing specifications with respect to these criteria. We cannot assure you that we will be able to address technological advances or introduce new products that may be necessary to remain competitive within our businesses. Furthermore, we cannot assure you that we can adequately protect any of our own technological developments to produce a sustainable competitive advantage.
If we lose certain of our key sales, marketing or engineering personnel,associates, our business may be adversely affected.
Our success depends on our ability to recruit, retain and motivate highly-skilled sales, marketing and engineering personnel. Competition for these persons in our industry is intense and we may not be able to successfully recruit, train or retain qualified personnel. If we fail to retain and recruit the necessary personnel, our business and our ability to obtain new customers, develop new products and provide acceptable levels of customer service could materially suffer. In addition, we cannot assure you that these individuals will continue their employment with us. If any of these key personnel were to leave our company, it could be difficult to replace them, and our business could be materially harmed.
We may incur significant costs for environmental compliance and/or to address liabilities under environmental laws and regulations.
Our operations and facilities are subject to extensive laws and regulations related to pollution and the protection of the environment, health and safety, including those governing, among other things, emissions to air, discharges to water, the generation, handling, storage, treatment and disposal of hazardous wastes and other materials, and the remediation of contaminated sites. A failure by us to comply with applicable requirements or the permits required for our operations could result in civil or criminal fines, penalties, enforcement actions, third party claims for property damage and personal injury, requirements to clean up property or to pay for the costs of cleanup or regulatory or judicial orders enjoining or curtailing operations or requiring corrective measures, including the installation of pollution control equipment or remedial actions. Moreover, if applicable environmental, health and safety laws and regulations, or the interpretation or enforcement thereof, become more stringent in the future, we could incur capital or operating costs beyond those currently anticipated.
20
Some environmental laws and regulations, including the federal Superfund law, impose requirements to investigate and remediate contamination on present and former owners and operators of facilities and sites, and on potentially responsible parties or PRPs,(“PRPs”) for sites to which such parties may have sent waste for disposal. Such liability can be imposed without regard to fault and, under certain circumstances, may be joint and several, resulting in one PRP being held responsible for the entire obligation. Liability may also include damages to natural resources. We are currently conducting investigations and/or cleanup of known or potential contamination at several of our current and former facilities and have been named as a PRP at several third party Superfund sites. The discovery of additional contamination, the imposition of more stringent cleanup requirements, disputes with our insurers or the insolvency of other responsible parties could require significant expenditures by us in excess of our current reserves. In addition, we occasionally evaluate various alternatives with respect to our facilities, including possible dispositions or closures. Investigations undertaken in connection with these activities may lead to discoveries of contamination that must be remediated, and closures of facilities may trigger remediation requirements that are not currently applicable to our operating facilities. We may also face liability for alleged personal injury or property damage due to exposure to hazardous substances used or disposed of by us, that may be contained within our current or former products, or that are present in the soil or groundwater at our current or former facilities. Significant costs could be incurred in connection with such liabilities.
We believe that, subject to various terms and conditions, we have certain indemnification protection from Invensys plc (“Invensys”) with respect to certain environmental liabilities that may have occurred prior to the acquisition by the Carlyle Group (the “Carlyle acquisition”Acquisition”) of the capital stock of 16 entities comprising the Rexnord group of Ivensys,Invensys, including certain liabilities associated with our Downers Grove, Illinois facility and with respect to personal injury claims for alleged exposure to hazardous materials. We also believe that, subject to various terms and conditions, we have certain indemnification protection from Hamilton Sundstrand Corporation or (“Hamilton Sundstrand,Sundstrand”), with respect to certain environmental liabilities that may have arisen from events occurring at Falk facilities prior to the Falk acquisition, including certain liabilities associated with personal injury claims for alleged exposure to hazardous materials. If Invensys or Hamilton Sundstrand becomes unable to, or otherwise does not, comply with its indemnity obligations, or if certain contamination or other liability for which we are obligated is not subject to such indemnities or historic insurance coverage, we could incur significant unanticipated costs. As a result, it is possible that we will not be able to recover pursuant to these indemnities a substantial portion, if any, of the costs that we may incur.
Certain subsidiaries are subject to numerous asbestos claims.
Certain subsidiaries are co-defendants in various lawsuits filed in a number of jurisdictions throughout the United States alleging personal injury as a result of exposure to asbestos that was used in certain components of our products. The uncertainties of litigation and the uncertainties related to the collection of insurance and indemnification coverage make it difficult to accurately predict the ultimate financial effect of these claims. In
the event our insurance or indemnification coverage becomes insufficient to cover our potential financial exposure, or the actual number or value of asbestos-related claims differs materially from our existing estimates, we could incur material costs that could have a material adverse effect on our business, financial condition, results of operations or cash flows. See “Business—Legal Proceedings.”
Certain Water Management subsidiaries are subject to a number of class action claims.
Certain Water Management subsidiaries are defendants in a class action lawsuit pending in U.S. federal court in Minnesota and in a number of putative class action lawsuits pending in various other U.S. federal courts. The plaintiffs in these suits represent or seek to represent a class of plaintiffs alleging damages due to the alleged failure or anticipated failure of the Zurn brass crimp fittings on the PEX plumbing systems in homes and other structures. The complaints assert various causes of action, including but not limited to negligence, breach of warranty, fraud, and violations of the Magnuson MossMagnuson-Moss Act and certain state consumer protection laws, and seek declaratory and injunctive relief, and damages (including punitive damages) in unspecified amounts. We are being provided a defense by insurers.. While we intend to vigorously
21
defend ourselves in these actions, the uncertainties of litigation and the uncertainties related to insurance coverage and collection as well as the actual number or value of claims make it difficult to accurately predict the financial effect these claims may ultimately have on us. We may not be successful in defending such claims, and the resulting liability could be substantial and may not be fully covered by insurance. As a result of the preceding, there can be no assurance as to the long termlong-term effect this litigation will have on our business, financial condition, results of operations or cash flows. See “Business—Legal Proceedings.”
Weather could adversely affect the demand for products in our Water Management platform and decrease its net sales.
Demand for our Water Management products is primarily driven by commercial, institutionalnon-residential construction activity, remodeling and residential construction activity.retro-fit opportunities, and to a lesser extent, new home starts as well as water and wastewater infrastructure expansion for municipal, industrial and hydropower applications. Weather is an important variable affecting financial performance as it significantly impacts construction activity. Spring and summer months in the United States and Europe represent the main construction seasons. Adverse weather conditions, such as prolonged periods of cold or rain, blizzards, hurricanes and other severe weather patterns, could delay or halt construction and remodeling activity.activity which could have a negative affect on our business. For example, an unusually severe winter can lead to reduced construction activity and magnify the seasonal decline in our Water Management net sales and earnings during the winter months. In addition, a prolonged winter season can delay construction and remodeling plans and hamper the typical seasonal increase in net sales and earnings during the spring months.
Our international operations are subject to uncertainties, which could adversely affect our operating results.
Our business is subject to certain risks associated with doing business internationally. For fiscal 2008,2011, our net sales outside the United States represented approximately 30.0%29% of our total net sales.sales (based on the country in which the shipment originates). The portion of our net sales and operations that is outside of the United States has increased in recent years, and may further increase as a result of internal growth and/or acquisition activity. Accordingly, our future results could be harmed by a variety of factors relating to international operations, including:
fluctuations in currency exchange rates, particularly fluctuations in the Euro against the U.S. dollar;
exchange controls;
compliance with export controls;
tariffs or other trade protection measures and import or export licensing requirements;
changes in tax laws;
interest rates;
changes in regulatory requirements;
differing labor regulations;
requirements relating to withholding taxes on remittances and other payments by subsidiaries;
restrictions on our ability to own or operate subsidiaries, make investments or acquire new businesses in these jurisdictions;
restrictions on our ability to repatriate dividends from our subsidiaries; and
exposure to liabilities under the Foreign Corrupt Practices Act.
As we continue to expand our business globally, our success will depend, in large part, on our ability to anticipate and effectively manage these and other risks associated with our international operations. However, any of these factors could have a material adverse effect on our international operations and, consequently, our business, financial condition, results of operations or cash flows.
22
We may be unable to identify potential acquisition candidates, or to realize the intended benefits of future or past acquisitions.
We cannot assure you that suitable acquisition candidates will be identified and acquired in the future, that the financing of any such acquisition will be available on satisfactory terms, that we will be able to complete any such acquisition or that we will be able to accomplish our strategic objectives as a result of any such acquisition. Nor can we assure you that our acquisition strategies will be successfully received by customers or achieve their intended benefits.
Often acquisitions are undertaken to improve the operating results of either or both of the acquirer and the acquired company and we cannot assure you that we will be successful in this regard nor can we provide any assurance that we will be able to realize all of the intended benefits from our prior acquisitions. We have encountered, and may encounter, various risks in acquiring other companies, including the possible inability to integrate an acquired business into our operations, diversion of management’s attention and unanticipated problems, risks or liabilities, some or all of which could have a material adverse effect on our business, financial condition, results of operations or cash flows.
We may be unable to make necessary capital expenditures.
We periodically make capital investments to, among other things, maintain and upgrade our facilities and enhance our products’ processes. As we grow our businesses, we may have to incur significant capital expenditures. We believe that we will be able to fund these expenditures through cash flow from operations and borrowings under our senior secured credit facilities. However, our senior secured credit facilities, the indentures governing our senior notes and the indenture governing our senior subordinated notes contain limitations that could affect our ability to fund our future capital expenditures and other capital requirements. We cannot assure you that we will have, or be able to obtain, adequate funds to make all necessary capital expenditures when required, or that the amount of future capital expenditures will not be materially in excess of our anticipated or current expenditures. If we are unable to make necessary capital expenditures, our product line may become dated, our productivity may be decreased and the quality of our products may be adversely affected which, in turn, could materially reduce our net sales and profitability.
Our debt agreements impose significant operating and financial restrictions, which could have a material adverse effect on our business, financial condition, results of operations or cash flows.
Our senior secured credit facilities and the indentures governing our senior notes and senior subordinated notes contain various covenants that limit or prohibit our ability, among other things, to:
incur or guarantee additional indebtedness or issue certain preferred shares;
pay dividends on our capital stock or redeem, repurchase, retire or make distributions in respect of our capital stock or subordinated indebtedness or make other restricted payments;
make certain loans, acquisitions, capital expenditures or investments;
sell certain assets, including stock of our subsidiaries;
enter into sale and leaseback transactions;
create or incur liens;
consolidate, merge, sell, transfer or otherwise dispose of all or substantially all of our assets; and
enter into certain transactions with our affiliates.
The indentures governing our senior notes and senior subordinated notes contain covenants that restrict our ability to take certain actions, such as incurring additional debt, if we are unable to meet defined specified financial ratios. As of March 31 2008,2011, our senior secured bank leverage ratio was 1.67x. As1.16x. In addition, as of March 31, 2008,this
23
date, we had $119.0$121.7 million of additional borrowing capacity under the senior secured credit facilities.facilities ($28.3 million was considered utilized in connection with outstanding letters of credit). Failure to comply with the leverage covenant of the senior secured credit facilities can result in limiting our long-term growth prospects by hindering our ability to incur future indebtedness or grow through acquisitions. The interest rate in respect of borrowings under the senior secured credit facilities is determined in reference to the senior secured bank leverage ratio. A breach of any of these covenants could result in a default under our debt agreements. See “Management’s Discussion and Analysis of Financial Condition and Results of Operations—Covenant Compliance.”For more information, see Note 10 to our audited consolidated financial statements included elsewhere in this prospectus.
The restrictions contained in the agreements that govern the terms of our debt could:
limit our ability to plan for or react to market conditions or meet capital needs or otherwise restrict our activities or business plans;
adversely affect our ability to finance our operations, to enter into strategic acquisitions, to fund investments or other capital needs or to engage in other business activities that would be in our interest; and
limit our access to the cash generated by our subsidiaries.
Upon the occurrence of an event of default under the senior secured credit facilities, the lenders could elect to declare all amounts outstanding under the senior secured credit facilities to be immediately due and payable and terminate all commitments to extend further credit. If we were unable to repay those amounts, the lenders under the senior secured credit facilities could proceed against the collateral granted to them to secure the senior secured credit facilities on a first-priority lien basis. If the lenders under the senior secured credit facilities accelerate the repayment of borrowings, such acceleration could have a material adverse effect on our business, financial condition, results of operations or cash flows. In addition, we may not have sufficient assets to repay our senior notes and senior subordinated notes upon acceleration. For a more detailed description onof the limitations on our ability to incur additional indebtedness, please see “Management’s Discussion and Analysis of Financial Condition and Results of Operations—Liquidity and Capital Resources”Note 10 to our audited consolidated financial statements included elsewhere in this prospectus and “Description of Indebtedness.”
Despite our substantial indebtedness, we may still be able to incur significantly more indebtedness which could have a material adverse effect on our business, financial condition, results of operations or cash flows.
The terms of the indentures governing our senior notes and senior subordinated notes and the senior secured credit facilities contain restrictions on our ability to incur additional indebtedness. These restrictions are subject to a number of important qualifications and exceptions, and the indebtedness incurred in compliance with these restrictions could be substantial. Accordingly, we or our subsidiaries could incur significant additional indebtedness in the future. As of June 28, 2008, we had approximately $120.8 million available for additional borrowing under the senior secured credit facilities, including a subfacility for letters of credit, and the covenants under our debt agreements would allow us to borrow a significant amount of additional indebtedness. Additional leverage could have a material adverse effect on our business, financial condition, results of operations or cash flows and could increase the risks described in “—Our substantial leverage exposes us to interest rate risk and could adversely affect our ability to raise additional capital to fund our operations, limit our ability to react to changes in the economy or our industry and prevent us from meeting our obligations under our indebtedness,” “—Our debt agreements impose significant operating and financial restrictions, which could have a material adverse effect on our business, financial condition, results of operations or cash flows” and “—Because a substantial portion of our indebtedness bears interest at rates that fluctuate with changes in certain prevailing short-term interest rates, we are vulnerable to interest rate increases.”
Because a substantial portion of our indebtedness bears interest at rates that fluctuate with changes in certain prevailing short-term interest rates, we are vulnerable to interest rate increases.
A substantial portion of our indebtedness, including the senior secured credit facilities and borrowings outstanding under our accounts receivable securitization facility, bears interest at rates that fluctuate with changes in certain short-term prevailing interest rates. As of June 28, 2008,March 31, 2011, we had $767.5$761.5 million of floating rate debt under the senior secured credit facilities. We also had an additional $120.8 million available for borrowing under the senior secured credit facilities as of June 28, 2008. Of the $767.5$761.5 million of floating rate debt, $262.0$370.0 million of our term loans are subject to an interest rate collar and $68.0 million of our term loans are subject to an interest rate swap,swaps, in each case maturing in October 2009. Assuming a consistent level of debt,July 2012. After considering the interest rate swaps, a 100 basis point changeincrease in the March 31, 2011 interest rate on the remaining unhedged portion of floating rate debt of $437.5 million effective from the beginning of the yearrates would increase or decrease our fiscal 2008 interest expense under the senior secured credit facilities by approximately $7.0$3.9 million on an annual basis. If interest rates increase dramatically, we could be unable to service our debt which could have a material adverse effect on our business, financial condition, results of operations or cash flows.
We rely on intellectual property that may be misappropriated or otherwise successfully challenged.
We attempt to protect our intellectual property through a combination of patent, trademark, copyright and trade secret protection, as well as third-party nondisclosure and assignment agreements. We cannot assure you that any of our applications for protection of our intellectual property rights will be approved and maintained or that our competitors will not infringe or successfully challenge our intellectual property rights. We also rely on unpatented proprietary technology. It is possible that others will independently develop the same or similar technology or otherwise obtain access to our unpatented technology. To protect our trade secrets and other proprietary information, we require employees, consultants and advisors to enter into confidentiality agreements. We cannot assure you that these agreements will provide meaningful protection for our trade secrets, know-how or other proprietary information in the event of any unauthorized use, misappropriation or disclosure. If we are unable to maintain the proprietary nature of our technologies, our ability to sustain margins on some or all of our products may be affected which could have a material adverse effect on our business, financial condition, results of operations or cash flows. In addition, in the ordinary course of our operations, from time to time we pursue
24
and are pursued in potential litigation relating to the protection of certain intellectual property rights, including some of our more profitable products, such as flattop chain. An adverse ruling in any such litigation could have a material adverse effect on our business, financial condition, results of operations or cash flows.
We could face potential product liability claims relating to products we manufacture or distribute.
We may be subject to additional product liability claims in the event that the use of our products, or the exposure to our products or their raw materials, is alleged to have resulted in injury or other adverse effects. We currently maintain product liability insurance coverage but we cannot assure you that we will be able to obtain such insurance on commercially reasonable terms in the future, if at all, or that any such insurance will provide adequate coverage against potential claims. Product liability claims can be expensive to defend and can divert the attention of management and other personnel for long periods of time, regardless of the ultimate outcome. An unsuccessful product liability defense could have a material adverse effect on our business, financial condition, results of operations or cash flows. In addition, our business depends on the strong brand reputation we have developed. In the event that this reputation is damaged as a result of a product liability claim, we may face difficulty in maintaining our pricing positions and market share with respect to some of our products, which could have a material adverse effect on our business, financial condition, results of operations or cash flows. See “Business—Legal Proceedings.”
We, our customers and our shippers have unionized employees thatwho may stage work stoppages which could seriously impact the profitability of our business.
As of June 28, 2008,the date of this filing, we had approximately 7,4006,300 employees, of whom approximately 5,3004,300 were employed in the United States. Approximately 700535 of our U.S. employees are represented by labor unions. The seven U.S. collective bargaining agreements to which we are a party will expire in February 2009, August 2009 (two bargaining agreements expire in August 2009), August 2010, September 2010, October 2010 and April 2012, respectively. Additionally, approximately 1,2001,000 of our employees reside in Europe, where trade union membership is common. Although we believe that our relations with our employees are currently satisfactory,strong, if our unionized workers were to engage in a strike, work stoppage or other slowdown in the future, we could experience a significant disruption of our operations, which could interfere with our ability to deliver products on a timely basis and could have other negative effects, such as decreased productivity and increased labor costs. Such negative effects could have a material adverse effect on our business, financial condition, results of operations or cash flows. In addition, if a greater percentage of our workforce becomes unionized, our business and financial condition, results of operations or cash flows could be affected in a material adverse manner. ManyFurther, many of our direct and indirect customers and their suppliers, have unionized workforces. Strikes, work stoppages or slowdowns experienced by these customers or their suppliers could result in slowdowns or closures of assembly plants where our products are used. In addition,and organizations responsible for shipping our products, have unionized workforces and their businesses may be impacted by occasional strikes, staged by the International Brotherhoodwork stoppages or slowdowns, any of Teamsters or the Teamsters Union. Any interruptionwhich, in the delivery of our products could reduce demand for our products andturn, could have a material adverse effect on our business, financial condition, results of operations or cash flows.
We could incur substantial business interruptions as the result of an expansion ofupdating our PeopleSoft platform.Enterprise Resource Planning (“ERP”) Systems.
We expect to continue an expansion of our PeopleSoft platform during fiscal 2009 and 2010, utilizingUtilizing a phased approach. This system expansion will affect certain domestic Power Transmission business units, replacing existing order entry, shippingapproach, we are updating our ERP systems across both our Process & Motion Control and billing systems.Water Management platforms. If this expansion isthese updates are unsuccessful, we could incur substantial business interruptions, including the inability to perform routine business transactions, which could have a material adverse effect on our financial performance.
We may be unable to successfully realize all of the intended benefits from our past acquisitions, and we may be unable to identify or realize the intended benefits of other potential acquisition candidates.
We may be unable to realize all of the intended benefits of our recent acquisitions. As part of our business strategy, we will also evaluate other potential acquisitions, some of which could be material, and engage in discussions with acquisition candidates. We cannot assure you that suitable acquisition candidates will be identified and acquired in the future, that the financing of any such acquisition will be available on satisfactory terms, that we will be able to complete any such acquisition or that we will be able to accomplish our strategic objectives as a result of any such acquisition. Nor can we assure you that our acquisition strategies will be successfully received by customers or achieve their intended benefits. Often acquisitions are undertaken to improve the operating results of either or both of the acquirer and the acquired company and we cannot assure you that we will be successful in this regard. We will encounter various risks in acquiring other companies, including the possible inability to integrate an acquired business into our operations, diversion of management’s attention and unanticipated problems or liabilities, some or all of which could have a material adverse effect on our business, financial condition, results of operations or cash flows.
Our future required cash contributions to our pension plans have increased and may increase.increase further and we could experience a material change in the funded status of our defined benefit pension plans and the amount recorded in our consolidated balance sheets related to those plans. Additionally, our pension costs could increase in future years.
Recent legislative changes have reformed funding requirements for underfunded U.S. defined benefit pension plans. The revised statutes,statute, among other things, increaseincreases the percentage funding target of U.S. defined benefit pension plans from 90% to 100% and requirerequires the use of a more current mortality table in the calculation
25
of minimum yearly funding requirements. Our future required cash contributions to our U.S. defined benefit pension plans may increase based on the funding reform provisions that were enacted into law. In addition, if the returns on the assets of any of our U.S. defined benefit pension plans were to decline in future periods, if the Pension Benefit Guaranty Corporation or PBGC, requires(“PBGC”) were to require additional contributions to any such plans as a result of our recent acquisitions or if other actuarial assumptions arewere to be modified, our future required cash contributions to such plans could increase. Any such increases could have a material and adverse effect on our business, financial condition, results of operations or cash flows.
The need to make these cash contributions to such plans may reduce the cash available to meet our other obligations, including our debt obligations with respect to our senior secured credit facilities, our senior notes and our senior subordinated notes, or to meet the needs of our business. In addition, the PBGC may terminate our U.S. defined benefit pension plans under limited circumstances, including in the event the PBGC concludes that itsthe risk may increase unreasonably if such plans continue. In the event a U.S. defined benefit pension plan is terminated for any reason while it is underfunded, we could be required to make an immediate payment to the PBGC of all or a substantial portion of such plan’s underfunding, as calculated by the PBGC based on its own assumptions (which might result in a larger pension obligation than that based on the assumptions we have used to fund such plan), and the PBGC could place a lien on material amounts of our assets.
The deterioration experienced in fiscal 2009 in the securities markets has impacted the value of the assets included in our defined benefit pension plans. The deterioration in pension asset values has led to additional contribution requirements (in accordance with the plan funding requirements of the U.S. Pension Protection Act of 2006). Any further deterioration may also lead to further cash contribution requirements and increased pension costs. Recent pension funding legislative and regulatory relief provided by the U.S. government in light of the securities markets decline has reduced our short-term required pension contributions from the amount required before relief. The impact of this relief has been reflected in our projected cash contribution requirements disclosed in the consolidated financial statements.
Our historical financial informationdata is not comparable to our current financial condition and results of operations because of our use of purchase accounting in connection with the Merger and the GA, Zurn and Falkvarious acquisitions and due to the different basis of accounting used by the Companyus prior to the Merger.acquisition by Apollo in 2006.
It may be difficult for you to compare both our historical and future results. These acquisitions were accounted for utilizing the purchase method of accounting, which resulted in a new valuation for the assets and liabilities to their fair values. This new basis of accounting began on the date of the consummation of each
transaction. Also, until our purchase price allocations are finalized for an acquisition (generally less than one year after the acquisition date), our allocation of the excess purchase price over the book value of the net assets acquired is considered preliminary and subject to future adjustment.
The calculation of Adjusted EBITDA pursuant to our senior secured credit facilities represents our actual historical covenant compliance calculations and permits certain estimates and assumptions that may differ materially from actual results.
Although Adjusted EBITDA is derived from our financial statements (pro forma or historical, as the case may be), the calculation of “EBITDA” pursuant to our senior secured credit facilities, which we have presented in this prospectus as Adjusted EBITDA, permits certain estimates and assumptions that may differ materially from actual results. For example, the determination of the adjustment attributable to inventory under absorption permits an estimate as to the decline in our inventory levels over historical amounts. In addition, the determination of fixed costs attributable to inventory and other similar costs permits certain assumptions. Although our management believes these estimates and assumptions are reasonable, investors should not place undue reliance upon the calculation of Adjusted EBITDA given how it is calculated and the possibility that the underlying estimates and assumptions may ultimately not reflect actual results. In addition, our senior secured credit facilities permit us to adjust Adjusted EBITDA for items that would not meet the standards for inclusion in pro forma financial statements under Regulation S-X and other Securities and Exchange Commission (“SEC”) rules. Some of these adjustments may be too speculative to merit adjustment under Regulation S-X; however, our senior secured credit facilities would permit such adjustments for purposes of determining Adjusted EBITDA under the indentures and our senior secured credit facilities. As a result of these adjustments, we may be able to incur more debt or pay dividends or make other restricted payments in greater amounts that would otherwise be permitted without such adjustments.
Adjusted EBITDA is not a presentation made in accordance with GAAP, is not a measure of financial condition, liquidity or profitability and should not be considered as an alternative to net income (loss) determined in accordance with GAAP or operating cash flows determined in accordance with GAAP. Additionally, EBITDA is not intended to be a measure of free cash flow for management’s discretionary use, as it does not take into account certain items such as interest and principal payments on our indebtedness, depreciation and amortization expense (because we use capital assets, depreciation and amortization expense is a necessary element of our costs and ability to generate revenue), working capital needs, tax payments (because the payment of taxes is part of our operations, it is a necessary element of our costs and ability to operate), non-recurring expenses and capital expenditures.
Risks Related to This Offering
Future sales or the possibility of future sales of a substantial amount of our common stock may depress the price of shares of our common stock.
Future sales or the availability for sale of substantial amounts of our common stock in the public market could have a material adverse effect on the prevailing market price of our common stock and could impair our ability to raise capital through future sales of equity securities.
Our amended and restated certificate of incorporation will authorize us to issue shares of common stock, of which shares will be outstanding upon consummation of this offering. This number includes shares that we are selling in this offering, which will be freely transferable without restriction or further registration under the Securities Act of 1933, as amended, which we refer to throughout this prospectus as the Securities Act. The remaining shares of our common stock outstanding, including the shares of common stock owned by Apollo and certain members of our management, will be restricted from immediate resale under the federal securities laws and the lock-up agreements between our current stockholders and the underwriters, but may be sold in the near future. See “Underwriting.” Following the expiration of the applicable lock-up period, all
these shares of our common stock will be eligible for resale under Rule 144 or Rule 701 of the Securities Act, subject to volume limitations and applicable holding period requirements. In addition, Apollo will have the ability to cause us to register the resale of their shares, and our management members who hold shares will have the ability to include their shares in the registration. See “Shares Eligible for Future Sale” for a discussion of the shares of our common stock that may be sold into the public market in the future.
We may issue shares of our common stock or other securities from time to time as consideration for future acquisitions and investments. If any such acquisition or investment is significant, the number of shares of our common stock, or the number or aggregate principal amount, as the case may be, of other securities that we may issue may in turn be substantial. We may also grant registration rights covering those shares of our common stock or other securities in connection with any such acquisitions and investments.
Upon consummation of this offering, options to purchase shares of our common stock will be outstanding under the 2006 Stock Option Plan of Rexnord Holdings (the “Option Plan”). In addition, immediately following this offering, we intend to file a registration statement registering shares of our common stock reserved for issuance under our Option Plan under the Securities Act.
We cannot predict the size of future issuances of our common stock or the effect, if any, that future issuances and sales of our common stock will have on the market price of our common stock. Sales of substantial amounts of our common stock (including shares of our common stock issued in connection with an acquisition), or the perception that such sales could occur, may adversely affect prevailing market prices for our common stock.
There is no existing market for our common stock and we do not know if one will develop, which could impede your ability to sell your shares and may depress the market price of our common stock.
Prior to this offering, thereThere has not been a public market for our common stock.stock prior to this offering. We cannot predict the extent to which investor interest in the companyus will lead to the development of an active trading market on the New York Stock Exchange or otherwise or how liquid that market might become. If an active trading market does not develop, you may have difficulty selling any of our common stock that you buy. The initial public offering price for ourthe common stock will be determined by negotiations between us and the representatives of the underwriters and may not be indicative of prices that will prevail in the open market following this offering. See “Underwriting.” Consequently, you may not be ableunable to sell our common stock at prices equal to or greater than the price you paidpay in this offering.
26
Apollo controls us and its interests may conflict with or differ from your interests as a stockholder.
After the consummation of this offering, Apollo will beneficially own approximately % of our common stock, assuming the underwriters do not exercise their option to purchase additional shares, or % if the underwriters exercise their option in full. In addition, representatives of Apollo comprise 4 of our 8 directors. As a result, Apollo will continue to have the ability to prevent any transaction that requires the approval of our board of directors or stockholders, including the approval of significant corporate transactions such as mergers and the sale of substantially all of our assets.
The interests of Apollo could conflict with or differ from your interests as a holder of our common stock. For example, the concentration of ownership held by Apollo could delay, defer or prevent a change of control of us or impede a merger, takeover or other business combination that you as a stockholder may otherwise view favorably. Apollo is in the business of making or advising on investments in companies and holds, and may from time to time in the future acquire, interests in or provide advice to businesses that directly or indirectly compete with certain portions of our business or are suppliers or customers of ours. They may also pursue acquisitions that may be complementary to our business, and, as a result, those acquisition opportunities may not be available to us.
So long as Apollo continues to beneficially own a significant amount of our equity, even if such amount is less than 50%, it may continue to be able to strongly influence or effectively control our decisions. See “Certain Relationships and Related Party Transactions” and “Description of Capital Stock.”
We will be a “controlled company” within the meaning of the New York Stock Exchange rules and, as a result, will qualify for, and intend to rely on, exemptions from certain corporate governance requirements.
Upon the closing of this offering, Apollo will continue to control a majority of our voting common stock. As a result, we will be a “controlled company” within the meaning of the New York Stock Exchange corporate governance standards. Under the rules, a company of which more than 50% of the voting power is held by an individual, group or another company is a “controlled company” and may elect not to comply with certain New York Stock Exchange corporate governance requirements, including:
the requirement that we have a majority of independent directors on our board of directors;
the requirement that we have a nominating and corporate governance committee that is composed entirely of independent directors with a written charter addressing the committee’s purpose and responsibilities;
the requirement that we have a compensation committee that is composed entirely of independent directors with a written charter addressing the committee’s purpose and responsibilities; and
the requirement for an annual performance evaluation of the nominating and corporate governance and compensation committees.
Following this offering, we intend to utilize certain exemptions from New York Stock Exchange corporate governance requirements, including the foregoing. As a result, we will not have a majority of independent directors nor will our nominating and corporate governance and compensation committees consist entirely of independent directors and we will not be required to have an annual performance evaluation of the nominating and corporate governance and compensation committees. See “Management.” Accordingly, you will not have the same protections afforded to stockholders of companies that are subject to the New York Stock Exchange’s corporate governance requirements.
27
The price of our common stock may fluctuate significantly and you could lose all or part of your investment.
Volatility in the market price of our common stock may prevent you from being able to sell your common stock at or above the price you paid for your common stock. The market price for our common stock could fluctuate significantly for various reasons, including:
our operating and financial performance and prospects;
our quarterly or annual earnings or those of other companies in our industry;
conditions that impact demand for our products and services;
future announcements concerning our business or our competitors’ businesses;
the public’s reaction to our press releases, other public announcements and filings with the U.S. Securities and Exchange Commission, or SEC;
changes in earnings estimates or recommendations by securities analysts who track our common stock;
market and industry perception of our success, or lack thereof, in pursuing our growth strategy;
strategic actions by us or our competitors, such as acquisitions or restructurings;
changes in government and environmental regulation;
general market, economic and political conditions;
changes in accounting standards, policies, guidance, interpretations or principles;
arrival andor departure of key personnel;
the number of shares to be publicly traded after this offering;
sales of common stock by us, Apollo or its affiliated funds or members of our management team;
adverse resolution of new or pending litigation against us; and
changes in general market, economic and political conditions in the United States and global economies or financial markets, including those resulting from natural disasters, terrorist attacks, acts of war and responses to such events.
In addition, in recent years, the stock market has experienced significant price and volume fluctuations.fluctuations in recent years. This volatility has had a significant impact on the market price of securities issued by many companies, including companies in our industry.industries. The changes frequently appear to occur without regard to the operating performance of the affected companies. Hence, the price of our common stock could fluctuate based upon factors that have little or nothing to do with the Company,us, and these fluctuations could materially reduce our share price.
Apollo controls usWe currently have no plans to pay regular dividends on our common stock, so you may not receive funds without selling your common stock.
We currently have no plans to pay regular dividends on our common stock. Any payment of future dividends will be at the discretion of our board of directors and its interestswill depend on, among other things, our earnings, financial condition, capital requirements, level of indebtedness, statutory and contractual restrictions applying to the payment of dividends, and other considerations that our board of directors deems relevant. The terms governing our outstanding debt also include limitations on the ability of our subsidiaries to pay dividends to us. Accordingly, you may conflict withhave to sell some or differall of your common stock in order to generate cash flow from your interests asinvestment.
Future sales or the possibility of future sales of a stockholder.
After the consummation of this offering, our equity sponsor, Apollo, will beneficially own approximately %substantial amount of our common stock assumingmay depress the underwriters do not exercise their over-allotment option. If the underwriters exercise in full their over-allotment option, Apollo will beneficially own approximately %price of shares of our common stock. As a result, Apollo has
We may sell additional shares of common stock in subsequent public offerings or otherwise, including to finance acquisitions. We have authorized shares of common stock, of which shares will be outstanding upon consummation of this offering. This number includes shares that we are selling in this offering, which may be resold immediately in the powerpublic market. Of the remaining shares, , or %, are restricted
28
from immediate resale under the federal securities laws and the lock-up agreements with the underwriters described in the “Underwriting” section of this prospectus, but may be sold into the market in the near future. These shares will become available for sale at various times following the expiration of the lock-up agreements, which, without the prior consent of , is days after the date of this prospectus. Immediately after the expiration of the lock-up period, the shares will be eligible for resale under Rule 144 or Rule 701 of the Securities Act subject to elect allvolume limitations and applicable holding period requirements.
We cannot predict the size of future issuances of our directors. Therefore, Apollocommon stock or the effect, if any, that future issuances and sales of our common stock will have on the abilitymarket price of our common stock. Sales of substantial amounts of our common stock (including shares issued in connection with an acquisition), or the perception that such sales could occur, may adversely affect prevailing market prices for our common stock.
Our organizational documents may impede or discourage a takeover, which could deprive our investors of the opportunity to receive a premium for their shares.
Provisions of our certificate of incorporation and bylaws may make it more difficult for, or prevent any transaction that requiresa third party from, acquiring control of us without the approval of our board of directors. These provisions include:
having a classified board of directors;
establishing limitations on the removal of directors;
prohibiting cumulative voting in the election of directors;
empowering only the board to fill any vacancy on our board of directors, whether such vacancy occurs as a result of an increase in the number of directors or our stockholders, including the approval of significant corporate transactions such otherwise;
as mergers and the sale of substantially alllong as Apollo continues to own more than 50% of our assets. Thecommon stock, granting Apollo the right to increase the size of our board of directors elected by Apollo haveand to fill the ability to control decisions affecting our corporate structure, includingresulting vacancies at any time;
authorizing the issuance of additional capital“blank check” preferred stock without any need for action by stockholders;
eliminating the implementationability of stock repurchase programs and the declarationstockholders to call special meetings of dividends. The interests of Apollo could conflict with or differ from your interests as a holderstockholders;
prohibiting stockholders to act by written consent if less than 50.1% of our outstanding common stock. For example, in March 2007, we entered into a credit agreement that provided $449.8 million in cash, which was used primarily to pay a special dividendstock is controlled by Apollo;
| • | requiring the approval of a majority of the board of directors (including a majority of the Apollo directors) to approve business combinations so long as Apollo owns 331/3% of the shares of common stock; and |
establishing advance notice requirements for nominations for election to our shareholders as well as holdersboard of fully vested rollover options. Furthermore, the concentrationdirectors or for proposing matters that can be acted on by stockholders at stockholder meetings.
Our issuance of ownership held by Apolloshares of preferred stock could delay defer or prevent a change of control of us. Our board of directors has the Companyauthority to cause us to issue, without any further vote or impedeaction by the stockholders, shares of preferred stock, par value $0.01 per share, in one or more series, to designate the number of shares constituting any series, and to fix the rights, preferences, privileges and restrictions thereof, including dividend rights, voting rights, rights and terms of redemption, redemption price or prices and liquidation preferences of such series. The issuance of shares of our preferred stock may have the effect of delaying, deferring or preventing a merger, takeover or other business combination which you aschange in control without further action by the stockholders, even where stockholders are offered a stockholder may otherwise view favorably. Additionally, Apollo is inpremium for their shares.
Together, these charter and statutory provisions could make the businessremoval of making or advising on investments in companies it holds,management more difficult and may from timediscourage transactions that otherwise could involve payment of a premium over prevailing market prices for our common stock. Furthermore, the existence of the foregoing provisions, as well as the significant common stock beneficially owned by Apollo, could limit the price that investors might be willing to timepay in the future acquire, interests in or provide advice to businesses that directly or indirectly compete with certain portions of our business or are suppliers or customers of ours. Apollo may also pursue acquisitions that may be complementary to our business, and, as a result, those acquisition opportunities may not be available to us. A sale of a substantial number of shares of stock in the future by funds affiliated with Apollo could cause our stock price to decline. In addition, the significant concentration of share ownership may adversely affect the trading price of our common stock because investors often perceive disadvantages in owning shares in companies with controlling stockholders. So long as Apollo continues to own a significant amount of the outstandingfor shares of our common stock. They could also deter potential acquirers of us, thereby reducing the likelihood that you could receive a premium for your common stock it will continue to be able to strongly influence or effectively control our decisions.
We will be a “controlled company” within the meaning of the New York Stock Exchange rules and, as a result, will qualify for, and intend to rely on, exemptions from certain corporate governance requirements.
Upon the closing of this offering, Apollo will continue to control a majority of our voting common stock. As a result, we will be a “controlled company” within the meaning of the New York Stock Exchange corporate governance standards. Under the New York Stock Exchange rules, a company of which more than 50% of the voting power is held byin an individual, group or another company is a “controlled company” and may elect not to comply with certain New York Stock Exchange corporate governance requirements, including:acquisition.
the requirement that we have a majority of independent directors on our board of directors;
the requirement that we have a nominating and corporate governance committee that is composed entirely of independent directors;
the requirement that we have a compensation committee that is composed entirely of independent directors; and
the requirement for an annual performance evaluation of the nominating and corporate governance and compensation committees.
Following this offering, we intend to utilize these exemptions. As a result, we will not have a majority of independent directors nor will our nominating and corporate governance and compensation committees consist entirely of independent directors and we will not be required to have an annual performance evaluation of the nominating/corporate governance and compensation committees. See “Management.” Accordingly, you will not have the same protections afforded to stockholders of companies that are subject to all of the New York Stock Exchange corporate governance requirements.
You will sufferexperience an immediate and substantial dilution in the net tangible book value of the common stock you purchase.
Prior investors have paid substantially less per share than the price in this offering. The initial offering price is substantially higher than theWe expect to have a net tangible book value per share of the outstanding common stock immediatelydeficit after this offering. Accordingly, basedoffering of $ per share. Based on an assumed initial public offering price of $ per share, (thethe midpoint of the estimated offering range set forth on the cover page of this prospectus), purchasers of common stock in this offeringprospectus, you will experience immediate and substantial dilution of approximately $ per share in net tangible book value of the common stock.stock you purchase in this offering. See “Dilution,” including the discussion of the effects on dilution from a change in the price of this offering.
BecauseDespite our substantial indebtedness, we do not anticipate paying dividendsmay still be able to incur significantly more indebtedness, which could have a material adverse effect on our common stock in the foreseeable future, you should not expect to receive dividends on sharesbusiness, financial condition, results of our common stock.operations or cash flows.
We have no present plans to pay cash dividends toThe terms of the indentures governing our stockholderssenior notes and for the foreseeable future, intend to retain all of our earnings for use in our business. The declaration of any future dividends by us is within the discretion of our board of directorssenior subordinated notes and will be dependent on our earnings, financial condition and capital requirements, as well as any other factors deemed relevant by our board of directors. In addition, our senior secured credit facilities contain covenants limitingrestrictions on our ability to incur additional indebtedness. These restrictions are subject to a number of important qualifications and exceptions, and the paymentindebtedness, if any, incurred in compliance with these restrictions could be substantial. Accordingly, we or our subsidiaries could incur significant additional indebtedness in the future. As of cash dividends withoutMarch 31, 2011, we had approximately $121.7 million available for additional borrowing under the consentsenior secured credit facilities (net of $28.3 million that was considered utilized as a result of the lendersletters of credit), and the indentures governingcovenants under our seniordebt agreements would allow us to borrow a significant amount of additional indebtedness. Additional leverage could have a material adverse effect on our business, financial condition, results of operations or cash flows and senior subordinated notes contain covenants limitingcould increase the paymentrisks described in “—Our substantial indebtedness could adversely affect our ability to raise additional capital to fund our operations, limit our ability to react to changes in the economy or our industry and prevent us from making debt service payments,” “—Our debt agreements impose significant operating and financial restrictions, which could have a material adverse effect on our business, financial condition, results of operations or cash dividends without the consentflows” and “—Because a substantial portion of the holders of the senior and senior subordinated notes.our indebtedness bears interest at rates that fluctuate with changes in certain prevailing short-term interest rates, we are vulnerable to interest rate increases.”
AlthoughThe additional requirements of having a class of publicly traded equity securities may strain our resources and distract management.
Even though RBS Global and Rexnord LLC our wholly-owned subsidiaries, alreadycurrently file periodic reports with the Securities and Exchange Commission, becoming a public company will increase our expenses and administrative burden, in particularSEC, after the consummation of this offering, we will incur expensesbe subject to bring our company into compliance with certain provisionsadditional reporting requirements of the Sarbanes OxleySecurities Exchange Act of 2002 to which we are not currently subject.
As a public company, we will incur significant legal, accounting and other expenses that we did not incur as a private company. In addition, our administrative staff will be required to perform additional tasks. For example, in anticipation of becoming a public company, we will need to create1934, or revise the roles and duties of our board committees, adopt additional internal controls and disclosure controls and procedures, retain a transfer agent and adopt an insider trading policy in compliance with our obligations under the securities laws.
In addition, changing laws, regulations and standards relating to corporate governance and public disclosure, includingExchange Act, the Sarbanes-Oxley Act of 2002, and related regulations implemented byor the SECSarbanes-Oxley Act, and the New York Stock Exchange, are creating uncertaintyDodd-Frank Wall Street Reform and Consumer Protection Act, or the Dodd-Frank Act. The Dodd-Frank Act, signed into law on July 21, 2010, effects comprehensive changes to public company governance and disclosures in the United States and will subject us to additional federal regulation. We cannot predict with any certainty the requirements of the regulations ultimately adopted or how the Dodd-Frank Act and such regulations will impact the cost of compliance for public companies, increasing legal and financial compliance costs and making some activities more time consuming.a company with publicly traded common stock. We are currently evaluating and monitoring developments
with respect to the Dodd-Frank Act and other new and proposed rules and cannot predict or estimate the amount of the additional costs we may incur or the timing of such costs. These laws, regulations and standards are subject to varying interpretations, in many cases due to their lack of specificity, and, as a result, their application in practice may evolve over time as new guidance is provided by regulatory and governing bodies. This could result in continuing uncertainty regarding compliance matters and higher costs necessitated by ongoing revisions to disclosure and governance practices. We intend to invest resources to comply with evolving laws, regulations and standards, and this investment may result in increased general and administrative expenses and a diversion of management’s time and attention from revenue-generating activities to compliance activities. If our efforts to comply with new laws, regulations and standards differ from the activities intended by regulatory or governing bodies due to ambiguities related to practice, regulatory authorities may initiate legal proceedings against us and our business may be harmed. We also expect that being a public company with publicly traded common stock and these new rules and regulations will make it more expensive for us to obtain director and officer
30
liability insurance, and we may be required to accept reduced coverage or incur substantially higher costs to obtain coverage. These factors could also make it more difficult for us to attract and retain qualified members of our board of directors, particularly to serve on our audit committee, and qualified executive officers.
The Sarbanes-Oxley Act requires that we maintain effective disclosure controls and procedures and internal control for financial reporting. These requirements may place a strain on our systems and resources. Under Section 404 of the Sarbanes-Oxley Act, we will be required to include a report of management on our internal control over financial reporting in our Annual Reports on Form 10-K. After consummation of this offering, our independent public accountants auditing our financial statements must attest to the effectiveness of our internal control over financial reporting. This requirement will first apply to our Annual Report on Form 10-K for our year ending March 31, 2013. In order to maintain and improve the effectiveness of our disclosure controls and procedures and internal control over financial reporting, significant resources and management oversight will be required. This may divert management’s attention from other business concerns, which could have a material adverse effect on our business, financial condition, results of operations and cash flows. If we are unable to conclude that our disclosure controls and procedures and internal control over financial reporting are effective, or if our independent public accounting firm is unable to provide us with an unqualified report as to management’s assessment of the effectiveness of our internal control over financial reporting in future years, investors may lose confidence in our financial reports and our stock price may decline.
31
CAUTIONARY NOTICE REGARDING FORWARD-LOOKING STATEMENTS
Our disclosureThis prospectus includes “forward-looking statements” within the meaning of the federal securities laws that involve risks and analysisuncertainties. Forward-looking statements include statements we make concerning our plans, objectives, goals, strategies, future events, future revenues or performance, capital expenditures, financing needs and other information that is not historical information and, in particular, appear under the headings “Summary,” “Risk Factors,” “Management’s Discussion and Analysis of Financial Condition and Results of Operations” and “Business.” When used in this prospectus, concerning our operations, cash flows and financial position, including, in particular, the likelihood of our success in developing and expanding our business and the realization of sales from our backlog, include forward-looking statements. Statements that are predictive in nature, that depend upon or refer to future events or conditions, or that include words such as“estimates,” “expects,” “anticipates,” “intends,“projects,” “forecasts,” “plans,” “intends,” “believes,” “estimates”“foresees,” “seeks,” “likely,” “may,” “might,” “will,” “should,” “goal,” “target” or “intends” and variations of these words or similar expressions (or the negative versions of any such words) are intended to identify forward-looking statements. Although theseAll forward-looking statements are based upon reasonable assumptions, including projectionsinformation available to us on the date of orders, sales, operating margins, earnings, cash flow, research and development costs, working capital and capital expenditures, theythis prospectus.
These forward-looking statements are subject to risks, uncertainties and uncertaintiesother factors, many of which are outside of our control, that are described more fullycould cause actual results to differ materially from the results discussed in the forward-looking statements, including, among other things, the matters discussed in this prospectus in the section titledsections captioned “Summary,” “Risk Factors,” “Management’s Discussion and Analysis of Financial Condition and Results of Operations” and “Business.” Some of the factors that we believe could affect our results include:
the impact of our substantial indebtedness;
the effect of local and national economic, credit and capital market conditions on the economy in general, and on the industries in which we operate in particular;
access to available and reasonable financing on a timely basis;
our competitive environment;
dependence on independent distributors;
general economic and business conditions, market factors and our dependence on customers in cyclical industries;
the seasonality of our sales;
impact of weather on the demand for our products;
availability of financing for our customers;
changes in technology and manufacturing techniques;
loss of key personnel;
increases in cost of our raw materials and our possible inability to increase product prices to offset such increases;
the loss of any significant customer;
inability to make necessary capital expenditures;
risks associated with international operations;
the costs of environmental compliance and/or the imposition of liabilities under environmental, health and safety laws and regulations;
the costs of asbestos claims;
the costs of Zurn’s class action litigation;
a declining construction market;
solvency of insurance carriers;
32
viability of key suppliers;
reliance on intellectual property;
potential product liability claims;
work stoppages by unionized employees;
integration of recent and future acquisitions into our business;
changes in pension funding requirements;
control by our principal equityholders; and
the other factors set forth herein, including those set forth under “Risk Factors.” Accordingly, we can give no assurance
There are likely other factors that we will achievecould cause our actual results to differ materially from the results anticipated or impliedreferred to in the forward-looking statements. All forward-looking statements attributable to us apply only as of the date of this prospectus and are expressly qualified in their entirety by our forward-looking statements.the cautionary statements included in this prospectus. We undertake no obligation to publicly update or revise any forward-looking statements whether as a result of new information, futureto reflect events or otherwise,circumstances after the date made or to reflect the occurrence of unanticipated events, except as required by law.
33
Assuming an initial public offering price of $ per share, we estimate that we will receive net proceeds from this offering of approximately $ million, after deducting underwriting discounts and commissions and other estimated expenses of $ million payable by us. This estimate assumes an initial public offering price of $ per share, the midpoint of the range set forth on the cover page of this prospectus. A $1.00 increase (decrease) in the assumed initial public offering price of $ per share would increase (decrease) the net proceeds to us from this offering by $ , assuming the number of shares offered by us, as set forth on the cover page of this prospectus, remains the same and after deducting the estimated underwriting discounts and commissions and estimated expenses payable by us.
We intend to use a portion of the net proceeds to: first, repay all $that we receive (i) to redeem up to $300.0 million in aggregate principal amount of the outstanding PIK toggleour 11.75% senior indebtednesssubordinated notes due 2013 of Rexnord Holdings as of the date of this prospectus2016 plus early redemption premiums of $ million and accrued interest; second,interest, (ii) to pay Apollo or its affiliates a $20.0fee of $ million fee to Apolloupon the consummation of this offering in connection with the termination of the fee arrangementour management services agreement, as described under the management consulting agreement, see “Related“Certain Relationships and Related Party Transactions—Management Service Fees”;Transactions,” and third, to use the remaining balance of the net proceeds(iii) for general corporate purposes. Borrowings under the PIK toggleAs of March 31, 2011, we had $300.0 million in aggregate principal amount of our 11.75% senior secured indebtedness mature on March 1, 2013 andsubordinated notes outstanding, which bear interest at a floating rate equal to an applicable margin plus a rate determined by reference to the interest rate payable in the London interbank market for dollar deposits, adjusted for certain additional costs. The interest rateof 11.75% per annum and mature on such borrowings was 10.06% at March 31, 2008. After giving pro forma effect to the offering and our intended use of theAugust 1, 2016.
Any net proceeds used to repay this indebtedness and pay Apollo its termination fee, we would have had $207.7redeem all $300.0 million of cash and cash equivalents available for general corporate purposes asoutstanding aggregate principal amount of June 28, 2008.
Our affiliates, including Apollo, that are holders of the PIK toggleour 11.75% senior indebtedness due 2013 of Rexnord Holdings will receive net proceeds from this offering in connection with the repayment of such indebtedness. See “Related Party Transactions—Debt Repayment.” As of the date of this prospectus our affiliates, including Apollo, held $43.2 million of the PIK toggle senior indebtedness due 2013, all of whichsubordinated notes would be repaid withfirst contributed by the Company to RBS Global so that RBS Global may effect such redemption or repayment. Pending the application of the net proceeds of this offering. In addition, pursuant to the termsoffering, as described above, all or a portion of the indebtedness being repaid, our affiliates that hold such indebtedness would be entitled to receive accrued interest and prepayment premiums in respect of such indebtedness. As such, assuming that our affiliates, including Apollo, neither increase nor decrease their holdings of the indebtedness to be repaid, we estimate that they would receive $ million in the aggregate upon completionnet proceeds of this offering and repayment of such indebtedness.may be invested by us in short-term interest bearing investments.
34
We currently intend to retain all future earnings, if any, for use in the operation of our business and to fund future growth. We do not anticipate paying any dividends for the foreseeable future, andIn addition, our senior secured credit facilities and the indentures governing theour senior and senior subordinated notes limit our ability to pay dividends or other distributions on our common stock. See “Description of Indebtedness.” The decision whether to pay dividends will be made by our board of directors in light of conditions then existing, including factors such as our results of operations, financial condition and requirements, business conditions and covenants under any applicable contractual arrangements.
35
The following table sets forth our capitalization as of June 28, 2008:March 31, 2011:
on an actual basis;
on a pro forma, as adjusted, basis giving effect to the repayment of the PIK toggle senior indebtedness as described below (which is occurring irrespective of the offering); and
on a pro forma, as further adjusted, basis giving effect to our sale of shares of common stock in this offering at an assumed offering price of $ , which is the midpoint of the range listed on the cover page of this prospectus, and our expected use of the net proceeds of this offering.offering, as well as the repayment of the PIK toggle senior indebtedness as described below (which is occurring irrespective of the offering).
You should read this table in conjunction with our condensed consolidated financial statements and related notes for the quarter ended June 28, 2008 and our consolidated financial statements and the related notes for the fiscal year ended March 31, 2008,2011, “Management’s Discussion and Analysis of Financial Condition and Results of Operations” and “Use of Proceeds” included elsewhere in this prospectus.
| As of June 28, 2008 (9) | |||||||
| Historical | Pro Forma, As Adjusted (8) | ||||||
| (in millions) | |||||||
Debt | |||||||
Term loans | $ | 767.5 | $ | 767.5 | |||
Revolving credit facility (1) | — | — | |||||
Accounts receivable securitization program (2) | — | — | |||||
PIK toggle senior indebtedness due 2013 (3) | 526.0 | — | |||||
9.50% senior notes due 2014 (4) | 803.0 | 803.0 | |||||
8.875% senior notes due 2016 | 150.0 | 150.0 | |||||
11.75% senior subordinated notes due 2016 | 300.0 | 300.0 | |||||
10.125% senior subordinated notes due 2012 | 0.3 | 0.3 | |||||
Other (5) | 3.3 | 3.3 | |||||
Total debt, including current portion | 2,550.1 | 2,024.1 | |||||
Stockholders’ equity: | |||||||
Common stock, $0.01 par value; shares authorized; shares and shares issued (6) | 0.2 | ||||||
Additional paid in capital | 275.3 | ||||||
Retained earnings (deficit) (7) | 1.6 | ||||||
Accumulated other comprehensive income | 4.4 | ||||||
Treasury stock at cost ( shares) | (0.7 | ) | |||||
Total stockholders’ equity | 280.8 | ||||||
Total capitalization | $ | 2,830.9 | |||||
| As of March 31, 2011 (1) | ||||||||||||
| (in millions, except share amounts) | Actual | Pro forma as adjusted for extinguishment of PIK toggle senior indebtedness | Pro forma as further adjusted (2) | |||||||||
Debt: | ||||||||||||
Term loans | $ | 761.5 | $ | 761.5 | $ | 761.5 | ||||||
Borrowing under revolving credit facility | — | — | — | |||||||||
Accounts receivable securitization program | — | — | — | |||||||||
PIK toggle senior indebtedness (3) | 93.2 | — | — | |||||||||
8.50% senior notes due 2018 | 1,145.0 | 1,145.0 | 1,145.0 | |||||||||
8.875% senior notes due 2016 | 2.0 | 2.0 | 2.0 | |||||||||
11.75% senior subordinated notes due 2016 | 300.0 | 300.0 | — | |||||||||
Other (4) | 12.4 | 12.4 | 12.4 | |||||||||
Total debt, including current portion | 2,314.1 | 2,220.9 | 1,920.9 | |||||||||
Stockholders’ equity (deficit): | ||||||||||||
Common stock, $0.01 par value; shares authorized and shares issued (5) | 0.2 | 0.2 | ||||||||||
Additional paid-in capital | 293.3 | 293.3 | ||||||||||
Retained earnings (deficit) (6) | (391.5 | ) | (392.0 | ) | ||||||||
Accumulated other comprehensive income | 16.1 | 16.1 | ||||||||||
Treasury stock at cost (216,423 shares) | (6.3 | ) | (6.3 | ) | ||||||||
Total stockholders’ equity (deficit) | (88.2 | ) | (88.7 | ) | ||||||||
Total capitalization | $ | 2,225.9 | 2,132.2 | |||||||||
| (1) |
|
|
| A $1.00 increase (decrease) in the assumed initial public offering price of $ per share (the midpoint of the range set forth on the cover page of this prospectus) would increase (decrease) each of cash, additional paid-in capital and total capitalization by $ , assuming the number of shares offered by us, as set forth on the cover page of this prospectus, remains the same and after deducting the estimated underwriting discounts and commissions and estimated expenses payable by us. |
36
| (4) | Primarily consists of |
| (5) | We expect to complete a for one stock split of |
| (6) | Pro forma as further adjusted retained deficit reflects the impact of this offering and |
37
Dilution is the amount by which the offering price paid by the purchasers of the common stock to be sold in this offering exceeds the net tangible book value per share of common stock after the offering. Net tangible book value per share is determined at any date by subtracting our total liabilities from the total book value of our tangible assets and dividing the difference by the number of shares of common stock deemed to be outstanding at that date.
Our net tangible book valuedeficit as of , 2008March 31, 2011 was $ million,$1.749 billion, or $$109.13 per share. After giving effect to the receipt and our intended use of approximately $ million of estimated net proceeds from our sale of shares of common stock in this offering at an assumed offering price of $ per share, which represents the midpoint of the range set forth on the front cover of this prospectus, our adjusted net tangible book valuedeficit as of , 20082011 would have been approximately $ million, or $ per share. This represents an immediate increase in pro forma net tangible book value of $ per share to existing stockholders and an immediate dilution of $ per share to new investors purchasing shares of common stock in the offering. The following table illustrates this substantial and immediate per share dilution to new investors:
| Per Share | ||||
Assumed initial public offering price per share | $ | |||
Net tangible book value (deficit) before the offering | (109.13 | ) | ||
Increase per share attributable to investors in the offering | ||||
Pro forma net tangible book value (deficit) after the offering | ||||
Dilution per share to new investors | $ | |||
A $1.00 increase (decrease) in the assumed initial public offering price of $ per share would increase (decrease) our pro forma net tangible book value by $ , the as adjusted net tangible book value per share after this offering by $ per share and the dilution per share to new investors in this offering by $ , assuming the number of shares offered by us, as set forth on the cover page of this prospectus, remains the same and after deducting the estimated underwriting discounts and commissions and estimated expenses payable by us.
The following table summarizes on an as adjusted basis as of , 2008,2011, giving effect to:
the total number of shares of common stock purchased from us;
the total consideration paid to us, assuming an initial public offering price of $ per share (before deducting the estimated underwriting discount and commissions and offering expenses payable by us in connection with this offering); and
the average price per share paid by existing stockholders and by new investors purchasing shares in this offering:
| Shares Purchased | Total Consideration | Average Price Per Share | Shares Purchased | Total Consideration | Average Price Per | |||||||||||||||||||||||||||||
Number | Percent | Amount | Percent | Number | Percent | Amount | Percent | Share | ||||||||||||||||||||||||||
Existing stockholders | % | $ | % | $ | % | $ | % | $ | ||||||||||||||||||||||||||
Investors in the offering | % | % | % | % | ||||||||||||||||||||||||||||||
Total | 100 | % | $ | 100 | % | $ | 100 | % | $ | 100 | % | $ | ||||||||||||||||||||||
38
A $1.00 increase (decrease) in the assumed initial public offering price of $ per share (the midpoint of the range set forth on the cover page of this prospectus) would increase (decrease) total consideration paid by
existing stockholders, total consideration paid by new investors and the average price per share by $ , $ and $ , respectively, assuming the number of shares offered by us, as set forth on the cover page of this prospectus, remains the same, and without deducting underwriting discounts and commissions and estimated expenses payable by us.
The tables and calculations above assume no exercise of stock options outstanding as of , 20082011 to purchase shares of common stock at a weighted average exercise price of $ per share. If these options were exercised at the weighted average exercise price, the additional dilution per share to new investors would be $ .
The tables and calculations above also assume no exercise of the underwriters’ over-allotment option. If the underwriters exercise their over-allotment option in full, then new investors would purchase shares, or approximately % of shares outstanding, the total consideration paid by new investors would increase to $ , or % of the total consideration paid (based on the midpoint of the range set forth on the cover page of this prospectus), and the additional dilution per share to new investors would be $ .
39
SELECTED FINANCIAL INFORMATION
The selected financial information as of March 31, 20072010 and 20082011 and for our fiscal years ended March 31, 2006, 20072009, 2010 and 20082011 have been derived from our consolidated financial statements and related notes thereto, which have been audited by Ernst & Young LLP, an independent registered public accounting firm, and are included elsewhere in this prospectus. The selected financial information as of and for the three months ended June 30, 2007 and June 28, 2008 have been derived from our unaudited consolidated financial statements and related notes thereto included elsewhere in this prospectus. Results for the three months ended June 30, 2007 and June 28, 2008 are not necessarily indicative of the results that may be expected for the entire year. The financial information for the years ended March 31, 20042007 and 20052008 have also been derived from financial statements audited by Ernst & Young LLP. The period from April 1, 2006 to July 21, 2006 includes the accounts of RBS Global prior to the Merger.acquisition by Apollo. The period from July 22, 2006 to March 31, 2007 includes the accounts of RBS Global after the Merger.Apollo acquisition. These two periods account for our fiscal year ended March 31, 2007. We refer to the financial statements prior to the MergerApollo acquisition as “Predecessor.” The following information should be read in conjunction with “Management’s Discussion and Analysis of Financial Condition and Results of Operations” and our consolidated financial statements and related notes thereto included elsewhere in this prospectus.
| Predecessor (1) | Successor | |||||||||||||||||||||||||||||||||
| Year Ended March 31, 2004 | Year Ended March 31, 2005 | Year Ended March 31, 2006 (2) | Period from April 1, 2006 through July 21, 2006 | Period from July 22, 2006 through March 31, 2007 (3) | Year Ended March 31, 2008 (4) | Three Months Ended June 30, 2007 | Three Months Ended June 28, 2008 | |||||||||||||||||||||||||||
| (in millions, except per share amounts) | ||||||||||||||||||||||||||||||||||
Statement of Operations: | ||||||||||||||||||||||||||||||||||
Net sales | $ | 712.8 | $ | 811.0 | $ | 1,081.4 | $ | 334.2 | $ | 921.5 | $ | 1,853.5 | $ | 448.2 | $ | 496.1 | ||||||||||||||||||
Cost of sales (5) | 485.4 | 555.8 | 742.3 | 237.7 | 628.2 | 1,250.4 | 306.2 | 334.2 | ||||||||||||||||||||||||||
Gross profit | 227.4 | 255.2 | 339.1 | 96.5 | 293.3 | 603.1 | 142.0 | 161.9 | ||||||||||||||||||||||||||
Selling, general and administrative expenses | 148.1 | 153.6 | 187.8 | 63.1 | 159.3 | 312.2 | 78.1 | 86.1 | ||||||||||||||||||||||||||
Restructuring and other similar costs | 2.6 | 7.3 | 31.1 | — | — | — | — | — | ||||||||||||||||||||||||||
Curtailment gain | (6.6 | ) | — | — | — | — | — | — | — | |||||||||||||||||||||||||
Loss on divestiture | — | — | — | — | — | 11.2 | — | — | ||||||||||||||||||||||||||
(Gain) on Canal Street facility accident, net | — | — | — | — | (6.0 | ) | (29.2 | ) | (8.1 | ) | — | |||||||||||||||||||||||
Transaction-related costs | — | — | — | 62.7 | — | — | — | — | ||||||||||||||||||||||||||
Amortization of intangible assets | 13.9 | 13.8 | 15.7 | 5.0 | 26.9 | 49.9 | 12.9 | 12.5 | ||||||||||||||||||||||||||
Income (loss) from operations | 69.4 | 80.5 | 104.5 | (34.3 | ) | 113.1 | 259.0 | 59.1 | 63.3 | |||||||||||||||||||||||||
Non-operating income (expense): | ||||||||||||||||||||||||||||||||||
Interest expense, net | (45.4 | ) | (44.0 | ) | (61.5 | ) | (21.0 | ) | (109.8 | ) | (254.3 | ) | (64.1 | ) | (58.2 | ) | ||||||||||||||||||
Other income (expense), net | (1.1 | ) | (0.7 | ) | (3.8 | ) | (0.4 | ) | 5.7 | (5.3 | ) | (2.9 | ) | (2.2 | ) | |||||||||||||||||||
Income (loss) before income taxes | 22.9 | 35.8 | 39.2 | (55.7 | ) | 9.0 | (0.6 | ) | (7.9 | ) | 2.9 | |||||||||||||||||||||||
Provision (benefit) for income taxes | 8.7 | 14.2 | 16.3 | (16.1 | ) | 9.2 | (0.9 | ) | (0.5 | ) | 2.7 | |||||||||||||||||||||||
Net income (loss) | $ | 14.2 | $ | 21.6 | $ | 22.9 | $ | (39.6 | ) | $ | (0.2 | ) | $ | 0.3 | $ | (7.4 | ) | $ | 0.2 | |||||||||||||||
Net income (loss) per share: | ||||||||||||||||||||||||||||||||||
Basic | $ | $ | ||||||||||||||||||||||||||||||||
Diluted | ||||||||||||||||||||||||||||||||||
Weighted-average number of shares outstanding: | ||||||||||||||||||||||||||||||||||
Basic | ||||||||||||||||||||||||||||||||||
Effect of dilutive stock options | ||||||||||||||||||||||||||||||||||
Diluted | ||||||||||||||||||||||||||||||||||
Other Data: | ||||||||||||||||||||||||||||||||||
Net cash provided by (used for): | ||||||||||||||||||||||||||||||||||
Operating activities | 45.0 | 67.4 | 91.9 | (4.4 | ) | 63.4 | 232.7 | 33.1 | 19.0 | |||||||||||||||||||||||||
Investing activities | (30.7 | ) | (19.3 | ) | (336.1 | ) | (15.7 | ) | (1,925.5 | ) | (121.6 | ) | (8.3 | ) | (10.1 | ) | ||||||||||||||||||
Financing activities | (31.2 | ) | (42.0 | ) | 240.6 | 8.2 | 1,909.0 | (15.6 | ) | (12.4 | ) | (0.1 | ) | |||||||||||||||||||||
Depreciation and amortization of intangible assets | 45.4 | 45.4 | 58.7 | 19.0 | 63.0 | 104.1 | 27.0 | 27.1 | ||||||||||||||||||||||||||
Capital expenditures | 22.1 | 25.7 | 37.1 | 11.7 | 28.0 | 54.9 | 8.3 | 11.0 | ||||||||||||||||||||||||||
| Predecessor (1) | Successor | |||||||||||||||||||||||||||
(dollars in millions, except share and per share amounts) | Period from April 1, 2006 through July 21, 2006 | Period from July 22, 2006 through March 31, 2007 (2) | Year Ended March 31, 2008 (3) (4) | Year Ended March 31, 2009 (4) (5) | Year Ended March 31, 2010 (4) | Year Ended March 31, 2011 | ||||||||||||||||||||||
Statement of Operations: | ||||||||||||||||||||||||||||
Net Sales | $ | 334.2 | $ | 921.5 | $ | 1,853.5 | $ | 1,882.0 | $ | 1,510.0 | $ | 1,699.6 | ||||||||||||||||
Cost of Sales | 237.7 | 628.2 | 1,250.4 | 1,290.1 | 994.4 | 1,102.8 | ||||||||||||||||||||||
Gross Profit | 96.5 | 293.3 | 603.1 | 591.9 | 515.6 | 596.8 | ||||||||||||||||||||||
Selling, General and Administrative Expenses | 63.1 | 159.3 | 313.3 | 467.8 | 297.7 | 329.1 | ||||||||||||||||||||||
Loss on Divestiture (6) | — | — | 11.2 | — | — | — | ||||||||||||||||||||||
(Gain) on Canal Street Facility Accident, net (7) | — | (6.0 | ) | (29.2 | ) | — | — | — | ||||||||||||||||||||
Intangible Impairment Charges | — | — | — | 422.0 | — | — | ||||||||||||||||||||||
Transaction-Related Costs (8) | 62.7 | — | — | — | — | — | ||||||||||||||||||||||
Restructuring and Other Similar Costs | — | — | — | 24.5 | 6.8 | — | ||||||||||||||||||||||
Amortization of Intangible Assets | 5.0 | 26.9 | 49.9 | 48.9 | 49.7 | 48.6 | ||||||||||||||||||||||
(Loss) Income from Operations | (34.3 | ) | 113.1 | 257.9 | (371.3 | ) | 161.4 | 219.1 | ||||||||||||||||||||
Non-Operating Income (Expense): | ||||||||||||||||||||||||||||
Interest Expense, net | (21.0 | ) | (109.8 | ) | (254.3 | ) | (230.4 | ) | (194.2 | ) | (180.8 | ) | ||||||||||||||||
Gain (Loss) on Debt Extinguishment | — | — | — | 103.7 | 167.8 | (100.8 | ) | |||||||||||||||||||||
Other (Expense) Income, net | (0.4 | ) | 5.7 | (5.3 | ) | (3.0 | ) | (16.4 | ) | 1.1 | ||||||||||||||||||
(Loss) Income Before Income Taxes | (55.7 | ) | 9.0 | (1.7 | ) | (501.0 | ) | 118.6 | (61.4 | ) | ||||||||||||||||||
(Benefit) Provision for Income Taxes | (16.1 | ) | 9.2 | (1.3 | ) | (72.0 | ) | 30.5 | (10.1 | ) | ||||||||||||||||||
Net (Loss) Income | $ | (39.6 | ) | $ | (0.2 | ) | $ | (0.4 | ) | $ | (429.0 | ) | $ | 88.1 | $ | (51.3 | ) | |||||||||||
Net (loss) Income per share: | ||||||||||||||||||||||||||||
Basic | ||||||||||||||||||||||||||||
Diluted | ||||||||||||||||||||||||||||
Weighted-average number of shares outstanding: | ||||||||||||||||||||||||||||
Basic | ||||||||||||||||||||||||||||
Effect of dilutive stock options | ||||||||||||||||||||||||||||
Diluted | ||||||||||||||||||||||||||||
Other Data: | ||||||||||||||||||||||||||||
Net Cash (Used for) Provided by: | ||||||||||||||||||||||||||||
Operating Activities | (4.4 | ) | 63.4 | 232.7 | 155.0 | 155.5 | 164.5 | |||||||||||||||||||||
Investing Activities | (15.7 | ) | (1,925.5 | ) | (121.6 | ) | (54.5 | ) | (22.0 | ) | (35.5 | ) | ||||||||||||||||
Financing Activities | 8.2 | 1,909.0 | (15.6 | ) | 36.6 | (161.5 | ) | (6.9 | ) | |||||||||||||||||||
Depreciation and Amortization of Intangible Assets | 19.0 | 63.0 | 104.1 | 109.6 | 109.3 | 106.1 | ||||||||||||||||||||||
Capital Expenditures | 11.7 | 28.0 | 54.9 | 39.1 | 22.0 | 37.6 | ||||||||||||||||||||||
(in millions) Balance Sheet Data: Cash Working capital (6) Total assets Total debt (7) Stockholders’ equity Predecessor (1) Successor March 31, June 30,
2007 June 28,
2008 2004 2005 2006 (2) 2007 (3) 2008 (4) $ 21.8 $ 26.3 $ 22.5 $ 58.2 $ 156.3 $ 70.5 $ 165.5 117.6 118.9 159.2 368.5 447.1 378.4 476.3 1,299.1 1,277.4 1,608.1 3,783.4 3,826.3 3,778.7 3,839.0 550.8 506.7 753.7 2,496.9 2,536.8 2,491.3 2,550.1 399.1 424.7 441.1 256.3 273.1 262.3 280.8
40
| March 31, | ||||||||||||||||||||
| (dollars in millions) | 2007 | 2008 | 2009 | 2010 | 2011 | |||||||||||||||
Balance Sheet Data: | ||||||||||||||||||||
Cash and Cash Equivalents | $ | 58.2 | $ | 156.3 | $ | 287.9 | $ | 263.9 | $ | 391.0 | ||||||||||
Working Capital (9) | 368.5 | 447.1 | 555.2 | 481.9 | 483.6 | |||||||||||||||
Total Assets | 3,783.4 | 3,826.3 | 3,218.8 | 3,016.5 | 3,099.7 | |||||||||||||||
Total Debt (10) | 2,496.9 | 2,536.8 | 2,526.1 | 2,215.5 | 2,314.1 | |||||||||||||||
Stockholders’ Equity (Deficit) | 256.3 | 273.1 | (177.8 | ) | (57.5 | ) | (88.2 | ) | ||||||||||||
| (1) | Consolidated financial data for all periods subsequent to July 21, 2006 (the |
| Consolidated financial data as of March 31, 2007 and for the period from July 22, 2006 through March 31, 2007 reflects the estimated fair value of assets acquired and liabilities assumed in connection with the Zurn acquisition on February 7, 2007. As a result, the comparability of the operating results for the periods presented is affected by the revaluation of the assets acquired and liabilities assumed on the date of both the |
| Consolidated financial data as of and for |
| (4) | Financial data for fiscal 2008 to 2010 has been adjusted for our voluntary change in accounting for actuarial gains and losses related to its pension and other postretirement benefit plans. The change in accounting did not have any impact on the financial data prior to fiscal 2008. See Note 2 to our audited consolidated financial statements included elsewhere in this prospectus. |
| (5) |
| (6) | On March 28, 2008, we sold a French subsidiary, Rexnord SAS, to members of our local management team for €1 (one Euro). This loss includes Rexnord SAS’s cash on hand of $2.5 million at March 28, 2008, that pursuant to the agreement was included with the net assets divested. |
| (7) | We recognized a net gain of $35.2 million related to an accident at our Canal Street (Wisconsin) facility from the date of the accident (December 6, 2006) through March 31, 2008. $14.2 million of the net gain represents the excess property insurance recoveries (at replacement value) over the write-off of tangible assets (at net book value) and other direct expenses related to the |
| (8) | Transaction-related costs represent expenses incurred in |
| Represents total current assets less total current liabilities. |
| Total debt represents long-term debt plus the current portion of long-term debt. |
41
MANAGEMENT’S DISCUSSION AND ANALYSIS OF
FINANCIAL CONDITION AND RESULTS OF OPERATIONS
The following discussion of results of operations and financial condition covers periods prior to the consummationacquisition of the MergerFontaine-Alliance Inc. and the GA and Zurn acquisitions.affiliates (“Fontaine”). Our financial performance includes: (i) GA fromincludes Fontaine subsequent to February 1, 2008 through June 28, 2008; (ii) Zurn from February 8, 2007 through June 28, 2008 and (iii) the impact of the Merger from July 22, 2006 through June 28, 2008.2009. Accordingly, the discussion and analysis of historical periodsfiscal 2009 does not fully reflect the significant impact thatof the Merger and the GA and Zurn transactions had, and will have on us, including significantly increased liquidity requirements.Fontaine transaction. You should read the following discussion of our results of operations and financial condition together with the “Selected Historical Financial Data”Information” and all of our consolidated financial statements and related notes included elsewhere in this prospectus. Our fiscal year is the year ending March 31 of the corresponding calendar year. For example, our fiscal year 2011, means the period from April 1, 2010 to March 31, 2011. This discussion contains forward-looking statements and involves numerous risks and uncertainties, including, but not limited to, those described in the “Risk Factors” section of this prospectus. Actual results may differ materially from those contained in any forward-looking statements. See also “Cautionary Notice Regarding Forward-Looking Statements”found elsewhere in this prospectus.
The information contained in this section is provided as a supplement to the audited consolidated financial statements and the related notes included elsewhere in this prospectus to help provide an understanding of our financial condition, changes in our financial condition and results of our operations. This section is organized as follows:
Company Overview. This section provides a general description of our business as well as recent developments that we believe are necessary to understand our financial condition and results of our operations and to anticipate future trends in our business.
Critical Accounting Estimates. This section discusses the accounting policiesRestructuring and estimates that we consider to be important to our financial condition and results of operations and that require significant judgment and estimates on the part of management in their application.
Results of Operations. This section provides an analysis of our results of operations for our quarter ended June 28, 2008 and our fiscal years ended March 31, 2006, 2007 and 2008, in each case as compared to the prior period’s performance.
Liquidity and Capital Resources. This section provides an analysis of our cash flows for our quarter ended June 28, 2008 and our fiscal years ended March 31, 2006, 2007 and 2008, as well as a discussion of our indebtedness and its potential effects on our liquidity.
Tabular Disclosure of Contractual ObligationsOther Similar Costs. This section provides a discussiondescription of our commitments as of March 31, 2008.the restructuring actions we executed to reduce operating costs and improve profitability.
Quantitative and Qualitative Disclosures about Market Risk. This section discusses our exposure to potential losses arising from adverse changes in interest rates and commodity prices.
Recent Accounting Pronouncements. This section describes new accounting requirements that we have not yet adopted but that could potentially impact our results of operations and financial position.
Overview
General
We believe we are a leading diversified, multi-platform industrial company strategically well positioned within the markets and industries we serve. Currently, our business is comprised of two strategic platforms: (i) Power Transmission, which produces gears, couplings, industrial bearings, aerospace bearings and seals, flattop, special components and industrial chain and conveying equipment, and (ii) Water Management, which produces professional grade specification plumbing, water treatment and waste water control products. Our strategy is to build the Company around multi-billion dollar, global strategic platforms that participate in end markets with above average growth characteristics where we are, or have the opportunity to become, the industry leader. We
have successfully completed and integrated several acquisitions and expect to continue to pursue strategic acquisitions within our existing platforms that will expand our geographic presence, broaden our product lines and allow us to move into adjacent markets. Over time, we anticipate adding additional strategic platforms to our company. We believe that we have the broadest portfolio of highly engineered, mission and project-critical Power Transmission products in the industrial and aerospace end markets, including gears, couplings, industrial bearings, flattop, aerospace bearings and seals, special components and industrial chain. Our Power Transmission products are used in the plants and equipment of companies in diverse end market industries, including aerospace, cement and aggregates, construction, energy, food and beverages and forest and wood products. Our Power Transmission products are either incorporated into products sold by OEMs or sold to end users through industrial distributors as aftermarket products. We have a significant installed base of Power Transmission products comprised primarily of components that are consumed or worn out in use and that have a predictable replacement cycle. Our Water Management platform is a leader in the multi-billion dollar, specification-driven, non-residential construction market for water management products, and, with the recent acquisition of GA, we have gained entry into the municipal water and wastewater treatment markets. Although our results of operations are dependent on general economic conditions, we believe our significant installed base generates aftermarket sales that may partially mitigate the impact of economic downturns on our results of operations. Due to the similarity of our products across our portfolio of products, historically we have not experienced significant changes in gross margins due to changes in sales product mix or sales channel mix.
The Sale of Rexnord SAS
In March 28, 2008, we sold a French subsidiary, Rexnord SAS, to members of that company’s local management team for €1 (one Euro), subject to a customary post-close working capital adjustment. We made the decision to sell Rexnord SAS to the local management team for one Euro as the business would have required a substantial investment (both financial and by Company management) to increase the overall market share position of certain products sold by the business to levels consistent with our long-term strategic plan. Rexnord SAS was a wholly owned subsidiary located in Raon, France with approximately 140 employees. This entity occupied a 217,000 square foot manufacturing facility that supported portions of our European Power Transmission business. In connection with the sale, we recorded a pretax loss on divestiture of approximately $11.2 million (including transaction costs), which was recognized in our fourth quarter of our fiscal year ended March 31, 2008. Also as part of the transaction, we signed a supplemental commercial agreement defining the prospective commercial relationship between us and the divested entity (“PTP Industry”). Through this agreement, we maintain direct access to key regional distributors and in return have agreed to purchase from PTP Industry certain locally manufactured coupling product lines and components to serve our local customer base. The divestiture is not expected to have a material impact on our overall capabilities or the results of our operations.
The GA Acquisition
On January 31, 2008, we utilized existing cash balances to purchase GA Industries, Inc., or GA, for $73.7 million, net of $3.2 million of cash acquired. This acquisition expanded our Water Management platform into the water and wastewater markets, specifically in municipal, hydropower and industrial environments. GA Industries, Inc. is comprised of GA Industries and Rodney Hunt Company, Inc. GA Industries is a manufacturer of automatic control valves, check valves and air valves. Rodney Hunt Company, Inc., its wholly owned subsidiary at the time of closing, is a leader in the design and manufacture of butterfly valves, sluice/slide gates and other specialized products for municipal, industrial, and hydropower applications. Our results and financial statements for our fiscal year ended March 31, 2008, include GA for the period from February 1, 2008 through March 31, 2008.
The Zurn Acquisition
On February 7, 2007, we acquired Zurn from an affiliate of Apollo for a cash purchase price of $942.5 million, including transaction costs. The purchase price was financed through an equity investment by Apollo and its affiliates of approximately $282.0 million and debt financing of approximately $669.3 million, consisting of (i) $319.3 million of 9.50% senior notes due 2014 (including a bond issue premium of $9.3 million),
(ii) $150.0 million of 8.875% senior notes due 2016 and (iii) $200.0 million of borrowings under existing senior secured credit facilities. This acquisition created a new strategic water management platform. Zurn is a leader in the multi-billion dollar non-residential construction and replacement market for plumbing fixtures and fittings. It designs and manufactures plumbing products used in commercial and industrial construction, renovation and facilities maintenance markets in North America and holds a leading market position across most of its businesses. Our results and financial statements for our fiscal year ended March 31, 2007 include Zurn for the period from February 8, 2007 through March 31, 2007.
The Merger and Related Financing
On July 21, 2006, certain affiliates of Apollo and management purchased RBS Global, Inc. from The Carlyle Group for approximately $1.825 billion, excluding transaction fees, through the Merger. The Merger was financed with (i) $485.0 million of 9.50% senior notes due 2014, (ii) $300.0 million of 11.75% senior subordinated notes due 2016, (iii) $645.7 million of borrowings under new senior secured credit facilities (consisting of a seven-year $610.0 million term loan facility and $35.7 million of borrowings under a six-year $150.0 million revolving credit facility) and (iv) $475.0 million of equity contributions (consisting of a $438.0 million cash contribution from Apollo and $37.0 million of rollover stock and stock options held by management participants). The proceeds from the Apollo cash contribution and the new financing arrangements, net of related debt issuance costs, were used to (i) purchase RBS Global from its then existing shareholders for $1,018.4 million, including transaction costs; (ii) repay all outstanding borrowings under RBS Global’s previously existing credit agreement as of the Merger Date, including accrued interest; (iii) repurchase substantially all of our $225.0 million of 10.125% senior subordinated notes outstanding as of the Merger Date pursuant to a tender offer, including accrued interest and tender premium; and (iv) pay certain seller-related transaction costs.
The Falk Acquisition
On May 16, 2005, we acquired The Falk Corporation, or Falk, from Hamilton Sundstrand, a division of United Technologies Corporation, for $301.3 million ($306.2 million purchase price including transaction related expenses, net of cash acquired of $4.9 million) and the assumption of certain liabilities. The acquisition of Falk was funded by a $312.0 million term loan and was accounted for using the purchase method of accounting. During fiscal 2006, the allocation of the Falk purchase price to identifiable assets acquired and liabilities assumed resulted in the recording of $95.3 million of goodwill.
Canal Street Facility Accident and Recovery
On December 6, 2006, we experienced an explosion at our primary gear manufacturing facility (“Canal Street”), in which three employees lost their lives and approximately 45 employees were injured. Canal Street is comprised of over 1.1 million square feet among several buildings and employed approximately 750 associates prior to the accident. The accident resulted from a leak in an underground pipe related to a backup propane gas system that was being tested. The explosion destroyed approximately 80,000 square feet of warehouse, storage and non-production buildings and damaged portions of other production areas. The Canal Street facility manufactures portions of our gear product line and, to a lesser extent, our coupling product line. Our core production capabilities were substantially unaffected by the accident. As of the end of the second quarter of fiscal 2008, production at the Canal Street facility had returned to pre-accident levels. Throughout our fiscal year ended March 31, 2008, approximately $11.2 million of capital expenditures have been made in connection with the reconstruction of the facility. The reconstruction efforts were substantially complete as of March 31, 2008.
We have substantial property, business interruption, or BI, and casualty insurance. The property and BI insurance provides coverage of up to $2.0 billion per incident. The casualty insurance provides coverage in excess of approximately $100.0 million per incident. The aggregate amount of deductibles under all applicable insurance coverage is $1.0 million. In addition to our insurance deductibles, we have and may continue to incur certain other incremental and non-reimbursable out-of-pocket expenses as a result of the explosion. For the period from December 6, 2006 (the date of loss) through March 31, 2008, we have recorded recoveries from our
insurance carrier totaling $71.4 million, of which $50.4 million has been allocated to recoveries attributable to property loss and $21.0 million of which has been allocated to recoveries attributable to BI loss.
On December 5, 2007, we finalized our property and BI claims with our property insurance carrier. Accordingly, no additional insurance proceeds related to such property and BI coverage are expected in future periods. As of March 31, 2008, we and our casualty insurance carrier continue to manage ongoing general liability and workers’ compensation claims. Management believes that the limits of applicable coverage will be in excess of the general liability and workers’ compensation losses incurred. Additionally, we have established a reserve to provide for the payment of legal defense fees incurred in relation to the accident, which may not be covered by insurance. As of March 31, 2008, we have accrued for all costs related to the Canal Street facility accident that are probable and can be reasonably estimated. We did not incur any losses during the quarter ended June 28, 2008 and do not expect to incur any significant losses in future periods. Further, management does not believe that there will be any long-term negative implications to our gear product line as a result of the accident nor do we expect to experience any material adverse impact to liquidity, cash or our leverage profile as a result of the accident.
For the period from December 6, 2006 through March 31, 2007, our fiscal year ended March 31, 2008 and the accident to-date period from December 6, 2006 through March 31, 2008, we have recorded the following (gains)/losses related to this incident (in millions):
| Accident to-date | ||||||||||||
| Period from December 6, 2006 through March 31, 2007 | Year Ended March 31, 2008 | Period from December 6, 2006 through March 31, 2008 | ||||||||||
Insurance deductibles | $ | 1.0 | $ | — | $ | 1.0 | ||||||
Professional services | 1.8 | (0.1 | ) | 1.7 | ||||||||
Clean-up and restoration expenses | 18.3 | 5.0 | 23.3 | |||||||||
Non-cash asset impairments: | ||||||||||||
Inventories | 7.1 | 0.3 | 7.4 | |||||||||
Property, plant and equipment, net | 2.6 | — | 2.6 | |||||||||
Other | 0.2 | — | 0.2 | |||||||||
Subtotal prior to property insurance recoveries | 31.0 | 5.2 | 36.2 | |||||||||
Less property insurance recoveries | (27.0 | ) | (23.4 | ) | (50.4 | ) | ||||||
Subtotal prior to business interruption insurance recoveries | 4.0 | (18.2 | ) | (14.2 | ) | |||||||
Less business interruption insurance recoveries | (10.0 | ) | (11.0 | ) | (21.0 | ) | ||||||
(Gain) on Canal Street facility accident, net | $ | (6.0 | ) | $ | (29.2 | ) | $ | (35.2 | ) | |||
Summary of total insurance recoveries: | ||||||||||||
Total property and business interruption insurance recoveries | $ | 37.0 | $ | 34.4 | $ | 71.4 | ||||||
We recognized a net gain of $35.2 million related to the Canal Street facility accident from the date of the accident (December 6, 2006) through March 31, 2008. $14.2 million of the net gain represents the excess property insurance recoveries (at replacement value) over the write-off of tangible assets (at net book value) and other direct expenses related to the accident. The remaining $21.0 million gain is comprised of business interruption insurance recoveries.
Recovery Under Continued Dumping and Subsidy Offset Act (“CDSOA”)
The U.S. government has eight anti-dumping duty orders in effect against certain foreign producers of ball bearings exported from six countries, tapered roller bearings from China and spherical plain bearings from France. The foreign ball bearing producers are located in France, Germany, Italy, Japan, Singapore and the United Kingdom. We are a producer of ball bearing products in the United States. The CDSOA provides for distribution of monies collected by Customs and Border Protection, or CBP, from anti-dumping cases to
qualifying producers, on a pro rata basis, where the domestic producers have continued to invest their technology, equipment and people in products that were the subject of the anti-dumping orders. As a result of providing relevant information to CBP regarding historical manufacturing, personnel and development costs for the calendar years 2006 and 2007 and prior, we received $8.8 million and $1.4 million, our pro rata share of the total CDSOA distribution, during the period from July 22, 2006 through March 31, 2007 and our fiscal year ended March 31, 2008, respectively, which is included in other income (expense), net on the consolidated statement of operations.
In February 2006, U.S. legislation was enacted which ended CDSOA distributions for imports covered by anti-dumping duty orders entering the U.S. after September 30, 2007. Because monies were collected by CBP until September 30, 2007 and for prior year entries, we may receive some additional distributions; however, because of pending cases, 2006 legislation, and the administrative operation of law, we cannot reasonably estimate the amount of CDSOA distributions we will receive in future years, if any.
Financial Statement Presentation. This section provides a brief description of certain items and accounting policies that appear in our financial statements and general factors that impact these items.
Critical Accounting Estimates. This section discusses the accounting policies and estimates that we consider to be important to our financial condition and results of operations and that require significant judgment and estimates on the part of management in their application.
Results of Operations. This section provides an analysis of our results of operations for our fiscal years ended March 31, 2009, 2010 and 2011, in each case as compared to the prior period’s performance.
Non-GAAP Financial Measure. This section provides an explanation of a certain Non-GAAP financial measure we use.
Covenant Compliance. This section provides a description of certain restrictive covenants with which our credit agreement and indentures require us to comply.
Liquidity and Capital Resources. This section provides an analysis of our cash flows for our fiscal years ended March 31, 2009, 2010 and 2011, as well as a discussion of our indebtedness and its potential effects on our liquidity.
Tabular Disclosure of Contractual Obligations. This section provides a discussion of our commitments as of March 31, 2011.
Quantitative and Qualitative Disclosures about Market Risk. This section discusses our exposure to potential losses arising from adverse changes in interest rates and commodity prices.
Company Overview
Rexnord is a growth-oriented, multi-platform industrial company with what we believe are leading market shares and highly trusted brands that serve a diverse array of global end-markets. Our heritage of innovation and specification have allowed us to provide highly engineered, mission critical solutions to customers for decades and affords us the privilege of having long-term, valued relationships with market leaders. We operate our
42
company in a disciplined way and RBS is our operating philosophy. Grounded in the spirit of continuous improvement, RBS creates a scalable, process-based framework that focuses on driving superior customer satisfaction and financial results by targeting world-class operating performance throughout all aspects of our business.
Restructuring and Other Similar Costs
Beginning with the quarter ended September 28, 2008, we executed certain restructuring actions to reduce operating costs and improve profitability. As the restructuring actions were substantially completed during fiscal 2010, we did not record any restructuring charges during the year ended March 31, 2011. Comparatively, we recorded restructuring charges of $24.5 million and $6.8 million for the years ended March 31, 2009 and 2010, respectively, primarily consisting of severance costs related to workforce reductions.
Financial Statement Presentation
The following paragraphs provide a brief description of certain items and accounting policies that appear in our financial statements and general factors that impact these items.
As described above, the Merger occurred on July 21, 2006, and created a new basis of accounting for the Company. In this management’s discussion and analysis, our results from July 22, 2006, through March 31, 2007 are combined with Predecessor results for the period from April 1, 2006 through July 21, 2006, with the result being referred to as our fiscal year ended March 31, 2007. GAAP does not allow for such a combination of predecessor and successor financial results; however, we believe the combined results provide information that is useful in evaluating our financial performance. The combined financial information is the result of merely adding the predecessor and successor results and does not include any pro forma assumptions or adjustments.
Net Sales.Sales. Net sales represent gross sales less deductions taken for sales returns and allowances and incentive rebate programs.
Cost of Sales.Sales. Cost of sales includes all costs of manufacturing required to bring a product to a ready for sale condition. Such costs include direct and indirect materials, direct and indirect labor costs, including fringe benefits, supplies, utilities, depreciation, insurance, pension and postretirement benefits, information technology costs and other manufacturing related costs.
The largest component of our cost of sales is cost of materials, which represented approximately 38%36% of net sales in fiscal 2008.2011. The principal materials used in our Power TransmissionProcess & Motion Control manufacturing processes are commodities that are available from numerous sources and include sheet, plate and bar steel, castings, forgings, high-performance engineered plastics and a wide variety of other components. Within our Water Management, platform, we purchase a broad range of materials and components throughout the world in connection with our manufacturing activities. Major raw materials and components include bar steel, brass, castings, copper, forgings, high-performance engineered plastic, plate steel, resin, sheet plastic and zinc. We have a strategic sourcing program to significantly reduce the number of direct and indirect suppliers we use and to lower the cost of purchased materials.
The next largest component of our cost of sales is direct and indirect labor, which represented approximately 16% of net sales in fiscal 2008.2011. Direct and indirect labor and related fringe benefit costs are susceptible to inflationary trends.
Selling, General and Administrative Expenses.Expenses. Selling, general and administrative expenses primarily includes sales and marketing, finance and administration, engineering and technical services and distribution. Our major cost elements include salary and wages, fringe benefits, pension and postretirement benefits, insurance, depreciation, advertising, travel and information technology costs.
Critical Accounting Estimates
The methods, estimates and judgments we use in applying our critical accounting policies have a significant impact on the results we report in our consolidated financial statements. We evaluate our estimates and judgments on an on-going basis. We base our estimates on historical experience and on assumptions that we believe to be reasonable under the circumstances. Our experience and assumptions form the basis for our judgments about the carrying value of assets and liabilities that are not readily apparent from other sources. Actual results may vary from what we anticipate and different assumptions or estimates about the future could
43
change our reported results. Within the context of these critical accounting policies, we are not currently aware of any reasonably likely event that would result in materially different amounts being reported.
We believe the following accounting policies are the most critical to us in that they are important to our financial statements and they require our most difficult, subjective or complex judgments in the preparation of our consolidated financial statements.
Revenue Recognitionrecognition.
SalesNet sales are recorded upon transfer of title and risk of product which occurs upon shipmentloss to the customer. Because we enter into sales rebate programs with some of our customers, which require us to make rebate payments to them from time to time, we estimate amounts due under these sales rebate programs at the time of shipment. Net sales relating to any particular shipment are based upon the amount invoiced for the shippeddelivered goods less estimated future rebate payments and sales returns. These rebatesreturns which are primarily volume-based and are estimated based upon our historical experience. Revisions to these estimates are recorded in the period in which the facts that give rise to the revision become known to us.known. The value of returned goods during fiscal 2006, 2007each of the years ended March 31, 2009, 2010 and 20082011 was approximately 1.0% or less than 1.3% of net sales in each such year.sales. Other than oura standard product warranty, there are no other significant post-shipment obligations.
InventoryReceivables. Receivables are stated net of allowances for doubtful accounts of $9.6 million at March 31, 2010 and $5.3 million at March 31, 2011. On a regular basis, we evaluate our receivables and establish the allowance for doubtful accounts based on a combination of specific customer circumstances and historical write-off experience. Credit is extended to customers based upon an evaluation of their financial position. Generally, advance payment is not required. Credit losses are provided for in the consolidated financial statements and consistently have been within management’s expectations.
We value inventoriesInventory. Inventories are stated at the lower of cost or market. CostMarket is determined based on estimated net realizable values. Approximately 70% of certain domesticthe Company’s total inventories as of March 31, 2010 and 2011 were valued using the “last-in, first-out” (LIFO) method. All remaining inventories are determined on a last-in, first-out (LIFO) basis. Cost ofvalued using the remaining domestic inventories and all foreign inventories are determined on a first-in, first-out“first-in, first-out” (FIFO) basis.method. The valuation of inventories includes variablematerial, labor and fixed overhead costs and requires management estimates to determine the amount of overheadmanufacturing variances to capitalize into inventories. We capitalize material, labor and overhead variances into inventories based onupon estimates of related costkey drivers, which are generally eitherinclude raw material purchases or(for material variances), standard labor.labor (for labor variances) and calculations of inventory turnover (for overhead variances).
In some cases we have determined a certain portion of our inventories are excess or obsolete. In those cases, we write down the value of those inventories to their net realizable value based upon assumptions about future demand and market conditions. If actual market conditions are less favorable than those projected by management, additional inventory write-downs may be required. The total write-down of inventories charged to expense was $4.9$17.2 million, $4.9$7.1 million, and $8.4$3.8 million, during fiscal 2006, 20072009, 2010, and 2008,2011, respectively. The reduction in inventory write-downs charged to expense in fiscal 2010 and 2011 relates to decreased levels of excess and obsolete inventory given the stabilization in market conditions that were the cause of significant destocking throughout fiscal 2009.
Impairment of Intangible Assetsintangible assets and Tangible Fixed Assetstangible fixed assets.
Our intangible assets and tangible fixed assets are held at historical cost, net of depreciation and amortization, less any provision for impairment.
Intangible assets are amortized over the shorter of their legal life or estimated useful life as follows:
| Trademarks and tradenames | No amortization (indefinite life) | |
Patents | 2 to 20 years | |
Customer Relationships | 3 to 15 years | |
Non-compete | 2 to 5 years |
44
Tangible fixed assets are depreciated to their residual values on a straight-line basis over their estimated useful lives as follows:
Land | No depreciation | |
Buildings and improvements | 10 to 30 years | |
Machinery and equipment | 5 to 10 years | |
Computer hardware and software | 3 to 5 years |
An impairment review of specifically identifiable amortizable intangible or tangible fixed assets is performed if an indicator of impairment, such as an operating loss or cash outflow from operating activities or a significant adverse change in the business or market place, exists. Estimates of future cash flows used to test the asset for impairment are based on current operating projections extended to the useful life of the asset group and are, by their nature, subjective.
Our recorded goodwill isand indefinite lived intangible assets are not amortized but isare tested annually for impairment or whenever circumstances indicate that impairment may exist using a discounted cash flow analysis. Asmethodology based on future business projections and a market value approach. The discount rate utilized within our impairment test is based upon the weighted average cost of capital of comparable public companies.
During the year ended March 31, 2008, there was no2009, the Company recorded a non-cash pre-tax impairment recordedcharge associated with goodwill and identifiable intangible assets of $422.0 million, of which $319.3 million related to goodwill impairment and $102.7 million related to other identifiable intangible asset impairments. See Note 8 to our audited consolidated financial statements included elsewhere in this prospectus for any reporting unit.more information regarding the prior year impairment charge.
We expectThe Company expects to recognize amortization expense on the intangible assets subject to amortization of $49.6 million in the each of the next three fiscal years, $49.5$47.9 million in fiscal year 2012, and $48.8$47.5 million in theeach of fiscal 2013.years 2013, 2014, 2015, and 2016.
Retirement Benefitsbenefits.
We have significant pension and post-retirement benefit income and expense and assets/liabilities that are developed from actuarial valuations. These valuations include key assumptions regarding discount rates, expected return on plan assets, mortality rates, merit and promotion increases and the current health care cost trend rate. We consider current market conditions in selecting these assumptions. Changes in the related pension and post-retirement benefit income/costs or assets/liabilities may occur in the future due to changes in the assumptions and changes in asset values.
Future changes inDuring the assumptions underlyingfourth quarter of fiscal 2011, we voluntarily changed our method of accounting for actuarial gains and losses related to our pension valuations, including those that ariseand other postretirement benefit plans. Previously, we recognized actuarial gains and losses as a resultcomponent of declines in equity marketsStockholders’ Equity on the consolidated balance sheets and interest rates, could result in reductions in pension income which could negatively affect our consolidated resultsamortized the actuarial gains and losses over participants’ average remaining service period, or average remaining life expectancy, when all or almost all plan participants are inactive, as a component of operations in future periods.
Asnet periodic benefit cost if the unrecognized gain or loss exceeded 10 percent of March 31, 2008, we had pension plans with a combinedthe greater of the market-related value of plan assets or the plan’s projected benefit obligation of $617.5 million compared to plan assets of $647.1 million. While our combined domestic pension plans are over-funded, approximately $49.4 millionat the beginning of the above projectedyear (the “corridor”). Under the new method, the net actuarial gains or losses in excess of the corridor will be recognized immediately in operating results during the fourth quarter of each fiscal year (or upon any re-measurement date). Net periodic benefit obligationcosts recorded on a quarterly basis would continue to primarily be comprised of service and interest cost, amortization of unrecognized prior service cost and the expected return on plan assets. While the historical method of recognizing actuarial gains and losses was considered acceptable, we believe this method is from planspreferable as it accelerates the recognition of actuarial gains and losses outside of the corridor. See Note 2 to our audited consolidated financial statements included elsewhere in this prospectus for a presentation of our German subsidiaries where such plans are typically not funded.operating results before and after the application of this accounting change.
45
The obligation for postretirement benefits other than pension also is actuarially determined and is affected by assumptions including the discount rate and expected future increase in per capita costs of covered postretirement health care benefits. Changes in the discount rate and differences between actual and assumed per capita health care costs may affect the recorded amount of the expense in future periods.
Income Taxestaxes.
We are subject to income taxes in the United States and numerous foreign jurisdictions. Significant judgment is required in determining our worldwide provision for income taxes and recording the related deferred tax assets and liabilities.
We assess our income tax positions and record tax liabilities for all years subject to examination based upon management’s evaluation of the facts and circumstances and information available at the reporting dates. For those income tax positions where it is more-likely-than-not that a tax benefit will be sustained upon the conclusion of an examination, we have recorded the largest amount of tax benefit having a cumulatively greater than 50% likelihood of being realized upon ultimate settlement with the applicable taxing authority, assuming that it has full knowledge of all relevant information. For those tax positions which do not meet the more-likely-than-not threshold regarding the ultimate realization of the related tax benefit, no tax benefit has been recorded in the financial statements. In addition, we have provided for interest and penalties, as applicable, and record such amounts as a component of the overall income tax provision.
We recognize deferred tax assets and liabilities based on the differences between the financial statement carrying amounts and the tax bases of assets and liabilities, net operating losses, tax creditcredits and other
carryforwards. We regularly review our deferred tax assets for recoverability and establish a valuation allowance based on historical losses, projected future taxable income and the expected timing of the reversals of existing temporary differences. As a result of this review, we have established a valuation allowance against substantially all of our deferred tax assets relating to foreign loss carryforwards, and a partial valuation allowance against our deferred tax assets relating to certain state net operating loss and foreign tax credit carryforwards.
Commitments and ContingenciesContingencies.
We are subject to proceedings, lawsuits and other claims related to environmental, labor, product and other matters. We are required to assess the likelihood of any adverse judgments or outcomes to these matters as well as potential ranges of probable losses. We determine the amount of reserves needed, if any, for each individual issue based on our professional knowledge and experience and discussions with legal counsel. The required reserves may change in the future due to new developments in each matter, the ultimate resolution of each matter or changes in approach, such as a change in settlement strategy, in dealing with these matters.strategy.
Through recent acquisitions, we have assumed presently recorded and potential future liabilities relating to product liability, environmental and other claims. We have recorded reserves for claims related to these obligations when appropriate and, on certain occasions, have obtained the assistance of an independent actuary in the determination of those reserves. If actual experience deviates from our estimates, we may need to record adjustments to these liabilities in future periods.
Warranty ReservesReserves.
Reserves are recorded on our consolidated balance sheets to reflect our contractual liabilities relating to warranty commitments to our customers. We provide warranty coverage of various lengths and terms to our customers depending on standard offerings and negotiated contractual agreements. We record an estimate for warranty expense at the time of sale based on historical warranty return rates and repair costs. Should future warranty experience differ materially from our historical experience, we may be required to record additional warranty reserves which could have a material adverse effect on our results of operations in the period in which these additional reserves are required.
Environmental LiabilitiesLiabilities.
We accrue an estimated liability for each environmental matter when the likelihood of an unfavorable outcome is probable and the amount of loss associated with such unfavorable outcome is reasonably estimable. We presume that a matter is probable of an unfavorable outcome if (a) litigation has commenced or a claim has been asserted or if commencement of litigation or assertion of a claim is probable and (b) if we are somehow associated with the site. In addition, if the reporting entity has been named as a Potentially Responsible Party, or PRP, an unfavorable outcome is presumed.
46
Estimating environmental remediation liabilities involves an array of issues at any point in time. In the early stages of the process, cost estimates can be difficult to derive because of uncertainties about a variety of factors. For this reason, estimates developed in the early stages of remediation can vary significantly;significantly, and, in many cases, early estimates later require significant revision. The following are some of the factors that are integral to developing cost estimates:
The extent and types of hazardous substances at a site;
The range of technologies that can be used for remediation;
Evolving standards of what constitutes acceptable remediation; and
The number and financial condition of other PRPs and the extent of their responsibility for the remediation.
An estimate of the range of an environmental remediation liability typically is derived by combining estimates of various components of the liability, which themselves are likely to be ranges. At the early stages of the remediation process, particular components of the overall liability may not be reasonably estimable. This fact does not preclude our recognition of a liability. Rather, the components of the liability that can be reasonably estimated are viewed as a surrogate for the minimum in the range of our overall liability. Estimated legal and consulting fees are included as a component of our overall liability.
Asbestos Claims and Insurance for Asbestos ClaimsClaims.
As noted in noteNote 18 to our audited consolidated financial statements included elsewhere in this prospectus, certain Water Management subsidiaries are subject to asbestos litigation. As a result, we have recorded a liability for pending and potential future asbestos claims, as well as a receivable for insurance coverage of such liability. The valuation of our potential asbestos liability was based on the number and severity of future asbestos claims, future settlement costs, and the effectiveness of defense strategies and settlement initiatives.
The present estimate of our asbestos liability assumes (i) our continuous vigorous defense strategy will remain effective; (ii) new asbestos claims filed annually against Zurn will decline modestly through the next ten years; (iii) the values by disease will remain consistent with past experience and (iv) our insurers will continue to pay defense costs without eroding the coverage amounts of our insurance policies. Our potential asbestos liability could be adversely affected by changes in law and other factors beyond our control. Further, while our current asbestos liability is based on an estimate of claims through the next ten years, such liability may continue beyond that time period and such liability could be substantial.
We estimate that our available insurance to cover our potential asbestos liability as of the end of fiscal 20082011 is greater than our potential asbestos liability. This conclusion was reached after considering our experience in asbestos litigation, the insurance payments made to date by our insurance carriers, existing insurance policies, the industry ratings of the insurers and the advice of insurance coverage counsel with respect to applicable insurance coverage law relating to the terms and conditions of those policies. We used these same considerations when evaluating the recoverability of our receivable for insurance coverage of potential asbestos claims.
Results of Operations
The financial information for the fiscal year endedFiscal Year Ended March 31, 2006 and the period from April 1, 2006 through July 21, 2006 represents historical results prior to the consummation of the Merger and is referred to herein as the “Predecessor” period. The period from July 22, 2006 through March 31, 2007 and thereafter is referred to herein as the “Successor” period. As a result of the Merger on July 21, 2006 and the resulting change in ownership, under GAAP we are required to present our operating results for the Predecessor and the Successor during the twelve months ended March 31, 2007 separately. In the following discussion, our fiscal 2007 results are adjusted to reflect the pro forma effect of the Merger as if it had occurred on April 1, 2006. The fiscal 2007 pro forma adjustments are described in the footnotes of the following table. In the following discussion and analysis, the pro forma basis amounts for the combined twelve months ended March 31, 2007 are compared to the twelve months ended March 31, 2006 and 2008 on an “as reported” historical basis as we believe this is the most meaningful and practical way to comment on our results of operations.
Our fiscal year is the year ending March 31 of the corresponding calendar year. For example, our fiscal year 2008, or fiscal 2008, means the period from April 1, 2007 to March 31, 2008. The following table sets forth our consolidated statements of operations data for the Predecessor periods and Successor periods indicated:
| Fiscal Year 2006 | Fiscal Year 2007 | Fiscal Year 2008 | First Quarter Ended | ||||||||||||||||||||||||||||||||||
| Predecessor | Predecessor | Successor | Pro Forma | ||||||||||||||||||||||||||||||||||
| Period from April 1, 2005 through March 31, 2006 | Period from April 1, 2006 through July 21, 2006 | Period from July 22, 2006 through March 31, 2007 | Pro Forma Adjustments | Period from April 1, 2006 through March 31, 2007 | Period from April 1, 2007 through March 31, 2008 | Period from April 1, 2007 through June 30, 2007 | Period from April 1, 2008 through June 28, 2008 | ||||||||||||||||||||||||||||||
Net sales | $ | 1,081.4 | $ | 334.2 | $ | 921.5 | $ | — | $ | 1,255.7 | $ | 1,853.5 | $ | 448.2 | $ | 496.1 | |||||||||||||||||||||
Cost of sales | 742.3 | 237.7 | 628.2 | (1.5 | ) | (1 | ) | 864.4 | 1,250.4 | 306.2 | 334.2 | ||||||||||||||||||||||||||
Gross profit | 339.1 | 96.5 | 293.3 | 1.5 | 391.3 | 603.1 | 142.0 | 161.9 | |||||||||||||||||||||||||||||
% of net sales | 31.4 | % | 28.9 | % | 31.8 | % | — | 31.2 | % | 32.5 | % | 31.7 | % | 32.6 | % | ||||||||||||||||||||||
Selling, general and administrative expenses | 187.8 | 63.1 | 159.3 | — | 222.4 | 312.2 | 78.1 | 86.1 | |||||||||||||||||||||||||||||
Restructuring and other similar costs | 31.1 | — | — | — | — | — | — | — | |||||||||||||||||||||||||||||
(Gain) loss on Canal Street accident, net | — | — | (6.0 | ) | — | (6.0 | ) | (29.2 | ) | (8.1 | ) | — | |||||||||||||||||||||||||
Loss on divestiture | — | — | — |
| — |
| — | 11.2 | — | — | |||||||||||||||||||||||||||
Transaction-related costs | — | 62.7 | — | (62.7 | ) | (2 | ) | — | — | — | — | ||||||||||||||||||||||||||
Amortization of intangible assets | 15.7 | 5.0 | 26.9 | 4.3 | (3 | ) | 36.2 | 49.9 | 12.9 | 12.5 | |||||||||||||||||||||||||||
Income (loss) from operations | 104.5 | (34.3 | ) | 113.1 | 59.9 | 138.7 | 259.0 | 59.1 | 63.3 | ||||||||||||||||||||||||||||
% of net sales | 9.7 | % | -10.3 | % | 12.3 | % | �� | — | 11.0 | % | 14.0 | % | 13.2 | % | 12.8 | % | |||||||||||||||||||||
Non-operating income (expense): | |||||||||||||||||||||||||||||||||||||
Interest expense, net | (61.5 | ) | (21.0 | ) | (109.8 | ) | (21.1 | ) | (4 | ) | (151.9 | ) | (254.3 | ) | (64.1 | ) | (58.2 | ) | |||||||||||||||||||
Other (expense) income, net | (3.8 | ) | (0.4 | ) | 5.7 | — | 5.3 | (5.3 | ) | (2.9 | ) | (2.2 | ) | ||||||||||||||||||||||||
Income (loss) before income taxes | 39.2 | (55.7 | ) | 9.0 | 38.8 | (7.9 | ) | (0.6 | ) | (7.9 | ) | 2.9 | |||||||||||||||||||||||||
Provision (benefit) for income taxes | 16.3 | (16.1 | ) | 9.2 | 11.7 | (5 | ) | 4.8 | (0.9 | ) | (0.5 | ) | 2.7 | ||||||||||||||||||||||||
Net income (loss) | $ | 22.9 | $ | (39.6 | ) | $ | (0.2 | ) | $ | 27.1 | $ | (12.7 | ) | $ | 0.3 | $ | (7.4 | ) | $ | 0.2 | |||||||||||||||||
Seller-related expenses | $ | 19.1 | |
Bond tender premium | 23.1 | ||
Write-off deferred financing fees | 20.5 | ||
| $ | 62.7 | ||
Seller-related expenses consisted of investment banking fees, outside attorney fees, and other third-party fees. The bond tender premium related to the $225.0 million of senior subordinated notes, substantially all of which were repurchased in connection with the Merger. The Predecessor also incurred a non-cash charge of $20.5 million to write-off the remaining net book value of previously-capitalized financing fees related to the Predecessor’s term loans and senior subordinated notes that were repaid/repurchased in connection with the Merger.
First Quarter Ended June 28, 20082011 Compared with the First QuarterFiscal Year Ended June 30, 2007:March 31, 2010
Net Sales
(in Millions)
| Fiscal Year Ended | ||||||||||||||||
| March 31, 2010 | March 31, 2011 | Change | % Change | |||||||||||||
Process & Motion Control | $ | 1,003.7 | $ | 1,175.1 | $ | 171.4 | 17.1 | % | ||||||||
Water Management | 506.3 | 524.5 | 18.2 | 3.6 | % | |||||||||||
Consolidated | $ | 1,510.0 | $ | 1,699.6 | $ | 189.6 | 12.6 | % | ||||||||
47
.Process & Motion ControlNet
Process & Motion Control net sales for the first quarter of fiscal 2009year ended March 31, 2011 increased by $47.9 million, or 10.7%, over the comparable period in the prior year. The majority of our net sales growth in the quarter was driven by strength in our Power Transmission platform end markets of mining, energy and cement and aggregates coupled with strong demand for our aerospace products. Our Water Management platform also posted solid year-over-year net sales growth, primarily due to the January 31, 2008 acquisition of GA. In addition to our net sales growth, orders in the first quarter of fiscal 2009 grew by 12.7% over the comparable period in17.1% from the prior year resulting in a $41.4 million, or 7.7%, increase in our backlog since March 31, 2008. Our backlog as of June 28, 2008 was approximately $582to $1,175.1 million. Set forth below are ourCore net sales, by segment for the quarters ended June 30, 2007 and June 28, 2008 (in millions):
| Quarter Ended | ||||||||||||
| June 30, 2007 | June 28, 2008 | Change | % Change | |||||||||
Power Transmission | $ | 309.8 | $ | 340.6 | $ | 30.8 | 9.9 | % | ||||
Water Management | 138.4 | 155.5 | 17.1 | 12.4 | ||||||||
Consolidated | $ | 448.2 | $ | 496.1 | $ | 47.9 | 10.7 | |||||
Power Transmission. Power Transmission net sales increased by $30.8 million, or 9.9%, from $309.8 million in the quarter ended June 30, 2007 to $340.6 million in the quarter ended June 28, 2008. Foreign currency fluctuations favorably impacted sales by approximately $13.9 million, or 4.5%, during the quarter as the Euro, and other currencies, strengthened against the U.S. dollar compared to the prior period. Excludingwhich excludes foreign currency fluctuations, and the impact of our fiscal 2008 divestiture of Rexnord SAS,increased by 17.5% year-over-year salesdriven by solid international growth, of approximately 7.2% is attributable to a continuation of strong globalimproved demand in our Power Transmission end marketsNorth America end-markets and market share gains across many of mining, energy and cement as well as aerospace.our products.
Water Management
Water Management.Water Management net sales for the year ended March 31, 2011 increased by $17.1 million, or 12.4%,3.6% from $138.4 million in the quarter ended June 30, 2007 to $155.5 million in the quarter ended June 28, 2008 primarily due to the January 31, 2008 acquisition of GA. This sales increase was driven by strong institutional and commercial construction end market demand offset by a decline in sales to the residential construction market when compared to the prior year first quarter.to $524.5 million. Core net sales, which excludes the foreign currency fluctuations, increased by 3.1% year-over-year as a result of targeted market share gains and growth in alternative markets, which more than offset the overall decline in the core infrastructure and non-residential construction markets, which we estimate to be down 15% year-over-year based on McGraw Hill construction data.
Income from OperationsRestructuring and Other Similar Costs.Income from operations in the first quarter of fiscal 2009 increased by 7.1% to $63.3 million, or 12.8% of net sales, compared to $59.1 million, or 13.2% of net sales, in the prior year first quarter which included an $8.1 million gain recorded as This section provides a resultdescription of the Canal Street facility accident. Excludingrestructuring actions we executed to reduce operating costs and improve profitability.
Financial Statement Presentation. This section provides a brief description of certain items and accounting policies that appear in our financial statements and general factors that impact these items.
Critical Accounting Estimates. This section discusses the impactaccounting policies and estimates that we consider to be important to our financial condition and results of operations and that require significant judgment and estimates on the $8.1 million Canal Street gain, income from operations would have increased by $12.3 million,part of management in their application.
or 24.1%, and income from operations as a percent of net sales would have improved by 140 basis points to 12.8%. Set forth below is our income from operations by segment for the quarters ended June 30, 2007 and June 28, 2008 (in millions):
| Quarter Ended | |||||||||||||||
| June 30, 2007 | June 28, 2008 | Change | % Change | ||||||||||||
Power Transmission | $ | 43.1 | $ | 46.0 | $ | 2.9 | 6.7 | % | |||||||
% of net sales | 13.9 | % | 13.5 | % | -0.4 | % | |||||||||
Water Management | 20.0 | 23.1 | 3.1 | 15.5 | |||||||||||
% of net sales | 14.5 | % | 14.9 | % | 0.4 | % | |||||||||
Corporate | (4.0 | ) | (5.8 | ) | (1.8 | ) | 45.0 | ||||||||
Consolidated | $ | 59.1 | $ | 63.3 | $ | 4.2 | 7.1 | ||||||||
% of net sales | 13.2 | % | 12.8 | % | -0.4 | % | |||||||||
Power Transmission.Power Transmission income from operations in the first quarterResults of fiscal 2009 was $46.0 million,Operations. This section provides an increase of $2.9 million, or 6.7%, over the first quarter of fiscal 2008. As a percent of net sales, operating income decreased 40 basis points from 13.9% in the quarter ended June 30, 2007 to 13.5% in the quarter ended June 28, 2008. The comparabilityanalysis of our income fromresults of operations is affected by the $8.1 million gain recordedfor our fiscal years ended March 31, 2009, 2010 and 2011, in the prior periodeach case as a direct result of the accident at our Canal Street facility. Excluding this gain, income from operations would have increased $11.0 million, or 31.4%, and income from operations as a percent of sales would have increased 220 basis points compared to the prior period. Other items contributing to this increase (excluding the Canal Street gain) include: the earnings contribution on $30.8 million of higher net sales and on-going operational improvements and cost reductions driven by our RBS processes, partially offset by raw material price inflation.period’s performance.
Water Management.Non-GAAP Financial MeasureWater Management income. This section provides an explanation of a certain Non-GAAP financial measure we use.
Covenant Compliance. This section provides a description of certain restrictive covenants with which our credit agreement and indentures require us to comply.
Liquidity and Capital Resources. This section provides an analysis of our cash flows for our fiscal years ended March 31, 2009, 2010 and 2011, as well as a discussion of our indebtedness and its potential effects on our liquidity.
Tabular Disclosure of Contractual Obligations. This section provides a discussion of our commitments as of March 31, 2011.
Quantitative and Qualitative Disclosures about Market Risk. This section discusses our exposure to potential losses arising from operations increasedadverse changes in interest rates and commodity prices.
Company Overview
Rexnord is a growth-oriented, multi-platform industrial company with what we believe are leading market shares and highly trusted brands that serve a diverse array of global end-markets. Our heritage of innovation and specification have allowed us to provide highly engineered, mission critical solutions to customers for decades and affords us the privilege of having long-term, valued relationships with market leaders. We operate our
42
company in a disciplined way and RBS is our operating philosophy. Grounded in the spirit of continuous improvement, RBS creates a scalable, process-based framework that focuses on driving superior customer satisfaction and financial results by $3.1 million, or 15.5%, from $20.0 million intargeting world-class operating performance throughout all aspects of our business.
Restructuring and Other Similar Costs
Beginning with the quarter ended June 30, 2007September 28, 2008, we executed certain restructuring actions to $23.1reduce operating costs and improve profitability. As the restructuring actions were substantially completed during fiscal 2010, we did not record any restructuring charges during the year ended March 31, 2011. Comparatively, we recorded restructuring charges of $24.5 million inand $6.8 million for the quarteryears ended June 28, 2008. Income from operations as a percent of net sales increased 40 basis points from 14.5% in the quarter ended June 30, 2007 to 14.9% in the quarter ended June 28, 2008. The increase in income from operations as a percentage of net sales is primarily due to a $1.1 million reduction in the net expense associated with fair value inventory adjustments, net of LIFO adjustments, recorded in the first quarter of fiscal 2009 compared to the prior year first quarter and on-going operational improvements and cost reductions driven by our RBS processes. This favorability was partially offset by an increase in selling, general and administrative expenses tied to infrastructure and commercial construction end market sales growth as well as the inclusion of GA in the first quarter of fiscal 2009 as GA currently has slightly lower margins than our other Water Management businesses.
Corporate.Corporate expenses increased by $1.8 million, or 45.0%, from $4.0 million in the quarter ended June 30, 2007 to $5.8 million in the quarter ended June 28, 2008. This increase was primarily the result of higher staffing levels as well as incremental professional fees in support of strategic growth opportunities.
Interest Expense, net. Interest expense, net was $58.2 million in the first quarter of fiscal 2009 compared to $64.1 million in the first quarter of fiscal 2008. The decrease in interest expense is a result of reduced borrowing costs on our variable rate debt.
Other Expense, net.Other expense, net was $2.2 million in the first quarter of fiscalMarch 31, 2009 and includes $1.1 million2010, respectively, primarily consisting of foreign currency transaction losses, a $0.3 million loss on dispositions of fixed assets, $0.8 million of management fee expenses, $0.2 million of lossesseverance costs related to unconsolidated affiliatesworkforce reductions.
Financial Statement Presentation
The following paragraphs provide a brief description of certain items and $0.2 million of other income. Other expense, net was $2.9 millionaccounting policies that appear in the first quarter of fiscal 2008our financial statements and includes $2.5 million of foreign currency transaction losses, a $0.1 million loss on dispositions of fixed assets, $0.8 million of management fee expenses, $0.2 million of equity in earnings of unconsolidated affiliates and $0.3 million of other income.
Provision for Income Taxes.The provision for income taxes was $2.7 million in the first quarter of fiscal 2009 compared to a $0.5 million benefit in the first quarter of fiscal 2008. Our effective income tax rate for the first quarter of fiscal 2009 was a 93.1% liability versus a 6.3% benefit in the first quarter of fiscal 2008. The effective tax rate for the first quarter of fiscal 2009 includes an accrual of interest expense (through income tax expense) relating to unrecognized tax benefits and an increase to the valuation allowance relating to foreign tax credits generated for which realization of such benefits is not deemed more likely than not. Similarly, the low effective tax rate benefit in the first quarter of fiscal 2008 was due to the effect of the accrual of interest expense (through income tax expense) relating to unrecognized tax benefits and an increase to the valuation allowance for foreign tax credits generated for which the realization of such benefits was not deemed more likely than not.general factors that impact these items.
Net IncomeSales.Our net income for the first quarter of fiscal 2009 was $0.2 million compared to a net loss of $7.4 million in the first quarter of fiscal 2008 due to the factors described above.
Fiscal Year Ended March 31, 2008 Compared with the Period from April 1, 2006 through July 21, 2006, the Period from July 22, 2006 through March 31, 2007 and the Pro Forma Fiscal Year Ended March 31, 2007
Net Sales.Net sales were $1,853.5 million in fiscal 2008, $334.2 millionrepresent gross sales less deductions taken for the period from April 1, 2006 through July 21, 2006sales returns and $921.5 million for the period from July 22, 2006 through March 31, 2007. Pro forma fiscal 2007 sales were $1,255.7 million, which merely represents the combination of the above Predecessorallowances and Successor periods, as no pro forma adjustments are required to reflect the impact of the Merger based upon an assumed consummation date of April 1, 2006. The year-over-year net sales growth of $597.8 million or 47.6%, over pro forma fiscal 2007 net sales of $1,255.7 million was primarily the result of both the Zurn acquisition as well as strong organic growth within the Power Transmission platform and our recovery from the Canal Street facility accident. The majority of the sales growth was driven by acquisitions (Zurn and GA), which accounts for $441.7 million of the year-over-year increase. Power Transmission net sales in fiscal 2008 also grew $156.1 million or 13.2% versus last fiscal year. The Power Transmission net sales growth was largely driven by strength in our industrial products end markets of mining, energy, aggregates, aerospace and cement as well as the recovery of our Canal Street facility. It is estimated that sales from our Canal Street facility were adversely impacted by approximately $4.5 to $6.5 million in fiscal 2008 and by $37.0 to $46.0 million in pro forma fiscal 2007 as a result of the explosion. Foreign currency fluctuations also favorably impacted Power Transmission net sales by approximately $40.0 million during fiscal 2008 as the Euro, and other currencies, strengthened against the U.S. dollar compared to the prior period.incentive rebate programs.
Cost of Sales.Sales.Cost of sales was $1,250.4 million in fiscal 2008, $237.7 millionincludes all costs of manufacturing required to bring a product to a ready for the period from April 1, 2006 through July 21, 2006sale condition. Such costs include direct and $628.2 million for the period from July 22, 2006 through March 31, 2007. Our fiscal 2008indirect materials, direct and indirect labor costs, including fringe benefits, supplies, utilities, depreciation, insurance, pension and postretirement benefits, information technology costs and other manufacturing related costs.
The largest component of our cost of sales increased $386.0 million or 44.7%, comparedis cost of materials, which represented approximately 36% of net sales in fiscal 2011. The principal materials used in our Process & Motion Control manufacturing processes are commodities that are available from numerous sources and include sheet, plate and bar steel, castings, forgings, high-performance engineered plastics and a wide variety of other components. Within Water Management, we purchase a broad range of materials and components throughout the world in connection with our manufacturing activities. Major raw materials and components include bar steel, brass, castings, copper, forgings, high-performance engineered plastic, plate steel, resin, sheet plastic and zinc. We have a strategic sourcing program to significantly reduce the number of direct and indirect suppliers we use and to lower the cost of purchased materials.
The next largest component of our pro forma fiscal 2007 cost of sales is direct and indirect labor, which represented approximately 16% of $864.4 million. The majority of the increase was directly attributable to acquisitions (Zurn and GA), which accounted for $284.2 million of the year over year increase. On a pro forma basis, Power Transmission cost of sales increased $101.8 million or 12.4%, which was primarily due to the higher net sales between periods. Additional items unfavorably impacting Power Transmission cost of sales in fiscal 2008 relative2011. Direct and indirect labor and related fringe benefit costs are susceptible to fiscal 2007 included: (i) a $2.8 million reduction in a net benefit recorded as a result of a change in our vacation policy in pro forma fiscal 2007; (ii) $2.7 of severance recorded in connection with an organizational re-alignment within the Power Transmission platform and (iii) a $2.1 million charge to increase certain risk reserves (primarily workers compensation) to include a loss development factor. Partially offsetting these unfavorable items in fiscal 2008 was a $3.9 million curtailment gain related to our Power Transmission retiree medical plan.
Gross Profit.Gross profit was $603.1 million in fiscal 2008, $96.5 million for the period from April 1, 2006 through July 21, 2006 and $293.3 million for the period from July 22, 2006 through March 31, 2007. Fiscal 2008 gross profit grew $211.8 million, or 54.1%, compared to pro forma fiscal 2007 gross profit of $391.3 million. The majority of the increase is directly related to our acquisitions of Zurn and GA which accounted for $157.5 million of the year over year increase. On a pro forma basis, fiscal 2008 Power Transmission gross profit increased $54.3 million, or 14.8% compared to fiscal 2007, which was driven largely by the higher net sales
discussed above. As a percent of net sales, consolidated gross profit margins in fiscal 2008 expanded 130 basis points to 32.5% compared to our pro forma fiscal 2007 gross profit margin of 31.2%. This gross margin expansion was primarily attributable to the inclusion of Zurn’s stronger relative margins for a full twelve months in fiscal 2008 (versus 1.7 months in fiscal 2007) as well as additional cost reductions and productivity. Items adversely impacting the year over year gross margin expansion include the net unfavorable cost of sales items mentioned in the preceding paragraph.
Loss on Divestiture.On March 28, 2008, we sold a French subsidiary, Rexnord SAS, to members of that company’s local management team. We made the decision to sell Rexnord SAS to the local management team as the business would have required a substantial investment (both financial and Company management investment) to increase the overall market share position of certain products sold by the business to levels consistent with our long-term strategic plan. We incurred an $11.2 million pre-tax loss on the divestiture, which includes a $10.3 loss on disposal of net assets and $0.9 million of transactional costs. Also as part of the transaction, we signed a supplemental commercial agreement defining the prospective commercial relationship between us and PTP Industry. Through this agreement, we maintain direct access to key regional distributors and in return have agreed to purchase from PTP Industry certain locally manufactured coupling product lines and components to serve our local customer base. The divestiture is not expected to have a material impact on our overall capabilities or the results of our operations.inflationary trends.
Selling, General and Administrative Expenses (“SG&A”).SG&A was $312.2 million Selling, general and administrative expenses primarily includes sales and marketing, finance and administration, engineering and technical services and distribution. Our major cost elements include salary and wages, fringe benefits, pension and postretirement benefits, insurance, depreciation, advertising, travel and information technology costs.
Critical Accounting Estimates
The methods, estimates and judgments we use in fiscal 2008, $63.1 millionapplying our critical accounting policies have a significant impact on the results we report in our consolidated financial statements. We evaluate our estimates and judgments on an on-going basis. We base our estimates on historical experience and on assumptions that we believe to be reasonable under the circumstances. Our experience and assumptions form the basis for our judgments about the carrying value of assets and liabilities that are not readily apparent from other sources. Actual results may vary from what we anticipate and different assumptions or estimates about the future could
43
change our reported results. Within the context of these critical accounting policies, we are not currently aware of any reasonably likely event that would result in materially different amounts being reported.
We believe the following accounting policies are the most critical to us in that they are important to our financial statements and they require our most difficult, subjective or complex judgments in the preparation of our consolidated financial statements.
Revenue recognition.Net sales are recorded upon transfer of title and risk of product loss to the customer. Net sales relating to any particular shipment are based upon the amount invoiced for the period from April 1, 2006 through July 21, 2006delivered goods less estimated future rebate payments and $159.3 million forsales returns which are based upon historical experience. Revisions to these estimates are recorded in the period from July 22, 2006 throughin which the facts that give rise to the revision become known. The value of returned goods during each of the years ended March 31, 2007. Pro forma fiscal 2007 SG&A2009, 2010 and 2011 was $222.4 million and is the result of adding the above Predecessor and Successor periods with no pro forma adjustments required as a result of an assumed Merger date of April 1, 2006. Compared to pro forma fiscal 2007, fiscal 2008 SG&A increased $89.8 million,approximately 1.0% or 40.4% year-over-year. Of the $89.8 million SG&A increase, $78.9 million is attributable to the Zurn and GA acquisitions. The key drivers contributing to the remaining $10.9 million year over year increase include: (i) a $2.5 million reduction of a net benefit recorded as a result of a change in our vacation policy in fiscal 2007; (ii) $2.3 million of higher stock option expense and (iii) $1.7 million of incremental severance costs related to an organization re-alignment within the Power Transmission platform. As a percentageless of net sales, consolidated SG&A decreased to 16.8% in fiscal 2008 versus 17.7% in pro forma fiscal 2007. The 90 basis point decrease in SG&A assales. Other than a percent of net sales in fiscal 2008 is primarily the result of improved fixed cost leverage recognized on higher net sales year over year.standard product warranty, there are no other significant post-shipment obligations.
GainReceivables. Receivables are stated net of allowances for doubtful accounts of $9.6 million at March 31, 2010 and $5.3 million at March 31, 2011. On a regular basis, we evaluate our receivables and establish the allowance for doubtful accounts based on Canal Street Facility Accident, net. We recorded a gaincombination of $29.2 million in fiscal 2008 as a resultspecific customer circumstances and historical write-off experience. Credit is extended to customers based upon an evaluation of the accident at our Canal Street facility on December 6, 2006. The gain recognizedtheir financial position. Generally, advance payment is not required. Credit losses are provided for in the consolidated statement of operations in fiscal 2008 is a result of recording $5.2 million of clean-upfinancial statements and restoration expenses, professional services and inventory write-offs offset by $34.4 million of insurance recoveries. In fiscal 2007, from the date of the accident through March 31, 2007, we recorded a gain of $6.0 million as a result of the accident at our Canal Street facility. This gain was a result of recording expenses and asset impairments related to the accident, offset by cash advances from our insurance carriers totaling $37.0 million. The net impact on operations recorded as a result of the receipt of the insurance proceeds and the incurrence of expenses, impairment of assets and clean-up and restoration costs resulted in a $6.0 million gain recognized in the consolidated statement of operations in fiscal 2007. As of December 29, 2007, we finalized our accounting for this event and as a result do not expect to incur any future gains or losses.consistently have been within management’s expectations.
Transaction-Related Costs.Inventory.There Inventories are stated at the lower of cost or market. Market is determined based on estimated net realizable values. Approximately 70% of the Company’s total inventories as of March 31, 2010 and 2011 were no transaction costs recordedvalued using the “last-in, first-out” (LIFO) method. All remaining inventories are valued using the “first-in, first-out” (FIFO) method. The valuation of inventories includes material, labor and overhead and requires management to determine the amount of manufacturing variances to capitalize into inventories. We capitalize material, labor and overhead variances into inventories based upon estimates of key drivers, which generally include raw material purchases (for material variances), standard labor (for labor variances) and calculations of inventory turnover (for overhead variances).
In some cases we have determined a certain portion of our inventories are excess or obsolete. In those cases, we write down the value of those inventories to their net realizable value based upon assumptions about future demand and market conditions. If actual market conditions are less favorable than those projected by management, additional inventory write-downs may be required. The total write-down of inventories charged to expense was $17.2 million, $7.1 million, and $3.8 million, during fiscal 2009, 2010, and 2011, respectively. The reduction in inventory write-downs charged to expense in fiscal 2008. We expensed $62.7 million2010 and 2011 relates to decreased levels of Apollo transaction-related costsexcess and obsolete inventory given the stabilization in market conditions that were the cause of significant destocking throughout fiscal 2007 Predecessor period from April 1, 2006 through July 21, 2006. These costs consisted of (i) $19.1 million of seller-related expenses, including investment banking fees, outside attorney fees, and other third-party fees; (ii) $23.1 million of bond tender premium related to the $225.0 million of senior subordinated notes, substantially all of which were repurchased in connection with the Merger; and (iii) a non-cash charge of $20.5 million to write-off the remaining net book value of previously-capitalized financing fees related to the term loans and senior subordinated notes that we repaid/repurchased in connection with the Merger. On a pro forma basis, these transaction costs have been removed from our fiscal 2007 results as they are non-recurring in nature and were a direct result of the Merger.2009.
Amortization of Intangible Assets.We amortize the cost of our intangible assets which primarily include patents and customer relationships (including distribution networks). Amortization of these intangible assets amounted to $49.9 million in fiscal 2008, $5.0 million for the period from April 1, 2006 through July 21, 2006 and $26.9 million for the period from July 22, 2006 through March 31, 2007. Pro forma fiscal 2007 amortization expense was $36.2 million and includes a $4.3 million pro forma adjustment representing the additional amortization required on the incremental intangibles recorded as if the Merger occurred on April 1, 2006. After adjusting fiscal 2007 for the pro forma impact of the Merger, amortization increased $13.7 million in fiscal 2008 primarily due to the incremental amortizationImpairment of intangible assets resultingand tangible fixed assets. Our intangible assets and tangible fixed assets are held at historical cost, net of depreciation and amortization, less any provision for impairment.
Intangible assets are amortized over the shorter of their legal life or estimated useful life as follows:
| Trademarks and tradenames | No amortization (indefinite life) | |
Patents | 2 to 20 years | |
Customer Relationships | 3 to 15 years | |
Non-compete | 2 to 5 years |
44
Tangible fixed assets are depreciated to their residual values on a straight-line basis over their estimated useful lives as follows:
| Land | No depreciation | |
Buildings and improvements | 10 to 30 years | |
Machinery and equipment | 5 to 10 years | |
Computer hardware and software | 3 to 5 years |
An impairment review of specifically identifiable amortizable intangible or tangible fixed assets is performed if an indicator of impairment, such as an operating loss or cash outflow from bothoperating activities or a significant adverse change in the Zurnbusiness or market place, exists. Estimates of future cash flows used to test the asset for impairment are based on current operating projections extended to the useful life of the asset group and GA acquisitions.are, by their nature, subjective.
Interest Expense, net.Interest expense, net was $254.3 million in fiscal 2008, $21.0 millionOur recorded goodwill and indefinite lived intangible assets are not amortized but are tested annually for impairment or whenever circumstances indicate that impairment may exist using a discounted cash flow methodology based on future business projections and a market value approach. The discount rate utilized within our impairment test is based upon the period from April 1, 2006 through July 21, 2006 and $109.8 million forweighted average cost of capital of comparable public companies.
During the period from July 22, 2006 throughyear ended March 31, 2007. On2009, the Company recorded a pro forma basis, fiscal 2007 interest expense, net was $151.9 million, which includes a $21.1 million adjustment to increase our full year interest expense assuming the Mergernon-cash pre-tax impairment charge associated with goodwill and the related indebtedness occurred on April 1, 2006. Compared to pro forma fiscal 2007, fiscal 2008 interest expense, net increased $102.4 million year-over-year. The majorityidentifiable intangible assets of this increase is attributable to the incremental interest on the debt issued in the fourth quarter of fiscal 2007 (the $669.3$422.0 million, of debt issued in connection with the acquisition of Zurn on February 7, 2007which $319.3 million related to goodwill impairment and the $449.8$102.7 million of proceeds from the PIK toggle senior indebtedness issued on March 2, 2007) which was outstanding for the entire fiscal 2008 year.
Other (Expense) Income, net.Other (expense) income, net was ($5.3) million for fiscal 2008, ($0.4) million for the period from April 1, 2006 through July 21, 2006 and $5.7 million for the period from July 22, 2006 through March 31, 2007. Pro forma fiscal 2007related to other income, net was $5.3 million and is the result of adding the above Predecessor and Successor time periods with no pro forma adjustments required as a result of an assumed Merger date of April 1, 2006. Fiscal 2008 other expense, net included $5.1 million of foreign currency transaction losses, $3.0 million management fee expense and $0.3 million of losses on the sale of property, plant and equipment offset by a $1.4 million of CDSOA recovery, $1.1 million of earnings in unconsolidated affiliates and $0.6 million of other income. Other income, net for pro forma fiscal 2007 included $1.4 million of foreign currency transaction losses, $2.0 million of management fee expenses, and $0.1 million of other expenses offset by an $8.8 million CDSOA recovery.
Provision (Benefit) for Income Taxes.The income tax benefit in fiscal 2008 was $0.9 million or an effective tax rate benefit of 150.0%. The unusually high effective tax rate benefit relative to our statutory rate is due to the small pre-tax loss combined with the income tax benefit associated with the previously discussed loss on divestiture. During the periods from April 1, 2006 through July 21, 2006 and from July 22, 2006 through March 31, 2007, the income tax provision (benefit) was $(16.1) million and $9.2 million, respectively. On a pro forma basis, our fiscal 2007 income tax provision was $4.8 million or an effective tax rate of (60.8%). This amount includes a pro forma increase to our provision of $11.7 million representing the tax effect on $38.8 million of net pre-tax pro forma income adjustments impacting depreciation, amortization, transaction costs and interest expense assuming the Merger occurred on April 1, 2006. The $4.8 million income tax provision recorded with respect to the pro forma fiscal 2007 pre-tax loss of $7.9 million is primarily the result of an increase to the valuation allowance relating to foreign tax credits generated for which the realization of such receipts is not deemed more likely than not.identifiable intangible asset impairments. See note 16Note 8 to our audited consolidated financial statements included elsewhere in this prospectus for more information regarding the prior year impairment charge.
The Company expects to recognize amortization expense on the intangible assets subject to amortization of $47.9 million in fiscal year 2012, and $47.5 million in each of fiscal years 2013, 2014, 2015, and 2016.
Retirement benefits. We have significant pension and post-retirement benefit income and expense and assets/liabilities that are developed from actuarial valuations. These valuations include key assumptions regarding discount rates, expected return on plan assets, mortality rates, merit and promotion increases and the current health care cost trend rate. We consider current market conditions in selecting these assumptions. Changes in the related pension and post-retirement benefit income/costs or assets/liabilities may occur in the future due to changes in the assumptions and changes in asset values.
During the fourth quarter of fiscal 2011, we voluntarily changed our method of accounting for actuarial gains and losses related to our pension and other postretirement benefit plans. Previously, we recognized actuarial gains and losses as a component of Stockholders’ Equity on the consolidated balance sheets and amortized the actuarial gains and losses over participants’ average remaining service period, or average remaining life expectancy, when all or almost all plan participants are inactive, as a component of net periodic benefit cost if the unrecognized gain or loss exceeded 10 percent of the greater of the market-related value of plan assets or the plan’s projected benefit obligation at the beginning of the year (the “corridor”). Under the new method, the net actuarial gains or losses in excess of the corridor will be recognized immediately in operating results during the fourth quarter of each fiscal year (or upon any re-measurement date). Net periodic benefit costs recorded on a quarterly basis would continue to primarily be comprised of service and interest cost, amortization of unrecognized prior service cost and the expected return on plan assets. While the historical method of recognizing actuarial gains and losses was considered acceptable, we believe this method is preferable as it accelerates the recognition of actuarial gains and losses outside of the corridor. See Note 2 to our audited consolidated financial statements included elsewhere in this prospectus for a presentation of our operating results before and after the application of this accounting change.
45
The obligation for postretirement benefits other than pension also is actuarially determined and is affected by assumptions including the discount rate and expected future increase in per capita costs of covered postretirement health care benefits. Changes in the discount rate and differences between actual and assumed per capita health care costs may affect the recorded amount of the expense in future periods.
Income taxes. We are subject to income taxes in the United States and numerous foreign jurisdictions. Significant judgment is required in determining our worldwide provision for income taxes and recording the related deferred tax assets and liabilities.
We assess our income tax positions and record tax liabilities for all years subject to examination based upon management’s evaluation of the facts and circumstances and information available at the reporting dates. For those income tax positions where it is more-likely-than-not that a tax benefit will be sustained upon the conclusion of an examination, we have recorded the largest amount of tax benefit having a cumulatively greater than 50% likelihood of being realized upon ultimate settlement with the applicable taxing authority, assuming that it has full knowledge of all relevant information. For those tax positions which do not meet the more-likely-than-not threshold regarding the ultimate realization of the related tax benefit, no tax benefit has been recorded in the financial statements. In addition, we have provided for interest and penalties, as applicable, and record such amounts as a component of the overall income tax provision.
We recognize deferred tax assets and liabilities based on the differences between the financial statement carrying amounts and the tax bases of assets and liabilities, net operating losses, tax credits and other carryforwards. We regularly review our deferred tax assets for recoverability and establish a valuation allowance based on historical losses, projected future taxable income and the expected timing of the reversals of existing temporary differences. As a result of this review, we have established a valuation allowance against substantially all of our deferred tax assets relating to foreign loss carryforwards, state net operating loss and foreign tax credit carryforwards.
Commitments and Contingencies. We are subject to proceedings, lawsuits and other claims related to environmental, labor, product and other matters. We are required to assess the likelihood of any adverse judgments or outcomes to these matters as well as potential ranges of probable losses. We determine the amount of reserves needed, if any, for each individual issue based on our professional knowledge and experience and discussions with legal counsel. The required reserves may change in the future due to new developments in each matter, the ultimate resolution of each matter or changes in approach, such as a change in settlement strategy.
Through acquisitions, we have assumed presently recorded and potential future liabilities relating to product liability, environmental and other claims. We have recorded reserves for claims related to these obligations when appropriate and, on certain occasions, have obtained the assistance of an independent actuary in the determination of those reserves. If actual experience deviates from our estimates, we may need to record adjustments to these liabilities in future periods.
Warranty Reserves. Reserves are recorded on our consolidated balance sheets to reflect our contractual liabilities relating to warranty commitments to our customers. We provide warranty coverage of various lengths and terms to our customers depending on standard offerings and negotiated contractual agreements. We record an estimate for warranty expense at the time of sale based on historical warranty return rates and repair costs. Should future warranty experience differ materially from our historical experience, we may be required to record additional warranty reserves which could have a material adverse effect on our results of operations in the period in which these additional reserves are required.
Net Income (Loss).Environmental Liabilities. We accrue an estimated liability for each environmental matter when the likelihood of an unfavorable outcome is probable and the amount of loss associated with such unfavorable outcome is reasonably estimable. We presume that a matter is probable of an unfavorable outcome if (a) litigation has commenced or a claim has been asserted or if commencement of litigation or assertion of a claim is probable and (b) if we are somehow associated with the site. In addition, if the reporting entity has been named as a PRP, an unfavorable outcome is presumed.
46
Estimating environmental remediation liabilities involves an array of issues at any point in time. In the early stages of the process, cost estimates can be difficult to derive because of uncertainties about a variety of factors. For this reason, estimates developed in the early stages of remediation can vary significantly, and, in many cases, early estimates later require significant revision. The net income recorded in fiscal 2008 was $0.3 million as compared to a pro forma net lossfollowing are some of $12.7 million in fiscal 2007 due to the factors described above. that are integral to developing cost estimates:
The $12.7 million net loss in pro forma fiscal 2007 was comprisedextent and types of hazardous substances at a site;
The range of technologies that can be used for remediation;
Evolving standards of what constitutes acceptable remediation; and
The number and financial condition of other PRPs and the extent of their responsibility for the remediation.
An estimate of the range of an environmental remediation liability typically is derived by combining estimates of various components of the liability, which themselves are likely to be ranges. At the early stages of the remediation process, particular components of the overall liability may not be reasonably estimable. This fact does not preclude our recognition of a $39.6 million net lossliability. Rather, the components of the liability that can be reasonably estimated are viewed as a surrogate for the period from April 1, 2006 through July 21, 2006,minimum in the range of our overall liability. Estimated legal and consulting fees are included as a $0.2 million net losscomponent of our overall liability.
Asbestos Claims and Insurance for the period from July 22, 2006 through March 31, 2007Asbestos Claims. As noted in Note 18 to our consolidated financial statements included elsewhere in this prospectus, certain Water Management subsidiaries are subject to asbestos litigation. As a result, we have recorded a liability for pending and potential future asbestos claims, as well as $27.1 milliona receivable for insurance coverage of pro forma net income adjustmentssuch liability. The valuation of our potential asbestos liability was based on the number and severity of future asbestos claims, future settlement costs, and the effectiveness of defense strategies and settlement initiatives.
The present estimate of our asbestos liability assumes (i) our continuous vigorous defense strategy will remain effective; (ii) new asbestos claims filed annually against Zurn will decline modestly through the next ten years; (iii) the values by disease will remain consistent with past experience and (iv) our insurers will continue to recordpay defense costs without eroding the impactcoverage amounts of our insurance policies. Our potential asbestos liability could be adversely affected by changes in law and other factors beyond our control. Further, while our current asbestos liability is based on an estimate of claims through the next ten years, such liability may continue beyond that time period and such liability could be substantial.
We estimate that our available insurance to cover our potential asbestos liability as of the Merger assuming itend of fiscal 2011 is greater than our potential asbestos liability. This conclusion was completed on April 1, 2006.reached after considering our experience in asbestos litigation, the insurance payments made to date by our insurance carriers, existing insurance policies, the industry ratings of the insurers and the advice of insurance coverage counsel with respect to applicable insurance coverage law relating to the terms and conditions of those policies. We used these same considerations when evaluating the recoverability of our receivable for insurance coverage of potential asbestos claims.
Results of Operations
Period from April 1, 2006 through July 21, 2006, the Period from July 22, 2006 through March 31, 2007 and the Pro Forma Fiscal Year Ended March 31, 20072011 Compared with the Fiscal Year Ended March 31, 20062010
Net Sales.Sales Net
(in Millions)
| Fiscal Year Ended | ||||||||||||||||
| March 31, 2010 | March 31, 2011 | Change | % Change | |||||||||||||
Process & Motion Control | $ | 1,003.7 | $ | 1,175.1 | $ | 171.4 | 17.1 | % | ||||||||
Water Management | 506.3 | 524.5 | 18.2 | 3.6 | % | |||||||||||
Consolidated | $ | 1,510.0 | $ | 1,699.6 | $ | 189.6 | 12.6 | % | ||||||||
47
Process & Motion Control
Process & Motion Control net sales were $334.2 million for the periodyear ended March 31, 2011 increased 17.1% from April 1, 2006 through July 21, 2006, $921.5 millionthe prior year to $1,175.1 million. Core net sales, which excludes foreign currency fluctuations, increased by 17.5% year-over-year driven by solid international growth, improved demand in our North America end-markets and market share gains across many of our products.
Water Management
Water Management net sales for the period from July 22, 2006 throughyear ended March 31, 2007 and $1,081.4 million in fiscal 2006. Pro forma fiscal 2007 sales were $1,255.7 million, which merely represents2011 increased 3.6% from the combination of the above Predecessor and Successor periods as no pro forma adjustments are requiredprior year to reflect the impact of the Merger based upon an assumed consummation date of April 1, 2006. On a pro forma basis, fiscal 2007$524.5 million. Core net sales, increased $174.3 million or 16.1%, over fiscal 2006 net sales of $1,081.4 million. Approximately $25.2 million ofwhich excludes the year over year increase was due to the inclusion of the Falk acquisition for all of pro forma fiscal 2007 compared to approximately 10.5 months in fiscal 2006. Additionally, the Zurn acquisition added $69.5 million of net sales from the date of acquisition through March 31, 2007. The remaining net sales increase of $79.6 million was driven primarily by strength in our power transmission products end markets of mining, energy, aerospace and cement. Foreignforeign currency fluctuations, favorably impacted net salesincreased by approximately $18.8 million during fiscal 2007, as the Euro and Canadian Dollar strengthened against the U.S. Dollar. The Canal Street facility accident affected production and shipments from the Canal Street facility, creating a business interruption that we estimate adversely impacted net sales in pro forma fiscal 2007 by approximately $37.0 to $46.0 million.
Cost of Sales.Cost of sales was $237.7 million for the period from April 1, 2006 through July 21, 2006 and $628.2 million for the period from July 22, 2006 through March 31, 2007. On a pro forma basis, our fiscal 2007 cost of sales of $864.4 million increased $122.1 million or 16.4% compared to fiscal 2006 cost of sales of $742.3 million. Power Transmission cost of sales increased $77.0 million3.1% year-over-year on a pro forma basis which was primarily the result of higher net sales volume year-over-year. Additionally, the Zurn acquisition added $45.1 million of costs from February 7, 2007 through March 31, 2007. Cost of sales in pro forma fiscal 2007 also includes $25.0 million of incremental unfavorable expenses from selling inventories that were adjusted to fair value in purchase accounting as a result of targeted market share gains and growth in alternative markets, which more than offset the Apollooverall decline in the core infrastructure and Zurn acquisitions, partially offset by $18.8 million of LIFO income recorded in pro forma fiscal 2007.non-residential construction markets, which we estimate to be down 15% year-over-year based on McGraw Hill construction data.
Gross Profit. Gross profit was $96.5 million for the period from April 1, 2006 through July 21, 2006 and $293.3 million for the period from July 22, 2006 through March 31, 2007. Pro forma fiscal 2007 gross profit grew 15.4% to $391.3 million, or 31.2% of net sales, from $339.1 million, or 31.4% of net sales in fiscal 2006. The increase in gross profit in pro forma fiscal 2007 compared to fiscal 2006 was primarily driven by the incremental sales volume year-over-year. Our gross profit in pro forma fiscal 2007 also includes $25.0 million of incremental unfavorable expenses from selling inventories that were adjusted to fair value in purchase accounting as a result of the Apollo and Zurn acquisitions, partially offset by $18.8 million of LIFO income recorded in fiscal 2007. The net of these fair value and LIFO adjustments adversely affected gross profit margins by a combined 50 basis points in fiscal 2007. In fiscal 2006, we recorded $3.0 million of LIFO expense that adversely affected gross profit margins by 28 basis points.
Selling, General and Administrative Expenses. (“SG&A”). SG&A expenses were $63.1 million for the period from April 1, 2006 through July 21, 2006 and $159.3 million for the period from July 22, 2006 through March 31, 2007. Pro forma fiscal 2007 SG&A was $222.4 million and is the result of adding the above Predecessor and Successor periods with no pro forma adjustments required as a result of an assumed Merger date of April 1, 2006. Compared to fiscal 2006 SG&A of $187.8 million, pro forma fiscal 2007 SG&A increased $34.6 million, or 18.4% year-over-year. As a percentage of net sales, SG&A expenses grew to 17.7% in pro forma fiscal 2007 compared to 17.4% in fiscal 2006. The increase in SG&A expenses as a percent of net sales is due primarily to the impact of the Canal Street facility accident and resulting lower net sales in pro forma fiscal 2007 as a result of the business interruption. In SG&A dollars, the Zurn and Falk acquisitions account for approximately $15.0 million of the year-over-year increase in SG&A expense. Excluding acquisitions, SG&A increased as a result of the following: higher stock option expense of $5.1 million due to the adoption of SFAS No. 123R, $5.3 million of higher depreciation expense and $2.8 million of unfavorable currency impact due to
the strengthening of the Euro and Canadian Dollar. The remaining increase in SG&A was driven by higher compensation costs as compared to the prior year, offset by a one-time $3.1 million benefit recorded in pro forma fiscal 2007 as a result of the change in our vacation policy.
Restructuring and Other Similar Costs.We have recorded no This section provides a description of the restructuring or other similaractions we executed to reduce operating costs and improve profitability.
Financial Statement Presentation. This section provides a brief description of certain items and accounting policies that appear in pro forma fiscal 2007. We expensed $31.1 millionour financial statements and general factors that impact these items.
Critical Accounting Estimates. This section discusses the accounting policies and estimates that we consider to be important to our financial condition and results of restructuring and other similar costs in fiscal 2006, including $6.9 million of non-cash asset impairments, related to plans we initiated in fiscal 2006 to restructure certain manufacturing operations and reduce headcount at certain locations. The non-cash asset impairments relatedthat require significant judgment and estimates on the part of management in their application.
Results of Operations. This section provides an analysis of our results of operations for our fiscal years ended March 31, 2009, 2010 and 2011, in each case as compared to the closureprior period’s performance.
Non-GAAP Financial Measure. This section provides an explanation of a certain Non-GAAP financial measure we use.
Covenant Compliance. This section provides a description of certain restrictive covenants with which our credit agreement and indentures require us to comply.
Liquidity and Capital Resources. This section provides an analysis of our flattop plant in Puerto Ricocash flows for our fiscal years ended March 31, 2009, 2010 and 2011, as well as a decision to outsource certain portionsdiscussion of our industrial chain manufacturing operations. We also incurred $16.5 millionindebtedness and its potential effects on our liquidity.
Tabular Disclosure of plant consolidation and integration costs consisting primarily of (i) the closureContractual Obligations. This section provides a discussion of our coupling plant in Warren, Pennsylvania, (ii) the closure of our flattop plant in Puerto Rico and (iii) Falk integration costs, including the continuation of certain Falk plant consolidation efforts that had been initiated prior to the Falk acquisition. All of these consolidation and integration actions were substantially completecommitments as of March 31, 2006. 2011.
Quantitative and Qualitative Disclosures about Market Risk. This section discusses our exposure to potential losses arising from adverse changes in interest rates and commodity prices.
Company Overview
Rexnord is a growth-oriented, multi-platform industrial company with what we believe are leading market shares and highly trusted brands that serve a diverse array of global end-markets. Our heritage of innovation and specification have allowed us to provide highly engineered, mission critical solutions to customers for decades and affords us the privilege of having long-term, valued relationships with market leaders. We operate our
42
company in a disciplined way and RBS is our operating philosophy. Grounded in the spirit of continuous improvement, RBS creates a scalable, process-based framework that focuses on driving superior customer satisfaction and financial results by targeting world-class operating performance throughout all aspects of our business.
Restructuring and Other Similar Costs
Beginning with the quarter ended September 28, 2008, we executed certain restructuring actions to reduce operating costs and improve profitability. As the restructuring actions were substantially completed during fiscal 2010, we did not record any restructuring charges during the year ended March 31, 2011. Comparatively, we recorded restructuring charges of $24.5 million and $6.8 million for the years ended March 31, 2009 and 2010, respectively, primarily consisting of severance costs related to workforce reductions.
Financial Statement Presentation
The remaining $7.7 millionfollowing paragraphs provide a brief description of restructuringcertain items and other similar costsaccounting policies that appear in fiscal 2006 relate primarily to severance, relocationour financial statements and recruiting expensesgeneral factors that impact these items.
Net Sales. Net sales represent gross sales less deductions taken for certain headcount reductionsales returns and management realignment initiatives.allowances and incentive rebate programs.
GainCost of Sales. Cost of sales includes all costs of manufacturing required to bring a product to a ready for sale condition. Such costs include direct and indirect materials, direct and indirect labor costs, including fringe benefits, supplies, utilities, depreciation, insurance, pension and postretirement benefits, information technology costs and other manufacturing related costs.
The largest component of our cost of sales is cost of materials, which represented approximately 36% of net sales in fiscal 2011. The principal materials used in our Process & Motion Control manufacturing processes are commodities that are available from numerous sources and include sheet, plate and bar steel, castings, forgings, high-performance engineered plastics and a wide variety of other components. Within Water Management, we purchase a broad range of materials and components throughout the world in connection with our manufacturing activities. Major raw materials and components include bar steel, brass, castings, copper, forgings, high-performance engineered plastic, plate steel, resin, sheet plastic and zinc. We have a strategic sourcing program to significantly reduce the number of direct and indirect suppliers we use and to lower the cost of purchased materials.
The next largest component of our cost of sales is direct and indirect labor, which represented approximately 16% of net sales in fiscal 2011. Direct and indirect labor and related fringe benefit costs are susceptible to inflationary trends.
Selling, General and Administrative Expenses. Selling, general and administrative expenses primarily includes sales and marketing, finance and administration, engineering and technical services and distribution. Our major cost elements include salary and wages, fringe benefits, pension and postretirement benefits, insurance, depreciation, advertising, travel and information technology costs.
Critical Accounting Estimates
The methods, estimates and judgments we use in applying our critical accounting policies have a significant impact on Canal Street facility accident, net.the results we report in our consolidated financial statements. We evaluate our estimates and judgments on an on-going basis. We base our estimates on historical experience and on assumptions that we believe to be reasonable under the circumstances. Our experience and assumptions form the basis for our judgments about the carrying value of assets and liabilities that are not readily apparent from other sources. Actual results may vary from what we anticipate and different assumptions or estimates about the future could
43
change our reported results. Within the context of these critical accounting policies, we are not currently aware of any reasonably likely event that would result in materially different amounts being reported.
We believe the following accounting policies are the most critical to us in that they are important to our financial statements and they require our most difficult, subjective or complex judgments in the preparation of our consolidated financial statements.
Revenue recognition.Net sales are recorded upon transfer of title and risk of product loss to the customer. Net sales relating to any particular shipment are based upon the amount invoiced for the delivered goods less estimated future rebate payments and sales returns which are based upon historical experience. Revisions to these estimates are recorded in the period in which the facts that give rise to the revision become known. The value of returned goods during each of the years ended March 31, 2009, 2010 and 2011 was approximately 1.0% or less of net sales. Other than a standard product warranty, there are no other significant post-shipment obligations.
Receivables. Receivables are stated net of allowances for doubtful accounts of $9.6 million at March 31, 2010 and $5.3 million at March 31, 2011. On a regular basis, we evaluate our receivables and establish the allowance for doubtful accounts based on a combination of specific customer circumstances and historical write-off experience. Credit is extended to customers based upon an evaluation of their financial position. Generally, advance payment is not required. Credit losses are provided for in the consolidated financial statements and consistently have been within management’s expectations.
Inventory. Inventories are stated at the lower of cost or market. Market is determined based on estimated net realizable values. Approximately 70% of the Company’s total inventories as of March 31, 2010 and 2011 were valued using the “last-in, first-out” (LIFO) method. All remaining inventories are valued using the “first-in, first-out” (FIFO) method. The valuation of inventories includes material, labor and overhead and requires management to determine the amount of manufacturing variances to capitalize into inventories. We capitalize material, labor and overhead variances into inventories based upon estimates of key drivers, which generally include raw material purchases (for material variances), standard labor (for labor variances) and calculations of inventory turnover (for overhead variances).
In some cases we have determined a certain portion of our inventories are excess or obsolete. In those cases, we write down the value of those inventories to their net realizable value based upon assumptions about future demand and market conditions. If actual market conditions are less favorable than those projected by management, additional inventory write-downs may be required. The total write-down of inventories charged to expense was $17.2 million, $7.1 million, and $3.8 million, during fiscal 2009, 2010, and 2011, respectively. The reduction in inventory write-downs charged to expense in fiscal 2010 and 2011 relates to decreased levels of excess and obsolete inventory given the stabilization in market conditions that were the cause of significant destocking throughout fiscal 2009.
Impairment of intangible assets and tangible fixed assets. Our intangible assets and tangible fixed assets are held at historical cost, net of depreciation and amortization, less any provision for impairment.
Intangible assets are amortized over the shorter of their legal life or estimated useful life as follows:
| Trademarks and tradenames | No amortization (indefinite life) | |
Patents | 2 to 20 years | |
Customer Relationships | 3 to 15 years | |
Non-compete | 2 to 5 years |
44
Tangible fixed assets are depreciated to their residual values on a straight-line basis over their estimated useful lives as follows:
| Land | No depreciation | |
Buildings and improvements | 10 to 30 years | |
Machinery and equipment | 5 to 10 years | |
Computer hardware and software | 3 to 5 years |
An impairment review of specifically identifiable amortizable intangible or tangible fixed assets is performed if an indicator of impairment, such as an operating loss or cash outflow from operating activities or a significant adverse change in the business or market place, exists. Estimates of future cash flows used to test the asset for impairment are based on current operating projections extended to the useful life of the asset group and are, by their nature, subjective.
Our recorded goodwill and indefinite lived intangible assets are not amortized but are tested annually for impairment or whenever circumstances indicate that impairment may exist using a discounted cash flow methodology based on future business projections and a market value approach. The discount rate utilized within our impairment test is based upon the weighted average cost of capital of comparable public companies.
During the year ended March 31, 2009, the Company recorded a gainnon-cash pre-tax impairment charge associated with goodwill and identifiable intangible assets of $6.0$422.0 million, of which $319.3 million related to goodwill impairment and $102.7 million related to other identifiable intangible asset impairments. See Note 8 to our audited consolidated financial statements included elsewhere in this prospectus for more information regarding the prior year impairment charge.
The Company expects to recognize amortization expense on the intangible assets subject to amortization of $47.9 million in pro forma fiscal year 20072012, and $47.5 million in each of fiscal years 2013, 2014, 2015, and 2016.
Retirement benefits. We have significant pension and post-retirement benefit income and expense and assets/liabilities that are developed from actuarial valuations. These valuations include key assumptions regarding discount rates, expected return on plan assets, mortality rates, merit and promotion increases and the current health care cost trend rate. We consider current market conditions in selecting these assumptions. Changes in the related pension and post-retirement benefit income/costs or assets/liabilities may occur in the future due to changes in the assumptions and changes in asset values.
During the fourth quarter of fiscal 2011, we voluntarily changed our method of accounting for actuarial gains and losses related to our pension and other postretirement benefit plans. Previously, we recognized actuarial gains and losses as a component of Stockholders’ Equity on the consolidated balance sheets and amortized the actuarial gains and losses over participants’ average remaining service period, or average remaining life expectancy, when all or almost all plan participants are inactive, as a component of net periodic benefit cost if the unrecognized gain or loss exceeded 10 percent of the greater of the market-related value of plan assets or the plan’s projected benefit obligation at the beginning of the year (the “corridor”). Under the new method, the net actuarial gains or losses in excess of the corridor will be recognized immediately in operating results during the fourth quarter of each fiscal year (or upon any re-measurement date). Net periodic benefit costs recorded on a quarterly basis would continue to primarily be comprised of service and interest cost, amortization of unrecognized prior service cost and the expected return on plan assets. While the historical method of recognizing actuarial gains and losses was considered acceptable, we believe this method is preferable as it accelerates the recognition of actuarial gains and losses outside of the corridor. See Note 2 to our audited consolidated financial statements included elsewhere in this prospectus for a presentation of our operating results before and after the application of this accounting change.
45
The obligation for postretirement benefits other than pension also is actuarially determined and is affected by assumptions including the discount rate and expected future increase in per capita costs of covered postretirement health care benefits. Changes in the discount rate and differences between actual and assumed per capita health care costs may affect the recorded amount of the expense in future periods.
Income taxes. We are subject to income taxes in the United States and numerous foreign jurisdictions. Significant judgment is required in determining our worldwide provision for income taxes and recording the related deferred tax assets and liabilities.
We assess our income tax positions and record tax liabilities for all years subject to examination based upon management’s evaluation of the facts and circumstances and information available at the reporting dates. For those income tax positions where it is more-likely-than-not that a tax benefit will be sustained upon the conclusion of an examination, we have recorded the largest amount of tax benefit having a cumulatively greater than 50% likelihood of being realized upon ultimate settlement with the applicable taxing authority, assuming that it has full knowledge of all relevant information. For those tax positions which do not meet the more-likely-than-not threshold regarding the ultimate realization of the related tax benefit, no tax benefit has been recorded in the financial statements. In addition, we have provided for interest and penalties, as applicable, and record such amounts as a component of the overall income tax provision.
We recognize deferred tax assets and liabilities based on the differences between the financial statement carrying amounts and the tax bases of assets and liabilities, net operating losses, tax credits and other carryforwards. We regularly review our deferred tax assets for recoverability and establish a valuation allowance based on historical losses, projected future taxable income and the expected timing of the reversals of existing temporary differences. As a result of this review, we have established a valuation allowance against substantially all of our deferred tax assets relating to foreign loss carryforwards, state net operating loss and foreign tax credit carryforwards.
Commitments and Contingencies. We are subject to proceedings, lawsuits and other claims related to environmental, labor, product and other matters. We are required to assess the likelihood of any adverse judgments or outcomes to these matters as well as potential ranges of probable losses. We determine the amount of reserves needed, if any, for each individual issue based on our professional knowledge and experience and discussions with legal counsel. The required reserves may change in the future due to new developments in each matter, the ultimate resolution of each matter or changes in approach, such as a change in settlement strategy.
Through acquisitions, we have assumed presently recorded and potential future liabilities relating to product liability, environmental and other claims. We have recorded reserves for claims related to these obligations when appropriate and, on certain occasions, have obtained the assistance of an independent actuary in the determination of those reserves. If actual experience deviates from our estimates, we may need to record adjustments to these liabilities in future periods.
Warranty Reserves. Reserves are recorded on our consolidated balance sheets to reflect our contractual liabilities relating to warranty commitments to our customers. We provide warranty coverage of various lengths and terms to our customers depending on standard offerings and negotiated contractual agreements. We record an estimate for warranty expense at the time of sale based on historical warranty return rates and repair costs. Should future warranty experience differ materially from our historical experience, we may be required to record additional warranty reserves which could have a material adverse effect on our results of operations in the period in which these additional reserves are required.
Environmental Liabilities. We accrue an estimated liability for each environmental matter when the likelihood of an unfavorable outcome is probable and the amount of loss associated with such unfavorable outcome is reasonably estimable. We presume that a matter is probable of an unfavorable outcome if (a) litigation has commenced or a claim has been asserted or if commencement of litigation or assertion of a claim is probable and (b) if we are somehow associated with the site. In addition, if the reporting entity has been named as a PRP, an unfavorable outcome is presumed.
46
Estimating environmental remediation liabilities involves an array of issues at any point in time. In the early stages of the process, cost estimates can be difficult to derive because of uncertainties about a variety of factors. For this reason, estimates developed in the early stages of remediation can vary significantly, and, in many cases, early estimates later require significant revision. The following are some of the factors that are integral to developing cost estimates:
The extent and types of hazardous substances at a site;
The range of technologies that can be used for remediation;
Evolving standards of what constitutes acceptable remediation; and
The number and financial condition of other PRPs and the extent of their responsibility for the remediation.
An estimate of the range of an environmental remediation liability typically is derived by combining estimates of various components of the liability, which themselves are likely to be ranges. At the early stages of the remediation process, particular components of the overall liability may not be reasonably estimable. This fact does not preclude our recognition of a liability. Rather, the components of the liability that can be reasonably estimated are viewed as a surrogate for the minimum in the range of our overall liability. Estimated legal and consulting fees are included as a component of our overall liability.
Asbestos Claims and Insurance for Asbestos Claims. As noted in Note 18 to our consolidated financial statements included elsewhere in this prospectus, certain Water Management subsidiaries are subject to asbestos litigation. As a result, we have recorded a liability for pending and potential future asbestos claims, as well as a receivable for insurance coverage of such liability. The valuation of our potential asbestos liability was based on the number and severity of future asbestos claims, future settlement costs, and the effectiveness of defense strategies and settlement initiatives.
The present estimate of our asbestos liability assumes (i) our continuous vigorous defense strategy will remain effective; (ii) new asbestos claims filed annually against Zurn will decline modestly through the next ten years; (iii) the values by disease will remain consistent with past experience and (iv) our insurers will continue to pay defense costs without eroding the coverage amounts of our insurance policies. Our potential asbestos liability could be adversely affected by changes in law and other factors beyond our control. Further, while our current asbestos liability is based on an estimate of claims through the next ten years, such liability may continue beyond that time period and such liability could be substantial.
We estimate that our available insurance to cover our potential asbestos liability as of the end of fiscal 2011 is greater than our potential asbestos liability. This conclusion was reached after considering our experience in asbestos litigation, the insurance payments made to date by our insurance carriers, existing insurance policies, the industry ratings of the insurers and the advice of insurance coverage counsel with respect to applicable insurance coverage law relating to the terms and conditions of those policies. We used these same considerations when evaluating the recoverability of our receivable for insurance coverage of potential asbestos claims.
Results of Operations
Fiscal Year Ended March 31, 2011 Compared with the Fiscal Year Ended March 31, 2010
Net Sales
(in Millions)
| Fiscal Year Ended | ||||||||||||||||
| March 31, 2010 | March 31, 2011 | Change | % Change | |||||||||||||
Process & Motion Control | $ | 1,003.7 | $ | 1,175.1 | $ | 171.4 | 17.1 | % | ||||||||
Water Management | 506.3 | 524.5 | 18.2 | 3.6 | % | |||||||||||
Consolidated | $ | 1,510.0 | $ | 1,699.6 | $ | 189.6 | 12.6 | % | ||||||||
47
Process & Motion Control
Process & Motion Control net sales for the year ended March 31, 2011 increased 17.1% from the prior year to $1,175.1 million. Core net sales, which excludes foreign currency fluctuations, increased by 17.5% year-over-year driven by solid international growth, improved demand in our North America end-markets and market share gains across many of our products.
Water Management
Water Management net sales for the year ended March 31, 2011 increased 3.6% from the prior year to $524.5 million. Core net sales, which excludes the foreign currency fluctuations, increased by 3.1% year-over-year as a result of targeted market share gains and growth in alternative markets, which more than offset the overall decline in the core infrastructure and non-residential construction markets, which we estimate to be down 15% year-over-year based on McGraw Hill construction data.
Income from Operations
(in Millions)
| Fiscal Year Ended | ||||||||||||
| March 31, 2010 | March 31, 2011 | Change | ||||||||||
Process & Motion Control | $ | 116.5 | $ | 181.1 | $ | 64.6 | ||||||
% of net sales | 11.6 | % | 15.4 | % | 3.8 | % | ||||||
Water Management | 76.1 | 69.4 | (6.7 | ) | ||||||||
% of net sales | 15.0 | % | 13.2 | % | (1.8 | %) | ||||||
Corporate | (31.2 | ) | (31.4 | ) | (0.2 | ) | ||||||
Consolidated | $ | 161.4 | $ | 219.1 | $ | 57.7 | ||||||
% of net sales | 10.7 | % | 12.9 | % | 2.2 | % | ||||||
Process & Motion Control
Process & Motion Control income from operations for the year ended March 31, 2011 increased 55.5% to $181.1 million compared to fiscal 2010. Income from operations as a percent of net sales increased 380 basis points from the prior year to 15.4%. The improvement in fiscal 2011 operating margin is primarily the result of our improved operating leverage on higher year-over-year net sales volume, productivity gains and cost reduction actions, partially offset by higher material costs and targeted investments in new product development and global growth capabilities.
Water Management
Water Management income from operations for the year ended March 31, 2011 declined 8.8% to $69.4 million compared to fiscal 2010. Income from operations as a percent of net sales decreased 180 basis points from the prior year to 13.2%. The decline in fiscal 2011 operating margin is primarily the result of higher year-over-year material costs and the impact of profit variability within certain water and wastewater project shipments in the current year compared to the prior year as well as investments in new product development and growth initiatives.
48
Corporate
Corporate expenses increased by $0.2 million from $31.2 million in fiscal 2010 to $31.4 million in fiscal 2011.
Interest Expense, Net.Interest expense, net was $194.2 million during the year ended March 31, 2010 compared to $180.8 million during the year ended March 31, 2011. The year-over-year reduction in interest expense is primarily the result of the lower weighted average fixed borrowing rates on our senior notes, partially offset by a slight increase in average debt outstanding as a result of the accident at our Canal Street facility on December 6, 2006. The net impact on operations was the result of the receipt of $37.0 million of insurance proceeds offset by $31.0 million of expenses related to insurance deductibles, professional services, clean-up and restoration costs and asset impairments.
Transaction-Related Costs.We expensed $62.7 million of Apollo transaction-related costs in the Predecessor period from April 1, 2006 through July 21, 2006. These costs consisted of (i) $19.1 million of seller-related expenses, including investment banking fees, outside attorney fees, and other third-party fees; (ii) $23.1 million of bond tender premium related to the $225.0 million of senior subordinatedincremental notes substantially all of which were repurchasedissued in connection with the Merger;April 2010 refinancing.
Gain (Loss) on Debt Extinguishment. During fiscal 2010, we recorded a $167.8 million gain on debt extinguishment as a result of the purchase and extinguishment of a portion of our PIK toggle senior indebtedness and our April 2009 debt exchange offer. During fiscal 2011, we recorded a $100.8 million loss on debt extinguishment as a result of our early repayment of debt in April 2010 pursuant to cash tender offers. The $100.8 million charge was comprised of a bond tender premium paid to the lender and the non-cash write-off of deferred financing fees and net original issuance discount.
Purchase and Extinguishment of a Portion of PIK Toggle Senior Indebtedness
During fiscal 2010, we purchased and extinguished $67.4 million of outstanding face value PIK toggle senior indebtedness due 2013 for $36.5 million in cash. As a result, we recognized a $30.3 million gain during the year ended March 31, 2010, which was measured based on the difference between the cash paid and the net carrying amount of the debt (the net carrying amount of the debt included unamortized original issue discount of $0.6 million, unamortized debt issuance costs of $0.6 million, and $0.3 million of accrued interest) along with the forgiveness of $0.4 million of accrued interest.
Debt Exchange
During fiscal 2010, we completed an exchange offer by which (i) approximately $71.0 million principal amount of 8.875% Senior Notes due 2014 (the “8.875% Notes”), (ii) approximately $235.7 million principal amount of PIK Toggle Notes, and (iii) approximately $7.9 million principal amount of PIK Toggle Loans were exchanged for $196.3 million of aggregate principal of 9.50% Senior Notes due 2014 (the “2009 9.50% Notes”) (excluding a non-cash chargenet original issue discount of $20.5$20.6 million).
The Company accounted for the debt exchange transaction pursuant to ASC 470-50Debt Modifications and Extinguishments (“ASC 470-50”). As a result of the debt exchange, the Company recognized a gain of $137.5 million on the extinguishment of 8.875% Notes, PIK Toggle Notes and PIK Toggle Loans. The gain on extinguishment of $137.5 million relates to write-off the remaining net bookextinguishment of $235.7 million of outstanding face value 8.875% Notes and PIK Toggle Notes and $7.9 million of outstanding face value of previously-capitalized financing fees relatedPIK Toggle Loans and is measured based on the difference between the fair market value of the 9.50% Notes issued of $104.5 million and the net carrying amount of the debt (the net carrying amount of the debt includes unamortized original issue discount of $2.5 million, unamortized debt issuance costs of $2.2 million and $3.1 million of accrued interest).
Tender Offer and Note Issuance
During fiscal 2011, we purchased by means of cash tender offers and extinguished $794.1 million of 9.50% Senior Notes due 2014 issued in 2006 (the “2006 9.50% Notes”), $196.3 million of 2009 9.50% Notes and $77.0 million of 8.875% Notes, and issued $1,145.0 million of 8.50% Senior Notes due 2018 (the “8.50% Notes”). We accounted for the cash tender offers and the issuance of the 8.50% Notes in accordance with ASC 470-50. Pursuant to this guidance, the term loans and senior subordinated notes that we repaid/repurchased incash tender offers were accounted for as an extinguishment of debt. In connection with the Merger. There were no transaction-related costs recordednote offering, we incurred an increase in fiscal 2006.
Amortizationlong-term debt of Intangible Assets. We amortize the cost of our intangible assets which include patents, customer relationships (including distribution network), a covenant not to compete and software. Amortization of these intangible assets amounted to $5.0 million for the period from April 1, 2006 through July 21, 2006 and $26.9 million for the period from July 22, 2006 through March 31, 2007. Pro forma fiscal 2007 amortization expense was $36.2approximately $89.5 million, and includeswe also recognized a $4.3$100.8 million pro forma adjustment representing the additional amortization requiredloss on the incremental intangibles recorded as if the Merger occurred on April 1, 2006. Amortizationdebt extinguishment, which was comprised of intangible assets amounteda bond tender premium paid to $15.7 million in fiscal 2006. The increase in pro forma fiscal 2007 amortization expense over fiscal 2006 is due to our increased levels of intangible assets recorded through purchase accounting as a result both the Merger and Zurn acquisitions in pro forma fiscal 2007.
Interest Expense, net. Interest expense, net was $21.0 million for the period from April 1, 2006 through July 21, 2006, $109.8 million for the period from July 22, 2006 through March 31, 2007 and $61.5 million in fiscal 2006. On a pro forma basis, fiscal 2007 interest expense, net was $151.9 million, which includes a $21.1 million adjustment to increase our full year interest expense assuming the Merger and the related indebtedness occurred on April 1, 2006. Compared to fiscal 2006, pro forma fiscal 2007 interest expense, net increased $90.4 million year-over-year due to the increased interest costs on our higher debt levels in fiscal 2007 resulting from the Merger, the acquisition of Zurn on February 7, 2007,lenders, as well as the PIK toggle senior indebtedness issued on March 2, 2007.non-cash write-off of deferred financing fees and net original issue discount associated with the extinguished debt. Additionally, we capitalized
49
approximately $14.6 million of third party transaction costs, which are being amortized over the life of the 8.50% Notes as interest expense using the effective interest method. Below is a summary of the transaction costs and other offering expenses recorded along with their corresponding pre-tax financial statement impact (in millions):
| Financial Statement Impact | ||||||||||||||||
| Balance Sheet -Debit (Credit) | Statement of Operations | |||||||||||||||
| Deferred Financing Costs (1) | Original Issue Discount (2) | Expense (3) | Total | |||||||||||||
Cash transaction costs: | ||||||||||||||||
Third party transaction costs | $ | 14.6 | $ | — | $ | — | $ | 14.6 | ||||||||
Bond tender premiums (paid to lenders) | — | — | 63.5 | 63.5 | ||||||||||||
Total expected cash transaction costs | 14.6 | — | 63.5 | $ | 78.1 | |||||||||||
Non-cash write-off of unamortized amounts: | ||||||||||||||||
Deferred financing costs | (25.4 | ) | — | 25.4 | ||||||||||||
Net original issue discount | — | (11.9 | ) | 11.9 | ||||||||||||
Net financial statement impact | $ | (10.8 | ) | $ | (11.9 | ) | $ | 100.8 | ||||||||
| (1) | Recorded as a component of other assets within the consolidated balance sheet. |
| (2) | Recorded as a reduction in the face value of long-term debt within the consolidated balance sheet. |
| (3) | Recorded as a component of other non-operating expense within the consolidated statement of operations. |
Other Income (Expense), net.Net. Other income (expense), net was ($0.4) million for the period from April 1, 2006 through July 21, 2006 and $5.7 million for the period from July 22, 2006 through March 31, 2007. Pro forma fiscal 2007 other income, net was $5.3 million and is the result of adding the above Predecessor and Successor time periods with no pro forma adjustments required as a result of an assumed Merger date of April 1,
2006. This $5.3 million in pro forma fiscal 2007 includes $1.4 million of foreign currency transaction losses, $2.0 million of management fee expenses, and $0.1 million of other expenses, offset by an $8.8 million CDSOA recovery. Other expense, net for fiscal 2006the year ended March 31, 2010 was $3.8$16.4 million, and consistswhich consisted of management feesfee expense of $2.0$3.0 million, attorney fees related to the refinancingtransaction costs associated with a debt exchange offer of our credit agreement of $1.0$6.0 million, losses on the sale of property, plant and equipment of $0.4 million and foreign currency transaction losses of $0.4$4.3 million and other net miscellaneous expenses of $3.1 million. Other income, net for the year ended March 31, 2011 was $1.1 million, which consisted of management fee expense of $3.0 million, income in unconsolidated affiliates of $4.1 million (including a $3.4 million gain recorded as a result of our step acquisition of 100% of the voting shares in Mecánica Falk on August 31, 2010), foreign currency transaction gains of $1.5 million and other net miscellaneous expenses of $1.5 million.
Provision (Benefit) for Income Taxes. During the periods from April 1, 2006 through July 21, 2006 and from July 22, 2006 through March 31, 2007 theThe income tax provision (benefit)in fiscal 2010 was $(16.1) million and $9.2 million, respectively. On a pro forma basis, our fiscal 2007 income tax provision was $4.8$30.5 million or an effective tax rate of (60.8%)25.7%. This amount includes a pro forma increaseThe provision recorded differs from the statutory rate mainly due to our provisionthe effect of $11.7 million representing the tax effect on $38.8 million of net pre-tax pro forma income adjustments impacting depreciation, amortization, transaction costs and interest expense assuming the Merger occurred on April 1, 2006. The $4.8 million income tax provision recorded with respectbenefit recognized as a result of a decrease to the pro formaliability for unrecognized tax benefits associated with the conclusion of the Internal Revenue Service (“IRS”) examination and certain benefits provided under a new Brazilian tax settlement program. The income tax benefit in fiscal 2007 pre-tax loss of $7.9 million is primarily the result of an increase to the valuation allowance relating to foreign tax credits generated for which the realization of such receipts is not deemed more likely than not. The fiscal 2006 provision2011 was $16.3$(10.1) million or an effective income tax rate of 41.6%16.4%. This rate is higher than our USThe benefit recorded differs from the U.S. federal statutory rate mainly due to increased foreign-relatedthe effect of the increase in the valuation allowance related to foreign tax expense, offset in part by thecredit carryforwards for which such realization of certain state and local income tax benefits.is not deemed to be more-likely-than-not. See noteNote 16 to our audited consolidated financial statements included elsewhere in this prospectus for information on income taxes.
Net Income (Loss).The net income recorded in fiscal 2010 was $88.1 million compared to a net loss of $51.3 million in fiscal 2011 due to the factors described above.
Fiscal Year Ended March 31, 2010 Compared with the Fiscal Year Ended March 31, 2009
Net Sales
(dollars in Millions)
| Fiscal Year Ended | ||||||||||||||||
| March 31, 2009 | March 31, 2010 | Change | % Change | |||||||||||||
Process & Motion Control | $ | 1,321.7 | $ | 1,003.7 | $ | (318.0 | ) | (24.1 | )% | |||||||
Water Management | 560.3 | 506.3 | (54.0 | ) | (9.6 | )% | ||||||||||
Consolidated | $ | 1,882.0 | $ | 1,510.0 | $ | (372.0 | ) | (19.8 | )% | |||||||
50
Process & Motion Control
Process & Motion Control net sales decreased $318.0 million, or 24.1%, from $1,321.7 million for the year ended March 31, 2009 to $1,003.7 million for the year ended March 31, 2010. Excluding foreign currency fluctuations, year-over-year core net sales decreased by $316.4 million, or 23.9%, which is attributable to the impact the economic downturn has had on our end-markets.
Water Management
Water Management net sales decreased $54.0 million, or 9.6%, from $560.3 million for the year ended March 31, 2009 to $506.3 million for the year ended March 31, 2010. Excluding foreign currency fluctuations, year-over-year core net sales decreased by $52.3 million, or 9.3%, which is attributable to softness within our commercial and residential construction end-markets as well as certain segments of our infrastructure end-markets. These declines were partially offset by an increase in year-over-year net sales in our water and wastewater treatment markets.
Income (loss) from Operations
(in Millions)
| Fiscal Year Ended | ||||||||||||
| March 31, 2009 | March 31, 2010 | Change | ||||||||||
Process & Motion Control | $ | 15.6 | $ | 116.5 | $ | 100.9 | ||||||
% of net sales | 1.2 | % | 11.6 | % | 10.4 | % | ||||||
Water Management | (212.8 | ) | 76.1 | 288.9 | ||||||||
% of net sales | (38.0 | )% | 15.0 | % | 53.0 | % | ||||||
Corporate | (174.1 | ) | (31.2 | ) | 142.9 | |||||||
Consolidated | $ | (371.3 | ) | $ | 161.4 | $ | 532.7 | |||||
% of net sales | (19.7 | )% | 10.7 | % | 30.4 | % | ||||||
Process & Motion Control
Process & Motion Control income from operations for the year ended March 31, 2009 was $15.6 million compared to income from operations of $116.5 million during the year ended March 31, 2010. The comparability of our year-over-year results has been significantly impacted by the $149.0 million impairment charge taken on our goodwill and other identifiable intangible assets during the year ended March 31, 2009. In addition, income from operations for the year ended March 31, 2009 included $16.5 million of restructuring expenses, compared to restructuring expense of $6.3 million during the year ended March 31, 2010. Excluding the impact of the impairment charge and restructuring expenses, income from operations would have decreased $58.3 million, or 32.2%, and income from operations as a percent of net sales would have declined by 150 basis points to 12.2% of net sales during the year ended March 31, 2010 versus the comparable prior year period. The remaining decline in income from operations as a percent of net sales was primarily driven by the unfavorable impact of lower year-over-year net sales, partially offset by productivity gains, cost reduction initiatives and lower material prices.
Water Management
Water Management loss from operations was $212.8 million for the year ended March 31, 2009 compared to $76.1 million of income from operations for the year ended March 31, 2010. The comparability of our year-over-year results has been significantly impacted by the $273.0 million impairment charge taken on our goodwill and other identifiable intangible assets during the year ended March 31, 2009. In addition, income from operations for the year ended March 31, 2009 included $7.8 million of restructuring expenses, compared to restructuring expense of $0.5 million during the year ended March 31, 2010. Excluding the impact of impairment
51
charges and restructuring expenses, income from operations would have increased $8.6 million, or 12.6%, and income from operations as a percent of net sales would have expanded by 300 basis points to 15.1% of sales for the year ended March 31, 2010 versus the comparable prior year period as cost reduction actions, lower material prices and productivity gains more than offset the unfavorable impact of lower sales.
Corporate
Corporate expenses decreased by $142.9 million from $174.1 million during the year ended March 31, 2009 to $31.2 million during the year ended March 31, 2010. The comparability of corporate expenses is primarily attributable to a net reduction in actuarial losses related to our pension and other postretirement benefit plans recognized year-over-year.
Interest Expense, Net.Interest expense, net was $230.4 million and $194.2 million in fiscal 2009 and fiscal 2010, respectively. The decrease in interest expense is due to the lower year-over-year weighted-average outstanding indebtedness (resulting from the completion of our debt exchange offer during the first quarter of fiscal 2010 and various purchases and extinguishments of our PIK toggle senior indebtedness, beginning in the third quarter of fiscal 2009) as well as the lower relative variable rate borrowing costs year-over-year.
Gain on Debt Extinguishment. During fiscal 2009, the Company recorded a $103.7 million gain on debt extinguishment as a result of the purchase and extinguishment of a portion of our PIK toggle senior indebtedness. During fiscal 2010, the Company recorded a $167.8 million gain on debt extinguishment as a result of the purchase and extinguishment of a portion of our PIK toggle senior indebtedness and our April 2009 debt exchange offer.
During fiscal 2009, we purchased and extinguished $174.6 million of outstanding face value PIK toggle senior indebtedness due 2013 for $72.9 million in cash. As a result, we recognized a $103.7 million gain during the year ended March 31, 2009, which was measured based on the difference between the cash paid and the net carrying amount of the debt (the net carrying amount of the debt included unamortized original issue discounts of $2.0 million, unamortized debt issuance costs of $1.8 million and $5.8 million of accrued interest).
For more information regarding the gain on debt extinguishment for fiscal 2010, see “—Results of Operations—Fiscal Year Ended March 31, 2011 Compared with the Fiscal Year Ended March 31, 2010—Gain (Loss) on Debt Extinguishment.”
Other Expense, Net.Other expense, net for the year ended March 31, 2009 was $3.0 million, which consisted of management fee expense of $3.0 million, foreign currency transaction gains of $2.4 million and other net miscellaneous expenses of $2.4 million. Other expense, net for the year ended March 31, 2010 was $16.4 million, which consisted of management fee expense of $3.0 million, transaction costs associated with the debt exchange offer of $6.0 million, foreign currency transaction losses of $4.3 million and other net miscellaneous expenses of $3.1 million.
Provision (Benefit) for Income Taxes.The income tax benefit in fiscal 2009 was $(72.0) million or an effective tax rate of 14.4%. The benefit recorded differs from the statutory rate mainly due to the effect of approximately $304.8 million of nondeductible expenses relating to the impairment charges recorded in fiscal 2009 as a result of then-existing economic conditions. The income tax provision in fiscal 2010 was $30.5 million or an effective tax rate of 25.7%. The provision recorded differs from the U.S. federal statutory rate mainly due to the effect of the income tax benefit recognized as a result of a decrease to the liability for unrecognized tax benefits associated with the conclusion of the IRS examination and certain benefits provided under a new Brazilian tax settlement program. See Note 16 to our audited consolidated financial statements included elsewhere in this prospectus for more information on income taxes.
Net Income (Loss).The net loss recorded in pro forma fiscal 20072009 was $12.7$429.0 million as compared to $22.9 million of net income of $88.1 million in fiscal 20062010 due to the factors described above. The $12.7
52
Non-GAAP Financial Measure
In addition to net (loss) income, we believe Adjusted EBITDA (as described below in “Covenant Compliance”) is an important measure under our senior secured credit facilities, as our ability to incur certain types of acquisition debt or subordinated debt, make certain types of acquisitions or asset exchanges, operate our business and make dividends or other distributions, all of which will impact our financial performance, is impacted by our Adjusted EBITDA, as our lenders measure our performance by comparing the ratio of our net senior secured bank debt to our Adjusted EBITDA (see “Covenant Compliance” for additional discussion of this ratio). We reported Adjusted EBITDA of $335.7 million net loss in pro forma fiscal 2007 was comprised of2011 and a $39.6 million net loss for the same period from April 1, 2006 through July 21, 2006,of $51.3 million.
Covenant Compliance
The credit agreement and indentures that govern our notes contain, among other provisions, restrictive covenants regarding indebtedness, payments and distributions, mergers and acquisitions, asset sales, affiliate transactions, capital expenditures and the maintenance of certain financial ratios. Payment of borrowings under the senior secured credit facilities and indentures that govern our notes may be accelerated if there is an event of default. Events of default include the failure to pay principal and interest when due, a $0.2 millionmaterial breach of a representation or warranty, covenant defaults, events of bankruptcy and a change of control. Certain covenants contained in the credit agreement that governs our senior secured credit facilities restrict our ability to take certain actions, such as incurring additional debt or making acquisitions, if we are unable to meet certain maximum net losssenior secured bank debt to Adjusted EBITDA ratios and, with respect to our revolving facility, also require us to remain at or below a certain maximum net senior secured bank debt to Adjusted EBITDA ratio as of the end of each fiscal quarter. Certain covenants contained in the indentures that govern our notes restrict our ability to take certain actions, such as incurring additional debt or making acquisitions, if we are unable to achieve a minimum Adjusted EBITDA to Fixed Charges ratio. Under such indentures, our ability to incur additional indebtedness and our ability to make future acquisitions under certain circumstances requires us to have an Adjusted EBITDA to Fixed Charges ratio (measured on a last twelve months, or LTM, basis) of at least 2.0 to 1.0. Failure to comply with these covenants could limit our long-term growth prospects by hindering our ability to obtain future debt or make acquisitions.
“Fixed Charges” is defined in our indentures as net interest expense, excluding the amortization or write-off of deferred financing costs.
“Adjusted EBITDA” is defined in our credit facilities as net income, adjusted for the perioditems summarized in the table below. Adjusted EBITDA is intended to show our unleveraged, pre-tax operating results and therefore reflects our financial performance based on operational factors, excluding non-operational, non-cash or non-recurring losses or gains. Adjusted EBITDA is not a presentation made in accordance with GAAP, and our use of the term Adjusted EBITDA varies from July 22, 2006 through March 31, 2007others in our industry. This measure should not be considered as well as $27.1 million of pro formaan alternative to net income, adjustmentsincome from operations or any other performance measures derived in accordance with GAAP. Adjusted EBITDA has important limitations as an analytical tool, and you should not consider it in isolation, or as a substitute for analysis of our results as reported under GAAP. For example, Adjusted EBITDA does not reflect: (a) our capital expenditures, future requirements for capital expenditures or contractual commitments; (b) changes in, or cash requirements for, our working capital needs; (c) the significant interest expenses, or the cash requirements necessary to recordservice interest or principal payments, on our debt; (d) tax payments that represent a reduction in cash available to us; (e) any cash requirements for the assets being depreciated and amortized that may have to be replaced in the future; (f) management fees that may be paid to Apollo or its affiliates; or (g) the impact of earnings or charges resulting from matters that we and the Merger assuming it was completedlenders under our secured senior credit facilities may not consider indicative of our ongoing operations. In particular, our definition of Adjusted EBITDA allows us to add back certain non-cash, non-operating or non-recurring charges that are deducted in calculating net income, even though these are expenses that may recur, vary greatly and are difficult to predict and can represent the effect of long-term strategies as opposed to short-term results. In
53
addition, certain of these expenses can represent the reduction of cash that could be used for other corporate purposes. Further, although not included in the calculation of Adjusted EBITDA below, the measure may at times allow us to add estimated cost savings and operating synergies related to operational changes ranging from acquisitions to dispositions to restructurings and/or exclude one-time transition expenditures that we anticipate we will need to incur to realize cost savings before such savings have occurred.
As of the date of this prospectus, the calculation of Adjusted EBITDA under the credit agreement and indentures that govern our notes result in substantially identical amounts. However, the results of such calculations could differ in the future based on April 1, 2006.the different types of adjustments that may be included in such respective calculations at the time.
| (in millions) | Fiscal year ended March 31, 2011 | |||
Net loss | $ | (51.3 | ) | |
Interest expense, net | 180.8 | |||
Income tax benefit | (10.1 | ) | ||
Depreciation and amortization | 106.1 | |||
EBITDA | $ | 225.5 | ||
Adjustments to EBITDA: | ||||
Loss on extinguishment of debt (1) | 100.8 | |||
Stock option expense | 5.6 | |||
LIFO expense (2) | 4.9 | |||
Other income, net (3) | (1.1 | ) | ||
Subtotal of adjustments to EBITDA | $ | 110.2 | ||
Adjusted EBITDA | $ | 335.7 | ||
Fixed Charges of RBS Global, Inc. and subsidiaries (4) | $ | 166.0 | ||
Ratio of Adjusted EBITDA to Fixed Charges—RBS Global, Inc. and subsidiaries | 2.02 | x | ||
Net senior secured bank indebtedness (5) | $ | 388.1 | ||
Net senior secured bank leverage ratio (6) | 1.16 | x | ||
| (1) | The loss on extinguishment of debt is the result of the cash tender offer for notes that we completed during the first quarter of fiscal 2011. See Note 10 to our audited consolidated financial statements included elsewhere in this prospectus. |
| (2) | Last-in first-out (LIFO) inventory adjustments are excluded in calculating Adjusted EBITDA as defined in our senior secured credit facilities. |
| (3) | Other income, net for the fiscal year ended March 31, 2011, consists of management fee expense of $3.0 million, income in unconsolidated affiliates of $4.1 million (including a $3.4 million gain recorded as a result of our step acquisition of 100% of the voting shares in Mecánica Falk on August 31, 2010), foreign currency transaction gains of $1.5 million and other net miscellaneous expenses of $1.5 million. |
| (4) | The indentures governing our senior notes define fixed charges as interest expense excluding the amortization or write-off of deferred financing costs for the trailing four quarters. |
| (5) | Our senior secured credit facilities define net senior secured bank indebtedness as consolidated secured indebtedness for borrowed money, less unrestricted cash, which was $373.4 million (as defined by the senior secured credit facilities) at March 31, 2011. Net senior secured bank indebtedness reflected in the table consists of borrowings under our senior secured credit facilities. |
| (6) | The senior secured credit facilities define the net senior secured bank leverage ratio as the ratio of net senior secured bank debt to Adjusted EBITDA for the trailing four fiscal quarters. |
54
Liquidity and Capital Resources
Our primary source of liquidity is available cash and cash equivalents, cash flow from operations and borrowing availability under our $150$150.0 million revolving credit facility and our $100.0 million accounts receivable securitization program.
As of June 28, 2008,March 31, 2010, we had $165.5$263.9 million of cash and approximately $220.8$207.4 million of additional borrowing capacity ($118.6 million of available borrowings under our revolving credit facility and $88.8 million available under our accounts receivable securitization program). As of March 31, 2011, we had $391.0 million of cash and approximately $219.6 million of additional borrowings available to us (there were no($121.7 million of available borrowings outstanding under theour revolving credit facility or theand $97.9 million available under our accounts receivable securitization program; however, $29.2 million of the revolving credit facility was utilized in connection with outstanding letters of credit)program). Both our revolving credit facility and the accounts receivable securitization program are available to fund our working capital requirements, capital expenditures and other general corporate purposes. As of March 31, 2011, the available borrowings under our credit facility had been reduced by $28.3 million due to outstanding letters of credit. While we believe we have sufficient capital resources for our foreseeable needs, we regularly reassess those needs and resources to determine whether we require or would benefit from additional or different resources. However, we cannot assure that additional or different resources would be available on terms that we find acceptable or at all.
Indebtedness
As of June 28, 2008March 31, 2011 we had $2,550.1$2,314.1 million of total indebtedness outstanding as follows (in millions):
| Total Debt at June 28, 2008 | Short-term Debt and Current Maturities of Long-Term Debt | Long-term Portion | Total Debt at March 31, 2011 | Short-term Debt and Current Maturities of Long-Term Debt | Long-term Portion | ||||||||||||||||
8.50% senior notes due 2018 | $ | 1,145.0 | $ | — | $ | 1,145.0 | |||||||||||||||
Term loans | $ | 767.5 | $ | 2.0 | $ | 765.5 | 761.5 | 2.0 | 759.5 | ||||||||||||
11.75% senior subordinated notes due 2016 | 300.0 | — | 300.0 | ||||||||||||||||||
PIK toggle senior indebtedness due 2013 (1) | 526.0 | — | 526.0 | 93.2 | 93.2 | — | |||||||||||||||
9.50% senior notes due 2014 (2) | 803.0 | — | 803.0 | ||||||||||||||||||
8.875% senior notes due 2016 | 150.0 | — | 150.0 | 2.0 | — | 2.0 | |||||||||||||||
11.75% senior subordinated notes due 2016 | 300.0 | — | 300.0 | ||||||||||||||||||
10.125% senior subordinated notes due 2012 | 0.3 | — | 0.3 | ||||||||||||||||||
Other | 3.3 | 0.9 | 2.4 | 12.4 | 9.0 | 3.4 | |||||||||||||||
Total Debt | $ | 2,550.1 | $ | 2.9 | $ | 2,547.2 | $ | 2,314.1 | $ | 104.2 | $ | 2,209.9 | |||||||||
| (1) | Includes an unamortized |
OurAt March 31, 2011, our outstanding debt was issued or guaranteed by Rexnord Holdings,Corporation, RBS Global and various subsidiaries of RBS Global. Rexnord HoldingsCorporation is the issuer of the PIK toggle senior indebtedness and RBS Global, as well as its wholly-owned subsidiary Rexnord LLC, are the co-issuers of the term loans, senior notes and senior subordinated notes.
Rexnord Holdings Indebtedness
On March 2, 2007, Rexnord Holdings entered intoFor a credit agreement with various lenders which provided $449.8 milliondescription of our outstanding indebtedness, see “Description of Indebtedness” elsewhere in cash ($459.0 million of debt financing, net of a $9.2 million original issue discount) that was primarily used to pay a special dividend to its shareholders as well as to holders of fully vested rollover options. The PIK toggle senior indebtedness borrowed pursuant to the credit agreement is due March 1, 2013 and bears interest at a floating rate. The floating rate is equal to adjusted LIBOR (the interest rate per annum equal to the product of (a) the LIBOR in effect and (b) Statutory Reserves) plus 7.0%. As of March 31, 2008 and June 28, 2008 the interest rate was 10.06% and 9.68%, respectively. Pursuant to the terms of the credit agreement, we have elected to pay interest in-kind and have accordingly added accrued interest to the principal amount of the debt on pre-determined quarterly interest rate reset dates. During fiscal 2008, $60.8 million of interest was added to the principal amount of the outstanding debt. During the first quarter of fiscal 2009, $13.4 million of interest was added to the principal amount of the outstanding debt. We intend to repay this indebtedness in full with a portion of the proceeds of this offering.prospectus.
RBS Global and Subsidiaries Long-term Debt
In connection with the Merger on July 21, 2006, all borrowings under the Predecessor’s previous credit agreement and substantially all of the $225.0 million of its 10.125% senior subordinated notes were repaid or repurchased on July 21, 2006. The Merger was financed in part with (i) $485.0 million of 9.50% senior notes due 2014, (ii) $300.0 million of 11.75% senior subordinated notes due 2016, and (iii) $645.7 million of borrowings under new senior secured credit facilities (consisting of a seven-year $610.0 million term loan facility, which matures in July 2013, and $35.7 million of borrowings under a six-year $150.0 million revolving credit facility, which expires in July 2012).
On February 7, 2007, we completed our acquisition of the Zurn water management business. This acquisition was funded partially with debt financing of $669.3 million, consisting of (i) $319.3 million of 9.50% senior notes due 2014 (which includes a bond issue premium of $9.3 million), (ii) $150.0 million of 8.875% senior notes due 2016 and (iii) $200.0 million of incremental borrowings under our existing term loan credit facilities.
As of June 28, 2008, the outstanding borrowings under the term loan credit facility were apportioned between two primary tranches: a $570.0 million term loan B1 facility and a $197.5 million term loan B2 facility. Borrowings under the $570.0 million term loan B1 facility accrue interest, at RBS Global’s option, at the following rates per annum: (i) 2.50% plus the LIBOR Rate per annum, or (ii) 1.50% plus the Base Rate (which is defined as the higher of the Federal funds rate plus 0.5% or the Prime rate). Borrowings under the $197.5 million term loan B2 facility accrue interest, at RBS Global’s option, at the following rates per annum: (i) 2.00% plus the LIBOR Rate per annum, or (ii) 1.00% plus the Base Rate (which is defined as the higher of the Federal funds rate plus 0.5% or the Prime rate). The outstanding principal balances of the term loan B1 and B2 credit facilities at March 31, 2008 were $570.0 million and $197.5 million, respectively. After considering the pre-payment of $20.0 million on the term loan B1 facility in the first quarter of fiscal 2008, all mandatory principal repayments have been fulfilled on the B1 facility through March 31, 2013. Principal pre-payments of $0.5 million on the B2 facility are scheduled to be made at the end of each calendar quarter beginning on June 30, 2008 and continuing through June 30, 2013. As of June 28, 2008, the remaining mandatory pre-payments to maturity on both the term loan B1 and B2 facilities are $1.2 million and $10.5 million, respectively.
All of the senior notes and senior subordinated notes listed under “Liquidity and Capital Resources” are unsecured obligations. The senior subordinated notes are subordinated in right of payment to all existing and
future senior indebtedness. RBS Global’s senior secured credit facilities limit its maximum senior secured bank leverage ratio to 4.25 to 1.00. As of March 31, 2008 and June 28, 2008, the senior secured bank leverage ratio was 1.67 to 1.00 and 1.61 to 1.00, respectively. Management expects to be in compliance with this financial covenant for the foreseeable future. RBS Global’s senior credit facility also significantly restricts the payment of dividends. As a result, RBS Global has not paid any dividends on its common stock or membership interests. It is currently RBS Global’s policy to retain earnings to repay debt and finance its operations.
Revolving Credit Facility
Borrowings under RBS Global’s $150.0 million revolving credit facility accrue interest, at RBS Global’s option, at the following rates per annum: (i) 2.25% plus the LIBOR Rate, or (ii) 1.25% plus the Base Rate (which is defined as the higher of the Federal funds rate plus 0.5% or the Prime rate). There were no outstanding borrowings on the revolver as of June 28, 2008. However, $29.2 million of the revolving credit facility was considered utilized in connection with outstanding letters of credit at June 28, 2008.
Account Receivable Securitization Program
On September 26, 2007, three wholly-owned domestic subsidiaries entered into an accounts receivable securitization program (the “AR Securitization Program” or the “Program”) whereby they continuously sell substantially all of their domestic trade accounts receivables to a wholly-owned bankruptcy remote special purpose subsidiary (the “SPV”) for cash and subordinated notes. The Receivables Sales and Servicing Agreement entered into between Rexnord Industries, LLC and the SPV provides for the purchase and servicing of such receivables. The SPV in turn may obtain revolving loans and letters of credit from General Electric Capital Corporation (“GECC”) pursuant to a five year revolving loan agreement. The maximum borrowing amount under the Receivables Financing and Administration Agreement is $100 million, subject to certain borrowing base limitations related to the amount and type of receivables owned by the SPV. All of the receivables purchased by the SPV are pledged as collateral for revolving loans and letters of credit obtained from GECC under the Receivables Financing and Administration Agreement.
The AR Securitization Program does not qualify for sale accounting under SFAS No. 140,Accounting for Transfers and Servicing of Financial Assets and Extinguishments of Liabilities, and as such, any borrowings are accounted for as secured borrowings on our consolidated balance sheet. Financing costs associated with the Program will be recorded within “Interest expense, net” in our consolidated statement of operations if revolving loans or letters of credit have been obtained under the Receivables Financing and Administration Agreement.
Borrowings under the Receivables Financing and Administration Agreement bear interest at a rate equal to LIBOR plus an applicable margin, which at June 28, 2008 was 1.35%. In addition, a non-use fee of 0.30% is applied to the unutilized portion of the $100.0 million commitment. These rates are per annum and the fees are paid to GECC on a daily basis. At June 28, 2008, RBS Global had no outstanding borrowings under the Program. Additionally, the Program requires compliance with certain covenants and performance ratios contained in the Receivables Financing and Administration Agreement. As of June 28, 2008, RBS Global was in compliance with all applicable covenants and performance ratios.
Other Debt
At June 28, 2008, various wholly owned subsidiaries had additional borrowings of $3.3 million comprised primarily of borrowings at various foreign subsidiaries.
At June 28, 2008, the weighted average interest rate on our outstanding term loans and the PIK toggle senior indebtedness due 2013 of Rexnord Holdings was 7.41%.
Off-Balance Sheet Arrangements
We do not have any off-balance sheet or unconsolidated special-purpose entities.
Cash FlowsCovenant Compliance
The following cash flows discussioncredit agreement and indentures that govern our notes contain, among other provisions, restrictive covenants regarding indebtedness, payments and distributions, mergers and acquisitions, asset sales, affiliate transactions, capital expenditures and the maintenance of certain financial ratios. Payment of borrowings under the senior secured credit facilities and indentures that govern our notes may be accelerated if there is based upon pro forma information for fiscal 2007 that combinesan event of default. Events of default include the amounts reportedfailure to pay principal and interest when due, a material breach of a representation or warranty, covenant defaults, events of bankruptcy and a change of control. Certain covenants contained in the statementcredit agreement that governs our senior secured credit facilities restrict our ability to take certain actions, such as incurring additional debt or making acquisitions, if we are unable to meet certain maximum net senior secured bank debt to Adjusted EBITDA ratios and, with respect to our revolving facility, also require us to remain at or below a certain maximum net senior secured bank debt to Adjusted EBITDA ratio as of the end of each fiscal quarter. Certain covenants contained in the indentures that govern our notes restrict our ability to take certain actions, such as incurring additional debt or making acquisitions, if we are unable to achieve a minimum Adjusted EBITDA to Fixed Charges ratio. Under such indentures, our ability to incur additional indebtedness and our ability to make future acquisitions under certain circumstances requires us to have an Adjusted EBITDA to Fixed Charges ratio (measured on a last twelve months, or LTM, basis) of at least 2.0 to 1.0. Failure to comply with these covenants could limit our long-term growth prospects by hindering our ability to obtain future debt or make acquisitions.
“Fixed Charges” is defined in our indentures as net interest expense, excluding the amortization or write-off of deferred financing costs.
“Adjusted EBITDA” is defined in our credit facilities as net income, adjusted for the items summarized in the table below. Adjusted EBITDA is intended to show our unleveraged, pre-tax operating results and therefore reflects our financial performance based on operational factors, excluding non-operational, non-cash or non-recurring losses or gains. Adjusted EBITDA is not a presentation made in accordance with GAAP, and our use of the term Adjusted EBITDA varies from others in our industry. This measure should not be considered as an alternative to net income, income from operations or any other performance measures derived in accordance with GAAP. Adjusted EBITDA has important limitations as an analytical tool, and you should not consider it in isolation, or as a substitute for analysis of our results as reported under GAAP. For example, Adjusted EBITDA does not reflect: (a) our capital expenditures, future requirements for capital expenditures or contractual commitments; (b) changes in, or cash requirements for, our working capital needs; (c) the significant interest expenses, or the cash requirements necessary to service interest or principal payments, on our debt; (d) tax payments that represent a reduction in cash available to us; (e) any cash requirements for the assets being depreciated and amortized that may have to be replaced in the future; (f) management fees that may be paid to Apollo or its affiliates; or (g) the impact of earnings or charges resulting from matters that we and the lenders under our secured senior credit facilities may not consider indicative of our ongoing operations. In particular, our definition of Adjusted EBITDA allows us to add back certain non-cash, non-operating or non-recurring charges that are deducted in calculating net income, even though these are expenses that may recur, vary greatly and are difficult to predict and can represent the effect of long-term strategies as opposed to short-term results. In
53
addition, certain of these expenses can represent the reduction of cash flowsthat could be used for other corporate purposes. Further, although not included in the Predecessor periodcalculation of Adjusted EBITDA below, the measure may at times allow us to add estimated cost savings and operating synergies related to operational changes ranging from April 1, 2006 through July 21, 2006 and the Successor period from July 22, 2006 through March 31, 2007 as adjustedacquisitions to reflect the pro forma effectdispositions to restructurings and/or exclude one-time transition expenditures that we anticipate we will need to incur to realize cost savings before such savings have occurred.
As of the Merger as if it had occurred on April 1, 2006. Our cash flow discussion is presenteddate of this prospectus, the calculation of Adjusted EBITDA under the credit agreement and indentures that govern our notes result in this manner because we believe it enables a meaningful comparisonsubstantially identical amounts. However, the results of cash flows between fiscal years.
Net cash provided by operating activitiessuch calculations could differ in the first quarterfuture based on the different types of fiscal 2009 was $19.0 million compared to $33.1 millionadjustments that may be included in such respective calculations at the time.
| (in millions) | Fiscal year ended March 31, 2011 | |||
Net loss | $ | (51.3 | ) | |
Interest expense, net | 180.8 | |||
Income tax benefit | (10.1 | ) | ||
Depreciation and amortization | 106.1 | |||
EBITDA | $ | 225.5 | ||
Adjustments to EBITDA: | ||||
Loss on extinguishment of debt (1) | 100.8 | |||
Stock option expense | 5.6 | |||
LIFO expense (2) | 4.9 | |||
Other income, net (3) | (1.1 | ) | ||
Subtotal of adjustments to EBITDA | $ | 110.2 | ||
Adjusted EBITDA | $ | 335.7 | ||
Fixed Charges of RBS Global, Inc. and subsidiaries (4) | $ | 166.0 | ||
Ratio of Adjusted EBITDA to Fixed Charges—RBS Global, Inc. and subsidiaries | 2.02 | x | ||
Net senior secured bank indebtedness (5) | $ | 388.1 | ||
Net senior secured bank leverage ratio (6) | 1.16 | x | ||
| (1) | The loss on extinguishment of debt is the result of the cash tender offer for notes that we completed during the first quarter of fiscal 2011. See Note 10 to our audited consolidated financial statements included elsewhere in this prospectus. |
| (2) | Last-in first-out (LIFO) inventory adjustments are excluded in calculating Adjusted EBITDA as defined in our senior secured credit facilities. |
| (3) | Other income, net for the fiscal year ended March 31, 2011, consists of management fee expense of $3.0 million, income in unconsolidated affiliates of $4.1 million (including a $3.4 million gain recorded as a result of our step acquisition of 100% of the voting shares in Mecánica Falk on August 31, 2010), foreign currency transaction gains of $1.5 million and other net miscellaneous expenses of $1.5 million. |
| (4) | The indentures governing our senior notes define fixed charges as interest expense excluding the amortization or write-off of deferred financing costs for the trailing four quarters. |
| (5) | Our senior secured credit facilities define net senior secured bank indebtedness as consolidated secured indebtedness for borrowed money, less unrestricted cash, which was $373.4 million (as defined by the senior secured credit facilities) at March 31, 2011. Net senior secured bank indebtedness reflected in the table consists of borrowings under our senior secured credit facilities. |
| (6) | The senior secured credit facilities define the net senior secured bank leverage ratio as the ratio of net senior secured bank debt to Adjusted EBITDA for the trailing four fiscal quarters. |
54
Liquidity and Capital Resources
Our primary source of fiscal 2008, which included $10.0 million of insurance proceeds related to the Canal Street facility accident. Excluding these insurance proceeds, the remaining change inliquidity is available cash and cash equivalents, cash flow from operations was primarily due to a $7.6 million increase in net income, offset by a $15.0 million increase in trade working capital (accounts receivable, inventories and accounts payable) in the first quarter of fiscal 2009 compared to the prior year. The trade working capital use of cash was primarily driven by an increase in accounts receivable due to the timing of shipments in the first quarter of fiscal 2009 compared to the prior year.
Net cash provided by (used for) operating activities was $(4.4) million for the period from April 1, 2006 through July 21, 2006 and $63.4 million for the period from July 22, 2006 through March 31, 2007. On a pro forma basis, fiscal 2007 cash provided by operations was $57.9 million which includes pro forma adjustments to eliminate seller-related transaction costs of $19.1 million offset by additional interest expense of $20.2 million ($21.1 million of additional pro forma interest expense less $0.9 million of non-cash deferred financing cost amortization). Net cash provided by our operating activities in fiscal 2008 was $232.7 million compared to $57.9 million in pro forma fiscal 2007 and $91.9 million in fiscal 2006. The majority of the $174.8 million increase in fiscal 2008 is due to the incremental cash flows generated as a result of the inclusion of Zurn for a full twelve months in fiscal 2008 (compared to 1.7 months in fiscal 2007) complemented by strong earnings growth from our Power Transmission platform and improved trade working capital management (receivables, inventories and trade payables). Our continued focus on inventory reductions, in particular, generated an additional $39.5 million of cash year over year. Other noteworthy items contributing to the overall increase in cash flow from operations year over year include a $12.2 million increase in customer advances and the collection of $19.9 million of tax refunds and accrued interest from the IRS arising from a settlement of an audit of the former JBI for the fiscal years ended September 30, 1998 through 2002, which was partially offset by a $7.4 million reduction in year over year CDSOA recoveries. The $34.0 million reduction in cash flows from operations in pro forma fiscal 2007 compared to fiscal 2006 was driven primarily by an increase in interest paid on a pro forma basis of $70.2 million, which is partially offset by CDSOA receipts of $8.8 million and higher income from operations before interest, tax, amortization of intangible assets, transaction related costs and restructuring and similar charges.
Cash used for investing activities was $10.1 million in the first quarter of fiscal 2009 compared to $8.3 million in the first quarter of fiscal 2008. The increase in capital expenditures is primarily related to the construction of a new gear service and sales center in New Orleans, Louisiana. During the quarter ended June 28, 2008, the Company also received cash surrender proceeds of $0.9 million related to the termination of life insurance policies that were acquired with the acquisition of GA.
Net cash used for investing activities was $121.6 million in fiscal 2008, $15.7 million for the period from April 1, 2006 through July 21, 2006 and $1,925.5 million for the period from July 22, 2006 through March 31, 2007. Pro forma fiscal 2007 cash used for investing activities was $1,941.2 million. Fiscal 2008 cash used by investing activities decreased $1,819.6 million primarily as a result of reduced acquisition activity in fiscal 2008 of $1,830.7 million (the prior year acquisitions figure contained $1,018.4 related to the Merger, $880.1 million paid for the Zurn acquisition and the $5.9 million paid for the Dalong acquisition compared to the fiscal 2008 acquisition of GA for $73.7 million). Other items impacting the year over year variance include $6.6 million of proceeds from the sale of short-term investments (acquired through the acquisition of GA) offset by a $2.5 million reduction in proceeds from dispositions of property, plant and equipment and incremental capital expenditures of $15.2 million (which includes $11.2 million attributable to the rebuild of the Canal Street facility, as previously discussed).
Pro forma cash used for investing activities in fiscal 2007 increased $1,605.1 million compared to fiscal 2006. The year over year increase in cash used in investing activities was driven by a combination of the $1,018.4 million paid as a result of the Merger, the $880.1 million paid for the Zurn acquisition and the $5.9 million paid for the Dalong acquisition offset by the $301.3 million paid for the Falk Acquisition in fiscal 2006. Capital expenditures and proceeds from dispositions of property, plant and equipment, combined, were comparable between pro forma fiscal 2007 and 2006 and were $36.8 million and $34.8 million, respectively.
Cash used for financing activities was $0.1 million in the first quarter of fiscal 2009 compared to a use of $12.4 million in the first quarter of fiscal 2008. Cash used of $0.1 million in 2009 represents payments on borrowings at various foreign subsidiaries. Cash used for financing activities in the first quarter of fiscal 2008 consisted of payments of $19.8 million on term loans, $0.3 million on other debt and $0.3 million of financing fees. The first quarter of fiscal 2008 payments were partially offset by $8.2 million in net proceeds from the issuance of common stock and from the exercise of stock options.
Net cash provided by (used for) financing activities was $(15.6) million in fiscal 2008, $8.2 million for the period from April 1, 2006 through July 21, 2006 and $1,909.0 million for the period from July 22, 2006 through March 31, 2007. Pro forma fiscal 2007 cash used for financing activities was $1,917.2 million. Cash used for financing activities in fiscal 2008 decreased $1,932.8 million from pro forma fiscal 2007 primarily as a result of significantly reduced net borrowings and related financing fees associated with the Merger and the Zurn acquisition in pro forma fiscal 2007. Financing activities in fiscal 2008 consisted of $27.4 million of debt repayments and the payment of $0.6 million of financing fees. These cash outflows were partially offset by $12.5 million of proceeds received from the issuance of common stock. Cash provided by financing activities in pro forma fiscal 2007 included: $721.6 million from the issuance of common stock and the related issuance of $2,116.9 million of debt to facilitate both the Merger and the Zurn acquisition. Approximately $765.7 million of these proceeds were used to repay the outstanding debt as of the Merger Date. An additional $59.1 million of debt repayments were made subsequent to the Merger Date in fiscal 2007. During pro forma fiscal 2007, we also paid $83.2 million of financing fees and $23.1 million of bond tender premiums to complete the Merger, the acquisition of Zurn and the issuance of debt to fund the March 2, 2007 dividend. The $449.8 million in additional debt financing proceeds was primarily used to pay a $440 million distribution to the Company’s equity holders and to enter into certain other transactions related thereto.
Cash provided by financing activities in fiscal 2006 included $312.0 million of additional term loans issued in May 2005borrowing availability under our credit agreement. The proceeds from those term loans, net of $7.6$150.0 million of fees paid, were used to fund the Falk acquisition. Our strong performance allowed us to repay $65.0 million of debt during fiscal 2006, including $63.0 million of principal on the term loans. We also received $1.2 million of cash proceeds from the issuance of common stock in fiscal 2006.
Tabular Disclosure of Contractual Obligations
Payments of interest associated with our current revolving credit facility obligations have been omitted from the table below because they are predominantly based on varying market interest rates and varying debt balances. our $100.0 million accounts receivable securitization program.
As of March 31, 2008, there were no outstanding obligations2010, we had $263.9 million of cash and approximately $207.4 million of additional borrowing capacity ($118.6 million of available borrowings under theour revolving credit facility.facility and $88.8 million available under our accounts receivable securitization program). As of March 31, 2011, we had $391.0 million of cash and approximately $219.6 million of additional borrowings available to us ($121.7 million of available borrowings under our revolving credit facility and $97.9 million available under our accounts receivable securitization program). Both our revolving credit facility and accounts receivable securitization program are available to fund our working capital requirements, capital expenditures and other general corporate purposes. As of March 31, 2011, the available borrowings under our credit facility had been reduced by $28.3 million due to outstanding letters of credit. While we believe we have sufficient capital resources for our foreseeable needs, we regularly reassess those needs and resources to determine whether we require or would benefit from additional or different resources. However, we cannot assure that additional or different resources would be available on terms that we find acceptable or at all.
Indebtedness
As of March 31, 2011 we had $2,314.1 million of total indebtedness outstanding as follows (in millions):
| Payments Due by Period | |||||||||||||||
| Total | Less than 1 Year | 1-3 Years | 3-5 Years | More than 5 Years | |||||||||||
Term loan B facilities | $ | 767.5 | $ | 2.0 | $ | 4.0 | $ | 4.0 | $ | 757.5 | |||||
Senior subordinated notes due 2012 | 0.3 | — | — | 0.3 | — | ||||||||||
PIK Toggle Senior indebtedness due 2013 (1) | 519.8 | — | — | 519.8 | — | ||||||||||
Senior notes due 2014 (2) | 795.0 | — | — | — | 795.0 | ||||||||||
Senior notes due 2016 | 150.0 | — | — | — | 150.0 | ||||||||||
Senior subordinated notes due 2016 | 300.0 | — | — | — | 300.0 | ||||||||||
Other long-term debt | 3.4 | 0.9 | 1.7 | 0.8 | — | ||||||||||
Interest on long-term debt obligations (3) | 1,148.3 | 172.3 | 344.1 | 343.4 | 288.5 | ||||||||||
Purchase commitments | 127.0 | 119.2 | 7.8 | — | — | ||||||||||
Operating lease obligations | 67.4 | 18.6 | 24.5 | 14.3 | 10.0 | ||||||||||
Pension and post retirement plans (4) | 60.3 | 10.0 | 23.5 | 26.8 | na | ||||||||||
Totals | $ | 3,939.0 | $ | 323.0 | $ | 405.6 | $ | 909.4 | $ | 2,301.0 | |||||
8.50% senior notes due 2018 Term loans 11.75% senior subordinated notes due 2016 PIK toggle senior indebtedness due 2013 (1) 8.875% senior notes due 2016 Other Total Debt Total Debt at
March 31,
2011 Short-term Debt
and Current
Maturities of
Long-Term
Debt Long-term
Portion $ 1,145.0 $ — $ 1,145.0 761.5 2.0 759.5 300.0 — 300.0 93.2 93.2 — 2.0 — 2.0 12.4 9.0 3.4 $ 2,314.1 $ 104.2 $ 2,209.9
| (1) |
Our pensionAt March 31, 2011, our outstanding debt was issued or guaranteed by Rexnord Corporation, RBS Global and postretirement benefit plans whichvarious subsidiaries of RBS Global. Rexnord Corporation is the issuer of the PIK toggle senior indebtedness and RBS Global, as well as its wholly-owned subsidiary Rexnord LLC, are discussed in detail in note 15 tothe co-issuers of the term loans, senior notes and senior subordinated notes.
For a description of our audited consolidated financial statements are includedoutstanding indebtedness, see “Description of Indebtedness” elsewhere in this prospectus. The pension plans cover most of our employees and provide for monthly pension payments to eligible employees upon retirement. Other postretirement benefits consist of retiree medical plans that cover a portion of employees in the United States that meet certain age and service requirements and other postretirement benefits for employees at certain foreign locations. See “Risk Factors—Our future required cash contributions to our pension plans may increase.”
Covenant Compliance “Adjusted EBITDA” is defined in our credit facilities as net income,OurThe credit agreement and indentures that govern our notes contain, among other provisions, restrictive covenants regarding indebtedness, payments and distributions, mergers and acquisitions, asset sales, affiliate transactions, capital expenditures and the maintenance of certain financial ratios. Payment of borrowings under the senior secured credit facilities require usand indentures that govern our notes may be accelerated if there is an event of default. Events of default include the failure to maintainpay principal and interest when due, a maximummaterial breach of a representation or warranty, covenant defaults, events of bankruptcy and a change of control. Certain covenants contained in the credit agreement that governs our senior secured bank leverage ratio (being the ratio ofcredit facilities restrict our ability to take certain actions, such as incurring additional debt or making acquisitions, if we are unable to meet certain maximum net senior secured bank debt to Adjusted EBITDA)EBITDA ratios and, with respect to our revolving facility, also require us to remain at or below a certain maximum net senior secured bank debt to Adjusted EBITDA ratio as of no more than 4.25the end of each fiscal quarter. Certain covenants contained in the indentures that govern our notes restrict our ability to 1.0, calculatedtake certain actions, such as incurring additional debt or making acquisitions, if we are unable to achieve a minimum Adjusted EBITDA to Fixed Charges ratio. Under such indentures, our ability to incur additional indebtedness and our ability to make future acquisitions under certain circumstances requires us to have an Adjusted EBITDA to Fixed Charges ratio (measured on a pro forma basis for the trailing four quarters (as determined under our senior secured credit facilities) as long as the commitments under our revolving credit facility remain outstanding.last twelve months, or LTM, basis) of at least 2.0 to 1.0. Failure to comply with this covenant would result in an event of default underthese covenants could limit our revolving credit facility which, unless waivedlong-term growth prospects by our revolving credit lenders or remedied within 45 days, would cause an event of default under our other senior secured credit facilities, and in any event would likely limithindering our ability to borrow funds pursuant to our revolving credit facility. An event of default under our senior secured credit facilities can result in the acceleration of our indebtedness under the facilities, which in turn would result in an event of default and possible acceleration of indebtedness under ourobtain future debt securities. The total amount of debt which could therefore be accelerated as a result of a breach of this covenant was $2,545.9 million as of June 28, 2008. In addition, unless we comply with this covenant (or in the case of the carve-out for certain types of subordinated debt maintain a senior secured bank leverage ratio of 4.5 to 1.0), our ability under the negative covenants in our senior secured credit facilities to incur certain types of acquisition debt and certain types of subordinated debt, make certain types of acquisitions or asset exchanges, and make dividends or other distributions will be limited. As our failure to comply with the covenant described above can, at best, limit our ability to incur debt, grow our company or make dividends or other distributions and, at worst, cause us to go into default under the agreements governing our indebtedness, management believes that this covenant is material to us. As of June 28, 2008, we were in compliance with the covenant described above.acquisitions.Adjusted EBITDA“Fixed Charges” is defined in our senior securedindentures as net interest expense, excluding the amortization or write-off of deferred financing costs. as adjusted for the items summarized in the table below. Adjusted EBITDA is not a measurement ofintended to show our unleveraged, pre-tax operating results and therefore reflects our financial performance based on operational factors, excluding non-operational, non-cash or liquidity undernon-recurring losses or gains. Adjusted EBITDA is not a presentation made in accordance with GAAP, and our use of the term Adjusted EBITDA varies from others in our industry. This measure should not be considered as an alternative to net income, income from operations or any other performance measures derived in accordance with GAAP.
Set forth below is Adjusted EBITDA has important limitations as an analytical tool, and you should not consider it in isolation, or as a reconciliationsubstitute for analysis of our results as reported under GAAP. For example, Adjusted EBITDA does not reflect: (a) our capital expenditures, future requirements for capital expenditures or contractual commitments; (b) changes in, or cash requirements for, our working capital needs; (c) the significant interest expenses, or the cash requirements necessary to service interest or principal payments, on our debt; (d) tax payments that represent a reduction in cash available to us; (e) any cash requirements for the assets being depreciated and amortized that may have to be replaced in the future; (f) management fees that may be paid to Apollo or its affiliates; or (g) the impact of earnings or charges resulting from matters that we and the lenders under our secured senior credit facilities may not consider indicative of our ongoing operations. In particular, our definition of Adjusted EBITDA allows us to add back certain non-cash, non-operating or non-recurring charges that are deducted in calculating net income, even though these are expenses that may recur, vary greatly and are difficult to Adjusted EBITDA. The data below forpredict and can represent the twelve months ended June 28, 2008 is calculated by subtracting the data for the three months ended June 30, 2007 from the data for the year ended March 31, 2008 and adding the data for the three months ended June 28, 2008.effect of long-term strategies as opposed to short-term results. In
| (in millions) | Three Months Ended June 30, 2007 | Year Ended March 31, 2008 | Three Months Ended June 28, 2008 | Twelve Months Ended June 28, 2008 | |||||||||||
Net income | $ | (7.4 | ) | $ | 0.3 | $ | 0.2 | $ | 7.9 | ||||||
Interest expense, net | 64.1 | 254.3 | 58.2 | 248.4 | |||||||||||
Provision (benefit) for income taxes | (0.5 | ) | (0.9 | ) | 2.7 | 2.3 | |||||||||
Depreciation and amortization | 27.0 | 104.1 | 27.1 | 104.2 | |||||||||||
EBITDA | $ | 83.2 | $ | 357.8 | $ | 88.2 | $ | 362.8 | |||||||
Adjustments to EBITDA: | |||||||||||||||
(Gain) on Canal Street facility accident, net | (8.1 | ) | (29.2 | ) | — | (21.1 | ) | ||||||||
Business interruption insurance recoveries related to fiscal 2008 (1) | 2.5 | 2.8 | — | 0.3 | |||||||||||
Loss on divestiture (2) | — | 11.2 | — | 11.2 | |||||||||||
Stock option expense | 1.8 | 7.4 | 1.8 | 7.4 | |||||||||||
Impact of inventory fair value adjustment (3) | 19.0 | 20.0 | 1.6 | 2.6 | |||||||||||
LIFO income (4) | (14.3 | ) | (9.5 | ) | 1.9 | 6.7 | |||||||||
CDSOA recovery (5) | — | (1.4 | ) | — | (1.4 | ) | |||||||||
Other expense, net (6) | 2.9 | 6.7 | 2.2 | 6.0 | |||||||||||
Subtotal (7) | $ | 374.5 | |||||||||||||
Other senior secured credit facility adjustments: | |||||||||||||||
Business interruption insurance recoveries related to fiscal 2007 (8) | — | 8.3 | — | 8.3 | |||||||||||
Pro forma adjustments to give full year effect to the acquisition of GA (9) | 1.8 | 8.6 | — | 6.8 | |||||||||||
Adjusted EBITDA | $ | 389.6 | |||||||||||||
Senior secured bank indebtedness (10) | $ | 628.5 | |||||||||||||
Senior secured bank leverage ratio (11) | 1.61x | ||||||||||||||
53
addition, certain of these expenses can represent the reduction of cash that could be used for other corporate purposes. Further, although not included in the calculation of Adjusted EBITDA below, the measure may at times allow us to add estimated cost savings and operating synergies related to operational changes ranging from acquisitions to dispositions to restructurings and/or exclude one-time transition expenditures that we anticipate we will need to incur to realize cost savings before such savings have occurred.
As of the date of this prospectus, the calculation of Adjusted EBITDA under the credit agreement and indentures that govern our notes result in substantially identical amounts. However, the results of such calculations could differ in the future based on the different types of adjustments that may be included in such respective calculations at the time.
| (in millions) | Fiscal year ended March 31, 2011 | |||
Net loss | $ | (51.3 | ) | |
Interest expense, net | 180.8 | |||
Income tax benefit | (10.1 | ) | ||
Depreciation and amortization | 106.1 | |||
EBITDA | $ | 225.5 | ||
Adjustments to EBITDA: | ||||
Loss on extinguishment of debt (1) | 100.8 | |||
Stock option expense | 5.6 | |||
LIFO expense (2) | 4.9 | |||
Other income, net (3) | (1.1 | ) | ||
Subtotal of adjustments to EBITDA | $ | 110.2 | ||
Adjusted EBITDA | $ | 335.7 | ||
Fixed Charges of RBS Global, Inc. and subsidiaries (4) | $ | 166.0 | ||
Ratio of Adjusted EBITDA to Fixed Charges—RBS Global, Inc. and subsidiaries | 2.02 | x | ||
Net senior secured bank indebtedness (5) | $ | 388.1 | ||
Net senior secured bank leverage ratio (6) | 1.16 | x | ||
| (1) |
| (2) |
| Last-in first-out (LIFO) inventory adjustments are excluded in calculating Adjusted EBITDA as defined in our senior secured credit facilities. |
| Three Months Ended June 30, 2007 | Year Ended March 31, 2008 | Three Months Ended June 28, 2008 | Twelve Months Ended June 28, 2008 | |||||||||||||
Management fee expense | $ | 0.8 | $ | 3.0 | $ | 0.8 | $ | 3.0 | ||||||||
Losses on sales of fixed assets | 0.1 | 0.3 | 0.3 | 0.5 | ||||||||||||
Foreign currency transaction losses | 2.5 | 5.1 | 1.1 | 3.7 | ||||||||||||
Equity in earnings of unconsolidated subsidiaries | (0.2 | ) | (1.1 | ) | 0.2 | (0.7 | ) | |||||||||
Miscellaneous income | (0.3 | ) | (0.6 | ) | (0.2 | ) | (0.5 | ) | ||||||||
| $ | 2.9 | $ | 6.7 | $ | 2.2 | $ | 6.0 | |||||||||
| The senior secured credit facilities define the net senior secured bank leverage ratio as the ratio of net senior secured bank |
54
Liquidity and Capital Resources
Our primary source of liquidity is available cash and cash equivalents, cash flow from operations and borrowing availability under our $150.0 million revolving credit facility and our $100.0 million accounts receivable securitization program.
As of March 31, 2010, we had $263.9 million of cash and approximately $207.4 million of additional borrowing capacity ($118.6 million of available borrowings under our revolving credit facility and $88.8 million available under our accounts receivable securitization program). As of March 31, 2011, we had $391.0 million of cash and approximately $219.6 million of additional borrowings available to us ($121.7 million of available borrowings under our revolving credit facility and $97.9 million available under our accounts receivable securitization program). Both our revolving credit facility and accounts receivable securitization program are available to fund our working capital requirements, capital expenditures and other general corporate purposes. As of March 31, 2011, the available borrowings under our credit facility had been reduced by $28.3 million due to outstanding letters of credit. While we believe we have sufficient capital resources for our foreseeable needs, we regularly reassess those needs and resources to determine whether we require or would benefit from additional or different resources. However, we cannot assure that additional or different resources would be available on terms that we find acceptable or at all.
Indebtedness
As of March 31, 2011 we had $2,314.1 million of total indebtedness outstanding as follows (in millions):
| Total Debt at March 31, 2011 | Short-term Debt and Current Maturities of Long-Term Debt | Long-term Portion | ||||||||||
8.50% senior notes due 2018 | $ | 1,145.0 | $ | — | $ | 1,145.0 | ||||||
Term loans | 761.5 | 2.0 | 759.5 | |||||||||
11.75% senior subordinated notes due 2016 | 300.0 | — | 300.0 | |||||||||
PIK toggle senior indebtedness due 2013 (1) | 93.2 | 93.2 | — | |||||||||
8.875% senior notes due 2016 | 2.0 | — | 2.0 | |||||||||
Other | 12.4 | 9.0 | 3.4 | |||||||||
Total Debt | $ | 2,314.1 | $ | 104.2 | $ | 2,209.9 | ||||||
| (1) | Includes an unamortized bond issue discount of $0.4 million at March 31, 2011. On May 13, 2011, we prepaid $53.7 million in principal amount of this indebtedness, and have commenced procedures to extinguish the remaining balance of our PIK toggle senior |
At March 31, 2011, our outstanding debt was issued or guaranteed by Rexnord Corporation, RBS Global and various subsidiaries of RBS Global. Rexnord Corporation is the issuer of the PIK toggle senior indebtedness and RBS Global, as well as its wholly-owned subsidiary Rexnord LLC, are the co-issuers of the term loans, senior notes and senior subordinated notes.
For a description of our outstanding indebtedness, see “Description of Indebtedness” elsewhere in this prospectus.
Off-Balance Sheet Arrangements
We do not have any off-balance sheet or unconsolidated special-purpose entities.
55
Cash Flows
Net cash provided by operating activities in fiscal 2010 was $155.5 million compared to $164.5 million in fiscal 2011, representing a $9.0 million increase year-over-year. The improvement in cash provided by operating activities was driven by $53.9 million of incremental cash generated on $189.6 million of higher year-over-year net sales, an $18.2 million reduction in year-over-year cash interest payments, and a $14.2 million reduction in year-over-year cash restructuring payments. That increase was partially offset by a $77.3 million increase in trade working capital (accounts receivable, inventories and accounts payable) as a result of the year-over-year change in sales volume.
Net cash provided by operating activities in fiscal 2009 was $155.0 million compared to $155.5 million in fiscal 2010. Fiscal 2010 cash provided by operating activities includes an incremental $6.0 million of transaction costs associated with our April 2009 debt exchange offer and $16.5 million of restructuring payments, compared to $5.7 million cash restructuring payments during fiscal 2009. Excluding the incremental transaction and restructuring payments, cash flow from operations improved by $17.3 million. Decreases in trade working capital (accounts receivable, inventories and accounts payable) contributed a $62.3 million source of cash year-over-year. The remaining decline in operating cash flow is due to the impact of $372.0 million of lower net sales, partially offset by the cash savings generated from our restructuring initiatives year-over-year.
Cash used for investing activities was $22.0 million during fiscal 2010 compared to $35.5 million during fiscal 2011. The year-over-year increase in cash used for investing activities relates to a $15.6 million increase in capital expenditures partially offset by the net cash acquired in connection with the acquisition of Mecánica Falk (excluding a $6.1 million seller-financed note payable assumed in connection with the acquisition) and $0.9 million of cash proceeds received in connection with the sale of our 9.5% interest in a non-core joint venture within our Water Management platform.
Cash used for investing activities was $54.5 million during fiscal 2009 compared to $22.0 million during fiscal 2010. The year-over-year decrease in cash used for investing activities is primarily due to lower capital expenditures as we aligned our capital expenditures with current sales volume at that time as well as the fiscal 2009 acquisition of Fontaine.
Cash used for financing activities was $161.5 million during fiscal 2010 compared to a use of $6.9 million during fiscal 2011. The cash used for financing activities during fiscal 2011 consisted of a source of cash from the issuance of $1,145.0 million of 8.50% Notes, the proceeds of which were utilized to retire $1,067.4 million of previously outstanding senior notes, pay the $63.5 million tender premium to holders of the retired senior notes as well as $14.6 million of related debt issue costs. Additionally, during fiscal 2011 we made repayments of $3.7 million of other long-term debt (including a $2.0 million payment on our term loan and a $0.9 million payment to redeem 100% of our then outstanding 9.50% Notes), $0.8 million of net short-term borrowings and repayments at various foreign subsidiaries ($2.0 million of borrowings and $2.8 million of repayments). The current year also includes a $1.0 million use for the purchase of common stock and a $1.4 million use for the payments in connection with stock option exercises.
Cash provided by financing activities was $36.6 million during fiscal 2009 compared to a use of $161.5 million during fiscal 2010. The cash used for financing activities during fiscal 2010 consisted of a $36.5 million payment made to retire a portion of our outstanding PIK toggle senior indebtedness due 2013, financing fee payments of $4.9 million associated with our April 2009 debt exchange offer, $116.1 million of long-term debt repayments (comprised of $82.7 million on our revolving credit facility, $30.0 million on our accounts receivable facility, $2.0 million of mandatory repayments on our term loans and $1.4 million on all other debt) and repayments of $2.8 million on miscellaneous short-term debt. Fiscal 2010 also included a $0.4 million use of cash for the purchase of common stock and $1.5 million of cash used to cancel stock options.
56
Tabular Disclosure of Contractual Obligations
The table below lists our contractual obligations, as of March 31, 2011, by period:
| Payments Due by Period | ||||||||||||||||||||
| (in millions) | Total | Less than 1 Year | 1-3 Years | 3-5 Years | More than 5 Years | |||||||||||||||
8.50% senior notes due 2018 | $ | 1,145.0 | $ | — | $ | — | $ | — | $ | 1,145.0 | ||||||||||
Term loans | 761.5 | 2.0 | 759.5 | — | — | |||||||||||||||
11.75% senior subordinated notes due 2016 | 300.0 | — | — | — | 300.0 | |||||||||||||||
PIK toggle senior indebtedness due 2013 (1) | 93.2 | 93.2 | — | — | — | |||||||||||||||
8.875% senior notes due 2016 | 2.0 | — | — | — | 2.0 | |||||||||||||||
Other long-term debt | 12.4 | 9.0 | 2.2 | 0.5 | 0.7 | |||||||||||||||
Interest on long-term debt obligations | 932.5 | 158.1 | 293.8 | 265.5 | 215.1 | |||||||||||||||
Purchase commitments | 174.3 | 165.0 | 9.3 | — | — | |||||||||||||||
Operating lease obligations | 50.4 | 15.1 | 18.0 | 8.8 | 8.5 | |||||||||||||||
Pension and post retirement plans (2) | 93.7 | 14.8 | 35.9 | 43.0 | n/a | |||||||||||||||
Totals | $ | 3,565.0 | $ | 457.2 | $ | 1,118.7 | $ | 317.8 | $ | 1,671.3 | ||||||||||
| (1) | Includes unamortized original issue discount of $0.4 million at March 31, 2011. On May 13, 2011, we prepaid $53.7 million in principal amount of this indebtedness, and have commenced procedures to redeem the remaining balance of our PIK toggle senior indebtedness at face value in June 2011. |
| (2) | Represents expected pension and post retirement contributions and benefit payments to be paid directly by the Company. Contributions and benefit payments beyond fiscal 2016 cannot be reasonably estimated. |
Our pension and postretirement benefit plans are discussed in detail in Note 15 of our audited consolidated financial statements included elsewhere in this prospectus. The pension plans cover most of our employees and provide for monthly pension payments to eligible employees upon retirement. Other postretirement benefits consist of retiree medical plans that cover a portion of employees in the United States that meet certain age and service requirements and other postretirement benefits for employees at certain foreign locations. See “Risk Factors—Our required cash contributions to our pension plans may increase further and we could experience a material change in the funded status of our defined benefit pension plans and the amount recorded in our consolidated balance sheets related to those plans. Additionally, our pension costs could increase in future years.”
Quantitative and Qualitative Disclosures about Market Risk
We are exposed to market risk during the normal course of business from changes in foreign currency exchange rates and interest rates. The exposure to these risks is managed through a combination of normal operating and financing activities and derivative financial instruments in the form of foreign exchange forward exchange contracts and interest rate swaps to cover known foreign exchange transactions.transactions and interest rate fluctuations.
Our Company Rexnord is a growth-oriented, multi-platform industrial company with what we believe are leading market shares and highly trusted brands that serve a diverse array of global end-markets. Our heritage of innovation and specification have allowed us to provide highly engineered, mission critical solutions to customers for decades and affords us the privilege of having long-term, valued relationships with market leaders. We operate our company in a disciplined way and the Rexnord Business System (“RBS”) is our operating philosophy. Grounded in the spirit of continuous improvement, RBS creates a scalable, process-based framework that focuses on driving superior customer satisfaction and financial results by targeting world-class operating performance throughout all aspects of our business. Our strategy is to build the Company around multiple, global strategic platforms that participate in end-markets with sustainable growth characteristics where we are, or have the opportunity to become, the industry leader. We have a track record of acquiring and integrating companies and expect to continue to pursue strategic acquisitions within our existing platforms that will expand our geographic presence, broaden our product lines and allow us to move into adjacent markets. Over time, we anticipate adding additional strategic platforms to our Company. Currently, our business is comprised of two platforms, Process & Motion Control and Water Management. We believe that we have one of the broadest portfolios of highly engineered, mission and project critical Process & Motion Control products in the industrial and aerospace end-markets. Our Process & Motion Control product portfolio includes gears, couplings, industrial bearings, aerospace bearings and seals, FlatTop™ modular belting, engineered chain and conveying equipment. Our Water Management platform is a leader in the multi-billion dollar, specification-driven, non-residential construction market for water management products. Through recent acquisitions, we have gained entry into the municipal water and wastewater treatment markets. Our Water Management product portfolio includes professional grade specification drainage products, flush valves and faucet products, backflow prevention pressure release valves, Pex piping and engineered valves and gates for the water and wastewater treatment market.
1
Our products are generally “specified” or requested by end-users across both of our strategic platforms as a result of their reliable performance in demanding environments, our custom application engineering capabilities and our ability to provide global customer support. Typically, our Process & Motion Control products are initially incorporated into products sold by original equipment manufacturers (“OEMs”) or sold to end-users as critical components in large, complex systems where the cost of failure or downtime is high and thereafter replaced through industrial distributors as they are consumed or require replacement.
The demand for our Water Management products is primarily driven by new infrastructure, the retro-fit of existing structures to make them more energy and water efficient, commercial construction and, to a lesser extent, residential construction. We believe we have become a market leader in the industry by meeting the stringent third party regulatory, building and plumbing code requirements and subsequently achieving specification of our products into projects and applications.
We are led by an experienced, high-caliber management team that employs RBS as a proven operating philosophy to drive excellence and world class performance in all aspects of our business by focusing on the “Voice of the Customer” process and ensuring superior customer satisfaction. Our global footprint encompasses 36 principal Process & Motion Control manufacturing, warehouse and repair facilities located around the world and 23 principal Water Management manufacturing and warehouse facilities which allow us to meet the needs of our increasingly global customer base as well as our distribution channel partners.
We believe we have a sustainable competitive advantage in both of our platforms as a result of the following attributes:
We are a leading designer, manufacturer and marketer of highly-engineered, end-user and/or third-party specified products that are mission- or project-critical for applications where the cost of failure or downtime is high or there is a requirement to provide and enhance water quality, safety, flow control and conservation.
We believe our portfolio includes premier and widely known brands in the Process & Motion Control and Water Management markets in which we participate, as well as one of the broadest and most extensive product offerings.
We estimate that over 85% of our total net sales come from products in which we have leading market share positions.
We believe we have established a sustainable revenue profile. Within our Process & Motion Control platform, we have an extensive installed base of our products that provides us the opportunity to capture significant, recurring aftermarket revenues at attractive margins as a result of a “like-for-like” replacement dynamic. Within our Water Management platform, we pursue the retrofit of existing structures to improve water conservation and efficiency, thereby reducing our exposure to the new construction cycle.
We have extensive distribution networks in both of our platforms—in Process & Motion Control, we have over 2,600 distributor locations serving our customers globally and, in Water Management, we have more than 1,100 independent sales representatives across approximately 210 sales agencies that work directly with our in-house technical team to drive specification of our products.
We employ approximately 6,300 employees across 59 locations around the world. For the fiscal year ended March 31, 2011, we generated net sales of $1.7 billion, income from operations of $219.1 million and a net loss of $51.3 million. Fiscal 2011 results reflect the effect of a $100.8 million loss on debt extinguishment recorded during the year as a result of the early repayment of debt pursuant to cash tender offers. We generated net sales of $1.5 billion, income from operations of $161.4 million and net income of $88.1 million for the fiscal year ended March 31, 2010. Fiscal 2010 results reflect the effect of a $167.8 million gain on debt extinguishment recorded during the year as a result of a repurchase and extinguishment of debt and a debt exchange offer.
2
In addition to net income (loss), we believe Adjusted EBITDA is an important measure under our senior secured credit facilities, as our ability to incur certain types of acquisition debt or subordinated debt, make certain types of acquisitions or asset exchanges, operate our business and make dividends or other distributions, all of which will impact our financial performance, is impacted by our Adjusted EBITDA, as our lenders measure our performance by comparing the ratio of our senior secured bank debt to our Adjusted EBITDA. Adjusted EBITDA for the twelve months ended March 31, 2011 was $335.7 million. For the twelve months ended March 31, 2010, Adjusted EBITDA was $285.0 million. For more information on these and other adjustments and the limitations of Adjusted EBITDA, see “Management’s Discussion and Analysis of Financial Condition and Results of Operations—Covenant Compliance.”
Our Strategic Platforms
Foreign Currency Exchange Rate Process & Motion Control
Our Process & Motion Control platform designs, manufactures, markets and services specified, highly-engineered mechanical components used within complex systems where our customers’ reliability requirements and cost of failure or downtime is high. The Process & Motion Control product portfolio includes gears, couplings, industrial bearings, aerospace bearings and seals, FlatTop™ modular belting, engineered chain and conveying equipment and are marketed and sold globally under several brands, including Rexnord®, Rex®, Falk® and Link-Belt®. We sell our Process & Motion Control products into a diverse group of attractive end-markets, including mining, general industrial applications, cement and aggregate, agriculture, forest and wood products, petrochemical, energy, food and beverage, aerospace and wind energy.
FY2011 Process & Motion Control Net Sales by End-Market | FY2011 Process & Motion Control Net Sales End-User/OEM vs. Aftermarket | |
| |
| (1) | General Industrial includes, but is not limited to, material handling, package handling, utilities, automation and robotics, marine and steel processing, none of which individually represented more than 2% of fiscal 2011 net sales. |
We have established long-term relationships with OEMs and end-users serving a wide variety of industries. As a result of our long-term relationships with OEMs and end-users, we have created a significant installed base for our Process & Motion Control products, which are consumed or worn in use and have a relatively predictable replacement cycle. We believe this replacement dynamic drives recurring aftermarket demand for our products. We estimate that approximately 50% of our Process & Motion Control net sales are to distributors, who primarily serve the end-user/OEM aftermarket demand for our products.
3
Most of our products are critical components in large scale manufacturing processes, where the cost of component failure and resulting down-time is high. We believe our reputation for superior quality, application expertise and ability to meet lead time expectations are highly valued by our customers, as demonstrated by their preference to replace their worn Rexnord products with new Rexnord products, or “like-for-like” product replacements. We believe this replacement dynamic for our products, combined with our significant installed base, enables us to achieve premium pricing, generates a source of recurring revenue and provides us with a competitive advantage. We believe the majority of our products are purchased by customers as part of their regular maintenance budget, and in many cases do not represent significant capital expenditures.
Water Management
Our Water Management platform designs, procures, manufactures and markets products that provide and enhance water quality, safety, flow control and conservation. The Water Management product portfolio includes professional grade specification drainage products, flush valves and faucet products, engineered valves and gates for the water and wastewater treatment market and Pex piping and are marketed and sold through widely recognized brand names, including Zurn®, Wilkins®, Rodney Hunt® and Fontaine®.
Over the past century, the businesses that comprise our Water Management platform have established themselves as innovators and leading designers, manufacturers and distributors of highly engineered products and solutions that control the flow, delivery, treatment and conservation of water to the infrastructure construction (which is comprised of various segments, including those identified as “Water Supply and Treatment” in the chart below), commercial construction and, to a lesser extent, the residential construction end-markets. Segments of the infrastructure end-market include: municipal water and wastewater, transportation, government, health care and education. Segments of the commercial construction end-market include: lodging, retail, dining, sports arenas, and warehouse/office. The demand for our Water Management products is primarily driven by new infrastructure, the retro-fit of existing structures to make them more energy and water efficient, commercial construction and, to a lesser extent, residential construction.
FY2011 Water Management Net Sales by End-Market | FY2011 Water Management Net Sales New Construction vs. Retrofit | |
| |
Our Water Management products are principally specification-driven and project-critical and typically represent a low percentage of the overall project cost. We believe these characteristics, coupled with our extensive distribution network, create a high level of end-user loyalty for our products and allow us to maintain leading market shares in the majority of our product lines. We believe we have become a market leader in the industry by meeting the stringent third party regulatory, building and plumbing code requirements and subsequently achieving specification of our products into projects and applications. The majority of these stringent testing and regulatory
4
approval processes are completed through the University of Southern California (“USC”), the International Association of Plumbing and Mechanical Codes (“IAPMO”), the National Sanitation Foundation (“NSF”), the Underwriters Laboratories (“UL”), Factory Mutual (“FM”), or the American Waterworks Association (“AWWA”), prior to the commercialization of our products.
Our Water Management platform has an extensive network of approximately 1,100 independent sales representatives across approximately 210 sales agencies in North America who work with local engineers, contractors, builders and architects to specify, or “spec-in,” our products for use in construction projects. Approximately 85% of our Water Management platform net sales come from products that are specified for use in projects by engineers, contractors, owners or architects. Specifically, it has been our experience that, once an architect, engineer, contractor or owner has specified our product with satisfactory results, that person will generally continue to use our products in future projects. The inclusion of our products with project specifications, combined with our ability to innovate, engineer and deliver products and systems that save time and money for engineers, contractors, builders and architects, has resulted in growing demand for our products. Our distribution model is predicated upon maintaining high product availability near our customers. We believe that this model provides us with a competitive advantage as we are able to meet our customer demand with local inventory at significantly reduced lead times as compared to others in our industry.
Our Markets
We evaluate our competitive position in our markets based on available market data, relevant benchmarks compared to our relative peer group and industry trends. We generally do not participate in segments of our served markets that are thought of as commodities or in applications that do not require differentiation based on product quality, reliability and innovation. In both of our platforms, we believe the end-markets we serve span a broad and diverse array of commercial and industrial end-markets with solid fundamental long-term growth characteristics.
Process & Motion Control Market
Within the overall Process & Motion Control market, we estimate that the addressable North American market for our current product offerings is approximately $5.0 billion in net sales per year. Globally, we estimate our addressable market to be approximately $12.0 billion in net sales per year. The market for Process & Motion Control products is very fragmented with most participants having single or limited product lines and serving specific geographic markets. While there are numerous competitors with limited product offerings, there are only a few national and international competitors of a size comparable to us. While we compete with certain domestic and international competitors across a portion of our product lines, we do not believe that any one competitor directly competes with us on all of our product lines. The industry’s customer base is broadly diversified across many sectors of the economy. We believe that growth in the Process & Motion Control market is closely tied to overall growth in industrial production, which fundamentally, we believe has significant long-term growth potential. In addition, we believe that Process & Motion Control manufacturers who innovate to meet changes in customer demands and focus on higher growth end-markets can grow at rates faster than overall United States industrial production.
The Process & Motion Control market is also characterized by the need for sophisticated engineering experience, the ability to produce a broad number of niche products with very little lead time and long-standing customer relationships. We believe entry into our markets by competitors with lower labor costs, including foreign competitors, will be limited due to the fact that we manufacture highly specialized niche products that are critical components in large scale manufacturing processes, where the cost of component failure and resulting downtime is high. In addition, we believe there is an industry trend of customers increasingly consolidating their vendor bases, which we believe should allow suppliers with broader product offerings, like us, to capture additional market share.
5
Water Management Market
Within the overall Water Management market, we estimate that the addressable North American market for our current product offerings is approximately $2.3 billion in net sales per year. Globally, we estimate our addressable market to be approximately $3.0 billion in net sales per year. We believe the markets in which our Water Management platform participates are relatively fragmented with competitors across a broad range of industries and product lines. Although competition exists across all of our Water Management businesses, we do not believe that any one competitor directly competes with us across all of our product lines. We believe that, by focusing our efforts and resources towards end-markets that have above average growth characteristics, we can continue to grow our platform at rates above the growth rate of the overall market and the growth rate of our competition.
We believe the areas of the Water Management industry in which we compete are tied to growth in infrastructure and commercial construction, which we believe have significant long-term growth fundamentals. Historically, the infrastructure and commercial construction industry has been more stable and less vulnerable to down-cycles than the residential construction industry. Compared to residential construction cycles, downturns in infrastructure and commercial construction have been shorter and less severe, and upturns have lasted longer and had higher peaks in terms of spending as well as units and square footage. In addition, through successful new product innovation, we believe that water management manufacturers are able to grow at a faster pace than the broader infrastructure and commercial construction markets, as well as mitigate downturns in the cycle.
The Water Management industry’s specification-driven end-markets require manufacturers to work closely with engineers, contractors, builders and architects in local markets across the United States to design specific applications on a project-by-project basis. As a result, building and maintaining relationships with architects, engineers, contractors and builders who specify or “spec-in” products for use in construction projects and having flexibility in design and product innovation are critical to compete effectively in the market. Companies with a strong network of such relationships have a competitive advantage. Specifically, it has been our experience that, once an engineer, contractor, builder or architect has specified our product with satisfactory results, that person often will continue to use our products in future projects.
Our Competitive Strengths
Key characteristics of our business that we believe provide us with a competitive advantage and position us for future growth include the following:
The Rexnord Business System.We operate our company in a disciplined way. The Rexnord Business System is our operating philosophy and it creates a scalable, process-based framework that focuses on driving superior customer satisfaction and financial results by targeting world-class operating performance. RBS is based on the following principles: (1) strategy deployment—a long-term strategic planning process that determines annual improvement priorities and the actions necessary to achieve those priorities; (2) measuring our performance based on customer satisfaction, or the “Voice of the Customer;” (3) involvement of all our associates in the execution of our strategy; and (4) a culture that embraces Kaizen, the Japanese philosophy of continuous improvement. We believe applying RBS can yield superior growth, quality, delivery and cost positions relative to our competition, resulting in enhanced profitability and ultimately the creation of stockholder value. As we have applied RBS over the past several years, we have experienced significant improvements in growth, productivity, cost reduction and asset efficiency and believe there are substantial opportunities to continue to improve our performance as we continue to apply RBS.
Experienced, High-Caliber Management Team. Our management team is led by Todd Adams, President and Chief Executive Officer. George Sherman, our Non-Executive Chairman of the Board and, from 1990 to 2001, the CEO of the Danaher Corporation, collaborates with the management team to establish the strategic
6
direction of the Company. Other members of the management team include Michael Shapiro, Vice President and Chief Financial Officer, Praveen Jeyarajah, Executive Vice President—Corporate and Business Development and George Moore, Executive Vice President. We believe the overall talent level within our organization is a competitive strength, and we have added a number of experienced key managers across our platforms over the past several years. Mr. Sherman and the management team currently maintain a significant equity investment in the Company. As of March 31, 2011, their ownership interest represented approximately 20% of our common stock on a fully diluted basis.
Strong Financial Performance and Free Cash Flow. Since implementing RBS, we have established a solid track-record of delivering strong financial performance measured in terms of net sales growth, margin expansion and free cash flow conversion (cash flow from operations less capital expenditures compared to net income). Since fiscal 2004, net sales have grown at a compound annual growth rate of 13% inclusive of acquisitions, and Adjusted EBITDA margins (Adjusted EBITDA divided by net sales) have expanded to 19.8%. Additionally, we have consistently delivered strong free cash flow over the past several years by improving working capital performance and maintaining capital expenditures at reasonable levels. By continually focusing on improving our overall operating performance and free cash flow conversion, we believe we can create long-term stockholder value by using our cash flows to manage our leverage, as well as to drive growth through acquisitions over time.
Leading Market Positions in Diversified End-Markets. Our high-margin performance is driven by industry leading positions in the diversified end-markets in which we compete. We estimate that greater than 85% of our net sales are derived from products in which we have leading market share positions. We believe we have achieved leadership positions in these markets through our focus on customer satisfaction, extensive offering of quality products, ability to service our customers globally, positive brand perception, highly engineered product lines, extensive specification efforts and market/application experience. We serve a diverse set of end-markets with our largest single end-market, mining, accounting for 13% of consolidated net sales in fiscal 2011.
Broad Portfolio of Highly Engineered, Specification-Driven Products. We believe we offer one of the broadest portfolios of highly engineered, specification-driven, project-critical products in the end-markets we serve. Our array of product applications, knowledge and expertise applied across our extensive portfolio of products allows us to work closely with our customers to design and develop solutions tailored to their individual specifications. Within our Water Management platform, our representatives work directly with engineers, contractors, builders and architects to “spec-in” our Water Management products early in the design phase of a project. We have found that once these customers have specified a company’s product with satisfactory results, they will generally use that company’s products in future projects. Furthermore, we believe our strong application engineering and new product development capabilities have contributed to our reputation as an innovator in each of our end-markets.
Large Installed Base, Extensive Distribution Network and Strong Aftermarket Revenues. Over the past century we have established relationships with OEMs and end-users across a diverse group of end-markets, creating a significant installed base for our Process & Motion Control products. This installed base generates significant aftermarket sales for us, as our Process & Motion Control products are consumed in use and must be replaced in relatively predictable cycles. In order to provide our customers with superior service, we have cultivated relationships with over 2,600 distributor locations serving our customers globally. Our Water Management platform has 23 manufacturing and warehouse facilities and uses approximately 90 third-party distribution facilities at which it maintains inventory. This broad distribution network provides us with a competitive advantage and drives demand for our Water Management products by allowing quick delivery of project-critical products to our customers facing short lead times. In addition, we believe this extensive distribution network also provides us with an opportunity to capitalize on the expanding renovation and repair market as building owners begin to upgrade existing commercial and institutional bathroom fixtures with high efficiency systems.
7
Significant Experience Identifying and Integrating Strategic Acquisitions.We have successfully completed and integrated several acquisitions in recent years totaling more than $1.3 billion of total transaction value, including our $942.5 million acquisition of Zurn. These strategic acquisitions have allowed us to establish and expand our Water Management platform, widen our geographic presence, broaden our product lines and, in other instances, move into adjacent markets. Since 2005, we have completed strategic acquisitions that have significantly expanded our Process & Motion Control platform and established and expanded our Water Management platform. We believe these acquisitions have created stockholder value through the implementation of RBS operating principles, which has resulted in identifying and achieving cost synergies, as well as driving growth and operational and working capital improvements.
Our Business Strategy
We strive to create stockholder value by seeking to deliver sales growth, profitability and asset efficiency, which we believe will result in superior financial performance and free cash flow generation when compared to other leading multi-platform industrial companies by driving the following key strategies:
Drive Profitable Growth. Our key growth strategies are:
| • | Accelerate Growth in Key Vertical End-Markets—We believe that we have an opportunity to accelerate our overall net sales growth over the next several years by deploying resources to leverage our highly engineered product portfolio, industry expertise, application knowledge and unique manufacturing capabilities into certain key vertical end-markets that we expect to have above market growth rate potential. We believe those end-markets include, but are not limited to, mining, energy, aerospace, cement and aggregates, food and beverage, water infrastructure and the renovation and repair of existing commercial buildings and infrastructure. |
| • | Product Innovation and Resourcing “Break-throughs”—We intend to continue to invest in strong application engineering and new product development capabilities and processes. Our disciplined focus on innovation begins with our extensive “Voice of the Customer” process and follows a systematic process, ensuring that the commercialization and profitability of new products meet both the markets’ and our expectations. Additionally, we will continue resourcing “break-throughs,” which we define as potential products or other growth opportunities that have an annual net sales potential of $20 million or more over 3 to 5 years. We believe growing demands for more energy and water conservation products will also provide opportunities for us to grow through innovation in both platforms. |
| • | Drive Specification for Our Products—We intend to increase our installed base and grow aftermarket revenues by continuing to partner with OEMs to specify our Process & Motion Control products on original equipment applications. Within our Water Management platform, we intend to leverage our sales and distribution network and to increase specification for our products by working directly with our customers to drive specification for our products in the early design stages of a project. |
| • | Expand Internationally—We believe there is substantial growth potential outside the United States for many of our existing products by expanding distribution, further penetrating key vertical end-markets that are growing faster outside the United States and selectively pursuing acquisitions that will provide us with additional international exposure. |
| • | Pursue Strategic Acquisitions—We believe the fragmented nature of our Process & Motion Control and Water Management markets will allow us to continue to identify attractive acquisition candidates in the future that have the potential to complement our existing platforms by either broadening our product offerings, expanding geographically or addressing an adjacent market opportunity. |
Platform Focused Strategies. We intend to build our business around leadership positions in platforms that participate in multi-billion dollar, global, growing end-markets. Within our two existing platforms, we expect to continue to leverage our overall market presence and competitive position to provide further growth and diversification and increase our market share.
8
The Rexnord Business System. We operate our company in a disciplined way through the Rexnord Business System. RBS is our operating philosophy and it creates a scalable, process-based framework that focuses on driving superior customer satisfaction and financial results by targeting world-class operating performance. We believe applying RBS can yield superior growth, quality, delivery and cost positions relative to our competition, resulting in enhanced profitability and ultimately the creation of stockholder value.
Our Ownership Structure
The chart below is a summary of our organizational structure after giving effect to this offering and the redemption and prepayment of all of our PIK toggle senior indebtedness, which is expected to be completed in the first quarter of fiscal 2012 as described in “Capitalization.” Unless otherwise indicated, the indebtedness information below is as of March 31, 2011.
| (1) | Includes investment funds affiliated with, or co-investment vehicles managed by, Apollo Management VI, L.P., an affiliate of Apollo Management, L.P., which, as of March 31, 2011, collectively beneficially owned 93.8% of our common stock, with the balance beneficially owned by the management stockholders. |
| (2) | As of March 31, 2011, $761.5 million was outstanding. |
| (3) | As of March 31, 2011, $1,147.0 million was outstanding. |
| (4) | As of March 31, 2011, $300.0 million was outstanding. We intend to use a portion of the proceeds of this offering to redeem $300.0 million in principal amount of the 11.75% senior subordinated notes due 2016. |
| (5) | As of March 31, 2011, $12.4 million was outstanding. Primarily consists of foreign borrowings and capitalized lease obligations. |
| (6) | Guarantors of the senior secured credit facilities, the senior notes and the senior subordinated notes include substantially all of the domestic operating subsidiaries of RBS Global as of the date of this prospectus other than Rexnord LLC, which is a co-issuer of the notes, but do not include any of its foreign subsidiaries. |
9
Our Principal Stockholders
Our principal stockholders are investment funds affiliated with, or co-investment vehicles managed by, Apollo Management VI, L.P., an affiliate of Apollo Management, L.P., which we collectively refer to herein as “Apollo” (unless the context otherwise indicates) and which prior to this offering collectively beneficially owned 93.8% of our common stock and will beneficially own % or shares of our common stock after this offering, assuming the underwriters do not exercise their over-allotment option. Apollo Investment Fund VI, L.P., which is the sole member of one of our principal stockholders, is an investment fund with committed capital, along with its co-investment affiliates, of approximately $10.1 billion. Apollo Management, L.P., is an affiliate of Apollo Global Management, LLC, a leading global alternative asset manager with offices in New York, Los Angeles, London, Frankfurt, Luxembourg, Singapore, Hong Kong and Mumbai. As of March 31, 2011, Apollo Global Management, LLC and its subsidiaries have assets under management of approximately $70 billion in private equity, hedge funds, distressed debt and mezzanine funds invested across a core group of industries where Apollo Global Management, LLC has considerable knowledge and resources.
Risk Factors
Investing in our common stock involves substantial risk. Our ability to execute our strategy is also subject to certain risks. The risks described under the heading “Risk Factors” immediately following this summary may cause us not to realize the full benefits of our strengths or may cause us to be unable to successfully execute all or part of our strategy. These risks include, among others:
Our substantial indebtedness could have a material adverse effect on our operations, which could prevent us from satisfying our debt obligations and have a material adverse effect on the value of our common stock. Our business may not generate sufficient cash flow from operations to meet our debt service and other obligations, and currently anticipated cost savings and operating improvements may not be realized on schedule, or at all.
Our business and financial performance depend on general economic conditions and other market factors beyond our control. Any sustained weakness in demand or downturn or uncertainty in the economy generally would materially reduce our net sales and profitability.
We face significant competition from numerous companies both on the international and national levels. Some of our competitors have achieved substantially more market penetration in certain of the markets in which we operate, and some of our competitors have greater financial and other resources than we do. We cannot provide assurance that we will be able to maintain or increase the current market share of our products successfully in the future.
Some of the industries we serve are highly cyclical, such as the aerospace, energy and industrial equipment industries. Any declines in commercial, institutional or residential construction starts or demand for replacement building and home improvement products may impact us in a material adverse manner, and there can be no assurance that any such adverse effects would not continue for a prolonged period of time.
If any of the foregoing risks or the risks described under the heading “Risk Factors” were to occur, you may lose part or all of your investment. You should carefully consider all the information in this prospectus, including matters set forth under the heading “Risk Factors” on page 16 before making an investment decision.
10
Additional Information
Rexnord Corporation is a Delaware corporation. Our principal executive offices are located at 4701 West Greenfield Avenue, Milwaukee, Wisconsin 53214. Our telephone number is (414) 643-3000. Our website is located at www.rexnord.com; however, the information on our website is not part of this document, and you should rely only on the information contained in this document and the documents to which we refer you.
11
The Offering
Issuer | Rexnord Corporation |
Common stock offered by us | shares. |
Common stock to be outstanding immediately after the offering | shares. |
Underwriters’ option to purchase additional shares of common stock in this offering | We have granted to the underwriters a 30-day option to purchase up to additional shares at the initial public offering price less underwriting discounts and commissions. The underwriters will not execute sales to discretionary accounts without the prior written specific approval of the customers. |
Common stock voting rights | Each share of our common stock will entitle its holder to one vote. |
Dividend policy | We currently intend to retain all future earnings, if any, for use in the operation of our business and to fund future growth. The decision whether to pay dividends will be made by our board of directors in light of conditions then existing, including factors such as our results of operations, financial condition and requirements, business conditions and covenants under any applicable contractual arrangements, including our indebtedness. See “Dividend Policy.” |
Use of proceeds | We estimate that our net proceeds from this offering will be approximately $ million after deducting the estimated underwriting discounts and commissions and expenses, assuming the shares are offered at $ per share, which represents the midpoint of the range set forth on the front cover of this prospectus. We intend to use a portion of these net proceeds to: first, redeem $300.0 million of the outstanding 11.75% senior subordinated notes due 2016 plus early redemption premiums of $ million and accrued interest; and second, pay Apollo a fee of $ million upon the consummation of this offering in connection with the termination of our management services agreement, as described under “Certain Relationships and Related Party Transactions.” We will use the remaining net proceeds for general corporate purposes. For sensitivity analyses as to the offering price and other information, see “Use of Proceeds.” |
NYSE symbol | “RXN” |
Risk factors | You should carefully read and consider the information set forth under “Risk Factors” beginning on page 16 of this prospectus and all other information set forth in this prospectus before deciding to invest in our common stock. |
12
Except as otherwise indicated, all of the information in this prospectus assumes:
a for one stock split described below has been completed;
no exercise of the underwriters’ over-allotment option to purchase up to additional shares of common stock to cover over-allotments of shares;
an initial offering price of $ per share, the midpoint of the range set forth on the cover page of this prospectus; and
our amended and restated certificate of incorporation and amended and restated bylaws are in effect, pursuant to which the provisions described under “Description of Capital Stock” will become operative.
Prior to completion of this offering, we will effect a stock split whereby holders of our outstanding shares of common stock will receive shares of common stock for each share they currently hold. The number of shares of common stock to be outstanding after completion of this offering is based on shares of our common stock to be sold in this offering and, except where we state otherwise, the information with respect to our common stock we present in this prospectus:
does not give effect to shares of our common stock issuable upon the exercise of outstanding options as of , 2011, at a weighted-average exercise price of $ per share; and
does not give effect to shares of common stock reserved for future issuance under Rexnord Corporation’s 2006 Stock Option Plan.
13
Summary Historical Financial and Other Data
The summary historical financial data for the fiscal years ended March 31, 2009, 2010 and 2011 have been derived from our consolidated financial statements and related notes thereto which have been audited by Ernst & Young LLP, an independent registered public accounting firm and are included elsewhere in this prospectus.
The following data should be read in conjunction with “Risk Factors,” “Selected Financial Information,” “Management’s Discussion and Analysis of Financial Condition and Results of Operations” and our consolidated financial statements and related notes thereto included elsewhere in this prospectus.
(dollars in millions) | Year Ended March 31, 2009 (1)(2) | Year Ended March 31, 2010 (1) | Year Ended March 31, 2011 | |||||||||
Statement of Operations: | ||||||||||||
Net Sales | $ | 1,882.0 | $ | 1,510.0 | $ | 1,699.6 | ||||||
Cost of Sales | 1,290.1 | 994.4 | 1,102.8 | |||||||||
Gross Profit | 591.9 | 515.6 | 596.8 | |||||||||
Selling, General and Administrative Expenses | 467.8 | 297.7 | 329.1 | |||||||||
Intangible Impairment Charges | 422.0 | — | — | |||||||||
Restructuring and Other Similar Costs | 24.5 | 6.8 | — | |||||||||
Amortization of Intangible Assets | 48.9 | 49.7 | 48.6 | |||||||||
(Loss) Income from Operations | (371.3 | ) | 161.4 | 219.1 | ||||||||
Non-Operating Income (Expense): | ||||||||||||
Interest Expense, net | (230.4 | ) | (194.2 | ) | (180.8 | ) | ||||||
Gain (Loss) on debt extinguishment | 103.7 | 167.8 | (100.8 | ) | ||||||||
Other (Expense) Income, net | (3.0 | ) | (16.4 | ) | 1.1 | |||||||
(Loss) Income Before Income Taxes | (501.0 | ) | 118.6 | (61.4 | ) | |||||||
(Benefit) Provision for Income Taxes | (72.0 | ) | 30.5 | (10.1 | ) | |||||||
Net (Loss) Income | $ | (429.0 | ) | $ | 88.1 | $ | (51.3 | ) | ||||
Other Data: | ||||||||||||
Net Cash (Used for) Provided by: | ||||||||||||
Operating Activities | 155.0 | 155.5 | 164.5 | |||||||||
Investing Activities | (54.5 | ) | (22.0 | ) | (35.5 | ) | ||||||
Financing Activities | 36.6 | (161.5 | ) | (6.9 | ) | |||||||
Depreciation and Amortization of Intangible Assets | 109.6 | 109.3 | 106.1 | |||||||||
Capital Expenditures | 39.1 | 22.0 | 37.6 | |||||||||
14
| March 31 | ||||||||||||
(dollars in millions) | 2009 | 2010 | 2011 | |||||||||
Balance Sheet Data: | ||||||||||||
Cash and Cash Equivalents | $ | 287.9 | $ | 263.9 | $ | 391.0 | ||||||
Working Capital (3) | 555.2 | 481.9 | 483.6 | |||||||||
Total Assets | 3,218.8 | 3,016.5 | 3,099.7 | |||||||||
Total Debt (4) | 2,526.1 | 2,215.5 | 2,314.1 | |||||||||
Stockholders’ Equity (Deficit) | (177.8 | ) | (57.5 | ) | (88.2 | ) | ||||||
| (1) | Financial data for fiscal 2009 and 2010 has been adjusted for our voluntary change in accounting for actuarial gains and losses related to our pension and other postretirement benefit plans. See Note 2 to our audited consolidated financial statements included elsewhere in this prospectus. |
| (2) | Consolidated financial data as of and for the year ended March 31, 2009 reflects the estimated fair value of assets acquired and liabilities assumed in connection with the Fontaine acquisition on February 27, 2009. As a result, the comparability of the operating results for the periods presented is affected by the revaluation of the assets acquired and liabilities assumed on the date of the Fontaine acquisition. |
| (3) | Represents total current assets less total current liabilities. |
| (4) | Total debt represents long-term debt plus the current portion of long-term debt. |
In addition to net (loss) income, we believe Adjusted EBITDA is an important measure under our senior secured credit facilities, as our ability to incur certain types of acquisition debt or subordinated debt, make certain types of acquisitions or asset exchanges, operate our business and make dividends or other distributions, all of which will impact our financial performance, is impacted by our Adjusted EBITDA, as our lenders measure our performance by comparing the ratio of our net senior secured bank debt to our Adjusted EBITDA. We reported Adjusted EBITDA of $335.7 million in fiscal 2011. See “Management’s Discussion and Analysis of Financial Condition and Results of Operations—Covenant Compliance.”
15
Investing in our common stock involves a high degree of risk. You should carefully consider the risk factors set forth below as well as the other information contained in this prospectus before investing in our common stock. The risks described below are not the only risks facing us. Additional risks and uncertainties not currently known to us or those we currently view to be immaterial may also materially and adversely affect our business, financial condition, results of operations or cash flows. Any of the following risks could materially and adversely affect our business, financial condition, results of operations or cash flows. In such a case, you may lose part or all of your original investment.
Risks Related to Our Business
Our substantial indebtedness could adversely affect our ability to raise additional capital to fund our operations, limit our ability to react to changes in the economy or our industry and prevent us from making debt service payments.
We are a highly leveraged company. Our ability to generate sufficient cash flow from operations to make scheduled payments on our debt will depend on a range of economic, competitive and business factors, many of which are outside our control. Our business may not generate sufficient cash flow from operations to meet our debt service and other obligations, and currently anticipated cost savings and operating improvements may not be realized on schedule, or at all. If we are unable to meet our expenses and debt service and other obligations, we may need to refinance all or a portion of our indebtedness on or before maturity, sell assets or raise equity. Furthermore, Apollo has no obligation to provide us with debt or equity financing and we therefore may be unable to generate sufficient cash to service all of our indebtedness. We may not be able to refinance any of our indebtedness, sell assets or raise equity on commercially reasonable terms or at all, which could cause us to default on our obligations and impair our liquidity. Our inability to generate sufficient cash flow to satisfy our debt obligations or to refinance our obligations on commercially reasonable terms would have a material adverse effect on our business, financial condition, results of operations or cash flows.
Our substantial indebtedness could also have other important consequences with respect to our ability to manage our business successfully, including the following:
it may limit our ability to borrow money for our working capital, capital expenditures, debt service requirements, strategic initiatives or other purposes;
it may make it more difficult for us to satisfy our obligations with respect to our indebtedness, and any failure to comply with the obligations of any of our debt instruments, including restrictive covenants and borrowing conditions, could result in an event of default under our senior secured credit facilities, the indentures governing our senior notes, senior subordinated notes and our other indebtedness;
a substantial portion of our cash flow from operations will be dedicated to the repayment of our indebtedness and so will not be available for other purposes;
it may limit our flexibility in planning for, or reacting to, changes in our operations or business;
we are and will continue to be more highly leveraged than some of our competitors which may place us at a competitive disadvantage;
it may make us more vulnerable to further downturns in our business or the economy;
it may restrict us from making strategic acquisitions, introducing new technologies or exploiting business opportunities; and
it, along with the financial and other restrictive covenants in the documents governing our indebtedness, among other things, may limit our ability to borrow additional funds or dispose of assets.
16
Furthermore, our interest expense could increase if interest rates increase because a portion of the debt under our senior secured credit facilities is unhedged variable-rate debt. For the last several quarters, interest rates have been subject to extreme volatility which may intensify this risk. Also, we may still incur significantly more debt, which could intensify the risks described above. For more information, see Note 10 to our audited consolidated financial statements included elsewhere in this prospectus.
Weak economic and financial market conditions have impacted our business operations and may adversely affect our results of operations and financial condition.
Weak global economic and financial market conditions in recent years have affected our business operations and continuing weakness or a further downturn may adversely affect our future results of operations and financial condition. Economic conditions in the end-markets, businesses or geographic areas in which we sell our products could reduce demand for these products and result in a decrease in sales volume for a prolonged period of time which would have a negative impact on our future results of operations. Also, a weak recovery could prolong, or resume, the negative effects we have experienced in the past.
For example, sales to the construction industry are driven by trends in commercial and residential construction, housing starts and trends in residential repair and remodeling. Consumer confidence, mortgage rates, credit standards and availability and income levels play a significant role in driving demand in the residential construction, repair and remodeling sector. A prolonged or further drop in consumer confidence, continued restrictions in the credit market or an increase in mortgage rates, credit standards or unemployment could delay the recovery of commercial and residential construction levels and have a material adverse effect on our business, financial condition, results of operations or cash flows. This may express itself in the form of substantial downward pressure on product pricing and our profit margins, thereby adversely affecting our financial results.
Additionally, many of our products are used in the energy, mining and cement and aggregate markets. With the recent increases and volatility in commodity prices, certain customers may defer or cancel anticipated projects or expansions until such time as these projects will be profitable based on the underlying cost of commodities compared to the cost of the project. Volatility and disruption of financial markets, like in recent years, could limit the ability of our customers to obtain adequate financing to maintain operations and may cause them to terminate existing purchase orders, reduce the volume of products they purchase from us in the future or impact their ability to pay their receivables. Adverse economic and financial market conditions may also cause our suppliers to be unable to meet their commitments to us or may cause suppliers to make changes in the credit terms they extend to us, such as shortening the required payment period for outstanding accounts receivable or reducing or eliminating the amount of trade credit available to us.
Demand for our Water Management products depends on availability of financing.
Many customers who purchase our Water Management products depend on third-party financing. There have been significant disruptions in the availability of financing on reasonable terms. Fluctuations in prevailing interest rates affect the availability and cost of financing to our customers. Given recent market conditions, some lenders and institutional investors have significantly reduced, and in some cases ceased to provide, funding to borrowers. The lack of availability or increased cost of credit could lead to decreased construction which would result in a reduction in demand for our products and have a material adverse effect on our Water Management business, financial condition, results of operations or cash flows.
The markets in which we sell our products are highly competitive.
We operate in highly fragmented markets within the Process & Motion Control. As a result, we compete against numerous companies. Some of our competitors have achieved substantially more market penetration in certain of the markets in which we operate, and some of our competitors have greater financial and other
17
resources than we do. Competition in our business lines is based on a number of considerations including product performance, cost of transportation in the distribution of our Process & Motion Control products, brand reputation, quality of client service and support, product availability and price. Additionally, some of our larger, more sophisticated customers are attempting to reduce the number of vendors from which they purchase in order to increase their efficiency. If we are not selected to become one of these preferred providers, we may lose access to certain sections of the markets in which we compete. Our customers increasingly demand a broad product range and we must continue to develop our expertise in order to manufacture and market these products successfully. To remain competitive, we will need to invest continuously in manufacturing, customer service and support, marketing and our distribution networks. We may also have to adjust the prices of some of our Process & Motion Control products to stay competitive. We cannot assure you that we will have sufficient resources to continue to make these investments or that we will maintain our competitive position within each of the markets we serve.
Within the Water Management platform, we compete against both large international and national rivals, as well as many regional competitors. Some of our competitors have greater resources than we do. Significant competition in any of the markets in which the Water Management platform operates could result in substantial downward pressure on product pricing and our profit margins, thereby adversely affecting the Water Management financial results. Furthermore, we cannot provide assurance that we will be able to maintain or increase the current market share of our products successfully in the future.
Our business depends upon general economic conditions and other market factors beyond our control, and we serve customers in cyclical industries. As a result, our operating results could further be negatively affected during any continued or future economic downturns.
Our financial performance depends, in large part, on conditions in the markets that we serve in the U.S. and the global economy generally. Some of the industries we serve are highly cyclical, such as the aerospace, energy and industrial equipment industries. We have undertaken cost reduction programs as well as diversified our markets to mitigate the effect of downturns in economic conditions; however, such programs may be unsuccessful. Any sustained weakness in demand or downturn or uncertainty in the economy generally, such as the recent unprecedented volatility in the capital and credit markets, would materially reduce our net sales and profitability.
The demand in the water management industry is influenced by new construction activity, both residential and non-residential, and the level of repair and remodeling activity. The level of new construction and repair and remodeling activity is affected by a number of factors beyond our control, including the overall strength of the U.S. economy (including confidence in the U.S. economy by our customers), the strength of the residential and commercial real estate markets, institutional building activity, the age of existing housing stock, unemployment rates and interest rates. Any declines in commercial, institutional or residential construction starts or demand for replacement building and home improvement products may impact us in a material adverse manner and there can be no assurance that any such adverse effects would not continue for a prolonged period of time.
The loss of any significant customer could adversely affect our business.
We have certain customers that are significant to our business. During fiscal 2011, our top 20 customers accounted for approximately 32% of our consolidated net sales, and our largest customer accounted for 8% of our consolidated net sales. Our competitors may adopt more aggressive sales policies and devote greater resources to the development, promotion and sale of their products than we do, which could result in a loss of customers. The loss of one or more of our major customers or deterioration in our relationship with any of them could have a material adverse effect on our business, financial condition, results of operations or cash flows.
18
Increases in the cost of our raw materials, in particular bar steel, brass, castings, copper, forgings, high-performance engineered plastic, plate steel, resin, sheet steel and zinc, as well as petroleum products, or the loss of a substantial number of our suppliers, could adversely affect our financial condition.
We depend on third parties for the raw materials used in our manufacturing processes. We generally purchase our raw materials on the open market on a purchase order basis. In the past, these contracts generally have had one to five year terms and have contained competitive and benchmarking clauses intended to ensure competitive pricing. While we currently maintain alternative sources for raw materials, our business is subject to the risk of price fluctuations, delays in the delivery of and potential unavailability of our raw materials. Any such price fluctuations or delays, if material, could harm our profitability or operations. In addition, the loss of a substantial number of suppliers could result in material cost increases or reduce our production capacity.
In addition, prices for petroleum products and other carbon-based fuel products have also significantly increased recently. These price increases, and consequent increases in the cost of electricity and for products for which petroleum-based products are components or used in part of the process of manufacture, may substantially increase our costs for transportation, fuel, component parts and manufacturing. We may not be able to recoup the costs of these increases by adjusting our prices.
We do not typically enter into hedge transactions to reduce our exposure to foreign currency exchange rates relates primarilyprice risks and cannot assure you that we would be successful in passing on any attendant costs if these risks were to materialize. In addition, if we are unable to continue to purchase our required quantities of raw materials on commercially reasonable terms, or at all, or if we are unable to maintain or enter into our purchasing contracts for our larger commodities, our business operations could be disrupted and our profitability could be impacted in a material adverse manner.
We rely on independent distributors. Termination of one or more of our relationships with any of those independent distributors or an increase in the distributors’ sales of our competitors’ products could have a material adverse effect on our business, financial condition, results of operations or cash flows.
In addition to our foreign operations.own direct sales force, we depend on the services of independent distributors to sell our Process & Motion Control products and provide service and aftermarket support to our OEMs and end-users. We rely on an extensive distribution network, with nearly 2,600 distributor locations nationwide; however, for fiscal 2011, approximately 21% of our Process & Motion Control net sales were generated through sales to three of our key independent distributors, the largest of which accounted for 12% of Process & Motion Control net sales. Rather than serving as passive conduits for delivery of product, our industrial distributors are active participants in the overall competitive dynamic in the Process & Motion Control industry. Industrial distributors play a significant role in determining which of our Process & Motion Control products are stocked at the branch locations, and hence are most readily accessible to aftermarket buyers, and the price at which these products are sold. Almost all of the distributors with whom we transact business also offer competitors’ products and services to our customers. Within Water Management, we depend on a network of several hundred independent sales representatives and approximately 90 third-party warehouses to distribute our products; however, for fiscal 2011, our three key independent distributors generated approximately 28% of our Water Management net sales with the largest accounting for 20% of Water Management net sales.
Our Process & Motion Control and Water Management distributorship sales are on “market standard” terms. In addition, certain key distributors are on rebate programs, including our top three Water Management distributors. For more information on our foreignrebate programs, see “Management’s Discussion and Analysis of Financial Condition and Results of Operations-Revenue Recognition.”
The loss of one of our key distributors or of a substantial number of our other distributors or an increase in the distributors’ sales of our competitors’ products to our customers could have a material adverse effect on our business, financial condition, results of operations exchange rates impactor cash flows.
19
We could be adversely affected if any of our significant customers default in their obligations to us.
Our contracted backlog is comprised of future orders for our products from a broad number of customers. Defaults by any of the U.S. Dollarcustomers that have placed significant orders with us could have a significant adverse effect on our net sales, profitability and cash flow. Our customers may in the future default on their obligations to us due to bankruptcy, lack of liquidity, operational failure or other reasons deriving from the current general economic environment. More specifically, the recession and tightening of credit have led to an increased level of commercial and consumer delinquencies, lack of customer confidence, increased market volatility and widespread reduction of business generally. Accordingly, the recession and tightening of credit increases the risks associated with our backlog. If a customer defaults on its obligations to us, it could have a material adverse effect on our business, financial condition, results of operations or cash flows. Approximately 5% of our backlog at March 31, 2011 is currently scheduled to ship beyond fiscal 2012.
We are subject to risks associated with changing technology and manufacturing techniques, which could place us at a competitive disadvantage.
The successful implementation of our business strategy requires us to continuously evolve our existing products and introduce new products to meet customers’ needs in the industries we serve. Our products are characterized by stringent performance and specification requirements that mandate a high degree of manufacturing and engineering expertise. If we fail to meet these requirements, our business could be at risk. We believe that our customers rigorously evaluate their suppliers on the basis of a number of factors, including product quality, price competitiveness, technical and manufacturing expertise, development and product design capability, new product innovation, reliability and timeliness of delivery, operational flexibility, customer service and overall management. Our success will depend on our ability to continue to meet our customers’ changing specifications with respect to these criteria. We cannot assure you that we will be able to address technological advances or introduce new products that may be necessary to remain competitive within our businesses. Furthermore, we cannot assure you that we can adequately protect any of our own technological developments to produce a sustainable competitive advantage.
If we lose certain of our key associates, our business may be adversely affected.
Our success depends on our ability to recruit, retain and motivate highly-skilled sales, marketing and engineering personnel. Competition for these persons in our industry is intense and we may not be able to successfully recruit, train or retain qualified personnel. If we fail to retain and recruit the necessary personnel, our business and our ability to obtain new customers, develop new products and provide acceptable levels of customer service could materially suffer. In addition, we cannot assure you that these individuals will continue their employment with us. If any of these key personnel were to leave our company, it could be difficult to replace them, and our business could be materially harmed.
We may incur significant costs for environmental compliance and/or to address liabilities under environmental laws and regulations.
Our operations and facilities are subject to extensive laws and regulations related to pollution and the protection of the environment, health and safety, including those governing, among other things, emissions to air, discharges to water, the generation, handling, storage, treatment and disposal of hazardous wastes and other materials, and the remediation of contaminated sites. A failure by us to comply with applicable requirements or the permits required for our operations could result in civil or criminal fines, penalties, enforcement actions, third party claims for property damage and personal injury, requirements to clean up property or to pay for the costs of cleanup or regulatory or judicial orders enjoining or curtailing operations or requiring corrective measures, including the installation of pollution control equipment or remedial actions. Moreover, if applicable environmental, health and safety laws and regulations, or the interpretation or enforcement thereof, become more stringent in the future, we could incur capital or operating costs beyond those currently anticipated.
20
Some environmental laws and regulations, including the federal Superfund law, impose requirements to investigate and remediate contamination on present and former owners and operators of facilities and sites, and on potentially responsible parties (“PRPs”) for sites to which such parties may have sent waste for disposal. Such liability can be imposed without regard to fault and, under certain circumstances, may be joint and several, resulting in one PRP being held responsible for the entire obligation. Liability may also include damages to natural resources. We are currently conducting investigations and/or cleanup of known or potential contamination at several of our current and former facilities and have been named as a PRP at several third party Superfund sites. The discovery of additional contamination, the imposition of more stringent cleanup requirements, disputes with our insurers or the insolvency of other responsible parties could require significant expenditures by us in excess of our current reserves. In addition, we occasionally evaluate various alternatives with respect to our facilities, including possible dispositions or closures. Investigations undertaken in connection with these activities may lead to discoveries of contamination that must be remediated, and closures of facilities may trigger remediation requirements that are not currently applicable to our operating facilities. We may also face liability for alleged personal injury or property damage due to exposure to hazardous substances used or disposed of by us, that may be contained within our current or former products, or that are present in the soil or groundwater at our current or former facilities. Significant costs could be incurred in connection with such liabilities.
We believe that, subject to various terms and conditions, we have certain indemnification protection from Invensys plc (“Invensys”) with respect to certain environmental liabilities that may have occurred prior to the acquisition by the Carlyle Group (the “Carlyle Acquisition”) of the capital stock of 16 entities comprising the Rexnord group of Invensys, including certain liabilities associated with our Downers Grove, Illinois facility and with respect to personal injury claims for alleged exposure to hazardous materials. We also believe that, subject to various terms and conditions, we have certain indemnification protection from Hamilton Sundstrand Corporation (“Hamilton Sundstrand”), with respect to certain environmental liabilities that may have arisen from events occurring at Falk facilities prior to the Falk acquisition, including certain liabilities associated with personal injury claims for alleged exposure to hazardous materials. If Invensys or Hamilton Sundstrand becomes unable to, or otherwise does not, comply with its indemnity obligations, or if certain contamination or other liability for which we are obligated is not subject to such indemnities or historic insurance coverage, we could incur significant unanticipated costs. As a result, it is possible that we will not be able to recover pursuant to these indemnities a substantial portion, if any, of the costs that we may incur.
Certain subsidiaries are subject to numerous asbestos claims.
Certain subsidiaries are co-defendants in various lawsuits filed in a number of jurisdictions throughout the United States alleging personal injury as a result of exposure to asbestos that was used in certain components of our products. The uncertainties of litigation and the uncertainties related to the collection of insurance and indemnification coverage make it difficult to accurately predict the ultimate financial effect of these claims. In the event our insurance or indemnification coverage becomes insufficient to cover our potential financial exposure, or the actual number or value of asbestos-related claims differs materially from our reported earnings,existing estimates, we could incur material costs that could have a material adverse effect on our investmentsbusiness, financial condition, results of operations or cash flows. See “Business—Legal Proceedings.”
Certain Water Management subsidiaries are subject to a number of class action claims.
Certain Water Management subsidiaries are defendants in a class action lawsuit pending in U.S. federal court in Minnesota and in a number of putative class action lawsuits pending in various other U.S. federal courts. The plaintiffs in these suits represent or seek to represent a class of plaintiffs alleging damages due to the alleged failure or anticipated failure of the Zurn brass crimp fittings on the PEX plumbing systems in homes and other structures. The complaints assert various causes of action, including but not limited to negligence, breach of warranty, fraud, and violations of the Magnuson-Moss Act and certain state consumer protection laws, and seek declaratory and injunctive relief, and damages (including punitive damages). While we intend to vigorously
21
defend ourselves in these actions, the uncertainties of litigation and the uncertainties related to insurance coverage and collection as well as the actual number or value of claims make it difficult to accurately predict the financial effect these claims may ultimately have on us. We may not be successful in defending such claims, and the resulting liability could be substantial and may not be covered by insurance. As a result of the preceding, there can be no assurance as to the long-term effect this litigation will have on our business, financial condition, results of operations or cash flows. See “Business—Legal Proceedings.”
Weather could adversely affect the demand for products in our Water Management platform and decrease its net sales.
Demand for our Water Management products is primarily driven by non-residential construction activity, remodeling and retro-fit opportunities, and to a lesser extent, new home starts as well as water and wastewater infrastructure expansion for municipal, industrial and hydropower applications. Weather is an important variable affecting financial performance as it significantly impacts construction activity. Spring and summer months in the subsidiariesUnited States and Europe represent the intercompany transactions withmain construction seasons. Adverse weather conditions, such as prolonged periods of cold or rain, blizzards, hurricanes and other severe weather patterns, could delay or halt construction and remodeling activity which could have a negative affect on our business. For example, an unusually severe winter can lead to reduced construction activity and magnify the subsidiaries. See “Risk Factors—seasonal decline in our Water Management net sales and earnings during the winter months. In addition, a prolonged winter season can delay construction and remodeling plans and hamper the typical seasonal increase in net sales and earnings during the spring months.
Our international operations are subject to uncertainties, which could adversely affect our operating results.”
Approximately 25%Our business is subject to certain risks associated with doing business internationally. For fiscal 2011, our net sales outside the United States represented approximately 29% of our total net sales (based on the country in which the shipment originates). The portion of our net sales originateand operations that is outside of the United States with approximately 15% generated from our European operations that use the Eurohas increased in recent years, and may further increase as their functional currency. As a result fluctuations in the value of foreign currencies against the U.S. Dollar, particularly the Euro, may haveinternal growth and/or acquisition activity. Accordingly, our future results could be harmed by a material impact on our reported results. Revenues and expenses denominated in foreign currencies are translated into U.S. Dollars at the endvariety of the fiscal period using the average exchange rates in effect during the period. Consequently, as the value of the U.S. Dollar changes relativefactors relating to the currencies of our major markets, our reported results vary.international operations, including:
Fluctuations
fluctuations in currency exchange rates, also impactparticularly fluctuations in the Euro against the U.S. Dollar amount ofdollar;
exchange controls;
compliance with export controls;
tariffs or other trade protection measures and import or export licensing requirements;
changes in tax laws;
interest rates;
changes in regulatory requirements;
differing labor regulations;
requirements relating to withholding taxes on remittances and other payments by subsidiaries;
restrictions on our stockholders’ equity. The assetsability to own or operate subsidiaries, make investments or acquire new businesses in these jurisdictions;
restrictions on our ability to repatriate dividends from our subsidiaries; and
exposure to liabilities of our non-U.S. subsidiaries are translated into U.S. Dollars atunder the exchange rates in effect at the end of the fiscal period. The U.S. Dollar continued to weaken during fiscal 2008 relative to many foreign currencies. For the fiscal year ended March 31, 2008, stockholders’ equity increased by $14.2 million as a result of foreign currency translation adjustments, and for the three months ended June 28, 2008, stockholders’ equity increased by $1.4 million. If the U.S. Dollar had strengthened by 10% as of March 31, 2008 or June 28, 2008, the results would have decreased stockholders’ equity by approximately $7.9 million and $11.2 million, respectively.Foreign Corrupt Practices Act.
As we continue to expand our business globally, our success will depend, in large part, on our ability to anticipate and effectively manage these and other risks associated with our international operations. However, any of these factors could adversely affecthave a material adverse effect on our international operations and, consequently, our business, financial condition, results of operations or cash flows.
22
We may be unable to identify potential acquisition candidates, or to realize the intended benefits of future or past acquisitions.
We cannot assure you that suitable acquisition candidates will be identified and acquired in the future, that the financing of any such acquisition will be available on satisfactory terms, that we will be able to complete any such acquisition or that we will be able to accomplish our strategic objectives as a result of any such acquisition. Nor can we assure you that our acquisition strategies will be successfully received by customers or achieve their intended benefits.
Often acquisitions are undertaken to improve the operating results.results of either or both of the acquirer and the acquired company and we cannot assure you that we will be successful in this regard nor can we provide any assurance that we will be able to realize all of the intended benefits from our prior acquisitions. We have encountered, and may encounter, various risks in acquiring other companies, including the possible inability to integrate an acquired business into our operations, diversion of management’s attention and unanticipated problems, risks or liabilities, some or all of which could have a material adverse effect on our business, financial condition, results of operations or cash flows.
At June 28, 2008,We may be unable to make necessary capital expenditures.
We periodically make capital investments to, among other things, maintain and upgrade our facilities and enhance our products’ processes. As we had outstanding forward contracts for Canadian Dollars ingrow our businesses, we may have to incur significant capital expenditures. We believe that we will be able to fund these expenditures through cash flow from operations and borrowings under our senior secured credit facilities. However, our senior secured credit facilities, the indentures governing our senior notes and the indenture governing our senior subordinated notes contain limitations that could affect our ability to fund our future capital expenditures and other capital requirements. We cannot assure you that we will have, or be able to obtain, adequate funds to make all necessary capital expenditures when required, or that the amount of 25.4future capital expenditures will not be materially in excess of our anticipated or current expenditures. If we are unable to make necessary capital expenditures, our product line may become dated, our productivity may be decreased and the quality of our products may be adversely affected which, in turn, could materially reduce our net sales and profitability.
Our debt agreements impose significant operating and financial restrictions, which could have a material adverse effect on our business, financial condition, results of operations or cash flows.
Our senior secured credit facilities and the indentures governing our senior notes and senior subordinated notes contain various covenants that limit or prohibit our ability, among other things, to:
incur or guarantee additional indebtedness or issue certain preferred shares;
pay dividends on our capital stock or redeem, repurchase, retire or make distributions in respect of our capital stock or subordinated indebtedness or make other restricted payments;
make certain loans, acquisitions, capital expenditures or investments;
sell certain assets, including stock of our subsidiaries;
enter into sale and leaseback transactions;
create or incur liens;
consolidate, merge, sell, transfer or otherwise dispose of all or substantially all of our assets; and
enter into certain transactions with our affiliates.
The indentures governing our senior notes and senior subordinated notes contain covenants that restrict our ability to take certain actions, such as incurring additional debt, if we are unable to meet defined specified financial ratios. As of March 31 2011, our senior secured bank leverage ratio was 1.16x. In addition, as of this
23
date, we had $121.7 million Canadian Dollars entered intoof additional borrowing capacity under the senior secured credit facilities ($28.3 million was considered utilized in connection with outstanding letters of credit). Failure to hedge firm and anticipated monthly cash flowscomply with the leverage covenant of the senior secured credit facilities can result in limiting our long-term growth prospects by hindering our ability to incur future indebtedness or grow through fiscal 2009. These contracts are not designated as hedges for SFAS133 accounting purposes. acquisitions. A breach of any of these covenants could result in a default under our debt agreements. For more information, see Note 10 to our audited consolidated financial statements included elsewhere in this prospectus.
The outstanding contracts are adjusted
to mark-to-market through earnings. The Company believes that a hypothetical 10% adverse changerestrictions contained in the foreign currency exchange rates would have resulted in a $2.7 million loss dueagreements that govern the terms of our debt could:
limit our ability to a write down in the fair value of the outstanding forward contracts as of June 28, 2008.plan for or react to market conditions or meet capital needs or otherwise restrict our activities or business plans;
Interest Rate Risk
We utilize a combination of short-term and long-term debtadversely affect our ability to finance our operations, and are exposed to interest rate risk on these debt obligations.enter into strategic acquisitions, to fund investments or other capital needs or to engage in other business activities that would be in our interest; and
As
limit our access to the cash generated by our subsidiaries.
Upon the occurrence of June 28, 2008, our borrowingsan event of default under the term loansenior secured credit facility were apportioned between two primary tranches: a $570.0 million term loan B1 facility and a $197.5 million term loan B2 facility. Borrowingsfacilities, the lenders could elect to declare all amounts outstanding under the $570.0 million term loan B1 facility accrue interest, atsenior secured credit facilities to be immediately due and payable and terminate all commitments to extend further credit. If we were unable to repay those amounts, the lenders under the senior secured credit facilities could proceed against the collateral granted to them to secure the senior secured credit facilities on a first-priority lien basis. If the lenders under the senior secured credit facilities accelerate the repayment of borrowings, such acceleration could have a material adverse effect on our option, at the following rates per annum: (i) 2.50% plus the LIBOR Rate per annum,business, financial condition, results of operations or (ii) 1.50% plus the Base Rate (which is defined as the highercash flows. In addition, we may not have sufficient assets to repay our senior notes and senior subordinated notes upon acceleration. For a more detailed description of the Federal funds rate plus 0.5% or the Prime rate). Borrowings under the $197.5 million term loan B2 facility accrue interest, at our option, at the following rates per annum: (i) 2.00% plus the LIBOR Rate, or (ii) 1.00% plus the Base Rate (which is defined as the higher of the Federal funds rate plus 0.5% or the Prime rate). The weighted average interest ratelimitations on our outstanding term loans at June 28, 2008 was 5.84%. In August 2006, we entered into an interest rate collarability to incur additional indebtedness, see Note 10 to our audited consolidated financial statements included elsewhere in this prospectus and an interest rate swap to hedge the variability in future cash flows associated with“Description of Indebtedness.”
Because a substantial portion of our variable-rate term loans. The interest rate collar provides an interest rate floor of 4.0% plus the applicable margin and an interest rate cap of 6.065% plus the applicable margin on $262.0 million of our variable-rate term loans, while the interest rate swap converts $68.0 million of our variable-rate term loans to a fixed interest rate of 5.14% plus the applicable margin. Both the interest rate collar and the interest rate swap became effective on October 20, 2006 and have a maturity of three years.
Borrowings under our $150.0 million revolving credit facility accrue interest, at our option, at the following rates per annum: (i) 2.25% plus the LIBOR Rate, or (ii) 1.25% plus the Base Rate (which is defined as the higher of the Federal funds rate plus 0.5% or the Prime rate).
Our PIK toggle senior indebtedness bears interest at a floating rate. The floating rate is equalrates that fluctuate with changes in certain prevailing short-term interest rates, we are vulnerable to adjusted LIBOR (the interest rate per annum equal toincreases.
A substantial portion of our indebtedness, including the product of (a) the LIBORsenior secured credit facilities and borrowings outstanding under our accounts receivable securitization facility, bears interest at rates that fluctuate with changes in effect and (b) Statutory Reserves) plus 7.0%.certain short-term prevailing interest rates. As of March 31, 2008 and June 28, 20082011, we had $761.5 million of floating rate debt under the senior secured credit facilities. Of the $761.5 million of floating rate debt, $370.0 million of our term loans are subject to interest rate swaps, in each case maturing in July 2012. After considering the interest rate was 10.06% and 9.68%, respectively.
Our results of operations would likely be affected by changes in market interest rates on the un-hedged portion of these variable-rate obligations and on our PIK toggle senior indebtedness. Answaps, a 100 basis point increase in the March 31, 2011 interest rate of 1.00% on our variable rate debtrates would increase our interest costexpense under the senior secured credit facilities by approximately $12.3$3.9 million on an annual basis.
We rely on intellectual property that may be misappropriated or otherwise successfully challenged.
We attempt to protect our intellectual property through a combination of patent, trademark, copyright and trade secret protection, as well as third-party nondisclosure and assignment agreements. We cannot assure you that any of our applications for protection of our intellectual property rights will be approved and maintained or that our competitors will not infringe or successfully challenge our intellectual property rights. We also rely on unpatented proprietary technology. It is possible that others will independently develop the same or similar technology or otherwise obtain access to our unpatented technology. To protect our trade secrets and other proprietary information, we require employees, consultants and advisors to enter into confidentiality agreements. We cannot assure you that these agreements will provide meaningful protection for our trade secrets, know-how or other proprietary information in the event of any unauthorized use, misappropriation or disclosure. If we are unable to maintain the proprietary nature of our technologies, our ability to sustain margins on some or all of our products may be affected which could have a material adverse effect on our business, financial condition, results of operations or cash flows. In addition, in the ordinary course of our operations, from time to time we pursue
24
and are pursued in potential litigation relating to the protection of certain intellectual property rights, including some of our more profitable products, such as flattop chain. An adverse ruling in any such litigation could have a material adverse effect on our business, financial condition, results of operations or cash flows.
We could face potential product liability claims relating to products we manufacture or distribute.
We may be subject to additional product liability claims in the event that the use of our products, or the exposure to our products or their raw materials, is alleged to have resulted in injury or other adverse effects. We currently maintain product liability insurance coverage but we cannot assure you that we will be able to obtain such insurance on commercially reasonable terms in the future, if at all, or that any such insurance will provide adequate coverage against potential claims. Product liability claims can be expensive to defend and can divert the attention of management and other personnel for long periods of time, regardless of the ultimate outcome. An unsuccessful product liability defense could have a material adverse effect on our business, financial condition, results of operations or cash flows. In addition, our business depends on the strong brand reputation we have developed. In the event that this reputation is damaged as a result of a product liability claim, we may face difficulty in maintaining our pricing positions and market share with respect to some of our products, which could have a material adverse effect on our business, financial condition, results of operations or cash flows. See “Business—Legal Proceedings.”
We, our customers and our shippers have unionized employees who may stage work stoppages which could seriously impact the profitability of our business.
As of the date of this filing, we had approximately 6,300 employees, of whom approximately 4,300 were employed in the United States. Approximately 535 of our U.S. employees are represented by labor unions. Additionally, approximately 1,000 of our employees reside in Europe, where trade union membership is common. Although we believe that our relations with our employees are currently strong, if our unionized workers were to engage in a strike, work stoppage or other slowdown in the future, we could experience a significant disruption of our operations, which could interfere with our ability to deliver products on a timely basis and could have other negative effects, such as decreased productivity and increased labor costs. Such negative effects could have a material adverse effect on our business, financial condition, results of operations or cash flows. In addition, if a greater percentage of our workforce becomes unionized, our business and financial results could be affected in a material adverse manner. Further, many of our direct and indirect customers and their suppliers, and organizations responsible for shipping our products, have unionized workforces and their businesses may be impacted by strikes, work stoppages or slowdowns, any of which, in turn, could have a material adverse effect on our business, financial condition, results of operations or cash flows.
We could incur substantial business interruptions as the result of updating our Enterprise Resource Planning (“ERP”) Systems.
Utilizing a phased approach, we are updating our ERP systems across both our Process & Motion Control and Water Management platforms. If these updates are unsuccessful, we could incur substantial business interruptions, including the inability to perform routine business transactions, which could have a material adverse effect on our financial performance.
Our required cash contributions to our pension plans have increased and may increase further and we could experience a material change in the funded status of our defined benefit pension plans and the amount recorded in our consolidated balance sheets related to those plans. Additionally, our pension costs could increase in future years.
Recent Accounting Pronouncementslegislative changes have reformed funding requirements for underfunded U.S. defined benefit pension plans. The revised statute, among other things, increases the percentage funding target of U.S. defined benefit pension plans from 90% to 100% and requires the use of a more current mortality table in the calculation
25
of minimum yearly funding requirements. Our future required cash contributions to our U.S. defined benefit pension plans may increase based on the funding reform provisions that were enacted into law. In addition, if the returns on the assets of any of our U.S. defined benefit pension plans were to decline in future periods, if the Pension Benefit Guaranty Corporation (“PBGC”) were to require additional contributions to any such plans as a result of our recent acquisitions or if other actuarial assumptions were to be modified, our future required cash contributions to such plans could increase. Any such increases could have a material and adverse effect on our business, financial condition, results of operations or cash flows.
The need to make these cash contributions to such plans may reduce the cash available to meet our other obligations, including our debt obligations with respect to our senior secured credit facilities, our senior notes and our senior subordinated notes, or to meet the needs of our business. In addition, the PBGC may terminate our U.S. defined benefit pension plans under limited circumstances, including in the event the PBGC concludes that the risk may increase unreasonably if such plans continue. In the event a U.S. defined benefit pension plan is terminated for any reason while it is underfunded, we could be required to make an immediate payment to the PBGC of all or a substantial portion of such plan’s underfunding, as calculated by the PBGC based on its own assumptions (which might result in a larger obligation than that based on the assumptions we have used to fund such plan), and the PBGC could place a lien on material amounts of our assets.
The deterioration experienced in fiscal 2009 in the securities markets has impacted the value of the assets included in our defined benefit pension plans. The deterioration in pension asset values has led to additional contribution requirements (in accordance with the plan funding requirements of the U.S. Pension Protection Act of 2006). Any further deterioration may also lead to further cash contribution requirements and increased pension costs. Recent pension funding legislative and regulatory relief provided by the U.S. government in light of the securities markets decline has reduced our short-term required pension contributions from the amount required before relief. The impact of this relief has been reflected in our projected cash contribution requirements disclosed in the consolidated financial statements.
Our historical financial data is not comparable to our current financial condition and results of operations because of our use of purchase accounting in connection with various acquisitions and due to the different basis of accounting used by us prior to the acquisition by Apollo in 2006.
It may be difficult for you to compare both our historical and future results. These acquisitions were accounted for utilizing the purchase method of accounting, which resulted in a new valuation for the assets and liabilities to their fair values. This new basis of accounting began on the date of the consummation of each transaction. Also, until our purchase price allocations are finalized for an acquisition (generally less than one year after the acquisition date), our allocation of the excess purchase price over the book value of the net assets acquired is considered preliminary and subject to future adjustment.
Risks Related to This Offering
There is no existing market for our common stock and we do not know if one will develop, which could impede your ability to sell your shares and may depress the market price of our common stock.
There has not been a public market for our common stock prior to this offering. We cannot predict the extent to which investor interest in us will lead to the development of an active trading market or how liquid that market might become. If an active trading market does not develop, you may have difficulty selling any of our common stock that you buy. The initial public offering price for the common stock will be determined by negotiations between us and the underwriters and may not be indicative of prices that will prevail in the open market following this offering. See “Underwriting.” Consequently, you may be unable to sell our common stock at prices equal to or greater than the price you pay in this offering.
26
Apollo controls us and its interests may conflict with or differ from your interests as a stockholder.
After the consummation of this offering, Apollo will beneficially own approximately % of our common stock, assuming the underwriters do not exercise their option to purchase additional shares, or % if the underwriters exercise their option in full. In June 2006,addition, representatives of Apollo comprise 4 of our 8 directors. As a result, Apollo will continue to have the ability to prevent any transaction that requires the approval of our board of directors or stockholders, including the approval of significant corporate transactions such as mergers and the sale of substantially all of our assets.
The interests of Apollo could conflict with or differ from your interests as a holder of our common stock. For example, the concentration of ownership held by Apollo could delay, defer or prevent a change of control of us or impede a merger, takeover or other business combination that you as a stockholder may otherwise view favorably. Apollo is in the business of making or advising on investments in companies and holds, and may from time to time in the future acquire, interests in or provide advice to businesses that directly or indirectly compete with certain portions of our business or are suppliers or customers of ours. They may also pursue acquisitions that may be complementary to our business, and, as a result, those acquisition opportunities may not be available to us.
So long as Apollo continues to beneficially own a significant amount of our equity, even if such amount is less than 50%, it may continue to be able to strongly influence or effectively control our decisions. See “Certain Relationships and Related Party Transactions” and “Description of Capital Stock.”
We will be a “controlled company” within the meaning of the New York Stock Exchange rules and, as a result, will qualify for, and intend to rely on, exemptions from certain corporate governance requirements.
Upon the closing of this offering, Apollo will continue to control a majority of our voting common stock. As a result, we will be a “controlled company” within the meaning of the New York Stock Exchange corporate governance standards. Under the rules, a company of which more than 50% of the voting power is held by an individual, group or another company is a “controlled company” and may elect not to comply with certain New York Stock Exchange corporate governance requirements, including:
the requirement that we have a majority of independent directors on our board of directors;
the requirement that we have a nominating and corporate governance committee that is composed entirely of independent directors with a written charter addressing the committee’s purpose and responsibilities;
the requirement that we have a compensation committee that is composed entirely of independent directors with a written charter addressing the committee’s purpose and responsibilities; and
the requirement for an annual performance evaluation of the nominating and corporate governance and compensation committees.
Following this offering, we intend to utilize certain exemptions from New York Stock Exchange corporate governance requirements, including the foregoing. As a result, we will not have a majority of independent directors nor will our nominating and corporate governance and compensation committees consist entirely of independent directors and we will not be required to have an annual performance evaluation of the nominating and corporate governance and compensation committees. See “Management.” Accordingly, you will not have the same protections afforded to stockholders of companies that are subject to the New York Stock Exchange’s corporate governance requirements.
27
The price of our common stock may fluctuate significantly and you could lose all or part of your investment.
Volatility in the market price of our common stock may prevent you from being able to sell your common stock at or above the price you paid for your common stock. The market price for our common stock could fluctuate significantly for various reasons, including:
our operating and financial performance and prospects;
our quarterly or annual earnings or those of other companies in our industry;
conditions that impact demand for our products and services;
future announcements concerning our business or our competitors’ businesses;
the public’s reaction to our press releases, other public announcements and filings with the U.S. Securities and Exchange Commission, or SEC;
changes in earnings estimates or recommendations by securities analysts who track our common stock;
market and industry perception of our success, or lack thereof, in pursuing our growth strategy;
strategic actions by us or our competitors, such as acquisitions or restructurings;
changes in government and environmental regulation;
general market, economic and political conditions;
changes in accounting standards, policies, guidance, interpretations or principles;
arrival or departure of key personnel;
the number of shares to be publicly traded after this offering;
sales of common stock by us, Apollo or its affiliated funds or members of our management team;
adverse resolution of new or pending litigation against us; and
changes in general market, economic and political conditions in the United States and global economies or financial markets, including those resulting from natural disasters, terrorist attacks, acts of war and responses to such events.
In addition, the stock market has experienced significant price and volume fluctuations in recent years. This volatility has had a significant impact on the market price of securities issued by many companies, including companies in our industries. The changes frequently appear to occur without regard to the operating performance of the affected companies. Hence, the price of our common stock could fluctuate based upon factors that have little or nothing to do with us, and these fluctuations could materially reduce our share price.
We currently have no plans to pay regular dividends on our common stock, so you may not receive funds without selling your common stock.
We currently have no plans to pay regular dividends on our common stock. Any payment of future dividends will be at the discretion of our board of directors and will depend on, among other things, our earnings, financial condition, capital requirements, level of indebtedness, statutory and contractual restrictions applying to the payment of dividends, and other considerations that our board of directors deems relevant. The terms governing our outstanding debt also include limitations on the ability of our subsidiaries to pay dividends to us. Accordingly, you may have to sell some or all of your common stock in order to generate cash flow from your investment.
Future sales or the possibility of future sales of a substantial amount of our common stock may depress the price of shares of our common stock.
We may sell additional shares of common stock in subsequent public offerings or otherwise, including to finance acquisitions. We have authorized shares of common stock, of which shares will be outstanding upon consummation of this offering. This number includes shares that we are selling in this offering, which may be resold immediately in the public market. Of the remaining shares, , or %, are restricted
28
from immediate resale under the federal securities laws and the lock-up agreements with the underwriters described in the “Underwriting” section of this prospectus, but may be sold into the market in the near future. These shares will become available for sale at various times following the expiration of the lock-up agreements, which, without the prior consent of , is days after the date of this prospectus. Immediately after the expiration of the lock-up period, the shares will be eligible for resale under Rule 144 or Rule 701 of the Securities Act subject to volume limitations and applicable holding period requirements.
We cannot predict the size of future issuances of our common stock or the effect, if any, that future issuances and sales of our common stock will have on the market price of our common stock. Sales of substantial amounts of our common stock (including shares issued in connection with an acquisition), or the perception that such sales could occur, may adversely affect prevailing market prices for our common stock.
Our organizational documents may impede or discourage a takeover, which could deprive our investors of the opportunity to receive a premium for their shares.
Provisions of our certificate of incorporation and bylaws may make it more difficult for, or prevent a third party from, acquiring control of us without the approval of our board of directors. These provisions include:
having a classified board of directors;
establishing limitations on the removal of directors;
prohibiting cumulative voting in the election of directors;
empowering only the board to fill any vacancy on our board of directors, whether such vacancy occurs as a result of an increase in the number of directors or otherwise;
as long as Apollo continues to own more than 50% of our common stock, granting Apollo the right to increase the size of our board of directors and to fill the resulting vacancies at any time;
authorizing the issuance of “blank check” preferred stock without any need for action by stockholders;
eliminating the ability of stockholders to call special meetings of stockholders;
prohibiting stockholders to act by written consent if less than 50.1% of our outstanding common stock is controlled by Apollo;
| • | requiring the approval of a majority of the board of directors (including a majority of the Apollo directors) to approve business combinations so long as Apollo owns 331/3% of the shares of common stock; and |
establishing advance notice requirements for nominations for election to our board of directors or for proposing matters that can be acted on by stockholders at stockholder meetings.
Our issuance of shares of preferred stock could delay or prevent a change of control of us. Our board of directors has the authority to cause us to issue, without any further vote or action by the stockholders, shares of preferred stock, par value $0.01 per share, in one or more series, to designate the number of shares constituting any series, and to fix the rights, preferences, privileges and restrictions thereof, including dividend rights, voting rights, rights and terms of redemption, redemption price or prices and liquidation preferences of such series. The issuance of shares of our preferred stock may have the effect of delaying, deferring or preventing a change in control without further action by the stockholders, even where stockholders are offered a premium for their shares.
Together, these charter and statutory provisions could make the removal of management more difficult and may discourage transactions that otherwise could involve payment of a premium over prevailing market prices for our common stock. Furthermore, the existence of the foregoing provisions, as well as the significant common stock beneficially owned by Apollo, could limit the price that investors might be willing to pay in the future for shares of our common stock. They could also deter potential acquirers of us, thereby reducing the likelihood that you could receive a premium for your common stock in an acquisition.
29
You will experience an immediate and substantial dilution in the net tangible book value of the common stock you purchase.
Prior investors have paid substantially less per share than the price in this offering. We expect to have a net tangible book deficit after this offering of $ per share. Based on an assumed initial public offering price of $ per share, the midpoint of the estimated offering range set forth on the cover page of this prospectus, you will experience immediate and substantial dilution of approximately $ per share in net tangible book value of the common stock you purchase in this offering. See “Dilution,” including the discussion of the effects on dilution from a change in the price of this offering.
Despite our substantial indebtedness, we may still be able to incur significantly more indebtedness, which could have a material adverse effect on our business, financial condition, results of operations or cash flows.
The terms of the indentures governing our senior notes and senior subordinated notes and our senior secured credit facilities contain restrictions on our ability to incur additional indebtedness. These restrictions are subject to a number of important qualifications and exceptions, and the indebtedness, if any, incurred in compliance with these restrictions could be substantial. Accordingly, we or our subsidiaries could incur significant additional indebtedness in the future. As of March 31, 2011, we had approximately $121.7 million available for additional borrowing under the senior secured credit facilities (net of $28.3 million that was considered utilized as a result of the letters of credit), and the covenants under our debt agreements would allow us to borrow a significant amount of additional indebtedness. Additional leverage could have a material adverse effect on our business, financial condition, results of operations or cash flows and could increase the risks described in “—Our substantial indebtedness could adversely affect our ability to raise additional capital to fund our operations, limit our ability to react to changes in the economy or our industry and prevent us from making debt service payments,” “—Our debt agreements impose significant operating and financial restrictions, which could have a material adverse effect on our business, financial condition, results of operations or cash flows” and “—Because a substantial portion of our indebtedness bears interest at rates that fluctuate with changes in certain prevailing short-term interest rates, we are vulnerable to interest rate increases.”
The additional requirements of having a class of publicly traded equity securities may strain our resources and distract management.
Even though RBS Global and Rexnord LLC currently file reports with the SEC, after the consummation of this offering, we will be subject to additional reporting requirements of the Securities Exchange Act of 1934, or the Exchange Act, the Sarbanes-Oxley Act of 2002, or the Sarbanes-Oxley Act, and the Dodd-Frank Wall Street Reform and Consumer Protection Act, or the Dodd-Frank Act. The Dodd-Frank Act, signed into law on July 21, 2010, effects comprehensive changes to public company governance and disclosures in the United States and will subject us to additional federal regulation. We cannot predict with any certainty the requirements of the regulations ultimately adopted or how the Dodd-Frank Act and such regulations will impact the cost of compliance for a company with publicly traded common stock. We are currently evaluating and monitoring developments with respect to the Dodd-Frank Act and other new and proposed rules and cannot predict or estimate the amount of the additional costs we may incur or the timing of such costs. These laws, regulations and standards are subject to varying interpretations, in many cases due to their lack of specificity, and, as a result, their application in practice may evolve over time as new guidance is provided by regulatory and governing bodies. This could result in continuing uncertainty regarding compliance matters and higher costs necessitated by ongoing revisions to disclosure and governance practices. We intend to invest resources to comply with evolving laws, regulations and standards, and this investment may result in increased general and administrative expenses and a diversion of management’s time and attention from revenue-generating activities to compliance activities. If our efforts to comply with new laws, regulations and standards differ from the activities intended by regulatory or governing bodies due to ambiguities related to practice, regulatory authorities may initiate legal proceedings against us and our business may be harmed. We also expect that being a company with publicly traded common stock and these new rules and regulations will make it more expensive for us to obtain director and officer
30
liability insurance, and we may be required to accept reduced coverage or incur substantially higher costs to obtain coverage. These factors could also make it more difficult for us to attract and retain qualified members of our board of directors, particularly to serve on our audit committee, and qualified executive officers.
The Sarbanes-Oxley Act requires that we maintain effective disclosure controls and procedures and internal control for financial reporting. These requirements may place a strain on our systems and resources. Under Section 404 of the Sarbanes-Oxley Act, we will be required to include a report of management on our internal control over financial reporting in our Annual Reports on Form 10-K. After consummation of this offering, our independent public accountants auditing our financial statements must attest to the effectiveness of our internal control over financial reporting. This requirement will first apply to our Annual Report on Form 10-K for our year ending March 31, 2013. In order to maintain and improve the effectiveness of our disclosure controls and procedures and internal control over financial reporting, significant resources and management oversight will be required. This may divert management’s attention from other business concerns, which could have a material adverse effect on our business, financial condition, results of operations and cash flows. If we are unable to conclude that our disclosure controls and procedures and internal control over financial reporting are effective, or if our independent public accounting firm is unable to provide us with an unqualified report as to management’s assessment of the effectiveness of our internal control over financial reporting in future years, investors may lose confidence in our financial reports and our stock price may decline.
31
CAUTIONARY NOTICE REGARDING FORWARD-LOOKING STATEMENTS
This prospectus includes “forward-looking statements” within the meaning of the federal securities laws that involve risks and uncertainties. Forward-looking statements include statements we make concerning our plans, objectives, goals, strategies, future events, future revenues or performance, capital expenditures, financing needs and other information that is not historical information and, in particular, appear under the headings “Summary,” “Risk Factors,” “Management’s Discussion and Analysis of Financial Accounting Standards Board (“FASB”) issued FASB Interpretation (“FIN”) No. 48,AccountingCondition and Results of Operations” and “Business.” When used in this prospectus, the words “estimates,” “expects,” “anticipates,” “projects,” “forecasts,” “plans,” “intends,” “believes,” “foresees,” “seeks,” “likely,” “may,” “might,” “will,” “should,” “goal,” “target” or “intends” and variations of these words or similar expressions (or the negative versions of any such words) are intended to identify forward-looking statements. All forward-looking statements are based upon information available to us on the date of this prospectus.
These forward-looking statements are subject to risks, uncertainties and other factors, many of which are outside of our control, that could cause actual results to differ materially from the results discussed in the forward-looking statements, including, among other things, the matters discussed in this prospectus in the sections captioned “Summary,” “Risk Factors,” “Management’s Discussion and Analysis of Financial Condition and Results of Operations” and “Business.” Some of the factors that we believe could affect our results include:
the impact of our substantial indebtedness;
the effect of local and national economic, credit and capital market conditions on the economy in general, and on the industries in which we operate in particular;
access to available and reasonable financing on a timely basis;
our competitive environment;
dependence on independent distributors;
general economic and business conditions, market factors and our dependence on customers in cyclical industries;
the seasonality of our sales;
impact of weather on the demand for Uncertaintyour products;
availability of financing for our customers;
changes in Income Taxestechnology and manufacturing techniques;
loss of key personnel;
increases in cost of our raw materials and our possible inability to increase product prices to offset such increases;
the loss of any significant customer;
inability to make necessary capital expenditures;
risks associated with international operations;
the costs of environmental compliance and/or the imposition of liabilities under environmental, health and safety laws and regulations;
the costs of asbestos claims;
the costs of Zurn’s class action litigation;
a declining construction market;
solvency of insurance carriers;
32
viability of key suppliers;
reliance on intellectual property;
potential product liability claims;
work stoppages by unionized employees;
integration of recent and future acquisitions into our business;
changes in pension funding requirements;
control by our principal equityholders; and
the other factors set forth herein, including those set forth under “Risk Factors.”
There are likely other factors that could cause our actual results to differ materially from the results referred to in the forward-looking statements. All forward-looking statements attributable to us apply only as of the date of this prospectus and are expressly qualified in their entirety by the cautionary statements included in this prospectus. We undertake no obligation to publicly update or revise forward-looking statements to reflect events or circumstances after the date made or to reflect the occurrence of unanticipated events, except as required by law.
33
Assuming an initial public offering price of $ per share, we estimate that we will receive net proceeds from this offering of approximately $ million, after deducting underwriting discounts and commissions and other estimated expenses of $ million payable by us. This estimate assumes an initial public offering price of $ per share, the midpoint of the range set forth on the cover page of this prospectus. A $1.00 increase (decrease) in the assumed initial public offering price of $ per share would increase (decrease) the net proceeds to us from this offering by $ , assuming the number of shares offered by us, as set forth on the cover page of this prospectus, remains the same and after deducting the estimated underwriting discounts and commissions and estimated expenses payable by us.
We intend to use the net proceeds that we receive (i) to redeem up to $300.0 million in aggregate principal amount of our 11.75% senior subordinated notes due 2016 plus early redemption premiums of $ million and accrued interest, (ii) to pay Apollo or its affiliates a fee of $ million upon the consummation of this offering in connection with the termination of our management services agreement, as described under “Certain Relationships and Related Party Transactions,” and (iii) for general corporate purposes. As of March 31, 2011, we had $300.0 million in aggregate principal amount of our 11.75% senior subordinated notes outstanding, which bear interest at a rate of 11.75% per annum and mature on August 1, 2016.
Any net proceeds used to redeem all $300.0 million of outstanding aggregate principal amount of our 11.75% senior subordinated notes would be first contributed by the Company to RBS Global so that RBS Global may effect such redemption or repayment. Pending the application of the net proceeds of this offering, as described above, all or a portion of the net proceeds of this offering may be invested by us in short-term interest bearing investments.
34
We currently intend to retain all future earnings, if any, for use in the operation of our business and to fund future growth. In addition, our senior secured credit facilities and the indentures governing our senior notes limit our ability to pay dividends or other distributions on our common stock. See “Description of Indebtedness.” The decision whether to pay dividends will be made by our board of directors in light of conditions then existing, including factors such as our results of operations, financial condition and requirements, business conditions and covenants under any applicable contractual arrangements.
35
The following table sets forth our capitalization as of March 31, 2011:
on an actual basis;
on a pro forma, as adjusted, basis giving effect to the repayment of the PIK toggle senior indebtedness as described below (which is occurring irrespective of the offering); and
on a pro forma, as further adjusted, basis giving effect to our sale of shares of common stock in this offering at an assumed offering price of $ , which addressesis the midpoint of the range listed on the cover page of this prospectus, and our expected use of the net proceeds of this offering, as well as the repayment of the PIK toggle senior indebtedness as described below (which is occurring irrespective of the offering).
You should read this table in conjunction with our financial statements and related notes for the fiscal year ended March 31, 2011, “Management’s Discussion and Analysis of Financial Condition and Results of Operations” and “Use of Proceeds” included elsewhere in this prospectus.
| As of March 31, 2011 (1) | ||||||||||||
| (in millions, except share amounts) | Actual | Pro forma as adjusted for extinguishment of PIK toggle senior indebtedness | Pro forma as further adjusted (2) | |||||||||
Debt: | ||||||||||||
Term loans | $ | 761.5 | $ | 761.5 | $ | 761.5 | ||||||
Borrowing under revolving credit facility | — | — | — | |||||||||
Accounts receivable securitization program | — | — | — | |||||||||
PIK toggle senior indebtedness (3) | 93.2 | — | — | |||||||||
8.50% senior notes due 2018 | 1,145.0 | 1,145.0 | 1,145.0 | |||||||||
8.875% senior notes due 2016 | 2.0 | 2.0 | 2.0 | |||||||||
11.75% senior subordinated notes due 2016 | 300.0 | 300.0 | — | |||||||||
Other (4) | 12.4 | 12.4 | 12.4 | |||||||||
Total debt, including current portion | 2,314.1 | 2,220.9 | 1,920.9 | |||||||||
Stockholders’ equity (deficit): | ||||||||||||
Common stock, $0.01 par value; shares authorized and shares issued (5) | 0.2 | 0.2 | ||||||||||
Additional paid-in capital | 293.3 | 293.3 | ||||||||||
Retained earnings (deficit) (6) | (391.5 | ) | (392.0 | ) | ||||||||
Accumulated other comprehensive income | 16.1 | 16.1 | ||||||||||
Treasury stock at cost (216,423 shares) | (6.3 | ) | (6.3 | ) | ||||||||
Total stockholders’ equity (deficit) | (88.2 | ) | (88.7 | ) | ||||||||
Total capitalization | $ | 2,225.9 | 2,132.2 | |||||||||
| (1) | As of March 31, 2011 we had cash and cash equivalents of $391.0 million on a historical basis, $296.9 million on a pro forma basis, as adjusted for the extinguishment of our PIK toggle senior indebtedness, and $ million, on a pro forma basis, as further adjusted to give effect to the offering. |
| (2) | A $1.00 increase (decrease) in the assumed initial public offering price of $ per share (the midpoint of the range set forth on the cover page of this prospectus) would increase (decrease) each of cash, additional paid-in capital and total capitalization by $ , assuming the number of shares offered by us, as set forth on the cover page of this prospectus, remains the same and after deducting the estimated underwriting discounts and commissions and estimated expenses payable by us. |
36
| (3) | Includes unamortized original issue discount of $0.4 million at March 31, 2011. We have prepaid $53.7 million in principal amount of this indebtedness on May 13, 2011, and have commenced procedures to extinguish the remaining balance of the Company’s PIK toggle senior indebtedness at face value in June 2011. This extinguishment has been or will be funded through our existing liquidity and is not dependent on proceeds from this offering. |
| (4) | Primarily consists of foreign borrowings and capital lease obligations. |
| (5) | We expect to complete a for one stock split of our common stock prior to the completion of this offering. All share amounts have been retroactively adjusted to give effect to this stock split. |
| (6) | Pro forma as further adjusted retained deficit reflects the impact of this offering and the intended use of proceeds. |
37
Dilution is the amount by which the offering price paid by the purchasers of the common stock to be sold in this offering exceeds the net tangible book value per share of common stock after the offering. Net tangible book value per share is determined at any date by subtracting our total liabilities from the total book value of our tangible assets and dividing the difference by the number of shares of common stock deemed to be outstanding at that date.
Our net tangible book deficit as of March 31, 2011 was $1.749 billion, or $109.13 per share. After giving effect to the receipt and our intended use of approximately $ million of estimated net proceeds from our sale of shares of common stock in this offering at an assumed offering price of $ per share, which represents the midpoint of the range set forth on the front cover of this prospectus, our adjusted net tangible book deficit as of , 2011 would have been approximately $ million, or $ per share. This represents an immediate increase in pro forma net tangible book value of $ per share to existing stockholders and an immediate dilution of $ per share to new investors purchasing shares of common stock in the offering. The following table illustrates this substantial and immediate per share dilution to new investors:
| Per Share | ||||
Assumed initial public offering price per share | $ | |||
Net tangible book value (deficit) before the offering | (109.13 | ) | ||
Increase per share attributable to investors in the offering | ||||
Pro forma net tangible book value (deficit) after the offering | ||||
Dilution per share to new investors | $ | |||
A $1.00 increase (decrease) in the assumed initial public offering price of $ per share would increase (decrease) our pro forma net tangible book value by $ , the as adjusted net tangible book value per share after this offering by $ per share and the dilution per share to new investors in this offering by $ , assuming the number of shares offered by us, as set forth on the cover page of this prospectus, remains the same and after deducting the estimated underwriting discounts and commissions and estimated expenses payable by us.
The following table summarizes on an as adjusted basis as of , 2011, giving effect to:
the total number of shares of common stock purchased from us;
the total consideration paid to us, assuming an initial public offering price of $ per share (before deducting the estimated underwriting discount and commissions and offering expenses payable by us in connection with this offering); and
the average price per share paid by existing stockholders and by new investors purchasing shares in this offering:
| Shares Purchased | Total Consideration | Average Price Per | ||||||||||||||||||
| Number | Percent | Amount | Percent | Share | ||||||||||||||||
Existing stockholders | % | $ | % | $ | ||||||||||||||||
Investors in the offering | % | % | ||||||||||||||||||
Total | 100 | % | $ | 100 | % | $ | ||||||||||||||
38
A $1.00 increase (decrease) in the assumed initial public offering price of $ per share (the midpoint of the range set forth on the cover page of this prospectus) would increase (decrease) total consideration paid by existing stockholders, total consideration paid by new investors and the average price per share by $ , $ and $ , respectively, assuming the number of shares offered by us, as set forth on the cover page of this prospectus, remains the same, and without deducting underwriting discounts and commissions and estimated expenses payable by us.
The tables and calculations above assume no exercise of stock options outstanding as of , 2011 to purchase shares of common stock at a weighted average exercise price of $ per share. If these options were exercised at the weighted average exercise price, the additional dilution per share to new investors would be $ .
The tables and calculations above also assume no exercise of the underwriters’ over-allotment option. If the underwriters exercise their over-allotment option in full, then new investors would purchase shares, or approximately % of shares outstanding, the total consideration paid by new investors would increase to $ , or % of the total consideration paid (based on the midpoint of the range set forth on the cover page of this prospectus), and the additional dilution per share to new investors would be $ .
39
SELECTED FINANCIAL INFORMATION
The selected financial information as of March 31, 2010 and 2011 and for our fiscal years ended March 31, 2009, 2010 and 2011 have been derived from our consolidated financial statements and related notes thereto, which have been audited by Ernst & Young LLP, an independent registered public accounting firm, and are included elsewhere in this prospectus. The financial information for the years ended March 31, 2007 and 2008 have also been derived from financial statements audited by Ernst & Young LLP. The period from April 1, 2006 to July 21, 2006 includes the accounts of RBS Global prior to the acquisition by Apollo. The period from July 22, 2006 to March 31, 2007 includes the accounts of RBS Global after the Apollo acquisition. These two periods account for our fiscal year ended March 31, 2007. We refer to the financial statements prior to the Apollo acquisition as “Predecessor.” The following information should be read in conjunction with “Management’s Discussion and Analysis of Financial Condition and Results of Operations” and our consolidated financial statements and related notes thereto included elsewhere in this prospectus.
| Predecessor (1) | Successor | |||||||||||||||||||||||||||
(dollars in millions, except share and per share amounts) | Period from April 1, 2006 through July 21, 2006 | Period from July 22, 2006 through March 31, 2007 (2) | Year Ended March 31, 2008 (3) (4) | Year Ended March 31, 2009 (4) (5) | Year Ended March 31, 2010 (4) | Year Ended March 31, 2011 | ||||||||||||||||||||||
Statement of Operations: | ||||||||||||||||||||||||||||
Net Sales | $ | 334.2 | $ | 921.5 | $ | 1,853.5 | $ | 1,882.0 | $ | 1,510.0 | $ | 1,699.6 | ||||||||||||||||
Cost of Sales | 237.7 | 628.2 | 1,250.4 | 1,290.1 | 994.4 | 1,102.8 | ||||||||||||||||||||||
Gross Profit | 96.5 | 293.3 | 603.1 | 591.9 | 515.6 | 596.8 | ||||||||||||||||||||||
Selling, General and Administrative Expenses | 63.1 | 159.3 | 313.3 | 467.8 | 297.7 | 329.1 | ||||||||||||||||||||||
Loss on Divestiture (6) | — | — | 11.2 | — | — | — | ||||||||||||||||||||||
(Gain) on Canal Street Facility Accident, net (7) | — | (6.0 | ) | (29.2 | ) | — | — | — | ||||||||||||||||||||
Intangible Impairment Charges | — | — | — | 422.0 | — | — | ||||||||||||||||||||||
Transaction-Related Costs (8) | 62.7 | — | — | — | — | — | ||||||||||||||||||||||
Restructuring and Other Similar Costs | — | — | — | 24.5 | 6.8 | — | ||||||||||||||||||||||
Amortization of Intangible Assets | 5.0 | 26.9 | 49.9 | 48.9 | 49.7 | 48.6 | ||||||||||||||||||||||
(Loss) Income from Operations | (34.3 | ) | 113.1 | 257.9 | (371.3 | ) | 161.4 | 219.1 | ||||||||||||||||||||
Non-Operating Income (Expense): | ||||||||||||||||||||||||||||
Interest Expense, net | (21.0 | ) | (109.8 | ) | (254.3 | ) | (230.4 | ) | (194.2 | ) | (180.8 | ) | ||||||||||||||||
Gain (Loss) on Debt Extinguishment | — | — | — | 103.7 | 167.8 | (100.8 | ) | |||||||||||||||||||||
Other (Expense) Income, net | (0.4 | ) | 5.7 | (5.3 | ) | (3.0 | ) | (16.4 | ) | 1.1 | ||||||||||||||||||
(Loss) Income Before Income Taxes | (55.7 | ) | 9.0 | (1.7 | ) | (501.0 | ) | 118.6 | (61.4 | ) | ||||||||||||||||||
(Benefit) Provision for Income Taxes | (16.1 | ) | 9.2 | (1.3 | ) | (72.0 | ) | 30.5 | (10.1 | ) | ||||||||||||||||||
Net (Loss) Income | $ | (39.6 | ) | $ | (0.2 | ) | $ | (0.4 | ) | $ | (429.0 | ) | $ | 88.1 | $ | (51.3 | ) | |||||||||||
Net (loss) Income per share: | ||||||||||||||||||||||||||||
Basic | ||||||||||||||||||||||||||||
Diluted | ||||||||||||||||||||||||||||
Weighted-average number of shares outstanding: | ||||||||||||||||||||||||||||
Basic | ||||||||||||||||||||||||||||
Effect of dilutive stock options | ||||||||||||||||||||||||||||
Diluted | ||||||||||||||||||||||||||||
Other Data: | ||||||||||||||||||||||||||||
Net Cash (Used for) Provided by: | ||||||||||||||||||||||||||||
Operating Activities | (4.4 | ) | 63.4 | 232.7 | 155.0 | 155.5 | 164.5 | |||||||||||||||||||||
Investing Activities | (15.7 | ) | (1,925.5 | ) | (121.6 | ) | (54.5 | ) | (22.0 | ) | (35.5 | ) | ||||||||||||||||
Financing Activities | 8.2 | 1,909.0 | (15.6 | ) | 36.6 | (161.5 | ) | (6.9 | ) | |||||||||||||||||||
Depreciation and Amortization of Intangible Assets | 19.0 | 63.0 | 104.1 | 109.6 | 109.3 | 106.1 | ||||||||||||||||||||||
Capital Expenditures | 11.7 | 28.0 | 54.9 | 39.1 | 22.0 | 37.6 | ||||||||||||||||||||||
40
| March 31, | ||||||||||||||||||||
| (dollars in millions) | 2007 | 2008 | 2009 | 2010 | 2011 | |||||||||||||||
Balance Sheet Data: | ||||||||||||||||||||
Cash and Cash Equivalents | $ | 58.2 | $ | 156.3 | $ | 287.9 | $ | 263.9 | $ | 391.0 | ||||||||||
Working Capital (9) | 368.5 | 447.1 | 555.2 | 481.9 | 483.6 | |||||||||||||||
Total Assets | 3,783.4 | 3,826.3 | 3,218.8 | 3,016.5 | 3,099.7 | |||||||||||||||
Total Debt (10) | 2,496.9 | 2,536.8 | 2,526.1 | 2,215.5 | 2,314.1 | |||||||||||||||
Stockholders’ Equity (Deficit) | 256.3 | 273.1 | (177.8 | ) | (57.5 | ) | (88.2 | ) | ||||||||||||
| (1) | Consolidated financial data for all periods subsequent to July 21, 2006 (the date of the Apollo acquisition) reflects the fair value of assets acquired and liabilities assumed as a result of that transaction. The comparability of the operating results for the periods presented is affected by the revaluation of the assets acquired and liabilities assumed on the date of the Apollo acquisition. |
| (2) | Consolidated financial data as of March 31, 2007 and for the period from July 22, 2006 through March 31, 2007 reflects the estimated fair value of assets acquired and liabilities assumed in connection with the Zurn acquisition on February 7, 2007. As a result, the comparability of the operating results for the periods presented is affected by the revaluation of the assets acquired and liabilities assumed on the date of both the Apollo and Zurn acquisitions. |
| (3) | Consolidated financial data as of and for the year ended March 31, 2008 reflects the estimated fair value of assets acquired and liabilities assumed in connection with the GA acquisition on January 31, 2008. As a result, the comparability of the operating results for the periods presented is affected by the revaluation of the assets acquired and liabilities assumed on the date of the GA acquisition. |
| (4) | Financial data for fiscal 2008 to 2010 has been adjusted for our voluntary change in accounting for actuarial gains and losses related to its pension and other postretirement benefit plans. The change in accounting did not have any impact on the financial data prior to fiscal 2008. See Note 2 to our audited consolidated financial statements included elsewhere in this prospectus. |
| (5) | Consolidated financial data as of and for the year ended March 31, 2009 reflects the estimated fair value of assets acquired and liabilities assumed in connection with the Fontaine acquisition on February 27, 2009. As a result, the comparability of the operating results for the periods presented is affected by the revaluation of the assets acquired and liabilities assumed on the date of the Fontaine acquisition. |
| (6) | On March 28, 2008, we sold a French subsidiary, Rexnord SAS, to members of our local management team for €1 (one Euro). This loss includes Rexnord SAS’s cash on hand of $2.5 million at March 28, 2008, that pursuant to the agreement was included with the net assets divested. |
| (7) | We recognized a net gain of $35.2 million related to an accident at our Canal Street (Wisconsin) facility from the date of the accident (December 6, 2006) through March 31, 2008. $14.2 million of the net gain represents the excess property insurance recoveries (at replacement value) over the write-off of tangible assets (at net book value) and other direct expenses related to the accident. The remaining $21.0 million gain is comprised of business interruption insurance recoveries. |
| (8) | Transaction-related costs represent expenses incurred in connection with the Apollo acquisition on July 21, 2006. |
| (9) | Represents total current assets less total current liabilities. |
| (10) | Total debt represents long-term debt plus the current portion of long-term debt. |
41
MANAGEMENT’S DISCUSSION AND ANALYSIS OF
FINANCIAL CONDITION AND RESULTS OF OPERATIONS
The following discussion of results of operations and financial condition covers periods prior to the acquisition of Fontaine-Alliance Inc. and affiliates (“Fontaine”). Our financial performance includes Fontaine subsequent to February 28, 2009. Accordingly, the discussion and analysis of fiscal 2009 does not fully reflect the impact of the Fontaine transaction. You should read the following discussion of our results of operations and financial condition together with the “Selected Financial Information” and all of our consolidated financial statements and related notes included elsewhere in this prospectus. Our fiscal year is the year ending March 31 of the corresponding calendar year. For example, our fiscal year 2011, means the period from April 1, 2010 to March 31, 2011. This discussion contains forward-looking statements and involves numerous risks and uncertainties, including, but not limited to, those described in the “Risk Factors” section of this prospectus. Actual results may differ materially from those contained in any forward-looking statements. See also “Cautionary Notice Regarding Forward-Looking Statements” found elsewhere in this prospectus.
The information contained in this section is provided as a supplement to the audited consolidated financial statements and the related notes included elsewhere in this prospectus to help provide an understanding of our financial condition, changes in our financial condition and results of our operations. This section is organized as follows:
Company Overview. This section provides a general description of our business.
Restructuring and Other Similar Costs. This section provides a description of the restructuring actions we executed to reduce operating costs and improve profitability.
Financial Statement Presentation. This section provides a brief description of certain items and accounting policies that appear in our financial statements and general factors that impact these items.
Critical Accounting Estimates. This section discusses the accounting policies and estimates that we consider to be important to our financial condition and results of operations and that require significant judgment and estimates on the part of management in their application.
Results of Operations. This section provides an analysis of our results of operations for uncertaintyour fiscal years ended March 31, 2009, 2010 and 2011, in each case as compared to the prior period’s performance.
Non-GAAP Financial Measure. This section provides an explanation of a certain Non-GAAP financial measure we use.
Covenant Compliance. This section provides a description of certain restrictive covenants with which our credit agreement and indentures require us to comply.
Liquidity and Capital Resources. This section provides an analysis of our cash flows for our fiscal years ended March 31, 2009, 2010 and 2011, as well as a discussion of our indebtedness and its potential effects on our liquidity.
Tabular Disclosure of Contractual Obligations. This section provides a discussion of our commitments as of March 31, 2011.
Quantitative and Qualitative Disclosures about Market Risk. This section discusses our exposure to potential losses arising from adverse changes in interest rates and commodity prices.
Company Overview
Rexnord is a growth-oriented, multi-platform industrial company with what we believe are leading market shares and highly trusted brands that serve a diverse array of global end-markets. Our heritage of innovation and specification have allowed us to provide highly engineered, mission critical solutions to customers for decades and affords us the privilege of having long-term, valued relationships with market leaders. We operate our
42
company in a disciplined way and RBS is our operating philosophy. Grounded in the spirit of continuous improvement, RBS creates a scalable, process-based framework that focuses on driving superior customer satisfaction and financial results by targeting world-class operating performance throughout all aspects of our business.
Restructuring and Other Similar Costs
Beginning with the quarter ended September 28, 2008, we executed certain restructuring actions to reduce operating costs and improve profitability. As the restructuring actions were substantially completed during fiscal 2010, we did not record any restructuring charges during the year ended March 31, 2011. Comparatively, we recorded restructuring charges of $24.5 million and $6.8 million for the years ended March 31, 2009 and 2010, respectively, primarily consisting of severance costs related to workforce reductions.
Financial Statement Presentation
The following paragraphs provide a brief description of certain items and accounting policies that appear in our financial statements and general factors that impact these items.
Net Sales. Net sales represent gross sales less deductions taken for sales returns and allowances and incentive rebate programs.
Cost of Sales. Cost of sales includes all costs of manufacturing required to bring a product to a ready for sale condition. Such costs include direct and indirect materials, direct and indirect labor costs, including fringe benefits, supplies, utilities, depreciation, insurance, pension and postretirement benefits, information technology costs and other manufacturing related costs.
The largest component of our cost of sales is cost of materials, which represented approximately 36% of net sales in fiscal 2011. The principal materials used in our Process & Motion Control manufacturing processes are commodities that are available from numerous sources and include sheet, plate and bar steel, castings, forgings, high-performance engineered plastics and a wide variety of other components. Within Water Management, we purchase a broad range of materials and components throughout the world in connection with our manufacturing activities. Major raw materials and components include bar steel, brass, castings, copper, forgings, high-performance engineered plastic, plate steel, resin, sheet plastic and zinc. We have a strategic sourcing program to significantly reduce the number of direct and indirect suppliers we use and to lower the cost of purchased materials.
The next largest component of our cost of sales is direct and indirect labor, which represented approximately 16% of net sales in fiscal 2011. Direct and indirect labor and related fringe benefit costs are susceptible to inflationary trends.
Selling, General and Administrative Expenses. Selling, general and administrative expenses primarily includes sales and marketing, finance and administration, engineering and technical services and distribution. Our major cost elements include salary and wages, fringe benefits, pension and postretirement benefits, insurance, depreciation, advertising, travel and information technology costs.
Critical Accounting Estimates
The methods, estimates and judgments we use in applying our critical accounting policies have a significant impact on the results we report in our consolidated financial statements. We evaluate our estimates and judgments on an on-going basis. We base our estimates on historical experience and on assumptions that we believe to be reasonable under the circumstances. Our experience and assumptions form the basis for our judgments about the carrying value of assets and liabilities that are not readily apparent from other sources. Actual results may vary from what we anticipate and different assumptions or estimates about the future could
43
change our reported results. Within the context of these critical accounting policies, we are not currently aware of any reasonably likely event that would result in materially different amounts being reported.
We believe the following accounting policies are the most critical to us in that they are important to our financial statements and they require our most difficult, subjective or complex judgments in the preparation of our consolidated financial statements.
Revenue recognition.Net sales are recorded upon transfer of title and risk of product loss to the customer. Net sales relating to any particular shipment are based upon the amount invoiced for the delivered goods less estimated future rebate payments and sales returns which are based upon historical experience. Revisions to these estimates are recorded in the period in which the facts that give rise to the revision become known. The value of returned goods during each of the years ended March 31, 2009, 2010 and 2011 was approximately 1.0% or less of net sales. Other than a standard product warranty, there are no other significant post-shipment obligations.
Receivables. Receivables are stated net of allowances for doubtful accounts of $9.6 million at March 31, 2010 and $5.3 million at March 31, 2011. On a regular basis, we evaluate our receivables and establish the allowance for doubtful accounts based on a combination of specific customer circumstances and historical write-off experience. Credit is extended to customers based upon an evaluation of their financial position. Generally, advance payment is not required. Credit losses are provided for in the consolidated financial statements and consistently have been within management’s expectations.
Inventory. Inventories are stated at the lower of cost or market. Market is determined based on estimated net realizable values. Approximately 70% of the Company’s total inventories as of March 31, 2010 and 2011 were valued using the “last-in, first-out” (LIFO) method. All remaining inventories are valued using the “first-in, first-out” (FIFO) method. The valuation of inventories includes material, labor and overhead and requires management to determine the amount of manufacturing variances to capitalize into inventories. We capitalize material, labor and overhead variances into inventories based upon estimates of key drivers, which generally include raw material purchases (for material variances), standard labor (for labor variances) and calculations of inventory turnover (for overhead variances).
In some cases we have determined a certain portion of our inventories are excess or obsolete. In those cases, we write down the value of those inventories to their net realizable value based upon assumptions about future demand and market conditions. If actual market conditions are less favorable than those projected by management, additional inventory write-downs may be required. The total write-down of inventories charged to expense was $17.2 million, $7.1 million, and $3.8 million, during fiscal 2009, 2010, and 2011, respectively. The reduction in inventory write-downs charged to expense in fiscal 2010 and 2011 relates to decreased levels of excess and obsolete inventory given the stabilization in market conditions that were the cause of significant destocking throughout fiscal 2009.
Impairment of intangible assets and tangible fixed assets. Our intangible assets and tangible fixed assets are held at historical cost, net of depreciation and amortization, less any provision for impairment.
Intangible assets are amortized over the shorter of their legal life or estimated useful life as follows:
| Trademarks and tradenames | No amortization (indefinite life) | |
Patents | 2 to 20 years | |
Customer Relationships | 3 to 15 years | |
Non-compete | 2 to 5 years |
44
Tangible fixed assets are depreciated to their residual values on a straight-line basis over their estimated useful lives as follows:
| Land | No depreciation | |
Buildings and improvements | 10 to 30 years | |
Machinery and equipment | 5 to 10 years | |
Computer hardware and software | 3 to 5 years |
An impairment review of specifically identifiable amortizable intangible or tangible fixed assets is performed if an indicator of impairment, such as an operating loss or cash outflow from operating activities or a significant adverse change in the business or market place, exists. Estimates of future cash flows used to test the asset for impairment are based on current operating projections extended to the useful life of the asset group and are, by their nature, subjective.
Our recorded goodwill and indefinite lived intangible assets are not amortized but are tested annually for impairment or whenever circumstances indicate that impairment may exist using a discounted cash flow methodology based on future business projections and a market value approach. The discount rate utilized within our impairment test is based upon the weighted average cost of capital of comparable public companies.
During the year ended March 31, 2009, the Company recorded a non-cash pre-tax impairment charge associated with goodwill and identifiable intangible assets of $422.0 million, of which $319.3 million related to goodwill impairment and $102.7 million related to other identifiable intangible asset impairments. See Note 8 to our audited consolidated financial statements included elsewhere in this prospectus for more information regarding the prior year impairment charge.
The Company expects to recognize amortization expense on the intangible assets subject to amortization of $47.9 million in fiscal year 2012, and $47.5 million in each of fiscal years 2013, 2014, 2015, and 2016.
Retirement benefits. We have significant pension and post-retirement benefit income and expense and assets/liabilities that are developed from actuarial valuations. These valuations include key assumptions regarding discount rates, expected return on plan assets, mortality rates, merit and promotion increases and the current health care cost trend rate. We consider current market conditions in selecting these assumptions. Changes in the related pension and post-retirement benefit income/costs or assets/liabilities may occur in the future due to changes in the assumptions and changes in asset values.
During the fourth quarter of fiscal 2011, we voluntarily changed our method of accounting for actuarial gains and losses related to our pension and other postretirement benefit plans. Previously, we recognized actuarial gains and losses as a component of Stockholders’ Equity on the consolidated balance sheets and amortized the actuarial gains and losses over participants’ average remaining service period, or average remaining life expectancy, when all or almost all plan participants are inactive, as a component of net periodic benefit cost if the unrecognized gain or loss exceeded 10 percent of the greater of the market-related value of plan assets or the plan’s projected benefit obligation at the beginning of the year (the “corridor”). Under the new method, the net actuarial gains or losses in excess of the corridor will be recognized immediately in operating results during the fourth quarter of each fiscal year (or upon any re-measurement date). Net periodic benefit costs recorded on a quarterly basis would continue to primarily be comprised of service and interest cost, amortization of unrecognized prior service cost and the expected return on plan assets. While the historical method of recognizing actuarial gains and losses was considered acceptable, we believe this method is preferable as it accelerates the recognition of actuarial gains and losses outside of the corridor. See Note 2 to our audited consolidated financial statements included elsewhere in this prospectus for a presentation of our operating results before and after the application of this accounting change.
45
The obligation for postretirement benefits other than pension also is actuarially determined and is affected by assumptions including the discount rate and expected future increase in per capita costs of covered postretirement health care benefits. Changes in the discount rate and differences between actual and assumed per capita health care costs may affect the recorded amount of the expense in future periods.
Income taxes. We are subject to income taxes recognized in accordancethe United States and numerous foreign jurisdictions. Significant judgment is required in determining our worldwide provision for income taxes and recording the related deferred tax assets and liabilities.
We assess our income tax positions and record tax liabilities for all years subject to examination based upon management’s evaluation of the facts and circumstances and information available at the reporting dates. For those income tax positions where it is more-likely-than-not that a tax benefit will be sustained upon the conclusion of an examination, we have recorded the largest amount of tax benefit having a cumulatively greater than 50% likelihood of being realized upon ultimate settlement with SFAS No. 109, Accountingthe applicable taxing authority, assuming that it has full knowledge of all relevant information. For those tax positions which do not meet the more-likely-than-not threshold regarding the ultimate realization of the related tax benefit, no tax benefit has been recorded in the financial statements. In addition, we have provided for Income Taxes. FIN 48 prescribesinterest and penalties, as applicable, and record such amounts as a recognition thresholdcomponent of the overall income tax provision.
We recognize deferred tax assets and measurement attribute forliabilities based on the differences between the financial statement recognitioncarrying amounts and measurementthe tax bases of assets and liabilities, net operating losses, tax credits and other carryforwards. We regularly review our deferred tax assets for recoverability and establish a valuation allowance based on historical losses, projected future taxable income and the expected timing of the reversals of existing temporary differences. As a result of this review, we have established a valuation allowance against substantially all of our deferred tax assets relating to foreign loss carryforwards, state net operating loss and foreign tax credit carryforwards.
Commitments and Contingencies. We are subject to proceedings, lawsuits and other claims related to environmental, labor, product and other matters. We are required to assess the likelihood of any adverse judgments or outcomes to these matters as well as potential ranges of probable losses. We determine the amount of reserves needed, if any, for each individual issue based on our professional knowledge and experience and discussions with legal counsel. The required reserves may change in the future due to new developments in each matter, the ultimate resolution of each matter or changes in approach, such as a change in settlement strategy.
Through acquisitions, we have assumed presently recorded and potential future liabilities relating to product liability, environmental and other claims. We have recorded reserves for claims related to these obligations when appropriate and, on certain occasions, have obtained the assistance of an independent actuary in the determination of those reserves. If actual experience deviates from our estimates, we may need to record adjustments to these liabilities in future periods.
Warranty Reserves. Reserves are recorded on our consolidated balance sheets to reflect our contractual liabilities relating to warranty commitments to our customers. We provide warranty coverage of various lengths and terms to our customers depending on standard offerings and negotiated contractual agreements. We record an estimate for warranty expense at the time of sale based on historical warranty return rates and repair costs. Should future warranty experience differ materially from our historical experience, we may be required to record additional warranty reserves which could have a material adverse effect on our results of operations in the period in which these additional reserves are required.
Environmental Liabilities. We accrue an estimated liability for each environmental matter when the likelihood of an unfavorable outcome is probable and the amount of loss associated with such unfavorable outcome is reasonably estimable. We presume that a matter is probable of an unfavorable outcome if (a) litigation has commenced or a claim has been asserted or if commencement of litigation or assertion of a tax position taken or expectedclaim is probable and (b) if we are somehow associated with the site. In addition, if the reporting entity has been named as a PRP, an unfavorable outcome is presumed.
46
Estimating environmental remediation liabilities involves an array of issues at any point in time. In the early stages of the process, cost estimates can be difficult to derive because of uncertainties about a variety of factors. For this reason, estimates developed in the early stages of remediation can vary significantly, and, in many cases, early estimates later require significant revision. The following are some of the factors that are integral to developing cost estimates:
The extent and types of hazardous substances at a site;
The range of technologies that can be used for remediation;
Evolving standards of what constitutes acceptable remediation; and
The number and financial condition of other PRPs and the extent of their responsibility for the remediation.
An estimate of the range of an environmental remediation liability typically is derived by combining estimates of various components of the liability, which themselves are likely to be takenranges. At the early stages of the remediation process, particular components of the overall liability may not be reasonably estimable. This fact does not preclude our recognition of a liability. Rather, the components of the liability that can be reasonably estimated are viewed as a surrogate for the minimum in the range of our overall liability. Estimated legal and consulting fees are included as a tax return. FIN 48component of our overall liability.
Asbestos Claims and Insurance for Asbestos Claims. As noted in Note 18 to our consolidated financial statements included elsewhere in this prospectus, certain Water Management subsidiaries are subject to asbestos litigation. As a result, we have recorded a liability for pending and potential future asbestos claims, as well as a receivable for insurance coverage of such liability. The valuation of our potential asbestos liability was based on the number and severity of future asbestos claims, future settlement costs, and the effectiveness of defense strategies and settlement initiatives.
The present estimate of our asbestos liability assumes (i) our continuous vigorous defense strategy will remain effective; (ii) new asbestos claims filed annually against Zurn will decline modestly through the next ten years; (iii) the values by disease will remain consistent with past experience and (iv) our insurers will continue to pay defense costs without eroding the coverage amounts of our insurance policies. Our potential asbestos liability could be adversely affected by changes in law and other factors beyond our control. Further, while our current asbestos liability is effectivebased on an estimate of claims through the next ten years, such liability may continue beyond that time period and such liability could be substantial.
We estimate that our available insurance to cover our potential asbestos liability as of the end of fiscal 2011 is greater than our potential asbestos liability. This conclusion was reached after considering our experience in asbestos litigation, the insurance payments made to date by our insurance carriers, existing insurance policies, the industry ratings of the insurers and the advice of insurance coverage counsel with respect to applicable insurance coverage law relating to the terms and conditions of those policies. We used these same considerations when evaluating the recoverability of our receivable for insurance coverage of potential asbestos claims.
Results of Operations
Fiscal Year Ended March 31, 2011 Compared with the Fiscal Year Ended March 31, 2010
Net Sales
(in Millions)
| Fiscal Year Ended | ||||||||||||||||
| March 31, 2010 | March 31, 2011 | Change | % Change | |||||||||||||
Process & Motion Control | $ | 1,003.7 | $ | 1,175.1 | $ | 171.4 | 17.1 | % | ||||||||
Water Management | 506.3 | 524.5 | 18.2 | 3.6 | % | |||||||||||
Consolidated | $ | 1,510.0 | $ | 1,699.6 | $ | 189.6 | 12.6 | % | ||||||||
47
Process & Motion Control
Process & Motion Control net sales for the year ended March 31, 2011 increased 17.1% from the prior year to $1,175.1 million. Core net sales, which excludes foreign currency fluctuations, increased by 17.5% year-over-year driven by solid international growth, improved demand in our North America end-markets and market share gains across many of our products.
Water Management
Water Management net sales for the year ended March 31, 2011 increased 3.6% from the prior year to $524.5 million. Core net sales, which excludes the foreign currency fluctuations, increased by 3.1% year-over-year as a result of targeted market share gains and growth in alternative markets, which more than offset the overall decline in the core infrastructure and non-residential construction markets, which we estimate to be down 15% year-over-year based on McGraw Hill construction data.
Income from Operations
(in Millions)
| Fiscal Year Ended | ||||||||||||
| March 31, 2010 | March 31, 2011 | Change | ||||||||||
Process & Motion Control | $ | 116.5 | $ | 181.1 | $ | 64.6 | ||||||
% of net sales | 11.6 | % | 15.4 | % | 3.8 | % | ||||||
Water Management | 76.1 | 69.4 | (6.7 | ) | ||||||||
% of net sales | 15.0 | % | 13.2 | % | (1.8 | %) | ||||||
Corporate | (31.2 | ) | (31.4 | ) | (0.2 | ) | ||||||
Consolidated | $ | 161.4 | $ | 219.1 | $ | 57.7 | ||||||
% of net sales | 10.7 | % | 12.9 | % | 2.2 | % | ||||||
Process & Motion Control
Process & Motion Control income from operations for the year ended March 31, 2011 increased 55.5% to $181.1 million compared to fiscal years that begin after December 15, 2006. 2010. Income from operations as a percent of net sales increased 380 basis points from the prior year to 15.4%. The improvement in fiscal 2011 operating margin is primarily the result of our improved operating leverage on higher year-over-year net sales volume, productivity gains and cost reduction actions, partially offset by higher material costs and targeted investments in new product development and global growth capabilities.
Water Management
Water Management income from operations for the year ended March 31, 2011 declined 8.8% to $69.4 million compared to fiscal 2010. Income from operations as a percent of net sales decreased 180 basis points from the prior year to 13.2%. The decline in fiscal 2011 operating margin is primarily the result of higher year-over-year material costs and the impact of profit variability within certain water and wastewater project shipments in the current year compared to the prior year as well as investments in new product development and growth initiatives.
48
Corporate
Corporate expenses increased by $0.2 million from $31.2 million in fiscal 2010 to $31.4 million in fiscal 2011.
Interest Expense, Net.Interest expense, net was $194.2 million during the year ended March 31, 2010 compared to $180.8 million during the year ended March 31, 2011. The year-over-year reduction in interest expense is primarily the result of the lower weighted average fixed borrowing rates on our senior notes, partially offset by a slight increase in average debt outstanding as a result of the incremental notes issued in connection with the April 2010 refinancing.
Gain (Loss) on Debt Extinguishment. During fiscal 2010, we recorded a $167.8 million gain on debt extinguishment as a result of the purchase and extinguishment of a portion of our PIK toggle senior indebtedness and our April 2009 debt exchange offer. During fiscal 2011, we recorded a $100.8 million loss on debt extinguishment as a result of our early repayment of debt in April 2010 pursuant to cash tender offers. The $100.8 million charge was comprised of a bond tender premium paid to the lender and the non-cash write-off of deferred financing fees and net original issuance discount.
Purchase and Extinguishment of a Portion of PIK Toggle Senior Indebtedness
During fiscal 2010, we purchased and extinguished $67.4 million of outstanding face value PIK toggle senior indebtedness due 2013 for $36.5 million in cash. As a result, we recognized a $30.3 million gain during the year ended March 31, 2010, which was measured based on the difference between the cash paid and the net carrying amount of the debt (the net carrying amount of the debt included unamortized original issue discount of $0.6 million, unamortized debt issuance costs of $0.6 million, and $0.3 million of accrued interest) along with the forgiveness of $0.4 million of accrued interest.
Debt Exchange
During fiscal 2010, we completed an exchange offer by which (i) approximately $71.0 million principal amount of 8.875% Senior Notes due 2014 (the “8.875% Notes”), (ii) approximately $235.7 million principal amount of PIK Toggle Notes, and (iii) approximately $7.9 million principal amount of PIK Toggle Loans were exchanged for $196.3 million of aggregate principal of 9.50% Senior Notes due 2014 (the “2009 9.50% Notes”) (excluding a net original issue discount of $20.6 million).
The Company has adopted FIN 48 as of April 1, 2007, as required.accounted for the debt exchange transaction pursuant to ASC 470-50Debt Modifications and Extinguishments (“ASC 470-50”). As a result of the adoption of FIN 48,debt exchange, the Company recognized a $5.5gain of $137.5 million on the extinguishment of 8.875% Notes, PIK Toggle Notes and PIK Toggle Loans. The gain on extinguishment of $137.5 million relates to the extinguishment of $235.7 million of outstanding face value 8.875% Notes and PIK Toggle Notes and $7.9 million of outstanding face value of PIK Toggle Loans and is measured based on the difference between the fair market value of the 9.50% Notes issued of $104.5 million and the net carrying amount of the debt (the net carrying amount of the debt includes unamortized original issue discount of $2.5 million, unamortized debt issuance costs of $2.2 million and $3.1 million of accrued interest).
Tender Offer and Note Issuance
During fiscal 2011, we purchased by means of cash tender offers and extinguished $794.1 million of 9.50% Senior Notes due 2014 issued in 2006 (the “2006 9.50% Notes”), $196.3 million of 2009 9.50% Notes and $77.0 million of 8.875% Notes, and issued $1,145.0 million of 8.50% Senior Notes due 2018 (the “8.50% Notes”). We accounted for the cash tender offers and the issuance of the 8.50% Notes in accordance with ASC 470-50. Pursuant to this guidance, the cash tender offers were accounted for as an extinguishment of debt. In connection with the note offering, we incurred an increase in long-term debt of approximately $89.5 million, and we also recognized a $100.8 million loss on the debt extinguishment, which was comprised of a bond tender premium paid to lenders, as well as the non-cash write-off of deferred financing fees and net original issue discount associated with the extinguished debt. Additionally, we capitalized
49
approximately $14.6 million of third party transaction costs, which are being amortized over the life of the 8.50% Notes as interest expense using the effective interest method. Below is a summary of the transaction costs and other offering expenses recorded along with their corresponding pre-tax financial statement impact (in millions):
| Financial Statement Impact | ||||||||||||||||
| Balance Sheet -Debit (Credit) | Statement of Operations | |||||||||||||||
| Deferred Financing Costs (1) | Original Issue Discount (2) | Expense (3) | Total | |||||||||||||
Cash transaction costs: | ||||||||||||||||
Third party transaction costs | $ | 14.6 | $ | — | $ | — | $ | 14.6 | ||||||||
Bond tender premiums (paid to lenders) | — | — | 63.5 | 63.5 | ||||||||||||
Total expected cash transaction costs | 14.6 | — | 63.5 | $ | 78.1 | |||||||||||
Non-cash write-off of unamortized amounts: | ||||||||||||||||
Deferred financing costs | (25.4 | ) | — | 25.4 | ||||||||||||
Net original issue discount | — | (11.9 | ) | 11.9 | ||||||||||||
Net financial statement impact | $ | (10.8 | ) | $ | (11.9 | ) | $ | 100.8 | ||||||||
| (1) | Recorded as a component of other assets within the consolidated balance sheet. |
| (2) | Recorded as a reduction in the face value of long-term debt within the consolidated balance sheet. |
| (3) | Recorded as a component of other non-operating expense within the consolidated statement of operations. |
Other Income (Expense), Net.Other expense, net for the year ended March 31, 2010 was $16.4 million, which consisted of management fee expense of $3.0 million, transaction costs associated with a debt exchange offer of $6.0 million, foreign currency transaction losses of $4.3 million and other net miscellaneous expenses of $3.1 million. Other income, net for the year ended March 31, 2011 was $1.1 million, which consisted of management fee expense of $3.0 million, income in unconsolidated affiliates of $4.1 million (including a $3.4 million gain recorded as a result of our step acquisition of 100% of the voting shares in Mecánica Falk on August 31, 2010), foreign currency transaction gains of $1.5 million and other net miscellaneous expenses of $1.5 million.
Provision (Benefit) for Income Taxes.The income tax provision in fiscal 2010 was $30.5 million or an effective tax rate of 25.7%. The provision recorded differs from the statutory rate mainly due to the effect of the income tax benefit recognized as a result of a decrease into the liability for unrecognized tax benefits associated with the conclusion of the Internal Revenue Service (“IRS”) examination and certain benefits provided under a new Brazilian tax settlement program. The income tax benefit in fiscal 2011 was $(10.1) million or an offsetting reductioneffective tax rate of 16.4%. The benefit recorded differs from the U.S. federal statutory rate mainly due to goodwill. Further discussion regarding the adoptioneffect of FIN 48 canthe increase in the valuation allowance related to foreign tax credit carryforwards for which such realization is not deemed to be found in notemore-likely-than-not. See Note 16 to our audited consolidated financial statements included elsewhere in this prospectus.prospectus for information on income taxes.
In September 2006,Net Income (Loss).The net income recorded in fiscal 2010 was $88.1 million compared to a net loss of $51.3 million in fiscal 2011 due to the FASB issued SFAS No. 157,factors described above.
Fair Value MeasurementsFiscal Year Ended March 31, 2010 Compared with the Fiscal Year Ended March 31, 2009 (“SFAS 157”)
Net Sales
(dollars in Millions)
| Fiscal Year Ended | ||||||||||||||||
| March 31, 2009 | March 31, 2010 | Change | % Change | |||||||||||||
Process & Motion Control | $ | 1,321.7 | $ | 1,003.7 | $ | (318.0 | ) | (24.1 | )% | |||||||
Water Management | 560.3 | 506.3 | (54.0 | ) | (9.6 | )% | ||||||||||
Consolidated | $ | 1,882.0 | $ | 1,510.0 | $ | (372.0 | ) | (19.8 | )% | |||||||
50
Process & Motion Control
Process & Motion Control net sales decreased $318.0 million, or 24.1%, as amended in February 2008 by FSP FAS 157-2,Effective Date of FASB Statement No. 157.The provisions of SFAS 157 were effectivefrom $1,321.7 million for the Company as of April 1, 2008. However, FSP FAS 157-2 deferredyear ended March 31, 2009 to $1,003.7 million for the effective date for all nonfinancial assets and liabilities, except those recognizedyear ended March 31, 2010. Excluding foreign currency fluctuations, year-over-year core net sales decreased by $316.4 million, or disclosed at fair value on an annual or more frequent basis, until April 1, 2009. SFAS 157 defines fair value, creates a framework for measuring fair value in generally accepted accounting principles and expands disclosures about fair value measurements. The Company adopted SFAS 157 on April 1, 2008; see note 1023.9%, which is attributable to the condensedimpact the economic downturn has had on our end-markets.
Water Management
Water Management net sales decreased $54.0 million, or 9.6%, from $560.3 million for the year ended March 31, 2009 to $506.3 million for the year ended March 31, 2010. Excluding foreign currency fluctuations, year-over-year core net sales decreased by $52.3 million, or 9.3%, which is attributable to softness within our commercial and residential construction end-markets as well as certain segments of our infrastructure end-markets. These declines were partially offset by an increase in year-over-year net sales in our water and wastewater treatment markets.
Income (loss) from Operations
(in Millions)
| Fiscal Year Ended | ||||||||||||
| March 31, 2009 | March 31, 2010 | Change | ||||||||||
Process & Motion Control | $ | 15.6 | $ | 116.5 | $ | 100.9 | ||||||
% of net sales | 1.2 | % | 11.6 | % | 10.4 | % | ||||||
Water Management | (212.8 | ) | 76.1 | 288.9 | ||||||||
% of net sales | (38.0 | )% | 15.0 | % | 53.0 | % | ||||||
Corporate | (174.1 | ) | (31.2 | ) | 142.9 | |||||||
Consolidated | $ | (371.3 | ) | $ | 161.4 | $ | 532.7 | |||||
% of net sales | (19.7 | )% | 10.7 | % | 30.4 | % | ||||||
Process & Motion Control
Process & Motion Control income from operations for the year ended March 31, 2009 was $15.6 million compared to income from operations of $116.5 million during the year ended March 31, 2010. The comparability of our year-over-year results has been significantly impacted by the $149.0 million impairment charge taken on our goodwill and other identifiable intangible assets during the year ended March 31, 2009. In addition, income from operations for the year ended March 31, 2009 included $16.5 million of restructuring expenses, compared to restructuring expense of $6.3 million during the year ended March 31, 2010. Excluding the impact of the impairment charge and restructuring expenses, income from operations would have decreased $58.3 million, or 32.2%, and income from operations as a percent of net sales would have declined by 150 basis points to 12.2% of net sales during the year ended March 31, 2010 versus the comparable prior year period. The remaining decline in income from operations as a percent of net sales was primarily driven by the unfavorable impact of lower year-over-year net sales, partially offset by productivity gains, cost reduction initiatives and lower material prices.
Water Management
Water Management loss from operations was $212.8 million for the year ended March 31, 2009 compared to $76.1 million of income from operations for the year ended March 31, 2010. The comparability of our year-over-year results has been significantly impacted by the $273.0 million impairment charge taken on our goodwill and other identifiable intangible assets during the year ended March 31, 2009. In addition, income from operations for the year ended March 31, 2009 included $7.8 million of restructuring expenses, compared to restructuring expense of $0.5 million during the year ended March 31, 2010. Excluding the impact of impairment
51
charges and restructuring expenses, income from operations would have increased $8.6 million, or 12.6%, and income from operations as a percent of net sales would have expanded by 300 basis points to 15.1% of sales for the year ended March 31, 2010 versus the comparable prior year period as cost reduction actions, lower material prices and productivity gains more than offset the unfavorable impact of lower sales.
Corporate
Corporate expenses decreased by $142.9 million from $174.1 million during the year ended March 31, 2009 to $31.2 million during the year ended March 31, 2010. The comparability of corporate expenses is primarily attributable to a net reduction in actuarial losses related to our pension and other postretirement benefit plans recognized year-over-year.
Interest Expense, Net.Interest expense, net was $230.4 million and $194.2 million in fiscal 2009 and fiscal 2010, respectively. The decrease in interest expense is due to the lower year-over-year weighted-average outstanding indebtedness (resulting from the completion of our debt exchange offer during the first quarter of fiscal 2010 and various purchases and extinguishments of our PIK toggle senior indebtedness, beginning in the third quarter of fiscal 2009) as well as the lower relative variable rate borrowing costs year-over-year.
Gain on Debt Extinguishment. During fiscal 2009, the Company recorded a $103.7 million gain on debt extinguishment as a result of the purchase and extinguishment of a portion of our PIK toggle senior indebtedness. During fiscal 2010, the Company recorded a $167.8 million gain on debt extinguishment as a result of the purchase and extinguishment of a portion of our PIK toggle senior indebtedness and our April 2009 debt exchange offer.
During fiscal 2009, we purchased and extinguished $174.6 million of outstanding face value PIK toggle senior indebtedness due 2013 for $72.9 million in cash. As a result, we recognized a $103.7 million gain during the year ended March 31, 2009, which was measured based on the difference between the cash paid and the net carrying amount of the debt (the net carrying amount of the debt included unamortized original issue discounts of $2.0 million, unamortized debt issuance costs of $1.8 million and $5.8 million of accrued interest).
For more information regarding the gain on debt extinguishment for fiscal 2010, see “—Results of Operations—Fiscal Year Ended March 31, 2011 Compared with the Fiscal Year Ended March 31, 2010—Gain (Loss) on Debt Extinguishment.”
Other Expense, Net.Other expense, net for the year ended March 31, 2009 was $3.0 million, which consisted of management fee expense of $3.0 million, foreign currency transaction gains of $2.4 million and other net miscellaneous expenses of $2.4 million. Other expense, net for the year ended March 31, 2010 was $16.4 million, which consisted of management fee expense of $3.0 million, transaction costs associated with the debt exchange offer of $6.0 million, foreign currency transaction losses of $4.3 million and other net miscellaneous expenses of $3.1 million.
Provision (Benefit) for Income Taxes.The income tax benefit in fiscal 2009 was $(72.0) million or an effective tax rate of 14.4%. The benefit recorded differs from the statutory rate mainly due to the effect of approximately $304.8 million of nondeductible expenses relating to the impairment charges recorded in fiscal 2009 as a result of then-existing economic conditions. The income tax provision in fiscal 2010 was $30.5 million or an effective tax rate of 25.7%. The provision recorded differs from the U.S. federal statutory rate mainly due to the effect of the income tax benefit recognized as a result of a decrease to the liability for unrecognized tax benefits associated with the conclusion of the IRS examination and certain benefits provided under a new Brazilian tax settlement program. See Note 16 to our audited consolidated financial statements included elsewhere in this prospectus for disclosures requiredmore information on income taxes.
Net Income (Loss).The net loss recorded in fiscal 2009 was $429.0 million compared to net income of $88.1 million in fiscal 2010 due to the factors described above.
52
Non-GAAP Financial Measure
In addition to net (loss) income, we believe Adjusted EBITDA (as described below in “Covenant Compliance”) is an important measure under SFAS 157. our senior secured credit facilities, as our ability to incur certain types of acquisition debt or subordinated debt, make certain types of acquisitions or asset exchanges, operate our business and make dividends or other distributions, all of which will impact our financial performance, is impacted by our Adjusted EBITDA, as our lenders measure our performance by comparing the ratio of our net senior secured bank debt to our Adjusted EBITDA (see “Covenant Compliance” for additional discussion of this ratio). We reported Adjusted EBITDA of $335.7 million in fiscal 2011 and a net loss for the same period of $51.3 million.
Covenant Compliance
The Company has also elected a partial deferralcredit agreement and indentures that govern our notes contain, among other provisions, restrictive covenants regarding indebtedness, payments and distributions, mergers and acquisitions, asset sales, affiliate transactions, capital expenditures and the maintenance of SFAS 157certain financial ratios. Payment of borrowings under the provisionssenior secured credit facilities and indentures that govern our notes may be accelerated if there is an event of FSP FAS 157-2default. Events of default include the failure to pay principal and interest when due, a material breach of a representation or warranty, covenant defaults, events of bankruptcy and a change of control. Certain covenants contained in the credit agreement that governs our senior secured credit facilities restrict our ability to take certain actions, such as incurring additional debt or making acquisitions, if we are unable to meet certain maximum net senior secured bank debt to Adjusted EBITDA ratios and, with respect to our revolving facility, also require us to remain at or below a certain maximum net senior secured bank debt to Adjusted EBITDA ratio as of the end of each fiscal quarter. Certain covenants contained in the indentures that govern our notes restrict our ability to take certain actions, such as incurring additional debt or making acquisitions, if we are unable to achieve a minimum Adjusted EBITDA to Fixed Charges ratio. Under such indentures, our ability to incur additional indebtedness and our ability to make future acquisitions under certain circumstances requires us to have an Adjusted EBITDA to Fixed Charges ratio (measured on a last twelve months, or LTM, basis) of at least 2.0 to 1.0. Failure to comply with these covenants could limit our long-term growth prospects by hindering our ability to obtain future debt or make acquisitions.
“Fixed Charges” is defined in our indentures as net interest expense, excluding the amortization or write-off of deferred financing costs.
“Adjusted EBITDA” is defined in our credit facilities as net income, adjusted for the items summarized in the table below. Adjusted EBITDA is intended to show our unleveraged, pre-tax operating results and therefore reflects our financial performance based on operational factors, excluding non-operational, non-cash or non-recurring losses or gains. Adjusted EBITDA is not a presentation made in accordance with GAAP, and our use of the term Adjusted EBITDA varies from others in our industry. This measure should not be considered as an alternative to net income, income from operations or any other performance measures derived in accordance with GAAP. Adjusted EBITDA has important limitations as an analytical tool, and you should not consider it in isolation, or as a substitute for analysis of our results as reported under GAAP. For example, Adjusted EBITDA does not reflect: (a) our capital expenditures, future requirements for capital expenditures or contractual commitments; (b) changes in, or cash requirements for, our working capital needs; (c) the significant interest expenses, or the cash requirements necessary to service interest or principal payments, on our debt; (d) tax payments that represent a reduction in cash available to us; (e) any cash requirements for the assets being depreciated and amortized that may have to be replaced in the future; (f) management fees that may be paid to Apollo or its affiliates; or (g) the impact of earnings or charges resulting from matters that we and the lenders under our secured senior credit facilities may not consider indicative of our ongoing operations. In particular, our definition of Adjusted EBITDA allows us to add back certain non-cash, non-operating or non-recurring charges that are deducted in calculating net income, even though these are expenses that may recur, vary greatly and are difficult to predict and can represent the effect of long-term strategies as opposed to short-term results. In
53
addition, certain of these expenses can represent the reduction of cash that could be used for other corporate purposes. Further, although not included in the calculation of Adjusted EBITDA below, the measure may at times allow us to add estimated cost savings and operating synergies related to the measurement of fair value used when evaluating non-financial assets and liabilities.
In September 2006, the FASB released SFAS No. 158,Employers’ Accounting for Defined Benefit Pension and Other Postretirement Plans, an amendment of FASB Statements No. 87, 88, 106, and 132(R)(“SFAS 158”). Under the new standard, companies must recognize a net liability or asset to report the funded status of their defined benefit pension and other postretirement benefit plans on their balance sheets. SFAS 158 also requires companies to measure the funded status of plans asAs of the date of this prospectus, the Company’scalculation of Adjusted EBITDA under the credit agreement and indentures that govern our notes result in substantially identical amounts. However, the results of such calculations could differ in the future based on the different types of adjustments that may be included in such respective calculations at the time.
| (in millions) | Fiscal year ended March 31, 2011 | |||
Net loss | $ | (51.3 | ) | |
Interest expense, net | 180.8 | |||
Income tax benefit | (10.1 | ) | ||
Depreciation and amortization | 106.1 | |||
EBITDA | $ | 225.5 | ||
Adjustments to EBITDA: | ||||
Loss on extinguishment of debt (1) | 100.8 | |||
Stock option expense | 5.6 | |||
LIFO expense (2) | 4.9 | |||
Other income, net (3) | (1.1 | ) | ||
Subtotal of adjustments to EBITDA | $ | 110.2 | ||
Adjusted EBITDA | $ | 335.7 | ||
Fixed Charges of RBS Global, Inc. and subsidiaries (4) | $ | 166.0 | ||
Ratio of Adjusted EBITDA to Fixed Charges—RBS Global, Inc. and subsidiaries | 2.02 | x | ||
Net senior secured bank indebtedness (5) | $ | 388.1 | ||
Net senior secured bank leverage ratio (6) | 1.16 | x | ||
| (1) | The loss on extinguishment of debt is the result of the cash tender offer for notes that we completed during the first quarter of fiscal 2011. See Note 10 to our audited consolidated financial statements included elsewhere in this prospectus. |
| (2) | Last-in first-out (LIFO) inventory adjustments are excluded in calculating Adjusted EBITDA as defined in our senior secured credit facilities. |
| (3) | Other income, net for the fiscal year ended March 31, 2011, consists of management fee expense of $3.0 million, income in unconsolidated affiliates of $4.1 million (including a $3.4 million gain recorded as a result of our step acquisition of 100% of the voting shares in Mecánica Falk on August 31, 2010), foreign currency transaction gains of $1.5 million and other net miscellaneous expenses of $1.5 million. |
| (4) | The indentures governing our senior notes define fixed charges as interest expense excluding the amortization or write-off of deferred financing costs for the trailing four quarters. |
| (5) | Our senior secured credit facilities define net senior secured bank indebtedness as consolidated secured indebtedness for borrowed money, less unrestricted cash, which was $373.4 million (as defined by the senior secured credit facilities) at March 31, 2011. Net senior secured bank indebtedness reflected in the table consists of borrowings under our senior secured credit facilities. |
| (6) | The senior secured credit facilities define the net senior secured bank leverage ratio as the ratio of net senior secured bank debt to Adjusted EBITDA for the trailing four fiscal quarters. |
54
Liquidity and Capital Resources
Our primary source of liquidity is available cash and cash equivalents, cash flow from operations and borrowing availability under our $150.0 million revolving credit facility and our $100.0 million accounts receivable securitization program.
As of March 31, 2010, we had $263.9 million of cash and approximately $207.4 million of additional borrowing capacity ($118.6 million of available borrowings under our revolving credit facility and $88.8 million available under our accounts receivable securitization program). As of March 31, 2011, we had $391.0 million of cash and approximately $219.6 million of additional borrowings available to us ($121.7 million of available borrowings under our revolving credit facility and $97.9 million available under our accounts receivable securitization program). Both our revolving credit facility and accounts receivable securitization program are available to fund our working capital requirements, capital expenditures and other general corporate purposes. As of March 31, 2011, the available borrowings under our credit facility had been reduced by $28.3 million due to outstanding letters of credit. While we believe we have sufficient capital resources for our foreseeable needs, we regularly reassess those needs and resources to determine whether we require or would benefit from additional or different resources. However, we cannot assure that additional or different resources would be available on terms that we find acceptable or at all.
Indebtedness
As of March 31, 2011 we had $2,314.1 million of total indebtedness outstanding as follows (in millions):
| Total Debt at March 31, 2011 | Short-term Debt and Current Maturities of Long-Term Debt | Long-term Portion | ||||||||||
8.50% senior notes due 2018 | $ | 1,145.0 | $ | — | $ | 1,145.0 | ||||||
Term loans | 761.5 | 2.0 | 759.5 | |||||||||
11.75% senior subordinated notes due 2016 | 300.0 | — | 300.0 | |||||||||
PIK toggle senior indebtedness due 2013 (1) | 93.2 | 93.2 | — | |||||||||
8.875% senior notes due 2016 | 2.0 | — | 2.0 | |||||||||
Other | 12.4 | 9.0 | 3.4 | |||||||||
Total Debt | $ | 2,314.1 | $ | 104.2 | $ | 2,209.9 | ||||||
| (1) | Includes an unamortized bond issue discount of $0.4 million at March 31, 2011. On May 13, 2011, we prepaid $53.7 million in principal amount of this indebtedness, and have commenced procedures to extinguish the remaining balance of our PIK toggle senior indebtedness at face value in June 2011. |
At March 31, 2011, our outstanding debt was issued or guaranteed by Rexnord Corporation, RBS Global and various subsidiaries of RBS Global. Rexnord Corporation is the issuer of the PIK toggle senior indebtedness and RBS Global, as well as its wholly-owned subsidiary Rexnord LLC, are the co-issuers of the term loans, senior notes and senior subordinated notes.
For a description of our outstanding indebtedness, see “Description of Indebtedness” elsewhere in this prospectus.
Off-Balance Sheet Arrangements
We do not have any off-balance sheet or unconsolidated special-purpose entities.
55
Cash Flows
Net cash provided by operating activities in fiscal 2010 was $155.5 million compared to $164.5 million in fiscal 2011, representing a $9.0 million increase year-over-year. The improvement in cash provided by operating activities was driven by $53.9 million of incremental cash generated on $189.6 million of higher year-over-year net sales, an $18.2 million reduction in year-over-year cash interest payments, and a $14.2 million reduction in year-over-year cash restructuring payments. That increase was partially offset by a $77.3 million increase in trade working capital (accounts receivable, inventories and accounts payable) as a result of the year-over-year change in sales volume.
Net cash provided by operating activities in fiscal 2009 was $155.0 million compared to $155.5 million in fiscal 2010. Fiscal 2010 cash provided by operating activities includes an incremental $6.0 million of transaction costs associated with our April 2009 debt exchange offer and $16.5 million of restructuring payments, compared to $5.7 million cash restructuring payments during fiscal 2009. Excluding the incremental transaction and restructuring payments, cash flow from operations improved by $17.3 million. Decreases in trade working capital (accounts receivable, inventories and accounts payable) contributed a $62.3 million source of cash year-over-year. The remaining decline in operating cash flow is due to the impact of $372.0 million of lower net sales, partially offset by the cash savings generated from our restructuring initiatives year-over-year.
Cash used for investing activities was $22.0 million during fiscal 2010 compared to $35.5 million during fiscal 2011. The year-over-year increase in cash used for investing activities relates to a $15.6 million increase in capital expenditures partially offset by the net cash acquired in connection with the acquisition of Mecánica Falk (excluding a $6.1 million seller-financed note payable assumed in connection with the acquisition) and $0.9 million of cash proceeds received in connection with the sale of our 9.5% interest in a non-core joint venture within our Water Management platform.
Cash used for investing activities was $54.5 million during fiscal 2009 compared to $22.0 million during fiscal 2010. The year-over-year decrease in cash used for investing activities is primarily due to lower capital expenditures as we aligned our capital expenditures with current sales volume at that time as well as the fiscal 2009 acquisition of Fontaine.
Cash used for financing activities was $161.5 million during fiscal 2010 compared to a use of $6.9 million during fiscal 2011. The cash used for financing activities during fiscal 2011 consisted of a source of cash from the issuance of $1,145.0 million of 8.50% Notes, the proceeds of which were utilized to retire $1,067.4 million of previously outstanding senior notes, pay the $63.5 million tender premium to holders of the retired senior notes as well as $14.6 million of related debt issue costs. Additionally, during fiscal 2011 we made repayments of $3.7 million of other long-term debt (including a $2.0 million payment on our term loan and a $0.9 million payment to redeem 100% of our then outstanding 9.50% Notes), $0.8 million of net short-term borrowings and repayments at various foreign subsidiaries ($2.0 million of borrowings and $2.8 million of repayments). The current year end.also includes a $1.0 million use for the purchase of common stock and a $1.4 million use for the payments in connection with stock option exercises.
Cash provided by financing activities was $36.6 million during fiscal 2009 compared to a use of $161.5 million during fiscal 2010. The Company adoptedcash used for financing activities during fiscal 2010 consisted of a $36.5 million payment made to retire a portion of our outstanding PIK toggle senior indebtedness due 2013, financing fee payments of $4.9 million associated with our April 2009 debt exchange offer, $116.1 million of long-term debt repayments (comprised of $82.7 million on our revolving credit facility, $30.0 million on our accounts receivable facility, $2.0 million of mandatory repayments on our term loans and $1.4 million on all other debt) and repayments of $2.8 million on miscellaneous short-term debt. Fiscal 2010 also included a $0.4 million use of cash for the fundingpurchase of common stock and disclosure requirements$1.5 million of SFAS 158cash used to cancel stock options.
56
Tabular Disclosure of Contractual Obligations
The table below lists our contractual obligations, as of March 31, 2008. The measurement provisions2011, by period:
| Payments Due by Period | ||||||||||||||||||||
| (in millions) | Total | Less than 1 Year | 1-3 Years | 3-5 Years | More than 5 Years | |||||||||||||||
8.50% senior notes due 2018 | $ | 1,145.0 | $ | — | $ | — | $ | — | $ | 1,145.0 | ||||||||||
Term loans | 761.5 | 2.0 | 759.5 | — | — | |||||||||||||||
11.75% senior subordinated notes due 2016 | 300.0 | — | — | — | 300.0 | |||||||||||||||
PIK toggle senior indebtedness due 2013 (1) | 93.2 | 93.2 | — | — | — | |||||||||||||||
8.875% senior notes due 2016 | 2.0 | — | — | — | 2.0 | |||||||||||||||
Other long-term debt | 12.4 | 9.0 | 2.2 | 0.5 | 0.7 | |||||||||||||||
Interest on long-term debt obligations | 932.5 | 158.1 | 293.8 | 265.5 | 215.1 | |||||||||||||||
Purchase commitments | 174.3 | 165.0 | 9.3 | — | — | |||||||||||||||
Operating lease obligations | 50.4 | 15.1 | 18.0 | 8.8 | 8.5 | |||||||||||||||
Pension and post retirement plans (2) | 93.7 | 14.8 | 35.9 | 43.0 | n/a | |||||||||||||||
Totals | $ | 3,565.0 | $ | 457.2 | $ | 1,118.7 | $ | 317.8 | $ | 1,671.3 | ||||||||||
| (1) | Includes unamortized original issue discount of $0.4 million at March 31, 2011. On May 13, 2011, we prepaid $53.7 million in principal amount of this indebtedness, and have commenced procedures to redeem the remaining balance of our PIK toggle senior indebtedness at face value in June 2011. |
| (2) | Represents expected pension and post retirement contributions and benefit payments to be paid directly by the Company. Contributions and benefit payments beyond fiscal 2016 cannot be reasonably estimated. |
Our pension and postretirement benefit plans are discussed in detail in Note 15 of SFAS 158 were adopted on April 1, 2008. Upon adoption, the Company recorded an increase to retained earnings of $2.2 million ($1.3 million, net of tax). See note 15 to our audited consolidated financial statements and note 12 to our condensed consolidated financial statements included elsewhere in this prospectusprospectus. The pension plans cover most of our employees and provide for monthly pension payments to eligible employees upon retirement. Other postretirement benefits consist of retiree medical plans that cover a portion of employees in the incremental effectsUnited States that meet certain age and service requirements and other postretirement benefits for employees at certain foreign locations. See “Risk Factors—Our required cash contributions to our pension plans may increase further and we could experience a material change in the funded status of adopting SFAS 158.
In February 2007,our defined benefit pension plans and the FASB issued SFAS No. 159,The Fair Value Option for Financial Assets and Financial Liabilities (“SFAS 159”), which permits all entities to choose to measure eligible items at fair value on specified election dates. The associated unrealized gains and losses on the items for which the fair value option has been elected shall be reported in earnings. SFAS 159 became effective for the Company as of April 1, 2008; however, the Company has not elected to utilize the fair value option on any of its financial assets or liabilities under the scope of SFAS 159.
In December 2007, the FASB issued SFAS No. 160,Noncontrolling Interests in Consolidated Financial Statements—an amendment of ARB No. 51 (“SFAS 160”). SFAS 160 requires a company to clearly identify and present ownership interests in subsidiaries held by parties other than the companyamount recorded in our consolidated financial statements withinbalance sheets related to those plans. Additionally, our pension costs could increase in future years.”
Quantitative and Qualitative Disclosures about Market Risk
We are exposed to market risk during the equity section but separatenormal course of business from the company’s equity. It also requires the amount of consolidated net income attributable to the parent and to the noncontrolling interest be clearly identified and presented on the face of the consolidated statement of operations; changes in ownershipforeign currency exchange rates and interest be accounted for similarly, as equity transactions;rates. The exposure to these risks is managed through a combination of normal operating and when a subsidiary is deconsolidated, any retained noncontrolling equity investmentfinancing activities and derivative financial instruments in the former subsidiaryform of foreign exchange forward contracts and the gain or loss on the deconsolidation of the subsidiary be measured at fair value. This statement is effective for fiscal years,interest rate swaps to cover known foreign exchange transactions and interim periods within those fiscal years, beginning on or after December 15, 2008, and earlier application is prohibited. The Company is currently evaluating the requirements of SFAS 160 and does not expect adoption of SFAS 160 will have a material impact on its financial statements.interest rate fluctuations.
In December 2007, the FASB issued SFAS No. 141(R),Business Combinations (“SFAS 141(R)”). The objective of SFAS 141(R) is to improve the information provided in financial reports about a business combination and its effects. SFAS 141(R) states that all business combinations (whether full, partial or step acquisitions) must apply the “acquisition method.” In applying the acquisition method, the acquirer must determine the fair value of the acquired business as of the acquisition date and recognize the fair value of the acquired assets and liabilities assumed. As a result, it will require that certain forms of contingent consideration and certain acquired contingencies be recorded at fair value at the acquisition date. SFAS 141(R) also states acquisition costs will generally be expensed as incurred and restructuring costs will be expensed in periods after the acquisition date. This statement is effective for business combination transactions for which the acquisition date is on or after April 1, 2009, and earlier application is prohibited. The Company is currently evaluating the requirements of SFAS 141(R) and will apply the statement to any acquisitions after March 31, 2009.
In March 2008, the FASB issued SFAS No. 161,Disclosures about Derivative Instruments and Hedging Activities-an amendment of FASB Statement No. 133 (“SFAS 161”).This Statement changes the disclosure requirements for derivative instruments and hedging activities. Entities are required to provide enhanced disclosures about (a) how and why an entity uses derivative instruments, (b) how derivative instruments and related hedged items are accounted for under Statement 133 and its related interpretations, and (c) how derivative instruments and related hedged items affect an entity’s financial position, financial performance, and cash flows. This statement is effective for financial statements issued for fiscal years and interim periods beginning after November 15, 2008. The Company is currently reviewing the requirements of SFAS 161 to determine the impact on its financial statements.
Our Company
We believe we areRexnord is a leading, globalgrowth-oriented, multi-platform industrial company strategically positionedwith what we believe are leading market shares and highly trusted brands that serve a diverse array of global end-markets. Our heritage of innovation and specification have allowed us to provide highly engineered, mission critical solutions to customers for decades and affords us the privilege of having long-term, valued relationships with market leaders. We operate our company in a disciplined way and the Rexnord Business System (“RBS”) is our operating philosophy. Grounded in the spirit of continuous improvement, RBS creates a scalable, process-based framework that focuses on driving superior customer satisfaction and financial results by targeting world-class operating performance throughout all aspects of our business.
Our strategy is to build the Company around multiple, global strategic platforms that participate in end-markets with sustainable growth characteristics where we are, or have the opportunity to become, the industry leader. We have a track record of acquiring and integrating companies and expect to continue to pursue strategic acquisitions within the marketsour existing platforms that will expand our geographic presence, broaden our product lines and industriesallow us to move into adjacent markets. Over time, we serve. Ouranticipate adding additional strategic platforms to our Company. Currently, our business is comprised of two strategic platforms: (i) Power Transmissionplatforms, Process & Motion Control and (ii) Water Management.
We believe that we have one of the broadest portfolioportfolios of highly engineered, mission and project-critical Power Transmissionproject critical Process & Motion Control products in the end markets we serve.industrial and aerospace end-markets. Our Power Transmission products includeProcess & Motion Control product portfolio includes gears, couplings, industrial bearings, flattop, aerospace bearings and seals, special components and industrialFlatTop™ modular belting, engineered chain and conveying equipment. OverOur Water Management platform is a leader in the past centurymulti-billion dollar, specification-driven, non-residential construction market for water management products. Through recent acquisitions, we have gained entry into the municipal water and wastewater treatment markets. Our Water Management product portfolio includes professional grade specification drainage products, flush valves and faucet products, backflow prevention pressure release valves, Pex piping and engineered valves and gates for the water and wastewater treatment market.
1
Our products are generally “specified” or requested by end-users across both of our strategic platforms as a result of their reliable performance in demanding environments, our custom application engineering capabilities and our ability to provide global customer support. Typically, our Process & Motion Control products are initially incorporated into products sold by original equipment manufacturers (“OEMs”) or sold to end-users as critical components in large, complex systems where the cost of failure or downtime is high and thereafter replaced through industrial distributors as they are consumed or require replacement.
The demand for our Water Management platform has established itself as an innovatorproducts is primarily driven by new infrastructure, the retro-fit of existing structures to make them more energy and leading designer, manufacturer and distributor of highly engineered water products and solutions that deliver water conservation, safety and hygiene, treatment, and control & comfort to the infrastructure construction, consumer/businessefficient, commercial construction and, to a lesser extent, residential construction. We believe we have become a market leader in the residential construction end markets. Our highly engineered Water Management portfolio includes:industry by meeting the stringent third party regulatory, building and plumbing code requirements and subsequently achieving specification drainage, PEX, water control, commercial brassof our products check valves, butterfly valves, slide/sluice gatesinto projects and hydraulic actuation systems.applications.
We are led by an experienced, high-caliber management team that employs RBS as a proven operating system, Rexnord Business System, or RBS, modeled after the Danaher Business System,philosophy to drive excellence and world class performance in all aspects of our business by focusing on the “Voice of the Customer” while continuously improving our growth, quality, deliveryprocess and cost.ensuring superior customer satisfaction. Our global footprint encompasses 28 Power Transmission36 principal Process & Motion Control manufacturing, warehouse and four Power Transmission repair facilities located around the world and 2123 principal Water Management manufacturing and warehouse facilities in North America which allow us to meet the needs of our increasingly global customer base as well as our distribution channel partners.
We believe we have a sustainable competitive advantage in both of our platforms as a result of the following attributes:
We are a leading designer, manufacturer and marketer of highly-engineered, end-user and/or third-party specified products that are mission- or project-critical for applications where the cost of failure or downtime is high or there is a requirement to provide and enhance water quality, safety, flow control and conservation.
We believe our portfolio includes premier and widely known brands in the Process & Motion Control and Water Management markets in which we participate, as well as one of the broadest and most extensive product offerings.
We estimate that over 85% of our total net sales come from products in which we have leading market share positions.
We believe we have established a sustainable revenue profile. Within our Process & Motion Control platform, we have an extensive installed base of our products that provides us the opportunity to capture significant, recurring aftermarket revenues at attractive margins as a result of a “like-for-like” replacement dynamic. Within our Water Management platform, we pursue the retrofit of existing structures to improve water conservation and efficiency, thereby reducing our exposure to the new construction cycle.
We have extensive distribution networks in both of our platforms—in Process & Motion Control, we have over 2,600 distributor locations serving our customers globally and, in Water Management, we have more than 1,100 independent sales representatives across approximately 210 sales agencies that work directly with our in-house technical team to drive specification of our products.
We employ approximately 7,4006,300 employees and for ouracross 59 locations around the world. For the fiscal year ended March 31, 2008,2011, we generated net sales of $1.9$1.7 billion, income from operations of $219.1 million and a net loss of $51.3 million. Fiscal 2011 results reflect the effect of a $100.8 million loss on debt extinguishment recorded during the year as a result of the early repayment of debt pursuant to cash tender offers. We generated net sales of $1.5 billion, income from operations of $161.4 million and net income of $0.3$88.1 million for the fiscal year ended March 31, 2010. Fiscal 2010 results reflect the effect of a $167.8 million gain on debt extinguishment recorded during the year as a result of a repurchase and extinguishment of debt and a debt exchange offer.
2
In addition to net income (loss), we believe Adjusted EBITDA is an important measure under our senior secured credit facilities, as our ability to incur certain types of $382.7 million (which includes $8.6 millionacquisition debt or subordinated debt, make certain types of pro forma adjustmentsacquisitions or asset exchanges, operate our business and make dividends or other distributions, all of which will impact our financial performance, is impacted by our Adjusted EBITDA, as our lenders measure our performance by comparing the ratio of our senior secured bank debt to give full year effect to the acquisition of GA on January 31, 2008 and $8.3 million of recoveries related to the Canal Street facility accidentour Adjusted EBITDA. Adjusted EBITDA for the period from December 6, 2006 throughtwelve months ended March 31, 2007).2011 was $335.7 million. For the twelve months ended March 31, 2010, Adjusted EBITDA was $285.0 million. For more information on these and other adjustments and the limitations of Adjusted EBITDA, see “Management’s Discussion and Analysis of Financial Condition and Results of Operations—Covenant Compliance.”
Our Strategic Platforms
Our strategy is to build the company around multi-billion dollar, global platforms that participate in end markets with above average growth characteristics where we are, or have the opportunity to become, the industry leader. We have successfully completed and integrated several acquisitions and expect to continue to pursue strategic acquisitions inside our existing platforms that will expand our geographic presence, broaden our product lines, or allow us to move into adjacent markets. Over time, we anticipate adding additional platforms to our company. An overview of our existing platforms is outlined below. For financial information about these platforms, see note 19 to our audited consolidated financial statements contained elsewhere in this prospectus:
Power TransmissionProcess & Motion Control
Our Power Transmission products includeProcess & Motion Control platform designs, manufactures, markets and services specified, highly-engineered mechanical components used within complex systems where our customers’ reliability requirements and cost of failure or downtime is high. The Process & Motion Control product portfolio includes gears, couplings, industrial bearings, flattop, aerospace bearings and seals, special components and industrialFlatTop™ modular belting, engineered chain and conveying equipment and are marketed and sold globally under several brands, such asincluding Rexnord®, Rex®, Falk™® and Link-Belt®. We sell our Power TransmissionProcess & Motion Control products into a diverse group of attractive end markets,end-markets, including aerospace, agri-farm, air handling,mining, general industrial applications, cement and aggregates, chemicals, construction equipment, energy, beverage and container,aggregate, agriculture, forest and wood products, marine, materialpetrochemical, energy, food and package handling, mining, natural resource extractionbeverage, aerospace and petrochemical. Our international net sales (as measured on a destination basis) have grown from 34% of Power Transmission net sales in fiscal 2006 to 40% in fiscal 2008.wind energy.
Over the past century, we
FY2011 Process & Motion Control Net Sales by End-Market | FY2011 Process & Motion Control Net Sales End-User/OEM vs. Aftermarket | |
| |
| (1) | General Industrial includes, but is not limited to, material handling, package handling, utilities, automation and robotics, marine and steel processing, none of which individually represented more than 2% of fiscal 2011 net sales. |
We have established long-term relationships with original equipment manufacturers, or OEMs and end usersend-users serving a wide variety of industries. As a result of our long-term relationshiprelationships with OEMs and end users,end-users, we have created a significant installed base for our Power TransmissionProcess & Motion Control products, which are consumed or
worn in use and have a relatively predictable replacement cycle. We believe this replacement dynamic drives recurring aftermarket demand for our products. We estimate that approximately 45%50% of our North American Power TransmissionProcess & Motion Control net sales are to distributors. These net sales aredistributors, who primarily driven byserve the end-user/OEM aftermarket demand for our products.
3
Most of our products are critical components in large scale manufacturing processes, where the cost of component failure and resulting downtimedown-time is high. We believe our reputation for superior quality, productsapplication expertise and our ability to meet lead times as short as one daytime expectations are highly valued by our customers, as demonstrated by their strong preference to replace their worn Rexnord products with new Rexnord products, foror “like-for-like” product replacements. We believe this replacement dynamic for our customers’ preference to replace “like-for-like” products, combined with our significant installed base, enables us to achieve premium pricing, generates a source of recurring revenue and provides us with a competitive advantage. We believe the majority of our products are purchased by customers as part of their regular maintenance budgetsbudget, and in many cases do not represent significant capital expenditures.
Over the past several years, both our customer base, as well as many of our end markets have grown faster than the underlying economic growth in the United States. Our international net sales (as measured on a destination basis) have grown from 34% of Power Transmission net sales in fiscal 2006 to 40% in fiscal 2008.
Set forth below are our Power Transmission net sales for fiscal 2008 by end market and by geographic destination:
Water Management
Our Water Management platform designs, procures, manufactures and markets products includethat provide and enhance water quality, safety, flow control and conservation. The Water Management product portfolio includes professional grade specification plumbing,drainage products, flush valves and faucet products, engineered valves and gates for the water and wastewater treatment market and waste water control productsPex piping and are marketed and sold through widely recognized brand names, including Zurn®, Wilkins®, Aquaflush®, Aquasense®, Aquavantage®, Zurn One Systems®, Ecovantage®, Aquaspec®, Zurn PEX®, Checktronic®, Cam-Seal®, Rodney Hunt® and Golden AndersonFontaine™®.
Over the past century, the businesses that comprise our Water Management platform hashave established itselfthemselves as an innovatorinnovators and leading designer, manufacturerdesigners, manufacturers and distributordistributors of highly engineered water products and solutions that deliver water conservation, safety & hygiene,control the flow, delivery, treatment and control & comfortconservation of water to the infrastructure construction (which is comprised of various segments, including those identified as “Water Supply and Treatment” in the chart below), commercial construction and, to a lesser extent, the residential construction end markets.end-markets. Segments of the infrastructure end marketend-market include: municipal water and wastewater, transportation, government, health care and education. Segments of the commercial construction end marketend-market include: lodging, retail, dining, sports arenas, and warehouse/office. The demand for our Water Management products is primarily driven by new infrastructure, the retro-fit of existing structures to make them more energy and water efficient, commercial construction and, to a lesser extent, residential construction. In
FY2011 Water Management Net Sales by End-Market | FY2011 Water Management Net Sales New Construction vs. Retrofit | |
| |
Our Water Management products are principally specification-driven and project-critical and typically represent a low percentage of the overall project cost. We believe these characteristics, coupled with our extensive distribution network, create a high level of end-user loyalty for our products and allow us to maintain leading market shares in the majority of our product lines. We believe we have become a market leader in the industry by meeting the stringent third party regulatory, building and plumbing code requirements and subsequently achieving specification of our products into projects and applications. The majority of these stringent testing and regulatory
4
approval processes are completed through the University of Southern California (“USC”), the International Association of Plumbing and Mechanical Codes (“IAPMO”), the National Sanitation Foundation (“NSF”), the Underwriters Laboratories (“UL”), Factory Mutual (“FM”), or the American Waterworks Association (“AWWA”), prior to the commercialization of our products.
Our Water Management platform has an extensive network of approximately 1,100 independent sales representatives across approximately 210 sales agencies in North America who work with local engineers, contractors, builders and architects to specify, or “spec-in,” our products for use in construction projects. Approximately 85% of our Water Management platform net sales come from products that are specified for use in projects by engineers, contractors, owners or architects. Specifically, it has been our experience that, once an architect, engineer, contractor or owner has specified our product with satisfactory results, that person will generally continue to use our products in future projects. The inclusion of our products with project specifications, combined with our ability to innovate, engineer and deliver products and systems that save time and money for engineers, contractors, builders and architects, has resulted in growing demand for our products. Our distribution model is predicated upon maintaining high product availability near our customers. We believe that this model provides us with a competitive advantage as we are able to meet our customer demand with local inventory at significantly reduced lead times as compared to others in our industry.
Our Markets
We evaluate our competitive position in our markets based on available market data, relevant benchmarks compared to our relative peer group and industry trends. We generally do not participate in segments of our served markets that are thought of as commodities or in applications that do not require differentiation based on product quality, reliability and innovation. In both of our platforms, we believe the end-markets we serve span a broad and diverse array of commercial and industrial end-markets with solid fundamental long-term growth characteristics.
Process & Motion Control Market
Within the overall Process & Motion Control market, we estimate that the addressable North American market for our current product offerings is approximately $5.0 billion in net sales per year. Globally, we estimate our addressable market to be approximately $12.0 billion in net sales per year. The market for Process & Motion Control products is very fragmented with most participants having single or limited product lines and serving specific geographic markets. While there are numerous competitors with limited product offerings, there are only a few national and international competitors of a size comparable to us. While we compete with certain domestic and international competitors across a portion of our product lines, we do not believe that any one competitor directly competes with us on all of our product lines. The industry’s customer base is broadly diversified across many sectors of the economy. We believe that growth in the Process & Motion Control market is closely tied to overall growth in industrial production, which fundamentally, we believe has significant long-term growth potential. In addition, we believe that Process & Motion Control manufacturers who innovate to meet changes in customer demands and focus on higher growth end-markets can grow at rates faster than overall United States industrial production.
The Process & Motion Control market is also characterized by the need for sophisticated engineering experience, the ability to produce a broad number of niche products with very little lead time and long-standing customer relationships. We believe entry into our markets by competitors with lower labor costs, including foreign competitors, will be limited due to the fact that we manufacture highly specialized niche products that are critical components in large scale manufacturing processes, where the cost of component failure and resulting downtime is high. In addition, we believe there is an industry trend of customers increasingly consolidating their vendor bases, which we believe should allow suppliers with broader product offerings, like us, to capture additional market share.
5
Water Management Market
Within the overall Water Management market, we estimate that the addressable North American market for our current product offerings is approximately $2.3 billion in net sales per year. Globally, we estimate our addressable market to be approximately $3.0 billion in net sales per year. We believe the markets in which our Water Management platform participates are relatively fragmented with competitors across a broad range of industries and product lines. Although competition exists across all of our Water Management businesses, we do not believe that any one competitor directly competes with us across all of our product lines. We believe that, by focusing our efforts and resources towards end marketsend-markets that have above average growth characteristics, we can continue to grow our platform at rates above the growth rate of the overall market and the growth rate of our
competition. Additionally,We believe the areas of the Water Management industry in which we compete are tied to growth in infrastructure and commercial construction, which we believe there ishave significant long-term growth fundamentals. Historically, the infrastructure and commercial construction industry has been more stable and less vulnerable to down-cycles than the residential construction industry. Compared to residential construction cycles, downturns in infrastructure and commercial construction have been shorter and less severe, and upturns have lasted longer and had higher peaks in terms of spending as well as units and square footage. In addition, through successful new product innovation, we believe that water management manufacturers are able to grow at a significant opportunityfaster pace than the broader infrastructure and commercial construction markets, as well as mitigate downturns in the cycle.
The Water Management industry’s specification-driven end-markets require manufacturers to work closely with engineers, contractors, builders and architects in local markets across the United States to design specific applications on a project-by-project basis. As a result, building and maintaining relationships with architects, engineers, contractors and builders who specify or “spec-in” products for use in construction projects and having flexibility in design and product innovation are critical to compete effectively in the market. Companies with a strong network of such relationships have a competitive advantage. Specifically, it has been our experience that, once an engineer, contractor, builder or architect has specified our product with satisfactory results, that person often will continue to use our products in future projects.
Our Competitive Strengths
Key characteristics of our business that we believe provide us with a competitive advantage and position us for future growth include the following:
The Rexnord Business System.We operate our company in a disciplined way. The Rexnord Business System is our operating philosophy and it creates a scalable, process-based framework that focuses on driving superior customer satisfaction and financial results by sellingtargeting world-class operating performance. RBS is based on the following principles: (1) strategy deployment—a long-term strategic planning process that determines annual improvement priorities and distributingthe actions necessary to achieve those priorities; (2) measuring our performance based on customer satisfaction, or the “Voice of the Customer;” (3) involvement of all our associates in the execution of our strategy; and (4) a culture that embraces Kaizen, the Japanese philosophy of continuous improvement. We believe applying RBS can yield superior growth, quality, delivery and cost positions relative to our competition, resulting in enhanced profitability and ultimately the creation of stockholder value. As we have applied RBS over the past several years, we have experienced significant improvements in growth, productivity, cost reduction and asset efficiency and believe there are substantial opportunities to continue to improve our performance as we continue to apply RBS.
Experienced, High-Caliber Management Team. Our management team is led by Todd Adams, President and Chief Executive Officer. George Sherman, our Non-Executive Chairman of the Board and, from 1990 to 2001, the CEO of the Danaher Corporation, collaborates with the management team to establish the strategic
6
direction of the Company. Other members of the management team include Michael Shapiro, Vice President and Chief Financial Officer, Praveen Jeyarajah, Executive Vice President—Corporate and Business Development and George Moore, Executive Vice President. We believe the overall talent level within our organization is a competitive strength, and we have added a number of experienced key managers across our platforms over the past several years. Mr. Sherman and the management team currently maintain a significant equity investment in the Company. As of March 31, 2011, their ownership interest represented approximately 20% of our common stock on a fully diluted basis.
Strong Financial Performance and Free Cash Flow. Since implementing RBS, we have established a solid track-record of delivering strong financial performance measured in terms of net sales growth, margin expansion and free cash flow conversion (cash flow from operations less capital expenditures compared to net income). Since fiscal 2004, net sales have grown at a compound annual growth rate of 13% inclusive of acquisitions, and Adjusted EBITDA margins (Adjusted EBITDA divided by net sales) have expanded to 19.8%. Additionally, we have consistently delivered strong free cash flow over the past several years by improving working capital performance and maintaining capital expenditures at reasonable levels. By continually focusing on improving our overall operating performance and free cash flow conversion, we believe we can create long-term stockholder value by using our cash flows to manage our leverage, as well as to drive growth through acquisitions over time.
Leading Market Positions in Diversified End-Markets. Our high-margin performance is driven by industry leading positions in the diversified end-markets in which we compete. We estimate that greater than 85% of our net sales are derived from products intoin which we have leading market share positions. We believe we have achieved leadership positions in these markets through our focus on customer satisfaction, extensive offering of quality products, ability to service our customers globally, positive brand perception, highly engineered product lines, extensive specification efforts and market/application experience. We serve a diverse set of end-markets with our largest single end-market, mining, accounting for 13% of consolidated net sales in fiscal 2011.
Broad Portfolio of Highly Engineered, Specification-Driven Products. We believe we offer one of the broadest portfolios of highly engineered, specification-driven, project-critical products in the end-markets we serve. Our array of product applications, knowledge and expertise applied across our extensive portfolio of products allows us to work closely with our customers to design and develop solutions tailored to their individual specifications. Within our Water Management platform, our representatives work directly with engineers, contractors, builders and architects to “spec-in” our Water Management products early in the design phase of a project. We have found that once these customers have specified a company’s product with satisfactory results, they will generally use that company’s products in future projects. Furthermore, we believe our strong application engineering and new product development capabilities have contributed to our reputation as an innovator in each of our end-markets.
Large Installed Base, Extensive Distribution Network and Strong Aftermarket Revenues. Over the past century we have established relationships with OEMs and end-users across a diverse group of end-markets, creating a significant installed base for our Process & Motion Control products. This installed base generates significant aftermarket sales for us, as our Process & Motion Control products are consumed in use and must be replaced in relatively predictable cycles. In order to provide our customers with superior service, we have cultivated relationships with over 2,600 distributor locations serving our customers globally. Our Water Management platform has 23 manufacturing and warehouse facilities and uses approximately 90 third-party distribution facilities at which it maintains inventory. This broad distribution network provides us with a competitive advantage and drives demand for our Water Management products by allowing quick delivery of project-critical products to our customers facing short lead times. In addition, we believe this extensive distribution network also provides us with an opportunity to capitalize on the expanding renovation and repair market as building owners begin to upgrade existing commercial and institutional bathroom fixtures with high efficiency systems.
7
Significant Experience Identifying and Integrating Strategic Acquisitions.We have successfully completed and integrated several acquisitions in recent years totaling more than $1.3 billion of total transaction value, including our $942.5 million acquisition of Zurn. These strategic acquisitions have allowed us to establish and expand our Water Management platform, widen our geographic presence, broaden our product lines and, in other instances, move into adjacent markets. Since 2005, we have completed strategic acquisitions that have significantly expanded our Process & Motion Control platform and established and expanded our Water Management platform. We believe these acquisitions have created stockholder value through the implementation of RBS operating principles, which has resulted in identifying and achieving cost synergies, as well as driving growth and operational and working capital improvements.
Our Business Strategy
We strive to create stockholder value by seeking to deliver sales growth, profitability and asset efficiency, which we believe will result in superior financial performance and free cash flow generation when compared to other leading multi-platform industrial companies by driving the following key strategies:
Drive Profitable Growth. Our key growth strategies are:
| • | Accelerate Growth in Key Vertical End-Markets—We believe that we have an opportunity to accelerate our overall net sales growth over the next several years by deploying resources to leverage our highly engineered product portfolio, industry expertise, application knowledge and unique manufacturing capabilities into certain key vertical end-markets that we expect to have above market growth rate potential. We believe those end-markets include, but are not limited to, mining, energy, aerospace, cement and aggregates, food and beverage, water infrastructure and the renovation and repair of existing commercial buildings and infrastructure. |
| • | Product Innovation and Resourcing “Break-throughs”—We intend to continue to invest in strong application engineering and new product development capabilities and processes. Our disciplined focus on innovation begins with our extensive “Voice of the Customer” process and follows a systematic process, ensuring that the commercialization and profitability of new products meet both the markets’ and our expectations. Additionally, we will continue resourcing “break-throughs,” which we define as potential products or other growth opportunities that have an annual net sales potential of $20 million or more over 3 to 5 years. We believe growing demands for more energy and water conservation products will also provide opportunities for us to grow through innovation in both platforms. |
| • | Drive Specification for Our Products—We intend to increase our installed base and grow aftermarket revenues by continuing to partner with OEMs to specify our Process & Motion Control products on original equipment applications. Within our Water Management platform, we intend to leverage our sales and distribution network and to increase specification for our products by working directly with our customers to drive specification for our products in the early design stages of a project. |
| • | Expand Internationally—We believe there is substantial growth potential outside the United States for many of our existing products by expanding distribution, further penetrating key vertical end-markets that are growing faster outside the United States and selectively pursuing acquisitions that will provide us with additional international exposure. |
| • | Pursue Strategic Acquisitions—We believe the fragmented nature of our Process & Motion Control and Water Management markets will allow us to continue to identify attractive acquisition candidates in the future that have the potential to complement our existing platforms by either broadening our product offerings, expanding geographically or addressing an adjacent market opportunity. |
Platform Focused Strategies. We intend to build our business around leadership positions in platforms that participate in multi-billion dollar, global, growing end-markets. Within our two existing platforms, we expect to continue to leverage our overall market presence and competitive position to provide further growth and diversification and increase our market share.
8
The Rexnord Business System. We operate our company in a disciplined way through the Rexnord Business System. RBS is our operating philosophy and it creates a scalable, process-based framework that focuses on driving superior customer satisfaction and financial results by targeting world-class operating performance. We believe applying RBS can yield superior growth, quality, delivery and cost positions relative to our competition, resulting in enhanced profitability and ultimately the creation of stockholder value.
Our Ownership Structure
The chart below is a summary of our organizational structure after giving effect to this offering and the redemption and prepayment of all of our PIK toggle senior indebtedness, which is expected to be completed in the first quarter of fiscal 2012 as described in “Capitalization.” Unless otherwise indicated, the indebtedness information below is as of March 31, 2011.
| (1) | Includes investment funds affiliated with, or co-investment vehicles managed by, Apollo Management VI, L.P., an affiliate of Apollo Management, L.P., which, as of March 31, 2011, collectively beneficially owned 93.8% of our common stock, with the balance beneficially owned by the management stockholders. |
| (2) | As of March 31, 2011, $761.5 million was outstanding. |
| (3) | As of March 31, 2011, $1,147.0 million was outstanding. |
| (4) | As of March 31, 2011, $300.0 million was outstanding. We intend to use a portion of the proceeds of this offering to redeem $300.0 million in principal amount of the 11.75% senior subordinated notes due 2016. |
| (5) | As of March 31, 2011, $12.4 million was outstanding. Primarily consists of foreign borrowings and capitalized lease obligations. |
| (6) | Guarantors of the senior secured credit facilities, the senior notes and the senior subordinated notes include substantially all of the domestic operating subsidiaries of RBS Global as of the date of this prospectus other than Rexnord LLC, which is a co-issuer of the notes, but do not include any of its foreign subsidiaries. |
9
Our Principal Stockholders
Our principal stockholders are investment funds affiliated with, or co-investment vehicles managed by, Apollo Management VI, L.P., an affiliate of Apollo Management, L.P., which we collectively refer to herein as “Apollo” (unless the context otherwise indicates) and which prior to this offering collectively beneficially owned 93.8% of our common stock and will beneficially own % or shares of our common stock after this offering, assuming the underwriters do not exercise their over-allotment option. Apollo Investment Fund VI, L.P., which is the sole member of one of our principal stockholders, is an investment fund with committed capital, along with its co-investment affiliates, of approximately $10.1 billion. Apollo Management, L.P., is an affiliate of Apollo Global Management, LLC, a leading global alternative asset manager with offices in New York, Los Angeles, London, Frankfurt, Luxembourg, Singapore, Hong Kong and Mumbai. As of March 31, 2011, Apollo Global Management, LLC and its subsidiaries have assets under management of approximately $70 billion in private equity, hedge funds, distressed debt and mezzanine funds invested across a core group of industries where Apollo Global Management, LLC has considerable knowledge and resources.
Risk Factors
Investing in our common stock involves substantial risk. Our ability to execute our strategy is also subject to certain risks. The risks described under the heading “Risk Factors” immediately following this summary may cause us not to realize the full benefits of our strengths or may cause us to be unable to successfully execute all or part of our strategy. These risks include, among others:
Our substantial indebtedness could have a material adverse effect on our operations, which could prevent us from satisfying our debt obligations and have a material adverse effect on the value of our common stock. Our business may not generate sufficient cash flow from operations to meet our debt service and other obligations, and currently anticipated cost savings and operating improvements may not be realized on schedule, or at all.
Our business and financial performance depend on general economic conditions and other market factors beyond our control. Any sustained weakness in demand or downturn or uncertainty in the economy generally would materially reduce our net sales and profitability.
We face significant competition from numerous companies both on the international and national levels. Some of our competitors have achieved substantially more market penetration in certain of the markets in which we operate, and some of our competitors have greater financial and other resources than we do. We cannot provide assurance that we will be able to maintain or increase the current market share of our products successfully in the future.
Some of the industries we serve are highly cyclical, such as the aerospace, energy and industrial equipment industries. Any declines in commercial, institutional or residential construction starts or demand for replacement building and home improvement products may impact us in a material adverse manner, and there can be no assurance that any such adverse effects would not continue for a prolonged period of time.
If any of the foregoing risks or the risks described under the heading “Risk Factors” were to occur, you may lose part or all of your investment. You should carefully consider all the information in this prospectus, including matters set forth under the heading “Risk Factors” on page 16 before making an investment decision.
10
Additional Information
Rexnord Corporation is a Delaware corporation. Our principal executive offices are located at 4701 West Greenfield Avenue, Milwaukee, Wisconsin 53214. Our telephone number is (414) 643-3000. Our website is located at www.rexnord.com; however, the information on our website is not part of this document, and you should rely only on the information contained in this document and the documents to which we refer you.
11
The Offering
Issuer | Rexnord Corporation |
Common stock offered by us | shares. |
Common stock to be outstanding immediately after the offering | shares. |
Underwriters’ option to purchase additional shares of common stock in this offering | We have granted to the underwriters a 30-day option to purchase up to additional shares at the initial public offering price less underwriting discounts and commissions. The underwriters will not execute sales to discretionary accounts without the prior written specific approval of the customers. |
Common stock voting rights | Each share of our common stock will entitle its holder to one vote. |
Dividend policy | We currently intend to retain all future earnings, if any, for use in the operation of our business and to fund future growth. The decision whether to pay dividends will be made by our board of directors in light of conditions then existing, including factors such as our results of operations, financial condition and requirements, business conditions and covenants under any applicable contractual arrangements, including our indebtedness. See “Dividend Policy.” |
Use of proceeds | We estimate that our net proceeds from this offering will be approximately $ million after deducting the estimated underwriting discounts and commissions and expenses, assuming the shares are offered at $ per share, which represents the midpoint of the range set forth on the front cover of this prospectus. We intend to use a portion of these net proceeds to: first, redeem $300.0 million of the outstanding 11.75% senior subordinated notes due 2016 plus early redemption premiums of $ million and accrued interest; and second, pay Apollo a fee of $ million upon the consummation of this offering in connection with the termination of our management services agreement, as described under “Certain Relationships and Related Party Transactions.” We will use the remaining net proceeds for general corporate purposes. For sensitivity analyses as to the offering price and other information, see “Use of Proceeds.” |
NYSE symbol | “RXN” |
Risk factors | You should carefully read and consider the information set forth under “Risk Factors” beginning on page 16 of this prospectus and all other information set forth in this prospectus before deciding to invest in our common stock. |
12
Except as otherwise indicated, all of the information in this prospectus assumes:
a for one stock split described below has been completed;
no exercise of the underwriters’ over-allotment option to purchase up to additional shares of common stock to cover over-allotments of shares;
an initial offering price of $ per share, the midpoint of the range set forth on the cover page of this prospectus; and
our amended and restated certificate of incorporation and amended and restated bylaws are in effect, pursuant to which the provisions described under “Description of Capital Stock” will become operative.
Prior to completion of this offering, we will effect a stock split whereby holders of our outstanding shares of common stock will receive shares of common stock for each share they currently hold. The number of shares of common stock to be outstanding after completion of this offering is based on shares of our common stock to be sold in this offering and, except where we state otherwise, the information with respect to our common stock we present in this prospectus:
does not give effect to shares of our common stock issuable upon the exercise of outstanding options as of , 2011, at a weighted-average exercise price of $ per share; and
does not give effect to shares of common stock reserved for future issuance under Rexnord Corporation’s 2006 Stock Option Plan.
13
Summary Historical Financial and Other Data
The summary historical financial data for the fiscal years ended March 31, 2009, 2010 and 2011 have been derived from our consolidated financial statements and related notes thereto which have been audited by Ernst & Young LLP, an independent registered public accounting firm and are included elsewhere in this prospectus.
The following data should be read in conjunction with “Risk Factors,” “Selected Financial Information,” “Management’s Discussion and Analysis of Financial Condition and Results of Operations” and our consolidated financial statements and related notes thereto included elsewhere in this prospectus.
(dollars in millions) | Year Ended March 31, 2009 (1)(2) | Year Ended March 31, 2010 (1) | Year Ended March 31, 2011 | |||||||||
Statement of Operations: | ||||||||||||
Net Sales | $ | 1,882.0 | $ | 1,510.0 | $ | 1,699.6 | ||||||
Cost of Sales | 1,290.1 | 994.4 | 1,102.8 | |||||||||
Gross Profit | 591.9 | 515.6 | 596.8 | |||||||||
Selling, General and Administrative Expenses | 467.8 | 297.7 | 329.1 | |||||||||
Intangible Impairment Charges | 422.0 | — | — | |||||||||
Restructuring and Other Similar Costs | 24.5 | 6.8 | — | |||||||||
Amortization of Intangible Assets | 48.9 | 49.7 | 48.6 | |||||||||
(Loss) Income from Operations | (371.3 | ) | 161.4 | 219.1 | ||||||||
Non-Operating Income (Expense): | ||||||||||||
Interest Expense, net | (230.4 | ) | (194.2 | ) | (180.8 | ) | ||||||
Gain (Loss) on debt extinguishment | 103.7 | 167.8 | (100.8 | ) | ||||||||
Other (Expense) Income, net | (3.0 | ) | (16.4 | ) | 1.1 | |||||||
(Loss) Income Before Income Taxes | (501.0 | ) | 118.6 | (61.4 | ) | |||||||
(Benefit) Provision for Income Taxes | (72.0 | ) | 30.5 | (10.1 | ) | |||||||
Net (Loss) Income | $ | (429.0 | ) | $ | 88.1 | $ | (51.3 | ) | ||||
Other Data: | ||||||||||||
Net Cash (Used for) Provided by: | ||||||||||||
Operating Activities | 155.0 | 155.5 | 164.5 | |||||||||
Investing Activities | (54.5 | ) | (22.0 | ) | (35.5 | ) | ||||||
Financing Activities | 36.6 | (161.5 | ) | (6.9 | ) | |||||||
Depreciation and Amortization of Intangible Assets | 109.6 | 109.3 | 106.1 | |||||||||
Capital Expenditures | 39.1 | 22.0 | 37.6 | |||||||||
14
| March 31 | ||||||||||||
(dollars in millions) | 2009 | 2010 | 2011 | |||||||||
Balance Sheet Data: | ||||||||||||
Cash and Cash Equivalents | $ | 287.9 | $ | 263.9 | $ | 391.0 | ||||||
Working Capital (3) | 555.2 | 481.9 | 483.6 | |||||||||
Total Assets | 3,218.8 | 3,016.5 | 3,099.7 | |||||||||
Total Debt (4) | 2,526.1 | 2,215.5 | 2,314.1 | |||||||||
Stockholders’ Equity (Deficit) | (177.8 | ) | (57.5 | ) | (88.2 | ) | ||||||
| (1) | Financial data for fiscal 2009 and 2010 has been adjusted for our voluntary change in accounting for actuarial gains and losses related to our pension and other postretirement benefit plans. See Note 2 to our audited consolidated financial statements included elsewhere in this prospectus. |
| (2) | Consolidated financial data as of and for the year ended March 31, 2009 reflects the estimated fair value of assets acquired and liabilities assumed in connection with the Fontaine acquisition on February 27, 2009. As a result, the comparability of the operating results for the periods presented is affected by the revaluation of the assets acquired and liabilities assumed on the date of the Fontaine acquisition. |
| (3) | Represents total current assets less total current liabilities. |
| (4) | Total debt represents long-term debt plus the current portion of long-term debt. |
In addition to net (loss) income, we believe Adjusted EBITDA is an important measure under our senior secured credit facilities, as our ability to incur certain types of acquisition debt or subordinated debt, make certain types of acquisitions or asset exchanges, operate our business and make dividends or other distributions, all of which will impact our financial performance, is impacted by our Adjusted EBITDA, as our lenders measure our performance by comparing the ratio of our net senior secured bank debt to our Adjusted EBITDA. We reported Adjusted EBITDA of $335.7 million in fiscal 2011. See “Management’s Discussion and Analysis of Financial Condition and Results of Operations—Covenant Compliance.”
15
Investing in our common stock involves a high degree of risk. You should carefully consider the risk factors set forth below as well as the other information contained in this prospectus before investing in our common stock. The risks described below are not the only risks facing us. Additional risks and uncertainties not currently known to us or those we currently view to be immaterial may also materially and adversely affect our business, financial condition, results of operations or cash flows. Any of the following risks could materially and adversely affect our business, financial condition, results of operations or cash flows. In such a case, you may lose part or all of your original investment.
Risks Related to Our Business
Our substantial indebtedness could adversely affect our ability to raise additional capital to fund our operations, limit our ability to react to changes in the economy or our industry and prevent us from making debt service payments.
We are a highly leveraged company. Our ability to generate sufficient cash flow from operations to make scheduled payments on our debt will depend on a range of economic, competitive and business factors, many of which are outside our control. Our business may not generate sufficient cash flow from operations to meet our debt service and other obligations, and currently anticipated cost savings and operating improvements may not be realized on schedule, or at all. If we are unable to meet our expenses and debt service and other obligations, we may need to refinance all or a portion of our indebtedness on or before maturity, sell assets or raise equity. Furthermore, Apollo has no obligation to provide us with debt or equity financing and we therefore may be unable to generate sufficient cash to service all of our indebtedness. We may not be able to refinance any of our indebtedness, sell assets or raise equity on commercially reasonable terms or at all, which could cause us to default on our obligations and impair our liquidity. Our inability to generate sufficient cash flow to satisfy our debt obligations or to refinance our obligations on commercially reasonable terms would have a material adverse effect on our business, financial condition, results of operations or cash flows.
Our substantial indebtedness could also have other important consequences with respect to our ability to manage our business successfully, including the following:
it may limit our ability to borrow money for our working capital, capital expenditures, debt service requirements, strategic initiatives or other purposes;
it may make it more difficult for us to satisfy our obligations with respect to our indebtedness, and any failure to comply with the obligations of any of our debt instruments, including restrictive covenants and borrowing conditions, could result in an event of default under our senior secured credit facilities, the indentures governing our senior notes, senior subordinated notes and our other indebtedness;
a substantial portion of our cash flow from operations will be dedicated to the repayment of our indebtedness and so will not be available for other purposes;
it may limit our flexibility in planning for, or reacting to, changes in our operations or business;
we are and will continue to be more highly leveraged than some of our competitors which may place us at a competitive disadvantage;
it may make us more vulnerable to further downturns in our business or the economy;
it may restrict us from making strategic acquisitions, introducing new technologies or exploiting business opportunities; and
it, along with the financial and other restrictive covenants in the documents governing our indebtedness, among other things, may limit our ability to borrow additional funds or dispose of assets.
16
Furthermore, our interest expense could increase if interest rates increase because a portion of the debt under our senior secured credit facilities is unhedged variable-rate debt. For the last several quarters, interest rates have been subject to extreme volatility which may intensify this risk. Also, we may still incur significantly more debt, which could intensify the risks described above. For more information, see Note 10 to our audited consolidated financial statements included elsewhere in this prospectus.
Weak economic and financial market conditions have impacted our business operations and may adversely affect our results of operations and financial condition.
Weak global economic and financial market conditions in recent years have affected our business operations and continuing weakness or a further downturn may adversely affect our future results of operations and financial condition. Economic conditions in the end-markets, businesses or geographic areas in which we sell our products could reduce demand for these products and result in a decrease in sales volume for a prolonged period of time which would have a negative impact on our future results of operations. Also, a weak recovery could prolong, or resume, the negative effects we have experienced in the past.
For example, sales to the construction industry are driven by trends in commercial and residential construction, housing starts and trends in residential repair and remodeling. Consumer confidence, mortgage rates, credit standards and availability and income levels play a significant role in driving demand in the residential construction, repair and remodeling sector. A prolonged or further drop in consumer confidence, continued restrictions in the credit market or an increase in mortgage rates, credit standards or unemployment could delay the recovery of commercial and residential construction levels and have a material adverse effect on our business, financial condition, results of operations or cash flows. This may express itself in the form of substantial downward pressure on product pricing and our profit margins, thereby adversely affecting our financial results.
Additionally, many of our products are used in the energy, mining and cement and aggregate markets. With the recent increases and volatility in commodity prices, certain customers may defer or cancel anticipated projects or expansions until such time as these projects will be profitable based on the underlying cost of commodities compared to the cost of the project. Volatility and disruption of financial markets, like in recent years, could limit the ability of our customers to obtain adequate financing to maintain operations and may cause them to terminate existing purchase orders, reduce the volume of products they purchase from us in the future or impact their ability to pay their receivables. Adverse economic and financial market conditions may also cause our suppliers to be unable to meet their commitments to us or may cause suppliers to make changes in the credit terms they extend to us, such as shortening the required payment period for outstanding accounts receivable or reducing or eliminating the amount of trade credit available to us.
Demand for our Water Management products depends on availability of financing.
Many customers who purchase our Water Management products depend on third-party financing. There have been significant disruptions in the availability of financing on reasonable terms. Fluctuations in prevailing interest rates affect the availability and cost of financing to our customers. Given recent market conditions, some lenders and institutional investors have significantly reduced, and in some cases ceased to provide, funding to borrowers. The lack of availability or increased cost of credit could lead to decreased construction which would result in a reduction in demand for our products and have a material adverse effect on our Water Management business, financial condition, results of operations or cash flows.
The markets in which we sell our products are highly competitive.
We operate in highly fragmented markets within the Process & Motion Control. As a result, we compete against numerous companies. Some of our competitors have achieved substantially more market penetration in certain of the markets in which we operate, and some of our competitors have greater financial and other
17
resources than we do. Competition in our business lines is based on a number of considerations including product performance, cost of transportation in the distribution of our Process & Motion Control products, brand reputation, quality of client service and support, product availability and price. Additionally, some of our larger, more sophisticated customers are attempting to reduce the number of vendors from which they purchase in order to increase their efficiency. If we are not selected to become one of these preferred providers, we may lose access to certain sections of the markets in which we compete. Our customers increasingly demand a broad product range and we must continue to develop our expertise in order to manufacture and market these products successfully. To remain competitive, we will need to invest continuously in manufacturing, customer service and support, marketing and our distribution networks. We may also have to adjust the prices of some of our Process & Motion Control products to stay competitive. We cannot assure you that we will have sufficient resources to continue to make these investments or that we will maintain our competitive position within each of the markets we serve.
Within the Water Management platform, we compete against both large international and national rivals, as well as many regional competitors. Some of our competitors have greater resources than we do. Significant competition in any of the markets in which the Water Management platform operates could result in substantial downward pressure on product pricing and our profit margins, thereby adversely affecting the Water Management financial results. Furthermore, we cannot provide assurance that we will be able to maintain or increase the current market share of our products successfully in the future.
Our business depends upon general economic conditions and other market factors beyond our control, and we serve customers in cyclical industries. As a result, our operating results could further be negatively affected during any continued or future economic downturns.
Our financial performance depends, in large part, on conditions in the markets that we serve in the U.S. and the global economy generally. Some of the industries we serve are highly cyclical, such as the aerospace, energy and industrial equipment industries. We have undertaken cost reduction programs as well as diversified our markets to mitigate the effect of downturns in economic conditions; however, such programs may be unsuccessful. Any sustained weakness in demand or downturn or uncertainty in the economy generally, such as the recent unprecedented volatility in the capital and credit markets, would materially reduce our net sales and profitability.
The demand in the water management industry is influenced by new construction activity, both residential and non-residential, and the level of repair and remodeling activity. The level of new construction and repair and remodeling activity is affected by a number of factors beyond our control, including the overall strength of the U.S. economy (including confidence in the U.S. economy by our customers), the strength of the residential and commercial real estate markets, institutional building activity, the age of existing housing stock, unemployment rates and interest rates. Any declines in commercial, institutional or residential construction starts or demand for replacement building and home improvement products may impact us in a material adverse manner and there can be no assurance that any such adverse effects would not continue for a prolonged period of time.
The loss of any significant customer could adversely affect our business.
We have certain customers that are significant to our business. During fiscal 2011, our top 20 customers accounted for approximately 32% of our consolidated net sales, and our largest customer accounted for 8% of our consolidated net sales. Our competitors may adopt more aggressive sales policies and devote greater resources to the development, promotion and sale of their products than we do, which could result in a loss of customers. The loss of one or more of our major customers or deterioration in our relationship with any of them could have a material adverse effect on our business, financial condition, results of operations or cash flows.
18
Increases in the cost of our raw materials, in particular bar steel, brass, castings, copper, forgings, high-performance engineered plastic, plate steel, resin, sheet steel and zinc, as well as petroleum products, or the loss of a substantial number of our suppliers, could adversely affect our financial condition.
We depend on third parties for the raw materials used in our manufacturing processes. We generally purchase our raw materials on the open market on a purchase order basis. In the past, these contracts generally have had one to five year terms and have contained competitive and benchmarking clauses intended to ensure competitive pricing. While we currently maintain alternative sources for raw materials, our business is subject to the risk of price fluctuations, delays in the delivery of and potential unavailability of our raw materials. Any such price fluctuations or delays, if material, could harm our profitability or operations. In addition, the loss of a substantial number of suppliers could result in material cost increases or reduce our production capacity.
In addition, prices for petroleum products and other carbon-based fuel products have also significantly increased recently. These price increases, and consequent increases in the cost of electricity and for products for which petroleum-based products are components or used in part of the process of manufacture, may substantially increase our costs for transportation, fuel, component parts and manufacturing. We may not be able to recoup the costs of these increases by adjusting our prices.
We do not typically enter into hedge transactions to reduce our exposure to price risks and cannot assure you that we would be successful in passing on any attendant costs if these risks were to materialize. In addition, if we are unable to continue to purchase our required quantities of raw materials on commercially reasonable terms, or at all, or if we are unable to maintain or enter into our purchasing contracts for our larger commodities, our business operations could be disrupted and our profitability could be impacted in a material adverse manner.
We rely on independent distributors. Termination of one or more of our relationships with any of those independent distributors or an increase in the distributors’ sales of our competitors’ products could have a material adverse effect on our business, financial condition, results of operations or cash flows.
In addition to our own direct sales force, we depend on the services of independent distributors to sell our Process & Motion Control products and provide service and aftermarket support to our OEMs and end-users. We rely on an extensive distribution network, with nearly 2,600 distributor locations nationwide; however, for fiscal 2011, approximately 21% of our Process & Motion Control net sales were generated through sales to three of our key independent distributors, the largest of which accounted for 12% of Process & Motion Control net sales. Rather than serving as passive conduits for delivery of product, our industrial distributors are active participants in the overall competitive dynamic in the Process & Motion Control industry. Industrial distributors play a significant role in determining which of our Process & Motion Control products are stocked at the branch locations, and hence are most readily accessible to aftermarket buyers, and the price at which these products are sold. Almost all of the distributors with whom we transact business also offer competitors’ products and services to our customers. Within Water Management, we depend on a network of several hundred independent sales representatives and approximately 90 third-party warehouses to distribute our products; however, for fiscal 2011, our three key independent distributors generated approximately 28% of our Water Management net sales with the largest accounting for 20% of Water Management net sales.
Our Process & Motion Control and Water Management distributorship sales are on “market standard” terms. In addition, certain key distributors are on rebate programs, including our top three Water Management distributors. For more information on our rebate programs, see “Management’s Discussion and Analysis of Financial Condition and Results of Operations-Revenue Recognition.”
The loss of one of our key distributors or of a substantial number of our other distributors or an increase in the distributors’ sales of our competitors’ products to our customers could have a material adverse effect on our business, financial condition, results of operations or cash flows.
19
We could be adversely affected if any of our significant customers default in their obligations to us.
Our contracted backlog is comprised of future orders for our products from a broad number of customers. Defaults by any of the customers that have placed significant orders with us could have a significant adverse effect on our net sales, profitability and cash flow. Our customers may in the future default on their obligations to us due to bankruptcy, lack of liquidity, operational failure or other reasons deriving from the current general economic environment. More specifically, the recession and tightening of credit have led to an increased level of commercial and consumer delinquencies, lack of customer confidence, increased market volatility and widespread reduction of business generally. Accordingly, the recession and tightening of credit increases the risks associated with our backlog. If a customer defaults on its obligations to us, it could have a material adverse effect on our business, financial condition, results of operations or cash flows. Approximately 5% of our backlog at March 31, 2011 is currently scheduled to ship beyond fiscal 2012.
We are subject to risks associated with changing technology and manufacturing techniques, which could place us at a competitive disadvantage.
The successful implementation of our business strategy requires us to continuously evolve our existing products and introduce new products to meet customers’ needs in the industries we serve. Our products are characterized by stringent performance and specification requirements that mandate a high degree of manufacturing and engineering expertise. If we fail to meet these requirements, our business could be at risk. We believe that our customers rigorously evaluate their suppliers on the basis of a number of factors, including product quality, price competitiveness, technical and manufacturing expertise, development and product design capability, new product innovation, reliability and timeliness of delivery, operational flexibility, customer service and overall management. Our success will depend on our ability to continue to meet our customers’ changing specifications with respect to these criteria. We cannot assure you that we will be able to address technological advances or introduce new products that may be necessary to remain competitive within our businesses. Furthermore, we cannot assure you that we can adequately protect any of our own technological developments to produce a sustainable competitive advantage.
If we lose certain of our key associates, our business may be adversely affected.
Our success depends on our ability to recruit, retain and motivate highly-skilled sales, marketing and engineering personnel. Competition for these persons in our industry is intense and we may not be able to successfully recruit, train or retain qualified personnel. If we fail to retain and recruit the necessary personnel, our business and our ability to obtain new customers, develop new products and provide acceptable levels of customer service could materially suffer. In addition, we cannot assure you that these individuals will continue their employment with us. If any of these key personnel were to leave our company, it could be difficult to replace them, and our business could be materially harmed.
We may incur significant costs for environmental compliance and/or to address liabilities under environmental laws and regulations.
Our operations and facilities are subject to extensive laws and regulations related to pollution and the protection of the environment, health and safety, including those governing, among other things, emissions to air, discharges to water, the generation, handling, storage, treatment and disposal of hazardous wastes and other materials, and the remediation of contaminated sites. A failure by us to comply with applicable requirements or the permits required for our operations could result in civil or criminal fines, penalties, enforcement actions, third party claims for property damage and personal injury, requirements to clean up property or to pay for the costs of cleanup or regulatory or judicial orders enjoining or curtailing operations or requiring corrective measures, including the installation of pollution control equipment or remedial actions. Moreover, if applicable environmental, health and safety laws and regulations, or the interpretation or enforcement thereof, become more stringent in the future, we could incur capital or operating costs beyond those currently anticipated.
20
Some environmental laws and regulations, including the federal Superfund law, impose requirements to investigate and remediate contamination on present and former owners and operators of facilities and sites, and on potentially responsible parties (“PRPs”) for sites to which such parties may have sent waste for disposal. Such liability can be imposed without regard to fault and, under certain circumstances, may be joint and several, resulting in one PRP being held responsible for the entire obligation. Liability may also include damages to natural resources. We are currently conducting investigations and/or cleanup of known or potential contamination at several of our current and former facilities and have been named as a PRP at several third party Superfund sites. The discovery of additional contamination, the imposition of more stringent cleanup requirements, disputes with our insurers or the insolvency of other responsible parties could require significant expenditures by us in excess of our current reserves. In addition, we occasionally evaluate various alternatives with respect to our facilities, including possible dispositions or closures. Investigations undertaken in connection with these activities may lead to discoveries of contamination that must be remediated, and closures of facilities may trigger remediation requirements that are not currently applicable to our operating facilities. We may also face liability for alleged personal injury or property damage due to exposure to hazardous substances used or disposed of by us, that may be contained within our current or former products, or that are present in the soil or groundwater at our current or former facilities. Significant costs could be incurred in connection with such liabilities.
We believe that, subject to various terms and conditions, we have certain indemnification protection from Invensys plc (“Invensys”) with respect to certain environmental liabilities that may have occurred prior to the acquisition by the Carlyle Group (the “Carlyle Acquisition”) of the capital stock of 16 entities comprising the Rexnord group of Invensys, including certain liabilities associated with our Downers Grove, Illinois facility and with respect to personal injury claims for alleged exposure to hazardous materials. We also believe that, subject to various terms and conditions, we have certain indemnification protection from Hamilton Sundstrand Corporation (“Hamilton Sundstrand”), with respect to certain environmental liabilities that may have arisen from events occurring at Falk facilities prior to the Falk acquisition, including certain liabilities associated with personal injury claims for alleged exposure to hazardous materials. If Invensys or Hamilton Sundstrand becomes unable to, or otherwise does not, comply with its indemnity obligations, or if certain contamination or other liability for which we are obligated is not subject to such indemnities or historic insurance coverage, we could incur significant unanticipated costs. As a result, it is possible that we will not be able to recover pursuant to these indemnities a substantial portion, if any, of the costs that we may incur.
Certain subsidiaries are subject to numerous asbestos claims.
Certain subsidiaries are co-defendants in various lawsuits filed in a number of jurisdictions throughout the United States alleging personal injury as a result of exposure to asbestos that was used in certain components of our products. The uncertainties of litigation and the uncertainties related to the collection of insurance and indemnification coverage make it difficult to accurately predict the ultimate financial effect of these claims. In the event our insurance or indemnification coverage becomes insufficient to cover our potential financial exposure, or the actual number or value of asbestos-related claims differs materially from our existing estimates, we could incur material costs that could have a material adverse effect on our business, financial condition, results of operations or cash flows. See “Business—Legal Proceedings.”
Certain Water Management subsidiaries are subject to a number of class action claims.
Certain Water Management subsidiaries are defendants in a class action lawsuit pending in U.S. federal court in Minnesota and in a number of putative class action lawsuits pending in various other U.S. federal courts. The plaintiffs in these suits represent or seek to represent a class of plaintiffs alleging damages due to the alleged failure or anticipated failure of the Zurn brass crimp fittings on the PEX plumbing systems in homes and other structures. The complaints assert various causes of action, including but not limited to negligence, breach of warranty, fraud, and violations of the Magnuson-Moss Act and certain state consumer protection laws, and seek declaratory and injunctive relief, and damages (including punitive damages). While we intend to vigorously
21
defend ourselves in these actions, the uncertainties of litigation and the uncertainties related to insurance coverage and collection as well as the actual number or value of claims make it difficult to accurately predict the financial effect these claims may ultimately have on us. We may not be successful in defending such claims, and the resulting liability could be substantial and may not be covered by insurance. As a result of the preceding, there can be no assurance as to the long-term effect this litigation will have on our business, financial condition, results of operations or cash flows. See “Business—Legal Proceedings.”
Weather could adversely affect the demand for products in our Water Management platform and decrease its net sales.
Demand for our Water Management products is primarily driven by non-residential construction activity, remodeling and retro-fit opportunities, and to a lesser extent, new home starts as well as water and wastewater infrastructure expansion for municipal, industrial and hydropower applications. Weather is an important variable affecting financial performance as it significantly impacts construction activity. Spring and summer months in the United States and Europe represent the main construction seasons. Adverse weather conditions, such as prolonged periods of cold or rain, blizzards, hurricanes and other severe weather patterns, could delay or halt construction and remodeling activity which could have a negative affect on our business. For example, an unusually severe winter can lead to reduced construction activity and magnify the seasonal decline in our Water Management net sales and earnings during the winter months. In addition, a prolonged winter season can delay construction and remodeling plans and hamper the typical seasonal increase in net sales and earnings during the spring months.
Our international operations are subject to uncertainties, which could adversely affect our operating results.
Our business is subject to certain risks associated with doing business internationally. For fiscal 2011, our net sales outside the United States represented approximately 29% of our total net sales (based on the country in which the shipment originates). The portion of our net sales and operations that is outside of the United States has increased in recent years, and may further increase as a result of internal growth and/or acquisition activity. Accordingly, our future results could be harmed by a variety of factors relating to international operations, including:
fluctuations in currency exchange rates, particularly fluctuations in the Euro against the U.S. dollar;
exchange controls;
compliance with export controls;
tariffs or other trade protection measures and import or export licensing requirements;
changes in tax laws;
interest rates;
changes in regulatory requirements;
differing labor regulations;
requirements relating to withholding taxes on remittances and other payments by subsidiaries;
restrictions on our ability to own or operate subsidiaries, make investments or acquire new businesses in these jurisdictions;
restrictions on our ability to repatriate dividends from our subsidiaries; and
exposure to liabilities under the Foreign Corrupt Practices Act.
As we continue to expand our business globally, our success will depend, in large part, on our ability to anticipate and effectively manage these and other risks associated with our international operations. However, any of these factors could have a material adverse effect on our international operations and, consequently, our business, financial condition, results of operations or cash flows.
22
We may be unable to identify potential acquisition candidates, or to realize the intended benefits of future or past acquisitions.
We cannot assure you that suitable acquisition candidates will be identified and acquired in the future, that the financing of any such acquisition will be available on satisfactory terms, that we will be able to complete any such acquisition or that we will be able to accomplish our strategic objectives as a result of any such acquisition. Nor can we assure you that our acquisition strategies will be successfully received by customers or achieve their intended benefits.
Often acquisitions are undertaken to improve the operating results of either or both of the acquirer and the acquired company and we cannot assure you that we will be successful in this regard nor can we provide any assurance that we will be able to realize all of the intended benefits from our prior acquisitions. We have encountered, and may encounter, various risks in acquiring other companies, including the possible inability to integrate an acquired business into our operations, diversion of management’s attention and unanticipated problems, risks or liabilities, some or all of which could have a material adverse effect on our business, financial condition, results of operations or cash flows.
We may be unable to make necessary capital expenditures.
We periodically make capital investments to, among other things, maintain and upgrade our facilities and enhance our products’ processes. As we grow our businesses, we may have to incur significant capital expenditures. We believe that we will be able to fund these expenditures through cash flow from operations and borrowings under our senior secured credit facilities. However, our senior secured credit facilities, the indentures governing our senior notes and the indenture governing our senior subordinated notes contain limitations that could affect our ability to fund our future capital expenditures and other capital requirements. We cannot assure you that we will have, or be able to obtain, adequate funds to make all necessary capital expenditures when required, or that the amount of future capital expenditures will not be materially in excess of our anticipated or current expenditures. If we are unable to make necessary capital expenditures, our product line may become dated, our productivity may be decreased and the quality of our products may be adversely affected which, in turn, could materially reduce our net sales and profitability.
Our debt agreements impose significant operating and financial restrictions, which could have a material adverse effect on our business, financial condition, results of operations or cash flows.
Our senior secured credit facilities and the indentures governing our senior notes and senior subordinated notes contain various covenants that limit or prohibit our ability, among other things, to:
incur or guarantee additional indebtedness or issue certain preferred shares;
pay dividends on our capital stock or redeem, repurchase, retire or make distributions in respect of our capital stock or subordinated indebtedness or make other restricted payments;
make certain loans, acquisitions, capital expenditures or investments;
sell certain assets, including stock of our subsidiaries;
enter into sale and leaseback transactions;
create or incur liens;
consolidate, merge, sell, transfer or otherwise dispose of all or substantially all of our assets; and
enter into certain transactions with our affiliates.
The indentures governing our senior notes and senior subordinated notes contain covenants that restrict our ability to take certain actions, such as incurring additional debt, if we are unable to meet defined specified financial ratios. As of March 31 2011, our senior secured bank leverage ratio was 1.16x. In addition, as of this
23
date, we had $121.7 million of additional borrowing capacity under the senior secured credit facilities ($28.3 million was considered utilized in connection with outstanding letters of credit). Failure to comply with the leverage covenant of the senior secured credit facilities can result in limiting our long-term growth prospects by hindering our ability to incur future indebtedness or grow through acquisitions. A breach of any of these covenants could result in a default under our debt agreements. For more information, see Note 10 to our audited consolidated financial statements included elsewhere in this prospectus.
The restrictions contained in the agreements that govern the terms of our debt could:
limit our ability to plan for or react to market conditions or meet capital needs or otherwise restrict our activities or business plans;
adversely affect our ability to finance our operations, to enter into strategic acquisitions, to fund investments or other capital needs or to engage in other business activities that would be in our interest; and
limit our access to the cash generated by our subsidiaries.
Upon the occurrence of an event of default under the senior secured credit facilities, the lenders could elect to declare all amounts outstanding under the senior secured credit facilities to be immediately due and payable and terminate all commitments to extend further credit. If we were unable to repay those amounts, the lenders under the senior secured credit facilities could proceed against the collateral granted to them to secure the senior secured credit facilities on a first-priority lien basis. If the lenders under the senior secured credit facilities accelerate the repayment of borrowings, such acceleration could have a material adverse effect on our business, financial condition, results of operations or cash flows. In addition, we may not have sufficient assets to repay our senior notes and senior subordinated notes upon acceleration. For a more detailed description of the limitations on our ability to incur additional indebtedness, see Note 10 to our audited consolidated financial statements included elsewhere in this prospectus and “Description of Indebtedness.”
Because a substantial portion of our indebtedness bears interest at rates that fluctuate with changes in certain prevailing short-term interest rates, we are vulnerable to interest rate increases.
A substantial portion of our indebtedness, including the senior secured credit facilities and borrowings outstanding under our accounts receivable securitization facility, bears interest at rates that fluctuate with changes in certain short-term prevailing interest rates. As of March 31, 2011, we had $761.5 million of floating rate debt under the senior secured credit facilities. Of the $761.5 million of floating rate debt, $370.0 million of our term loans are subject to interest rate swaps, in each case maturing in July 2012. After considering the interest rate swaps, a 100 basis point increase in the March 31, 2011 interest rates would increase interest expense under the senior secured credit facilities by approximately $3.9 million on an annual basis.
We rely on intellectual property that may be misappropriated or otherwise successfully challenged.
We attempt to protect our intellectual property through a combination of patent, trademark, copyright and trade secret protection, as well as third-party nondisclosure and assignment agreements. We cannot assure you that any of our applications for protection of our intellectual property rights will be approved and maintained or that our competitors will not infringe or successfully challenge our intellectual property rights. We also rely on unpatented proprietary technology. It is possible that others will independently develop the same or similar technology or otherwise obtain access to our unpatented technology. To protect our trade secrets and other proprietary information, we require employees, consultants and advisors to enter into confidentiality agreements. We cannot assure you that these agreements will provide meaningful protection for our trade secrets, know-how or other proprietary information in the event of any unauthorized use, misappropriation or disclosure. If we are unable to maintain the proprietary nature of our technologies, our ability to sustain margins on some or all of our products may be affected which could have a material adverse effect on our business, financial condition, results of operations or cash flows. In addition, in the ordinary course of our operations, from time to time we pursue
24
and are pursued in potential litigation relating to the protection of certain intellectual property rights, including some of our more profitable products, such as flattop chain. An adverse ruling in any such litigation could have a material adverse effect on our business, financial condition, results of operations or cash flows.
We could face potential product liability claims relating to products we manufacture or distribute.
We may be subject to additional product liability claims in the event that the use of our products, or the exposure to our products or their raw materials, is alleged to have resulted in injury or other adverse effects. We currently maintain product liability insurance coverage but we cannot assure you that we will be able to obtain such insurance on commercially reasonable terms in the future, if at all, or that any such insurance will provide adequate coverage against potential claims. Product liability claims can be expensive to defend and can divert the attention of management and other personnel for long periods of time, regardless of the ultimate outcome. An unsuccessful product liability defense could have a material adverse effect on our business, financial condition, results of operations or cash flows. In addition, our business depends on the strong brand reputation we have developed. In the event that this reputation is damaged as a result of a product liability claim, we may face difficulty in maintaining our pricing positions and market share with respect to some of our products, which could have a material adverse effect on our business, financial condition, results of operations or cash flows. See “Business—Legal Proceedings.”
We, our customers and our shippers have unionized employees who may stage work stoppages which could seriously impact the profitability of our business.
As of the date of this filing, we had approximately 6,300 employees, of whom approximately 4,300 were employed in the United States. Approximately 535 of our U.S. employees are represented by labor unions. Additionally, approximately 1,000 of our employees reside in Europe, where trade union membership is common. Although we believe that our relations with our employees are currently strong, if our unionized workers were to engage in a strike, work stoppage or other slowdown in the future, we could experience a significant disruption of our operations, which could interfere with our ability to deliver products on a timely basis and could have other negative effects, such as decreased productivity and increased labor costs. Such negative effects could have a material adverse effect on our business, financial condition, results of operations or cash flows. In addition, if a greater percentage of our workforce becomes unionized, our business and financial results could be affected in a material adverse manner. Further, many of our direct and indirect customers and their suppliers, and organizations responsible for shipping our products, have unionized workforces and their businesses may be impacted by strikes, work stoppages or slowdowns, any of which, in turn, could have a material adverse effect on our business, financial condition, results of operations or cash flows.
We could incur substantial business interruptions as the result of updating our Enterprise Resource Planning (“ERP”) Systems.
Utilizing a phased approach, we are updating our ERP systems across both our Process & Motion Control and Water Management platforms. If these updates are unsuccessful, we could incur substantial business interruptions, including the inability to perform routine business transactions, which could have a material adverse effect on our financial performance.
Our required cash contributions to our pension plans have increased and may increase further and we could experience a material change in the funded status of our defined benefit pension plans and the amount recorded in our consolidated balance sheets related to those plans. Additionally, our pension costs could increase in future years.
Recent legislative changes have reformed funding requirements for underfunded U.S. defined benefit pension plans. The revised statute, among other things, increases the percentage funding target of U.S. defined benefit pension plans from 90% to 100% and requires the use of a more current mortality table in the calculation
25
of minimum yearly funding requirements. Our future required cash contributions to our U.S. defined benefit pension plans may increase based on the funding reform provisions that were enacted into law. In addition, if the returns on the assets of any of our U.S. defined benefit pension plans were to decline in future periods, if the Pension Benefit Guaranty Corporation (“PBGC”) were to require additional contributions to any such plans as a result of our recent acquisitions or if other actuarial assumptions were to be modified, our future required cash contributions to such plans could increase. Any such increases could have a material and adverse effect on our business, financial condition, results of operations or cash flows.
The need to make these cash contributions to such plans may reduce the cash available to meet our other obligations, including our debt obligations with respect to our senior secured credit facilities, our senior notes and our senior subordinated notes, or to meet the needs of our business. In addition, the PBGC may terminate our U.S. defined benefit pension plans under limited circumstances, including in the event the PBGC concludes that the risk may increase unreasonably if such plans continue. In the event a U.S. defined benefit pension plan is terminated for any reason while it is underfunded, we could be required to make an immediate payment to the PBGC of all or a substantial portion of such plan’s underfunding, as calculated by the PBGC based on its own assumptions (which might result in a larger obligation than that based on the assumptions we have used to fund such plan), and the PBGC could place a lien on material amounts of our assets.
The deterioration experienced in fiscal 2009 in the securities markets has impacted the value of the assets included in our defined benefit pension plans. The deterioration in pension asset values has led to additional contribution requirements (in accordance with the plan funding requirements of the U.S. Pension Protection Act of 2006). Any further deterioration may also lead to further cash contribution requirements and increased pension costs. Recent pension funding legislative and regulatory relief provided by the U.S. government in light of the securities markets decline has reduced our short-term required pension contributions from the amount required before relief. The impact of this relief has been reflected in our projected cash contribution requirements disclosed in the consolidated financial statements.
Our historical financial data is not comparable to our current financial condition and results of operations because of our use of purchase accounting in connection with various acquisitions and due to the different basis of accounting used by us prior to the acquisition by Apollo in 2006.
It may be difficult for you to compare both our historical and future results. These acquisitions were accounted for utilizing the purchase method of accounting, which resulted in a new valuation for the assets and liabilities to their fair values. This new basis of accounting began on the date of the consummation of each transaction. Also, until our purchase price allocations are finalized for an acquisition (generally less than one year after the acquisition date), our allocation of the excess purchase price over the book value of the net assets acquired is considered preliminary and subject to future adjustment.
Risks Related to This Offering
There is no existing market for our common stock and we do not know if one will develop, which could impede your ability to sell your shares and may depress the market price of our common stock.
There has not been a public market for our common stock prior to this offering. We cannot predict the extent to which investor interest in us will lead to the development of an active trading market or how liquid that market might become. If an active trading market does not develop, you may have difficulty selling any of our common stock that you buy. The initial public offering price for the common stock will be determined by negotiations between us and the underwriters and may not be indicative of prices that will prevail in the open market following this offering. See “Underwriting.” Consequently, you may be unable to sell our common stock at prices equal to or greater than the price you pay in this offering.
26
Apollo controls us and its interests may conflict with or differ from your interests as a stockholder.
After the consummation of this offering, Apollo will beneficially own approximately % of our common stock, assuming the underwriters do not exercise their option to purchase additional shares, or % if the underwriters exercise their option in full. In addition, representatives of Apollo comprise 4 of our 8 directors. As a result, Apollo will continue to have the ability to prevent any transaction that requires the approval of our board of directors or stockholders, including the approval of significant corporate transactions such as mergers and the sale of substantially all of our assets.
The interests of Apollo could conflict with or differ from your interests as a holder of our common stock. For example, the concentration of ownership held by Apollo could delay, defer or prevent a change of control of us or impede a merger, takeover or other business combination that you as a stockholder may otherwise view favorably. Apollo is in the business of making or advising on investments in companies and holds, and may from time to time in the future acquire, interests in or provide advice to businesses that directly or indirectly compete with certain portions of our business or are suppliers or customers of ours. They may also pursue acquisitions that may be complementary to our business, and, as a result, those acquisition opportunities may not be available to us.
So long as Apollo continues to beneficially own a significant amount of our equity, even if such amount is less than 50%, it may continue to be able to strongly influence or effectively control our decisions. See “Certain Relationships and Related Party Transactions” and “Description of Capital Stock.”
We will be a “controlled company” within the meaning of the New York Stock Exchange rules and, as a result, will qualify for, and intend to rely on, exemptions from certain corporate governance requirements.
Upon the closing of this offering, Apollo will continue to control a majority of our voting common stock. As a result, we will be a “controlled company” within the meaning of the New York Stock Exchange corporate governance standards. Under the rules, a company of which more than 50% of the voting power is held by an individual, group or another company is a “controlled company” and may elect not to comply with certain New York Stock Exchange corporate governance requirements, including:
the requirement that we have a majority of independent directors on our board of directors;
the requirement that we have a nominating and corporate governance committee that is composed entirely of independent directors with a written charter addressing the committee’s purpose and responsibilities;
the requirement that we have a compensation committee that is composed entirely of independent directors with a written charter addressing the committee’s purpose and responsibilities; and
the requirement for an annual performance evaluation of the nominating and corporate governance and compensation committees.
Following this offering, we intend to utilize certain exemptions from New York Stock Exchange corporate governance requirements, including the foregoing. As a result, we will not have a majority of independent directors nor will our nominating and corporate governance and compensation committees consist entirely of independent directors and we will not be required to have an annual performance evaluation of the nominating and corporate governance and compensation committees. See “Management.” Accordingly, you will not have the same protections afforded to stockholders of companies that are subject to the New York Stock Exchange’s corporate governance requirements.
27
The price of our common stock may fluctuate significantly and you could lose all or part of your investment.
Volatility in the market price of our common stock may prevent you from being able to sell your common stock at or above the price you paid for your common stock. The market price for our common stock could fluctuate significantly for various reasons, including:
our operating and financial performance and prospects;
our quarterly or annual earnings or those of other companies in our industry;
conditions that impact demand for our products and services;
future announcements concerning our business or our competitors’ businesses;
the public’s reaction to our press releases, other public announcements and filings with the U.S. Securities and Exchange Commission, or SEC;
changes in earnings estimates or recommendations by securities analysts who track our common stock;
market and industry perception of our success, or lack thereof, in pursuing our growth strategy;
strategic actions by us or our competitors, such as acquisitions or restructurings;
changes in government and environmental regulation;
general market, economic and political conditions;
changes in accounting standards, policies, guidance, interpretations or principles;
arrival or departure of key personnel;
the number of shares to be publicly traded after this offering;
sales of common stock by us, Apollo or its affiliated funds or members of our management team;
adverse resolution of new or pending litigation against us; and
changes in general market, economic and political conditions in the United States and global economies or financial markets, including those resulting from natural disasters, terrorist attacks, acts of war and responses to such events.
In addition, the stock market has experienced significant price and volume fluctuations in recent years. This volatility has had a significant impact on the market price of securities issued by many companies, including companies in our industries. The changes frequently appear to occur without regard to the operating performance of the affected companies. Hence, the price of our common stock could fluctuate based upon factors that have little or nothing to do with us, and these fluctuations could materially reduce our share price.
We currently have no plans to pay regular dividends on our common stock, so you may not receive funds without selling your common stock.
We currently have no plans to pay regular dividends on our common stock. Any payment of future dividends will be at the discretion of our board of directors and will depend on, among other things, our earnings, financial condition, capital requirements, level of indebtedness, statutory and contractual restrictions applying to the payment of dividends, and other considerations that our board of directors deems relevant. The terms governing our outstanding debt also include limitations on the ability of our subsidiaries to pay dividends to us. Accordingly, you may have to sell some or all of your common stock in order to generate cash flow from your investment.
Future sales or the possibility of future sales of a substantial amount of our common stock may depress the price of shares of our common stock.
We may sell additional shares of common stock in subsequent public offerings or otherwise, including to finance acquisitions. We have authorized shares of common stock, of which shares will be outstanding upon consummation of this offering. This number includes shares that we are selling in this offering, which may be resold immediately in the public market. Of the remaining shares, , or %, are restricted
28
from immediate resale under the federal securities laws and the lock-up agreements with the underwriters described in the “Underwriting” section of this prospectus, but may be sold into the market in the near future. These shares will become available for sale at various times following the expiration of the lock-up agreements, which, without the prior consent of , is days after the date of this prospectus. Immediately after the expiration of the lock-up period, the shares will be eligible for resale under Rule 144 or Rule 701 of the Securities Act subject to volume limitations and applicable holding period requirements.
We cannot predict the size of future issuances of our common stock or the effect, if any, that future issuances and sales of our common stock will have on the market price of our common stock. Sales of substantial amounts of our common stock (including shares issued in connection with an acquisition), or the perception that such sales could occur, may adversely affect prevailing market prices for our common stock.
Our organizational documents may impede or discourage a takeover, which could deprive our investors of the opportunity to receive a premium for their shares.
Provisions of our certificate of incorporation and bylaws may make it more difficult for, or prevent a third party from, acquiring control of us without the approval of our board of directors. These provisions include:
having a classified board of directors;
establishing limitations on the removal of directors;
prohibiting cumulative voting in the election of directors;
empowering only the board to fill any vacancy on our board of directors, whether such vacancy occurs as a result of an increase in the number of directors or otherwise;
as long as Apollo continues to own more than 50% of our common stock, granting Apollo the right to increase the size of our board of directors and to fill the resulting vacancies at any time;
authorizing the issuance of “blank check” preferred stock without any need for action by stockholders;
eliminating the ability of stockholders to call special meetings of stockholders;
prohibiting stockholders to act by written consent if less than 50.1% of our outstanding common stock is controlled by Apollo;
| • | requiring the approval of a majority of the board of directors (including a majority of the Apollo directors) to approve business combinations so long as Apollo owns 331/3% of the shares of common stock; and |
establishing advance notice requirements for nominations for election to our board of directors or for proposing matters that can be acted on by stockholders at stockholder meetings.
Our issuance of shares of preferred stock could delay or prevent a change of control of us. Our board of directors has the authority to cause us to issue, without any further vote or action by the stockholders, shares of preferred stock, par value $0.01 per share, in one or more series, to designate the number of shares constituting any series, and to fix the rights, preferences, privileges and restrictions thereof, including dividend rights, voting rights, rights and terms of redemption, redemption price or prices and liquidation preferences of such series. The issuance of shares of our preferred stock may have the effect of delaying, deferring or preventing a change in control without further action by the stockholders, even where stockholders are offered a premium for their shares.
Together, these charter and statutory provisions could make the removal of management more difficult and may discourage transactions that otherwise could involve payment of a premium over prevailing market prices for our common stock. Furthermore, the existence of the foregoing provisions, as well as the significant common stock beneficially owned by Apollo, could limit the price that investors might be willing to pay in the future for shares of our common stock. They could also deter potential acquirers of us, thereby reducing the likelihood that you could receive a premium for your common stock in an acquisition.
29
You will experience an immediate and substantial dilution in the net tangible book value of the common stock you purchase.
Prior investors have paid substantially less per share than the price in this offering. We expect to have a net tangible book deficit after this offering of $ per share. Based on an assumed initial public offering price of $ per share, the midpoint of the estimated offering range set forth on the cover page of this prospectus, you will experience immediate and substantial dilution of approximately $ per share in net tangible book value of the common stock you purchase in this offering. See “Dilution,” including the discussion of the effects on dilution from a change in the price of this offering.
Despite our substantial indebtedness, we may still be able to incur significantly more indebtedness, which could have a material adverse effect on our business, financial condition, results of operations or cash flows.
The terms of the indentures governing our senior notes and senior subordinated notes and our senior secured credit facilities contain restrictions on our ability to incur additional indebtedness. These restrictions are subject to a number of important qualifications and exceptions, and the indebtedness, if any, incurred in compliance with these restrictions could be substantial. Accordingly, we or our subsidiaries could incur significant additional indebtedness in the future. As of March 31, 2011, we had approximately $121.7 million available for additional borrowing under the senior secured credit facilities (net of $28.3 million that was considered utilized as a result of the letters of credit), and the covenants under our debt agreements would allow us to borrow a significant amount of additional indebtedness. Additional leverage could have a material adverse effect on our business, financial condition, results of operations or cash flows and could increase the risks described in “—Our substantial indebtedness could adversely affect our ability to raise additional capital to fund our operations, limit our ability to react to changes in the economy or our industry and prevent us from making debt service payments,” “—Our debt agreements impose significant operating and financial restrictions, which could have a material adverse effect on our business, financial condition, results of operations or cash flows” and “—Because a substantial portion of our indebtedness bears interest at rates that fluctuate with changes in certain prevailing short-term interest rates, we are vulnerable to interest rate increases.”
The additional requirements of having a class of publicly traded equity securities may strain our resources and distract management.
Even though RBS Global and Rexnord LLC currently file reports with the SEC, after the consummation of this offering, we will be subject to additional reporting requirements of the Securities Exchange Act of 1934, or the Exchange Act, the Sarbanes-Oxley Act of 2002, or the Sarbanes-Oxley Act, and the Dodd-Frank Wall Street Reform and Consumer Protection Act, or the Dodd-Frank Act. The Dodd-Frank Act, signed into law on July 21, 2010, effects comprehensive changes to public company governance and disclosures in the United States and will subject us to additional federal regulation. We cannot predict with any certainty the requirements of the regulations ultimately adopted or how the Dodd-Frank Act and such regulations will impact the cost of compliance for a company with publicly traded common stock. We are currently evaluating and monitoring developments with respect to the Dodd-Frank Act and other new and proposed rules and cannot predict or estimate the amount of the additional costs we may incur or the timing of such costs. These laws, regulations and standards are subject to varying interpretations, in many cases due to their lack of specificity, and, as a result, their application in practice may evolve over time as new guidance is provided by regulatory and governing bodies. This could result in continuing uncertainty regarding compliance matters and higher costs necessitated by ongoing revisions to disclosure and governance practices. We intend to invest resources to comply with evolving laws, regulations and standards, and this investment may result in increased general and administrative expenses and a diversion of management’s time and attention from revenue-generating activities to compliance activities. If our efforts to comply with new laws, regulations and standards differ from the activities intended by regulatory or governing bodies due to ambiguities related to practice, regulatory authorities may initiate legal proceedings against us and our business may be harmed. We also expect that being a company with publicly traded common stock and these new rules and regulations will make it more expensive for us to obtain director and officer
30
liability insurance, and we may be required to accept reduced coverage or incur substantially higher costs to obtain coverage. These factors could also make it more difficult for us to attract and retain qualified members of our board of directors, particularly to serve on our audit committee, and qualified executive officers.
The Sarbanes-Oxley Act requires that we maintain effective disclosure controls and procedures and internal control for financial reporting. These requirements may place a strain on our systems and resources. Under Section 404 of the Sarbanes-Oxley Act, we will be required to include a report of management on our internal control over financial reporting in our Annual Reports on Form 10-K. After consummation of this offering, our independent public accountants auditing our financial statements must attest to the effectiveness of our internal control over financial reporting. This requirement will first apply to our Annual Report on Form 10-K for our year ending March 31, 2013. In order to maintain and improve the effectiveness of our disclosure controls and procedures and internal control over financial reporting, significant resources and management oversight will be required. This may divert management’s attention from other business concerns, which could have a material adverse effect on our business, financial condition, results of operations and cash flows. If we are unable to conclude that our disclosure controls and procedures and internal control over financial reporting are effective, or if our independent public accounting firm is unable to provide us with an unqualified report as to management’s assessment of the effectiveness of our internal control over financial reporting in future years, investors may lose confidence in our financial reports and our stock price may decline.
31
CAUTIONARY NOTICE REGARDING FORWARD-LOOKING STATEMENTS
This prospectus includes “forward-looking statements” within the meaning of the federal securities laws that involve risks and uncertainties. Forward-looking statements include statements we make concerning our plans, objectives, goals, strategies, future events, future revenues or performance, capital expenditures, financing needs and other information that is not historical information and, in particular, appear under the headings “Summary,” “Risk Factors,” “Management’s Discussion and Analysis of Financial Condition and Results of Operations” and “Business.” When used in this prospectus, the words “estimates,” “expects,” “anticipates,” “projects,” “forecasts,” “plans,” “intends,” “believes,” “foresees,” “seeks,” “likely,” “may,” “might,” “will,” “should,” “goal,” “target” or “intends” and variations of these words or similar expressions (or the negative versions of any such words) are intended to identify forward-looking statements. All forward-looking statements are based upon information available to us on the date of this prospectus.
These forward-looking statements are subject to risks, uncertainties and other factors, many of which are outside of our control, that could cause actual results to differ materially from the results discussed in the forward-looking statements, including, among other things, the matters discussed in this prospectus in the sections captioned “Summary,” “Risk Factors,” “Management’s Discussion and Analysis of Financial Condition and Results of Operations” and “Business.” Some of the factors that we believe could affect our results include:
the impact of our substantial indebtedness;
the effect of local and national economic, credit and capital market conditions on the economy in general, and on the industries in which we operate in particular;
access to available and reasonable financing on a timely basis;
our competitive environment;
dependence on independent distributors;
general economic and business conditions, market factors and our dependence on customers in cyclical industries;
the seasonality of our sales;
impact of weather on the demand for our products;
availability of financing for our customers;
changes in technology and manufacturing techniques;
loss of key personnel;
increases in cost of our raw materials and our possible inability to increase product prices to offset such increases;
the loss of any significant customer;
inability to make necessary capital expenditures;
risks associated with international operations;
the costs of environmental compliance and/or the imposition of liabilities under environmental, health and safety laws and regulations;
the costs of asbestos claims;
the costs of Zurn’s class action litigation;
a declining construction market;
solvency of insurance carriers;
32
viability of key suppliers;
reliance on intellectual property;
potential product liability claims;
work stoppages by unionized employees;
integration of recent and future acquisitions into our business;
changes in pension funding requirements;
control by our principal equityholders; and
the other factors set forth herein, including those set forth under “Risk Factors.”
There are likely other factors that could cause our actual results to differ materially from the results referred to in the forward-looking statements. All forward-looking statements attributable to us apply only as of the date of this prospectus and are expressly qualified in their entirety by the cautionary statements included in this prospectus. We undertake no obligation to publicly update or revise forward-looking statements to reflect events or circumstances after the date made or to reflect the occurrence of unanticipated events, except as required by law.
33
Assuming an initial public offering price of $ per share, we estimate that we will receive net proceeds from this offering of approximately $ million, after deducting underwriting discounts and commissions and other estimated expenses of $ million payable by us. This estimate assumes an initial public offering price of $ per share, the midpoint of the range set forth on the cover page of this prospectus. A $1.00 increase (decrease) in the assumed initial public offering price of $ per share would increase (decrease) the net proceeds to us from this offering by $ , assuming the number of shares offered by us, as set forth on the cover page of this prospectus, remains the same and after deducting the estimated underwriting discounts and commissions and estimated expenses payable by us.
We intend to use the net proceeds that we receive (i) to redeem up to $300.0 million in aggregate principal amount of our 11.75% senior subordinated notes due 2016 plus early redemption premiums of $ million and accrued interest, (ii) to pay Apollo or its affiliates a fee of $ million upon the consummation of this offering in connection with the termination of our management services agreement, as described under “Certain Relationships and Related Party Transactions,” and (iii) for general corporate purposes. As of March 31, 2011, we had $300.0 million in aggregate principal amount of our 11.75% senior subordinated notes outstanding, which bear interest at a rate of 11.75% per annum and mature on August 1, 2016.
Any net proceeds used to redeem all $300.0 million of outstanding aggregate principal amount of our 11.75% senior subordinated notes would be first contributed by the Company to RBS Global so that RBS Global may effect such redemption or repayment. Pending the application of the net proceeds of this offering, as described above, all or a portion of the net proceeds of this offering may be invested by us in short-term interest bearing investments.
34
We currently intend to retain all future earnings, if any, for use in the operation of our business and to fund future growth. In addition, our senior secured credit facilities and the indentures governing our senior notes limit our ability to pay dividends or other distributions on our common stock. See “Description of Indebtedness.” The decision whether to pay dividends will be made by our board of directors in light of conditions then existing, including factors such as our results of operations, financial condition and requirements, business conditions and covenants under any applicable contractual arrangements.
35
The following table sets forth our capitalization as of March 31, 2011:
on an actual basis;
on a pro forma, as adjusted, basis giving effect to the repayment of the PIK toggle senior indebtedness as described below (which is occurring irrespective of the offering); and
on a pro forma, as further adjusted, basis giving effect to our sale of shares of common stock in this offering at an assumed offering price of $ , which is the midpoint of the range listed on the cover page of this prospectus, and our expected use of the net proceeds of this offering, as well as the repayment of the PIK toggle senior indebtedness as described below (which is occurring irrespective of the offering).
You should read this table in conjunction with our financial statements and related notes for the fiscal year ended March 31, 2011, “Management’s Discussion and Analysis of Financial Condition and Results of Operations” and “Use of Proceeds” included elsewhere in this prospectus.
| As of March 31, 2011 (1) | ||||||||||||
| (in millions, except share amounts) | Actual | Pro forma as adjusted for extinguishment of PIK toggle senior indebtedness | Pro forma as further adjusted (2) | |||||||||
Debt: | ||||||||||||
Term loans | $ | 761.5 | $ | 761.5 | $ | 761.5 | ||||||
Borrowing under revolving credit facility | — | — | — | |||||||||
Accounts receivable securitization program | — | — | — | |||||||||
PIK toggle senior indebtedness (3) | 93.2 | — | — | |||||||||
8.50% senior notes due 2018 | 1,145.0 | 1,145.0 | 1,145.0 | |||||||||
8.875% senior notes due 2016 | 2.0 | 2.0 | 2.0 | |||||||||
11.75% senior subordinated notes due 2016 | 300.0 | 300.0 | — | |||||||||
Other (4) | 12.4 | 12.4 | 12.4 | |||||||||
Total debt, including current portion | 2,314.1 | 2,220.9 | 1,920.9 | |||||||||
Stockholders’ equity (deficit): | ||||||||||||
Common stock, $0.01 par value; shares authorized and shares issued (5) | 0.2 | 0.2 | ||||||||||
Additional paid-in capital | 293.3 | 293.3 | ||||||||||
Retained earnings (deficit) (6) | (391.5 | ) | (392.0 | ) | ||||||||
Accumulated other comprehensive income | 16.1 | 16.1 | ||||||||||
Treasury stock at cost (216,423 shares) | (6.3 | ) | (6.3 | ) | ||||||||
Total stockholders’ equity (deficit) | (88.2 | ) | (88.7 | ) | ||||||||
Total capitalization | $ | 2,225.9 | 2,132.2 | |||||||||
| (1) | As of March 31, 2011 we had cash and cash equivalents of $391.0 million on a historical basis, $296.9 million on a pro forma basis, as adjusted for the extinguishment of our PIK toggle senior indebtedness, and $ million, on a pro forma basis, as further adjusted to give effect to the offering. |
| (2) | A $1.00 increase (decrease) in the assumed initial public offering price of $ per share (the midpoint of the range set forth on the cover page of this prospectus) would increase (decrease) each of cash, additional paid-in capital and total capitalization by $ , assuming the number of shares offered by us, as set forth on the cover page of this prospectus, remains the same and after deducting the estimated underwriting discounts and commissions and estimated expenses payable by us. |
36
| (3) | Includes unamortized original issue discount of $0.4 million at March 31, 2011. We have prepaid $53.7 million in principal amount of this indebtedness on May 13, 2011, and have commenced procedures to extinguish the remaining balance of the Company’s PIK toggle senior indebtedness at face value in June 2011. This extinguishment has been or will be funded through our existing liquidity and is not dependent on proceeds from this offering. |
| (4) | Primarily consists of foreign borrowings and capital lease obligations. |
| (5) | We expect to complete a for one stock split of our common stock prior to the completion of this offering. All share amounts have been retroactively adjusted to give effect to this stock split. |
| (6) | Pro forma as further adjusted retained deficit reflects the impact of this offering and the intended use of proceeds. |
37
Dilution is the amount by which the offering price paid by the purchasers of the common stock to be sold in this offering exceeds the net tangible book value per share of common stock after the offering. Net tangible book value per share is determined at any date by subtracting our total liabilities from the total book value of our tangible assets and dividing the difference by the number of shares of common stock deemed to be outstanding at that date.
Our net tangible book deficit as of March 31, 2011 was $1.749 billion, or $109.13 per share. After giving effect to the receipt and our intended use of approximately $ million of estimated net proceeds from our sale of shares of common stock in this offering at an assumed offering price of $ per share, which represents the midpoint of the range set forth on the front cover of this prospectus, our adjusted net tangible book deficit as of , 2011 would have been approximately $ million, or $ per share. This represents an immediate increase in pro forma net tangible book value of $ per share to existing stockholders and an immediate dilution of $ per share to new investors purchasing shares of common stock in the offering. The following table illustrates this substantial and immediate per share dilution to new investors:
| Per Share | ||||
Assumed initial public offering price per share | $ | |||
Net tangible book value (deficit) before the offering | (109.13 | ) | ||
Increase per share attributable to investors in the offering | ||||
Pro forma net tangible book value (deficit) after the offering | ||||
Dilution per share to new investors | $ | |||
A $1.00 increase (decrease) in the assumed initial public offering price of $ per share would increase (decrease) our pro forma net tangible book value by $ , the as adjusted net tangible book value per share after this offering by $ per share and the dilution per share to new investors in this offering by $ , assuming the number of shares offered by us, as set forth on the cover page of this prospectus, remains the same and after deducting the estimated underwriting discounts and commissions and estimated expenses payable by us.
The following table summarizes on an as adjusted basis as of , 2011, giving effect to:
the total number of shares of common stock purchased from us;
the total consideration paid to us, assuming an initial public offering price of $ per share (before deducting the estimated underwriting discount and commissions and offering expenses payable by us in connection with this offering); and
the average price per share paid by existing stockholders and by new investors purchasing shares in this offering:
| Shares Purchased | Total Consideration | Average Price Per | ||||||||||||||||||
| Number | Percent | Amount | Percent | Share | ||||||||||||||||
Existing stockholders | % | $ | % | $ | ||||||||||||||||
Investors in the offering | % | % | ||||||||||||||||||
Total | 100 | % | $ | 100 | % | $ | ||||||||||||||
38
A $1.00 increase (decrease) in the assumed initial public offering price of $ per share (the midpoint of the range set forth on the cover page of this prospectus) would increase (decrease) total consideration paid by existing stockholders, total consideration paid by new investors and the average price per share by $ , $ and $ , respectively, assuming the number of shares offered by us, as set forth on the cover page of this prospectus, remains the same, and without deducting underwriting discounts and commissions and estimated expenses payable by us.
The tables and calculations above assume no exercise of stock options outstanding as of , 2011 to purchase shares of common stock at a weighted average exercise price of $ per share. If these options were exercised at the weighted average exercise price, the additional dilution per share to new investors would be $ .
The tables and calculations above also assume no exercise of the underwriters’ over-allotment option. If the underwriters exercise their over-allotment option in full, then new investors would purchase shares, or approximately % of shares outstanding, the total consideration paid by new investors would increase to $ , or % of the total consideration paid (based on the midpoint of the range set forth on the cover page of this prospectus), and the additional dilution per share to new investors would be $ .
39
SELECTED FINANCIAL INFORMATION
The selected financial information as of March 31, 2010 and 2011 and for our fiscal years ended March 31, 2009, 2010 and 2011 have been derived from our consolidated financial statements and related notes thereto, which have been audited by Ernst & Young LLP, an independent registered public accounting firm, and are included elsewhere in this prospectus. The financial information for the years ended March 31, 2007 and 2008 have also been derived from financial statements audited by Ernst & Young LLP. The period from April 1, 2006 to July 21, 2006 includes the accounts of RBS Global prior to the acquisition by Apollo. The period from July 22, 2006 to March 31, 2007 includes the accounts of RBS Global after the Apollo acquisition. These two periods account for our fiscal year ended March 31, 2007. We refer to the financial statements prior to the Apollo acquisition as “Predecessor.” The following information should be read in conjunction with “Management’s Discussion and Analysis of Financial Condition and Results of Operations” and our consolidated financial statements and related notes thereto included elsewhere in this prospectus.
| Predecessor (1) | Successor | |||||||||||||||||||||||||||
(dollars in millions, except share and per share amounts) | Period from April 1, 2006 through July 21, 2006 | Period from July 22, 2006 through March 31, 2007 (2) | Year Ended March 31, 2008 (3) (4) | Year Ended March 31, 2009 (4) (5) | Year Ended March 31, 2010 (4) | Year Ended March 31, 2011 | ||||||||||||||||||||||
Statement of Operations: | ||||||||||||||||||||||||||||
Net Sales | $ | 334.2 | $ | 921.5 | $ | 1,853.5 | $ | 1,882.0 | $ | 1,510.0 | $ | 1,699.6 | ||||||||||||||||
Cost of Sales | 237.7 | 628.2 | 1,250.4 | 1,290.1 | 994.4 | 1,102.8 | ||||||||||||||||||||||
Gross Profit | 96.5 | 293.3 | 603.1 | 591.9 | 515.6 | 596.8 | ||||||||||||||||||||||
Selling, General and Administrative Expenses | 63.1 | 159.3 | 313.3 | 467.8 | 297.7 | 329.1 | ||||||||||||||||||||||
Loss on Divestiture (6) | — | — | 11.2 | — | — | — | ||||||||||||||||||||||
(Gain) on Canal Street Facility Accident, net (7) | — | (6.0 | ) | (29.2 | ) | — | — | — | ||||||||||||||||||||
Intangible Impairment Charges | — | — | — | 422.0 | — | — | ||||||||||||||||||||||
Transaction-Related Costs (8) | 62.7 | — | — | — | — | — | ||||||||||||||||||||||
Restructuring and Other Similar Costs | — | — | — | 24.5 | 6.8 | — | ||||||||||||||||||||||
Amortization of Intangible Assets | 5.0 | 26.9 | 49.9 | 48.9 | 49.7 | 48.6 | ||||||||||||||||||||||
(Loss) Income from Operations | (34.3 | ) | 113.1 | 257.9 | (371.3 | ) | 161.4 | 219.1 | ||||||||||||||||||||
Non-Operating Income (Expense): | ||||||||||||||||||||||||||||
Interest Expense, net | (21.0 | ) | (109.8 | ) | (254.3 | ) | (230.4 | ) | (194.2 | ) | (180.8 | ) | ||||||||||||||||
Gain (Loss) on Debt Extinguishment | — | — | — | 103.7 | 167.8 | (100.8 | ) | |||||||||||||||||||||
Other (Expense) Income, net | (0.4 | ) | 5.7 | (5.3 | ) | (3.0 | ) | (16.4 | ) | 1.1 | ||||||||||||||||||
(Loss) Income Before Income Taxes | (55.7 | ) | 9.0 | (1.7 | ) | (501.0 | ) | 118.6 | (61.4 | ) | ||||||||||||||||||
(Benefit) Provision for Income Taxes | (16.1 | ) | 9.2 | (1.3 | ) | (72.0 | ) | 30.5 | (10.1 | ) | ||||||||||||||||||
Net (Loss) Income | $ | (39.6 | ) | $ | (0.2 | ) | $ | (0.4 | ) | $ | (429.0 | ) | $ | 88.1 | $ | (51.3 | ) | |||||||||||
Net (loss) Income per share: | ||||||||||||||||||||||||||||
Basic | ||||||||||||||||||||||||||||
Diluted | ||||||||||||||||||||||||||||
Weighted-average number of shares outstanding: | ||||||||||||||||||||||||||||
Basic | ||||||||||||||||||||||||||||
Effect of dilutive stock options | ||||||||||||||||||||||||||||
Diluted | ||||||||||||||||||||||||||||
Other Data: | ||||||||||||||||||||||||||||
Net Cash (Used for) Provided by: | ||||||||||||||||||||||||||||
Operating Activities | (4.4 | ) | 63.4 | 232.7 | 155.0 | 155.5 | 164.5 | |||||||||||||||||||||
Investing Activities | (15.7 | ) | (1,925.5 | ) | (121.6 | ) | (54.5 | ) | (22.0 | ) | (35.5 | ) | ||||||||||||||||
Financing Activities | 8.2 | 1,909.0 | (15.6 | ) | 36.6 | (161.5 | ) | (6.9 | ) | |||||||||||||||||||
Depreciation and Amortization of Intangible Assets | 19.0 | 63.0 | 104.1 | 109.6 | 109.3 | 106.1 | ||||||||||||||||||||||
Capital Expenditures | 11.7 | 28.0 | 54.9 | 39.1 | 22.0 | 37.6 | ||||||||||||||||||||||
40
| March 31, | ||||||||||||||||||||
| (dollars in millions) | 2007 | 2008 | 2009 | 2010 | 2011 | |||||||||||||||
Balance Sheet Data: | ||||||||||||||||||||
Cash and Cash Equivalents | $ | 58.2 | $ | 156.3 | $ | 287.9 | $ | 263.9 | $ | 391.0 | ||||||||||
Working Capital (9) | 368.5 | 447.1 | 555.2 | 481.9 | 483.6 | |||||||||||||||
Total Assets | 3,783.4 | 3,826.3 | 3,218.8 | 3,016.5 | 3,099.7 | |||||||||||||||
Total Debt (10) | 2,496.9 | 2,536.8 | 2,526.1 | 2,215.5 | 2,314.1 | |||||||||||||||
Stockholders’ Equity (Deficit) | 256.3 | 273.1 | (177.8 | ) | (57.5 | ) | (88.2 | ) | ||||||||||||
| (1) | Consolidated financial data for all periods subsequent to July 21, 2006 (the date of the Apollo acquisition) reflects the fair value of assets acquired and liabilities assumed as a result of that transaction. The comparability of the operating results for the periods presented is affected by the revaluation of the assets acquired and liabilities assumed on the date of the Apollo acquisition. |
| (2) | Consolidated financial data as of March 31, 2007 and for the period from July 22, 2006 through March 31, 2007 reflects the estimated fair value of assets acquired and liabilities assumed in connection with the Zurn acquisition on February 7, 2007. As a result, the comparability of the operating results for the periods presented is affected by the revaluation of the assets acquired and liabilities assumed on the date of both the Apollo and Zurn acquisitions. |
| (3) | Consolidated financial data as of and for the year ended March 31, 2008 reflects the estimated fair value of assets acquired and liabilities assumed in connection with the GA acquisition on January 31, 2008. As a result, the comparability of the operating results for the periods presented is affected by the revaluation of the assets acquired and liabilities assumed on the date of the GA acquisition. |
| (4) | Financial data for fiscal 2008 to 2010 has been adjusted for our voluntary change in accounting for actuarial gains and losses related to its pension and other postretirement benefit plans. The change in accounting did not have any impact on the financial data prior to fiscal 2008. See Note 2 to our audited consolidated financial statements included elsewhere in this prospectus. |
| (5) | Consolidated financial data as of and for the year ended March 31, 2009 reflects the estimated fair value of assets acquired and liabilities assumed in connection with the Fontaine acquisition on February 27, 2009. As a result, the comparability of the operating results for the periods presented is affected by the revaluation of the assets acquired and liabilities assumed on the date of the Fontaine acquisition. |
| (6) | On March 28, 2008, we sold a French subsidiary, Rexnord SAS, to members of our local management team for €1 (one Euro). This loss includes Rexnord SAS’s cash on hand of $2.5 million at March 28, 2008, that pursuant to the agreement was included with the net assets divested. |
| (7) | We recognized a net gain of $35.2 million related to an accident at our Canal Street (Wisconsin) facility from the date of the accident (December 6, 2006) through March 31, 2008. $14.2 million of the net gain represents the excess property insurance recoveries (at replacement value) over the write-off of tangible assets (at net book value) and other direct expenses related to the accident. The remaining $21.0 million gain is comprised of business interruption insurance recoveries. |
| (8) | Transaction-related costs represent expenses incurred in connection with the Apollo acquisition on July 21, 2006. |
| (9) | Represents total current assets less total current liabilities. |
| (10) | Total debt represents long-term debt plus the current portion of long-term debt. |
41
MANAGEMENT’S DISCUSSION AND ANALYSIS OF
FINANCIAL CONDITION AND RESULTS OF OPERATIONS
The following discussion of results of operations and financial condition covers periods prior to the acquisition of Fontaine-Alliance Inc. and affiliates (“Fontaine”). Our financial performance includes Fontaine subsequent to February 28, 2009. Accordingly, the discussion and analysis of fiscal 2009 does not fully reflect the impact of the Fontaine transaction. You should read the following discussion of our results of operations and financial condition together with the “Selected Financial Information” and all of our consolidated financial statements and related notes included elsewhere in this prospectus. Our fiscal year is the year ending March 31 of the corresponding calendar year. For example, our fiscal year 2011, means the period from April 1, 2010 to March 31, 2011. This discussion contains forward-looking statements and involves numerous risks and uncertainties, including, but not limited to, those described in the “Risk Factors” section of this prospectus. Actual results may differ materially from those contained in any forward-looking statements. See also “Cautionary Notice Regarding Forward-Looking Statements” found elsewhere in this prospectus.
The information contained in this section is provided as a supplement to the audited consolidated financial statements and the related notes included elsewhere in this prospectus to help provide an understanding of our financial condition, changes in our financial condition and results of our operations. This section is organized as follows:
Company Overview. This section provides a general description of our business.
Restructuring and Other Similar Costs. This section provides a description of the restructuring actions we executed to reduce operating costs and improve profitability.
Financial Statement Presentation. This section provides a brief description of certain items and accounting policies that appear in our financial statements and general factors that impact these items.
Critical Accounting Estimates. This section discusses the accounting policies and estimates that we consider to be important to our financial condition and results of operations and that require significant judgment and estimates on the part of management in their application.
Results of Operations. This section provides an analysis of our results of operations for our fiscal years ended March 31, 2009, 2010 and 2011, in each case as compared to the prior period’s performance.
Non-GAAP Financial Measure. This section provides an explanation of a certain Non-GAAP financial measure we use.
Covenant Compliance. This section provides a description of certain restrictive covenants with which our credit agreement and indentures require us to comply.
Liquidity and Capital Resources. This section provides an analysis of our cash flows for our fiscal years ended March 31, 2009, 2010 and 2011, as well as a discussion of our indebtedness and its potential effects on our liquidity.
Tabular Disclosure of Contractual Obligations. This section provides a discussion of our commitments as of March 31, 2011.
Quantitative and Qualitative Disclosures about Market Risk. This section discusses our exposure to potential losses arising from adverse changes in interest rates and commodity prices.
Company Overview
Rexnord is a growth-oriented, multi-platform industrial company with what we believe are leading market shares and highly trusted brands that serve a diverse array of global end-markets. Our heritage of innovation and specification have allowed us to provide highly engineered, mission critical solutions to customers for decades and affords us the privilege of having long-term, valued relationships with market leaders. We operate our
42
company in a disciplined way and RBS is our operating philosophy. Grounded in the spirit of continuous improvement, RBS creates a scalable, process-based framework that focuses on driving superior customer satisfaction and financial results by targeting world-class operating performance throughout all aspects of our business.
Restructuring and Other Similar Costs
Beginning with the quarter ended September 28, 2008, we executed certain restructuring actions to reduce operating costs and improve profitability. As the restructuring actions were substantially completed during fiscal 2010, we did not record any restructuring charges during the year ended March 31, 2011. Comparatively, we recorded restructuring charges of $24.5 million and $6.8 million for the years ended March 31, 2009 and 2010, respectively, primarily consisting of severance costs related to workforce reductions.
Financial Statement Presentation
The following paragraphs provide a brief description of certain items and accounting policies that appear in our financial statements and general factors that impact these items.
Net Sales. Net sales represent gross sales less deductions taken for sales returns and allowances and incentive rebate programs.
Cost of Sales. Cost of sales includes all costs of manufacturing required to bring a product to a ready for sale condition. Such costs include direct and indirect materials, direct and indirect labor costs, including fringe benefits, supplies, utilities, depreciation, insurance, pension and postretirement benefits, information technology costs and other manufacturing related costs.
The largest component of our cost of sales is cost of materials, which represented approximately 36% of net sales in fiscal 2011. The principal materials used in our Process & Motion Control manufacturing processes are commodities that are available from numerous sources and include sheet, plate and bar steel, castings, forgings, high-performance engineered plastics and a wide variety of other components. Within Water Management, we purchase a broad range of materials and components throughout the world in connection with our manufacturing activities. Major raw materials and components include bar steel, brass, castings, copper, forgings, high-performance engineered plastic, plate steel, resin, sheet plastic and zinc. We have a strategic sourcing program to significantly reduce the number of direct and indirect suppliers we use and to lower the cost of purchased materials.
The next largest component of our cost of sales is direct and indirect labor, which represented approximately 16% of net sales in fiscal 2011. Direct and indirect labor and related fringe benefit costs are susceptible to inflationary trends.
Selling, General and Administrative Expenses. Selling, general and administrative expenses primarily includes sales and marketing, finance and administration, engineering and technical services and distribution. Our major cost elements include salary and wages, fringe benefits, pension and postretirement benefits, insurance, depreciation, advertising, travel and information technology costs.
Critical Accounting Estimates
The methods, estimates and judgments we use in applying our critical accounting policies have a significant impact on the results we report in our consolidated financial statements. We evaluate our estimates and judgments on an on-going basis. We base our estimates on historical experience and on assumptions that we believe to be reasonable under the circumstances. Our experience and assumptions form the basis for our judgments about the carrying value of assets and liabilities that are not readily apparent from other sources. Actual results may vary from what we anticipate and different assumptions or estimates about the future could
43
change our reported results. Within the context of these critical accounting policies, we are not currently aware of any reasonably likely event that would result in materially different amounts being reported.
We believe the following accounting policies are the most critical to us in that they are important to our financial statements and they require our most difficult, subjective or complex judgments in the preparation of our consolidated financial statements.
Revenue recognition.Net sales are recorded upon transfer of title and risk of product loss to the customer. Net sales relating to any particular shipment are based upon the amount invoiced for the delivered goods less estimated future rebate payments and sales returns which are based upon historical experience. Revisions to these estimates are recorded in the period in which the facts that give rise to the revision become known. The value of returned goods during each of the years ended March 31, 2009, 2010 and 2011 was approximately 1.0% or less of net sales. Other than a standard product warranty, there are no other significant post-shipment obligations.
Receivables. Receivables are stated net of allowances for doubtful accounts of $9.6 million at March 31, 2010 and $5.3 million at March 31, 2011. On a regular basis, we evaluate our receivables and establish the allowance for doubtful accounts based on a combination of specific customer circumstances and historical write-off experience. Credit is extended to customers based upon an evaluation of their financial position. Generally, advance payment is not required. Credit losses are provided for in the consolidated financial statements and consistently have been within management’s expectations.
Inventory. Inventories are stated at the lower of cost or market. Market is determined based on estimated net realizable values. Approximately 70% of the Company’s total inventories as of March 31, 2010 and 2011 were valued using the “last-in, first-out” (LIFO) method. All remaining inventories are valued using the “first-in, first-out” (FIFO) method. The valuation of inventories includes material, labor and overhead and requires management to determine the amount of manufacturing variances to capitalize into inventories. We capitalize material, labor and overhead variances into inventories based upon estimates of key drivers, which generally include raw material purchases (for material variances), standard labor (for labor variances) and calculations of inventory turnover (for overhead variances).
In some cases we have determined a certain portion of our inventories are excess or obsolete. In those cases, we write down the value of those inventories to their net realizable value based upon assumptions about future demand and market conditions. If actual market conditions are less favorable than those projected by management, additional inventory write-downs may be required. The total write-down of inventories charged to expense was $17.2 million, $7.1 million, and $3.8 million, during fiscal 2009, 2010, and 2011, respectively. The reduction in inventory write-downs charged to expense in fiscal 2010 and 2011 relates to decreased levels of excess and obsolete inventory given the stabilization in market conditions that were the cause of significant destocking throughout fiscal 2009.
Impairment of intangible assets and tangible fixed assets. Our intangible assets and tangible fixed assets are held at historical cost, net of depreciation and amortization, less any provision for impairment.
Intangible assets are amortized over the shorter of their legal life or estimated useful life as follows:
| Trademarks and tradenames | No amortization (indefinite life) | |
Patents | 2 to 20 years | |
Customer Relationships | 3 to 15 years | |
Non-compete | 2 to 5 years |
44
Tangible fixed assets are depreciated to their residual values on a straight-line basis over their estimated useful lives as follows:
| Land | No depreciation | |
Buildings and improvements | 10 to 30 years | |
Machinery and equipment | 5 to 10 years | |
Computer hardware and software | 3 to 5 years |
An impairment review of specifically identifiable amortizable intangible or tangible fixed assets is performed if an indicator of impairment, such as an operating loss or cash outflow from operating activities or a significant adverse change in the business or market place, exists. Estimates of future cash flows used to test the asset for impairment are based on current operating projections extended to the useful life of the asset group and are, by their nature, subjective.
Our recorded goodwill and indefinite lived intangible assets are not amortized but are tested annually for impairment or whenever circumstances indicate that impairment may exist using a discounted cash flow methodology based on future business projections and a market value approach. The discount rate utilized within our impairment test is based upon the weighted average cost of capital of comparable public companies.
During the year ended March 31, 2009, the Company recorded a non-cash pre-tax impairment charge associated with goodwill and identifiable intangible assets of $422.0 million, of which $319.3 million related to goodwill impairment and $102.7 million related to other identifiable intangible asset impairments. See Note 8 to our audited consolidated financial statements included elsewhere in this prospectus for more information regarding the prior year impairment charge.
The Company expects to recognize amortization expense on the intangible assets subject to amortization of $47.9 million in fiscal year 2012, and $47.5 million in each of fiscal years 2013, 2014, 2015, and 2016.
Retirement benefits. We have significant pension and post-retirement benefit income and expense and assets/liabilities that are developed from actuarial valuations. These valuations include key assumptions regarding discount rates, expected return on plan assets, mortality rates, merit and promotion increases and the current health care cost trend rate. We consider current market conditions in selecting these assumptions. Changes in the related pension and post-retirement benefit income/costs or assets/liabilities may occur in the future due to changes in the assumptions and changes in asset values.
During the fourth quarter of fiscal 2011, we voluntarily changed our method of accounting for actuarial gains and losses related to our pension and other postretirement benefit plans. Previously, we recognized actuarial gains and losses as a component of Stockholders’ Equity on the consolidated balance sheets and amortized the actuarial gains and losses over participants’ average remaining service period, or average remaining life expectancy, when all or almost all plan participants are inactive, as a component of net periodic benefit cost if the unrecognized gain or loss exceeded 10 percent of the greater of the market-related value of plan assets or the plan’s projected benefit obligation at the beginning of the year (the “corridor”). Under the new method, the net actuarial gains or losses in excess of the corridor will be recognized immediately in operating results during the fourth quarter of each fiscal year (or upon any re-measurement date). Net periodic benefit costs recorded on a quarterly basis would continue to primarily be comprised of service and interest cost, amortization of unrecognized prior service cost and the expected return on plan assets. While the historical method of recognizing actuarial gains and losses was considered acceptable, we believe this method is preferable as it accelerates the recognition of actuarial gains and losses outside of the corridor. See Note 2 to our audited consolidated financial statements included elsewhere in this prospectus for a presentation of our operating results before and after the application of this accounting change.
45
The obligation for postretirement benefits other than pension also is actuarially determined and is affected by assumptions including the discount rate and expected future increase in per capita costs of covered postretirement health care benefits. Changes in the discount rate and differences between actual and assumed per capita health care costs may affect the recorded amount of the expense in future periods.
Income taxes. We are subject to income taxes in the United States and numerous foreign jurisdictions. Significant judgment is required in determining our worldwide provision for income taxes and recording the related deferred tax assets and liabilities.
We assess our income tax positions and record tax liabilities for all years subject to examination based upon management’s evaluation of the facts and circumstances and information available at the reporting dates. For those income tax positions where it is more-likely-than-not that a tax benefit will be sustained upon the conclusion of an examination, we have recorded the largest amount of tax benefit having a cumulatively greater than 50% likelihood of being realized upon ultimate settlement with the applicable taxing authority, assuming that it has full knowledge of all relevant information. For those tax positions which do not meet the more-likely-than-not threshold regarding the ultimate realization of the related tax benefit, no tax benefit has been recorded in the financial statements. In addition, we have provided for interest and penalties, as applicable, and record such amounts as a component of the overall income tax provision.
We recognize deferred tax assets and liabilities based on the differences between the financial statement carrying amounts and the tax bases of assets and liabilities, net operating losses, tax credits and other carryforwards. We regularly review our deferred tax assets for recoverability and establish a valuation allowance based on historical losses, projected future taxable income and the expected timing of the reversals of existing temporary differences. As a result of this review, we have established a valuation allowance against substantially all of our deferred tax assets relating to foreign loss carryforwards, state net operating loss and foreign tax credit carryforwards.
Commitments and Contingencies. We are subject to proceedings, lawsuits and other claims related to environmental, labor, product and other matters. We are required to assess the likelihood of any adverse judgments or outcomes to these matters as well as potential ranges of probable losses. We determine the amount of reserves needed, if any, for each individual issue based on our professional knowledge and experience and discussions with legal counsel. The required reserves may change in the future due to new developments in each matter, the ultimate resolution of each matter or changes in approach, such as a change in settlement strategy.
Through acquisitions, we have assumed presently recorded and potential future liabilities relating to product liability, environmental and other claims. We have recorded reserves for claims related to these obligations when appropriate and, on certain occasions, have obtained the assistance of an independent actuary in the determination of those reserves. If actual experience deviates from our estimates, we may need to record adjustments to these liabilities in future periods.
Warranty Reserves. Reserves are recorded on our consolidated balance sheets to reflect our contractual liabilities relating to warranty commitments to our customers. We provide warranty coverage of various lengths and terms to our customers depending on standard offerings and negotiated contractual agreements. We record an estimate for warranty expense at the time of sale based on historical warranty return rates and repair costs. Should future warranty experience differ materially from our historical experience, we may be required to record additional warranty reserves which could have a material adverse effect on our results of operations in the period in which these additional reserves are required.
Environmental Liabilities. We accrue an estimated liability for each environmental matter when the likelihood of an unfavorable outcome is probable and the amount of loss associated with such unfavorable outcome is reasonably estimable. We presume that a matter is probable of an unfavorable outcome if (a) litigation has commenced or a claim has been asserted or if commencement of litigation or assertion of a claim is probable and (b) if we are somehow associated with the site. In addition, if the reporting entity has been named as a PRP, an unfavorable outcome is presumed.
46
Estimating environmental remediation liabilities involves an array of issues at any point in time. In the early stages of the process, cost estimates can be difficult to derive because of uncertainties about a variety of factors. For this reason, estimates developed in the early stages of remediation can vary significantly, and, in many cases, early estimates later require significant revision. The following are some of the factors that are integral to developing cost estimates:
The extent and types of hazardous substances at a site;
The range of technologies that can be used for remediation;
Evolving standards of what constitutes acceptable remediation; and
The number and financial condition of other PRPs and the extent of their responsibility for the remediation.
An estimate of the range of an environmental remediation liability typically is derived by combining estimates of various components of the liability, which themselves are likely to be ranges. At the early stages of the remediation process, particular components of the overall liability may not be reasonably estimable. This fact does not preclude our recognition of a liability. Rather, the components of the liability that can be reasonably estimated are viewed as a surrogate for the minimum in the range of our overall liability. Estimated legal and consulting fees are included as a component of our overall liability.
Asbestos Claims and Insurance for Asbestos Claims. As noted in Note 18 to our consolidated financial statements included elsewhere in this prospectus, certain Water Management subsidiaries are subject to asbestos litigation. As a result, we have recorded a liability for pending and potential future asbestos claims, as well as a receivable for insurance coverage of such liability. The valuation of our potential asbestos liability was based on the number and severity of future asbestos claims, future settlement costs, and the effectiveness of defense strategies and settlement initiatives.
The present estimate of our asbestos liability assumes (i) our continuous vigorous defense strategy will remain effective; (ii) new asbestos claims filed annually against Zurn will decline modestly through the next ten years; (iii) the values by disease will remain consistent with past experience and (iv) our insurers will continue to pay defense costs without eroding the coverage amounts of our insurance policies. Our potential asbestos liability could be adversely affected by changes in law and other factors beyond our control. Further, while our current asbestos liability is based on an estimate of claims through the next ten years, such liability may continue beyond that time period and such liability could be substantial.
We estimate that our available insurance to cover our potential asbestos liability as of the end of fiscal 2011 is greater than our potential asbestos liability. This conclusion was reached after considering our experience in asbestos litigation, the insurance payments made to date by our insurance carriers, existing insurance policies, the industry ratings of the insurers and the advice of insurance coverage counsel with respect to applicable insurance coverage law relating to the terms and conditions of those policies. We used these same considerations when evaluating the recoverability of our receivable for insurance coverage of potential asbestos claims.
Results of Operations
Fiscal Year Ended March 31, 2011 Compared with the Fiscal Year Ended March 31, 2010
Net Sales
(in Millions)
| Fiscal Year Ended | ||||||||||||||||
| March 31, 2010 | March 31, 2011 | Change | % Change | |||||||||||||
Process & Motion Control | $ | 1,003.7 | $ | 1,175.1 | $ | 171.4 | 17.1 | % | ||||||||
Water Management | 506.3 | 524.5 | 18.2 | 3.6 | % | |||||||||||
Consolidated | $ | 1,510.0 | $ | 1,699.6 | $ | 189.6 | 12.6 | % | ||||||||
47
Process & Motion Control
Process & Motion Control net sales for the year ended March 31, 2011 increased 17.1% from the prior year to $1,175.1 million. Core net sales, which excludes foreign currency fluctuations, increased by 17.5% year-over-year driven by solid international growth, improved demand in our North America end-markets and market share gains across many of our products.
Water Management
Water Management net sales for the year ended March 31, 2011 increased 3.6% from the prior year to $524.5 million. Core net sales, which excludes the foreign currency fluctuations, increased by 3.1% year-over-year as a result of targeted market share gains and growth in alternative markets, which more than offset the overall decline in the core infrastructure and non-residential construction markets, which we estimate to be down 15% year-over-year based on McGraw Hill construction data.
Income from Operations
(in Millions)
| Fiscal Year Ended | ||||||||||||
| March 31, 2010 | March 31, 2011 | Change | ||||||||||
Process & Motion Control | $ | 116.5 | $ | 181.1 | $ | 64.6 | ||||||
% of net sales | 11.6 | % | 15.4 | % | 3.8 | % | ||||||
Water Management | 76.1 | 69.4 | (6.7 | ) | ||||||||
% of net sales | 15.0 | % | 13.2 | % | (1.8 | %) | ||||||
Corporate | (31.2 | ) | (31.4 | ) | (0.2 | ) | ||||||
Consolidated | $ | 161.4 | $ | 219.1 | $ | 57.7 | ||||||
% of net sales | 10.7 | % | 12.9 | % | 2.2 | % | ||||||
Process & Motion Control
Process & Motion Control income from operations for the year ended March 31, 2011 increased 55.5% to $181.1 million compared to fiscal 2010. Income from operations as a percent of net sales increased 380 basis points from the prior year to 15.4%. The improvement in fiscal 2011 operating margin is primarily the result of our improved operating leverage on higher year-over-year net sales volume, productivity gains and cost reduction actions, partially offset by higher material costs and targeted investments in new product development and global growth capabilities.
Water Management
Water Management income from operations for the year ended March 31, 2011 declined 8.8% to $69.4 million compared to fiscal 2010. Income from operations as a percent of net sales decreased 180 basis points from the prior year to 13.2%. The decline in fiscal 2011 operating margin is primarily the result of higher year-over-year material costs and the impact of profit variability within certain water and wastewater project shipments in the current year compared to the prior year as well as investments in new product development and growth initiatives.
48
Corporate
Corporate expenses increased by $0.2 million from $31.2 million in fiscal 2010 to $31.4 million in fiscal 2011.
Interest Expense, Net.Interest expense, net was $194.2 million during the year ended March 31, 2010 compared to $180.8 million during the year ended March 31, 2011. The year-over-year reduction in interest expense is primarily the result of the lower weighted average fixed borrowing rates on our senior notes, partially offset by a slight increase in average debt outstanding as a result of the incremental notes issued in connection with the April 2010 refinancing.
Gain (Loss) on Debt Extinguishment. During fiscal 2010, we recorded a $167.8 million gain on debt extinguishment as a result of the purchase and extinguishment of a portion of our PIK toggle senior indebtedness and our April 2009 debt exchange offer. During fiscal 2011, we recorded a $100.8 million loss on debt extinguishment as a result of our early repayment of debt in April 2010 pursuant to cash tender offers. The $100.8 million charge was comprised of a bond tender premium paid to the lender and the non-cash write-off of deferred financing fees and net original issuance discount.
Purchase and Extinguishment of a Portion of PIK Toggle Senior Indebtedness
During fiscal 2010, we purchased and extinguished $67.4 million of outstanding face value PIK toggle senior indebtedness due 2013 for $36.5 million in cash. As a result, we recognized a $30.3 million gain during the year ended March 31, 2010, which was measured based on the difference between the cash paid and the net carrying amount of the debt (the net carrying amount of the debt included unamortized original issue discount of $0.6 million, unamortized debt issuance costs of $0.6 million, and $0.3 million of accrued interest) along with the forgiveness of $0.4 million of accrued interest.
Debt Exchange
During fiscal 2010, we completed an exchange offer by which (i) approximately $71.0 million principal amount of 8.875% Senior Notes due 2014 (the “8.875% Notes”), (ii) approximately $235.7 million principal amount of PIK Toggle Notes, and (iii) approximately $7.9 million principal amount of PIK Toggle Loans were exchanged for $196.3 million of aggregate principal of 9.50% Senior Notes due 2014 (the “2009 9.50% Notes”) (excluding a net original issue discount of $20.6 million).
The Company accounted for the debt exchange transaction pursuant to ASC 470-50Debt Modifications and Extinguishments (“ASC 470-50”). As a result of the debt exchange, the Company recognized a gain of $137.5 million on the extinguishment of 8.875% Notes, PIK Toggle Notes and PIK Toggle Loans. The gain on extinguishment of $137.5 million relates to the extinguishment of $235.7 million of outstanding face value 8.875% Notes and PIK Toggle Notes and $7.9 million of outstanding face value of PIK Toggle Loans and is measured based on the difference between the fair market value of the 9.50% Notes issued of $104.5 million and the net carrying amount of the debt (the net carrying amount of the debt includes unamortized original issue discount of $2.5 million, unamortized debt issuance costs of $2.2 million and $3.1 million of accrued interest).
Tender Offer and Note Issuance
During fiscal 2011, we purchased by means of cash tender offers and extinguished $794.1 million of 9.50% Senior Notes due 2014 issued in 2006 (the “2006 9.50% Notes”), $196.3 million of 2009 9.50% Notes and $77.0 million of 8.875% Notes, and issued $1,145.0 million of 8.50% Senior Notes due 2018 (the “8.50% Notes”). We accounted for the cash tender offers and the issuance of the 8.50% Notes in accordance with ASC 470-50. Pursuant to this guidance, the cash tender offers were accounted for as an extinguishment of debt. In connection with the note offering, we incurred an increase in long-term debt of approximately $89.5 million, and we also recognized a $100.8 million loss on the debt extinguishment, which was comprised of a bond tender premium paid to lenders, as well as the non-cash write-off of deferred financing fees and net original issue discount associated with the extinguished debt. Additionally, we capitalized
49
approximately $14.6 million of third party transaction costs, which are being amortized over the life of the 8.50% Notes as interest expense using the effective interest method. Below is a summary of the transaction costs and other offering expenses recorded along with their corresponding pre-tax financial statement impact (in millions):
| Financial Statement Impact | ||||||||||||||||
| Balance Sheet -Debit (Credit) | Statement of Operations | |||||||||||||||
| Deferred Financing Costs (1) | Original Issue Discount (2) | Expense (3) | Total | |||||||||||||
Cash transaction costs: | ||||||||||||||||
Third party transaction costs | $ | 14.6 | $ | — | $ | — | $ | 14.6 | ||||||||
Bond tender premiums (paid to lenders) | — | — | 63.5 | 63.5 | ||||||||||||
Total expected cash transaction costs | 14.6 | — | 63.5 | $ | 78.1 | |||||||||||
Non-cash write-off of unamortized amounts: | ||||||||||||||||
Deferred financing costs | (25.4 | ) | — | 25.4 | ||||||||||||
Net original issue discount | — | (11.9 | ) | 11.9 | ||||||||||||
Net financial statement impact | $ | (10.8 | ) | $ | (11.9 | ) | $ | 100.8 | ||||||||
| (1) | Recorded as a component of other assets within the consolidated balance sheet. |
| (2) | Recorded as a reduction in the face value of long-term debt within the consolidated balance sheet. |
| (3) | Recorded as a component of other non-operating expense within the consolidated statement of operations. |
Other Income (Expense), Net.Other expense, net for the year ended March 31, 2010 was $16.4 million, which consisted of management fee expense of $3.0 million, transaction costs associated with a debt exchange offer of $6.0 million, foreign currency transaction losses of $4.3 million and other net miscellaneous expenses of $3.1 million. Other income, net for the year ended March 31, 2011 was $1.1 million, which consisted of management fee expense of $3.0 million, income in unconsolidated affiliates of $4.1 million (including a $3.4 million gain recorded as a result of our step acquisition of 100% of the voting shares in Mecánica Falk on August 31, 2010), foreign currency transaction gains of $1.5 million and other net miscellaneous expenses of $1.5 million.
Provision (Benefit) for Income Taxes.The income tax provision in fiscal 2010 was $30.5 million or an effective tax rate of 25.7%. The provision recorded differs from the statutory rate mainly due to the effect of the income tax benefit recognized as a result of a decrease to the liability for unrecognized tax benefits associated with the conclusion of the Internal Revenue Service (“IRS”) examination and certain benefits provided under a new Brazilian tax settlement program. The income tax benefit in fiscal 2011 was $(10.1) million or an effective tax rate of 16.4%. The benefit recorded differs from the U.S. federal statutory rate mainly due to the effect of the increase in the valuation allowance related to foreign tax credit carryforwards for which such realization is not deemed to be more-likely-than-not. See Note 16 to our audited consolidated financial statements included elsewhere in this prospectus for information on income taxes.
Net Income (Loss).The net income recorded in fiscal 2010 was $88.1 million compared to a net loss of $51.3 million in fiscal 2011 due to the factors described above.
Fiscal Year Ended March 31, 2010 Compared with the Fiscal Year Ended March 31, 2009
Net Sales
(dollars in Millions)
| Fiscal Year Ended | ||||||||||||||||
| March 31, 2009 | March 31, 2010 | Change | % Change | |||||||||||||
Process & Motion Control | $ | 1,321.7 | $ | 1,003.7 | $ | (318.0 | ) | (24.1 | )% | |||||||
Water Management | 560.3 | 506.3 | (54.0 | ) | (9.6 | )% | ||||||||||
Consolidated | $ | 1,882.0 | $ | 1,510.0 | $ | (372.0 | ) | (19.8 | )% | |||||||
50
Process & Motion Control
Process & Motion Control net sales decreased $318.0 million, or 24.1%, from $1,321.7 million for the year ended March 31, 2009 to $1,003.7 million for the year ended March 31, 2010. Excluding foreign currency fluctuations, year-over-year core net sales decreased by $316.4 million, or 23.9%, which is attributable to the impact the economic downturn has had on our end-markets.
Water Management
Water Management net sales decreased $54.0 million, or 9.6%, from $560.3 million for the year ended March 31, 2009 to $506.3 million for the year ended March 31, 2010. Excluding foreign currency fluctuations, year-over-year core net sales decreased by $52.3 million, or 9.3%, which is attributable to softness within our commercial and residential construction end-markets as well as certain segments of our infrastructure end-markets. These declines were partially offset by an increase in year-over-year net sales in our water and wastewater treatment markets.
Income (loss) from Operations
(in Millions)
| Fiscal Year Ended | ||||||||||||
| March 31, 2009 | March 31, 2010 | Change | ||||||||||
Process & Motion Control | $ | 15.6 | $ | 116.5 | $ | 100.9 | ||||||
% of net sales | 1.2 | % | 11.6 | % | 10.4 | % | ||||||
Water Management | (212.8 | ) | 76.1 | 288.9 | ||||||||
% of net sales | (38.0 | )% | 15.0 | % | 53.0 | % | ||||||
Corporate | (174.1 | ) | (31.2 | ) | 142.9 | |||||||
Consolidated | $ | (371.3 | ) | $ | 161.4 | $ | 532.7 | |||||
% of net sales | (19.7 | )% | 10.7 | % | 30.4 | % | ||||||
Process & Motion Control
Process & Motion Control income from operations for the year ended March 31, 2009 was $15.6 million compared to income from operations of $116.5 million during the year ended March 31, 2010. The comparability of our year-over-year results has been significantly impacted by the $149.0 million impairment charge taken on our goodwill and other identifiable intangible assets during the year ended March 31, 2009. In addition, income from operations for the year ended March 31, 2009 included $16.5 million of restructuring expenses, compared to restructuring expense of $6.3 million during the year ended March 31, 2010. Excluding the impact of the impairment charge and restructuring expenses, income from operations would have decreased $58.3 million, or 32.2%, and income from operations as a percent of net sales would have declined by 150 basis points to 12.2% of net sales during the year ended March 31, 2010 versus the comparable prior year period. The remaining decline in income from operations as a percent of net sales was primarily driven by the unfavorable impact of lower year-over-year net sales, partially offset by productivity gains, cost reduction initiatives and lower material prices.
Water Management
Water Management loss from operations was $212.8 million for the year ended March 31, 2009 compared to $76.1 million of income from operations for the year ended March 31, 2010. The comparability of our year-over-year results has been significantly impacted by the $273.0 million impairment charge taken on our goodwill and other identifiable intangible assets during the year ended March 31, 2009. In addition, income from operations for the year ended March 31, 2009 included $7.8 million of restructuring expenses, compared to restructuring expense of $0.5 million during the year ended March 31, 2010. Excluding the impact of impairment
51
charges and restructuring expenses, income from operations would have increased $8.6 million, or 12.6%, and income from operations as a percent of net sales would have expanded by 300 basis points to 15.1% of sales for the year ended March 31, 2010 versus the comparable prior year period as cost reduction actions, lower material prices and productivity gains more than offset the unfavorable impact of lower sales.
Corporate
Corporate expenses decreased by $142.9 million from $174.1 million during the year ended March 31, 2009 to $31.2 million during the year ended March 31, 2010. The comparability of corporate expenses is primarily attributable to a net reduction in actuarial losses related to our pension and other postretirement benefit plans recognized year-over-year.
Interest Expense, Net.Interest expense, net was $230.4 million and $194.2 million in fiscal 2009 and fiscal 2010, respectively. The decrease in interest expense is due to the lower year-over-year weighted-average outstanding indebtedness (resulting from the completion of our debt exchange offer during the first quarter of fiscal 2010 and various purchases and extinguishments of our PIK toggle senior indebtedness, beginning in the third quarter of fiscal 2009) as well as the lower relative variable rate borrowing costs year-over-year.
Gain on Debt Extinguishment. During fiscal 2009, the Company recorded a $103.7 million gain on debt extinguishment as a result of the purchase and extinguishment of a portion of our PIK toggle senior indebtedness. During fiscal 2010, the Company recorded a $167.8 million gain on debt extinguishment as a result of the purchase and extinguishment of a portion of our PIK toggle senior indebtedness and our April 2009 debt exchange offer.
During fiscal 2009, we purchased and extinguished $174.6 million of outstanding face value PIK toggle senior indebtedness due 2013 for $72.9 million in cash. As a result, we recognized a $103.7 million gain during the year ended March 31, 2009, which was measured based on the difference between the cash paid and the net carrying amount of the debt (the net carrying amount of the debt included unamortized original issue discounts of $2.0 million, unamortized debt issuance costs of $1.8 million and $5.8 million of accrued interest).
For more information regarding the gain on debt extinguishment for fiscal 2010, see “—Results of Operations—Fiscal Year Ended March 31, 2011 Compared with the Fiscal Year Ended March 31, 2010—Gain (Loss) on Debt Extinguishment.”
Other Expense, Net.Other expense, net for the year ended March 31, 2009 was $3.0 million, which consisted of management fee expense of $3.0 million, foreign currency transaction gains of $2.4 million and other net miscellaneous expenses of $2.4 million. Other expense, net for the year ended March 31, 2010 was $16.4 million, which consisted of management fee expense of $3.0 million, transaction costs associated with the debt exchange offer of $6.0 million, foreign currency transaction losses of $4.3 million and other net miscellaneous expenses of $3.1 million.
Provision (Benefit) for Income Taxes.The income tax benefit in fiscal 2009 was $(72.0) million or an effective tax rate of 14.4%. The benefit recorded differs from the statutory rate mainly due to the effect of approximately $304.8 million of nondeductible expenses relating to the impairment charges recorded in fiscal 2009 as a result of then-existing economic conditions. The income tax provision in fiscal 2010 was $30.5 million or an effective tax rate of 25.7%. The provision recorded differs from the U.S. federal statutory rate mainly due to the effect of the income tax benefit recognized as a result of a decrease to the liability for unrecognized tax benefits associated with the conclusion of the IRS examination and certain benefits provided under a new Brazilian tax settlement program. See Note 16 to our audited consolidated financial statements included elsewhere in this prospectus for more information on income taxes.
Net Income (Loss).The net loss recorded in fiscal 2009 was $429.0 million compared to net income of $88.1 million in fiscal 2010 due to the factors described above.
52
Non-GAAP Financial Measure
In addition to net (loss) income, we believe Adjusted EBITDA (as described below in “Covenant Compliance”) is an important measure under our senior secured credit facilities, as our ability to incur certain types of acquisition debt or subordinated debt, make certain types of acquisitions or asset exchanges, operate our business and make dividends or other distributions, all of which will impact our financial performance, is impacted by our Adjusted EBITDA, as our lenders measure our performance by comparing the ratio of our net senior secured bank debt to our Adjusted EBITDA (see “Covenant Compliance” for additional discussion of this ratio). We reported Adjusted EBITDA of $335.7 million in fiscal 2011 and a net loss for the same period of $51.3 million.
Covenant Compliance
The credit agreement and indentures that govern our notes contain, among other provisions, restrictive covenants regarding indebtedness, payments and distributions, mergers and acquisitions, asset sales, affiliate transactions, capital expenditures and the maintenance of certain financial ratios. Payment of borrowings under the senior secured credit facilities and indentures that govern our notes may be accelerated if there is an event of default. Events of default include the failure to pay principal and interest when due, a material breach of a representation or warranty, covenant defaults, events of bankruptcy and a change of control. Certain covenants contained in the credit agreement that governs our senior secured credit facilities restrict our ability to take certain actions, such as incurring additional debt or making acquisitions, if we are unable to meet certain maximum net senior secured bank debt to Adjusted EBITDA ratios and, with respect to our revolving facility, also require us to remain at or below a certain maximum net senior secured bank debt to Adjusted EBITDA ratio as of the end of each fiscal quarter. Certain covenants contained in the indentures that govern our notes restrict our ability to take certain actions, such as incurring additional debt or making acquisitions, if we are unable to achieve a minimum Adjusted EBITDA to Fixed Charges ratio. Under such indentures, our ability to incur additional indebtedness and our ability to make future acquisitions under certain circumstances requires us to have an Adjusted EBITDA to Fixed Charges ratio (measured on a last twelve months, or LTM, basis) of at least 2.0 to 1.0. Failure to comply with these covenants could limit our long-term growth prospects by hindering our ability to obtain future debt or make acquisitions.
“Fixed Charges” is defined in our indentures as net interest expense, excluding the amortization or write-off of deferred financing costs.
“Adjusted EBITDA” is defined in our credit facilities as net income, adjusted for the items summarized in the table below. Adjusted EBITDA is intended to show our unleveraged, pre-tax operating results and therefore reflects our financial performance based on operational factors, excluding non-operational, non-cash or non-recurring losses or gains. Adjusted EBITDA is not a presentation made in accordance with GAAP, and our use of the term Adjusted EBITDA varies from others in our industry. This measure should not be considered as an alternative to net income, income from operations or any other performance measures derived in accordance with GAAP. Adjusted EBITDA has important limitations as an analytical tool, and you should not consider it in isolation, or as a substitute for analysis of our results as reported under GAAP. For example, Adjusted EBITDA does not reflect: (a) our capital expenditures, future requirements for capital expenditures or contractual commitments; (b) changes in, or cash requirements for, our working capital needs; (c) the significant interest expenses, or the cash requirements necessary to service interest or principal payments, on our debt; (d) tax payments that represent a reduction in cash available to us; (e) any cash requirements for the assets being depreciated and amortized that may have to be replaced in the future; (f) management fees that may be paid to Apollo or its affiliates; or (g) the impact of earnings or charges resulting from matters that we and the lenders under our secured senior credit facilities may not consider indicative of our ongoing operations. In particular, our definition of Adjusted EBITDA allows us to add back certain non-cash, non-operating or non-recurring charges that are deducted in calculating net income, even though these are expenses that may recur, vary greatly and are difficult to predict and can represent the effect of long-term strategies as opposed to short-term results. In
53
addition, certain of these expenses can represent the reduction of cash that could be used for other corporate purposes. Further, although not included in the calculation of Adjusted EBITDA below, the measure may at times allow us to add estimated cost savings and operating synergies related to operational changes ranging from acquisitions to dispositions to restructurings and/or exclude one-time transition expenditures that we anticipate we will need to incur to realize cost savings before such savings have occurred.
As of the date of this prospectus, the calculation of Adjusted EBITDA under the credit agreement and indentures that govern our notes result in substantially identical amounts. However, the results of such calculations could differ in the future based on the different types of adjustments that may be included in such respective calculations at the time.
| (in millions) | Fiscal year ended March 31, 2011 | |||
Net loss | $ | (51.3 | ) | |
Interest expense, net | 180.8 | |||
Income tax benefit | (10.1 | ) | ||
Depreciation and amortization | 106.1 | |||
EBITDA | $ | 225.5 | ||
Adjustments to EBITDA: | ||||
Loss on extinguishment of debt (1) | 100.8 | |||
Stock option expense | 5.6 | |||
LIFO expense (2) | 4.9 | |||
Other income, net (3) | (1.1 | ) | ||
Subtotal of adjustments to EBITDA | $ | 110.2 | ||
Adjusted EBITDA | $ | 335.7 | ||
Fixed Charges of RBS Global, Inc. and subsidiaries (4) | $ | 166.0 | ||
Ratio of Adjusted EBITDA to Fixed Charges—RBS Global, Inc. and subsidiaries | 2.02 | x | ||
Net senior secured bank indebtedness (5) | $ | 388.1 | ||
Net senior secured bank leverage ratio (6) | 1.16 | x | ||
| (1) | The loss on extinguishment of debt is the result of the cash tender offer for notes that we completed during the first quarter of fiscal 2011. See Note 10 to our audited consolidated financial statements included elsewhere in this prospectus. |
| (2) | Last-in first-out (LIFO) inventory adjustments are excluded in calculating Adjusted EBITDA as defined in our senior secured credit facilities. |
| (3) | Other income, net for the fiscal year ended March 31, 2011, consists of management fee expense of $3.0 million, income in unconsolidated affiliates of $4.1 million (including a $3.4 million gain recorded as a result of our step acquisition of 100% of the voting shares in Mecánica Falk on August 31, 2010), foreign currency transaction gains of $1.5 million and other net miscellaneous expenses of $1.5 million. |
| (4) | The indentures governing our senior notes define fixed charges as interest expense excluding the amortization or write-off of deferred financing costs for the trailing four quarters. |
| (5) | Our senior secured credit facilities define net senior secured bank indebtedness as consolidated secured indebtedness for borrowed money, less unrestricted cash, which was $373.4 million (as defined by the senior secured credit facilities) at March 31, 2011. Net senior secured bank indebtedness reflected in the table consists of borrowings under our senior secured credit facilities. |
| (6) | The senior secured credit facilities define the net senior secured bank leverage ratio as the ratio of net senior secured bank debt to Adjusted EBITDA for the trailing four fiscal quarters. |
54
Liquidity and Capital Resources
Our primary source of liquidity is available cash and cash equivalents, cash flow from operations and borrowing availability under our $150.0 million revolving credit facility and our $100.0 million accounts receivable securitization program.
As of March 31, 2010, we had $263.9 million of cash and approximately $207.4 million of additional borrowing capacity ($118.6 million of available borrowings under our revolving credit facility and $88.8 million available under our accounts receivable securitization program). As of March 31, 2011, we had $391.0 million of cash and approximately $219.6 million of additional borrowings available to us ($121.7 million of available borrowings under our revolving credit facility and $97.9 million available under our accounts receivable securitization program). Both our revolving credit facility and accounts receivable securitization program are available to fund our working capital requirements, capital expenditures and other general corporate purposes. As of March 31, 2011, the available borrowings under our credit facility had been reduced by $28.3 million due to outstanding letters of credit. While we believe we have sufficient capital resources for our foreseeable needs, we regularly reassess those needs and resources to determine whether we require or would benefit from additional or different resources. However, we cannot assure that additional or different resources would be available on terms that we find acceptable or at all.
Indebtedness
As of March 31, 2011 we had $2,314.1 million of total indebtedness outstanding as follows (in millions):
| Total Debt at March 31, 2011 | Short-term Debt and Current Maturities of Long-Term Debt | Long-term Portion | ||||||||||
8.50% senior notes due 2018 | $ | 1,145.0 | $ | — | $ | 1,145.0 | ||||||
Term loans | 761.5 | 2.0 | 759.5 | |||||||||
11.75% senior subordinated notes due 2016 | 300.0 | — | 300.0 | |||||||||
PIK toggle senior indebtedness due 2013 (1) | 93.2 | 93.2 | — | |||||||||
8.875% senior notes due 2016 | 2.0 | — | 2.0 | |||||||||
Other | 12.4 | 9.0 | 3.4 | |||||||||
Total Debt | $ | 2,314.1 | $ | 104.2 | $ | 2,209.9 | ||||||
| (1) | Includes an unamortized bond issue discount of $0.4 million at March 31, 2011. On May 13, 2011, we prepaid $53.7 million in principal amount of this indebtedness, and have commenced procedures to extinguish the remaining balance of our PIK toggle senior indebtedness at face value in June 2011. |
At March 31, 2011, our outstanding debt was issued or guaranteed by Rexnord Corporation, RBS Global and various subsidiaries of RBS Global. Rexnord Corporation is the issuer of the PIK toggle senior indebtedness and RBS Global, as well as its wholly-owned subsidiary Rexnord LLC, are the co-issuers of the term loans, senior notes and senior subordinated notes.
For a description of our outstanding indebtedness, see “Description of Indebtedness” elsewhere in this prospectus.
Off-Balance Sheet Arrangements
We do not have any off-balance sheet or unconsolidated special-purpose entities.
55
Cash Flows
Net cash provided by operating activities in fiscal 2010 was $155.5 million compared to $164.5 million in fiscal 2011, representing a $9.0 million increase year-over-year. The improvement in cash provided by operating activities was driven by $53.9 million of incremental cash generated on $189.6 million of higher year-over-year net sales, an $18.2 million reduction in year-over-year cash interest payments, and a $14.2 million reduction in year-over-year cash restructuring payments. That increase was partially offset by a $77.3 million increase in trade working capital (accounts receivable, inventories and accounts payable) as a result of the year-over-year change in sales volume.
Net cash provided by operating activities in fiscal 2009 was $155.0 million compared to $155.5 million in fiscal 2010. Fiscal 2010 cash provided by operating activities includes an incremental $6.0 million of transaction costs associated with our April 2009 debt exchange offer and $16.5 million of restructuring payments, compared to $5.7 million cash restructuring payments during fiscal 2009. Excluding the incremental transaction and restructuring payments, cash flow from operations improved by $17.3 million. Decreases in trade working capital (accounts receivable, inventories and accounts payable) contributed a $62.3 million source of cash year-over-year. The remaining decline in operating cash flow is due to the impact of $372.0 million of lower net sales, partially offset by the cash savings generated from our restructuring initiatives year-over-year.
Cash used for investing activities was $22.0 million during fiscal 2010 compared to $35.5 million during fiscal 2011. The year-over-year increase in cash used for investing activities relates to a $15.6 million increase in capital expenditures partially offset by the net cash acquired in connection with the acquisition of Mecánica Falk (excluding a $6.1 million seller-financed note payable assumed in connection with the acquisition) and $0.9 million of cash proceeds received in connection with the sale of our 9.5% interest in a non-core joint venture within our Water Management platform.
Cash used for investing activities was $54.5 million during fiscal 2009 compared to $22.0 million during fiscal 2010. The year-over-year decrease in cash used for investing activities is primarily due to lower capital expenditures as we aligned our capital expenditures with current sales volume at that time as well as the fiscal 2009 acquisition of Fontaine.
Cash used for financing activities was $161.5 million during fiscal 2010 compared to a use of $6.9 million during fiscal 2011. The cash used for financing activities during fiscal 2011 consisted of a source of cash from the issuance of $1,145.0 million of 8.50% Notes, the proceeds of which were utilized to retire $1,067.4 million of previously outstanding senior notes, pay the $63.5 million tender premium to holders of the retired senior notes as well as $14.6 million of related debt issue costs. Additionally, during fiscal 2011 we made repayments of $3.7 million of other long-term debt (including a $2.0 million payment on our term loan and a $0.9 million payment to redeem 100% of our then outstanding 9.50% Notes), $0.8 million of net short-term borrowings and repayments at various foreign subsidiaries ($2.0 million of borrowings and $2.8 million of repayments). The current year also includes a $1.0 million use for the purchase of common stock and a $1.4 million use for the payments in connection with stock option exercises.
Cash provided by financing activities was $36.6 million during fiscal 2009 compared to a use of $161.5 million during fiscal 2010. The cash used for financing activities during fiscal 2010 consisted of a $36.5 million payment made to retire a portion of our outstanding PIK toggle senior indebtedness due 2013, financing fee payments of $4.9 million associated with our April 2009 debt exchange offer, $116.1 million of long-term debt repayments (comprised of $82.7 million on our revolving credit facility, $30.0 million on our accounts receivable facility, $2.0 million of mandatory repayments on our term loans and $1.4 million on all other debt) and repayments of $2.8 million on miscellaneous short-term debt. Fiscal 2010 also included a $0.4 million use of cash for the purchase of common stock and $1.5 million of cash used to cancel stock options.
56
Tabular Disclosure of Contractual Obligations
The table below lists our contractual obligations, as of March 31, 2011, by period:
| Payments Due by Period | ||||||||||||||||||||
| (in millions) | Total | Less than 1 Year | 1-3 Years | 3-5 Years | More than 5 Years | |||||||||||||||
8.50% senior notes due 2018 | $ | 1,145.0 | $ | — | $ | — | $ | — | $ | 1,145.0 | ||||||||||
Term loans | 761.5 | 2.0 | 759.5 | — | — | |||||||||||||||
11.75% senior subordinated notes due 2016 | 300.0 | — | — | — | 300.0 | |||||||||||||||
PIK toggle senior indebtedness due 2013 (1) | 93.2 | 93.2 | — | — | — | |||||||||||||||
8.875% senior notes due 2016 | 2.0 | — | — | — | 2.0 | |||||||||||||||
Other long-term debt | 12.4 | 9.0 | 2.2 | 0.5 | 0.7 | |||||||||||||||
Interest on long-term debt obligations | 932.5 | 158.1 | 293.8 | 265.5 | 215.1 | |||||||||||||||
Purchase commitments | 174.3 | 165.0 | 9.3 | — | — | |||||||||||||||
Operating lease obligations | 50.4 | 15.1 | 18.0 | 8.8 | 8.5 | |||||||||||||||
Pension and post retirement plans (2) | 93.7 | 14.8 | 35.9 | 43.0 | n/a | |||||||||||||||
Totals | $ | 3,565.0 | $ | 457.2 | $ | 1,118.7 | $ | 317.8 | $ | 1,671.3 | ||||||||||
| (1) | Includes unamortized original issue discount of $0.4 million at March 31, 2011. On May 13, 2011, we prepaid $53.7 million in principal amount of this indebtedness, and have commenced procedures to redeem the remaining balance of our PIK toggle senior indebtedness at face value in June 2011. |
| (2) | Represents expected pension and post retirement contributions and benefit payments to be paid directly by the Company. Contributions and benefit payments beyond fiscal 2016 cannot be reasonably estimated. |
Our pension and postretirement benefit plans are discussed in detail in Note 15 of our audited consolidated financial statements included elsewhere in this prospectus. The pension plans cover most of our employees and provide for monthly pension payments to eligible employees upon retirement. Other postretirement benefits consist of retiree medical plans that cover a portion of employees in the United States that meet certain age and service requirements and other postretirement benefits for employees at certain foreign locations. See “Risk Factors—Our required cash contributions to our pension plans may increase further and we could experience a material change in the funded status of our defined benefit pension plans and the amount recorded in our consolidated balance sheets related to those plans. Additionally, our pension costs could increase in future years.”
Quantitative and Qualitative Disclosures about Market Risk
We are exposed to market risk during the normal course of business from changes in foreign currency exchange rates and interest rates. The exposure to these risks is managed through a combination of normal operating and financing activities and derivative financial instruments in the form of foreign exchange forward contracts and interest rate swaps to cover known foreign exchange transactions and interest rate fluctuations.
Foreign Currency Exchange Rate Risk
Our exposure to foreign currency exchange rates relates primarily to our foreign operations. For our foreign operations, exchange rates impact the U.S. Dollar (“USD”) value of our reported earnings, our investments in the subsidiaries and the intercompany transactions with the subsidiaries. See “Risk Factors—Our international operations are subject to uncertainties, which could adversely affect our operating results.”
Approximately 29% of our sales originate outside of the United States. As a result, fluctuations in the value of foreign currencies against the USD, particularly the Euro, may have a material impact on our reported results. Revenues and expenses denominated in foreign currencies are translated into USD at the end of the fiscal period using the average exchange rates in effect during the period. Consequently, as the value of the USD changes relative to the currencies of our major markets, our reported results vary.
57
Fluctuations in currency exchange rates also impact the USD amount of our stockholders’ equity. The assets and liabilities of our non-U.S. subsidiaries are translated into USD at the exchange rates in effect at the end of the fiscal periods. As of March 31, 2011, stockholders’ equity increased by $8.5 million from March 31, 2010 as a result of foreign currency translation adjustments. If the USD had strengthened by 10% as of March 31, 2011, the result would have decreased stockholders’ equity by approximately $16.1 million.
As we continue to expand our business globally, our success will depend, in large part, on our ability to anticipate and effectively manage these and other risks associated with our international operations. However, any of these factors could adversely affect our international operations and, consequently, our operating results.
At March 31, 2011, we had outstanding forward foreign currency contracts that exchange USD for Canadian dollars (“CAD”) as well as CAD for USD. The forward contracts in place as of March 31, 2011 expire between April and September of 2011 and have notional amounts of $9.0 million CAD ($9.1 million USD) and contract rates of approximately $0.99CAD:$1USD. These foreign exchange forward contracts were not accounted for as effective cash flow hedges in accordance with ASC 815,Derivatives and Hedging (“ASC 815”) and as such were marked to market through earnings. We believe that a hypothetical 10% adverse change in the foreign currency exchange rates would have resulted in a $0.5 million decrease in the fair value of foreign exchange forward contracts as of March 31, 2011.
Interest Rate Risk
We utilize a combination of short-term and long-term debt to finance our operations and are exposed to interest rate risk on these debt obligations.
A substantial portion of our indebtedness, including indebtedness under the senior secured credit facilities bears interest at rates that fluctuate with changes in certain short-term prevailing interest rates. As of March 31, 2011, our outstanding borrowings under the senior secured term loan credit facility were $761.5 million. The term loan credit facility is apportioned between two primary tranches: a $570.0 million term loan B1 facility and a $191.5 million term loan B2 facility. Borrowings under the term loan B1 facility accrue interest, at our option, at the following rates per annum: (i) 2.50% plus the LIBOR, or (ii) 1.50% plus the Base Rate (which is defined as the higher of the Federal funds rate plus 0.5% or the Prime rate). Borrowings under the B2 facility accrue interest, at our option, at the following rates: (i) 2.25% plus the LIBOR per annum or (ii) 1.00% plus the Base Rate (which is defined as the higher of the Federal funds rate plus 0.5% or the Prime rate). The weighted average interest rate on the outstanding term loans at March 31, 2011 was 3.67%. We have entered into three interest rate swaps, which became effective beginning October 20, 2009 and mature on July 20, 2012, to hedge the variability in future cash flows associated with our variable-rate term loans. The three swaps convert an aggregate of $370.0 million of our variable-rate term loans to a fixed interest rates ranging from 2.08% to 2.39%, plus the applicable margin.
Our loss before income taxes would likely be affected by changes in market interest rates on the un-hedged portion of these variable-rate obligations. After considering the interest rate swaps, a 100 basis point increase in the March 31, 2011 interest rates would increase interest expense under the senior secured credit facilities by approximately $3.9 million on an annual basis.
58
Our Company
Rexnord is a growth-oriented, multi-platform industrial company with what we believe are leading market shares and highly trusted brands that serve a diverse array of global end-markets. Our heritage of innovation and specification have allowed us to provide highly engineered, mission critical solutions to customers for decades and affords us the privilege of having long-term, valued relationships with market leaders. We operate our company in a disciplined way and the Rexnord Business System (“RBS”) is our operating philosophy. Grounded in the spirit of continuous improvement, RBS creates a scalable, process-based framework that focuses on driving superior customer satisfaction and financial results by targeting world-class operating performance throughout all aspects of our business.
Our strategy is to build the Company around multiple, global strategic platforms that participate in end-markets with sustainable growth characteristics where we are, or have the opportunity to become, the industry leader. We have a track record of acquiring and integrating companies and expect to continue to pursue strategic acquisitions within our existing platforms that will expand our geographic presence, broaden our product lines and allow us to move into adjacent markets. Over time, we anticipate adding additional strategic platforms to our Company. Currently, our business is comprised of two platforms, Process & Motion Control and Water Management.
We believe that we have one of the broadest portfolios of highly engineered, mission and project critical Process & Motion Control products in the industrial and aerospace end-markets. Our Process & Motion Control product portfolio includes gears, couplings, industrial bearings, aerospace bearings and seals, FlatTop™ modular belting, engineered chain and conveying equipment. Our Water Management platform is a leader in the multi-billion dollar, specification-driven, non-residential construction market for water management products. Through recent acquisitions, we have gained entry into the municipal water and wastewater treatment markets. Our Water Management product portfolio includes professional grade specification drainage products, flush valves and faucet products, backflow prevention pressure release valves, Pex piping and engineered valves and gates for the water and wastewater treatment market.
Our products are generally “specified” or requested by end-users across both of our strategic platforms as a result of their reliable performance in demanding environments, our custom application engineering capabilities and our ability to provide global customer support. Typically, our Process & Motion Control products are initially incorporated into products sold by OEMs or sold to end-users as critical components in large, complex systems where the cost of failure or downtime is high and thereafter replaced through industrial distributors as they are consumed or require replacement.
The demand for our Water Management products is primarily driven by new infrastructure, the retro-fit of existing structures to make them more energy and water efficient, commercial construction and, to a lesser extent, residential construction. We believe we have become a market leader in the industry by meeting the stringent third party regulatory, building and plumbing code requirements and subsequently achieving specification of our products into projects and applications.
We are led by an experienced, high-caliber management team that employs RBS as a proven operating philosophy to drive excellence and world class performance in all aspects of our business by focusing on the “Voice of the Customer” process and ensuring superior customer satisfaction. Our global footprint encompasses 36 principal Process & Motion Control manufacturing, warehouse and repair facilities located around the world and 23 principal Water Management manufacturing and warehouse facilities which allow us to meet the needs of our increasingly global customer base as well as our distribution channel partners.
On July 21, 2006 (the “Merger Date”), affiliates of Apollo, George M. Sherman and certain members of management acquired RBS Global through the merger of Chase Merger Sub, Inc., an indirect, wholly-owned
59
subsidiary of an Apollo affiliate, Rexnord Corporation, with and into RBS Global, and RBS Global became an indirect, wholly-owned subsidiary of Rexnord Corporation. Rexnord Corporation, formerly known as Rexnord Holdings, Inc., was incorporated in Delaware in 2006.
Our Strategic Platforms
Below is a summary of our net sales by segment and geographic region:
Net Sales by Geographic Region
(in millions)
| Year Ended March 31, 2011 | ||||||||||||||||
| United States | Europe | Rest of World | Total Net Sales | |||||||||||||
Process & Motion Control | $ | 751.6 | $ | 225.8 | $ | 197.7 | $ | 1,175.1 | ||||||||
% of net sales | 64.0 | % | 19.2 | % | 16.8 | % | 100.0 | % | ||||||||
Water Management | 461.2 | 4.8 | 58.5 | 524.5 | ||||||||||||
% of net sales | 87.9 | % | 0.9 | % | 11.2 | % | 100.0 | % | ||||||||
Consolidated | $ | 1,212.8 | $ | 230.6 | $ | 256.2 | $ | 1,699.6 | ||||||||
% of net sales | 71.3 | % | 13.6 | % | 15.1 | % | 100.0 | % | ||||||||
See more information regarding our segments and sales by geography within Note 19 to our audited consolidated financial statements included elsewhere in this prospectus.
Process & Motion Control
Our Process & Motion Control platform designs, manufactures, markets and services specified, highly-engineered mechanical components used within complex systems where our customers’ reliability requirements and cost of failure or downtime is high. The Process & Motion Control product portfolio includes gears, couplings, industrial bearings, aerospace bearings and seals, FlatTop™ modular belting, engineered chain and conveying equipment and are marketed and sold globally under several brands, including Rexnord®, Rex®, Falk® and Link-Belt®. We sell our Process & Motion Control products into a diverse group of attractive end-markets, including mining, general industrial applications, cement and aggregate, agriculture, forest and wood products, petrochemical, energy, food and beverage, aerospace and wind energy.
We have established long-term relationships with OEMs and end-users serving a wide variety of industries. As a result of our long-term relationships with OEMs and end-users, we have created a significant installed base for our Process & Motion Control products, which are consumed or worn in use and have a relatively predictable replacement cycle. We believe this replacement dynamic drives recurring aftermarket demand for our products. We estimate that approximately 50% of our Process & Motion Control net sales are to distributors, who primarily serve the end-user/OEM aftermarket demand for our products.
Most of our products are critical components in large scale manufacturing processes, where the cost of component failure and resulting down time is high. We believe our reputation for superior quality, application expertise and ability to meet lead time expectations are highly valued by our customers, as demonstrated by their preference to replace their worn Rexnord products with new Rexnord products, or “like-for-like” product replacements. We believe this replacement dynamic for our products, combined with our significant installed base, enables us to achieve premium pricing, generates a source of recurring revenue and provides us with a competitive advantage. We believe the majority of our products are purchased by customers as part of their regular maintenance budget, and in many cases do not represent significant capital expenditures.
Water Management
Our Water Management platform designs, procures, manufactures and markets products that provide and enhance water quality, safety, flow control and conservation. The Water Management product portfolio includes
60
professional grade specification drainage products, flush valves and faucet products, engineered valves and gates for the water and wastewater treatment market and Pex piping and are marketed and sold through widely recognized brand names, including Zurn®, Wilkins®, Rodney Hunt® and Fontaine®.
Over the past century, the businesses that comprise our Water Management platform have established themselves as innovators and leading designers, manufacturers and distributors of highly engineered products and solutions that control the flow, delivery, treatment and conservation of water to the infrastructure construction, commercial construction and, to a lesser extent, the residential construction end-markets. Segments of the infrastructure end-market include: municipal water and wastewater, transportation, government, health care and education. Segments of the commercial construction end-market include: lodging, retail, dining, sports arenas, and warehouse/office. The demand for our Water Management products is primarily driven by new infrastructure, the retro-fit of existing structures to make them more energy and water efficient, commercial construction and, to a lesser extent, residential construction.
Our Water Management products are principally specification-driven and project-critical and typically represent a low percentage of the overall project cost. We believe these characteristics, coupled with our extensive distribution network, createscreate a high level of end userend-user loyalty for our products and allowsallow us to maintain leading market shares in the majority of our product lines. We believe we have become a market leader in the industry by meeting the stringent third party regulatory, building and plumbing code requirements and subsequently achieving specification of our products into projects and applications. The majority of these stringent testing and regulatory approval processes are completed through USC, NSFthe University of Southern California (“USC”), the International Association of Plumbing and Mechanical Codes (“IAPMO”), the National Sanitation Foundation (“NSF”), the Underwriters Laboratories (“UL”), Factory Mutual (“FM”), or AWWA,the American Waterworks Association (“AWWA”), prior to the commercialization of our products.
Our Water Management platform has an extensive network of more than 550approximately 1,100 independent sales representatives across approximately 170210 sales agencies in North America who work with local engineers, contractors, builders and architects to specify, or “spec-in,” our Water Management products for use in construction projects. Approximately 85% of our Water Management platform net sales come from products that are specified for use in projects by engineers, contractors, owners or architects. Specifically, it has been our experience that, once an architect, engineer, contractor builder or architectowner has specified our product with satisfactory results, theythat person will generally continue to use our products in future projects. The inclusion of our products with project specification,specifications, combined with our ability to innovate, engineer and deliver products and systems that save time and money for engineers, contractors, builders and architects, havehas resulted in growing demand for our Water Management products. Approximately 80% of our Water Management platform net sales come from products that are specified for use in projects by engineers, contractors, builders or architects. Our Water Management distribution model is predicated upon maintaining high product availability near our customers. We believe that this model provides us with a competitive advantage as we are able to meet our customer demand with local inventory at significantly reduced lead times as compared to others in our industry.
Set forth belowOur Markets
We evaluate our competitive position in our markets based on available market data, relevant benchmarks compared to our relative peer group and industry trends. We generally do not participate in segments of our served markets that are thought of as commodities or in applications that do not require differentiation based on product quality, reliability and innovation. In both of our platforms, we believe the end-markets we serve span a broad and diverse array of commercial and industrial end-markets with solid fundamental long-term growth characteristics.
Process & Motion Control Market
Within the overall Process & Motion Control market, we estimate that the addressable North American market for our current product offerings is approximately $5.0 billion in net sales per year. Globally, we estimate our addressable market to be approximately $12.0 billion in net sales per year. The market for Process & Motion
61
Control products is very fragmented with most participants having single or limited product lines and serving specific geographic markets. While there are numerous competitors with limited product offerings, there are only a few national and international competitors of a size comparable to us. While we compete with certain domestic and international competitors across a portion of our product lines, we do not believe that any one competitor directly competes with us on all of our product lines. The industry’s customer base is broadly diversified across many sectors of the economy. We believe that growth in the Process & Motion Control market is closely tied to overall growth in industrial production, which fundamentally, we believe has significant long-term growth potential. In addition, we believe that Process & Motion Control manufacturers who innovate to meet the changes in customer demands and focus on higher growth end-markets can grow at rates faster than overall United States industrial production.
The Process & Motion Control market is also characterized by the need for sophisticated engineering experience, the ability to produce a broad number of niche products with very little lead time and long-standing customer relationships. We believe entry into our markets by competitors with lower labor costs, including foreign competitors, will be limited due to the fact that we manufacture highly specialized niche products that are critical components in large scale manufacturing processes, where the cost of component failure and resulting downtime is high. In addition, we believe there is an industry trend of customers increasingly consolidating their vendor bases, which we believe should allow suppliers with broader product offerings, like us, to capture additional market share.
Water Management Market
Within the overall Water Management market, we estimate that the addressable North American market for our current product offerings is approximately $2.3 billion in net sales per year. Globally, we estimate our addressable market to be approximately $3.0 billion in net sales per year. We believe the markets in which our Water Management net sales for fiscal 2008 by end market, adjusted to assume the full year effectplatform participates are relatively fragmented with competitors across a broad range of industries and product lines. Although competition exists across all of our January 2008 acquisitionWater Management businesses, we do not believe that any one competitor directly competes with us across all of GA industries, Inc. (see “Management’s Discussionour product lines. We believe that, by focusing our efforts and Analysisresources towards end-markets that have above average growth characteristics, we can continue to grow our platform at rates above the growth rate of Financial Conditionthe overall market and Resultsthe growth rate of Operations—The GA Acquisition”) (the GA information is based on GA’s booksour competition.
We believe the areas of the Water Management industry in which we compete are tied to growth in infrastructure and records, is unauditedcommercial construction, which we believe have significant long-term growth fundamentals. Historically, the infrastructure and does not conformcommercial construction industry has been more stable and less vulnerable to GA’s historical accounting periods), which was completed on January 31, 2008down-cycles than the residential construction industry. Compared to residential construction cycles, downturns in infrastructure and by geographic destination:
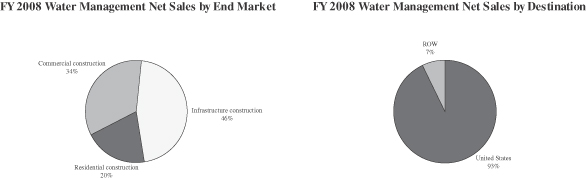
The inclusionWater Management industry’s specification-driven end-markets require manufacturers to work closely with engineers, contractors, builders and architects in local markets across the United States to design specific applications on a project-by-project basis. As a result, building and maintaining relationships with architects, engineers, contractors and builders who specify or “spec-in” products for use in construction projects and having flexibility in design and product innovation are critical to compete effectively in the market. Companies with a strong network of the GA acquisitionsuch relationships have a competitive advantage. Specifically, it has been our experience that, once an engineer, contractor, builder or architect has specified our product with satisfactory results, that person often will continue to use our products in our net sales for the full fiscal year 2008 effectively increased the proportion of our fiscal year 2008 net sales related to the infrastructure construction end market by seven percentage points. while decreasing the proportion of our fiscal year 2008 net sales related to the commercial construction and residential construction end markets by four and three percentage points, respectively.future projects.
62
Our Products
Power TransmissionProcess & Motion Control Products
Our Process & Motion Control products are generally critical components in the machinery or plant in which they operate, yet they typically account for a low percentage of an end-user’s total production cost. We believe, because the costs associated with Process & Motion Control product failure to the end-user can be substantial, end-users in most of the markets we serve focus on Process & Motion Control products with superior quality, reliability and availability, rather than considering price alone, when making a purchasing decision. We believe that the key to success in our industry is to develop and maintain a reputation for quality and reliability, as well as create and maintain an extensive distribution network, which we believe leads to a strong preference to replace “like-for-like” products driving recurring aftermarket revenues and market share gain.
Gears.Gears
We are a leading manufacturer of gear drives and large gear sets for the heavy duty industrial market, with the number one position in the North American market for parallel shaft, right angle, and inline drives along with mill gear sets. Gear drives and gear sets reduce the output speed and increase the torque from an electronic motor or engine to the level required to drive a particular piece of equipment. Our gear drives, service and gear sets are used in a number of heavy duty industries. These primary industries include the natural resource extraction, steel, pulp and paper, chemical, forest and wood industries. We manufacture a wide range of heavy duty, medium and light duty gear drives used for bulk material handling, mixing, pumping and general gearing applications. We also operate a gear service and repair business through our Product Service group (Prager™(PragerTM and Falk Renew®). We believe we are the number one provider of gear repair, replacement parts and onsite services in the US. Generally, our gear drives and gear sets have an average replacement cycle of 5 to 20 years. We estimate that our aftermarket sales of gears comprise half of our overall gear sales. Our gear products are manufactured in our facilities in Wisconsin, Louisiana, Pennsylvania, Texas, Virginia, Australia, Canada, China and Germany. Our gear products are sold under the Falk™, Rex®, Link-Belt® , Stephan™ and Prager™ brand names. We categorize our gear products and services as follows.
|
|
|
|
We believe we are a leading manufacturer of heavy duty gear drives and mill gearing in North America, and we sell our gear products to a variety of customers within numerous end markets. Market competition in the heavy duty gear industry is based primarily on quality, lead times, reputation for quality and cost. We estimate the global gear market to be approximately $5.0 billion. The global market is both competitive and fragmented, with a few significant competitors and none that dominate.
Couplings.Couplings are primarily used in high-speed, high torquehigh-torque applications and are the interface between two shafts that permit power to be transmitted from one shaft to the other. Our couplings are sold to a variety of end markets,end-markets, including the petrochemical and refining, wood processing, chemical, power generation and natural resources industries. We estimate that our aftermarket sales of couplings comprise half of our overall coupling sales. Our couplings are manufactured in our facilities in Alabama, Nebraska, Texas, Wisconsin and Germany.
Couplings are comprised of the grid, flexible disc, elastomeric and gear product lines and are sold under the Steelflex®, Thomas®, Omega®, Rex®, Viva®, Wrapflex®, Lifelign®, True Torque®, Addax® and AddaxAutogard® brand names.
|
|
|
|
|
|
|
|
The global couplings market is estimated at approximately $1.0 billion in annual sales and generally follows the investment cycles of the industries it supplies. We sell our couplings to a variety of customers in several end markets, including the petrochemical and refining, wood processing, chemical, power generation and natural resources industries. Global demand for couplings is split approximately equally among North America, Europe and the rest of the world. The couplings market is split between dry couplings and wet couplings and is fragmented, with numerous manufacturers.
Industrial Bearings.Industrial bearings are components that support, guide and reduce the friction of motion between fixed and moving machine parts. These products are primarily sold for use in the mining, aggregate, forest and wood products, construction equipment, and agricultural equipment industries. Industrial bearings are sold either mounted or unmounted. We primarily produce mounted bearings, which are offered in a variety of specialized housings to suit specific industrial applications, and generally command higher margins than unmounted bearings. Bearings have an average replacement cycle of 3 to 5 years. We estimate that our aftermarket sales of industrial bearings products comprise more than half of our overall industrial bearings sales. We manufacture our industrial bearings products in our facilities in Indiana, Tennessee and Illinois. Our primary industrial bearings products include:
FlatTop™
|
|
|
|
|
We believe we are one of the leading producers of mounted bearings in North America. We sell our industrial bearings products to a variety of customers within numerous end markets. Market competition in the bearings industry is based primarily on cost, quality, on-time delivery and market access.
Flattop. Our flattop chain is a highly engineeredhighly-engineered conveyor chain that provides a smooth continuous conveying surface that is critical to high-speed operations such as those used to transport cans and bottles in
beverage-filling operations, and is primarily sold to the food and beverage, consumer products, warehousing and distribution, and parts processing industries. Flattop chain products generally need to be replaced every 4 to 5 years on average. We manufacture our flattop chain products in our manufacturing facilities in Wisconsin, Italy and the Netherlands. Our primary flattop chain products include:
|
|
|
|
|
|
We market our flattop chain products directly to end users and market and sell these products to both OEMs and distributors. The flattop chain market has experienced and continues to undergo a shift towards plastic. We believe this trend towards plastic will continue in the flattop chain market as more food and beverage companies begin to replace their older conveyor lines and as container production continues to move away from the use of returnable glass bottles that have traditionally been conveyed on stainless steel chain. This is a global trend that is more pronounced and developed in North America. Other regions of the world use a higher relative share of glass containers due to environmental demands and overall industry maturity. In addition, we believe there will be other additional growth opportunities as rubber belt and roller conveyors are replaced by newer technologies.
Aerospace Bearings and Seals.Seals
We supply our aerospace bearings and seals to the commercial aircraft, military aircraft and regional jet end marketsend-markets for use in door systems, engine accessories, engine controls, engine mounts, flight control systems, gearboxes, landing gear and rotor pitch controls. The majority of our sales are to engine and airframe OEMs that specify our Power TransmissionProcess & Motion Control products for their aircraft platforms. Our aerospace bearings and seals
63
products consist of rolling element airframe bearings sold under the Shafer® brand name, slotted-entry and split-ball sliding bearings sold under the PSI® brand name and aerospace seals that are sold under the Cartriseal® brand name, which are primarily sold for use in both aerospace and industrial applications. Our aerospace bearings and seals products are manufactured in our facilities in Illinois and California and are supported by a direct sales organization, aerospace agents and distributors.
|
|
|
|
|
|
|
The aviation market is undergoing significant change because of the long term growth of the flying public and the long term continued expansion of the global economy. The order books at the OEMs are full based on the orders that are being placed for platforms such as the B737, B777, B787, A320, A330 and A380. Aircraft operators are facing pressure because of the rising price of oil and rising maintenance costs. We are well positioned to provide the products and services to meet the rising demand in the market both for the OEM manufacturers and for the aircraft operators.
The aerospace components industry we are a part of, is fragmented and consists of many specialized companies and a limited number of larger, well-capitalized companies who provide integrated systems to aircraft manufacturers. We compete in specific segments of the aircraft market such as flight controls, landing gear systems and small engines/auxiliary power units. These segments are typically several hundred million dollars in revenues. These market segments are subject to stringent regulatory approvals, quality requirements and certification processes.
Special Components.Our special components products are comprised of three primary product lines: electric motor brakes, miniature Power TransmissionProcess & Motion Control components and security devices for utility companies. These products are manufactured by our three stand-alone niche businesses: Stearns, W.M. Berg and Highfield, which are located in Wisconsin, New York and Connecticut, respectively.
|
|
|
Highfield. Stearns’ products are used in a diverse range of applications, including steel mills, oil field equipment, pulp processing equipment, large textile machines, rubber mills, metal forming machinery and dock and pier handling equipment. W.M. Berg sells its products to a variety of markets, including aerospace, semiconductor, telecommunications, medical equipment, robotics, instrumentation, office equipment production tooling, digital imaging and printing, aerospace and automated vending.satellite communications. Highfield’s products are sold to a variety of markets, including electric, gas, water, telecommunications, utilities and plumbing and heating.
Stearns services customers in numerous industries, including material handling, cranes, servomotors and actuators, conveyors and single-phase motor manufacturers. Approximately 75% of W.M. Berg’s sales are made to OEMs with the remaining sales generally going through distributors. For fiscal 2008, the majority of Highfield’s sales were made to wholesalers, utilities and installers.
We compete against a wide variety of niche manufacturers in each of our respective markets. The competition is generally local or regional in nature.
Conveying Equipment and Industrial Chain.Engineered Chain
Our conveying equipment and industrial chain products are manufactured in our facilities in Wisconsin, Germany, China and Brazil. These products are used in various applications in numerous industries, including food and food processing, beverage and container, mining, construction and agricultural equipment, hydrocarbon processing and cement and aggregates processing. Our primary products include:
|
|
|
|
|
We market and sell our industrial chain products, directlywhich are sold under the Link-Belt® and Rexnord® brand names, are designed and manufactured to OEMs, end users,meet the demands of customers’ specific applications. These products are used in many applications including cement elevators, construction and through industrial distributors. We believe we have a leading position inmining equipment and conveyors, and they are supplied to the North American market for engineered steel chain.cement and aggregate, energy, food and beverage, and forest and wood products industries.
Water Management Products
Water Management products tend to be project-critical, highly-engineered and high value-add and typically are a low percentage of overall project cost. We believe the combination of these features creates a high level of end-user loyalty. Demand for these products is influenced by regulatory, building and plumbing code requirements. Many Water Management products must be tested and approved by USC, IAPMO, NSF, UL, FM, or AWWA before they may be sold. In addition, many of these products must meet detailed specifications set by water management engineers, contractors, builders and architects.
Specification Drainage. Our specification drainage products are manufactured in our facilities in Pennsylvania and New York. Drainage
Specification drainage products are used to control storm water, process water and potable water in various commercial, industrial, civil and irrigation applications. This product line includes point drains (such as roof drains and floor drains), linear drainage systems, interceptors, hydrants, fixture carrier systems, chemical drainage systems and light commercial drainage products.
Our specification drainage products include:
|
|
|
|
|
|
|
|
|
|
PEX. Zurn PEX® is our product line manufactured out of cross-linked polyethylene into tubing. Zurn PEX® is essentially polyethylene (PE) material (a thermoplastic that consists of a series of ethylene hydrocarbon chains) which has undergone a chemical or physical reaction that causes the molecular structure of the PE chains to link together. This reaction creates a three dimensional structure which has superior resistance to high temperatureWater Control and pressure. Zurn PEX® tubing demonstrates superior characteristics at elevated temperatures and pressures (as compared to uncross-linked polyethylene) in the areas of tensile strength, resistance to deformation, resistance to corrosion and mineral build-up, creep resistance, abrasion resistance, impact strength and chemical resistance. This makes Zurn PEX® a perfect product for high temperature and pressure fluid distribution piping.Safety
Our Zurn PEX® products include complete lines of pipe, fittings, valveswater control and installation tools for both potable water and radiant heating systems. These systems are engineered in our facilities in Commerce, Texas, Elkhart, Indiana and Erie, Pennsylvania, to meet stringent NSF requirements.
Our Zurn PEX® products include:
|
|
|
|
Water Control. Our water controlsafety products are sold under the Wilkins® brand name and encompass a wide variety of valves, including backflow preventers, fire system valves, pressure reducing valves and thermostatic mixing valves. These products are designed to meet the stringent requirements of independent test labs, such as the Foundation for Cross Connection Control and Hydraulic Research at the University of Southern California
(“USC”) andUSC, the NSF, UL and FM, and are sold into the commercial and industrial construction end marketsapplications as well as the fire protection, waterworks and irrigation end markets.end-markets.
Our water control products include:
|
|
64
|
|
|
|
|
|
Commercial Brass.Brass
Zurn’s commercial brass product line is manufactured in New York and North Carolina. It’s commercial brass products include manual and sensor operated flush valves marketed under the Aquaflush®, AquasenseAquaSense®, AquaVantage® and AquavantageHydroVantage®TM brand names and heavy duty commercial faucets marketed under the AquaspecAquaSpec® brand name. Innovative water conserving fixtures are marketed under the EcovantageEcoVantage® and Zurn One® brand names. These products are commonly used in office buildings, schools, hospitals, airports, sports facilities, convention centers, shopping malls, restaurants and industrial production buildings. The Zurn One Systems® integrate commercial brass and fixtures into complete, easily customizable plumbing systems, and thus provide a valuable time-time and cost-saving means of delivering commercial and institutional bathroom fixtures. The EcoVantage® fixture systems promote water-efficiency and low consumption of water that deliver savings for building owners in new construction and retro-fit bathroom fixture installations.
PEX
PEX is our product line manufactured out of cross-linked polyethylene into tubing and is well-suited for high temperature and pressure fluid distribution piping. Our PEX products include complete lines of pipe, fittings, valves and installation tools for both potable water and radiant heating systems. These systems are engineered to meet stringent NSF requirements.
Water and Wastewater. GA’s products are manufactured in PennsylvaniaWastewater
GA and Massachusetts. It’sFontaine products are used to control water and waste waterwastewater throughout the water cycle from raw water through collection, distribution and wastewater treatment. GA is a leader in the specification, design, application, and manufacture of automatic control valves, check valves, air valves, large butterfly valves, slide/sluice gates, actuation systems, and other specialized products for municipal, industrial, and hydropower applications. Over 90% of its comprehensive product lines go to the growing and less-cyclical water and wastewater markets. Fontaine products are used to control water and wastewater from raw water through collection, distribution and wastewater treatment. Fontaine is a leading manufacturer of fabricated stainless steel water control gates and sells within the municipal, industrial and hydropower end-markets. Fontaine’s complete line of products are sold to the growing and less cyclical water and wastewater markets.
Our MarketsAcquisitions
We evaluatehave has grown significantly in recent years by means of acquisitions. Information regarding some of our competitive positionrecent acquisitions follows.
The Autogard Acquisition
On April 2, 2011, we acquired Autogard Holdings Limited and affiliates (“Autogard”) for a total cash purchase price of $18.6 million subject to a final customary working capital adjustment. Autogard is a European-based manufacturer of torque limiters and couplings. The acquisition further expands our global Process & Motion Control platform. Autogard’s premium brand of torque limiter products complements our leading power transmission product offering and will allow us to provide increased support to its global customer base. The results of operations of Autogard will be included in our markets based upon the markets we serve. We generally do not participate in segmentsresults of our served markets that are thought of as commodities or in applications that do not require differentiation based on product quality, reliability and innovation. In both of our platforms, we believe the end markets we serve span a broad and diverse array of commercial and industrial end markets with solid fundamental long-term growth characteristics.operations from April 2, 2011.
Power Transmission MarketThe Mecánica Falk Acquisition
According to Industrial Market Information, Inc., the North American Power Transmission market generates approximately $103 billion in annual sales. Of this overall estimated Power Transmission market, the relevant or served North American market for our current product offerings is approximately $5 billion in sales per year.
Globally,On August 31, 2010, we estimate our served market to be approximately $12 billion in sales per year. The Power Transmission market is relatively fragmented with most participants having single or limited product lines and serving specific geographic markets. While there are numerous competitors with limited product offerings, there are onlyacquired full control of Mecánica Falk, a few national and international competitors of a size comparable to us, including the Emerson Power Transmission division of Emerson Electric and the Dodge Manufacturing division of Baldor Electric. While we compete with certain domestic and international competitors across a portion of our product lines, we do not believe that any one competitor directly competes with us on all of our product lines. The industry’s customer base is broadly diversified across many sectors of the economy. We believe that growth in the Power Transmission market is closely tied to overall growth in industrial production, which we believe has significant long-term growth fundamentals. In addition, we believe that Power Transmission manufacturers who innovate to meet the changes in customer demands and focus on higher growth end markets can grow at rates faster than overall U.S. industrial production.
Our Power Transmission products are generally critical components in the machinery or plant in which they operate, yet they typically account for a low percentage of an end user’s total production cost. We believe, because the costs associated with Power Transmission product failure to the end user can be substantial, end users in most of the markets we serve focus on Power Transmission products with superior quality, reliability and availability, rather than considering price alone, when making a purchasing decision. We believe that the key to success in our industry is to develop a reputation for quality and reliability, as well as create and maintain an extensive distribution network, which we believe leads to strong recurring aftermarket revenues, attractive margins on products and market share gain.
The Power Transmission market is also characterized by the need for sophisticated engineering experience, the ability to produce a broad number of niche products with very little lead time and long-standing customer relationships. We believe entry into our markets by competitors with lower labor costs, including foreign competitors, will be limited due to the fact that we manufacture highly specialized niche products that are critical components in large scale manufacturing processes, where the cost of component failure and resulting downtime is high. In addition, we believe there is an industry trend of customers increasingly consolidating their vendor bases, which we believe should allow suppliers with broader product offerings to capture additional market share.
Water Management Market
According to the U.S. Census Bureau, U.S. non-residential construction expenditures were approximately $637.5 billion in 2007. We estimate that the relevant market within non-residential construction for all of our Water Management product offerings is approximately $4.5 billion. Although Zurn competes against numerous competitors with limited products or scale, one competitor, Watts Water Technologies, competes with Zurn across several lines on a nationwide basis. Zurn also competes against Sloan Valve Company in flush valves, Uponor (formerly Wirsbo) in PEX piping and Geberit in commercial faucets.
We believe the segment in which our Water Management platform participates is relatively fragmented and that most of our competitors offer more limited product lines. While we compete with certain of our competitors across a portion of our product lines, we do not believe that any one competitor directly competes with us across all of our product lines.
We believe the areas of the water management industryjoint venture in which we compete are tiedpreviously maintained a 49% non-controlling interest for a $6.1 million seller-financed note. Located in Mexico City, Mexico, Mecánica Falk primarily serves as a distributor of our existing Process & Motion Control product lines in Latin America. The acquisition of the remaining 51% interest in Mecánica Falk provides us with the opportunity to growth in industrial and commercial construction, which we believe to have significant long-term growth fundamentals. Historically, the institutional and commercial construction industry has beenexpand our international presence through a more stable and less vulnerable to down-cycles than the residential construction industry. Compared to residential construction cycles, downturns in institutional and commercial constructiondirect ownership structure. The results of operations of Mecánica Falk have been shorter and less severe, and upturns have lasted longer and had higher peaks in termswholly consolidated from August 31, 2010.
65
The Fontaine Acquisition
On February 27, 2009, we acquired the stock of spending as well as units and square footage. In addition, through successful new product innovation, we believe thatFontaine for a total purchase price of $24.2 million, net of $0.6 million of cash acquired. This acquisition further expanded our water management manufacturers are able to grow at a faster pace than the broader infrastructureplatform. Fontaine manufactures stainless steel slide gates and commercial construction markets, as well as mitigate downturns in the cycle.
Water management products tend to be project-critical, highlyother engineered and high value-add and typically are a low percentage of overall project cost. We believe the combination of these features creates a high level of end user loyalty. Demand for these products is influenced by regulatory, building and plumbing code requirements. Many water management products must be tested and approved by USC, NSF, or AWWA before they may be sold. In addition, many of these products must meet detailed specifications set by water management engineers, contractors, builders and architects.
The water management industry’s specification-driven end markets require manufacturers to work closely with engineers, contractors, builders and architects in local markets across the United States to design specific applications on a project-by-project basis. As a result, building and maintaining relationships with engineers, contractors, builders and architects who specify or “spec-in”flow control products for usethe municipal water and wastewater markets. Fontaine is included in construction projects and having the flexibility in design and product innovation is critical to compete effectively. Companies with a strong networkour results of such relationships have a competitive advantage. Specifically, it has been our experience that, once an engineer, contractor, builder or architect has specified our product with satisfactory results, they will continue to use our products in future projects.
Acquisitionsoperations from February 28, 2009.
The GA Acquisition
On January 31, 2008, we utilized existing cash balances to purchase GA Industries, Inc. for $73.7 million, net of $3.2 million of cash acquired. This acquisition expanded our Water Management platform into the water and wastewater markets, specifically in municipal, hydropower and industrial environments. GA Industries, Inc. is comprised of GA Industries and Rodney Hunt Company, Inc.Hunt. GA Industries is a manufacturer of automatic control valves, check valves and air valves. Rodney Hunt, Company, Inc., its wholly owned subsidiary at the time of closing, is a leader in the design and manufacturemanufacturer of sluice/slide gates, butterfly valves, cone valves and other specialized products for municipal, industrial, and hydropower applications.actuation systems. GA is included in our results of operations from February 1, 2008.
The Zurn Acquisition
On February 7, 2007 we acquired Zurn from an affiliate of Apollo for a cash purchase price of $942.5 million, including transaction costs. The purchase price was financed through an equity investment by Apollo and its affiliates of approximately $282.0 million and debt financing of approximately $669.3 million. This acquisition created a new strategic water management platform for the Company. Zurn is a leader in the multi-billion dollar non-residential construction and replacement market for plumbing fixtures and fittings. It designs and manufactures plumbing products used in commercial and industrial construction, renovation and facilities maintenance markets in North America and holds a leading market position across most of its businesses. Zurn is included in our results of operations from February 8, 2007.
The Apollo Transaction
On July 21, 2006, certain affiliates of Apollo and certain members of management purchased RBS Global Inc. from The Carlyle Group for approximately $1.825 billion, excluding transaction fees, through the Mergermerger of Chase Merger Sub, Inc., an entity formed and controlled by Apollo, with and into RBS Global, Inc.Global. The MergerApollo acquisition was financed with (i) $485.0 million of 9.50% senior notes due 2014, (ii) $300.0 million of 11.75% senior subordinated notes due 2016, (iii) $645.7 million of borrowings under new senior secured credit facilities (consisting of a seven-year $610.0 million term loan facility and $35.7 million of borrowings under a six-year $150.0 million revolving credit facility) and (iv) $475.0 million of equity contributions (consisting of a $438.0 million cash contribution from Apollo and $37.0 million of rollover stock and stock options held by management participants). The proceeds from the Apollo cash contribution and the new financing arrangements, net of related debt issuance costs, were used to (i) purchase the Company from its then existing shareholdersstockholders for $1,018.4 million, including transaction costs; (ii) repay all outstanding borrowings under our previously existing credit agreement as of the Merger Date, including accrued interest; (iii) repurchase substantially all $225.0 million of
our 10.125% senior subordinated notes outstanding as of the Merger Date pursuant to a tender offer, including accrued interest and tender premium; and (iv) pay certain seller-related transaction costs.
Acquisition ofThe Dalong Chain Company Acquisition
On July 11, 2006, we acquired Dalong Chain Company or Dalong,(“Dalong”) located in China for a total cash purchase price of $5.9 million, net of $0.4 million of cash acquired, plus the assumption of certain liabilities. The acquisition was financed primarily with on-hand cash and was accounted for using the purchase methodDalong is included in our results of accounting.operations from July 12, 2006.
The Falk Acquisition
On May 16, 2005, we acquired Thethe Falk Corporation or Falk,(“Falk”) from Hamilton Sundstrand, a division of United Technologies Corporation, for $301.3 million ($306.2 million purchase price including related expenses,
66
net of cash acquired of $4.9 million) and the assumption of certain liabilities. Falk is a manufacturer of gears and lubricated couplings and is a recognized leader in the gear and coupling markets. The Falk acquisition significantly enhanced our position as a leading manufacturer of highly engineered Power TransmissionProcess & Motion Control products. By combining our leadership positions in flattopFlatTop™ chain, industrial bearings, non-lubricated couplings and industrial chain with Falk’s complementary leadership positions in gears and lubricated couplings, as well as a growing gear repair business, the Falk acquisition resulted in a comprehensive, market-leading product portfolio that we believe to be one of the broadest in the Power TransmissionProcess & Motion Control industry. Falk is included in our results of operations from May 16, 2005.for all periods presented herein.
Customers
Power TransmissionProcess & Motion Control Customers
Our Power TransmissionProcess & Motion Control components are either incorporated into products sold by OEMs or sold to end usersend-users through industrial distributors as aftermarket products. While approximately 50% of our Process & Motion Control net sales are aftermarket, OEM’s and end-users ultimately drive the demand for our Process & Motion Control products. With nearly 2,500more than 2,600 distributor locations worldwide, we have one of the most extensive distribution networks in the industry. OneThe largest of our Power TransmissionProcess & Motion Control industrial distributors, Motion Industries, Inc.,which is also our largest customer, accounted for approximately 8.1%7.7%, 10.7%7.1%, and 11.8%8.0% of consolidated net sales during our fiscalthe years ended March 31, 2008, 20072009, 2010, and 2006,2011, respectively.
Rather than serving as passive conduits for delivery of product, our industrial distributors participate in the overall competitive dynamic in the Power TransmissionProcess & Motion Control industry. Industrial distributors play a role in determining which of our Power TransmissionProcess & Motion Control products are stocked at their distributor centers and branch locations and, consequently, are most readily accessible to aftermarket buyers, and the price at which these products are sold.
We market our Power TransmissionProcess & Motion Control products both to OEMs and directly to end usersend-users to cultivate an end usercreate preference forof our Power Transmission products.products through end-user specification. We believe this customer preference is important in differentiating our Power TransmissionProcess & Motion Control products from our competitors’ products and preserves our ability to influencecreate channel partnerships where distributors towill recommend Rexnord products to OEMs and end users.end-users. In some instances, we have established a relationship with the end userend-user such that we, the end user,end-user, and the endend- user’s preferred distributor enter into a trilateral agreement whereby the distributor will purchase our Power TransmissionProcess & Motion Control products and stock them for the end user.end-user. We believe our extensive product portfolio positions us to benefit from the trend towards rationalizing suppliers by industrial distributors.
Our Power Transmission products are moving, wearing components that are consumed in use and require regular replacement. This gives rise to an on-going aftermarket opportunity.
Water Management Customers
The majority of our Water Management products are branded under the Zurn tradename and distributed through independent sales representatives;representatives, plumbing wholesalers such as Ferguson, Hughes and Hajoca; home centers such as The Home Depot and Lowe’s; and industry-specific distributors in the food service, industrial, janitorial and
sanitation industries. Ferguson is our largest Water Management customer, which represented approximately 6% of consolidated net sales during our fiscal year ended March 31, 2008. Sales to Ferguson did not represent a significant percentage of consolidated net sales in our fiscal year ended March 31, 2007 as Zurn was only included in our results of operations from February 7, 2007 through March 31, 2007.
Our independent sales representatives work with wholesalers to assess and meet the needs of building contractors. They also combine knowledge of Zurn’s products, installation and delivery with knowledge of the local markets to provide contractors with value added service. We use several hundred independent sales representatives nationwide, along with a network of approximately 7090 third-party warehouses, to provide our customers with 24-hoursame-day service and quick response times.
Water and wastewater customersend-users primarily consist of municipalities. These municipalities, as well as their general contractors, are the principal decision-makers. GA, benefitsRodney Hunt, and Fontaine benefit from strong brand recognition in the industry, which is further bolstered by a strong customer propensity to replace “like-for-like” products.
67
In addition to our domestic Water Management manufacturing facilities, we have maintained a global network of independent sources that manufacture high quality, lower cost component parts for our commercial and institutional products. These sources fabricate parts to our specifications using our proprietary designs, which enables us to focus on product engineering, assembly, testing and quality control. By closely monitoring these sources and through extensive product testing, we are able to maintain product quality and be a cost competitive producer of commercial and institutional products.
Product Development
In both of our Power Transmission and Water Management platforms, we have demonstrated a commitment to developing technologically advanced products within the industries we serve. In the Power Transmission platform, we had approximately 160 active U.S. patents and approximately 850 foreign patents as of March 31, 2008. In addition, we thoroughly test our Power Transmission products to ensure their quality, understand their wear characteristics and improve their performance. These practices have enabled us, together with our customers, to develop reliable and functional Power Transmission solutions. In our Water Management platform, we had approximately 50 and approximately 25 active U.S. and foreign patents, respectively as of March 31, 2008. Product innovation is crucial in the commercial and institutional plumbing products markets because new products must continually be developed to meet specifications and regulatory demands. Zurn’s plumbing products are known in the industry for such innovation. Research and development costs amounted to $6.2 million, $1.9 million, $4.9 million and $8.5 million for the year ended March 31, 2006, the period from April 1, 2006 through July 21, 2006, the period from July 22, 2006 through March 31, 2007 and the year ended March 31, 2008, respectively.
The majority of our new product development begins with discussions and feedback from our customers.extensive “Voice of the Customer” process. We have a team of approximately 400350 engineers and technical employees who are organized by product line. Each of our product lines has technical staff responsible for product development and application support. If the product engineers requireThe Rexnord Innovation Center provides additional support orthrough enhanced capabilities and specialty expertise theythat can call upon additional engineersbe utilized for product innovation and resources fromnew product development. The Rexnord Technical Services. Rexnord Technical ServicesInnovation Center is a groupcertified lab comprised of approximately 3025 specialists that offers testing capability and support during the development process to all of our product lines. Our existing pipeline and continued investment in new product development are expected to drive revenue growth as we address key customer needs.
In both of our Process & Motion Control and Water Management platforms, we have demonstrated a commitment to developing technologically advanced products within the industries we serve. In the Process & Motion Control platform, we had approximately 200 and approximately 800 active United States and foreign patents, respectively, as of March 31, 2011. In addition, we thoroughly test our Process & Motion Control products to ensure their quality, understand their wear characteristics and improve their performance. These practices have enabled us, together with our customers, to develop reliable and functional Process & Motion Control solutions. In our Water Management platform, we had approximately 60 and approximately 30 active United States. and foreign patents, respectively, as of March 31, 2011. Product innovation is crucial in the commercial and institutional plumbing products markets because new products must continually be developed to meet specifications and regulatory demands. Zurn’s plumbing products are known in the industry for such innovation. During fiscal 2011 our total investment in research, development and engineering was $33.7 million.
Our Competitive Strengths
Key characteristics of our business that we believe provide us with a competitive advantage and position us for future growth include the following:
The Rexnord Business System.We operate our company in a disciplined way. The Rexnord Business System
We manage is our company withoperating philosophy and it creates a management philosophy we call RBS.scalable, process-based framework that focuses on driving superior customer satisfaction and financial results by targeting world-class operating performance. RBS is based on the following principles: (1) a culture that embraces Kaizen, the Japanese philosophy of continuous improvement; (2) strategy deployment—a long-term strategic planning process that determines annual improvement priorities and the actions necessary to achieve those priorities; (2) measuring our performance based on customer satisfaction, or the “Voice of the Customer;” (3) involvement of all our associates in the execution of our strategy; and (4) measuring our performance based on customer satisfaction, ora culture that embraces Kaizen, the “VoiceJapanese philosophy of the Customer.”continuous improvement. We
believe applying RBS can yield superior growth, quality, delivery and cost positions relative to our competition, resulting in enhanced profitability and ultimately the creation of shareholderstockholder value. RBS was established by George Sherman, our Non-Executive Chairman of the Board and the former CEO of the Danaher Corporation from 1990 to 2001, during which time he provided leadership and direction in the execution of the Danaher Business System. Bob Hitt, our CEO, and our management team have led the implementation of RBS throughout the Company. As we have applied RBS over the past fiveseveral years, we have experienced significant improvements in growth, productivity, cost reduction and asset efficiency and believe there are substantial opportunities to continue to improve our performance as we continue to apply RBS.
Experienced, High-Caliber Management Team. Our management team is led by Todd Adams, President and Chief Executive Officer. George Sherman, our Non-Executive Chairman of the Board and, from 1990 to 2001, the CEO of the Danaher Corporation, collaborates with the management team to establish the strategic direction of the Company. Other members of the management team include Michael Shapiro, Vice President and
68
Chief Financial Officer, Praveen Jeyarajah, Executive Vice President—Corporate and Business Development and George Moore, Executive Vice President. We believe the overall talent level within our organization is a competitive strength, and we have added a number of experienced key managers across our platforms over the past several years. Mr. Sherman and the management team currently maintain a significant equity investment in the Company. As of March 31, 2011, their ownership interest represented approximately 20% of our common stock on a fully diluted basis.
Strong Financial Performance and Free Cash Flow. Since implementing RBS, we have established a solid track-record of delivering strong financial performance measured in terms of net sales growth, margin expansion and free cash flow conversion (cash flow from operations less capital expenditures compared to net income). Since fiscal 2004, net sales have grown at a compound annual growth rate of 13% inclusive of acquisitions, and Adjusted EBITDA margins (Adjusted EBITDA divided by net sales) have expanded to 19.8%. Additionally, we have consistently delivered strong free cash flow over the past several years by improving working capital performance and maintaining capital expenditures at reasonable levels. By continually focusing on improving our overall operating performance and free cash flow conversion, we believe we can create long-term stockholder value by using our cash flows to manage our leverage, as well as to drive growth through acquisitions over time.
Leading Market Positions in Diversified End-Markets. Our high-margin performance is driven by industry leading positions in the diversified end-markets in which we compete. We estimate that greater than 85% of our net sales are derived from products in which we have leading market share positions. We believe we have achieved leadership positions in these markets through our focus on customer satisfaction, extensive offering of quality products, ability to service our customers globally, positive brand perception, highly engineered product lines, extensive specification efforts and market/application experience. We serve a diverse set of end-markets with our largest single end-market, mining, accounting for 13% of consolidated net sales in fiscal 2011.
Broad Portfolio of Highly Engineered, Specification-Driven Products. We believe we offer one of the broadest portfolios of highly engineered, specification-driven, project-critical products in the end-markets we serve. Our array of product applications, knowledge and expertise applied across our extensive portfolio of products allows us to work closely with our customers to design and develop solutions tailored to their individual specifications. Within our Water Management platform, our representatives work directly with engineers, contractors, builders and architects to “spec-in” our Water Management products early in the design phase of a project. We have found that once these customers have specified a company’s product with satisfactory results, they will generally use that company’s products in future projects. Furthermore, we believe our strong application engineering and new product development capabilities have contributed to our reputation as an innovator in each of our end-markets.
Large Installed Base, Extensive Distribution Network and Strong Aftermarket Revenues. Over the past century we have established relationships with OEMs and end-users across a diverse group of end-markets, creating a significant installed base for our Process & Motion Control products. This installed base generates significant aftermarket sales for us, as our Process & Motion Control products are consumed in use and must be replaced in relatively predictable cycles. In order to provide our customers with superior service, we have cultivated relationships with over 2,600 distributor locations serving our customers globally. Our Water Management platform has 23 manufacturing and warehouse facilities and uses approximately 90 third-party distribution facilities at which it maintains inventory. This broad distribution network provides us with a competitive advantage and drives demand for our Water Management products by allowing quick delivery of project-critical products to our customers facing short lead times. In addition, we believe this extensive distribution network also provides us with an opportunity to capitalize on the expanding renovation and repair market as building owners begin to upgrade existing commercial and institutional bathroom fixtures with high efficiency systems.
Significant Experience Identifying and Integrating Strategic Acquisitions.We have successfully completed and integrated several acquisitions in recent years totaling more than $1.3 billion of total transaction value, including our $942.5 million acquisition of Zurn. These strategic acquisitions have allowed us to establish
69
and expand our Water Management platform, widen our geographic presence, broaden our product lines and, in other instances, move into adjacent markets. Since 2005, we have completed strategic acquisitions that have significantly expanded our Process & Motion Control platform and established and expanded our Water Management platform. We believe these acquisitions have created stockholder value through the implementation of RBS operating principles, which has resulted in identifying and achieving cost synergies, as well as driving growth and operational and working capital improvements.
Our Business Strategy
We strive to create stockholder value by seeking to deliver sales growth, profitability and asset efficiency, which we believe will result in superior financial performance and free cash flow generation when compared to other leading multi-platform industrial companies by driving the following key strategies:
Drive Profitable Growth. Our key growth strategies are:
| • | Accelerate Growth in Key Vertical End-Markets—We believe that we have an opportunity to accelerate our overall net sales growth over the next several years by deploying resources to leverage our highly engineered product portfolio, industry expertise, application knowledge and unique manufacturing capabilities into certain key vertical end-markets that we expect to have above market growth rate potential. We believe those end-markets include, but are not limited to, mining, energy, aerospace, cement and aggregates, food and beverage, water infrastructure and the renovation and repair of existing commercial buildings and infrastructure. |
| • | Product Innovation and Resourcing “Break-throughs”—We intend to continue to invest in strong application engineering and new product development capabilities and processes. Our disciplined focus on innovation begins with our extensive “Voice of the Customer” process and follows a systematic process, ensuring that the commercialization and profitability of new products meet our expectations. Additionally, we will continue resourcing “break-throughs,” which we define as potential products or other growth opportunities that have an annual net sales potential of $20 million or more over 3 to 5 years. We believe growing demands for more energy and water conservation products will also provide opportunities for us to grow through innovation in both platforms. |
| • | Drive Specification for Our Products—We intend to increase our installed base and grow aftermarket revenues by continuing to partner with OEMs to specify our Process & Motion Control products on original equipment applications. Within our Water Management platform, we intend to leverage our sales and distribution network and to increase specification for our products by working directly with our customers to drive specification for our products in the early design stages of a project. |
| • | Expand Internationally—We believe there is substantial growth potential outside the United States for many of our existing products by expanding distribution, further penetrating key vertical end-markets that are growing faster outside the United States and selectively pursuing acquisitions that will provide us with additional international exposure. |
| • | Pursue Strategic Acquisitions—We believe the fragmented nature of our Process & Motion Control and Water Management markets will allow us to continue to identify attractive acquisition candidates in the future that have the potential to complement our existing platforms by either broadening our product offerings, expanding geographically or addressing an adjacent market opportunity. |
Platform Focused Strategies. We intend to build our business around leadership positions in platforms that participate in multi-billion dollar, global, growing end-markets. Within our two existing platforms, we expect to continue to leverage our overall market presence and competitive position to provide further growth and diversification and increase our market share.
The Rexnord Business System.We operate our company in a disciplined way through the Rexnord Business System. RBS is our operating philosophy and it creates a scalable, process-based framework that
70
focuses on driving superior customer satisfaction and financial results by targeting world-class operating performance. We believe applying RBS can yield superior growth, quality, delivery and cost positions relative to our competition, resulting in enhanced profitability and ultimately the creation of stockholder value.
Suppliers and Raw Materials
The principal materials used in our Power TransmissionProcess & Motion Control and Water Management manufacturing processes are commodities and components available from numerous sources. The key metal materials used in our Process & Motion Control manufacturing processes include: sheet, plate and bar steel, castings, forgings, high-performance engineered plastic and a variety of components. The key non-metalWithin our Water Management platform, we purchase a broad range of materials used includeand components throughout the world in connection with our manufacturing activities that include: bar steel, brass, castings, copper, zinc, forgings, plate steel, high-performance engineered plastic. Weplastic and resin. Our global sourcing strategy is to maintain alternate sources of supply for our important materials and components wherever possible within both our Process & Motion Control and Water Management platforms. Historically, we have been able to successfully source materials, and consequently are not dependent on a single source for any significant raw material or component. As a result, we believe there is a readily available supply of materials in sufficient quantity from a variety of sources. Wesources to serve both our short-term and long-term requirements. Additionally, we have not experienced any significant shortage of our key materials and have not historically engaged in hedging transactions for commodity supplies.
We generally purchase our materials on the open market. However, in certain situations we have found it advantageous to enter into contracts for certain large commodity purchases. Although currently we are not a party to any unconditional purchase obligations, including take-or-pay contracts or through-put contracts, in the past, these contracts generally have had one-one to five-year terms and have contained competitive and benchmarking clauses to ensure competitive pricing.
Within our Water Management platform, we purchase a broad range of materials and components throughout the world in connection with our manufacturing activities. Major raw materials and components include bar steel, brass, castings, copper, forgings, high-performance engineered plastic, plate steel, resin, sheet plastic and zinc. Our policy is to maintain alternate sources of supply for our important materials and components wherever possible. Historically, we have been able to successfully apply this policy, and consequently are not dependent on a single source for any raw material or component. The materials and components required for our Water Management manufacturing operations have been readily available, and we do not foresee any significant shortages.
Backlog
Our backlog of unshipped Power Transmission orders was $478 million, $438$359 million and $405 million at June 28, 2008, March 31, 2008 and March 31, 2007, respectively. Our backlog of unshipped Water Management orders was $104 million, $103 million and $19 million at June 28, 2008, March 31, 2008 and March 31, 2007, respectively. The increase in the Water Management backlog from March 31, 2007 to March 31, 2008 is due to our acquisition of GA, which had a backlog of $81$388 million at March 31, 2008. We believe that approximately $123 million2010 and 2011, respectively. Approximately 5% of our total backlog at March 31, 2011 is currently scheduled to ship beyond fiscal 2012. See Risk Factor titled “We could reasonably be expected notadversely affected if any of our significant customers default in their obligations to convert to net sales in fiscal 2009.us” for more information on the risks associated with backlog.
Geographic Areas
For financial information about geographic areas, see noteNote 19 to our audited consolidated financial statements containedincluded elsewhere in this prospectus.
Seasonality
We do not experience significant seasonality of demand for our Power TransmissionProcess & Motion Control products, although sales generally are slightly higher during our fourth fiscal quarter as our customers spend against recently approved capital budgets and perform maintenance and repairs in advance of spring and summer activity. Our end marketsProcess & Motion Control end-markets also do not experience significant seasonality of demand.
Demand for our Water Management products is primarily driven by non-residential construction activity, remodeling and retro-fit opportunities, and to a lesser extent, new home starts as well as water and waste waterwastewater infrastructure expansion for municipal, industrial and hydropower applications. Accordingly, many external factors affectweather has an impact on the cyclicality of certain end-markets. With the exception of our Water Management business, includingremodeling and retro-fit opportunities, weather and the impact of the broader economy on our end markets. Weather is an important variable as it significantly impacts construction. Spring and summer months in the United States and Europe represent the main construction season for new housing starts and remodeling, as well as increased construction in the commercial and institutional markets.markets, as well as new housing starts. As a result, sales generally decrease slightly in the third and fourth fiscal quarters as compared to the first two quarters of the fiscal year. The autumn and winter months generally impede construction and installation activity.
71
Our business also depends upon general economic conditions and other market factors beyond our control, and we serve customers in cyclical industries. As a result, our operating results could be negatively affected during economic downturns. See further information within Risk Factors—“Our business depends upon general economic conditions and other market factors beyond our control, and we serve customers in cyclical industries. As a result, our operating results could further be negatively affected during any continued or future economic downturns.”
Employees
As of June 28, 2008,the date of this filing, we had approximately 7,4006,300 employees, of whom approximately 5,3004,300 were employed in the United States. Approximately 700535 of our U.S.United States employees are represented by labor unions. The seven U.S.five United States collective bargaining agreements to which we are a party will expire inbetween February 2009, August 2009 (two bargaining agreements expire in August 2009), August 2010,2012 and September 2010, October 2010 and April 2012, respectively.2016. Additionally, approximately 1,2001,000 of our employees reside in Europe, where trade union membership is common. We believe we have a satisfactorystrong relationship with our employees, including those represented by labor unions.
Environmental Matters
Our operations and facilities are subject to extensive federal, state, local and foreign laws and regulations related to pollution and the protection of the environment, health and safety, including those governing, among other things, emissions to air, discharges to water, the generation, handling, storage, treatment and disposal of hazardous wastes and other materials, and the remediation of contaminated sites. We have incurred and expect to continue to incur significant costs to maintain or achieve compliance with these requirements. We believe that our business, operations and facilities are being operated in material compliance with applicable environmental, health and safety laws and regulations. However, the operation of manufacturing plants entails risks in these areas, and a failure by us to comply with applicable environmental laws, regulations or the permits required for our operations, could result in civil or criminal fines, penalties, enforcement actions, third party claims for property damage and personal injury, requirements to clean up property or to pay for the capital or operating costs of cleanup, regulatory or judicial orders enjoining or curtailing operations or requiring corrective measures, including the installation of pollution control equipment or remedial actions. Moreover, if applicable environmental, health and safety laws and regulations, or the interpretation or enforcement thereof, become more stringent in the future, we could incur capital or operating costs beyond those currently anticipated.
Some environmental laws and regulations, including the federal Superfund law, impose liability to investigate and remediate contamination on present and former owners and operators of facilities and sites, and on potentially responsible parties, or PRPs for sites to which such parties may have sent waste for disposal. Such liability can be imposed without regard to fault and, under certain circumstances, may be joint and several resulting in one PRP being held responsible for the entire obligation. Liability may also include damages to natural resources. We are currently conducting investigations and/or cleanup of known or potential contamination at severalcertain of our current or former facilities, and have been named as a PRP at severalcertain third party Superfund sites. See Note 18 to our audited consolidated financial statements included elsewhere in this prospectus for further discussion regarding our Downers Grove, Illinois facility and the Ellsworth Industrial Park Site. The discovery of additional contamination, or the imposition of more stringent cleanup requirements, disputes with our insurers or the insolvency of other responsible parties could require us to make significant expenditures in excess of current reserves and/or available indemnification. In addition, we occasionally evaluate various alternatives with respect to our facilities, including possible dispositions or closures. Investigations undertaken in connection with these activities may lead to discoveries of contamination that must be remediated, and closures of facilities may trigger remediation requirements that are not applicable to operating facilities. We also may also face liability for alleged personal injury or property damage due to exposure to hazardous substances used or disposed of by us, that may be contained within our current or former products, or that are present in the soil or ground water at our current or former facilities.
72
Legal Proceedings
Our entitiessubsidiaries are involved in various unresolved legal actions, administrative proceedings and claims in the ordinary course of business involving, among other things, product liability, commercial, employment, workers’ compensation, intellectual property claims and environmental matters. We establishestablished reserves in a manner that is consistent with accounting principles generally accepted in the United States for costs associated with such matters when liability is probable and those costs are capable of being reasonably estimated. Although it is not possible to predict with certainty the outcome of these unresolved legal actions or the range of possible loss or recovery, based upon current information, we believemanagement believes the eventual outcome of these unresolved legal actions, either individually or in the aggregate, will not have a material adverse effect on our financial position, results of operations or cash flows.
In connection with the Carlyle acquisitionAcquisition in November 2002, Invensys plc has provided us with indemnification against certain contingent liabilities, including certain pre-closing environmental liabilities. We believe that, pursuant to such indemnity obligations, Invensys is obligated to defend and indemnify us with respect to the matters described below relating to the Ellsworth Industrial Park Site and to various asbestos claims. The indemnity obligations relating to the matters described below are not subject to any time limitations and are subject to an overall dollar cap equal to the purchase price, which is an amount in excess of $900 million. The following paragraphs summarize the most significant actions and proceedings:
In 2002, Rexnord Industries, LLC (“Rexnord Industries”) was named as a PRP, together with at least ten other companies, at the Ellsworth Industrial Park Site, Downers Grove, DuPage County, Illinois (the “Site”), by the United States Environmental Protection Agency (“USEPA”), and the Illinois Environmental Protection Agency (“IEPA”). Rexnord Industries’ Downers Grove property is situated within the Ellsworth Industrial Complex. The USEPA and IEPA allege there have been one or more releases or threatened releases of chlorinated solvents and other hazardous substances, pollutants or contaminants, allegedly including but not limited to a release or threatened release on or from our property, at the Site. The relief sought by the USEPA and IEPA includes further investigation and potential remediation |
The ultimate outcome of the EllsworthSite and reimbursement of USEPA’s past costs. Rexnord Industries’ allocated share of past and future costs related to the Site, including for investigation and/or remediation, could be significant.
All previously pending lawsuits related to the Site have been settled and related litigation cannot presently be determined; however, we believe we have meritorious defenses to these matters.dismissed. Pursuant to its indemnity obligation, Invensys is defendingcontinues to defend us in these matters related to the Site and has paid 100% of the related costs to date. To provide additional protection, we have brought several indemnification suits against previous property owners who retained certain environmental liabilities associated with our property, and we are also involved in litigation with our insurance companies for a declaration of coverage. These suits are progressing in accordance with the respective court’s scheduling order.
Approximately 700Multiple lawsuits (with approximately 6,9501,435 claimants) are pending in state or federal court in numerous jurisdictions relating to alleged personal injuries due to the alleged presence of asbestos in certain brakes and clutches previously manufactured by our Stearns division and/or its predecessor owners. Invensys and FMC, prior owners of the Stearns business, have paid 100% of the costs to date related to the Stearns lawsuits. Similarly, our Prager subsidiary has been named asis a defendant in two pending multi-defendant lawsuits relating to alleged personal injuries due to the alleged presence of asbestos in a product allegedly manufactured by Prager. Additionally, there are approximately 3,700 individuals who have filed asbestos related claims against Prager; however, these claims are currently on the Texas Multi-district Litigation inactive docket. The ultimate outcome of these asbestos matters cannot presently be determined. To date, our insurance providers have paid 100% of the costs related to the Prager asbestos matters. We believe that the combination of its insurance coverage and the Invensys indemnity obligations will cover any future costs of these matters.
|
In connection with the Falk Corporation (“Falk”) acquisition, Hamilton Sundstrand has provided us with indemnification against certain contingent liabilities, including coverage for certain pre-closing environmental liabilities. We believe that, pursuant to such indemnity obligations, Hamilton Sundstrand is obligated to defend and indemnify us with respect to the asbestos claims described below, and that, with respect to these claims, such indemnity obligations are not subject to any time or dollar limitations. The following paragraph summarizes the most significant actions and proceedings for which Hamilton Sundstrand has accepted responsibility:
73
Falk, through its successor entity, is a defendant in approximately 150200 lawsuits pending in state or federal court in numerous jurisdictions relating to alleged personal injuries due to the alleged presence of asbestos in certain clutches and drives previously manufactured by Falk. There are approximately 1,840570 claimants in these suits. The ultimate outcome of these lawsuits cannot presently be determined. Hamilton Sundstrand is defending us in these lawsuits pursuant to its indemnity obligations and has paid 100% of the costs to date.
Certain Water Management subsidiaries are also subject to asbestos and class action related litigation.
As of June 28, 2008,March 31, 2011, Zurn and an average of 113approximately 80 other unrelated companies were defendants in approximately 6,0007,000 asbestos related lawsuits representing approximately 45,00028,500 claims. The suits allege damages in an aggregate amount of approximately $14.2 billion against all defendants. Plaintiffs’ claims allege personal injuries caused by exposure to asbestos used primarily in industrial boilers formerly manufactured by a segment of Zurn. Zurn did not manufacture asbestos or asbestos components. Instead, Zurn purchased them from suppliers. These claims are being handled pursuant to a defense strategy funded by insurers.
We currently As of March 31, 2011, we estimate the potential liability for asbestos-related claims pending against Zurn as well as the claims expected to be filed in the next ten years isto be approximately $134.0$65.0 million of which Zurn expects to pay approximately $116.0$53.0 million in the next ten years on such claims, with the balance of the estimated liability being paid in subsequent years. However, there are inherent uncertainties involved in estimating the number of future asbestos claims, future settlement costs, and the effectiveness of defense strategies and settlement initiatives.
As a result, Zurn’s actual liability could differ from the estimate described herein. Further, while this current asbestos liability is based on an estimate of claims through the next ten years, such liability may continue beyond that time frame, and such liability could be substantial.
We estimateManagement estimates that its available insurance to cover its potential asbestos liability as of June 28, 2008,March 31, 2011, is approximately $280.5$266.3 million, and believebelieves that all current claims are covered by this insurance. However, principally as a result of the past insolvency of certain of our insurance carriers, certain coverage gaps will exist if and after our other carriers have paid the first $204.5$190.3 million of aggregate liabilities. In order for the next $51.0 million of insurance coverage from solvent carriers to apply, we estimatemanagement estimates that weit would need to satisfy $14.0 million of asbestos claims. Layered within the final $25.0 million of the total $280.5$266.3 million of coverage, we estimatemanagement estimates that weit would need to satisfy an additional $80$80.0 million of asbestos claims. If required to pay any such amounts, we could pursue recovery against the insolvent carriers, but it is not currently possible to determine the likelihood or amount of any such recoveries, if any.
As of June 28, 2008,March 31, 2011, we recorded a receivable from our insurance carriers of $134.0$65.0 million, which corresponds to the amount of ourits potential asbestos liability that is covered by available insurance and is currently determined to be probable of recovery. However, there is no assurance that $280.5$266.3 million of insurance coverage will ultimately be available or that Zurn’s asbestos liabilities will not ultimately exceed $280.5$266.3 million. Factors that
could cause a decrease in the amount of available coverage includeinclude: changes in law governing the policies, potential disputes with the carriers onregarding the scope of coverage, and insolvencies of one or more of our carriers.
As of the date of this filing,May 12, 2011, subsidiaries, Zurn Pex, Inc. and Zurn Industries, LLC (formerly known as Zurn Industries, Inc.), have been named as defendants in tenfourteen lawsuits, brought between July 2007 and August 2008,December 2009, in various U.S. federalUnited States courts (MN, ND, CO, NC, MT, AL, VA, LA, NM, MI and VA)HI). The plaintiffs in these suits represent (in the case of the proceedings in Minnesota), or seek to represent, a class of plaintiffs alleging damages due to the alleged failure or anticipated failure of the Zurn brass crimp fittings on the PEXPex plumbing systems in homes and other structures. The complaints assert various causes of action, including but not limited to negligence, breach of warranty, fraud, and violations of the Magnuson Moss Act and certain state consumer protection laws, and seek declaratory and injunctive relief, and damages (including punitive damages). All but the Hawaii suit, which remains in unspecified amounts. The suits wereHawaii state court, have been transferred to a multi-district litigation docket in the District of Minnesota for coordinated pretrial proceedings. The court in the Minnesota proceedings subject, however,certified certain classes of plaintiffs in Minnesota for negligence and negligent failure to policy termswarn claims and conditions, and deductibles. We are being provided a defense by our insurance carrier and believefor
74
breach of warranty claims. While we have insurance to cover potential liabilities, subject, however, to policy termsappealed the class certification decision in the Minnesota proceedings, and conditions, and deductibles. While we intend towill otherwise vigorously defend ourselves in thesethe various actions, the uncertainties of litigation and the uncertainties related to insurance coverage and collection as well as the actual number or value of claims make it difficult to accurately predict the financial effect these claims may ultimately have on us.
Properties
Within Power TransmissionProcess & Motion Control, as of the date hereof, we have 28had 36 principal manufacturing, warehouse and four repair facilities, 2223 of which are located in North America, fivesix in Europe, one in Australia, onetwo in South America and threefour in Asia. With the exception of one plant located in Downers Grove, Illinois, each of our facilities is dedicated to the manufacture of a single product line. All of our facilities listed below are suitable for their respective operations and provide sufficient capacity to meet reasonably foreseeable production requirements.
We own and lease our Power TransmissionProcess & Motion Control facilities throughout the United States and in several foreign countries. Listed below are the locations of our principal Power TransmissionProcess & Motion Control manufacturing, warehouse and repair facilities:
Facility Location | Product/Use | Size | Owned | |||||
North America | ||||||||
| ||||||||
Auburn, AL | Coupling | 133,000 | Leased | |||||
Bridgeport, CT | Special Components | 31,000 | Owned | |||||
Clinton, TN | Industrial Bearings | 180,000 | Owned | |||||
Cudahy, WI | Special Components | 100,000 | ||||||
| Leased | |||||||
Downers Grove, IL (2 facilities) | 248,000 | Owned | ||||||
Grafton, WI | Flattop | 95,000 | Owned | |||||
Grove City, OH | Warehouse | 73,000 | ||||||
| Leased | |||||||
Indianapolis, IN | Industrial Bearings | 527,000 | Owned | |||||
Lincoln, NE | Coupling | 34,000 | Leased | |||||
| 36,000 | Leased | ||||||
Milwaukee, WI | Gear | 1,100,000 | Owned | |||||
New Berlin, WI | Gear Repair | 47,000 | Leased | |||||
New Berlin, WI | Coupling | 54,000 | Owned | |||||
New Orleans, LA | Gear Repair | 54,000 | Owned | |||||
Rockford, IL | Coupling | 22,500 | Leased | |||||
Simi Valley, CA (2 facilities) | Aerospace | 55,000 | Leased | |||||
Stuarts Draft, VA | Gear | 97,000 | Owned | |||||
Toronto, Canada | Gear Repair | 30,000 | Leased | |||||
Toronto, Canada | Warehouse | 33,000 | Leased | |||||
West Milwaukee, WI | Industrial Chain | 370,000 | Owned | |||||
Wheeling, IL | Aerospace | 83,000 | Owned | |||||
Europe | ||||||||
Betzdorf, Germany | Industrial Chain | 179,000 | Owned | |||||
Corregio, Italy | Flattop | 79,000 | Owned | |||||
Dortmund, Germany | Coupling | 36,000 | Owned | |||||
Gloucestershire, England | Coupling | 20,500 | Leased | |||||
Gravenzande, Netherlands | Flattop | 117,000 | Leased | |||||
Hamelin, Germany | Gear | 374,000 | Leased | |||||
South America | ||||||||
Sao Leopoldo, Brazil | Industrial Chain | 77,000 | Owned | |||||
Santiago, Chile | Gear Repair | 15,000 | Leased | |||||
Australia | ||||||||
Newcastle, Australia | Gear | 65,000 | Owned | |||||
Asia | ||||||||
Changzhou, China | Gear and Coupling | 206,000 | Owned | |||||
Shanghai, China | Gear and Coupling | 47,000 | Leased | |||||
Shanghai, China | Industrial Chain and Flattop | 134,000 | Leased | |||||
Thane, India | Coupling | 16,500 | Leased | |||||
75
Within Water Management, as of the date hereof, we had 23 principal manufacturing and warehouse facilities, primarily located in the United States and Canada, as set forth below:
Facility Location | Product/Use | Size | Owned | |||||||
| ||||||||||
| ||||||||||
| ||||||||||
| ||||||||||
| ||||||||||
| ||||||||||
| ||||||||||
| ||||||||||
| ||||||||||
| ||||||||||
| ||||||||||
| ||||||||||
| ||||||||||
| ||||||||||
We have 21 Water Management facilities principally located in the U.S. and Canada, as set forth below:
|
| |||||||||
| ||||||||||
| ||||||||||
| ||||||||||
Abilene, Texas | Commercial Brass | 177,000 | Owned | |||||||
| ||||||||||
Commerce, Texas | PEX | 175,000 | Owned | |||||||
Cranberry TWP., Pennsylvania | Water and Wastewater | 37,000 | Owned | |||||||
Dallas, Texas | Warehouse | 52,000 | Leased | |||||||
Elkhart, Indiana | PEX | 110,000 | Owned | |||||||
Erie, Pennsylvania | Specification Drainage | 210,000 | Leased | |||||||
Erie, Pennsylvania | Specification Drainage | 100,000 | Owned | |||||||
Falconer, New York | Specification | 151,500 | Leased | |||||||
Fresno, California | Warehouse | 52,000 | Leased | |||||||
Gardena, California | Warehouse | 74,000 | Owned | |||||||
Harborcreek, Pennsylvania | Specification | 15,000 | Leased | |||||||
Hayward, California | Warehouse | 23,500 | Leased | |||||||
Levittown, Pennsylvania | Warehouse | 40,000 | Leased | |||||||
Magog, Quebec | Water and Wastewater | 58,000 | Owned | |||||||
Mars, Pennsylvania | Water and Wastewater | 63,000 | Owned | |||||||
Mississauga, Ontario | Manufacturing/Warehouse | 28,000 | Leased | |||||||
Mississauga, Ontario | Warehouse | 25,000 | Leased | |||||||
Norcross, Georgia | Warehouse | 96,000 | Leased | |||||||
Northwood, Ohio | Warehouse | 18,000 | Leased | |||||||
Orange, Massachusetts | Water and Wastewater | 250,000 | Owned | |||||||
Paso Robles, California | Water Control | 158,000 | Owned | |||||||
Sacramento, California | Warehouse | 16,000 | Leased | |||||||
Sanford, North Carolina | Commercial Brass | 78,000 | Owned | |||||||
In addition, we lease sales office space in Taipei, R.O.C. and, an engineering and sourcing center in Zhuhai, China. We also currently leaseChina and approximately 14,000 square feet of office space that had previously been the JBIJacuzzi Brands, Inc. corporate headquarters in West Palm Beach, Florida.
We believe our Power TransmissionProcess & Motion Control and Water Management properties are sufficient for our current and future anticipated needs.
76
Board of Directors and Executive Officers
The following table sets forth information concerning our directors and executive officers as of August 15, 2008:the date of this prospectus:
Name | Age | Position(s) | ||||
George M. Sherman | 69 | Chairman of the Board and Director | ||||
| 40 | President, Chief Executive Officer and Director | ||||
| ||||||
George C. Moore | 56 | Executive Vice President | ||||
| 40 | Vice President | ||||
Praveen R. Jeyarajah | 43 | Executive Vice President-Corporate & Business Development and Director | ||||
Laurence M. Berg | 45 | Director | ||||
Peter P. Copses | 52 | Director | ||||
Damian J. Giangiacomo | 34 | |||||
| Director | |||||
Steven Martinez | 42 | Director | ||||
John S. Stroup | 45 | Director | ||||
The following is information about the experience and attributes of the members of our board of directors as of the date of this prospectus. Together, the experience and attributes discussed below, along with the provisions of the stockholders agreements and the management consulting agreement with Cypress discussed in “Certain Relationships and Related Party Transactions,” provide the reasons that these individuals were selected for board membership, as well as why they continue to serve on the board.
Board of Directors
George M. Sherman has been theour Non-Executive Chairman of the Companyand a director since 2002. Mr. Sherman is a principal of Cypress Group LLC. Mr. Sherman also currently serves as the non-executive Chairman of Jacuzzi Brands Corp. and has served as the Chairman of Campbell Soup Company from August 2001 to November 2004, and currently serves as the chairman of Jacuzzi Brands Corp.2004. Prior to his appointmentservice with Campbell Soup, Company, Mr. Sherman was the Chief Executive Officer at Danaher Corporation, a manufacturer of process/environmental controls and tools and components, from 1990 to May 2001. Prior to joining Danaher, he was Executive Vice President at Black and& Decker Corporation. Mr. Sherman serves on our board of directors because he has significant experience and expertise in the manufacturing industry (including as chief executive officer), mergers and acquisitions and strategy development and continues to serve because of his in-depth knowledge of Rexnord and our business.
RobertTodd A. HittAdams became our President and Chief Executive Officer in September 2009 and became a director in October 2009. Mr. Adams joined us in 2004 as Vice President, Treasurer and Controller; he has also served as Senior Vice President and Chief Financial Officer from April 2008 to September 2009 and as President of the Water Management platform in 2009. Prior to joining us, Mr. Adams held various positions at The Boeing Company, APW Ltd. and Applied Power Inc. (currently Actuant Corporation). Mr. Adams serves on our board of directors because he has significant experience in the manufacturing industry and an in-depth knowledge of Rexnord and our business and because he is our Chief Executive Officer.
Praveen R. Jeyarajahbecame our Executive Vice President—Corporate & Business Development in April 2001 and was elected as2010. Mr. Jeyarajah first became a director in connection with the Carlyle acquisitionAcquisition in 2002. Prior to the Carlyle acquisition, Mr. Hitt had been the Chief Operating Officer of Invensys Industrial Components and Systems Division since April 2002, Division Chief Executive of Invensys Automation Systems Division from April 2001 to March 2002 and Division Chief Executive of Invensys Industrial Drive Systems Division from October 2000 to March 2001. Prior to joining the Company, Mr. Hitt joined Siebe/Invensysserved in 1994, where he held various positions, including President of Climate Controls, from June 1997 to October 2000, and prior to June 1997, General Manager of Appliance Controls.
Todd A. Adams became Chief Financial Officer and Senior Vice President of the Company in April 2008. Mr. Adams had been Vice President, Controller and Treasurer of the Company since July 2004. Prior to joining Rexnord, he held positions as Director of Financial Planning and Analysis at The Boeing Company from February 2003 to July 2004, Vice President & Controller of APW Ltd. from July 2000 to February 2003 and Vice President & Controller of Applied Power Inc. (currently Actuant Corporation) from May 1998 to July 2000.
George C. Moore became the Executive Vice President Chief Financial Officer and Secretary of the Company in September 2006. Effective April 1, 2008, he relinquished his role as Chief Financial Officer but retained his position of Executive Vice President and Secretary. Prior to joining the Company, Mr. Moore had been the Executive Vice President and Chief Financial Officer of Maytag, a manufacturer of major appliances and household products, since 2003. Prior to that Mr. Moore served as Group Vice President of Finance at Danaher Corporation, where he was employed since 1993. Mr. Moore is a director of Jacuzzi Brands Corp. and also currently serves on the advisory board of FM Global.
Alex P. Marini became President of our Water Management Group upon consummation of the Zurn acquisition. From August 2006capacity until the acquisition, Mr. Marini was the President and Chief Executive Officer of JBI, the President and Chief Operating Officer of JBI from August 2005 to August 2006 and the President of
Zurn from 1996 to August 2006. He joined Zurn in 1969 and held a variety of financial positions, including Vice President and Group Controller. He was promoted to Vice President of Sales, Marketing and Administration in 1984, and in 1987 was named President of Wilkins, a Zurn division, a position he held until becoming President of Zurn. Mr. Marini is also a director of Jacuzzi Brands Corp.
Laurence M. Bergbecame a member of our board of directors upon consummation of the Apollo acquisition in July 2006. Mr. Jeyarajah again became a director in October 2006. Prior to becoming our Executive Vice President—Corporate & Business Development, Mr. Jeyarajah was a Managing Director at Cypress Group, LLC from 2006 to 2010 and a Director of Jacuzzi Brands Corp. until 2010. Mr. Jeyarajah was also a Managing Director of Carlyle from 2000 to 2006. Prior to joining Carlyle,
77
Mr. Jeyarajah was with Saratoga Partners from 1996 to 2000 and, prior to that, he worked at Dillon, Read & Co., Inc. Mr. Jeyarajah serves on our board of directors because he has significant investment expertise and experience with mergers and acquisitions, including leveraged buyouts, and he continues to serve because of his in-depth knowledge of Rexnord and our business.
Laurence M. Berg became a director in July 2006 upon consummation of the Apollo acquisition. Mr. Berg is a Senior Partner of Apollo Management, L.P. and its investment affiliates,, where he has worked since 1992. Prior to joining Apollo, Mr. Berg was a member of the Mergers and Acquisition Group at Drexel Burnham Lambert.Lambert, an investment banking firm. Mr. Berg is also a director of Jacuzzi Brands Corp., Connections Academy LLC, Panolam Industries International, Inc. and Connections Academy.ABC Supply Co. Inc., and has previously served as a director of Bradco Supply Corp., Educate, Inc., GNC Corp., Goodman Global Holdings, Inc., Hayes Lemmerz International, Inc. and Rent A Center, Inc. Mr. Berg serves on our board of directors because he has significant experience making and managing private equity investments on behalf of Apollo and has over 20 years of experience financing, analyzing and investing in public and private companies. In addition, Mr. Berg worked with the diligence team for Apollo at the time of the Apollo acquisition and has worked closely with our management since that time; therefore, pursuant to a stockholders agreement, Apollo appointed him to the board.
Peter P. Copsesbecame a member of our board of directorsdirector in July 2006 upon consummation of the Apollo acquisition in July 2006.acquisition. Mr. Copses is a FoundingSenior Partner of Apollo Management, L.P. and its investment affiliates,, where he has worked since 1990. Prior to joining Apollo, Mr. Copses was an investment banker at Drexel Burnham Lambert, and subsequently at Donaldson, Lufkin & Jenrette Securities, primarily concentrating on the structuring, financing and negotiation of mergers and acquisitions. Mr. Copses is also a director of Claire’s Stores, Inc. and CKE Restaurants, Inc., and has previously served as a director of Linens N’ Things, Inc., GNC Corp., Rent A Center, Inc. and Smart & Final.Final, Inc. Mr. Copses serves on our board of directors because he has significant experience making and managing private equity investments on behalf of Apollo and has over 25 years of experience financing, analyzing and investing in public and private companies; therefore, pursuant to a stockholders agreement, Apollo appointed him to the board.
Damian J. Giangiacomobecame a member of our board of directorsdirector in October 2006. Mr. Giangiacomo is a principal atof Apollo Management, L.P., where he has been employed since July 2000. Prior to joining Apollo, Mr. Giangiacomo was an investment banker at Morgan Stanley & Co. Mr. Giangiacomo is also a director of Linens N’ Things, Jacuzzi Brands Corp. and Connections Academy.Academy LLC, and has previously served as director of Linens N’ Things, Inc. Mr. Giangiacomo serves on our board of directors because he has significant experience making and managing private equity investments on behalf of Apollo and has over 10 years of experience financing, analyzing and investing in public and private companies. In addition, Mr. Giangiacomo worked with the diligence team for Apollo at the time of the Apollo acquisition and has worked closely with our management since that time; therefore, pursuant to a stockholders agreement, Apollo appointed him to the board.
Praveen R. Jeyarajah was first elected as a director of RBS Global in connection with the Carlyle acquisition in 2002 and served in that capacity until the Apollo acquisition. Mr. Jeyarajah was reappointed as a director of the Company in October 2006, and also serves as a director of Jacuzzi Brands Corp. Mr. Jeyarajah is a Managing Director at Cypress Group, LLC. Prior to joining Cypress Group, he was a Managing Director of Carlyle from 2001 to 2006. Prior to joining Carlyle, Mr. Jeyarajah was with Saratoga Partners from 1996 to 2000. Prior to that, Mr. Jeyarajah worked at Dillon, Read & Co., Inc.
Steven Martinezbecame a member of our board of directorsdirector in July 2006 upon the consummation of the Apollo acquisition in July 2006.acquisition. Mr. Martinez is a Senior Partner atof Apollo Management, L.P. Prior to joining Apollo in 2000, heMr. Martinez worked for Goldman Sachs & Co. and Bain and Company.& Company, Inc. Mr. Martinez also serves as a director of Prestige Cruises, Norwegian Cruise Line andHoldings, Inc., NCL Corporation Ltd., Hughes Telematics, Inc., Jacuzzi Brands Corp., Principal Maritime and Veritable Maritime Holdings, LLC, and has previously served as a director of Allied Waste Industries, Inc. and Goodman Global Holdings, Inc. Mr. Martinez serves on our board of directors because he has significant experience making and managing private equity investments on behalf of Apollo and has over 15 years of experience financing, analyzing and investing in public and private companies. In addition, Mr. Martinez worked with the diligence team for Apollo at the time of the Apollo acquisition and has worked closely with our management since that time; therefore, pursuant to a stockholders agreement, Apollo appointed him to the board.
John S. Stroup became a director in October 2008. Mr. Stroup is currently president and chief executive officer and a member of the board of directors of Belden Inc., a company listed on the New York Stock Exchange, that designs, manufactures, and markets cable, connectivity, and networking products in markets
78
including industrial automation, enterprise, transportation, infrastructure, and consumer electronics. Prior to joining Belden Inc. in 2005, Mr. Stroup was employed by Danaher Corporation, a manufacturer of process/environmental controls and tools and components. At Danaher, Mr. Stroup initially served as Vice President, Business Development. He was promoted to President of a division of Danaher’s Motion Group and later to Group Executive of the Motion Group. Prior to that, he was Vice President of Marketing and General Manager with Scientific Technologies Inc. Mr. Stroup serves on our board of directors because he has significant experience in strategic planning and general management of business units of public companies (including as chief executive officer).
Executive Officers
The following is information about the executive officers of the Company as of the date of this prospectus.
Todd A. Adams became our President and Chief Executive Officer in September 2009 and became a member of our board of directors in October 2009. See “Board of Directors” above.
George C. Moore became our Executive Vice President in September 2006. During his tenure with Rexnord, Mr. Moore has served as Chief Financial Officer from 2006 to April 2008, as Acting Chief Financial Officer from September 2009 to February 2010 and as Treasurer from 2006 to 2010. Mr. Moore has also served as a Director of Jacuzzi Brands Corp. from 2008 to 2009 and as the Executive Vice President and Chief Financial Officer of Maytag Corporation, a manufacturer of major appliances and household products, from 2003 to 2006. Prior to that, Mr. Moore served as Group Vice President of Finance at Danaher Corporation, where he was employed since 1993. Mr. Moore also serves on the advisory board of FM Global.
Michael H. Shapiro became our Vice President and Chief Financial Officer in February 2010. Prior to joining Rexnord, Mr. Shapiro served as Vice President, Finance and Business Development for the Renal Division of Baxter International Inc., a global medical device and biopharmaceutical manufacturer, since 2008. Mr. Shapiro, who joined Baxter in 1995, also held various other positions with Baxter, including Vice President, Corporate Financial Planning and Analysis; Vice President and Assistant Treasurer, Corporate Treasury; Director of Investor Relations, Corporate; Director of Global Operations Finance, BioScience Division; and Director of Global Finance, BioScience Division. Mr. Shapiro, a certified public accountant, worked at Deloitte & Touche LLP, a public accounting firm, from 1992 to 1995.
Praveen R. Jeyarajah became our Executive Vice President—Corporate & Business Development in April 2010 and became a member of our board of directors in October 2006 (he also served as a member of the board of directors from 2002 to May 2006). See “Board of Directors” above.
Composition of Board of Directors
Upon the closing of this offering, the Company will have directors. We will appoint additionalintend to avail ourselves of the “controlled company” exception under the New York Stock Exchange rules, which eliminates the requirements that we have a majority of independent members todirectors on our board of directors priorand that we have compensation and nominating/corporate governance committees composed entirely of independent directors. We will be required, however, to have an audit committee with one independent director during the 90-day period beginning on the date of effectiveness of the registration statement filed with the SEC in connection with this offering and of which this prospectus is part. After such 90-day period and until one year from the date of effectiveness of the registration statement, we will be required to have a majority of independent directors on our audit committee. Thereafter, we will be required to have an audit committee comprised entirely of independent directors.
If at any time we cease to be a “controlled company” under the New York Stock Exchange rules, the board of directors will take all action necessary to comply with the applicable New York Stock Exchange rules,
79
including appointing a majority of independent directors to the completionboard of directors and establishing certain committees composed entirely of independent directors, subject to a permitted “phase-in” period.
Upon consummation of this offering. offering, our board of directors will be divided into three classes. The members of each class will serve staggered, three-year terms (other than with respect to the initial terms of the Class I and Class II directors, which will be one and two years, respectively). Upon the expiration of the term of a class of directors, directors in that class will be elected for three-year terms at the annual meeting of stockholders in the year in which their term expires. Upon consummation of this offering:
, and will be Class I directors, whose initial terms will expire at the 2012 annual meeting of stockholders;
, and will be Class II directors, whose initial terms will expire at the 2013 annual meeting of stockholders; and
, , and will be Class III directors, whose initial terms will expire at the 2014 annual meeting of stockholders.
Any additional directorships resulting from an increase in the number of directors will be distributed among the three classes so that, as nearly as possible, each class will consist of one-third of our directors. This classification of our board of directors may have the effect of delaying or preventing changes in control.
At each annual meeting, our stockholders will elect the successors to our directors. Any director may be removed from office by a majority of our stockholders. Our executive officers and key employees serve at the discretion of our board of directors. Directors may be removed for cause by the affirmative vote of the holders of a majority of our common stock.
Committees of our Board of Directors
Upon consummation of this offering, our board of directors will have three standing committees: an audit committee, a compensation committee and a nominating and corporate governance committee. Following the consummation of this offering, we intend to avail ourselves of the “controlled company” exception under the New York Stock Exchange rules which exempts us from certain requirements, including the requirements that we have a majority of independent directors on our board of directors and that we have compensation and nominating and corporate governance committees composed entirely of independent directors. We will, however, remain subject to the requirement that we have an audit committee composed entirely of independent members.
If at any time we cease to be a “controlled company” under the New York Stock Exchange Rules, the board of directors will take all action necessary to comply with the applicable New York Stock Exchange Rules, including appointing a majority of independent directors to the board of directors and establishing certain committees composed entirely of independent directors, subject to a permitted “phase-in” period.
Audit Committee
UponFollowing the consummation of this offering, our audit committeeAudit Committee will consist of (Chair), and . Our board of directors has determined that qualifies as an “audit committee financial expert” as such term is defined in Item 407(d)(5) of Regulation S-K and that is independent as independence is defined in Rule 10A-3 of the Exchange Act and under the New York Stock Exchange listing standards.
The principal duties and responsibilities of our audit committee are to oversee and monitor the following:Audit Committee will be as follows:
preparation ofto prepare annual audit committeeAudit Committee report to be included in our annual proxy statement;
to oversee and monitor our financial reporting processprocess;
to oversee and monitor the integrity of our financial statements and internal control system;
the integrity of our financial statements;
to oversee and monitor the independence, qualificationsretention, performance and performancecompensation of our independent auditor;
to oversee and monitor the performance, appointment and retention of our senior internal audit function; andstaff person;
to discuss, oversee and monitor policies with respect to risk assessment and risk management;
to oversee and monitor our compliance with legal, ethical and regulatory matters.matters; and
to provide regular reports to the board.
The audit committee will have the power to investigate any matter brought to its attention within the scope of its duties. ItAudit Committee will also have the authority to retain counsel and advisors to fulfill its responsibilities and duties.duties and to form and delegate authority to subcommittees.
80
Holdings Compensation Committee
Following the consummation of this offering, our compensation committee (the “Holdings Compensation Committee”)Committee will consist of (Chair), and . The principal duties and responsibilities of the Holdings Compensation Committee will be as follows:
to review, evaluate and make recommendations to the full board of directors regarding our compensation policies and establish performance-based incentives that support our long-term goals, objectives and interests;programs;
to review and approve the compensation of our chief executive officer, other officers and key employees, including all employees who report directly to our chief executive officermaterial benefits, option or stock award grants and other members of our senior management;prerequisites and all material employment agreements, confidentiality and non-competition agreements;
to review and make recommendations to the board of directors with respect to our incentive compensation plans and equity-based compensation plans;
to administer incentive compensation and equity-related plans;
to review and make recommendations to the board of directors with respect to the financial and other performance targets that must be met;
to set and review the compensation of and reimbursement policies for members of the board of directors;
to provide oversight concerning selection of officers, management succession planning, expense accounts, indemnification and insurance matters, and separation packages; and
to prepare an annual compensation committee report provide regular reports to the board, and take such other actions as are necessary and consistent with the governing law and our organizational documents.
We intend to avail ourselves of the “controlled company” exception under the New York Stock Exchange rules which exempts us from the requirement that we have a compensation committee composed entirely of independent directors.
A copy of the Holdings Compensation Committee Charter is posted on our website www.rexnord.com under .
Nominating and Corporate Governance Committee
Prior to consummation of this offering, our board of directors will establish a nominatingNominating and corporate governance committee. We expect thatCorporate Governance Committee. Following the membersconsummation of the nominatingthis offering, our Nominating and corporate governance committeeCorporate Governance Committee will beconsist of (Chair), and , who will be appointed to the committee promptly following this offering.. The principal duties and responsibilities of the nominatingNominating and corporate governance committeeCorporate Governance Committee will be as follows:
to establishidentify candidates qualified to become directors of the Company, consistent with criteria for board and committee membership and recommend to our board of directors proposed nominees for election to the board of directors and for membership on committees ofapproved by our board of directors;
to make recommendationsrecommend to our board of directors nominees for election as directors at the next annual meeting of stockholders or a special meeting of stockholders at which directors are to be elected, as well as to recommend directors to serve on the other committees of the board;
to recommend to our board of directors candidates to fill vacancies and newly created directorships on the board of directors;
to identify best practices and recommend corporate governance principles, including giving proper attention and making effective responses to stockholder concerns regarding proposals submitted bycorporate governance;
to develop and recommend to our stockholders;board of directors guidelines setting forth corporate governance principles applicable to the Company; and
to make recommendations tooversee the evaluation of our board of directors regarding board governance matters and practices.senior management.
We intend to avail ourselves of the “controlled company” exception under the New York Stock Exchange rules which exempts us from the requirement that we have a nominatingNominating and corporate governance committeeCorporate Governance Committee composed entirely of independent directors.
81
Code of Business Conduct and Ethics
We have a Code of Business Conduct and Ethics that applies to all of our associates, including our principal executive officer, principal financial officer and principal accounting officer, or persons performing similar functions. These standards are designed to deter wrongdoing and to promote honest and ethical conduct. TheExcerpts from the Code of Business Conduct and Ethics, which addressesaddress the subject areas covered by the SEC’s rules, iswill be posted on our website: www.rexnord.com under Ethics Policy (www.rexnord.com/corporate_profile/rexnord_ethics_ policy.asp).“Investor Relations.” Any substantive amendment to, or waiver from, any provision of the Code of Business Conduct and Ethics with respect to any senior executive or financial officer shallwill also be posted on our website.The information contained on our website is not part of this prospectus.
Securities Authorized for Issuance Under Equity Compensation Plans
The following table provides information about the Company’s equity compensation as of March 31, 2008:2011:
| ||||||||
| ||||||||
| ||||||||
| ||||||||
Plan Category | Number of securities to be issued upon exercise of outstanding options, warrants and rights | Weighted-average exercise price of outstanding options, warrants and rights | Number of securities remaining available for future issuance under equity compensation plans (excluding securities reflected in the first column) | |||||||||
Equity compensation plans approved by security holders | 2,570,513 | (1) | $ | 19.73 | 139,070 | |||||||
Equity compensation plans not approved by security holders | — | — | — | |||||||||
Total | 2,570,513 | $ | 19.73 | 139,070 | ||||||||
| (1) | Includes 377,623 of Rollover Options and 2,192,890 options granted under the 2006 Stock Option Plan of Rexnord |
Executive Compensation82
Compensation Discussion and AnalysisCOMPENSATION DISCUSSION AND ANALYSIS
Overview
This section discusses each of the material elements of compensation awarded to, earned by, or paid to each of our three executive officers during our fiscal year ended March 31, 2008.2011. Throughout this discussion, we refer to our executive officersthe individuals named in the Summary Compensation Table below as “Named Executive Officers.” The Named Executive Officers are identified in the Summary Compensation Table.
With the exception of the awardawards of equity-based compensation, the compensation committee of the board of directors of RBS Global, (the “Committee”), in consultation with the RBS Global board of directors, has historically been responsible for determining our executive compensation programs, including making compensation decisions during the fiscal year ended March 31, 2008.2011. Awards of equity-based compensation have beenare determined by the HoldingsRexnord Corporation Compensation Committee as these awards coverrelate to our equity securitiessecurities. Going forward, after the offering is completed, compensation decisions as to our executive officers will be made by the Rexnord Corporation Compensation Committee. As used in this Compensation Discussion and Analysis, the “Committee” refers to the compensation committee of RBS Global or Rexnord Corporation, whichever is appropriate from the Company.context, and the “Committees” refers to both compensation committees generally.
The Committee,Committees, in consultation with the boardboards of directors, of RBS Global, has historically overseenoversee our executive compensation agreements, plans and policies and hadhave the authority to approve all matters regarding executive compensation other than equity awards. The Committee soughtCommittees seek to ensure that the compensation and benefits provided to executives were reasonable, fair and competitive and aligned with the long- and short-term goals of our Company. Based upon these criteria, the CommitteeCommittees set the principles and strategies that guided the design of our executive compensation program.
FollowingWe compensate our executives through various forms of cash and non-cash compensation, although all equity compensation is paid with our stock. Our compensation program includes:
Cash compensation:
| – | base salaries, which are intended to attract and retain highly-qualified individuals (as base salary is frequently used as an initial metric for evaluating compensation) and provide a predictable stream of income for living expenses in an amount proportionate to the executive’s duties and responsibilities; |
| – | annual performance-based cash incentive awards, which are intended to award performance by tying additional cash compensation to specific Company and individual goals; and |
| – | discretionary bonuses, which can be used to recognize extraordinary performance or other unique contributions or circumstances that may not be quantifiable, although no discretionary bonuses were paid to Named Executive Officers in fiscal 2011; |
Long-term equity incentive awards, which are intended to further align the consummationfinancial interests of this offering, themanagement with those of our stockholders and incent executive compensation programs forofficers by providing economic rewards tied to increased value of the Company will be determinedover an extended period of time;
Retirement benefits, which are intended to reward long-term service to us and provide incentive to remain with us by the Holdings Compensation Committee, consistent with its dutiesbuilding benefits for eventual retirement; and responsibilities
Severance benefits and other post-employment commitments under the Holdings Compensation Committee Charter described above.a policy that applies to all domestic salaried employees, which are intended to provide some degree of certainty when employment ends under certain circumstances.
General Compensation Philosophy and Objectives of Executive Compensation Programs
The foundation of our executive compensation program is to reward our executives for achieving specific annual and long-term strategic goals of the Company and to align each executive’s interest with that of our shareholders.stockholders. We believe that rewarding executives for superior levels of achievement will result in significant long-term value creation for the Companyus and its shareholders.our stockholders. As a result, we believe that the compensation packages we
83
provide to executives, including the Named Executive Officers, must include both cash-based and equity-based elements that reward short and long-term performance. Prior to the completion of this offering, theThe Committee or its designated member, with input from the Chief Executive Officer evaluated(for executives other than himself), evaluates the performance of our executives other than the Chief Executive Officer and their compensation packages to ensure that we maintainedmaintain our ability to retain highly talented key employees and attract new talent, as needed, to successfully grow and lead the organization. Following the completion of this offering, we anticipate that the Holdings Compensation Committee will continue to evaluate the performance of our executives and their compensation packages in line with this philosophy.
We have created a “pay for performance” culture that places an emphasis on value creation and subjects a substantial portion of each executive’s compensation to risk depending on the performance of the Company. As such, we base our executive compensation program on the following philosophy:philosophies:
The compensation program should support the business by establishing an emphasis on critical short-term objectives and long-term strategy;strategy without encouraging unreasonable risk taking;
Each executive’s total compensation should correlate to theirhis or her relative contribution to the Company;Company and achievement of individual goals;
A significant portion of each executive’s total compensation should be based on the achievement of corporate and individual performance goals and objectives;objectives in a way that incents results without encouraging unreasonable risk taking; and
Executives should be rewarded for superior performance through annual cash-based incentives and, if appropriate, the grant of equity-based awards.
Our executive compensation program is designed to focus our executives on critical business goals that translate into long-term value creation. As a result, we believe that a substantial portion of our executives’ compensation should be variable and based on overall corporate financial performance. Another element of our executive compensation program is designed to reward annual improvement in personal objectives, withobjectives. For each fiscal year, individualized target performance areas are determined for each executive, officer.and a component of each executive’s compensation under our Management Incentive Compensation Plan, which is more fully described below, is dependent upon achievement of those objectives. We refer to these individualized target performance areas as annual improvement priorities (“AIPs”).
As described in more detail below, our compensation program is composed of elements that are generally paid on a short-term or current basis (such as base salaries and annual performance-based awards) and elements that are generally paid out on a longer-term basis (such as long-term equity incentives and retirement benefits). We believe this mix of short-term and long-term elements allows us to achieve our compensation objectives of attracting and retaining top executives, creating a pay-for-performance culture and emphasizing long-term value creation for the Companyus and its shareholders.our stockholders without encouraging unreasonable risk taking.
Setting Executive Compensation and the Role of Our Executive Officers in Compensation Decisions
Prior to the completion of this offering, the CommitteeThe Committees or itstheir designated membermembers annually reviewedreview and approvedapprove all compensation decisions related to our Named Executive Officers except for decisions relating to equity-based awards, which, as described above, have been made byOfficers. Near the Holdings Compensation Committee. Thebeginning of each fiscal year, the Chief Executive Officer establishedestablishes the AIPs for each executive officer other than himself andhimself; the Committee establishedCommittees or their designated members establish the AIPs for the Chief Executive Officer. PriorAt the end of the year, prior to making itsthe annual compensation determinations for each executive officer, (other than that of the Chief Executive Officer), one or more members of the Committee workedwork together with the Chief Executive Officer to review the performance of the Company and,(and, if applicable, the respective business group,group), the role of each executive in the various aspects of that performance and the executive’s level of achievement of his or her AIPs. Based on this review, the Chief Executive Officer mademakes recommendations to the Committee as to the compensation of all executivessenior management, including the Named Executive Officers other than himself. The Committee or its designated member considered these recommendations and used its discretion and judgment in accepting or modifyingconsiders these recommendations in making itsthe final determinations. Other than our Chief Executive Officer, none of the Named Executive Officers had any role in determining the fiscal 2011 compensation of other Named Executive Officers. Following the completion of this offering, we anticipate that the Chief Executive Officer will continue to have a role in setting the compensation for executive officersthe senior management of the Company other than himself.
84
The Committee has not retained a compensation consultant to review our executive compensation policies and procedures. We may from time to time obtain compensation studies to determinetry to evaluate the relative strengths and weaknesses of our compensation packages. In determining the level of compensation to be paid to executive officers, we generally do not generally factor in amounts realized from prior compensation paid to executive officers or conduct any formal survey of the compensation paid by other comparable public companies.companies; however, we may from time to time informally gather and review publicly-available data to get a general sense of other companies’ compensation packages. The Committee has historically believedbelieves that its compensation decisions should be based primarily on the performance of the Company and the individual executive officers. In making its compensation decisions, the Committee also consideredofficers, as well as each executive officer’s responsibility for the overall operations of the Company. Thus, the compensation levels for Mr. HittAdams are higher than they are for the other Named Executive Officers, reflecting his responsibility as Chief Executive Officer for the overall operations of the Company.
20082011 Executive Compensation Components and Determinations
We compensate our executives through a variety of forms of cash and non-cash compensation, although all non-equity compensation is paid at our subsidiary level. Our compensation program includes:
Cash compensation;
base salaries;
annual performance-based awards;
discretionary bonuses; and
special signing bonus;
Long-term equity incentive awards;
Retirement benefits; and
Severance benefits.
The principal components of our executive compensation program for the fiscal year ended March 31, 20082011 are discussed below.
Base Salary. The Committee has historically reviewedreviews base salaries annually and mademakes adjustments from time to time andtime; for example, in connection with promotions and other changes in responsibilities. TheIn determining base salaries, the Committee considers available market data (although it does not conduct any formal surveys or otherwise engage in benchmarking), the executive’s responsibilities, experience, skills, knowledgesustained level of performance in the job, performance in the prior year, contribution to overall business goals, publicly-available data gathered informally (solely to obtain a general understanding of certain compensation practices) and responsibilities required of the executives in their respective roles, the individual’s past performance and expected future contributions to the Company, as well as the Chief Executive Officer’s recommendations (with respect to executive officers other than himself). Based on the Committee’s subjective review of these factors, the Committee determines each Named Executive Officer’s base salary. The Committee does not use any predetermined formula or specific weightings as to any given factor to determine base salaries nor does it engage in any benchmarking in making base salary or other compensation determinations.
Based on this review, the Committee determined that the appropriatebase salaries for the Named Executive Officers as indicated in the following table; the table also contains information showing the percentage change in base salary for each of the Named Executive Officers between fiscal 2011 and fiscal 2010.
Name | 2011 Base Salary ($) | Increase (Decrease) in Base Salary Compared to 2010 (%) | ||||
Todd A. Adams | $ | 650,000 | 30% | |||
Michael H. Shapiro | 300,000 | 0% | ||||
George C. Moore | 350,000 | (19%) | ||||
Praveen R. Jeyarajah* | 400,000 | N/A | ||||
| * | Mr. Jeyarajah was not employed by us in fiscal 2010. |
In September 2010, upon the one-year anniversary of his appointment as Chief Executive Officer, for fiscal 2008 was the amount reported for such officerCommittee approved an increase in the “Salary” column of the “Summary Compensation Table” below. During fiscal 2008, Mr. Moore was awarded a salary increase of 5% ofAdams’ base salary effectivefrom $500,000 to $650,000 to reflect the Committee’s satisfaction with his performance as Chief Executive Officer over the prior year, as well as his anticipated duties and contributions going forward. The Committee expects that Mr. Adams will continue to be considered for compensation increases in June, 2007 based onSeptember each year as it coincides with his appointment as Chief Executive Officer; however, the factors cited above. None ofCommittee determines annual base salary increases, if any, for the other Named Executive Officers received an increase in theirnear the beginning of each fiscal year. Mr. Shapiro’s base salary duringwas negotiated in connection with his joining the Company as Vice President and Chief Financial Officer in February 2010 and set at $300,000, which the board believed was necessary to incent Mr. Shapiro to join the Company and was commensurate with his anticipated responsibilities. Due to Mr. Shapiro’s recent start date, the Committee determined not to grant a salary increase for him for fiscal 2008. Our existing2011. Mr. Moore’s salary was decreased from
85
$432,000 in fiscal 2010 to $350,000 in fiscal 2011 to reflect his transition away from responsibilities as Chief Financial Officer and to be consistent with the intent of his initial employment agreements with our Named Executive Officers do not provide for mandatory minimum annual salary increases above theterms, which provided that his base salary amountswas to be adjusted downward after the first year of employment based on the transitioning of his then role and responsibilities as Chief Financial Officer. Prior to fiscal 2011, the Company had agreed to delay the reduction of Mr. Moore’s base salary due to his continuing involvement in various roles with the Company, including his involvement as interim Chief Financial Officer. Mr. Jeyarajah’s base salary for fiscal 2011 was negotiated upon his appointment as Executive Vice President—Corporate & Business Development in April 2010 and was set forth inat $400,000, which the employment agreements.board believed was necessary to incent Mr. Jeyarajah to accept his new position and was commensurate with his anticipated responsibilities.
Annual Performance Based Awards.We believe that a substantial portion of our executive officers’ compensation should be variable, and based on overall corporate financial performance, with theand provide an opportunity to earn substantialadditional awards in connection with superior business and individual performance.
Cash incentives for our executive officers are principally awarded through our Management Incentive Compensation Plan (“MIP”(the “MICP”). The MIPMICP is designed to provide our key officers, including our Named Executive Officers, with appropriate incentives to achieve and exceed key annual business objectives by providing performance-based cash compensation in addition to their annual base salary. Under the terms of the MIP,MICP, participants are eligible to earn cash bonusesincentives based upon the achievement by the Company of the corporate financial targets that have historically been established by the Committee and each executive’s individual performance and achievement of AIPs; all amounts awarded under the MICP are also subject to the overall review, approval and potential adjustment by the achievementCommittee.
Near the beginning of each executive’s AIPs. Eachfiscal year, the board of directors, based on input from the Chief Executive Officer and Chief Financial Officer, approves the corporate financial performance targets for the Company and the Committee uses those to set the financial targets under the MICP; the Committee or its designee sets the AIPs for our Chief Executive Officer; and our Chief Executive Officer establishes the AIPs for all of the other senior management, including the Named Executive Officers, participating in the MICP. In setting the financial targets, the Company considers its strategic plan and determines what achievement will be required on an annual basis to drive to its multi-year performance commitment.
Under the MICP, each participant’s target bonusincentive amount is based upon a specified percentage of the participant’s annual base salary. EachFor fiscal 2011, the target incentive amounts for Messrs. Adams, Shapiro, Moore and Jeyarajah were 100%, 50%, 50% and 50% of base salary, respectively. The level for each executive was set so as to incentivize executives to achieve superior corporate and individual results by providing meaningful compensation upon the achievement of established goals. The target incentive level for Mr. Adams was higher than the other executives because of his greater degree of responsibility, as Chief Executive Officer, for the overall operations of the Company.
Under the terms of the MICP, each participant is initially entitled to his target bonusincentive amount if 100% of the specified performance targets (“Base Targets”) are achieved. For the Named Executive Officers to be eligible for a minimum incentive under the corporate financial performance metrics, which are subject to adjustment by the Committee in extraordinary circumstances, the Company must reach a specified cliff set near the beginning of each fiscal year, which, for fiscal 2011, was at least 90% of either of the respective metrics (which are described in more detail below) with an accelerated payout schedule for attainment as summarized in the below table:
Achievement | 90% of Base Targets | 100% of Base Targets | 105% of Base Targets | 110% of Base Targets | 115% of Base Targets | 120% of Base Targets | 125% of Base Targets | 130% or > of Base Targets | ||||||||||||||||||||||
Financial Factor Payout | 50 | % | 100 | % | 112.5 | % | 125 | % | 150 | % | 175 | % | 200 | % | 225% and >* | |||||||||||||||
| * | For each additional 5% increase in the percent of Target Bonus Plan Achievement above 115%, the financial factor payout will increase 25%. |
86
The MICP does not set a limit on the maximum incentive opportunity payable with respect to the corporate financial performance portion of the incentive formula because the Committee believes that the incentive compensation for the fiscal year should increase incrementally as the level of achievement increases, and the Company does not want to disincent executives from striving for superior results. However, the Committee has discretion to increase or decrease the amount actually paid out under the MICP if necessary to account for certain corporate events or other factors that may have disproportionately affected the formulaic results. In addition, there is no minimum incentive payable under the MICP even if 90% or more of the corporate financial performance metrics are achieved because the incentive payment is subject to the individual’s AIP multiplier described below.(also referred to as personal performance multiplier), which could be 0%.
After the corporate financial results have been calculated under the MICP, each individual’s personal performance and AIPs are evaluated and the individual’s personal performance multiplier is applied to determine the amount of the incentive earned. The target bonus amountpersonal performance multiplier ranges from 0% to 150%. The Committee believes it is important for Messrs. Hitt, Marinithe MICP to align each Named Executive Officer’s compensation with his individual performance and Moorethe overall performance of the Company. Under the MICP, the personal performance objectives are 75%, 100%intended to reinforce cross-functional, business teamwork, should generally tie to strategy deployment objectives and 50%should be aggressive, measureable and critical to success of salary, respectively.the Company’s business.
As noted above, Base Targets under the MIPMICP are comprised of corporate financial performance metrics, which are similar for each Named Executive Officer, and individual AIPs. TheIn fiscal 2011, the financial performance metrics for Messrs. HittAdams, Shapiro, Moore and Moore areJeyarajah were the same and arewere based on the Company consolidated financial performance metrics. The financialIn prior years, the Company had used EBITDA and Debt Reduction as the performance metrics under the MICP; however, for Mr. Marini are based on the Water Management financial performance metrics. For fiscal 2008,2011, the financial performance metrics for the Company consolidated businessCompany were based upon EBITDA and debt reduction, and for the Water Management business they were based on EBITDA and DivisionalDe-levered Free Cash Flow, (defined below). These metrics are substantially the same as those that are established for the bonus system of our other management personnel and salaried employees and reflect the Committee’s belief thateach 50% weighted. The Committee chose these measures because it believes they correlate to the Company’s and its stockholders’ strategic goals. Specifically, the Company uses EBITDA as a measure under the MICP because it believes EBITDA is an important supplemental measure of performance and is frequently used by analysts, investors and other interested parties in the evaluation of companies in our industry; further, the Company believes EBITDA is important because it is often compared by analysts and investors in evaluating the performance of issuers of “high yield” securities because it is a common measure of the ability to meet debt service obligations. The Committee has historically setBoard of Directors recommended and approved the change from Debt Reduction to De-levered Free Cash Flow as a metric for fiscal 2011 because it believes that De-levered Cash Flow is now more representative of the financial performance metrics and has been responsible for setting the AIPs for our Chief Executive Officer and our Chief Executive Officer has historically set the AIPs for each of the other executive officers, includingCompany, as it more closely represents the ability to generate cash and, therefore, potentially improve profits, and because it eliminates the impact of cash interest, over which management has relatively little control. It also provides increased transparency around operating cash flow generation and, therefore, better aligns the Named Executive Officers, participating in the plan. The Committee also has historically considered our strategic plan
and determined what achievement will be required on an annual basis in order to drive to our multi-year performance commitment. The Committee’s intention in setting the Base Targets for fiscal 2008 was to provide strongOfficers’ incentive for the executives to perform atcompensation with a high level and create a certain level of value for our shareholders in order for any annual incentives to be earned, thereby requiring an exceptional level of performance to attain or exceed the target level.measure over which they have more control.
We define EBITDA as net income plus interest, income taxes, depreciation and amortization, plus adjustments for restructuring, stock based compensation expense, other (income) expense, LIFO (income) expense, un-budgeted acquisitions, and other nonrecurringnon-recurring items, translated at constant currency as used for internal management reporting. For fiscal 2008 our Company Consolidated EBITDA target was $343.2 million, and the Water Management’s EBITDA target was $106.7 million. The Company Consolidated EBITDA finished the year at $359.0 or 105% to plan which generated a 112.5% payout of target. The Water Management EBITDA finished the year at $106.7 or 100% to plan generating a 100% payout. Debt Reduction is defined as the change in the Company’s total debt balance in a fiscal year. For fiscal 2008 our Company Consolidated Debt Reduction target was $66.1 million. The Committee concluded that the Company consolidated debt reduction for fiscal 2008 was $140.0 million or 212% of plan, generating a 635% payout of target.We define De-levered Free Cash Flow, for purposes of the MICP, as cash flow from operations less capital expenditures, as adjusted for cash interest on the Company’s outstanding debt obligations (to simulate a debt-free capital structure), un-budgeted acquisitions, and other non-recurring items as used for internal management reporting. The De-levered Free Cash Flow metric is used solely for associates, whose MICP performance is tied to the Company’s consolidated financial performance, including all of our Named Executive Officers. For all other associates eligible to participate in our MICP, their cash flow metric is tied to Divisional Free Cash Flow, defined as EBITDA plus or minus changes in trade working capital (accounts receivable, inventory and accounts payable) less capital expenditures. expenditures as used for internal management reporting. While these metrics may be measured at various levels within the organization, the mechanics of the calculations are substantially the same for other management personnel and salaried employees eligible to participate in MICP.
87
The Water Management DivisionalCommittee’s intention in setting the Base Targets under the MICP for fiscal 2011 was to provide strong incentive for the executives to perform at a high level and create value for our stockholders in order for any annual incentives to be earned, thereby requiring an exceptional level of performance to attain or exceed the target level, without setting so high of targets that they would not be attainable or that it would encourage excessive risk-taking to achieve them. For fiscal 2011, the Company consolidated EBITDA target under the MICP was $305.2 million. Actual Company consolidated EBITDA for fiscal 2011 was $336.9 million or 110% the target, which would generate a payout amount of 125% of the target. For fiscal 2011, the De-levered Free Cash Flow target for fiscal 2008 was $111.0$259.0 million. The Committee also concluded that the Water Management DivisionalActual De-levered Free Cash Flow finished the year at $129.0for fiscal 2011 was $270.5 million or 117% to plan, generating104% of the target, which would generate a 160% payout amount of 110% of the target. The RBS Global boardTogether, under the formula, the corporate financial performance factors of directors has historically madethe MICP would have generated a payout amount of 118% of the target. After each fiscal year, the Committee makes a determination as to whether the respective EBITDA and Debt Reduction/De-levered Free Cash Flow targets were met, and determineddetermines the extent, if any, to which the target incentives should be paid.paid based on these results and other factors. Under the MIP,MICP, if any acquisition or disposition of any business by the Company, merger, consolidation, split-up, spin-off, or any unusual or nonrecurring transactions or events affecting the Company, or the financial statements of the Company, or change in applicable laws, regulations, or accounting principles occurs such that an adjustment is determined by the Committee to be appropriate, then the Committee will, in good faith and in such manner as it may deem equitable, adjust the financial targets of the MIP.MICP or modify the payouts thereunder. With respect to fiscal 2011 performance, the Committee determined that no adjustments were necessary and, therefore, approved a payout of 118% with respect to the corporate performance target for the fiscal 2011 MICP.
Aggregate bonusesAs mentioned above, aggregate incentives under the MIPMICP are weighted to include both corporate financial performance metrics as well as the AIPs . For fiscal 2008, we implemented a program modification for the MIP. The plan was changed from having 80% weight on EBITDA and Debt Reduction (each 50% weighted) and 20% weight on AIPs to a plan of 100% weight on EBITDA and Debt Reduction (each 50% weighted) and a personal performance, multiplierthus the results under the corporate financial metrics are subject to increase or decrease based on the individual’s AIPs. Once the financial results have been calculated, each individual’s personal performance is calculated and the individual’s personal performance multiplier is determined and applied against the individual’s target bonus amount. The personal performance multiplier ranges from 0% to 150%. This program modification was implemented to align each Named Executive Officer’s individual performance for achieving their AIPs with their compensation and the overall performance of the Company. For plan participants to be eligible for a minimum bonus under the financial performance metrics, subject to adjustment in extraordinary circumstances, the Company must reach at least 90% of the respective metrics. However, there is no minimum bonus payable under the plan even if 90% or more of the financial performance metrics are achieved because the bonus payment is subject to the personal performance multiplier which could be 0%. The MIP also does not set a limitand achievement of AIPs. For fiscal 2011, Mr. Adams’ AIPs focused on overall growth of the Company and expansion of its products; Mr. Shapiro’s AIPs focused on the maximum bonus opportunity payable with respect to the financial performance-based portionstrength and systems of the bonus formula. Instead, the plan provides that the percentageCompany; Mr. Moore’s AIPs reflected his various interim responsibilities and special duties; and Mr. Jeyarajah’s AIPs focused on establishing processes and identifying opportunities for potential acquisitions.
After completion of the participant’s base bonus used to determine the participant’s financial performance based portion of the bonus for the fiscal year, will increase incrementally as the Committee or its designee reviewed the Chief Executive Officer’s level of personal performance and the achievement increases.
The RBS Global board of directorsAIPs. Additionally, the Committee or its designee, along with input from the Chief Executive Officer, reviewed Messrs. Hitt, Moore and Marini’sthe remaining Named Executive Officers’ level of personal performance and the achievement of their respective AIPs and, as a result, establisheddetermined a personal performance multiplier for Messrs. Hitt, MooreMr. Adams of 1.30, and Marini of 113%, 125%for other Named Executive Officers ranging between 1.13 and 100%, respectively. 1.00, for fiscal 2011.
Utilizing the corporate financial targets and the personal performance multiplier results, the bonusincentive payments under the MICP for Messrs. Hitt,Adams, Shapiro, Moore and MariniJeyarajah for fiscal 20082011 were $1,813,271, $981,094$1,000,000, $185,900, $206,500 and $650,000,$266,700, respectively. The RBS Global board of directors believes the above targeted financial results and individual achievements are appropriately aligned with the bonus awards approved under the MIP.
Discretionary Bonuses.In addition to annual incentive awards under the MIP,MICP, the Committee has historically had the authority and discretion to award additional performance-based compensation to our executives if the Committee determined that a particular executive has greatly exceeded thehis objectives and/orand goals established for such executive or made a unique contribution to the Company during the year. The Committee did not award anyyear, or other circumstances warrant. There were no discretionary bonus awards forbonuses paid to our Named Executive Officers during fiscal 2008.2011.
Special Signing Bonus. The Company established the Special Signing Bonus Plan (the “Signing Bonus Plan”) effective July 21, 2006 to provide for the award of a cash bonus to certain employees, directors, consultants and other service providers of the Company and its subsidiaries to motivate those individuals to continue to provide services to the Company following the date of its adoption (which was the date of the July 2006 Apollo acquisition). Mr. Hitt is the only Named Executive Officer who is a participant in the Signing Bonus Plan. Bonuses are payable to participants upon the earliest to occur of: (i) a change in control of the Company, (ii) the separation from service of the participant or (iii) a date specified for each participant (which is within 30 days after November 25, 2012 in the case of Mr. Hitt).
Long TermLong-Term Equity Incentive Awards. The Holdings Compensation Committee may, from time to time, approve the grantcurrently does not make annual or regularly-recurring grants of equity awards to our Named Executive Officers andor other officers, employees, directors and consultants. The Committee believes this is particularly appropriate since the Company does not yet have publicly-traded equity securities. However, the Committee may and the Holdings Compensationdoes, from time to time, approve such grants based on various facts and circumstances, including but not limited to new hires, changes in roles or
88
responsibilities, individual performance, specific achievements and other associate retention considerations. The Committee believebelieves that equity-based awards play an important role in creating incentives for our executives to maximize Company performance and align the interests of our executives with those of our shareholders.stockholders. These equity awards are generally subject to time-based and performance-based vesting requirements. Time-based awards function as a retention incentive, while performance-based awards encourage executives to maximize Company performance and create value for our shareholders.stockholders without encouraging unreasonable risk taking. Equity awards are generally provided through grants of stock options to purchase shares of our common stock under theRexnord Corporation’s 2006 Stock Option Plan.Plan, as amended (the “Option Plan”).
Among other things, the Holdings Compensation Committee decides which of our executives, employees, directors or consultants will receive awards under the Option Plan, as well as the exercise price, vesting terms and such other terms or conditions for the grants as the Holdings Compensation Committee may determine, in its sole discretion, provided such terms are consistent with the provisions of the Option Plan. Other than a grant of options to Mr. Adams in October 2010, the Committee did not grant stock options to the other Named Executive Officers in fiscal 2011 because of the reasons mentioned above. In October 2010, the Committee granted options to purchase 40,000 shares of common stock to Mr. Adams because it believed such a grant was appropriate to recognize Mr. Adams’ achievements in his first year as Chief Executive Officer and to increase his potential stake in the Company. For information regarding stock options granted to directors, see “Director Compensation” below.
With respect to the options granted to or held by our Named Executive Officers, except for certain options previously granted to Mr. Jeyarajah for his service on the board of directors, 50% of the options granted to each officer under the Option Plan vest on a pro-rata basis over five years, subject to continued employment. Theemployment; the other 50% vest annually over five years subject to the Company meeting pre-established annual and cumulative corporate financial performance metrics. We use this methodology to add a performance component to the options so that they reward achievement in addition to longevity with the Company. With respect to options granted to Mr. Jeyarajah in October 2009, 70% of those options vest on a pro-rata basis over three years, subject to continued service with the Company, and the other 30% vest annually over three years, subject to the Company meeting pre-established annual and cumulative corporate financial performance metrics. The board of directors chose EBITDA and Debt Repayment targets.Reduction as the targets under the Option Plan, including the options granted in fiscal 2011 to Mr. Adams, because the Committee believes that these measures continue to correlate to the Company’s and its stockholders’ strategic goals and provide consistency with respect to metrics among all option holders. As is the case under the MIP,MICP, the Holdings Compensation Committee’sCompany’s intention in setting the performance vesting targets for the options wasis that the Company would havehas to perform at a high level and create a certain level of value for its shareholdersstockholders for any portion of the performance-based options to vest.
In July 2010, the board decided that, as a result of the recent recession and its negative impact on the Company’s financial performance for reasons outside of the option holders’ control, it was appropriate to reset the existing EBITDA and Debt Reduction forecasts, with respect to the Option Plan, for fiscal years 2011 through 2014. At the July meeting, the board also determined that, with respect to the performance-based awards that were scheduled to vest based on fiscal 2010 performance, the annual and cumulative Debt Reduction targets were fully achieved and therefore that portion of the options was fully vested and that the annual and cumulative EBITDA targets were partially achieved and therefore that portion of the options was partially vested. However, recognizing the Company’s relatively strong performance throughout the recent recession and management’s collective efforts to position the Company for strong future growth, the board determined to allow the remaining portion of the unvested options tied to fiscal 2010 performance to vest automatically if the Company achieved the fiscal 2011 performance targets as set forth below.
The fiscal 20082011 performance targets for EBITDA and Debt Reduction for purposes of the Option Plan were $343.2set in July 2010 at $315.0 million and $66.1$110.0 million, respectively. As is customary in incentive plans such as the Option Plan, the performance targets established for awards are subject to adjustment to prevent dilution or enlargement of the economic benefits intended to be made available under the awards, as a result of certain corporate events, including acquisitions or divestitures. The board or the Committee typically meets after the end
In April 2007,
89
of the Holdings Compensation Committee granted stock optionsfiscal year to Messrs. Hitt and Moore to provide them with additional compensation to reflect their increased responsibilitiesdetermine whether the performance targets for the oversightprevious year were met and determine the vesting, if any, of outstanding options. Actual EBITDA was $336.9 million and actual Debt Reduction was $126.9 million, respectively, for fiscal 2011. Based on the Company’s reported results the Committee determined that all of the new Water Management Platformperformance-based options subject to fiscal 2011 performance have vested, and, as a result, the remaining portion of the Zurn acquisition. In addition, in April 2007,performance-based options that had previously been unvested based on the Company granted options to Mr. Marini in connection with his entering into an employment agreement with Rexnord LLC in connection with the Zurn acquisition. The Company believes that the size of the option awards to Messrs. Hitt, Moore and Marini were appropriate and reasonable in each of the forgoing circumstances. The corresponding number of stock options granted to our Named Executive Officers and the material terms of these options as of the end of our 2008 fiscal year are described below under “Narrative to Grants of Plan Based Awards.”2010 EBITDA target automatically vested.
We do not have any formal program, plan or practice in place for selecting grant dates for awards under the Option Plan in coordination with the release of material non-public information. However, noNo options granted, including those granted in fiscal 2011, were
based on material non-public information in determining the number of options awarded or the exercise price thereof, and we did not “time” the release of any material non-public information to affect the value of those awards. The Company does not have any stock ownership requirements or guidelines for its Named Executive Officers.
Retirement Benefits.Each of our continuing Named Executive Officers participates in qualified defined-benefit and/or defined-contributiondefined contribution retirement plans maintained by the Company on substantially the same terms as our other participating employees.
The None of the Named Executive Officers participated in a defined benefit retirement plan in 2011. In 2011, the Company provides supplemental retirement to eligible executives through theterminated its former Rexnord Supplemental Executive Retirement Plan, (“SERP”) effective on January 1, 2004 to provide participants with deferred compensation opportunities. Mr. Hitt is the only participant in the SERP. Under the plan, during the term of each participant’s active employment withwhich certain former executive officers participated, as the Company each participant’s account is credited annually as of each December 31 withdetermined it was no longer necessary or appropriate to maintain such a percentage of his compensation and account balances are credited at an annual interest rate of 6.75%. Account balances become payable upon a termination of employment or in the event of death.
Under the terms of Mr. Marini’s employment agreement, Mr. Marini is entitled to receive a monthly supplemental retirement benefit commencing upon his retirement, so long as his employment is not terminated for “cause” (as defined in the employment agreement). The amountplan; none of the monthly supplemental retirement benefit is determined as of Mr. Marini’s retirement date and is an amount necessary to provide Mr. Marini with a monthly 60% joint and survivor annuity during Mr. Marini’s life after his retirement equal to the positive difference, if any, between $20,000 less his “existing retirement benefit” (as definedcurrent executive officers has ever participated in the employment agreement). If Mr. Marini voluntarily terminates his employment for any reason other than a termination for “good reason” (as defined in the employment agreement), death or “disability” (as defined in the employment agreement), he must give six months notice of his termination in order to receive the supplemental retirement benefit. If he does not give the six months notice, Mr. Marini will be required to pay to the Company an amount equal to his then current base salary. The Company believes that the benefits provided to Mr. Marini recognize his substantial past and expected future contributions to the Company (including his prior service with Zurn).plan.
Severance Benefits. The employment agreements for Messrs. Hitt and Marini provide that, among other things, the executive would be entitled to certainNamed Executive Officers do not have individual severance benefitsor change in the event of a termination of employment during the term of the respective agreement if such termination is: (i) initiated by us without “cause” or (ii) initiated by the respective officer for “good reason” (each as defined in the respective agreements). We believe that it is appropriate to provide these executives with severance benefits under these circumstances in light of their positions with the Company and as part of their overall compensation package. We believe that a termination by the executive for good reason (or constructive termination) is conceptually the same as an actual termination by the Company without cause; therefore, we believe it is appropriate to provide severance benefits following such a constructive termination of the executive’s employment.
Mr. Moore iscontrol agreements; rather, they are covered under a corporate severance policy that applies to our employees whose employment is involuntarily terminated under various conditions described in the plan document. Severance benefits under the policy generally include cash payments equal to weekly base salary for up to 52 weeks depending on the level of position and years of seniority and up to six months of COBRA subsidy for medical, dental and/or vision insurance, although specific amounts payable upon a termination of employment could and do vary depending on individual circumstances.
The Company generally does not enter into severance or change in control agreements or other special arrangements with executive officers or employees because the Company believes the severance policy is intendedprovides adequate support following a covered termination and that all employees should receive the similar benefits (relative to cover employees who are not entitled totheir position) without special treatment; however, the Committee regularly reconsiders whether such agreements should be adopted, and may adjust in individual circumstances, in view of then-current circumstances. In addition, outstanding options granted under the Option Plan may become fully vested immediately if Rexnord Corporation experiences certain liquidity events, such as being acquired, as set forth in the Option Plan. We maintain the corporate severance benefits under an employment agreement. Wepolicy because we believe that it is appropriate to provide severance benefits to employees whose employment terminates in thesevarious circumstances and believe that doing so helps us to attract and retain highly qualified employees.
Additional information concerning potential payments that may be made to the Named Executive Officers in connection with their termination of employment or a change in control of the Company is presented in “Potential Payments Upon Termination or Change in Control” below.
Perquisites and Other Personal Benefits. The Company and its subsidiaries providesprovide the Named Executive Officers with perquisites and other personal benefits, thatsuch as reimbursement of travel and remote office expenses, automobile-related benefits, club dues and moving and relocation expenses, all of which the Company believes are reasonable, competitive and consistent with theits overall compensation program. In that connection,regard, the Committee has periodically reviewed the perquisites and other benefits provided to the Named Executive Officers and we anticipate the Holdings
Compensation Committee will do the same.Officers. In particular, Messrs. Hittduring fiscal 2011, Mr. Adams received estate planning assistance and club dues; Mr. Shapiro received relocation expenses; Mr. Moore receive travelreceived reimbursement of commuting expenses and club dues; and Mr. Jeyarajah received reimbursement of office expenses for an office located in connection with travel toWashington D.C. and from their respective principal residences, which are located out-of-state, and housing reimbursement in Milwaukee, Wisconsin.club dues. In addition, the Named Executive Officers, other than Mr. Moore hasJeyarajah, either receive an automobile allowance and Messrs. Hitt and Marinior participate in an automobile leasing program.
Compensation Committee Actions Taken After Fiscal 2008Employment Agreements. The Company generally does not enter into employment agreements with its domestic employees, including with its executive officers, because the Company believes that management and executives should be treated similarly to other employees and should be subject to at-will employment. Instead,
90
the Company enters into employment offer letters to set forth the terms and conditions of employment. The Committee appointed Todd AdamsCompany has, from time to serve as the Company’s Chief Financial Officer and Senior Vice President effective April 1, 2008. Intime, entered into employment agreements with certain individuals, for example, in connection with his appointmentacquisitions or significant transactions in order to this position,retain key individuals; the Committee also regularly considers whether employment agreements should be adopted, and may adjust in individual circumstances, in view of then-current circumstances. The Company and Mr. Adamshas not entered into a letteran employment agreement on April 2, 2008 that provided him with a new compensation package to reflect his increased responsibilities. The material terms of Mr. Adams’ letter agreement are described in a Form 8-K filed by RBS Global, Inc. and Rexnord LLC with the SEC on April 2, 2008. The letter agreement provides that Mr. Adams’ base salary shall be $280,000 annually and Mr. Adams will have a target annual incentive bonus opportunity equal to 50% of his base salary, will participate in an automobile leasing program and provides for the award of stock options under the Option Plan.
Compensation Committee Report on Executive Compensation(1)
The Committee is currently composedany of the five non-employee directors named at the end of this report. The Committee has reviewed and discussed with management the disclosures contained in the above Compensation Discussion and Analysis. Based upon this review and discussion, the Committee recommended to the Company’s board of directors that the Compensation Discussion and Analysis section be included in this prospectus.
Steven Martinez (Chair)
George M. Sherman
Laurence M. Berg
Praveen R. Jeyarajah
Damian GiangiacomoNamed Executive Officers.
Compensation Committee Interlocks and Insider Participation
The members of the Committee in fiscal 2011 were Messrs. Martinez (Chair), Sherman, Berg and Giangiacomo. Messrs. Berg, Giangiacomo and Martinez, whose names appear on the Compensation Committee Report above, became Compensation Committee members immediately following the Apollo acquisition in July 2006. Each of these directors are partnersis a partner of Apollo Management, L.P., theour controlling stockholder of Holdings.stockholder. In fiscal 2008,2011, we paid anincurred $3.0 million of annual consulting fee, currently set at $3.0 million per year,fees payable to Apollo or one of its affiliates.affiliates, pursuant to the management consulting agreement with Apollo. During fiscal 2011, the Company, Mr. Sherman and two entities controlled by Mr. Sherman, Cypress Group, LLC and Cypress Industrial Holdings, LLC were parties to a consulting agreement. Mr. Sherman was employed by the Cypress entities during fiscal 2011. In fiscal 2008,2011, the Company also reimbursed approximately $71,000$26,713 in out-of-pocket expenses to Mr. George Sherman whose name also appearsSherman. Mr. Jeyarajah served on the above Compensation Committee Report. Mr. Jeyarajah, whose name also appearsuntil he became an executive officer of the Company in April 2010; in connection with his appointment as an executive officer, he ceased serving on the above Compensation Committee Report, is aand ceased serving as Managing Director of Cypress. Out-of-pocket expenses of approximately $38,000 were reimbursed to Mr. Jeyarajah in fiscal 2008.the Cypress Group. None of our executive officers served as a director or a member of a compensation committee (or other committee serving an equivalent function) of any other entity during the fiscal year ended March 31, 2008.2011.
91
Executive Compensation Information
|
|
Summary Compensation Table
The following table presents information about the compensation of our “Named Executive Officers,” as such term is defined in SEC rules. For fiscal 2011, our Named Executive Officers include our Chief Executive Officer, our Chief Financial Officer and our two other executive officer, whom we refer to as our Named Executive Officers, for the fiscal years ended March 31, 2008 and 2007.officers.
Name and Principal Position | Year | Salary ($) | Bonus ($) | Stock Awards ($) | Option Awards ($) (1) | Non-Equity Incentive Plan Compensation ($) (2) | Change in Pension Value and Nonqualified Deferred Compensation Earnings ($) (3) | All Other Compensation ($) (4) | Total ($) | |||||||||||||||
| (a) | (b) | (c) | (d) | (e) | (f) | (g) | (h) | (i) | (j) | |||||||||||||||
Robert A. Hitt, | 2008 | $ | 575,000 | — | — | $ | 1,211,807 | $ | 1,813,271 | $ | 7,624 | $ | 183,668 | $ | 3,791,370 | |||||||||
President and Chief Executive Officer | 2007 | $ | 558,942 | — | — | $ | 807,844 | $ | 507,797 | $ | 3,510 | $ | 1,025,811 | $ | 2,903,904 | |||||||||
George C. Moore, | 2008 | $ | 411,537 | — | — | $ | 247,219 | $ | 981,094 | — | $ | 105,719 | $ | 1,745,569 | ||||||||||
Executive Vice President and Chief Financial Officer | 2007 | $ | 215,384 | — | — | $ | 101,529 | $ | 151,667 | — | $ | 32,862 | $ | 501,442 | ||||||||||
Alex P. Marini, | 2008 | $ | 500,000 | — | — | $ | 375,076 | $ | 650,000 | — | $ | 17,798 | $ | 1,550,374 | ||||||||||
President, Water Management Group | 2007 | $ | 75,000 | — | — | — | $ | 212,414 | $ | 1,309,766 | $ | 6,621 | $ | 1,603,801 | ||||||||||
Name and Principal Position | Year | Salary ($)(1) | Bonus ($) | Stock Awards ($) | Option Awards* ($)(2) | Non-Equity Incentive Plan Compensation ($)(3) | Change in Pension Value and Nonqualified Deferred Compensation Earnings | All Other Compensation ($)(4) | Total ($) | |||||||||||||||||||||||||||
| (a) | (b) | (c) | (d) | (e) | (f) | (g) | (h) | (i) | (j) | |||||||||||||||||||||||||||
Todd A. Adams* | 2011 | $ | 577,885 | $ | — | $ | — | $ | 602,713 | $ | 1,000,000 | $ | — | $ | 30,480 | $ | 2,211,078 | |||||||||||||||||||
President and Chief Executive Officer | 2010 | $ | 419,827 | $ | — | $ | — | $ | 1,480,560 | $ | 625,000 | $ | — | $ | 11,811 | $ | 2,537,198 | |||||||||||||||||||
| 2009 | $ | 278,031 | $ | 58,250 | $ | — | $ | 345,876 | $ | 141,750 | $ | — | $ | 17,888 | $ | 841,795 | ||||||||||||||||||||
Michael H. Shapiro* | 2011 | $ | 300,000 | $ | — | $ | — | $ | — | $ | 185,900 | $ | — | $ | 159,896 | $ | 645,796 | |||||||||||||||||||
Vice President and Chief Financial Officer | 2010 | $ | 28,846 | $ | — | $ | — | $ | 444,126 | $ | 12,000 | $ | — | $ | 1,366 | $ | 486,338 | |||||||||||||||||||
George C. Moore* | 2011 | $ | 365,885 | $ | — | $ | — | $ | — | $ | 206,500 | $ | — | $ | 77,184 | $ | 649,569 | |||||||||||||||||||
Executive Vice President | 2010 | $ | 432,600 | $ | — | $ | — | $ | — | $ | 248,700 | $ | — | $ | 68,350 | $ | 749,650 | |||||||||||||||||||
| 2009 | $ | 430,177 | $ | — | $ | — | $ | — | $ | 146,000 | $ | — | $ | 98,274 | $ | 674,451 | ||||||||||||||||||||
Praveen R. Jeyarajah** | 2011 | $ | 369,231 | $ | — | $ | — | $ | — | $ | 266,700 | $ | — | $ | 28,240 | $ | 664,171 | |||||||||||||||||||
Executive Vice President—Corporate & Business Development | ||||||||||||||||||||||||||||||||||||
| * | Mr. Adams served as Chief Financial Officer from April 1, 2008 until his appointment as President and Chief Executive Officer on September 11, 2009. From September 11, 2009 until February 15, 2010, Mr. Moore served as Acting Chief Financial Officer. Mr. Shapiro began serving as Vice President and Chief Financial Officer on February 15, 2010 and the information related to him in the table reflects his compensation since that date. |
| ** | Mr. Jeyarajah began serving as Executive Vice President—Corporate & Business Development on April 19, 2010 and the information related to him in the table reflects his compensation since that date. |
| (1) | Salary reflects amounts actually paid during the fiscal year. |
| (2) | The amounts in column (f) reflect the |
| The amounts in column (g) |
| The amounts in column |
Name and Principal Position | Year | 401(k) Matching Contribution ($) | 401(k) Personal Retirement Account (“PRA”) ($) | Automobile Allowance and Related Expenses ($) | Estate Planning ($) | Club Dues ($) | Moving/ Relocation Expenses ($) | Commuting/ Remote Location Expenses ($) | Total ($) | |||||||||||||||||||||||||||
Todd A. Adams | 2011 | $ | 8,769 | $ | 2,933 | $ | 2,278 | $ | 1,850 | $ | 14,650 | $ | — | $ | — | $ | 30,480 | |||||||||||||||||||
Michael H. Shapiro | 2011 | 4,793 | 1,500 | 14,208 | — | — | 139,395 | (a) | — | 159,896 | ||||||||||||||||||||||||||
George C. Moore | 2011 | 7,487 | 1,750 | 14,208 | — | 395 | — | 53,344 | (b) | 77,184 | ||||||||||||||||||||||||||
Praveen R. Jeyarajah | 2011 | 4,615 | 2,000 | — | — | 395 | — | 21,230 | (b) | 28,240 | ||||||||||||||||||||||||||
92
| (b) | In the case of |
Narrative to Summary Compensation of Named Executive OfficersTable
The “Summary Compensation Table” above quantifies the value of the different forms of compensation earned by or awarded to our Named Executive Officers in fiscal 20082011, 2010 and fiscal 2007.2009. The primary elements of each Named Executive Officer’s total compensation reported in the table are base salary, long-term equity incentives consisting of stock options, cash incentive compensation and, for certain Named Executive Officers, the change in pension value relating to our tax-qualified defined benefit plans and contract benefits and certain earnings relating to our nonqualified defined contribution plan and SERP.a discretionary bonus. Named Executive Officers also earned or were paid the other benefits listed in Column (i) of the “Summary Compensation Table,Table.” as further described in footnote (4) to the table.
The “Summary Compensation Table” should be read in conjunction with the tables and narrative descriptions that follow. A description of the material terms of each Named Executive Officer’s employment agreement, or offer letter, as applicable, is provided immediately following this paragraph. The “Grants of Plan-Based Awards in Fiscal 2008”2011” table, and the description of the material terms of the stock options that follows it, providesprovide information regarding the long-term equity incentives awarded to our Named Executive Officers in fiscal 2008.2011. The “Outstanding Equity Awards at Fiscal 20082011 Year-End” and “Option Exercises and Stock Vested in Fiscal 2008”2011” tables provide further information onregarding the Named Executive Officers’ potential realizable value and actual value realized with respect to their equity awards. The “Pension Benefits Table” and related description of the material terms of our defined benefit plans describe each Named Executive Officer’s retirement benefits under our tax-qualified and nonqualified defined benefit plans and agreements to provide context to the amounts listed in the “Summary Compensation Table.” The “Nonqualified Deferred Compensation Plans” table and related description of the material terms of the SERPnarrative describe the benefits forpayable to Mr. Hitt underAdams pursuant to the SERP.Company’s Signing Bonus Plan. The discussion under “—“Employment-Related Agreements and Potential Payments Upon Termination or Change in Control” below is intended to further explain the potential future payments that are, or may become, payable to our Named Executive Officers under certain circumstances.
Description of Employment Agreements
The Company, through its subsidiaries, has entered into employment agreements with Messrs. Hitt and Marini and an employment offer letter with Mr. Moore.
The agreement for Mr. Hitt was effective as of July 21, 2006 and provides for a five-year term, subject to automatic extension for successive one-year periods thereafter unless either party delivers notice within specified notice periods. Mr. Hitt’s initial annual salary, which may be increased by our board of directors, was $575,000, and he is eligible to receive an incentive compensation bonus under the terms of our MIP. In addition, the agreement for Mr. Hitt provided for a stock option grant to purchase 230,706 shares of Holdings common stock at an exercise price of $19.94 per share.
The employment agreement with Mr. Marini, which was effective as of February 7, 2007, provides for an initial term of employment through August 31, 2008, subject to automatic extensions for successive one-year periods thereafter unless either party delivers notice within specified notice periods. Under the agreement, Mr. Marini’s annual base salary was $500,000, which may be increased by the Company’s Chairman or Chief Executive Officer. Mr. Marini is eligible to receive a discretionary bonus under the Company’s annual bonus plan established for each fiscal year commencing with fiscal 2008 with an annual cash target bonus opportunity for each fiscal year equal to 100% of his base salary. In addition, the agreement for Mr. Marini provided for a stock option grant to purchase 205,244 shares of Holdings common stock at an exercise price of $19.94 per share. See the discussion following the “Pension Benefits Table” below for a description of the terms of Mr. Marini’s supplemental pension benefit.
In connection with Mr. Moore’s appointment as Chief Financial Officer of the Company, Mr. Moore and the Company executed an employment offer letter on July 27, 2006. This offer letter provides for a base salary of $400,000 for the first year of his employment and a base salary of $275,000 for the second year of his employment. The Company and Mr. Moore subsequently agreed to delay the reduction of Mr. Moore’s base
salary for his second year of employment contemplated by the offer letter. As described under “—2008 Executive Compensation Components—Base Salary” Mr. Moore was awarded a salary increase effective June 2007.
Each of the employment agreements for Mr. Hitt and Mr. Marini provide for severance payments and benefits upon a termination of employment, as further described under “—Potential Payments Upon Termination or Change in Control” below.
Grants of Plan-Based Awards in Fiscal 20082011
The following table presents information about grants of plan-based awards made to our Named Executive Officers during the fiscal year ended March 31, 2008.2011.
| Grant Date | Estimated Possible Payouts Under Non-Equity Incentive Plan Awards (1) | Estimated Future Payouts Under Equity Incentive Plan Awards | All Other Stock Awards: Number of Shares of Stock or Units (#) | All Other Option Awards: Number of Securities Underlying Options (#) (2) | Exercise or Base Price of Option Awards ($/Sh) | Closing Market Price on Grant Date ($) | Estimated Future Payouts Under Non-Equity Incentive Plan Awards(1) | Estimated Future Payouts Under Equity Incentive Plan Awards | All Other Stock Awards: Number of Shares of Stock or Units (#) | All Other Option Awards: Number of Securities Underlying Options(8) (#) | Exercise of Base Price of Option Awards(9) ($) | Grant Date Fair Value of Stock & Option Awards (10)($) | |||||||||||||||||||||||||||||||||||||||||||||||||||||||||||
Name | Threshold (3) ($) | Target ($) (4) | Maximum ($) (5) | Threshold (#) (6) | Target (#) (7) | Maximum (#) (8) | Award Type | Grant Date | Threshold (2)($) | Target (3)($) | Maximum (4)($) | Threshold (5)(#) | Target (6)(#) | Maximum (7)(#) | |||||||||||||||||||||||||||||||||||||||||||||||||||||||||
| (a) | (b) | (c) | (d) | (e) | (f) | (g) | (h) | (i) | (j) | (k) | (l) | (b) | (c) | (d) | (e) | (f) | (g) | (h) | (i) | (j) | (k) | (l) | |||||||||||||||||||||||||||||||||||||||||||||||||
Robert A. Hitt | 4/19/07 | — | 431,250 | — | — | (9 | ) | ||||||||||||||||||||||||||||||||||||||||||||||||||||||||||||||||
Todd A. Adams | Options | 10/29/2010 | — | — | — | 10,000 | 20,000 | 20,000 | — | 20,000 | $ | 37.00 | $ | 602,713 | |||||||||||||||||||||||||||||||||||||||||||||||||||||||||
| MICP | 6/1/2010 | $ | 325,000 | $ | 650,000 | — | — | — | — | — | — | — | — | ||||||||||||||||||||||||||||||||||||||||||||||||||||||||||
Michael H. Shapiro | MICP | 6/1/2010 | 75,000 | 150,000 | — | — | — | — | — | — | — | — | |||||||||||||||||||||||||||||||||||||||||||||||||||||||||||
George C. Moore | 4/19/07 | — | 210,000 | — | — | (9 | ) | MICP | 6/1/2010 | 87,500 | 175,000 | — | — | — | — | — | — | — | — | ||||||||||||||||||||||||||||||||||||||||||||||||||||
Alex P. Marini | 4/19/07 | — | 500,000 | — | — | (9 | ) | ||||||||||||||||||||||||||||||||||||||||||||||||||||||||||||||||
Praveen R. Jeyarajah | MICP | 6/1/2010 | 100,000 | 200,000 | — | — | — | — | — | — | — | — | |||||||||||||||||||||||||||||||||||||||||||||||||||||||||||
| (1) | Amounts reflect target cash incentive awards under the |
| (2) | There is no minimum amount payable under the MICP. No payout is earned if either the Company fails to achieve the minimum corporate targets for EBITDA and De-levered Free Cash Flow, or if an individual receives a zero achievement on |
| (3) | Represents the amount payable under the MICP if 100% of the corporate financial performance measures are met and a 1.0 personal performance multiplier is applied, assuming each executive’s current annual base salary, excluding any additional discretionary bonus which could be paid under the plan. |
| (4) | The MICP does not set a limit on the maximum incentive opportunity payable with respect to |
| (5) | Represents the minimum number of option shares that would vest under the Named Executive Officer’s award under the Option Plan if the lowest performance threshold for vesting is satisfied. |
| (6) | Represents the number of option shares that would vest under the Named Executive Officer’s award under the Option Plan if 100% of the target |
93
| (7) | Represents the maximum number of options that could vest under the Named Executive Officer’s award |
| Represents the portion (50%) of the options granted to each Named Executive Officer under the Option Plan not subject to performance-based vesting. These options vest in equal portions on the first five anniversaries of the grant date based upon continued employment. |
| (9) |
| (10) | This amount represents the grant date fair value of the option awards calculated in accordance with ASC 718. See also the discussion of option awards contained in Note 14 to our audited consolidated financial statements included elsewhere in this prospectus. |
Narrative to Grants of Plan Based Awards
As described under “—2008“Compensation Discussion and Analysis—2011 Executive Compensation Components—Annual Performance-Based Awards,” the MIPMICP provides for cash incentive awards based on three criteria:specified criteria. For Messrs. Adams, Shapiro, Moore and Jeyarajah, the goals are based on: the achievement of personal goals, referred to as “annual improvement priorities” or AIPs, and the achievement of minimum annual EBITDA targets and the reduction of the Company’s debt by predetermined minimum levels. For Mr. Marini, the goals are based on EBITDA targets and Water Management’s Divisional Free Cash Flow.corporate financial performance targets.
Under the Option Plan, the vesting criteria for 50% of all options granted to our Named Executive Officers including those options granted in fiscal 2008,2011 is based upon annual and cumulative EBITDA and debt reductioncorporate financial performance targets over a five-year period (theperiod; the other 50% of such options vest in five equal amounts annually based on continued employment with the Company, subject to accelerated vesting or other modifications, as determined by the Holdings Compensation Committee).Committee. As is customary in incentive plans such as the Option Plan, the performance targets established for awards are subject to adjustment (such as the number and kind of shares with respect to which options may be granted, the number and kind of shares subject to outstanding options, the exercise price with respect to any option and the financial or other targets specified in an option award agreement) as appropriate to prevent dilution or enlargement of the economic benefits intended to be made available under the awards as a result of certain corporate events, including as a result of an acquisition or divestiture.
Outstanding Equity Awards at Fiscal 20082011 Year-End
The following table presents information about outstanding and unexercised options held by our Named Executive Officers at March 31, 2008.2011.
| |||||||||||
| |||||||||||
| |||||||||||
| |||||||||||
| Option Awards | ||||||||||||||||||||||||
Name | Grant Date | Number of Securities Underlying Unexercised Options (#) Exercisable | Number of Securities Underlying Unexercised Options (#) Unexercisable(2) | Equity Incentive Plan Awards: Number of Securities Underlying Unexercised Unearned Options(3)(#) | Option Exercise Price ($) | Option Expiration Date(4) | ||||||||||||||||||
| (a) | (b) | (c) | (d) | (e) | (f) | |||||||||||||||||||
Todd A. Adams | 7/21/2006 | 13,683 | (1) | — | — | $ | 7.13 | 7/27/2014 | ||||||||||||||||
| 7/21/2006 | 27,036 | 3,461 | 4,109 | $ | 19.94 | 7/21/2016 | ||||||||||||||||||
| 4/19/2007 | 27,026 | 3,967 | 8,678 | $ | 19.94 | 4/19/2017 | ||||||||||||||||||
| 6/24/2008 | 8,235 | 6,480 | 6,885 | $ | 40.00 | 6/24/2018 | ||||||||||||||||||
| 7/30/2009 | 9,450 | 21,600 | 22,950 | $ | 20.00 | 7/30/2019 | ||||||||||||||||||
| 9/11/2009 | 21,000 | 48,000 | 51,000 | $ | 20.00 | 9/11/2019 | ||||||||||||||||||
| 10/29/2010 | — | 20,000 | 20,000 | $ | 37.00 | 10/29/2020 | ||||||||||||||||||
Michael H. Shapiro | 2/15/2010 | 4,500 | 18,000 | 22,500 | $ | 20.00 | 2/15/2020 | |||||||||||||||||
George C. Moore | 10/25/2006 | 9,733 | 3,461 | 4,109 | $ | 19.94 | 10/25/2016 | |||||||||||||||||
| 4/19/2007 | 16,380 | 5,824 | 12,740 | $ | 19.94 | 4/19/2017 | ||||||||||||||||||
Praveen R. Jeyarajah | 4/19/2007 | 37,950 | 5,571 | 12,186 | $ | 19.94 | 4/19/2017 | |||||||||||||||||
| 10/29/2009 | 40,312 | 61,013 | 29,418 | $ | 20.00 | 10/29/2019 | ||||||||||||||||||
| (1) | Represents options granted by our predecessor to purchase common stock of RBS Global held by Mr. |
94
| (2) | Represents |
| (3) |
| (4) | The option expiration date shown in column (f) above is the stated expiration date, and the latest date that the options may be exercised. The options may terminate earlier upon a termination of employment or in connection with a change in control of the Company. |
Narrative to the Outstanding Equity Awards
Outstanding options currently consist of Roll-Over Options (described above) granted to Mr. HittAdams in connection with the Apollo acquisition and incentive-based and time-based options granted to Messrs. Hitt, MariniAdams, Shapiro, Moore and MooreJeyarajah pursuant to the Option Plan.
The options granted under the Option Plan may become fully vested immediately if HoldingsRexnord Corporation experiences certain liquidity events, such as definedcertain business combinations or other events, as set forth in the Option Plan.
Option Exercises and Stock Vested in Fiscal 20082011
The following table provides information regarding exercises of option awardsNo options were exercised by our Named Executive Officers during theor stock vested in fiscal year ended March 31, 2008.2011.
Pension Benefits
| ||||
| ||||
| ||||
| ||||
Pension Benefits Table
The following table presents information regarding the present value of accumulated benefits that may become payable to each of the Named Executive Officers under ourparticipated in any qualified andor nonqualified defined-benefit pension plans as of March 31, 2008.
Name | Plan Name | Number of Years Credited Service (#) | Present Value of Accumulated Benefit ($) (1) | Payments During Last Fiscal Year ($) | |||||
| (a) | (b) | (c) | (d) | (e) | |||||
Robert A. Hitt | Rexnord Non-Union Pension Plan | 8.25 | $ | 114,693 | — | ||||
George C. Moore | — | — | — | ||||||
Alex P. Marini (2) | Rexnord Non-Union Pension Plan | 35 | $ | 936,613 | — | ||||
Supplemental Pension Benefit (Employment Agreement) | — | $ | 1,218,163 | — | |||||
Rexnord Non-Union Pension Plan. Mr. Hitt participates in the Rexnord Non-Union Pension Plan. Benefit payments under this plan are generally based on final average annual compensation—including overtime pay,
incentive compensation and certain other forms of compensation reportable as wages taxable for federal income tax purposes, but excluding severance payments, amounts attributable to our equity plans and any taxable fringe benefits—for the five years within the final ten years of employment prior to termination that produce the highest average. The plan’s benefits formula also integrates benefit formulas from prior plans of our former parent and JBI in which certain participants may have been entitled to participate. Benefits are generally payable as a life annuity for unmarried participants and on a 50% joint and survivor basis for married participants. The full retirement benefit is payable to participants who retire on or after age 65, and a reduced early retirement benefit is available to participants who retire on or after age 55 with 10 years of service. No offsets are made for the value of any social security benefits earned. During our 2004 fiscal year the Company froze credited service as of March 31, 2004. As such, no additional benefits are accruing under this plan. Mr. Hitt is eligible for increases in final average pay through 2014.2011.
Supplemental Pension Benefits for Mr. Marini.Under the terms of Mr. Marini’s employment agreement with the Company that became effective February 7, 2007 in connection with the Zurn acquisition (the “Marini Employment Agreement”), Mr. Marini is entitled to receive a monthly supplemental retirement benefit in the form of a 60% joint and survivor annuity commencing upon his retirement, so long as his employment is not terminated for “cause” (as defined under the Marini employment agreement). The amount of the monthly supplemental retirement benefit is determined as of Mr. Marini’s retirement date and is an amount necessary to provide Mr. Marini with a monthly 60% joint and survivor annuity during Mr. Marini’s life after his retirement equal to the positive difference, if any, between $20,000 less his “existing retirement benefit.” Mr. Marini’s “existing retirement benefit” is equal to the sum of (1) the aggregate monthly benefit that he is entitled to receive under all of the tax-qualified and non tax-qualified pension plans covering Mr. Marini during his employment with the Company and its affiliates and (2) the value of the lump sum payment he received under certain supplemental pension plans maintained by JBI upon the sale of JBI to affiliates of Apollo on February 7, 2007, assuming for purposes of the calculation that the amount was not paid until his retirement and was paid in the form of a 60% joint and survivor annuity rather than in a lump sum. Regardless of the form in which the existing retirement benefits would be paid under the terms of the applicable plan, for purposes of the calculation under the agreement, each benefit is determined assuming that the benefit is payable in the form of a 60% joint and survivor annuity determined using the actuarial assumptions that are used under the Company’s tax-qualified defined benefit plan at the time of Mr. Marini’s retirement. If Mr. Marini voluntarily terminates his employment with the Company for any reason other than a termination for “good reason” (as defined under the Marini employment agreement), death or disability, he must give the Company six months notice of his termination in order to receive the supplemental retirement benefit. If he does not give the Company the six months notice, Mr. Marini will be required to pay the Company an amount equal to his then current base salary.
Nonqualified Deferred Compensation Table
The following table presents information onregarding contributions to, earnings accrued under and distributions from our nonqualified defined contribution and other nonqualified deferred compensation plans during the fiscal year ended March 31, 2008.2011.
Name | Plan Name | Executive Contributions in Last FY ($) | Registrant Contributions in Last FY ($)(1) | Aggregate Earnings in Last FY ($)(2) | Aggregate Withdrawals/ Distributions ($) | Aggregate Balance at Last FYE ($) | ||||||||||
| (a) | (b) | (c) | (d) | (e) | (f) | |||||||||||
Robert A. Hitt | SERP | — | $ | 91,821 | $ | 20,177 | — | $ | 410,911 | (3) | ||||||
| Signing Bonus Plan | $ | 825,594 | ||||||||||||||
George C. Moore | — | — | — | — | — | |||||||||||
Alex P. Marini | — | — | — | — | — | |||||||||||
Name | Plan Name | Executive Contribution in Last FY ($) | Registrant Contributions in Last FY ($) | Aggregate Earnings in Last FY ($) | Aggregate Withdrawals/ Distributions ($) | Aggregate Balance at Last FYE ($) | ||||||||||||||||||
| (a) | (b) | (c) | (d) | (e) | (f) | |||||||||||||||||||
Todd A. Adams | Signing Bonus Plan | $ | — | $ | — | $ | — | $ | — | $ | 97,599 | |||||||||||||
Michael H. Shapiro | — | $ | — | $ | — | $ | — | $ | — | $ | — | |||||||||||||
George C. Moore | — | $ | — | $ | — | $ | — | $ | — | $ | — | |||||||||||||
Praveen R. Jeyarajah | — | $ | — | $ | — | $ | — | $ | — | $ | — | |||||||||||||
Narrative to the Nonqualified Deferred Compensation Table
Mr. HittAdams is a participant in the Rexnord Special Signing Bonus Plan (the “Signing Bonus Plan”). The Company established the Signing Bonus Plan effective July 21, 2006 to provide for an award of a cash bonus to certain employees, directors, consultants and other service providers of the Company and its subsidiaries who agreed to provide services to the Company following the date of its adoption (which was the date of the July 2006 Apollo acquisition). Bonuses become payable to participants upon the earliest to occur of: (i) a change in control of the
95
Company, (ii) the participant’s separation from service or (iii) a date specified in the participant’s plan participation letter, which for Mr. HittAdams is within 30 days after November 25, 2012. Bonus amounts are not credited with interest or other earnings. None of the other Named Executive Officers is a participant in the Signing Bonus Plan.
Mr. Hitt, is the sole participant in the Rexnord Supplemental Executive Retirement Plan (“SERP”) that the Company adopted on January 1, 2004. Under the SERP, on the date the plan was adopted, each participant was credited with a specified amount to his account,Employment-Related Agreements and during the term of each participant’s active employment with the Company thereafter each participant’s account is credited annually as of each December 31 with a percentage of his compensation, which is 8.48% for Mr. Hitt. Account balances are also credited with earnings at an annual interest rate of 6.75%. Participants are credited with a pro-rata contribution amount and interest in the year that the participant’s employment terminates. Benefits become payable upon a termination of employment or in the event of death. A “rabbi-trust” has been established to fund benefit obligations under the SERP.
Potential Payments Upon Termination or Change in Control
As described above in the “Compensation Discussion and Analysis—Severance Benefits”, theThe Company generally does not enter into employment agreements of Mr. Hitt and Mr. Marini include provisions regarding certain payments to be made in the event of termination bywith its domestic employees, including with its executive officers, because the Company or bybelieves that management and executives should be treated similarly to other employees and should be subject to at-will employment. Instead, the executive.
UnderCompany enters into employment offer letters to set forth the terms and conditions of employment. The Company has, from time to time, entered into employment agreements with certain individuals, for example, in connection with acquisitions or significant transactions in order to retain key individuals; the Committee also regularly considers whether employment agreements should be adopted in view of then-current circumstances. The Company has not entered into an employment agreement with any of the Named Executive Officers.
Offer Letters. The Company, through its subsidiaries, has entered into employment agreement for offer letters with Messrs. Adams, Shapiro, Moore and Jeyarajah.
Mr. Hitt, upon termination ofAdams and the Company executed an employment either by us without cause or byoffer letter on April 2, 2008 in connection with his appointment as the Company’s Chief Financial Officer. In September 2009, Mr. Hitt for good reason, he will be entitled to an amount equal toAdams was appointed President and Chief Executive Officer, at which time, his stated annual base salary for a period of eighteen monthswas increased and during such severance period, continued coveragehis target bonus under all of our group health benefit plans in which he and anythe MICP was set at 100% of his dependents were entitledbase salary.
In connection with being hired as Vice President and Chief Financial Officer, Mr. Shapiro executed an employment offer letter with the Company on February 1, 2010. The offer letter provided for, among other things, an initial base salary of $300,000; an opportunity to participate immediately prior to termination. In addition to the foregoing, the employment agreement also provides that in the eventMICP with a target bonus of a termination within 18 months50% of a changehis base salary, to participate in control (as defined inother benefit programs and to receive grants of stock options under the employment agreement) byOption Plan; and payment of relocation costs and expenses.
Mr. Moore and the Company without cause, or by Mr. Hittexecuted an employment offer letter on July 27, 2006. The offer letter provided for good reason, Mr. Hitt is also entitled to receive an amount equal toinitial base salary of $400,000 for the annual bonus he would have received in the performance period in effect at the time of termination, plus 18 months of the premium amount of the basic life insurance coverage then in place for him. Mr. Hitt is prohibited from competing with us during the termfirst year of his employment and a base salary of $275,000 for a period of twenty four months following terminationthe second year of his employment.
Underemployment based on the termstransitioning out of his then role and responsibilities as Chief Financial Officer. The Company and Mr. Moore subsequently agreed to delay the reduction of Mr. Moore’s base salary for subsequent years of employment that was contemplated by the offer letter. For fiscal 2011, given his transitioning out of the employment agreement for Mr. Marini, in the event Mr. Marini voluntarily retires fromChief Financial Officer position, the Company he will be entitled to receive certain annuity benefits (described above under “Supplemental Pension Benefits foradjusted Mr. Marini”), provided he gives the Company at least six months’ notice of his intention to retire, and retiree medical coverage under our retiree medical plan in effect, if any, upon his termination. If Mr. Marini’s employment is terminated on or before August 31, 2008 either by us without cause, by Mr. Marini for good reason (in each case as defined in the agreement), or because we do not extend his employment term, subject to the execution of a release of claims, he will be entitled to receive 24 monthly payments equal to his
then-monthly rate of baseMoore’s salary and a lump sum payment equal to two times his annual target bonus amount. If a termination occurs for either of these reasons after August 31, 2008, he will be entitled to receive 12 monthly payments equal to his then-monthly rate of base salary and a lump sum payment equal to his annual target bonus amount. Additionally, if such termination occurs prior to August 31, 2008 Mr. Marini will also be entitled to continued coverage under all of our group health benefit plans in which he and any of his dependents were entitled to participate immediately prior to termination for a period of two years, or for a period of one year if such termination occurs thereafter. In either case, he will also be entitled to receive his minimum pension amount, as calculated pursuant to the agreement, retiree medical benefits for him and his spouse pursuant to the terms of the Company’s retiree medical plan covering the senior executives of the Company at the time of such termination, 12 months of accelerated vesting of his then-unvested options and any amounts then owed to Mr. Marini under the applicable benefit plans in which he is a participant, which are to be paid in accordance with the termsintent of such plans. Subjectthe offer letter.
Mr. Jeyarajah and the Company executed an employment offer letter on April 19, 2010 in connection with his appointment as Executive Vice President—Corporate & Business Development of the Company. Mr. Jeyarajah’s initial annual base salary was negotiated and, pursuant to certain limitations,his employment offer letter, was set at $400,000; he is eligible to participate in the MICP with an initial target bonus opportunity of 50% of base salary, to participate in other benefit programs of the Company and to receive grants of stock options under the agreementOption Plan; and he receives reimbursement of reasonable office expenses for an office located in Washington, D.C. In addition, in connection with his appointment, Mr. Marini is prohibited from competing with us or solicitingJeyarajah’s outstanding options to purchase shares of our employees, customers, suppliers or certain other persons duringcommon stock, which he received while serving as a director, were amended and restated to reflect his current position as Executive Vice President—Corporate & Business Development.
Other Potential Payments to the term of his employmentNamed Executive Officers. Messrs. Adams, Shapiro, Moore and for a period of 24 months following termination of his employment.
Mr. Moore isJeyarajah are covered under a corporate severance policy that applies to our employees whose employment is involuntarily terminated under various conditions described in the plan document. The severance policy is intended to cover employees who are not entitled to severanceSeverance benefits under an employment agreement
The following table presents the dollar valuepolicy generally include cash payments equal to weekly base salary for up to 52 weeks depending on the level of the maximum severance benefitsposition and years of seniority and up to which each executive would have been entitled under their respective employment agreements had a qualifying terminationsix months of employment occurred on March 31, 2008.
Name | Triggering Event | Cash Severance | Continued Benefits | Total | Value of accelerated Unvested Options (1) | |||||||||
Robert A. Hitt | Term. Without Cause or Resign for Good Reason | $ | 862,500 | $ | 23,625 | $ | 886,125 | — | ||||||
| Change in Control and Term. Without Cause or Resign for Good Reason(2) | $ | 1,293,750 | (3) | $ | 25,229 | $ | 1,318,979 | — | ||||||
Alex P. Marini | Term. Without Cause or Resign for Good Reason | $ | 2,000,000 | $ | 21,084 | $ | 2,021,084 | — | ||||||
| Change in Control and Term. Without Cause or Resign for Good Reason | $ | 2,000,000 | $ | 21,048 | $ | 2,021,048 | — | |||||||
UponCOBRA subsidy for medical, dental and/or vision insurance, although specific amounts payable upon a termination of employment Mr. Hitt would alsocould and do vary depending on
96
individual circumstances. The Company generally does not enter into severance or change in control agreements or other special arrangements with executive officers or employees because the Company believes the severance policy provides adequate support following a covered termination and that all employees should receive similar benefits (relative to their position) without special treatment; however, the Committee regularly reconsiders whether such agreements should be entitledadopted, and may adjust in individual circumstances, in view of then-current circumstances. We maintain the corporate severance policy because we believe that it is appropriate to a distribution of the amount then creditedprovide severance benefits to his accountemployees whose employment terminates in various circumstances and fully vested under the SERP of $410,911. believe that doing so helps us attract and retain highly qualified employees.
In addition, upon a termination of
employment or a change in control, Mr. HittAdams would be entitled to receive the $825,594 credited to his account and fully vested$97,599 under the Special Signing Bonus Plan. UponThe Signing Bonus Plan was established effective July 21, 2006 to provide for the award of a terminationcash bonus to certain employees, directors, consultants and other service providers of employment,the Company and its subsidiaries. All amounts under the Signing Bonus Plan are fully vested and payable to participants upon the earliest to occur of: (i) a change of control of the Company, (ii) the separation from service of the participant or (iii) a date specified for each participant (which is within 30 days after November 25, 2012 in the case of Mr. Marini would also be entitled to his minimum supplemental pension benefit as described under “Pension Benefits Table” above. Adams).
Additionally, in the event of a change in control, the Option Plan permits the Committee to take one of a series of actions, including causing outstanding option grants to be subject to accelerated vesting or repurchase by the Company.
The following table sets forth the estimated current value of benefits that could be paid to our Named Executive Officers upon a termination without cause or a termination in connection with a change in control under the corporate severance policy and/or the terms of various benefits plans available to the Named Executive Officers. These amounts are estimates only and do not necessarily reflect the actual amounts that would be paid to the Named Executive Officers; the actual amounts would be known only at the time that they become eligible for payment and would be payable only if a termination event or change in control were to occur. The tables reflect the amounts that could be payable under the various arrangements if a termination event or change of control had occurred at March 31, 2011. The table does not include certain payments that are generally otherwise available on a non-discriminatory basis to all U.S. salaried employees or that were earned irrespective of the termination.
Name | Cash ($) | Equity(1) ($) | Pension / Non-Qualified Deferred Compensation ($) | Perquisites / Benefits ($) | Tax Reimbursement ($) | Other ($) | Total ($) | |||||||||||||||||||||
| (a) | (b) | (c) | (d) | (e) | (f) | (g) | (h) | |||||||||||||||||||||
Termination Without Cause | ||||||||||||||||||||||||||||
Todd A. Adams | $ | 400,000 | $ | — | $ | 97,599 | — | — | — | $ | 497,599 | |||||||||||||||||
Michael H. Shapiro | 155,769 | — | — | — | — | — | 155,769 | |||||||||||||||||||||
George C. Moore | 201,923 | — | — | — | — | — | 201,923 | |||||||||||||||||||||
Praveen R. Jeyarajah | 200,000 | — | — | — | — | — | 200,000 | |||||||||||||||||||||
Termination in Connection with Change in Control | ||||||||||||||||||||||||||||
Todd A. Adams | $ | 400,000 | 2,785,221 | 97,599 | — | — | — | 3,282,820 | ||||||||||||||||||||
Michael H. Shapiro | 155,769 | 688,500 | — | — | — | — | 844,269 | |||||||||||||||||||||
George C. Moore | 201,923 | 445,847 | — | — | — | — | 647,770 | |||||||||||||||||||||
Praveen R. Jeyarajah | 200,000 | 1,840,247 | — | — | — | — | 2,040,247 | |||||||||||||||||||||
| (1) | Upon a change in control, outstanding unvested stock options could become vested under the terms of the Option Plan. The amount shown represents the difference in value of the outstanding unvested options between their exercise price and the most recent annual valuation of the Company available at March 31, 2011 of $37.00 per share. The amount does not include the value of any options that have already vested at fiscal year end, even though the Named Executive Officer could receive the value of those options in connection with a termination, along with other already-earned compensation. |
97
Other than the Signing Bonus Plan and a payout of outstanding unvested options upon a termination in connection with a change in control described above, upon a termination for any other reason (e.g., retirement, death, disability, voluntary termination), the Named Executive Officers would receive payments and benefits, if any, under the corporate severance policy, as well as the right to the value of already vested stock options, both of which are generally available on a non-discriminatory basis to all other U.S. salaried employees, and would not receive any other payments or benefits that are generally not available on a non-discriminatory basis to all other U.S. salaried employees.
Director Compensation
The table below summarizes the compensation we paid to persons who were non-employee directors of the Company for the fiscal year ended March 31, 2008. Director fees were paid for board membership in the RBS Global board of directors. No additional directors fees were paid to such persons for service on the Company’s Board.2011.
Name | Fees Earned or Paid in Cash ($) | Stock Awards ($) | Option Awards ($) (1) | Non-Equity Incentive Plan Compensation ($) | Change in Pension Value and Nonqualified Deferred Compensation Earnings ($) | All Other Compensation ($) | Total ($) | Fees earned or Paid in Cash ($) | Stock Awards ($) | Option Awards (1) ($) | Non-Equity Incentive Plan Compensation ($) | Change in Pension Value and Nonqualified Deferred Compen- sation Earnings ($) | All Other Compensation ($) | Total ($) | |||||||||||||||||||||||||||||||
| (a) | (b) | (c) | (d) | (e) | (f) | (g) | (h) | (b) | (c) | (d) | (e) | (f) | (g) | (h) | |||||||||||||||||||||||||||||||
George M. Sherman | — | — | $ | 2,927,178 | — | — | — | $ | 2,927,178 | $ | 298,000 | $ | — | $ | — | $ | — | $ | — | $ | — | $ | 298,000 | ||||||||||||||||||||||
Laurence M. Berg | $ | 48,000 | — | 124,185 | — | — | — | 172,185 | $ | 48,000 | $ | — | $ | — | $ | — | $ | — | $ | — | $ | 48,000 | |||||||||||||||||||||||
Peter P. Copses | $ | 48,000 | — | 124,185 | — | — | — | 172,185 | $ | 47,000 | $ | — | $ | — | $ | — | $ | — | $ | — | $ | 47,000 | |||||||||||||||||||||||
Damian J. Giangiacomo | $ | 48,000 | — | 124,185 | — | — | — | 172,185 | $ | 47,000 | $ | — | $ | — | $ | — | $ | — | $ | — | $ | 47,000 | |||||||||||||||||||||||
Praveen R. Jeyarajah | — | — | 249,278 | — | — | — | 249,278 | ||||||||||||||||||||||||||||||||||||||
Steven Martinez | $ | 48,000 | — | 124,185 | — | — | — | 172,185 | $ | 46,000 | $ | — | $ | — | $ | — | $ | — | $ | — | $ | 46,000 | |||||||||||||||||||||||
John S. Stroup | $ | 49,000 | $ | — | $ | — | $ | — | $ | — | $ | — | $ | 49,000 | |||||||||||||||||||||||||||||||
| (1) |
| 2011. The following table presents the aggregate number of outstanding unexercised options (including, in the case of Messrs. Sherman and Stroup, options that have not yet vested) held by each of our non-employee directors as of March 31, |
Director | Number of Options Outstanding | |||
George M. Sherman (*) | 831,144 | |||
Laurence M. Berg | 10,000 | |||
Peter P. Copses | 10,000 | |||
Damian J. Giangiacomo | ||||
| ||||
Steven Martinez | 10,000 | |||
John S. Stroup | 4,500 |
| (*) | These include options |
98
Narrative to Directors’ Compensation Table
We payIn fiscal 2011, we paid certain fees to our non-employee directors. In addition, directors (excludingare eligible to receive equity-based awards from time to time on a discretionary basis. Directors who are also employees of the Company receive no additional compensation for their service as directors. In fiscal 2011, Mr. Jeyarajah was a non-employee director of the Company until his appointment as Executive Vice President—Corporate & Business Development in April 2010; however, in accordance with Company policy, he did not receive any fees for his service on the board during fiscal 2011. See the executive compensation disclosures above for information related to Mr. Jeyarajah’s compensation in fiscal 2011.
In fiscal 2011, Messrs. Sherman, Berg, Copses, Giangiacomo and Jeyarajah)Martinez each received an annual cash retainer of $40,000, paid quarterly after each fiscal quarter of service, and a fee of $2,000 for each board and committee
meeting attended in person. With respect to Messrs. Berg, Copses, Giangiacomo and Martinez (i.e., the directors appointed by Apollo), the amount of fees are set forth in the stockholders agreements executed at the time of the Apollo transaction. Fifty percent of the meeting fee is paid for board and committee meetings attended by teleconference. Directors who are also employeesMr. Stroup receives annual cash compensation comprised of (i) a $35,000 annual fee, (ii) fees of $2,500 per board meeting attended and (iii) committee attendance fees of $1,000 per meeting. In addition, in fiscal 2011, Mr. Sherman received a fee of $250,000 for his service as Chairman of the Company receive no additional compensationBoard. The cash retainer and meeting and chairmanship fees paid to non-employee directors described above will remain the same for their service as Directors. Directors are eligible to receive equity-based awards from time to time on a discretionary basis. On April 29, 2007, Messrs. Berg, Martinez, Copses and Giangiacomo received options to purchase shares of Company common stock pursuant to the Option Plan and Mr. Jeyarajah received options to purchase shares of Company common stock pursuant to the Option Plan.fiscal 2012.
On July 22, 2006, we entered into the Cypress agreement, as described above.in Note 17 to our audited consolidated financial statements included elsewhere in this prospectus. Under the terms of the agreement, Mr. Sherman also received a grant of options to purchase 130,743 and 165,244 shares of Companyour common stock were granted to Cypress and Mr. Sherman, respectively. Pursuant to the Option Plan, 50% of the options granted vest based on continued service in equal annual amounts on the first five anniversaries of February 7, 2007, the April 19, 2007 grant date of the Zurn acquisition, and the remaining 50% of the options granted are subject to performance-based vesting over five years, subject to the Company meeting certain specific annual and cumulative corporate financial performance targets in each of the fiscal years 2008 though 2012, which include both annual and cumulative EBITDA and debt reduction targets.through 2012. Under the agreement, Mr. Sherman is also is entitled to reimbursement for all reasonable travel and other expenses incurred in connection with our business. Mr. Sherman purchased shares at $ on April 17, 2007.
As a public company we will ensureIn order that all material transactions with related parties are fair, reasonable and in our best interest. In this regard the audit committee charter shall provide that that committee will review all material transactions between us and related parties to determine that such transactions meet that standard. Management shall not cause the Company to enter into any new related-party transaction unlesscould grant additional options under the audit committee approves that transaction.
Management Service Fees
Rexnord Holdings, Inc. has a management consulting agreement with Apollo for advisory and consulting services relating to business, financial oversight, administration andOption Plan, in October 2009, at the policiesrequest of Rexnord Holdings, Inc. and its subsidiaries. Under the terms of the agreement, which became effective July 22, 2006 and was subsequently amended and restated as of February 7, 2007,Cypress, the Company paid $1.4 million during the period from July 22, 2006 through March 31, 2007 and $3.0 million during the year ended March 31, 2008 plus out-of-pocket expenses. This agreement will remain in effect until the twelfth anniversarycancelled Cypress’ options to purchase 130,743 shares of the date of the amended agreement (unless extended pursuant to the terms thereof), or such earlier time as the Company and Apollo may mutually agree. Upon the consummation of this offering, Apollo intends to terminate the management consulting agreement, and as a result will receive $20.0 million.
RBS Global, Inc. had a management services agreement with TC Group, L.L.C., (The Carlyle Group) for advisory and consulting services related to corporate management, finance, product strategy, investment, acquisitions and other matters relating to the business of the Predecessor. Under the terms of the agreement, the Company paid the following, plus out-of-pocket expenses; $2.0 million for the year ended March 31, 2006 and $0.5 million during the period from April 1, 2006 through July 21, 2006. This agreement was terminated on July 21, 2006 when The Carlyle Group sold the Company to Apollo.
Consulting Services
Rexnord LLC has a management consulting agreement (the “Cypress agreement”) with Mr. George Sherman and two entities controlled by Mr. Sherman, Cypress Group, LLC (“Cypress”) and Cypress Industrial Holdings, LLC (“Cypress Industrial” and, collectively with Mr. Sherman and Cypress, “Consultant”). Pursuant to the Cypress agreement, Mr. Sherman serves as a director of Rexnord LLC and as a director in the capacity of Non-Executive Chairman of the boards of directors of RBS Global and Rexnord Holdings and also provides certain consulting services to us including advising with respect to management strategy. In exchange, Consultant receives reimbursement for reasonable out-of-pocket expenses. Through the date of the Zurn acquisition, Mr. Sherman also received an annual consulting fee of $250,000. Effective this date, the Cypress agreement was amended, effectively eliminating the consulting fee compensation prospectively. In addition to out-of pocket expenses, the Company paid the following consulting fees for the respective time periods: $250,000 during the year ended March 31, 2006, $77,500 for the period from April 1, 2006 through July 21, 2006 and $136,000 during the period from July 22, 2006 through February 7, 2007. Consultant also received non-qualified stock options in fiscal 2007 and fiscal 2008.
During the year ended March 31, 2006, the period from April 1, 2006 through July 21, 2006, the period from July 22, 2006 through March 31, 2007 and the year ended March 31, 2008, the Company paid approximately $1.5 million, $0.5 million, $2.5 million and $1.4 million respectively, for consulting services provided by an entity that is controlled by certain minority shareholders of the Company.
The Zurn Acquisition
On October 11, 2006 the Company entered into an agreement with Jupiter, an affiliate of Apollo, to acquire the water management business (“Zurn”) of Jacuzzi Brands, Inc. (“Jacuzzi”). Apollo subsequently caused Jacuzzi
to sell the assets of its bath business to Bath Acquisition Corp., an affiliate of Apollo, leaving Zurn as Jacuzzi’s sole business operation and on February 7, 2007, the Company acquired theour common stock of Jacuzzi, and therefore, Zurn, from an affiliate of Apollo, for a cash purchase price of $942.5 million, including transaction costs and additional deferred financing fees. The transaction was approved both by the stockholders of the Company, as required by Delaware law in the case of an affiliate transaction of this type, and unanimously by the Company’s board of directors, including those who were not affiliated with Apollo. In each case the stockholders and the unaffiliated directors assessed the transaction and the purchase price to be paid for Jacuzzi from the Rexnord Holdings, Inc. and Subsidiaries perspective of what was in the best interests of the Company and all of its stockholders, when taking into account the benefits they expected the Company to realize from the transaction. Further, upon completion of their review of the transaction, the board of directors made the determination that the acquisition of Jacuzzi was made on terms not materially less favorable to RBS Global than those that could have been obtained in a comparable transaction between RBS Global and an unrelated person, as required by the indentures governing the debt securities of RBS Global and Rexnord, LLC.
Transaction costs
During the year ended March 31, 2006, the Company paid approximately $3.0 million to The Carlyle Group and $2.0 million to Cypress for investment banking services and other transaction costs in connection with the acquisition of Falk.
During the year ended March 31, 2007, the Company paid a total of $0.6 million to The Carlyle Group and $21.3 million to Apollo for investment banking and other transaction related services as part of the purchase of the Company by Apollo.
During the year ended March 31, 2007, the Company paid a total of $9.0 million to Apollo and $1.8 million to the Cypress Group LLC for investment banking and other transaction related services as part of the Zurn Acquisition.
Other
In April 2008, Mr. Sherman purchased approximately $0.5 million (approximately $0.6 million face value or 0.2133% of the total commitment) of the 11.75% senior subordinated notes due 2016 of RBS Global. Additionally, in April 2008, Cypress Group Holdings II, LLC, an entity controlled by Mr. Sherman, purchased approximately $2.0 million (approximately $3.0 million face value or 0.5798% of the total commitment) of the outstanding PIK toggle senior indebtedness due 2013 of Rexnord Holdings, which is outstanding pursuant to a credit agreement dated March 2, 2007 between us, various lenders thereunder and an affiliate of Credit Suisse, as administrative agent.
In February 2008, Apollo purchased approximately $25.1 million (approximately $36.6 million face value or 7.0489% of the total) of the outstanding PIK toggle senior indebtedness due 2013 of Rexnord Holdings, which is outstanding pursuant to a credit agreement dated March 2, 2007 between us, various lenders thereunder and an affiliate of Credit Suisse, as administrative agent. Additionally in February 2008, Apollo purchased approximately $8.3 million (approximately $10.0 million face value or 3.3333% of the total) of the 11.75% senior subordinated notes due 2016 of RBS Global.
In connection with the Zurn acquisition, we, through one or more of our subsidiaries, continue to incur certain payroll and administrative costs on behalf of Bath Acquisition Corp. (“Bath”) (the former bath segment of JBI, which was purchased by an Apollo affiliate). These costs are reimbursed to us by Bath on a monthly basis. During the year ended March 31, 2008, we received approximately $6.8 million of reimbursements. It is anticipated that this cost incurrence and reimbursement arrangement will continue in effect until we have fully transitioned the payment of these costs to Bath, which we expect will be by the end of fiscal 2009.rights thereunder.
Debt Repayment
Our affiliates, including Apollo, that are holders of the PIK toggle senior indebtedness due 2013 of Rexnord Holdings may receive net proceeds from this offering in connection with the repayment of this indebtedness. As of the date of this prospectus, Apollo and its affiliates held approximately $40.0 million of the PIK toggle senior indebtedness due 2013 of Rexnord Holdings and Cypress Group Holdings II, LLC held approximately $3.2 million of the PIK toggle senior indebtedness due 2013 of Rexnord Holdings. However, from time to time, Apollo, Cypress Group Holdings II, LLC, Mr. Sherman or any of their respective affiliates, depending upon market, pricing and other conditions, may in the future purchase additional PIK toggle senior indebtedness due 2013 of Rexnord Holdings or sell such indebtedness owned by them in the market. Any such future purchases or sales may be made in the open market, privately negotiated transactions, tender offers or otherwise. At July 1, 2008, the PIK toggle senior indebtedness traded at approximately 80% of face value based on indicative bid/offer prices.99
Shareholder’s Agreeement
In connection with the acquisition of RBS Global by affiliates of Apollo, we entered into a stockholders’ agreement (the “RHI Stockholders’ Agreement”) with Rexnord Acquisition Holdings I, LLC, Rexnord Acquisition Holdings II, LLC and certain other of our stockholders. The RHI Stockholders’ Agreement provides for customary restrictions on transfer, grants to us customary repurchase rights, grants to all stockholders customary tag-along rights, grants to Apollo customary drag-along rights, demand registration rights and information rights, and grants to all stockholders customary piggyback registration rights. The RHI Stockholders’ Agreement includes a customary non-solicitation covenant applicable to management for two (2) years following termination of employment and a customary non-competition covenant applicable to management for one (1) year following the termination of employment. The RHI Stockholders’ Agreement also includes a voting agreement among the stockholders with respect to the nomination and election of directors.
We also entered into a stockholders’ agreement with Rexnord Acquisition Holdings I, LLC, Rexnord Acquisition Holdings II, LLC, Cypress and George M. Sherman (the “Cypress Stockholders’ Agreement”) which provides for similar repurchase rights, tag-along rights, drag-along rights, registration rights, information rights, registration rights, restrictions on transfers and voting agreements with respect to the nomination and election of directors as the RHI Stockholders’ Agreement. The Cypress Stockholders’ Agreement also grants to stockholders affiliated with Cypress a put right exercisable upon the termination of George M. Sherman’s consulting agreement with us.
The following table provides certain information regarding the beneficial ownership of our outstanding capital stock as of September 1, 2008May 12, 2011, and after giving effect to the offering, for:
each person or group who beneficially owns more than 5% of our capital stock on a fully diluted basis;
each of theour current executive officers named in the summary compensation table;officers;
each of our directors and director nominees;directors; and
all of our directors and executive officers as a group.
The percentage of ownership indicated before this offering is based on 16,028,406 shares of common stock outstanding on September 1, 2008.May 12, 2011. The percentage of ownership indicated after this offering is based on shares, including the shares offered by this prospectus and assuming no exercise of options outstanding after September 1, 2008.May 12, 2011.
Beneficial ownership of shares is determined under the rules of the Securities and Exchange Commission and generally includes any shares over which a person exercises sole or shared voting or investment power. Except as indicated by footnote, and subject to applicable community property laws, each person identified in the table possesses sole voting and investment power with respect to all shares of common stock held by them. Shares of common stock subject to options currently exercisable or exercisable within 60 days of September 1, 2008May 12, 2011 and not subject to repurchase as of that date are deemed outstanding for the purpose of calculating the percentage of outstanding shares of the person holding these options, but are not deemed outstanding for the purpose of calculating the percentage of outstanding shares owned by any other person. Unless otherwise noted, the business address for each director and executive officer is 4701 West Greenfield Avenue, Milwaukee, Wisconsin 53214.
| |||||||||
| |||||||||
| |||||||||
| |||||||||
| |||||||||
| |||||||||
| |||||||||
| |||||||||
| |||||||||
| |||||||||
| |||||||||
| |||||||||
| |||||||||
| |||||||||
| |||||||||
Name of Beneficial Owner | Ownership Before the Offering | Percentage Before the Offering | Ownership After Giving Effect to the Offering | Percentage After Giving Effect to the Offering | ||||||||||||||||
Apollo Management, L.P. | (1 | ) | 15,027,277 | 93.8 | % | |||||||||||||||
George M. Sherman | (2 | ) | 1,431,805 | 8.5 | % | |||||||||||||||
Todd A. Adams | (3 | ) | 143,565 | * | ||||||||||||||||
Michael H. Shapiro | (4 | ) | 9,000 | * | ||||||||||||||||
George C. Moore | (5 | ) | 113,789 | * | ||||||||||||||||
Praveen R. Jeyarajah | (6 | ) | 131,352 | * | ||||||||||||||||
Laurence M. Berg | (7 | )(11) | 10,000 | * | ||||||||||||||||
Peter P. Copses | (8 | )(11) | 10,000 | * | ||||||||||||||||
Damian J. Giangiacomo | (9 | )(11) | 10,000 | * | ||||||||||||||||
Steven Martinez | (10 | )(11) | 10,000 | * | ||||||||||||||||
John S. Stroup | (12 | ) | 1,500 | * | ||||||||||||||||
Current directors and executive officers as a Group (10 persons) | (13 | ) | 1,871,011 | 11.0 | % | |||||||||||||||
| * | Indicates less than one percent |
| (1) | Represents 7,883,506 shares of our common stock owned by Rexnord Acquisition Holdings I, LLC (“Rexnord I”) and 7,143,771 shares of our common stock owned by Rexnord Acquisition Holdings II, |
100
Management GP, LLC (“Management GP”) is the general partner of Apollo Management. Apollo Management Holdings, L.P. (“Management Holdings”) is the sole member and manager of Management |
|
Leon Black, Joshua Harris and Marc Rowan effectively have the power to exercise voting and investment control over Apollo Management, with respect to the shares held by the Apollo funds. Each of Messrs. Black, Harris and Rowan disclaim beneficial ownership of such shares.
| (2) | Includes 131,877 shares held by Mr. Sherman and 559,509 shares held by Cypress Industrial Holdings, LLC, over which Mr. Sherman has sole voting and dispositive power. Includes options to purchase |
| (3) |
| (4) | Represents options to purchase 9,000 shares held by Mr. Shapiro. |
| (5) | Includes 1,800 shares transferred by Mr. Moore to his children, over which Mr. Moore has sole voting power. |
| (6) | Includes options to purchase 101,221 shares held by Mr. |
| (7) | Represents options to purchase 10,000 shares held by Mr. |
| (8) | Represents options to purchase 10,000 shares held by Mr. |
| (9) | Represents options to purchase 10,000 shares held by Mr. |
| (10) |
| Represents options to purchase 10,000 shares held by Mr. |
| Each of |
| (12) | Represents options to purchase 1,500 shares held by Mr. Stroup. |
| (13) | Includes an aggregate of options to purchase 1,072,843 shares |
101
CERTAIN RELATIONSHIPS AND RELATED PARTY TRANSACTIONS
As a public company we will ensure that all material transactions with related parties are fair, reasonable and in our best interest. In this regard the audit committee charter shall provide that that committee will review all material transactions between us and related parties to determine that such transactions meet that standard. Management shall not cause the Company to enter into any new related-party transaction unless the audit committee approves that transaction.
Management Service Fees
We have a management services agreement with an affiliate of Apollo for advisory and consulting services related to corporate management, finance, product strategy, investment, acquisitions and other matters relating to our business. Under the terms of the agreement, which became effective July 22, 2006 (and was amended and restated on February 7, 2007), we incurred $3.0 million of costs in each of the years ended March 31, 2009, 2010, and 2011, plus out-of-pocket expenses in each period. This agreement will remain in effect until the twelfth anniversary of the date of the amended agreement (unless extended pursuant to the terms thereof), or such earlier time as we and Apollo or its affiliates may mutually agree. Upon the consummation of this offering, we and Apollo and its affiliates intend to terminate the management consulting agreement, and in connection with the termination Apollo or its affiliates will receive $ million from us.
Consulting Services
We have had a management consulting agreement (the “Cypress Agreement”) with Mr. George Sherman, our Chairman of the Board, and two entities controlled by Mr. Sherman, Cypress Group, LLC and Cypress Industrial Holdings, LLC (collectively, “Cypress”), since July 21, 2006. Effective February 7, 2007, the Cypress Agreement was amended and restated. The amended and restated agreement provides that Mr. Sherman has a right to serve as our Non-Executive Chairman of the Board. The amended and restated agreement also eliminated the annual consulting fees payable to Mr. Sherman and/or Cypress, but maintained provisions for the reimbursement of certain out-of-pocket expenses incurred in connection with performing the agreement. During fiscal 2009, 2010 and 2011, Mr. Sherman did not receive consulting fees under the Cypress Agreement; he did, however, receive fees in fiscal 2010 and 2011 for serving on our board of directors, including $250,000 annually for serving as Chairman of the Board. In addition, Mr. Sherman and Cypress also received non-qualified stock options in fiscal 2008 under the agreement. Options to purchase 130,743 shares of our common stock previously granted to Cypress in connection with the Cypress agreement were cancelled at Cypress’ request, in October 2009. See “Director Compensation” and Note 17 to our audited consolidated financial statements included elsewhere in this prospectus.
During the years ended March 31, 2009, 2010 and 2011, we paid fees of approximately $1.1 million, $0.7 million and $0.4 million, respectively, for consulting services provided by Next Level Partners, L.L.C. (“NLP”), an entity that is controlled by certain of our minority stockholders. NLP provided consulting services to us related primarily to lean manufacturing processes, consolidation and integration of operations, strategic planning and recruitment of managers and executives.
Stockholders’ Agreements
In connection with the consummation of the Apollo transaction, we entered into two separate stockholders’ agreements—one with Rexnord Acquisition Holdings I, LLC, Rexnord Acquisition Holdings II, LLC (together with Rexnord Acquisition Holdings I, LLC, the “Apollo Holders”) and certain other of our stockholders, and the other with the Apollo Holders, George M. Sherman and Cypress (collectively, the “Stockholders’ Agreements”). Pursuant to the Stockholders’ Agreements, (1) so long as the Apollo group owns any shares of our common stock it has the right to nominate a majority of our directors and (2) Mr. Sherman has the right to serve as a director
102
until he resigns as a director or ceases to serve under the consulting agreement with Cypress. All terms of the Stockholders’ Agreements (including the board nomination rights), will terminate upon the consummation of the offering contemplated hereby with the exception of the registration rights provisions described below.
Under the terms of the Stockholders’ Agreements, we have agreed to register shares of our common stock owned by affiliates of the Apollo Holders under the following circumstances:
Demand Registration Rights. At any time upon the written request from the Apollo Holders, we will use our best efforts to register as soon as possible, but in any event within 90 days, our restricted shares specified in such request for resale under the Securities Act, subject to customary cutbacks. The Apollo Holders have the right to make two such written requests in any 12-month period. We may defer a demand registration by up to 90 days if our board of directors determines it would be materially adverse to us to file a registration statement.
Piggyback Rights. If at any time we propose to register restricted shares under the Securities Act (other than on Form S-4 or Form S-8), prompt written notice of our intention shall be given to each stockholder. If within 15 days of delivery of such notice, stockholders elect to include in such registration statement any restricted shares such person holds, we will use our best efforts to register all such restricted shares. We will also include all such restricted shares in any demand registration or registration on Form S-3, subject to customary cutbacks.
Registrations on Form S-3. The Apollo Holders may request in writing an unlimited number of demand registrations on Form S-3 of its restricted shares. At any time upon the written request from the Apollo Holders, prompt written notice of the proposed registration shall be given to each stockholder. Within 15 days of delivery of such notice, the stockholders may elect to include in such registration statement any restricted shares such person holds, subject to customary cutbacks.
Holdback. In consideration of the foregoing registration rights, each stockholder has agreed not to transfer any restricted shares without our prior written consent for a period not to begin more than 10 days prior to the effectiveness of the registration statement pursuant to which any public offering shall be made and not to exceed 180 days following the consummation of this offering (or 90 days in the case of other public offerings).
Debt Transactions and Purchases of Debt Securities
From time to time, Apollo and our directors and executive officers have purchased debt securities from, or financed borrowings involving, us. The following paragraphs describe any such transactions that occurred during the last three fiscal years.
During fiscal 2010, Cypress, an entity controlled by Mr. Sherman, purchased approximately $2.1 million (approximately $2.5 million face value or 0.8% of the total commitment) of our senior subordinated notes due 2016.
During fiscal 2010, Mr. Adams, a director and our President and Chief Executive Officer, purchased approximately $0.1 million (approximately $0.1 million face value or 0.1% of the total commitment) of our senior subordinated notes due 2016.
During fiscal 2010, Mr. Jeyarajah, while he was an employee of Cypress and a director, purchased approximately $0.2 million (approximately $0.2 million face value or 0.1% of the total commitment) of our senior subordinated notes due 2016. In April 2010, Mr. Jeyarajah became our Executive Vice President—Corporate & Business Development and ceased his employment with Cypress.
103
During fiscal 2009, Cypress purchased approximately $0.5 million (approximately $0.6 million face value or 0.2% of the total commitment) of our senior subordinated notes due 2016.
During fiscal 2009, Mr. Sherman purchased approximately $2.0 million (approximately $3.0 million face value or 0.6% of the total commitment) of our PIK toggle senior indebtedness.
During fiscal 2009, Mr. Jeyarajah purchased approximately $0.2 million (approximately $0.3 million face value or 0.1% of the total commitment) of our senior subordinated notes due 2016.
During fiscal 2009, Mr. Moore, our Executive Vice President, purchased approximately $0.3 million (approximately $0.4 million face value or 0.1% of the total commitment) of our senior subordinated debt due 2016.
Other
Our engineering and sourcing center in Zhuhai, China has an agreement with Bath Acquisition Corp. (“Bath”) (the former bath segment of Jacuzzi Brands, Inc., which was subsequently purchased by an Apollo affiliate) to perform certain sourcing, engineering and product development services that are reimbursed based on the actual costs we incur. We earned $0.4 million, $0.2 million and $0.1 million during fiscal 2009, 2010 and 2011, respectively, for services rendered under this agreement. At March 31, 2011, we had an outstanding receivable from Bath in the amount of $0.1 million.
Further, in connection with the Zurn acquisition, we, through one or more of our subsidiaries, incurred certain payroll and administrative costs on behalf of Bath and received during the year ended March 31, 2009 approximately $0.9 million of reimbursements from Bath. As of March 31, 2009, we had fully transitioned the payment of these costs to Bath and have been fully reimbursed for all costs incurred on its behalf.
104
Upon completion of the offering, our authorized capital stock will consist of shares of common stock, the rights and preferences of which may be designated by the board of directors. As of , 2008,2011, there were shares of common stock issued and outstanding and no shares of preferred stock issued and outstanding. As of , 2008,2011, there were holders of record of our common stock.
The discussion below describes the most important terms of our capital stock, certificate of incorporation and bylaws as will be in effect upon completion of this offering. Because it is only a summary, it does not contain all the information that may be important to you. For a complete description refer to our certificate of incorporation and bylaws, copies of which have been filed as exhibits to the registration statement of which the prospectus is a part.
Common Stock
Voting Rights.The holders of our common stock arewill be entitled to one vote per share on all matters submitted for action by the shareholders.stockholders. There iswill be no provision for cumulative voting with respect to the election of directors. Accordingly, a holder of more than 50% of the shares of our common stock can,will be able to, if it so chooses, elect all of our directors. In that event, the holders of the remaining shares will not be able to elect any directors. Under the Delaware General Corporation Law, amendments to our certificate of incorporation that would alter or change the powers, preferences or special rights of the common stock so as to affect them adversely also must be approved by a majority of the votes entitled to be cast by the holders of the shares affected by the amendment.
Dividend Rights.All shares of our common stock arewill be entitled to share equally in any dividends our board of directors may declare from legally available sources, subject to the terms of any outstanding preferred stock. Our credit agreement imposesand other debt instruments impose restrictions on our ability to declare dividends with respect to our common stock.
Liquidation Rights.Upon liquidation or dissolution of our company, whether voluntary or involuntary, all shares of our common stock arewill be entitled to share equally in the assets available for distribution to shareholdersstockholders after payment of all of our prior obligations, including any then-outstanding preferred stock.
Registration Rights.Under the terms of the Stockholders’ Agreements, we have agreed to register shares of our common stock owned by affiliates of Apollo under certain circumstances. See “Certain Relationships and Related Party Transactions—Stockholders’ Agreements” for more detail regarding these registration rights.
Other Matters.The holders of our common stock will have no preemptive or conversion rights, and our common stock iswill not be subject to further calls or assessments by us. There are no redemption or sinking fund provisions applicable to our common stock.
Preferred Stock
Our board of directors, without further stockholder approval, will be able to issue, from time to time, up to an aggregate of shares of preferred stock in one or more series and to fix or alter the designations, preferences, rights and any qualifications, limitations or restrictions of the shares of each such series thereof, including the dividend rights, dividend rates, conversion rights, voting rights, terms of redemption (including sinking fund provisions), redemption prices, liquidation preferences and the number of shares constituting any series or designations of such series. Our board of directors may authorize the issuance of preferred stock with voting or conversion rights that could adversely affect the voting power or other rights of the holders of common stock. The issuance of preferred stock, while providing flexibility in connection with possible future financings and acquisitions and other corporate purposes could, under certain circumstances, have the effect of delaying, deferring or preventing a change in control of us might harm the market price of our common stock. See “—Certain Anti-Takeover, Limited Liability and Indemnification Provisions.”
105
Certain Anti-Takeover, Limited Liability and Indemnification Provisions
We are governed by the Delaware General Corporation Law (the “DGCL”). Our certificate of incorporation and bylaws will contain provisions that could make more difficult the acquisition of us by means of a tender offer, a proxy contest or otherwise, or to remove or place our current management.
Requirements for Advance Notification“Blank Check” Preferred Stock. Our certificate of Stockholder Nominationsincorporation will authorize the issuance of “blank check” preferred stock that could be issued by our board of directors to increase the number of outstanding shares or establish a stockholders rights plan making a takeover more difficult and Proposals.expensive.
Classified Board. Our bylaws establish advance notice proceduresboard of directors will be divided into three classes. The members of each class will serve staggered, three-year terms (other than with respect to the initial terms of the Class I and Class II directors, which will be one and two years, respectively). Upon the expiration of the term of a class of directors, directors in that class will be elected for three-year terms at the annual meeting of stockholders in the year in which their term expires. See “Management—Board of Directors.”
Removal of Directors; Vacancies. Our stockholders will be able to remove directors only for cause and only by the affirmative vote of the holders of a majority of the outstanding shares of our capital stock entitled to vote in the election of directors. Vacancies on our board of directors may be filled only by a majority of our board of directors.
No Cumulative Voting. Our certificate of incorporation will provide that stockholders do not have the right to cumulative votes in the election of directors.
No Stockholder Action by Written Consent; Calling of Special Meetings of Stockholders.Our bylaws will not permit stockholder proposalsaction without a meeting by consent if less than 50.1% of our outstanding common stock is owned by affiliates of Apollo. They also will provide that special meetings of our stockholders may be called only by our board of directors or the chairman of the board of directors.
Advance Notice Requirements for Stockholder Proposals and the nominationDirector Nominations.Our bylaws will provide that stockholders seeking to bring business before an annual meeting of stockholders, or to nominate candidates for election as directors otherat an annual meeting of stockholders, must provide timely notice thereof in writing. To be timely, a stockholder’s notice generally must be delivered to and received at our principal executive offices, not less than 90 days nor more than 120 days prior to the first anniversary of the preceding year’s annual meeting; provided, that in the event that the date of such meeting is advanced more than 30 days prior to, or delayed by more than 30 days after, the anniversary of the preceding year’s annual meeting of our stockholders, a stockholder’s notice to be timely must be so delivered not earlier than the close of business on the 120th day prior to such meeting and not later than the close of business on the later of the 90th day prior to such meeting or the 10th day following the day on which public announcement of the date of such meeting is first made. Our bylaws also specify certain requirements as to the form and content of a stockholder’s notice. These provisions may preclude stockholders from bringing matters before an annual meeting of stockholders or from making nominations made byfor directors at an annual meeting of stockholders.
Board of Directors.If Apollo or atits affiliates beneficially own more than a majority of our common stock, Apollo will have the direction ofright to require the board of directors or one of its committees.to be expanded and to nominate directors to fill these vacant seats.
Delaware Anti-Takeover Law.Business Combinations. We are a Delaware corporation subject to Section 203Until such time as Apollo no longer beneficially owns at least 33 1/3% of the Delaware General Corporation Law. Under Section 203, certain “business combinations” between a Delaware corporation whosetotal number of shares of our common stock generally is publicly traded stockholders and an “interested stockholder” are prohibited for a three-year period following the date that such stockholder became an interested stockholder, unless:
the corporation has elected in its certificate of incorporation not to be governed by Section 203, which we have elected;
the business combination or the transaction which resulted in the stockholder becoming an interested stockholder was approved by the board of directors of the corporation before such stockholder became an interested stockholder;
upon consummation of the transaction that made such stockholder an interested stockholder, the interested stockholder owned at least 85% of the voting stock of the corporation outstanding at the commencement of the transaction excluding voting stock owned by directors who are also officers or held in employee benefit plans in which the employees do not have a confidential right to tender stock held by the plan in a tender or exchange offer; or
the business combination is approved by the board of directors of the corporation and authorized at a meeting by two-thirds of the voting stock which the interested stockholder did not own.
The three-year prohibition also does not apply to some business combinations proposed by an interested stockholder following the announcement or notification of an extraordinary transaction involving the corporation and a person who had not been an interested stockholder during the previous three years or who became an interested stockholder withany time, the approval of a majority of the corporation’s directors. The term “business combination” is defined generally tomembers of our Board of Directors, which must include mergers or consolidations between a Delaware corporation and an interested stockholder, transactions with an interested stockholder involving the assets or stockapproval of the corporationmajority of the directors affiliated with Apollo, will be required for a consolidation or its majority-owned subsidiaries,merger with or into any other entity, or transfer (by lease, assignment, sale or otherwise) of all or substantially all of our assets to another entity and transactionsother business combinations.
106
Delaware Takeover Statute. Our certificate of incorporation provides that we are not governed by Section 203 of the DGCL which, increase an interested stockholder’s percentage ownershipin the absence of stock. Delaware law defines “interested stockholder” as those stockholders who become beneficial owners of 15% or more of a Delaware corporation’s voting stock, together with the affiliates or associates of that stockholder.such provisions, would have imposed additional requirements regarding mergers and other business combinations.
Limitation of Officer and Director Liability and Indemnification Arrangements.Our certificate limits the liability of our officers and directors to the maximum extent permitted by Delaware law. Delaware law provides that directors will not be personally liable for monetary damages for breach of their fiduciary duties as directors, except liability for:
any breach of their duty of loyalty to the corporation or its stockholders;
acts or omissions not in good faith or which involve intentional misconduct or a knowing violation of law;
unlawful payments of dividends or unlawful stock repurchases or redemptions; or
any transaction from which the director derived an improper personal benefit.
This charter provision has no effect on any non-monetary remedies that may be available to us or our stockholders, nor does it relieve us or our officers or directors from compliance with federal or state securities laws. The certificate also generally provides that we shall indemnify, to the fullest extent permitted by law, any person who was or is a party or is threatened to be made a party to any threatened, pending or completed action, suit, investigation, administrative hearing or any other proceeding by reason of the fact that he is or was a director or officer of ours, or is or was serving at our request as a director, officer, employee or agent of another entity, against expenses incurred by him in connection with such proceeding. An officer or director shall not be entitled to indemnification by us if:
the officer or director did not act in good faith and in a manner reasonably believed to be in, or not opposed to, our best interests; or
with respect to any criminal action or proceeding, the officer or director had reasonable cause to believe his conduct was unlawful.
TheseWe currently maintain liability insurance for our directors and officers. In addition, certain of our directors are also insured under Apollo’s professional liability insurance policies and may be indemnified under Apollo’s bylaws or other constitutive documents.
Our charter and bylaw provisions and provisions of Delaware law may have the effect of delaying, deterring or preventing a change of control of RBS Global.Rexnord Corporation.
As permitted by the DGCL, our certificate of incorporation and bylaws provide that:
we will indemnify our current and former directors and officers and anyone who is or was serving at our request as the director or officer of, or our legal representative in, another entity, and may indemnify our current or former employees and other agents, to the fullest extent permitted by the DGCL, subject to limited exceptions; and
we may purchase and maintain insurance on behalf of our current or former directors, officers, employees or agents against any liability asserted against them and incurred by them in any such capacity, or arising out of their status as such.
Our certificate of incorporation will require us to advance expenses to our directors and officers in connection with a legal proceeding, subject to receiving an undertaking from such director or officer to repay advanced amounts if it is determined he or she is not entitled to indemnification. Our bylaws will provide that we may advance expenses to our employees and other agents, upon such terms and conditions, if any, as we deem appropriate.
107
We intend to enter into separate indemnification agreements with each of our directors and officers, which may be broader than the specific indemnification provisions contained in the DGCL. These indemnification agreements may require us, among other things, to indemnify our directors and officers against liabilities that may arise by reason of their status or service as directors or officers, other than liabilities arising from willful misconduct. These indemnification agreements may also require us to advance any expenses incurred by the directors or officers as a result of any proceeding against them as to which they could be indemnified and to obtain directors’ and officers’ insurance, if available on reasonable terms.
Currently, to our knowledge, there is no pending litigation or proceeding involving any of our directors, officers, employees or agents in which indemnification by us is sought, nor are we aware of any threatened litigation or proceeding that may result in a claim for indemnification.
Insofar as indemnification for liabilities arising under the Securities Act may be permitted for our directors, officers and controlling persons under the foregoing provisions or otherwise, we have been informed that, in the opinion of the SEC, such indemnification is against public policy as expressed in the Securities Act and is, therefore, unenforceable.
Transfer Agent and Registrar
American Stock Transfer & Trust Company, LLC is the transfer agent and registrar for our common stock.
Listing
We will apply to list the common stock on the New York Stock Exchange under the symbol “RXN.”
108
We are a holding company and have no material direct obligations outstanding as of March 31, 2011 except the approximately $546.0$93.6 million of aggregate principal amount of PIK toggle senior indebtedness due 2013 outstanding, asall of September 2, 2008 (See “Management’s Discussion and Analysiswhich is expected to be extinguished in the first quarter of Financial Condition and Results of Operations—Rexnord Holdings Indebtedness”). The net proceeds from the indebtedness under the credit agreement were used to fund a special dividend to our stockholders. We intend to repay this indebtedness in full with a portion of the proceeds from this offering.fiscal 2012. Our principal operating subsidiaries, RBS Global and Rexnord LLC, also have substantial obligations. We summarize below the principal terms of the agreements that govern certain of our existing indebtedness. This summary is not a complete description of all of the terms of the agreements and we urge you to read the entirety of the agreements whichthat govern our indebtedness because it is those agreements in their entirety and not these summaries that govern our indebtedness.
Rexnord Corporation PIK Toggle Senior Indebtedness Due 2013
On March 2, 2007, we entered into a Credit Agreement (the “PIK Loan Credit Agreement”) with various lenders, which provided $449.8 million ($459.0 million of debt financing, net of a $9.2 million original issue discount) that was primarily used to pay a distribution to stockholders as well as to holders of fully vested rollover options. The PIK Toggle Loans issued pursuant to the PIK Loan Credit Agreement were due March 1, 2013 and bore interest at a floating rate equal to adjusted LIBOR (the interest rate per annum equal to the product of (a) the LIBOR in effect and (b) Statutory Reserves) plus 7.0%. At March 31, 2011, $53.7 million in principal amount of PIK Toggle Loans remained outstanding; those loans were repaid in full on May 13, 2011.
In fiscal 2009, $460.8 million of the then-outstanding PIK Toggle Loans were exchanged for PIK toggle senior notes due 2013 (the “PIK Toggle Notes”), which are governed by the terms and conditions of an indenture between Rexnord Corporation and Wells Fargo Bank, N.A, as trustee. The terms of the PIK Toggle Notes were substantially the same as the terms of the PIK Toggle Loans in all material respects (including their maturity, variable interest rates and our ability to make certain interest payments in kind, which we refer to as “PIK Interest,” rather than in cash), except that (1) interest on the PIK Toggle was payable semi-annually (generally at the three month LIBOR in effect for the interest period plus 7.0% per annum) while interest on the PIK Toggle Loans was payable quarterly (also generally at the three month LIBOR in effect for the interest period plus 7.0% per annum), (2) the PIK Toggle Notes were issued pursuant to the indenture, (3) a change of control was not an event of default under the PIK Toggle Notes but instead required us to make an offer to purchase the PIK Toggle Notes at a price of 101% of their principal amount plus accrued and unpaid interest, and (4) certain other provisions have been adjusted as required or permitted by the PIK Loan Credit Agreement. There was $39.9 million in principal amount of PIK Toggle Notes outstanding at March 31, 2011; we have commenced procedures to redeem these PIK Toggle Notes at face value in June 2011. We refer collectively to the PIK Toggle Loans and the PIK Toggle Notes as the PIK toggle senior indebtedness.
Senior Secured Credit Facilities
On October 5, 2009, RBS Global and Rexnord LLC are co-borrowers under certainentered into an Amended and Restated Credit Agreement amending and restating their credit agreement dated as of July 21, 2006. The senior secured credit facilities withare funded by a syndicate of banks and other financial institutions and provide for loans of up to $960.0 million, consisting of:
of (i) a $810.0 million term loan facility (consisting of B1 and B2 tranches) with a maturity date of July 19, 2013, all of which has been drawn and of which $767.5$761.5 million was outstanding at March 31, 2008;2011; and
(ii) a $150.0 million revolving credit facility with a maturity date of July 20, 2012 and borrowing capacity available for letters of credit and for borrowings on a same-day notice referred(referred to as swingline loans, noneloans), of which $28.3 million was outstanding at June 28, 2008 (other than $29.2 millionconsidered utilized in connection with outstanding letters of credit).credit at March 31, 2011.
The senior secured credit facilities, among other things: (i) allow for one or more future issuances of secured notes, which may include, in each case, indebtedness secured on a pari passu basis with the obligations under the senior secured credit facilities, so long as, in each case, among other things, an agreed amount of the net cash
109
proceeds from any such issuance are used to prepay term loans under the senior secured credit facilities at par; (ii) subject to the requirement to make such offers on a pro rata basis to all lenders, allow RBS Global and Rexnord LLC to agree with individual lenders to extend the maturity of their terms loans or revolving commitments, and/or to pay increased interest rates or otherwise modify the terms of their loans or revolving commitments in connection with such an extension; and (iii) allow for one or more future issuances of additional secured notes, which may include, in each case, indebtedness secured on a pari passu basis with the obligations under the senior secured credit facilities, in an amount not to exceed the amount of incremental facility availability under the senior secured credit facilities.
Interest Rate and Fees.The borrowings under the senior secured credit facilities bear interest at a rate equal to an applicable margin plus, at our option, either (a) a base rate determined by reference to the higher of (1) the federal funds effective rate plus 1/2 of 1% and (2) the prime rate determined from time to time by Credit Suisse or (b) a Eurocurrency rate determined by reference to an interest rate per annual equal to (x) the primeLIBO rate published by Bloomberg professional service page prime, and (2) the Federal funds rate plus 1/2 of 1% or (b)in effect for a eurocurrency rate determined by reference to the costs of funds for eurocurrency deposits for thegiven interest period relevantdivided by (y) one minus a statutory reserve applicable to such borrowing adjusted for certain additional costs.borrowing. The applicable margins for such borrowings are determined by reference to our senior secured leverage ratio as in effect from time to time, except that the applicable margin for our B1 tranche is determined by reference to our corporate credit ratings from time to time. The weighted average interest rate of the outstanding term loans at March 31, 20082011 was 6.26% per annum.3.67%.
In addition to paying interest on outstanding principal under the senior secured credit facilities, our subsidiariesRBS Global and Rexnord LLC are required to pay a commitment fee to the lenders under the revolving credit facility in respect of the unutilized commitments thereunder at a rate equal to 0.50% per annum (subject to reduction upon attainment and maintenance of a certain senior secured leverage ratio)ratios). Our subsidiariesRBS Global and Rexnord LLC also pay customary letter of credit and agency fees.
Prepayments.Prepayments. The senior secured credit facilities require our subsidiariesRBS Global and Rexnord LLC to prepay outstanding term loans, subject to certain exceptions, with:
50% (which percentage may be reduced to 25% or zero upon the achievement and maintenance of certain senior secured leverage ratios) of excess cash flow (as defined in the credit agreement);
100%, or, in certain cases, 90% (which percentagepercentages may be reduced to zero upon the achievement of a certain senior secured leverage ratio) of the net cash proceeds of certain incurrences of debt; and
100% (which percentage may be reduced to zero upon the achievement of a certain senior secured leverage ratio) of the net cash proceeds of most non-ordinary course asset sales and casualty and condemnation events, if we do not reinvest or commit to reinvest those proceeds in assets to be used in our business or to make certain other permitted investments within 15 months (and, if so committed, in the event that such contract has been terminated), subject to certain limitations.
��As of March 31, 2011, the remaining mandatory principal payments prior to maturity on the term loan B1 and B2 facilities are $1.2 million and $4.5 million, respectively. Our subsidiaries have fulfilled all mandatory principal payments prior to maturity on the B1 facility through March 31, 2013. Principal payments of $0.5 million are scheduled to be made at the end of each quarter until June 30, 2013 on the B2 facility.
116
We may voluntarily repay outstanding loans under the senior secured credit facilities at any time without premium or penalty, other than customary “breakage” costs with respect to eurocurrencyEurocurrency loans.
Amortization.Amortization. During the fiscal year ended March 31, 2011, we made four quarterly principal payments on the B2 facility of $0.5 million at the end of each quarter. Principal payments of $0.5 million are scheduled to be made at the end of each quarter until June 30, 2013 on the B2 facility. The existing term loan amortizes each year in an amount equalonly scheduled principal payment on the B1 facility prior to 1% per annum in equal quarterly installments formaturity is a $1.175 million payment due on June 30, 2013. All amounts remaining under both the first six yearsB1 facility and nine months, with the remaining amountB2 facility will be due and payable on July 19, 2013. As of March 31, 2008,2011, the remaining scheduled amortization payments on the B2 facility prior to maturity total $11.7$4.5 million.
110
All amounts outstanding under the revolving credit facility will be due and payable in full, and the commitments thereunder will terminate, on July 20, 2012.
Guarantee and Security.All obligations under the subsidiaries’ senior secured credit facilities are unconditionally guaranteed by Chase Acquisition I, Inc. (prior to an initial public offering of Chase Acquisition I, Inc.’s common stock) and, subject to certain exceptions, each of RBS Global’s existing and future direct and indirect domestic subsidiaries, which we refer to collectively as “U.S. Guarantors.”
All obligations under the senior secured credit facilities, and the guarantees of those obligations (as well as certain interest-hedging or other swap agreements) are secured by substantially all of the assets of RBS Global’s assetsGlobal and its consolidated subsidiaries as well as those of Chase Acquisition I, Inc. and each U.S. Guarantor, including, but not limited to, the following and subject to certain exceptions:
a pledge of all of RBS Global’s equity interests of RBS Global and its consolidated subsidiaries by Chase Acquisition I, Inc., a pledge of 100% of the equity interests of all U.S. Guarantors and a pledge of 65% of the voting equity interests of certain of RBS Global’s foreign subsidiaries; and
a first priority security interest in substantially all of RBS Global’sthe tangible and intangible assets of RBS Global and its consolidated subsidiaries, as well as those of Chase Acquisition I, Inc. and each U.S. Guarantor.
Certain Covenants and Events of Default.Default. The senior secured credit facilities contain a number of covenants that, among other things, restrict, subject to certain exceptions, RBS Global’s ability, and the ability of its subsidiaries, to:
sell assets;
incur additional indebtedness;
repay other indebtedness;
pay dividends and distributions or repurchase its capital stock;
make payments, redemptions or repurchases in respect of subordinated debt (including the 2016 senior subordinated notes);
create liens on assets;
make investments, loans, guarantees or advances;
make certain acquisitions;
engage in certain mergers or consolidations;
enter into sale-and-leaseback transactions;
engage in certain transactions with affiliates;
amend certain material agreements governing its indebtedness;
make capital expenditures;
enter into hedging agreements;
amend its organizational documents;
change the business conducted by it and its subsidiaries; and
enter into agreements that restrict dividends from subsidiaries.
In addition, the revolving credit facility requires RBS Global and its consolidated subsidiaries to maintain a maximum consolidated senior secured bank leverage ratio. The senior secured credit facilities also contain certain customary affirmative covenants and events of default.
Senior Notes Due 2014
On July 21, 2006, RBS Global and Rexnord LLC, as joint obligors, issued $485.0 million in aggregate principal amount of the initial 2014 notes, and on February 7, 2007 they issued the additional 2014 notes in aggregate principal amount of $310.0 million. The 2014 notes are RBS Global’s unsecured, senior obligations and are guaranteed on an unsecured, senior basis by each of the subsidiaries of Rexnord LLC that guarantees RBS Global’s senior secured credit facilities, the 2016 senior notes and its senior subordinated notes. The 2014 notes will mature on August 1, 2014.
The 2014 notes bear interest at a rate of 9 1/2% per annum, payable on each February 1 and August 1, commencing February 1, 2007. Upon the occurrence of a change of control, RBS Global will be required to offer to repurchase all of the 2014 notes at 101% of the principal amount thereto.
On or after August 1, 2011, RBS Global may redeem the 2014 notes at its option, in whole at any time or in part from time to time, at the following redemption prices (expressed as a percentage of principal amount), plus accrued and unpaid interest and additional interest, if any, to the redemption date, if redeemed during the 12-month period commencing on August 1 of the years set forth below:
Period | Redemption Price | ||
2010 | 104.750 | % | |
2011 | 102.375 | % | |
2012 and thereafter | 100.000 | % |
In addition, prior to August 1, 2010, the 2014 notes may be redeemed at our option, in whole at any time or in part from time to time, upon not less than 30 nor more than 60 days’ prior notice mailed by first-class mail to each holder’s registered address, at a redemption price equal to 100% of the principal amount of the 2014 notes redeemed plus a “make whole” premium as of, and accrued and unpaid interest and additional interest, if any, to, the applicable redemption date.111
Notwithstanding the foregoing, at any time and from time to time on or prior to August 1, 2009, we may redeem in the aggregate up to 35% of the original aggregate principal amount of the initial and additional 2014 notes with the net cash proceeds of one or more equity offerings (1) by RBS Global or (2) by any direct or indirect parent of RBS Global, including by the Company with proceeds from this offering, at a redemption price (expressed as a percentage of principal amount thereof) of 109.500%, plus accrued and unpaid interest and additional interest, if any, to the redemption date.
The 2014 note indenture allows RBS Global to incur all permitted indebtedness (as defined therein) without restriction, which includes all amounts borrowed under the senior secured credit facilities. The indenture also allows them to incur additional debt as long they can satisfy the coverage ratio of the indenture after giving effect thereto on a pro forma basis.
The 2014 note indenture also contains covenants limiting dividends, investments, purchases or redemptions of stock, transactions with affiliates and mergers and sales of assets, and require RBS Global and Rexnord LLC to make an offer to purchase such notes upon the occurrence of a change in control, as defined in the 2014 note indenture. These covenants are subject to a number of important qualifications. The 2014 note indenture does not impose any limitation on the incurrence by RBS Global of liabilities that are not considered “indebtedness” under the 2014 note indenture, such as certain sale/leaseback transactions; nor does the 2014 note indenture impose any limitation on the amount of liabilities incurred by RBS Global’s subsidiaries, if any, that might be designated as “unrestricted subsidiaries” (as defined in the 2014 note indenture).
Senior Notes Due 2016
On February 7, 2007, RBS Global and Rexnord LLC, as joint obligors, issued $150.0 million in aggregate principal amount of the 8 7/8% senior notes due 2016. The 2016 senior notes are RBS Global’s unsecured, senior obligations and are guaranteed on an unsecured, senior basis by each of the subsidiaries of Rexnord LLC that guarantees RBS Global’s senior secured credit facilities, the 2014 notes and its senior subordinated notes. The 2016 senior notes will mature on September 1, 2016. The 2016 senior notes bear interest at a rate of 8 7/8% per annum, payable on each March 1 and September 1, commencing September 1, 2007. Upon the occurrence of a change of control, RBS Global will be required to offer to repurchase all of the 2016 senior notes at 101% of the principal amount thereto. On or after August 1, 2011, RBS Global may redeem the 2016 senior notes at its option, in whole at any time or in part from time to time, at the following redemption prices (expressed as a percentage of principal amount), plus accrued and unpaid interest and additional interest, if any, to the redemption date, if redeemed during the 12-month period commencing on August 1 of the years set forth below:
Period | Redemption Price | ||
2011 | 104.438 | % | |
2012 | 102.219 | % | |
2013 and thereafter | 100.000 | % |
In addition, prior to August 1, 2011, the 2016 senior notes may be redeemed at our option, in whole at any time or in part from time to time, upon not less than 30 nor more than 60 days’ prior notice mailed by first-class mail to each holder’s registered address, at a redemption price equal to 100% of the principal amount of the 2016 senior notes redeemed plus a “make whole” premium as of, and accrued and unpaid interest and additional interest, if any, to, the applicable redemption date.
Notwithstanding the foregoing, at any time and from time to time on or prior to August 1, 2011, we may redeem in the aggregate up to 35% of the original aggregate principal amount of the initial and additional 2016 senior notes with the net cash proceeds of one or more equity offerings (1) by RBS Global or (2) by any direct or indirect parent of RBS Global, including by the Company with proceeds from this offering, at a redemption price (expressed as a percentage of principal amount thereof) of 108.875%, plus accrued and unpaid interest and additional interest, if any, to the redemption date.
The 2016 senior notes indenture allows RBS Global to incur all permitted indebtedness (as defined therein) without restriction, which includes all amounts borrowed under the senior secured credit facilities. The indenture also allows them to incur additional debt as long they can satisfy the coverage ratio of the indenture after giving effect thereto on a pro forma basis.
The 2016 senior note indenture also contains covenants limiting dividends, investments, purchases or redemptions of stock, transactions with affiliates and mergers and sales of assets, and require RBS Global and Rexnord LLC to make an offer to purchase such notes upon the occurrence of a change in control, as defined in the 2016 senior note indenture. These covenants are subject to a number of important qualifications. The 2016 senior note indenture does not impose any limitation on the incurrence by RBS Global of liabilities that are not considered “indebtedness” under the 2016 senior note indenture, such as certain sale/leaseback transactions; nor does the 2016 senior note indenture impose any limitation on the amount of liabilities incurred by RBS Global’s subsidiaries, if any, that might be designated as “unrestricted subsidiaries” (as defined in the 2016 senior note indenture).
Senior Subordinated Notes Due 2016
On July 21, 2006, RBS Global and Rexnord LLC, as joint obligors, also issued $300.0 million in aggregate principal amount of senior subordinated notes. notes (referred to as the “2016 senior subordinated notes”), all of which was outstanding as of March 31, 2011.
The 2016 senior subordinated notes are unsecured, senior subordinated obligations and are guaranteed on an unsecured, senior subordinated basis by each of the subsidiaries of Rexnord
LLCRBS Global that guarantees its senior secured credit facilities, the 2014its 8.875% senior notes due 2016 and theits 8.50% senior notes due 2018. The 2016 senior notes. The senior subordinated notes will mature on August 1, 2016.
The 2016 senior subordinated notes bear interest at a rate of 11 3/4%11.75% per annum, payable on each February 1 and August 1, commencing February 1, 2007. Upon the occurrence of a change of control, RBS Global will be required to offer to repurchase all of the senior subordinated notes at 101% of the principal amount thereto.1.
On or after August 1, 2011, weRBS Global and Rexnord LLC may redeem the 2016 senior subordinated notes at ourtheir option, in whole at any time or in part from time to time, at the following redemption prices (expressed as a percentage of principal amount), plus accrued and unpaid interest and additional interest, if any, to the redemption date, if redeemed during the 12-month period commencing on August 1 of the years set forth below:
Period | Redemption Price | |||
2011 | 105.875 | % | ||
2012 | 103.917 | % | ||
2013 | 101.958 | % | ||
2014 and thereafter | 100.000 | % | ||
In addition, prior to August 1, 2011, weRBS Global may redeem the 2016 senior subordinated notes at its option, in whole at any time or in part from time to time, upon not less than 30 nor more than 60 days’ prior notice mailed by first-class mail to each holder’s registered address, at a redemption price equal to 100% of the principal amount of the 2016 senior subordinated notes redeemed plus a “make whole” premium as of, and accrued and unpaid interest and additional interest, if any, to, the applicable redemption date.
Notwithstanding the foregoing, at any time and from time to time on or prior to August 1, 2009, we may redeem in the aggregate up to 35% of the original aggregate principal amount of the senior subordinated notes with the net cash proceeds of one or more equity offerings (1) by RBS Global or (2) by any direct or indirect parent of RBS Global, including by the Company with proceeds from this offering, at a redemption price (expressed as a percentage of principal amount thereof) of 111.750%, plus accrued and unpaid interest and additional interest, if any, to the redemption date.
The senior subordinated note indenture allows RBS Global and Rexnord LLC to incur allcertain permitted indebtedness (as definedset forth therein) without restriction,, which includes all amounts borrowed under thetheir senior secured credit facilities.facilities, in an amount not to exceed $805.0 million. The indenture also allows themRBS Global and Rexnord LLC to incur additional debt as long they can satisfy the fixed charge coverage ratio of the senior subordinated note indenture after giving effect thereto on a pro forma basis.
The senior subordinated note indenture also contains covenants limiting dividends, investments, purchases or redemptions of stock, transactions with affiliates and mergers and sales of assets, and requires RBS Global and Rexnord LLC to make an offer to purchase such notes at 101% of the principal amount thereto upon the occurrence of a change in control, as defined in the senior subordinated note indenture.indenture, and upon the occurrence of certain asset sales. These covenants are subject to a number of important qualifications. The senior subordinated note indenture does not impose any limitation on the incurrence by RBS Global and Rexnord LLC of liabilities that are not considered “indebtedness” under the senior subordinated note indenture, such as certain sale/leaseback transactions; nor does the senior subordinated note indenture impose any limitation on the amount of liabilities incurred by RBS Global’sGlobal and Rexnord LLC subsidiaries, if any, that might be designated as “unrestricted subsidiaries” (as defined in the senior subordinated note indenture).
The Company intends to use a portion of the proceeds of this offering to redeem the 2016 senior subordinated notes.
112
AccountSenior Notes Due 2018
On April 28, 2010, RBS Global and Rexnord LLC, as joint obligors, issued $1,145.0 million in aggregate principal amount of senior notes (referred to as the “2018 notes”), all of which was outstanding as of March 31, 2011. The 2018 senior notes are unsecured, senior obligations and are guaranteed on an unsecured, senior basis by each of the subsidiaries of RBS Global that guarantees RBS Global’s senior secured credit facilities, the 8.875% senior notes due 2016, and the 2016 senior subordinated notes. The 2018 notes will mature on May 1, 2018.
The 2018 notes bear interest at a rate of 8.50% per annum, payable on each May 1 and November 1.
On or after May 1, 2014, RBS Global and Rexnord LLC may redeem the 2018 notes at their option, in whole at any time or in part from time to time, at the following redemption prices (expressed as a percentage of principal amount), plus accrued and unpaid interest and additional interest, if any, to the redemption date, if redeemed during the 12-month period commencing on May 1 of the years set forth below:
Period | Redemption Price | |||
2014 | 104.250 | % | ||
2015 | 102.125 | % | ||
2016 and thereafter | 100.000 | % | ||
In addition, prior to May 1, 2014, RBS Global and Rexnord LLC may redeem the 2018 notes at their option, in whole at any time or in part from time to time, upon not less than 30 or more than 60 days’ prior notice mailed by first-class mail to each holder’s registered address, at a redemption price equal to 100% of the principal amount of the 2018 notes redeemed plus a “make whole” premium as of, and accrued and unpaid interest and additional interest, if any, to, the applicable redemption date.
Notwithstanding the foregoing, at any time and from time to time on or prior to May 1, 2013, RBS Global and Rexnord LLC may redeem in the aggregate up to 35% of the original aggregate principal amount of the initial and additional 2018 notes with the net cash proceeds of one or more equity offerings (1) by RBS Global or Rexnord LLC or (2) by any direct or indirect parent of RBS Global or Rexnord LLC, at a redemption price (expressed as a percentage of principal amount thereof) of 108.500%, plus accrued and unpaid interest and additional interest, if any, to the redemption date.
The 2018 notes indenture allows RBS Global and Rexnord LLC to incur certain permitted indebtedness (as set forth therein) without restriction, which includes all amounts borrowed under the senior secured credit facilities up to an aggregate principal amount of $805 million plus an aggregate additional principal amount of secured indebtedness so long as they can satisfy the secured indebtedness leverage ratio of the indenture after giving effect thereto on a pro forma basis. The indenture also allows them to incur additional debt as long they can satisfy the fixed charge coverage ratio of the indenture after giving effect thereto on a pro forma basis.
The 2018 note indenture also contains covenants limiting dividends, investments, purchases or redemptions of stock, transactions with affiliates and mergers and sales of assets, and require RBS Global and Rexnord LLC to make an offer to purchase such notes at 101% of the principal amount thereto upon the occurrence of a change in control, as defined in the 2018 note indenture, and upon the occurrence of certain asset sales. These covenants are subject to a number of important qualifications. The 2018 note indenture does not impose any limitation on the incurrence by RBS Global of liabilities that are not considered “indebtedness” under the 2018 note indenture, such as certain sale/leaseback transactions; nor does the 2018 note indenture impose any limitation on the amount of liabilities incurred by RBS Global’s subsidiaries, if any, that might be designated as “unrestricted subsidiaries” (as defined in the 2018 note indenture).
113
Accounts Receivable Securitization Program
On September 26, 2007, RBS GlobalMay 20, 2011, we entered into an accounts receivable securitization programa five-year Amended and Restated Receivables Funding and Administration Agreement (the “AR Securitization Program” or“RFAA”) by and among Rexnord Funding LLC (“Funding,” a wholly-owned bankruptcy-remote special purpose subsidiary), the “Program”financial institutions from time to time party thereto, and General Electric Capital Corporation, as a lender, a swing line lender and administrative agent (“GECC”) whereby it. The RFAA, which amended and restated in its entirety a facility entered into in 2007, is the principal operative agreement under which certain subsidiaries continuously sellssell substantially all of itstheir domestic trade accounts receivable to a wholly-owned bankruptcy remote special purpose subsidiary ( the “SPV”)Funding for cash and
subordinated notes. The Receivables Sales and Servicing Agreement entered into between Rexnord Industries, LLC and the SPV provides for the purchase and servicing of such receivables. The SPVnotes (the “Program”). Funding in turn may obtain revolving loans and letters of credit from General Electric Capital Corporation (“GECC”) pursuant to a five year revolving loan agreement (the “Receivables Financing and Administration Agreement”).GECC under the RFAA. The maximum borrowing amount under the Receivables Financing and Administration AgreementRFAA is $100$100.0 million, subject to certain borrowing base limitationseligibility requirements related to the amount and type of receivables owned by Funding; the SPV.RFAA also contains an “accordion” provision pursuant to which Funding can request that the facility be increased by $75.0 million. All of the receivables purchased by the SPVFunding are pledged as collateral for revolving loans and letters of credit obtained from GECC under the Receivables Financing and Administration Agreement.RFAA.
The AR Securitization Program does not qualify for sale accounting under SFAS No. 140,ASC 860,Accounting for Transfers and Servicing of Financial Assets and Extinguishments of Liabilities (“ASC 860”), and as such, any borrowings are accounted for as secured borrowings on ourthe consolidated balance sheet. Financing costs associated with the Program will be recorded within “Interest expense, net” in ourthe consolidated statement of operations if revolving loans or letters of credit have beenare obtained under the Receivables Financing and Administration Agreement.RFAA.
Borrowings under the Receivables Financing and Administration AgreementRFAA bear interest at a rate equal to LIBOR plus an applicable margin, which at June 28, 2008 was 1.35%2.25%. Outstanding borrowings mature on May 20, 2016. In addition, a non-use fee of 0.30%0.50% is applied to the unutilized portion of the $100.0 million commitment. These rates are per annum and the fees are paid to GECC on a dailymonthly basis.
At June 28, 2008, RBS Global had no outstanding borrowingsMarch 31, 2011, our available borrowing capacity under the Program.Program was $97.9 million. Additionally, the Program requires compliance with certain covenants and performance ratios contained in the Receivables Financing and Administration Agreement.RFAA. As of June 28, 2008, RBS GlobalMarch 31, 2011, Funding was in compliance with all applicable covenants and performance ratios.
Other Indebtedness
At March 31, 2011, various other wholly owned subsidiaries had outstanding debt of $12.4 million, comprised primarily of borrowings at various foreign subsidiaries and capital lease obligations.
114
SHARES ELIGIBLE FOR FUTURE SALE
Prior to this offering, there has been no public market for our common stock, and no predictions can be made about the effect, if any, that market sales of shares of our common stock or the availability of such shares for sale will have on the market price prevailing from time to time. Nevertheless, the actual sale of, or the perceived potential for the sale of, our common stock in the public market may have an adverse effect on the market price for our common stock and could impair our ability to raise capital through future sales of our securities. See “Risk Factors—Risks Related to an Investment in Our Common Stock and This Offering—Future sales or the possibility of future sales of a substantial amount of our common stock may depress the price of shares of our common stock.”
Sale of Restricted Shares
Upon completion of this offering, we will have an aggregate of shares of our common stock outstanding, excluding shares reserved at , 20082011 for issuance upon exercise of options that have been granted under our stock option plans ( of which were exercisable at such date). Of these shares, the shares of our common stock to be sold in this offering will be freely tradable without restriction or further registration under the Securities Act, except for any shares which may be acquired by any of our “affiliates” as that term is defined in Rule 144 under the Securities Act, which will be subject to the resale limitations of Rule 144. The remaining shares of our common stock outstanding will be restricted securities, as that term is defined in Rule 144, and may in the future be sold without restriction under the Securities Act to the extent permitted by Rule 144 or any applicable exemption under the Securities Act.
Stock Option Plan
Following the completion of this offering, we intend to file a registration statement on Form S-8 under the Securities Act with the SEC to register shares of our common stock issued or reserved for issuance under our 2006 Stock Option Plan. As of the date of this prospectus, we have granted options to purchase shares of our common stock, of which shares are vested and exercisable. Subject to the expiration of any lock-up restrictions as described below and following the completion of any vesting periods, shares of our common stock issuable upon the exercise of options granted or to be granted under our plan will be freely tradable without restriction under the Securities Act, unless such shares are held by any of our affiliates.
Lock-up Agreements
Executive officers, directors and significant stockholders, including affiliates of Apollo, have agreed not to sell any shares of our common stock for a period of days from the date of this prospectus, subject to certain exceptions. See “Underwriting” for a description of these lock-up provisions.
Rule 144
In general, under Rule 144 under the Securities Act, a person (or persons whose shares are aggregated) who is not deemed to have been an affiliate of ours at any time during the three months preceding a sale, and who has beneficially owned restricted securities within the meaning of Rule 144 for at least six months (including any period of consecutive ownership of preceding non-affiliated holders) would be entitled to sell those shares, subject only to the availability of current public information about us. A non-affiliated person who has beneficially owned restricted securities within the meaning of Rule 144 for at least one year would be entitled to sell those shares without regard to the provisions of Rule 144.
A person (or persons whose shares are aggregated) who is deemed to be an affiliate of ours and who has beneficially owned restricted securities within the meaning of Rule 144 for at least six months would be entitled to sell within any three-month period a number of shares that does not exceed the greater of one percent of the
115
then outstanding shares of our common stock or the average weekly trading volume of our common stock reported through the New York Stock Exchange during the four calendar weeks preceding such sale. Such sales are also subject to certain manner of sale provisions, notice requirements and the availability of current public information about us.
Rule 701
In general, under Rule 701 of the Securities Act as currently in effect, any of our employees, consultants or advisors who purchases shares of our common stock from us in connection with a compensatory stock or option plan or other written agreement is eligible to resell those shares 90 days after the effective date of the offering in reliance on Rule 144, but without compliance with some of the restrictions, including the holding period, contained in Rule 144.
Registration Rights
Pursuant to the Stockholders’ Agreements, we have granted Apollo demand registration rights and we have granted Apollo and certain of our management stockholders incidental registration rights, in each case, with respect to certain shares of common stock owned by them. See “Certain Relationships and Related Party Transactions—Stockholders’ Agreements.”
116
MATERIAL UNITED STATES TAX CONSIDERATIONS FOR
NON-U.S. HOLDERS OF COMMON STOCK
The following is a general discussion of certain material U.S. federal income tax considerations with respect to the ownership and disposition of our common stock applicable to non-U.S. holders.holders (as defined below) who purchase our common stock pursuant to this offering. This discussion is based on current provisions of the Internal Revenue Code of 1986, as amended (the “Code”), existing and proposed U.S. Treasury regulations promulgated thereunder, and administrative rulings and court decisions in effect as of the date hereof, all of which are subject to change at any time, possibly with retroactive effect.
For the purposes of this discussion, the term “non-U.S. holder” means a beneficial owner of our common stock that is not for U.S. federal income tax purposes any of the following:
a citizen or resident of the United States;
a corporation, or other entity treated as a corporation for U.S. federal income tax purposes, or a partnership (or any entity treated as a partnership for U.S. federal income tax purposes), created or organized in or under the laws of the United States, any state thereof or the District of Columbia;
an estate, the income of which is includible in gross income for U.S. federal income tax purposes regardless of its source; or
a trust if (1) a court within the United States is able to exercise primary supervision over the administration of the trust and one or more U.S. persons have the authority to control all substantial decisions of the trust, or (2) it has a valid election in effect (the “Code”)under applicable U.S. Treasury regulations to be treated as a U.S. person.
It is assumed in this discussion that a non-U.S. holder holds shares of our common stock as a capital asset within the meaning of Section 1221 of the Code (generally, property held for investment) and does not hold our common stock in connection with the conduct of a trade or business in the United States. This discussion does not address all aspects of U.S. federal income taxation that may be important to a non-U.S. holder in light of such holder’s particular circumstances or that may be applicable to holders subject to special treatment under U.S. federal income tax laws (including, for example, financial institutions, dealers in securities, traders in securities that elect mark-to-market treatment, insurance companies, tax-exempt entities, holders who acquired our common stock pursuant to the exercise of employee stock options or otherwise as compensation, controlled foreign corporations, passive foreign investment companies, entities or arrangements treated as partnerships for U.S. federal income tax purposes, holders subject to the alternative minimum tax, certain former citizens or former long-term residents of the United States, and holders who hold our common stock as part of a hedge, straddle, constructive sale or conversion transaction). In addition, except to the extent provided below, this discussion does not address U.S. federal tax laws other than those pertaining to the U.S. federal income tax, nor does it address any aspects of U.S. state, local or non-U.S. taxes. Accordingly, prospective investors should consult with their own tax advisors regarding the U.S. federal, state, local, non-U.S. income and other tax considerations of acquiring, holding and disposing of shares of our common stock.
If an entity or arrangement treated as a partnership for U.S. federal income tax purposes holds shares of our common stock, the tax treatment of a partner generally will depend on the status of the partner and the activities of the partnership. Partnerships holding our common stock and partners in such partnerships are urged to consult their tax advisors as to the particular U.S. federal income tax consequences of acquiring, holding and disposing of our common stock.
THIS SUMMARY IS NOT INTENDED TO CONSTITUTE A COMPLETE DESCRIPTION OF ALL TAX CONSEQUENCES RELATING TO THE ACQUISITION, OWNERSHIP AND DISPOSITION OF OUR COMMON STOCK. HOLDERS OF OUR COMMON STOCK SHOULD CONSULT WITH THEIR TAX ADVISORS REGARDING THE TAX CONSEQUENCES TO THEM (INCLUDING THE APPLICATION AND EFFECT OF ANY STATE, LOCAL, NON-U.S. INCOME AND OTHER TAX LAWS) OF THE ACQUISITION, OWNERSHIP AND DISPOSITION OF OUR COMMON STOCK.
117
Information Reporting and Backup Withholding
Generally,As discussed above, we currently have no plans to pay regular dividends on our common stock. In the event that we do pay dividends, generally we must report annually to the Internal Revenue Service (the “IRS”) and to each non-U.S. holder the amount of dividends (if any) paid to, and the tax withheld with respect to, each non-U.S. holder. These reporting requirements apply regardless of whether withholding was reduced or eliminated. Copies of this information also may be made available under the provisions of a specific treaty or agreement with the tax authorities in the country in which the non-U.S. holder resides or is established.
U.S. backup withholding (currently at a rate of 28%) is imposed on certain payments to persons that fail to furnish the information required under the U.S. information reporting requirements. Dividends paid to a non-U.S. holder of our common stock generally will be exempt from backup withholding if the non-U.S. holder provides to us or our paying agent a properly executed IRS Form W-8BEN or W-8ECI (as applicable) or otherwise establishes an exemption.
Under U.S. Treasury regulations, the payment of proceeds from the disposition of our common stock by a non-U.S. holder effected at a U.S. office of a broker generally will be subject to information reporting and backup withholding, unless the beneficial owner, under penalties of perjury, certifies, among other things, its status as a non-U.S. holder or otherwise establishes an exemption. The payment of proceeds from the disposition of our common stock by a non-U.S. holder effected at a non-U.S. office of a broker generally will not be subject to backup withholding and information reporting, except as noted below. Inthat information reporting (but generally not backup withholding) may apply to payments if the case of proceeds from a disposition of our common stock by a non-U.S. holder effected at a non-U.S. office of a broker that is:
a U.S. person;
a “controlled foreign corporation” for U.S. federal income tax purposes;
a foreign person, 50% or more of whose gross income from certain periods is effectively connected with a U.S. trade or business; or
a foreign partnership if at any time during its tax year (a) one or more of its partners are U.S. persons who, in the aggregate, hold more than 50% of the income or capital interests of the partnership or (b) the foreign partnership is engaged in a U.S. trade or business;business.
information reporting (but not backup withholding) will apply unless the broker has documentary evidence in its files that the owner is a non-U.S. holder and certain other conditions are satisfied, or the beneficial owner otherwise establishes an exemption (and the broker has no knowledge or reason to know to the contrary).
Backup withholding is not an additional tax. Any amounts withheld under the backup withholding rules from a payment to a non-U.S. holder can be refunded or credited against the non-U.S. holder’s U.S. federal income tax liability, if any, and any excess refunded, provided that the required information is furnished to the Internal Revenue ServiceIRS in a timely manner.
ForRecent Legislation Relating to Foreign Accounts
Recently enacted rules require the purposesreporting to the IRS of direct and indirect ownership of foreign financial accounts and certain foreign entities by U.S. persons. Failure to provide this discussion,required information can result in a thirty percent (30%) withholding tax on certain payments made after December 31, 2012 including U.S.-source dividends and gross proceeds from the term “non-U.S. holder” means a beneficial owner of our common stock that is not a “U.S. person” for U.S. federal income tax purposes. A U.S. person is any of the following:
a citizen or resident of the United States;
a corporation,sale or other entity treated as a corporation for U.S. federal income tax purposes, or a partnership (or any entity treated as a partnership for U.S. federal income tax purposes), created or organized in the United States or under the lawsdisposition of the United States, any state thereof or the District of Columbia;
an estate, the income of which is includible in gross income for U.S. federal income tax purposes regardless of its source; or
a trust if (1) a court within the United States is able to exercise primary supervision over the administration of the trust and one or morestock issued by U.S. persons, havesuch as the authorityCompany. Because the IRS has not yet issued final regulations with respect to control all substantial decisions of the trust, or (2) it has a valid election in effect under applicable U.S. Treasury regulationsthese new rules, their scope remains unclear and potentially subject to be treated as a U.S. person.
If an entity or arrangement treated as a partnership for U.S. federal income tax purposes holds shares of our common stock, the tax treatment of a person treated as a partner generally will depend on the status of the partner and the activities of the partnership. Persons that for U.S. federal income tax purposesmaterial change. Prospective Non-U.S. Holders are treated as a partner in a partnership holding shares of our common stock shouldadvised to consult their tax advisors.
It is assumed inadvisors regarding this discussion that a non-U.S. holder holds shares of our common stock as a capital asset within the meaning of Section 1221 of the Code (generally, property held for investment). This discussion does not address all aspects of U.S. federal income taxation that may be important to a non-U.S. holdernew reporting and withholding regime, in light of that holder’stheir particular circumstances or that may be applicable to holders subject to special treatment under U.S. federal income tax law (including, for example, financial institutions, dealers in securities, traders in securities that elect mark-to-market treatment, insurance companies, tax-exempt entities, holders who acquired our common stock pursuant to the exercise of employee stock options or otherwise as compensation, entities or arrangements treated as partnerships for U.S. federal income tax purposes, holders liable for the alternative minimum tax, certain former citizens or former long-term residents of the United States, and holders who hold our common stock as part of a hedge, straddle, constructive sale or conversion transaction). In addition, except to the extent provided below, this discussion does not address U.S. federal tax laws other than those pertaining to the U.S. federal income tax, nor does it address any aspects of U.S. state, local or non-U.S. taxes. Accordingly, prospective investors should consult with their own tax advisors regarding the U.S. federal, state, local, non-U.S. income and other tax considerations of acquiring, holding and disposing of shares of our common stock.circumstances.
THIS SUMMARY IS NOT INTENDED TO CONSTITUTE A COMPLETE DESCRIPTION OF ALL TAX CONSEQUENCES RELATING TO THE OWNERSHIP AND DISPOSITION OF OUR COMMON STOCK. HOLDERS OF OUR COMMON STOCK SHOULD CONSULT WITH THEIR TAX ADVISORS REGARDING THE TAX CONSEQUENCES TO THEM (INCLUDING THE APPLICATION AND EFFECT OF ANY STATE, LOCAL, NON-U.S. INCOME AND OTHER TAX LAWS) OF THE OWNERSHIP AND DISPOSITION OF OUR COMMON STOCK.
118
Dividends
DistributionsAs discussed above, we currently have no plans to make distributions of cash or other property on our common stock. In the event that we do make distributions of cash or other property on our common stock, generally such distributions will constitute dividends for U.S. federal income tax purposes to the extent paid from current and accumulated earnings and profits, as determined for U.S. federal income tax purposes. Amounts not treated as dividends for U.S. federal income tax purposes will constitute a return of capital and will first reduce a non-U.S. holder’s adjusted basis in our common stock, but not below zero. Any excess will be treated as capital gain.gain from the sale of our common stock.
In general, dividends, if any, paid by us to a non-U.S. holder will be subject to U.S. withholding tax at a rate of 30% of the gross amount (or a reduced rate prescribed by an applicable income tax treaty) unless the dividends are effectively connected with a trade or business carried on by the non-U.S. holder within the United States and, if required by an applicable income tax treaty, are attributable to a permanent establishment of the non-U.S. holder within the United States. Dividends effectively connected with this U.S. trade or business, and, if required
by an applicable income tax treaty, attributable to such a permanent establishment of a non-U.S. holder, generally will not be subject to U.S. withholding tax if the non-U.S. holder filesprovides us or our paying agent with certain forms, including Internal Revenue ServiceIRS Form W-8ECI (or any successor form), with the payor of the dividend, and generally will be subject to U.S. federal income tax on a net income basis, in the same manner as if the non-U.S. holder were a U.S. person. A non-U.S. holder that is a corporation and receives effectively connected dividends may also be subject to an additional “branch profits tax” imposed at a 30% rate (or lower treaty rate).
Under applicable U.S. Treasury regulations, a non-U.S. holder (including, in certain cases of non-U.S. holders that are entities, the owner or owners of these entities) is required to satisfy certain certification requirements in order to claim a reduced rate of withholding pursuant to an applicable income tax treaty.treaty (including providing us or our paying agent with an IRS Form W-8BEN certifying such non-U.S. holder’s entitlement to benefits under a treaty).
Gain on Sale or Other Disposition of our Common Stock
In general, a non-U.S. holder will not be subject to U.S. federal income tax on any gain realized upon the sale or other disposition of our common stock unless:
the gain is effectively connected with a trade or business carried on by the non-U.S. holder within the United States (in which case the branch profits tax discussed above may also apply if the non-U.S. holder is a corporation) and, if required by an applicable income tax treaty, the gain is attributable to a permanent establishment of the non-U.S. holder maintained in the United States;
the non-U.S. holder is an individual and is present in the United States for 183 days or more in the taxable year of disposition and certain other conditions are satisfied; or
the non-U.S. holder was a citizen or resident of the United States and thus is subject to special rules that apply to expatriates; or
we are or have been a U.S. real property holding corporation (a “USRPHC”) for U.S. federal income tax purposes at any time within the shorter of the five-year period preceding the disposition and the non-U.S. holder’s holding period.
We believe that we currently are not, and do not anticipate becoming, a USRPHC. Because the determination of whether we are a USRPHC depends on the fair market value of our interests in real property located within the United States relative to the fair market value of our interests in real property located outside the United States and our other business assets, however, there can be no assurance that we will not become a USRPHC in the future. If we were or were to become a USRPHC at any time during this period, generally gains realized upon a disposition of shares of our common stock by a non-U.S. holder that did not directly or indirectly own more than 5% of our common stock during this period would not be subject to U.S. federal income tax, provided that our common stock is “regularly traded on an established securities market” (within the meaning of Section 897(c)(3) of the Code). Our common stock will be treated as regularly traded on an established securities market during any period in which our common stock is listed on a registered national securities exchange or any over-the-counter market. However, there can be no assurance that our common stock will qualify as regularly traded on an established securities market when a non U.S. holder sells its common stock.
119
UnderSubject to the terms and subject toconditions of the conditions contained in an underwriting agreement, dated , 2008, we have agreed to sell to the underwriters named below for whom Goldman, Sachs & Co. and Merrill Lynch, Pierce, Fenner and Smith Incorporated are acting as representatives,have severally agreed to purchase from us the following respective numbersnumber of shares of common stock:stock at a public offering price less the underwriting discounts and commissions set forth on the cover page of this prospectus:
Name | Number of Shares | |||
| ||||
| ||||
| ||||
| ||||
| ||||
| ||||
| ||||
| ||||
| ||||
| ||||
Total | ||||
The underwriting agreement provides that the underwriters’ obligation to purchase shares of common stock depends on the satisfaction of the conditions contained in the underwriting agreement including:
the obligation to purchase all of the shares of common stock offered hereby (other than those shares of common stock covered by their option to purchase additional shares as described below), if any of the shares are purchased;
the representations and warranties made by us to the underwriters are true;
there is no material change in our business or the financial markets; and
we deliver customary closing documents to the underwriters.
Commissions and Expenses
The following table summarizes the underwriting discounts and commissions we will pay to the underwriters. These amounts are shown assuming both no exercise and full exercise of the underwriters’ option to purchase up to an additional shares. The underwriting fee is the difference between the initial offering price to the public and the amount the underwriters pay us for the shares.
| Per Share | Total | |||||||||||||||
Underwriting discounts and commissions | ||||||||||||||||
The representativerepresentatives of the underwriters hashave advised us that the underwriters propose to offer the shares of common stock directly to the public at the public offering price on the cover of this prospectus and to selected dealers, which may include the underwriters, at such offering price less a selling concession not in excess of $ per share. The underwriters may allow, and the selected dealers may re-allow, a discount from the concession not in excess of $ per share to brokers and dealers. After the offering, the representativerepresentatives may change the offering price and other selling terms. The offering of the shares by the underwriters is subject to receipt and acceptance and subject to the underwriters’ right to reject any order in whole or in part.
The expenses of the offering that are payable by us are estimated to be approximately $ (excluding underwriting discounts and commissions).
Option to Purchase Additional Shares
We have granted the underwriters an option exercisable for 30 days after the date of this prospectus, to purchase, from time to time, in whole or in part, up to an aggregate of shares at the public offering price less underwriting discounts and commissions. This option may be exercised if the underwriters sell more than shares in connection with this offering. To the extent the underwriters exercise this option, each underwriter will be committed, so long as the conditions of the underwriting agreement are satisfied, to purchase
120
a number of additional shares of common stock proportionate to that underwriter’s initial commitment as indicated in the preceding table, and we will be obligated to sell the additional shares of common stock to the underwriters.
Directed Share Program
At our request, the underwriters have reserved up to % of the shares of common stock for sale at the initial public offering price to persons who are directors, officers or employees, or who are otherwise associated with us, through a directed share program by ... The number of shares of common stock available for sale to the general public will be reduced by the number of directed shares purchased by participants in the program. We do not know if these persons will choose to purchase all or any portion of these reserved shares, but any purchases they do make will reduce the number of shares available to the general public. These persons must commit to purchase by 8:00 a.m. on the day following the date of this prospectus. Any reserved shares not so purchased will be offered by the underwriters to the general public on the same terms as the other shares. Except for certain of our officers and directors who have entered into lock-up agreements as contemplated under “Underwriting—Lock-up Agreements” below, each person buying shares through the directed share program has agreed that, for a period of 25 calendar days from the date of this prospectus, he or she will not, without the prior written consent of the representativerepresentatives offer, pledge, announce the intention to sell, sell, contract to sell, sell any option or contract to purchase, purchase any option or contract to sell, grant any option, right or warrant to purchase or otherwise transfer or dispose of, directly or indirectly, any shares of our common stock or any securities convertible into our or exchangeable for our common stock, enter into any swap or other agreement that transfers, in whole or in part, any of the economic consequences of ownership of our common stock, or make any demand for or exercise any right with respect to the registration of any shares or any security convertible into or exercisable or exchangeable for shares of common stock. For officer and directors purchasing shares through the directed share program, the lock-up agreements contemplated under “Underwriting—Lock-upLock-Up Agreements” below shall govern their purchases.purchase.
Lock-Up Agreements
We, all of our directors and executive officers and certain of our other existing stockholders, including affiliates of Apollo, have agreed that, subject to certain exceptions, without the prior written consent of the representative,representatives, we and they will not directly or indirectly, (1) offer for sale, sell, pledge, or otherwise dispose of (or enter into any transaction or device that is designed to, or could be expected to, result in the disposition by any person at any time in the future of) any shares of our common stock (including, without limitation, shares of our common stock that may be deemed to be beneficially owned by us or them in accordance with the rules and regulations of the SEC and shares of common stock that may be issued upon exercise of any options or warrants) or securities convertible into or exercisable or exchangeable for our common stock, (2) enter into any swap or other derivatives transaction that transfers to another, in whole or in part, any of the economic consequences of ownership of our common stock or (3) make any demand for or exercise any right or file or cause to be filed a registration statement, including any amendments thereto, with respect to the registration of any shares of our common stock or securities convertible, exercisable or exchangeable into our common stock or any of our other securities, or (4) publicly disclose the intention to do any of the foregoing for a period of days after the date of this prospectus.securities.
The -day restricted period described in the preceding paragraph will be extended if:
during the last 17 days of the -day restricted period we issue an earnings release or material news or a material event relating to us occurs; or
prior to the expiration of the -day restricted period, we announce that we will release earnings results during the 16-day-day period beginning on the last day of the -day period, in which case the restrictions described in the preceding paragraph will continue to apply until the expiration of the 18-day-day period beginning on the issuance of the earnings release or the announcement of the material news or occurrence of a material event, unless such extension is waived in writing by the representative.representatives.
121
The representative,representatives, in itstheir sole discretion, may release our common stock and other securities subject to the lock-up agreements described above in whole or in part at any time with or without notice. When determining whether or not to release our common stock and other securities from the lock-up agreements, the representativerepresentatives will consider, among other factors, the holder’s reasons for requesting the release, the number of shares of our common stock and other securities for which the release is being requested and market conditions at the time.
Offering Price Determination
Prior to this offering, there has been no public market for our common stock. The initial public offering price will be negotiated between the representativerepresentatives and us. In determining the initial public offering price of our common stock, the representativerepresentatives will consider:
the history and prospects for the industry in which we compete;
our financial information;
the ability of our management and our business potential and earning prospects;
the prevailing securities markets at the time of this offering; and
the recent market prices of, and the demand for, publicly traded shares of generally comparable companies.
Indemnification
We have agreed to indemnify the underwriters against certain liabilities, including liabilities under the Securities Act, liabilities arising from breaches of the representations and warranties contained in the underwriting agreement and to contribute to payments that the underwriters may be required to make for these liabilities.
Stabilization, Short Positions and Penalty Bids
The underwriters may engage in stabilizing transactions, short sales and purchases to cover positions created by short sales, and penalty bids or purchases for the purpose of pegging, fixing or maintaining the price of our common stock, in accordance with Regulation M under the Exchange Act.
Stabilizing transactions permit bids to purchase the underlying security so long as the stabilizing bids do not exceed a specified maximum.
A short position involves a sale by the underwriters of shares in excess of the number of shares the underwriters are obligated to purchase in the offering, which creates the syndicate short position. This short position may be either a covered short position or a naked short position. In a covered short position, the number of shares involved in the sales made by the underwriters in excess of the number of shares they are obligated to purchase is not greater than the number of shares that they may purchase by exercising their option to purchase additional shares. In a naked short position, the number of shares involved is greater than the number of shares in their option to purchase additional shares. The underwriters may close out any short position by either exercising their option to purchase additional shares, in whole or in part, and/or purchasing shares in the open market. In determining the source of shares to close out the short position, the underwriters will consider, among other things, the price of shares available for purchase in the open market as compared to the price at which they may purchase shares through their option to purchase additional shares. A naked short position is more likely to be created if the underwriters are concerned that there could be downward pressure on the price of the shares in the open market after pricing that could adversely affect investors who purchase in the offering.
|
122
Syndicate covering transactions involve purchases of our common stock in the open market after the distribution has been completed in order to cover syndicate short positions.
Penalty bids permit the representativerepresentatives to reclaim a selling concession from a syndicate member when the common stock originally sold by the syndicate member is purchased in a stabilizing or syndicate covering transaction to cover syndicate short positions.
These stabilizing transactions, syndicate covering transactions and penalty bids may have the effect of raising or maintaining the market price of our common stock or preventing or retarding a decline in the market price of our common stock. As a result, the price of our common stock may be higher than the price that might otherwise exist in the open market. These transactions may be effected on the New York Stock Exchange or otherwise and, if commenced, may be discontinued at any time.
Neither we nor any of the underwriters make any representation or prediction as to the direction or magnitude of any effect that the transactions described above may have on the price of our common stock. In addition, neither we nor any of the underwriters make representation that the underwriters will engage in these stabilizing transactions or that any transaction, once commenced, will not be discontinued without notice.
Electronic Distribution
A prospectus in electronic format may be made available on the Internet sites or through other online services maintained by one or more of the underwriters and/or selling group members participating in this offering, or by their affiliates. In those cases, prospective investors may view offering terms online and, depending upon the particular underwriter or selling group member, prospective investors may be allowed to place orders online. The underwriters may agree with us to allocate a specific number of shares for sale to online brokerage account holders. Any such allocation for online distributions will be made by the underwriters on the same basis as other allocations.
Other than the prospectus in electronic format, the information on any underwriter’s or selling group member’s website and any information contained in any other website maintained by an underwriter or selling group member is not part of the prospectus or the registration statement of which this prospectus forms a part, has not been approved and/or endorsed by us or any underwriter or selling group member in its capacity as underwriter or selling group member and should not be relied upon by investors.
New York Stock Exchange Listing
We intend to apply to list our common stock on the New York Stock Exchange under the symbol “RXN.” In order to meet one of the requirements for listing the common stock on the New York Stock Exchange, the underwriters have undertaken to sell lots of 100 or more shares to a minimum of 2,000 beneficial owners.
Discretionary Sales
The underwriters have informed us that they do not intend to confirm sales to discretionary accounts that exceed 5% of the total number of shares offered by them.
Stamp Taxes
Purchasers of the shares of our common stock offered in this prospectus may be required to pay stamp taxes and other charges under the laws and practices of the country of purchase, in addition to the offering price listed
on the cover page of this prospectus. Accordingly, we urge you to consult a tax advisor with respect to whether you may be required to pay those taxes or charges, as well as any other tax consequences that may arise under the laws of the country of purchase.
123
Relationships
Certain of the underwriters and their respective affiliates have performed and may in the future perform investment banking, financial advisory and lending services for us and our affiliates from time to time, for which they have received customary compensation.
An affiliate of Credit Suisse Securities (USA) LLC is the administrative agent and the syndication agent and a lender under the $150.0 million revolving credit facility with RBS Global and Rexnord LLC. Additionally, the $29.2 million of the revolving credit facility used to support outstanding letters of credit is provided by an affiliate of Credit Suisse Securities (USA) LLC. None of that amount will be replaced with proceeds of this offering. Affiliates of Lehman Brothers Inc. and Merrill Lynch, Pierce, Fenner and Smith Incorporated are also lenders under the revolving credit facility.
Banc of America Securities LLC holds less than $6 million of the PIK toggle senior indebtedness due 2013, which will be repaid completely with the proceeds of this offering.
Lazard Frères & Co. LLC referred this transaction to Lazard Capital Markets LLC and will receive a referral fee from Lazard Capital Markets LLC in connection therewith.
European Economic Area
In relation to each member state of the European Economic Area that has implemented the Prospectus Directive (each, a relevant member state), with effect from and including the date on which the Prospectus Directive is implemented in that relevant member state (the relevant implementation date), an offer of securities described in this prospectus may not be made to the public in that relevant member state prior to the publication of a prospectus in relation to the securities that has been approved by the competent authority in that relevant member state or, where appropriate, approved in another relevant member state and notified to the competent authority in that relevant member state, all in accordance with the Prospectus Directive, except that, with effect from and including the relevant implementation date, an offer of securities may be offered to the public in that relevant member state at any time:
to any legal entity that is authorized or regulated to operate in the financial markets or, if not so authorized or regulated, whose corporate purpose is solely to invest in securities or
to any legal entity that has two or more of (1) an average of at least 250 employees during the last financial year; (2) a total balance sheet of more than €43,000,000 and (3) an annual net turnover of more than €50,000,000, as shown in its last annual or consolidated accounts or
in any other circumstances that do not require the publication of a prospectus pursuant to Article 3 of the Prospectus Directive.
Each purchaser of securities described in this prospectus located within a relevant member state will be deemed to have represented, acknowledged and agreed that it is a “qualified investor” within the meaning of Article 2(1)(e) of the Prospectus Directive.
For purposes of this provision, the expression an “offer to the public” in any relevant member state means the communication in any form and by any means of sufficient information on the terms of the offer and the securities to be offered so as to enable an investor to decide to purchase or subscribe the securities, as the expression may be varied in that member state by any measure implementing the Prospectus Directive in that member state, and the expression “Prospectus Directive” means Directive 2003/71/EC and includes any relevant implementing measure in each relevant member state.
The sellers of the securities have not authorized and do not authorize the making of any offer of securities through any financial intermediary on their behalf, other than offers made by the underwriters with a view to the final placement of the securities as contemplated in this prospectus. Accordingly, no purchaser of the securities, other than the underwriters, is authorized to make any further offer of the securities on behalf of the sellers or the underwriters.
United Kingdom
This prospectus is only being distributed to, and is only directed at, persons in the United Kingdom that are qualified investors within the meaning of Article 2(1)(e) of the Prospectus Directive (“Qualified Investors”) that are also (i) investment professionals falling within Article 19(5) of the Financial Services and Markets Act 2000 (Financial Promotion) Order 2005 (the “Order”) or (ii) high net worth entities, and other persons to whom it may lawfully be communicated, falling within Article 49(2)(a) to (d) of the Order (all such persons together being referred to as “relevant persons”). This prospectus and its contents are confidential and should not be distributed, published or reproduced (in whole or in part) or disclosed by recipients to any other persons in the United Kingdom. Any person in the United Kingdom that is not a relevant persons should not act or rely on this document or any of its contents.
124
The validity of the shares of common stock offered hereby will be passed upon for us by our counsel, O’Melveny & Myers LLP, New York, NY. The underwriters have been represented by Cravath, Swaine & Moore LLP, New York, NY..
The consolidated financial statements of Rexnord Holdings, Inc. as ofCorporation at March 31, 20072010 and 2008,2011 and for our fiscal yeareach of the three years in the period ended March 31, 2006 (Predecessor Company), the period from April 1, 2006 to July 21, 2006 (Predecessor Company), the period from July 22, 2006 to March 31, 2007, and our fiscal year ended March 31, 2008,2011, appearing in this prospectus and registration statement have been audited by Ernst &Young LLP, independent registered public accounting firm, as set forth in their report thereon appearing elsewhere herein, and are included in reliance upon such report given on the authority of such firm as experts in accounting and auditing. The consolidated financial statements of JBI as of September 30, 2005 and 2006, and for the years ended September 30, 2004, 2005 and 2006 appearing in this prospectus and the registration statement have been audited by Ernst & Young LLP, independent registered public accounting firm, as set forth in their report thereon appearing elsewhere herein, and are included in reliance upon such report given on the authority of such firm as experts in accounting and auditing.
WHERE YOU CAN FIND ADDITIONAL INFORMATION
We have filed with the Securities and Exchange Commission a registration statement under the Securities Act of 1933, as amended, referred to as the Securities Act, with respect to the shares of our common stock offered by this prospectus. This prospectus, filed as a part of the registration statement, does not contain all of the information set forth in the registration statement or the exhibits and schedules thereto as permitted by the rules and regulations of the SEC. For further information about us and our common stock, you should refer to the registration statement. This prospectus summarizes provisions that we consider material of certain contracts and other documents to which we refer you. Because the summaries may not contain all of the information that you may find important, you should review the full text of those documents. We have included copies of those documents as exhibits to the registration statement.
RBS Global, Inc. and Rexnord LLC, our wholly ownedwholly-owned subsidiaries, file reports with the SEC pursuant to Section 13(a) of the Securities Exchange Act of 1934, as amended. Such reports are filed in accordance with the terms of the indentures governing the senior and senior subordinated notes co-issued by these registrants. Such periodic reports are not incorporated herein by reference.
The registration statement and the exhibits thereto and our periodic reports filed with the SEC may be inspected, without charge, and copies may be obtained at prescribed rates, at the public reference facility maintained by the SEC at 100 F Street, N.E., Washington, D.C. 20549. You may obtain information on the operation of the SEC’s public reference facility by calling 1-800-SEC-0330. The registration statement and other information filed by us with the SEC are also available at the SEC’s website athttp://www.sec.gov. You may request copies of the filing, at no cost, by telephone at (414) 643-3000 or by mail at Rexnord Holdings, Inc.,Corporation, 4701 West Greenfield Avenue, Milwaukee, Wisconsin 53214.
As a result of the offering, we and our stockholders will become subject to the proxy solicitation rules, annual and periodic reporting requirements, restrictions of stock purchases and sales by affiliates and other requirements of the Exchange Act. We will furnish our stockholders with annual reports containing audited financial statements certified by an independent registered public accounting firm and quarterly reports containing unaudited financial statements for the first three quarters of each fiscal year.
We also maintain an Internet site athttp://www.rexnord.com. We will, as soon as reasonably practicable after the electronic filing of our annual report on Form 10-K, quarterly reports on Form 10-Q, current reports on Form 8-K and amendments to those reports if applicable, make available such reports free of charge on our website.Our website and the information contained therein or connected thereto shall not be deemed to be incorporated into this prospectus or registration statement of which this prospectus forms a part, and you should not rely on any such information in making your decision whether to purchase our securities.
125
Rexnord Holdings, Inc.Corporation and Subsidiaries
Jacuzzi Brands, Inc. and SubsidiariesConsolidated Financial Statements
Index to Financial StatementsAs of March 31, 2010 and 2011 and
For the Fiscal Years ended March 31, 2009, 2010 and 2011
| ||||
| ||||
AUDITED CONSOLIDATED FINANCIAL STATEMENTS OF REXNORD | ||||
Report of | F-2 | |||
Consolidated Balance Sheets as of March 31, | ||||
| F-3 | ||||
| ||||
| ||||
| ||||
| ||||
| F-4 | ||||
| F-5 | ||||
| F-6 | ||||
| ||||
| ||||
F-1
Rexnord Holdings, Inc. and Subsidiaries
Condensed Consolidated Balance Sheets
(in Millions, except share amounts)
(Unaudited)
| March 31, 2008 | June 28, 2008 | |||||||
Assets | ||||||||
Current assets: | ||||||||
Cash | $ | 156.3 | $ | 165.5 | ||||
Receivables, net | 288.5 | 304.5 | ||||||
Inventories, net | 370.3 | 374.0 | ||||||
Other current assets | 35.0 | 31.4 | ||||||
Total current assets | 850.1 | 875.4 | ||||||
Property, plant and equipment, net | 443.3 | 439.5 | ||||||
Intangible assets, net | 883.9 | 871.6 | ||||||
Goodwill | 1,331.7 | 1,331.1 | ||||||
Insurance for asbestos claims | 134.0 | 134.0 | ||||||
Pension assets | 101.8 | 108.8 | ||||||
Other assets | 81.5 | 78.6 | ||||||
Total assets | $ | 3,826.3 | $ | 3,839.0 | ||||
Liabilities and stockholders’ equity | ||||||||
Current liabilities: | ||||||||
Current portion of long-term debt | $ | 2.9 | $ | 2.9 | ||||
Trade payables | 178.6 | 162.8 | ||||||
Income taxes payable | 4.8 | 4.6 | ||||||
Deferred income taxes | 11.7 | 11.2 | ||||||
Compensation and benefits | 71.3 | 55.4 | ||||||
Current portion of pension obligations | 3.0 | 3.1 | ||||||
Current portion of postretirement benefit obligations | 3.6 | 3.5 | ||||||
Interest payable | 31.3 | 62.0 | ||||||
Other current liabilities | 95.8 | 93.6 | ||||||
Total current liabilities | 403.0 | 399.1 | ||||||
Long-term debt | 2,533.9 | 2,547.2 | ||||||
Pension obligations | 69.0 | 67.8 | ||||||
Postretirement benefit obligations | 49.5 | 50.1 | ||||||
Deferred income taxes | 294.6 | 295.9 | ||||||
Reserve for asbestos claims | 134.0 | 134.0 | ||||||
Other liabilities | 69.2 | 64.1 | ||||||
Total liabilities | 3,553.2 | 3,558.2 | ||||||
Stockholders’ equity: | ||||||||
Common stock, $0.01 par value; 25,000,000 shares authorized; | 0.2 | 0.2 | ||||||
Additional paid in capital | 273.5 | 275.3 | ||||||
Retained earnings | 0.1 | 1.6 | ||||||
Accumulated other comprehensive income | — | 4.4 | ||||||
Treasury stock at cost (35,996 shares) | (0.7 | ) | (0.7 | ) | ||||
Total stockholders’ equity | 273.1 | 280.8 | ||||||
Total liabilities and stockholders’ equity | $ | 3,826.3 | $ | 3,839.0 | ||||
See notes to the condensed consolidated financial statements.
Rexnord Holdings, Inc. and Subsidiaries
Condensed Consolidated Statements of Operations
(in Millions, except per share data)
(Unaudited)
| First Quarter Ended | ||||||||
| June 30, 2007 | June 28, 2008 | |||||||
Net sales | $ | 448.2 | $ | 496.1 | ||||
Cost of sales | 306.2 | 334.2 | ||||||
Gross profit | 142.0 | 161.9 | ||||||
Selling, general and administrative expenses | 78.1 | 86.1 | ||||||
(Gain) on Canal Street facility accident, net | (8.1 | ) | — | |||||
Amortization of intangible assets | 12.9 | 12.5 | ||||||
Income from operations | 59.1 | 63.3 | ||||||
Non-operating expense: | ||||||||
Interest expense, net | (64.1 | ) | (58.2 | ) | ||||
Other expense, net | (2.9 | ) | (2.2 | ) | ||||
Income (loss) before income taxes | (7.9 | ) | 2.9 | |||||
Provision (benefit) for income taxes | (0.5 | ) | 2.7 | |||||
Net income (loss) | $ | (7.4 | ) | $ | 0.2 | |||
Net income (loss) per share: | ||||||||
Basic | $ | (0.47 | ) | $ | 0.01 | |||
Diluted | $ | (0.47 | ) | $ | 0.01 | |||
Weighted-average number of shares outstanding: | ||||||||
Basic | 15.7 | 16.0 | ||||||
Effect of dilutive stock options | — | 1.6 | ||||||
Diluted | 15.7 | 17.6 | ||||||
See notes to the condensed consolidated financial statements.
Rexnord Holdings, Inc. and Subsidiaries
Condensed Consolidated Statements of Cash Flows
(in Millions)
(Unaudited)
| First Quarter Ended | ||||||||
| June 30, 2007 | June 28, 2008 | |||||||
Operating activities | ||||||||
Net income (loss) | $ | (7.4 | ) | $ | 0.2 | |||
Adjustments to reconcile net income (loss) to cash provided by operating activities: | ||||||||
Depreciation | 14.1 | 14.6 | ||||||
Amortization of intangible assets | 12.9 | 12.5 | ||||||
Accretion of bond premium | (0.2 | ) | (0.3 | ) | ||||
Amortization of original issue discount | 0.4 | 0.4 | ||||||
Amortization of deferred financing costs | 2.8 | 2.9 | ||||||
Interest expense converted to long-term debt | 14.3 | 13.4 | ||||||
Loss on dispositions of property, plant and equipment | 0.1 | 0.3 | ||||||
Equity in earnings of unconsolidated affiliates | (0.2 | ) | 0.2 | |||||
Other non-cash charges | 1.5 | 0.7 | ||||||
Stock-based compensation expense | 1.8 | 1.8 | ||||||
Changes in operating assets and liabilities: | ||||||||
Receivables | (12.4 | ) | (22.9 | ) | ||||
Inventories | 9.1 | (3.3 | ) | |||||
Other assets | (6.0 | ) | (2.2 | ) | ||||
Accounts payable | (23.9 | ) | (16.0 | ) | ||||
Accruals and other | 26.2 | 16.7 | ||||||
Cash provided by operating activities | 33.1 | 19.0 | ||||||
Investing activities | ||||||||
Expenditures for property, plant and equipment | (8.3 | ) | (11.0 | ) | ||||
Proceeds from surrender of life insurance policies | — | 0.9 | ||||||
Cash used for investing activities | (8.3 | ) | (10.1 | ) | ||||
Financing activities | ||||||||
Repayments of long-term debt | (20.1 | ) | (0.1 | ) | ||||
Payment of financing fees | (0.3 | ) | — | |||||
Purchase of common stock | (0.2 | ) | — | |||||
Net proceeds from issuance of common stock and stock option exercises | 8.2 | — | ||||||
Cash used for financing activities | (12.4 | ) | (0.1 | ) | ||||
Effect of exchange rate changes on cash | (0.1 | ) | 0.4 | |||||
Increase in cash | 12.3 | 9.2 | ||||||
Cash at beginning of period | 58.2 | 156.3 | ||||||
Cash at end of period | $ | 70.5 | $ | 165.5 | ||||
See notes to the condensed consolidated financial statements.
Rexnord Holdings, Inc. and Subsidiaries
Notes to Condensed Consolidated Financial Statements
June 28, 2008
(Unaudited)
1. Basis of Presentation and Significant Accounting Policies
The accompanying unaudited condensed consolidated financial statements include the accounts of Rexnord Holdings, Inc. and subsidiaries (collectively, the “Company”).
The financial statements included herein have been prepared in accordance with accounting principles generally accepted in the United States for interim financial information and pursuant to the rules and regulations of the Securities and Exchange Commission. Certain information and footnote disclosures normally included in financial statements prepared in accordance with accounting principles generally accepted in the United States have been condensed or omitted pursuant to such rules and regulations, although the Company believes that the disclosures are adequate to make the information presented not misleading. In the opinion of management, the condensed consolidated financial statements include all adjustments necessary for a fair presentation of the results of operations for the interim periods. Results for the interim periods are not necessarily indicative of results that may be expected for the fiscal year ending March 31, 2009. It is suggested that these condensed consolidated financial statements be read in conjunction with the audited consolidated financial statements of the Company including the notes thereto included in the Audited Consolidated Financial Statements of Rexnord Holdings, Inc. within this prospectus.
The Company
The Company is a leading diversified, multi-platform industrial company comprised of two key segments, Power Transmission and Water Management. The Power Transmission platform manufactures gears, couplings, industrial bearings, flattop chain and modular conveyer belts, special components, industrial chain and aerospace bearings and seals. The products are either incorporated into products sold by original equipment manufacturers (“OEMs”) or sold to end-users through industrial distributors as aftermarket products. Our Water Management platform is a leading supplier of professional grade specification drainage, water control, PEX piping and commercial brass products, serving the commercial, institutional, civil, municipal, hydropower and public water works construction markets.
New Accounting Pronouncements
In September 2006, the Financial Accounting Standards Board (“FASB”) issued Statement of Financial Accounting Standards (“SFAS”) No. 157,Fair Value Measurements (“SFAS 157”), as amended in February 2008 by FSP FAS 157-2,Effective Date of FASB Statement No. 157.The provisions of SFAS 157 were effective for the Company as of April 1, 2008. However, FSP FAS 157-2 deferred the effective date for all nonfinancial assets and liabilities, except those recognized or disclosed at fair value on an annual or more frequent basis, until April 1, 2009. SFAS 157 defines fair value, creates a framework for measuring fair value in generally accepted accounting principles and expands disclosures about fair value measurements. The Company adopted SFAS 157 on April 1, 2008; see Note 10 for disclosures required under SFAS 157. The Company has also elected a partial deferral of SFAS 157 under the provisions of FSP FAS 157-2 related to the measurement of fair value used when evaluating nonfinancial assets and liabilities.
In September 2006, the FASB released SFAS No. 158,Employers’ Accounting for Defined Benefit Pension and Other Postretirement Plans, an amendment of FASB Statements No. 87, 88, 106, and 132(R)(“SFAS 158”). Under the new standard, companies must recognize a net liability or asset to report the funded status of their defined benefit pension and other postretirement benefit plans on their balance sheets. SFAS 158 also requires
Rexnord Holdings, Inc. and Subsidiaries
Notes to Condensed Consolidated Financial Statements—(Continued)
June 28, 2008
(Unaudited)
companies to measure the funded status of plans as of the date of the Company’s fiscal year end. The Company adopted the funding and disclosure requirements of SFAS 158 as of March 31, 2008. The measurement provisions of SFAS 158 were adopted on April 1, 2008. Upon adoption, the Company recorded an increase to retained earnings of $2.2 million ($1.3 million, net of tax).
In February 2007, the FASB issued SFAS No. 159,The Fair Value Option for Financial Assets and Financial Liabilities (“SFAS 159”), which permits all entities to choose to measure eligible items at fair value on specified election dates. The associated unrealized gains and losses on the items for which the fair value option has been elected shall be reported in earnings. SFAS 159 became effective for the Company as of April 1, 2008; however, the Company has not elected to utilize the fair value option on any of its financial assets or liabilities under the scope of SFAS 159.
In December 2007, the FASB issued SFAS No. 160,Noncontrolling Interests in Consolidated Financial Statements—an amendment of ARB No. 51 (“SFAS 160”). SFAS 160 requires a company to clearly identify and present ownership interests in subsidiaries held by parties other than the company in the consolidated financial statements within the equity section but separate from the company’s equity. It also requires the amount of consolidated net income attributable to the parent and to the noncontrolling interest be clearly identified and presented on the face of the consolidated statement of operations; changes in ownership interest be accounted for similarly, as equity transactions; and when a subsidiary is deconsolidated, any retained noncontrolling equity investment in the former subsidiary and the gain or loss on the deconsolidation of the subsidiary be measured at fair value. This statement is effective for fiscal years, and interim periods within those fiscal years, beginning on or after December 15, 2008, and earlier application is prohibited. The Company is currently evaluating the requirements of SFAS 160 and has not yet determined the impact of adoption on its financial statements.
In December 2007, the FASB issued SFAS No. 141(R),Business Combinations (“SFAS 141(R)”). The objective of SFAS 141(R) is to improve the information provided in financial reports about a business combination and its effects. SFAS 141(R) states that all business combinations (whether full, partial or step acquisitions) must apply the “acquisition method.” In applying the acquisition method, the acquirer must determine the fair value of the acquired business as of the acquisition date and recognize the fair value of the acquired assets and liabilities assumed. As a result, it will require that certain forms of contingent consideration and certain acquired contingencies be recorded at fair value at the acquisition date. SFAS 141(R) also states acquisition costs will generally be expensed as incurred and restructuring costs will be expensed in periods after the acquisition date. This statement is effective for financial statements issued for fiscal years beginning after December 15, 2008, and earlier application is prohibited. The Company is currently evaluating the requirements of SFAS 141(R) and will apply the statement to any acquisitions after March 31, 2009.
In March 2008, the FASB issued SFAS No. 161,Disclosures about Derivative Instruments and Hedging Activities-an amendment of FASB Statement No. 133 (“SFAS 161”).This Statement changes the disclosure requirements for derivative instruments and hedging activities. Entities are required to provide enhanced disclosures about (a) how and why an entity uses derivative instruments, (b) how derivative instruments and related hedged items are accounted for under Statement 133 and its related interpretations, and (c) how derivative instruments and related hedged items affect an entity’s financial position, financial performance, and cash flows. This statement is effective for financial statements issued for fiscal years and interim periods beginning after November 15, 2008. The Company is currently reviewing the requirements of SFAS 161 to determine the impact on its financial statements and related disclosures.
Rexnord Holdings, Inc. and Subsidiaries
Notes to Condensed Consolidated Financial Statements—(Continued)
June 28, 2008
(Unaudited)
2. Acquisition
The GA Acquisition
On January 31, 2008, the Company utilized existing cash balances to purchase GA Industries, Inc. (“GA”) for $73.7 million, net of $3.2 million of cash acquired. This acquisition expanded the Company’s Water Management platform into the water and wastewater markets, specifically in municipal, hydropower and industrial environments. GA Industries, Inc. is comprised of GA Industries and Rodney Hunt Company, Inc. GA Industries is a manufacturer of automatic control valves, check valves and air valves. Rodney Hunt Company, Inc., its wholly owned subsidiary at the time of closing, is a leader in the design and manufacture of sluice/slide gates, butterfly valves and other specialized products for municipal, industrial, and hydropower applications. The Company is still in the process of finalizing third-party appraisals of the acquired property, plant and equipment and certain identifiable intangible assets, as well as the tax effects of the related temporary differences. Accordingly, final adjustments to the purchase price allocation may be required. The Company expects to finalize the purchase price allocation within one year from the date of the acquisition.
The following table summarizes the estimated fair value of the acquired assets and assumed liabilities of GA at the date of acquisition (in millions):
Cash | $ | 3.2 | ||
Securities | 6.7 | |||
Receivables | 16.4 | |||
Inventories | 19.7 | |||
Other current assets | 1.3 | |||
Property, plant and equipment | 17.2 | |||
Intangible assets | 19.4 | |||
Goodwill | 23.3 | |||
Total assets acquired | 107.2 | |||
Accounts payable | (2.6 | ) | ||
Accrued liabilities | (6.4 | ) | ||
Deferred taxes | (15.8 | ) | ||
Debt | (5.5 | ) | ||
Net assets acquired | $ | 76.9 | ||
Approximately $6.6 million of the short-term investments were sold prior to March 31, 2008. These short-term investments consisted primarily of common stocks and other marketable securities. The $19.4 million of acquired intangible assets consist of $10.6 million of tradenames, $8.4 million of customer relationships and a patent of $0.4 million. The acquired customer relationships and patent are being amortized over their estimated useful lives (9-12 years for customer relationships and 16 years for the patent). The acquired intangibles have a weighted average amortization period of 10.8 years (10.7 years for customer relationships and 16.0 years for the acquired patent). The acquired tradenames have an indefinite life and are not being amortized but are tested annually for impairment. Goodwill is not expected to be deductible for income tax purposes. GA’s operations were included in the Company’s results of operations beginning on February 1, 2008.
Rexnord Holdings, Inc. and Subsidiaries
Notes to Condensed Consolidated Financial Statements—(Continued)
June 28, 2008
(Unaudited)
3. Canal Street Facility Accident
On December 6, 2006, the Company experienced an explosion at its primary gear manufacturing facility (“Canal Street”), in which three employees lost their lives and approximately 45 employees were injured. Canal Street is comprised of over 1.1 million square feet among several buildings, and employed approximately 750 associates prior to the accident. The accident resulted from a leak in an underground pipe related to a backup propane gas system that was being tested. The explosion destroyed approximately 80,000 square feet of warehouse, storage and non-production buildings, and damaged portions of other production areas. The Canal Street facility manufactures portions of the Company’s gear product line and, to a lesser extent, the Company’s coupling product line. The Company’s core production capabilities were substantially unaffected by the accident. As of the end of the second quarter of fiscal 2008, production at the Canal Street facility had returned to pre-accident levels.
The Company finalized its accounting for this event in the quarter ending December 29, 2007. As a result, there was no activity related to the Canal Street facility accident during the quarter ended June 28, 2008. For the quarter ended June 30, 2007, the Company recorded the following (gains)/losses related to this incident (in millions):
| Quarter Ended June 30, 2007 | ||||
| (Unaudited) | ||||
Clean-up and restoration expenses | $ | 1.8 | ||
Non-cash inventory impairment | 0.1 | |||
Less property insurance recoveries | (7.5 | ) | ||
Subtotal prior to business interruption insurance recoveries | (5.6 | ) | ||
Less business interruption insurance recoveries | (2.5 | ) | ||
(Gain) on Canal Street facility accident, net | $ | (8.1 | ) | |
The Company recognized a net gain of $8.1 million related to the Canal Street facility accident during the first quarter ended June 30, 2007. $5.6 million of the net gain represents the excess property insurance recoveries (at replacement value) over the write-off of tangible assets (at net book value) and other direct expenses related to the accident. The remaining $2.5 million gain is comprised of business interruption insurance recoveries.
For the period from December 6, 2006 (the date of loss) through December 5, 2007 (the date on which the Company settled its property and business interruption claims with its insurance carrier), the Company has recorded recoveries from its insurance carrier totaling $71.4 million, of which $50.4 million has been allocated to recoveries attributable to property loss and $21.0 million of which has been allocated to recoveries attributable to business interruption loss. $10.0 million of the above recoveries was received during the first quarter ended June 30, 2007 ($7.5 million allocated to property and $2.5 million allocated to business interruption). Beyond the settlement reached on December 5, 2007, no additional insurance proceeds related to such property and business interruption coverage are expected in future periods. As of March 31, 2008, the Company has accrued for all costs related to the Canal Street facility accident that are probable and can be reasonably estimated. The Company did not incur any losses during the quarter ended June 28, 2008 and does not expect to incur any significant losses in future periods. As of June 28, 2008 the Company and its casualty insurance carrier continue to manage ongoing general liability and workers compensation claims. Management believes that the limits of such coverage will be in excess of the losses incurred.
Rexnord Holdings, Inc. and Subsidiaries
Notes to Condensed Consolidated Financial Statements—(Continued)
June 28, 2008
(Unaudited)
4. Income Taxes
The provision for income taxes for all periods presented is based on an estimated effective income tax rate for the respective full fiscal years. The estimated annual effective income tax rate is determined excluding the effect of significant discrete items or items that are reported net of their related tax effects. The tax effect of significant, discrete items is reflected in the period in which they occur. The Company’s income tax expense is impacted by a number of factors, including the amount of taxable earnings derived in foreign jurisdictions with tax rates that are higher or lower than the U.S. federal statutory rate, state tax rates in the jurisdictions where the Company does business and the Company’s ability to utilize various tax credits and net operating loss carryforwards.
The effective income tax rate for the first quarter of fiscal 2008 was a benefit of 6.3% versus a liability of 93.1% in the first quarter of fiscal 2009. The low effective tax rate benefit in the first quarter of fiscal 2008 was due to the effect of the accrual of state income taxes, the accrual of interest expense (through income tax expense) relating to unrecognized tax benefits and an increase to the valuation allowance for foreign tax credits generated during this period for which the realization of such benefits was not deemed more likely than not. The effective tax rate for the first quarter of fiscal 2009 is higher than the U.S. federal statutory rate of 35% mainly due to the effect of the accrual of state income taxes, the accrual of interest expense (through income tax expense) relating to unrecognized tax benefits and an increase to the valuation allowance relating to foreign tax credits generated for which realization of such benefits is not deemed more likely than not.
The Company adopted the provisions of FIN 48 on April 1, 2007. As a result of the implementation of FIN 48, the Company recognized a $5.5 million decrease in the liability for unrecognized tax benefits, with an offsetting reduction to goodwill. At March 31, 2008, the Company’s total liability for unrecognized net tax benefits was $45.7 million. Included in this figure is $5.2 million, which represents tax benefits that if recognized, would favorably impact the effective tax rate. At June 28, 2008, the Company had $45.5 million in unrecognized net tax benefits, of which $6.0 million represented tax benefits that if recognized, would favorably impact the effective tax rate.
The Company recognizes accrued interest and penalties related to unrecognized tax benefits in income tax expense. As of March 31, 2008 and June 28, 2008, the total amount of unrecognized tax benefits includes $14.2 million and $14.8 million of accrued interest and penalties, respectively. The amount of interest and penalties recorded as income tax expense during the quarter ended June 30, 2007 and June 28, 2008 amounted to $1.2 million and $0.6 million, respectively.
The Company is subject to periodic audits by domestic and foreign tax authorities. Currently, the Company is undergoing routine, periodic audits in both domestic and foreign tax jurisdictions. In addition, the Company was recently notified by the Internal Revenue Service of its intention to conduct an examination of the United States federal income tax return for the tax periods ended March 31, 2006 and July 21, 2006. It appears reasonably possible that the amounts of unrecognized tax benefits could change in the next twelve months as a result of such audits; however, any potential payments of income tax, interest and penalties is not expected to be significant to the Company’s consolidated financial statements. With certain exceptions, the Company is no longer subject to U.S. federal income tax examinations for years ending prior to fiscal 2005, state and local income tax examinations for years ending prior to fiscal 2004 or significant foreign income tax examinations for years ending prior to fiscal 2003. With respect to the Company’s U.S. federal net operating loss (“NOL”) carryforward, fiscal year 2003 and 2004 are open under statutes of limitations; whereby, the tax authorities may not adjust the income tax liability for these years, but may reduce the NOL carryforward and any other tax attribute carryforward to future open tax years.
Rexnord Holdings, Inc. and Subsidiaries
Notes to Condensed Consolidated Financial Statements—(Continued)
June 28, 2008
(Unaudited)
5. Comprehensive Income
Comprehensive income (loss) consists of the following (in millions):
| First Quarter Ended | |||||||
| June 30, 2007 | June 28, 2008 | ||||||
Net income (loss) | $ | (7.4 | ) | $ | 0.2 | ||
Other comprehensive income: | |||||||
Unrealized gain on interest rate derivatives, net of tax | 0.9 | 2.9 | |||||
Amortization of pension and postretirement unrecognized prior service costs and actuarial gains and losses, net of tax | — | 0.1 | |||||
Foreign currency translation adjustments | 2.7 | 1.4 | |||||
Comprehensive income (loss) | $ | (3.8 | ) | $ | 4.6 | ||
6. Inventories
The major classes of inventories are summarized as follows (in millions):
| March 31, 2008 | June 28, 2008 | |||||
Finished goods | $ | 228.3 | $ | 230.1 | ||
Work in progress | 63.2 | 61.9 | ||||
Raw materials | 49.5 | 54.6 | ||||
Inventories at First-in, First-Out (“FIFO”) cost | 341.0 | 346.6 | ||||
Adjustment to state inventories at Last-in, First-Out (“LIFO”) cost | 29.3 | 27.4 | ||||
| $ | 370.3 | $ | 374.0 | |||
7. Other Current Liabilities
Other current liabilities are summarized as follows (in millions):
| March 31, 2008 | June 28, 2008 | |||||
Taxes, other than income taxes | $ | 5.2 | $ | 4.9 | ||
Sales rebates | 17.4 | 17.3 | ||||
Severance obligations | 4.7 | 3.9 | ||||
Customer advances | 31.5 | 30.6 | ||||
Product warranty | 6.8 | 6.2 | ||||
Commissions | 7.3 | 7.7 | ||||
Risk management reserves(1) | 4.6 | 5.1 | ||||
Other | 18.3 | 17.9 | ||||
| $ | 95.8 | $ | 93.6 | |||
Rexnord Holdings, Inc. and Subsidiaries
Notes to Condensed Consolidated Financial Statements—(Continued)
June 28, 2008
(Unaudited)
8. Long-Term Debt
Long-term debt is summarized as follows (in millions):
| March 31, 2008 | June 28, 2008 | |||||
Term loans | $ | 767.5 | $ | 767.5 | ||
PIK toggle senior indebtedness due 2013(1) | 512.3 | 526.0 | ||||
9.50% Senior notes due 2014(2) | 803.3 | 803.0 | ||||
8.875% Senior notes due 2016 | 150.0 | 150.0 | ||||
11.75% Senior subordinated notes due 2016 | 300.0 | 300.0 | ||||
10.125% Senior subordinated notes due 2012 | 0.3 | 0.3 | ||||
Other | 3.4 | 3.3 | ||||
Total | 2,536.8 | 2,550.1 | ||||
Less current portion | 2.9 | 2.9 | ||||
Long-term debt | $ | 2,533.9 | $ | 2,547.2 | ||
The Company’s outstanding debt was issued by Rexnord Holdings, Inc., RBS Global, Inc., and various subsidiaries of RBS Global, Inc. Rexnord Holdings, Inc. is the issuer of the PIK toggle senior indebtedness and RBS Global as well as its wholly-owned subsidiary Rexnord LLC are the co-issuers of the term loans, senior notes and senior subordinated notes.
Rexnord Holdings, Inc. PIK Toggle Senior Indebtedness
On March 2, 2007, Rexnord Holdings, Inc. entered into a Credit Agreement with various lenders which provided $449.8 million in cash ($459.0 million of debt financing, net of a $9.2 million original issue discount) that was primarily used to pay a distribution to its shareholders as well as to holders of fully vested rollover options (see Note 13 for further information on stock options). The PIK toggle senior indebtedness borrowed pursuant to the credit agreement is due March 1, 2013 and bears interest at a floating rate. The floating rate is equal to adjusted LIBOR (the interest rate per annum equal to the product of (a) the LIBOR in effect and (b) Statutory Reserves) plus 7.0%. As of March 31, 2008 and June 28, 2008 the interest rate was 10.06% and 9.68%, respectively. Pursuant to the terms of the credit agreement, Holdings has elected to pay interest in-kind and has accordingly added accrued interest to the principal amount of the debt on pre-determined quarterly interest rate reset dates. During the quarter ended June 28, 2008, $13.4 million of interest was added to the principal amount of the outstanding debt.
The PIK toggle senior indebtedness is an unsecured obligation. The PIK toggle senior indebtedness contains customary affirmative and negative covenants including: (i) limitations on the incurrence of indebtedness and the issuance of disqualified and preferred stock, (ii) limitations on restricted payments, dividends and certain other payments, (iii) limitations on asset sales, (iv) limitations on transactions with affiliates, (v) requirements as to the addition of future guarantors in certain circumstances and (vi) limitations on liens. Notwithstanding these covenants, Holdings’ PIK toggle senior indebtedness significantly restricts the payment of dividends and also limits the incurrence of additional indebtedness and the issuance of certain forms of equity. However, Holdings
Rexnord Holdings, Inc. and Subsidiaries
Notes to Condensed Consolidated Financial Statements—(Continued)
June 28, 2008
(Unaudited)
may incur additional indebtedness and issue certain forms of equity if immediately prior to such events, the fixed charge to coverage ratio for the most recently ended four full fiscal quarters for which internal financial statements are available, as defined in the credit agreement, would have been at least 1.75 to 1.00, or, 2.00 to 1.00 in the case of the Holdings’ subsidiaries, including the pro forma application of the additional indebtedness or equity issuance. The PIK toggle senior indebtedness may be repaid in whole at any time or in part from time to time (subject to certain notice requirements) provided that any partial prepayment must be in integral multiples of $1,000,000 and all prepayments must be accompanied by a 1% prepayment premium.
RBS Global, Inc. and Subsidiaries Long-term Debt
As of June 28, 2008, RBS Global’s outstanding borrowings under the term loan credit facility were apportioned between two primary tranches: a $570.0 million term loan B1 facility and a $197.5 million term loan B2 facility. Borrowings under the term loan B1 facility accrue interest, at RBS Global’s option, at the following rates per annum: (i) 2.50% plus the LIBOR Rate, or (ii) 1.50% plus the Base Rate (which is defined as the higher of the Federal funds rate plus 0.5% or the Prime rate). Borrowings under the B2 facility accrue interest, at RBS Global’s option, at the following rates per annum: (i) 2.00% plus the LIBOR Rate or (ii) 1.00% plus the Base Rate (which is defined as the higher of the Federal funds rate plus 0.5% or the Prime rate). The weighted averaged interest rate on the outstanding term loans at June 28, 2008 was 5.84%. As of June 28, 2008, the remaining mandatory principal pre-payments on both the term loan B1 and B2 facilities are $1.2 million and $10.5 million, respectively. RBS Global has fulfilled all mandatory principal repayments on the B1 facility through March 31, 2013. Principal pre-payments of $0.5 million on the B2 facility are scheduled to be made at the end of each calendar quarter beginning on June 30, 2008 and continuing through June 30, 2013.
Borrowings under RBS Global’s $150.0 million revolving credit facility accrue interest, at RBS Global’s option, at the following rates per annum: (i) 2.25% plus the LIBOR Rate, or (ii) 1.25% plus the Base Rate (which is defined as the higher of the Federal funds rate plus 0.5% or the Prime rate). There were no outstanding borrowings on the revolver as of March 31, 2008 or June 28, 2008. However, $31.0 million and $29.2 million of the revolving credit facility was considered utilized in connection with outstanding letters of credit at March 31, 2008 and June 28, 2008, respectively
The senior notes and senior subordinated notes are unsecured obligations of RBS Global. The senior subordinated notes are subordinated in right of payment to all existing and future senior indebtedness. The indentures governing the senior notes and senior subordinated notes contain customary affirmative and negative covenants including: (i) limitations on the incurrence of indebtedness and the issuance of disqualified and preferred stock, (ii) limitations on restricted payments, dividends and certain other payments, (iii) limitations on asset sales, (iv) limitations on transactions with affiliates, (v) a covenant regarding the effect of a change of control, (vi) requirements as to the addition of future guarantors in certain circumstances and (vii) limitations on liens. The indenture governing the senior subordinated notes contains a further covenant limiting other senior subordinated indebtedness. Prior to August 1, 2011, the Company may redeem the 8.875% senior notes due 2016 and/or the senior subordinated notes at their option, in whole, or from time to time in part, upon not less than 30 and not more than 60 days’ prior notice, at a redemption price equal to (A) 100% of the principal amount of the notes redeemed plus (B) the greater of (x) 1% of the outstanding principal amount of the such notes and (y) the excess of the net present value of the notes (assuming they would otherwise be redeemed on August 1, 2011 and further assuming a discount rate equal to the Treasury Rate plus 50 basis points), and (C) accrued and unpaid interest and additional interest, if any, to, the applicable redemption date. The 9.50% senior notes due 2014 are redeemable on similar terms until August 1, 2010 (provided that the net present value of such notes would be
Rexnord Holdings, Inc. and Subsidiaries
Notes to Condensed Consolidated Financial Statements—(Continued)
June 28, 2008
(Unaudited)
calculated assuming they would otherwise be redeemed on August 1, 2010). RBS Global’s senior secured credit facilities contain customary affirmative and negative covenants including: (i) limitations on indebtedness, (ii) limitations on liens, (iii) limitations on sale and leaseback transactions, (iv) limitations on investments, loans and advances, (v) limitations on mergers, consolidations, sales of assets and acquisitions, (vi) limitations on dividends and distributions, (vii) limitations on transactions with affiliates, (viii) limitations on modifications of indebtedness and certain other agreements, (ix) limitations on capital expenditures, (x) limitations on swap agreements, and (xi) limitations on other senior debt. As a result of these covenants, RBS Global has not paid any dividends on its common stock or membership interests. It is currently RBS Global’s policy to retain earnings to repay debt and finance its operations.
RBS Global’s senior secured credit facilities also limit its maximum senior secured bank leverage ratio to 4.25 to 1.00. As of June 28, 2008, the senior secured bank leverage ratio was 1.61 to 1.00. Management expects to be in compliance with this financial covenant for the foreseeable future. RBS Global’s senior credit facility also significantly restricts the payment of dividends. Borrowings under RBS Global’s senior secured credit facilities may be repaid in whole at any time or in part from time to time without premium or penalty provided that any partial prepayment must be in integral multiples of $250,000 and of at least $5,000,000 in the aggregate (or $1,000,000 in the case of swingline loans).
At March 31, 2008 and June 28, 2008, various wholly owned subsidiaries had additional debt of $3.4 million and $3.3 million, respectively, comprised primarily of capital lease obligations and borrowings at various foreign subsidiaries.
Account Receivable Securitization Program
On September 26, 2007, three wholly-owned domestic subsidiaries entered into an accounts receivable securitization program (the “AR Securitization Program” or the “Program”) whereby they continuously sell substantially all of their domestic trade accounts receivables to Rexnord Funding LLC (a wholly-owned bankruptcy remote special purpose subsidiary) for cash and subordinated notes. Rexnord Funding LLC in turn may obtain revolving loans and letters of credit from General Electric Capital Corporation (“GECC”) pursuant to a five year revolving loan agreement. The maximum borrowing amount under the loan agreement with GECC is $100 million, subject to certain borrowing base limitations related to the amount and type of receivables owned by Rexnord Funding LLC. All of the receivables purchased by the Rexnord Funding LLC are pledged as collateral for revolving loans and letters of credit obtained from GECC under the loan agreement.
The AR Securitization Program does not qualify for sale accounting under SFAS No. 140, Accounting for Transfers and Servicing of Financial Assets and Extinguishments of Liabilities, and as such, any borrowings are accounted for as secured borrowings on the consolidated balance sheet. Financing costs associated with the Program will be recorded within “Interest expense, net” in the consolidated statement of operations if revolving loans or letters of credit are obtained under the loan agreement.
Borrowings under the loan agreement bear interest at a rate equal to LIBOR plus an applicable margin, which at June 28, 2008 was 1.35%. In addition, a non-use fee of 0.30% is applied to the unutilized portion of the $100.0 million commitment. These rates are per annum and the fees are paid to GECC on a daily basis. At June 28, 2008, the Company had no outstanding borrowings under the Program. Additionally, the Program requires compliance with certain covenants and performance ratios. As of June 28, 2008, Rexnord Funding was in compliance with all applicable covenants and performance ratios.
Rexnord Holdings, Inc. and Subsidiaries
Notes to Condensed Consolidated Financial Statements—(Continued)
June 28, 2008
(Unaudited)
9. Financial Instruments
The Company selectively uses interest rate collars and swaps and foreign exchange forward contracts to manage interest rate and foreign currency risks. The use of the derivatives is restricted to those intended for hedging purposes.
In February 2008, the Company entered into foreign exchange forward contracts to mitigate the foreign currency volatility relative to certain intercompany cash flows expected to occur within the current fiscal year. The remaining forward contracts expire between July 29, 2008 and March 27, 2009 and have a notional amount of 25.4 million Canadian dollars (“CAD”) ($25.3 million United States dollars (“USD”)) and contract rates ranging from $1 CAD:$0.9988 USD to $1CAD:$0.9931 USD. These foreign exchange forward contracts have not been accounted for as effective cash flow hedges in accordance with SFAS No. 133,Accounting for Derivative Instruments and Hedging Activities (“SFAS 133”) and as such are marked to market through earnings. At June 28, 2008, the Company recorded the fair value of these contracts of $0.2 million within other current assets and recorded $0.7 million of other expense during the quarter ended June 28, 2008. The Company recorded $1.8 million of other expense during the quarter ended June 30, 2007 related to existing foreign exchange forward contracts in place at June 30, 2007.
In August 2006, the Company entered into an interest rate collar and an interest rate swap to hedge the variability in future cash flows associated with a portion of the Company’s variable-rate term loans. The interest rate collar provides an interest rate floor of 4.0% plus the applicable margin and an interest rate cap of 6.065% plus the applicable margin on $262.0 million of the Company’s variable-rate term loans, while the interest rate swap converts $68.0 million of the Company’s variable-rate term loans to a fixed interest rate of 5.14% plus the applicable margin. Both the interest rate collar and the interest rate swap became effective on October 20, 2006 and have a maturity of three years. These interest rate derivatives have been accounted for as effective cash flow hedges in accordance with SFAS 133. The negative fair value of these interest rate derivatives totaled $4.9 million at June 28, 2008 and has been recorded on the Company’s condensed consolidated balance sheets as an other long-term liability with the corresponding offset recorded as a component of accumulated other comprehensive income, net of tax.
10. Fair Value Measurements
As further discussed in Note 1, the Company adopted SFAS 157, effective April 1, 2008. While SFAS 157 does not expand the use of fair value measurements in any new circumstance, it applies to several current accounting standards that require or permit measurement of assets and liabilities at fair value. SFAS 157 provides a common definition of fair value and establishes a framework to make the measurement of fair value in generally accepted accounting principles more consistent and comparable. SFAS 157 defines fair value as the exchange price that would be received for an asset or paid to transfer a liability (an exit price) in the principal or most advantageous market for the asset or liability in an orderly transaction between market participants. SFAS 157 also specifies a fair value hierarchy based upon the observability of inputs used in valuation techniques. Observable inputs (highest level) reflect market data obtained from independent sources, while unobservable inputs (lowest level) reflect internally developed assumptions about the assumptions a market participant would use.
In accordance with SFAS 157, fair value measurements are classified under the following hierarchy:
Level 1- Quoted prices for identical instruments in active markets.
Rexnord Holdings, Inc. and Subsidiaries
Notes to Condensed Consolidated Financial Statements—(Continued)
June 28, 2008
(Unaudited)
Level 2- Quoted prices for similar instruments; quoted prices for identical or similar instruments in markets that are not active; and model-derived valuations in which all significant inputs or significant value-drivers are observable.
Level 3- Model-derived valuations in which one or more inputs or value-drivers are both significant to the fair value measurement and unobservable.
If applicable, the Company uses quoted market prices in active markets to determine fair value, and therefore classifies such measurements within Level 1. In some cases where market prices are not available, the Company makes use of observable market based inputs to calculate fair value, in which case the measurements are classified within Level 2. If quoted or observable market prices are not available, fair value is based upon internally developed models that use, where possible, current market-based parameters. These measurements are classified within Level 3 if they use significant unobservable inputs.
The Company’s fair value measurements which are impacted by SFAS 157 include:
Interest Rate Collar and Swap
The fair value of interest rate swap and collar derivatives is primarily based on pricing models. These models use discounted cash flows that utilize the appropriate market-based forward swap curves and interest rates.
Foreign exchange forward contracts
The fair value of foreign exchange forward contracts is based on a pricing model that utilizes the differential between the contract price and the market-based forward rate as applied to fixed future deliveries of Canadian dollars (for United States dollars) at pre-designated settlement dates.
The Company endeavors to utilize the best available information in measuring fair value. As required by SFAS 157, financial assets and liabilities are classified in their entirety based on the lowest level of input that is significant to the fair value measurement. The Company has determined that its financial instruments reside within level 2 of the fair value hierarchy. The following table provides a summary of the Company’s assets and liabilities that were recognized at fair value on a recurring basis as of June 28, 2008 (in millions):
| Fair Value as of June 28, 2008 | ||||||||||||
| Level 1 | Level 2 | Level 3 | Total | |||||||||
Assets: | ||||||||||||
Foreign exchange forward contracts(1) | $ | — | $ | 0.2 | $ | — | $ | 0.2 | ||||
Total assets at fair value | $ | — | $ | 0.2 | $ | — | $ | 0.2 | ||||
Liabilities: | ||||||||||||
Interest rate collar and swap(2) | $ | — | $ | 4.9 | $ | — | $ | 4.9 | ||||
Total liabilities at fair value | $ | — | $ | 4.9 | $ | — | $ | 4.9 | ||||
Rexnord Holdings, Inc. and Subsidiaries
Notes to Condensed Consolidated Financial Statements—(Continued)
June 28, 2008
(Unaudited)
11. Commitments and Contingencies
Warranties:
The Company offers warranties on the sales of certain products and records an accrual for estimated future claims. Such accruals are based upon historical experience and management’s estimate of the level of future claims. The following table presents changes in the Company’s product warranty liability (in millions):
| First Quarter Ended | ||||||||
| June 30, 2007 | June 28, 2008 | |||||||
Balance at beginning of period | $ | 4.2 | $ | 6.8 | ||||
Charged to operations | 1.0 | 0.1 | ||||||
Claims settled | (0.6 | ) | (0.7 | ) | ||||
Balance at end of period | $ | 4.6 | $ | 6.2 | ||||
Contingencies:
The Company’s entities are involved in various unresolved legal actions, administrative proceedings and claims in the ordinary course of business involving, among other things, product liability, commercial, employment, workers’ compensation, intellectual property claims and environmental matters. The Company establishes reserves in a manner that is consistent with accounting principles generally accepted in the United States for costs associated with such matters when liability is probable and those costs are capable of being reasonably estimated. Although it is not possible to predict with certainty the outcome of these unresolved legal actions or the range of possible loss or recovery, based upon current information, management believes the eventual outcome of these unresolved legal actions either individually, or in the aggregate, will not have a material adverse effect on the financial position, results of operations or cash flows of the Company.
In connection with the Carlyle acquisition in November 2002, Invensys plc has provided the Company with indemnification against certain contingent liabilities, including certain pre-closing environmental liabilities. The Company believes that, pursuant to such indemnity obligations, Invensys is obligated to defend and indemnify the Company with respect to the matters described below relating to the Ellsworth Industrial Park Site and to various asbestos claims. The indemnity obligations relating to the matters described below are not subject to any time limitations and are subject to an overall dollar cap equal to the purchase price, which is an amount in excess of $900 million. The following paragraphs summarize the most significant actions and proceedings:
|
Rexnord Holdings, Inc. and Subsidiaries
Notes to Condensed Consolidated Financial Statements—(Continued)
June 28, 2008
(Unaudited)
|
The ultimate outcome of the Ellsworth investigation and related litigation cannot presently be determined; however, management believes the Company has meritorious defenses to these matters. Pursuant to its indemnity obligation, Invensys is defending the Company in these matters and has paid 100% of the related costs to date. To provide additional protection, the Company has brought several indemnification suits against previous property owners who retained certain environmental liabilities associated with its property, and is also involved in litigation with its insurance companies for a declaration of coverage. These suits are progressing in accordance with the respective court’s scheduling order.
Approximately 700 lawsuits (with approximately 6,950 claimants) are pending in state or federal court in numerous jurisdictions relating to alleged personal injuries due to the alleged presence of asbestos in certain brakes and clutches previously manufactured by the Company’s Stearns division and/or its predecessor owners. Invensys and FMC, prior owners of the Stearns business, have paid 100% of the costs to date related to the Stearns lawsuits. Similarly, the Company’s Prager subsidiary has been named as a defendant in two pending multi-defendant lawsuits relating to alleged personal injuries due to the alleged presence of asbestos in a product allegedly manufactured by Prager. There are approximately 3,700 claimants in the Prager lawsuits. The ultimate outcome of these lawsuits cannot presently be determined. To date, the Company’s insurance providers have paid 100% of the costs related to the Prager lawsuits. The Company believes that the combination of its insurance coverage and the Invensys indemnity obligations will cover any future costs of these suits.
In connection with the Falk acquisition, Hamilton Sundstrand has provided the Company with indemnification against certain contingent liabilities, including coverage for certain pre-closing environmental liabilities. The Company believes that, pursuant to such indemnity obligations, Hamilton Sundstrand is obligated to defend and indemnify the Company with respect to the asbestos claims described below, and that, with respect to these claims, such indemnity obligations are not subject to any time or dollar limitations. The following paragraph summarizes the most significant actions and proceedings for which Hamilton Sundstrand has accepted responsibility:
Falk, through its successor entity, is a defendant in approximately 150 lawsuits pending in state or federal court in numerous jurisdictions relating to alleged personal injuries due to the alleged presence of asbestos in certain clutches and drives previously manufactured by Falk. There are approximately 1,840 claimants in these suits. The ultimate outcome of these lawsuits cannot presently be determined. Hamilton Sundstrand is defending the Company in these lawsuits pursuant to its indemnity obligations and has paid 100% of the costs to date.
Certain Water Management subsidiaries are also subject to asbestos and class action related litigation.
As of June 28, 2008, Zurn and an average of 113 other unrelated companies were defendants in approximately 6,000 asbestos related lawsuits representing approximately 45,000 claims. The suits allege
Rexnord Holdings, Inc. and Subsidiaries
Notes to Condensed Consolidated Financial Statements—(Continued)
June 28, 2008
(Unaudited)
damages in an aggregate amount of approximately $14.2 billion against all defendants. Plaintiffs’ claims allege personal injuries caused by exposure to asbestos used primarily in industrial boilers formerly manufactured by a segment of Zurn. Zurn did not manufacture asbestos or asbestos components. Instead, Zurn purchased them from suppliers. These claims are being handled pursuant to a defense strategy funded by insurers.
The Company currently estimates the potential liability for asbestos-related claims pending against Zurn as well as the claims expected to be filed in the next ten years is approximately $134.0 million, of which Zurn expects to pay approximately $116.0 million in the next ten years on such claims, with the balance of the estimated liability being paid in subsequent years. However, there are inherent uncertainties involved in estimating the number of future asbestos claims, future settlement costs, and the effectiveness of defense strategies and settlement initiatives. As a result, Zurn’s actual liability could differ from the estimate described herein. Further, while this current asbestos liability is based on an estimate of claims through the next ten years, such liability may continue beyond that time frame, and such liability could be substantial.
Management estimates that its available insurance to cover its potential asbestos liability as of June 28, 2008, is approximately $280.5 million, and believes that all current claims are covered by this insurance. However, principally as a result of the past insolvency of certain of the Company’s insurance carriers, certain coverage gaps will exist if and after the Company’s other carriers have paid the first $204.5 million of aggregate liabilities. In order for the next $51.0 million of insurance coverage from solvent carriers to apply, management estimates that it would need to satisfy $14.0 million of asbestos claims. Layered within the final $25.0 million of the total $280.5 million of coverage, management estimates that it would need to satisfy an additional $80 million of asbestos claims. If required to pay any such amounts, the Company could pursue recovery against the insolvent carriers, but it is not currently possible to determine the likelihood or amount of any such recoveries, if any.
As of June 28, 2008, the Company recorded a receivable from its insurance carriers of $134.0 million, which corresponds to the amount of its potential asbestos liability that is covered by available insurance and is currently determined to be probable of recovery. However, there is no assurance that $280.5 million of insurance coverage will ultimately be available or that Zurn’s asbestos liabilities will not ultimately exceed $280.5 million. Factors that could cause a decrease in the amount of available coverage include: changes in law governing the policies, potential disputes with the carriers on the scope of coverage, and insolvencies of one or more of the Company’s carriers.
As of the date of this filing, subsidiaries, Zurn Pex, Inc. and Zurn Industries, LLC (formerly known as Zurn Industries, Inc.), have been named as defendants in ten lawsuits, brought between July 2007 and August 2008, in various U.S. federal courts (MN, ND, CO, NC, MT, AL and VA). The plaintiffs in these suits seek to represent a class of plaintiffs alleging damages due to the alleged failure or anticipated failure of the Zurn brass crimp fittings on the PEX plumbing systems in homes and other structures. The complaints assert various causes of action, including but not limited to negligence, breach of warranty, fraud, and violations of the Magnuson Moss Act and certain state consumer protection laws, and seek declaratory and injunctive relief, and damages (including punitive damages) in unspecified amounts. The suits were transferred to a multi-district litigation docket in the District of Minnesota for coordinated pretrial proceedings. The Company is being provided a defense by its insurance carrier and believes it has insurance to cover potential liabilities, subject, however, to policy terms and conditions, and deductibles. While the Company intends to vigorously defend itself in these actions, the uncertainties of litigation and the uncertainties related to insurance coverage and collection as well as the actual number or value of claims make it difficult to accurately predict the financial effect these claims may ultimately have on the Company.
Rexnord Holdings, Inc. and Subsidiaries
Notes to Condensed Consolidated Financial Statements—(Continued)
June 28, 2008
(Unaudited)
12. Retirement Benefits
The components of net periodic benefit cost are as follows (in millions):
| First Quarter Ended | ||||||||
| June 30, 2007 | June 28, 2008 | |||||||
Pension Benefits: | ||||||||
Service cost | $ | 1.3 | $ | 1.2 | ||||
Interest cost | 8.3 | 8.8 | ||||||
Expected return on plan assets | (12.1 | ) | (12.5 | ) | ||||
Amortization of: | ||||||||
Prior service cost | 0.1 | 0.1 | ||||||
Net periodic benefit cost (income) | $ | (2.4 | ) | $ | (2.4 | ) | ||
Other Postretirement Benefits: | ||||||||
Service cost | $ | 0.1 | $ | 0.1 | ||||
Interest cost | 0.8 | 0.8 | ||||||
Net periodic benefit cost | $ | 0.9 | $ | 0.9 | ||||
In the first quarter of fiscal 2008 and 2009, the Company made contributions of $1.6 million and $0.6 million, respectively, to its U.S. qualified pension plan trusts. On April 1, 2008, the Company adopted the measurement date provisions of SFAS 158. The impact of the adoption was an increase in total liabilities of $1.3 million, an increase in total assets of $3.5 million, an increase in deferred tax liabilities of $0.9 million and an increase in retained earnings, net of tax, of $1.3 million.
13. Stock Options
As a nonpublic entity that previously used the minimum value method for pro forma disclosure purposes under SFAS 123, the Company adopted SFAS 123(R) using the prospective transition method of adoption on April 1, 2006. Accordingly, the provisions of SFAS 123(R) are applied prospectively to new awards and to awards modified, repurchased or cancelled after the adoption date. In connection with the acquisition of the Company by Apollo Management, L.P. (“Apollo”) on July 21, 2006, all previously outstanding stock options became fully vested and were either cashed out or rolled into fully-vested stock options of Rexnord Holdings. On July 22, 2006, a total of 577,945 of stock options were rolled over, each with an exercise price of $7.13. As of June 28, 2008, 539,242 of these rollover stock options remain outstanding.
In connection with the acquisition of the Company by Apollo on July 21, 2006, the Board of Directors of Rexnord Holdings also adopted, and stockholders approved, the 2006 Stock Option Plan of Rexnord Holdings, Inc. (the “Option Plan”). Persons eligible to receive options under the Option Plan include officers, employees or directors of Rexnord Holdings or any of its subsidiaries and certain consultants and advisors to Rexnord Holdings or any of its subsidiaries. The maximum number of shares of Rexnord Holdings common stock that may be issued or transferred pursuant to options under the Option Plan equals 2,700,000 shares (excluding rollover options mentioned above). Approximately 50% of the options granted under the Option Plan vest ratably over five years from the date of grant; the remaining fifty percent of the options are eligible to vest based on the Company’s achievement of earnings before interest, taxes, depreciation and amortization (“EBITDA”) targets and debt repayment targets for fiscal years 2007 through 2014.
Rexnord Holdings, Inc. and Subsidiaries
Notes to Condensed Consolidated Financial Statements—(Continued)
June 28, 2008
(Unaudited)
The fair value of each option granted under the Option Plan during the first quarter ended June 28, 2008 was estimated on the date of grant using the Black-Scholes valuation model that uses the following assumptions: expected volatility of 28% based on the expected volatilities of publicly-traded companies within the Company’s industry; an expected term of 7.5 years based on the midpoint between when the options vest and when they expire; a weighted average risk free interest rate of 3.76% based on the U.S. Treasury yield curve in effect at the date of grant; and expected dividends of zero. The weighted average grant date fair value of the 44,900 options granted under the Option Plan between April 1, 2008 and June 28, 2008 was $16.01.
For each of the quarters ended June 30, 2007 and June 28, 2008, the Company recorded $1.8 million of stock-based compensation expense. As of June 28, 2008, there was $23.1 million of total unrecognized compensation cost related to non-vested stock options granted under the Option Plan. That cost is expected to be recognized over a weighted average period of 3.4 years.
The following table presents the Company’s stock option activity during the first quarter of fiscal 2009:
| Shares | Weighted Avg. Exercise Price | |||||
Number of shares under option: | ||||||
Outstanding at beginning of period | 2,795,887 | $ | 17.47 | |||
Granted | 44,900 | 40.00 | ||||
Exercised | — | — | ||||
Canceled/Forfeited | (1,185 | ) | 19.94 | |||
Outstanding at end of period(1)(2) | 2,839,602 | $ | 17.82 | |||
Exercisable at end of period(3) | 955,827 | $ | 12.71 | |||
14. Business Segment Information
The results of operations are reported in two business segments, consisting of the Power Transmission platform and the Water Management platform. The Power Transmission platform manufactures gears, couplings, industrial bearings, flattop chain and modular conveyer belts, aerospace bearings and seals, special components and industrial chain and conveying equipment. This segment serves a diverse group of end market industries, including aerospace, aggregates and cement, air handling, construction equipment, chemicals, energy, food and beverage, forest and wood products, mining, material and package handling, marine, natural resource extraction and petrochemical. The Water Management platform manufactures professional grade specification plumbing, water treatment and waste water control products serving the commercial, institutional, civil, municipal, hydropower and public water works construction markets.
The financial information of the Company’s segments is regularly evaluated by the chief operating decision makers in determining resource allocation and assessing performance and is periodically reviewed by the Company’s Board of Directors. Management evaluates the performance of each business segment based on its operating results.
Rexnord Holdings, Inc. and Subsidiaries
Notes to Condensed Consolidated Financial Statements—(Continued)
June 28, 2008
(Unaudited)
Business Segment Information:
(in Millions)
| First Quarter Ended | ||||||||
| June 30, 2007 | June 28, 2008 | |||||||
Net sales | ||||||||
Power Transmission | $ | 309.8 | $ | 340.6 | ||||
Water Management | 138.4 | 155.5 | ||||||
Consolidated | $ | 448.2 | $ | 496.1 | ||||
Income (loss) from operations | ||||||||
Power Transmission | $ | 43.1 | $ | 46.0 | ||||
Water Management | 20.0 | 23.1 | ||||||
Corporate | (4.0 | ) | (5.8 | ) | ||||
Consolidated | $ | 59.1 | $ | 63.3 | ||||
Non-operating expense: | ||||||||
Interest expense, net | (64.1 | ) | (58.2 | ) | ||||
Other expense, net | (2.9 | ) | (2.2 | ) | ||||
Income (loss) before income taxes | (7.9 | ) | 2.9 | |||||
Provision (benefit) for income taxes | (0.5 | ) | 2.7 | |||||
Net income (loss) | $ | (7.4 | ) | $ | 0.2 | |||
Depreciation and Amortization | ||||||||
Power Transmission | $ | 20.2 | $ | 20.1 | ||||
Water Management | 6.8 | 7.0 | ||||||
Consolidated | $ | 27.0 | $ | 27.1 | ||||
Capital Expenditures | ||||||||
Power Transmission | $ | 7.9 | $ | 10.0 | ||||
Water Management | 0.4 | 1.0 | ||||||
Consolidated | $ | 8.3 | $ | 11.0 | ||||
| March 31, 2008 | June 28, 2008 | |||||||
Total Assets | ||||||||
Power Transmission | $ | 2,477.0 | $ | 2,496.2 | ||||
Water Management | 1,265.9 | 1,262.2 | ||||||
Corporate | 83.4 | 80.6 | ||||||
Consolidated | $ | 3,826.3 | $ | 3,839.0 | ||||
Rexnord Holdings, Inc. and Subsidiaries
Notes to Condensed Consolidated Financial Statements—(Continued)
June 28, 2008
(Unaudited)
15. Subsequent Events
On July 10, 2008, the Company commenced an exchange offer with respect to the PIK toggle senior indebtedness due 2013. This exchange offer expired on August 7, 2008. Approximately $460.8 million of the PIK toggle senior indebtedness due 2013 was tendered for exchange. The Company has complied with its obligation pursuant to the Credit Agreement dated March 2, 2007, and no further action is required.
Report of Ernst & Young LLP, Independent Registered Public Accounting Firm
The boardBoard of directorsDirectors and ShareholdersStockholders of Rexnord Holdings, Inc.Corporation:
We have audited the accompanying consolidated balance sheets of Rexnord Holdings, Inc.Corporation and subsidiaries (the Company) as of March 31, 20072010 and 2008,2011, and the related consolidated statements of operations, stockholders’ equity (deficit), and cash flows for each of the Predecessor Company forthree years in the yearperiod ended March 31, 2006 and the period from April 1, 2006 to July 21, 2006, and of the Company for the period from July 22, 2006 to March 31, 2007, and the year ended March 31, 2008.2011. These financial statements are the responsibility of the Company’s management. Our responsibility is to express an opinion on these financial statements based on our audits.
We conducted our audits in accordance with the standards of the Public Company Accounting Oversight Board (United States). Those standards require that we plan and perform the audit to obtain reasonable assurance about whether the financial statements are free of material misstatement. We were not engaged to perform an audit of the Company’s internal control over financial reporting. Our audits included consideration of internal control over financial reporting as a basis for designing audit procedures that are appropriate in the circumstances, but not for the purpose of expressing an opinion on the effectiveness of the Company’s internal control over financial reporting. Accordingly, we express no such opinion. An audit also includes examining, on a test basis, evidence supporting the amounts and disclosures in the financial statements, assessing the accounting principles used and significant estimates made by management, and evaluating the overall financial statement presentation. We believe that our audits provide a reasonable basis for our opinion.
In our opinion, the financial statements referred to above present fairly, in all material respects, the consolidated financial position of the Company at March 31, 20072010 and 2008,2011, and the consolidated results of its operations and its cash flows for each of the Predecessor Company forthree years in the yearperiod ended March 31, 2006 and the period from April 1, 2006 to July 21, 2006, and of the Company for the period from July 22, 2006 to March 31, 2007, and the year ended March 31, 2008,2011, in conformity with U.S. generally accepted accounting principles.
As discussed in Note 2 to the consolidated financial statements, the Company changed its methods of accounting for stock based compensation effective April 1, 2006 andhas elected to change its method of accounting for uncertainty in income taxesactuarial gains and losses related to its pension and other postretirement benefit plans during the fourth quarter of the year ended March 31, 2008.2011.
/s/ Ernst & Young LLP |
Milwaukee, Wisconsin |
May 25, 2011 |
Milwaukee, Wisconsin
July 1, 2008
Rexnord Holdings, Inc.Corporation and Subsidiaries
Consolidated Balance Sheets
(In Millions,in millions, except share amounts)
| March 31, 2007 | March 31, 2008 | March 31, 2010(1) | March 31, 2011 | |||||||||||||
Assets | ||||||||||||||||
Current assets: | ||||||||||||||||
Cash | $ | 58.2 | $ | 156.3 | ||||||||||||
Cash and cash equivalents | $ | 263.9 | $ | 391.0 | ||||||||||||
Receivables, net | 254.4 | 288.5 | 234.1 | 270.1 | ||||||||||||
Inventories, net | 384.3 | 370.3 | 273.8 | 283.8 | ||||||||||||
Other current assets | 26.3 | 35.0 | 29.4 | 36.5 | ||||||||||||
Total current assets | 723.2 | 850.1 | 801.2 | 981.4 | ||||||||||||
Property, plant and equipment, net | 437.1 | 443.3 | 376.2 | 358.4 | ||||||||||||
Intangible assets, net | 987.7 | 883.9 | 688.5 | 644.7 | ||||||||||||
Goodwill | 1,294.2 | 1,331.7 | 1,012.2 | 1,016.2 | ||||||||||||
Insurance for asbestos claims | 136.0 | 134.0 | 86.0 | 65.0 | ||||||||||||
Pension assets | 114.6 | 101.8 | — | 4.6 | ||||||||||||
Other assets | 90.6 | 81.5 | 52.4 | 29.4 | ||||||||||||
Total assets | $ | 3,783.4 | $ | 3,826.3 | $ | 3,016.5 | $ | 3,099.7 | ||||||||
Liabilities and stockholders’ equity | ||||||||||||||||
Liabilities and stockholders’ deficit | ||||||||||||||||
Current liabilities: | ||||||||||||||||
Current portion of long-term debt | $ | 2.2 | $ | 2.9 | $ | 5.3 | $ | 104.2 | ||||||||
Trade payables | 154.4 | 178.6 | 135.3 | 181.7 | ||||||||||||
Income taxes payable | 3.5 | 4.8 | ||||||||||||||
Deferred income taxes | 16.9 | 11.7 | ||||||||||||||
Compensation and benefits | 52.9 | 71.3 | 58.7 | 67.9 | ||||||||||||
Current portion of pension obligations | 9.4 | 3.0 | ||||||||||||||
Current portion of postretirement benefit obligations | 4.9 | 3.6 | ||||||||||||||
Current portion of pension and postretirement obligations | 6.1 | 6.1 | ||||||||||||||
Interest payable | 35.2 | 31.3 | 30.7 | 51.8 | ||||||||||||
Other current liabilities | 75.3 | 95.8 | 83.2 | 86.1 | ||||||||||||
Total current liabilities | 354.7 | 403.0 | 319.3 | 497.8 | ||||||||||||
Long-term debt | 2,494.7 | 2,533.9 | 2,210.2 | 2,209.9 | ||||||||||||
Pension obligations | 68.8 | 69.0 | ||||||||||||||
Postretirement benefit obligations | 52.3 | 49.5 | ||||||||||||||
Pension and postretirement obligations | 137.5 | 113.2 | ||||||||||||||
Deferred income taxes | 379.6 | 294.6 | 273.2 | 254.9 | ||||||||||||
Reserve for asbestos claims | 136.0 | 134.0 | 86.0 | 65.0 | ||||||||||||
Other liabilities | 41.0 | 69.2 | 47.8 | 47.1 | ||||||||||||
Total liabilities | 3,527.1 | 3,553.2 | 3,074.0 | 3,187.9 | ||||||||||||
Stockholders’ equity: | ||||||||||||||||
Common stock, $0.01 par value; 25,000,000 shares authorized; 15,391,527 and 16,065,758 shares issued | 0.2 | 0.2 | ||||||||||||||
Additional paid in capital | 253.0 | 273.5 | ||||||||||||||
Retained earnings (deficit) | (0.2 | ) | 0.1 | |||||||||||||
Accumulated other comprehensive income | 3.3 | — | ||||||||||||||
Treasury stock at cost (35,996 shares) | — | (0.7 | ) | |||||||||||||
Stockholders’ deficit: | ||||||||||||||||
Common stock, $0.01 par value; 25,000,000 shares authorized; shares issued: 16,142,886 at March 31, 2010 and 16,244,829 at March 31, 2011 | 0.2 | 0.2 | ||||||||||||||
Additional paid-in capital | 285.6 | 293.3 | ||||||||||||||
Retained deficit | (340.2 | ) | (391.5 | ) | ||||||||||||
Accumulated other comprehensive (loss) income | (1.0 | ) | 16.1 | |||||||||||||
Treasury stock at cost, | (2.1 | ) | (6.3 | ) | ||||||||||||
Total stockholders’ equity | 256.3 | 273.1 | ||||||||||||||
Total stockholders’ deficit | (57.5 | ) | (88.2 | ) | ||||||||||||
Total liabilities and stockholders’ equity | $ | 3,783.4 | $ | 3,826.3 | ||||||||||||
Total liabilities and stockholders’ deficit | $ | 3,016.5 | $ | 3,099.7 | ||||||||||||
| (1) | Financial data for 2010 has been adjusted for the Company’s voluntary change in accounting for actuarial gains and losses related to its pension and other postretirement benefit plans. See Note 2, Significant Accounting Policies. |
See notes to the consolidated financial statementsstatements.
F-3
Rexnord Holdings, Inc.Corporation and Subsidiaries
Consolidated Statements of Operations
(In Millions,in millions, except share and per share amounts)
| Predecessor | ||||||||||||||||||||||||||||||
| Year Ended March 31, 2006 | Period from April 1, 2006 through July 21, 2006 | Period from July 22, 2006 through March 31, 2007 | Year Ended March 31, 2008 | Year Ended March 31, 2009(1) | Year Ended March 31, 2010(1) | Year Ended March 31, 2011 | ||||||||||||||||||||||||
Net sales | $ | 1,081.4 | $ | 334.2 | $ | 921.5 | $ | 1,853.5 | $ | 1,882.0 | $ | 1,510.0 | $ | 1,699.6 | ||||||||||||||||
Cost of sales | 742.3 | 237.7 | 628.2 | 1,250.4 | 1,290.1 | 994.4 | 1,102.8 | |||||||||||||||||||||||
Gross profit | 339.1 | 96.5 | 293.3 | 603.1 | 591.9 | 515.6 | 596.8 | |||||||||||||||||||||||
Selling, general and administrative expenses | 187.8 | 63.1 | 159.3 | 312.2 | 467.8 | 297.7 | 329.1 | |||||||||||||||||||||||
Loss on divestiture | — | — | — | 11.2 | ||||||||||||||||||||||||||
(Gain) on Canal Street facility accident, net | — | — | (6.0 | ) | (29.2 | ) | ||||||||||||||||||||||||
Transaction-related costs | — | 62.7 | — | — | ||||||||||||||||||||||||||
Intangible impairment charges | 422.0 | — | — | |||||||||||||||||||||||||||
Restructuring and other similar costs | 31.1 | — | — | — | 24.5 | 6.8 | — | |||||||||||||||||||||||
Amortization of intangible assets | 15.7 | 5.0 | 26.9 | 49.9 | 48.9 | 49.7 | 48.6 | |||||||||||||||||||||||
Income (loss) from operations | 104.5 | (34.3 | ) | 113.1 | 259.0 | |||||||||||||||||||||||||
(Loss) income from operations | (371.3 | ) | 161.4 | 219.1 | ||||||||||||||||||||||||||
Non-operating (expense) income: | ||||||||||||||||||||||||||||||
Interest expense, net | (230.4 | ) | (194.2 | ) | (180.8 | ) | ||||||||||||||||||||||||
Gain (loss) on debt extinguishment | 103.7 | 167.8 | (100.8 | ) | ||||||||||||||||||||||||||
Other (expense) income, net | (3.0 | ) | (16.4 | ) | 1.1 | |||||||||||||||||||||||||
Non-operating income (expense): | ||||||||||||||||||||||||||||||
Interest expense, net | (61.5 | ) | (21.0 | ) | (109.8 | ) | (254.3 | ) | ||||||||||||||||||||||
Other income (expense), net | (3.8 | ) | (0.4 | ) | 5.7 | (5.3 | ) | |||||||||||||||||||||||
(Loss) income before income taxes | (501.0 | ) | 118.6 | (61.4 | ) | |||||||||||||||||||||||||
(Benefit) provision for income taxes | (72.0 | ) | 30.5 | (10.1 | ) | |||||||||||||||||||||||||
Income (loss) before income taxes | 39.2 | (55.7 | ) | 9.0 | (0.6 | ) | ||||||||||||||||||||||||
Provision (benefit) for income taxes | 16.3 | (16.1 | ) | 9.2 | (0.9 | ) | ||||||||||||||||||||||||
Net (loss) income | $ | (429.0 | ) | $ | 88.1 | $ | (51.3 | ) | ||||||||||||||||||||||
Net income (loss) | $ | 22.9 | $ | (39.6 | ) | $ | (0.2 | ) | $ | 0.3 | ||||||||||||||||||||
Net income (loss) per share: | ||||||||||||||||||||||||||||||
Net (loss) income per share: | ||||||||||||||||||||||||||||||
Basic | $ | (0.02 | ) | $ | 0.02 | $ | (26.76 | ) | $ | 5.49 | $ | (3.20 | ) | |||||||||||||||||
Diluted | (0.02 | ) | 0.02 | $ | (26.76 | ) | $ | 5.30 | $ | (3.20 | ) | |||||||||||||||||||
| NM | NM | |||||||||||||||||||||||||||||
Weighted-average number of shares outstanding: | ||||||||||||||||||||||||||||||
Weighted-average number of shares outstanding (in thousands): | ||||||||||||||||||||||||||||||
Basic | 10.7 | 15.8 | 16,030 | 16,036 | 16,037 | |||||||||||||||||||||||||
Effect of dilutive stock options | — | 0.4 | — | 579 | — | |||||||||||||||||||||||||
Diluted | 10.7 | 16.2 | 16,030 | 16,615 | 16,037 | |||||||||||||||||||||||||
| (1) | Financial data for fiscal 2009 and 2010 has been adjusted for the Company’s voluntary change in accounting for actuarial gains and losses related to its pension and other postretirement benefit plans. See Note 2, Significant Accounting Policies. |
See notes to the consolidated financial statementsstatements.
F-4
Rexnord Holdings, Inc.Corporation and Subsidiaries
Consolidated Statements of Stockholders’ Equity (Deficit)
(In Millions,millions, except share and per share amounts)
| Common Stock | Additional Paid-In Capital | Retained Earnings (Deficit) | Accumulated Other Comprehensive Income (Loss) | Treasury Stock | Total Stockholders’ Equity | ||||||||||||||||||
Balance at March 31, 2005 (Predecessor) | $ | 0.1 | $ | 361.6 | $ | 45.4 | $ | 17.6 | $ | — | 424.7 | ||||||||||||
Comprehensive Income: | |||||||||||||||||||||||
Net income | — | — | 22.9 | — | — | 22.9 | |||||||||||||||||
Foreign currency translation adjustments | — | — | — | (3.3 | ) | — | (3.3 | ) | |||||||||||||||
Additional minimum pension liability, net of $3.2 income tax benefit | — | — | — | (5.0 | ) | — | (5.0 | ) | |||||||||||||||
Total comprehensive income | 14.6 | ||||||||||||||||||||||
Issuance of common stock | — | 1.2 | — | — | — | 1.2 | |||||||||||||||||
Other common stock activity | — | 0.6 | — | — | — | 0.6 | |||||||||||||||||
Balance at March 31, 2006 (Predecessor) | 0.1 | 363.4 | 68.3 | 9.3 | — | 441.1 | |||||||||||||||||
Comprehensive Income: | |||||||||||||||||||||||
Net loss | — | — | (39.6 | ) | — | — | (39.6 | ) | |||||||||||||||
Foreign currency translation adjustments | — | — | — | 3.1 | — | 3.1 | |||||||||||||||||
Total comprehensive loss | (36.5 | ) | |||||||||||||||||||||
Tax benefit of stock options exercised | — | 10.7 | — | — | — | 10.7 | |||||||||||||||||
Balance at July 21, 2006 (Predecessor) | 0.1 | 374.1 | 28.7 | 12.4 | — | 415.3 | |||||||||||||||||
Acquisition of RBS Global, Inc. | (0.1 | ) | (374.1 | ) | (28.7 | ) | (12.4 | ) | — | (415.3 | ) | ||||||||||||
Issuance of common stock, 15,391,527 shares | 0.2 | 682.0 | — | — | — | 682.2 | |||||||||||||||||
Comprehensive Income: | |||||||||||||||||||||||
Net loss | — | — | (0.2 | ) | — | — | (0.2 | ) | |||||||||||||||
Foreign currency translation adjustments | — | — | — | 4.2 | — | 4.2 | |||||||||||||||||
Unrealized loss on interest rate derivatives, net of $0.4 income tax benefit | — | — | — | (0.7 | ) | — | (0.7 | ) | |||||||||||||||
Additional minimum pension liability, net of $0.1 income tax benefit | — | — | — | (0.2 | ) | — | (0.2 | ) | |||||||||||||||
Total comprehensive income | 3.1 | ||||||||||||||||||||||
Tax benefit of stock options exercised | — | 5.9 | — | — | — | 5.9 | |||||||||||||||||
Stock-based compensation expense | — | 5.1 | — | — | — | 5.1 | |||||||||||||||||
Cash dividend—$27.56 per share | — | (440.0 | ) | — | — | — | (440.0 | ) | |||||||||||||||
Balance at March 31, 2007 | 0.2 | 253.0 | (0.2 | ) | 3.3 | — | 256.3 | ||||||||||||||||
Comprehensive Income: | |||||||||||||||||||||||
Net income | — | — | 0.3 | — | — | 0.3 | |||||||||||||||||
Foreign currency translation adjustments | — | — | — | 14.2 | — | 14.2 | |||||||||||||||||
Unrealized loss on interest rate derivatives, net of $3.4 income tax benefit | — | — | — | (5.2 | ) | — | (5.2 | ) | |||||||||||||||
Additional minimum pension liability, net of $0.2 income tax benefit | — | — | — | (0.4 | ) | — | (0.4 | ) | |||||||||||||||
Total comprehensive income | 8.9 | ||||||||||||||||||||||
Stock options exercised, 263,927 shares, net of 29,130 shares surrendered as proceeds | — | 4.9 | — | — | (0.6 | ) | 4.3 | ||||||||||||||||
Stock-based compensation expense | — | 7.4 | — | — | — | 7.4 | |||||||||||||||||
Adjustment to adopt SFAS No. 158, net of $8.2 million income tax benefit | — | — | — | (11.9 | ) | — | (11.9 | ) | |||||||||||||||
Issuance of common stock, 410,304 shares | — | 8.2 | — | — | — | 8.2 | |||||||||||||||||
Repurchase of common stock, 6,866 shares | — | — | — | — | (0.1 | ) | (0.1 | ) | |||||||||||||||
Balance at March 31, 2008 | $ | 0.2 | $ | 273.5 | $ | 0.1 | $ | — | $ | (0.7 | ) | 273.1 | |||||||||||
| Common Stock | Additional Paid-In Capital | Retained Deficit | Accumulated Other Comprehensive Income (Loss) | Treasury Stock | Total Stockholders’ Equity (Deficit) | |||||||||||||||||||
Balance at March 31, 2008 (1) | $ | 0.2 | $ | 273.5 | $ | (0.6 | ) | $ | 0.7 | (0.7 | ) | $ | 273.1 | |||||||||||
Comprehensive income (loss): | ||||||||||||||||||||||||
Net loss | — | — | (429.0 | ) | — | — | (429.0 | ) | ||||||||||||||||
Foreign currency translation adjustments | — | — | — | (26.7 | ) | — | (26.7 | ) | ||||||||||||||||
Unrealized gain on interest rate derivatives, net of $1.5 income tax expense | — | — | — | 2.4 | — | 2.4 | ||||||||||||||||||
Change in pension and other postretirement defined benefit plans, net of $0.8 income tax benefit | — | — | — | (5.8 | ) | — | (5.8 | ) | ||||||||||||||||
Total comprehensive loss | (459.1 | ) | ||||||||||||||||||||||
Stock-based compensation expense | — | 6.9 | — | — �� | — | 6.9 | ||||||||||||||||||
Impact of the adoption of the measurement date provisions of ASC 715, net of $0.8 income tax expense | — | — | 1.3 | — | — | 1.3 | ||||||||||||||||||
Exercise of 1,806 stock options, net of 1,806 shares surrendered as proceeds | — | 0.1 | — | — | (0.1 | ) | — | |||||||||||||||||
Balance at March 31, 2009 (1) | 0.2 | 280.5 | (428.3 | ) | (29.4 | ) | (0.8 | ) | (177.8 | ) | ||||||||||||||
Comprehensive income (loss): | ||||||||||||||||||||||||
Net income | — | — | 88.1 | — | — | 88.1 | ||||||||||||||||||
Foreign currency translation adjustments | — | — | — | 14.7 | — | 14.7 | ||||||||||||||||||
Unrealized loss on interest rate derivatives, net of $0.3 income tax benefit | — | — | — | (0.5 | ) | — | (0.5 | ) | ||||||||||||||||
Change in pension and other postretirement defined benefit plans, net of $12.9 income tax expense | — | — | — | 14.2 | — | 14.2 | ||||||||||||||||||
Total comprehensive income | 116.5 | |||||||||||||||||||||||
Stock-based compensation expense | — | 5.5 | — | — | — | 5.5 | ||||||||||||||||||
Exercise of 75,322 stock options, net of 47,468 shares surrendered as proceeds | — | 1.1 | — | — | (0.9 | ) | 0.2 | |||||||||||||||||
Cost to cancel stock options | — | (1.5 | ) | — | — | — | (1.5 | ) | ||||||||||||||||
Repurchase of common stock, 17,500 shares | — | — | — | — | (0.4 | ) | (0.4 | ) | ||||||||||||||||
Balance at March 31, 2010 (1) | 0.2 | 285.6 | (340.2 | ) | (1.0 | ) | (2.1 | ) | (57.5 | ) | ||||||||||||||
Comprehensive income (loss): | ||||||||||||||||||||||||
Net loss | — | — | (51.3 | ) | — | — | (51.3 | ) | ||||||||||||||||
Foreign currency translation adjustments | — | — | — | 8.5 | — | 8.5 | ||||||||||||||||||
Unrealized loss on interest rate derivatives, net of $0.5 income tax benefit | — | — | — | (0.8 | ) | — | (0.8 | ) | ||||||||||||||||
Change in pension and other postretirement defined benefit plans, net of $5.2 income tax expense | — | — | — | 9.4 | — | 9.4 | ||||||||||||||||||
Total comprehensive loss | (34.2 | ) | ||||||||||||||||||||||
Stock-based compensation expense | — | 5.6 | — | — | — | 5.6 | ||||||||||||||||||
Tax benefit on option exercises, net of write-off of deferred tax asset | — | 0.3 | — | — | — | 0.3 | ||||||||||||||||||
Exercise of 101,943 stock options, net of 86,153 shares surrendered as proceeds | — | 1.8 | — | — | (3.2 | ) | (1.4 | ) | ||||||||||||||||
Repurchase of common stock, 27,500 shares | — | — | — | — | (1.0 | ) | (1.0 | ) | ||||||||||||||||
Balance at March 31, 2011 | $ | 0.2 | $ | 293.3 | $ | (391.5 | ) | $ | 16.1 | $ | (6.3 | ) | $ | (88.2 | ) | |||||||||
| (1) | Financial data for fiscal 2008 to 2010 have been adjusted for the Company’s voluntary change in accounting for actuarial gains and losses related to its pension and other postretirement benefit plans. See Note 2, Significant Accounting Policies. |
See notes to the consolidated financial statements.
F-5
Rexnord Holdings, Inc.Corporation and Subsidiaries
Consolidated Statements of Cash Flows
(In Millions)in millions)
| Predecessor | Period from July 22, 2006 through March 31, 2007 | Year Ended March 31, 2008 | ||||||||||||||||
| Year Ended March 31, 2006 | Period from April 1, 2006 through July 21, 2006 | |||||||||||||||||
Operating activities | ||||||||||||||||||
Net income (loss) | $ | 22.9 | $ | (39.6 | ) | $ | (0.2 | ) | $ | 0.3 | ||||||||
Adjustments to reconcile net income (loss) to cash provided by (used for) operating activities: | ||||||||||||||||||
Depreciation | 43.0 | 14.0 | 36.1 | 54.2 | ||||||||||||||
Amortization of intangible assets | 15.7 | 5.0 | 26.9 | 49.9 | ||||||||||||||
Accretion of bond premium | — | — | — | (0.9 | ) | |||||||||||||
Amortization of original issue discount | — | — | 0.2 | 1.5 | ||||||||||||||
Amortization of deferred financing costs | 3.7 | 1.1 | 5.1 | 11.7 | ||||||||||||||
Interest expense converted to long-term debt | — | — | — | 60.8 | ||||||||||||||
Deferred income taxes | 3.1 | (17.0 | ) | 10.7 | (36.1 | ) | ||||||||||||
Loss (gain) on dispositions of property, plant and equipment | 0.4 | (1.3 | ) | 1.3 | 0.3 | |||||||||||||
Equity in earnings of unconsolidated affiliates | — | — | — | (1.1 | ) | |||||||||||||
Non-cash write-off of deferred financing fees | — | 20.5 | — | — | ||||||||||||||
Non-cash loss on divestiture | — | — | — | 8.7 | ||||||||||||||
Other non-cash (credits) charges | 6.9 | — | 3.2 | (2.2 | ) | |||||||||||||
Stock-based compensation expense | — | — | 5.1 | 7.4 | ||||||||||||||
Changes in operating assets and liabilities: | ||||||||||||||||||
Receivables | (15.1 | ) | 12.4 | (20.0 | ) | (12.1 | ) | |||||||||||
Inventories | (14.7 | ) | (18.1 | ) | 15.7 | 37.1 | ||||||||||||
Other assets | (2.1 | ) | (1.3 | ) | (0.6 | ) | 3.3 | |||||||||||
Accounts payable | 25.7 | (17.2 | ) | 23.9 | 16.2 | |||||||||||||
Accrued transaction fees | — | 18.6 | (18.6 | ) | — | |||||||||||||
Accruals and other | 2.4 | 18.5 | (25.4 | ) | 33.7 | |||||||||||||
Cash provided by (used for) operating activities | 91.9 | (4.4 | ) | 63.4 | 232.7 | |||||||||||||
Investing activities | ||||||||||||||||||
Expenditures for property, plant and equipment | (37.1 | ) | (11.7 | ) | (28.0 | ) | (54.9 | ) | ||||||||||
Proceeds from dispositions of property, plant and equipment | 2.3 | 1.6 | 1.3 | 0.4 | ||||||||||||||
Proceeds from sale of short term investments | — | — | — | 6.6 | ||||||||||||||
Acquisitions, net of cash acquired | (301.3 | ) | (5.6 | ) | (1,898.8 | ) | (73.7 | ) | ||||||||||
Cash used for investing activities | (336.1 | ) | (15.7 | ) | (1,925.5 | ) | (121.6 | ) | ||||||||||
Financing activities | ||||||||||||||||||
Proceeds from issuance of long-term debt | 312.0 | 16.9 | 2,549.8 | — | ||||||||||||||
Repayments of long-term debt | (65.0 | ) | (8.5 | ) | (816.3 | ) | (27.4 | ) | ||||||||||
Payment of financing fees | (7.6 | ) | (0.2 | ) | (83.0 | ) | (0.6 | ) | ||||||||||
Payment of tender premium | — | — | (23.1 | ) | — | |||||||||||||
Dividends paid | — | — | (440.0 | ) | — | |||||||||||||
Purchase of common stock | — | — | — | (0.1 | ) | |||||||||||||
Net proceeds from issuance of common stock and stock option exercises | 1.2 | — | 721.6 | 12.5 | ||||||||||||||
Cash provided by (used for) financing activities | 240.6 | 8.2 | 1,909.0 | (15.6 | ) | |||||||||||||
Effect of exchange rate changes on cash | (0.2 | ) | 0.2 | 0.5 | 2.6 | |||||||||||||
Increase (decrease) in cash | (3.8 | ) | (11.7 | ) | 47.4 | 98.1 | ||||||||||||
Cash at beginning of period | 26.3 | 22.5 | 10.8 | 58.2 | ||||||||||||||
Cash at end of period | $ | 22.5 | $ | 10.8 | $ | 58.2 | $ | 156.3 | ||||||||||
| Year Ended March 31, 2009(1) | Year Ended March 31, 2010(1) | Year Ended March 31, 2011 | ||||||||||
Operating activities | ||||||||||||
Net (loss) income | $ | (429.0 | ) | $ | 88.1 | $ | (51.3 | ) | ||||
Adjustments to reconcile net (loss) income to cash provided by operating activities: | ||||||||||||
Depreciation | 60.7 | 59.6 | 57.5 | |||||||||
Amortization of intangible assets | 48.9 | 49.7 | 48.6 | |||||||||
Intangible impairment charges (see Note 8) | 422.0 | — | — | |||||||||
Amortization of deferred financing costs | 11.5 | 11.4 | 7.9 | |||||||||
Deferred income taxes | (84.5 | ) | 33.3 | (22.9 | ) | |||||||
Loss on dispositions of property, plant and equipment | 0.8 | 2.5 | 1.7 | |||||||||
Equity in (earnings) loss of unconsolidated affiliates | 0.5 | (0.5 | ) | (4.1 | ) | |||||||
Non-cash restructuring charges (see Note 4) | 5.8 | 0.4 | — | |||||||||
Actuarial loss on pension and postretirement benefit obligations | 164.3 | 7.7 | 2.5 | |||||||||
Other non-cash charges (credits) | 1.3 | 1.5 | (1.1 | ) | ||||||||
(Gain) loss on debt extinguishment | (103.7 | ) | (167.8 | ) | 100.8 | |||||||
Interest expense converted to long-term debt | 44.5 | 8.2 | 6.6 | |||||||||
Stock-based compensation expense | 6.9 | 5.5 | 5.6 | |||||||||
Changes in operating assets and liabilities: | ||||||||||||
Receivables | 28.2 | 29.8 | (30.4 | ) | ||||||||
Inventories | 38.4 | 57.7 | (2.9 | ) | ||||||||
Other assets | (9.3 | ) | 4.8 | (3.5 | ) | |||||||
Accounts payable | (41.9 | ) | (0.5 | ) | 43.0 | |||||||
Accruals and other | (10.4 | ) | (35.9 | ) | 6.5 | |||||||
Cash provided by operating activities | 155.0 | 155.5 | 164.5 | |||||||||
Investing activities | ||||||||||||
Expenditures for property, plant and equipment | (39.1 | ) | (22.0 | ) | (37.6 | ) | ||||||
Proceeds from the surrender of life insurance policies | 0.9 | — | — | |||||||||
Proceeds from dispositions of property, plant and equipment | 0.3 | — | — | |||||||||
Proceeds from sale of unconsolidated affiliate | — | — | 0.9 | |||||||||
Acquisitions, net of cash acquired (see Note 3) | (16.6 | ) | — | 1.2 | ||||||||
Cash used for investing activities | (54.5 | ) | (22.0 | ) | (35.5 | ) | ||||||
Financing activities | ||||||||||||
Proceeds from borrowings of long-term debt | — | 0.5 | 1,145.0 | |||||||||
Proceeds from borrowings of short-term debt | — | — | 2.0 | |||||||||
Proceeds from borrowings on revolving credit facility | 82.7 | — | — | |||||||||
Proceeds from borrowings on accounts receivable securitization facility | 30.0 | — | — | |||||||||
Repayments of long-term debt | (3.2 | ) | (116.1 | ) | (1,071.1 | ) | ||||||
Repayments of short-term debt | — | (2.8 | ) | (2.8 | ) | |||||||
Purchase of PIK toggle senior indebtedness | (72.9 | ) | (36.5 | ) | — | |||||||
Payment of deferred financing fees | — | (4.9 | ) | (14.6 | ) | |||||||
Payment of tender premium | — | — | (63.5 | ) | ||||||||
Excess tax benefit on exercise of stock options | — | — | 0.5 | |||||||||
Purchase of common stock | — | (0.4 | ) | (1.0 | ) | |||||||
Payment to cancel stock options | — | (1.5 | ) | — | ||||||||
Net proceeds (payments) from issuance of common stock and stock option exercises | — | 0.2 | (1.4 | ) | ||||||||
Cash (used for) provided by financing activities | 36.6 | (161.5 | ) | (6.9 | ) | |||||||
Effect of exchange rate changes on cash and cash equivalents | (5.5 | ) | 4.0 | 5.0 | ||||||||
Increase (decrease) in cash and cash equivalents | 131.6 | (24.0 | ) | 127.1 | ||||||||
Cash and cash equivalents at beginning of period | 156.3 | 287.9 | 263.9 | |||||||||
Cash and cash equivalents at end of period | 287.9 | 263.9 | 391.0 | |||||||||
| (1) | Financial data for fiscal 2009 and 2010 have been adjusted for the Company’s voluntary change in accounting for actuarial gains and losses related to its pension and other postretirement benefit plans. See Note 2, Significant Accounting Policies. |
See notes to the consolidated financial statements.
F-6
Rexnord Holdings, Inc.Corporation and Subsidiaries
Notes to Consolidated Financial Statements
March 31, 20082011
1. Basis of Presentation and Description of Business
Rexnord Corporation (formerly known as Rexnord Holdings, Inc.) (“Rexnord”) was formed on July 13, 2006 and is the indirect parent company of RBS Global, Inc. (“RBS Global”) and its subsidiaries. On July 21, 2006 (the “Merger Date”), certain affiliates of Apollo Management, L.P. (“Apollo”) and management purchased the operating company from The Carlyle Group. There was no business activity at Rexnord prior to the Merger Date. The accompanying consolidated financial statements include the accounts of Rexnord and subsidiaries subsequent to the Merger Date (collectively, the “Company”).
The financial statements included herein have been prepared in accordance with accounting principles generally accepted in the United States (“GAAP”) pursuant to the rules and regulations of the Securities and Exchange Commission. In the opinion of management, the consolidated financial statements include all adjustments necessary for a fair presentation of the results of operations for the periods presented.
The Company
Rexnord Holdings, Inc. (“Holdings”) was formed on July 13, 2006 and is the indirect parent company of RBS Global, Inc. and its subsidiaries. As further discussed in Note 3, on July 21, 2006 (the “Merger Date”), certain affiliates of Apollo Management, L.P. (“Apollo”) and management purchased the operating company from The Carlyle Group. There was no business activity at Rexnord Holdings, Inc. prior to the Merger Date. The accompanying consolidated financial statements include the accounts of Rexnord Holdings, Inc. and subsidiaries subsequent to the Merger Date (collectively, “the Company”). The consolidated financial statements of the operating company and its subsidiaries prior to the Merger Date (collectively, the “Predecessor”) are presented for comparative purposes.
The Company is a leading diversified,growth-oriented, multi-platform industrial company comprisedwith what it believes are leading market shares and highly trusted brands that serve a diverse array of two key segments, Power Transmissionglobal end-markets. The Company’s heritage of innovation and Water Management.specification have allowed it to provide highly engineered, mission critical solutions to customers for decades and affords it the privilege of having long-term, valued relationships with market leaders. The Power TransmissionProcess & Motion Control platform designs, manufactures, markets and services specified, highly-engineered mechanical components used within complex systems where our customers’ reliability requirements and cost of failure or downtime is extremely high. The Process & Motion Control product portfolio includes gears, couplings, industrial bearings, flattop chain and modular conveyer belts, special components, industrial chain and aerospace bearings and seals.seals, FlatTop™ modular belting, engineered chain and conveying equipment. The products are either incorporated into products sold by original equipment manufacturers (“OEMs”) or sold to end-users through industrial distributors as aftermarket products. Our Water Management platform is a leading supplier ofdesigns, procures, manufactures and markets products that provide and enhance water quality, safety, flow control and conservation. The Water Management product portfolio includes professional grade specification drainage water control, PEXproducts, flush valves and faucet products, Pex piping and commercial brass products, servingengineered valves and gates for the commercial, institutional, civil, municipal, hydropowerwater and public water works construction markets.wastewater treatment market.
2. Significant Accounting Policies
Use of Estimates
The preparation of financial statements in accordance with accounting principles generally accepted in the United StatesGAAP requires management to make estimates and assumptions that affect the amounts reported in the consolidated financial statements and accompanying notes. Actual results could differ from those estimates.
Reclassifications
Certain prior year amounts have been reclassified to conform to the fiscal 20082011 presentation.
Pension and Other Postretirement Benefits—Change in Accounting
During the fourth quarter of fiscal 2011, the Company voluntarily changed its method of accounting for actuarial gains and losses related to its pension and other postretirement benefit plans. Previously, the Company recognized actuarial gains and losses as a component of Stockholders’ Equity on the consolidated balance sheet and amortized the actuarial gains and losses over participants’ average remaining service period, or average remaining life expectancy, when all or almost all plan participants are inactive, as a component of net periodic benefit cost if the unrecognized gain or loss exceeded 10 percent of the greater of the market-related value of
F-7
plan assets or the plan’s projected benefit obligation at the beginning of the year (the “corridor”). Under the new method, the net actuarial gains or losses in excess of the corridor will be recognized immediately in operating results during the fourth quarter of each fiscal year (or upon any re-measurement date). Net periodic benefit costs recorded on a quarterly basis would continue to primarily be comprised of service and interest cost, amortization of unrecognized prior service cost and the expected return on plan assets. While the historical method of recognizing actuarial gains and losses was considered acceptable, the Company believes this method is preferable as it accelerates the recognition of actuarial gains and losses outside of the corridor. In accordance with ASC 250Accounting Changes and Error Corrections (“ASC 250”), the voluntary accounting policy change has been reported through retrospective application of the new policy to all periods presented. The impacts of all adjustments made to the consolidated financial statements is summarized below:
Consolidated Statements of Operations
(in millions, except per share amounts)
| Year Ended March 31, 2009 | ||||||||||||
| Previously Reported | As Adjusted | Effect of Change | ||||||||||
Cost of sales | $ | 1,277.0 | $ | 1,290.1 | $ | (13.1 | ) | |||||
Selling, general and administrative expenses | 316.6 | 467.8 | (151.2 | ) | ||||||||
Loss before income taxes | (336.7 | ) | (501.0 | ) | (164.3 | ) | ||||||
Benefit for income taxes | (8.7 | ) | (72.0 | ) | 63.3 | |||||||
Net loss | (328.0 | ) | (429.0 | ) | (101.0 | ) | ||||||
Basic loss per share | (20.46 | ) | (26.76 | ) | (6.30 | ) | ||||||
Diluted loss per share | (20.46 | ) | (26.76 | ) | (6.30 | ) | ||||||
| Year Ended March 31, 2010 | ||||||||||||
| Previously Reported | As Adjusted | Effect of Change | ||||||||||
Cost of sales | $ | 998.0 | $ | 994.4 | $ | 3.6 | ||||||
Selling, general and administrative expenses | 299.0 | 297.7 | 1.3 | |||||||||
Income before income taxes | 113.7 | 118.6 | 4.9 | |||||||||
Provision for income taxes | 28.6 | 30.5 | (1.9 | ) | ||||||||
Net income | 85.1 | 88.1 | 3.0 | |||||||||
Basic earnings per share | 5.31 | 5.49 | 0.18 | |||||||||
Diluted earnings per share | 5.12 | 5.30 | 0.18 | |||||||||
| Year Ended March 31, 2011 | ||||||||||||
| Recognized Under Previous Method | Recognized Under New Method | Effect of Change | ||||||||||
Cost of sales | $ | 1,105.7 | $ | 1,102.8 | $ | 2.9 | ||||||
Selling, general and administrative expenses | 331.7 | 329.1 | 2.6 | |||||||||
Loss before income taxes | (66.9 | ) | (61.4 | ) | 5.5 | |||||||
Benefit for income taxes | (12.3 | ) | (10.1 | ) | (2.2 | ) | ||||||
Net loss | (54.6 | ) | (51.3 | ) | 3.3 | |||||||
Basic loss per share | (3.41 | ) | (3.20 | ) | 0.21 | |||||||
Diluted loss per share | (3.41 | ) | (3.20 | ) | 0.21 | |||||||
F-8
Consolidated Statements of Stockholders’ Equity (Deficit)
(in millions)
| April 1, 2008 | ||||||||||||
| Previously Reported | As Adjusted | Effect of Change | ||||||||||
Retained earnings (deficit) | $ | 0.1 | $ | (0.6 | ) | $ | (0.7 | ) | ||||
Accumulated other comprehensive income | — | 0.7 | 0.7 | |||||||||
| Year Ended March 31, 2009 | ||||||||||||
| Previously Reported | As Adjusted | Effect of Change | ||||||||||
Retained deficit | $ | (326.6 | ) | $ | (428.3 | ) | $ | (101.7 | ) | |||
Accumulated other comprehensive loss | (131.1 | ) | (29.4 | ) | 101.7 | |||||||
| Year Ended March 31, 2010 | ||||||||||||
| Previously Reported | As Adjusted | Effect of Change | ||||||||||
Retained deficit | $ | (241.5 | ) | $ | (340.2 | ) | $ | (98.7 | ) | |||
Accumulated other comprehensive loss | (99.7 | ) | (1.0 | ) | 98.7 | |||||||
| Year Ended March 31, 2011 | ||||||||||||
| Previously Reported | As Adjusted | Effect of Change | ||||||||||
Retained deficit | $ | (296.1 | ) | $ | (391.5 | ) | $ | (95.4 | ) | |||
Accumulated other comprehensive loss | (79.3 | ) | 16.1 | 95.4 | ||||||||
The effect of the accounting change is also reflected in the Company’s consolidated statements of cash flows in “Net (loss) income” and relevant adjustments to reconcile net (loss) income to net cash provided by operating activities.
Revenue Recognition
Net sales are recorded upon transfer of title and risk of product which occurs upon shipmentloss to the customer. The Company estimates amounts due and records accruals for sales rebates to certain distributors at the time of shipment. Net sales relating to any particular shipment are based upon the amount invoiced for the shippeddelivered goods less estimated future rebate payments and sales returns which are based upon the Company’s historical experience. Revisions to these estimates are recorded in the period in which the facts that give rise to the revision become known. The value of returned goods during the yearyears ended March 31, 20062009, 2010 and during the period from April 1, 2006 through July 21, 2006, the period from July 22, 2006 through March 31, 2007 and the year ended March 31, 20082011 was approximately 1.0% or less than 1.3% of net sales. Other than a standard product warranty, there are no post-shipment obligations.
The Company classifies shipping and handling fees billed to customers as net sales and the corresponding costs are classified as cost of sales in the consolidated statements of operations.
Rexnord Holdings, Inc. and Subsidiaries
Notes to Consolidated Financial Statements—(Continued)
March 31, 2008
Compensated Absences
In the third quarter of fiscal 2007, the Company changed its domestic vacation policy for certain employees so that vacation pay is earned ratably throughout the year and must be used by year-end. The accrual for compensated absences was reduced by $6.7 million in the quarter ended December 30, 2006, to eliminate vacation pay no longer required to be accrued or paid under the current policy.
Share Based Payments
In December 2004, the Financial The Company accounts for share based payments in accordance with ASC 718Accounting Standards Boardfor Stock Compensation (“FASB”) issued the revised Statement of Financial Accounting Standards (“SFAS”) No. 123,Share Based Payment (SFAS 123(R)ASC 718”). SFAS 123(R)ASC 718 requires compensation costs related to share-based payment transactions to be recognized in the financial statements. Generally, compensation cost is measured based on the grant-date fair value of the equity or liability instruments issued. In addition, liability awards are re-measured each reporting period. Compensation cost is recognized over the requisite service period, generally as the awards vest. As a nonpublic entity that previously used the minimum value method for pro forma disclosure purposes under SFAS No. 123, the Company adopted SFAS 123(R) using the prospective transition method of adoption on April 1, 2006. Accordingly, the provisions of SFAS 123(R) are applied prospectively to new awards and to awards modified, repurchased or cancelled after the adoption date. See further discussion of the Company’s stock option plans in Note 14.
F-9
Per Share Data
Basic net income (loss) per share is computed by dividing net income (loss) by the corresponding weighted-average number of common shares outstanding for the period. The dilutive effect of the potential exercise of outstanding stock options to purchase common shares is calculated using the treasury stock method, except when the effect would be anti-dilutive. The denominatorcomputation for diluted net loss per share for the period from July 22, 2006 toyears ended March 31, 20072009 and 2011 excludes 371,004 options703,742 shares and 795,803 shares, respectively, due to their anti-dilutive effects. The Company had 360,068 dilutive shares as of March 31, 2008.
Receivables
Receivables are stated net of allowances for doubtful accounts of $7.4$9.6 million at March 31, 20072010 and $8.9$5.3 million at March 31, 2008.2011. On a regular basis, the Company evaluates its receivables and establishes the allowance for doubtful accounts based on a combination of specific customer circumstances and historical write-off experience. Credit is extended to customers based upon an evaluation of their financial position. Generally, advance payment is not required. Credit losses are provided for in the consolidated financial statements and consistently have been within management’s expectations.
Significant Customers
The Company’s largest customer accounted for 7.7%, 7.1%, and 8.0% of consolidated net sales for the years ended March 31, 2009, 2010 and 2011, respectively. Receivables related to this industrial distributor at March 31, 2010 and 2011 were $10.8 million and $11.5 million, respectively.
Inventories
Inventories are stated at the lower of cost or market. Market is determined based on estimated net realizable values. Approximately 82%70% of the Company’s total inventories as of March 31, 20072010 and 76% of the Company’s total inventories as of March 31, 20082011 were valued using the “last-in, first-out” (LIFO) method. All remaining inventories are valued using the “first-in, first-out” (FIFO) method.
Property, Plant and Equipment
Property, plant and equipment are stated at cost. Depreciation is provided using the straight-line method over 10 to 30 years for buildings and improvements, 5 to 10 years for machinery and equipment and 3 to 5 years for computer hardware and software. Maintenance and repair costs are expensed as incurred.
Rexnord Holdings, Inc. and Subsidiaries
Notes to Consolidated Financial Statements—(Continued)
March 31, 2008
Goodwill and Intangible Assets
Intangible assets consist of acquired trademarks and tradenames, customer relationships (including distribution network), patents and patents.non-compete intangibles. The customer relationships, patents and patentsnon-compete intangibles are being amortized using the straight-line method over their estimated useful lives of 93 to 15 years, 2 to 20 years and 2 to 205 years, respectively. Goodwill, trademarks and tradenames have indefinite lives and are not amortized but are tested annually for impairment using a discounted cash flow analysis.
Deferred Financing Costs
Other assets at March 31, 2007 and March 31, 2008, include deferred financing costs of $77.8 million and $69.0 million, respectively, net of accumulated amortization of $5.1 million and $16.8 million, respectively. These costs were incurred to obtain long-term financing and are being amortized using the effective interest method over the term of the related debt.market value approach analysis.
Impairment of Long-Lived Assets
Long-lived assets, including property, plant and equipment and amortizable intangible assets, are reviewed for impairment whenever events or changes in circumstances indicate that the carrying amount of the long-lived asset may not be recoverable. Long-lived assets held for use are reviewed for impairment by comparing the carrying amount of the long-lived asset or group of assets to the undiscounted future cash flows expected to be generated by such asset over its remaining useful life. If the long-lived asset or group of assets is considered to be
F-10
impaired, an impairment charge is recognized for the amount by which the carrying amount of the asset or group of assets exceeds its fair value. Long-lived assets to be disposed of are reported at the lower of the carrying amount or fair value less cost to sell.
Deferred Financing Costs
Other assets at March 31, 2010 and March 31, 2011, include deferred financing costs of $46.6 million and $27.9 million, respectively, net of accumulated amortization of $37.3 million and $26.7 million, respectively. These costs were incurred to obtain long-term financing and are being amortized using the effective interest method over the term. During the first quarter of fiscal 2011, the Company finalized the results of the cash tender offers and consent solicitations launched on April 7, 2010. In connection with the cash tender offers and solicitation the Company had a non-cash write-off of $25.4 million of unamortized deferred financing costs. Additionally, the Company capitalized $14.6 million of deferred financing costs related to the issuance of $1,145.0 million aggregate principal amount of 8.50% senior notes due 2018 (the “8.50% Notes”). See Note 10 for additional information regarding the cash tender offers and consent solicitations.
Product Warranty
The Company offers warranties on the sales of certain of its products and records an accrual for estimated future claims. Such accruals are based upon historical experience and management’s estimate of the level of future claims. The following table presents changes in the Company’s product warranty liability (in millions):
| Predecessor | ||||||||||||||||||||||||||||||
| Year Ended March 31, 2006 | Period from April 1, 2006 through July 21, 2006 | Period from July 22, 2006 through March 31, 2007 | Year Ended March 31, 2008 | Year Ended March 31, 2009 | Year Ended March 31, 2010 | Year Ended March 31, 2011 | ||||||||||||||||||||||||
Balance at beginning of period | $ | 0.9 | $ | 2.7 | $ | 3.1 | $ | 4.2 | $ | 6.8 | $ | 7.2 | $ | 10.7 | ||||||||||||||||
Acquired obligations | 1.7 | 0.3 | 1.1 | 0.1 | — | 0.1 | — | |||||||||||||||||||||||
Charged to operations | 1.4 | 0.4 | 0.7 | 5.1 | 7.3 | 8.1 | 5.6 | |||||||||||||||||||||||
Claims settled | (1.3 | ) | (0.3 | ) | (0.7 | ) | (2.6 | ) | (6.9 | ) | (4.7 | ) | (7.7 | ) | ||||||||||||||||
Balance at end of period | $ | 2.7 | $ | 3.1 | $ | 4.2 | $ | 6.8 | $ | 7.2 | $ | 10.7 | $ | 8.6 | ||||||||||||||||
Income Taxes
The Company accounts for income taxes in accordance with SFAS No. 109,ASC 740,Accounting for Income Taxes.Taxes (“ASC 740”). Deferred income taxes are provided for future tax effects attributable to temporary differences between the financial statement carrying amounts of existing assets and liabilities and their respective tax bases, net operating
Rexnord Holdings, Inc. and Subsidiaries
Notes to Consolidated Financial Statements—(Continued)
March 31, 2008
losses, tax credits and other applicable carryforwards. Deferred tax assets and liabilities are measured using enacted tax rates expected to apply to taxable income in the years in which those temporary differences are expected to be actually paid or recovered. The effect on deferred tax assets and liabilities of a change in tax rates is recognized in the results of continuing operations in the period that includes the date of enactment.
The Company regularly reviews its deferred tax assets for recoverability and provides a valuation allowance against its deferred tax assets if, based upon consideration of all positive and negative evidence, the Company determines that it is more-likely-than-not that a portion or all of the deferred tax assets will ultimately not be realized in future tax periods. Such positive and negative evidence would include review of historical earnings and losses, anticipated future earnings, the time period over which the temporary differences and carryforwards are anticipated to reverse and implementation of feasible, prudent tax planning strategies.
The Company is subject to income taxes in the United States and numerous foreign jurisdictions. Significant judgment is required in determining the Company’s worldwide provision for income taxes and recording the related deferred tax assets and liabilities. In the ordinary course of the Company’s business, there is inherent uncertainty in quantifying the ultimate tax outcome of all of the numerous transactions and required calculations relating to the Company’s tax positions. Accruals for unrecognized tax benefits are provided for in accordance
F-11
with the requirements of FASB Interpretation (“FIN”) No. 48,Accounting for Uncertainty in Income Taxes.ASC 740. An unrecognized tax benefit represents the difference between the recognition of benefits related to uncertain tax positions for income tax reporting purposes and financial reporting purposes. The Company has established a reserve for interest and penalties, as applicable, for uncertain tax positions and it is recorded as a component of the overall income tax provision.
The Company is subject to periodic income tax examinations by domestic and foreign income tax authorities. Although the outcome of income tax examinations is always uncertain, the Company believes that it has appropriate support for the positions taken on its income tax returns and has adequately provided for potential income tax assessments. Nonetheless, the amounts ultimately settled relating to issues raised by the taxing authorities may differ materially from the amounts accrued for each year.
See Note 16 of the consolidated financial statements for more information on income taxes.
Accumulated Other Comprehensive Income (Loss)
At March 31, 2007,2010, accumulated other comprehensive income (loss)loss consisted of $4.2$6.4 million of foreign currency translation adjustments, $(0.7)gains, $4.0 million of unrealized losses on derivative contracts, net of tax and $(0.2) million of additional minimum pension liability, net of tax. At March 31, 2008, accumulated other comprehensive income (loss) consisted of $18.4 million of foreign currency translation adjustments, $(5.9) million of unrealized losses on derivative contracts, net of tax and $(12.5)$3.4 million of unrecognized actuarial losses and unrecognized prior services costs, net of tax. At March 31, 2011, accumulated other comprehensive income consisted of $14.9 million of foreign currency translation gains, $4.8 million of unrealized losses on derivative contracts, net of tax and $6.0 million of unrecognized actuarial gains and unrecognized prior services costs, net of tax.
Derivative Financial Instruments
The Company accounts for derivative instruments based on SFAS No. 133,Accounting for Derivative Instrumentsis exposed to certain financial risks relating to fluctuations in foreign currency exchange rates and Hedging Activities, as amended (“SFAS 133”).interest rates. The fair value of all derivative financial instruments is recorded in the balance sheet, which is based on the quoted market prices for contracts with similar maturities. The Company selectively uses foreign currency forward exchange contracts and interest rate swap contracts to manage its foreign currency and interest rate risks which is discussed in more detail below.risks. All hedging transactions are authorized and executed pursuant to defined policies and procedures which prohibit the use of financial instruments for speculative purposes.
Rexnord Holdings, Inc. and Subsidiaries
Notes to Consolidated Financial Statements—(Continued)
March 31, 2008
Foreign Currency Forwards
The Company enters intoaccounts for derivative instruments based on ASC 815,Accounting for Derivative Instruments and Hedging Activities (“ASC 815”). ASC 815 requires companies to recognize all of its derivative instruments as either assets or liabilities in the balance sheet at fair value. Fair value is defined under ASC 820,Fair Value Measurements and Disclosures (“ASC 820”), as the exchange price that would be received for an asset or paid to transfer a liability (an exit price) in the principal or most advantageous market for the asset or liability in an orderly transaction between market participants. See more information as it relates to applying fair value to derivative instruments at Note 12. The accounting for changes in the fair value of a derivative instrument depends on whether the derivative instrument has been designated and qualifies as part of a hedging relationship and further, on the type of hedging relationship. For those derivative instruments that are designated and qualify as hedging instruments, a company must designate the hedging instrument, based upon the exposure being hedged, as a fair value hedge, a cash flow hedge or a hedge of a net investment in a foreign exchange forward contracts to mitigateoperation. If the foreign currency volatility relative to certain intercompany cash flows expected to occur withinderivative instrument is designated and qualifies as an effective hedging instrument under ASC 815, the next fiscal year. Thesechanges in the fair value of the effective portion of the instrument are recognized in accumulated other comprehensive income (loss) whereas any changes in the fair value of a derivative contracts didinstrument that is not designated or does not qualify as hedges of future cash flows and, accordingly, were adjusted to fair value at March 31, 2007 and 2008, with the gain or loss includedan effective hedge are recorded in other non-operating income (expense). See Note 11 for further information regarding the classification and accounting for the Company’s derivative financial instruments.
Financial Instrument Counterparties
The Company is exposed to credit losses in the consolidated statementsevent of operations.non-performance by counterparties to its financial instruments. The gain (loss) onCompany anticipates, however, that counterparties will be able to fully satisfy their obligations under these instruments. The Company places cash and temporary investments, foreign currency contracts was $0.5 million, $(0.7) million, $0.4 million and $(2.3) million for the year ended March 31, 2006, the period from April 1, 2006 through July 21, 2006, the period from July 22, 2006 through March 31, 2007 and the year ended March 31, 2008, respectively.its
Interest Rate Swaps
In August 2006, the Company entered into an interest rate collar and an F-12
interest rate swap agreements with various high-quality financial institutions. Although the Company does not obtain collateral or other security to hedgesupport these financial instruments, it does periodically evaluate the variability in future cash flows associated with a portioncredit-worthiness of the Company’s variable-rate term loans. The interest rate collar provides an interest rate flooreach of 4.0% plus the applicable margin and an interest rate cap of 6.065% plus the applicable margin on $262.0 million of the Company’s variable-rate term loans, while the interest rate swap converts $68.0 million of the Company’s variable-rate term loans to a fixed interest rate of 5.14% plus the applicable margin. Both the interest rate collar and the interest rate swap became effective on October 20, 2006 and have a maturity of three years. These interest rate derivatives have been accounted for as effective cash flow hedges in accordance with SFAS 133. The unrealized loss on these interest rate derivatives totaled $1.1 million at March 31, 2007, and $9.7 million at March 31, 2008, and have been recorded on the Company’s consolidated balance sheets as an other long-term liability with a corresponding decrease in accumulated other comprehensive income, net of tax.its counterparties.
Foreign Currency Translation
AssetsAccounting for Income Taxes (“ASC 740”). Deferred income taxes are provided for future tax effects attributable to temporary differences between the financial statement carrying amounts of existing assets and liabilities and their respective tax bases, net operating losses, tax credits and other applicable carryforwards. Deferred tax assets and liabilities are measured using enacted tax rates expected to apply to taxable income in the years in which those temporary differences are expected to be actually paid or recovered. The effect on deferred tax assets and liabilities of subsidiaries operating outsidea change in tax rates is recognized in the results of continuing operations in the period that includes the date of enactment.
The Company regularly reviews its deferred tax assets for recoverability and provides a valuation allowance against its deferred tax assets if, based upon consideration of all positive and negative evidence, the Company determines that it is more-likely-than-not that a portion or all of the deferred tax assets will ultimately not be realized in future tax periods. Such positive and negative evidence would include review of historical earnings and losses, anticipated future earnings, the time period over which the temporary differences and carryforwards are anticipated to reverse and implementation of feasible, prudent tax planning strategies.
The Company is subject to income taxes in the United States with a functional currency other thanand numerous foreign jurisdictions. Significant judgment is required in determining the U.S. dollar are translated into U.S. dollars using exchange rates atCompany’s worldwide provision for income taxes and recording the endrelated deferred tax assets and liabilities. In the ordinary course of the respective period. RevenuesCompany’s business, there is inherent uncertainty in quantifying the ultimate tax outcome of all of the numerous transactions and expensesrequired calculations relating to the Company’s tax positions. Accruals for unrecognized tax benefits are provided for in accordance
F-11
with the requirements of such entities are translated at average exchange rates in effect duringASC 740. An unrecognized tax benefit represents the respective period. Foreign currency translation adjustments are includeddifference between the recognition of benefits related to uncertain tax positions for income tax reporting purposes and financial reporting purposes. The Company has established a reserve for interest and penalties, as applicable, for uncertain tax positions and it is recorded as a component of the overall income tax provision.
The Company is subject to periodic income tax examinations by domestic and foreign income tax authorities. Although the outcome of income tax examinations is always uncertain, the Company believes that it has appropriate support for the positions taken on its income tax returns and has adequately provided for potential income tax assessments. Nonetheless, the amounts ultimately settled relating to issues raised by the taxing authorities may differ materially from the amounts accrued for each year.
See Note 16 for more information on income taxes.
Accumulated Other Comprehensive Income (Loss)
At March 31, 2010, accumulated other comprehensive loss consisted of $6.4 million of foreign currency translation gains, $4.0 million of unrealized losses on derivative contracts, net of tax and $3.4 million of unrecognized actuarial losses and unrecognized prior services costs, net of tax. At March 31, 2011, accumulated other comprehensive income consisted of $14.9 million of foreign currency translation gains, $4.8 million of unrealized losses on derivative contracts, net of tax and $6.0 million of unrecognized actuarial gains and unrecognized prior services costs, net of tax.
Derivative Financial Instruments
The Company is exposed to certain financial risks relating to fluctuations in foreign currency exchange rates and interest rates. The Company selectively uses foreign currency forward contracts and interest rate swap contracts to manage its foreign currency and interest rate risks. All hedging transactions are authorized and executed pursuant to defined policies and procedures which prohibit the use of financial instruments for speculative purposes.
The Company accounts for derivative instruments based on ASC 815,Accounting for Derivative Instruments and Hedging Activities (“ASC 815”). ASC 815 requires companies to recognize all of its derivative instruments as either assets or liabilities in the balance sheet at fair value. Fair value is defined under ASC 820,Fair Value Measurements and Disclosures (“ASC 820”), as the exchange price that would be received for an asset or paid to transfer a liability (an exit price) in the principal or most advantageous market for the asset or liability in an orderly transaction between market participants. See more information as it relates to applying fair value to derivative instruments at Note 12. The accounting for changes in the fair value of a derivative instrument depends on whether the derivative instrument has been designated and qualifies as part of a hedging relationship and further, on the type of hedging relationship. For those derivative instruments that are designated and qualify as hedging instruments, a company must designate the hedging instrument, based upon the exposure being hedged, as a fair value hedge, a cash flow hedge or a hedge of a net investment in a foreign operation. If the derivative instrument is designated and qualifies as an effective hedging instrument under ASC 815, the changes in the fair value of the effective portion of the instrument are recognized in accumulated other comprehensive income (loss). Currency transaction gains and losses whereas any changes in the fair value of a derivative instrument that is not designated or does not qualify as an effective hedge are includedrecorded in other non-operating income (expense) in. See Note 11 for further information regarding the consolidated statements of operationsclassification and totaled $(0.4) million, $(1.1) million, $(0.3) million and $(5.1) millionaccounting for the year ended March 31, 2006, the period from April 1, 2006 through July 21, 2006, the period from July 22, 2006 through March 31, 2007 and the year ended March 31, 2008, respectively.
Advertising Costs
Advertising costs are charged to selling, general and administrative expenses as incurred and amounted to $3.9 million, $1.4 million, $4.8 million and $9.9 million for the year ended March 31, 2006, the period from April 1, 2006 through July 21, 2006, the period from July 22, 2006 through March 31, 2007 and the year ended March 31, 2008, respectively.
Research and Development Costs
Research and development costs are charged to selling, general and administrative expenses as incurred and amounted to $6.2 million, $1.9 million, $4.9 million and $8.5 million for the year ended March 31, 2006, the period from April 1, 2006 through July 21, 2006, the period from July 22, 2006 through March 31, 2007 and the year ended March 31, 2008, respectively.
Rexnord Holdings, Inc. and SubsidiariesCompany’s derivative financial instruments.
Notes to Consolidated Financial Statements—(Continued)
March 31, 2008
Concentrations of Credit Risk
Financial instruments that potentially subject the Company to significant concentrations of credit risk consist of cash and temporary investments, forward currency contracts, interest rate swap/collar agreements and trade accounts receivable.
Financial Instrument Counter PartiesCounterparties
The Company is exposed to credit losses in the event of non-performance by counter partiescounterparties to its financial instruments. The Company anticipates, however, that counter partiescounterparties will be able to fully satisfy their obligations under these instruments. The Company places cash and temporary investments, foreign currency forward contracts and its
F-12
interest rate swap/collarswap agreements with various high-quality financial institutions. Although the Company does not obtain collateral or other security to support these financial instruments, it does periodically evaluate the credit-worthiness of each of its counterparties.
Significant Customers
The Company’s Power Transmission group has a customer, Motion Industries Inc. (an industrial distributor), that accounted for 11.8%, 11.4%, 10.4% and 8.1% of consolidated net sales for the year ended March 31, 2006, the period from April 1, 2006 through July 21, 2006, the period from July 22, 2006 through March 31, 2007 and the year ended March 31, 2008, respectively. Receivables related to this industrial distributor at March 31, 2007 and 2008 were $12.2 million and $11.9 million, respectively. Ferguson, the Company’s largest Water Management customer, represented approximately 6% of consolidated net sales during the year ended March 31, 2008. Sales to Ferguson did not represent a significant percentage of consolidated net sales in the fiscal year ended March 31, 2007 as Zurn was only included in the Company’s results of operations from February 7, 2007 through March 31, 2007. Receivables related to this wholesale distributor at March 31, 2007 and 2008 were $19.4 million and $18.9 million, respectively.
Fair Value of Non-Derivative Financial Instruments
The carrying amounts of cash, receivables, payables and accrued liabilities approximated fair value at March 31, 2007 and 2008 due to the short-term nature of those instruments. The fair value of long-term debt as of March 31, 2007 and 2008 was approximately $2,534.1 million and $2,218.1 million, respectively, based on quoted market prices for the same or similar issues.
Recent Accounting Pronouncements
In June 2006, the FASB issued FIN 48,Accounting for Uncertainty in Income Taxes, which addresses the accounting for uncertainty in income taxes recognized in accordance with SFAS No. 109, Accounting for Income Taxes. FIN 48 prescribes a recognition threshold and measurement attribute for the financial statement recognition and measurement of a tax position taken or expected to be taken in a tax return. FIN 48 is effective for fiscal years that begin after December 15, 2006. The Company has adopted FIN 48 as of April 1, 2007, as required. As a result of the adoption of FIN 48, the Company recognized a $5.5 million decrease in the liability for unrecognized tax benefits, with an offsetting reduction to goodwill. Further discussion regarding the adoption of FIN 48 can be found in Note 16.
In September 2006, the FASB issued SFAS No. 157,Fair Value Measurements (“SFAS 157”), as amended in February 2008 by FSP FAS 157-2,Effective Date of FASB Statement No. 157.The provisions of SFAS 157 are
Rexnord Holdings, Inc. and Subsidiaries
Notes to Consolidated Financial Statements—(Continued)
March 31, 2008
effective for the Company as of April 1, 2008. However, FSP FAS 157-2 defers the effective date for all nonfinancial assets and liabilities, except those recognized or disclosed at fair value on an annual or more frequent basis, until April 1, 2009. SFAS 157 defines fair value, creates a framework for measuring fair value in generally accepted accounting principles and expands disclosures about fair value measurements. The Company does not expect the adoption of SFAS 157 to have a material impact on its financial statements.
In September 2006, the FASB released SFAS No. 158,Employers’ Accounting for Defined Benefit Pension and Other Postretirement Plans, an amendment of FASB Statements No. 87, 88, 106, and 132(R)(“SFAS 158”). Under the new standard, companies must recognize a net liability or asset to report the funded status of their defined benefit pension and other postretirement benefit plans on their balance sheets. The Company was required to adopt the recognition and disclosure provisions of SFAS 158 as of March 31, 2008. See Note 15 for the incremental effects of adopting SFAS 158.
In February 2007, the FASB issued SFAS No. 159,The Fair Value Option for Financial Assets and Financial Liabilities (“SFAS 159”), which permits all entities to choose to measure eligible items at fair value on specified election dates. The associated unrealized gains and losses on the items for which the fair value option has been elected shall be reported in earnings. SFAS 159 is effective for financial statements issued for fiscal years beginning after November 15, 2007. The Company does not expect the adoption of SFAS 159 to have a material impact on its financial statements.
In December 2007, the FASB issued SFAS No. 160,Noncontrolling Interests in Consolidated Financial Statements—an amendment of ARB No. 51 (“SFAS 160”). SFAS 160 requires a company to clearly identify and present ownership interests in subsidiaries held by parties other than the company in the consolidated financial statements within the equity section but separate from the company’s equity. It also requires the amount of consolidated net income attributable to the parent and to the noncontrolling interest be clearly identified and presented on the face of the consolidated statement of operations; changes in ownership interest be accounted for similarly, as equity transactions; and when a subsidiary is deconsolidated, any retained noncontrolling equity investment in the former subsidiary and the gain or loss on the deconsolidation of the subsidiary be measured at fair value. This statement is effective for fiscal years, and interim periods within those fiscal years, beginning on or after December 15, 2008, and earlier application is prohibited. The Company is currently evaluating the requirements of SFAS 160 and does not expect adoption of SFAS 160 will have a material impact on its financial statements.
In December 2007, the FASB issued SFAS No. 141(R),Business Combinations (“SFAS 141(R)”). The objective of SFAS 141(R) is to improve the information provided in financial reports about a business combination and its effects. SFAS 141(R) states that all business combinations (whether full, partial or step acquisitions) must apply the “acquisition method.” In applying the acquisition method, the acquirer must determine the fair value of the acquired business as of the acquisition date and recognize the fair value of the acquired assets and liabilities assumed. As a result, it will require that certain forms of contingent consideration and certain acquired contingencies be recorded at fair value at the acquisition date. SFAS 141(R) also states acquisition costs will generally be expensed as incurred and restructuring costs will be expensed in periods after the acquisition date. This statement is effective for business combination transactions for which the acquisition date is on or after April 1, 2009, and earlier application is prohibited. The Company is currently evaluating the requirements of SFAS 141(R) and will apply the statement to any acquisitions after March 31, 2009.
In March 2008, the FASB issued SFAS No. 161,Disclosures about Derivative Instruments and Hedging Activities-an amendment of FASB Statement No. 133 (“SFAS 161”).This Statement changes the disclosure requirements for derivative instruments and hedging activities. Entities are required to provide enhanced
Rexnord Holdings, Inc. and Subsidiaries
Notes to Consolidated Financial Statements—(Continued)
March 31, 2008
disclosures about (a) how and why an entity uses derivative instruments, (b) how derivative instruments and related hedged items are accounted for under Statement 133 and its related interpretations, and (c) how derivative instruments and related hedged items affect an entity’s financial position, financial performance, and cash flows. This statement is effective for financial statements issued for fiscal years and interim periods beginning after November 15, 2008. The Company is currently reviewing the requirements of SFAS 161 to determine the impact on its financial statements.
3. Acquisitions and Divestiture
The Sale of Rexnord SAS
On March 28, 2008, the Company sold a French subsidiary, Rexnord SAS, to members of that company’s local management team for €1 (one Euro), subject to a customary post-close working capital adjustment. The Company made the decision to sell Rexnord SAS to the local management team for one Euro as the business would have required a substantial investment (both financial and by Company management) to increase the overall market share position of certain products sold by the business to levels consistent with the Company’s long-term strategic plan. Rexnord SAS was a wholly owned subsidiary located in Raon, France with approximately 140 employees. This entity occupied a 217,000 square foot manufacturing facility that supported portions of the Company’s European Power Transmission business. In connection with the sale, the Company recorded a pretax loss on divestiture of approximately $11.2 million (including transaction costs), which was recognized in the Company’s fourth quarter of the year ended March 31, 2008. This loss includes Rexnord SAS’s cash on hand of $2.5 million at March 28, 2008, that pursuant to the agreement was included with the net assets divested. Also as part of the transaction, the Company signed a supplemental commercial agreement defining the prospective commercial relationship between the Company and the divested entity (“PTP Industry”). Through this agreement, the Company will retain its direct access to key regional distributors and in return has agreed to purchase from PTP Industry certain locally manufactured coupling product lines and components to serve its local customer base. The divestiture is not expected to have a material impact on the Company’s overall capabilities or results of operations.
The GA Acquisition
On January 31, 2008, the Company utilized existing cash balances to purchase GA Industries, Inc.(“GA”) for $73.7 million, net of $3.2 million of cash acquired. This acquisition expanded the Company’s Water Management platform into the water and wastewater markets, specifically in municipal, hydropower and industrial environments. GA Industries, Inc. is comprised of GA Industries and Rodney Hunt Company, Inc. GA Industries is a manufacturer of automatic control valves, check valves and air valves. Rodney Hunt Company, Inc., its wholly owned subsidiary at the time of closing, is a leader in the design and manufacture of sluice/slide gates, butterfly valves and other specialized products for municipal, industrial, and hydropower applications. The Company is still in the process of finalizing third-party appraisals of the acquired property, plant and equipment and certain identifiable intangible assets, as well as the tax effects of the related temporary differences. Accordingly, final adjustments to the purchase price allocation may be required. The Company expects to finalize the purchase price allocation within one year from the date of the acquisition.
Rexnord Holdings, Inc. and Subsidiaries
Notes to Consolidated Financial Statements—(Continued)
March 31, 2008
The following table summarizes the estimated fair value of the acquired assets and assumed liabilities of GA at the date of acquisition (in millions):
Cash | $ | 3.2 | ||
Short-term investments | 6.7 | |||
Receivables | 16.4 | |||
Inventories | 19.7 | |||
Other current assets | 1.3 | |||
Property, plant and equipment | 17.2 | |||
Intangible assets | 19.4 | |||
Goodwill | 23.3 | |||
Total assets acquired | 107.2 | |||
Accounts payable | 2.6 | |||
Accrued liabilities | (6.4 | ) | ||
Deferred taxes | (15.8 | ) | ||
Debt | (5.5 | ) | ||
Net assets acquired | $ | 76.9 | ||
Approximately $6.6 million of the short-term investments were sold prior to March 31, 2008. These short-term investments consisted primarily of common stocks and other marketable securities. The $19.4 million of acquired intangible assets consist of $10.6 million of tradenames, $8.4 million of customer relationships and a patent of $0.4 million. The acquired customer relationships and patent are being amortized over their estimated useful lives (9—12 years for customer relationships and 16 years for the patent). The acquired intangibles have a weighted average amortization period of 10.8 years (10.7 years for customer relationships and 16.0 years for the acquired patent). The acquired tradenames have an indefinite life and are not being amortized but are tested annually for impairment. Goodwill is not expected to be deductible for income tax purposes. The Company’s results of operations include GA from February 1, 2008 through March 31, 2008.
The Zurn Acquisition
On October 11, 2006, Jacuzzi Brands, Inc., (“Jacuzzi”) an unaffiliated company, entered into an agreement and plan of merger with Jupiter, an affiliate of Apollo. Upon consummation of that merger on February 7, 2007, Jacuzzi became a wholly owned subsidiary of Jupiter and was therefore beneficially owned by affiliates of Apollo. Also on October 11, 2006, the Company entered into an agreement with Jupiter, to acquire the water management business (“Zurn”) of Jacuzzi Brands, Inc. Upon the consummation of the Jacuzzi merger with Jupiter, Apollo caused Jacuzzi to sell the assets of its bath business to Bath Acquisition Corp., an affiliate of Apollo, leaving Zurn as Jacuzzi’s sole business operation. Subsequently, on February 7, 2007, the Company acquired the common stock of Jacuzzi, and therefore, Zurn, from an affiliate of Apollo for a cash purchase price of $942.5 million, including transaction costs and additional deferred financing fees. The purchase price was financed through an equity investment by Apollo and its affiliates of approximately $282.0 million and debt financing of approximately $669.3 million, consisting of (i) $319.3 million of 9.50% senior notes due 2014 (including a bond issue premium of $9.3 million), (ii) $150.0 million of 8.875% senior notes due 2016 and (iii) $200.0 million of borrowings under existing senior secured credit facilities. The transaction was approved both by the stockholders of the Company, as required by Delaware law in the case of an affiliate transaction of this type, and unanimously by the Company’s board of directors, including those who were not affiliated with Apollo. In each case the stockholders and the unaffiliated directors assessed the transaction and the purchase price to be paid for Jacuzzi from the perspective of what was in the best interests of the Company and all of its stockholders,
Rexnord Holdings, Inc. and Subsidiaries
Notes to Consolidated Financial Statements—(Continued)
March 31, 2008
when taking into account the benefits they expected the Company to realize from the transaction. Further, upon completion of their review of the transaction, the board of directors made the determination that the acquisition of Jacuzzi was made on terms not materially less favorable to RBS Global than those that could have been obtained in a comparable transaction between RBS Global and an unrelated person, as required by the indentures governing the debt securities of RBS Global and Rexnord, LLC. This acquisition created a new strategic water management platform for the Company which broadened the Company’s product portfolio and expanded the Company’s end markets.
The acquisition has been accounted for using the purchase method of accounting. The purchase price was allocated to identifiable assets acquired and liabilities assumed based upon their estimated fair values. The following table summarizes the estimated fair value of the acquired assets and assumed liabilities of Zurn at the date of acquisition (in millions):
Cash | $ | 55.9 | ||
Receivables | 61.3 | |||
Inventories | 170.9 | |||
Other current assets | 2.8 | |||
Property, plant and equipment | 46.0 | |||
Intangible assets | 404.2 | |||
Goodwill | 359.4 | |||
Other assets | 256.5 | |||
Total assets acquired | �� | 1,357.0 | ||
Accounts payable | (24.0 | ) | ||
Accrued liabilities | (231.7 | ) | ||
Deferred taxes | (167.5 | ) | ||
Net assets acquired | $ | 933.8 | ||
The $404.2 million of acquired intangible assets consisted of $124.4 million of tradenames, $250.8 million of customer relationships and $29.0 million of patents. The acquired customer relationships and patents are being amortized over their estimated useful lives (15 years for customer relationships and 5 to 20 years for patents). The acquired intangibles have a weighted average amortization period of 14.4 years (15 years for customer relationships and 9.6 years for patents). The acquired tradenames have an indefinite life and are not being amortized but are tested annually for impairment. The purchase price of this acquisition exceeded the fair value of identifiable tangible and intangible assets, which created goodwill. The goodwill reflects the expectation that the acquisition of Zurn will provide increased earnings to the Company and a strategic platform from which the combined entity can actively pursue growth opportunities, both domestically and internationally. Most of the acquired goodwill is not expected to be deductible for income tax purposes.
The income approach was used to value the significant intangible assets acquired in the Zurn acquisition. The income approach is a valuation technique that capitalizes the anticipated income stream from the intangible assets. This approach is predicated on developing either a cash flow or income projections, over the useful lives of the assets, which are then discounted for risk and time value. Below is a discussion of certain methodologies and assumptions used to value each significant class of intangible assets acquired in the Zurn acquisition.
Tradenames
Discounted cash flow calculations for tradenames utilize a relief from royalty concept which utilizes three principal assumptions (sales forecasts for the specific tradename, a royalty rate and a discount or required rate of return) to derive the value of the Company’s individual trade names.
Rexnord Holdings, Inc. and Subsidiaries
Notes to Consolidated Financial Statements—(Continued)
March 31, 2008
Patents
Discounted cash flow calculations for patents utilize the following significant assumptions: future forecasts of revenues for each product that the patent is associated with, a royalty rate, a discount rate and the expected life of the individual patent.
Customer Relationships
Discounted cash flow calculations for customer relationships use an excess earnings approach to value customer relationships. This approach develops a cash flow stream based on the revenues attributed to Zurn’s existing customer list assuming a future growth rate and reduced to account for attrition due to the loss of customers. The estimated life is estimated to be 15 years based upon the customer base and historical customer relationships.
The Company’s results of operations for the period from July 22, 2006 through March 31, 2007 only include Zurn for the period from February 8, 2007 through March 31, 2007.
The Apollo Acquisition and Related Financing
On July 21, 2006, certain affiliates of Apollo purchased the operating company from The Carlyle Group and management for approximately $1.825 billion, excluding transaction fees, through the merger of Chase Merger Sub, Inc., an entity formed and controlled by Apollo, with and into RBS Global, Inc., an indirect wholly owned subsidiary of the Company (the “Merger”). The Merger was financed with (i) $485.0 million of 9.50% senior notes due 2014, (ii) $300.0 million of 11.75% senior subordinated notes due 2016, (iii) $645.7 million of borrowings under new senior secured credit facilities (consisting of a seven-year $610.0 million term loan facility, which matures in July 2013, and $35.7 million of borrowings under a six-year $150.0 million revolving credit facility, which expires in July 2012) and (iv) $475.0 million of equity contributions (consisting of a $438.0 million cash contribution from Apollo and $37.0 million of rollover stock and stock options held by management participants). The proceeds from the Apollo cash contribution and the new financing arrangements, net of related debt issuance costs, were used to (i) purchase the operating company from its then existing shareholders for $1,018.4 million, including transaction costs; (ii) repay all outstanding borrowings under the Predecessor’s previously existing credit agreement as of the Merger Date, including accrued interest; (iii) repurchase substantially all of the Predecessor’s $225.0 million of 10.125% senior subordinated notes outstanding as of the Merger Date pursuant to a tender offer, including accrued interest and tender premium; and (iv) pay certain seller-related transaction costs.
The Merger has been accounted for using the purchase method of accounting and, accordingly, resulted in a new basis of accounting for the Company. The purchase price was allocated to identifiable assets acquired and liabilities assumed based upon their estimated fair values resulting in $946.5 million of goodwill, most of which is not expected to be deductible for income tax purposes. The primary reasons for the Apollo acquisition and the acquired goodwill relate to the expectation that the Company has the ability to grow sales and earnings through existing operations and actively pursue growth opportunities both domestically and internationally.
Rexnord Holdings, Inc. and Subsidiaries
Notes to Consolidated Financial Statements—(Continued)
March 31, 2008
The following table summarizes the estimated fair values of the Company’s assets and assumed liabilities at the date of acquisition (in millions):
Cash | $ | 11.3 | ||
Receivables | 161.3 | |||
Inventories | 233.5 | |||
Other current assets | 23.3 | |||
Property, plant and equipment | 380.2 | |||
Intangible assets | 537.1 | |||
Goodwill | 946.5 | |||
Other assets | 57.5 | |||
Total assets acquired | 2,350.7 | |||
Accounts payable | (110.7 | ) | ||
Accrued liabilities | (247.1 | ) | ||
Deferred taxes | (158.5 | ) | ||
Debt | (1,435.7 | ) | ||
Net assets acquired | $ | 398.7 | ||
The $398.7 million of net assets acquired consists of Apollo’s $438.0 million cash contribution and $3.8 million of carryover basis in rollover stock, net of a $43.1 million deemed cash dividend to the selling shareholders that was required to be recognized by Emerging Issues Task Force Issue No. 88-16,Basis in Leveraged Buyout Transactions, due to the increased leverage of the Company.
The $537.1 million of acquired intangible assets consisted of $242.2 million of tradenames, $269.4 million of customer relationships, $21.0 million of patents, $0.6 million of acquired software and a $3.9 million covenant not to compete. The acquired customer relationships, patents, software, and covenant not to compete are being amortized over their useful lives (10 years for customer relationships, 2 to 14 years for patents, one year for software and 0.4 years for the covenant not to compete). The acquired intangibles have a weighted average amortization period of 9.9 years (10 years for customer relationships, 11.3 years for patents, one year for software and 0.4 years for the covenant not to compete). The acquired tradenames have an indefinite life and are not being amortized but are tested annually for impairment.
The income approach was used to value the significant intangible assets acquired in the Apollo acquisition. The income approach is a valuation technique that capitalizes the anticipated income stream from the intangible assets. This approach is predicated on developing either a cash flow or income projections, over the useful lives of the assets, which are then discounted for risk and time value. Below is a discussion of certain methodologies and assumptions used to value each significant class of intangible asset acquired in the Apollo acquisition.
Tradenames
Discounted cash flow calculations for tradenames utilize a relief from royalty concept which utilizes three principal assumptions (sales forecasts for the specific tradename, a royalty rate, and a discount or required rate of return) to derive the value of the Company’s individual trade names.
Rexnord Holdings, Inc. and Subsidiaries
Notes to Consolidated Financial Statements—(Continued)
March 31, 2008
Patents
Discounted cash flow calculations for patents utilize the following significant assumptions: future forecasts of revenues for each product that the patent is associated with, a royalty rate, a discount rate and an expected life of the individual patent.
Customer Relationships
Discounted cash flow calculations for customer relationships use an excess earnings approach to value customer relationships. This approach develops a cash flow stream based on the revenues attributed to the existing customer list for Rexnord’s operating divisions assuming a future growth rate and reduced to account for attrition due to the loss of customers. The estimated life is estimated to be 10 years based upon the customer base and historical customer relationships.
Acquisition of Dalong Chain Company
On July 11, 2006, the Company acquired Dalong Chain Company (“Dalong”) located in China for $5.9 million, net of $0.4 million of cash acquired, plus the assumption of certain liabilities. The acquisition was financed primarily with on-hand cash and was accounted for using the purchase method of accounting. This acquisition did not have a material impact on the Company’s fiscal 2007 and 2008 consolidated results of operations.
Acquisition of The Falk Corporation
On May 16, 2005, the Company acquired The Falk Corporation (“Falk”) from Hamilton Sundstrand, a division of United Technologies Corporation (“UTC”), for $301.3 million ($306.2 million purchase price including transaction related expenses, net of cash acquired of $4.9 million) and the assumption of certain liabilities. The acquisition of Falk was funded by a $312.0 million term loan and was accounted for using the purchase method of accounting. During fiscal 2006, the allocation of the Falk purchase price to identifiable assets acquired and liabilities assumed resulted in the recording of $95.3 million of goodwill.
Pro Forma Financial Information
The following table sets forth the unaudited pro forma financial information for the Company as if the Apollo and Zurn acquisitions (and the related issuance of debt) had occurred as of the beginning of fiscal year 2007 (in millions, except per share amounts):
| Year Ended March 31, 2007 (Unaudited) | ||||
Net sales | $ | 1,646.8 | ||
Net loss | $ | (18.3 | ) | |
Net loss per share-basic and diluted | $ | (1.19 | ) | |
Weighted-average number of shares outstanding-basic and diluted | 15.4 | |||
4. Canal Street Facility Accident
On December 6, 2006, the Company experienced an explosion at its primary gear manufacturing facility (“Canal Street”), in which three employees lost their lives and approximately 45 employees were injured. Canal Street is
Rexnord Holdings, Inc. and Subsidiaries
Notes to Consolidated Financial Statements—(Continued)
March 31, 2008
comprised of over 1.1 million square feet among several buildings, and employed approximately 750 associates prior to the accident. The accident resulted from a leak in an underground pipe related to a backup propane gas system that was being tested. The explosion destroyed approximately 80,000 square feet of warehouse, storage and non-production buildings, and damaged portions of other production areas. The Canal Street facility manufactures portions of the Company’s gear product line and, to a lesser extent, the Company’s coupling product line. The Company’s core production capabilities were substantially unaffected by the accident. As of the end of the second quarter of fiscal 2008, production at the Canal Street facility had returned to pre-accident levels. Throughout the year ended March 31, 2008, approximately $11.2 million of capital expenditures have been made in connection with the reconstruction of the facility. The reconstruction efforts were substantially complete as of March 31, 2008.
For the period from December 6, 2006 through March 31, 2007, the year ended March 31, 2008 and the accident to-date period from December 6, 2006 through March 31, 2008, the Company has recorded the following (gains)/losses related to this incident (in millions):
| Accident to-date | ||||||||||||
| Period from December 6, 2006 through March 31, 2007 | Year Ended March 31, 2008 | Period from December 6, 2006 through March 31, 2008 | ||||||||||
Insurance deductibles | $ | 1.0 | $ | — | $ | 1.0 | ||||||
Professional services | 1.8 | (0.1 | ) | 1.7 | ||||||||
Clean-up and restoration expenses | 18.3 | 5.0 | 23.3 | |||||||||
Non-cash asset impairments: | ||||||||||||
Inventories | 7.1 | 0.3 | 7.4 | |||||||||
Property, plant and equipment, net | 2.6 | — | 2.6 | |||||||||
Other | 0.2 | — | 0.2 | |||||||||
Subtotal prior to property insurance recoveries | 31.0 | 5.2 | 36.2 | |||||||||
Less property insurance recoveries | (27.0 | ) | (23.4 | ) | (50.4 | ) | ||||||
Subtotal prior to business interruption insurance recoveries | 4.0 | (18.2 | ) | (14.2 | ) | |||||||
Less business interruption insurance recoveries | (10.0 | ) | (11.0 | ) | (21.0 | ) | ||||||
(Gain) on Canal Street facility accident, net | $ | (6.0 | ) | $ | (29.2 | ) | $ | (35.2 | ) | |||
Summary of total insurance recoveries: | ||||||||||||
Total property and business interruption insurance recoveries | $ | 37.0 | $ | 34.4 | $ | 71.4 | ||||||
The Company recognized a net gain of $35.2 million related to the Canal Street facility accident from the date of the accident (December 6, 2006) through March 31, 2008. $14.2 million of the net gain represents the excess property insurance recoveries (at replacement value) over the write-off of tangible assets (at net book value) and other direct expenses related to the accident. The remaining $21.0 million gain is comprised of business interruption insurance recoveries.
The Company has substantial property, business interruption and casualty insurance. The property and business interruption insurance provides coverage of up to $2.0 billion per incident. The casualty insurance provides coverage in excess of approximately $100.0 million per incident. The aggregate amount of deductibles under all applicable insurance coverage is $1.0 million. In addition to its insurance deductibles, the Company has and may continue to incur certain other incremental and non-reimbursable out-of-pocket expenses as a result of the explosion. For the period from December 6, 2006 (the date of loss) through March 31, 2008, the Company has recorded recoveries from its insurance carrier totaling $71.4 million, of which $50.4 million has been allocated to recoveries attributable to property loss and $21.0 million of which has been allocated to recoveries
Rexnord Holdings, Inc. and Subsidiaries
Notes to Consolidated Financial Statements—(Continued)
March 31, 2008
attributable to business interruption loss. On December 5, 2007, the Company finalized its property and business interruption claims with its property insurance carrier. Accordingly, no additional insurance proceeds related to such property and business interruption coverage are expected in future periods. As of March 31, 2008, the Company and its casualty insurance carrier continue to manage ongoing general liability and workers’ compensation claims. Management believes that the limits of such coverage will be in excess of the general liability and workers’ compensation losses incurred. As of March 31, 2008, the Company has accrued for all costs related to the Canal Street facility accident that are probable and can be reasonably estimated. The Company does not expect to incur any significant losses in future periods.
5. Restructuring and Other Similar Costs
Restructuring and other similar costs totaled $31.8 million for fiscal year ended March 31, 2006 and relate to plans the Company initiated to restructure certain manufacturing operations and reduce headcount at certain locations, including the continuation of certain Falk plant consolidation activity that had been initiated prior to the Company’s acquisition of Falk. The Company did not incur any restructuring expense in fiscal 2007 or 2008.
Restructuring and other similar costs are summarized as follows (in millions):
| Predecessor | |||
| Year Ended March 31, 2006 | |||
Consolidation and integration costs | $ | 16.5 | |
Severance, recruiting and relocation cost | 7.7 | ||
Subtotal | 24.2 | ||
Non-cash fixed asset impairments | 6.9 | ||
Excess and obsolete inventory (charged to cost of sales) | 0.7 | ||
Total restructuring and other similar costs | $ | 31.8 | |
Consolidation and Integration Costs
Consolidation and integration costs in fiscal 2006 consist primarily of (i) the closure of the Company’s Coupling plant in Warren, Pennsylvania, (ii) the closure of the Company’s Flattop plant in Puerto Rico, and (iii) Falk integration costs, including the continuation of certain Falk plant consolidation efforts that had been initiated prior to the Falk Acquisition. All of these consolidation and integration actions were completed as of March 31, 2007.
Severance, Recruiting and Relocation Costs
Severance, recruiting and relocation costs relate to certain headcount reduction and management realignment initiatives. Costs for the year ended March 31, 2006 included $6.3 million of severance, $0.6 million of relocation expenses and $0.8 million of recruiting expenses.
Non-cash Fixed Asset Impairments
Non-cash fixed asset impairments in fiscal 2006 relate primarily to the Company’s decision to close the FlatTop plant in Puerto Rico and the decision to outsource certain portions of the Company’s Industrial Chain manufacturing operations.
Rexnord Holdings, Inc. and Subsidiaries
Notes to Consolidated Financial Statements—(Continued)
March 31, 2008
Excess and Obsolete Inventory
The Company recorded a charge of $0.7 million in fiscal 2006 to write-off certain excess and obsolete inventory in connection with plant consolidation and integration activities. The charge is included in cost of sales in the consolidated statement of operations.
Restructuring Accrual Cash Analysis
An analysis of the restructuring accrual is summarized as follows (in millions):
| Predecessor | ||||||||||||||||||
| Year Ended March 31, 2006 | Period from April 1, 2006 through July 21, 2006 | Period from July 22, 2006 through March 31, 2007 | Year Ended March 31, 2008 | |||||||||||||||
Balance at beginning of period | $ | 2.3 | $ | 2.5 | $ | 1.3 | $ | 0.2 | ||||||||||
Restructuring and other similar costs charged to operations | 24.2 | — | — | — | ||||||||||||||
Cash payments | (24.0 | ) | (1.2 | ) | (1.1 | ) | (0.2 | ) | ||||||||||
Balance at end of period | $ | 2.5 | $ | 1.3 | $ | 0.2 | $ | — | ||||||||||
6. Transaction-Related Costs
The Company expensed the following transaction-related costs in connection with the Merger (in millions):
| Predecessor | |||
| Period from April 1, 2006 through July 21, 2006 | |||
Seller-related expenses | $ | 19.1 | |
Bond tender premium | 23.1 | ||
Write-off deferred financing fees | 20.5 | ||
| $ | 62.7 | ||
Seller-related expenses consist of investment banking fees, outside attorney fees, and other third-party fees. The bond tender premium relates to the Company’s $225.0 million of senior subordinated notes, substantially all of which were repurchased in connection with the Merger. The Company also incurred a non-cash charge of $20.5 million to write-off the remaining net book value of previously-capitalized financing fees related to the Company’s term loans and senior subordinated notes that were repaid/repurchased in connection with the Merger.
7. Recovery Under Continued Dumping and Subsidy Offset Act (“CDSOA”)
The U.S. government has eight anti-dumping duty orders in effect against certain foreign producers of ball bearings exported from six countries, tapered roller bearings from China and spherical plain bearings from France. The foreign producers of the ball bearing orders are located in France, Germany, Italy, Japan, Singapore
Rexnord Holdings, Inc. and Subsidiaries
Notes to Consolidated Financial Statements—(Continued)
March 31, 2008
and the United Kingdom. The Company is a producer of ball bearing products in the United States. The CDSOA provides for distribution of monies collected by Customs and Border Protection (“CBP”) from anti-dumping cases to qualifying producers, on a pro rata basis, where the domestic producers have continued to invest their technology, equipment and people in products that were the subject of the anti-dumping orders. As a result of providing relevant information to CBP regarding historical manufacturing, personnel and development costs for the calendar years 2006 and 2007 and prior, the Company received $8.8 million and $1.4 million, its pro rata share of the total CDSOA distribution, during the period from July 22, 2006 through March 31, 2007 and the year ended March 31, 2008, respectively, which is included in other income (expense), net on the consolidated statement of operations.
In February 2006, U.S. legislation was enacted that ends CDSOA distributions for imports covered by anti-dumping duty orders entering the U.S. after September 30, 2007. Because monies were collected by CBP until September 30, 2007 and for prior year entries, the Company may still receive some additional distributions; however, because of the pending cases, 2006 legislation and the administrative operation of law, the Company cannot reasonably estimate the amount of CDSOA distributions it will receive in future years, if any.
8. Inventories
The major classes of inventories are summarized as follows (in millions):
| March 31, | ||||||
| 2007 | 2008 | |||||
Finished goods | $ | 255.2 | $ | 228.3 | ||
Work in process | 62.9 | 63.2 | ||||
Raw materials | 46.4 | 49.5 | ||||
Inventories at FIFO cost | 364.5 | 341.0 | ||||
Adjustment to state inventories at LIFO cost | 19.8 | 29.3 | ||||
| $ | 384.3 | $ | 370.3 | |||
In connection with the Merger as well as the Zurn and GA acquisitions, the Company was required to adjust its inventories to fair value. These fair value or purchase accounting adjustments increased inventories by $19.6 million as of the Merger Date and $26.8 million as of the date of the Zurn acquisition for a total of $46.4 million. The fair value adjustment in connection with the GA acquisition was not significant. On a FIFO basis, approximately $27.4 million of the above fair value adjustments were expensed in the period from July 22, 2006 through March 31, 2007 and the final $19.0 million was expensed in the three months ended June 30, 2007 through cost of sales on the consolidated statement of operations as the corresponding inventory was sold. However, since the majority of the Company’s inventories are valued on the LIFO method (see Note 2), a substantial portion of these fair value adjustments have been reversed through the application of the Company’s LIFO calculations, resulting in an increase to the LIFO carrying value of this inventory and a corresponding reduction in cost of sales.
Rexnord Holdings, Inc. and Subsidiaries
Notes to Consolidated Financial Statements—(Continued)
March 31, 2008
9. Property, Plant & Equipment
Property, plant and equipment is summarized as follows (in millions):
| March 31, | ||||||||
| 2007 | 2008 | |||||||
Land | $ | 34.8 | $ | 35.6 | ||||
Buildings and improvements | 123.5 | 145.3 | ||||||
Machinery and equipment | 300.1 | 329.2 | ||||||
Hardware and software | 15.4 | 21.2 | ||||||
| 473.8 | 531.3 | |||||||
Less accumulated depreciation | (36.7 | ) | (88.0 | ) | ||||
| $ | 437.1 | $ | 443.3 | |||||
10. Goodwill and Intangible Assets
Goodwill totaled $1,294.2 million and $1,331.7 million at March 31, 2007 and 2008, respectively. Goodwill at each fiscal year end is directly attributed to the acquisitions described in Note 3. The change in goodwill from March 31, 2007 to March 31, 2008 is due to the acquisition of GA as well as the finalization of both the Zurn and Apollo purchase price allocations during the year ended March 31, 2008. Intangible assets are summarized as follows (in millions):
| March 31, 2007 | March 31, 2008 | |||||||||||||||
| Weighted Average Useful Life | Gross Carrying Amount | Accumulated Amortization | Gross Carrying Amount | Accumulated Amortization | ||||||||||||
Intangible assets subject to amortization: | ||||||||||||||||
Patents | 10 Years | $ | 52.1 | $ | (2.0 | ) | $ | 50.4 | $ | (7.2 | ) | |||||
Customer relationships (including distribution network) | 12 Years | 454.4 | (20.6 | ) | 528.6 | (65.1 | ) | |||||||||
Software | 1 Year | 0.5 | (0.3 | ) | 0.6 | (0.6 | ) | |||||||||
Intangible asset not subject to amortization—trademarks and tradenames | 503.6 | — | 377.2 | — | ||||||||||||
| $ | 1,010.6 | $ | (22.9 | ) | $ | 956.8 | $ | (72.9 | ) | |||||||
The decrease in intangible assets not subject to amortization—trademarks and tradenames of $126.4 million from $503.6 million at March 31, 2007 to $377.2 million at March 31, 2008 is a result of finalizing the purchase price allocation and fair value calculation assumptions of recently acquired intangibles.
The Company expects to recognize amortization expense on the intangible assets subject to amortization of $49.6 million in each of the next three fiscal years, $49.5 million in fiscal year 2012, and $48.8 million in fiscal year 2013.
Rexnord Holdings, Inc. and Subsidiaries
Notes to Consolidated Financial Statements—(Continued)
March 31, 2008
11. Other Current Liabilities
Other current liabilities are summarized as follows (in millions):
| March 31, | ||||||
| 2007 | 2008 | |||||
Taxes, other than income taxes | $ | 4.4 | $ | 5.2 | ||
Sales rebates | 19.0 | 17.4 | ||||
Severance obligations | 2.4 | 4.7 | ||||
Customer advances | 19.3 | 31.5 | ||||
Product warranty | 4.2 | 6.8 | ||||
Commissions | 5.8 | 7.3 | ||||
Risk management reserves(1) | 3.7 | 4.6 | ||||
Other | 16.5 | 18.3 | ||||
| $ | 75.3 | $ | 95.8 | |||
12. Long-term Debt
Long-term debt is summarized as follows (in millions):
| March 31, | ||||||
| 2007 | 2008 | |||||
Term loans | $ | 787.5 | $ | 767.5 | ||
PIK toggle senior indebtedness due 2013(1) | 450.0 | 512.3 | ||||
9.50% senior notes due 2014(2) | 804.2 | 803.3 | ||||
8.875% senior notes due 2016 | 150.0 | 150.0 | ||||
11.75% senior subordinated notes due 2016 | 300.0 | 300.0 | ||||
10.125% senior subordinated notes due 2012 | 0.3 | 0.3 | ||||
Other | 4.9 | 3.4 | ||||
Total | 2,496.9 | 2,536.8 | ||||
Less current portion | 2.2 | 2.9 | ||||
Long-term debt | $ | 2,494.7 | $ | 2,533.9 | ||
The Company’s outstanding debt was issued by Rexnord Holdings, Inc., RBS Global, Inc., and various subsidiaries of RBS Global, Inc. Rexnord Holdings, Inc. is the issuer of the PIK toggle senior indebtedness and RBS Global as well as its wholly-owned subsidiary Rexnord LLC are the co-issuers of the term loans, senior notes and senior subordinated notes.
Rexnord Holdings, Inc. and Subsidiaries
Notes to Consolidated Financial Statements—(Continued)
March��31, 2008
Rexnord Holdings, Inc. PIK Toggle Senior Indebtedness
On March 2, 2007, Rexnord Holdings, Inc. entered into a Credit Agreement with various lenders which provided $449.8 million in cash ($459.0 million of debt financing, net of a $9.2 million original issue discount) that was primarily used to pay a distribution to its shareholders as well as to holders of fully vested rollover options (see Note 14 for further information on stock options). The PIK toggle senior indebtedness borrowed pursuant to the credit agreement is due March 1, 2013 and bears interest at a floating rate. The floating rate is equal to adjusted LIBOR (the interest rate per annum equal to the product of (a) the LIBOR in effect and (b) Statutory Reserves) plus 7.0%. As of March 31, 2008 the interest rate was 10.06%. Pursuant to the terms of the credit agreement, Rexnord Holdings, Inc. has elected to pay interest in-kind and has accordingly added accrued interest to the principal amount of the debt on pre-determined quarterly interest rate reset dates. During fiscal 2008, $60.8 million of interest was added to the principal amount of the outstanding debt.
The PIK toggle senior indebtedness is an unsecured obligation. The PIK toggle senior indebtedness contains customary affirmative and negative covenants including: (i) limitations on the incurrence of indebtedness and the issuance of disqualified and preferred stock, (ii) limitations on restricted payments, dividends and certain other payments, (iii) limitations on asset sales, (iv) limitations on transactions with affiliates, (v) requirements as to the addition of future guarantors in certain circumstances and (vi) limitations on liens. Notwithstanding these covenants, Holdings may incur additional indebtedness and issue certain forms of equity if immediately prior to such events, the fixed charge to coverage ratio for the most recently ended four full fiscal quarters for which internal financial statements are available, as defined in the credit agreement, would have been at least 1.75 to 1.00, or, 2.00 to 1.00 in the case of the Holdings’ subsidiaries, including the pro forma application of the additional indebtedness or equity issuance. The PIK toggle senior indebtedness may be repaid in whole at any time or in part from time to time on at least three business days notice provided that any partial prepayment must be in integral multiples of $1,000,000 and all prepayments must be accompanied by a 1% prepayment premium.
RBS Global, Inc. and Subsidiaries Long-term Debt
In connection with the Merger on July 21, 2006, all borrowings under the Predecessor’s previous credit agreement and substantially all of the $225.0 million of 10.125% senior subordinated notes were repaid or repurchased on July 21, 2006. The Merger was financed in part with (i) $485.0 million of 9.50% senior notes due 2014, (ii) $300.0 million of 11.75% senior subordinated notes due 2016, and (iii) $645.7 million of borrowings under new senior secured credit facilities (consisting of a seven-year $610.0 million term loan facility, which matures in July 2013, and $35.7 million of borrowings under a six-year $150.0 million revolving credit facility, which expires in July 2012).
On February 7, 2007, the acquisition of the Zurn water management business was completed. This acquisition was funded partially with debt financing of $669.3 million, consisting of (i) $319.3 million of 9.50% senior notes due 2014 (which includes a bond issue premium of $9.3 million), (ii) $150.0 million of 8.875% senior notes due 2016 and (iii) $200.0 million of incremental borrowings under RBS Global’s existing term loan credit facilities.
As of March 31, 2008, the outstanding borrowings under the term loan credit facility were apportioned between two primary tranches: a $570.0 million term loan B1 facility and a $197.5 million term loan B2 facility. Borrowings under the $570.0 million term loan B1 facility accrue interest, at RBS Global’s option, at the following rates per annum: (i) 2.50% plus the LIBOR Rate per annum, or (ii) 1.50% plus the Base Rate (which is defined as the higher of the Federal funds rate plus 0.5% or the Prime rate). Borrowings under the $197.5 million term loan B2
Rexnord Holdings, Inc. and Subsidiaries
Notes to Consolidated Financial Statements—(Continued)
March 31, 2008
facility accrue interest, at RBS Global’s option, at the following rates per annum: (i) 2.25% plus the LIBOR Rate per annum, or (ii) 1.25% plus the Base Rate (which is defined as the higher of the Federal funds rate plus 0.5% or the Prime rate). The outstanding principal balances of the term loan B1 and B2 credit facilities at March 31, 2008 were $570.0 million and $197.5 million, respectively. After considering the pre-payment of $20.0 million on the term loan B1 facility in the first quarter of fiscal 2008, all mandatory principal repayments have been fulfilled on the B1 facility through March 31, 2013. As of March 31, 2008, the remaining mandatory pre-payments to maturity on both the term loan B1 and B2 facilities are $1.2 million and $10.5 million, respectively.
The senior notes and senior subordinated notes are unsecured obligations. The senior subordinated notes are subordinated in right of payment to all existing and future senior indebtedness. The indentures governing the senior notes and senior subordinated notes contain customary affirmative and negative covenants including: (i) limitations on the incurrence of indebtedness and the issuance of disqualified and preferred stock, (ii) limitations on restricted payments, dividends and certain other payments, (iii) limitations on asset sales, (iv) limitations on transactions with affiliates, (v) a covenant regarding the effect of a change of control, (vi) requirements as to the addition of future guarantors in certain circumstances and (vii) limitations on liens. The indenture governing the senior subordinated notes contains a further covenant limiting other senior subordinated indebtedness. Prior to August 1, 2011, the Company may redeem the 8.875% senior notes due 2016 and/or the senior subordinated notes at their option, in whole, or from time to time in part, upon not less than 30 and not more than 60 days’ prior notice, at a redemption price equal to (A) 100% of the principal amount of the notes redeemed plus (B) the greater of (x) 1% of the outstanding principal amount of the such notes and (y) the excess of the net present value of the notes (assuming they would otherwise be redeemed on August 1, 2011 and further assuming a discount rate equal to the Treasury Rate plus 50 basis points), and (C) accrued and unpaid interest and additional interest, if any, to, the applicable redemption date. The 9.50% senior notes due 2014 are redeemable on similar terms until August 1, 2010 (provided that the net present value of such notes would be calculated assuming they would otherwise be redeemed on August 1, 2010).
RBS Global’s senior secured credit facilities contain customary affirmative and negative covenants including: (i) limitations on indebtedness, (ii) limitations on liens, (iii) limitations on sale and leaseback transactions, (iv) limitations on investments, loans and advances, (v) limitations on mergers, consolidations, sales of assets and acquisitions, (vi) limitations on dividends and distributions, (vii) limitations on transactions with affiliates, (viii) limitations on modifications of indebtedness and certain other agreements, (ix) limitations on capital expenditures, (x) limitations on swap agreements, and (xi) limitations on other senior debt. As a result of these covenants, RBS Global has not paid any dividends on its common stock or membership interests. It is currently RBS Global’s policy to retain earnings to repay debt and finance its operations. RBS Global’s senior secured credit facilities also limit its maximum senior secured bank leverage ratio to 4.25 to 1.00. As of March 31, 2008, the senior secured bank leverage ratio was 1.67 to 1.00. Management expects to be in compliance with this financial covenant for the foreseeable future. RBS Global’s senior credit facility also significantly restricts the payment of dividends. Borrowings under RBS Global’s senior secured credit facilities may be repaid in whole at any time or in part from time to time without premium or penalty provided that any partial prepayment must be in integral multiples of $250,000 and at least $5,000,000 in the aggregate (or $1,000,000 in the case of swingline loans).
Revolving Credit Facility
Borrowings under RBS Global’s $150.0 million revolving credit facility accrue interest, at RBS Global’s option, at the following rates per annum: (i) 2.25% plus the Eurodollar Rate, or (ii) 1.25% plus the Base Rate (which is defined as the higher of the Federal funds rate plus 0.5% or the Prime rate). There were no outstanding
Rexnord Holdings, Inc. and Subsidiaries
Notes to Consolidated Financial Statements—(Continued)
March 31, 2008
borrowings on the revolver as of March 31, 2007 or 2008. Additionally, $31.0 million of the revolving credit facility was considered utilized in connection with outstanding letters of credit at March 31, 2008.
Other Debt
At March 31, 2007 and 2008, various wholly owned subsidiaries had additional borrowings of $4.9 million and $3.4 million, respectively, comprised primarily of borrowings at various foreign subsidiaries.
Account Receivable Securitization Program
On September 26, 2007, three wholly-owned domestic subsidiaries entered into an accounts receivable securitization program (the “AR Securitization Program” or the “Program”) whereby they continuously sell substantially all of their domestic trade accounts receivables to Rexnord Funding LLC (a wholly-owned bankruptcy remote special purpose subsidiary) for cash and subordinated notes. Rexnord Funding LLC in turn may obtain revolving loans and letters of credit from General Electric Capital Corporation (“GECC”) pursuant to a five year revolving loan agreement. The maximum borrowing amount under the loan agreement with GECC is $100 million, subject to certain borrowing base limitations related to the amount and type of receivables owned by Rexnord Funding LLC. All of the receivables purchased by Rexnord Funding LLC are pledged as collateral for revolving loans and letters of credit obtained from GECC under the loan agreement.
The AR Securitization Program does not qualify for sale accounting under SFAS No. 140,Accounting for Transfers and Servicing of Financial Assets and Extinguishments of Liabilities, and as such, any borrowings are accounted for as secured borrowings on our consolidated balance sheet. Financing costs associated with the Program will be recorded within “Interest expense, net” in the Company’s consolidated statement of operations if revolving loans or letters of credit have been obtained under the loan agreement.
Borrowings under the loan agreement bear interest at a rate equal to LIBOR plus an applicable margin (currently 1.35%). In addition, a non-use fee of 0.30% is applied to the unutilized portion of the $100.0 million commitment. These rates are per annum and the fees are paid to GECC on a daily basis. At March 31, 2008, there were no outstanding borrowings under the Program. Additionally, the Program requires compliance with certain covenants and performance ratios. As of March 31, 2008, Rexnord Funding was in compliance with all applicable covenants and performance ratios.
The weighted average interest rate on the Company’s outstanding term loans and PIK toggle senior indebtedness at March 31, 2007 and 2008 was 9.46% and 7.80%, respectively.
Future maturities of debt are as follows, excluding the unamortized original issue discount of $7.5 million and bond issue premium of $8.3 million (in millions):
Year ending March 31: | |||
2009 | $ | 2.9 | |
2010 | 3.1 | ||
2011 | 2.6 | ||
2012 | 2.6 | ||
2013 | 522.4 | ||
Thereafter | 2,002.4 | ||
| $ | 2,536.0 | ||
Rexnord Holdings, Inc. and Subsidiaries
Notes to Consolidated Financial Statements—(Continued)
March 31, 2008
Cash interest paid for the year ended March 31, 2006, the period from April 1, 2006 through July 21, 2006, the period from July 22, 2006 through March 31, 2007 and the year ended March 31, 2008 was $53.1 million, $32.2 million, $70.9 million and $187.6 million, respectively.
13. Leases
The Company leases manufacturing and warehouse facilities and data processing and other equipment under non-cancelable operating leases which expire at various dates through 2021. Rent expense totaled $7.7 million, $2.2 million, $7.1 million and $12.7 million for the year ended March 31, 2006, the period from April 1, 2006 through July 21, 2006, the period from July 22, 2006 through March 31, 2007 and the year ended March 31, 2008, respectively.
Future minimum rental payments for operating leases with initial terms in excess of one year are as follows (in millions):
Year ending March 31: | |||
2009 | $ | 18.6 | |
2010 | 13.3 | ||
2011 | 11.2 | ||
2012 | 8.7 | ||
2013 | 5.6 | ||
Thereafter | 10.0 | ||
| $ | 67.4 | ||
14. Stock Options
SFAS 123(R) requires compensation costs related to share-based payment transactions to be recognized in the financial statements. Generally, compensation cost is measured based on the grant-date fair value of the equity or liability instruments issued. In addition, liability awards are re-measured each reporting period. Compensation cost is recognized over the requisite service period, generally as the awards vest. As a nonpublic entity that previously used the minimum value method for pro forma disclosure purposes under SFAS 123, the Company adopted SFAS 123(R) using the prospective transition method of adoption on April 1, 2006. Accordingly, the provisions of SFAS 123(R) are applied prospectively to new awards and to awards modified, repurchased or cancelled after the adoption date. The Company’s outstanding stock options as of the adoption date continued to be accounted for under the provisions of Accounting Principles Board (“APB”) Opinion No. 25 and related interpretations through July 21, 2006, the date of the Apollo transaction discussed in Note 3. The Company did not grant, repurchase, or significantly modify any stock options from April 1, 2006 through July 21, 2006. In connection with the Apollo transaction, all previously outstanding stock options became fully vested and were either cashed out or rolled into fully-vested stock options of Rexnord Holdings. On July 22, 2006, a total of 577,945 of stock options were rolled over, each with an exercise price of $7.13. As of March 31, 2008, 539,242 of these rollover stock options remain outstanding.
In connection with the Apollo transaction, the board of directors of Rexnord Holdings also adopted, and stockholders approved, the 2006 Stock Option Plan of Rexnord Holdings, Inc. (the “Option Plan”). Persons eligible to receive options under the Option Plan include officers, employees or directors of Rexnord Holdings or any of its subsidiaries and certain consultants and advisors to Rexnord Holdings or any of its subsidiaries. The
Rexnord Holdings, Inc. and Subsidiaries
Notes to Consolidated Financial Statements—(Continued)
March 31, 2008
maximum number of shares of Rexnord Holdings common stock that may be issued or transferred pursuant to options under the Option Plan equals 2,700,000 shares (excluding rollover options mentioned above). All of the options granted under the Option Plan in fiscal 2007 had an initial exercise price of $47.50, the estimated fair value of the Company’s stock on the date of grant. On March 2, 2007, Rexnord Holdings declared a dividend to shareholders and holders of rollover stock options in the amount of $27.56 per share/option. As a result of this transaction, the exercise price of the options previously granted under the Option Plan was amended to $19.94 per option. All subsequent option grants in fiscal 2008 were granted with an exercise price of $19.94 per share which was also the fair value of Rexnord Holdings’ common shares on the date of grant. Approximately fifty percent of the options granted under the Option Plan vest ratably over five years from the date of grant; the remaining fifty percent of the options are eligible to vest based on the Company’s achievement of earnings before interest, taxes, depreciation and amortization (“EBITDA”) targets and debt repayment targets for fiscal years 2007 through 2013. As of March 31, 2008, all performance targets for the years ended March 31, 2007 and 2008 have been achieved; however, vesting for the achievement of the 2008 performance targets has yet to be approved by the Compensation Committee of Rexnord Holdings.
The fair value of each option granted under the Option Plan was estimated on the date of grant using the Black-Scholes valuation model that uses the following assumptions:
| Period from July 22, 2006 through March 31, 2007 | Year ended March 31, 2008 | |||||
Expected option term (in years) | 7.5 | 7.5 | ||||
Expected volatility factor | 28 | % | 28 | % | ||
Weighted-average risk free interest rate | 5.04 | % | 4.64 | % | ||
Expected dividend rate | 0.0 | % | 0.0 | % |
Options granted under the Option Plan as well as the fully vested rollover options have a term of ten years. Management’s estimate of the option term for options granted under the Option Plan is 7.5 years based on the midpoint between when the options vest and when they expire. The Company’s expected volatility assumptions are based on the expected volatilities of publicly-traded companies within the Company’s industry. The weighted average risk free interest rate is based on the U.S. Treasury yield curve in effect at the date of grant. Management also assumes expected dividends of zero. The weighted-average grant date fair value of options granted under the Option Plan during the period from July 22, 2006 through March 31, 2007 and fiscal 2008 was $20.68 and $8.46, respectively. During the period from July 22, 2006 through March 31, 2007 and fiscal 2008 the Company recorded $5.1 million and $7.4 million of stock-based compensation, respectively (the related tax benefit on these amounts was $2.0 million for the period from July 22, 2006 through March 31, 2007 and $2.6 million for fiscal 2008).
Rexnord Holdings, Inc. and Subsidiaries
Notes to Consolidated Financial Statements—(Continued)
March 31, 2008
Other information relative to stock options and the changes period over period are as follows:
| Predecessor | ||||||||||||||||||||||||||
| Year ended March 31, 2006 | Period from April 1, 2006 through July 21, 2006 | Period from July 22, 2006 through March 31, 2007 | Year ended March 31, 2008 | |||||||||||||||||||||||
| Shares | Weighted Avg. Exercise Price | Shares | Weighted Avg. Exercise Price | Shares | Weighted Avg. Exercise Price | Shares | Weighted Avg. Exercise Price | |||||||||||||||||||
Number of shares under option: | ||||||||||||||||||||||||||
Outstanding at beginning of period | 304,005 | $ | 100.00 | 374,515 | $ | 113.96 | — | $ | — | 2,021,445 | $ | 16.30 | ||||||||||||||
Granted | 104,568 | 150.00 | — | — | 2,057,467 | (2) | 16.34 | 1,281,096 | 19.94 | |||||||||||||||||
Exercised | (1,778 | ) | 100.00 | (372,017 | )(1) | 114.05 | — | — | (263,927 | ) | 18.53 | |||||||||||||||
Canceled/Forfeited | (32,280 | ) | 100.00 | (2,498 | ) | 100.00 | (36,022 | ) | 18.62 | (242,727 | ) | 19.63 | ||||||||||||||
Outstanding at end of period | 374,515 | $ | 113.96 | — | $ | — | 2,021,445 | $ | 16.30 | 2,795,887 | (3),(4) | $ | 17.47 | |||||||||||||
Exercisable at end of period | 148,448 | $ | 107.04 | — | $ | — | 574,222 | $ | 7.13 | 709,910 | (5) | $ | 10.21 | |||||||||||||
| Shares | Fair Value(6) | |||||
Non-vested options at March 31, 2007 | 1,447,223 | $ | 20.68 | |||
Granted | 1,281,096 | 8.46 | ||||
Vested | (428,535 | ) | 16.89 | |||
Canceled/Forfeited | (213,807 | ) | 17.34 | |||
Non-vested options at March 31, 2008 | 2,085,977 | $ | 14.30 | |||
As of March 31, 2008, there was $24.2 million of total unrecognized compensation cost related to non-vested stock options granted under the Option Plan. That cost is expected to be recognized over a weighted-average period of 3.6 years.
15. Retirement Benefits
The Company sponsors pension and other postretirement benefit plans for certain employees. The pension plans cover most of the Company’s employees and provide for monthly pension payments to eligible employees upon retirement. Pension benefits for salaried employees generally are based on years of credited service and average earnings. Pension benefits for hourly employees generally are based on specified benefit amounts and years of service. The Company’s policy is to fund its pension obligations in conformity with the funding requirements under applicable laws and governmental regulations. Other postretirement benefits consist of retiree medical plans that cover a portion of employees in the United States that meet certain age and service requirements.
Rexnord Holdings, Inc. and Subsidiaries
Notes to Consolidated Financial Statements—(Continued)
March 31, 2008
On March 31, 2008, the Company adopted the recognition and disclosure provisions of SFAS 158 which required the Company to recognize the funded status of its pension and post-retirement benefit plans in the March 31, 2008, consolidated balance sheet, with a corresponding adjustment to accumulated other comprehensive income, net of tax. SFAS 158 also requires companies to measure the funded status of plans as of the date of the Company’s fiscal year end, which provision the Company is required to adopt as of March 31, 2009. The Company uses a December 31 measurement date for its defined benefit pension and other post-retirement plans and has elected to transition to a fiscal year-end measurement date utilizing the second alternative prescribed by SFAS 158. Accordingly, on April 1, 2008, the Company will recognize adjustments to its opening retained earnings, net of income tax effect, and pension and other post-retirement plan assets and liabilities. These adjustments are not expected to have a material impact on the Company’s consolidated financial statements.
The adjustment to accumulated other comprehensive income at adoption of the recognition provisions of SFAS 158 in the accompanying consolidated statement of stockholders’ equity represents net unrecognized actuarial losses and unrecognized prior service costs which were previously netted against the plan’s funded status in the Company’s consolidated balance sheet pursuant to the provisions of SFAS 87. These amounts will be subsequently recognized as net periodic benefit cost pursuant to the Company’s historical accounting policy for amortizing such amounts. Further, actuarial gains and losses that arise in subsequent periods and are not recognized as net periodic benefit cost in the same periods will be recognized as a component of other comprehensive income. Those amounts will be subsequently recognized as a component of net periodic pension cost on the same basis as the amounts recognized in accumulated other comprehensive income upon adoption of SFAS 158.
The incremental effects of adopting the recognition provisions of SFAS 158 are shown below (in millions):
| At March 31, 2008 | ||||||||||||
| Prior to Adopting SFAS 158 | Effects of Adopting SFAS 158 | As Reported at March 31, 2008 | ||||||||||
Pension assets | $ | 116.7 | $ | (14.9 | ) | $ | 101.8 | |||||
Intangible assets | 2.2 | (2.2 | ) | — | ||||||||
Current portion of pension obligations | (6.3 | ) | 3.3 | (3.0 | ) | |||||||
Current portion of postretirement benefit obligations | (3.7 | ) | 0.1 | (3.6 | ) | |||||||
Pension obligations | (64.4 | ) | (4.6 | ) | (69.0 | ) | ||||||
Postretirement benefit obligations | (47.7 | ) | (1.8 | ) | (49.5 | ) | ||||||
Deferred income tax liability | (302.8 | ) | 8.2 | (294.6 | ) | |||||||
Accumulated other comprehensive income | (11.9 | ) | 11.9 | — | ||||||||
Rexnord Holdings, Inc. and Subsidiaries
Notes to Consolidated Financial Statements—(Continued)
March 31, 2008
The components of net periodic benefit cost reported in the Consolidated Statements of Operations are as follows (in millions):
| Predecessor | ||||||||||||||||||
| Year Ended March 31, 2006 | Period from April 1, 2006 through July 21, 2006 | Period from July 22, 2006 through March 31, 2007 | Year Ended March 31, 2008 | |||||||||||||||
Pension Benefits: | ||||||||||||||||||
Service cost | $ | 2.0 | $ | 0.6 | $ | 2.0 | $ | 4.4 | ||||||||||
Interest cost | 13.3 | 3.9 | 12.3 | 33.6 | ||||||||||||||
Expected return on plan assets | (12.1 | ) | (3.9 | ) | (14.4 | ) | (48.4 | ) | ||||||||||
Curtailment gain | — | — | (0.4 | ) | — | |||||||||||||
Amortization: | ||||||||||||||||||
Prior service cost | — | — | — | 0.3 | ||||||||||||||
Actuarial losses (gains) | (0.7 | ) | 0.1 | — | — | |||||||||||||
Net periodic benefit cost (income) | $ | 2.5 | $ | 0.7 | $ | (0.5 | ) | $ | (10.1 | ) | ||||||||
Other Postretirement Benefits: | ||||||||||||||||||
Service cost | $ | 0.4 | $ | 0.1 | $ | 0.3 | $ | 0.5 | ||||||||||
Interest cost | 2.8 | 0.8 | 2.1 | 3.1 | ||||||||||||||
Amortization: | ||||||||||||||||||
Prior service cost | (0.3 | ) | (0.1 | ) | — | (0.1 | ) | |||||||||||
Actuarial losses | 0.9 | 0.4 | — | — | ||||||||||||||
Curtailment gain | — | — | — | (3.9 | ) | |||||||||||||
Net periodic benefit cost (income) | $ | 3.8 | $ | 1.2 | $ | 2.4 | $ | (0.4 | ) | |||||||||
The Company made contributions to its U.S. qualified pension plan trusts of $13.0 million, $8.0 million, $5.4 million and $4.8 million during the year ended March 31, 2006, the period from April 1, 2006 through July 21, 2006, the period from July 22, 2006 through March 31, 2007 and the year ended March 31, 2008, respectively.
Rexnord Holdings, Inc. and Subsidiaries
Notes to Consolidated Financial Statements—(Continued)
March 31, 2008
As mentioned above, the Company uses an actuarial measurement date of December 31 to measure its pension benefit obligations and its other postretirement obligations. The status of the plans are summarized as follows (in millions):
| Pension Benefits | Other Postretirement Benefits | |||||||||||||||||||||||||||
| Predecessor | Predecessor | |||||||||||||||||||||||||||
| Period from April 1, 2006 through July 21, 2006 | Period from July 22, 2006 through March 31, 2007 | Year Ended March 31, 2008 | Period from April 1, 2006 through July 21, 2006 | Period from July 22, 2006 through March 31, 2007 | Year Ended March 31, 2008 | |||||||||||||||||||||||
Benefit obligation at beginning of period | $ | (249.8 | ) | $ | (241.3 | ) | $ | (583.4 | ) | $ | (50.4 | ) | $ | (47.9 | ) | $ | (54.5 | ) | ||||||||||
Service cost | (0.6 | ) | (2.0 | ) | (4.4 | ) | (0.1 | ) | (0.3 | ) | (0.5 | ) | ||||||||||||||||
Interest cost | (3.9 | ) | (12.3 | ) | (33.6 | ) | (0.8 | ) | (2.1 | ) | (3.1 | ) | ||||||||||||||||
Actuarial gains (losses) | 7.8 | 4.8 | (15.4 | ) | 1.9 | 3.6 | (4.1 | ) | ||||||||||||||||||||
Plan amendments | — | (4.6 | ) | — | — | — | — | |||||||||||||||||||||
Benefits paid | 7.0 | 9.6 | 30.2 | 3.0 | 5.1 | 8.8 | ||||||||||||||||||||||
Curtailment gain | — | 0.4 | — | — | — | 3.8 | ||||||||||||||||||||||
Acquisitions | — | (335.5 | ) | — | — | (10.4 | ) | (0.3 | ) | |||||||||||||||||||
Plan participant contributions | — | — | (0.4 | ) | (1.5 | ) | (2.5 | ) | (3.2 | ) | ||||||||||||||||||
Other | — | — | (0.4 | ) | — | — | — | |||||||||||||||||||||
Translation adjustment | (1.8 | ) | (2.5 | ) | (10.1 | ) | — | — | — | |||||||||||||||||||
Benefit obligation at end of period | $ | (241.3 | ) | $ | (583.4 | ) | $ | (617.5 | ) | $ | (47.9 | ) | $ | (54.5 | ) | $ | (53.1 | ) | ||||||||||
Plan assets at the beginning of the period | $ | 155.8 | $ | 164.8 | $ | 620.6 | $ | — | $ | — | $ | — | ||||||||||||||||
Actual return on plan assets | 4.6 | 15.0 | 44.8 | — | — | — | ||||||||||||||||||||||
Contributions | 11.2 | 6.4 | 9.2 | 3.0 | 5.1 | 8.8 | ||||||||||||||||||||||
Benefits paid | (7.0 | ) | (9.6 | ) | (30.2 | ) | (3.0 | ) | (5.1 | ) | (8.8 | ) | ||||||||||||||||
Acquisitions | — | 444.1 | — | — | — | — | ||||||||||||||||||||||
Other | — | — | 0.4 | — | — | — | ||||||||||||||||||||||
Translation adjustment | 0.2 | (0.1 | ) | 2.3 | — | — | — | |||||||||||||||||||||
Plan assets at end of period | $ | 164.8 | $ | 620.6 | $ | 647.1 | $ | — | $ | — | $ | — | ||||||||||||||||
Funded status of plans | $ | (76.5 | ) | $ | 37.2 | $ | 29.6 | $ | (47.9 | ) | $ | (54.5 | ) | $ | (53.1 | ) | ||||||||||||
Unamortized prior service cost | — | 2.8 | — | (3.3 | ) | (0.2 | ) | — | ||||||||||||||||||||
Unamortized net actuarial (gains) losses | 10.9 | (2.9 | ) | — | 15.3 | (2.5 | ) | — | ||||||||||||||||||||
Contributions after measurement date | — | 0.6 | 0.2 | — | — | — | ||||||||||||||||||||||
Net amount on Consolidated Balance Sheet | $ | (65.6 | ) | $ | 37.7 | $ | 29.8 | $ | (35.9 | ) | $ | (57.2 | ) | $ | (53.1 | ) | ||||||||||||
Net amount on Consolidated Balance Sheet consists of: | ||||||||||||||||||||||||||||
Long-term assets | $ | — | $ | 114.6 | $ | 101.8 | $ | — | $ | — | $ | — | ||||||||||||||||
Intangible assets(1) | — | 1.0 | — | — | — | — | ||||||||||||||||||||||
Current liabilities | (21.0 | ) | (9.4 | ) | (3.0 | ) | (5.1 | ) | (4.9 | ) | (3.6 | ) | ||||||||||||||||
Long-term liabilities | (47.8 | ) | (68.8 | ) | (69.0 | ) | (30.8 | ) | (52.3 | ) | (49.5 | ) | ||||||||||||||||
Accumulated other comprehensive loss | 3.2 | 0.3 | — | — | — | — | ||||||||||||||||||||||
| $ | (65.6 | ) | $ | 37.7 | $ | 29.8 | $ | (35.9 | ) | $ | (57.2 | ) | $ | (53.1 | ) | |||||||||||||
Rexnord Holdings, Inc. and Subsidiaries
Notes to Consolidated Financial Statements—(Continued)
March 31, 2008
Amounts included in accumulated other comprehensive loss, net of tax, at March 31, 2008 consist of the following (in millions):
| Pension Benefits | Other Postretirement Benefits | Total | ||||||||||
Unrecognized prior service cost | $ | 3.0 | $ | (0.1 | ) | $ | 2.9 | |||||
Unrecognized actuarial loss | 16.3 | 1.8 | 18.1 | |||||||||
Accumulated other comprehensive loss, gross | 19.3 | 1.7 | 21.0 | |||||||||
Deferred income taxes | (7.9 | ) | (0.6 | ) | (8.5 | ) | ||||||
Accumulated other comprehensive loss, net | $ | 11.4 | $ | 1.1 | $ | 12.5 | ||||||
Estimated amounts that will be amortized from accumulated other comprehensive loss into the net periodic benefit cost over the next fiscal year, net of tax, are as follows (in millions):
| Pension Benefits | Other Postretirement Benefits | ||||||
Prior service cost | $ | 0.2 | $ | (0.1 | ) | ||
Net actuarial loss | — | 0.1 | |||||
The following table presents significant assumptions used to determine benefit obligations and net periodic benefit cost (in weighted-average percentages):
| Pension Benefits | Other Postretirement Benefits | |||||||||||||||||||||||||||
| Predecessor | Predecessor | |||||||||||||||||||||||||||
| March 31, 2006 | Period from April 1, 2006 through July 21, 2006 | Period from July 22, 2006 through March 31, 2007 | March 31, 2008 | March 31, 2006 | Period from April 1, 2006 through July 21, 2006 | Period from July 22, 2006 through March 31, 2007 | March 31, 2008 | |||||||||||||||||||||
Benefit Obligations: | ||||||||||||||||||||||||||||
Discount rate | 5.54 | % | 5.73 | % | 5.87 | % | 5.87 | % | 5.75 | % | 6.00 | % | 6.00 | % | 6.00 | % | ||||||||||||
Rate of compensation increase | 3.34 | % | 3.34 | % | 3.41 | % | 3.39 | % | n/a | n/a | n/a | n/a | ||||||||||||||||
Net Periodic Benefit Cost: | ||||||||||||||||||||||||||||
Discount rate | 5.78 | % | 5.54 | % | 5.73 | % | 5.87 | % | 6.00 | % | 5.75 | % | 6.00 | % | 6.00 | % | ||||||||||||
Rate of compensation increase | 3.31 | % | 3.35 | % | 3.33 | % | 3.41 | % | n/a | n/a | n/a | n/a | ||||||||||||||||
Expected return on plan assets | 8.46 | % | 8.44 | % | 8.25 | % | 7.95 | % | n/a | n/a | n/a | n/a | ||||||||||||||||
In evaluating the expected return on plan assets, consideration was given to historical long-term rates of return on plan assets and input from the Company’s pension fund consultant on asset class return expectations, long-term inflation and current market conditions.
The Company’s weighted-average investment allocations as of March 31, 2007 and 2008 are presented in the following table. Allocations between equity and fixed income securities are maintained within a 5% tolerance of the target allocation established by the investment committee of each plan. The Company’s defined benefit pension investment policy recognizes the long-term nature of pension liabilities, the benefits of diversification across asset classes and the effects of inflation. The diversified portfolio is designed to maximize investment returns consistent with levels of investment risk that are prudent and reasonable. All assets are managed externally according to guidelines established individually with investment managers and the Company’s investment consultant. The manager guidelines prohibit the use of any type of investment derivative without the prior approval of the investment committee. Portfolio risk is controlled by having managers comply with their
Rexnord Holdings, Inc. and Subsidiaries
Notes to Consolidated Financial Statements—(Continued)
March 31, 2008
established guidelines, including establishing the maximum size of any single holding in their portfolios and by using managers with different investment styles. The Company periodically undertakes asset and liability modeling studies to determine the appropriateness of the investments. The portfolio included holdings of domestic, international, and private equities, global high quality and high yield fixed income, and short-term interest bearing deposits. No equity securities of the Company are held in the portfolio.
| Plan Assets | ||||||
| March 31, 2007 | March 31, 2008 | |||||
Equity securities | 62 | % | 72 | % | ||
Debt securities | 20 | % | 26 | % | ||
Other | 18 | % | 2 | % | ||
During fiscal 2009, the Company expects to contribute approximately $3.2 million to its defined benefit plans and $2.5 million to its other postretirement benefit plans.
Expected benefit payments to be paid in each of the next five fiscal years and in the aggregate for the five fiscal years thereafter are as follows (in millions):
Year Ending March 31: | Pension Benefits | Other Postretirement Benefits | ||||
2009 | $ | 34.0 | $ | 3.7 | ||
2010 | 34.6 | 3.6 | ||||
2011 | 35.3 | 3.6 | ||||
2012 | 36.0 | 3.6 | ||||
2013 | 37.2 | 3.5 | ||||
2014 - 2018 | 203.6 | 20.3 | ||||
Pension Plans That Are Not Fully Funded
At March 31, 2007, the projected benefit obligation, accumulated benefit obligation and fair value of plan assets for the pension plans with accumulated benefit obligations in excess of the fair value of plan assets were $255.3 million, $245.4 million and $180.9 million, respectively.
At March 31, 2008, the projected benefit obligation, accumulated benefit obligation and fair value of plan assets for the pension plans with accumulated benefit obligations in excess of the fair value of plan assets were $205.4 million, $199.4 million and $133.4 million, respectively.
Other Postretirement Benefits
The other postretirement benefit obligation was determined using an assumed health care cost trend rate of 9% in fiscal 2009 grading down to 5% in fiscal 2016 and thereafter. The discount rate, compensation rate increase and health care cost trend rate assumptions are determined as of the measurement date.
Rexnord Holdings, Inc. and Subsidiaries
Notes to Consolidated Financial Statements—(Continued)
March 31, 2008
Assumed health care cost trend rates have a significant effect on amounts reported for the retiree medical plans. A one-percentage point change in assumed health care cost trend rates would have the following effect (in millions):
| One Percentage Point Increase | One Percentage Point Decrease | ||||||||||||||||||||||
| Year Ended March 31, | Year Ended March 31, | ||||||||||||||||||||||
| 2006 | 2007 | 2008 | 2006 | 2007 | 2008 | ||||||||||||||||||
Increase (decrease) in total of service and interest cost components | $ | 0.2 | $ | 0.3 | $ | 0.4 | $ | (0.2 | ) | $ | (0.2 | ) | $ | (0.3 | ) | ||||||||
Increase (decrease) in postretirement benefit obligation | $ | 3.5 | $ | 3.2 | $ | 5.2 | $ | (3.0 | ) | $ | (2.7 | ) | $ | (4.3 | ) | ||||||||
Multi-Employer and Government-sponsored Plans
The Company participates in certain multi-employer and government-sponsored plans for eligible employees. Expense related to these plans was $0.2 million, $0.1 million, $0.1 million and $0.2 million for the year ended March 31, 2006, the period from April 1, 2006 through July 21, 2006, the period from July 22, 2006 through March 31, 2007 and the year ended March 31, 2008, respectively.
Defined Contribution Savings Plans
The Company sponsors certain defined-contribution savings plans for eligible employees. Expense related to these plans was $9.8 million, $3.0 million, $7.6 million and $11.8 million for the year ended March 31, 2006, the period from April 1, 2006 through July 21, 2006, the period from July 22, 2006 through March 31, 2007 and the year ended March 31, 2008, respectively.
16. Income Taxes
The provision for income taxes consists of amounts for taxes currently payable, amounts for tax items deferred to future periods; as well as, adjustments relating to the Company’s determination of uncertain tax positions, including interest and penalties. The Company recognizes deferred tax assets and liabilities based on the future tax consequences attributable to tax net operating loss carryforwards, tax credit carryforwards and differences between the financial statement carrying amounts and the tax bases of applicable assets and liabilities. Deferred tax assets are regularly reviewed for recoverability and valuation allowances are established based on historical losses, projected future taxable income and the expected timing of the reversals of existing temporary differences. As a result of this review, the Company has established a valuation allowance against substantially all deferred tax assets relating to foreign tax loss carryforwards and a partial valuation allowance against deferred tax assets relating to certain state net operating loss and foreign tax credit carryforwards.
Rexnord Holdings, Inc. and Subsidiaries
Notes to Consolidated Financial Statements—(Continued)
March 31, 2008
Income Tax Provision (Benefit)
The components of the provision (benefit) for income taxes are as follows (in millions):
| Predecessor | |||||||||||||||||
| Year ended March 31, 2006 | Period from April 1, 2006 through July 21, 2006 | Period from July 22, 2006 through March 31, 2007 | Year ended March 31, 2008 | ||||||||||||||
Current: | |||||||||||||||||
United States | $ | — | $ | — | $ | — | $ | — | |||||||||
Non-United States | 10.6 | 1.6 | 2.8 | 13.0 | |||||||||||||
State and local | 2.6 | — | 1.2 | 2.5 | |||||||||||||
Total current | 13.2 | 1.6 | 4.0 | 15.5 | |||||||||||||
Deferred: | |||||||||||||||||
United States | 9.9 | (16.3 | ) | 0.7 | (11.8 | ) | |||||||||||
Non-United States | (1.4 | ) | (0.1 | ) | 3.7 | (3.6 | ) | ||||||||||
State and local | (5.4 | ) | (1.3 | ) | 0.8 | (1.0 | ) | ||||||||||
Total deferred | 3.1 | (17.7 | ) | 5.2 | (16.4 | ) | |||||||||||
Provision (benefit) for income taxes | $ | 16.3 | $ | (16.1 | ) | $ | 9.2 | $ | (0.9 | ) | |||||||
The provision (benefit) for income taxes differs from the United States statutory income tax rate due to the following items (in millions):
| Predecessor | ||||||||||||||||||
| Year ended March 31, 2006 | Period from April 1, 2006 through July 21, 2006 | Period from July 22, 2006 through March 31, 2007 | Year ended March 31, 2008 | |||||||||||||||
Provision for income taxes at U.S. federal statutory income tax rate | $ | 13.7 | $ | (19.5 | ) | $ | 3.1 | $ | (0.2 | ) | ||||||||
State and local income taxes, net of federal benefit | (1.8 | ) | (0.8 | ) | 1.2 | 0.9 | ||||||||||||
Net effects of foreign operations | 4.6 | 1.3 | 3.4 | 4.0 | ||||||||||||||
Tax benefit treated as a reduction to goodwill | — | — | 2.0 | 0.9 | ||||||||||||||
Net effect to deferred taxes for changes in tax rates | — | — | (0.4 | ) | (1.5 | ) | ||||||||||||
Loss on divestiture | — | — | — | (7.4 | ) | |||||||||||||
Interest on unrecognized tax benefits, net of federal benefit | — | — | — | 1.6 | ||||||||||||||
Nondeductible transaction costs | — | 2.8 | — | — | ||||||||||||||
Other | (0.2 | ) | 0.1 | (0.1 | ) | 0.8 | ||||||||||||
Provision (benefit) for income taxes | $ | 16.3 | $ | (16.1 | ) | $ | 9.2 | $ | (0.9 | ) | ||||||||
Rexnord Holdings, Inc. and Subsidiaries
Notes to Consolidated Financial Statements—(Continued)
March 31, 2008
The provision (benefit) for income taxes was calculated based upon the following components of income (loss) before income taxes (in millions):
| Predecessor | |||||||||||||||||
| Year ended March 31, 2006 | Period from April 1, 2006 through July 21, 2006 | Period from July 22, 2006 through March 31, 2007 | Year ended March 31, 2008 | ||||||||||||||
United States | $ | 37.0 | $ | (64.8 | ) | $ | (3.4 | ) | $ | (21.8 | ) | ||||||
Non-United States | 2.2 | 9.1 | 12.4 | 21.2 | |||||||||||||
Income (loss) before income taxes | $ | 39.2 | $ | (55.7 | ) | $ | 9.0 | $ | (0.6 | ) | |||||||
Deferred Income Tax Assets and Liabilities
Deferred income taxes consist of the tax effects of the following temporary differences (in millions):
| March 31, 2007 | March 31, 2008 | |||||||
Deferred tax assets: | ||||||||
Compensation and retirement benefits | $ | — | $ | 23.9 | ||||
US federal and state tax operating loss carryforwards | 93.1 | 97.6 | ||||||
Foreign tax credit carryforwards | 29.6 | 41.2 | ||||||
Foreign net operating loss carryforwards | 45.8 | 44.2 | ||||||
Other | 10.6 | 15.6 | ||||||
| 179.1 | 222.5 | |||||||
Valuation allowance | (85.7 | ) | (94.2 | ) | ||||
Total deferred assets | 93.4 | 128.3 | ||||||
Deferred tax liabilities: | ||||||||
Property, plant and equipment | 74.8 | 75.5 | ||||||
Compensation and retirement benefits | 9.5 | — | ||||||
Inventories | 35.4 | 34.1 | ||||||
Intangible assets and goodwill | 370.2 | 325.0 | ||||||
Total deferred tax liabilities | 489.9 | 434.6 | ||||||
Net deferred tax liabilities | $ | 396.5 | $ | 306.3 | ||||
These deferred tax assets and liabilities are classified in the consolidated balance sheet based on the balance sheet classification of the related assets and liabilities.
Management believes it is more-likely-than-not that current and long-term deferred tax assets will be realized through the reduction of future taxable income. Significant factors considered by management in this determination include the historical operating results of the Company and Predecessor and the expectation of future earnings, including anticipated reversals of future taxable temporary differences. A valuation allowance was established at March 31, 2007 and 2008 for deferred tax assets related to state net operating loss carryforwards, foreign net operating loss carryforwards and foreign tax credit carryforwards for which utilization is uncertain. The portion of the valuation allowance that would result in a reduction to goodwill upon the
Rexnord Holdings, Inc. and Subsidiaries
Notes to Consolidated Financial Statements—(Continued)
March 31, 2008
recognition of the related deferred tax asset was $76.1 million and $74.5 million as of March 31, 2007 and March 31, 2008, respectively. The carryforward period for the foreign tax credit is ten years. The carryforward periods for the state net operating losses range from five to twenty years. Certain foreign net operating loss carryforwards are subject to a five year expiration period, and the carryforward period for the remaining foreign net operating losses is indefinite.
No provision has been made for United States income taxes related to approximately $26.9 million of undistributed earnings of foreign subsidiaries considered to be permanently reinvested. It is not practicable to determine the income tax liability, if any, which would be payable if such earnings were not permanently reinvested.
Net cash paid (refund received) for income taxes to governmental tax authorities for the year ended March 31, 2006, the period from April 1, 2006 through July 21, 2006, the period from July 22, 2006 through March 31, 2007 and the year ended March 31, 2008 was $10.5 million, $1.1 million, $3.6 million, and ($4.1) million, respectively.
Adoption of FIN 48
The Company adopted the provisions of FIN 48 on April 1, 2007. As a result of the adoption, the Company recognized a $5.5 million decrease in the liability for unrecognized tax benefits, with an offsetting reduction to goodwill. As of April 1, 2007, the total amount of unrecognized tax benefits after the adoption of FIN 48 was $52.6 million, of which $0.2 million represented tax benefits that if recognized, would favorably impact the effective tax rate. As of March 31, 2008, the Company’s total liability for unrecognized tax benefits was $45.7 million. Included within this figure is $3.8 million, which represents tax benefits that if recognized, would favorably impact the effective tax rate.
The following table represents a reconciliation of the beginning and ending amount of the gross unrecognized tax benefits, excluding interest and penalties, for the fiscal year ended March 31, 2008 (in millions):
Balance at April 1, 2007 | $ | 48.0 | ||
Additions based on tax positions related to the current year | 1.1 | |||
Additions for tax positions of prior years | 8.5 | |||
Reductions for tax positions of prior years | (14.1 | ) | ||
Settlements | (3.2 | ) | ||
Reductions due to lapse of applicable statute of limitations | (0.4 | ) | ||
Balance at March 31, 2008 | $ | 39.9 | ||
The Company recognizes accrued interest and penalties related to unrecognized tax benefits in income tax expense. As of April 1, 2007 and March 31, 2008, the total amount of unrecognized tax benefits includes $13.2 million and $14.2 million of gross accrued interest and penalties, respectively. The amount of interest and penalties recorded as income tax expense during the fiscal year ended March 31, 2008 was $3.4 million.
The Company or one or more of its subsidiaries files income tax returns in the U.S. federal, various states and foreign jurisdictions. As a result, the Company is subject to periodic income tax examinations by domestic and foreign income tax authorities. Currently, the Company is undergoing routine, periodic income tax examinations in both domestic and foreign jurisdictions. It appears reasonably possible that the amounts of
Rexnord Holdings, Inc. and Subsidiaries
Notes to Consolidated Financial Statements—(Continued)
March 31, 2008
unrecognized income tax benefits could change in the next twelve months as a result of such examinations; however, any potential payments of income tax, interest and penalties are not expected to be significant to the Company’s consolidated financial statements. With certain exceptions, the Company is no longer subject to U.S. federal income tax examinations for years ending prior to fiscal 2005, state and local income tax examinations for years ending prior to fiscal 2004 or significant foreign income tax examinations for years ending prior to fiscal 2003. With respect to the Company’s U.S. federal net operating loss (“NOL”) carryforward, fiscal year 2003 is open under statutes of limitations; whereby, the Internal Revenue Service (“IRS”) may not adjust the income tax liability for this year, but may reduce the NOL carryforward and any other tax attribute carryforward to future, open tax years.
In conjunction with the Zurn acquisition, the Company assumed certain tax liabilities and contingencies of Jacuzzi Brands, Inc. A U.S. federal income tax examination was completed for Jacuzzi Brands, Inc. for the fiscal years ended September 30, 1998 through 2002. At the conclusion of this examination in September 2005, an appeal was filed with the IRS regarding various issues identified during the examination upon which agreement could not be reached. During the three months ended September 29, 2007, the Company received confirmation that the Joint Committee on Taxation had agreed to the proposed settlement. As a result, the Company recorded approximately $16.7 million of previously unrecognized tax benefits and $4.5 million of related accrued interest with an offsetting reduction to goodwill. During the three months ended December 29, 2007, the Company received a partial refund of approximately $18.0 million related to this settlement and received the remaining refund due of $2.0 million during the Company’s fourth fiscal quarter.
17. Related Party Transactions
Management Service Fees
Rexnord Holdings, Inc. has a management consulting agreement with Apollo for advisory and consulting services relating to business, financial oversight, administration and the policies of Rexnord Holdings, Inc. and its subsidiaries. Under the terms of the agreement, which became effective July 22, 2006 and was subsequently amended and restated as of February 7, 2007, the Company paid $1.4 million during the period from July 22, 2006 through March 31, 2007 and $3.0 million during the year ended March 31, 2008 plus out-of-pocket expenses. This agreement will remain in effect until the twelfth anniversary of the date of the amended agreement (unless extended pursuant to the terms thereof), or such earlier time as the Company and Apollo may mutually agree.
RBS Global, Inc. had a management services agreement with TC Group, L.L.C., (The Carlyle Group) for advisory and consulting services related to corporate management, finance, product strategy, investment, acquisitions and other matters relating to the business of the Predecessor. Under the terms of the agreement, the Company paid the following, plus out-of-pocket expenses; $2.0 million for the year ended March 31, 2006 and $0.5 million during the period from April 1, 2006 through July 21, 2006. This agreement was terminated on July 21, 2006 when The Carlyle Group sold the Company to Apollo.
Consulting Services
Rexnord LLC has a management consulting agreement (the “Cypress agreement”) with Mr. George Sherman and two entities controlled by Mr. Sherman, Cypress Group, LLC (“Cypress”) and Cypress Industrial Holdings, LLC (“Cypress Industrial” and, collectively with Mr. Sherman and Cypress, “Consultant”). Mr. Sherman serves as a director of Rexnord LLC and as a director in the capacity of Non-Executive Chairman
Rexnord Holdings, Inc. and Subsidiaries
Notes to Consolidated Financial Statements—(Continued)
March 31, 2008
of the Boards of Directors of RBS Global, Inc. and Rexnord Holdings. Pursuant to the Cypress agreement, Consultant provides certain consulting services to the Company and in exchange receives reimbursement for reasonable out-of-pocket expenses. Through the date of the Zurn acquisition, Mr. Sherman also received an annual consulting fee of $250,000. Effective this date, the Cypress agreement was amended, effectively eliminating the consulting fee compensation prospectively. In addition to out-of pocket expenses, the Company paid the following consulting fees for the respective time periods: $250,000 during the year ended March 31, 2006, $77,500 for the period from April 1, 2006 through July 21, 2006 and $136,000 during the period from July 22, 2006 through February 7, 2007. Consultant also received non-qualified stock options in fiscal 2007 and fiscal 2008.
During the year ended March 31, 2006, the period from April 1, 2006 through July 21, 2006, the period from July 22, 2006 through March 31, 2007 and the year ended March 31, 2008, the Company paid approximately $1.5 million, $0.5 million, $2.5 million and $1.4 million respectively, for consulting services provided by an entity that is controlled by certain minority shareholders of the Company.
The Zurn Acquisition
On October 11, 2006 the Company entered into an agreement with Jupiter, an affiliate of Apollo, to acquire the water management business (“Zurn”) of Jacuzzi Brands, Inc. (“Jacuzzi”). Apollo subsequently caused Jacuzzi to sell the assets of its bath business to Bath Acquisition Corp., an affiliate of Apollo, leaving Zurn as Jacuzzi’s sole business operation and on February 7, 2007, the Company acquired the common stock of Jacuzzi, and therefore, Zurn, from an affiliate of Apollo, for a cash purchase price of $942.5 million, including transaction costs and additional deferred financing fees. The transaction was approved both by the stockholders of the Company, as required by Delaware law in the case of an affiliate transaction of this type, and unanimously by the Company’s board of directors, including those who were not affiliated with Apollo. In each case the stockholders and the unaffiliated directors assessed the transaction and the purchase price to be paid for Jacuzzi from the Rexnord Holdings, Inc. and Subsidiaries perspective of what was in the best interests of the Company and all of its stockholders, when taking into account the benefits they expected the Company to realize from the transaction. Further, upon completion of their review of the transaction, the board of directors made the determination that the acquisition of Jacuzzi was made on terms not materially less favorable to RBS Global than those that could have been obtained in a comparable transaction between RBS Global and an unrelated person, as required by the indentures governing the debt securities of RBS Global and Rexnord, LLC.
Transaction costs
During the year ended March 31, 2006, the Company paid approximately $3.0 million to The Carlyle Group and $2.0 million to Cypress for investment banking services and other transaction costs in connection with the acquisition of Falk.
During the year ended March 31, 2007, the Company paid a total of $0.6 million to The Carlyle Group and $21.3 million to Apollo for investment banking and other transaction related services as part of the purchase of the Company by Apollo. These payments have been accounted for as transaction fees and are included in the total cost of the Apollo Acquisition as discussed in Note 3.
During the year ended March 31, 2007, the Company paid a total of $9.0 million to Apollo and $1.8 million to the Cypress Group LLC for investment banking and other transaction related services as part of the Zurn Acquisition. These payments have been accounted for as transaction fees and are included in the total cost of the Zurn Acquisition as discussed in Note 3.
Rexnord Holdings, Inc. and Subsidiaries
Notes to Consolidated Financial Statements—(Continued)
March 31, 2008
Other
In February 2008, Apollo purchased approximately $25.1 million (approximately $36.6 million face value or 7.0489% of the total commitment) of the outstanding debt of Rexnord Holdings, which debt is outstanding pursuant to a Credit Agreement dated March 2, 2007 between Rexnord Holdings, various lenders thereunder and an affiliate of Credit Suisse, as administrative agent. Additionally in February 2008, Apollo purchased approximately $8.3 million (approximately $10.0 million face value or 3.3333% of the total commitment) of the senior subordinated notes due 2016 of RBS Global.
In connection with the Zurn acquisition, the Company, through one or more of its subsidiaries, continues to incur certain payroll and administrative costs on behalf of Bath Acquisition Corp. (“Bath”) (the former bath segment of Jacuzzi Brands, Inc., which was purchased by an Apollo affiliate). These costs are reimbursed to the Company by Bath on a monthly basis. During the year ended March 31, 2008, the Company received approximately $6.8 million of reimbursements. It is anticipated that this cost incurrence and reimbursement arrangement will continue in effect until the Company has fully transitioned the payment of these costs to Bath, which the Company expects will be by the end of fiscal 2009.
18. Commitments and Contingencies
The Company’s entities are involved in various unresolved legal actions, administrative proceedings and claims in the ordinary course of business involving, among other things, product liability, commercial, employment, workers’ compensation, intellectual property claims and environmental matters. The Company establishes reserves in a manner that is consistent with accounting principles generally accepted in the United States for costs associated with such matters when liability is probable and those costs are capable of being reasonably estimated. Although it is not possible to predict with certainty the outcome of these unresolved legal actions or the range of possible loss or recovery, based upon current information, management believes the eventual outcome of these unresolved legal actions either individually, or in the aggregate, will not have a material adverse effect on the financial position, results of operations or cash flows of the Company.
In connection with the Carlyle acquisition in November 2002, Invensys plc has provided the Company with indemnification against certain contingent liabilities, including certain pre-closing environmental liabilities. The Company believes that, pursuant to such indemnity obligations, Invensys is obligated to defend and indemnify the Company with respect to the matters described below relating to the Ellsworth Industrial Park Site and to various asbestos claims. The indemnity obligations relating to the matters described below are not subject to any time limitations and are subject to an overall dollar cap equal to the purchase price, which is an amount in excess of $900 million. The following paragraphs summarize the most significant actions and proceedings:
|
Rexnord Holdings, Inc. and Subsidiaries
Notes to Consolidated Financial Statements—(Continued)
March 31, 2008
|
The ultimate outcome of the Ellsworth investigation and related litigation cannot presently be determined; however, management believes the Company has meritorious defenses to these matters. Pursuant to its indemnity obligation, Invensys is defending the Company in these matters and has paid 100% of the related costs to date. To provide additional protection, the Company has brought several indemnification suits against previous property owners who retained certain environmental liabilities associated with its property, and is also involved in litigation with its insurance companies for a declaration of coverage. These suits are progressing in accordance with the respective court’s scheduling order.
Approximately 690 lawsuits (with approximately 6,850 claimants) are pending in state or federal court in numerous jurisdictions relating to alleged personal injuries due to the alleged presence of asbestos in certain brakes and clutches previously manufactured by the Company’s Stearns division and/or its predecessor owners. Invensys and FMC, prior owners of the Stearns business, have paid 100% of the costs to date related to the Stearns lawsuits. Similarly, the Company’s Prager subsidiary has been named as a defendant in two pending multi-defendant lawsuits relating to alleged personal injuries due to the alleged presence of asbestos in a product allegedly manufactured by Prager. There are approximately 3,700 claimants in the Prager lawsuits. The ultimate outcome of these lawsuits cannot presently be determined. To date, the Company’s insurance providers have paid 100% of the costs related to the Prager lawsuits. The Company believes that the combination of its insurance coverage and the Invensys indemnity obligations will cover any future costs of these suits.
In connection with the Falk acquisition, Hamilton Sundstrand has provided the Company with indemnification against certain contingent liabilities, including coverage for certain pre-closing environmental liabilities. The Company believes that, pursuant to such indemnity obligations, Hamilton Sundstrand is obligated to defend and indemnify the Company with respect to the asbestos claims described below, and that, with respect to these claims, such indemnity obligations are not subject to any time or dollar limitations. The following paragraph summarizes the most significant actions and proceedings for which Hamilton Sundstrand has accepted responsibility:
Falk, through its successor entity, is a defendant in approximately 150 lawsuits pending in state or federal court in numerous jurisdictions relating to alleged personal injuries due to the alleged presence of asbestos in certain clutches and drives previously manufactured by Falk. There are approximately 2,230 claimants in these suits. The ultimate outcome of these lawsuits cannot presently be determined. Hamilton Sundstrand is defending the Company in these lawsuits pursuant to its indemnity obligations and has paid 100% of the costs to date.
Certain Water Management subsidiaries are also subject to asbestos and class action related litigation.
As of March 31, 2008, Zurn and an average of 72 other unrelated companies were defendants in approximately 6,900 asbestos related lawsuits representing approximately 45,000 claims. The suits allege
Rexnord Holdings, Inc. and Subsidiaries
Notes to Consolidated Financial Statements—(Continued)
March 31, 2008
damages in an aggregate amount of approximately $13.4 billion against all defendants. Plaintiffs’ claims allege personal injuries caused by exposure to asbestos used primarily in industrial boilers formerly manufactured by a segment of Zurn. Zurn did not manufacture asbestos or asbestos components. Instead, Zurn purchased them from suppliers. These claims are being handled pursuant to a defense strategy funded by insurers.
The Company currently estimates the potential liability for asbestos-related claims pending against Zurn as well as the claims expected to be filed in the next ten years is approximately $134.0 million, of which Zurn expects to pay approximately $116.0 million in the next ten years on such claims, with the balance of the estimated liability being paid in subsequent years. However, there are inherent uncertainties involved in estimating the number of future asbestos claims, future settlement costs, and the effectiveness of defense strategies and settlement initiatives. As a result, Zurn’s actual liability could differ from the estimate described herein. Further, while this current asbestos liability is based on an estimate of claims through the next ten years, such liability may continue beyond that time frame, and such liability could be substantial.
Management estimates that its available insurance to cover its potential asbestos liability as of March 31, 2008, is approximately $281.5 million, and believes that all current claims are covered by this insurance. However, principally as a result of the past insolvency of certain of the Company’s insurance carriers, certain coverage gaps will exist if and after the Company’s other carriers have paid the first $205.5 million of aggregate liabilities. In order for the next $51.0 million of insurance coverage from solvent carriers to apply, management estimates that it would need to satisfy $14.0 million of asbestos claims. Layered within the final $25.0 million of the total $281.5 million of coverage, management estimates that it would need to satisfy an additional $80 million of asbestos claims. If required to pay any such amounts, the Company could pursue recovery against the insolvent carriers, but it is not currently possible to determine the likelihood or amount of any such recoveries, if any.
As of March 31, 2008, the Company recorded a receivable from its insurance carriers of $134.0 million, which corresponds to the amount of its potential asbestos liability that is covered by available insurance and is currently determined to be probable of recovery. However, there is no assurance that $281.5 million of insurance coverage will ultimately be available or that Zurn’s asbestos liabilities will not ultimately exceed $281.5 million. Factors that could cause a decrease in the amount of available coverage include changes in law governing the policies, potential disputes with the carriers on the scope of coverage, and insolvencies of one or more of the Company’s carriers.
As of May 23, 2008, subsidiaries, Zurn Pex, Inc. and Zurn Industries, LLC (formerly known as Zurn Industries, Inc.), have been named as defendants in eight lawsuits in various U.S. federal courts (MN, ND, CO, NC, MT and VA). The plaintiffs in these suits seek to represent a class of plaintiffs alleging damages due to the alleged failure or anticipated failure of the Zurn brass crimp fittings on the PEX plumbing systems in homes and other structures. The complaints assert various causes of action, including but not limited to negligence, breach of warranty, fraud, and violations of the Magnuson Moss Act and certain state consumer protection laws, and seek declaratory and injunctive relief, and damages (including punitive damages) in unspecified amounts. The Company believes it has insurance coverage in excess of $100 million, subject, however, to policy terms and conditions, and deductibles. While the Company intends to vigorously defend itself in these actions, the uncertainties of litigation and the uncertainties related to insurance coverage and collection as well as the actual number or value of claims make it difficult to accurately predict the financial effect these claims may ultimately have on the Company.
Rexnord Holdings, Inc. and Subsidiaries
Notes to Consolidated Financial Statements—(Continued)
March 31, 2008
19. Business Segment Information
The results of operations are reported in two business segments, consisting of the Power Transmission platform and the Water Management platform. The Power Transmission platform manufactures gears, couplings, industrial bearings, flattop chain and modular conveyer belts, aerospace bearings and seals, special components and industrial chain. This segment serves a diverse group of end market industries, including aerospace, aggregates and cement, air handling, construction equipment, chemicals, energy, food and beverage, forest and wood products, mining, material and package handling, marine, natural resource extraction and petrochemical. The Water Management platform manufactures professional grade specification plumbing, water treatment and waste water control products serving the commercial, institutional, civil, municipal, hydropower and public water works construction markets.
The financial information of the Company’s segments is regularly evaluated by the chief operating decision makers in determining resource allocation and assessing performance and is periodically reviewed by the Company’s board of directors. Management evaluates the performance of each business segment based on its operating results. The same accounting policies are used throughout the organization (see Note 2).
Rexnord Holdings, Inc. and Subsidiaries
Notes to Consolidated Financial Statements—(Continued)
March 31, 2008
Business Segment Information:
(in Millions)
| Predecessor | ||||||||||||||||||
| Year Ended March 31, 2006 | Period from April 1, 2006 through July 21, 2006 | Period from July 22, 2006 through March 31, 2007 | Year Ended March 31, 2008 | |||||||||||||||
Net sales | ||||||||||||||||||
Power Transmission | $ | 1,081.4 | $ | 334.2 | $ | 852.0 | $ | 1,342.3 | ||||||||||
Water Management | — | — | 69.5 | 511.2 | ||||||||||||||
Consolidated | $ | 1,081.4 | $ | 334.2 | $ | 921.5 | $ | 1,853.5 | ||||||||||
Income (loss) from operations | ||||||||||||||||||
Power Transmission | $ | 150.4 | $ | 33.2 | $ | 118.4 | $ | 205.6 | ||||||||||
Water Management | — | — | 10.3 | 70.7 | ||||||||||||||
Corporate | (45.9 | ) | (67.5 | ) | (15.6 | ) | (17.3 | ) | ||||||||||
Consolidated | 104.5 | (34.3 | ) | 113.1 | 259.0 | |||||||||||||
Non-operating expense: | ||||||||||||||||||
Interest expense, net | (61.5 | ) | (21.0 | ) | (109.8 | ) | (254.3 | ) | ||||||||||
Other expense, net | (3.8 | ) | (0.4 | ) | 5.7 | (5.3 | ) | |||||||||||
Income (loss) before income taxes | 39.2 | (55.7 | ) | 9.0 | (0.6 | ) | ||||||||||||
Provision (benefit) for income taxes | 16.3 | (16.1 | ) | 9.2 | (0.9 | ) | ||||||||||||
Net income (loss) | $ | 22.9 | $ | (39.6 | ) | $ | (0.2 | ) | $ | 0.3 | ||||||||
Transaction-related costs (included in Income (loss) from operations) | ||||||||||||||||||
Corporate | $ | — | $ | 62.7 | $ | — | $ | — | ||||||||||
Restructuring and other similar costs (included in Income (loss) from operations) | ||||||||||||||||||
Corporate | $ | 31.1 | $ | — | $ | — | $ | — | ||||||||||
Depreciation and Amortization | ||||||||||||||||||
Power Transmission | $ | 58.7 | $ | 19.0 | $ | 59.4 | $ | 77.5 | ||||||||||
Water Management | — | — | 3.6 | 26.6 | ||||||||||||||
Consolidated | $ | 58.7 | $ | 19.0 | $ | 63.0 | $ | 104.1 | ||||||||||
Capital Expenditures | ||||||||||||||||||
Power Transmission | $ | 37.1 | $ | 11.7 | $ | 27.6 | $ | 51.5 | ||||||||||
Water Management | — | — | 0.4 | 3.4 | ||||||||||||||
Consolidated | $ | 37.1 | $ | 11.7 | $ | 28.0 | $ | 54.9 | ||||||||||
| March 31, 2007 | March 31, 2008 | |||||||||||||||||
Total Assets | ||||||||||||||||||
Power Transmission | $ | 2,447.0 | $ | 2,560.4 | ||||||||||||||
Water Management | 1,336.4 | 1,265.9 | ||||||||||||||||
Consolidated | $ | 3,783.4 | $ | 3,826.3 | ||||||||||||||
Rexnord Holdings, Inc. and Subsidiaries
Notes to Consolidated Financial Statements—(Continued)
March 31, 2008
Net sales to third parties and long-lived assets by geographic region are as follows (in millions):
| Net Sales | Long-lived Assets | ||||||||||||||||||||||||
| Predecessor | Predecessor | ||||||||||||||||||||||||
| Year Ended March 31, 2006 | Period from April 1, 2006 through July 21, 2006 | Period from July 22, 2006 through March 31, 2007 | Year Ended March 31, 2008 | March 31, 2006 | March 31, 2007 | March 31, 2008 | |||||||||||||||||||
United States | $ | 771.3 | $ | 235.8 | $ | 654.0 | $ | 1,392.1 | $ | 280.3 | $ | 340.0 | $ | 346.2 | |||||||||||
Europe | 202.7 | 65.1 | 169.0 | 285.2 | 54.4 | 77.2 | 73.3 | ||||||||||||||||||
Rest of World | 107.4 | 33.3 | 98.5 | 176.2 | 14.2 | 19.9 | 23.8 | ||||||||||||||||||
| $ | 1,081.4 | $ | 334.2 | $ | 921.5 | $ | 1,853.5 | $ | 348.9 | $ | 437.1 | $ | 443.3 | ||||||||||||
Net sales to third parties are attributed to the geographic regions based on the country in which the shipment originates. Amounts attributed to the geographic regions for long-lived assets are based on the location of the entity that holds such assets. Long-lived assets exclude net intangible assets and goodwill.
20. Quarterly Results of Operations (unaudited)
(in millions, except per share amounts)
| Predecessor | ||||||||||||||||||||
Fiscal Year 2007 | First | Period from July 3, 2006 through July 21, 2006 | Period from July 22, 2006 through September 30, 2006 | Third | Fourth | |||||||||||||||
Net sales | $ | 288.4 | $ | 45.8 | $ | 252.3 | $ | 283.1 | $ | 386.1 | ||||||||||
Gross profit | 89.7 | 6.8 | 84.0 | 84.1 | 125.2 | |||||||||||||||
Net income (loss) | (2.8 | ) | (36.8 | ) | 0.4 | (4.5 | ) | 3.9 | ||||||||||||
Net income (loss) per share: | ||||||||||||||||||||
Basic | $ | 0.04 | $ | (0.48 | ) | $ | 0.30 | |||||||||||||
Diluted | 0.04 | (0.48 | ) | 0.29 | ||||||||||||||||
| NM | NM | |||||||||||||||||||
Weighted-average number of shares outstanding: | ||||||||||||||||||||
Basic | 9.4 | 9.4 | 12.9 | |||||||||||||||||
Effect of dilutive stock options | 0.4 | — | 0.4 | |||||||||||||||||
Diluted | 9.8 | 9.4 | 13.3 | |||||||||||||||||
Fiscal Year 2008 | First | Second | Third | Fourth | ||||||||||
Net sales | $ | 448.2 | $ | 453.9 | $ | 449.1 | $ | 502.3 | ||||||
Gross profit | 142.0 | 149.2 | 147.6 | 164.3 | ||||||||||
Net income | (7.4 | ) | (3.1 | ) | 9.3 | 1.5 | ||||||||
Net income (loss) per share: | ||||||||||||||
Basic | $ | (0.47 | ) | $ | (0.20 | ) | $ | 0.59 | $ | 0.09 | ||||
Diluted | (0.47 | ) | (0.20 | ) | 0.57 | 0.09 | ||||||||
Weighted-average number of shares outstanding: | ||||||||||||||
Basic | 15.7 | 15.8 | 15.8 | 15.9 | ||||||||||
Effect of dilutive stock options | — | — | 0.4 | 0.4 | ||||||||||
Diluted | 15.7 | 15.8 | 16.2 | 16.3 | ||||||||||
Rexnord Holdings, Inc. and Subsidiaries
Notes to Consolidated Financial Statements—(Continued)
March 31, 2008
On March 28, 2008, the Company sold its French subsidiary, Rexnord SAS, to members of that company’s local management team for €1 (one Euro), subject to a customary post-close working capital adjustment. The Company made the decision to sell Rexnord SAS to the local management team for one Euro as the business would have required a substantial investment (both financial and by company management) to increase the overall market share position of certain products sold by the business to levels consistent with the Company’s long-term strategic plan. In connection with the sale, the Company recorded a pretax loss on divestiture of approximately $11.2 million (including transaction costs), which was recognized in the Company’s fourth quarter of the year ended March 31, 2008. See Note 3 for further information regarding the sale.
Condensed Consolidated Balance Sheets
(in millions)
| September 30, 2006 | December 31, 2006 | |||||
| (unaudited) | ||||||
| ASSETS | ||||||
Current assets: | ||||||
Cash and cash equivalents | $ | 147.2 | $ | 159.5 | ||
Trade receivables, net | 205.0 | 177.4 | ||||
Inventories | 194.6 | 215.6 | ||||
Deferred income taxes | 25.6 | 25.9 | ||||
Assets held for sale | 7.4 | 7.5 | ||||
Prepaid expenses and other current assets | 21.9 | 16.7 | ||||
Total current assets | 601.7 | 602.6 | ||||
Property, plant and equipment, net | 92.5 | 94.1 | ||||
Pension assets | 150.0 | 151.9 | ||||
Insurance for asbestos claims | 136.0 | 136.0 | ||||
Goodwill | 231.4 | 233.9 | ||||
Other non-current assets | 42.1 | 41.7 | ||||
TOTAL ASSETS | $ | 1,253.7 | $ | 1,260.2 | ||
| LIABILITIES AND STOCKHOLDERS’ EQUITY | ||||||
Current liabilities: | ||||||
Notes payable | $ | 19.8 | $ | 28.7 | ||
Current maturities of long-term debt | 1.7 | 1.7 | ||||
Trade accounts payable | 108.5 | 96.2 | ||||
Income taxes payable | 9.9 | 18.9 | ||||
Liabilities associated with assets held for sale | 0.8 | — | ||||
Accrued expenses and other current liabilities | 109.3 | 105.1 | ||||
Total current liabilities | 250.0 | 250.6 | ||||
Long-term debt | 381.8 | 381.8 | ||||
Deferred income taxes | 28.3 | 28.7 | ||||
Asbestos claims | 136.0 | 136.0 | ||||
Other non-current liabilities | 112.1 | 107.4 | ||||
Total liabilities | 908.2 | 904.5 | ||||
Commitments and contingencies | ||||||
Stockholders’ equity | 345.5 | 355.7 | ||||
TOTAL LIABILITIES AND STOCKHOLDERS’ EQUITY | $ | 1,253.7 | $ | 1,260.2 | ||
The accompanying notes are an integral part of these statements.
Unaudited Condensed Consolidated Statements of Operations
(in millions, except per share data)
| Three Months Ended December 31, | ||||||||
| 2005 | 2006 | |||||||
Net sales | $ | 267.1 | $ | 272.1 | ||||
Operating costs and expenses: | ||||||||
Cost of products sold | 184.9 | 192.3 | ||||||
Selling, general and administrative expenses | 59.5 | 61.0 | ||||||
Restructuring charges | 1.6 | 0.7 | ||||||
Operating income | 21.1 | 18.1 | ||||||
Interest expense | (10.3 | ) | (10.7 | ) | ||||
Interest income | 1.4 | 2.0 | ||||||
Rexair equity earnings | 0.6 | 0.3 | ||||||
Other income (expense), net | 8.1 | (1.5 | ) | |||||
Earnings before income taxes and discontinued operations | 20.9 | 8.2 | ||||||
Provision for income taxes | (8.8 | ) | (3.7 | ) | ||||
Earnings from continuing operations | 12.1 | 4.5 | ||||||
Discontinued operations: | ||||||||
Loss from operations (net of tax benefit of $0.3 for the three months ended December 31, 2005) | (0.6 | ) | — | |||||
Loss from disposals (net of tax benefit of $0.4 and $0.3 respectively) | (0.8 | ) | (0.6 | ) | ||||
Net earnings | $ | 10.7 | $ | 3.9 | ||||
Basic earnings (loss) per share: | ||||||||
Continuing operations | $ | 0.16 | $ | 0.06 | ||||
Discontinued operations | (0.02 | ) | (0.01 | ) | ||||
| $ | 0.14 | $ | 0.05 | |||||
Diluted earnings (loss) per share: | ||||||||
Continuing operations | $ | 0.16 | $ | 0.06 | ||||
Discontinued operations | (0.02 | ) | (0.01 | ) | ||||
| $ | 0.14 | $ | 0.05 | |||||
The accompanying notes are an integral part of these statements.
Unaudited Condensed Consolidated Statements of Cash Flows
(in millions)
| Three months ended December 31, | ||||||||
| 2005 | 2006 | |||||||
OPERATING ACTIVITIES: | ||||||||
Net cash provided by operating activities of continuing operations | $ | 2.6 | $ | 7.6 | ||||
Net cash used in operating activities of discontinued operations | (1.9 | ) | (1.4 | ) | ||||
NET CASH PROVIDED BY OPERATING ACTIVITIES | 0.7 | 6.2 | ||||||
INVESTING ACTIVITIES: | ||||||||
Collection of a non-operating note receivable | 9.3 | — | ||||||
Purchases of property, plant and equipment | (3.0 | ) | (2.5 | ) | ||||
Proceeds from sale of excess real estate | 1.7 | 0.8 | ||||||
Other | (0.1 | ) | — | |||||
Net cash provided by (used in) investing activities of continuing operations | 7.9 | (1.7 | ) | |||||
Investing activities of discontinued operations | (0.6 | ) | — | |||||
NET CASH PROVIDED BY (USED IN) FINANCING ACTIVITIES | 7.3 | (1.7 | ) | |||||
FINANCING ACTIVITIES: | ||||||||
Proceeds from stock option exercises | 0.3 | 0.2 | ||||||
Excess tax benefits from share based payment agreements | — | 0.1 | ||||||
Increase in notes payable, net | 3.8 | 7.8 | ||||||
Net cash provided by financing activities of continuing operations | 4.1 | 8.1 | ||||||
Financing activities of discontinued operations | (0.7 | ) | — | |||||
NET CASH PROVIDED BY FINANCING ACTIVITIES | 3.4 | 8.1 | ||||||
Effect of exchange rate changes on cash and cash equivalents | (0.2 | ) | (0.3 | ) | ||||
INCREASE IN CASH AND CASH EQUIVALENTS | 11.2 | 12.3 | ||||||
CASH AND CASH EQUIVALENTS AT BEGINNING OF PERIOD | 110.2 | 147.2 | ||||||
CASH AND CASH EQUIVALENTS AT END OF PERIOD | $ | 121.4 | $ | 159.5 | ||||
The accompanying notes are an integral part of these statements.
Notes to Condensed Consolidated Financial Statements
(Tabular amounts in millions unless otherwise noted)
(unaudited)
Note 1—Basis of Presentation
We manufacture and distribute a broad range of consumer and industrial products through our operating subsidiaries in two business segments—Bath Products and Plumbing Products. Refer toNote 13 regarding our business segments.
We operate on a 52- or 53-week fiscal year ending on the Saturday nearest to September 30. The three-month periods presented in our condensed consolidated financial statements reflect the 13-week periods ending on the Saturday nearest December 31 of the respective fiscal year, but are presented as of December 31 for convenience. The fiscal quarter periods presented consist of the 13 weeks ended December 31, 2006 (also referred to as the “first quarter of 2007”) and December 31, 2005 (also referred to as the “first quarter of 2006”), and are unaudited. However, in our opinion, these financial statements reflect all normal, recurring adjustments necessary to provide a fair presentation of our financial position, results of operations and cash flows for the periods presented. These interim financial statements are condensed, and thus, do not include all of the information and footnotes required by United States generally accepted accounting principles (“GAAP”) for presentation of a complete set of financial statements. The balance sheet as of September 30, 2006 has been derived from the audited consolidated financial statements at that date, but does not include all of the information and footnotes required by GAAP for a complete set of financial statements.
Our results are impacted by weather and other seasonal influences affecting construction. These interim results are not necessarily indicative of the results that should be expected for the full year. For a better understanding of Jacuzzi Brands, Inc. and our financial statements, the condensed interim financial statements should be read in conjunction with our audited consolidated financial statements for the year ended September 30, 2006, which are included in our 2006 Annual Report on Form 10-K, filed on December 7, 2006.
On October 11, 2006, we announced that a definitive merger agreement had been signed under which affiliates of private equity firm Apollo Management L.P. (“Apollo”) will purchase Jacuzzi Brands for $12.50 per share. On January 25, 2007, Jacuzzi Brands’ stockholders approved the adoption of the merger agreement with affiliates of Apollo Management, L.P. All required regulatory approvals for the merger have been obtained, including early termination under the Hart-Scott-Rodino Antitrust Improvements Act of 1976, as amended. On February 7, 2007, Apollo completed the acquisition.
As previously announced, in connection with the merger agreement, we launched a cash tender offer and consent solicitation on December 4, 2006 with respect to our outstanding $380 million in aggregate principal amount 9 5/8% Senior Secured Notes due 2010 (“Senior Notes”). On December 18, 2006 we announced that we had received tenders and consents for 99.99% of the Senior Notes. Substantially all of the Senior Notes were tendered in the tender offer, which was completed in connection with the merger.
Certain amounts have been reclassified in our prior year consolidated financial statements to conform them to the presentation used in the current year.
Jacuzzi Brands, Inc.
Notes to Condensed Consolidated Financial Statements—(Continued)
(Tabular amounts in millions unless otherwise noted)
(unaudited)
Note 2—Inventories
We use the first-in-first out (“FIFO”) method for determining the cost of approximately 37.2% of our inventories at December 31, 2006 and approximately 39.0% of our inventories at September 2006, and the last-in-last-out (“LIFO”) method for the remainder of our inventories. Our inventories are categorized as follows:
| September 30, 2006 | December 31, 2006 | |||||||
Finished products | $ | 147.4 | $ | 164.4 | ||||
In-process products | 15.1 | 18.5 | ||||||
Raw materials | 49.4 | 50.0 | ||||||
Inventory at FIFO | $ | 211.9 | $ | 232.9 | ||||
LIFO reserve | (17.3 | ) | (17.3 | ) | ||||
| $ | 194.6 | $ | 215.6 | |||||
The LIFO reserve represents the difference between the carrying values of our LIFO inventories and their FIFO cost value.
Note 3—Long-Term Debt
Long-term debt consists of the following:
| September 30, 2006 | December 31, 2006 | |||||||
Senior Notes | $ | 380.0 | $ | 380.0 | ||||
Other long-term debt | 3.5 | 3.5 | ||||||
| 383.5 | 383.5 | |||||||
Less: current maturities | (1.7 | ) | (1.7 | ) | ||||
Long-term debt | $ | 381.8 | $ | 381.8 | ||||
The Senior Notes are due on July 1, 2010 and require the payment of interest of $18.3 million on January 1 and July 1 of each year. As discussed inNote 1, substantially all of the Senior Notes were tendered in connection with the merger.
We also have an asset-based credit facility that matures on July 15, 2008. Under this facility, we can borrow up to $200.0 million subject to a borrowing base consisting of eligible accounts receivable and eligible inventory. There were no balances outstanding under this facility during the first quarter of 2007. At December 31, 2006, we had approximately $121.2 million available to be borrowed under the asset-based credit facility, of which we had utilized approximately $32.1 million for letters of credit, leaving $89.1 million available for borrowings. In addition, we have outstanding foreign commercial letters of credit of $2.0 million which do not affect availability under the asset-based credit facility.
We paid $0.8 million of interest on our borrowings during both the first quarters of 2007 and 2006. Additional information regarding our long-term debt can be found in our 2006 Annual Report on Form 10-K, filed on December 7, 2006.
Jacuzzi Brands, Inc.
Notes to Condensed Consolidated Financial Statements—(Continued)
(Tabular amounts in millions unless otherwise noted)
(unaudited)
Note 4—Commitments and Contingencies
Warranties
We record a reserve for future warranty costs based on current unit sales, historical experience and management’s judgment regarding anticipated rates of warranty claims and cost per claim. The adequacy of the recorded warranty reserves is assessed each quarter and adjustments are made as necessary. The specific terms and conditions of the warranties vary depending on the products sold and the countries in which we do business.
Changes in our warranty reserves during the first quarter of 2007 are as follows:
At September 30, 2006 | $ | 25.6 | ||
Warranty accrual | 3.2 | |||
Cash payments | (3.7 | ) | ||
Other | 0.1 | |||
At December 31, 2006 | $ | 25.2 | ||
Contingencies
We are aware of four purported class action lawsuits related to the merger filed against the Company, each of the Company’s directors and various other defendants, as the case may be, including Apollo, the Company and George M. Sherman (the non-executive Chairman of Rexnord Corporation, a portfolio company affiliated with Apollo), in the Court of Chancery in the State of Delaware in and for New Castle County (the “Court”). On January 22, 2007 we reached an agreement to settle the lawsuits—Usheroff v. Jacuzzi Brands, Inc., et al., C. A. No. 2473-N (filed Oct. 13, 2006),Ryan v. Victor, et al., C.A. No. 2477-N (filed Oct. 13, 2006),Rubenstein v. Marini, et al., C. A. No. 2485-N (filed Oct. 20, 2006) andWorcester Retirement System v. Jacuzzi Brands, Inc., et al., C.A. No. 2531-N (filed Nov. 8, 2006). Under the terms of the agreement, which remains subject to approval by the Court, the parties have agreed to settle all claims raised, or which could be raised, by the proposed plaintiff class relating to the merger. Pursuant to the terms of the proposed settlement, the Company has agreed to amend the merger agreement such that (1) the termination fee payable by the Company on the occurrence of certain specified events, is reduced from $25 million to $22.5 million and (2) the time period during which the Company’s entry into an alternative acquisition proposal would trigger payment of the termination fee under certain circumstances, is reduced from 12 months to 9 months. The Company also agreed to make certain additional disclosures already reflected in the Definitive Proxy Statement filed with the SEC on January 5, 2007. The parties also agreed that, in connection with a settlement, counsel for plaintiffs may seek an award from the Court of attorneys’ fees and expenses in an amount not to exceed $725,000 if the merger is consummated. The Company noted that there can be no assurance that the Court will approve the proposed settlement or that any ultimate settlement will be under the same terms as those contemplated by the agreement.
Guarantees & Indemnifications
In connection with the sale of Ames True Temper in January 2002, we continue to guarantee the lease payments of their master distribution center. The lease obligation will expire in 2015. The scheduled lease payments totaled $3.9 million for fiscal 2006, and increase by 2.25% each year thereafter. We obtained a security interest and indemnification from Ames True Temper on the lease that would enable us to exercise remedies in the event of default. We have not been called upon to make any payments under this guarantee.
Jacuzzi Brands, Inc.
Notes to Condensed Consolidated Financial Statements—(Continued)
(Tabular amounts in millions unless otherwise noted)
(unaudited)
We have sold a number of assets and businesses over the last several years and have, on occasion, provided indemnifications for liabilities relating to product liability, environmental, insurance, tax and other claims. We have recorded reserves, net of escrow deposits totaling approximately $10.2 million as of December 31, 2006 for asserted and potential unasserted claims related to these liabilities. These amounts have not been discounted.
We have an agreement with a third party financing company to repurchase any new or salable spas returned to us within twelve months of the original sale date. The costs associated with this agreement have been minimal to date.
Environmental Matters
We are subject to numerous foreign, federal, state and local laws and regulations concerning such matters as zoning, health and safety and protection of the environment. Laws and regulations protecting the environment may in certain circumstances impose “strict liability,” rendering a person liable for environmental damage without regard to negligence or fault on the part of such person. In addition, from time to time, we may receive notices of violation or may be denied applications for environmental licenses or permits because the practices of the operating unit are not consistent with regulations or ordinances.
Our subsidiaries have made capital and maintenance expenditures over time to comply with these laws and regulations. While the amount of expenditures in future years will depend on legal and technological developments which cannot be predicted at this time, these expenditures may progressively increase if regulations become more stringent. In addition, while future costs for compliance cannot be predicted with precision, no information currently available reasonably suggests that these expenditures will have a material adverse effect on our financial condition, results of operations or cash flows.
We are investigating and remediating contamination at a number of present and former operating sites under the Federal Comprehensive Environmental Response, Compensation and Liability Act of 1980 (“CERCLA” or “Superfund”), the Federal Resource Conservation and Recovery Act or comparable state statutes or agreements with third parties. These proceedings are in various stages ranging from initial investigations to active settlement negotiations to the cleanup of sites. We have been named as a potentially responsible party at a number of Superfund sites under CERCLA or comparable state statutes. Under these statutes, responsibility for the entire cost of cleanup of a contaminated site can be imposed upon any current or former site owner or operator, or upon any party who sent waste to the site, regardless of the lawfulness of the original activities that led to the contamination. No information currently available reasonably suggests that projected expenditures associated with any of these proceedings or any remediation of these sites will have a material adverse effect on our financial condition, results of operations or cash flows.
As of December 31, 2006, we had accrued approximately $7.2 million ($0.5 million accrued as current liabilities and $6.7 million as non-current liabilities), including $5.7 million for discontinued operations, for environmental liabilities. These amounts have not been discounted. In conjunction with some of these liabilities, we have deposited $10.4 million in escrow accounts pursuant to the terms of past disposal agreements. We accrue an amount for each case when the likelihood of an unfavorable outcome is probable and the amount of loss associated with such unfavorable outcome is reasonably estimable.
We believe that the range of liability for these matters would only increase by $0.2 million if it included cases where the likelihood of an unfavorable outcome is only reasonably possible. We cannot predict whether future developments in laws and regulations concerning environmental protection or unanticipated enforcement
Jacuzzi Brands, Inc.
Notes to Condensed Consolidated Financial Statements—(Continued)
(Tabular amounts in millions unless otherwise noted)
(unaudited)
actions will require material capital expenditures or otherwise affect our financial condition, results of operations or cash flows in a materially adverse manner, or whether our businesses will be successful in meeting future demands of regulatory agencies in a manner which will not have a material adverse effect on our financial condition, results of operations or cash flows.
Litigation
We and our subsidiaries are parties to legal proceedings that we believe to be either ordinary, routine litigation incidental to the business of present and former operations or immaterial to our financial condition, results of operations or cash flows.
Certain of our subsidiaries are defendants or plaintiffs in lawsuits that have arisen in the normal course of business. While certain of these matters involve substantial amounts, it is management’s opinion, based on the advice of counsel, that the ultimate resolution of such litigation will not have a material adverse effect on our financial condition, results of operations or cash flows.
In June 1998, we acquired Zurn Industries, Inc. (“Zurn”), which operates as one of our wholly-owned subsidiaries. At the time of the acquisition, Zurn had itself owned various subsidiaries. Zurn, along with many other unrelated companies, is a co-defendant in numerous asbestos related lawsuits pending in the U.S. Plaintiffs’ claims primarily allege personal injuries allegedly caused by exposure to asbestos used primarily in industrial boilers formerly manufactured by a segment of Zurn that has been accounted for as a discontinued operation. Zurn did not manufacture asbestos or asbestos components. Instead, Zurn purchased it from suppliers.
Federal legislation has been proposed that would remove asbestos claims from the current tort system and place them in a trust fund system. This trust would be funded by the insurers and defendant companies. There can be no assurance as to when or if this or any other legislation will be passed and become law or what, if any, the financial impact it could have on Zurn.
New claims filed against Zurn were lower period-over-period. During the first quarter of 2007, approximately 1,200 new asbestos claims were filed against Zurn versus 1,900 in the first quarter of 2006. As of December 31, 2006, the number of asbestos claims pending against Zurn was approximately 46,300 compared to 46,200 as of September 30, 2006. The pending claims against Zurn as of December 31, 2006 were included in approximately 5,000 lawsuits, in which Zurn and an average of 85 other companies are named as defendants, and which cumulatively allege damages of approximately $11.5 billion against all defendants. The claims are handled pursuant to a defense strategy funded by Zurn’s insurers. Defense costs currently do not erode the coverage amounts in the insurance policies, although a few policies that will be accessed in the future may count defense costs toward aggregate limits.
During the first quarter of 2007 and as of the end of such period, approximately 14,200 claims were paid and/or pending payment and approximately 5,800 claims were dismissed and/or pending dismissal. During the first quarter of 2006 and as of the end of such period, approximately 13,800 claims were paid and/or pending payment and approximately 2,900 claims were dismissed and/or pending dismissal. Since Zurn received its first asbestos claim in the 1980s, Zurn has paid or dismissed or agreed to settle or dismiss approximately 147,100 asbestos claims including dismissals or agreements to dismiss of approximately 49,600 of such claims through December 31, 2006.
Jacuzzi Brands, Inc.
Notes to Condensed Consolidated Financial Statements—(Continued)
(Tabular amounts in millions unless otherwise noted)
(unaudited)
Zurn used an independent economic consulting firm with substantial experience in asbestos liability valuations to assist in the estimation of Zurn’s potential asbestos liability. At September 30, 2006, that firm estimated that Zurn’s potential liability for asbestos claims pending against it and for claims estimated to be filed through 2016 is approximately $136 million, of which Zurn expects to pay approximately $102 million through 2016 on such claims, with the balance of the estimated liability being paid in subsequent years. As discussed below in more detail, Zurn expects all such payments to be paid by its carriers.
This asbestos liability estimate was based on the current and anticipated number of future asbestos claims, the timing and amounts of asbestos payments, the status of ongoing litigation and the potential impact of defense strategies and settlement initiatives. However, there are inherent uncertainties involved in estimating the number of future asbestos claims, future settlement costs, and the effectiveness of Zurn’s defense strategies and settlement initiatives. In addition, Zurn’s current estimate could be adversely affected due to changes in law and other factors beyond its control. As a result, Zurn’s actual liability could differ from Zurn’s estimate described herein.
Zurn’s current estimate of its asbestos liability of $136 million for claims filed through 2016 assumes that (i) its continuous vigorous defense strategy will remain effective; (ii) new asbestos claims filed annually against it will decline modestly through 2016; (iii) the values by disease will remain consistent with past experience; and (iv) its insurers will continue to pay defense costs without eroding the coverage amounts of its insurance policies. While Zurn believes there is evidence, in its claims settlements experience, for such an impact of a successful defense strategy, if the defense strategy ultimately is not successful to the extent assumed by Zurn, the severity and frequency of asbestos claims could increase substantially above Zurn’s estimates. Further, while Zurn’s current asbestos liability is based on an estimate of claims through 2016, such liability may continue beyond 2016, and such liability could be substantial.
Zurn estimates that its available insurance to cover its potential asbestos liability as of December 31, 2006 is approximately $280.2 million. Zurn believes, based on its experience in defending and dismissing such claims and the coverage available, that it has sufficient insurance to cover the pending and reasonably estimable future claims. This conclusion was reached after considering Zurn’s experience in asbestos litigation, the insurance payments made to date by Zurn’s insurance carriers, existing insurance policies, the industry ratings of the insurers and the advice of insurance coverage counsel with respect to applicable insurance coverage law relating to the terms and conditions of those policies. As of December 31, 2006 and September 30, 2006, Zurn recorded a receivable from its insurance carriers of $136 million, which corresponds to the amount of Zurn’s potential asbestos liability that is covered by available insurance and is probable of recovery.
However, there is no assurance that $280.2 million of insurance coverage will ultimately be available or that Zurn’s asbestos liabilities will not ultimately exceed this amount. Factors that could cause a decrease in the amount of available coverage include changes in law governing the policies, potential disputes with the carriers on the scope of coverage, and insolvencies of one or more of Zurn’s carriers.
Principally as a result of the past insolvency of certain of Zurn’s insurance carriers, coverage analysis reveals that certain gaps exist in Zurn’s insurance coverage, but only if and after Zurn uses approximately $210.2 million of its remaining approximate $280.2 million of insurance coverage. As noted above, the estimate of Zurn’s potential liability for asbestos claims pending against it and for claims estimated to be filed through 2016 is $136 million with the expected amount to be paid through 2016 being $102 million. In order to use approximately $255.2 million of the $280.2 million of its insurance coverage from solvent carriers, Zurn estimates that it would need to satisfy approximately $14 million of asbestos claims, with additional gaps of
Jacuzzi Brands, Inc.
Notes to Condensed Consolidated Financial Statements—(Continued)
(Tabular amounts in millions unless otherwise noted)
(unaudited)
$80 million layered within the final $25 million of the $280.2 million of coverage. We will pursue, if necessary, any available recoveries on our approximately $148 million of coverage with insolvent carriers, which includes approximately $83 million of coverage attributable to the gaps discussed above. These estimates are subject to the factors noted above.
After review of the foregoing with Zurn and its consultants, we believe that the resolution of Zurn’s pending and reasonably estimable asbestos claims will not have a material adverse effect on Zurn’s financial condition, results of operations or cash flows.
Note 5—Comprehensive Earnings
The components of comprehensive earnings are as follows:
| First Quarter | |||||||
| 2006 | 2007 | ||||||
Net earnings | $ | 10.7 | $ | 3.9 | |||
Foreign currency translation adjustments, net of tax | (3.6 | ) | 5.2 | ||||
Minimum pension liability adjustment, net of tax | 0.5 | — | |||||
Net unrealized loss on investments, net of tax | (0.1 | ) | — | ||||
Comprehensive earnings | $ | 7.5 | $ | 9.1 | |||
Note 6—Earnings Per Share
The information required to compute net earnings per basic and diluted share is as follows:
| First Quarter | ||||
| 2006 | 2007 | |||
Basic weighted-average number of common shares outstanding | 76.1 | 76.8 | ||
Effect of potentially dilutive securities: | ||||
Stock options | 0.3 | 0.4 | ||
Restricted stock and restricted stock units | 0.6 | 0.7 | ||
Diluted weighted-average number of common shares outstanding | 77.0 | 77.9 | ||
There were no options to purchase shares excluded from the computation of diluted earnings per share in the first quarter of 2007. Options to purchase 0.4 million shares in the first quarter of 2006, were not included in the computation of diluted earnings per share because the exercise prices of these options exceeded the average market price of the common shares during the first quarter of 2006.
Note 7—Stock Based Compensation
We maintain incentive stock plans that provide for grants of stock options and restricted stock awards to our directors, officers and key employees. We recorded compensation costs of $1.0 million for both the first quarters of 2007 and 2006. We granted 26,250 stock options during the first quarter of 2007 with a fair value of $6.31. The weighted average exercise price of stock options granted during the quarter was $9.98. There were no restricted stock awards issued during the first quarter of 2007. We recognized a tax benefit for share-based compensation arrangements of $0.3 million in both the first quarters of 2007 and 2006.
Jacuzzi Brands, Inc.
Notes to Condensed Consolidated Financial Statements—(Continued)
(Tabular amounts in millions unless otherwise noted)
(unaudited)
Note 8—Pension and Retirement Plans
We sponsor a number of non-contributory defined benefit pension plans and a number of defined contribution plans. Additionally, we provide other post-retirement benefits, such as health care and life insurance benefits, to certain groups of retirees, with most retirees contributing a portion of our costs.
The components of net periodic (income) expense for our defined benefit pension and other post-retirement benefit plans are as follows:
| Pension Plans First Quarter | Other Plans First Quarter | |||||||||||||||
| 2006 | 2007 | 2006 | 2007 | |||||||||||||
Service cost | $ | 1.5 | $ | 1.7 | $ | 0.1 | $ | 0.1 | ||||||||
Interest cost | 5.9 | 6.2 | 0.2 | 0.2 | ||||||||||||
Expected return on plan assets | (9.0 | ) | (9.9 | ) | — | — | ||||||||||
Amortization of prior service cost | 0.3 | 0.4 | (0.2 | ) | (0.3 | ) | ||||||||||
Amortization of net actuarial loss | 2.1 | 1.3 | — | — | ||||||||||||
Curtailment/settlement | 0.6 | — | — | — | ||||||||||||
Periodic (income) expense of defined benefit plans | 1.4 | (0.3 | ) | 0.1 | 0.0 | |||||||||||
Net periodic (income) expense of: | ||||||||||||||||
Defined benefit plans | 1.4 | (0.3 | ) | 0.1 | 0.0 | |||||||||||
Defined contribution plans | 0.4 | 0.5 | — | — | ||||||||||||
Net periodic expense | $ | 1.8 | $ | 0.2 | $ | 0.1 | $ | 0.0 | ||||||||
During the first quarter of 2006, we made an offer to certain retired or terminated vested participants in our defined benefit pension plans to pay them their future nonqualified benefits as a one time lump sum payment. There were 27 participants who accepted the offer, resulting in a payment of $3.0 million in benefits and a settlement change of $0.6 million, which is included in the other (expense) income, net.
Our funding policy is to contribute amounts to our pension plans sufficient to meet the minimum funding requirements set forth in the Employee Retirement Income Security Act of 1974 or U.K. law and pension regulations, plus such additional amounts as we may determine to be appropriate from time to time. During the first quarter of 2007, we contributed $5.4 million to our foreign defined benefit pension plans and expect to contribute another $7.1 million to these plans during the remainder of fiscal 2007. This estimated future contribution includes $2.8 million which is conditional on the receipt of proceeds related to the sale of a building.
Note 9—Restructuring Costs
The activity in the restructuring liability accounts by cost category is as follows:
| Lease and Contract-Related Costs | Severance and Related Costs | Total Costs | ||||||||||
At September 30, 2006 | $ | 1.3 | $ | 1.3 | $ | 2.6 | ||||||
Cash charges | — | 0.6 | 0.6 | |||||||||
Cash payments | (0.2 | ) | (1.2 | ) | (1.4 | ) | ||||||
At December 31, 2006 | $ | 1.1 | $ | 0.7 | $ | 1.8 | ||||||
Jacuzzi Brands, Inc.
Notes to Condensed Consolidated Financial Statements—(Continued)
(Tabular amounts in millions unless otherwise noted)
(unaudited)
We recorded restructuring charges of $0.7 million during the first quarter of 2007 which included the $0.6 million in cash charges reflected above and $0.1 million of charges related to stock-based compensation awards. The restructuring charges were for staff reductions primarily in the U.K. bath operations and corporate. The entire $1.8 million of the accrued restructuring costs at December 31, 2006 are included in the balance sheet caption “Accrued expenses and other current liabilities.” We expect the remaining accruals to be paid with cash over the next year as provided by the severance and lease agreements.
Note 10—Discontinued Operations
On July 28, 2006, we sold all of our shares of common stock of Spear and Jackson Inc. (“S&J”) to United Pacific Industries Limited for a purchase price of approximately $5.0 million. This disposal plan qualified for treatment as discontinued operations in accordance with FASB Statement No. 144,Accounting for the Impairment or Disposal of Long-Lived Assets(“SFAS No. 144”). Therefore, the operating results of S&J were not included in our results from continuing operations. Instead, the results were recorded as loss from discontinued operations.
Summarized results of the S&J are as follows:
| First Quarter | ||||
| 2006 | ||||
Net sales | $ | 14.2 | ||
Operating loss | (1.2 | ) | ||
Loss from discontinued operations | (0.6 | ) | ||
Included in assets held for sale are properties held for sale of $7.5 million at December 31, 2006 and $7.4 million at September 30, 2006. These properties are currently being marketed for sale and meet all of the criteria for classification as held for sale at December 31, 2006 as required by SFAS No. 144. These properties are recorded at the lower of their carrying value or fair value less costs to sell. In January 2007 we sold one of these properties for net proceeds of $8.4 million and expect to recognize a gain on the transaction of $2.0 million in the second quarter of fiscal 2007.
Note 11—Income Taxes
Our effective tax rate for the first quarter of 2007 was 45.1% as compared to 42.1% for the first quarter of 2006. The rate is high for the first quarter due to increases in our tax reserves. We expect our effective tax rate to be approximately 41% for the full fiscal 2007.
We have appealed various issues relating to the Federal audit of our U.S. consolidated returns for 1998 through 2002. We have recorded reserves that are adequate to cover any assessment if our appeals are rejected. In addition, several states and various other countries have examinations either in the planning stages or currently underway.
Net cash provided by operating activities in the first quarter of 2007 included $9.7 million received from the Italian government which consisted of a refund on withholding taxes for tax years 1998 and 1999 of $7.9 million and related interest of $1.8 million.
Jacuzzi Brands, Inc.
Notes to Condensed Consolidated Financial Statements—(Continued)
(Tabular amounts in millions unless otherwise noted)
(unaudited)
Note 12—Segment Data
We manufacture and distribute a broad range of consumer and industrial products through our operating subsidiaries in two business segments – Bath Products and Plumbing Products. Our Bath Products segment manufactures and sources whirlpool baths, spas, showers, sanitary ware, including sinks and toilets, and bathtubs for the construction and remodeling markets. Our Plumbing Products segment manufactures professional grade drainage, water control, commercial brass and PEX piping products primarily for the commercial and institutional construction, renovation and facilities maintenance markets. The following is a summary of the significant accounts and balances by segment, reconciled to the consolidated totals.
| Bath Products | Plumbing Products | Corporate and Other | Consolidated Total | ||||||||||||
Net Sales | |||||||||||||||
First Quarter | 2007 | $ | 167.7 | $ | 104.4 | $ | — | $ | 272.1 | ||||||
2006 | 174.2 | 92.9 | — | 267.1 | |||||||||||
Total Operating Income (Loss) | |||||||||||||||
First Quarter | 2007 | $ | 3.5 | $ | 18.6 | $ | (4.0 | ) | $ | 18.1 | |||||
2006 | 5.9 | 18.1 | (2.9 | ) | 21.1 | ||||||||||
Capital Expenditures | |||||||||||||||
First Quarter | 2007 | $ | 2.1 | $ | 0.4 | $ | — | $ | 2.5 | ||||||
2006 | 1.7 | 1.3 | — | 3.0 | |||||||||||
Depreciation and Amortization | |||||||||||||||
First Quarter | 2007 | $ | 4.3 | $ | 1.1 | $ | 0.4 | $ | 5.8 | ||||||
2006 | 4.2 | 1.2 | 0.3 | 5.7 | |||||||||||
Restructuring Charges Included in Operating Income (Loss) | |||||||||||||||
First Quarter | 2007 | $ | 0.3 | $ | — | $ | 0.4 | $ | 0.7 | ||||||
2006 | 1.4 | — | 0.2 | 1.6 | |||||||||||
Assets | |||||||||||||||
As of December 31, 2006 | $ | 460.7 | $ | 338.3 | $ | 461.2 | $ | 1,260.2 | |||||||
As of September 30, 2006 | 466.0 | 333.8 | 453.9 | 1,253.7 | |||||||||||
Jacuzzi Brands, Inc.
Notes to Condensed Consolidated Financial Statements—(Continued)
(Tabular amounts in millions unless otherwise noted)
(unaudited)
Note 13—Supplemental Joint Issuer and Guarantor Financial Information
The following represents the supplemental consolidating condensed financial statements of Jacuzzi Brands, Inc. (“JBI”), which is the issuer of our Senior Notes, the subsidiaries which are guarantors of the Senior Notes and our subsidiaries which are not guarantors of the Senior Notes as of December 31, 2006 and September 30, 2006 and for each of the three months ended December 31, 2006 and 2005. Certain of our existing and future domestic restricted subsidiaries guarantee the Senior Notes, jointly and severally, on a senior basis. The Senior Notes are secured by a first-priority lien on and security interest in substantially all of our domestic real property, plant and equipment. The Senior Notes are also secured by a second-priority lien on and security interest in the assets that secure the asset-based credit facility (see our 2006 Annual Report on Form 10-K, filed on December 7, 2006). Separate consolidated financial statements of each guarantor are not presented, as we have determined that they would not be material to investors.
| For the Three Months Ended December 31, 2006 | ||||||||||||||||||||
| JBI | Combined Guarantor Subsidiaries | Combined Non-Guarantor Subsidiaries | Eliminations | Consolidated | ||||||||||||||||
Net sales | $ | — | $ | 183.4 | $ | 90.9 | $ | (2.2 | ) | $ | 272.1 | |||||||||
Operating costs and expenses: | ||||||||||||||||||||
Cost of products sold | — | 130.3 | 64.2 | (2.2 | ) | 192.3 | ||||||||||||||
Selling, general and administrative expenses | 3.5 | 36.1 | 21.4 | 61.0 | ||||||||||||||||
Restructuring charges | 0.4 | 0.1 | 0.2 | 0.7 | ||||||||||||||||
Operating (loss) income | (3.9 | ) | 16.9 | 5.1 | — | 18.1 | ||||||||||||||
Interest expense | (10.3 | ) | (0.1 | ) | (0.3 | ) | (10.7 | ) | ||||||||||||
Interest income | 1.6 | 0.1 | 0.3 | 2.0 | ||||||||||||||||
Intercompany interest (expense) income, net | (7.5 | ) | 7.2 | 0.3 | — | |||||||||||||||
Equity in earnings of investees, net | 13.3 | 2.0 | — | (15.3 | ) | — | ||||||||||||||
Rexair equity earnings | — | 0.3 | — | 0.3 | ||||||||||||||||
Other (expense) income, net | (1.8 | ) | (0.3 | ) | 0.6 | (1.5 | ) | |||||||||||||
Other intercompany income (expense), net | 6.0 | (4.4 | ) | (1.6 | ) | — | ||||||||||||||
(Loss) earnings before income taxes and discontinued operations | (2.6 | ) | 21.7 | 4.4 | (15.3 | ) | 8.2 | |||||||||||||
Benefit from (provision for) income taxes | 7.1 | (8.4 | ) | (2.4 | ) | (3.7 | ) | |||||||||||||
Earnings (loss) from continuing operations | 4.5 | 13.3 | 2.0 | (15.3 | ) | 4.5 | ||||||||||||||
(Loss) earnings from discontinued operations | (0.6 | ) | (0.6 | ) | — | 0.6 | (0.6 | ) | ||||||||||||
Net earnings (loss) | $ | 3.9 | $ | 12.7 | $ | 2.0 | $ | (14.7 | ) | $ | 3.9 | |||||||||
Jacuzzi Brands, Inc.
Notes to Condensed Consolidated Financial Statements—(Continued)
(Tabular amounts in millions unless otherwise noted)
(unaudited)
| For the Three Months Ended December 31, 2005 | ||||||||||||||||||||
| JBI | Combined Guarantor Subsidiaries | Combined Non-Guarantor Subsidiaries | Eliminations | Consolidated | ||||||||||||||||
Net sales | $ | — | $ | 193.4 | $ | 75.4 | $ | (1.7 | ) | $ | 267.1 | |||||||||
Operating costs and expenses: | ||||||||||||||||||||
Cost of products sold | — | 132.8 | 53.8 | (1.7 | ) | 184.9 | ||||||||||||||
Selling, general and administrative expenses | 2.7 | 38.3 | 18.5 | 59.5 | ||||||||||||||||
Restructuring charges | 0.2 | 0.4 | 1.0 | 1.6 | ||||||||||||||||
Operating (loss) income | (2.9 | ) | 21.9 | 2.1 | — | 21.1 | ||||||||||||||
Interest expense | (9.9 | ) | (0.2 | ) | (0.2 | ) | — | (10.3 | ) | |||||||||||
Interest income | 1.0 | 0.2 | 0.2 | — | 1.4 | |||||||||||||||
Intercompany interest (expense) income, net | (7.4 | ) | 7.0 | 0.4 | — | — | ||||||||||||||
Equity in earnings (losses) of investees, net | 20.1 | 2.0 | — | (22.1 | ) | — | ||||||||||||||
Rexair equity earnings | — | 0.6 | — | — | 0.6 | |||||||||||||||
Other (expense) income, net | (0.5 | ) | 8.5 | 0.1 | — | 8.1 | ||||||||||||||
Other intercompany income (expense), net | 7.0 | (7.7 | ) | 0.7 | — | — | ||||||||||||||
Earnings (loss) before income taxes and discontinued operations | 7.4 | 32.3 | 3.3 | (22.1 | ) | 20.9 | ||||||||||||||
Benefit from (provision for) income taxes | 4.7 | (12.2 | ) | (1.3 | ) | (8.8 | ) | |||||||||||||
Earnings (loss) from continuing operations | 12.1 | 20.1 | 2.0 | (22.1 | ) | 12.1 | ||||||||||||||
(Loss) earnings from discontinued operations | (1.4 | ) | (1.4 | ) | — | 1.4 | (1.4 | ) | ||||||||||||
Net earnings (loss) | $ | 10.7 | $ | 18.7 | $ | 2.0 | $ | (20.7 | ) | $ | 10.7 | |||||||||
Jacuzzi Brands, Inc.
Notes to Condensed Consolidated Financial Statements—(Continued)
(Tabular amounts in millions unless otherwise noted)
(unaudited)
| At December 31, 2006 | |||||||||||||||||||
| JBI | Combined Guarantor Subsidiaries | Combined Non-Guarantor Subsidiaries | Eliminations | Consolidated | |||||||||||||||
ASSETS | |||||||||||||||||||
Current assets: | |||||||||||||||||||
Cash and cash equivalents | $ | 126.3 | $ | (2.6 | ) | $ | 35.8 | $ | — | $ | 159.5 | ||||||||
Trade receivables, net | 0.1 | 89.6 | 87.7 | — | 177.4 | ||||||||||||||
Inventories | — | 152.6 | 63.0 | — | 215.6 | ||||||||||||||
Deferred income taxes | (0.7 | ) | 25.3 | 1.3 | — | 25.9 | |||||||||||||
Assets held for sale | — | — | 7.5 | — | 7.5 | ||||||||||||||
Prepaid expenses and other current assets | 2.9 | 5.2 | 8.6 | — | 16.7 | ||||||||||||||
Total current assets | 128.6 | 270.1 | 203.9 | — | 602.6 | ||||||||||||||
Property, plant and equipment, net | 0.9 | 42.0 | 51.2 | — | 94.1 | ||||||||||||||
Pension assets | 151.2 | �� | 0.7 | — | — | 151.9 | |||||||||||||
Insurance for asbestos claims | — | 136.0 | — | — | 136.0 | ||||||||||||||
Goodwill | — | 176.6 | 57.3 | — | 233.9 | ||||||||||||||
Other non-current assets | 27.5 | 14.0 | 0.2 | — | 41.7 | ||||||||||||||
Investment in subsidiaries/Intercompany receivable (payable), net | 557.4 | 1,027.3 | 183.2 | (1,767.9 | ) | — | |||||||||||||
Total assets | $ | 865.6 | $ | 1,666.7 | $ | 495.8 | $ | (1,767.9 | ) | $ | 1,260.2 | ||||||||
LIABILITIES AND STOCKHOLDERS’ EQUITY | |||||||||||||||||||
Current liabilities: | |||||||||||||||||||
Notes payable | $ | — | $ | — | $ | 28.7 | $ | — | $ | 28.7 | |||||||||
Current maturities of long-term debt | — | 1.7 | — | — | 1.7 | ||||||||||||||
Trade accounts payable | — | 44.1 | 52.1 | — | 96.2 | ||||||||||||||
Income taxes payable | 22.0 | 5.0 | (8.1 | ) | — | 18.9 | |||||||||||||
Liabilities associated with assets held for sale | — | — | — | — | — | ||||||||||||||
Accrued expenses and other current liabilities | 22.3 | 49.8 | 33.0 | — | 105.1 | ||||||||||||||
Total current liabilities | 44.3 | 100.6 | 105.7 | — | 250.6 | ||||||||||||||
Long-term debt | 380.0 | 1.8 | — | — | 381.8 | ||||||||||||||
Deferred income taxes | 46.9 | (13.8 | ) | (4.4 | ) | — | 28.7 | ||||||||||||
Asbestos claims | — | 136.0 | — | — | 136.0 | ||||||||||||||
Other non-current liabilities | 38.7 | 40.7 | 28.0 | — | 107.4 | ||||||||||||||
Total liabilities | 509.9 | 265.3 | 129.3 | — | 904.5 | ||||||||||||||
Commitments and contingencies | |||||||||||||||||||
Stockholders’ equity | 355.7 | 1,401.4 | 366.5 | (1,767.9 | ) | 355.7 | |||||||||||||
Total liabilities and stockholders’ equity | $ | 865.6 | $ | 1,666.7 | $ | 495.8 | $ | (1,767.9 | ) | $ | 1,260.2 | ||||||||
Jacuzzi Brands, Inc.
Notes to Condensed Consolidated Financial Statements—(Continued)
(Tabular amounts in millions unless otherwise noted)
(unaudited)
| At September 30, 2006 | |||||||||||||||||||
| JBI | Combined Guarantor Subsidiaries | Combined Non-Guarantor Subsidiaries | Eliminations | Consolidated | |||||||||||||||
| (in millions) | |||||||||||||||||||
ASSETS | |||||||||||||||||||
Current assets: | |||||||||||||||||||
Cash and cash equivalents | $ | 112.6 | $ | (4.6 | ) | $ | 39.2 | $ | — | $ | 147.2 | ||||||||
Trade receivables, net | 0.4 | 116.6 | 88.0 | — | 205.0 | ||||||||||||||
Inventories | — | 138.2 | 56.4 | — | 194.6 | ||||||||||||||
Deferred income taxes | (0.7 | ) | 25.4 | 0.9 | — | 25.6 | |||||||||||||
Assets held for sale | — | 0.6 | 6.8 | — | 7.4 | ||||||||||||||
Prepaid expenses and other current assets | 4.3 | 6.5 | 11.1 | — | 21.9 | ||||||||||||||
Total current assets | 116.6 | 282.7 | 202.4 | — | 601.7 | ||||||||||||||
Property, plant and equipment, net | 1.0 | 44.0 | 47.5 | — | 92.5 | ||||||||||||||
Pension assets | 149.3 | 0.7 | — | — | 150.0 | ||||||||||||||
Insurance for asbestos claims | — | 136.0 | — | — | 136.0 | ||||||||||||||
Goodwill | — | 176.6 | 54.8 | — | 231.4 | ||||||||||||||
Other non-current assets | 28.2 | 13.6 | 0.3 | — | 42.1 | ||||||||||||||
Investment in subsidiaries/Intercompany receivable (payable), net | 555.2 | 1,017.0 | 174.8 | (1,747.0 | ) | — | |||||||||||||
Total assets | $ | 850.3 | $ | 1,670.6 | $ | 479.8 | $ | (1,747.0 | ) | $ | 1,253.7 | ||||||||
LIABILITIES AND STOCKHOLDERS’ EQUITY | |||||||||||||||||||
Current liabilities: | |||||||||||||||||||
Notes payable | $ | — | $ | — | $ | 19.8 | $ | — | $ | 19.8 | |||||||||
Current maturities of long-term debt | — | 1.7 | — | — | 1.7 | ||||||||||||||
Trade accounts payable | 0.3 | 56.1 | 52.1 | — | 108.5 | ||||||||||||||
Income taxes payable | 21.9 | 5.2 | (17.2 | ) | — | 9.9 | |||||||||||||
Liabilities associated with assets held for sale | — | 0.8 | — | — | 0.8 | ||||||||||||||
Accrued expenses and other current liabilities | 16.2 | 56.8 | 36.3 | — | 109.3 | ||||||||||||||
Total current liabilities | 38.4 | 120.6 | 91.0 | — | 250.0 | ||||||||||||||
Long-term debt | 380.0 | 1.8 | — | — | 381.8 | ||||||||||||||
Deferred income taxes | 46.7 | (13.8 | ) | (4.6 | ) | — | 28.3 | ||||||||||||
Asbestos claims | — | 136.0 | — | — | 136.0 | ||||||||||||||
Other liabilities | 39.7 | 41.4 | 31.0 | — | 112.1 | ||||||||||||||
Total liabilities | 504.8 | 286.0 | 117.4 | — | 908.2 | ||||||||||||||
Stockholders’ equity | 345.5 | 1,384.6 | 362.4 | (1,747.0 | ) | 345.5 | |||||||||||||
Total liabilities and stockholders’ equity | $ | 850.3 | $ | 1,670.6 | $ | 479.8 | $ | (1,747.0 | ) | $ | 1,253.7 | ||||||||
Jacuzzi Brands, Inc.
Notes to Condensed Consolidated Financial Statements—(Continued)
(Tabular amounts in millions unless otherwise noted)
(unaudited)
| For the Three Months Ended December 31, 2006 | ||||||||||||||||||||
| JBI | Combined Guarantor Subsidiaries | Combined Non-Guarantor Subsidiaries | Eliminations | Consolidated | ||||||||||||||||
NET CASH (USED IN) PROVIDED BY OPERATING ACTIVITIES | $ | (8.6 | ) | $ | 14.4 | $ | 0.4 | $ | — | $ | 6.2 | |||||||||
INVESTING ACTIVITIES: | ||||||||||||||||||||
Purchases of property, plant and equipment | — | (0.8 | ) | (1.7 | ) | — | (2.5 | ) | ||||||||||||
Collection of a non-operating note receivable | — | — | — | — | — | |||||||||||||||
Proceeds from the sale of excess real estate | — | 0.8 | — | — | 0.8 | |||||||||||||||
Other | — | — | — | — | — | |||||||||||||||
Net transfers with subsidiaries | 16.6 | 8.6 | — | (25.2 | ) | — | ||||||||||||||
NET CASH PROVIDED BY (USED IN) INVESTING ACTIVITIES | 16.6 | 8.6 | (1.7 | ) | (25.2 | ) | (1.7 | ) | ||||||||||||
FINANCING ACTIVITIES: | ||||||||||||||||||||
Excess tax benefits from share based payment agreements | 0.1 | — | — | — | 0.1 | |||||||||||||||
Proceeds from stock option exercise | 0.2 | — | — | — | 0.2 | |||||||||||||||
Increase in notes payable, net | — | — | 7.8 | — | 7.8 | |||||||||||||||
Net transfers with parent | — | (16.6 | ) | (8.6 | ) | 25.2 | — | |||||||||||||
NET CASH PROVIDED BY (USED IN) FINANCING ACTIVITIES | 0.3 | (16.6 | ) | (0.8 | ) | 25.2 | 8.1 | |||||||||||||
Effect of exchange rate changes on cash and cash equivalents | 5.4 | (4.4 | ) | (1.3 | ) | — | (0.3 | ) | ||||||||||||
INCREASE (DECREASE) IN CASH AND CASH EQUIVALENTS | 13.7 | 2.0 | (3.4 | ) | — | 12.3 | ||||||||||||||
CASH AND CASH EQUIVALENTS AT BEGINNING OF PERIOD | 112.6 | (4.6 | ) | 39.2 | — | 147.2 | ||||||||||||||
CASH AND CASH EQUIVALENTS AT END OF PERIOD | $ | 126.3 | $ | (2.6 | ) | $ | 35.8 | $ | — | $ | 159.5 | |||||||||
Jacuzzi Brands, Inc.
Notes to Condensed Consolidated Financial Statements—(Continued)
(Tabular amounts in millions unless otherwise noted)
(unaudited)
| For the Three Months Ended December 31, 2005 | ||||||||||||||||||||
| JBI | Combined Guarantor Subsidiaries | Combined Non-Guarantor Subsidiaries | Eliminations | Consolidated | ||||||||||||||||
NET CASH PROVIDED BY (USED IN) OPERATING ACTIVITIES | $ | 17.6 | $ | (20.9 | ) | $ | 4.0 | $ | — | $ | 0.7 | |||||||||
INVESTING ACTIVITIES: | ||||||||||||||||||||
Purchases of property, plant and equipment | — | (2.0 | ) | (1.0 | ) | — | (3.0 | ) | ||||||||||||
Collection of a non-operating note receivable | — | 9.3 | — | — | 9.3 | |||||||||||||||
Proceeds from the sale of excess real estate | — | 1.8 | (0.1 | ) | — | 1.7 | ||||||||||||||
Other | — | (0.1 | ) | — | — | (0.1 | ) | |||||||||||||
Net transfers with subsidiaries | (7.8 | ) | 4.4 | — | 3.4 | — | ||||||||||||||
Net cash (used in) provided by investing activities of continuing operations | (7.8 | ) | 13.4 | (1.1 | ) | 3.4 | 7.9 | |||||||||||||
Investing activities of discontinued operations | — | — | (0.6 | ) | — | (0.6 | ) | |||||||||||||
NET CASH (USED IN) PROVIDED BY INVESTING ACTIVITIES | (7.8 | ) | 13.4 | (1.7 | ) | 3.4 | 7.3 | |||||||||||||
FINANCING ACTIVITIES: | ||||||||||||||||||||
Proceeds from long-term debt | — | — | — | — | — | |||||||||||||||
Repayment of long-term debt | — | — | — | — | — | |||||||||||||||
Payment for Stock Option exchange | — | — | — | — | — | |||||||||||||||
Proceeds from stock option exercise | — | 0.3 | — | — | 0.3 | |||||||||||||||
Increase in notes payable, net | — | — | 3.8 | — | 3.8 | |||||||||||||||
Net transfers with parent | — | 7.8 | (4.4 | ) | (3.4 | ) | — | |||||||||||||
Net cash provided by (used in) financing activities of continuing operations | — | 8.1 | (0.6 | ) | (3.4 | ) | 4.1 | |||||||||||||
Financing activities of discontinued operations | — | — | (0.7 | ) | — | (0.7 | ) | |||||||||||||
NET CASH PROVIDED BY (USED IN) FINANCING ACTIVITIES | — | 8.1 | (1.3 | ) | (3.4 | ) | 3.4 | |||||||||||||
Effect of exchange rate changes on cash and cash equivalents | (0.2 | ) | (2.4 | ) | 2.4 | — | (0.2 | ) | ||||||||||||
INCREASE (DECREASE) IN CASH AND CASH EQUIVALENTS | 9.6 | (1.8 | ) | 3.4 | — | 11.2 | ||||||||||||||
CASH AND CASH EQUIVALENTS AT BEGINNING OF PERIOD | 84.1 | (7.0 | ) | 33.1 | — | 110.2 | ||||||||||||||
CASH AND CASH EQUIVALENTS AT END OF PERIOD | $ | 93.7 | $ | (8.8 | ) | $ | 36.5 | $ | — | $ | 121.4 | |||||||||
Report of Independent Registered Public Accounting Firm
Board of Directors and Stockholders
Jacuzzi Brands, Inc.
We have audited the accompanying consolidated balance sheets of Jacuzzi Brands, Inc. as of September 30, 2005 and 2006, and the related consolidated statements of operations, cash flows and changes in stockholders’ equity for each of the three years in the period ended September 30, 2006. These financial statements are the responsibility of the Company’s management. Our responsibility is to express an opinion on these financial statements based on our audits.
We conducted our audits in accordance with the standards of the Public Company Accounting Oversight Board (United States). Those standards require that we plan and perform the audit to obtain reasonable assurance about whether the financial statements are free of material misstatement. An audit includes examining, on a test basis, evidence supporting the amounts and disclosures in the financial statements. An audit also includes assessing the accounting principles used and significant estimates made by management, as well as evaluating the overall financial statement presentation. We believe that our audits provide a reasonable basis for our opinion.
In our opinion, the financial statements referred to above present fairly, in all material respects, the consolidated financial position of Jacuzzi Brands, Inc. at September 30, 2005 and 2006, and the consolidated results of its operations and its cash flows for each of the three years in the period ended September 30, 2006, in conformity with U.S. generally accepted accounting principles.
/s/ Ernst & Young LLP
Certified Public Accountants
West Palm Beach, Florida
December 1, 2006,
except for the second paragraph of Note 1,
the tenth paragraph of Note 10, and
Note 14, as to which the date is
January 22, 2007
Consolidated Statements of Operations
(in millions, except per share amounts)
| For the Fiscal Years Ended September 30, | ||||||||||||
| 2004 | 2005 | 2006 | ||||||||||
Net sales | $ | 1,201.2 | $ | 1,210.0 | $ | 1,202.4 | ||||||
Operating costs and expenses: | ||||||||||||
Cost of products sold | 802.4 | 820.4 | 821.9 | |||||||||
Selling, general and administrative expenses | 268.7 | 285.8 | 271.5 | |||||||||
Impairment, restructuring and other charges | 2.9 | 9.4 | 5.4 | |||||||||
Operating income | 127.2 | 94.4 | 103.6 | |||||||||
Interest expense | (50.5 | ) | (48.1 | ) | (42.2 | ) | ||||||
Interest income | 4.7 | 3.0 | 8.2 | |||||||||
Gain on sale of business | — | 24.7 | — | |||||||||
Other (expense) income, net | (3.2 | ) | (6.6 | ) | 7.5 | |||||||
Rexair equity earnings | — | 0.6 | 3.8 | |||||||||
Earnings before income taxes and discontinued operations | 78.2 | 68.0 | 80.9 | |||||||||
Provision for income taxes | (29.9 | ) | (10.0 | ) | (37.1 | ) | ||||||
Earnings from continuing operations | 48.3 | 58.0 | 43.8 | |||||||||
Discontinued operations: | ||||||||||||
Loss from operations, net of tax benefit of $11.5 in 2004, $2.3 in 2005 and $0.0 in 2006 | (19.9 | ) | (4.5 | ) | (3.4 | ) | ||||||
Loss on disposals, net of tax provision of $0.6 in 2005 and tax benefit of $1.9 in 2006 | — | (59.1 | ) | — | ||||||||
Loss from discontinued operations | (19.9 | ) | (63.6 | ) | (3.4 | ) | ||||||
Net earnings (loss) | $ | 28.4 | $ | (5.6 | ) | $ | 40.4 | |||||
Basic earnings (loss) per share: | ||||||||||||
Continuing operations | $ | 0.64 | $ | 0.77 | $ | 0.57 | ||||||
Discontinued operations | (0.26 | ) | (0.84 | ) | (0.04 | ) | ||||||
Net earnings (loss) | $ | 0.38 | $ | (0.07 | ) | $ | 0.53 | |||||
Diluted earnings (loss) per share: | ||||||||||||
Continuing operations | $ | 0.64 | $ | 0.76 | $ | 0.56 | ||||||
Discontinued operations | (0.27 | ) | (0.83 | ) | (0.04 | ) | ||||||
Net earnings (loss) | $ | 0.37 | $ | (0.07 | ) | $ | 0.52 | |||||
See Notes to Consolidated Financial Statements.
Consolidated Balance Sheets
(in millions, except share data)
| At September 30, | ||||||||
| 2005 | 2006 | |||||||
ASSETS | ||||||||
Current assets: | ||||||||
Cash and cash equivalents | $ | 110.2 | $ | 147.2 | ||||
Trade receivables, net of allowances of $8.2 in 2005 and $9.3 in 2006 | 200.5 | 205.0 | ||||||
Inventories | 165.0 | 194.6 | ||||||
Deferred income taxes | 27.9 | 25.6 | ||||||
Assets held for sale | 69.7 | 7.4 | ||||||
Prepaid expenses and other current assets | 22.6 | 21.9 | ||||||
Total current assets | 595.9 | 601.7 | ||||||
Restricted cash collateral | 12.4 | — | ||||||
Property, plant and equipment, net | 103.7 | 92.5 | ||||||
Pension assets | 147.8 | 150.0 | ||||||
Insurance for asbestos claims | 153.0 | 136.0 | ||||||
Goodwill | 228.2 | 231.4 | ||||||
Other non-current assets | 48.5 | 42.1 | ||||||
TOTAL ASSETS | $ | 1,289.5 | $ | 1,253.7 | ||||
LIABILITIES AND STOCKHOLDERS’ EQUITY | ||||||||
Current liabilities: | ||||||||
Notes payable | $ | 22.0 | $ | 19.8 | ||||
Current maturities of long-term debt | 1.5 | 1.7 | ||||||
Trade accounts payable | 105.7 | 108.5 | ||||||
Income taxes payable | 24.7 | 9.9 | ||||||
Liabilities associated with assets held for sale | 66.9 | 0.8 | ||||||
Accrued expenses and other current liabilities | 114.4 | 109.3 | ||||||
Total current liabilities | 335.2 | 250.0 | ||||||
Long-term debt | 383.5 | 381.8 | ||||||
Deferred income taxes | 5.6 | 28.3 | ||||||
Asbestos claims | 153.0 | 136.0 | ||||||
Other liabilities | 127.0 | 112.1 | ||||||
Total liabilities | 1,004.3 | 908.2 | ||||||
Commitments and contingencies | ||||||||
Common stock (par value $.01 per share, authorized 300,000,000 shares; issued 99,096,734 shares; outstanding 77,092,157 and 77,628,042 shares in 2005 and 2006, respectively) | 1.0 | 1.0 | ||||||
Paid-in capital | 630.7 | 620.5 | ||||||
Accumulated (deficit) retained earnings | (8.8 | ) | 31.6 | |||||
Unearned restricted stock | (5.2 | ) | — | |||||
Cumulative foreign currency translation | 12.8 | 21.4 | ||||||
Minimum pension liability | (29.4 | ) | (23.7 | ) | ||||
Unrealized loss on investment | — | (0.1 | ) | |||||
Treasury stock (22,004,557 and 21,468,692 shares in 2005 and 2006, respectively), at cost | (315.9 | ) | (305.2 | ) | ||||
Total stockholders’ equity | 285.2 | 345.5 | ||||||
TOTAL LIABILITIES AND STOCKHOLDERS’ EQUITY | $ | 1,289.5 | $ | 1,253.7 | ||||
See Notes to Consolidated Financial Statements.
Consolidated Statements of Cash Flows
(in millions)
| September 30, | ||||||||||||
| 2004 | 2005 | 2006 | ||||||||||
| (Revised) | (Revised) | |||||||||||
OPERATING ACTIVITIES: | ||||||||||||
Earnings from continuing operations | $ | 48.3 | $ | 58.0 | $ | 43.8 | ||||||
Adjustments to reconcile earnings from continuing operations to net cash provided by operating activities of continuing operations: | ||||||||||||
Depreciation expense | 19.2 | 21.7 | 20.4 | |||||||||
Amortization of intangible assets | 1.2 | 0.9 | — | |||||||||
Amortization of unearned restricted stock | 2.0 | 3.7 | 4.0 | |||||||||
Amortization of debt issuance costs and other financing costs | 3.7 | 3.3 | 2.9 | |||||||||
Charges for debt retirement and refinancing costs | — | 3.2 | — | |||||||||
Provision for deferred income taxes | 2.1 | 4.7 | 19.0 | |||||||||
Provision for doubtful accounts | 5.0 | 3.1 | 1.9 | |||||||||
Gain on sale of excess real estate | (0.5 | ) | (1.8 | ) | — | |||||||
Excess tax benefits from share based payment agreements | — | — | (0.2 | ) | ||||||||
Other stock-based compensation expense | 1.7 | 0.6 | 1.2 | |||||||||
Loss on sale of property, plant and equipment | 0.7 | 0.1 | 0.5 | |||||||||
(Gain)/Loss on sale/collection of notes | — | 0.7 | (9.3 | ) | ||||||||
Gain on sale of business | — | (24.7 | ) | — | ||||||||
Impairment, restructuring and other non-cash charges | — | 1.3 | 0.5 | |||||||||
Equity in earnings of investees | — | (0.5 | ) | (3.8 | ) | |||||||
Changes in operating assets and liabilities, excluding the effects of acquisition and dispositions: | ||||||||||||
Trade receivables | (23.9 | ) | 3.5 | (1.3 | ) | |||||||
Inventories | (27.1 | ) | (4.1 | ) | (26.9 | ) | ||||||
Other current assets | 0.8 | (1.2 | ) | 1.3 | ||||||||
Other assets | (4.2 | ) | (2.3 | ) | 1.3 | |||||||
Trade accounts payable | 16.8 | (5.2 | ) | (0.2 | ) | |||||||
Income taxes payable | 14.3 | (5.2 | ) | (10.2 | ) | |||||||
Accrued expenses and other current liabilities | 5.0 | (6.0 | ) | (1.8 | ) | |||||||
Other liabilities | (5.7 | ) | (1.6 | ) | (8.3 | ) | ||||||
Net cash provided by operating activities of continuing operations | 59.4 | 52.2 | 34.8 | |||||||||
Loss from discontinued operations | (19.9 | ) | (63.6 | ) | (3.4 | ) | ||||||
Adjustments to reconcile loss from discontinued operations to net cash used in discontinued operations: | ||||||||||||
Loss on disposal of discontinued operations | 0.3 | 59.1 | — | |||||||||
Other decreases (increases) in net assets held for sale | 5.3 | (26.7 | ) | (14.7 | ) | |||||||
Net cash used in discontinued operations | (14.3 | ) | (31.2 | ) | (18.1 | ) | ||||||
NET CASH PROVIDED BY OPERATING ACTIVITIES | 45.1 | 21.0 | 16.7 | |||||||||
INVESTING ACTIVITIES: | ||||||||||||
Proceeds from sale of businesses | 4.5 | 140.7 | 3.7 | |||||||||
Proceeds from sale of non-operating assets | 2.4 | 4.4 | 9.3 | |||||||||
Return of equity investment | — | — | 3.2 | |||||||||
Purchases of property, plant and equipment | (23.0 | ) | (22.7 | ) | (12.5 | ) | ||||||
Proceeds from sale of property, plant and equipment | 0.3 | 0.2 | 0.3 | |||||||||
Proceeds from sale of real estate | 3.5 | 2.8 | 1.7 | |||||||||
Net cash (used in) provided by investing activities of continuing operations | (12.3 | ) | 125.4 | 5.7 | ||||||||
Purchases of property, plant and equipment, discontinued operations | (0.3 | ) | (0.7 | ) | (1.5 | ) | ||||||
Proceeds from sale of property, plant and equipment, discontinued operations | — | — | 4.9 | |||||||||
NET CASH (USED IN) PROVIDED BY INVESTING ACTIVITIES | (12.6 | ) | 124.7 | 9.1 | ||||||||
Jacuzzi Brands, Inc.
Consolidated Statements of Cash Flows—(Continued)
(in millions)
| September 30, | ||||||||||||
| 2004 | 2005 | 2006 | ||||||||||
| (Revised) | (Revised) | |||||||||||
FINANCING ACTIVITIES: | ||||||||||||
Proceeds from long-term debt | $ | 46.4 | $ | 59.1 | $ | — | ||||||
Repayment of long-term debt | (72.3 | ) | (124.8 | ) | (1.5 | ) | ||||||
Deposits into restricted cash collateral accounts | — | (12.4 | ) | — | ||||||||
Withdrawals from restricted cash collateral accounts | — | — | 12.8 | |||||||||
Excess tax benefits from share based payment agreements | — | — | 0.2 | |||||||||
Payment of debt issuance, retirement and other financing costs | (1.5 | ) | (1.0 | ) | — | |||||||
(Repayment of) proceeds from notes payable, net | (4.4 | ) | 1.3 | (3.4 | ) | |||||||
Payment for stock option exchange | (0.4 | ) | (0.2 | ) | — | |||||||
Proceeds from issuance of common stock for option exercise | 0.9 | 1.4 | 1.7 | |||||||||
Net cash provided by (used in) financing activities of continuing operations | (31.3 | ) | (76.6 | ) | 9.8 | |||||||
(Decrease) increase in notes payable, discontinued operations | — | 0.7 | (0.8 | ) | ||||||||
NET CASH (USED IN) PROVIDED BY FINANCING ACTIVITIES | (31.3 | ) | (75.9 | ) | 9.0 | |||||||
Effect of exchange rate changes on cash and cash equivalents | 7.2 | 0.8 | 2.2 | |||||||||
INCREASE IN CASH AND CASH EQUIVALENTS | 8.4 | 70.6 | 37.0 | |||||||||
CASH AND CASH EQUIVALENTS AT BEGINNING OF YEAR | 31.2 | 39.6 | 110.2 | |||||||||
CASH AND CASH EQUIVALENTS AT END OF YEAR | $ | 39.6 | $ | 110.2 | $ | 147.2 | ||||||
See Notes to Consolidated Financial Statements.
Consolidated Statements of Changes in Stockholders’ Equity
For the Fiscal Years Ended September 30, 2004, 2005 and 2006
(in millions, except share data)
| Common Stock | Paid-in Capital | Retained Earnings (Accumulated Deficit) | Unearned Restricted Stock | Accumulated Other Comprehensive Loss | Treasury Stock | Other Comprehensive Earnings (Loss) | Total | ||||||||||||||||||||||||
Balance at September 30, 2003 | $ | 1.0 | $ | 650.1 | $ | (31.6 | ) | $ | (0.8 | ) | $ | (21.0 | ) | $ | (352.2 | ) | $ | 245.5 | |||||||||||||
Net earnings | 28.4 | $ | 28.4 | 28.4 | |||||||||||||||||||||||||||
Amortization of unearned restricted stock | 2.1 | 2.1 | |||||||||||||||||||||||||||||
Treasury stock issued to directors (6,988 shares) | — | 0.1 | 0.1 | ||||||||||||||||||||||||||||
Treasury stock issued in 401K match (135,098 shares) | (1.1 | ) | 2.4 | 1.3 | |||||||||||||||||||||||||||
Forfeiture of restricted stock (1,714 shares) | — | — | — | — | |||||||||||||||||||||||||||
Exercise of stock options (277,875 shares) | (3.7 | ) | 4.6 | 0.9 | |||||||||||||||||||||||||||
Issuance of restricted stock grants (698,230 shares) | (5.6 | ) | (5.9 | ) | 11.5 | — | |||||||||||||||||||||||||
Foreign currency translation adjustment, net of tax provision of $0.4 | 16.8 | 16.8 | 16.8 | ||||||||||||||||||||||||||||
Minimum pension liability adjustment, net of tax benefit of $1.9 | (6.8 | ) | (6.8 | ) | (6.8 | ) | |||||||||||||||||||||||||
Net unrealized losses on investments, net of tax provision of $0.1 | 0.2 | 0.2 | 0.2 | ||||||||||||||||||||||||||||
Other comprehensive earnings | 10.2 | ||||||||||||||||||||||||||||||
Total comprehensive earnings | $ | 38.6 | |||||||||||||||||||||||||||||
Balance at September 30, 2004 | 1.0 | 639.7 | (3.2 | ) | (4.6 | ) | (10.8 | ) | (333.6 | ) | 288.5 | ||||||||||||||||||||
Net loss | (5.6 | ) | $ | (5.6 | ) | (5.6 | ) | ||||||||||||||||||||||||
Amortization of unearned restricted stock | 4.9 | 4.9 | |||||||||||||||||||||||||||||
Treasury stock issued to directors (4,994 shares) | (0.1 | ) | 0.1 | — | |||||||||||||||||||||||||||
Deferred directors stock units | 0.9 | 0.9 | |||||||||||||||||||||||||||||
Treasury stock issued in 401K match (30,922 shares) | (0.2 | ) | 0.6 | 0.4 | |||||||||||||||||||||||||||
Forfeiture of restricted stock (101,901 shares) | (0.2 | ) | 1.1 | (0.9 | ) | — | |||||||||||||||||||||||||
Exercise of stock options (348,573 shares) | (4.0 | ) | 5.9 | 1.9 | |||||||||||||||||||||||||||
Issuance of restricted stock grants (706,110 shares) | (5.4 | ) | (6.6 | ) | 12.0 | — | |||||||||||||||||||||||||
Foreign currency translation adjustment, net of tax benefit of $0.8 | (1.3 | ) | (1.3 | ) | (1.3 | ) | |||||||||||||||||||||||||
Minimum pension liability adjustment, net of tax benefit of $2.5 | (4.4 | ) | (4.4 | ) | (4.4 | ) | |||||||||||||||||||||||||
Net unrealized losses on investments | (0.1 | ) | (0.1 | ) | (0.1 | ) | |||||||||||||||||||||||||
Other comprehensive loss | (5.8 | ) | |||||||||||||||||||||||||||||
Total comprehensive loss | $ | (11.4 | ) | ||||||||||||||||||||||||||||
Balance at September 30, 2005 | 1.0 | 630.7 | (8.8 | ) | (5.2 | ) | (16.6 | ) | (315.9 | ) | 285.2 | ||||||||||||||||||||
Jacuzzi Brands, Inc.
Consolidated Statements of Changes in Stockholders’ Equity—(Continued)
For the Fiscal Years Ended September 30, 2004, 2005 and 2006
(in millions, except share data)
| Common Stock | Paid-in Capital | Retained Earnings (Accumulated Deficit) | Unearned Restricted Stock | Accumulated Other Comprehensive Loss | Treasury Stock | Other Comprehensive Earnings (Loss) | Total | ||||||||||||||||||||||
Net earnings | $ | 40.4 | $ | 40.4 | $ | 40.4 | |||||||||||||||||||||||
Reclassification of unearned restricted stock on FAS 123R adoption | $ | (5.2 | ) | $ | 5.2 | — | |||||||||||||||||||||||
Deferred directors stock units | 0.5 | 0.5 | |||||||||||||||||||||||||||
Forfeiture of restricted stock (201,726 shares) | 0.9 | $ | (1.9 | ) | (1.0 | ) | |||||||||||||||||||||||
Exercise of stock options (274,084 shares) | (3.0 | ) | 4.7 | 1.7 | |||||||||||||||||||||||||
Issuance of restricted stock grants (463,527 shares) | (7.9 | ) | 7.9 | — | |||||||||||||||||||||||||
Stock-based compensation expense | 4.7 | 4.7 | |||||||||||||||||||||||||||
Tax benefit on stock options | 0.3 | 0.3 | |||||||||||||||||||||||||||
Retiree benefit revaluation (see Note 6) | (0.5 | ) | (0.5 | ) | |||||||||||||||||||||||||
S&J disposal: | |||||||||||||||||||||||||||||
Translation adjustment, net of tax benefit of $0.9 | $ | (1.6 | ) | (1.6 | ) | (1.6 | ) | ||||||||||||||||||||||
Minimum pension liability adjustment, net of tax provision of $3.2 | 5.4 | 5.4 | 5.4 | ||||||||||||||||||||||||||
Foreign currency translation adjustment, net of tax provision of $1.4 | 10.2 | 10.2 | 10.2 | ||||||||||||||||||||||||||
Minimum pension liability adjustment, net of tax provision of $0.5 | 0.3 | 0.3 | 0.3 | ||||||||||||||||||||||||||
Net unrealized losses on investments | (0.1 | ) | (0.1 | ) | (0.1 | ) | |||||||||||||||||||||||
Other comprehensive earnings | 14.2 | ||||||||||||||||||||||||||||
Total comprehensive earnings | $ | 54.6 | |||||||||||||||||||||||||||
Balance at September 30, 2006 | $ | 1.0 | $ | 620.5 | $ | 31.6 | $ | — | $ | (2.4 | ) | $ | (305.2 | ) | $ | 345.5 | |||||||||||||
See Notes to Consolidated Financial Statements.
F-97
Notes to Consolidated Financial Statements
Note 1—Basis of Presentation
We manufacture and distribute a broad range of consumer and industrial products through our operating subsidiaries in two business segments—Bath Products and Plumbing Products. Prior year amounts also include the Rexair segment (see Note 3 regarding the sale of Rexair, Inc.). Please refer to Note 11 regarding our business segments.
On October 11, 2006, we announced that a definitive merger agreement had been signed under which affiliates of private equity firm Apollo Management L.P. (“Apollo”) will purchase Jacuzzi Brands for $12.50 per share. The acquisition is subject to certain closing conditions, including the approval of our shareholders, regulatory approval, and the receipt by Apollo of all necessary debt financing, and is expected to close in the first quarter of calendar 2007. If the merger agreement is terminated, the agreement specifies that under certain circumstances, we will be obligated to pay a termination fee to Apollo which could range from $6 million to $22.5 million. Please refer to Note 14 regarding an amendment to the merger agreement.
As previously announced, in connection with the merger agreement, we launched a cash tender offer and consent solicitation on December 4, 2006 with respect to our outstanding $380 million in aggregate principal amount 95/8% Senior Secured Notes due 2010 (“Senior Notes”). The consummation of the tender offer is conditioned upon, among other things, the consummation of the proposed merger as well as the receipt of consent from the majority of the holders of the Senior Notes.
We operate on a 52- or 53-week fiscal year ending on the Saturday nearest to September 30. The fiscal year periods presented in our consolidated financial statements consist of the 52 weeks ended September 30, 2006 (“2006”), the 52 weeks ended October 1, 2005 (“2005”) and the 53 weeks ended on October 2, 2004 (“2004”), but are presented as of September 30 in each of those years for convenience. Businesses over which we had the ability to exercise significant influence, but are not consolidated into our results, were accounted for using the equity method. We eliminate inter-company balances and transactions when consolidating the account balances of our subsidiaries.
Any potential variable interest entity (“VIE”) in which we hold a variable interest has been assessed to determine whether the VIE should be consolidated into our results based on criteria established by FASB Interpretation No. 46,Consolidation of Variable Interest Entities, an Interpretation of ARB No. 51 (“FIN 46”). We have evaluated our interests in our wholly-owned subsidiaries and continue to consolidate them under the guidelines set forth in ARB No. 51,Consolidated Financial Statements (“ARB 51”), and FASB Statement No. 94,Consolidation of All Majority-Owned Subsidiaries. We have also completed an evaluation of all of our variable interests and believe that we do not have any interests in variable interest entities, as defined by FIN 46.
Certain amounts have been reclassified in our prior year consolidated financial statements to conform them to the presentation used in the current year.
Jacuzzi Brands, Inc.
Notes to Consolidated Financial Statements—(Continued)
Revision of Statements of Cash Flows
In 2006, we have separately disclosed the operating, investing and financing portion of the cash flows attributable to our discontinued operations, which in prior periods were reported on a combined basis as a single amount. The annual Statements of Cash Flows have been revised to reflect this change. The revision had the following impact on the past three fiscal years ended:
| September 30, | ||||||||||||
| 2003 | 2004 | 2005 | ||||||||||
Net cash used in discontinued operations, as reported | $ | (8.9 | ) | $ | (14.6 | ) | $ | (31.2 | ) | |||
Adjustments | 1.5 | 0.3 | — | |||||||||
Net cash used in operating activities of discontinued operations, revised | (7.4 | ) | (14.3 | ) | (31.2 | ) | ||||||
Net cash used in investing activities of discontinued operations, as reported | — | — | — | |||||||||
Adjustments | (1.5 | ) | (0.3 | ) | (0.7 | ) | ||||||
Net cash used in investing activities of discontinued operations, revised | (1.5 | ) | (0.3 | ) | (0.7 | ) | ||||||
Net cash provided by financing activities of discontinued operations, as reported | — | — | — | |||||||||
Adjustments | — | — | 0.7 | |||||||||
Net cash provided by financing activities of discontinued operations, revised | — | — | 0.7 | |||||||||
Note 2—Accounting Policies
Use of Estimates: Generally accepted accounting principles require us to make estimates and assumptions that affect amounts reported in our financial statements and accompanying notes. Actual results could differ from those estimates.
Foreign Currency Translation: Our subsidiaries outside of the U.S. record transactions using their local currency as their functional currency. In accordance with FASB Statement No. 52,Foreign Currency Translation,the assets and liabilities of our foreign subsidiaries are translated into U.S. dollars using the exchange rates in effect at the balance sheet dates. Revenues, expenses and cash flow items are translated at average daily exchange rates for the period. The gains and losses resulting from the changes in exchange rates from year to year have been reported in other comprehensive earnings.
Cash and Cash Equivalents: We consider all highly liquid investments with original maturities of three months or less when purchased to be cash equivalents.
Trade Receivables and Concentration of Credit Risk: We record an allowance for doubtful accounts, reducing our receivables balance to an amount we estimate is collectible from our customers. A rollforward of the balances in allowance for doubtful accounts is as follows:
Description | Balance at Beginning of Period | Additions Charged to Expense | Deductions Write-offs, Payments and Other Adjustments | Balance at End of Period | |||||||||
| (in millions) | |||||||||||||
Allowance for doubtful accounts: | |||||||||||||
2004 | $ | 8.9 | $ | 5.0 | $ | (5.2 | ) | $ | 8.7 | ||||
2005 | 8.7 | 3.1 | (3.6 | ) | 8.2 | ||||||||
2006 | 8.2 | 1.9 | (0.8 | ) | 9.3 | ||||||||
Jacuzzi Brands, Inc.
Notes to Consolidated Financial Statements—(Continued)
We operate in the U.S., Europe and, to a lesser extent, in other regions of the world. We perform periodic credit evaluations of our customers’ financial condition and generally do not require collateral. No single customer accounted for more than 10% of our total sales in fiscal 2004 or 2005. We encounter a certain amount of credit risk as a result of a concentration of receivables among a few significant customers, the largest of which, Ferguson, accounted for 11.0% of our total sales in 2006. As of September 30, 2006, this customer represented approximately 15.2% of our trade receivables.
Income Taxes: Deferred tax assets and liabilities represent the tax effects, based on current law, of any temporary differences in the timing of when revenues and expenses are recognized for tax purposes and when they are recognized for financial statement purposes. The deferred tax assets are reviewed periodically for recoverability and valuation allowances are provided as necessary.
Inventories: Our inventories are stated at the lower of cost or market value. We used the first-in-first-out (FIFO) method for determining the cost of approximately 52.4% of our inventories in 2005 and approximately 39.0% of our inventories in 2006, and the last-in-first-out (LIFO) method for the remainder of our inventories. The FIFO method approximates replacement cost. Our inventories are categorized as follows:
| At September 30, | ||||||||
| 2005 | 2006 | |||||||
| (in millions) | ||||||||
Finished products | $ | 112.1 | $ | 147.4 | ||||
In-process products | 12.9 | 15.1 | ||||||
Raw materials | 43.4 | 49.4 | ||||||
Inventory at FIFO | 168.4 | 211.9 | ||||||
LIFO reserve | (3.4 | ) | (17.3 | ) | ||||
| $ | 165.0 | $ | 194.6 | |||||
The LIFO reserve represents the difference between the carrying value of our LIFO inventories and their FIFO cost value. The increase over 2005 is due to an increase in raw material costs, most notably the cost of brass.
Property, Plant and Equipment: We record our property, plant and equipment at cost. We record depreciation and amortization in a manner that recognizes the cost of our depreciable assets in operations over their estimated useful lives using the straight-line method. We estimate the useful lives of our depreciable assets to be 20-50 years for buildings and 1-15 years for machinery, equipment and furniture. Leasehold improvements are amortized over the shorter of the terms of the underlying leases, including probable renewal periods, or the estimated useful lives of the improvements.
Property, plant and equipment consist of:
| At September 30, | ||||||||
| 2005 | 2006 | |||||||
| (in millions) | ||||||||
Land and buildings | $ | 63.6 | $ | 59.8 | ||||
Machinery, equipment and furniture | 161.9 | 164.8 | ||||||
Accumulated depreciation | (121.8 | ) | (132.1 | ) | ||||
| $ | 103.7 | $ | 92.5 | |||||
Jacuzzi Brands, Inc.
Notes to Consolidated Financial Statements—(Continued)
Other Non-current Assets: Upon the sale of Rexair in June 2005, we retained an approximate 30% equity interest in Rexair’s new parent company. The investment is accounted for under the equity method in accordance with APB No. 18,The Equity Method of Accounting for Investments in Common Stock (see also Note 3). In the fourth quarter of 2006, we received $7.6 million related to this investment, of which $4.4 million was accounted for as a dividend and included in operating cash flows and $3.2 million was accounted for as a return of our investment and included in investing cash flows. Also included in other non-current assets is $8.8 million of debt related fees. This amount will be amortized over the remaining lives of our Senior Notes and revolving credit facility (see Note 5). Included in other non-current assets at September 30, 2006 is $1.8 million related to our equity investment in Rexair.
Goodwill: Goodwill is not amortized, but is subject to annual impairment tests in accordance with FASB Statement No. 142,Goodwill and Other Intangible Assets (“SFAS No. 142”). Finite-lived intangible assets are amortized over their useful lives and are subject to impairment evaluation under FASB Statement No. 144,Accounting for the Impairment or Disposal of Long-lived Assets (“SFAS No. 144”).
We test our goodwill for impairment at the reporting unit level utilizing a two-step methodology. The initial step requires us to determine the fair value of each reporting unit and of each indefinite-lived intangible asset and compare it to the carrying value, including goodwill, of such reporting unit. If the fair value exceeds the carrying value, no impairment loss is recognized and the second step, which is a calculation of the impairment, is not performed. However, if the carrying value of the reporting unit or intangible asset exceeds its fair value, an impairment charge equal to the difference in the values should be recorded. We perform an impairment test annually in the fourth quarter of each year, unless an event occurs earlier in the year that requires us to perform an interim test. In 2005 and 2006, the fair values of each of our reporting units exceeded their respective carrying values. Consequently, no impairment of our goodwill was indicated.
In accordance with SFAS No. 142, any allocation of goodwill to an entity sold is done based on relative fair values. We sold our Rexair and Eljer business during 2005. Rexair was the only business in the Rexair segment; thus, we wrote off all goodwill associated with that segment. Eljer was part of our Bath Products segment. However, none of the goodwill was allocated to Eljer as part of the sale since Eljer’s fair value at the date of the transaction was minimal.
Goodwill by reporting unit is as follows:
| At September 30, | ||||||
| 2005 | 2006 | |||||
| (in millions) | ||||||
Bath Products | $ | 102.4 | $ | 105.6 | ||
Plumbing Products | 125.8 | 125.8 | ||||
| $ | 228.2 | $ | 231.4 | |||
Jacuzzi Brands, Inc.
Notes to Consolidated Financial Statements—(Continued)
Accrued Expenses and Other Current Liabilities: Accrued expenses and other current liabilities consist of the following:
| At September 30, | ||||||
| 2005 | 2006 | |||||
| (in millions) | ||||||
Compensation related | $ | 16.0 | $ | 21.4 | ||
Insurance | 4.8 | 3.5 | ||||
Customer incentives | 23.8 | 25.6 | ||||
Interest | 9.6 | 9.5 | ||||
Warranty | 12.2 | 13.2 | ||||
Commissions | 6.2 | 7.1 | ||||
Other(1) | 41.8 | 29.0 | ||||
| $ | 114.4 | $ | 109.3 | |||
We record a reserve for future warranty costs based on current unit sales, historical experience and management’s judgment regarding anticipated rates of warranty claims and cost per claim. The adequacy of the recorded warranty reserves is assessed each quarter and adjustments are made as necessary. The specific terms and conditions of the warranties vary depending on the products sold and the countries in which we do business.
Changes in our warranty reserves, a portion of which are classified as long-term on our consolidated balance sheets, during 2005 and 2006 are as follows:
| At September 30, | ||||||||
| 2005 | 2006 | |||||||
| (in millions) | ||||||||
Beginning balance | $ | 25.3 | $ | 24.3 | ||||
Warranty accrual | 15.4 | 17.8 | ||||||
Cash payments | (15.4 | ) | (17.0 | ) | ||||
Other | — | 0.5 | ||||||
Sale of Rexair (See Note 3) | (1.0 | ) | — | |||||
Ending balance | $ | 24.3 | $ | 25.6 | ||||
Fair Value of Financial Instruments: FASB Statement No. 107,Disclosure about Fair Value of Financial Instruments, requires that we disclose the fair value of our financial instruments when it is practical to estimate. We have determined the estimated fair values of our financial instruments, which are either recognized in our consolidated balance sheets or disclosed within these notes, using available market information and appropriate valuation methodologies. However, considerable judgment is required in interpreting market data to develop estimates of fair value. Accordingly, the estimates presented are not necessarily indicative of the amounts we could realize in a current market exchange.
Short-term Assets and Liabilities: The fair values of our cash and cash equivalents, trade receivables and accounts payable approximate their carrying values because of their short-term nature.
Long-term Debt: The fair values of our Senior Notes (as defined in Note 5) were determined by reference to quoted market prices. The fair value of our remaining debt is determined by discounting the
Jacuzzi Brands, Inc.
Notes to Consolidated Financial Statements—(Continued)
cash flows using current interest rates for financial instruments with similar characteristics and maturities. The fair value of our remaining debt approximates its carrying value as of September 30, 2005 and 2006.
There were no other significant differences as of September 30, 2005 and 2006 between the carrying value and fair value of our financial instruments except as disclosed below:
| At September 30, 2005 | At September 30, 2006 | |||||||||||
| (in millions) | ||||||||||||
| Carry Amount | Fair Amount | Carry Amount | Fair Amount | |||||||||
9.625% Senior Notes | $ | 380.0 | $ | 402.8 | $ | 380.0 | $ | 402.8 | ||||
Revenue Recognition: We recognize revenue when all of the following criteria are met: persuasive evidence of the arrangement exists; delivery has occurred and we have no remaining obligations; prices are fixed or determinable; and collectibility is probable. We make shipments to approved customers based on orders placed. Prices are fixed when the customer places the order. An approved customer is one that has been subjected to our credit evaluation. We record revenue when title passes, which is either at the time of shipment or upon delivery to the customer. The passage of title is dependent on the arrangements made with each customer. Provisions are made for sales returns and allowances at the time of sale.
Management uses significant judgment in estimating sales returns, considering numerous factors such as current overall and industry-specific economic conditions and historical sales return rates. Although we consider our sales return reserves to be adequate and proper, changes in historical customer patterns could require adjustments to the reserves. We also record reductions to our revenues for customer and distributor programs and incentive offerings including special pricing agreements, promotions and other volume-based incentives.
As required by Emerging Issues Task Force Issue No. 01-09,Accounting for Consideration Given by a Vendor to a Customer (Including a Reseller of the Vendor’s Products), we account for sales incentives, such as discounts, rebates and volume incentives, as a reduction of revenue at the later of 1) the date that the related revenue is recognized or 2) the date when the sales incentive is offered. In the case of volume incentives, we recognize the reduction of revenue ratably over the period of the underlying transactions that result in progress by the customer toward earning the incentive. We record free product given to customers as a sales incentive in cost of products sold.
Shipping and Handling Fees and Costs: We classify amounts charged to our customers for shipping and handling as revenues, while shipping and handling costs are recorded as cost of products sold.
Other Income/(Expense), net: Other income/(expense), net consists of the following:
| For the Fiscal Year Ended September 30, | ||||||||||||
| 2004 | 2005 | 2006 | ||||||||||
| (in millions) | ||||||||||||
Keller Ladder expenses | $ | (1.6 | ) | $ | (1.0 | ) | $ | 0.5 | ||||
Gain (Loss) on collection or sales of other non-operating assets | 2.5 | (0.7 | ) | 9.3 | ||||||||
(Loss) gain on sale of excess properties and equipment | (0.1 | ) | 1.7 | (0.6 | ) | |||||||
Foreign currency translation (losses) gains | (1.9 | ) | 0.4 | (1.7 | ) | |||||||
Debt retirement costs | — | (3.2 | ) | — | ||||||||
Gain on litigation of environmental claims | — | — | 3.5 | |||||||||
Other, net | (2.1 | ) | (3.8 | ) | (3.5 | ) | ||||||
| $ | (3.2 | ) | $ | (6.6 | ) | $ | 7.5 | |||||
Jacuzzi Brands, Inc.
Notes to Consolidated Financial Statements—(Continued)
We retained certain obligations related to our Keller Ladder operations, the majority of which relate to claims for defective ladders sold before the sale of Keller Ladder in October 1999. We continue to incur income and expenses related to those obligations. As a result of a favorable trend in the settlement of these obligations we reduced our estimated liability in fiscal 2006; however future year expenses are expected to be more in line with the expense recognized in the past two years. The gain on collection or sale of non-operating assets of $9.3 million in fiscal 2006 relates to a gain on the collection of a note which had previously been deferred until collection. We had obtained the note in October 2002 upon the sale of a piece of property to Woodlands Ventures, LLC. Foreign currency translation (losses)/gains in fiscal 2006 include $1.6 million recorded in the current period related to a prior year transaction. The impact of the adjustment if made in the appropriate periods would not have a material effect on the financial position or operating results of those periods. Debt retirement costs are associated with the repayment of the term loan, which was retired with proceeds from the sale of Rexair in 2005. Gain on litigation of environmental claim was the result of a favorable judgment received on an environmental liability retained as part of the sale of Rexair.
Advertising Costs: Advertising costs are charged to expense when incurred. Advertising expense totaled $27.8 million, $37.3 million and $31.9 million in 2004, 2005 and 2006, respectively.
Research and Development Costs: Research and development costs are expensed as incurred. Such amounts totaled $4.1 million, $7.2 million and $5.9 million in 2004, 2005 and 2006, respectively.
Stock-Based Compensation: We account for stock-based compensation under the fair value recognition provisions of FASB Statement No. 123R,Share-Based Payment, and related interpretations (“SFAS No. 123R”) using the modified—prospective transition method. Prior to October 2, 2005, we accounted for these plans under the recognition and measurement provisions of APB Opinion No. 25,Accounting for Stock Issued to Employees, and related Interpretations, (“APB 25”) as permitted by FASB Statement No. 123,Accounting for Stock-Based Compensation (“SFAS No. 123”). Compensation cost recorded for our Stock Plans (as defined in Note 8) approximated $3.8 million, $4.4 million and $5.3 million in 2004, 2005 and 2006, respectively.
Earnings (Loss) Per Share: Net earnings (loss) per basic share are based on the weighted-average number of shares outstanding during each period, excluding the weighted average of restricted shares outstanding during each period (see Note 8). Net earnings (loss) per diluted share further assumes that, under the treasury stock method, any dilutive stock options are exercised, restricted stock awards are vested and any other dilutive equity instruments are converted.
The information required to compute net earnings (loss) per basic and diluted share is as follows:
| For the Fiscal Year Ended September 30, | ||||||
| 2004 | 2005 | 2006 | ||||
| (in millions) | ||||||
Basic weighted average number of common shares outstanding | 75.0 | 75.5 | 76.3 | |||
Potential dilution of common shares | 0.7 | 1.2 | 1.3 | |||
Diluted weighted-average number of common shares outstanding | 75.7 | 76.7 | 77.6 | |||
Options to purchase 1.0 million, 0.1 million and 0.1 million shares in the years ended September 30, 2004, 2005 and 2006, respectively, were not included in the computation of earnings (loss) per share because the exercise prices of these options exceeded the average market price of the common shares during the respective periods.
Jacuzzi Brands, Inc.
Notes to Consolidated Financial Statements—(Continued)
New Accounting Pronouncements: In June 2006, the Financial Accounting Standards Board (“FASB”) issued Interpretation No. 48, Accounting for Uncertainty in Income Taxes—an interpretation of FASB Statement No. 109(“FIN 48”). This interpretation clarifies the accounting for uncertainty in income taxes recognized in an enterprise’s financial statements in accordance with Statement of Financial Accounting Standard No. 109,Accounting for Income Taxes (“ASC 740”). This interpretation clarifiesDeferred income taxes are provided for future tax effects attributable to temporary differences between the accountingfinancial statement carrying amounts of existing assets and liabilities and their respective tax bases, net operating losses, tax credits and other applicable carryforwards. Deferred tax assets and liabilities are measured using enacted tax rates expected to apply to taxable income in the years in which those temporary differences are expected to be actually paid or recovered. The effect on deferred tax assets and liabilities of a change in tax rates is recognized in the results of continuing operations in the period that includes the date of enactment.
The Company regularly reviews its deferred tax assets for recoverability and provides a valuation allowance against its deferred tax assets if, based upon consideration of all positive and negative evidence, the Company determines that it is more-likely-than-not that a portion or all of the deferred tax assets will ultimately not be realized in future tax periods. Such positive and negative evidence would include review of historical earnings and losses, anticipated future earnings, the time period over which the temporary differences and carryforwards are anticipated to reverse and implementation of feasible, prudent tax planning strategies.
The Company is subject to income taxes in the United States and numerous foreign jurisdictions. Significant judgment is required in determining the Company’s worldwide provision for income taxes by prescribingand recording the related deferred tax assets and liabilities. In the ordinary course of the Company’s business, there is inherent uncertainty in quantifying the ultimate tax outcome of all of the numerous transactions and required calculations relating to the Company’s tax positions. Accruals for unrecognized tax benefits are provided for in accordance
F-11
with the requirements of ASC 740. An unrecognized tax benefit represents the difference between the recognition thresholdof benefits related to uncertain tax positions for income tax reporting purposes and financial reporting purposes. The Company has established a tax position is required to meet before being recognized in the financial statements. This interpretation also provides guidance on de-recognition, classification,reserve for interest and penalties, as applicable, for uncertain tax positions and it is recorded as a component of the overall income tax provision.
The Company is subject to periodic income tax examinations by domestic and foreign income tax authorities. Although the outcome of income tax examinations is always uncertain, the Company believes that it has appropriate support for the positions taken on its income tax returns and has adequately provided for potential income tax assessments. Nonetheless, the amounts ultimately settled relating to issues raised by the taxing authorities may differ materially from the amounts accrued for each year.
See Note 16 for more information on income taxes.
Accumulated Other Comprehensive Income (Loss)
At March 31, 2010, accumulated other comprehensive loss consisted of $6.4 million of foreign currency translation gains, $4.0 million of unrealized losses on derivative contracts, net of tax and $3.4 million of unrecognized actuarial losses and unrecognized prior services costs, net of tax. At March 31, 2011, accumulated other comprehensive income consisted of $14.9 million of foreign currency translation gains, $4.8 million of unrealized losses on derivative contracts, net of tax and $6.0 million of unrecognized actuarial gains and unrecognized prior services costs, net of tax.
Derivative Financial Instruments
The Company is exposed to certain financial risks relating to fluctuations in foreign currency exchange rates and interest rates. The Company selectively uses foreign currency forward contracts and interest rate swap contracts to manage its foreign currency and interest rate risks. All hedging transactions are authorized and executed pursuant to defined policies and procedures which prohibit the use of financial instruments for speculative purposes.
The Company accounts for derivative instruments based on ASC 815,Accounting for Derivative Instruments and Hedging Activities (“ASC 815”). ASC 815 requires companies to recognize all of its derivative instruments as either assets or liabilities in the balance sheet at fair value. Fair value is defined under ASC 820,Fair Value Measurements and Disclosures (“ASC 820”), as the exchange price that would be received for an asset or paid to transfer a liability (an exit price) in the principal or most advantageous market for the asset or liability in an orderly transaction between market participants. See more information as it relates to applying fair value to derivative instruments at Note 12. The accounting for changes in interimthe fair value of a derivative instrument depends on whether the derivative instrument has been designated and qualifies as part of a hedging relationship and further, on the type of hedging relationship. For those derivative instruments that are designated and qualify as hedging instruments, a company must designate the hedging instrument, based upon the exposure being hedged, as a fair value hedge, a cash flow hedge or a hedge of a net investment in a foreign operation. If the derivative instrument is designated and qualifies as an effective hedging instrument under ASC 815, the changes in the fair value of the effective portion of the instrument are recognized in accumulated other comprehensive income (loss) whereas any changes in the fair value of a derivative instrument that is not designated or does not qualify as an effective hedge are recorded in other non-operating income (expense). See Note 11 for further information regarding the classification and accounting for the Company’s derivative financial instruments.
Financial Instrument Counterparties
The Company is exposed to credit losses in the event of non-performance by counterparties to its financial instruments. The Company anticipates, however, that counterparties will be able to fully satisfy their obligations under these instruments. The Company places cash and temporary investments, foreign currency contracts and its
F-12
interest rate swap agreements with various high-quality financial institutions. Although the Company does not obtain collateral or other security to support these financial instruments, it does periodically evaluate the credit-worthiness of each of its counterparties.
Foreign Currency Translation
Assets and liabilities of subsidiaries operating outside of the United States with a functional currency other than the U.S. dollar are translated into U.S. dollars using exchange rates at the end of the respective period. Revenues and expenses of such entities are translated at average exchange rates in effect during the respective period. Foreign currency translation adjustments are included as a component of accumulated other comprehensive income (loss). Currency transaction gains and (losses) are included in other non-operating income (expense) in the consolidated statements of operations and totaled $2.4 million, $(4.3) million and $1.5 million for the years ended March 31, 2009, 2010 and 2011, respectively.
Advertising Costs
Advertising costs are charged to selling, general and administrative expenses as incurred and amounted to $10.4 million, $6.8 million, and $8.2 million for the years ended March 31, 2009, 2010 and 2011, respectively.
Research, Development and Engineering Costs
Research, development and engineering costs are charged to selling, general and administrative expenses as incurred for the years ended March 31, 2009, 2010, and 2011 as follows (in millions):
| Year Ended March 31, 2009 | Year Ended March 31, 2010 | Year Ended March 31, 2011 | ||||||||||
Research and development costs | $ | 8.4 | $ | 10.8 | $ | 11.5 | ||||||
Engineering costs | 23.4 | 20.1 | 22.2 | |||||||||
Total | $ | 31.8 | $ | 30.9 | $ | 33.7 | ||||||
Concentrations of Credit Risk
Financial instruments that potentially subject the Company to significant concentrations of credit risk consist of cash and temporary investments, forward currency contracts, interest rate swap/collar agreements and trade accounts receivable.
Cash and Cash Equivalents
The Company considers all highly liquid investments with a maturity of three months or less to be cash equivalents.
3. Acquisitions
The Mecánica Falk Acquisition
On August 31, 2010, the Company acquired full control of Mecánica Falk S.A. de C.V. (“Mecánica Falk”), a joint venture in which the Company previously maintained a 49% non-controlling interest. Located in Mexico City, Mexico, Mecánica Falk primarily serves as a distributor of the Company’s existing Process & Motion Control product lines in Latin America. The acquisition of the remaining 51% interest in Mecánica Falk provides the Company with the opportunity to expand its international presence through a more direct ownership structure. Mecánica Falk’s results of operations have been wholly consolidated in all periods subsequent to August 31, 2010.
F-13
Due to the pre-existing 49% ownership interest in Mecánica Falk, this acquisition was accounted for as a step acquisition in accordance with ASC 805,Business Combinations (“ASC 805”). Accordingly, the Company recognized a gain of $3.4 million in connection with this transaction to record its 49% ownership interest in Mecánica Falk at fair value on the acquisition date the fair value was determined using a combination of the income approach and market approach. In completing this valuation, management considered future earnings and cash flow potential of the business, earnings multiples, and recent market transactions of similar businesses. The transaction was consummated through a redemption of the existing stockholders’ shares in exchange for a $6.1 million seller-financed note, which will be repaid in ratable installments over the next several quarters. Excluding the seller-financed note, the Company acquired net assets of $12.1 million, including $8.0 million of intangible assets (comprised of $4.4 million of customer relationships and $3.6 million of goodwill) and $1.2 million of cash. Certain information about Mecánica Falk is not presented (e.g. pro forma financial information and allocation of purchase price) as the disclosure and transition. FIN 48of such information is effective for fiscal years beginning after December 15, 2006. We are currently evaluatingnot material to the impact of FIN 48 on our consolidatedCompany’s results of operations and financial position.
The Fontaine Acquisition
On September 13, 2006February 27, 2009, the SecuritiesCompany acquired the stock of Fontaine-Alliance Inc. and Exchange Commissionaffiliates (“SEC”Fontaine”) issued Staff Accounting Bulletin No. 108 (“SAB 108”)Consideringfor a total purchase price of $24.2 million, net of $0.6 million of cash acquired. Of the Effectstotal purchase price of Prior Year Misstatements when Qualifying Misstatements$24.2 million, the Company paid $16.6 million in Current Year Financial Statements.cash and assumed $7.6 million of debt. The interpretationspurchase price was financed through borrowings on the Company’s accounts receivable securitization facility. Fontaine manufactures stainless steel slide gates and other engineered flow control products for the municipal water and wastewater markets. In accordance with the applicable authoritative guidance at the date of this transaction, the Company subsequently adjusted its goodwill and customer relationships in fiscal 2010 as well as pre-acquisition tax positions and certain miscellaneous balances related to this Staff Accounting Bulletintransaction. As a result of this transaction, the Company acquired $4.7 million of intangible assets consisting of $3.8 million of trademarks, $0.8 million of customer relationships and $0.1 of non-compete intangibles. The acquired customer relationships and non-compete intangibles are being issued to address diversity in practice in quantifying financial statement misstatementsamortized over their estimated useful lives of 3 years and the potential under current practice2 years, respectively. The acquired trademarks have an indefinite life and are not being amortized but are tested annually for the build up of improper amounts on the balance sheet. SAB 108impairment. Goodwill is effectivenot deductible for fiscal years beginning after November 15, 2006. We are currently evaluating the impact of SAB 108 on ourincome tax purposes. The Company’s results of operations; however we dooperations include Fontaine subsequent to February 28, 2009. Certain information about Fontaine is not expectpresented (e.g. pro forma financial information and allocation of purchase price) as the impact to bedisclosure of such information is not material to our financial position or results of operations.
In September 2006, the FASB issued Statement No. 157,Fair Value Measurements. The standard provides enhanced guidance for using fair value to measure assets and liabilities. The standard also responds to investors’ requests for expanded information about the extent to which companies measure assets and liabilities at fair value, the information used to measure fair value, and the effect of fair value measurements on earnings. This statement defines fair value, establishes a framework for measuring fair value in generally accepted accounting principles, and expands disclosures about fair value measurements. The Statement applies under other accounting pronouncements that require or permit fair value measurements and is effective for financial statements issued for fiscal years beginning after November 15, 2007 and interim periods within those fiscal years. We are currently evaluating the impact of this statement on ourCompany’s results of operations and financial position.
On September 29, 2006, the FASB issued Statement No. 158,Employers’ Accounting for Defined Benefit Pension and Other Postretirement Plans—An Amendment of FASB Statements No. 87, 88, 106, and 123R. This new standard requires an employer to: (a) recognize in its statement of financial position an asset for a plan’s overfunded status or a liability for a plan’s underfunded status; (b) measure a plan’s assets and its obligations that determine its funded status as of the end of the employer’s fiscal year (with limited exceptions); and (c) recognize changes in the funded status of a defined benefit postretirement plan in the year in which the changes occur. Those changes will be reported in comprehensive income of a business entity. The requirement to recognize the funded status of a benefit plan and the disclosure requirements are effective as of the end of the fiscal year ending after December 15, 2006. The requirement to measure plan assets and benefit obligations as of the date of the employer’s fiscal year-end statement of financial position is effective for fiscal years ending after December 15, 2008. We are currently evaluating the impact of FASB Statement No. 158 on our consolidated results of operations and financial position.
Note 3—Dispositions and Discontinued Operations
On June 30, 2005, we completed the sale of Rexair, Inc. (“Rexair”) to an affiliate of Rhone Capital, LLC (“Rhone”), which was initially computed based on EITF 01-02,Interpretations of APB Opinion No. 29 (“EITF No. 01-02”). We received net cash of $149.2 million and an approximately 30% equity interest in Rexair’s new parent company (see Note 2, other non-current assets section for information on the retained interest). We
Jacuzzi Brands, Inc.
Notes to Consolidated Financial Statements—(Continued)
recorded a gain of $24.7 million and debt retirement costs of $3.2 million associated with this transaction. As a result of applying EITF No. 01-02, there is a difference between the carrying value and the underlying equity in the investment. Rexair is not being accounted for as a discontinued operation as a result of this continuing investment. Our share of Rexair’s net earnings after the date of sale is reported as Rexair equity earnings in our Consolidated Statement of Operations. Beginning July 1, 2005, Rexair’s results are no longer reported in operating income as a separate business segment.
Discontinued Operations
In February 2003, our board of directors adopted a formal disposal plan to dispose of our swimming pool and equipment, hearth and water systems businesses (the “2003 Disposal Plan”). In connection with the disposal plan, we recorded a charge in 2003 of $39.9 million, net of tax, which represents the difference between the historical net carrying value (including allocated goodwill of $7.2 million) and the estimated net realizable value of these businesses. We sold the swimming pool and equipment business in May 2003, the hearth business in June 2003 and the water systems business in October 2003.
On April 15, 2005, we adopted a plan to dispose of our investment in Spear and Jackson Inc. (“S&J”). In the third quarter of 2005, we began accounting for S&J as a discontinued operation in accordance with SFAS No. 144. On July 28, 2006, we sold all of our shares of common stock of S&J to United Pacific Industries Limited for a purchase price of approximately $5.0 million. We recorded a gain on sale of $2.5 million, net of $1.3 million in expenses from the sale of S&J. Two of our directors were also directors and significant stockholders of the purchaser at the time of the sale. The transaction was considered and approved by a committee of independent directors, without participation by the interested directors. The Finance Committee also received a fairness opinion from an independent financial advisor to the effect that the sale of the shares was fair to Jacuzzi Brands. from a financial point of view. For further information, see our Reports on Form 8-K filed March 27, 2006 and July 28, 2006.
On May 20, 2005, the board of directors approved a plan to dispose of Eljer Plumbingware (“Eljer”). In the third quarter of 2005, we completed the sale of substantially all the assets, the current liabilities, the long-term retiree medical liability and certain other liabilities of Eljer to Sun Capital Partners, Inc. (“Sun Capital”). Sun Capital also took over our Ford City, PA and Tupelo, MS operations. We retained the Salem, OH manufacturing facility, which was closed in 2004, and several liabilities associated with events occurring before the acquisition, such as employee and environmental claims. We also agreed to provide transition services at no cost for a period of up to four months after the sale and to pay any severance liabilities for any Eljer employee not retained by Sun Capital. The sale of Eljer resulted in a loss of $57.8 million, net of tax for fiscal 2005. Eljer’s operations were previously included in our Bath Products segment.
Each of these disposal plans qualified for treatment as discontinued operations. The operating loss of these discontinued operations was not included in our results from continuing operations. Instead, the results were recorded as a loss from discontinued operations in the period in which they occurred in accordance with SFAS No. 144.
Summarized results of the discontinued operations through the dates of sale are as follows:
| September 30, | ||||||||||||
| 2004 | 2005 | 2006 | ||||||||||
| (in millions) | ||||||||||||
Net sales | $ | 148.1 | $ | 133.0 | $ | 82.0 | ||||||
Operating loss | (31.6 | ) | (9.1 | ) | (6.3 | ) | ||||||
Loss from discontinued operations | (19.9 | ) | (63.6 | ) | (3.4 | ) | ||||||
Jacuzzi Brands, Inc.
Notes to Consolidated Financial Statements—(Continued)
The assets and liabilities of these businesses were included in assets held for sale and liabilities associated with assets held for sale, respectively, until they were sold. The assets and liabilities of S&J included in assets and liabilities held for sale at September 30, 2005 were as follows:
| September 30, 2005 | |||
| (in millions) | |||
Cash | $ | 7.3 | |
Trade receivables, net | 16.4 | ||
Inventories | 25.0 | ||
Other current assets | 1.3 | ||
Deferred Taxes | 15.3 | ||
Property, plant and equipment, net | 1.4 | ||
Equipment investment | 0.2 | ||
Assets held for sale | $ | 66.9 | |
Notes payable | $ | 0.8 | |
Trade accounts payable | 8.1 | ||
Other current liabilities | 11.3 | ||
Other long term liabilities | 36.7 | ||
Minority interest | 10.0 | ||
Liabilities associated with assets held for sale | $ | 66.9 | |
Also included in assets held for sale are properties held for sale of $2.8 million at September 30, 2005 and $7.4 million at September 30, 2006. Liabilities associated with assets held for sale at September 30, 2006 includes $0.8 million of environmental liabilities associated with these properties. These properties are currently being marketed for sale and meet all of the criteria for classification as held for sale at September 30, 2005 and 2006 as required by SFAS No. 144. These properties are recorded at the lower of their carrying value or fair value less cost to sell.
We retained liabilities related to certain of the businesses we disposed of in prior years and therefore have continued to use cash to satisfy these liabilities. Payments of such costs totaled $15.5 million in fiscal 2006. We have an additional $12.5 million accrued at September 30, 2006 related to environmental, product liability, workers’ compensation and other retained liabilities of disposed businesses. These liabilities are expected to be paid over the next ten years and represent the only expenditures expected to be incurred over this period for businesses disposed of as of this date. In accordance with EITF Issue No. 03-13 “ApplyingASC 805, the Conditions in Paragraph 42 of FASB Statement No. 144 in Determining WhetherCompany adjusted its initial purchase price allocation subsequent to Report Discontinued Operations”, we concluded that these cash flows would not be direct cash flows of the disposed component because in each case we have had no significant involvement in the disposed businesses after the disposal. We have not migrated any of the operating activities of the disposed businesses to our current operations.
Jacuzzi Brands, Inc.
Notes to Consolidated Financial Statements—(Continued)
Note 4—Impairment, Restructuring and Other Charges
The principal components of impairment, restructuring and other charges are:
| For the Fiscal Year Ended September 30, | ||||||||||
| 2004 | 2005 | 2006 | ||||||||
| (in millions) | ||||||||||
Impairment of assets | $ | — | $ | — | $ | 1.9 | ||||
Lease obligations and other commitments | (0.6 | ) | 0.4 | 0.2 | ||||||
Severance and related costs | 3.5 | 9.0 | 5.1 | |||||||
| $ | 2.9 | $ | 9.4 | $ | 7.2 | |||||
Cash charges | $ | 2.9 | $ | 8.1 | $ | 5.3 | ||||
Non-cash charges | — | 1.3 | 1.9 | |||||||
| $ | 2.9 | $ | 9.4 | $ | 7.2 | |||||
Below is aFontaine acquisition. A summary of the impairment, restructuring and other charges we incurred in 2004, 2005 and 2006. Charges are recorded when a liability is incurred in accordance with FASB Statement No. 146,Accounting for Costs Associated with Exit or Disposal Activities (“SFAS No. 146”), FASB Statement No. 88,Employers’ Accounting for Settlements and Curtailments of Defined Benefit Pension Plans and for Termination Benefits, and SFAS No. 144 or other applicable guidance.
| For the Fiscal Year Ended September 30, | |||||||||||
| 2004 | 2005 | 2006 | |||||||||
| (in millions) | |||||||||||
Bath Products: | |||||||||||
U.K. initiatives | $ | — | $ | 1.6 | $ | 5.2 | (1) | ||||
Closure of Asia office | — | — | 0.6 | ||||||||
Consolidation of administrative functions | 3.5 | 2.9 | 1.2 | ||||||||
Sub-total Bath Products | 3.5 | 4.5 | 7.0 | ||||||||
Corporate Expenses: | |||||||||||
Adjustment of estimated lease obligation | (0.6 | ) | — | — | |||||||
Corporate headquarters restructuring | — | 4.9 | 0.2 | ||||||||
Sub-total Corporate Expenses | (0.6 | ) | 4.9 | 0.2 | |||||||
| $ | 2.9 | $ | 9.4 | $ | 7.2 | ||||||
In 2005, we reorganized and restructured the senior management of the Bath Products segment and corporate offices, reduced staff in the U.K. and domestic bath business and implemented other overhead reductions. We incurred severance charges of $3.5 million in 2004 relatedCompany’s goodwill adjustments to the consolidation and relocation of a number of administrative functions into a shared services operations center in Dallas, TX in an effort to reduce costs in our domestic bath and spa businesses. The shared service center occupies a portion of the unused office space in Dallas, TX that had remained vacant since our closing of the Zurn Industries, Inc. (“Zurn”) corporate office. A favorable adjustment of $0.6 million was recorded in 2004, to reduce the associated accrual for lease costs that had originally been established in 2000.
Jacuzzi Brands, Inc.
Notes to Consolidated Financial Statements—(Continued)
Restructuring and other charges for fiscal 2006 consisted of $5.2 million related to our Bradford, U.K. consolidation and other U.K. initiatives and included $1.8 million related to inventory write-downs and accelerated depreciation which was recorded in cost of goods sold. The remaining $3.4 million was recorded as restructuring and consisted of severance and other cash related charges. We also incurred severance and lease related charges of $0.6 million during 2006 associated with the closure of the Asia office and the termination of 11 employees. The remaining charges primarily relate to our continued efforts to consolidate administrative and other overhead of our domestic businesses. The $1.4 million in restructuring charges are primarily associated with severance and include $1.2 million in the Bath Products segment and $0.2 million in corporate expenses.
The activity in the restructuring liability accounts by cost category is as follows:
| Contract Related Costs | Severance and Related Costs | Total Costs | ||||||||||
| (in millions) | ||||||||||||
At September 30, 2004 | $ | 3.1 | $ | 2.5 | $ | 5.6 | ||||||
2005 charges | 0.4 | 9.0 | 9.4 | |||||||||
Cash payments | (1.8 | ) | (9.4 | ) | (11.2 | ) | ||||||
At September 30, 2005 | 1.7 | 2.1 | 3.8 | |||||||||
2006 charges | 0.2 | 5.1 | 5.3 | |||||||||
Cash payments | (0.8 | ) | (5.9 | ) | (6.7 | ) | ||||||
Other | 0.2 | — | 0.2 | |||||||||
At September 30, 2006 | $ | 1.3 | $ | 1.3 | $ | 2.6 | ||||||
At September 30, 2006, approximately $2.4 million of the reserves are included in the balance sheet caption “Accrued expenses and other current liabilities,” while the remaining $0.2 million are recorded in the balance sheet caption “Other liabilities.” We expect the remaining accruals to be paid with cash over the periods provided by the severance and lease agreements over the next fourteen months.
Note 5—Long-term Debt
Long-term debt consists of the following:
| September 30, | ||||||||
| 2005 | 2006 | |||||||
| (in millions) | ||||||||
Senior Notes | $ | 380.0 | $ | 380.0 | ||||
Other long-term debt | 5.0 | 3.5 | ||||||
| 385.0 | 383.5 | |||||||
Less: current maturities | (1.5 | ) | (1.7 | ) | ||||
Long-term debt | $ | 383.5 | $ | 381.8 | ||||
The 9.625% Senior Secured Notes (“Senior Notes”) are due on July 1, 2010 and require the payment of interest of $18.3 million on January 1 and July 1 of each year. We are restricted in our ability to cause a mandatory redemption of the Senior Notes per the terms of the indenture for the Senior Notes. On and after July 1, 2007, we can redeem the Senior Notes subject to a redemption premium of 104.8% for the first 12 months and 102.4% for the following 12 months. On and after July 1, 2009, the Senior Notes can be redeemed at face value. The indenture for the Senior Notes limits our ability to pay dividends, repurchase stock and make other restricted payments as defined therein.
Jacuzzi Brands, Inc.
Notes to Consolidated Financial Statements—(Continued)
As required by the indenture governing the Senior Notes, on April 11, 2006 we commenced an offer toinitial purchase up to $47.7 million aggregate principal amount of our Senior Notes at par, plus accrued and unpaid interest. The amount of the offer was equivalent to the remaining proceeds from both the Rexair and Eljer dispositions, net of certain expenses and payments incurred in connection with the dispositions. At September 30, 2005, we had restricted cash accounts of $12.4 million that were held for the benefit of the bondholders related to the proceeds from the Rexair and Eljer dispositions. None of the Senior Notes were tendered thus the restricted cash balance was reclassified to cash and cash equivalents. We have an asset-based revolving credit facility that matures on July 15, 2008. Under this facility, we can borrow up to $200.0 million subject to a borrowing base consisting of eligible accounts receivable and eligible inventory. At September 30, 2006, we had approximately $131.2 million available to be borrowed under the asset-based facility, of which we had utilized approximately $30.7 million for letters of credit, leaving $100.5 million available for additional borrowings. The interest rate under the facility is currently 2.0% over LIBOR or Prime. This rate is reset each quarter based on our Consolidated Leverage Ratio as defined in the agreement, and could range from 2.0% to 2.5% over LIBOR (“Applicable LIBOR Margin”). The weighted-average interest rate was 5.22% for 2005 and 3.98% for 2004. We had no amounts outstanding under the facility during 2006 or at September 30, 2005. Certain of our existing and future domestic restricted subsidiaries guarantee the Senior Notes, jointly and severally, on a senior basis. The Senior Notes are secured by an eligible first lien on domestic property, plant and equipment, and a second lien on the assets that secure the credit facilities. The asset-based credit facility is secured by a first lien on accounts receivable, inventory, the stock of our domestic subsidiaries and 65% of the stock of our first-tier foreign subsidiaries. In addition, the asset-based credit facility has a second lien on the property, plant and equipment securing the Senior Notes.
We paid $45.1 million, $45.3 million and $39.8 million of interest on our borrowings in 2004, 2005 and 2006, respectively.
Principal reductions of senior debt and other borrowings for the next five years ended September 30 and thereafterprice allocation are as follows (in millions):
2007 | $ | 1.7 | |
2008 | 1.8 | ||
2009 | — | ||
2010 | 380.0 | ||
2011 | — | ||
| $ | 383.5 | ||
Commitments
At September 30, 2006, we had approximately $131.2 million available to be borrowed under the asset-based facility, of which we had utilized approximately $30.7 million for letters of credit, leaving $100.5 million available for additional borrowings. In addition, we have outstanding foreign commercial letters of credit of $2.0 million which do not affect availability under the asset-based facility.
Note 6—Pension and Retirement Plans
We sponsor a number of domestic and foreign defined contribution plans. Contributions relating to defined contribution plans are made based upon the respective plans’ provisions.
Jacuzzi Brands, Inc.
Goodwill balance at acquisition Adjustments to original purchase price allocation Goodwill balance at March 31, 2010Notes to Consolidated Financial Statements—(Continued) $ 5.3 0.2 $ 5.5
F-14
Domestic Benefit Arrangements4. Restructuring and Other Similar Costs
In 2004, all our domestic defined benefit pension plansBeginning with the quarter ended December 27, 2008, the Company executed certain restructuring actions to reduce operating costs and improve profitability. The restructuring actions primarily resulted in workforce reductions, inventory impairments, and lease termination and other facility rationalization costs. As the restructuring actions were merged into a single pension plan.substantially completed during fiscal 2010, the Company did not record any restructuring charges during the year ended March 31, 2011. The benefits under this plan are based primarily onfollowing table summarizes the restructuring costs incurred during the years of credited service and/or compensation as defined underended March 31, 2009 and 2010 and the plan provisions. Our funding policy istotal restructuring costs incurred since such actions began (i.e., the period from September 28, 2008 to contribute amounts to the plan sufficient to meet the minimum funding requirements set forth in the Employee Retirement Income Security Act of 1974, plus such additional amounts as we may determine to be appropriate from time to time.March 31, 2010) by reportable segment (in millions):
We also provide health care and life insurance benefits to certain groups of retirees with most retirees contributing back to us a portion of our costs. These other post-employment benefit plans are presented as “Other Plans” in the tables that follow. We use a September 30 measurement date for the plans.
| Year Ended March 31, 2009 | ||||||||||||||||
| Process & Motion Control | Water Management | Corporate | Consolidated | |||||||||||||
Severance costs | $ | 16.0 | $ | 2.0 | $ | 0.2 | $ | 18.2 | ||||||||
Fixed asset impairments | — | 3.2 | — | 3.2 | ||||||||||||
Inventory impairments | — | 2.5 | — | 2.5 | ||||||||||||
Lease termination and other costs | 0.5 | 0.1 | — | 0.6 | ||||||||||||
Total restructuring and other similar costs | $ | 16.5 | $ | 7.8 | $ | 0.2 | $ | 24.5 | ||||||||
| Year Ended March 31, 2010 | ||||||||||||||||
| Process & Motion Control | Water Management | Corporate | Consolidated | |||||||||||||
Severance costs | $ | 3.7 | $ | 0.5 | $ | — | $ | 4.2 | ||||||||
Fixed asset impairments | — | — | — | — | ||||||||||||
Inventory impairments | 0.4 | — | — | 0.4 | ||||||||||||
Lease termination and other costs | 2.2 | — | — | 2.2 | ||||||||||||
Total restructuring and other similar costs | $ | 6.3 | $ | 0.5 | $ | — | $ | 6.8 | ||||||||
| Period from September 28, 2008 to March 31, 2010 | ||||||||||||||||
| Process & Motion Control | Water Management | Corporate | Consolidated | |||||||||||||
Severance costs | $ | 19.7 | $ | 2.5 | $ | 0.2 | $ | 22.4 | ||||||||
Fixed asset impairments | — | 3.2 | — | 3.2 | ||||||||||||
Inventory impairments | 0.4 | 2.5 | — | 2.9 | ||||||||||||
Lease termination and other costs | 2.7 | 0.1 | — | 2.8 | ||||||||||||
Total restructuring and other similar costs | $ | 22.8 | $ | 8.3 | $ | 0.2 | $ | 31.3 | ||||||||
The following table provides a reconciliation of changessummarizes the activity in the projected benefit obligation, fair value of plan assetsCompany’s restructuring reserve for the fiscal years ended March 31, 2010 and the funded status of our defined benefit pension and other post-employment benefit plans to the amounts recorded in our balance sheets:2011 (in millions):
| Pension Plans at September 30, | Other Plans at September 30, | |||||||||||||||
| 2005 | 2006 | 2005 | 2006 | |||||||||||||
| (in millions) | ||||||||||||||||
Benefit obligation at beginning of year | $ | 338.4 | $ | 372.1 | $ | 16.7 | $ | 17.2 | ||||||||
Adjustment relating to prior years(1) | — | 5.5 | — | — | ||||||||||||
Service cost | 6.5 | 4.3 | 0.3 | 0.3 | ||||||||||||
Interest cost | 18.8 | 19.6 | 0.9 | 0.9 | ||||||||||||
Plan amendments | 1.2 | — | — | — | ||||||||||||
Actuarial (gains)/losses | 30.5 | (15.7 | ) | 1.2 | (2.6 | ) | ||||||||||
Benefits paid | (19.8 | ) | (23.2 | ) | (1.9 | ) | (1.9 | ) | ||||||||
Curtailments | (3.5 | ) | (1.0 | ) | — | — | ||||||||||
Benefit obligation at end of year | $ | 372.1 | $ | 361.6 | $ | 17.2 | $ | 13.9 | ||||||||
Fair value of plan assets at beginning of year | $ | 369.8 | $ | 407.2 | $ | — | $ | — | ||||||||
Actual return on plan assets | 56.4 | 35.1 | — | — | ||||||||||||
Contributions | 0.8 | 3.7 | 1.9 | 1.9 | ||||||||||||
Benefits paid | (19.8 | ) | (23.2 | ) | (1.9 | ) | (1.9 | ) | ||||||||
Fair value of plan assets at end of year | $ | 407.2 | $ | 422.8 | $ | — | $ | — | ||||||||
Plan assets in excess of (less than) projected benefit obligation | $ | 35.1 | $ | 61.2 | $ | (17.2 | ) | $ | (13.9 | ) | ||||||
Unrecognized net actuarial losses (gains) | 85.7 | 59.5 | 1.5 | (1.1 | ) | |||||||||||
Unrecognized prior service cost (income) | 11.7 | 10.1 | (4.3 | ) | (3.3 | ) | ||||||||||
Net amount recognized | $ | 132.5 | $ | 130.8 | $ | (20.0 | ) | $ | (18.3 | ) | ||||||
Prepaid benefits | $ | 145.4 | $ | 148.1 | $ | — | $ | — | ||||||||
Accrued benefits | (22.2 | ) | (23.2 | ) | (20.0 | ) | (18.3 | ) | ||||||||
Intangible assets | 2.4 | 1.9 | — | — | ||||||||||||
Accumulated other comprehensive expense | 6.9 | 4.0 | — | — | ||||||||||||
Net amount recognized | $ | 132.5 | $ | 130.8 | $ | (20.0 | ) | $ | (18.3 | ) | ||||||
| Severance Costs | Fixed Asset Impairments | Lease Termination and Other Costs | Inventory Impairments | Total | ||||||||||||||||
Restructuring reserve, March 31, 2009 | $ | 12.6 | $ | — | $ | 0.6 | $ | — | $ | 13.2 | ||||||||||
Charges | 4.2 | — | 2.2 | 0.4 | 6.8 | |||||||||||||||
Cash payments | (15.7 | ) | — | (0.8 | ) | — | (16.5 | ) | ||||||||||||
Non-cash asset impairments | — | — | — | (0.4 | ) | (0.4 | ) | |||||||||||||
Currency translation adjustment | 0.2 | — | — | — | 0.2 | |||||||||||||||
Restructuring reserve, March 31, 2010 | $ | 1.3 | $ | — | $ | 2.0 | $ | — | $ | 3.3 | ||||||||||
Cash payments | $ | (1.2 | ) | $ | — | $ | (1.1 | ) | $ | — | $ | (2.3 | ) | |||||||
Currency translation adjustment | (0.1 | ) | — | — | — | (0.1 | ) | |||||||||||||
Restructuring reserve, March 31, 2011 | $ | — | $ | — | $ | 0.9 | $ | — | $ | 0.9 | ||||||||||
| (1) |
F-15
Jacuzzi Brands, Inc.
Notes to Consolidated Financial Statements—(Continued)
In the first quarter of 2006, we paid $3.0 million to buyout certain vested post-retirement benefit plan liabilities owed to participants who were retired or terminated. The curtailment charge of $1.0 million in the table above5. Recovery Under Continued Dumping and settlement charge of $0.6 million in the table which follows relate to this buyout.
For both years presented, the fair value of the pension plan’s assets exceeded its accumulated benefit obligation and projected benefit obligation.
The components of net periodic expense (income) for our domestic defined benefit pension and other plans are presented below:
| Pension Plans for the Fiscal Years Ended September 30, | Other Plans for the Fiscal Years Ended September 30, | |||||||||||||||||||||||
| 2004 | 2005 | 2006 | 2004 | 2005 | 2006 | |||||||||||||||||||
| (in millions) | ||||||||||||||||||||||||
Service cost | $ | 6.7 | $ | 6.5 | $ | 4.3 | $ | 0.2 | $ | 0.3 | $ | 0.3 | ||||||||||||
Interest cost | 18.2 | 18.8 | 19.5 | 1.0 | 0.9 | 0.9 | ||||||||||||||||||
Expected return on plan assets | (31.8 | ) | (31.5 | ) | (32.2 | ) | — | — | — | |||||||||||||||
Prior service cost | 0.9 | 1.5 | 3.4 | (1.0 | ) | (1.0 | ) | (1.0 | ) | |||||||||||||||
Net actuarial loss (gain) | 1.9 | 5.1 | 6.2 | (0.1 | ) | — | 0.1 | |||||||||||||||||
Curtailments/settlements | 2.5 | 4.8 | 0.6 | — | (0.4 | ) | — | |||||||||||||||||
Periodic expense (income) of defined benefit plans | (1.6 | ) | 5.2 | 1.8 | 0.1 | (0.2 | ) | 0.3 | ||||||||||||||||
Adjustment relating to prior years(1) | — | — | 2.9 | — | — | — | ||||||||||||||||||
Net reclassification adjustment for discontinued operations | (3.9 | ) | (4.5 | ) | — | — | — | — | ||||||||||||||||
Net periodic expense (income): | ||||||||||||||||||||||||
Defined benefit plans | (5.5 | ) | 0.7 | 4.7 | 0.1 | (0.2 | ) | 0.3 | ||||||||||||||||
Defined contribution plans | 1.4 | 1.3 | 1.3 | — | — | — | ||||||||||||||||||
| $ | (4.1 | ) | $ | 2.0 | $ | 6.0 | $ | 0.1 | $ | (0.2 | ) | $ | 0.3 | |||||||||||
AssumptionsSubsidy Offset Act (“CDSOA”)
The weighted-average assumptions used to determineU.S. government has seven anti-dumping duty orders in effect against certain foreign producers of ball bearings exported from six countries, tapered roller bearings from China and spherical plain bearings from France. The foreign producers of the benefit obligation for our domestic defined benefit pensionball bearing orders are located in France, Germany, Italy, Japan, Singapore and other plans are as follows:
| Pension Plans at September 30, | Other Plans at September 30, | |||||||||||||||||
| 2004 | 2005 | 2006 | 2004 | 2005 | 2006 | |||||||||||||
| (in millions) | ||||||||||||||||||
Discount rate | 5.75 | % | 5.35 | % | 5.65 | % | 5.75 | % | 5.35 | % | 5.65 | % | ||||||
Rate of compensation increases | 3.25 | % | 3.25 | % | 3.25 | % | — | — | — | |||||||||
Jacuzzi Brands, Inc.
Notes to Consolidated Financial Statements—(Continued)
the United Kingdom. The weighted-average assumptions used to determine the net periodic pension expense (income) for our domestic defined benefit pension and other plans are as follows:
| Pension Plans for the Fiscal Years Ended September 30, | Other Plans for the Fiscal Years Ended September 30, | |||||||||||||||||
| 2004 | 2005 | 2006 | 2004 | 2005 | 2006 | |||||||||||||
| (in millions) | ||||||||||||||||||
Discount rate | 6.00 | % | 5.75 | % | 5.35 | % | 6.00 | % | 5.75 | % | 5.35 | % | ||||||
Rate of compensation increases | 3.25 | % | 3.25 | % | 3.25 | % | — | — | — | |||||||||
Expected rate of return on assets | 8.75 | % | 8.75 | % | 8.75 | % | — | — | — | |||||||||
The expected rateCompany is a producer of return on assets is based on several factors. Such factors include current and expected target asset allocation, the historical experience of returns provided by plan assets, the evaluation of market conditions and interest rates, tolerance for risk within plan guidelines and cash requirements for benefit payments. In conjunction with our actuaries we analyze the foregoing factors as well as the advice of our pension investment advisors to develop the return on assets assumptions.
The weighted-average annual assumed rate of increaseball bearing products in the per capita costUnited States. The CDSOA provides for distribution of monies collected by Customs and Border Protection (“CBP”) from anti-dumping cases to qualifying producers, on a pro rata basis, where the domestic producers have continued to invest their technology, equipment and people in products that were the subject of the anti-dumping orders. As a result of providing relevant information to CBP regarding historical manufacturing, personnel and development costs for previous calendar years, the Company received $1.8 million, $0.8 million, and $0.7 million, its pro rata share of the total CDSOA distribution, during the years ended March 31, 2009, 2010 and 2011, respectively, which is included in other non-operating expense, net on the consolidated statement of operations.
In February 2006, U.S. Legislation was enacted that ends CDSOA distributions to U.S. manufacturers for imports covered benefits (i.e.,by anti-dumping duty orders entering the health care cost trend rate) for the other post-employment benefit plans was 9.5% for 2005 and 9.0% for 2006. The rate used as ofU.S. after September 30, 2006 was 9% and is assumed to decrease 0.5% a year to 5%. A one-percentage-point change in the assumed health care cost trend rate would have had the following effects as of2007. Because monies were collected by CBP until September 30, 2007 and for prior year entries, the year ended September 30, 2006 (in millions):
| Increase (Decrease) Costs/Obligations | ||||
Effect of a 1% increase in the health care cost trend rate on: | ||||
Service cost plus interest cost | $ | 0.2 | ||
Accumulated post-employment benefit obligation | 1.4 | |||
Effect of a 1% decrease in the health care cost trend rate on: | ||||
Service cost plus interest cost | $ | (0.1 | ) | |
Accumulated post-employment benefit obligation | (1.1 | ) | ||
Plan Assets
Our domestic defined benefit pension plan’s weighted-average asset allocations by asset category are as follows:
| At September 30, | ||||||
| 2005 | 2006 | |||||
| (in millions) | ||||||
Equity securities | $ | 279.5 | $ | 289.6 | ||
Debt securities | 98.8 | 98.3 | ||||
Other | 28.9 | 34.9 | ||||
| $ | 407.2 | $ | 422.8 | |||
The overall investment strategy for our domestic pension plan isCompany has continued to manage the plan’s assets in a prudent and productive manner. The selected investment managers seek to increase the aggregate valuereceive some additional distributions; however, because of the assets under management while consciouspending cases, the 2006 legislation and the administrative operation of the need to preserve asset value. Reasonable consistencylaw, the Company cannot reasonably estimate the amount of returns is
Jacuzzi Brands, Inc.CDSOA payments, if any, that it may receive in future years.
Notes to Consolidated Financial Statements—(Continued)
expected on a year-to-year basis. Active management strategies are used to meet investment objectives of the pension plan, which are to satisfy all pension benefit payments and to realize investment returns in excess of market indices. Consistent with these investment objectives, the plan has set the following range of target percentages for the allocation of plan assets by each major category.
| ||
| ||
| ||
|
The assets for our domestic plan are included in a master trust which principally invests in listed stocks and bonds, including the common stock of our company. At September 30, 2005 and 2006, 1,333,100 shares of our common stock representing $10.7 million and $13.3 million of the master trust’s assets as of September 30, 2005 and September 30, 2006, respectively, were included in plan assets.
Expected Contributions and Benefit Payments
We do not expect to make any contributions to our domestic defined benefit pension plan in 2006. Based on our assumptions discussed above, we expect to make the following estimated future benefit payments under the plans as follows:
| Pension Plans | Other Plans | |||||
| (in millions) | ||||||
2007 | $ | 18.9 | $ | 0.9 | ||
2008 | 19.7 | 1.0 | ||||
2009 | 20.0 | 1.0 | ||||
2010 | 20.3 | 1.0 | ||||
2011 | 20.9 | 1.0 | ||||
2012-2016 | 117.1 | 5.2 | ||||
| $ | 216.9 | $ | 10.1 | |||
The tables above and on the previous pages set forth the historical components of net periodic pension cost and a reconciliation of the funded status of the pension and other plans for our domestic employees. This information, however, is not necessarily indicative of the amounts we will recognize on a prospective basis.
We recorded a reduction of the minimum pension liability in accordance with SFAS No. 87, totaling $1.9 million ($1.2 million net of taxes) in 2005 and $2.9 million ($1.8 million net of taxes) in 2006 upon completion of our annual pension valuation for our domestic plans. The adjustment to the minimum pension liability was included in accumulated other comprehensive income as a direct charge to shareholders’ equity, net of related tax effect.
Jacuzzi Brands, Inc.
Notes to Consolidated Financial Statements—(Continued)
Foreign Benefit Arrangements
Our foreign defined benefit pension plans cover certain employees in our U.K. and Canadian operations. The following table provides a reconciliation of changes in the projected benefit obligation, the fair value of plan assets and the funded status of our foreign defined benefit pension plans with the amounts recognized on our balance sheets:
| At September 30, | ||||||||
| 2005 | 2006 | |||||||
| (in millions) | ||||||||
Benefit obligation at beginning of year | $ | 69.2 | $ | 81.9 | ||||
Service cost | 1.3 | 1.5 | ||||||
Interest cost | 4.1 | 4.4 | ||||||
Employee contributions | 0.9 | 0.8 | ||||||
Foreign currency exchange rate changes | (1.8 | ) | 5.4 | |||||
Actuarial losses | 10.4 | 4.9 | ||||||
Benefits paid | (2.2 | ) | (1.5 | ) | ||||
Benefit obligation at end of year | $ | 81.9 | $ | 97.4 | ||||
Fair value of plan assets at beginning of year | $ | 43.5 | $ | 53.7 | ||||
Actual return on plan assets | 10.6 | 5.4 | ||||||
Foreign currency exchange rate changes | (1.2 | ) | 3.6 | |||||
Employer contributions | 2.1 | 3.9 | ||||||
Employee contributions | 0.9 | 0.8 | ||||||
Benefits paid | (2.2 | ) | (1.5 | ) | ||||
Fair value of plan assets at end of year | $ | 53.7 | $ | 65.9 | ||||
Plan assets less than projected benefit obligation | $ | (28.2 | ) | $ | (31.5 | ) | ||
Unrecognized net actuarial losses | 38.3 | 42.2 | ||||||
| $ | 10.1 | $ | 10.7 | |||||
Accrued benefits | $ | (21.5 | ) | $ | (23.3 | ) | ||
Accumulated other comprehensive expense | 31.6 | 34.0 | ||||||
| $ | 10.1 | $ | 10.7 | |||||
The components of net periodic expense for our foreign defined benefit pension plans are presented below:
| For the Fiscal Years Ended September 30, | ||||||||||||
| 2004 | 2005 | 2006 | ||||||||||
| (in millions) | ||||||||||||
Service cost | $ | 1.1 | $ | 1.3 | $ | 1.5 | ||||||
Interest cost | 3.2 | 4.1 | 4.3 | |||||||||
Expected return on plan assets | (3.8 | ) | (4.2 | ) | (4.0 | ) | ||||||
Net actuarial loss | 0.4 | 1.0 | 2.1 | |||||||||
Net periodic expense: | ||||||||||||
Defined benefit plans | 0.9 | 2.2 | 3.9 | |||||||||
Defined contribution plans | 0.3 | 0.3 | 0.3 | |||||||||
| $ | 1.2 | $ | 2.5 | $ | 4.2 | |||||||
Jacuzzi Brands, Inc.
Notes to Consolidated Financial Statements—(Continued)
Assumptions6. Inventories
The weighted-average assumptions used to determine the benefit obligation for our foreign defined benefit plansmajor classes of inventories are as follows:
| At September 30, | |||||||||
| 2004 | 2005 | 2006 | |||||||
Discount rate | 5.75 | % | 5.25 | % | 5.00 | % | |||
Rate of compensation increases | 3.25 | % | 3.00 | % | 3.25 | % | |||
The weighted-average assumptions used to determine the net periodic pension expense for our foreign defined benefit pension plans are as follows:
| For the Fiscal Year Ended September 30, | |||||||||
| 2004 | 2005 | 2006 | |||||||
Discount rate | 5.75 | % | 5.25 | % | 5.00 | % | |||
Rate of compensation increases | 3.25 | % | 3.00 | % | 3.25 | % | |||
Expected rate of return on assets | 7.50 | % | 7.75 | % | 7.75 | % | |||
The expected rate of return on assets is based on several factors. Such factors include current and expected target asset allocation, the historical experience of returns provided by plan assets, the evaluation of market conditions and interest rates, tolerance for risk within plan guidelines and cash requirements for benefit payments. Our actuaries and we analyze the foregoing factors as well as the advice of our pension investment advisor to develop the return on assets assumption.
Plan Assets
Our foreign defined benefit pension plans’ weighted-average asset allocations by asset category are as follows:
| At September 30, | ||||||
| 2005 | 2006 | |||||
Equity securities | $ | 42.4 | $ | 50.0 | ||
Debt securities | 10.8 | 15.9 | ||||
Other | 0.5 | — | ||||
| $ | 53.7 | $ | 65.9 | |||
The plan’s asset allocation strategy was determined with regard to the actuarial characteristics of the plan, in particular the strength of the funding position and the liability profile. It was based on the assumption that equity securities would outperform debt securities over the longer term. The trustees considered written advice from their investment advisers when choosing the plan’s asset allocation strategy.
Jacuzzi Brands, Inc.
Notes to Consolidated Financial Statements—(Continued)
Expected Contributions and Benefit Payments
We expect to contribute $4.0 million to our foreign defined benefit pension plans in 2007. Based on our assumptions discussed above, we expect to make the following estimated future benefit payments under the plansummarized as follows (in millions):
2007 | $ | 1.2 | |
2008 | 1.3 | ||
2009 | 1.3 | ||
2010 | 1.4 | ||
2011 | 1.4 | ||
2012-2016 | 7.8 | ||
| $ | 14.4 | ||
| March 31, | ||||||||
| 2010 | 2011 | |||||||
Finished goods | $ | 171.7 | $ | 184.1 | ||||
Work in progress | 51.1 | 53.7 | ||||||
Raw materials | 30.9 | 30.8 | ||||||
Inventories at First-in, First-Out (“FIFO”) cost | 253.7 | 268.6 | ||||||
Adjustment to state inventories at Last-in, First-Out (“LIFO”) cost | 20.1 | 15.2 | ||||||
| $ | 273.8 | $ | 283.8 | |||||
We recorded an additional minimum pension liability7. Property, Plant & Equipment
Property, plant and equipment is summarized as follows (in millions):
| March 31, | ||||||||
| 2010 | 2011 | |||||||
Land | $ | 36.7 | $ | 37.5 | ||||
Buildings and improvements | 160.0 | 163.4 | ||||||
Machinery and equipment | 303.1 | 315.7 | ||||||
Hardware and software | 38.1 | 42.8 | ||||||
Construction in-progress | 8.7 | 21.0 | ||||||
| 546.6 | 580.4 | |||||||
Less accumulated depreciation | (170.4 | ) | (222.0 | ) | ||||
| $ | 376.2 | $ | 358.4 | |||||
F-16
8. Goodwill and Intangible Assets
The Company conducts its annual testing of $0.1 million ($0.4 million netindefinite lived intangible assets and goodwill during the third quarter of taxes and foreign currency translation) in 2005 upon completion of our annual pension valuations and an increase of our minimum pension liability for our foreign planseach year in accordance with SFAS No. 87, totaling $2.4ASC 350,Intangibles—Goodwill and Other(“ASC 350”). Pursuant to the guidance, an impairment loss is recognized if the estimated fair value of the intangible asset or reporting unit is less than its carrying amount. The fair value of the Company’s indefinite lived intangible assets and reporting units were primarily estimated using an income valuation model (discounted cash flow) and market approach (guideline public company comparables), which indicated that the fair value of the Company’s indefinite lived intangible assets and reporting units exceeded their carrying value, therefore, no impairment was present. The estimated fair value of the Company’s reporting units was dependent on several significant assumptions, including its weighted average cost of capital (discount rate) and future earnings and cash flow projections.
During the year ended March 31, 2009, the Company recorded non-cash pre-tax impairment charges associated with goodwill and identifiable intangible assets of $422.0 million, of which $319.3 million relates to goodwill impairment and $102.7 million relates to other identifiable intangible asset impairments. These charges were measured and recognized following the guidance in ASC 350 and 360,Property, Plant, and Equipment(“ASC 360”), which require that the carrying value of goodwill and identifiable intangible assets be tested for impairment annually or whenever circumstances indicate that impairment may exist. The impairment charges recorded were precipitated by the macroeconomic factors impacting the global credit markets as well as slower industry business conditions which contributed to deterioration in the Company’s projected sales, operating profits and cash flows at that time.
The Company commenced its testing of identifiable intangible assets and goodwill during fiscal 2009 by first testing its amortizable intangible assets (customer relationships and patents) for impairment under the provisions of ASC 360. Under ASC 360, an impairment loss is recognized if the estimated future undiscounted cash flows derived from the asset are less than its carrying amount. The impairment loss is measured as the excess of the carrying value over the fair value of the asset. Upon the completion of its impairment testing surrounding amortizable intangible assets, the Company recorded a pre-tax impairment charge of $14.3 million related to its existing patents during fiscal 2009. The reduction in patents of $14.3 million represented approximately 35.1% of the total patent balance.
The Company then tested its indefinite lived intangible assets (trademarks and tradenames) for impairment during fiscal 2009 in accordance with ASC 350. This test consisted of comparing the fair value of the Company’s trade names to their carrying values. As a result of this test, the Company recorded a pre-tax impairment charge of $88.4 million related to the Company’s trademarks and tradenames during fiscal 2009. The reduction in trademarks and tradenames of $88.4 million represented approximately 23.5% of the total trademarks and tradenames balance.
Lastly, the Company tested its goodwill for impairment under the provisions of ASC 350. Under ASC 350, the goodwill impairment measurement consists of two steps. In the first step, the fair value of each reporting unit is compared to its carrying value to identify reporting units that may be impaired. The Company’s analysis of the fair value of its reporting units incorporated a discounted cash flow methodology based on future business projections. Based on this evaluation, it was determined that the fair value of the Company’s Process & Motion Control and Zurn reporting units (within the Company’s Process & Motion Control and Water Management operating segments, respectively) were less than their carrying values.
The second step of the goodwill impairment test consists of determining the implied fair value of each impaired reporting unit’s goodwill. The activities in the second step include hypothetically valuing all of the tangible and intangible assets of the impaired reporting units at fair value as if the reporting unit had been acquired in a business combination. The excess of the fair value of the reporting unit over the fair value of its identifiable assets and liabilities is the implied fair value of goodwill. The goodwill impairment is measured as the excess of the implied fair value of the reporting units’ goodwill over the carrying value of the goodwill. Based upon the results of its two step analysis, the Company recognized a pre-tax goodwill impairment charge of
F-17
$319.3 million during fiscal 2009. The reduction in goodwill of $319.3 million represented approximately 24.0% of the total goodwill balance.
The changes in the net carrying value of goodwill and identifiable intangible assets for the years ended March 31, 2010 and 2011 by operating segment, are presented below (in millions):
| Amortizable Intangible Assets | ||||||||||||||||||||||||
| Goodwill | Indefinite Lived Intangible Assets (Trade Names) | Customer Relationships | Patents | Non-Compete | Total Identifiable Intangible Assets Excluding Goodwill | |||||||||||||||||||
Process & Motion Control | ||||||||||||||||||||||||
Net carrying amount as of March 31, 2009 | $ | 852.3 | $ | 191.9 | $ | 197.0 | $ | 10.3 | $ | — | $ | 399.2 | ||||||||||||
Amortization | — | (1.2 | ) | (27.0 | ) | (1.7 | ) | — | (29.9 | ) | ||||||||||||||
Net carrying amount as of March 31, 2010 | $ | 852.3 | $ | 190.7 | $ | 170.0 | $ | 8.6 | $ | — | $ | 369.3 | ||||||||||||
Amortization | $ | — | $ | — | $ | (27.2 | ) | $ | (1.5 | ) | $ | — | $ | (28.7 | ) | |||||||||
Acquisitions | 3.6 | — | 4.4 | — | — | 4.4 | ||||||||||||||||||
Net carrying amount as of March 31, 2011 | $ | 855.9 | $ | 190.7 | $ | 147.2 | $ | 7.1 | $ | — | $ | 345.0 | ||||||||||||
Water Management | ||||||||||||||||||||||||
Net carrying amount as of March 31, 2009 | $ | 158.6 | $ | 100.7 | $ | 222.3 | $ | 14.1 | $ | 0.1 | $ | 337.2 | ||||||||||||
Amortization | — | — | (17.8 | ) | (2.0 | ) | — | (19.8 | ) | |||||||||||||||
Adjustment to initial purchase price allocation (1) | 0.2 | — | 0.6 | — | — | 0.6 | ||||||||||||||||||
Currency translation adjustment | 1.1 | 0.8 | 0.1 | 0.3 | — | 1.2 | ||||||||||||||||||
Net carrying amount as of March 31, 2010 | $ | 159.9 | $ | 101.5 | $ | 205.2 | $ | 12.4 | $ | 0.1 | $ | 319.2 | ||||||||||||
Amortization | $ | — | $ | — | $ | (17.9 | ) | $ | (2.0 | ) | $ | — | $ | (19.9 | ) | |||||||||
Currency translation adjustment | 0.4 | 0.2 | 0.2 | — | — | 0.4 | ||||||||||||||||||
Net carrying amount as of March 31, 2011 | $ | 160.3 | $ | 101.7 | $ | 187.5 | $ | 10.4 | $ | 0.1 | $ | 299.7 | ||||||||||||
Consolidated | ||||||||||||||||||||||||
Net carrying amount as of March 31, 2009 | $ | 1,010.9 | $ | 292.6 | $ | 419.3 | $ | 24.4 | $ | 0.1 | $ | 736.4 | ||||||||||||
Amortization | — | (1.2 | ) | (44.8 | ) | (3.7 | ) | — | (49.7 | ) | ||||||||||||||
Adjustment to initial purchase price allocation | 0.2 | — | 0.6 | — | — | 0.6 | ||||||||||||||||||
Currency translation adjustment | 1.1 | 0.8 | 0.1 | 0.3 | — | 1.2 | ||||||||||||||||||
Net carrying amount as of March 31, 2010 | $ | 1,012.2 | $ | 292.2 | $ | 375.2 | $ | 21.0 | $ | 0.1 | $ | 688.5 | ||||||||||||
Amortization | $ | — | $ | — | $ | (45.1 | ) | $ | (3.5 | ) | $ | — | $ | (48.6 | ) | |||||||||
Acquisitions | 3.6 | — | 4.4 | — | — | 4.4 | ||||||||||||||||||
Currency translation adjustment | 0.4 | 0.2 | 0.2 | — | — | 0.4 | ||||||||||||||||||
Net carrying amount as of March 31, 2011 | $ | 1,016.2 | $ | 292.4 | $ | 334.7 | $ | 17.5 | $ | 0.1 | $ | 644.7 | ||||||||||||
| (1) | Represents adjustments to the Company’s initial purchase price allocation related to the Fontaine Acquisition in fiscal 2009. |
F-18
The gross carrying amount, accumulated amortization and net carrying amount for each major class of identifiable intangible assets as of March 31, 2010 and March 31, 2011 are as follows (in millions):
| March 31, 2010 | ||||||||||||||||
| Weighted Average Useful Life | Gross Carrying Amount | Accumulated Amortization | Net Carrying Amount | |||||||||||||
Intangible assets subject to amortization: | ||||||||||||||||
Patents | 10 Years | $ | 36.3 | $ | (15.3 | ) | $ | 21.0 | ||||||||
Customer relationships (including distribution network) | 12 Years | 529.5 | (154.3 | ) | 375.2 | |||||||||||
Non-compete | 2 Years | 0.1 | — | 0.1 | ||||||||||||
Intangible assets not subject to amortization—trademarks and tradenames | 292.2 | — | 292.2 | |||||||||||||
| $ | 858.1 | $ | (169.6 | ) | $ | 688.5 | ||||||||||
| March 31, 2011 | ||||||||||||||||
| Weighted Average Useful Life | Gross Carrying Amount | Accumulated Amortization | Net Carrying Amount | |||||||||||||
Intangible assets subject to amortization: | ||||||||||||||||
Patents | 10 Years | $ | 36.3 | $ | (18.8 | ) | $ | 17.5 | ||||||||
Customer relationships (including distribution network) | 12 Years | 534.1 | (199.4 | ) | 334.7 | |||||||||||
Non-compete | 2 Years | 0.1 | — | 0.1 | ||||||||||||
Intangible assets not subject to amortization—trademarks and tradenames | 292.4 | — | 292.4 | |||||||||||||
| $ | 862.9 | $ | (218.2 | ) | $ | 644.7 | ||||||||||
Intangible asset amortization expense totaled $48.9 million, $49.7 million, and $48.6 million for the years ended March 31, 2009, 2010 and 2011, respectively.
The Company expects to recognize amortization expense on the intangible assets subject to amortization of $47.9 million in 2006. fiscal year 2012, and $47.5 million in fiscal year 2013, 2014, 2015, and 2016, respectively.
9. Other Current Liabilities
Other current liabilities are summarized as follows (in millions):
| March 31, 2010 | March 31, 2011 | |||||||
Taxes, other than income taxes | 4.6 | 6.3 | ||||||
Sales rebates | 12.0 | 16.1 | ||||||
Restructuring obligations (1) | 3.3 | 0.9 | ||||||
Customer advances | 12.4 | 11.4 | ||||||
Product warranty (2) | 10.7 | 8.6 | ||||||
Commissions | 6.6 | 6.4 | ||||||
Risk management reserves (3) | 8.6 | 13.0 | ||||||
Deferred income taxes | 2.1 | 3.1 | ||||||
Other | 22.9 | 20.3 | ||||||
| $ | 83.2 | $ | 86.1 | |||||
| (1) | See more information related to the restructuring obligations balance within Note 4. |
F-19
| (2) | See more information related to the product warranty obligations balance within Note 2. |
| (3) | Includes projected liabilities related to the Company’s deductible portion of insured losses arising from automobile, general and product liability claims. |
10. Long-Term Debt
Long-term debt is summarized as follows (in millions):
| March 31, 2010 | March 31, 2011 | |||||||
8.50% Senior notes due 2018 | $ | — | $ | 1,145.0 | ||||
Term loans | 763.5 | 761.5 | ||||||
11.75% Senior subordinated notes due 2016 | 300.0 | 300.0 | ||||||
PIK toggle senior indebtedness due 2013 (1) | 86.3 | 93.2 | ||||||
8.875% Senior notes due 2016 | 79.0 | 2.0 | ||||||
9.50% Senior notes due 2014 (2) | 979.2 | — | ||||||
Other | 7.5 | 12.4 | ||||||
Total | 2,215.5 | 2,314.1 | ||||||
Less current portion (3) | 5.3 | 104.2 | ||||||
Long-term debt | $ | 2,210.2 | $ | 2,209.9 | ||||
| (1) | Includes an unamortized bond issue discount of $0.6 million and $0.4 million at March 31, 2010 and March 31, 2011, respectively. See (3) below. |
| (2) | Includes a net unamortized bond issue discount of $12.1 million at March 31, 2010. |
| (3) | Includes $93.2 million of PIK toggle senior indebtedness due 2013. On May 6, 2011, Rexnord received a dividend from its subsidiaries, substantially all of which has been or will be used to retire outstanding PIK toggle senior indebtedness due 2013. On May 13, 2011, we prepaid $53.7 million in principal amount of this indebtedness, and have commenced procedures to extinguish the remaining balance of the Company’s PIK toggle senior indebtedness at face value in June 2011. As such, this obligation is presented within the current portion of long-term debt on the consolidated balance sheet. |
The adjustmentCompany’s outstanding debt was issued by Rexnord, RBS Global, and various subsidiaries of RBS Global. Rexnord is the issuer of the PIK toggle senior indebtedness and RBS Global, as well as its wholly-owned subsidiary Rexnord LLC, are the co-issuers of the term loans, senior notes and senior subordinated notes.
Rexnord PIK Toggle Senior Indebtedness Due 2013
On March 2, 2007, the Company entered into a Credit Agreement (the “PIK Loan Credit Agreement”) with various lenders which provided $449.8 million ($459.0 million of debt financing, net of a $9.2 million original issue discount) that was primarily used to pay a distribution to its stockholders as well as to holders of fully vested rollover options. The PIK Toggle Loans issued pursuant to the minimum pension liabilityPIK Loan Credit Agreement are due March 1, 2013 and bear interest at a floating rate. The floating rate is equal to adjusted LIBOR (the interest rate per annum equal to the product of (a) the LIBOR in effect and (b) Statutory Reserves) plus 7.0%.
On August 8, 2008, the Company completed an exchange offer with respect to the PIK Toggle Loans. Approximately $460.8 million of the then outstanding PIK Toggle Loans were tendered and exchanged for PIK Toggle Senior Notes due 2013 (the “PIK Toggle Notes”). The PIK Toggle Loans that were not tendered for exchange continue to be governed by the terms and conditions in the PIK Loan Credit Agreement while the PIK Toggle Loans tendered and exchanged for PIK Toggle Notes are governed by the terms and conditions of an indenture. The PIK Toggle Notes were issued under an indenture between Rexnord and Wells Fargo Bank, N.A, as trustee (the “indenture”), which is capable of being qualified under the Trust Indenture Act of 1939. The terms
F-20
of the PIK Toggle Notes are substantially the same as the terms of the PIK Toggle Loans in all material respects (including their maturity, variable interest rates and our ability to make certain interest payments in kind, which the Company refers to as “PIK Interest,” rather than in cash), except that (1) interest on the PIK Toggle Notes is payable semi-annually (generally at the three month LIBOR in effect for the interest period plus 7.0% per annum) while interest on the PIK Toggle Loans is payable quarterly (also generally at the three month LIBOR in effect for the interest period plus 7.0% per annum), (2) the PIK Toggle Notes were issued pursuant to the indenture, (3) a change of control is not an event of default under the PIK Toggle Notes but instead requires us to make an offer to purchase the PIK Toggle Notes at a price of 101% of their principal amount plus accrued and unpaid interest, and (4) certain other provisions have been adjusted as required or permitted by Section 6.13 of the PIK Loan Credit Agreement. None of our subsidiaries currently guarantee any of our indebtedness, so there are no guarantors of the PIK Toggle Notes or of the PIK Toggle Loans. The PIK Toggle Notes and the PIK Toggle Loans are required to be guaranteed by any of our domestic subsidiaries which in the future may guarantee our indebtedness. The Company refers to the PIK Toggle Loans and the PIK Toggle Notes collectively as the PIK toggle senior indebtedness.
Fiscal 2010 Purchases and Extinguishment of PIK toggle senior indebtedness
During fiscal 2010, the Company purchased and extinguished $67.4 million of outstanding face value PIK toggle senior indebtedness due 2013 for $36.5 million in cash. As a result, the Company recognized a $30.3 million gain during the year ended March 31, 2010, which was measured based on the difference between the cash paid and the net carrying amount of the debt (the net carrying amount of the debt included unamortized original issue discount of $0.6 million, unamortized debt issuance costs of $0.6 million, and $0.3 million of accrued interest) along with the forgiveness of $0.4 million of accrued interest.
April 2009 Exchange Offer
On April 29, 2009, the Company finalized the results of a debt exchange offer to exchange (a) new RBS Global 9.50% Senior Notes due 2014 (the “2009 9.50% Notes”) for any and all of RBS Global’s 8.875% Senior Notes due 2016 (the “8.875% Notes”), (b) 2009 9.50% Notes for any and all of the PIK Toggle Notes (together with the 8.875% Notes, the “Old Notes”), and (c) 2009 9.50% Notes for any and all of the PIK Toggle Loans outstanding under the PIK Loan Credit Agreement.
Upon settlement of the April 2009 exchange offer, (i) approximately $71.0 million principal amount of 8.875% Notes, (ii) approximately $235.7 million principal amount of PIK Toggle Notes, and (iii) approximately $7.9 million principal amount of PIK Toggle Loans were exchanged for 2009 9.50% Notes. Based on the principal amount of Old Notes and PIK Toggle Loans validly tendered and accepted, approximately $196.3 million of aggregate principal of the 2009 9.50% Notes was issued in accumulated other comprehensive lossexchange for such Old Notes and PIK Toggle Loans (excluding a net original issue discount of $20.6 million). In addition, RBS Global incurred $11.1 million of transaction costs ($0.2 million of these transaction costs were issued in the form of 2009 9.50% Notes) to complete the exchange offer, of which $5.1 million was capitalized as deferred financing costs.
The Company accounted for the April 2009 exchange offer pursuant to ASC 470-50Debt Modification and Extinguishments (“ASC 470-50”). As a result of the April 2009 exchange offer, the Company recognized a gain of $137.5 million on the extinguishment of PIK Toggle Notes and PIK Toggle Loans. The gain on extinguishment of $137.5 million relates to the extinguishment of $235.7 million of outstanding face value PIK Toggle Notes and $7.9 million of outstanding face value of PIK Toggle Loans and is measured based on the difference between the fair market value of the 2009 9.50% Notes issued of $104.5 million and the net carrying amount of the debt (the net carrying amount of the debt includes unamortized original issue discount of $2.5 million, unamortized debt issuance costs of $2.2 million and $3.1 million of accrued interest). In connection with the $235.7 million of PIK Toggle Notes and $7.9 million of PIK Toggle Loans tendered in the exchange, RBS Global issued approximately $130.6 million of face value of 2009 9.50% Notes, net of a $26.1 million original issue discount.
F-21
Pursuant to ASC 470-50, the exchange of RBS Global’s 8.875% Notes did not constitute a significant modification of debt (that is, the change in the present value of expected cash flows under the terms of the modified debt as compared to the present value of expected cash flows under the original debt was less than 10%). Therefore, the carrying value of the $71.0 million in 8.875% Notes tendered was carried-forward as the net carrying value of the 2009 9.50% Notes, inclusive of a $5.5 million original issue premium. The premium is a result of the difference between the $71.0 million carrying value of the 8.875% notes and the $65.5 million of corresponding face value of the 2009 9.50% Notes issued with respect to this component of the exchange. This premium is required to be amortized as a direct chargereduction to shareholders’ equity, net of related tax effect.
Note 7—Income Taxes
Earnings from continuing operations, before income taxes, consistsinterest expense (via the effective interest method) over the life of the following:2009 9.50% Notes in conformity with the standard.
| For the Fiscal Years Ended September 30, | |||||||||
| 2004 | 2005 | 2006 | |||||||
| (in millions) | |||||||||
United States | $ | 49.0 | $ | 47.0 | $ | 67.3 | |||
Foreign | 29.2 | 21.0 | 13.6 | ||||||
| $ | 78.2 | $ | 68.0 | $ | 80.9 | ||||
After and including the April 2009 exchange offer, RBS Global had issued a total of $991.3 million in aggregate principal amount of 9.50% senior notes which bear interest at a rate of 9.50% per annum and which will mature on August 1, 2014. This amount included $196.3 million of aggregate principal related to the aforementioned debt exchange. The provision (benefit) for income taxes attributable to our earnings (loss) from continuing operations before income taxes consiststerms of the following:2009 9.50% Notes and RBS Global’s 2006 9.50% Notes are substantially similar with the exception of interest payment dates. See “RBS Global, Inc. and Subsidiaries Long-Term Debt—Senior Notes and Senior Subordinates Notes” section below for subsequent transactions related to the 2006 9.50% Notes and the 2009 9.50% Notes.
| For the Fiscal Years Ended September 30, | |||||||||||
| 2004 | 2005 | 2006 | |||||||||
| (in millions) | |||||||||||
Current: | |||||||||||
Federal | $ | 10.8 | $ | (7.1 | ) | $ | 22.7 | ||||
State | 1.6 | 2.5 | 2.2 | ||||||||
Foreign | 15.4 | 9.9 | (6.8 | ) | |||||||
Deferred | 2.1 | 4.7 | 19.0 | ||||||||
| $ | 29.9 | $ | 10.0 | $ | 37.1 | ||||||
The tax provisionAs of March 31, 2010 and March 31, 2011, the interest rate was 7.25% and 7.31% for 2006 includesboth the recognitionPIK Toggle Notes and PIK Toggle Loans, respectively. Pursuant to the terms of a valuation allowance against U.K. deferred taxesthe PIK Loan Credit Agreement and the indenture, the Company has elected to pay interest in-kind and has accordingly paid interest with additional PIK Toggle Notes and PIK Toggle Loans, as the case may be, on pre-determined interest rate reset dates. During fiscal 2009, 2010 and 2011, $44.5 million, $8.2 million and $6.6 million, respectively, of interest was paid in the amountform of $15.9 millionadditional PIK toggle senior indebtedness. On May 6, 2011, Rexnord received a dividend from its subsidiaries, substantially all of which has been or will be used to retire outstanding PIK toggle senior indebtedness due 2013; we have commenced procedures to continuing pretax lossesextinguish the remaining balance of the Company’s PIK toggle senior indebtedness at face value in our U.K. operations. June 2011.
The provisionPIK toggle senior indebtedness is an unsecured obligation. The governing instruments of the PIK toggle senior indebtedness contain customary affirmative and negative covenants including: (i) limitations on the incurrence of indebtedness and the issuance of disqualified and preferred stock, (ii) limitations on restricted payments, dividends and certain other payments, (iii) limitations on asset sales, (iv) limitations on transactions with affiliates, (v) requirements as to the addition of future guarantors in certain circumstances and (vi) limitations on liens. Notwithstanding these covenants, the PIK toggle senior indebtedness significantly restricts the payment of dividends and also limits the incurrence of additional indebtedness and the issuance of certain forms of equity. However, the Company may incur additional indebtedness and issue certain forms of equity if immediately prior to the consummation of such events, the fixed charge coverage ratio for 2006 also includes the reversalmost recently ended four full fiscal quarters for which internal financial statements are available, as defined in the PIK Loan Credit Agreement, would have been at least 1.75 to 1.00, or, 2.00 to 1.00 in the case of $14.0 millionRBS Global, Inc. and subsidiaries, including the pro forma application of reserves against Italian income tax refunds. We received $7.9 million in refundsthe additional indebtedness or equity issuance. The instruments governing the PIK toggle senior indebtedness due 2013, including the covenants and $1.6 million in interest fromrestrictions above, will be extinguished upon the Italian governmentfull redemption of the PIK toggle senior indebtedness due 2013, which is expected to be completed in the first quarter of fiscal 2007.
Jacuzzi Brands,RBS Global, Inc. and Subsidiaries Long-Term Debt
NotesSenior Secured Credit Facility
On October 5, 2009, RBS Global entered into an Amended and Restated Credit Agreement (the “RBS Credit Agreement”) amending and restating the credit agreement dated as of July 21, 2006. The senior secured credit facilities provided under the RBS Credit Agreement are funded by a syndicate of banks and other financial institutions consisting of: (i) a $810.0 million term loan facility with a maturity date of July 19, 2013 and (ii) a $150.0 million revolving credit facility with a maturity date of July 20, 2012 and borrowing capacity available for letters of credit and for borrowing on same-day notice, referred to Consolidated Financial Statements—(Continued)as swingline loans.
F-22
As of March 31, 2011, RBS Global’s outstanding borrowings under the term loan facility were apportioned between two primary tranches: a $570.0 million term loan B1 facility and a $191.5 million term loan B2 facility. Borrowings under the term loan B1 facility accrue interest, at RBS Global’s option, at the following rates per annum: (i) 2.50% plus LIBOR, or (ii) 1.50% plus the Base Rate (which is defined as the higher of the Federal funds rate plus 0.5% or the Prime rate). Borrowings under the B2 facility accrue interest, at RBS Global’s option, at the following rates per annum: (i) 2.25% plus LIBOR or (ii) 1.00% plus the Base Rate (which is defined as the higher of the Federal funds rate plus 0.5% or the Prime rate). The componentsweighted average interest rate on the outstanding term loans at March 31, 2011 was 3.67%.
Borrowings under RBS Global’s $150.0 million revolving credit facility accrue interest, at RBS Global’s option, at the following rates per annum: (i) 1.75% plus LIBOR, or (ii) 0.75% plus the Base Rate (which is defined as the higher of deferred income tax assetsthe Federal funds rate plus 0.5% or the Prime rate). All amounts outstanding under the revolving credit facility will be due and liabilities are as follows:
| At September 30, | ||||||||
| 2005 | 2006 | |||||||
| (in millions) | ||||||||
Deferred tax assets: | ||||||||
Accruals and allowances | $ | 41.5 | $ | 33.4 | ||||
Post-employment benefits | 7.7 | 6.1 | ||||||
Property, plant and equipment | 3.0 | — | ||||||
Inventory | 3.0 | 2.7 | ||||||
Other | 1.6 | 0.9 | ||||||
Foreign tax credits | 18.8 | 17.9 | ||||||
Expected benefit from disposal plans & capital loss carryforwards | 119.0 | 120.6 | ||||||
Gross deferred tax assets | 194.6 | 181.6 | ||||||
Valuation allowance | (133.5 | ) | (133.0 | ) | ||||
Total deferred tax assets | 61.1 | 48.6 | ||||||
Deferred tax liabilities: | ||||||||
Net pension assets | 34.2 | 45.6 | ||||||
Property, plant and equipment | — | 0.3 | ||||||
Deductible goodwill | 4.6 | 5.4 | ||||||
Total deferred tax liabilities | 38.8 | 51.3 | ||||||
Net deferred tax assets (liabilities) | $ | 22.3 | $ | (2.7 | ) | |||
We have established valuation allowances principally related to deferred tax assets resulting frompayable in full, and the losses recognizedcommitments thereunder will terminate, on July 20, 2012. In addition, $31.4 million and $28.3 million of the revolving credit facility was considered utilized in connection with disposals announcedoutstanding letters of credit at March 31, 2010 and March 31, 2011, respectively.
In addition to paying interest on outstanding principal under the senior secured credit facilities, RBS Global is required to pay a commitment fee to the lenders under the revolving credit facility in 2001, foreign losses (ordinary)respect to the unutilized commitments thereunder at a rate equal to 0.50% per annum (subject to reduction upon attainment and U.S. foreign tax credits reflectingmaintenance of a certain senior secured leverage ratio). RBS Global also must pay customary letter of credit and agency fees.
As of March 31, 2011, the uncertainty ofremaining mandatory principal payments prior to maturity on both the future realization of these assets. At September 30, 2005term loan B1 and 2006, we had approximately $200.1B2 facilities are $1.2 million and $204.4$4.5 million, respectively, in capital loss carryforwards inrespectively. RBS Global has fulfilled all mandatory principal payments prior to maturity on the U.S. for which, tax effected, we have recorded valuation allowances of $74.0 million and $75.6 million on September 30, 2005 and 2006, respectively. These capital loss carryforwards expire on September 30, 2007. We incurred a capital lossB1 facility through March 31, 2013. Principal payments of $0.5 million are scheduled to be made at the end of each calendar quarter until June 30, 2013 on the B2 facility. RBS Global may voluntarily repay outstanding loans under the senior secured credit facilities at any time without premium or penalty, other than customary “breakage” costs with respect to Eurocurrency loans.
The RBS Credit Agreement, among other things: (i) allows for one or more future issuances of secured notes, which may include, in each case, indebtedness secured on a pari passu basis with the obligations under the RBS Credit Agreement, so long as, in each case, among other things, an agreed amount of the net cash proceeds from any such issuance are used to prepay term loans under the RBS Credit Agreement at par; (ii) subject to the requirement to make such offers on a pro rata basis to all lenders, allows RBS Global to agree with individual lenders to extend the maturity of their term loans or revolving commitments, and for RBS Global to pay increased interest rates or otherwise modify the terms of their loans or revolving commitments in connection with such an extension; and (iii) allows for one or more future issuances of additional secured notes, which may include, in each case, indebtedness secured on a pari passu basis with the saleobligations under the RBS Credit Agreement, in an amount not to exceed the amount of incremental facility availability under the RBS Credit Agreement.
The RBS Credit Agreement also contains a majority interestnumber of typical covenants that, among other things, constrain, subject to certain fully-negotiated exceptions, RBS Global’s ability, and the ability of RBS Global’s subsidiaries, to: sell assets; incur additional indebtedness; repay other indebtedness; pay dividends and distributions, repurchase its capital stock, or make payments, redemptions or repurchases in Rexair for which, tax effected, we have recorded a valuation reserverespect certain indebtedness (including the senior notes and senior subordinated notes); create liens on assets; make investments, loans, guarantees or advances; make certain acquisitions; engage in certain mergers or consolidations; enter into sale-and-leaseback transactions; engage in certain transactions with affiliates; amend certain material agreements governing its indebtedness; make capital expenditures; enter into hedging agreements; amend its organizational documents; change the business conducted by it and its subsidiaries; and enter into agreements that restrict dividends from subsidiaries. RBS Global’s senior secured credit facilities limit RBS Global’s maximum senior secured bank leverage ratio to 4.25 to 1.00. As of $0.2 million at September 30, 2005March 31, 2011, the senior secured bank leverage ratio was 1.16x to 1.00.
F-23
Senior Notes and 2006. This capital loss carryforward will expire in 2010. We recorded a deferred tax assetSenior Subordinated Notes
Outstanding Tranches of $22.7Notes
At March 31, 2011, RBS Global had outstanding $1,145.0 million in connection withaggregate principal 8.50% Notes due 2018 (the “8.50% Notes”) and $300.0 million in aggregate principal 11.75% Senior Subordinated Notes due 2016 (the “11.75% Notes”). RBS Global also had outstanding $2.3 million in aggregate principal under other notes, consisting of the sale8.875% Notes and 10.125% senior subordinated notes due 2012.
The 8.50% Notes bear interest at a rate of Eljer8.50% per annum, payable on each May 1 and November 1, and will mature on May 1, 2018. The 11.75% Notes bear interest at a rate of 11.75% per annum, payable on each February 1 and August 1, and will mature on August 1, 2016.
The indenture governing the 8.50% Notes permits optional redemption of the notes, generally on or after May 1, 2014, on specified terms and at specified prices. In addition, the indenture provides that, prior to May 1, 2014, the outstanding 8.50% Notes may be redeemed at RBS Global’s option in 2005. A full valuation allowancewhole at any time or in part from time to time at a redemption price equal to the sum of $22.7 million was established against this asset since it relates to(i) 100% of the principal amount of the notes redeemed plus (ii) a future capital loss. We have foreign tax credit carryforwards for which we established full valuation allowances of $18.8 million and $17.9 million on September 30, 2005 and 2006, respectively. A substantial portion of these foreign tax credits will expire in 2011 and 2013. We recognized state loss carryforwards of $361.0 million and $391.0 million as of September 30, 2005 and 2006, respectively. These state losses result in tax benefits of $13.6 and $14.6 million at September 30, 2005 and September 30, 2006, respectively, for which we have established valuation allowances of $11.5 and $11.4 million on September 30, 2005 and 2006, respectively. We have U.K. loss carryforwards for which we have established full valuation allowance of $6.3 million and $4.3 million, on September 30, 2005 and 2006 respectively. We recognized Brazilian loss carryforwards of $5.1 million on September 30, 2006 for which, tax effected, we have recorded a valuation allowances of $0.9 million. We had Alternative Minimum Tax credit carryforwards of $1.7 million and $1.6 million at September 30, 2005 and 2006, respectively. These credits have no expiration date.
Jacuzzi Brands, Inc.
Notes to Consolidated Financial Statements—(Continued)
We recorded a $5.9 million tax benefit in fiscal 2005 as a result of a Federal tax audit of our consolidated tax returns for the fiscal years 1998 through 2002. The benefit resulted from agreed upon computational adjustments. We filed an appeal with the IRS in September 2005 regarding various issues related to this audit that we could not reach agreement on. This appeal is still in process and we have not yet reached a final settlement on the issues. We have recorded reserves that are adequate to cover any assessment if our appeals are rejected. Several states and various other countries have examinations either“make whole” premium specified in the planning stages or currently underway. A $2.9 million tax benefit was recognized in 2005 uponindenture, and (iii) accrued and unpaid interest and additional interest, if any, to the completion of a Federal tax audit of one of our subsidiaries. We recorded interest income of $2.5 million in fiscal 2004 as a resultredemption date. In the case of the settlement of a previous IRS audit.
The number of years with open tax audits varies depending11.75% Notes, the indenture permits optional redemption on or after August 1, 2011 at the tax jurisdiction. A number of years may elapse before a particular matter is audited and finally resolved. While it is often difficult to predict the final outcome or the timing of resolution of any particular tax matter, we believe that our financial statements reflect the probable outcome of known tax contingencies.
The deferred tax balances have been classifiedredemption prices set forth in the balance sheets as follows:
| At September 30, | ||||||||
| 2005 | 2006 | |||||||
| (in millions) | ||||||||
Current assets | $ | 27.9 | $ | 25.6 | ||||
Current liabilities | — | — | ||||||
Net current assets | 27.9 | 25.6 | ||||||
Non-current assets | 33.2 | 23.0 | ||||||
Non-current liabilities | (38.8 | ) | (51.3 | ) | ||||
Net non-current liabilities | (5.6 | ) | (28.3 | ) | ||||
Net deferred tax assets (liabilities) | $ | 22.3 | $ | (2.7 | ) | |||
Our effective tax rate is based on expected income, statutory tax ratesindenture plus accrued and tax planning opportunities availableunpaid interest. In addition, the indenture provides that, prior to usAugust 1, 2011, the outstanding 11.75% Notes may be redeemed at RBS Global’s option in whole at any time or in part from time to time at a redemption price equal to the sum of (i) 100% of the principal amount of the notes redeemed plus (ii) a “make whole” premium specified in the various jurisdictions in which we operate. The tax rate is sensitiveindenture, and (iii) accrued and unpaid interest and additional interest, if any, to the jurisdiction whereredemption date. RBS Global must provide specified prior notice for redemption of the income is earned since different jurisdictions will have different statutory tax rates. Significant judgment is required in determining our effective tax rate and in evaluation of our tax provisions. Despite our belief that our tax return positions are fully supportable, we estimate tax exposures and establish accruals when in our judgment we believe that certain positions are likely to be challenged and that we may not succeed. We adjust these reserves in light of changing facts and circumstances, such as the progress of a tax audit.
Jacuzzi Brands, Inc.
Notes to Consolidated Financial Statements—(Continued)
The following is a reconciliation of income taxes at the federal statutory rate of 35% to the provision for (benefit from) income taxes attributable to continuing operations:
| For the Fiscal Years Ended September 30, | ||||||||||||
| 2004 | 2005 | 2006 | ||||||||||
| (in millions) | ||||||||||||
Federal tax provision computed at the statutory rate | $ | 27.4 | $ | 23.8 | $ | 28.3 | ||||||
Foreign income tax differential | 0.5 | 2.3 | 3.2 | |||||||||
State income taxes (net of federal benefit) | 1.7 | 2.1 | 2.0 | |||||||||
Rexair disposition | — | (8.6 | ) | (0.2 | ) | |||||||
Resolution of tax contingencies | — | (8.8 | ) | — | ||||||||
Other non-deductible items | 0.4 | 0.2 | 0.1 | |||||||||
Changes in valuation allowances | 0.6 | (0.6 | ) | 1.0 | ||||||||
U.K. deferred tax reserve | — | — | 15.9 | |||||||||
Italian tax refunds | — | — | (14.0 | ) | ||||||||
Other, net | (0.7 | ) | (0.4 | ) | 0.8 | |||||||
| $ | 29.9 | $ | 10.0 | $ | 37.1 | |||||||
Income taxes paid during 2004, 2005 and 2006 were $16.9 million, $13.9 million and $25.9 million, respectively.
Note 8—Employee Benefit Plans
Retirement Savings Plans
We have one 401(k) retirement savings plan that allows eligible employees to contribute up to 60% of their salaries, commissions and bonuses, up to $14,000 annually, to the plan on a pretax basisnotes in accordance with the provisions of Section 401(k)indentures.
In addition, at any time (which may be more than once) on or prior to May 1, 2013, RBS Global has the right to redeem up to 35% of the Internal Revenue Code. Matching contributions of common stock or cash that are made into the plan are equivalent to 50%principal amount of the first 6% of an employee’s contributions. During 2004, 2005 and 2006, $1.4 million, $1.3 million and $1.3 million, respectively, was recognized as compensation expense under these programs.
Accounting for Stock-based Compensation
We maintain incentive stock plans that provide for grants of stock options and restricted stock awards to our directors, officers and key employees. The stock plans are described more fully below.
Adoption of New Accounting Guidance and Transition
Prior to October 2, 2005, we accounted for these plans under the recognition and measurement provisions of APB Opinion No. 25,Accounting for Stock Issued to Employees, and related Interpretations, (“APB 25”) as permitted by FASB Statement No. 123,Accounting for Stock-Based Compensation (“SFAS No. 123”). No compensation cost was recognized in the Statement of Operations prior to October 2, 2005 related to stock option grants as they all had an exercise8.50% Notes at a redemption price equal to the market value108.50% of the underlying commonface amount thereof, plus accrued and unpaid interest and additional interest, if any, with the net proceeds of one or more equity offerings so long as at least 65% of the aggregate principal amount of the 8.50% Notes issued remains outstanding after each redemption and such redemption occurs within a specified period after the equity offering.
Notwithstanding the above, RBS Global’s ability to make payments on, redeem, repurchase or otherwise retire for value, prior to the scheduled repayment or maturity, the senior notes or senior subordinated notes may be constrained or prohibited under the above-referenced senior secured credit facilities and, in the case of the senior subordinated notes, by the provisions in the indentures governing the senior notes.
The senior notes and senior subordinated notes are unsecured obligations. The senior subordinated notes are subordinated in right of payment to all existing and future senior indebtedness. The indentures governing the senior notes and senior subordinated notes permit RBS Global to incur all permitted indebtedness (as defined in the applicable indenture) without restriction, which includes amounts borrowed under the senior secured credit facilities. The indentures also allow RBS Global to incur additional debt as long as it can satisfy the fixed charge coverage ratio of the indenture after giving effect thereto on a pro forma basis.
The indentures governing the 8.50% Notes and 11.75% Notes contain customary covenants, among others, limiting dividends, investments, purchases or redemptions of stock, restricted payments, transactions with affiliates and mergers and sales of assets, and requiring RBS Global to make an offer to purchase notes upon the occurrence of a change in control, as defined in those indentures. These covenants are subject to a number of important qualifications. For example, the indentures do not impose any limitation on the dateincurrence by RBS Global of grant.liabilities that are not considered “indebtedness” under the indentures, such as certain sale/leaseback transactions; nor do the indentures impose any limitation on the amount of liabilities incurred by RBS Global’s subsidiaries, if any, that might be designated as “unrestricted subsidiaries” (as defined in the applicable indenture). The restricted stock awards granted under those plansindentures governing the other notes do not contain material restrictive covenants.
F-24
The indentures governing the senior notes and senior subordinated notes permit optional redemption of the notes on certain terms at certain prices, and described above.
April 2009 Exchange Offer
See “Rexnord PIK Toggle Senior Indebtedness due 2013—April 2009 Exchange Offer” for information related to a debt exchange offer involving various tranches of notes issued by RBS Global.
April 2010 Cash Tender Offers and $1,145.0 Million Note Offering
On May 5, 2010, RBS Global finalized the results of the cash tender offers and consent solicitations with respect to any and all of its outstanding 2006 9.50% Notes, 2009 9.50% Notes and 8.875% Notes. Upon completion of the tender offers, 99.7% of the holders had tendered their notes and consented to the proposed amendments. At closing, (i) $0.9 million aggregate principal amount of the 2006 9.50% Notes, (ii) $13,000 aggregate principal amount of the 2009 9.50% Notes and (iii) $2.0 million aggregate principal amount of the 8.875% Notes had not been tendered, and remained outstanding.
In connection with the April 2010 tender offers and consent solicitations, on April 20, 2010, RBS Global entered into supplemental indentures by and among RBS Global, each of the guarantors party thereto, and Wells Fargo Bank, National Association, as Trustee, pursuant to which the 2006 9.50% Notes, 2009 9.50% Notes and 8.875% Notes were measuredissued (as amended and supplemented, the “Supplemental Indentures”). The Supplemental Indentures amended the terms governing the respective notes to, among other things, eliminate substantially all of the material restrictive covenants, eliminate or modify certain events of default and eliminate or modify related provisions in the respective indentures governing the notes.
On April 28, 2010, RBS Global issued the 8.50% Notes in a private offering. The proceeds from the offering were used to fund (including transaction costs) the cash tender offers discussed above. The 8.50% Notes will mature on May 1, 2018, pursuant to an indenture, dated as of April 28, 2010, by and among RBS Global, the guarantors named therein, and Wells Fargo Bank, National Association, as Trustee. RBS Global pays interest on the 8.50% Notes at fair value,8.50% per annum, semiannually on May 1 and November 1 of each year.
F-25
RBS Global accounted for the cash tender offers and the issuance of the 8.50% Notes in accordance with ASC 470-50. Pursuant to this guidance, the cash tender offers were accounted for as an extinguishment of debt. In connection with the offering, RBS Global incurred an increase in long-term debt of approximately $89.5 million. RBS Global recognized a $100.8 million loss on the debt extinguishment in fiscal 2011, which was determinedcomprised of a bond tender premium paid to lenders, as well as the closing market valuenon-cash write-off of deferred financing fees and net original issue discount associated with the stock on the dateextinguished debt. Additionally, RBS Global capitalized approximately $14.6 million of the grant, andthird party transaction costs, which are being amortized over the vesting period in tranches consistent with our previous accounting policylife of recognizingthe 8.50% Notes as interest expense for awards with graded vesting underusing the expense attribution method described in FASB Interpretation No. 28,Accounting for Stock Appreciation Rightseffective interest method. Below is a summary of the transaction costs and other Variable Stock Option or Award Plans (“FIN 28”).
Jacuzzi Brands, Inc.
Notes to Consolidated Financial Statements—(Continued)offering expenses recorded along with their corresponding pre-tax financial statement impact (in millions):
| Financial Statement Impact | ||||||||||||||||
| Balance Sheet - Debit (Credit) | Statement of Operations | |||||||||||||||
| Deferred Financing Costs (1) | Original Issue Discount (2) | Expense (3) | Total | |||||||||||||
Cash transaction costs: | ||||||||||||||||
Third party transaction costs | $ | 14.6 | $ | — | $ | — | $ | 14.6 | ||||||||
Bond tender premiums (paid to lenders) | — | — | 63.5 | 63.5 | ||||||||||||
Total expected cash transaction costs | 14.6 | — | 63.5 | $ | 78.1 | |||||||||||
Non-cash write-off of unamortized amounts: | ||||||||||||||||
Deferred financing costs | (25.4 | ) | — | 25.4 | ||||||||||||
Net original issue discount | — | (11.9 | ) | 11.9 | ||||||||||||
Net financial statement impact | $ | (10.8 | ) | $ | (11.9 | ) | $ | 100.8 | ||||||||
| (1) | Recorded as a component of other assets within the consolidated balance sheet. |
| (2) | Recorded as a reduction in the face value of long-term debt within the consolidated balance sheet. |
| (3) | Recorded as a component of other non-operating expense within the consolidated statement of operations. |
Effective October 2, 2005, we adoptedSeptember 2010 Redemption of 9.50% Senior Notes
Subsequent to the fair value recognition provisionsApril 2010 tender offers and consent solicitations, on September 24, 2010, RBS Global completed a redemption of FASB Statement No. 123R,Share-Based Payment,the then outstanding $0.9 million aggregate principal amount of the 2006 9.50% Notes and related interpretations (“SFAS No. 123R”) usingall of the modified—prospective transition method. Underthen outstanding $13,000 aggregate principal amount of the 2009 9.50% Notes, at a redemption price of 104.75% of principal amount outstanding plus accrued and additional interest applicable to the redemption date.
Parent Debt
In addition, Rexnord relies heavily on RBS Global for the purpose of servicing its indebtedness. In the event Rexnord is unable to meet its debt service obligations, it could attempt to restructure or refinance its indebtedness or seek additional equity capital. The governing instruments for Rexnord’s indebtedness contain customary affirmative and negative covenants that method, compensation cost recognizedmay result in restrictions to Rexnord. Though the restrictions on these obligations are not directly imposed on RBS Global, a default under Rexnord’s debt obligations could result in a change of control and/or event of default under RBS Global’s other debt instruments and lead to an acceleration of all outstanding loans under RBS Global’s senior secured credit facilities and other debt. The instruments governing the PIK toggle senior indebtedness, including the covenants and restrictions above, will be extinguished upon the full redemption of the PIK toggle senior indebtedness, which is expected to be completed in the first quarter of 2006 includes (a) compensation costfiscal 2012. As described above, the covenants will be removed upon full redemption of the PIK toggle senior indebtedness.
F-26
Other Subsidiary Debt
At March 31, 2010 and March 31, 2011, various wholly-owned subsidiaries had additional debt of $7.2 million and $12.1 million, respectively, comprised primarily of borrowings at various foreign subsidiaries and capital lease obligations.
Account Receivable Securitization Program
On September 26, 2007, three wholly-owned domestic subsidiaries entered into an accounts receivable securitization program (the “AR Securitization Program” or the “Program”) whereby they continuously sell substantially all of their domestic trade accounts receivable to Rexnord Funding LLC (a wholly-owned bankruptcy remote special purpose subsidiary) for cash and subordinated notes. Rexnord Funding LLC in turn may obtain revolving loans and letters of credit from General Electric Capital Corporation (“GECC”) pursuant to a five year revolving loan agreement. The maximum borrowing amount under the Receivables Financing and Administration Agreement is $100.0 million, subject to certain borrowing base limitations related to the amount and type of receivables owned by Rexnord Funding LLC. All of the receivables purchased by Rexnord Funding LLC are pledged as collateral for revolving loans and letters of credit obtained from GECC under the loan agreement.
The AR Securitization Program does not qualify for sale accounting under ASC 860Transfers and Servicing (“ASC 860”), and as such, any borrowings are accounted for as secured borrowings on the consolidated balance sheet. Financing costs associated with the Program will be recorded within “Interest expense, net” in the consolidated statement of operations if revolving loans or letters of credit are obtained under the loan agreement.
Borrowings under the loan agreement bear interest at a rate equal to LIBOR plus 1.35%. Outstanding borrowings mature on September 26, 2012. In addition, a non-use fee of 0.30% is applied to the unutilized portion of the $100.0 million commitment. These rates are per annum and the fees are paid to GECC on a daily basis.
At March 31, 2011, the Company’s available borrowing capacity under the AR Securitization Program was $97.9 million. All of the receivables purchased by Rexnord Funding LLC are pledged as collateral for revolving loans and letters of credit obtained from GECC under the loan agreement. Additionally, the Program requires compliance with certain covenants and performance ratios contained in the Receivables Financing and Administration Agreement. As of March 31, 2011, Rexnord Funding LLC was in compliance with all share-based payments granted priorapplicable covenants and performance ratios.
See Note 21, Subsequent Events, for a discussion of an amendment of the Program.
Future Debt Maturities
Future maturities of debt are as follows (in millions):
Year ending March 31: | ||||
2012 | $ | 104.2 | ||
2013 | 3.9 | |||
2014 | 757.8 | |||
2015 | 0.5 | |||
2016 | — | |||
Thereafter | 1,447.7 | |||
| $ | 2,314.1 | |||
Cash interest paid for the years ended March 31, 2009, 2010 and 2011 was $169.2 million, $161.8 million, and $143.6 million, respectively.
F-27
11. Derivative Financial Instruments
The Company is exposed to but not yet vestedcertain financial risks relating to fluctuations in foreign currency exchange rates and interest rates. The Company selectively uses foreign currency forward exchange contracts and interest rate swap contracts to manage its foreign currency and interest rate risks. All hedging transactions are authorized and executed pursuant to defined policies and procedures which prohibit the use of financial instruments for speculative purposes.
Foreign Currency Forward Contracts
The Company periodically enters into foreign currency forward contracts to mitigate the foreign currency volatility relative to certain intercompany and external cash flows expected to occur during the fiscal year. The Company currently has entered into foreign currency forward contracts that exchange Canadian dollars (“CAD”) for United States dollars (“USD”). The forward contracts in place as of March 31, 2011 expire between April and September of 2011 and have notional amounts of $9.0 million CAD ($9.1 million USD) and contract rates of approximately $0.99CAD:$1USD. These foreign currency forward contracts were not accounted for as effective cash flow hedges in accordance with ASC 815,Derivatives and Hedging (“ASC 815”) and as such were marked to market through earnings. See the amounts recorded on the consolidated balance sheets and recognized within the consolidated statements of operations related to the Company’s foreign currency forward contracts within the tables below.
Interest Rate Collar and Swaps
Effective October 2, 200520, 2009, the Company entered into three interest rate swaps to hedge the variability in future cash flows associated with the Company’s variable rate term loans. All three interest rate swaps mature on July 20, 2012. The three swaps convert an aggregate of $370.0 million of the Company’s variable-rate term loans to fixed interest rates ranging from 2.08% to 2.39% plus the applicable margin. The Company previously entered into an interest rate collar and an interest rate swap, effective October 20, 2006, to hedge the variability in future cash flows associated with a portion of the Company’s variable-rate term loans. The interest rate collar provided an interest rate floor of 4.0% plus the applicable margin and an interest rate cap of 6.065% plus the applicable margin on $262.0 million of the Company’s variable-rate term loans, while the interest rate swap converted $68.0 million of the Company’s variable-rate term loans to a fixed interest rate of 5.14% plus the applicable margin. Both the interest rate collar and the interest rate swap matured on October 20, 2009. All interest rate derivatives have been accounted for as effective cash flow hedges in accordance with ASC 815. The fair values of these interest rate derivatives are recorded on the Company’s consolidated balance sheet with the corresponding offset recorded as a component of accumulated other comprehensive income (loss), net of tax. See the amounts recorded on the consolidated balance sheets and recognized within the consolidated statements of operations related to the Company’s interest rate collar and swaps within the tables below.
The Company’s derivatives are measured at fair value in accordance with ASC 820. See Note 12 for more information as it relates to the fair value measurement of the Company’s derivative financial instruments.
The following tables indicate the location and the fair value of the Company’s derivative instruments within the consolidated balance sheets segregated between designated, qualifying ASC 815 hedging instruments and non-qualifying, non-designated hedging instruments (in millions).
Fair value of derivatives designated as hedging instruments under ASC 815:
| Liability Derivatives | ||||||||||||
| March 31, 2010 | March 31, 2011 | Balance Sheet Classification | ||||||||||
Interest rate swaps | $ | 6.6 | $ | 8.0 | Other long-term liabilities | |||||||
F-28
| Asset Derivatives | ||||||||||||
| March 31, 2010 | March 31, 2011 | Balance Sheet Classification | ||||||||||
Foreign currency forward contracts | $ | 0.1 | $ | — | Other current assets | |||||||
| Liability | ||||||||||||
| March 31, 2010 | March 31, 2011 | Balance Sheet Classification | ||||||||||
Foreign currency forward contracts | $ | — | $ | 0.2 | Other current liabilities | |||||||
The following table indicates the location and the amount of gains and (losses) associated with the Company’s derivative instruments, net of tax, within the consolidated balance sheet (for qualifying ASC 815 instruments) and recognized within the consolidated statement of operations. The information is segregated between designated, qualifying ASC 815 hedging instruments and non-qualifying, non-designated hedging instruments (in millions).
| Amount of gain or (loss) recognized in OCI on derivatives | Location of gain or | Amount of gain or (loss) reclassified from accumulated OCI into income | ||||||||||||||||
Derivative instruments | Year Ended | |||||||||||||||||
| March 31, 2010 | March 31, 2011 | March 31, 2010 | March 31, 2011 | |||||||||||||||
Interest rate swaps | $ | (4.0 | ) | $ | (4.8 | ) | Interest expense, net | $ | (9.5 | ) | $ | (7.5 | ) | |||||
| Amount recognized in other income (expense), net | ||||||||||
Derivative instruments not designated | Location of gain or (loss) | Year Ended | ||||||||
| March 31, 2010 | March 31, 2011 | |||||||||
Foreign currency forward contracts | Other income (expense), net | $ | 1.3 | $ | (0.1 | ) | ||||
The Company currently expects to reclassify the current gross balance of $6.0 million within accumulated other comprehensive income into earnings (as interest expense) related to its interest rate derivatives throughout the period from April 1, 2011 to March 31, 2012.
12. Fair Value Measurements
ASC 820 defines fair value as the exchange price that would be received for an asset or paid to transfer a liability (an exit price) in the principal or most advantageous market for the asset or liability in an orderly transaction between market participants. ASC 820 also specifies a fair value hierarchy based upon the observability of inputs used in valuation techniques. Observable inputs (highest level) reflect market data obtained from independent sources, while unobservable inputs (lowest level) reflect internally developed assumptions about the assumptions a market participant would use.
In accordance with ASC 820, fair value measurements are classified under the following hierarchy:
Level 1- Quoted prices for identical instruments in active markets.
Level 2- Quoted prices for similar instruments; quoted prices for identical or similar instruments in markets that are not active; and model-derived valuations in which all significant inputs or significant value-drivers are observable.
Level 3- Model-derived valuations in which one or more inputs or value-drivers are both significant to the fair value measurement and unobservable.
F-29
If applicable, the Company uses quoted market prices in active markets to determine fair value, and therefore classifies such measurements within Level 1. In some cases where market prices are not available, the Company makes use of observable market based inputs to calculate fair value, in which case the measurements are classified within Level 2. If quoted or observable market prices are not available, fair value is based upon internally developed models that use, where possible, current market-based parameters. These measurements are classified within Level 3 if they use significant unobservable inputs.
The Company’s fair value measurements which were impacted by ASC 820 as of March 31, 2011 include:
Interest Rate Swaps
The fair value of interest rate swap and collar derivatives is primarily based on pricing models. These models use discounted cash flows that utilize the appropriate market-based forward swap curves and interest rates.
Foreign Currency Forward Contracts
The fair value of foreign currency forward contracts is based on a pricing model that utilizes the differential between the contract price and the market-based forward rate as applied to fixed future deliveries of currency at pre-designated settlement dates.
The following describes the valuation methodologies the Company uses to measure non-financial assets accounted for at fair value on a non-recurring basis.
Long-lived Assets and Intangible Assets
Long-lived assets (which includes property, plant and equipment and real estate) may be measured at fair value if such assets are held for sale or when there is a determination that the asset is impaired. Intangible assets (which includes patents, tradenames, customer relationships, and non-compete agreements) also may be measured at fair value when there is a determination that the asset is impaired. The determination of fair value for these assets is based on the grant datebest information available, including internal cash flow estimates discounted at an appropriate interest rate, quoted market prices when available, market prices for similar assets and independent appraisals, as appropriate. For real estate, cash flow estimates are based on current market estimates that reflect current and projected lease profiles and available industry information about expected trends in rental, occupancy and capitalization rates.
The Company endeavors to utilize the best available information in measuring fair value. As required by ASC 820, financial assets and liabilities are classified in their entirety based on the lowest level of input that is significant to the fair value estimatedmeasurement. The Company has determined that its financial instruments reside within level 2 of the fair value hierarchy. The following table provides a summary of the Company’s assets and liabilities that were recognized at fair value on a recurring basis as of March 31, 2010 and 2011 (in millions):
| Fair Value as of March 31, 2010 | ||||||||||||||||
| Level 1 | Level 2 | Level 3 | Total | |||||||||||||
Assets: | ||||||||||||||||
Foreign exchange currency contracts | $ | — | $ | 0.1 | $ | — | $ | 0.1 | ||||||||
Total assets at fair value | $ | — | $ | 0.1 | $ | — | $ | 0.1 | ||||||||
Liabilities: | ||||||||||||||||
Interest rate swaps | $ | — | $ | 6.6 | $ | — | $ | 6.6 | ||||||||
Total liabilities at fair value | $ | — | $ | 6.6 | $ | — | $ | 6.6 | ||||||||
F-30
| Fair Value as of March 31, 2011 | ||||||||||||||||
| Level 1 | Level 2 | Level 3 | Total | |||||||||||||
Liabilities: | ||||||||||||||||
Foreign exchange currency contracts | $ | — | $ | 0.2 | $ | — | $ | 0.2 | ||||||||
Interest rate swaps | — | 8.0 | — | 8.0 | ||||||||||||
Total liabilities at fair value | $ | — | $ | 8.2 | $ | — | $ | 8.2 | ||||||||
Fair Value of Non-Derivative Financial Instruments
The carrying amounts of cash, receivables, payables and accrued liabilities approximated fair value at March 31, 2010 and March 31, 2011 due to the short-term nature of those instruments. The carrying value of long-term debt recognized within the consolidated balance sheets as of March 31, 2010 and March 31, 2011 was approximately $2,215.5 million and $2,314.1 million, respectively, whereas the fair value of long-term debt as of March 31, 2010 and March 31, 2011 was approximately $2,212.2 million and $2,419.1 million, respectively. The fair value is based on quoted market prices for the same issues.
13. Leases
The Company leases manufacturing and warehouse facilities and data processing and other equipment under non-cancelable operating leases which expire at various dates through 2017. Rent expense totaled $14.7 million, $12.2 million, and $11.4 million for the years ended March 31, 2009, 2010, and 2011, respectively.
Future minimum rental payments for operating leases with initial terms in accordance withexcess of one year are as follows (in millions):
Year ending March 31: | ||||
2012 | $ | 15.1 | ||
2013 | 10.2 | |||
2014 | 7.8 | |||
2015 | 5.1 | |||
2016 | 3.7 | |||
Thereafter | 8.5 | |||
| $ | 50.4 | |||
14. Stock Options
ASC 718 requires compensation costs related to share-based payment transactions to be recognized in the original provisions of SFAS No. 123 and (b)financial statements. Generally, compensation cost for all share-based payments granted on or subsequent to October 2, 2005,is measured based on the grant-date fair value estimated in accordance withof the provisions of SFAS No. 123R.equity or liability instruments issued. In addition, liability awards are re-measured each reporting period. Compensation cost related to stock awards granted prior to, but not vested as of, October 2, 2005 continues to be amortized using the expense attribution method described in FIN 28, while compensation cost associated with stock awards granted on or after October 2, 2005 is being recognized on a straight-line basis over the requisite service period, generally as the awards vest. As a nonpublic entity that previously used the minimum value method for pro forma disclosure purposes under the entire award in accordance withprior authoritative literature, the Company adopted ASC 718 using the prospective transition method of adoption on April 1, 2006. Accordingly, the provisions of SFAS No. 123R. Results for the prior periods have not been restated.
Priorthis guidance are applied prospectively to the adoption of SFAS No. 123R, we recognized compensation cost over the explicit service period for restricted stocknew awards subjectand to acceleration of vesting upon retirement. This policy has changed upon the adoption of SFAS No. 123R. For awards granted prior to the adoption of SFAS No. 123R, we continue to recognize compensation cost over the explicit service period and will accelerate any remaining unrecognized compensation cost when an employee actually retires. For awards grantedmodified, repurchased or modifiedcancelled after the adoption date. In connection with the Apollo transaction in July 2006, all previously outstanding stock options became fully vested and were either cashed out or rolled into fully-vested stock options of SFAS No. 123R and subject to accelerationRexnord. On July 22, 2006, a total of vesting upon retirement, compensation cost is recognized over a service period ending no later than the date the employee first becomes eligible for retirement. Had we recognized any remaining unrecognized compensation cost at the point when an employee became eligible for retirement, compensation cost would have increased in fiscal 2004 by approximately $1.5 million and by $0.1 million in 2005, and would have decreased by approximately $1.5 million in fiscal 2006.
Prior to the adoption of SFAS No. 123R, we presented the tax benefit of deductions arising from the exercise577,945 of stock options as operating cash flows in the Condensed Consolidated Statementwere rolled over, each with an exercise price of Cash Flows. SFAS No. 123R requires that we classify the cash flows resulting from the tax benefit that arises when the tax deductions exceed the compensation cost recognized for those options (excess tax benefits) as financing cash flows. The excess tax benefits, which were less than $0.2 million for fiscal 2006, would have been classified as an operating cash inflow if we had not adopted SFAS No. 123R.
Pro Forma Information Under SFAS No. 123 for Periods Prior to Fiscal 2006
The table below illustrates the effect on net earnings and earnings per share if the Company had applied the fair value recognition provisions$7.13. As of SFAS No. 123 to options granted under the Company’s stock option plans in all periods presented (amounts are in millions, except shares and per share amounts):
| Year Ended September 30, | ||||||||
| 2004 | 2005 | |||||||
Net (loss) earnings, as reported | $ | 28.4 | $ | (5.6 | ) | |||
Stock-based employee compensation expense, net of tax | 2.2 | 2.5 | ||||||
Total stock-based employee compensation expense determined under the fair value method, net of tax | (3.0 | ) | (3.1 | ) | ||||
Pro forma net (loss) earnings | $ | 27.6 | $ | (6.2 | ) | |||
(Loss) earnings per share: | ||||||||
Basic—as reported | $ | 0.38 | $ | (0.07 | ) | |||
Basic—pro forma | 0.37 | (0.08 | ) | |||||
Diluted—as reported | $ | 0.37 | $ | (0.07 | ) | |||
Diluted—pro forma | 0.36 | (0.08 | ) | |||||
Jacuzzi Brands, Inc.
Notes to Consolidated Financial Statements—(Continued)
The pro forma information above was determined using the Black-Scholes-Merton (“BSM”) option-pricing formula based on the following assumptions:
| Year Ended September 30, | ||||||
| 2004 | 2005 | |||||
Expected term (in years) | 4.0 | 4.0 | ||||
Risk-free interest rate | 2.97 | % | 3.41 | % | ||
Expected volatility | 66 | % | 63 | % | ||
Expected dividend yield | 0 | % | 0 | % | ||
We estimated the expected term and expected volatilityMarch 31, 2011, 377,623 of thethese rollover stock options based upon historical data of our share-based compensation plans. The weighted-average fair value of options granted during fiscals 2004 and 2005 was $5.73 and $4.63, respectively. Forfeitures of share-based compensation were recognized as they occurred.
Valuation and Expense Information under SFAS No. 123R
The adoption of SFAS No. 123R had a negligible impact on our earnings before income taxes and net earnings for fiscal 2006. Accordingly, the adoption of SFAS No. 123R did not have an effect on earnings per share for the year ended 2006. We recorded compensation costs of $3.8 million, $4.4 million and $5.3 million for fiscals 2004, 2005 and 2006, respectively. We recognized a tax benefit for share-based compensation arrangements of $0.8 million, $1.3 million and $1.8 million for fiscal years 2004, 2005 and 2006, respectively.
As required by SFAS No. 123R, we now estimate forfeitures of employee stock options and recognize compensation cost only for those awards expected to vest. Forfeiture rates are determined for three groups of employees—directors, senior management and all other employees—based on historical experience. Estimated forfeitures are now adjusted to actual forfeiture experience as needed. The cumulative effect of adopting SFAS No. 123R of $0.2 million, which represents estimated forfeitures for restricted stock awards outstanding at the date of adoption, was not material and therefore has been recorded as a reduction of our stock-based compensation costs in SG&A expense rather than displayed separately as a cumulative change in accounting principle in the Consolidated Statement of Operations.remained outstanding.
In connection with the adoptionApollo transaction, the Board of SFAS No. 123R, we estimateDirectors of Rexnord adopted, and stockholders approved, the 2006 Stock Option Plan of Rexnord (the “Option Plan”). Persons eligible to receive options under the Option Plan include officers, employees or directors of Rexnord or any of its subsidiaries and certain
F-31
consultants and advisors to Rexnord or any of its subsidiaries. The maximum number of shares of Rexnord common stock that may be issued or transferred pursuant to options under the Option Plan equals 2,700,000 shares (excluding rollover options mentioned above). All option grants in fiscal 2009, 2010 and 2011 were granted with an exercise price of $40.00, $20.00, and $37.00 per share, respectively, which was the fair value of Rexnord’s common shares on the date of grant. Generally, approximately 50% of the options granted under the Option Plan vest ratably over five years from the date of grant; the remaining 50% of the options are eligible to vest based on the Company’s achievement of earnings before interest, taxes, depreciation and amortization (“EBITDA”) targets and net debt repayment targets for fiscal years 2007 through 2015. As of March 31, 2011, performance targets for the year ended March 31, 2011 have been achieved and the vesting for the achievement of the fiscal 2011 performance targets was approved by the Committee as of May 3, 2011.
The fair value of each stock option granted under the Option Plan was estimated on the date of grant using the BSM option-pricing formula and amortizeBlack-Scholes valuation model that value to expense overuses the option’s vesting period using the straight-line attribution approach. The following are the weighted-average assumptions used to value grants for the year ended September 30, 2006.assumptions:
| |||
| |||
| |||
|
| Year Ended March 31, 2009 | Year Ended March 31, 2010 | Year Ended March 31, 2011 | ||||||||||
Expected option term (in years) | 7.5 | 7.5 | 7.5 | |||||||||
Expected volatility factor | 28 | % | 36 | % | 39 | % | ||||||
Weighted-average risk free interest rate | 3.76 | % | 3.23 | % | 2.28 | % | ||||||
Expected divided rate | 0.0 | % | 0.0 | % | 0.0 | % | ||||||
Expected Term: The expectedOptions granted under the Option Plan as well as the fully vested rollover options have a term representsof ten years. Management’s estimate of the period over whichoption term for options granted under the share-based awards are expected to be outstanding. It has been determined using the “shortcut method” described in Staff Accounting Bulletin Topic 14.D.2, whichOption Plan is 7.5 years based on a calculation to arrive at the midpoint between when the vesting dateoptions vest and when they expire. The Company’s expected volatility assumptions are based on the endexpected volatilities of publicly-traded companies within the contractual term.
Jacuzzi Brands, Inc.
Notes to Consolidated Financial Statements—(Continued)
Risk-Free Interest Rate: We based the risk-freeCompany’s industry. The weighted average risk free interest rate used in our assumptions on the implied yield currently available on U.S. Treasury zero-coupon issues with a remaining term equivalent to the stock option award’s expected term.
Expected Volatility: The volatility factor used in our assumptions is based on the historical price of our stock over the most recent period commensurate with the expected term of the stock option award.
Expected Dividend Yield: We do not intend to pay dividends on our common stock for the foreseeable future. Accordingly, we use a dividendU.S. Treasury yield of zerocurve in our assumptions.
Incentive Stock Plans
We maintain incentive stock plans that provide for the grants of stock options and restricted stock awards to our directors, officers and key employees. Restricted stock awards granted in fiscal 2005 either vest in annual increments over four years oreffect at the end of three years. Restricted stock awards issued in prior years either vest in equal annual increments over four years or vest over seven years (either in thirds—on the third year, fifth year and seventh year—or solely at the end of the seventh year). In 2005 and 2006, we granted 726,053 and 484,571 restricted stock awards, respectively. During 2005, the weighted-average fair value of restricted stock awards granted was $9.19. The weighted-average fair value of restricted stock awards granted during 2006 was $8.27 per share.
As of September 30, 2006, there were 2,007,620 shares of common stock reserved for issuance under our stock plans. We intend to issue shares from treasury stock. Under these stock plans, stock options must be granted at an option price equal to the closing market value of the stock on the date of the grant. Options granted under these plans, prior to October 2, 2005, become exercisable over four years in equal annual installments after the date of grant, with the exception of directors’ options which cliff vest after six months, provided that the individual is continuously employed by our company. Options granted during 2006 become exercisable over three years in equal annual installments after the date of grant, with the exception of directors’ options which cliff vest after six months, provided that the individual is continuously employed by our company. All options granted expire ten years from the date of grant. We had authorizationManagement also assumes expected dividends of zero. The weighted-average grant date fair value of options granted under ourthe Option Plan during fiscal 2009, 2010 and 2011 was $16.01, $9.01, and $16.80, respectively. During fiscal 2009, 2010 and 2011, the Company recorded $6.9 million, $5.5 million and $5.6 million of stock-based compensation, respectively (the related tax benefit on these amounts was $2.6 million for fiscal 2009, $2.1 million for fiscal 2010, and $2.2 million for fiscal 2011).
Other information relative to stock plans to grant 3,225,948 additional stock awards at September 30, 2006. At September 30, 2005 and 2006, respectively, we had 1,012,204 and 903,058 restricted shares of our common stock (“restricted stock awards”) outstanding. Restricted stock awards granted in fiscal 2006 vest ratably over three years.
A summary of option activity under our stock plans as of September 30, 2006options and the changes during fiscal 2006 is presented below (amountsperiod over period are in millions, except shares and per share amounts):as follows:
Options | Number of Shares | Weighted- Average Exercise Price | Weighted- Average Remaining Contractual Term (years) | Aggregate Intrinsic Value | |||||||
Outstanding at September 30, 2005 | 1,266,032 | $ | 5.37 | ||||||||
Granted | 53,250 | 8.31 | |||||||||
Exercised | (269,650 | ) | 5.99 | ||||||||
Forfeited | (119,000 | ) | 7.36 | ||||||||
Outstanding at September 30, 2006 | 930,632 | $ | 5.11 | 5.8 | $ | 4.6 | |||||
Vested or expected to vest at September 30, 2006 | 889,271 | $ | 5.10 | 5.8 | 4.4 | ||||||
Exercisable at September 30, 2006 | 738,507 | $ | 4.81 | 5.4 | $ | 3.9 | |||||
Jacuzzi Brands, Inc.
Number of shares under option: Outstanding at beginning of period Granted Exercised Canceled/Forfeited Outstanding at end of period Exercisable at end of periodNotes to Consolidated Financial Statements—(Continued) Year Ended March 31, 2009 Year Ended March 31, 2010 Year Ended March 31, 2011 Shares Weighted
Avg. Exercise
Price Shares Weighted
Avg. Exercise
Price Shares Weighted
Avg. Exercise
Price 2,795,887 $ 17.47 2,721,505 $ 17.69 2,498,666 $ 18.25 44,900 40.00 582,593 20.00 215,000 37.00 (1,806 ) 19.94 (75,323 ) 14.83 (101,944 ) 17.96 (117,476 ) 20.86 (730,109 ) 17.91 (41,209 ) 25.33 2,721,505 (1 ) $ 17.69 2,498,666 (1 )(2) $ 18.25 2,570,513 (1 )(4) $ 19.73 1,198,115 $ 14.17 1,203,373 (3 ) $ 15.88 1,491,063 (5 ) $ 16.90
The weighted-average fair values of stock options granted during 2006 were $5.41. The total intrinsic value of stock options exercised was $1.4 million during the year ended September 30, 2005 and was approximately $0.9 million during the year ended September 30, 2006. F-32
| Shares | Weighted Average Grant Date Fair Value | |||||||
Non-vested options at March 31, 2010 | 1,295,293 | $ | 12.40 | |||||
Granted | 215,000 | 16.80 | ||||||
Vested | (402,133 | ) | 13.90 | |||||
Canceled/Forfeited | (28,710 | ) | 13.34 | |||||
Non-vested options at March 31, 2011 | 1,079,450 | $ | 12.69 | |||||
As of September 30, 2006,March 31, 2011, there was $0.4$7.6 million of total unrecognized compensation cost related to thenon-vested stock options granted under our stock plans.the Option Plan. That cost is expected to be recognized over a weighted-average period of 1.62.4 years.
A summary
| 1) | Includes 539,242, 393,413, and 377,623 of rollover options for the years ended March 31, 2009, 2010, and 2011, respectively. |
| 2) | The weighted average remaining contractual life of options outstanding at March 31, 2010 was 7.3 years. |
| 3) | The weighted average remaining contractual life of options exercisable at March 31, 2010 was 6.6 years. |
| 4) | The weighted average remaining contractual life of options outstanding at March 31, 2011 was 6.6 years. |
| 5) | The weighted average remaining contractual life of options exercisable at March 31, 2011 was 5.8 years. |
15. Retirement Benefits
The Company sponsors pension and other postretirement benefit plans for certain employees. Most of the Company’s employees are accumulating retirement income benefits through defined contribution plans. However, the Company does sponsor frozen pension plans for its salaried participants and ongoing pension benefits for certain employees represented by collective bargaining. These plans provide for monthly pension payments to eligible employees upon retirement. Pension benefits for salaried employees generally are based on years of frozen credited service and average earnings. Pension benefits for hourly employees generally are based on specified benefit amounts and years of service. The Company’s policy is to fund its pension obligations in conformity with the funding requirements under applicable laws and governmental regulations. Other postretirement benefits consist of retiree medical plans that cover a portion of employees in the United States that meet certain age and service requirements.
As of March 31, 2009, the Company was required to adopt the provisions of ASC 715Compensation-Retirement Benefits (“ASC 715”) which requires companies to measure the funded status of our restricted stock awardsplans as of September 30, 2006the date of the Company’s fiscal year end. The Company previously used a December 31 measurement date for its defined benefit pension and changesother post-retirement plans and elected to transition to a fiscal year-end measurement date utilizing the second alternative prescribed by ASC 715. Accordingly, as of April 1, 2008, the Company recognized adjustments to its retained earnings, net of income tax effect, and pension and other post-retirement plan assets and liabilities. The impact of the adoption was an increase in total liabilities of $1.3 million, an increase in total assets of $3.5 million, an increase in deferred tax liabilities of $0.9 million and an increase in retained earnings, net of tax, of $1.3 million.
During the fourth quarter of fiscal 2011, the Company voluntarily changed its method of accounting for actuarial gains and losses related to its pension and other postretirement benefit plans. Previously, the Company recognized actuarial gains and losses as a component of Stockholders’ Equity on the consolidated balance sheet and amortized the actuarial gains and losses over participants’ average remaining service period, or average remaining life expectancy, when all or almost all plan participants are inactive, as a component of net periodic benefit cost if the unrecognized gain or loss exceeded 10 percent of the greater of the market-related value of plan assets or the plan’s projected benefit obligation at the beginning of the year (the “corridor”). Under the new method, the net actuarial gains or losses in excess of the corridor will be recognized immediately in operating
F-33
results during the fourth quarter of each fiscal year (or upon any re-measurement date). Net periodic benefit costs recorded on a quarterly basis would continue to primarily be comprised of service and interest cost, amortization of unrecognized prior service cost and the expected return on plan assets. While the historical method of recognizing actuarial gains and losses was considered acceptable, the Company believes this method is presented below:preferable as it accelerates the recognition of actuarial gains and losses outside of the corridor. See Note 2 for additional information.
The components of net periodic benefit cost reported in the consolidated statements of operations are as follows (in millions):
| Number of Shares | Weighted- Average Fair Value at Grant Date | |||||
Nonvested at September 30, 2005 | 1,012,204 | $ | 9.41 | |||
Granted | 484,571 | 8.27 | ||||
Vested | (500,402 | ) | 9.59 | |||
Forfeited | (93,315 | ) | 9.17 | |||
Nonvested at September 30, 2006 | 903,058 | $ | 8.72 | |||
| Year Ended March 31, 2009 | Year Ended March 31, 2010 | Year Ended March 31, 2011 | ||||||||||
Pension Benefits: | ||||||||||||
Service cost | $ | 4.4 | $ | 2.9 | $ | 2.0 | ||||||
Interest cost | 34.2 | 34.8 | 33.3 | |||||||||
Expected return on plan assets | (49.9 | ) | (31.3 | ) | (36.3 | ) | ||||||
Amortization of prior service credits | 0.3 | 0.3 | 0.3 | |||||||||
Recognition of actuarial (gains) losses | 166.1 | 0.3 | (0.2 | ) | ||||||||
Net periodic benefit cost (income) | $ | 155.1 | $ | 7.0 | $ | (0.9 | ) | |||||
Other Postretirement Benefits: | ||||||||||||
Service cost | $ | 0.4 | $ | 0.1 | $ | 0.1 | ||||||
Interest cost | 2.2 | 2.1 | 2.0 | |||||||||
Amortization of prior service credits | (1.0 | ) | (2.0 | ) | (2.0 | ) | ||||||
Recognition of actuarial (gains) losses | (1.8 | ) | 7.4 | 2.7 | ||||||||
Net periodic benefit cost (income) | $ | (0.2 | ) | $ | 7.6 | $ | 2.8 | |||||
The Company made contributions to its U.S. qualified pension plan trusts of $2.4 million, $4.0 million, and $11.7 million during the years ended March 31, 2009, 2010 and 2011, respectively.
F-34
The status of the plans are summarized as follows (in millions):
| Pension Benefits | Other Postretirement Benefits | |||||||||||||||
| Year Ended March 31, 2010 | Year Ended March 31, 2011 | Year Ended March 31, 2010 | Year Ended March 31, 2011 | |||||||||||||
Benefit obligation at beginning of period | $ | (531.8 | ) | $ | (587.7 | ) | $ | (27.0 | ) | $ | (34.1 | ) | ||||
Service cost | (2.9 | ) | (2.0 | ) | (0.1 | ) | (0.1 | ) | ||||||||
Interest cost | (34.8 | ) | (33.3 | ) | (2.1 | ) | (2.0 | ) | ||||||||
Actuarial gains (losses) | (53.7 | ) | (9.7 | ) | (9.0 | ) | (3.6 | ) | ||||||||
Plan amendments | — | — | — | (0.2 | ) | |||||||||||
Benefits paid | 36.7 | 36.0 | 5.1 | 4.8 | ||||||||||||
Plan participant contributions | (0.4 | ) | (0.3 | ) | (1.0 | ) | (1.2 | ) | ||||||||
Acquisitions | — | (1.0 | ) | — | — | |||||||||||
Translation adjustment | (0.8 | ) | (3.4 | ) | — | — | ||||||||||
Benefit obligation at end of period | $ | (587.7 | ) | $ | (601.4 | ) | $ | (34.1 | ) | $ | (36.4 | ) | ||||
Plan assets at the beginning of the period | $ | 394.7 | $ | 478.2 | $ | — | $ | — | ||||||||
Actual return (loss) on plan assets | 111.1 | 63.5 | — | — | ||||||||||||
Contributions | 8.0 | 15.8 | 5.1 | 4.8 | ||||||||||||
Benefits paid | (36.7 | ) | (36.0 | ) | (5.1 | ) | (4.8 | ) | ||||||||
Acquisitions | — | 0.4 | — | — | ||||||||||||
Translation adjustment | 1.1 | 1.2 | — | — | ||||||||||||
Plan assets at end of period | $ | 478.2 | $ | 523.1 | $ | — | $ | — | ||||||||
Funded status of plans | $ | (109.5 | ) | $ | (78.3 | ) | $ | (34.1 | ) | $ | (36.4 | ) | ||||
Net amount on Consolidated Balance Sheet consists of: | ||||||||||||||||
Long-term assets | $ | — | $ | 4.6 | $ | — | $ | — | ||||||||
Current liabilities | (2.7 | ) | (2.5 | ) | (3.4 | ) | (3.6 | ) | ||||||||
Long-term liabilities | (106.8 | ) | (80.4 | ) | (30.7 | ) | (32.8 | ) | ||||||||
Total net funded status | $ | (109.5 | ) | $ | (78.3 | ) | $ | (34.1 | ) | $ | (36.4 | ) | ||||
As of September 30,March 31, 2011, the Company had pension plans with a combined projected benefit obligation of $601.4 million compared to plan assets of $523.1 million, resulting in an under-funded status of $78.3 million compared to a under-funded status of $109.5 million at March 31, 2010. The Company’s funded status has improved year-over-year primarily as a result of the market recoveries in fiscal 2011. Any further changes in the assumptions underlying the Company’s pension values, including those that arise as a result of declines in equity markets and changes in interest rates, could result in increased pension cost which could negatively affect the Company’s consolidated results of operations in future periods.
Amounts included in accumulated other comprehensive (income) loss, net of tax, at March 31, 2011 consist of the following (in millions):
| Pension Benefits | Postretirement Benefits | Total | ||||||||||
Unrecognized prior service cost (credit) | $ | 2.3 | $ | (15.1 | ) | $ | (12.8 | ) | ||||
Unrecognized actuarial loss | 0.4 | 1.6 | 2.0 | |||||||||
Accumulated other comprehensive loss (income), gross | 2.7 | (13.5 | ) | (10.8 | ) | |||||||
Deferred income tax (benefit) provision | (1.0 | ) | 5.8 | 4.8 | ||||||||
Accumulated other comprehensive loss (income), net | $ | 1.7 | $ | (7.7 | ) | $ | (6.0 | ) | ||||
F-35
The estimated prior service cost (credit) that will be amortized from accumulated other comprehensive loss into the net periodic benefit cost over the next fiscal year, net of tax, are $0.2 million and $(1.2) million for pension and other postretirement benefits, respectively.
The following table presents significant assumptions used to determine benefit obligations and net periodic benefit cost (income) in weighted-average percentages:
| Pension Benefits | Other Postretirement Benefits | |||||||||||||||||||||||
| March 31, 2009 | March 31, 2010 | March 31, 2011 | March 31, 2009 | March 31, 2010 | March 31, 2011 | |||||||||||||||||||
Benefit Obligations: | ||||||||||||||||||||||||
Discount rate | 6.90 | % | 5.93 | % | 5.75 | % | 7.00 | % | 6.00 | % | 5.40 | % | ||||||||||||
Rate of compensation increase | 3.41 | % | 3.40 | % | 3.40 | % | n/a | n/a | n/a | |||||||||||||||
Net Periodic Benefit Cost: | ||||||||||||||||||||||||
Discount rate | 5.87 | % | 6.90 | % | 5.93 | % | 6.00 | % | 7.00 | % | 6.00 | % | ||||||||||||
Rate of compensation increase | 3.39 | % | 3.41 | % | 3.40 | % | n/a | n/a | n/a | |||||||||||||||
Expected return on plan assets | 7.94 | % | 7.96 | % | 7.94 | % | n/a | n/a | n/a | |||||||||||||||
In evaluating the expected return on plan assets, consideration was given to historical long-term rates of return on plan assets and input from the Company’s pension fund consultant on asset class return expectations, long-term inflation and current market conditions.
The following table presents the Company’s target investment allocations for the year ended March 31, 2011 and actual investment allocations at March 31, 2010 and 2011.
| Plan Assets | ||||||||||||||||
| 2010 | 2011 | |||||||||||||||
| Actual Allocation | Investment Policy (1) | Target Allocation (2) | Actual Allocation | |||||||||||||
Equity securities | 73 | % | 35 - 85 | % | 65 | % | 67 | % | ||||||||
Debt securities (including cash and cash equivalents) | 25 | % | 20 - 40 | % | 25 | % | 30 | % | ||||||||
Other | 2 | % | 0 - 10 | % | 10 | % | 3 | % | ||||||||
| (1) | The investment policy allocation represents the allowable allocations for the Company’s principal U.S. pension plans. |
| (2) | The target allocations represent the weighted average target allocations for the Company’s principal U.S. pension plans. |
Allocations between equity and fixed income securities are generally maintained within a 10% tolerance of the target allocation established by the investment committee. As of March 31, 2011, the Company’s current allocations were within 10% of the target allocations. The Company’s defined benefit pension investment policy recognizes the long-term nature of pension liabilities, the benefits of diversification across asset classes and the effects of inflation. The diversified portfolio is designed to maximize investment returns consistent with levels of investment risk that are prudent and reasonable. All assets are managed externally according to guidelines established individually with investment managers and the Company’s investment consultant. The manager guidelines prohibit the use of any type of investment derivative without the prior approval of the investment committee. Portfolio risk is controlled by having managers comply with their established guidelines, including establishing the maximum size of any single holding in their portfolios and by using managers with different investment styles. The Company periodically undertakes asset and liability modeling studies to determine the appropriateness of the investments. The portfolio included holdings of domestic, international, and private equities, global high quality and high yield fixed income, and short-term interest bearing deposits. No equity securities of the Company are held in the portfolio.
F-36
The fair values of the Company’s pension plan assets for both the U.S and non-U.S. plans at March 31, 2010 and 2011, by asset category were as follows (in millions). For information on the fair value hierarchy and the inputs used to measure fair value, see Note 12 Fair Value Measurements.
| As of March 31, 2010 | ||||||||||||||||
| Quoted Prices in Active Market (Level 1) | Significant Other Observable Inputs (Level 2) | Significant Unobservable Inputs (Level 3) | Total | |||||||||||||
Cash and cash equivalents | $ | 1 | $ | 5 | $ | — | $ | 6 | ||||||||
Mutual and commingled funds (1) | — | 420 | — | 420 | ||||||||||||
Alternative investments (2) | — | — | 46 | 46 | ||||||||||||
Insurance contracts | — | — | 6 | 6 | ||||||||||||
Total | $ | 1 | $ | 425 | $ | 52 | $ | 478 | ||||||||
| As of March 31, 2011 | ||||||||||||||||
| Quoted Prices in Active Market (Level 1) | Significant Other Observable Inputs (Level 2) | Significant Unobservable Inputs (Level 3) | Total | |||||||||||||
Cash and cash equivalents | $ | 5 | $ | 6 | $ | — | $ | 11 | ||||||||
Mutual and commingled funds (1) | — | 460 | — | 460 | ||||||||||||
Alternative investments (2) | — | — | 44 | 44 | ||||||||||||
Insurance contracts | — | — | 8 | 8 | ||||||||||||
Total | $ | 5 | $ | 466 | $ | 52 | $ | 523 | ||||||||
| (1) | The Company’s mutual and commingled funds primarily include investments in common stock, U.S. government securities, and corporate bonds. The commingled funds also include an insignificant portion of investments in asset-backed securities or partnerships. Mutual and commingled funds are valued using quoted market prices of the underlying investments. |
| (2) | The Company’s alternative investments include venture capital and partnership investments. Alternative investments are valued using the net assets value, which reflects the plan’s share of the fair value of the investments. |
The table below sets forth a summary of changes in the fair value of the Level 3 investments for the years ended March 31, 2010 and 2011 (in millions):
| Alternative Investments | Insurance Contracts | Total | ||||||||||
Beginning balance, March 31, 2009 | $ | 26 | $ | 5 | $ | 31 | ||||||
Actual return on assets: | ||||||||||||
Related to assets held at reporting date | (1 | ) | 1 | — | ||||||||
Related to assets sold during the period | 3 | — | 3 | |||||||||
Purchases, sales, issuances and settlements | 18 | — | 18 | |||||||||
Transfers in and/or out of Level 3 | — | — | — | |||||||||
Ending balance, March, 31, 2010 | 46 | 6 | 52 | |||||||||
Actual return on assets: | ||||||||||||
Related to assets held at reporting date | 1 | 2 | 3 | |||||||||
Related to assets sold during the period | — | — | — | |||||||||
Purchases, sales, issuances and settlements | (3 | ) | — | (3 | ) | |||||||
Transfers in and/or out of Level 3 | — | — | — | |||||||||
Ending balance, March, 31, 2011 | $ | 44 | $ | 8 | $ | 52 | ||||||
F-37
During fiscal 2012, the Company expects to contribute approximately $9.3 million to its defined benefit plans and $3.6 million to its other postretirement benefit plans.
Expected benefit payments to be paid in each of the next five fiscal years and in the aggregate for the five fiscal years thereafter are as follows (in millions):
| Year Ending March 31: | Pension Benefits | Other Postretirement Benefits | ||||||
2012 | $ | 36.7 | $ | 3.6 | ||||
2013 | 37.4 | 3.6 | ||||||
2014 | 38.0 | 3.5 | ||||||
2015 | 38.9 | 3.5 | ||||||
2016 | 39.7 | 3.6 | ||||||
2017-2021 | 209.1 | 15.7 | ||||||
Pension Plans That Are Not Fully Funded
At March 31, 2010, the projected benefit obligation, accumulated benefit obligation and fair value of plan assets for the pension plans with accumulated benefit obligations in excess of the fair value of plan assets were $585.2 million, $573.9 million and $475.9 million, respectively.
At March 31, 2011, the projected benefit obligation, accumulated benefit obligation and fair value of plan assets for the pension plans with accumulated benefit obligations in excess of the fair value of plan assets were $202.2 million, $198.3 million and $119.3 million, respectively.
Other Postretirement Benefits
The other postretirement benefit obligation was determined using an assumed health care cost trend rate of 8.5% in fiscal 2012 grading down to 5% in fiscal 2018 and thereafter. The discount rate, compensation rate increase and health care cost trend rate assumptions are determined as of the measurement date.
Assumed health care cost trend rates have a significant effect on amounts reported for the retiree medical plans. A one-percentage point change in assumed health care cost trend rates would have the following effect (in millions):
| One Percentage Point Increase | One Percentage Point Decrease | |||||||||||||||||||||||
| Year Ended March 31, | Year Ended March 31, | |||||||||||||||||||||||
| 2009 | 2010 | 2011 | 2009 | 2010 | 2011 | |||||||||||||||||||
Increase (decrease) in total of service and interest cost components | $ | 0.2 | $ | 0.2 | $ | 0.2 | $ | (0.2 | ) | $ | (0.1 | ) | $ | (0.1 | ) | |||||||||
Increase (decrease) in postretirement benefit obligation | 2.0 | 2.4 | 2.6 | (1.7 | ) | (2.1 | ) | (2.3 | ) | |||||||||||||||
Multi-Employer and Government-sponsored Plans
The Company participates in certain multi-employer and government-sponsored plans for eligible employees. Expense related to these plans was $0.3 million, $0.3 million, and $0.2 million for the years ended March 31, 2009, 2010 and 2011, respectively.
F-38
Defined Contribution Savings Plans
The Company sponsors certain defined-contribution savings plans for eligible employees. Expense related to these plans was $7.4 million, $3.4 million, and $6.1 million for the years ended March 31, 2009, 2010 and 2011, respectively.
16. Income Taxes
The provision for income taxes consists of amounts for taxes currently payable, amounts for tax items deferred to future periods, as well as adjustments relating to the Company’s determination of uncertain tax positions, including interest and penalties. The Company recognizes deferred tax assets and liabilities based on the future tax consequences attributable to tax net operating loss carryforwards, tax credit carryforwards and differences between the financial statement carrying amounts and the tax bases of applicable assets and liabilities. Deferred tax assets are regularly reviewed for recoverability and valuation allowances are established based on historical losses, projected future taxable income and the expected timing of the reversals of existing temporary differences. As a result of this review, the Company has established a valuation allowance against substantially all deferred tax assets relating to foreign and state net operating loss carryforwards; and a partial valuation allowance against foreign tax credit carryforwards.
Income Tax (Benefit) Provision
The components of the (benefit) provision for income taxes are as follows (in millions):
| Year ended March 31, | ||||||||||||
| 2009 | 2010 | 2011 | ||||||||||
Current: | ||||||||||||
United States | $ | (0.4 | ) | $ | 0.5 | $ | 0.3 | |||||
Non-United States | 10.4 | 8.3 | 11.2 | |||||||||
State and local | 3.0 | 5.0 | 0.5 | |||||||||
Total current | 13.0 | 13.8 | 12.0 | |||||||||
Deferred: | ||||||||||||
United States | (56.3 | ) | 29.4 | (19.1 | ) | |||||||
Non-United States | (3.9 | ) | (7.8 | ) | (2.1 | ) | ||||||
State and local | (24.8 | ) | (4.9 | ) | (0.9 | ) | ||||||
Total deferred | (85.0 | ) | 16.7 | (22.1 | ) | |||||||
(Benefit) provision for income taxes | $ | (72.0 | ) | $ | 30.5 | $ | (10.1 | ) | ||||
The (benefit) provision for income taxes differs from the United States statutory income tax rate due to the following items (in millions):
| Year ended March 31, | ||||||||||||
| 2009 | 2010 | 2011 | ||||||||||
Provision for income taxes at U.S. federal statutory income tax rate | $ | (175.4 | ) | $ | 41.5 | $ | (21.5 | ) | ||||
State and local income taxes, net of federal benefit | (7.5 | ) | 5.6 | (3.7 | ) | |||||||
Net effects of foreign operations | 0.2 | (0.8 | ) | 9.3 | ||||||||
Tax benefit treated as a reduction to goodwill | 0.6 | — | — | |||||||||
Net effect to deferred taxes for changes in tax rates | (6.5 | ) | (0.6 | ) | (0.4 | ) | ||||||
Unrecognized tax benefits, net of federal benefit | 0.9 | (13.6 | ) | (1.5 | ) | |||||||
Nondeductible impairment charges | 106.7 | — | — | |||||||||
Change in valuation allowance | 8.5 | (2.4 | ) | 7.6 | ||||||||
Other | 0.5 | 0.8 | 0.1 | |||||||||
(Benefit) provision for income taxes | $ | (72.0 | ) | $ | 30.5 | $ | (10.1 | ) | ||||
F-39
The (benefit) provision for income taxes was calculated based upon the following components of (loss) income before income taxes (in millions):
| Year ended March 31, | ||||||||||||
| 2009 | 2010 | 2011 | ||||||||||
United States | $ | (507.3 | ) | $ | 130.1 | $ | (91.0 | ) | ||||
Non-United States | 6.3 | (11.5 | ) | 29.6 | ||||||||
Income before income taxes | $ | (501.0 | ) | $ | 118.6 | $ | (61.4 | ) | ||||
Deferred Income Tax Assets and Liabilities
Deferred income taxes consist of the tax effects of the following temporary differences (in millions):
| March 31, 2010 | March 31, 2011 | |||||||
Deferred tax assets: | ||||||||
Compensation and retirement benefits | $ | 74.9 | $ | 64.2 | ||||
US federal and state tax operating loss carryforwards | 58.8 | 88.7 | ||||||
Foreign tax credit carryforwards | 65.2 | 58.8 | ||||||
Foreign net operating loss carryforwards | 36.5 | 40.4 | ||||||
Other | 11.6 | 14.5 | ||||||
Total deferred tax assets before valuation allowance | 247.0 | 266.6 | ||||||
Valuation allowance | (100.7 | ) | (111.2 | ) | ||||
Total deferred tax assets | 146.3 | 155.4 | ||||||
Deferred tax liabilities: | ||||||||
Property, plant and equipment | 63.4 | 56.8 | ||||||
Inventories | 30.7 | 32.5 | ||||||
Intangible assets and goodwill | 256.6 | 245.7 | ||||||
Cancelation of indebtedness | 70.9 | 78.4 | ||||||
Total deferred tax liabilities | 421.6 | 413.4 | ||||||
Net deferred tax liabilities | $ | 275.3 | $ | 258.0 | ||||
These deferred tax assets and liabilities are classified in the consolidated balance sheet based on the balance sheet classification of the related assets and liabilities.
Due to the deterioration of the overall economic environment during the fiscal year ended March 31, 2009 and the uncertainty of realizing the related tax benefits associated with certain deferred tax assets, management has determined that a valuation allowance should be established for deferred tax assets relating to foreign and state net operating loss carryforwards, as well as certain foreign tax credit carryforwards. Other significant factors considered by management in this determination included the historical operating results of the Company (including the material impairment charges recorded for the year ended March 31, 2009) and the expectation of future earnings, including anticipated reversals of future taxable temporary differences. A valuation allowance was recorded at March 31, 2010 and 2011 for deferred tax assets related to state net operating loss carryforwards, foreign net operating loss carryforwards and certain foreign tax credit carryforwards for which utilization is uncertain. Due to the adoption of ASC 805, effective April 1, 2009, any future recognition of the related deferred tax asset will impact income tax expense instead of goodwill, irrespective of how the valuation allowance was originally established. The carryforward period for the foreign tax credit is ten years. The carryforward period for the U.S. federal net operating loss carryforward is twenty years. The carryforward periods for the state net operating losses range from five to twenty years. Certain foreign net operating loss carryforwards are subject to a five year expiration period, and the carryforward period for the remaining foreign net operating losses is indefinite.
F-40
No provision has been made for United States income taxes related to approximately $35.2 million of undistributed earnings of foreign subsidiaries considered to be permanently reinvested. It is not practicable to determine the income tax liability, if any, which would be payable if such earnings were not permanently reinvested.
Net cash paid for income taxes to governmental tax authorities for the years ended March 31, 2009, 2010 and 2011 was $5.4 million, $14.1 million and $15.3 million, respectively.
Liability for Unrecognized Tax Benefits
The Company’s total liability for unrecognized tax benefits as of March 31, 2010 and March 31, 2011 was $27.3 million and $26.0 million, respectively. Due to the adoption of ASC 805, effective April 1, 2009, any future recognition of unrecognized tax benefits will impact income tax expense instead of goodwill.
The following table represents a reconciliation of the beginning and ending amount of the gross unrecognized tax benefits, excluding interest and penalties, for the fiscal years ended March 31, 2010 and March 31, 2011 (in millions):
| Year Ended March 31, 2010 | Year Ended March 31, 2011 | |||||||
Balance at beginning of period | $ | 35.5 | $ | 25.7 | ||||
Additions based on tax positions related to the current year | 1.1 | 0.2 | ||||||
Additions for tax positions of prior years | 0.8 | — | ||||||
Reductions for tax positions of prior years | — | (1.5 | ) | |||||
Settlements | (11.4 | ) | — | |||||
Reductions due to lapse of applicable statute of limitations | (0.7 | ) | (0.9 | ) | ||||
Cumulative translation adjustment | 0.4 | 0.1 | ||||||
Balance at end of period | $ | 25.7 | $ | 23.6 | ||||
The Company recognizes accrued interest and penalties related to unrecognized tax benefits in income tax expense. As of March 31, 2010 and March 31, 2011, the total amount of unrecognized tax benefits includes $7.7 million and $8.8 million of gross accrued interest and penalties, respectively. The amount of interest and penalties recorded as income tax expense (benefit) during the fiscal years ended March 31, 2009, 2010, and 2011 was $1.9 million, $(4.5) million, and $1.1 million, respectively.
During the third quarter of fiscal 2010, the Company completed an examination of its United States federal income tax returns by the Internal Revenue Service (“IRS”) for the tax periods ended March 31, 2006 and July 21, 2006. The conclusion of the examination resulted in no cash tax impact to the Company; however, there was $3.4a relatively small downward adjustment to the Company’s federal net operating loss incurred for the tax period ended July 21, 2006. In addition, the Company signed up for a new Brazilian tax settlement program during fiscal 2010 with respect to certain outstanding tax liabilities relating to its Brazilian operations. In exchange for immediate payment of existing, historical tax liabilities, the settlement program provided for substantial discounts in related interest, penalties and other fees that were previously accrued to the Company. For the fiscal year ended March 31, 2010, the Company paid approximately $2.9 million to extinguish the historical Brazilian tax liability.
The Company or one or more of totalits subsidiaries conducts business in multiple locations within and outside U.S. Consequently, the Company is subject to periodic income tax examinations by domestic and foreign income tax authorities. Currently, the Company is undergoing routine, periodic income tax examinations in both domestic and foreign jurisdictions. It appears reasonably possible that the amounts of unrecognized compensation cost related to restricted stock awards granted under our stock plans. That cost isincome tax
F-41
benefits could change in the next twelve months as a result of such examinations; however, any potential payments of income tax, interest and penalties are not expected to be recognized oversignificant to the Company’s consolidated financial statements. With certain exceptions, the Company is no longer subject to U.S. federal income tax examinations for tax years ending prior to March 31, 2008, state and local income tax examinations for years ending prior to fiscal 2007 or significant foreign income tax examinations for years ending prior to fiscal 2006. With respect to the Company’s U.S. federal net operating loss carryforward, the short tax period ended March 31, 2007 remains open under statutes of limitations; whereby, the IRS may not adjust the income tax liability for this tax period, but may reduce the net operating loss carryforward and any other tax attribute carryforwards to future, open tax years.
In conjunction with the Zurn acquisition, the Company assumed certain tax liabilities, contingencies and refund claims of Jacuzzi Brands, Inc and its subsidiaries (“JBI”). A protective claim for refund had been filed with the IRS with respect to minimum tax credits (“MTC”) that had been allocated to JBI from a weighted-average periodconsolidated group to which it used to belong. The utilization of 2.1 years. the MTC by JBI on its US federal income tax return for the tax year ended September 30, 1995 was initially disallowed by the IRS as the group from which these credits were allocated was currently under examination by the IRS and the amount of the MTC was subject to change. Upon conclusion of this examination, the protective claim for refund was processed and the Company received this refund in December 2008. As a result, the Company recorded approximately $1.1 million of previously unrecognized tax benefits and $2.2 million of related accrued interest (net of US federal and state income taxes) of which $2.9 million was recorded through goodwill and $0.4 million was reflected as a reduction to income tax expense for the year ended March 31, 2009.
17. Related Party Transactions
Management Service Fees
The total fair valueCompany has a management services agreement with an affiliate of restrictedApollo for advisory and consulting services related to corporate management, finance, product strategy, investment, acquisitions and other matters relating to the business of the Company. Under the terms of the agreement, which became effective July 22, 2006 (and was amended and restated on February 7, 2007), the Company incurred $3.0 million of costs in each of the years ended March 31, 2009, 2010, and 2011, plus out-of-pocket expenses in each period. Unless the parties mutually agree to an earlier termination, this agreement will remain in effect for a term of twelve years, and shall automatically extend for successive one year terms thereafter, unless notice is given as set forth in the agreement. In addition, Apollo’s and/or its affiliates’ obligation to provide services under the agreement shall continue through and until the earlier of (i) the expiration of the term as defined above, (ii) a change of control or (iii) an initial public offering (as these terms are defined in the agreement).
Consulting Services
The Company has had a management consulting agreement (the “Cypress Agreement”) with Mr. George Sherman, the Company’s Chairman of the Board, and two entities controlled by Mr. Sherman, Cypress Group, LLC and Cypress Industrial Holdings, LLC (collectively, “Cypress”), since July 21, 2006. Effective February 7, 2007, the Cypress Agreement was amended and restated. The amended and restated agreement provides that Mr. Sherman has the right to serve as Non-Executive Chairman of the Board of Directors of the Company. The amended and restated agreement also eliminated the annual consulting fees payable to Mr. Sherman and/or Cypress, but maintained provisions for the reimbursement of certain out-of-pocket expenses incurred in connection with performing the agreement. Mr. Sherman did not receive any consulting fee during fiscal years 2009, 2010 or 2011. During fiscal year 2010 and 2011 the Company paid Mr. Sherman director fees, including $250,000 annually for his role as non-executive Chairman of the Board. In addition, Mr. Sherman and Cypress also received non-qualified stock awards vestedoptions in fiscal 2008 under the agreement. Options to purchase 130,743 shares of Rexnord stock previously granted to Cypress in connection with the Cypress Agreement were cancelled, at Cypress’ request, in October 2009. In addition, under the agreement, Mr. Sherman received reimbursement of out-of-pocket expenses during fiscals 2005fiscal years 2009, 2010 and 2006, based on2011.
F-42
During the closing price onyears ended March 31, 2009, 2010, and 2011 the vesting date, was $3.5Company paid fees of approximately $1.1 million, $0.7 million, and $4.8$0.4 million, respectively. David H. Clarke retiredrespectively, for consulting services provided by Next Level Partners, L.L.C. (“NLP”), an entity that is controlled by certain minority stockholders of the Company. NLP provided consulting services to the Company related primarily to lean manufacturing processes, consolidation and integration of operations, strategic planning and recruitment of managers and executives.
Stockholders’ Agreements
Pursuant to two stockholders agreements, entered into in connection with the consummation of the Apollo transaction, between Rexnord, affiliates of Apollo (the “Apollo Group”), certain other stockholders of Rexnord, Cypress Industrial Holdings, LLC and/or George M. Sherman: (1) as long as the Apollo Group owns any shares of Rexnord common stock, it has the right to nominate a majority of the Rexnord board of directors and (2) Mr. Sherman has the right to serve as a director of the Company until he resigns as a director or ceases to serve the Company under the consulting agreement with Cypress. In addition, pursuant to the Cypress Agreement, Mr. Sherman has agreed to serve as Non-Executive Chairman of the Board of Directors of the Company. The stockholders agreements also include other provisions which, among other things, provide (for non-Apollo stockholders) restrictions on transfer, certain registration and “tag along” rights and certain rights of repurchase.
Debt Transactions and Purchases of Debt Securities
In April 2008, Cypress Group Holdings II, LLC, purchased approximately $0.5 million (approximately $0.6 million face value or 0.2133% of the total commitment) of the senior subordinated notes due 2016 of RBS Global. Additionally, in April 2008, Mr. Sherman purchased approximately $2.0 million (approximately $3.0 million face value or 0.5798% of the total commitment) of the outstanding debt of Rexnord, which debt is outstanding pursuant to a Credit Agreement dated March 2, 2007 between Rexnord, various lenders thereunder and an affiliate of Credit Suisse, as administrative agent. In August 2009, Cypress Group Holdings II, LLC, an entity controlled by Mr. George Sherman, the Chairman of the Board, purchased approximately $2.1 million (approximately $2.5 million face value or 0.8333% of the total commitment) of the senior subordinated notes due 2016 of RBS Global.
During fiscal 2010, Mr. Adams, a director and President and Chief Executive Officer of the Company, on August 31, 2006 and as Chairman and memberpurchased approximately $0.1 million (approximately $0.1 million face value or 0.1% of the boardtotal commitment) of directors effective September 30, 2006. We recorded $2.6the senior subordinated notes due 2016 of RBS Global.
In December 2008, Mr. Praveen Jeyarajah, the current Executive Vice President—Corporate and Business Development and a director, purchased approximately $0.2 million related to his separation agreement(approximately $0.3 million face value or 0.1% of the total commitment) of the senior subordinated notes due 2016 of RBS Global. Additionally, in fiscal 2006,August 2009, Mr. Jeyarajah, purchased approximately $0.2 million (approximately $0.2 million face value or 0.1% of whichthe total commitment) of the senior subordinated notes due 2016 of RBS Global.
In March 2009, Mr. George C. Moore, Executive Vice President of the Company, purchased approximately $1.2$0.3 million related to stock-based compensation awards and(approximately $0.4 million face value or 0.1% of the remainder was cash charges. total commitment) of the senior subordinated debt due 2016 of RBS Global.
Other
In connection with his retirement,the acquisition of the water management businesses (“Zurn”) in fiscal 2007, the Company accelerated the remaining unrecognized compensation expenseincurred certain payroll and administrative costs on behalf of approximately $0.6 million for 244,115 unvested shares which were subject to acceleration of vesting upon his retirement. Additionally, the Company modified the vesting terms for 75,000 shares of unvested restricted stock and recorded $0.6 million in connection with this modification.
Note 9—Capital Stock
Common Stock
In March 2001, our board of directors indefinitely suspended the quarterly payment of dividends on our common stock.
Stockholder Rights Plan
We adopted a Stockholder Rights PlanBath Acquisition Corp. (“Bath”) (the “Rights Plan”) effective October 15, 1998. Under the Rights Plan, each of our stockholders on the date of record were issued one right (the “Right”) to acquire one-hundredth of a share of our Series A Junior Preferred Stock (“Preferred Stock”), having a market value of two times the exercise price for the Rights, for each outstanding shareformer bath segment of Jacuzzi Brands, Inc. common stock they own., which was subsequently purchased by an Apollo affiliate). These costs were reimbursed to the Company by Bath on a monthly basis. During the year ended March 31, 2009 the
Initially,
F-43
Company received reimbursements of approximately $0.9 million. As of March 31, 2009 the Rights tradeCompany has fully transitioned the payment of these costs to Bath and has been fully reimbursed for all costs incurred on its behalf and therefore, no reimbursements were made during the years ended March 31, 2010 and 2011. In addition, the Company’s engineering and sourcing center in Zhuhai, China has an agreement with our common stockBath to perform certain sourcing, engineering and product development services that are not exercisable. The Rights will separate from the Common Stock and only become exercisable when a single person or company acquires or makes an offer to acquire 15% or more of our outstanding common stock, unless otherwise agreed by our board of directors. Upon exercise of the Right, the economic and voting terms of the Preferred Stock acquiredreimbursed based on actual costs incurred by the stockholders will be equivalent to those possessed when they held sharesCompany. The Company earned $0.4 million, $0.2 million and $0.1 million during fiscal 2009, 2010 and 2011, respectively for services rendered under this agreement. At March 31, 2011 the Company had an outstanding receivable from Bath in the amount of our Common Stock.
Jacuzzi Brands, Inc.$0.1 million.
Notes to Consolidated Financial Statements—(Continued)
The Rights will expire on October 15, 2008 or 90 days following the date the Rights become exercisable, whichever is earlier. The board of directors has agreed to permit Southeastern Asset Management, Inc. and its managed funds to purchase up to 24.0% of the outstanding voting securities without causing the Rights to separate and become exercisable, and we have entered into a standstill agreement with Southeastern Asset Management containing limitations and restrictions on the voting and transfer of shares of common stock acquired in excess of 15%.
Note 10—18. Commitments and Contingencies
Operating Leases
The table below shows our future minimum lease payments due under non-cancelable leases asCompany’s subsidiaries are involved in various unresolved legal actions, administrative proceedings and claims in the ordinary course of September 30, 2006. Certain of these leases contain stated escalation clauses while others contain renewal options. These minimum lease payments (presentedbusiness involving, among other things, product liability, commercial, employment, workers’ compensation, intellectual property claims and environmental matters. The Company establishes reserves in millions) have not been reduced by minimum sublease rental income; however, they include facility leasesa manner that were accrued as restructuringis consistent with accounting principles generally accepted in the United States for costs (seeNote 4).
2007 | $ | 12.7 | |
2008 | 9.8 | ||
2009 | 7.9 | ||
2010 | 6.9 | ||
2011 | 5.7 | ||
Thereafter | 8.6 | ||
| $ | 51.6 | ||
Rent expense, including equipment rental, was approximately $15.6 million, $15.4 million and $16.3 million in 2004, 2005 and 2006, respectively.
Environmental Regulation
We are subject to numerous foreign, federal, state and local laws and regulations concerningassociated with such matters as zoning, health and safety and protection of the environment. Laws and regulations protecting the environment may in certain circumstances impose “strictwhen liability” rendering a person liable for environmental damage without regard to negligence or fault on the part of such person. In addition, from time to time, we may receive notices of violation or may be denied applications for environmental licenses or permits because the practices of the operating unit are not consistent with regulations or ordinances.
Our subsidiaries have made capital and maintenance expenditures over time to comply with these laws and regulations. While the amount of expenditures in future years will depend on legal and technological developments which cannot be predicted at this time, these expenditures may progressively increase if regulations become more stringent. In addition, while future costs for compliance cannot be predicted with precision, no information currently available reasonably suggests that these expenditures will have a material adverse effect on our financial condition, results of operations or cash flows.
We are investigating and remediating contamination at a number of present and former operating sites under the Federal Comprehensive Environmental Response, Compensation and Liability Act of 1980 (“CERCLA” or “Superfund”), the Federal Resource Conservation and Recovery Act or comparable state statutes or agreements with third parties. These proceedings are in various stages ranging from initial investigations to active settlement negotiations to the cleanup of sites. We have been named as a potentially responsible party at a number of
Jacuzzi Brands, Inc.
Notes to Consolidated Financial Statements—(Continued)
Superfund sites under CERCLA or comparable state statutes. Under these statutes, responsibility for the entire cost of cleanup of a contaminated site can be imposed upon any current or former site owner or operator, or upon any party who sent waste to the site, regardless of the lawfulness of the original activities that led to the contamination. No information currently available reasonably suggests that projected expenditures associated with any of these proceedings or any remediation of these sites will have a material adverse effect on our financial condition, results of operations or cash flows.
As of September 30, 2006, we had accrued approximately $8.1 million ($0.6 million accrued as current liabilities and $7.5 million as non-current liabilities), including $5.8 million for discontinued operations, for environmental liabilities. These amounts have not been discounted. In conjunction with some of these liabilities, we have deposited $10.2 million in escrow accounts pursuant to the terms of past disposal agreements. We accrue an amount for each case when the likelihood of an unfavorable outcome is probable and those costs are capable of being reasonably estimated. Although it is not possible to predict with certainty the amountoutcome of loss associated with such unfavorable outcome is reasonably estimable. We believe thatthese unresolved legal actions or the range of liability forpossible loss or recovery, based upon current information, management believes the eventual outcome of these matters would only increase by $0.1 million if it included cases whereunresolved legal actions, either individually or in the likelihood of an unfavorable outcome is only reasonably possible. During the third quarter of 2006, we entered into a settlement agreement with Ames True Temper, Inc. regarding our environmental liabilities. We surrendered the cash that was deposited in escrow for these matters and paid $2.5 million in return for our release from all pending claims and any future environmental liabilities associated with Ames True Temper, Inc.
We cannot predict whether future developments in laws and regulations concerning environmental protection or unanticipated enforcement actions will require material capital expenditures or otherwise affect our financial condition, results of operations or cash flows in a materially adverse manner, or whether our businesses will be successful in meeting future demands of regulatory agencies in a manner whichaggregate, will not have a material adverse effect on ourthe financial condition,position, results of operations or cash flows.flows of the Company.
Litigation
WeIn connection with the Carlyle Group (“Carlyle”) acquisition in November 2002, Invensys plc has provided the Company with indemnification against certain contingent liabilities, including certain pre-closing environmental liabilities. The Company believes that, pursuant to such indemnity obligations, Invensys is obligated to defend and our subsidiaries are parties to legal proceedings that we believe to be either ordinary, routine litigation incidentalindemnify the Company with respect to the businessmatters described below relating to the Ellsworth Industrial Park Site and to various asbestos claims. The indemnity obligations relating to the matters described below are not subject to any time limitations and are subject to an overall dollar cap equal to the purchase price, which is an amount in excess of present$900 million. The following paragraphs summarize the most significant actions and former operationsproceedings:
In 2002, Rexnord Industries, LLC (“Rexnord Industries”) was named as a potentially responsible party (“PRP”), together with at least ten other companies, at the Ellsworth Industrial Park Site, Downers Grove, DuPage County, Illinois (the “Site”), by the United States Environmental Protection Agency (“USEPA”), and the Illinois Environmental Protection Agency (“IEPA”). Rexnord Industries’ Downers Grove property is situated within the Ellsworth Industrial Complex. The USEPA and IEPA allege there have been one or immaterialmore releases or threatened releases of chlorinated solvents and other hazardous substances, pollutants or contaminants, allegedly including but not limited to our financial condition, resultsa release or threatened release on or from the Company’s property, at the Site. The relief sought by the USEPA and IEPA includes further investigation and potential remediation of operations the Site and reimbursement of USEPA’s past costs. Rexnord Industries’ allocated share of past and future costs related to the Site, including for investigation and/or cash flows.remediation, could be significant.
Certain of our subsidiaries are defendants or plaintiffs in lawsuits that have arisen in the normal course of business. While certain of these matters involve substantial amounts, it is management’s opinion, based on the advice of counsel, that the ultimate resolution of such litigation and environmental matters will not have a material adverse effect on our financial condition, results of operations or cash flows.
We are aware of four purported class actionAll previously pending lawsuits related to the merger filed againstSite have been settled and dismissed. Pursuant to its indemnity obligation, Invensys continues to defend the Company eachin matters related to the Site and has paid 100% of the Company’s directors and various other defendants, as the case may be, including Apollo, Parent, Merger Subsidiary and George M. Sherman (the non-executive Chairman of Rexnord LLC, a portfolio company affiliated with Apollo),costs to date.
Multiple lawsuits (with approximately 1,435 claimants) are pending in the Court of Chancerystate or federal court in the State of Delaware in and for New Castle County. The lawsuits—Usheroff v. Jacuzzi Brands, Inc., et al., C.A. No. 2473-N (filed Oct. 13, 2006),Ryan v. Victor, et al., C.A. No. 2477-N (filed Oct. 13, 2006),Rubenstein v. Marini, et al., C.A. No. 2485-N (filed Oct. 20, 2006) andWorcester Retirement System v. Jacuzzi Brands, Inc., et al., C.A. No. 2531-N (filed Nov. 8, 2006)—generally allege, among other things, that the merger considerationnumerous jurisdictions relating to be paidalleged personal injuries due to the Company’s stockholdersalleged presence of asbestos in the merger is unfaircertain brakes and grossly inadequate. In addition, the complaints allege thatclutches previously manufactured by the Company’s directors violated their fiduciary duties by, among other things, failingStearns division and/or its predecessor owners. Invensys and FMC, prior owners of the Stearns business, have paid 100% of the costs to take all reasonable steps to assure the maximization of stockholder value, including the exploration of strategic alternatives that will return greater or equivalent short-term valuedate related to the Stearns lawsuits. Similarly, the Company’s stockholders. CertainPrager subsidiary is a defendant in two pending multi-defendant lawsuits relating to alleged personal injuries due to the alleged presence of asbestos in a product allegedly manufactured by Prager. Additionally, there are approximately 3,700 individuals who have filed asbestos related claims against Prager; however, these
F-44
claims are currently on the Texas Multi-district Litigation inactive docket. The ultimate outcome of these asbestos matters cannot presently be determined. To date, the Company’s insurance providers have paid 100% of the costs related to the Prager asbestos matters. The Company believes that the combination of its insurance coverage and the Invensys indemnity obligations will cover any future costs of these matters. |
In connection with the Falk Corporation (“Falk”) acquisition, Hamilton Sundstrand has provided the Company with indemnification against certain contingent liabilities, including coverage for certain pre-closing environmental liabilities. The Company believes that, pursuant to such indemnity obligations, Hamilton Sundstrand is obligated to defend and indemnify the Company with respect to the asbestos claims described below, and that, with respect to these claims, such indemnity obligations are not subject to any time or dollar limitations. The following paragraph summarizes the most significant actions and proceedings for which Hamilton Sundstrand has accepted responsibility:
Falk, through its successor entity, is a defendant in approximately 200 lawsuits pending in state or federal court in numerous jurisdictions relating to alleged personal injuries due to the alleged presence of asbestos in certain clutches and drives previously manufactured by Falk. There are approximately 570 claimants in these suits. The ultimate outcome of these lawsuits cannot presently be determined. Hamilton Sundstrand is defending the Company in these lawsuits pursuant to its indemnity obligations and has paid 100% of the complaints further allege that the preliminary proxy
Jacuzzi Brands, Inc.
Notescosts to Consolidated Financial Statements—(Continued)date.
statement on Form 14A filed by the Company on November 2, 2006 is materially misleadingCertain Water Management subsidiaries are also subject to asbestos and omits material facts. The complaints each seek, among other relief, certification of the lawsuit as a class action a declaration that the merger is unfair, unjustrelated litigation. As of March 31, 2011, Zurn and inequitable to the Company’s stockholders, an injunction preventing completionaverage of the merger at a price that is not fair and equitable, compensatory damages to the class, attorneys’ fees and expenses, along with such other relief as the court might find just and proper. In addition, the complaint filed by Worcester Retirement System seeks expedited discovery and preliminary injunction proceedings. Additional lawsuits pertaining to the merger could be filed in the future. The Company has reached an agreement in principle to settle these lawsuits. Please refer to Note 14 for further information on the proposed settlement.
In June 1998, we acquired Zurn which operates as one of our wholly-owned subsidiaries. At the time of the acquisition, Zurn had itself owned various subsidiaries. Zurn, along with manyapproximately 80 other unrelated companies is a co-defendantwere defendants in numerousapproximately 7,000 asbestos related lawsuits pending in the U.S.representing approximately 28,500 claims. Plaintiffs’ claims primarily allege personal injuries allegedly caused by exposure to asbestos used primarily in industrial boilers formerly manufactured by a segment of Zurn that has been accounted for as a discontinued operation.Zurn. Zurn did not manufacture asbestos or asbestos components. Instead, Zurn purchased itthem from suppliers.
Federal legislation has been proposed that would remove asbestos These claims from the current tort system and place them in a trust fund system. This trust would be funded by the insurers and defendant companies. There can be no assurance as to when or if this or any other legislation will be passed and become law or what, if any, the financial impact it could have on Zurn.
New claims filed against Zurn decreased year-over-year. During 2005, approximately 10,400 new asbestos claims were filed against Zurn versus 6,400 in 2006. As of October 2, 2004, the number of asbestos claims pending against Zurn was approximately 69,900 compared to 46,200 as of September 30, 2006. The pending claims against Zurn as of September 30, 2006 were included in approximately 4,900 lawsuits, in which Zurn and an average of 80 other companies are named as defendants, and which cumulatively allege damages of approximately $11.2 billion against all defendants. The claims arebeing handled pursuant to a defense strategy funded by Zurn’s insurers. Defense costs currently do not erodeAs of March 31, 2011, the coverage amounts inCompany estimates the insurance policies, although a few policies that will be accessed in the future may count defense costs toward aggregate limits.
During 2005 and as of the end of such period, approximately 17,000 claims were paid and/or pending payment and approximately 13,600 claims were dismissed and/or pending dismissal. During 2006 and as of the end of such period, approximately 16,300 claims were paid and/or pending payment and approximately 24,600 claims were dismissed and/or pending dismissal. Since Zurn received its first asbestos claim in the 1980s, Zurn has paid or dismissed or agreed to settle or dismiss approximately 115,900 asbestos claims, including dismissals or agreements to dismiss of approximately 23,900 of such claims through the end of 2005, compared to 146,900 and 48,900 claims, respectively, through the end of 2006.
Zurn uses an independent economic consulting firm with substantial experience in asbestos liability valuations to assist in the estimation of Zurn’s potential asbestos liability. At September 30, 2006, that firm estimated that Zurn’s potential liability for asbestosasbestos-related claims pending against it and forZurn as well as the claims estimatedexpected to be filed through 2016 isin the next ten years to be approximately $136$65.0 million of which Zurn expects to pay approximately $102$53.0 million through 2016in the next ten years on such claims, with the balance of the estimated liability being paid in subsequent years. As discussed below in more detail, Zurn expects all such payments to be paid by its carriers.
This asbestos liability estimate was based on the current and anticipated number of future asbestos claims, the timing and amounts of asbestos payments, the status of ongoing litigation and the potential impact of defense strategies and settlement initiatives. However, there are inherent uncertainties involved in estimating the number
Jacuzzi Brands, Inc.
Notes to Consolidated Financial Statements—(Continued)
of future asbestos claims, future settlement costs, and the effectiveness of Zurn’s defense strategies and settlement initiatives. In addition, Zurn’s current estimate could be affected due to changes in law and other factors beyond its control.
As a result, Zurn’s actual liability could differ from Zurn’sthe estimate described herein. Zurn’s current estimate of its asbestos liability of $136 million for claims filed through 2016 assumes that (i) its continuous vigorous defense strategy will remain effective; (ii) new asbestos claims filed annually against it will decline modestly through 2016; (iii) the values by disease will remain consistent with past experience; and (iv) its insurers will continue to pay defense costs without eroding the coverage amounts of its insurance policies. While Zurn believes there is evidence, in its claims settlements experience, for such an impact of a successful defense strategy, if the defense strategy ultimately is not successful to the extent assumed by Zurn, the severity and frequency of asbestos claims could increase substantially above Zurn’s estimates. Further, while Zurn’sthis current asbestos liability is based on an estimate of claims through 2016,the next ten years, such liability may continue beyond 2016,that time frame, and such liability could be substantial.
Zurn estimated that its available insurance to cover its potential asbestos liability as of October 1, 2005 was approximately $293 million. ZurnManagement estimates that its available insurance to cover its potential asbestos liability as of September 30, 2006March 31, 2011, is approximately $286 million. The decrease in$266.3 million, and believes that all current claims are covered by this insurance. However, principally as a result of the amountpast insolvency of available insurance reflectscertain of the payments made during 2006. Zurn believes, based on its experience in defending and dismissing such claims and the coverage available, that it has sufficient insurance to cover the pending and reasonably estimable future claims. This conclusion was reached after considering Zurn’s experience in asbestos litigation, the insurance payments made to date by Zurn’sCompany’s insurance carriers, existing insurance policies,certain coverage gaps will exist if and after the industry ratingsCompany’s other carriers have paid the first $190.3 million of aggregate liabilities. In order for the insurers and the advicenext $51.0 million of insurance coverage counsel with respectfrom solvent carriers to applicable insuranceapply, management estimates that it would need to satisfy $14.0 million of asbestos claims. Layered within the final $25.0 million of the total $266.3 million of coverage, law relatingmanagement estimates that it would need to satisfy an additional $80.0 million of asbestos claims. If required to pay any such amounts, the terms and conditionsCompany could pursue recovery against the insolvent carriers, but it is not currently possible to determine the likelihood or amount of those policies. such recoveries, if any.
As of October 1, 2005 and September 30, 2006, ZurnMarch 31, 2011, the Company recorded a receivable from its insurance carriers of $153$65.0 million, and $136 million, respectively, which corresponds to the amount of Zurn’sits potential asbestos liability that is covered by available insurance and is currently determined to be probable of recovery. However, there is no assurance that $286$266.3 million of insurance coverage will ultimately be available or that Zurn’s asbestos liabilities will not ultimately exceed $286$266.3 million.
F-45
Factors that could cause a decrease in the amount of available coverage includeinclude: changes in law governing the policies, potential disputes with the carriers onregarding the scope of coverage, and insolvencies of one or more of Zurn’sthe Company’s carriers.
PrincipallyAs of May 12, 2011, subsidiaries, Zurn Pex, Inc. and Zurn Industries, LLC (formerly known as a resultZurn Industries, Inc.), have been named as defendants in fourteen lawsuits, brought between July 2007 and December 2009, in various U.S. courts (MN, ND, CO, NC, MT, AL, VA, LA, NM, MI and HI). The plaintiffs in these suits represent (in the case of the past insolvencyproceedings in Minnesota), or seek to represent, a class of plaintiffs alleging damages due to the alleged failure or anticipated failure of the Zurn brass crimp fittings on the Pex plumbing systems in homes and other structures. The complaints assert various causes of action, including but not limited to negligence, breach of warranty, fraud, and violations of the Magnuson Moss Act and certain state consumer protection laws, and seek declaratory and injunctive relief, and damages (including punitive damages). All but the Hawaii suit, which remains in Hawaii state court, have been transferred to a multi-district litigation docket in the District of Zurn’s insurance carriers, coverage analysis reveals thatMinnesota for coordinated pretrial proceedings. The court in the Minnesota proceedings certified certain gaps existclasses of plaintiffs in Zurn’sMinnesota for negligence and negligent failure to warn claims and for breach of warranty claims. While the Company has sought reconsideration and appeal of the class certification decision in the Minnesota proceedings, and will otherwise vigorously defend itself in the various actions, the uncertainties of litigation and the uncertainties related to insurance coverage but only if and after Zurn uses approximately $216 millioncollection as well as the actual number or value of its remaining approximate $286 million of insurance coverage. As noted above,claims make it difficult to accurately predict the estimate of Zurn’s potential liability for asbestosfinancial effect these claims pending against it and for claims estimated to be filed through 2016 is $136 million withmay ultimately have on the expected amount to be paid through 2016 being $102 million. In order to use approximately $261 million of the $286 million of its insurance coverage from solvent carriers, Zurn estimates that it would need to satisfy approximately $14 million of asbestos claims, with additional gaps of $80 million layered within the final $25 million of the $286 million of coverage. We will pursue, if necessary, any available recoveries on our approximately $148 million of coverage with insolvent carriers, which includes approximately $83 million of coverage attributable to the gaps discussed above. These estimates are subject to the factors noted above.
After review of the foregoing with Zurn and its consultants, we believe that the resolution of Zurn’s pending and reasonably estimable asbestos claims will not have a material adverse effect on Zurn’s financial condition, results of operations or cash flows.Company.
Note 11—19. Business Segment Information
The results of operations are reported in two business segments, consisting of the Bath Products segmentProcess & Motion Control platform and the Plumbing Products segment. Our Bath ProductsWater Management platform. The Process & Motion Control product portfolio includes gears, couplings, industrial bearings, aerospace bearings and seals, FlatTop™ modular belting, engineered chain and conveying equipment. This segment serves a diverse group of end-markets, including mining, general industrial applications, cement and aggregate, agriculture, forest and wood products, petrochemical, energy, food & beverage, aerospace and wind energy. The Water Management platform designs, procures, manufactures whirlpool baths, spas, showers,
Jacuzzi Brands, Inc.
Notes to Consolidated Financial Statements—(Continued)
sanitary ware, including sinks and toilets,markets products that provide and bathtubsenhance water quality, safety, flow control and conservation. The Water Management product portfolio includes professional grade specification drainage products, flush valves and faucet products, backflow prevention pressure release valves, Pex piping and engineered valves and gates for the constructionwater and remodeling markets. Our Plumbing Products segment manufactures professional grade drainage, water control, commercial brass and PEX piping products for the commercial and institutional construction, renovation and facilities maintenance markets. Prior periods include the Rexair segment, which was sold in 2005.
wastewater treatment market. The financial information of ourthe Company’s segments is regularly evaluated by the chief operating decision makers in determining resource allocation and assessing performance and is periodically reviewed by our boardthe Company’s Board of directors. We evaluateDirectors. Management evaluates the performance of each business segment based on its operating results and, other than general corporate expenses, allocate specific corporate overhead to each segment.results. The same accounting policies are used throughout the organization (seeNote 2)2).
The following isFinancial data for fiscal 2009 and 2010 has been adjusted for the Company’s voluntary change in accounting for actuarial gains and losses related to its pension and other postretirement benefit plans. As a summaryresult, the previously reported segment information has been adjusted as appropriate. See Note 2 for a discussion of our financial information by segment, reconciled to our consolidated totals.the change and its impacts.
| Bath Products | Plumbing Products | Rexair | Corporate | Consolidated Total | ||||||||||||
| (in millions) | ||||||||||||||||
Net Sales | ||||||||||||||||
2004 | $ | 788.4 | $ | 308.0 | $ | 104.8 | $ | — | $ | 1,201.2 | ||||||
2005 | 780.8 | 353.1 | 76.1 | — | 1,210.0 | |||||||||||
2006 | 766.6 | 435.8 | — | — | 1,202.4 | |||||||||||
Operating Income (Loss) | ||||||||||||||||
2004 | $ | 57.2 | $ | 60.7 | $ | 27.3 | $ | (18.0 | ) | $ | 127.2 | |||||
2005 | 30.1 | 75.3 | 19.0 | (30.0 | ) | 94.4 | ||||||||||
2006 | 38.5 | 90.9 | — | (25.8 | ) | 103.6 | ||||||||||
Capital Expenditures | ||||||||||||||||
2004 | $ | 17.2 | $ | 3.5 | $ | 1.5 | $ | 0.8 | $ | 23.0 | ||||||
2005 | 18.0 | 4.0 | 0.4 | 0.3 | 22.7 | |||||||||||
2006 | 8.4 | 4.0 | — | 0.1 | 12.5 | |||||||||||
Depreciation and Amortization | ||||||||||||||||
2004 | $ | 11.8 | $ | 5.6 | $ | 3.3 | $ | 1.7 | $ | 22.4 | ||||||
2005 | 15.6 | 5.2 | 2.3 | 3.2 | 26.3 | |||||||||||
2006 | 17.2 | 4.4 | — | 2.8 | 24.4 | |||||||||||
Restructuring and Other Charges Included in Operating Income (Loss)(1) | ||||||||||||||||
2004 | $ | 3.5 | $ | — | $ | — | $ | (0.6 | ) | $ | 2.9 | |||||
2005 | 4.5 | — | — | 4.9 | 9.4 | |||||||||||
2006 | 7.0 | — | — | 0.2 | 7.2 | |||||||||||
Assets | ||||||||||||||||
At September 30, 2005 | $ | 480.9 | $ | 295.6 | $ | — | $ | 513.0 | $ | 1,289.5 | ||||||
At September 30, 2006 | $ | 466.0 | $ | 333.8 | $ | — | $ | 453.9 | $ | 1,253.7 | ||||||
F-46
Business Segment Information:
(In millions)
| March 31, 2009 (1) | March 31, 2010 (1) | March 31, 2011 | ||||||||||
Net sales | ||||||||||||
Process & Motion Control | $ | 1,321.7 | $ | 1,003.7 | $ | 1,175.1 | ||||||
Water Management | 560.3 | 506.3 | 524.5 | |||||||||
Consolidated | $ | 1,882.0 | $ | 1,510.0 | $ | 1,699.6 | ||||||
Income (loss) from operations | ||||||||||||
Process & Motion Control | $ | 15.6 | $ | 116.5 | $ | 181.1 | ||||||
Water Management | (212.8 | ) | 76.1 | 69.4 | ||||||||
Corporate | (174.1 | ) | (31.2 | ) | (31.4 | ) | ||||||
Consolidated | $ | (371.3 | ) | $ | 161.4 | $ | 219.1 | |||||
Non-operating (expense) income: | ||||||||||||
Interest expense, net | $ | (230.4 | ) | $ | (194.2 | ) | $ | (180.8 | ) | |||
Gain (loss) on the extinguishment of debt | 103.7 | 167.8 | (100.8 | ) | ||||||||
Other (expense) income, net | (3.0 | ) | (16.4 | ) | 1.1 | |||||||
(Loss) income before income taxes | (501.0 | ) | 118.6 | (61.4 | ) | |||||||
(Benefit) provision for income taxes | (72.0 | ) | 30.5 | (10.1 | ) | |||||||
Net (loss) income | $ | (429.0 | ) | $ | 88.1 | $ | (51.3 | ) | ||||
Intangible impairment charges (included in Income (loss) from operations) | ||||||||||||
Process & Motion Control | $ | 149.0 | $ | — | $ | — | ||||||
Water Management | 273.0 | — | — | |||||||||
Consolidated | $ | 422.0 | $ | — | $ | — | ||||||
Restructuring and other similar costs (included in Income (loss) from operations) | ||||||||||||
Process & Motion Control | $ | 16.5 | $ | 6.3 | $ | — | ||||||
Water Management | 7.8 | 0.5 | — | |||||||||
Corporate | 0.2 | — | — | |||||||||
Consolidated | $ | 24.5 | $ | 6.8 | $ | — | ||||||
Depreciation and Amortization | ||||||||||||
Process & Motion Control | $ | 81.7 | $ | 83.0 | $ | 79.4 | ||||||
Water Management | 27.9 | 26.3 | 26.7 | |||||||||
Consolidated | $ | 109.6 | $ | 109.3 | $ | 106.1 | ||||||
Capital Expenditures | ||||||||||||
Process & Motion Control | $ | 35.2 | $ | 17.0 | $ | 32.1 | ||||||
Water Management | 3.9 | 5.0 | 5.5 | |||||||||
Consolidated | $ | 39.1 | $ | 22.0 | $ | 37.6 | ||||||
| March 31, 2009 | March 31, 2010 | March 31, 2011 | ||||||||||
Total Assets | ||||||||||||
Process & Motion Control | $ | 2,324.0 | $ | 2,170.0 | $ | 2,305.7 | ||||||
Water Management | 828.7 | 799.1 | 765.0 | |||||||||
Corporate | 66.1 | 47.4 | 29.0 | |||||||||
Consolidated | $ | 3,218.8 | $ | 3,016.5 | $ | 3,099.7 | ||||||
| (1) |
Aside from the operating income (loss) amounts noted above, our income from continuing operations includes interest income and expense, other income and expense items and income taxes, none of which are included in our measurement of segment operating profit. Corporate includes pension income of $10.3 million, $7.2 million and $5.2 million for 2004, 2005 and 2006, respectively. Corporate assets consist primarily of real property, assets held for sale, escrow deposits, cash and cash equivalents and other investments.
Jacuzzi Brands, Inc.
Notes to Consolidated Financial Statements—(Continued)
Our operationsF-47
Net sales to third parties and long-lived assets by geographic region are principally locatedas follows (in millions):
| Net Sales | Long-lived Assets | |||||||||||||||||||||||
| Year Ended March 31, 2009 | Year Ended March 31, 2010 | Year Ended March 31, 2011 | March 31, 2009 | March 31, 2010 | March 31, 2011 | |||||||||||||||||||
United States | $ | 1,431.0 | $ | 1,119.0 | $ | 1,212.8 | $ | 325.6 | $ | 292.8 | $ | 274.7 | ||||||||||||
Europe | 252.2 | 186.5 | 230.6 | 62.2 | 55.6 | 52.8 | ||||||||||||||||||
Rest of World | 198.8 | 204.5 | 256.2 | 25.7 | 27.8 | 30.9 | ||||||||||||||||||
| $ | 1,882.0 | $ | 1,510.0 | $ | 1,699.6 | $ | 413.5 | $ | 376.2 | $ | 358.4 | |||||||||||||
Net sales to third parties are attributed to the geographic regions based on the country in North America and Europe andwhich the shipment originates. Amounts attributed to a lesser extent, in otherthe geographic regions for long-lived assets are based on the location of the world. Our country of domicile is the U.S. Export sales represented 9%, 7%entity that holds such assets. In accordance with ASC 280-10Segment Reporting, long-lived assets includes moveable assets and 6% of total sales for 2004, 2005excludes net intangible assets and 2006, respectively. Principal international markets served include Europe, South America, Canada and Asia.
The following table presents summarized financial information by geographic area:
| For the Fiscal Years Ended September 30, | |||||||||||
| 2004 | 2005 | 2006 | |||||||||
| (in millions) | |||||||||||
Net Sales | |||||||||||
United States | $ | 825.2 | $ | 836.5 | $ | 850.9 | |||||
United Kingdom | 240.0 | 228.7 | 211.6 | ||||||||
Other foreign | 136.0 | 144.8 | 139.9 | ||||||||
| $ | 1,201.2 | $ | 1,210.0 | $ | 1,202.4 | ||||||
Operating Income (Loss)(1) | |||||||||||
United States | $ | 90.5 | $ | 70.2 | $ | 90.8 | |||||
United Kingdom | 12.6 | (2.0 | ) | (13.5 | ) | ||||||
Other foreign | 24.1 | 26.2 | 26.3 | ||||||||
| $ | 127.2 | $ | 94.4 | $ | 103.6 | ||||||
Long-lived Assets (at period end) | |||||||||||
United States | $ | 228.3 | $ | 221.6 | |||||||
United Kingdom | 92.4 | 89.6 | |||||||||
Other foreign | 11.2 | 12.7 | |||||||||
| $ | 331.9 | $ | 323.9 | ||||||||
Jacuzzi Brands, Inc.goodwill.
Notes to Consolidated Financial Statements—(Continued)20. Quarterly Results of Operations (unaudited)
Note 12—Quarterly Financial Data (Unaudited)
Summarized quarterly financial information for the years ended September 30, 2005 and 2006 is as follows (in(in millions, except per share amounts):
Financial data for all quarters of fiscal 2010 and for the first three quarters of fiscal 2011 have been adjusted for the Company’s voluntary change in accounting for actuarial gains and losses related to its pension and other postretirement benefit plans. As a result, the previously reported information has been adjusted as appropriate. See Note 2, Significant Accounting Policies.
| For the Fiscal 2005 Quarters Ended | For the Fiscal 2006 Quarters Ended | |||||||||||||||||||||||||
| Dec. 31 | March 31 | June 30 | Sept. 30 | Dec. 31 | March 31 | June 30 | Sept. 30 | |||||||||||||||||||
Net sales | $ | 281.5 | $ | 301.0 | $ | 334.2 | $ | 293.3 | $ | 267.1 | $ | 289.2 | $ | 332.6 | $ | 313.5 | ||||||||||
Gross profit | 90.7 | 94.1 | 110.7 | 94.1 | 82.2 | 90.8 | 107.0 | 100.5 | ||||||||||||||||||
Earnings from continuing operations | 6.6 | 8.6 | 37.9 | 4.9 | 12.1 | 7.1 | (1.0 | ) | 25.6 | |||||||||||||||||
Net earnings (loss) | 5.5 | 7.4 | (20.8 | ) | 2.3 | 10.7 | 4.1 | (3.9 | ) | 29.5 | ||||||||||||||||
Earnings (loss) per basic common share: | ||||||||||||||||||||||||||
Continuing operations | $ | 0.09 | $ | 0.11 | $ | 0.50 | $ | 0.06 | $ | 0.16 | $ | 0.09 | $ | (0.01 | ) | $ | 0.34 | |||||||||
Net earnings (loss) | 0.07 | 0.10 | (0.28 | ) | 0.03 | 0.14 | 0.05 | (0.05 | ) | 0.39 | ||||||||||||||||
Earnings (loss) per diluted common share: | ||||||||||||||||||||||||||
Continuing operations | $ | 0.09 | $ | 0.11 | $ | 0.50 | $ | 0.06 | $ | 0.16 | $ | 0.09 | $ | (0.01 | ) | $ | 0.33 | |||||||||
Net earnings (loss) | 0.07 | 0.10 | (0.27 | ) | 0.03 | 0.14 | 0.05 | (0.05 | ) | 0.38 | ||||||||||||||||
| Fiscal 2010 | ||||||||||||||||||||
| First Quarter | Second Quarter | Third Quarter | Fourth Quarter | Total | ||||||||||||||||
Net sales | $ | 367.9 | $ | 369.7 | $ | 365.7 | $ | 406.7 | $ | 1,510.0 | ||||||||||
Gross profit as previously reported | 114.6 | 124.7 | 124.1 | 148.6 | 512.0 | |||||||||||||||
Effect of pension policy change | (1.1 | ) | (1.2 | ) | (0.7 | ) | (0.6 | ) | (3.6 | ) | ||||||||||
Gross profit as adjusted | 115.7 | 125.9 | 124.8 | 149.2 | 515.6 | |||||||||||||||
Net income (loss) as previously reported | 82.3 | (2.3 | ) | 8.2 | (3.1 | ) | 85.1 | |||||||||||||
Effect of pension policy change, net of tax | 2.2 | 3.7 | 3.1 | (6.0 | ) | 3.0 | ||||||||||||||
Net income (loss) as adjusted | $ | 84.5 | $ | 1.4 | $ | 11.3 | $ | (9.1 | ) | $ | 88.1 | |||||||||
Net income (loss) per share: | ||||||||||||||||||||
Basic | $ | 5.27 | $ | 0.09 | $ | 0.71 | $ | (0.57 | ) | $ | 5.49 | |||||||||
Diluted | $ | 4.98 | $ | 0.08 | $ | 0.70 | $ | (0.57 | ) | $ | 5.30 | |||||||||
Operating income
F-48
| Fiscal 2011 | ||||||||||||||||||||
| First Quarter | Second Quarter | Third Quarter | Fourth Quarter | Total | ||||||||||||||||
Net sales | $ | 407.3 | $ | 412.3 | $ | 419.8 | $ | 460.2 | $ | 1,699.6 | ||||||||||
Gross profit as previously reported | 141.2 | 145.0 | 144.0 | — | 430.2 | |||||||||||||||
Effect of pension policy change | (0.6 | ) | (0.5 | ) | (1.1 | ) | — | (2.2 | ) | |||||||||||
Gross profit as adjusted | 141.8 | 145.5 | 145.1 | 164.4 | 596.8 | |||||||||||||||
Net (loss) income as previously reported | (78.1 | ) | 20.7 | (0.3 | ) | — | (57.7 | ) | ||||||||||||
Effect of pension policy change, net of tax | 1.2 | 1.2 | 1.3 | — | 3.7 | |||||||||||||||
Net (loss) income as adjusted | $ | (76.9 | ) | $ | 21.9 | $ | 1.0 | $ | 2.7 | $ | (51.3 | ) | ||||||||
Net (loss) income per share: | ||||||||||||||||||||
Basic | $ | (4.79 | ) | $ | 1.37 | $ | 0.06 | $ | 0.17 | $ | (3.20 | ) | ||||||||
Diluted | $ | (4.79 | ) | $ | 1.30 | $ | 0.06 | $ | 0.16 | $ | (3.20 | ) | ||||||||
21. Subsequent Events
Acquisitions
On April 2, 2011, the Company acquired Autogard Holdings Limited and affiliates (“Autogard”) for a total cash purchase price of $18.6 million subject to a final customary working capital adjustment. Autogard is a European-based manufacturer of torque limiters and couplings. The acquisition further expands the Company’s global Process & Motion Control platform. Autogard’s premium brand of torque limiter products complement the Company’s leading power transmission product offering and will allow Rexnord to provide increased support to its global customer base.
Extinguishment of PIK Toggle Senior Indebtedness Due 2013
On May 6, 2011, Rexnord received a dividend from its subsidiaries, substantially all of which has been or will be used to retire all of the outstanding PIK toggle senior indebtedness due 2013. Redemption of the PIK toggle senior indebtedness will be at par. PIK Toggle Loans in 2005 includes restructuring chargesthe total principal amount of $1.5$53.7 million $0.7 million, $1.4 millionwere prepaid on May 13, 2011, and $5.8notice has been given of the redemption of $39.9 million in principal amount of PIK Toggle Notes, which represents the first, second, third and fourth quarters, respectively, associated primarilybalance of the PIK toggle senior indebtedness, which is expected to occur in June 2011. The Company expects to incur a pre-tax loss of approximately $1.0 million in connection with the reorganization and restructuringredemption of the PIK toggle senior management in the Bath Products segment and corporate offices, staffing reductions in the U.K. and domestic bath business and other overhead reductions. Earnings from continuing operations in the third quarter of 2005 include a $25.8 million gain on the sale of Rexair. The net loss in the third quarter of 2005 includes a loss of $56.0 million related to disposals of discontinued operations. The fourth quarter of 2005 includes a $2.5 million (including $0.5 million of interest) provision for the settlement of taxes on property.
Operating income in 2006 includes restructuring and other charges of $1.6 million, $1.6 million, $1.3 million and $2.7 million in the first, second, third and fourth quarters, respectively, associated primarily with the reorganization and restructuring of senior management in the Bath Products segment and corporate offices, staffing reductions in the U.K. and domestic bath business and other overhead reductions. Net earnings in the fourth quarter of 2006 include a $14.0 million reversal of a tax reserve. Operating income in the third quarter of 2006 included $2.9 million of expense related to the Company’s retiree benefit liabilities for several key executives which should have been recorded during the period beginning with the Company’s 1995 spin-off from Hanson plc to fiscal year end 2005. No single fiscal year was materially misstated. Earnings from continuing operationsindebtedness in the first quarter of 2006 include a $9.3fiscal 2012, which will be comprised of the non-cash write-off of deferred financing fees and net original issue discount associated with the debt.
Amendment and Restatement of AR Securitization Program
On May 20, 2011, the Company entered in an amendment and restatement of the AR Securitization Program. The maximum facility commitment of $100.0 million gain on collectionremains unchanged; however, the amendment expands the types of a note. The net loss inaccounts receivable that are considered eligible for sale under the third quarter of 2006 includes a non-cash charge of $14.4facility, establishes special concentration limits for certain customers, allows Rexnord Funding LLC to request that the facility be increased by $75.0 million relatedand increases certain fees payable to the establishment of a reserve for the deferred tax assets of its U.K. operations.GECC, among other revisions.
Jacuzzi Brands, Inc.
Notes to Consolidated Financial Statements—(Continued)
Note 13—Supplemental Joint Issuer and Guarantor Financial InformationF-49
The following represents the supplemental condensed consolidating financial statements of Jacuzzi Brands, Inc. (“JBI”), which is the issuer of our Senior Notes, the subsidiaries which are guarantors of the Senior Notes and our subsidiaries which are not guarantors of the Senior Notes as of September 30, 2004 and September 30, 2005 and for each of the three years in the period ended September 30, 2005. Certain of our existing and future domestic restricted subsidiaries guarantee the Senior Notes, jointly and severally, on a senior basis. The Senior Notes are secured by a first-priority lien on and security interest in substantially all of our domestic real property, plant and equipment (referred to as Notes Collateral). The Senior Notes are also secured by a second-priority lien on and security interest in the Bank Collateral (see Note 5). Separate condensed consolidated financial statements of each guarantor are not presented, as we have determined that they would not be material to investors.
| For the Fiscal Year Ended September 30, 2004 | ||||||||||||||||||||
| JBI | Combined Guarantor Subsidiaries | Combined Non-Guarantor Subsidiaries | Eliminations | Consolidated | ||||||||||||||||
| (in millions) | ||||||||||||||||||||
Net sales | $ | — | $ | 844.3 | $ | 363.9 | $ | (7.0 | ) | $ | 1,201.2 | |||||||||
Operating costs and expenses: | ||||||||||||||||||||
Cost of products sold | — | 556.3 | 253.1 | (7.0 | ) | 802.4 | ||||||||||||||
Selling, general and administrative expenses | 18.0 | 174.5 | 76.2 | — | 268.7 | |||||||||||||||
Impairment, restructuring and other charges | — | 2.9 | — | — | 2.9 | |||||||||||||||
Operating (loss) income | (18.0 | ) | 110.6 | 34.6 | — | 127.2 | ||||||||||||||
Interest expense | (48.9 | ) | (0.8 | ) | (0.8 | ) | — | (50.5 | ) | |||||||||||
Interest income | 2.6 | 1.6 | 0.5 | — | 4.7 | |||||||||||||||
Intercompany interest (expense) income, net | (13.9 | ) | 14.0 | (0.1 | ) | — | — | |||||||||||||
Equity, in earnings (losses) of investees, net | 97.7 | 15.9 | — | (113.6 | ) | — | ||||||||||||||
Other (expense) income, net | (0.1 | ) | (1.2 | ) | (1.9 | ) | — | (3.2 | ) | |||||||||||
Other intercompany (expense) income, net | (0.1 | ) | 2.3 | (2.2 | ) | — | — | |||||||||||||
Earnings (loss) before income taxes and discontinued operations | 19.3 | 142.4 | 30.1 | (113.6 | ) | 78.2 | ||||||||||||||
Benefit from (provision for) income taxes | 29.0 | (45.3 | ) | (13.6 | ) | — | (29.9 | ) | ||||||||||||
Earnings (loss) from continuing operations | 48.3 | 97.1 | 16.5 | (113.6 | ) | 48.3 | ||||||||||||||
(Loss) earnings from discontinued operations | (19.9 | ) | (19.9 | ) | (0.9 | ) | 20.8 | (19.9 | ) | |||||||||||
Net earnings (loss) | $ | 28.4 | $ | 77.2 | $ | 15.6 | $ | (92.8 | ) | $ | 28.4 | |||||||||
Jacuzzi Brands, Inc.
Notes to Consolidated Financial Statements—(Continued)
| For the Fiscal Year Ended September 30, 2005 | ||||||||||||||||||||
| JBI | Combined Guarantor Subsidiaries | Combined Non-Guarantor Subsidiaries | Eliminations | Consolidated | ||||||||||||||||
| (in millions) | ||||||||||||||||||||
Net sales | $ | — | $ | 863.3 | $ | 360.4 | $ | (13.7 | ) | $ | 1,210.0 | |||||||||
Operating costs and expenses: | ||||||||||||||||||||
Cost of products sold | — | 576.6 | 257.5 | (13.7 | ) | 820.4 | ||||||||||||||
Selling, general and administrative expenses | 24.8 | 178.7 | 82.3 | — | 285.8 | |||||||||||||||
Impairment, restructuring and other charges | 4.7 | 3.0 | 1.7 | — | 9.4 | |||||||||||||||
Operating (loss) income | (29.5 | ) | 105.0 | 18.9 | — | 94.4 | ||||||||||||||
Interest expense | (46.4 | ) | (0.7 | ) | (1.0 | ) | — | (48.1 | ) | |||||||||||
Interest income | 0.8 | 1.1 | 1.1 | — | 3.0 | |||||||||||||||
Intercompany interest (expense) income, net | (19.0 | ) | 18.0 | 1.0 | — | — | ||||||||||||||
Equity, in earnings (losses) of investees, net | 127.4 | 10.9 | — | (138.3 | ) | — | ||||||||||||||
Gain on sale of business | — | 24.7 | — | — | 24.7 | |||||||||||||||
Rexair equity earnings | — | 0.6 | — | — | 0.6 | |||||||||||||||
Other (expense) income, net | (5.8 | ) | (1.1) | 0.3 | — | (6.6 | ) | |||||||||||||
Other intercompany (expense) income, net | (10.2 | ) | 10.1 | 0.1 | — | — | ||||||||||||||
Earnings (loss) before income taxes and discontinued operations | 17.3 | 168.6 | 20.4 | (138.3 | ) | 68.0 | ||||||||||||||
Benefit from (provision for) income taxes | 40.7 | (41.2 | ) | (9.5 | ) | — | (10.0 | ) | ||||||||||||
Earnings (loss) from continuing operations | 58.0 | 127.4 | 10.9 | (138.3 | ) | 58.0 | ||||||||||||||
(Loss) earnings from discontinued operations | (63.6 | ) | (63.6 | ) | — | 63.6 | (63.6 | ) | ||||||||||||
Net earnings (loss) | $ | (5.6 | ) | $ | 63.8 | $ | 10.9 | $ | (74.7 | ) | $ | (5.6 | ) | |||||||
Jacuzzi Brands, Inc.
Notes to Consolidated Financial Statements—(Continued)
| For the Fiscal Year Ended September 30, 2006 | ||||||||||||||||||||
| JBI | Combined Guarantor Subsidiaries | Combined Non-Guarantor Subsidiaries | Eliminations | Consolidated | ||||||||||||||||
| (in millions) | ||||||||||||||||||||
Net sales | $ | — | $ | 859.9 | $ | 354.8 | $ | (12.3 | ) | $ | 1,202.4 | |||||||||
Operating costs and expenses: | ||||||||||||||||||||
Cost of products sold | — | 581.1 | 253.1 | (12.3 | ) | 821.9 | ||||||||||||||
Selling, general and administrative expenses | 24.6 | 162.4 | 84.5 | — | 271.5 | |||||||||||||||
Impairment, restructuring and other charges | 0.2 | 1.0 | 4.2 | — | 5.4 | |||||||||||||||
Operating (loss) income | (24.8 | ) | 115.4 | 13.0 | — | 103.6 | ||||||||||||||
Interest expense | (40.7 | ) | (0.5 | ) | (1.0 | ) | — | (42.2 | ) | |||||||||||
Interest income | 4.1 | 0.3 | 3.8 | — | 8.2 | |||||||||||||||
Intercompany interest (expense) income, net | (31.2 | ) | 28.8 | 2.4 | — | — | ||||||||||||||
Equity in earnings (losses) of investees, net | 83.0 | 11.2 | — | (94.2 | ) | — | ||||||||||||||
Rexair equity earnings | — | 3.8 | — | — | 3.8 | |||||||||||||||
Other (expense) income, net | (2.2 | ) | 11.5 | (1.8 | ) | — | 7.5 | |||||||||||||
Other intercompany income (expense), net | 32.6 | (29.9 | ) | (2.7 | ) | — | — | |||||||||||||
Earnings (loss) before income taxes and discontinued operations | 20.8 | 140.6 | 13.7 | (94.2 | ) | 80.9 | ||||||||||||||
Benefit from (provision for) income taxes | 23.0 | (57.6 | ) | (2.5 | ) | — | (37.1 | ) | ||||||||||||
Earnings (loss) from continuing operations | 43.8 | 83.0 | 11.2 | (94.2 | ) | 43.8 | ||||||||||||||
(Loss) earnings from discontinued operations | (3.4 | ) | (3.4 | ) | (0.5 | ) | 3.9 | (3.4 | ) | |||||||||||
Net earnings (loss) | $ | 40.4 | $ | 79.6 | $ | 10.7 | $ | (90.3 | ) | $ | 40.4 | |||||||||
Jacuzzi Brands, Inc.
Notes to Consolidated Financial Statements—(Continued)
| At September 30, 2005 | ||||||||||||||||||
| JBI | Combined Guarantor Subsidiaries | Combined Non-Guarantor Subsidiaries | Eliminations | Consolidated | ||||||||||||||
| (in millions) | ||||||||||||||||||
ASSETS | ||||||||||||||||||
Current assets: | ||||||||||||||||||
Cash and cash equivalents | $ | 84.1 | $ | (7.0 | ) | $ | 33.1 | $ | — | $ | 110.2 | |||||||
Trade receivables, net | — | 118.9 | 81.6 | — | 200.5 | |||||||||||||
Inventories | — | 116.9 | 48.1 | — | 165.0 | |||||||||||||
Deferred income taxes | 7.9 | 19.4 | 0.6 | — | 27.9 | |||||||||||||
Assets held for sale | — | 1.8 | 67.9 | — | 69.7 | |||||||||||||
Prepaid expenses and other current assets | 4.4 | 5.9 | 12.3 | — | 22.6 | |||||||||||||
Total current assets | 96.4 | 255.9 | 243.6 | — | 595.9 | |||||||||||||
Restricted cash collateral accounts | 12.4 | — | — | — | 12.4 | |||||||||||||
Property, plant and equipment, net | 1.2 | 50.5 | 52.0 | — | 103.7 | |||||||||||||
Pension assets | 146.8 | 1.0 | — | — | 147.8 | |||||||||||||
Insurance for asbestos claims | — | 153.0 | — | — | 153.0 | |||||||||||||
Goodwill | — | 176.7 | 51.5 | — | 228.2 | |||||||||||||
Other non-current assets | 30.6 | 17.6 | 0.3 | — | 48.5 | |||||||||||||
Investment in subsidiaries/Intercompany receivable (payable), net | 475.7 | 985.2 | 180.7 | (1,641.6 | ) | — | ||||||||||||
Total assets | $ | 763.1 | $ | 1,639.9 | $ | 528.1 | $ | (1,641.6 | ) | $ | 1,289.5 | |||||||
LIABILITIES AND STOCKHOLDERS’ EQUITY | ||||||||||||||||||
Current liabilities: | ||||||||||||||||||
Notes Payable | $ | — | $ | — | $ | 22.0 | $ | — | $ | 22.0 | ||||||||
Current maturities of long-term debt | — | 1.5 | — | — | 1.5 | |||||||||||||
Trade accounts payable | 0.3 | 58.0 | 47.4 | — | 105.7 | |||||||||||||
Income taxes payable | 19.3 | 6.0 | (0.6 | ) | — | 24.7 | ||||||||||||
Liabilities associated with assets held for sale | — | — | 66.9 | — | 66.9 | |||||||||||||
Accrued expenses and other current Liabilities | 17.9 | 63.9 | 32.6 | — | 114.4 | |||||||||||||
Total current liabilities | 37.5 | 129.4 | 168.3 | — | 335.2 | |||||||||||||
Long-term debt | 380.0 | 3.5 | — | — | 383.5 | |||||||||||||
Deferred income taxes | 17.4 | (1.2 | ) | (10.6 | ) | — | 5.6 | |||||||||||
Asbestos claims | — | 153.0 | — | — | 153.0 | |||||||||||||
Other liabilities | 43.0 | 55.8 | 28.2 | — | 127.0 | |||||||||||||
Total liabilities | 477.9 | 340.5 | 185.9 | — | 1,004.3 | |||||||||||||
Stockholders’ equity | 285.2 | 1,299.4 | 342.2 | (1,641.6 | ) | 285.2 | ||||||||||||
Total liabilities and stockholders’ equity | $ | 763.1 | $ | 1,639.9 | $ | 528.1 | $ | (1,641.6 | ) | $ | 1,289.5 | |||||||
Jacuzzi Brands, Inc.
Notes to Consolidated Financial Statements—(Continued)
| At September 30, 2006 | |||||||||||||||||||
| JBI | Combined Guarantor Subsidiaries | Combined Non-Guarantor Subsidiaries | Eliminations | Consolidated | |||||||||||||||
| (in millions) | |||||||||||||||||||
ASSETS | |||||||||||||||||||
Current assets: | |||||||||||||||||||
Cash and cash equivalents | $ | 112.6 | $ | (4.6 | ) | $ | 39.2 | $ | — | $ | 147.2 | ||||||||
Trade receivables, net | 0.4 | 116.6 | 88.0 | — | 205.0 | ||||||||||||||
Inventories | — | 138.2 | 56.4 | — | 194.6 | ||||||||||||||
Deferred income taxes | (0.7 | ) | 25.4 | 0.9 | — | 25.6 | |||||||||||||
Assets held for sale | 0.6 | 6.8 | — | 7.4 | |||||||||||||||
Prepaid expenses and other current assets | 4.3 | 6.5 | 11.1 | — | 21.9 | ||||||||||||||
Total current assets | 116.6 | 282.7 | 202.4 | — | 601.7 | ||||||||||||||
Property, plant and equipment, net | 1.0 | 44.0 | 47.5 | — | 92.5 | ||||||||||||||
Pension assets | 149.3 | 0.7 | — | — | 150.0 | ||||||||||||||
Insurance for asbestos claims | — | 136.0 | — | — | 136.0 | ||||||||||||||
Goodwill | — | 176.6 | 54.8 | — | 231.4 | ||||||||||||||
Other non-current assets | 28.2 | 13.6 | 0.3 | — | 42.1 | ||||||||||||||
Investment in subsidiaries/Intercompany receivable (payable), net | 555.2 | 1,017.0 | 174.8 | (1,747.0 | ) | — | |||||||||||||
Total assets | $ | 850.3 | $ | 1,670.6 | $ | 479.8 | $ | (1,747.0 | ) | $ | 1,253.7 | ||||||||
LIABILITIES AND STOCKHOLDERS’ EQUITY | |||||||||||||||||||
Current liabilities: | |||||||||||||||||||
Notes Payable | $ | — | $ | — | $ | 19.8 | $ | — | $ | 19.8 | |||||||||
Current maturities of long-term debt | — | 1.7 | — | — | 1.7 | ||||||||||||||
Trade accounts payable | 0.3 | 56.1 | 52.1 | — | 108.5 | ||||||||||||||
Income taxes payable | 21.9 | 5.2 | (17.2 | ) | — | 9.9 | |||||||||||||
Liabilities associated with assets held for sale | — | 0.8 | — | — | 0.8 | ||||||||||||||
Accrued expenses and other current Liabilities | 16.2 | 56.8 | 36.3 | — | 109.3 | ||||||||||||||
Total current liabilities | 38.4 | 120.6 | 91.0 | — | 250.0 | ||||||||||||||
Long-term debt | 380.0 | 1.8 | — | — | 381.8 | ||||||||||||||
Deferred income taxes | 46.7 | (13.8 | ) | (4.6 | ) | — | 28.3 | ||||||||||||
Asbestos claims | — | 136.0 | — | — | 136.0 | ||||||||||||||
Other liabilities | 39.7 | 41.4 | 31.0 | — | 112.1 | ||||||||||||||
Total liabilities | 504.8 | 286.0 | 117.4 | — | 908.2 | ||||||||||||||
Stockholders’ equity | 345.5 | 1,384.6 | 362.4 | (1,747.0 | ) | 345.5 | |||||||||||||
Total liabilities and stockholders’ equity | $ | 850.3 | $ | 1,670.6 | $ | 479.8 | $ | (1,747.0 | ) | $ | 1,253.7 | ||||||||
Jacuzzi Brands, Inc.
Notes to Consolidated Financial Statements—(Continued)
| For the Fiscal Year Ended September 30, 2004 | ||||||||||||||||||||
| JBI | Combined Guarantor Subsidiaries | Combined Non-Guarantor Subsidiaries | Eliminations | Consolidated | ||||||||||||||||
(Revised) (in millions) | ||||||||||||||||||||
NET CASH PROVIDED BY (USED IN) OPERATING ACTIVITIES | $ | 24.8 | $ | (14.3 | ) | $ | 34.6 | $ | — | $ | 45.1 | |||||||||
INVESTING ACTIVITIES: | ||||||||||||||||||||
Proceeds from sale of businesses | — | 2.4 | 2.1 | — | 4.5 | |||||||||||||||
Proceeds from sale of non-operating assets | — | 2.4 | — | — | 2.4 | |||||||||||||||
Purchases of property, plant and equipment | (0.8 | ) | (14.4 | ) | (7.8 | ) | — | (23.0 | ) | |||||||||||
Proceeds from sale of property, plant and equipment | — | 0.1 | 0.2 | — | 0.3 | |||||||||||||||
Proceeds from sale of excess real estate | 3.2 | 0.3 | — | — | 3.5 | |||||||||||||||
Net transfers with subsidiaries | (1.8 | ) | 15.2 | — | (13.4 | ) | — | |||||||||||||
Net cash provided by (used in) investing activities of continuing operations | 0.6 | 6.0 | (5.5 | ) | (13.4 | ) | (12.3 | ) | ||||||||||||
Purchases of property, plant and equipment, discontinued operations | — | (0.3 | ) | — | — | (0.3 | ) | |||||||||||||
NET CASH PROVIDED BY (USED IN) INVESTING ACTIVITIES | 0.6 | 5.7 | (5.5 | ) | (13.4 | ) | (12.6 | ) | ||||||||||||
FINANCING ACTIVITIES: | ||||||||||||||||||||
Proceeds from long-term debt | 46.5 | (0.1 | ) | — | — | 46.4 | ||||||||||||||
Repayment of long-term debt | (71.1 | ) | (1.2 | ) | — | — | (72.3 | ) | ||||||||||||
Payment of debt issuance, retirement and other financing costs | (1.6 | ) | 0.1 | — | — | (1.5 | ) | |||||||||||||
Repayment of notes payable, net | — | — | (4.4 | ) | — | (4.4 | ) | |||||||||||||
Payment for stock option exchange | (0.4 | ) | — | — | — | (0.4 | ) | |||||||||||||
Proceeds from the issuance of common stock for stock option exercises | 0.9 | — | — | — | 0.9 | |||||||||||||||
Net transfers with parent | — | 1.8 | (15.2 | ) | 13.4 | — | ||||||||||||||
NET CASH (USED IN) PROVIDED BY FINANCING ACTIVITIES | (25.7 | ) | 0.6 | (19.6 | ) | 13.4 | (31.3 | ) | ||||||||||||
Effect of exchange rate changes on cash and cash equivalents | 1.0 | 6.1 | 0.1 | — | 7.2 | |||||||||||||||
INCREASE (DECREASE) IN CASH AND CASH EQUIVALENTS | 0.7 | (1.9 | ) | 9.6 | — | 8.4 | ||||||||||||||
CASH AND CASH EQUIVALENTS AT BEGINNING OF YEAR | 0.2 | 2.9 | 28.1 | — | 31.2 | |||||||||||||||
CASH AND CASH EQUIVALENTS AT END OF YEAR | $ | 0.9 | $ | 1.0 | $ | 37.7 | $ | — | $ | 39.6 | ||||||||||
Jacuzzi Brands, Inc.
Notes to Consolidated Financial Statements—(Continued)
| For the Fiscal Year Ended September 30, 2005 | ||||||||||||||||||||
| JBI | Combined Guarantor Subsidiaries | Combined Non-Guarantor Subsidiaries | Eliminations | Consolidated | ||||||||||||||||
| (Revised) (in millions) | ||||||||||||||||||||
NET CASH (USED IN) PROVIDED BY OPERATING ACTIVITIES | $ | (69.6 | ) | $ | 71.4 | $ | 19.2 | $ | — | $ | 21.0 | |||||||||
INVESTING ACTIVITIES: | ||||||||||||||||||||
Proceeds from sale of businesses | — | 140.7 | — | — | 140.7 | |||||||||||||||
Proceeds from sale of non-operating assets | — | 4.4 | — | — | 4.4 | |||||||||||||||
Purchases of property, plant and equipment | (0.3 | ) | (13.3 | ) | (9.1 | ) | — | (22.7 | ) | |||||||||||
Proceeds from sale of property, plant and equipment | — | 0.2 | — | — | 0.2 | |||||||||||||||
Proceeds from sale of excess real estate | — | 2.8 | — | — | 2.8 | |||||||||||||||
Net transfers with subsidiaries | 231.0 | 17.6 | — | (248.6 | ) | — | ||||||||||||||
Net cash provided by (used in) investing activities of continuing operations | 230.7 | 152.4 | (9.1 | ) | (248.6 | ) | 125.4 | |||||||||||||
Purchases of property, plant and equipment, discontinued operations | — | — | (0.7 | ) | — | (0.7 | ) | |||||||||||||
NET CASH PROVIDED BY (USED IN) INVESTING ACTIVITIES | 230.7 | 152.4 | (9.8 | ) | (248.6 | ) | 124.7 | |||||||||||||
FINANCING ACTIVITIES: | ||||||||||||||||||||
Proceeds from long-term debt | 59.1 | — | — | — | 59.1 | |||||||||||||||
Repayment of long-term debt | (123.4 | ) | (1.4 | ) | — | — | (124.8 | ) | ||||||||||||
Deposits into restricted cash collateral Accounts | (12.4 | ) | — | — | — | (12.4 | ) | |||||||||||||
Proceeds from the issuance of common stock for stock option exercises | 1.4 | — | — | — | 1.4 | |||||||||||||||
Payment of debt issuance, retirement and other financing costs | (1.0 | ) | — | — | — | (1.0 | ) | |||||||||||||
Proceeds from notes payable, net | — | — | 1.3 | — | 1.3 | |||||||||||||||
Payment for stock option exchange | (0.2 | ) | — | — | — | (0.2 | ) | |||||||||||||
Net transfers with parent | — | (231.0 | ) | (17.6 | ) | 248.6 | — | |||||||||||||
Net cash (used in) provided by financing activities of continuing operations | (76.5 | ) | (232.4 | ) | (16.3 | ) | 248.6 | (76.6 | ) | |||||||||||
Increase in notes payable, discontinued Operations | — | — | 0.7 | — | 0.7 | |||||||||||||||
NET CASH (USED IN) PROVIDED BY FINANCING ACTIVITIES | (76.5 | ) | (232.4 | ) | (15.6 | ) | 248.6 | (75.9 | ) | |||||||||||
Effect of exchange rate changes on cash and cash equivalents | (1.4 | ) | 0.6 | 1.6 | — | 0.8 | ||||||||||||||
INCREASE (DECREASE) IN CASH AND CASH EQUIVALENTS | 83.2 | (8.0 | ) | (4.6 | ) | — | 70.6 | |||||||||||||
CASH AND CASH EQUIVALENTS AT BEGINNING OF YEAR | 0.9 | 1.0 | 37.7 | — | 39.6 | |||||||||||||||
CASH AND CASH EQUIVALENTS AT END OF YEAR | $ | 84.1 | $ | (7.0 | ) | $ | 33.1 | $ | — | $ | 110.2 | |||||||||
Jacuzzi Brands, Inc.
Notes to Consolidated Financial Statements—(Continued)
| For the Fiscal Year Ended September 30, 2006 | ||||||||||||||||||||
| JBI | Combined Guarantor Subsidiaries | Combined Non-Guarantor Subsidiaries | Eliminations | Consolidated | ||||||||||||||||
| (in millions) | ||||||||||||||||||||
NET CASH (USED IN) PROVIDED BY OPERATING ACTIVITIES | $ | (55.7 | ) | $ | 66.0 | $ | 6.4 | $ | — | $ | 16.7 | |||||||||
INVESTING ACTIVITIES: | ||||||||||||||||||||
Proceeds from sale of businesses | — | — | 3.7 | — | 3.7 | |||||||||||||||
Proceeds from sale of non-operating assets | — | 9.3 | — | — | 9.3 | |||||||||||||||
Purchases of property, plant and equipment | (0.1 | ) | (6.7 | ) | (5.7 | ) | — | (12.5 | ) | |||||||||||
Return of equity investment | — | 3.2 | — | — | 3.2 | |||||||||||||||
Proceeds from sale of fixed assets | — | 0.3 | — | — | 0.3 | |||||||||||||||
Proceeds from sale of excess real estate | — | 1.7 | — | — | 1.7 | |||||||||||||||
Net transfers with subsidiaries | 69.6 | (1.9 | ) | — | (67.7 | ) | — | |||||||||||||
Net cash provided by (used in) investing activities of continuing operations | 69.5 | 5.9 | (2.0 | ) | (67.7 | ) | 5.7 | |||||||||||||
Purchases of property, plant and equipment, discontinued operations | — | — | (1.5 | ) | — | (1.5 | ) | |||||||||||||
Proceeds from sale of property, plant and equipment, discontinued operations | — | — | 4.9 | — | 4.9 | |||||||||||||||
NET CASH PROVIDED BY (USED IN) INVESTING ACTIVITIES | 69.5 | 5.9 | 1.4 | (67.7 | ) | 9.1 | ||||||||||||||
FINANCING ACTIVITIES: | ||||||||||||||||||||
Repayment of long-term debt | — | (1.5 | ) | — | — | (1.5 | ) | |||||||||||||
Withdrawals from restricted cash collateral accounts | 12.8 | — | — | — | 12.8 | |||||||||||||||
Excess tax benefits from share based payment agreements | 0.2 | — | — | — | 0.2 | |||||||||||||||
Proceeds from the issuance of common stock for stock option exercises | 1.7 | — | — | — | 1.7 | |||||||||||||||
Repayment of notes payable, net | — | — | (3.4 | ) | — | (3.4 | ) | |||||||||||||
Net transfers with parent | — | (69.6 | ) | 1.9 | 67.7 | — | ||||||||||||||
Net cash provided by (used in) financing activities of continuing operations | 14.7 | (71.1 | ) | (1.5 | ) | 67.7 | 9.8 | |||||||||||||
Decrease in notes payable, discontinued operations | — | — | (0.8 | ) | — | (0.8 | ) | |||||||||||||
NET CASH PROVIDED BY (USED IN) FINANCING ACTIVITIES | 14.7 | (71.1 | ) | (2.3 | ) | 67.7 | 9.0 | |||||||||||||
Effect of exchange rate changes on cash and cash equivalents | — | 1.6 | 0.6 | — | 2.2 | |||||||||||||||
INCREASE IN CASH AND CASH EQUIVALENTS | 28.5 | 2.4 | 6.1 | — | 37.0 | |||||||||||||||
CASH AND CASH EQUIVALENTS AT BEGINNING OF YEAR | 84.1 | (7.0 | ) | 33.1 | — | 110.2 | ||||||||||||||
CASH AND CASH EQUIVALENTS AT END OF YEAR | $ | 112.6 | $ | (4.6 | ) | $ | 39.2 | $ | — | $ | 147.2 | |||||||||
Jacuzzi Brands, Inc.
Notes to Consolidated Financial Statements—(Continued)
Note 14—Subsequent Event
The Company reached an agreement in principle to settle the four putative stockholder class action lawsuits related to the Company’s proposed merger with an affiliate of Apollo. Under the terms of the agreement, which remains subject to approval by the Court, the parties have agreed to settle all claims raised, or which could be raised, by the proposed plaintiff class relating to the proposed merger. Pursuant to the terms of the proposed settlement, the Company has agreed to amend the merger agreement such that (1) the termination fee payable by the Company on the occurrence of certain specified events, is reduced from $25 million to $22.5 million and (2) the time period during which the Company’s entry into an alternative acquisition proposal would trigger payment of the termination fee under certain circumstances, is reduced from 12 months to 9 months. The Company also agreed to make certain additional disclosures already reflected in the Definitive Proxy Statement filed with the SEC on January 5, 2007. The parties also agreed that, in connection with a settlement, counsel for plaintiffs may seek an award from the court of attorneys’ fees and expenses in an amount not to exceed $725,000 if the merger is consummated. There can be no assurance that the Court will approve the proposed settlement or that any ultimate settlement will be under the same terms as those contemplated by the agreement. The proposed settlement of these lawsuits will not affect the amount of merger consideration to be paid in the merger or any other terms of the merger.
On January 25, 2007, the shareholders of the Company approved the sale to Apollo for $12.50 per share. The sale of the Company to Apollo was completed on February 7, 2007.
UNAUDITED PRO FORMA CONDENSED CONSOLIDATED FINANCIAL INFORMATION OF JACUZZI BRANDS, INC.
The following unaudited pro forma condensed consolidated financial information has been derived by application of pro forma adjustments to Jacuzzi’s unaudited and audited historical consolidated financial statements included elsewhere in this prospectus. The unaudited pro forma condensed consolidated statement of operations data gives effect to the Bath sale as if it had occurred at the beginning of the applicable fiscal period. In addition, the unaudited pro forma condensed consolidated statement of operations data for the fiscal years ended September 30, 2004 and 2005 gives effect to the Rexair sale, as if it had occurred at the beginning of the applicable fiscal year. The unaudited pro forma condensed consolidated statement of operations data does not give effect to any adjustments other than those that relate to accounting for Bath and Rexair as discontinued operations.
The unaudited pro forma condensed consolidated financial information does not purport to represent what Jacuzzi’s results of operations would have been had the Rexair sale, the Bath sale and/or the combination of the remaining business with RBS Global actually occurred as of the dates indicated, nor does it project Jacuzzi’s or any of its segments’ results of operations for any future period. In addition, the unaudited pro forma condensed consolidated financial information does not purport to represent what Zurn’s results of operations would have been had it operated as a stand-alone business during the periods indicated.
The unaudited pro forma condensed consolidated financial information should be read in conjunction with “Risk Factors,” “Selected Historical Financial Data,” “Management’s Discussion and Analysis of Financial Condition and Results of Operations” and Jacuzzi’s historical consolidated financial statements included elsewhere in this prospectus.
Unaudited Pro Forma Condensed Consolidated Statement of Operations
For the Three Months Ended December 31, 2005
(in millions)
| Jacuzzi Consolidated(1) | (Deduct) Bath Discontinued Operations Adjustments | Jacuzzi Less Bath Discontinued Operations(3) | ||||||||||
Net sales | $ | 267.1 | $ | 174.2 | $ | 92.9 | ||||||
Operating costs and expenses: | ||||||||||||
Cost of products sold | 184.9 | 127.7 | 57.2 | |||||||||
Selling, general and administrative expenses | 59.5 | 39.3 | 20.2 | |||||||||
Restructuring charges | 1.6 | 1.4 | 0.2 | |||||||||
Operating income | 21.1 | 5.8 | 15.3 | |||||||||
Interest expense | (10.3 | ) | (0.3 | ) | (10.0 | ) | ||||||
Interest income | 1.4 | 0.3 | 1.1 | |||||||||
Other income (expense), net | 8.7 | 9.5 | (0.8 | ) | ||||||||
Income before income taxes | 20.9 | 15.3 | 5.6 | |||||||||
Provision for income taxes | 8.8 | 6.2 | 2.6 | |||||||||
Income from continuing operations | $ | 12.1 | $ | 9.1 | $ | 3.0 | ||||||
See Notes to Unaudited Pro Forma Condensed Consolidated Statement of Operations
Jacuzzi Brands, Inc.
Unaudited Pro Forma Condensed Consolidated Statement of Operations
For the Three Months Ended December 31, 2006
(in millions)
| Jacuzzi Consolidated(1) | (Deduct) Bath Discontinued Operations Adjustments | Jacuzzi Less Bath Discontinued Operations(3) | ||||||||||
Net sales | $ | 272.1 | $ | 167.8 | $ | 104.3 | ||||||
Operating costs and expenses: | ||||||||||||
Cost of products sold | 192.3 | 124.7 | 67.6 | |||||||||
Selling, general and administrative expenses | 61.0 | 39.4 | 21.6 | |||||||||
Restructuring charges | 0.7 | 0.3 | 0.4 | |||||||||
Operating income | 18.1 | 3.4 | 14.7 | |||||||||
Interest expense | (10.7 | ) | (0.3 | ) | (10.4 | ) | ||||||
Interest income | 2.0 | 0.4 | 1.6 | |||||||||
Other income (expense), net | (1.2 | ) | 0.6 | (1.8 | ) | |||||||
Income before income taxes | 8.2 | 4.1 | 4.1 | |||||||||
Provision for income taxes | 3.7 | 1.6 | 2.1 | |||||||||
Income from continuing operations | $ | 4.5 | $ | 2.5 | $ | 2.0 | ||||||
See Notes to Unaudited Pro Forma Condensed Consolidated Statement of Operations
Unaudited Pro Forma Condensed Consolidated Statement of Operations
For the Fiscal Year Ended September 30, 2004
(in millions)
| Jacuzzi Consolidated(1) | (Deduct) Bath and Rexair Discontinued Operations Adjustments | Jacuzzi Less Bath and Rexair Discontinued Operations(2) | ||||||||||
Net sales | $ | 1,201.2 | $ | 893.2 | $ | 308.0 | ||||||
Operating costs and expenses: | ||||||||||||
Cost of products sold | 802.4 | 617.7 | 184.7 | |||||||||
Selling, general and administrative expenses | 268.7 | 187.9 | 80.8 | |||||||||
Impairment, restructuring and other charges | 2.9 | 3.5 | (0.6 | ) | ||||||||
Operating income | 127.2 | 84.1 | 43.1 | |||||||||
Interest expense | (50.5 | ) | (0.9 | ) | (49.6 | ) | ||||||
Interest income | 4.7 | 2.1 | 2.6 | |||||||||
Other income (expense), net | (3.2 | ) | (6.6 | ) | 3.4 | |||||||
Income (loss) before income taxes | 78.2 | 78.7 | (0.5 | ) | ||||||||
Provision (benefit) for income taxes | 29.9 | (0.8 | ) | 30.7 | ||||||||
Income (loss) from continuing operations | $ | 48.3 | $ | 79.5 | $ | (31.2 | ) | |||||
See Notes to Unaudited Pro Forma Condensed Consolidated Statement of Operations
Jacuzzi Brands, Inc.
Unaudited Pro Forma Condensed Consolidated Statement of Operations
For the Fiscal Year Ended September 30, 2005
(in millions)
| Jacuzzi Consolidated(1) | (Deduct) Bath and Rexair Discontinued Operations Adjustments | Jacuzzi Less Bath and Rexair Discontinued Operations(2) | ||||||||||
Net sales | $ | 1,210.0 | $ | 856.9 | $ | 353.1 | ||||||
Operating costs and expenses: | ||||||||||||
Cost of products sold | 820.4 | 609.8 | 210.6 | |||||||||
Selling, general and administrative expenses | 285.8 | 194.1 | 91.7 | |||||||||
Impairment, restructuring and other charges | 9.4 | 4.7 | 4.7 | |||||||||
Operating income | 94.4 | 48.3 | 46.1 | |||||||||
Interest expense | (48.1 | ) | (1.1 | ) | (47.0 | ) | ||||||
Interest income | 3.0 | 2.2 | 0.8 | |||||||||
Other income (expense), net | 18.7 | 25.4 | (6.7 | ) | ||||||||
Income (loss) before income taxes | 68.0 | 74.8 | (6.8 | ) | ||||||||
Provision (benefit) for income taxes | 10.0 | 18.5 | (8.5 | ) | ||||||||
Income from continuing operations | $ | 58.0 | $ | 56.3 | $ | 1.7 | ||||||
See Notes to Unaudited Pro Forma Condensed Consolidated Statement of Operations
Jacuzzi Brands, Inc.
Unaudited Pro Forma Condensed Consolidated Statement of Operations
For the Fiscal Year Ended September 30, 2006
(in millions)
| Jacuzzi Consolidated(1) | (Deduct) Bath Discontinued Operations Adjustments | Jacuzzi Bath Discontinued Operations(3) | ||||||||||
Net sales | $ | 1,202.4 | $ | 766.6 | $ | 435.8 | ||||||
Operating costs and expenses: | ||||||||||||
Cost of products sold | 821.9 | 554.8 | 267.1 | |||||||||
Selling, general and administrative expenses | 271.5 | 169.1 | 102.4 | |||||||||
Impairment, restructuring and other charges | 5.4 | 5.2 | 0.2 | |||||||||
Operating income | 103.6 | 37.5 | 66.1 | |||||||||
Interest expense | (42.2 | ) | (1.0 | ) | (41.2 | ) | ||||||
Interest income | 8.2 | 4.0 | 4.2 | |||||||||
Other income (expense), net | 11.3 | 14.5 | (3.2 | ) | ||||||||
Income before income taxes | 80.9 | 55.0 | 25.9 | |||||||||
Provision for income taxes | 37.1 | 25.0 | 12.1 | |||||||||
Income from continuing operations | $ | 43.8 | $ | 30.0 | $ | 13.8 | ||||||
See Notes to Unaudited Pro Forma Condensed Consolidated Statement of Operations
Notes to the Unaudited Pro Forma Condensed Consolidated Statements of Operations
(in millions)
Through and including , 20082011 (the 25th day after the date of this prospectus), all dealers effecting transactions in these securities, whether or not participating in this offering, may be required to deliver a prospectus. This is in addition to the dealers’ obligation to deliver a prospectus when acting as underwriters and with respect to their unsold allotments or subscriptions.
Shares
Rexnord Holdings, Inc.Corporation
Common Stock
P R O S P E C T U S
, 20082011
PART II
INFORMATION NOT REQUIRED IN THE PROSPECTUS
| Item 13. | Other Expenses of Issuance and Distribution |
Set forth below is a table of the registration fee for the Securities and Exchange Commission, the filing fee for the National Association of Securities Dealers, Inc., the listing fee for the New York Stock Exchange and estimates of all other expenses to be incurred in connection with the issuance and distribution of the securities described in the registration statement, other than underwriting discounts and commissions:
SEC registration fee | $ | 29,475 | |
FINRA filing fee | 30,500 | ||
NYSE listing fee | * | ||
Printing and engraving expenses | * | ||
Legal fees and expenses | * | ||
Accounting fees and expenses | * | ||
Transfer agent and registrar fees | * | ||
Miscellaneous (including road show) | * | ||
Total | $ | * | |
SEC registration fee | $ | 81,270 | ||
FINRA filing fee | * | |||
NYSE listing fee | * | |||
Printing and engraving expenses | * | |||
Legal fees and expenses | * | |||
Accounting fees and expenses | * | |||
Transfer agent and registrar fees | * | |||
Miscellaneous expenses (including road show) | * | |||
Total | $ | * | ||
| * | To be completed by amendment. |
| Item 14. | Indemnification of Directors and Officers |
Rexnord Holdings, Inc.Corporation is incorporated under the laws of the State of Delaware. Reference is made to Section 102(b)(7) of the Delaware General Corporation Law or DGCL,(“DGCL”), which enables a corporation in its original certificate of incorporation or an amendment thereto to eliminate or limit the personal liability of a director for violations of the director’s fiduciary duty, except (1) for any breach of the director’s duty of loyalty to the corporation or its stockholders, (2) for acts or omissions not in good faith or which involve intentional misconduct or a knowing violation of law, (3) pursuant to Section 174 of the DGCL, which provides for liability of directors for unlawful payments of dividends of unlawful stock purchase or redemptions or (4) for any transaction from which a director derived an improper personal benefit.
Reference is also made to Section 145 of the DGCL, which provides that a corporation may indemnify any person, including an officer or director, who is, or is threatened to be made, party to any threatened, pending or completed legal action, suit or proceeding, whether civil, criminal, administrative or investigative, other than an action by or in the right of such corporation, by reason of the fact that such person was an officer, director, employee or agent of such corporation or is or was serving at the request of such corporation as a director, officer, employee or agent of another corporation or enterprise. The indemnity may include expenses (including attorneys’ fees), judgments, fines and amounts paid in settlement actually and reasonably incurred by such person in connection with such action, suit or proceeding, provided such officer, director, employee or agent acted in good faith and in a manner he reasonably believed to be in, or not opposed to, the corporation’s best interest and, for criminal proceedings, had no reasonable cause to believe that his conduct was unlawful. A Delaware corporation may indemnify any officer or director in an action by or in the right of the corporation under the same conditions, except that no indemnification is permitted without judicial approval if the officer or director is adjudged to be liable to the corporation. Where an officer or director is successful on the merits or otherwise in the defense of any action referred to above, the corporation must indemnify him against the expenses that such officer or director actually and reasonably incurred.
II-1
Our amended and restated by-laws provides for indemnification of the officers and directors to the full extent permitted by applicable law. The Underwriting Agreement provides for indemnification by the underwriters of the registrant and its officers and directors for certain liabilities arising under the Securities Act, or otherwise.
II-1
| Item 15. | Recent Sales of Unregistered Securities |
Since our inceptionSet forth below is certain information regarding securities issued by the Registrant during the last three years in July 2006, we havetransactions that were not sold securities without registration under the Securities Act of 1933, as amended, except as described below. At various times since inception, directors, employees and consultants of Rexnord Holdings, Inc. and its subsidiaries exercised options to purchase an aggregate of 263,927 shares of Rexnord Holdings, Inc. Common Stock (Holdings Common Stock) at a weighted average exercise price of $18.53 per share, for total consideration of $4,889,549. The shares were sold pursuant to exemptions availableregistered under the Securities Act of 1933, as amended (the “Securities Act”), including Rule 701 promulgated thereunder. All options were exercised at the discretion ofconsideration, if any, received by the option holder after they had become fully vested, in accordance with the terms of the respective option grant.
On the Merger Date, in connection with the Merger, we issued:Registrant for such issuances.
4,860,125On October 7, 2008, we issued 1,806 shares of common stock to Rexnord Acquisition Holdings I, LLC (an entity controlled by Apollo)an employee for an aggregate purchase price of $230,855,676.82;$36,012.
4,361,889On August 10, 2009, we issued 26,315 shares of common stock to Rexnord Acquisition Holdings II, LLC (an entity controlled by Apollo)an employee for an aggregate purchase price of $207,189,518.56;$187,626 and
200,041 5,618 shares of common stock to Cypress Industrial, in exchange for the contribution by Cypress Industrial to the Company of 35,467 shares of common stock of RBS Global, Inc.
On October 31, 2006, we issued 21,052 shares of common stock to George Mooreanother employee for an aggregate purchase price of $999,970.$64,331.
On November 30, 2006,August 14, 2009, we issued 12,6319,236 shares of common stock to Praveen Jeyarajahan employee for an aggregate purchase price of $599,972.50.
On February 7, 2007, in connection with the Zurn acquisition, we issued:
3,023,381$184,166 and 6,300 shares of common stock to Rexnord Acquisition Holdings I, LLCanother employee for an aggregate purchase price of $143,610,600;$125,622.
2,781,882On August 16, 2009, we issued 27,854 shares of common stock to Rexnord Acquisition Holdings II, LLCan employee for an aggregate purchase price of $132,139,400; and$555,409.
130,526On December 13, 2010, we issued 15,790 shares of common stock to Cypress Industrialan employee for an aggregate purchase price of $6,200,000.$112,853.
On April 1, 2007, we issued:
12,500On December 17, 2010, we issued 82,098 shares of common stock to Andrew Silvernailan employee for an aggregate purchase price of $249,250;$1,637,034.
5,016On February 14, 2011, we issued 4,056 shares of common stock to Charles Heathan employee for an aggregate purchase price of $100,019;$80,908.
5,000 shares of common stock to Christopher Connors for an aggregate purchase price of $99,700;
10,211 shares of common stock to Dennis Longo for an aggregate purchase price of $203,607;
5,868 shares of common stock to Donald Dreher for an aggregate purchase price of $117,008;
9,352 shares of common stock to Karl Heinz Willmann for an aggregate purchase price of $186,479;
2,199 shares of common stock to Patricia Whaley for an aggregate purchase price of $43,848; and
1,244 shares of common stock to Tim Carpenter for an aggregate purchase price of $24,805.
II-2
On April 2, 2007, we issued:
8,107 shares of common stock to Todd Adams for an aggregate purchase price of $161,654;
13,500 shares of common stock to Dean Vlasak for an aggregate purchase price of $269,190;
14,949 shares of common stock to William Butler for an aggregate purchase price of $298,083;
15,000 shares of common stock to George Moore for an aggregate purchase price of $299,100; and
1,866 shares of common stock to Christopher Jurasek for an aggregate purchase price of $37,208.
On April 3, 2007, we issued 17,500 shares of common stock to Praveen Jeyarajah for an aggregate purchase price of $348,950.
On April 10, 2007, we issued:
27,500 shares of common stock to Alex Marini for an aggregate purchase price of $548,350; and
5,000 shares of common stock to Al Becker for an aggregate purchase price of $99,700.
On April 11, 2007, we issued 5,000 shares of common stock to Jon Steffan for an aggregate purchase price of $99,700.
On April 12, 2007, we issued:
6,300 shares of common stock to Carl Nicolia for an aggregate purchase price of $125,622; and
4,000 shares of common stock to Trevor Johnson for an aggregate purchase price of $79,760.
On April 13, 2007, we issued 5,000 shares of common stock to Craig Wehr for an aggregate purchase price of $99,700.
On April 14, 2007, we issued 6,250 shares of common stock to Edmund Krainski for an aggregate purchase price of $124,625.
On September 10, 2007, we issued 228,942 shares of common stock to Cypress Industrial for an aggregate purchase price of $4,565,103.
Each issuance of securities described above was exempt from registration under the Securities Act in accordance with Section 4(2) thereof, as a transaction by the issuer not involving a public offering. We determined that the purchasers of securities in these transactions were either accredited or sophisticated investors and were provided access to all relevant information necessary to evaluate the investment.
II-3
| Item 16. | Exhibits and Financial Statement Schedules |
(a)Exhibits
| ||
| 1.1 |
| |
| 2.1 | Agreement and Plan of Merger, by and among Chase Acquisition I, Inc., Chase Merger Sub, Inc., RBS Global, Inc. and TC Group, L.L.C., dated as of May 24, 2006 (incorporated by reference from Exhibit 2.1 to the Form 8-K/A filed by RBS Global, Inc./Rexnord LLC on July 27, 2006). The Registrants agree to furnish supplementally a copy of the schedules omitted from this Exhibit 2.1 to the Commission upon request. | |
| 2.2 | Purchase Agreement, dated as of October 11, 2006, between RBS Global, Inc. and Jupiter Acquisition, LLC (incorporated by reference from Exhibit 2.2 to the Form 10-Q filed by RBS Global, Inc./Rexnord LLC on November 8, 2006). The registrants agree to furnish supplementally a copy of the schedules omitted from this Exhibit 2.3 to the Commission upon request. | |
| 2.3 | Stock Purchase Agreement dated as of September 27, 2002, by and among RBS Acquisition Corporation, Invensys plc, BTR Inc., BTR (European Holdings) BV, BTR Industries GmbH, Dunlop Vermögensverwaltungsgesellschaft GmbH, Brook Hansen Inc., Invensys France SAS, Invensys Holdings Ltd., Hansen Transmissions International Ltd., Hawker Siddeley Management Ltd. and BTR Finance BV (incorporated by reference from Exhibit 2.1 to the Form S-4 Registration Statement (SEC File no. 333-102428 filed by RBS Global, Inc./Rexnord | |
II-2
| 2.4 | Stock Purchase Agreement dated as of April 5, 2005, by and among Rexnord | |
| 2.5 | Merger Agreement by and among Zurn Industries, LLC, Zurn Acquisition Sub Inc., GA Industries, Inc. and Certain | |
| 3.1 | Amended and Restated Certificate of Incorporation of Rexnord | |
| 3.2 | Amended and Restated By-Laws of Rexnord | |
| 4.1 | Senior | |
II-4
|
| |
| First Supplemental Indenture with respect to the 11 3/4% Senior Subordinated Notes due 2016, by and among RBS Global, Inc., Rexnord | ||
| Second Supplemental Indenture with respect to the 11 3/4% Senior Subordinated Notes due 2016, by and among RBS Global, Inc., Rexnord LLC, the Guarantors listed therein and Wells Fargo Bank, dated as of February 7, 2007 (incorporated by reference from Exhibit 4.16 to the Form S-4 Registration Statement (SEC File No. 333-140040) filed by RBS Global, Inc./Rexnord | ||
| Third Supplemental Indenture with respect to the 11 3/4% Senior Subordinated Notes due 2016, by and among Zurn Industries, LLC, RBS Global, Inc., Rexnord LLC, and Wells Fargo Bank, dated as of April 1, 2007 (incorporated by reference from Exhibit 4.16 to the Form 10-K filed by RBS Global, Inc./Rexnord LLC on May 25, 2007). | ||
II-5
|
| |
| Fourth Supplemental Indenture with respect to the 11 3/4% Senior Subordinated Notes due 2016, by and among RBS Global, Inc., Rexnord LLC, the Guarantors listed therein and Wells Fargo Bank, dated as of February 1, 2008 (incorporated by reference from Exhibit 10.3 to the Form 10-Q filed by RBS Global, Inc./Rexnord LLC on February 5, 2008). | ||
| 4.7 | Registration Rights Agreement with respect to the 11 3/4% Senior Subordinated Notes due 2016, by and among | |
| 4.8 | Form of Unrestricted Global Note evidencing the 11 3/4% Senior Subordinated Notes due 2016 (incorporated by reference from Exhibit 4.11 to the Form S-4 Registration Statement (SEC File No. 333-140040) filed by RBS Global, Inc./Rexnord LLC on January 17, 2007). | |
| 4.9 | Indenture, dated as of April 28, 2010, with respect to the 8 1/2% Senior Notes due 2018, by and among RBS Global, Inc., Rexnord LLC, the guarantors named therein and Wells Fargo Bank, National Association, as Trustee (incorporated by reference from Exhibit 4.1 to the Form 8-K filed by RBS Global, Inc./Rexnord LLC on April 28, 2010). | |
II-3
| 4.10 | Registration Rights Agreement, dated as of April 28, 2010, with respect to the 8 1/2% Senior Notes due 2018, by and among RBS Global, Inc., Rexnord LLC, the subsidiaries of RBS Global, Inc. party thereto, Credit Suisse Securities (USA) LLC, Banc of America Securities LLC | |
| | Form of Unrestricted Global Note evidencing the 8 1/2% Senior Notes due 2018 (incorporated by reference from Exhibit 4.6(e) to the Form S-4 Registration Statement (SEC File No. 333-167904-30) filed by RBS Global, Inc./Rexnord LLC on June 30, 2010). | |
| 4.12 | Indenture with respect to the PIK Toggle Senior Notes due 2013 by and between Rexnord Corporation (f/k/a Rexnord Holdings, Inc.) and Wells Fargo Bank, National Association, as Trustee, dated as of August 8, 2008.† | |
| 4.13 | Form of Certificate of Common Stock (to be filed by amendment). | |
| 5.1 | Opinion of O’Melveny & Myers LLP (to be filed by amendment). | |
| 10.1 | ||
| Amended and Restated Management Consulting Agreement among Rexnord | ||
| Amended and Restated Management Consulting Agreement by and between Rexnord Corporation (f/k/a Rexnord Holdings, Inc.) and Apollo Management VI, L.P., dated February 7, 2007 (incorporated by reference from Exhibit 10.3 to the Form 10-K filed by RBS Global, Inc./Rexnord LLC on May 23, 2008).* | ||
| Stockholders’ Agreement of Rexnord Corporation (f/k/a Rexnord Holdings, Inc.), Rexnord Acquisition Holdings I, LLC, Rexnord Acquisition Holdings II, LLC and certain other stockholders, dated July 21, 2006 (incorporated by reference from Exhibit 10.5 to the Form 8-K/A filed by RBS Global, Inc./Rexnord LLC on July 27, 2006).* | ||
| Stockholders’ Agreement of Rexnord Corporation (f/k/a Rexnord Holdings, Inc.), Rexnord Acquisition Holdings I, LLC, Rexnord Acquisition Holdings II, LLC, Cypress Industrial Holdings, LLC and George M. Sherman, dated July 21, 2006 (incorporated by reference from Exhibit 10.6 to the Form 8-K/A filed by RBS Global, Inc./Rexnord LLC on July 27, 2006). | ||
| 10.5 | Rexnord Industries Special Signing Bonus Plan (incorporated by reference from Exhibit 10.7 to the Form 8-K/A filed by RBS Global, Inc./Rexnord LLC on July 27, 2006).* | |
| 10.6 | Form of Special Signing Bonus Plan Participation Letter (incorporated by reference from Exhibit 10.8 to the Form 8-K/A filed by RBS Global, Inc./Rexnord LLC on July 27, 2006).* | |
| 10.7 | ||
II-6
|
| |
| 10.8 | Form of Executive Non-Qualified Stock Option Agreement (incorporated by reference from Exhibit | |
| 10.9 | Form of | |
| 10.10 | Form of Non-Employee Director (Apollo Director) Non-Qualified Stock Option Grant (incorporated by reference from Exhibit | |
| 10.11 | Stock Option Cancellation and Release Agreement, dated as of October 29, 2009, by and among Rexnord Corporation (f/k/a Rexnord Holdings, Inc.) and Cypress Industrial Holdings, LLC (incorporated by reference from Exhibit 10.5 to the Form 10-Q filed by RBS Global/Rexnord LLC on February 4, 2010).* | |
II-4
| 10.12 | Amended and Restated Non-Qualified Stock Option Agreement, dated April 16, 2010, between Rexnord Corporation (f/k/a Rexnord Holdings, Inc.) and Praveen Jeyarajah, amending and restating the option agreement dated as of October 29, 2009 (incorporated by reference from Exhibit 10.1 to the Form 8-K filed by RBS Global, Inc./Rexnord LLC on April 22, 2010).* | |
| 10.13 | Amended and Restated Non-Qualified Stock Option Agreement, dated April 16, 2010, between Rexnord Corporation (f/k/a Rexnord Holdings, Inc.) and Praveen Jeyarajah, amending and restating the option agreement dated as of April 19, 2007 (incorporated by reference from Exhibit 10.2 to the Form 8-K filed by RBS Global, Inc./Rexnord LLC on April 22, 2010).* | |
| 10.14 | Form of Rexnord Non-Union Pension Plan (incorporated by reference from Exhibit 10.13 to the Form S-4 Registration Statement (SEC File No. 333-102428).* | |
| 10.15 | Form of Rexnord Supplemental Pension Plan (incorporated by reference from Exhibit 10.14 to the Form S-4 Registration Statement (SEC File No. 333-102428).* | |
| 10.16 | Form of Rexnord Industries Executive Bonus Plan (incorporated by reference from Exhibit 10.15 to the Form S-4 Registration Statement (SEC File No. 333-102428).* | |
| 10.17 | Amended and Restated Credit Agreement, dated as of October 5, 2009, among Chase Acquisition I, Inc., RBS Global, Inc., and Rexnord LLC, Credit Suisse, Cayman Islands Branch, as administrative agent and the lenders party thereto (incorporated by reference from Exhibit 10.1 to the Form 8-K/A filed by RBS Global, Inc./Rexnord LLC on October 9, 2009). | |
| 10.18 | Receivables Sale and Servicing Agreement, dated September 26, 2007, by and among the Originators, Rexnord Industries, LLC as Servicer, and Rexnord Funding LLC (incorporated by reference from Exhibit 10.1 to the Form 8-K filed by RBS Global, Inc./Rexnord LLC on October 1, 2007). | |
| First Amendment, dated as of November 30, 2007, to the Receivables Sale and Servicing Agreement, dated as of September 26, 2007, among Rexnord Funding LLC, as the buyer, Rexnord Industries, LLC, as the servicer and an originator, Zurn Industries, LLC, as an originator, Zurn PEX, Inc., as an originator, and General Electric Capital Corporation, as the administrative agent (incorporated by reference from Exhibit 10.2 to the Form 8-K filed by RBS Global, Inc./Rexnord LLC on May 23, 2011). | ||
| 10.20 | Second Amendment, dated as of May 20, 2011, to the Receivables Sale and Servicing Agreement, dated as of September 26, 2007, among Rexnord Funding LLC, as the buyer, Rexnord Industries, LLC, as the servicer and an originator, Zurn Industries, LLC, as an originator, Zurn PEX, Inc., as an originator, and General Electric Capital Corporation, as the administrative agent (incorporated by reference from Exhibit 10.3 to the Form 8-K filed by RBS Global, Inc./Rexnord LLC on May 23, 2011). | |
| 10.21 | Receivables Funding and Administration Agreement, dated September 26, 2007, by and among Rexnord Funding LLC and General Electric Capital Corporation (incorporated by reference from Exhibit | |
| as of May 20, 2011, by and among Rexnord Funding LLC, | ||
| Amended and Restated Guarantee and Collateral Agreement, dated as of October 5, 2009, among Chase Acquisition I, Inc., RBS Global, Inc., Rexnord LLC, the subsidiary guarantors party thereto and Credit Suisse, Cayman Islands Branch, as administrative agent (incorporated by reference from Exhibit 10.2 to the Form 8-K/A filed by RBS Global, Inc./Rexnord LLC on October 9, 2009). | ||
| 10.24 | Rexnord Management Incentive Compensation Plan (revised as of July 29, 2010) (incorporated by reference from Exhibit 10.14 to the Form 10-Q filed by RBS Global, Inc./Rexnord LLC on November 12, 2010).* | |
II-5
| 10.25 | Rexnord Supplemental Retirement Plan adopted May 1, | |
| 10.26 | Rexnord Supplemental Executive Retirement Plan As Amended Effective January 1, 2008 (incorporated by reference from Exhibit 10.24 to the Form 10-Q filed by RBS Global, Inc./Rexnord LLC on February 10, 2009).* | |
| 10.27 | Credit Agreement among Rexnord Corporation (f/k/a Rexnord Holdings, Inc.), the lenders party thereto, Credit Suisse, as administrative agent, Banc of America Bridge LLC as Syndication Agent and Credit Suisse Securities (USA) LLC and Banc of America Securities LLC as joint lead arrangers and joint bookrunning managers, dated as of March 2, 2007.† | |
| 21.1 | List of Subsidiaries of the | |
| 23.1 | Consent of Independent Registered Public Accounting Firm.† | |
| 23.2 | Consent of O’Melveny & Myers LLP (included in Exhibit 5.1). | |
| 24 | Powers of Attorney (included on signature pages of this Registration Statement). | |
| Filed herewith |
| * | Denotes management plan or compensatory plan or arrangement. |
(b)(1)Financial Statements:
The Company’s consolidated financial statements appended hereto are for the years ended March 31, 2009, 2010 and 2011 and consisted of the following:
Consolidated Balance Sheets
Consolidated Statements of Operations
Consolidated Statements of Stockholders’ Equity (Deficit)
Consolidated Statements of Cash Flows
Notes to Consolidated Financial Statements
(b)(2)Financial Statement Schedules:Schedules:
The Financial Statement Schedules of the Registrant and of the Predecessor Company appended hereto for the year ended March 31, 2006 (Predecessor Company), the period from April 1, 2006 to April 21, 2006 (Predecessor Company), the period from July 22, 2006 through March 31, 2007 and the year ended March 31, 2008 consist of the following:
Schedule II—Valuation and Qualifying Accounts
II-7
Report of Independent Registered Public Accounting Firm
The Board of Directors and ShareholdersStockholders of Rexnord Holdings, Inc.Corporation:
We have audited the consolidated financial statements of Rexnord Holdings, Inc.Corporation and subsidiaries (the Company)“Company”) as of March 31, 20072010 and 2008,2011, and for each of the yearthree years in the period ended March 31, 2006 (Predecessor Company), the period from April 1, 2006 to July 21, 2006 (Predecessor Company), the period from July 22, 2006 to March 31, 2007 and the year ended March 31, 20082011 and have issued our report thereon dated July 1, 2008May 25, 2011 (included elsewhere in this Registration Statement). Our audits also included the financial statement schedule listed in Item 16(b) of this Registration Statement. This schedule is the responsibility of the Company’s management. Our responsibility is to express an opinion based on our audits.
In our opinion, the financial statement schedule referred to above, when considered in relation to the basic financial statements taken as a whole, presents fairly in all material respects the information set forth therein.
/s/ Ernst & Young LLP
Milwaukee, Wisconsin
July 1, 2008May 25, 2011
II-8
Rexnord Holdings, Inc.The Financial Statement Schedule of the Company appended hereto is for the years ended March 31, 2009, 2010 and Subsidiaries2011 and consists of the following:
Schedule II—Valuation and Qualifying Accounts
(In Millions)
Description | Balance at Beginning of Year | Additions | Deductions (1) | Balance at End of Year | ||||||||||||||||||||
| Charged to Costs and Expenses | Acquired Obligations | Charged to Other Accounts | ||||||||||||||||||||||
Fiscal Year 2009: | ||||||||||||||||||||||||
Valuation allowance for trade and notes receivable | $ | 8.9 | $ | 4.7 | $ | — | $ | (0.2 | ) | $ | (4.3 | ) | $ | 9.1 | ||||||||||
Valuation allowance for excess and obsolete inventory | 21.8 | 17.2 | — | (0.9 | ) | (7.3 | ) | 30.8 | ||||||||||||||||
Valuation allowance for income taxes | 94.2 | 19.5 | — | — | (11.0 | ) | 102.7 | |||||||||||||||||
Fiscal Year 2010: | ||||||||||||||||||||||||
Valuation allowance for trade and notes receivable | 9.1 | 0.3 | 0.2 | 0.1 | (0.1 | ) | 9.6 | |||||||||||||||||
Valuation allowance for excess and obsolete inventory | 30.8 | 7.1 | 0.5 | 0.1 | (6.5 | ) | 32.0 | |||||||||||||||||
Valuation allowance for income taxes | 102.7 | 6.4 | — | — | (8.4 | ) | 100.7 | |||||||||||||||||
Fiscal Year 2011: | ||||||||||||||||||||||||
Valuation allowance for trade and notes receivable | 9.6 | 0.6 | — | — | (4.9 | ) | 5.3 | |||||||||||||||||
Valuation allowance for excess and obsolete inventory | 32.0 | 3.8 | — | — | (6.3 | ) | 29.5 | |||||||||||||||||
Valuation allowance for income taxes | 100.7 | 8.7 | — | 3.5 | (1.7 | ) | 111.2 | |||||||||||||||||
| Additions | |||||||||||||||||||
Description | Balance at Beginning of Year | Charged to Costs and Expenses | Acquired Obligations | Charged to Other Accounts | Deductions (1) | Balance at End of Year | |||||||||||||
Fiscal Year 2006: | |||||||||||||||||||
Valuation allowance for trade and notes receivable | $ | 3.2 | $ | 2.0 | $ | — | $ | 1.2 | $ | (1.2 | ) | $ | 5.2 | ||||||
Valuation allowance for excess and obsolete inventory | 10.6 | 4.9 | — | 2.1 | (3.4 | ) | 14.2 | ||||||||||||
Valuation allowance for income taxes | 38.3 | 13.0 | — | — | (4.7 | ) | 46.6 | ||||||||||||
Fiscal Year 2007: | |||||||||||||||||||
Period from April 1, 2006 through | |||||||||||||||||||
Valuation allowance for trade and notes receivable | 5.2 | 0.4 | 0.3 | 0.1 | (0.2 | ) | 5.8 | ||||||||||||
Valuation allowance for excess and obsolete inventory | 14.2 | 1.3 | — | 0.1 | (1.5 | ) | 14.1 | ||||||||||||
Valuation allowance for income taxes | 46.6 | 3.6 | — | — | (0.4 | ) | 49.8 | ||||||||||||
Period from July 22, 2006 through March 31, 2007: | |||||||||||||||||||
Valuation allowance for trade and notes receivable | 5.8 | 1.7 | 0.8 | 0.1 | (1.0 | ) | 7.4 | ||||||||||||
Valuation allowance for excess and obsolete inventory | 14.1 | 3.6 | 2.0 | 0.3 | (1.7 | ) | 18.3 | ||||||||||||
Valuation allowance for income taxes | 49.8 | 9.6 | 15.7 | 11.9 | (1.3 | ) | 85.7 | ||||||||||||
Fiscal Year 2008: | |||||||||||||||||||
Valuation allowance for trade and notes receivable | 7.4 | 2.6 | 0.3 | 0.3 | (1.7 | ) | 8.9 | ||||||||||||
Valuation allowance for excess and obsolete inventory | 18.3 | 8.4 | — | 1.0 | (5.9 | ) | 21.8 | ||||||||||||
Valuation allowance for income taxes | 85.7 | 10.1 | — | 3.0 | (4.6 | ) | 94.2 | ||||||||||||
| (1) | Uncollectible amounts, dispositions charged against the reserve and utilization of net operating losses. |
All other schedules have been omitted because they are not applicable or because the information required is included in the notes to the consolidated financial statements included elsewhere in this prospectus.statements.
| Item 17. | Undertakings |
Insofar as indemnification for liabilities arising under the Securities Act of 1933 (the “Securities Act”) may be permitted to directors, officers and controlling persons of the Registrant pursuant to the foregoing provisions, or otherwise, the Registrant has been advised that in the opinion of the Securities and Exchange Commission such indemnification is against public policy as expressed in the Securities Act and is, therefore, unenforceable. In the event that a claim for indemnification against such liabilities (other than the payment by the Registrant of expenses incurred or paid by a director, officer or controlling person of the Registrant in the successful defense of any action, suit or proceeding) is asserted by such director, officer or controlling person in connection with the securities being registered, the Registrant will, unless in the opinion of its counsel the matter has been settled by controlling precedent, submit to a court of appropriate jurisdiction the question whether such indemnification by it is against public policy as expressed in the Securities Act and will be governed by the final adjudication of such issues.
II-9
The undersigned Registrant hereby undertakes that:
(1)
| (1) | For purposes of determining any liability under the Securities Act, the information omitted from the form of prospectus filed as part of this registration statement in reliance upon Rule 430A and contained in a form of prospectus filed by the Registrant pursuant to Rule 424(b)(1) or (4) or 497(h) under the Securities Act shall be deemed to be part of this registration statement as of the time it was declared effective. |
(2) For the purpose of determining any liability under the Securities Act, each post-effective amendment that contains a form of prospectus shall be deemed to be a new registration statement relating to the securities offered therein, and the offering of such securities at that time shall be deemed to be the initial bona fide offering thereof.
(3) Each prospectus filed pursuant to Rule 424(b) as part of the registration statement relating to this offering shall be deemed to be part of and included in the registration statement as of the date it is first used after effectiveness, provided, however, that no statement made in a registration statement or prospectus that is part of the registration statement or made in a document incorporated or deemed incorporated by reference into the registration statement or prospectus that is part of the registration statement will, as to a purchaser with a time of contract of sale prior to such first use, supersede or modify any statement that was made in the registration statement or prospectus that was part of the registration statement or made in any such document immediately prior to such date of first use.II-8
(4) For the purpose of determining liability of the Registrant under the Securities Act to any purchaser in the initial distribution of the securities, in a primary offering of securities of the Registrant pursuant to this registration statement, regardless of the underwriting method used to sell the securities to the purchaser, if the securities are offered or sold to such purchaser by means of any of the following communications, the Registrant will be a seller to the purchaser and will be considered to offer or sell such securities to such purchaser: (i) any preliminary prospectus or prospectus of the Registrant relating to the offering required to be filed pursuant to Rule 424; (ii) any free writing prospectus relating to the offering prepared by or on behalf of the Registrant or used or referred to by the Registrant; (iii) the portion of any other free writing prospectus relating to the offering containing material information about the Registrant or its securities provided by or on behalf of the Registrant; and (iv) any other communication that is an offer in the offering made by the Registrant to the purchaser.
| (2) | For the purpose of determining any liability under the Securities Act, each post-effective amendment that contains a form of prospectus shall be deemed to be a new registration statement relating to the securities offered therein, and the offering of such securities at that time shall be deemed to be the initial bona fide offering thereof. |
| (3) | Each prospectus filed pursuant to Rule 424(b) as part of the registration statement relating to this offering shall be deemed to be part of and included in the registration statement as of the date it is first used after effectiveness, provided, however, that no statement made in a registration statement or prospectus that is part of the registration statement or made in a document incorporated or deemed incorporated by reference into the registration statement or prospectus that is part of the registration statement will, as to a purchaser with a time of contract of sale prior to such first use, supersede or modify any statement that was made in the registration statement or prospectus that was part of the registration statement or made in any such document immediately prior to such date of first use. |
| (4) | For the purpose of determining liability of the Registrant under the Securities Act to any purchaser in the initial distribution of the securities, in a primary offering of securities of the Registrant pursuant to this registration statement, regardless of the underwriting method used to sell the securities to the purchaser, if the securities are offered or sold to such purchaser by means of any of the following communications, the Registrant will be a seller to the purchaser and will be considered to offer or sell such securities to such purchaser: (i) any preliminary prospectus or prospectus of the Registrant relating to the offering required to be filed pursuant to Rule 424; (ii) any free writing prospectus relating to the offering prepared by or on behalf of the Registrant or used or referred to by the Registrant; (iii) the portion of any other free writing prospectus relating to the offering containing material information about the Registrant or its securities provided by or on behalf of the Registrant; and (iv) any other communication that is an offer in the offering made by the Registrant to the purchaser. |
The undersigned Registrant hereby undertakes to provide to the underwriters at the closing specified in the Underwriting Agreement, certificates in such denomination and registered in such names as required by the underwriters to permit prompt delivery to each purchaser.
II-10
Signatures
Pursuant to the requirements of the Securities Act of 1933, as amended, the Registrant has duly caused this registration statement to be signed on its behalf by the undersigned, thereunto duly authorized, in the City of Milwaukee, State of Wisconsin on September 4, 2008.May 25, 2011.
By: | /S/ TODD A. ADAMS | |
| Name: | ||
| Title: |
President and Chief | |
SIGNATURES AND POWER OF ATTORNEY
We, the undersigned directors and officers of Rexnord Corporation (the “Company”), hereby severally constitute and appoint Todd A. Adams, Patricia M. Whaley and Michael H. Shapiro, and each of them individually, our true and lawful attorneys, with full power to them, and to each of them individually, to sign for us and in our names in the capacities indicated below, the registration statement on Form S-1 filed herewith, and any and all pre-effective and post-effective amendments to said registration statement, and any registration statement filed pursuant to Rule 462(b) under the Securities Act, in connection with the registration under the Securities Act, of our equity securities, and to file or cause to be filed the same, with all exhibits thereto and other documents in connection therewith, with the SEC, granting unto said attorneys, and each of them, full power and authority to do and perform each and every act and thing requisite and necessary to be done in connection therewith, as fully to all intents and purposes as each of them might or could do in person, and hereby ratifying and confirming all that said attorneys, and each of them, or their substitute or substitutes, shall do or cause to be done by virtue of this Power of Attorney.
Pursuant to the requirements of the Securities Act of 1933, this registration statement has been signed by the following persons in the capacities and on the dates indicated.
|
| |||
/S/ TODD A. ADAMS Todd A. Adams | President, Chief Executive Officer, Director (Principal Executive Officer) | May 25, 2011 | ||
Michael H. Shapiro | Vice President and Chief Financial Officer (Principal Financial and Accounting Officer) | |||
George M. Sherman |
| |||
Laurence M. Berg | Director | |||
Peter P. Copses | Director | |||
Damian J. Giangiacomo | Director | |||
Praveen R. Jeyarajah | Director | |||
Steven Martinez | Director | |||
/S/ JOHN S. STROUP John S. Stroup | Director | May 25, 2011 | ||
S-1
EXHIBIT INDEX
| Underwriting Agreement (to be filed by amendment). | ||
| 2.1 | Agreement and Plan of Merger, by and among Chase Acquisition I, Inc., Chase Merger Sub, Inc., RBS Global, Inc. and TC Group, L.L.C., dated as of May 24, 2006 (incorporated by reference from Exhibit 2.1 to the Form 8-K/A filed by RBS Global, Inc./Rexnord LLC on July 27, 2006). The Registrants agree to furnish supplementally a copy of the schedules omitted from this Exhibit 2.1 to the Commission upon request. | |
| 2.2 | Purchase Agreement, dated as of October 11, 2006, between RBS Global, Inc. and Jupiter Acquisition, LLC (incorporated by reference from Exhibit 2.2 to the Form 10-Q filed by RBS Global, Inc./Rexnord LLC on November 8, 2006). The registrants agree to furnish supplementally a copy of the schedules omitted from this Exhibit 2.3 to the Commission upon request. | |
| 2.3 | Stock Purchase Agreement dated as of September 27, 2002, by and among RBS Acquisition Corporation, Invensys plc, BTR Inc., BTR (European Holdings) BV, BTR Industries GmbH, Dunlop Vermögensverwaltungsgesellschaft GmbH, Brook Hansen Inc., Invensys France SAS, Invensys Holdings Ltd., Hansen Transmissions International Ltd., Hawker Siddeley Management Ltd. and BTR Finance BV (incorporated by reference from Exhibit 2.1 to the Form S-4 Registration Statement (SEC File no. 333-102428 filed by RBS Global, Inc./Rexnord LLC on January 9, 2003). The registrants agree to furnish supplementally a copy of the schedules omitted from this Exhibit 2.3 to the Commission upon request. | |
| 2.4 | Stock Purchase Agreement dated as of April 5, 2005, by and among Rexnord Industries, Hamilton Sundstrand Corporation and The Falk Corporation (incorporated by reference from Exhibit 99.2 to the Form 8-K filed by RBS Global, Inc./Rexnord LLC on May 19, 2005). The registrants agree to furnish supplementally a copy of the schedules omitted from this Exhibit 2.4 to the Commission upon request. | |
| 2.5 | Merger Agreement by and among Zurn Industries, LLC, Zurn Acquisition Sub Inc., GA Industries, Inc. and Certain Stockholders dated as of December 20, 2007 (incorporated by reference from Exhibit 10.1 to the Form 8-K filed by RBS Global, Inc./Rexnord LLC on December 21, 2007). | |
| 3.1 | Amended and Restated Certificate of Incorporation of Rexnord Corporation, as further amended (to be filed by amendment). | |
| 3.2 | Amended and Restated By-Laws of Rexnord Corporation (to be filed by amendment). | |
| 4.1 | Senior Subordinated Note Indenture with respect to the 11 3/ | |
| 4.2 |
| |
| 4.3 | Second Supplemental Indenture with respect to the 11 3/4% Senior Subordinated Notes due 2016, by and among RBS Global, Inc., Rexnord LLC, the Guarantors listed therein and Wells Fargo Bank, dated as of February 7, 2007 (incorporated by reference from Exhibit 4.16 to the Form S-4 Registration Statement (SEC File No. 333-140040) filed by RBS Global, Inc./Rexnord LLC on February 8, 2007). | |
| 4.4 | Third Supplemental Indenture with respect to the 11 3/4% Senior Subordinated Notes due 2016, by and among Zurn Industries, LLC, RBS Global, Inc., Rexnord LLC, and Wells Fargo Bank, dated as of April 1, 2007 (incorporated by reference from Exhibit 4.16 to the Form 10-K filed by RBS Global, Inc./Rexnord LLC on May 25, 2007). | |
| 4.5 | Fourth Supplemental Indenture with respect to the 11 3/4% Senior Subordinated Notes due 2016, by and among RBS Global, Inc., Rexnord LLC, the Guarantors listed therein and Wells Fargo Bank, dated as of February 1, 2008 (incorporated by reference from Exhibit 10.3 to the Form 10-Q filed by RBS Global, Inc./Rexnord LLC on February 5, 2008). | |
| 4.6 | Fifth Supplemental Indenture with respect to the 11 3/4% Senior Subordinated Notes due 2016, by and among RBS Global, Inc., Rexnord LLC, the Guarantors listed therein and Wells Fargo Bank, dated as of February 1, 2008 (incorporated by reference from Exhibit 4.1(f) to the Form 10-K filed by RBS Global, Inc./Rexnord LLC on May 13, 2011). | |
| 4.7 | Registration Rights Agreement with respect to the 11 3/4% Senior Subordinated Notes due 2016, by and among Chase Merger Sub, Inc., RBS Global, Inc., Rexnord Industries, the subsidiaries listed therein and Credit Suisse Securities (USA) LLC, Merrill Lynch, Pierce, Fenner & Smith Incorporated, Bear Stearns & Co. Inc. and Lehman Brothers Inc., dated July 21, 2006 (incorporated by reference from Exhibit 4.10 to the Form 8-K/A filed by RBS Global/Rexnord LLC on July 27, 2006). | |
| 4.8 | Form of Unrestricted Global Note evidencing the 11 3/4% Senior Subordinated Notes due 2016 (incorporated by reference from Exhibit 4.11 to the Form S-4 Registration Statement (SEC File No. 333-140040) filed by RBS Global, Inc./Rexnord LLC on January 17, 2007). | |
| 4.9 | Indenture, dated as of April 28, 2010, with respect to the 8 1/2% Senior Notes due 2018, by and among RBS Global, Inc., Rexnord LLC, the guarantors named therein and Wells Fargo Bank, National Association, as Trustee (incorporated by reference from Exhibit 4.1 to the Form 8-K filed by RBS Global, Inc./Rexnord LLC on April 28, 2010). | |
| 4.10 | Registration Rights Agreement, dated as of April 28, 2010, with respect to the 8 1/2% Senior Notes due 2018, by and among RBS Global, Inc., Rexnord LLC, the subsidiaries of RBS Global, Inc. party thereto, Credit Suisse Securities (USA) LLC, Banc of America Securities LLC and Goldman, Sachs & Co (incorporated by reference from Exhibit 4.2 to the Form 8-K filed by RBS Global, Inc./Rexnord LLC on April 28, 2010). | |
| 4.11 | Form of Unrestricted Global Note evidencing the 8 1/2% Senior Notes due 2018 (incorporated by reference from Exhibit 4.6(e) to the Form S-4 Registration Statement (SEC File No. 333-167904-30) filed by RBS Global, Inc./Rexnord LLC on June 30, 2010). | |
| 4.12 | Indenture with respect to the PIK Toggle Senior Notes due 2013 by and between Rexnord Corporation (f/k/a Rexnord Holdings, Inc.) and Wells Fargo Bank, National Association, as Trustee, dated as of August 8, 2008† | |
| 4.13 | Form of Certificate of Common Stock (to be filed by amendment). | |
| 5.1 | Opinion of O’Melveny & Myers LLP (to be filed by amendment). | |
| 10.1 | Amended and Restated Management Consulting Agreement among Rexnord Industries, George M. Sherman, Cypress Group, LLC and Cypress Industrial Holdings, LLC, effective February 7, 2007 (incorporated by reference from Exhibit 10.2 to the Form 10-K filed by RBS Global, Inc./Rexnord LLC on May 23, 2008).* | |
| 10.2 | Amended and Restated Management Consulting Agreement by and between Rexnord Corporation (f/k/a Rexnord Holdings, Inc.) and Apollo Management VI, L.P., dated February 7, 2007 (incorporated by reference from Exhibit 10.3 to the Form 10-K filed by RBS Global, Inc./Rexnord LLC on May 23, 2008).* | |
| 10.3 | Stockholders’ Agreement of Rexnord Corporation (f/k/a Rexnord Holdings, Inc.), Rexnord Acquisition Holdings I, LLC, Rexnord Acquisition Holdings II, LLC and certain other stockholders, dated July 21, 2006 (incorporated by reference from Exhibit 10.5 to the Form 8-K/A filed by RBS Global, Inc./Rexnord LLC on July 27, 2006).* | |
| 10.4 | Stockholders’ Agreement of Rexnord Corporation (f/k/a Rexnord Holdings, Inc.), Rexnord Acquisition Holdings I, LLC, Rexnord Acquisition Holdings II, LLC, Cypress Industrial Holdings, LLC and George M. Sherman, dated July 21, 2006 (incorporated by reference from Exhibit 10.6 to the Form 8-K/A filed by RBS Global, Inc./Rexnord LLC on July 27, 2006). | |
| 10.5 | Rexnord Industries Special Signing Bonus Plan (incorporated by reference from Exhibit 10.7 to the Form 8-K/A filed by RBS Global, Inc./Rexnord LLC on July 27, 2006).* | |
| 10.6 | Form of Special Signing Bonus Plan Participation Letter (incorporated by reference from Exhibit 10.8 to the Form 8-K/A filed by RBS Global, Inc./Rexnord LLC on July 27, 2006).* | |
| 10.7 | Rexnord Corporation (f/k/a Rexnord Holdings, Inc.) 2006 Stock Option Plan, as amended (incorporated by reference from Exhibit 10.6 to the Form 10-K filed by RBS Global, Inc./Rexnord LLC on May 25, 2010).* | |
| 10.8 | Form of Executive Non-Qualified Stock Option Agreement (incorporated by reference from Exhibit 10.10 to the Form 8-K/A filed by RBS Global, Inc./Rexnord LLC on July 27, 2006).* | |
| 10.9 | Form of George M. Sherman Non-Qualified Stock Option Agreement (incorporated by reference from Exhibit 10.11 to the Form 8-K/A filed by RBS Global, Inc./Rexnord LLC on July 27, 2006).* | |
| 10.10 | Form of Non-Employee Director (Apollo Director) Non-Qualified Stock Option Grant (incorporated by reference from Exhibit 10.8 to the Form 10-K filed by RBS Global, Inc./Rexnord LLC on May 25, 2007).* | |
| 10.11 | Stock Option Cancellation and Release Agreement, dated as of October 29, 2009, by and among Rexnord Corporation (f/k/a Rexnord Holdings, Inc.) and Cypress Industrial Holdings, LLC (incorporated by reference from Exhibit 10.5 to the Form 10-Q filed by RBS Global/Rexnord LLC on February 4, 2010).* | |
| 10.12 | Amended and Restated Non-Qualified Stock Option Agreement, dated April 16, 2010, between Rexnord Corporation (f/k/a Rexnord Holdings, Inc.) and Praveen Jeyarajah, amending and restating the option agreement dated as of October 29, 2009 (incorporated by reference from Exhibit 10.1 to the Form 8-K filed by RBS Global, Inc./Rexnord LLC on April 22, 2010).* | |
| 10.13 | Amended and Restated Non-Qualified Stock Option Agreement, dated April 16, 2010, between Rexnord Corporation (f/k/a Rexnord Holdings, Inc.) and Praveen Jeyarajah, amending and restating the option agreement dated as of April 19, 2007 (incorporated by reference from Exhibit 10.2 to the Form 8-K filed by RBS Global, Inc./Rexnord LLC on April 22, 2010).* | |
| 10.14 | Form of Rexnord Non-Union Pension Plan (incorporated by reference from Exhibit 10.13 to the Form S-4 Registration Statement (SEC File No. 333-102428).* | |
| 10.15 | Form of Rexnord Supplemental Pension Plan (incorporated by reference from Exhibit 10.14 to the Form S-4 Registration Statement (SEC File No. 333-102428).* | |
| 10.16 | Form of Rexnord Industries Executive Bonus Plan (incorporated by reference from Exhibit 10.15 to the Form S-4 Registration Statement (SEC File No. 333-102428).* | |
| 10.17 | Amended and Restated Credit Agreement, dated as of October 5, 2009, among Chase Acquisition I, Inc., RBS Global, Inc., and Rexnord LLC, Credit Suisse, Cayman Islands Branch, as administrative agent and the lenders party thereto (incorporated by reference from Exhibit 10.1 to the Form 8-K/A filed by RBS Global, Inc./Rexnord LLC on October 9, 2009). | |
| 10.18 | Receivables Sale and Servicing Agreement, dated September 26, 2007, by and among the Originators, Rexnord Industries, LLC as Servicer, and Rexnord Funding LLC (incorporated by reference from Exhibit 10.1 to the Form 8-K filed by RBS Global, Inc./Rexnord LLC on October 1, 2007). | |
| 10.19 | First Amendment, dated as of November 30, 2007, to the Receivables Sale and Servicing Agreement, dated as of September 26, 2007, among Rexnord Funding LLC, as the buyer, Rexnord Industries, LLC, as the servicer and an originator, Zurn Industries, LLC, as an originator, Zurn PEX, Inc., as an originator, and General Electric Capital Corporation, as the administrative agent. (incorporated by reference from Exhibit 10.2 to the Form 8-K filed by RBS Global, Inc./Rexnord LLC on May 23, 2011) | |
| 10.20 | Second Amendment, dated as of May 20, 2011, to the Receivables Sale and Servicing Agreement, dated as of September 26, 2007, among Rexnord Funding LLC, as the buyer, Rexnord Industries, LLC, as the servicer and an originator, Zurn Industries, LLC, as an originator, Zurn PEX, Inc., as an originator, and General Electric Capital Corporation, as the administrative agent (incorporated by reference from Exhibit 10.3 to the Form 8-K filed by RBS Global, Inc./Rexnord LLC on May 23, 2011). | |
| 10.21 | Receivables Funding and Administration Agreement, dated September 26, 2007, by and among Rexnord Funding LLC and General Electric Capital Corporation (incorporated by reference from Exhibit 10.2 to the Form 8-K filed by RBS Global, Inc./Rexnord LLC on October 1, 2007). (superseded) | |
| 10.22 | Amended and Restated Receivables Funding and Administration Agreement, dated as of May 20, 2011, by and among Rexnord Funding LLC, the financial institutions from time to time party thereto and General Electric Capital Corporation (incorporated by reference from Exhibit 10.1 to the Form 8-K filed by RBS Global, Inc./Rexnord LLC on May 23, 2011). | |
| 10.23 | Amended and Restated Guarantee and Collateral Agreement, dated as of October 5, 2009, among Chase Acquisition I, Inc., RBS Global, Inc., Rexnord LLC, the subsidiary guarantors party thereto and Credit Suisse, Cayman Islands Branch, as administrative agent (incorporated by reference from Exhibit 10.2 to the Form 8-K/A filed by RBS Global, Inc./Rexnord LLC on October 9, 2009). | |
| 10.24 | Rexnord Management Incentive Compensation Plan (revised as of July 29, 2010) (incorporated by reference from Exhibit 10.14 to the Form 10-Q filed by RBS Global, Inc./Rexnord LLC on November 12, 2010).* | |
| 10.25 | Rexnord Supplemental Retirement Plan adopted May 1, 2008 (incorporated by reference from Exhibit 10.21 to the Form 10-Q filed by RBS Global, Inc./Rexnord LLC on August 8, 2008).* | |
| 10.26 | Rexnord Supplemental Executive Retirement Plan As Amended Effective January 1, 2008 (incorporated by reference from Exhibit 10.24 to the Form 10-Q filed by RBS Global, Inc./Rexnord LLC on February 10, 2009).* | |
| 10.27 | Credit Agreement among Rexnord Corporation (f/k/a Rexnord Holdings, Inc.), the lenders party thereto, Credit Suisse, as administrative agent, Banc of America Bridge LLC as Syndication Agent and Credit Suisse Securities (USA) LLC and Banc of America Securities LLC as joint lead arrangers and joint bookrunning managers, dated as of March 2, 2007.† | |
| 21.1 | List of Subsidiaries of the registrant.† | |
| 23.1 | Consent of Independent Registered Public Accounting Firm.† | |
| 23.2 | Consent of O’Melveny & Myers LLP (included in Exhibit 5.1). | |
| 24 | Powers of Attorney (included on signature pages of this Registration Statement). | |
S-1
| † | Filed herewith |
| * | Denotes management plan or compensatory plan or arrangement. |