As filed with the Securities and Exchange Commission on July 12,August 1, 2011
Registration No. 333-174493
SECURITIES AND EXCHANGE COMMISSION
Washington, D.C. 20549
Amendment No. 23
to
FORM S-1
REGISTRATION STATEMENT
UNDER
THE SECURITIES ACT OF 1933
DELPHI AUTOMOTIVE PLC
(Exact Name of Registrant as Specified in Its Charter)
| | | | |
| Jersey | | 3714 | | Not Applicable |
(State or Other Jurisdiction of Incorporation or Organization) | | (Primary Standard Industrial Classification Code Number) | | (I.R.S. Employer Identification Number) |
| | Courtney Road Hoath Way Gillingham, Kent ME8 0RU United Kingdom 011-44-163-423-4422 | | |
(Address, Including Zip Code, and Telephone Number, Including Area Code, of Registrant’s Principal Executive Offices)
KEVIN P. CLARK
Vice President and Chief Financial
Officer
c/o Delphi Automotive LLP
5725 Delphi Drive
Troy, MI 48098
(248) 813-2000
(Name, Address, Including Zip Code, and Telephone Number, Including Area Code, of Agent For Service)
Copies to:
| | | | |
David M. Sherbin Vice President, General Counsel, Secretary and Chief Compliance Officer c/o Delphi Automotive LLP 5725 Delphi Drive Troy, MI 48098 (248) 813-2000 | | Michael Kaplan Davis Polk & Wardwell LLP 450 Lexington Avenue New York, New York 10017 (212) 450-4000 | | Richard B. Aftanas Skadden, Arps, Slate, Meagher & Flom LLP Four Times Square New York, New York 10036 (212) 735-3000 |
Approximate date of commencement of proposed sale to the public: As soon as practicable after the effective date of this Registration Statement.
If any of the securities being registered on this form are to be offered on a delayed or continuous basis pursuant to Rule 415 under the Securities Act of 1933, check the following box. ¨
If this form is filed to register additional securities for an offering pursuant to Rule 462(b) under the Securities Act, check the following box and list the Securities Act registration statement number of the earlier effective registration statement for the same offering. ¨
If this form is a post-effective amendment filed pursuant to Rule 462(c) under the Securities Act, check the following box and list the Securities Act registration statement number of the earlier effective registration statement for the same offering. ¨
If this form is a post-effective amendment filed pursuant to Rule 462(d) under the Securities Act, check the following box and list the Securities Act registration statement number of the earlier effective registration statement for the same offering. ¨
Indicate by check mark whether the registrant is a large accelerated filer, an accelerated filer, a non-accelerated filer, or a smaller reporting company. See the definitions of “large accelerated filer,” “accelerated filer” and “smaller reporting company” in Rule 12b-2 of the Exchange Act.
| | |
Large accelerated filer ¨ | | Accelerated filer ¨ |
Non-accelerated filer x (Do not check if a smaller reporting company) | | Smaller reporting company ¨ |
| | | | |
| |
Title Of Each Class Of Securities To Be Registered | | Proposed Maximum
Aggregate Offering Price(1) | | Amount Of
Registration Fee(2)(3) |
Ordinary Shares, par value $0.01 per share | | $100,000,000 | | $11,610 |
| |
| |
| (1) | Includes offering price of additional shares, if any, that may be purchased by the underwriters. |
| (2) | Calculated pursuant to Rule 457(o) under the Securities Act based on an estimate of the maximum aggregate offering price. |
The Registrant hereby amends this Registration Statement on such date or dates as may be necessary to delay its effective date until the Registrant shall file a further amendment which specifically states that this Registration Statement shall thereafter become effective in accordance with Section 8(a) of the Securities Act of 1933 or until the Registration Statement shall become effective on such date as the Commission, acting pursuant to said Section 8(a), may determine.
The information in this preliminary prospectus is not complete and may be changed. These securities may not be sold until the registration statement filed with the Securities and Exchange Commission is effective. This preliminary prospectus is not an offer to sell nor does it seek an offer to buy these securities in any jurisdiction where the offer or sale is not permitted.
Subject to Completion. Dated July 12,August 1, 2011.
SHARES
DELPHI AUTOMOTIVE PLC
Ordinary Shares
This is an initial public offering of ordinary shares of Delphi Automotive PLC.
Delphi Automotive PLC is offering of the shares to be sold in the offering. The selling shareholders identified in this prospectus are offering an additional shares. Delphi Automotive PLC will not receive any of the proceeds from the sale of the shares being sold by the selling shareholders.
Prior to this offering, there has been no public market for the ordinary shares. It is currently estimated that the initial public offering price per share will be between $ and $ . Delphi Automotive PLC intends to list the ordinary shares on The New York Stock Exchange under the symbol “DLPH”.
See “Risk Factors” on page 16 to read about factors you should consider before buying ordinary shares.
Neither the Securities and Exchange Commission nor any state securities commission has approved or disapproved of these securities or passed upon the accuracy or adequacy of this prospectus. Any representation to the contrary is a criminal offense.
| | | | | | | | |
| | | Per Share | | | Total | |
Initial public offering price | | $ | | | | $ | | |
Underwriting discounts and commissions (1) | | $ | | | | $ | | |
Proceeds, before expenses, to Delphi Automotive PLC | | $ | | | | $ | | |
Proceeds, before expenses, to the selling shareholders (1) | | $ | | | | $ | | |
| (1) | The selling shareholders will not pay any underwriting discount on the shares sold by them. In lieu thereof, Delphi Automotive PLC will pay a commission with respect to such shares to the underwriters. See “Underwriting.” |
To the extent that the underwriters sell more than ordinary shares, the underwriters have the option to purchase up to an additional shares from Delphi Automotive PLC and shares from the selling shareholders at the initial public offering price less the underwriting discount and any commissions payable by Delphi Automotive PLC.
The underwriters expect to deliver the shares against payment in New York, New York on , 2011.
| | | | |
| Goldman, Sachs & Co. | | J.P. Morgan |
| |
| BofA Merrill Lynch | | Barclays Capital |
| | | | |
| |
Citi | | Deutsche Bank Securities |
Morgan Stanley
| | | | | | | | |
| Baird | | Credit Suisse | | Lazard Capital Markets | | | UBS Investment Bank | |
| | | | | | | | |
| CRT Capital Group LLC | | Guggenheim Securities | | Houlihan Lokey | | | RBC Capital Markets | |
| | | | | | | | |
| Scotia Capital | | Ticonderoga Securities | | The Williams Capital Group, L.P. | | | UniCredit Capital Markets | |
Prospectus dated , 2011.
TABLE OF CONTENTS
Through and including , 2011 (the 25th day after the date of this prospectus), all dealers effecting transactions in these securities, whether or not participating in this offering, may be required to deliver a prospectus. This is in addition to a dealer’s obligation to deliver a prospectus when acting as an underwriter and with respect to an unsold allotment or subscription.
ABOUT THIS PROSPECTUS
In this prospectus, “Delphi,” the “Company,” the “Successor,” “we,” “us” and “our” refer to Delphi Automotive PLC, a public limited company which was formed under the laws of Jersey on May 19, 2011, together with the entities that will become its subsidiaries following the completion of this offering. Delphi Automotive PLC will, in connection with this offering, acquire all membership interests in Delphi Automotive LLP, a limited liability partnership incorporated under the laws of England and Wales which was formed on August 19, 2009 for the purpose of acquiring certain assets of the former Delphi Corporation. The former Delphi Corporation and, as the context may require, its subsidiaries and affiliates, are referred to herein as the “Predecessor” or “Old Delphi”. As the context may require, references to “Delphi”, “the Company”, “us”, “we” and “our” may also include the Predecessor.
We and the selling shareholders have not authorized anyone to provide any information other than that contained in this prospectus or in any free writing prospectus prepared by or on behalf of us or to which we have referred you. We and the selling shareholders take no responsibility for, and can provide no assurance as to the reliability of, any other information that others may give you. We and the selling shareholders are offering to sell, and seeking offers to buy, ordinary shares only in jurisdictions where offers and sales are permitted. The information contained in this prospectus is accurate only as of the date of this prospectus, regardless of the time of delivery of this prospectus or of any sale of the ordinary shares offered hereby.
The directors of the Company have taken all reasonable care to ensure that the facts stated in this prospectus are true and accurate in all material respects, and that there are no other facts the omission of which would make misleading any statement in this prospectus, whether of facts or of opinion. All the directors accept responsibility accordingly.
i
A copy of this document has been delivered to the registrar of companies in Jersey in accordance with Article 5 of the Companies (General Provisions) (Jersey) Order 2002, and he has given, and has not withdrawn, his consent to its circulation. The Jersey Financial Services Commission has given, and has not withdrawn, its consent under Article 2 of the Control of Borrowing (Jersey) Order 1958 to the issue of the ordinary shares. It must be distinctly understood that, in giving these consents, neither the registrar of companies in Jersey nor the Jersey Financial Services Commission takes any responsibility for the financial soundness of the Company or for the correctness of any statements made, or opinions expressed, with regard to it.
If you are in any doubt about the contents of this prospectus, you should consult your stockbroker, bank manager, solicitor, lawyer, accountant or other financial advisor.
MARKET AND INDUSTRY DATA
In this prospectus, we refer to information regarding market data obtained from internal sources, market research, publicly available information and industry publications, including industry data derived from information provided by J. D. Power & Associates, which we refer to as J. D. Power & Associates, and The Freedonia Group, Inc., Cleveland, OH, which we refer to as The Freedonia Group. Market share data included in this prospectus about our product lines and segments is based in large part on internal analyses as there is limited public information about such market share. We estimate the size of the applicable market based on our general market knowledge of our competitors and their capacities. We further estimate our market share and position based on our understanding regarding business awards to our competitors. Accordingly, figures for our market share are estimates. While we believe our estimates of market share to be accurate in all material respects, because this data is based on a number of estimates there can be no assurance that the actual market share data will not be materially different. Estimates are inherently uncertain, involve risks and uncertainties and are subject to change based on various factors, including those discussed under the heading “Risk Factors” in this prospectus. We believe that these sources and estimates are reliable but have not independently verified them.
ii
PROSPECTUS SUMMARY
This summary highlights information contained elsewhere in this prospectus. This summary may not contain all of the information that you should consider before deciding to invest in our ordinary shares. You should read this entire prospectus carefully, including the “Risk Factors” section and “Management’s Discussion and Analysis of Financial Condition and Results of Operations” and the consolidated financial statements and notes thereto included elsewhere in this prospectus.
Our Company
We are a leading global vehicle components manufacturer and provide electrical and electronic, powertrain, safety and thermal technology solutions to the global automotive and commercial vehicle markets. We are one of the largest vehicle component manufacturers, and our customers include the 25 largest automotive original equipment manufacturers (“OEMs”) in the world. We operate 110 manufacturing facilities and 15 major technical centers utilizing a regional service model that enables us to efficiently and effectively serve our global customers from low cost countries. We have a presence in 30 countries and have over 16,000 scientists, engineers and technicians focused on developing market relevant product solutions for our customers. In line with the growth in the emerging markets, we have been increasing our focus on these markets, in particular in China, where we have a major manufacturing base and strong customer relationships.
We believe we are well-positioned for growth from increasing global vehicle production volumes, increased demand for our Safe, Green and Connected products which are being added to vehicle content, and new business wins with existing and new customers. In order to transform its business portfolio and rationalize its cost structure, the former Delphi Corporation and certain of its U.S. subsidiaries filed for Chapter 11 protection in October 2005. As a result of the actions taken by the Predecessor and Delphi Automotive LLP’s continuing efforts following its acquisition of the majority of the Predecessor’s businesses in October 2009, we have substantially reduced our costs, aligned our product offerings with the faster-growing industry mega trends and re-aligned our manufacturing footprint into an efficient regional service model, allowing us to increase our profit margins. For the threesix months ended March 31,June 30, 2011, we generated revenue of $4.0$8.2 billion, net income of $310$626 million, and EBITDA (as defined in “Summary Historical Consolidated Financial Data” in this prospectus) of $529$1,073 million, with gross margins of 16.1%16.3% and EBITDA margins of 13.2%13.1%, and for the year ended December 31, 2010, we generated revenue of $13.8 billion, net income of $703 million, and EBITDA of $1.4 billion, with gross margins of 14.8% and EBITDA margins of 9.9%.
We believe the automotive industry is being shaped by increasing government regulations for vehicle safety, fuel efficiency and emissions control, as well as rapidly increasing consumer demand for connectivity. These industry mega trends, which we refer to as “Safe,” “Green” and “Connected,” are driving higher growth in products that address these trends than growth in the automotive industry overall. We have reorganized our business into four diversified segments, which enable us to develop solutions and manufacture highly-engineered products that enable our customers to respond to these mega trends:
| | • | | Electrical / Electronic Architecture—This segment provides complete design of the vehicle’s electrical architecture, including connectors, wiring assemblies and harnesses, electrical centers and hybrid power distribution systems. Our products provide the critical electrical and electronics backbone that supports increased vehicle content and electrification, reduced emissions and higher fuel economy through weight savings. For the threesix months ended March 31,June 30, 2011 and the year ended December 31, 2010, our revenues in this segment were $1,613$3,354 million and $5,620 million, respectively, and segment EBITDA was $240$457 million and $650 million, respectively, with EBITDA margins of 14.9%13.6% and 11.6%, respectively. |
| | • | | Powertrain Systems—This segment provides systems integration of full end-to-end gasoline and diesel engine management systems including fuel handling, fuel injection, combustion, electronic controls |
| | and test and validation capabilities. We design solutions to optimize powertrain power and performance while helping our customers meet new emissions and fuel economy regulations. For the threesix months ended March 31,June 30, 2011 and the year ended December 31, 2010, our revenues in this segment were $1,237$2,546 million and $4,086 million, respectively, and segment EBITDA was $132$320 million and $361 million, respectively, with EBITDA margins of 10.7%12.6% and 8.8%, respectively. |
| | • | | Electronics and Safety—This segment provides critical components, systems and advanced software for passenger safety, security, comfort and infotainment, as well as vehicle operation, including body controls, reception systems, audio/video/navigation systems, hybrid vehicle power electronics, displays and mechatronics. Our products integrate and optimize electronic content, which improves fuel economy, reduces emissions, increases safety and provides occupant infotainment and connectivity. For the threesix months ended March 31,June 30, 2011 and the year ended December 31, 2010, our revenues in this segment were $762$1,526 million and $2,721 million, respectively, and segment EBITDA was $105$198 million and $247 million, respectively, with EBITDA margins of 13.8%13.0% and 9.1%, respectively. |
| | • | | Thermal Systems—This segment provides powertrain cooling and heating, ventilating and air conditioning (“HVAC”) systems, such as compressors, systems and controls, and heat exchangers for the vehicle markets. Our products improve the efficiency by which the powertrain and cabin temperatures are managed, which are critical factors in achieving increased fuel economy and reduced emissions. For the threesix months ended March 31,June 30, 2011 and the year ended December 31, 2010, our revenues in this segment were $449$922 million and $1,603 million, respectively, and segment EBITDA was $52$98 million and $109 million, respectively, with EBITDA margins of 11.6%10.6% and 6.8%, respectively. |
Our business is diversified across end-markets, regions, customers, vehicle platforms and products. Our customer base includes the 25 largest automotive OEMs in the world, and, in 2010, 24% of our net sales came from emerging markets (Asia Pacific and South America). Our six largest platforms in 2010 were with six different OEMs. In addition, in 2010 our products were found in 17 of the 20 top-selling vehicle models in the United States, in all of the 20 top-selling vehicle models in Europe and in 13 of the 20 top-selling vehicle models in China. We have further diversified our business by increasing our sales in the commercial vehicle market, which is typically on a different business cycle than the light vehicle market and has grown to 8% of our 2010 net sales. In addition, approximately 8% of our 2010 net sales arewere to the aftermarket, which meets the ongoing need for replacement parts required for vehicle servicing.
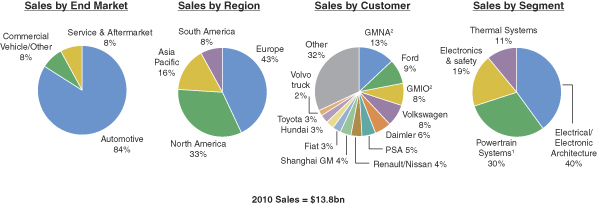
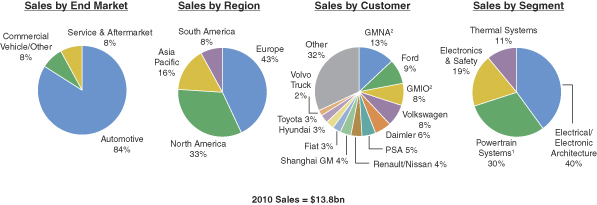
| (1) | Includes aftermarket sales, which comprised 8% of our 2010 revenue. |
| (2) | General Motors North America (“GMNA”) and General Motors International Operations (“GMIO”) are segments of General Motors Company (“GM”) and together represent 21% of our 2010 revenue. |
We have substantially restructured and transformed our business to achieve a lean cost structure and global footprint to compete profitably in our industry. Since 2005, we have reduced our product lines from 119 to 33, exited 11 businesses, closed over 70 sites, and decreased our global headcount, including temporary employees, by approximately 27%25%. As a result of our transformation, 91% of our hourly workforce is now located in low cost countries. In addition, approximately 30% of our hourly workforce is composed of temporary employees, making it easier for us to flex our workforce as volumes change. We no longer have any employees represented by the International Union, United Automobile, Aerospace and Agricultural Implement Workers of America (“UAW”). In addition, we do not have any significant U.S. defined benefit pension or workforce postretirement health care benefits or employer-paid postretirement basic life insurance benefits (“OPEB”) obligations.
We have established a worldwide design and manufacturing footprint with a regional service model that enables us to efficiently and effectively serve our global customers from low cost countries. This regional model is structured primarily to service the North American market from Mexico, the South American market from Brazil, the European market from Eastern Europe and North Africa, and the Asia Pacific market from China. Our global scale and regional service model enables us to engineer globally and execute regionally to serve the largest OEMs, which are seeking suppliers that can serve them on a worldwide basis. Our footprint also enables us to adapt to the regional design variations the global OEMs require and serve the emerging market OEMs.
Together, our cost reductions and re-alignment of our manufacturing footprint have substantially increased our profit margins and operational flexibility. Our business model is now designed to be profitable at all points in the normal automotive business cycle. For example, in 2010, we would have maintained positive EBITDA even if volumes were 30% below actual industry production volumes (or global production of 55 million vehicles rather than 78 million vehicles), assuming constant pricing and product and regional mix and based on our fixed cost structure in 2010 of approximately $3.2 billion and our variable costs which approximated two-thirds of sales in 2010; actual pricing, product and regional mix would likely differ in any future downturn. Our business model also has operating leverage, from which we believe we will benefit as our production volumes increase due to forecasted industry growth, content growth, and new business wins. We do not believe we will need to add substantial manufacturing capacity over the next several years to support this growth. We have had significant success winning new business with existing and new customers on both global platforms and on regional specific platforms. In 2010, we won business that we estimate will represent $20 billion of gross anticipated revenues based on expected volumes and assumed pricing. In the first quarterhalf of 2011, this trend accelerated, with another $6.6$14.4 billion in new business awards, based on expected volumes and assumed pricing. Actual results could vary if these assumptions prove incorrect. See “Risk Factors—Risks Related to Business Environment and Economic Conditions—Continued pricing pressures, OEM cost reduction initiatives and the ability of OEMs to re-source or cancel vehicle programs may result in lower than anticipated margins, or losses, which may have a significant negative impact on our business.” We believe our operating leverage will enable us to generate increased profitability and higher margins from these new business wins.
Our Industry
Demand for vehicle component parts from OEMs is generally a function of the number of vehicles produced and trends in content per vehicle, which can be affected by a number of factors including social, political and economic conditions.
Recovery of Developed Markets and Continued Emerging Markets Growth
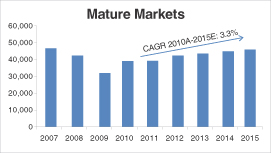
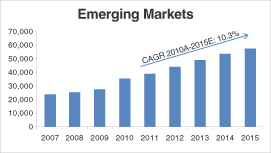
According to J.D. Power & Associates, global vehicle production is forecast to grow at a compound annual growth rate (“CAGR”) of 6.8% from 2010 to 2015. In the near term, the mature markets, including North America and Western Europe, are expected to grow at 3.3% from 2010 to 2015 for an increase of approximately 6.9 million units, while the emerging markets are forecast to grow at 10.3% during the same period, for an increase of approximately 22.2 million units. However, current OEM production volumes in North America and
Western Europe continue to be substantially less than OEM production volumes prior to the disruptions in the economic and credit markets experienced in 2008 and 2009. We expect that nearly half of our total future growth will be generated from emerging markets, especially China, which now represents a larger market for automotive components than either the United States or Japan. As a consequence of this shift in demand, many automotive manufacturing and supply companies have located operations in China and have entered into strategic partnerships and supply arrangements designed to support increased production. The total market and the relative growth in the emerging markets are shown in the illustrations below.
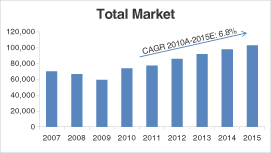
Source: J.D. Power & Associates
Note: Vehicles in thousands. “Mature markets” refers to Australia, Japan, South Korea, North America (including Mexico) and Western Europe. “Emerging markets” refers to the rest of the world.
Demand for Increased Safety
OEMs continue to focus on improving occupant and pedestrian safety in order to meet increasingly stringent regulatory requirements in various markets, such as the recent proposal by the U.S. National Highway Traffic Safety Administration to mandate rear view cameras in all vehicles by 2014. As a result, suppliers are focused on developing technologies aimed at protecting vehicle occupants when a crash occurs, as well as those that proactively mitigate the risk of a crash occurring. Examples of new and alternative technologies are lane departure warning systems and collision avoidance technologies, which incorporate sophisticated electronics and advanced software. According to The Freedonia Group, the value of safety and security electronics content globally is expected to grow (based on increasing production and increased content per vehicle) in excess of 13% CAGR from 2009 to 2014, a trend which favors suppliers with the ability to fulfill demand for these important components and systems.
Trend of Increased Fuel Efficiency and Reduced Emissions
OEMs also continue to focus on improving fuel efficiency and reducing emissions in order to meet increasingly stringent regulatory requirements in various markets. On a worldwide basis, the relevant authorities
in the European Union, the United States, China, India, Japan, Brazil, South Korea and Argentina have already instituted regulations requiring further reductions in emissions and/or increased fuel economy through 2014. In many cases, the same authorities have initiated legislation that would further tighten the standards through 2020 and beyond. Based on proposed European legislation, we believe OEMs may be required to reduce fleet average CO2 emissions for passenger cars by nearly 40% from 140 grams/kilometer, or approximately 39 miles/gallon, in 2008 to 85 grams/kilometer, or over 60 miles/gallon, by 2020. Based on the current regulatory environment, we believe that OEMs in other parts of the world, including the U.S. and China, will be subject to even greater reductions in CO2 emissions from their current levels over the next ten years. These standards will require meaningful innovation as OEMs and suppliers are forced to find ways to improve thermal management, engine management, electrical power consumption, vehicle weight and integration of alternative powertrains (e.g., electric/hybrid engines). According to The Freedonia Group, the value (i.e., the absolute dollar amount of demand, which may grow based on vehicle sales, more content per vehicle and higher prices for content) of powertrain and emissions electronics systems content globally, including fuel injection systems and engine management systems, is expected to grow (based on increasing production and increased content per vehicle) in excess of 11% CAGR from 2009 to 2014. We expect that as the market for these products expands, we will have the opportunity to obtain proportional growth in prices and margins in these areas, subject to competitive market dynamics.
Trend Towards Connectivity
The technology content of vehicles continues to increase as consumers demand greater safety, personalization, infotainment, productivity and convenience while driving. The automotive industry is focused on developing technologies designed to seamlessly integrate the highly complex electronic world in which automotive consumers live in the cars they drive, so that time in a vehicle is more productive and enjoyable. Advanced technologies offering mobile voice and data communication, while minimizing driver distraction, such as those used in our mobile electronics products coupled with global positioning systems and in-vehicle infotainment will continue to grow in importance. These and other related products are leading to higher electronic content per vehicle. According to The Freedonia Group, the value of OEM-installed infotainment systems globally, including communication and navigation equipment, backup monitors and heads up displays, entertainment systems, and other comfort and convenience systems are expected to increase (based on increasing production and increased content per vehicle) at CAGRs of approximately 20%, 28%, 10%, and 14%, respectively, from 2009 to 2014.
Standardization of Sourcing by OEMs
Many OEMs are adopting global vehicle platforms to increase standardization, reduce per unit cost and increase capital efficiency and profitability. As a result, OEMs are selecting suppliers that have the capability to manufacture products on a worldwide basis as well as the flexibility to adapt to regional variations. Suppliers with global scale and strong design, engineering and manufacturing capabilities, are best positioned to benefit from this trend. OEMs are also increasingly looking to their suppliers to simplify vehicle design and assembly processes to reduce costs. As a result, suppliers that sell vehicle components directly to manufacturers (Tier I suppliers) have assumed many of the design, engineering, research and development and assembly functions traditionally performed by vehicle manufacturers. Suppliers that can provide fully-engineered solutions, systems and pre-assembled combinations of component parts are positioned to leverage the trend toward system sourcing.
Our Competitive Strengths
Global Market Leader
We are one of the world’s largest vehicle component manufacturers. We estimate that we hold the #1 or #2 position in product categories representing over 70% of our 2010 net sales, including electrical/electronic
distribution systems, automotive connection systems, diesel engine management systems, and infotainment & driver interface. In addition, in 2010 our products were found in 17 of the 20 top-selling vehicle models in the United States, in all of the 20 top-selling vehicle models in Europe and in 13 of the 20 top-selling vehicle models in China.
Product Portfolio Tied to the Key Industry Mega Trends
Our product offerings satisfy the OEMs’ need to meet increasingly stringent government regulations and fulfill consumer preferences for products that address the mega trends of Safe, Green and Connected, leading to increased content per vehicle, greater profitability and higher margins. With these offerings, we are well-positioned to capitalize on demand for increased safety, fuel efficiency, emissions control and connectivity to the global information network. There has been a substantial increase in vehicle content and electrification requiring a complex and reliable electrical architecture and systems to operate, such as hybrid power electronics, electrical vehicle monitoring, lane departure warning systems, integrated electronic displays, navigation systems and consumer electronics. Our ability to design a reliable electrical architecture that optimizes power distribution and/or consumption is key to satisfying the OEMs’ need to reduce emissions while continuing to meet the demands of consumers. Additionally, our Powertrain Systems and Thermal Systems segments are also focused on addressing the demand for increased fuel efficiency and emission control by controlling fuel consumption and heat dissipation, which are principal factors influencing fuel efficiency and emissions.
Global and Diverse Customer Base
Our customer base includes the 25 largest automotive OEMs in the world. Our long-standing relationships with both the leading global OEMs and regional OEMs position us to benefit from the cyclical recovery in North America and Europe and secular growth in emerging markets. Our six largest platforms in 2010 were with six different OEMs. Our top five customers are Daimler AG (“Daimler”), Ford Motor Company (“Ford”), General Motors Company (“GM”), PSA Peugeot Citroën (“Peugeot”) and Volkswagen Group (“VW”), collectively representing 49% of our 2010 revenue, with our largest customer representing only 21% of our 2010 revenue. We have further diversified our business by increasing our sales in the commercial vehicle market, which is typically on a different business cycle than the light vehicle market and now representsrepresented 8% of our 2010 net sales. In addition, approximately 8% of our 2010 net sales arewere to the aftermarket.
We have substantially expanded our presence in emerging markets to enable us to capture the rapid growth principally in China, Brazil, India and Russia. Our presence in these countries will, for example, enable us to continue growing our market share among the regional automotive OEMs in these countries, including AVTOVAZ, Brilliance China, Changan, Chery, China FAW, Geely, Mahindra & Mahindra, Tata Motors and Ulyanovsk.
Global Manufacturing Footprint and Regional Service Model
We have a global manufacturing footprint and regional service model that enable us to efficiently and effectively operate from primarily low cost countries. We operate 110 manufacturing facilities and 15 major technical centers with a presence in 30 countries throughout the world. We have located these technical and manufacturing facilities in close proximity to our customers, enabling us to rapidly meet customer support requirements and satisfy regional variations in global vehicle platforms, while minimizing supply chain costs. Our global footprint enables us to serve the global OEMs on a worldwide basis along with gaining market share with the emerging market OEMs. This regional model has largely migrated to service the North American market out of Mexico, the South American market out of Brazil, the European market out of Eastern Europe and North Africa and the Asia Pacific market out of China.
Leading Supplier in the China Automotive Market
We have a strong presence in China, where we have operated for nearly 20 years. All of our business segments have operations and sales in China, where we employ approximately 21,000 people (including temporary workers), including approximately 2,800 scientists, engineers and technicians. Our strong engineering capabilities allow us to provide full product design and system integration to the regional OEMs.OEMs in China. As a result, we are a supplier to every major automotive OEM in China, with whom we have well-established relationships, with all of the major automotive OEMs in China, including: Brilliance China, Changan, Chery, China FAW, Geely, Shanghai General Motors and Shanghai Volkswagen. The Delphi brand is recognized by OEMs in China as a leading supplier, and we estimate that we hold the #1 or #2 position in product categories representing over 75% of our 2010 China revenues. We conduct our business through twofully consolidated, wholly-owned subsidiaries and 12 majority controlled joint ventures.ventures over which we have management control. Our local partners in the joint ventures are not our competitors. This legal entity structure gives us control over our strategy and operational activities in the region. We generated approximately $1.8 billion in revenue from China in 2010. In support of our growing revenue, we anticipate these subsidiariesour facilities in China will expand their operations with the addition of four new manufacturing sites over the next two years. This legal entity structure gives us control over our strategy and operational activities in the region and results in consolidation of revenue and earnings in our financial statements. We generated approximately $1.8 billion in revenue from China in 2010. With only 21 of our 33 offered products currently locally manufactured, we believe we have the opportunity to expand additional product lines into China, and as a result, we see further growth potential.
Lean and Flexible Cost Structure
We have a world-class, lean manufacturing system that allows us to provide customers with quality products and just-in-time delivery at competitive costs. In 2010, we largely completed our restructuring activities, resulting in a lower fixed cost base, improved manufacturing footprint and reduced overhead. We dramatically reduced our U.S. and Western European footprints, realigned our selling, general and administrative cost structure and increased the variable nature of our employee base. As a result, 91% of our hourly workforce is located in low cost countries. Furthermore, we have substantial operational flexibility by leveraging a large workforce of temporary workers, which represented approximately 30% of the hourly workforce as of March 31,June 30, 2011. We are focused on maintaining a low fixed cost base to minimize our EBITDA breakeven, which we estimate to be 30% below the current production volumes, assuming constant product mix and based on 2010 results. We believe that our lean cost structure will allow us to remain profitable at all points of the traditional vehicle industry production cycle.
World-Class Engineering Capabilities
Our history and culture of innovation have enabled us to develop significant intellectual property and design and development expertise to provide advanced technology solutions that meet the demands of our customers. We have a team of more than 16,000 scientists, engineers and technicians focused on developing leading product solutions for our key markets, located at 15 major technical centers in Brazil, China, France, Germany, India, Luxembourg, Mexico, Poland, South Korea, the United Kingdom and the United States. We invest approximately $1 billion annually in engineering to maintain our portfolio of innovative products, and currently own approximately 6,000 patents. We also encourage “open innovation” and collaborate extensively with peers in the industry, government agencies and academic institutions. Our technology competencies are recognized by both customers and government agencies, who have co-invested approximately $300 million of additional funds annually in new product development, increasing our total spend accordingly, accelerating the pace of innovation and reducing the risk associated with successful commercialization of technological breakthroughs. One example of co-investment is that we received an $89 million grant from the U.S. Department of Energy for reimbursement for up to 50% of the project costs associated with the development and manufacturing of power electronics related to electric and hybrid electric vehicles.
Our heritage includes the first factory installed radio, and we were a developer and designer of digital satellite radios, non-CFC refrigerant systems, high efficiency heat & mass exchangers, halogen free cables, dual
mode electronically scanning radar, gas direct injection, power electronics & high voltage architectures for hybrid electric vehicles and electric vehicles. We have been recognized for our long history of innovation as a winner of the prestigious Automotive News PACE Award. The Automotive News PACE awards honor superior innovation, technological advancement and business performance in the automotive industry and is judged by an independent panel of industry experts. Over the past two years we have been a winner three times and over the 17-year history of the PACE awards, we have received more awards than any other automotive supplier. In 2010, we launched approximately 800 new product programs around the globe. Our future pipeline has promise in collision mitigation with auto braking, electric cam phasing, software defined radio, 2-step continuous variable valvetrain, ammonia and particulate sensors, high power density inverter switches for hybrid electric vehicles and other Safe, Green and Connected solutions.
Significant Operating Leverage Leading to Higher Margins
Our business model has generated strong margins. We believe our operating leverage will enable us to generate increased profitability from higher OEM production volumes, increased content per vehicle and new business wins, and our profitability has been increasing with these trends. We generated gross margins of 16.1%16.3% for the threesix months ended March 31,June 30, 2011 as compared to 14.8% for the year ended December 31, 2010, and EBITDA margins of 13.2%13.1% as compared to 9.9% for the year ended December 31, 2010. Segment EBITDA margins were greater than 10% in each of our operating segments for the threesix months ended March 31,June 30, 2011.
Strong Cash Flow Generation and Balance Sheet
Our margins have also translated to strong cash flow generation. In 2010, we generated $781 million in cash flow before financing (which is defined as cash flows from operating activities and cash flows from investing activities (excluding investments in time deposits)). Furthermore, we have a strong balance sheet with gross debt of $2.5$2.2 billion and substantial liquidity of $2.5 billion as of March 31,June 30, 2011, (in each case after giving effect to the modification of our Credit Agreement and issuance of Senior Notes (each as defined and described below) on May 17, 2011), and no significant U.S. defined benefit or OPEB liabilities. We intend to maintain strong financial discipline targeting industry-leading earnings growth, cash flow generation and return on invested capital and to maintain sufficient liquidity to sustain our financial flexibility throughout the industry cycle.
Experienced Management Team
Our management team has significant experience, a deep understanding of the vehicle components industry and a firm focus on sustaining our leadership and financial strength. This team has been responsible for implementing the key operational restructuring initiatives that have positioned us for sustainable leadership in our industry with a strong and competitive financial profile. Key accomplishments since 2005 have included:
Aligning our portfolio with the mega trends—Safe, Green and Connected—by reducing our business units from 27 to 10 and our product lines from 119 to 33;
Diversifying our geographic, product and customer mix, resulting in only 33% of our 2010 net sales generated in the North American market and 21% from our largest customer;
Reducing our cost structure by repositioning 91% of our hourly workforce in low cost countries; reducing our manufacturing space by 62%, or 42 million square feet; and reducing total headcount by approximately 27%25%;
Sustaining our commitment to innovation by investing approximately $1 billion annually in engineering; and
Generating a record level of business bookings, including $20 billion in 2010 and $6.6$14.4 billion in the first quarterhalf of 2011.
Our Strategy
Our strategy is to develop and manufacture innovative market-relevant products for a diverse base of customers around the globe and leverage our lean and flexible cost structure to achieve strong earnings growth and returns on invested capital. Through our culture of innovation and world class engineering capabilities we will continue to employ our rigorous, forward-looking product development process to deliver new technologies that provide solutions to OEMs.
Leverage Our Engineering and Technological Prowess
We will continue to leverage our strong product portfolio tied to the industry’s key mega trends with our global footprint to increase our revenues. We remain committed to sustaining our substantial annual investment in research and development to maintain and enhance our leadership in each of our product lines. We expect to introduce new products and customized solutions that enable OEMs to meet the increasing fuel economy and emissions regulations as well as consumer demand for increased connectivity and active safety features. We will continue to focus on identifying the next market trends that we believe will position us to capture new growth.
Capitalize on Our Scale, Global Footprint and Established Position in Emerging Markets
We intend to generate sustained growth by capitalizing on the breadth and scale of our operating capabilities, our global footprint that provides us the important proximity to our customers’ manufacturing facilities and allows us to serve them in every region of the world in which they operate, and our established presence in high growth emerging markets.
We are one of only a few vehicle component manufacturers with the resources and scale of operations to provide our customers with complete end-to-end systems solutions. From the development and design of innovative new products, to world class engineering, manufacturing and supply-chain management capabilities, we have significant resources that we use to help our customers meet the changing demands of the market. We have engineering and production capabilities in every major auto-producing market in the world, including North America, South America, Europe and Asia. As a result, we are able to capitalize on the global standardization of vehicle platforms by the largest OEMs, while adapting our products for regional variations and regional OEMs.
We continue to expand our significant presence in emerging markets, positioning us to benefit from the expected growth opportunities in these regions. We will accomplish this by capitalizing on our long-standing relationships with the global OEMs and further enhancing our positions with the emerging market OEMs, thereby continuing to expand our worldwide leadership. We will continue to build upon our extensive geographic reach to capitalize on the fast-growing automotive markets, particularly in China, Brazil, India and Russia. We believe that our presence in low cost countries positions us to realize incremental margin improvements as the global balance of automotive production shifts towards the emerging markets.
Leverage Our Lean and Flexible Cost Structure to Deliver Profitability and Cash Flow
We recognize the importance of maintaining a lean and flexible cost structure in order to deliver stable earnings and cash flow in a cyclical industry. We intend to focus on maximizing manufacturing output to meet increasing production requirements with minimal additions to our fixed-cost base. We will continue to utilize a meaningful amount of temporary workers to ensure we have the appropriate operational flexibility to scale our operations so that we maintain our profitability as industry production levels increase or contract.
Target the Right Business with the Right Customers
We are strategic in pursuing new business and customers. We conduct in-depth analysis of market share and product trends by region in order to prioritize research, development and engineering spend for the customers that we believe will be successful. We collaborate with these customers in our 15 major technical centers around the world to help develop innovative product solutions for their needs. As more OEMs design vehicles for global platforms, where the same vehicle architecture is shared among different regions, we are well suited to provide global design and engineering support while manufacturing these products for a specific regional market. In addition we are disciplined in our pursuit of new business to ensure that we earn appropriate returns on capital. We have a rigorous internal approval process that requires senior executive review and approval to ensure consistency with our strategic and financial goals.
Pursue Selected Acquisitions and Strategic Alliances
Acquisitions and strategic alliances represent an important element of our business strategy and we believe we have the financial flexibility to pursue these opportunities with our current capital structure and liquidity profile. We believe that there are opportunities to grow through acquisitions, given the trend by OEMs to source globally and from a smaller number of suppliers, and that strategic alliances will allow us to pursue new opportunities faster and with less risk and investment. We intend to pursue selected transactions that leverage our technology capabilities, enhance our customer base, geographic penetration and scale to complement our current businesses. These complementary opportunities will provide us with access to new technologies, expand our presence in existing markets and enable us to establish a presence in adjacent markets.
Our History and Structure
On August 19, 2009, Delphi Automotive LLP, a limited liability partnership organized under the laws of England and Wales, was formed for the purpose of acquiring certain assets and subsidiaries of the Predecessor, which had filed for bankruptcy protection. At this time, three firms, GM and affiliates of Silver Point Capital and Elliott Management, agreed to take a controlling stake in Delphi Automotive LLP. These three equity holders had jointly established a plan to fund the restructuring and repositioning of the business. As a part of this plan, these equityholders established a board of proven senior executives to assist the management team in the continued restructuring of the business.
On October 6, 2009, Delphi Automotive LLP acquired the major portion of the business of the Predecessor, other than the global steering business, the U.S. manufacturing facilities in which the hourly employees were represented by the UAW and certain non-productive U.S. assets, and Delphi Automotive LLP issued membership interests to a group of investors consisting of lenders to the Predecessor, GM and the Pension Benefit Guaranty Corporation (the “PBGC”).
On May 19, 2011, Delphi Automotive PLC, a Jersey public limited company, was formed. Delphi Automotive PLC has nominal assets and no liabilities and has conducted no operations prior to completion of this offering. Immediately prior to the closing of this offering, it will acquire all of the outstanding unitsmembership interests of Delphi Automotive LLP from its existing unitequity holders in exchange for ordinary shares and, as a result, Delphi Automotive LLP will become a wholly-owned subsidiary of Delphi Automotive PLC. All historical financial information presented in this prospectus for periods subsequent to October 6, 2009 is that of Delphi Automotive LLP.
Recent Developments
On March 31, 2011, Delphi Automotive LLP redeemed the membership interests owned by GM and the PBGC for $3.8 billion and $594 million, respectively. In addition, on April 26, 2011, Delphi Automotive LLP amended its limited liability partnership agreement to adjust the distribution rights among the holders of the remaining classes of membership interests and to modify and normalize governance rights by eliminating special control rights held by affiliates of Silver Point Capital and Elliott Management to more closely reflect a typical public company.
On March 31, 2011, Delphi Corporation, a wholly-owned U.S. subsidiary of Delphi Automotive LLP, entered into a credit agreement (the “Credit Agreement”) with JPMorgan Chase Bank, N.A. that provided for a $500 million undrawn revolver and $2.5 billion in funded term loans, guaranteed by Delphi Automotive LLP and certain of its existing and future subsidiaries. The $2.5 billion in term loan proceeds, along with existing cash, were utilized to finance the redemptions of the membership interests owned by GM and PBGC and repayment of our 12.00% unsecured notes due 2014. On May 17, 2011, the Credit Agreement was modified to increase the amount of commitments on the revolver to $1.2 billion, to reduce the amount of the term loans to $1.2 billion and to reduce certain interest rates applicable to the term loans.
On May 17, 2011, Delphi Corporation issued $500 million of 5.875% senior notes due 2019 and $500 million of 6.125% senior notes due 2021 (collectively, the “Senior Notes”) in a transaction exempt from registration under Rule 144A and Regulation S of the Securities Act of 1933, as amended (the “Securities Act”). The Senior Notes are fully and unconditionally guaranteed, jointly and severally, by Delphi Automotive LLP and certain of its existing and future subsidiaries. The net proceeds of approximately $1.0 billion, together with cash on hand, were used to pay down amounts outstanding under the Credit Agreement.
Risks Affecting Us
Investing in securities involves substantial risk, and our business is subject to numerous risks and uncertainties. Investors should carefully consider the information set forth in this prospectus and, in particular the information under the heading “Risk Factors.”
Company Information
Our principal executive offices are located at Courtney Road, Hoath Way, Gillingham, Kent ME8 0RU, United Kingdomand our telephone number is 011-44-163-423-4422. Our register of members is kept at our registered office, which is Queensway House, Hilgrove Street, St Helier, Jersey JE1 1ES, Channel Islands.
Our internet address iswww.delphi.com. The information on our website and any other website that is referred to in this prospectus is not part of this prospectus.
THE OFFERING
| | |
| |
Ordinary shares offered by us | | shares |
| |
Ordinary shares offered by the selling shareholders | | shares |
| |
Total ordinary shares offered | | shares |
| |
Ordinary shares to be outstanding after this offering | | shares |
| |
Option to purchase additional shares | | shares from us and shares from the selling shareholders |
| |
Use of proceeds | | Our net proceeds from the offering will be approximately $ , or approximately $ if the underwriters exercise their option to purchase additional shares in full. We intend to use the net proceeds for general corporate purposes, primarily to fund our operations, to acquire capital equipment and to repay debt. We will not receive any proceeds from the ordinary shares being sold by the selling shareholders. |
| |
Dividend policy | | We do not intend to pay dividends on our ordinary shares. We plan to retain any earnings for use in the operation of our business and to fund future growth. |
| |
NYSE symbol | | We intend to list our ordinary shares on The New York Stock Exchange, or NYSE, under the symbol “DLPH”. |
Unless we specifically state otherwise and except for historical financial information, the information in this prospectus reflects or assumes our issuance of ordinary shares to Delphi Automotive LLP’s equityholders (assuming that the offering is priced at the midpoint of the range set forth on the cover of this prospectus) in connection with this offering in exchange for all of the equity interests in Delphi Automotive LLP, including shares issued to our directors who are holders of its Class E-1 membership interests and remaining shares issued to its other equityholders. A $1.00 increase (decrease) in the offering price, holding the number of shares offered constant, would increase (decrease) the number of shares issued to our existing equityholders to and the number of shares issued to our directors who are holders of its Class E-1 membership interests to .
Unless we specifically state otherwise, the information in this prospectus does not take into account:
the issuance of up to additional ordinary shares that the underwriters have the option to purchase from us; and
shares reserved for issuance pursuant to awards under our existing Management Value Creation Plan, or Value Creation Plan (which provides for issuances of equity and/or cash to members of our management based on the value of the Company at December 31, 2012, including the amounts used to repurchase unitsmembership interests of Delphi Automotive LLP prior to the date of this offering), based on an offering price at the midpoint of the range set forth on the cover of this prospectus. A $1.00 increase (decrease) in the offering price, holding the number of ordinary shares offered constant, would increase (decrease) the number of ordinary shares reserved for issuance under this plan by .
SUMMARY HISTORICAL CONSOLIDATED FINANCIAL DATA
Delphi Automotive PLC was formed on May 19, 2011, has nominal assets and no liabilities and will conduct no operations prior to the completion of this offering. Accordingly, the following presents historical financial information for Delphi Automotive LLP, which will become a wholly-owned subsidiary of Delphi Automotive PLC immediately prior to completion of this offering.
The following selected consolidated financial data of the Successor and the Predecessor have been derived from the audited and unaudited consolidated financial statements of the Successor and the Predecessor and should be read in conjunction with, and are qualified by reference to, “Management’s Discussion and Analysis of Financial Condition and Results of Operations”, “Unaudited Pro Forma Condensed Consolidated Financial Information” and the consolidated financial statements and notes thereto included elsewhere in this prospectus.
| | | | Successor | | | | Predecessor(1) | | | Successor | | | | Predecessor(1) | |
| | | Three months
ended March 31, | | Year ended
December 31,
2010 | | | Period from
August 19 to
December 31,
2009 | | | | | Period from
January 1 to
October 6, 2009 | | | Year ended
December 31,
2008 | | | Six months
ended June 30, | | Year ended
December 31,
2010 | | | Period from
August 19 to
December 31,
2009 | | | | | Period from
January 1 to
October 6, 2009 | | | Year ended
December 31,
2008 | |
| | 2011 | | 2010 | | | 2011 | | 2010 | |
| | | (dollars in millions, except per share data) | | | | (dollars in millions, except per
share data) | | | (dollars in millions, except per share data) | | | | (dollars in millions, except per
share data) | |
Statements of operations data: | | | | | | | | | | | | | | | | | | | | | | | | | | | | |
Net sales | | $ | 3,997 | | | $ | 3,410 | | | $ | 13,817 | | | $ | 3,421 | | | | | $ | 8,334 | | | $ | 16,808 | | | $ | 8,210 | | | $ | 6,856 | | | $ | 13,817 | | | $ | 3,421 | | | | | $ | 8,334 | | | $ | 16,808 | |
Depreciation and amortization | | | 117 | | | | 99 | | | | 421 | | | | 139 | | | | | | 540 | | | | 822 | | | | 233 | | | | 206 | | | | 421 | | | | 139 | | | | | | 540 | | | | 822 | |
Operating income (loss) | | | 412 | | | | 324 | | | | 940 | | | | (10 | ) | | | | | (1,118 | ) | | | (1,425 | ) | | | 840 | | | | 621 | | | | 940 | | | | (10 | ) | | | | | (1,118 | ) | | | (1,425 | ) |
Interest expense | | | (6 | ) | | | (8 | ) | | | (30 | ) | | | (8 | ) | | | | | — | | | | (434 | ) | | | (47 | ) | | | (16 | ) | | | (30 | ) | | | (8 | ) | | | | | — | | | | (434 | ) |
Reorganization items, net | | | — | | | | — | | | | — | | | | — | | | | | | 10,210 | | | | 5,147 | | | | — | | | | — | | | | — | | | | — | | | | | | 10,210 | | | | 5,147 | |
Income (loss) from continuing operations | | | 310 | | | | 235 | | | | 703 | | | | (3 | ) | | | | | 9,391 | | | | 3,163 | | | | 626 | | | | 468 | | | | 703 | | | | (3 | ) | | | | | 9,391 | | | | 3,163 | |
Net income (loss) | | | 310 | | | | 235 | | | | 703 | | | | (3 | ) | | | | | 9,347 | | | | 3,066 | | | | 626 | | | | 468 | | | | 703 | | | | (3 | ) | | | | | 9,347 | | | | 3,066 | |
Net income attributable to noncontrolling interests | | | 19 | | | | 20 | | | | 72 | | | | 15 | | | | | | 29 | | | | 29 | | | | 37 | | | | 39 | | | | 72 | | | | 15 | | | | | | 29 | | | | 29 | |
Net income (loss) attributable to Successor/Predecessor | | | 291 | | | | 215 | | | | 631 | | | | (18 | ) | | | | | 9,318 | | | | 3,037 | | | | 589 | | | | 429 | | | | 631 | | | | (18 | ) | | | | | 9,318 | | | | 3,037 | |
| | | | | | |
Net income (loss) per membership interests unit and per share data: (actual) | | | | | | | | | | | | | | | | | | | | | | | | | | | | |
Class A net income (loss) per membership interests unit | | $ | 43.50 | | | $ | 21.50 | | | $ | 65.35 | | | $ | (1.80 | ) | | | | | — | | | | — | | | $ | 43.50 | | | $ | 42.90 | | | $ | 65.35 | | | $ | (1.80 | ) | | | | | — | | | | — | |
Class B net income (loss) per membership interests unit | | | 531.79 | | | | 394.22 | | | | 1,156.98 | | | | (33.00 | ) | | | | | — | | | | — | | | | 1,370.85 | | | | 786.60 | | | | 1,156.98 | | | | (33.00 | ) | | | | | — | | | | — | |
Class C net income (loss) per membership interests unit | | | 253.78 | | | | 376.25 | | | | 1,064.88 | | | | (31.50 | ) | | | | | — | | | | — | | | | 253.78 | | | | 750.75 | | | | 1,064.88 | | | | (31.50 | ) | | | | | — | | | | — | |
Class E-1 net income per membership interests unit | | | 40.42 | | | | — | | | | — | | | | — | | | | | | — | | | | ��� | | | | 63.40 | | | | — | | | | — | | | | — | | | | | | — | | | | — | |
Income (loss) from continuing operations attributable to Predecessor | | | — | | | | — | | | | — | | | | — | | | | | $ | 16.58 | | | $ | 5.55 | | | | — | | | | — | | | | — | | | | — | | | | | $ | 16.58 | | | $ | 5.55 | |
Loss from discontinued operations attributable to Predecessor | | | — | | | | — | | | | — | | | | — | | | | | | (0.08 | ) | | | (0.17 | ) | | | — | | | | — | | | | — | | | | — | | | | | | (0.08 | ) | | | (0.17 | ) |
| | | | | | | | | | | | | | | | | | | | | | | | | | | | | | | | | | | | | | | | |
Basic and diluted income (loss) per share attributable to Predecessor | | | — | | | | — | | | | — | | | | — | | | | | $ | 16.50 | | | $ | 5.38 | | | | — | | | | — | | | | — | | | | — | | | | | $ | 16.50 | | | $ | 5.38 | |
| | | | | | |
Per share data: (pro forma)(2) | | | | | | | | | | | | | | | | | | | | | | | | | | | | |
Income (loss) from continuing operations attributable to Successor | | | | | | | | | | | | | | | | | | | | | | | | | | | | |
Income (loss) from discontinued operations attributable to Successor | | | | | | | | | | | | | | | | | | | | | | | | | | | | |
| | | | | | | | | | | | | | | | | | | | | | | | | | | | | | | | | | |
Income (loss) per share attributable to Successor | | | | | | | | | | | | | | | | | | | | | | | | | | | | |
Basic | | | | | | | | | | | | | | | | | | | | | | | | | | | | |
Diluted | | | | | | | | | | | | | | | | | | | | | | | | | | | | |
Weighted average shares outstanding | | | | | | | | | | | | | | | | | | | | | | | | | | | | |
| | | | | | |
Other financial data: | | | | | | | | | | | | | | | | | | | | | | | | | | | | |
Cash and cash equivalents (as of period end) | | $ | 1,633 | | | $ | 3,296 | | | $ | 3,219 | | | $ | 3,107 | | | | | $ | — | | | $ | 959 | | | $ | 1,322 | | | $ | 3,383 | | | $ | 3,219 | | | $ | 3,107 | | | | | $ | — | | | $ | 959 | |
Capital expenditures | | | 181 | | | | 93 | | | | 500 | | | | 88 | | | | | | 321 | | | | 771 | | | | 292 | | | | 179 | | | | 500 | | | | 88 | | | | | | 321 | | | | 771 | |
EBITDA(3) | | | 529 | | | | 423 | | | | 1,361 | | | | 129 | | | | | | (514 | ) | | | (211 | ) | | | 1,073 | | | | 827 | | | | 1,361 | | | | 129 | | | | | | (514 | ) | | | (211 | ) |
Adjusted EBITDA(3) | | | 538 | | | | 456 | | | | 1,633 | | | | 313 | | | | | | (229 | ) | | | 269 | | | | 1,090 | | | | 900 | | | | 1,633 | | | | 313 | | | | | | (229 | ) | | | 269 | |
EBITDA margin(4) | | | 13.2 | % | | | 12.4 | % | | | 9.9 | % | | | 3.8 | % | | | | | (6.2 | %) | | | (1.3 | %) | | | 13.1 | % | | | 12.1 | % | | | 9.9 | % | | | 3.8 | % | | | | | (6.2 | %) | | | (1.3 | %) |
Adjusted EBITDA margin(4) | | | 13.5 | % | | | 13.4 | % | | | 11.8 | % | | | 9.1 | % | | | | | (2.7 | %) | | | 1.6 | % | | | 13.3 | % | | | 13.1 | % | | | 11.8 | % | | | 9.1 | % | | | | | (2.7 | %) | | | 1.6 | % |
Net cash provided by (used in) operating activities | | $ | 156 | | | $ | 246 | | | $ | 1,142 | | | $ | 159 | | | | | $ | (257 | ) | | $ | 455 | | | $ | 499 | | | $ | 626 | | | $ | 1,142 | | | $ | 159 | | | | | $ | (257 | ) | | $ | 455 | |
Net cash provided by (used in) investing activities | | | 433 | | | | (98 | ) | | | (911 | ) | | | 885 | | | | | | (1,052 | ) | | | (958 | ) | | | 311 | | | | (260 | ) | | | (911 | ) | | | 885 | | | | | | (1,052 | ) | | | (958 | ) |
Net cash provided by (used in) financing activities | | | (2,204 | ) | | | 52 | | | | (126 | ) | | | 2,062 | | | | | | 315 | | | | 465 | | | | (2,757 | ) | | | (47 | ) | | | (126 | ) | | | 2,062 | | | | | | 315 | | | | 465 | |
| | | | Successor | | | Successor | |
| | | As of March 31, 2011 | | | As of June 30, 2011 | |
| | | Historical | | | As
adjusted(5) | | | As further
adjusted(6) | | | Historical | | | As
adjusted(5) | |
| | | (dollars in millions) | | | (dollars in millions) | |
Balance sheet and employment data: | | | | | | | | | | |
Cash and cash equivalents | | $ | 1,633 | | | $ | 1,336 | | | $ | | | | $ | 1,322 | | | $ | | |
Total assets | | $ | 9,724 | | | $ | 9,441 | | | $ | | | | $ | 9,627 | | | $ | | |
Total debt | | $ | 2,751 | | | $ | 2,468 | | | $ | | | | $ | 2,236 | | | $ | | |
Working capital(7)(6) | | $ | 1,453 | | | $ | 1,453 | | | $ | | | | $ | 1,444 | | | $ | | |
Owners’ equity | | $ | 1,907 | | | $ | 1,907 | | | $ | | | | $ | 2,242 | | | $ | | |
Global employees | | | 100,630 | | | | 100,630 | | | | 100,630 | | | | 101,000 | | | | 101,000 | |
| (1) | The Predecessor adopted the accounting guidance in Financial Accounting Standards Board Accounting Standards Codification (“FASB ASC”) 852,Reorganizations, effective October 8, 2005 and has segregated in the financial statements for all reporting periods subsequent to such date and through the consummation of the transactions pursuant to the Modified Plan (as defined in “Note 1. General and Acquisition of Predecessor Businesses” to the audited consolidated financial statements included herein), transactions and events that were directly associated with the reorganization from the ongoing operations of the business. Our consolidated financial statements are not comparable to the consolidated financial statements of the Predecessor due to the effects of the consummation of the Modified Plan and the change in the basis of presentation. For more information, please refer to “Management’s Discussion and Analysis of Financial Condition and Results of Operations.” |
| (2) | Reflects issuance of ordinary shares in exchange for Delphi Automotive LLP membership interests and ordinary shares in this offering. |
| (3) | Our management utilizes operating income before depreciation and amortization, including long-lived asset and goodwill impairment (“EBITDA”) to evaluate performance. EBITDA was used as a performance indicator for the threesix months ended March 31,June 30, 2011. |
“Adjusted EBITDA” means operating income before depreciation and amortization, including long-lived asset and goodwill impairment, transformation and rationalization charges related to plant consolidations, plant wind-downs and discontinued operations. Through December 31, 2010, our management relied on Adjusted EBITDA as a key performance measure. Our management believed that Adjusted EBITDA was a meaningful measure of performance and it was used by management and the Board of Managers of Delphi Automotive LLP to analyze Company and stand-alone segment operating performance and for planning and forecasting purposes. Effective January 1, 2011, our management began utilizing EBITDA as a key performance measure because our restructuring was substantially completed in 2010. EBITDA and Adjusted EBITDA should not be considered substitutes for results prepared in accordance with accounting principles generally accepted in the United States of America (“U.S. GAAP”) and should not be considered alternatives to net income (loss) attributable to Successor/Predecessor, which is the most directly comparable financial measure to EBITDA and Adjusted EBITDA that is in accordance with U.S. GAAP. EBITDA and Adjusted EBITDA, as determined and measured by us, should also not be compared to similarly titled measures reported by other companies.
In the threesix months ended March 31,June 30, 2011, we reached a final customer commercial settlement that resulted in an unusual warranty expense of $76 million. This amount adversely affected EBITDA and Adjusted EBITDA in such period.
The reconciliation of Adjusted EBITDA to EBITDA includes other transformation and rationalization costs related to 1) the implementation of information technology systems to support finance, manufacturing and product development initiatives, 2) certain plant consolidations and closure costs and 3) consolidation of many staff administrative functions into a global business service group. The reconciliation of EBITDA and Adjusted EBITDA to net income (loss) attributable to Successor/Predecessor follows:
| | | | Successor | | | | Predecessor | | | Successor | | | | Predecessor | |
| | | Three months
ended March 31, | | Year ended
December 31,
2010 | | | Period from
August 19 to
December 31,
2009 | | | | | Period from
January 1 to
October 6,
2009 | | | Year ended
December 31,
2008 | | | Six months
ended June 30, | | Year ended
December 31,
2010 | | | Period from
August 19 to
December 31,
2009 | | | | | Period from
January 1 to
October 6,
2009 | | | Year ended
December 31,
2008 | |
| | 2011 | | 2010 | | | 2011 | | 2010 | |
| | | (in millions) | | | | (in millions) | | | (in millions) | | | | (in millions) | |
Adjusted EBITDA | | $ | 538 | | | $ | 456 | | | $ | 1,633 | | | $ | 313 | | | | | $ | (229 | ) | | $ | 269 | | | $ | 1,090 | | | $ | 900 | | | $ | 1,633 | | | $ | 313 | | | | | $ | (229 | ) | | $ | 269 | |
Transformation and rationalization charges: | | | | | | | | | | | | | | | | | | | | | | | | | | | | |
Employee termination benefits and other exit costs | | | (9) | | | | (26 | ) | | | (224 | ) | | | (126 | ) | | | | | (235 | ) | | | (326 | ) | | | (17) | | | | (56 | ) | | | (224 | ) | | | (126 | ) | | | | | (235 | ) | | | (326 | ) |
Other transformation and rationalization costs | | | — | | | | (7 | ) | | | (48 | ) | | | (58 | ) | | | | | (50 | ) | | | (154 | ) | | | — | | | | (17 | ) | | | (48 | ) | | | (58 | ) | | | | | (50 | ) | | | (154 | ) |
| | | | | | | | | | | | | | | | | | | | | | | | | | | | | | | | | | | | | | | | |
EBITDA | | $ | 529 | | | $ | 423 | | | $ | 1,361 | | | $ | 129 | | | | | $ | (514 | ) | | $ | (211 | ) | | $ | 1,073 | | | $ | 827 | | | $ | 1,361 | | | $ | 129 | | | | | $ | (514 | ) | | $ | (211 | ) |
| | | | | | | | | | | | | | | | | | | | | | | | | | | | | | | | | | | | | | | | |
Depreciation and amortization | | | (117 | ) | | | (99 | ) | | | (421 | ) | | | (139 | ) | | | | | (540 | ) | | | (822 | ) | | | (233 | ) | | | (206 | ) | | | (421 | ) | | | (139 | ) | | | | | (540 | ) | | | (822 | ) |
Goodwill impairment charges | | | — | | | | — | | | | — | | | | — | | | | | | — | | | | (325 | ) | | | — | | | | — | | | | — | | | | — | | | | | | — | | | | (325 | ) |
Discontinued operations | | | — | | | | — | | | | — | | | | — | | | | | | (64 | ) | | | (67 | ) | | | — | | | | — | | | | — | | | | — | | | | | | (64 | ) | | | (67 | ) |
| | | | | | | | | | | | | | | | | | | | | | | | | | | | | | | | | | | | | | | | |
Operating income (loss) | | $ | 412 | | | $ | 324 | | | $ | 940 | | | $ | (10 | ) | | | | $ | (1,118 | ) | | $ | (1,425 | ) | | $ | 840 | | | $ | 621 | | | $ | 940 | | | $ | (10 | ) | | | | $ | (1,118 | ) | | $ | (1,425 | ) |
| | | | | | | | | | | | | | | | | | | | | | | | | | | | | | | | | | | | | | | | |
Interest expense | | | (6 | ) | | | (8 | ) | | | (30 | ) | | | (8 | ) | | | | | — | | | | (434 | ) | | | (47 | ) | | | (16 | ) | | | (30 | ) | | | (8 | ) | | | | | — | | | | (434 | ) |
Other income, net | | | 3 | | | | 2 | | | | 34 | | | | (17 | ) | | | | | 24 | | | | 9 | | |
Other (expense) income, net | | | | (1 | ) | | | 2 | | | | 34 | | | | (17 | ) | | | | | 24 | | | | 9 | |
Reorganization items | | | — | | | | — | | | | — | | | | — | | | | | | 10,210 | | | | 5,147 | | | | — | | | | — | | | | — | | | | — | | | | | | 10,210 | | | | 5,147 | |
| | | | | | | | | | | | | | | | | | | | | | | | | | | | | | | | | | | | | | | | |
Income from continuing operations before income taxes and equity income | | | 409 | | | | 318 | | | | 944 | | | | (35 | ) | | | | | 9,116 | | | | 3,297 | | | | 792 | | | | 607 | | | | 944 | | | | (35 | ) | | | | | 9,116 | | | | 3,297 | |
Income tax (expense) benefit | | | (116 | ) | | | (85 | ) | | | (258 | ) | | | 27 | | | | | | 311 | | | | (163 | ) | | | (189 | ) | | | (147 | ) | | | (258 | ) | | | 27 | | | | | | 311 | | | | (163 | ) |
Equity income (loss), net of tax | | | 17 | | | | 2 | | | | 17 | | | | 5 | | | | | | (36 | ) | | | 29 | | | | 23 | | | | 8 | | | | 17 | | | | 5 | | | | | | (36 | ) | | | 29 | |
Loss from discontinued operations, net of tax | | | — | | | | — | | | | — | | | | — | | | | | | (44 | ) | | | (97 | ) | | | — | | | | — | | | | — | | | | — | | | | | | (44 | ) | | | (97 | ) |
| | | | | | | | | | | | | | | | | | | | | | | | | | | | | | | | | | | | | | | | |
Net income (loss) | | $ | 310 | | | $ | 235 | | | $ | 703 | | | $ | (3 | ) | | | | $ | 9,347 | | | $ | 3,066 | | | $ | 626 | | | $ | 468 | | | $ | 703 | | | $ | (3 | ) | | | | $ | 9,347 | | | $ | 3,066 | |
Net income attributable to noncontrolling interest | | | 19 | | | | 20 | | | | 72 | | | | 15 | | | | | | 29 | | | | 29 | | | | 37 | | | | 39 | | | | 72 | | | | 15 | | | | | | 29 | | | | 29 | |
| | | | | | | | | | | | | | | | | | | | | | | | | | | | | | | | | | | | | | | | |
Net income (loss) attributable to Successor/Predecessor | | $ | 291 | | | $ | 215 | | | $ | 631 | | | $ | (18 | ) | | | | $ | 9,318 | | | $ | 3,037 | | | $ | 589 | | | $ | 429 | | | $ | 631 | | | $ | (18 | ) | | | | $ | 9,318 | | | $ | 3,037 | |
| | | | | | | | | | | | | | | | | | | | | | | | | | | | | | | | | | | | | | | | |
| (4) | EBITDA margin is defined as EBITDA as a percentage of revenues. Adjusted EBITDA margin is defined as Adjusted EBITDA as a percentage of revenues. |
| (5) | Gives effect to the modification of our credit agreement and the issuance of senior notes on May 17, 2011. See “Unaudited Pro Forma Condensed Consolidated Financial Information” and “Management’s Discussion and Analysis of Financial Condition and Results of Operations—Liquidity and Capital Resources.” |
(6) | Gives effect to this offering and the application of proceeds therefrom. See “Unaudited Pro Forma Condensed Consolidated Financial Information.” |
(7)(6) | Working capital is calculated herein as accounts receivable plus inventories less accounts payable. |
| (7) | Excludes approximately 38,000 temporary and contract workers. |
RISK FACTORS
An investment in our ordinary shares involves a high degree of risk. You should consider carefully the following information about these risks, and the other information included in this prospectus in its entirety before investing in our ordinary shares. Any of the risks we describe below could cause our business, financial condition and/or operating results to suffer. The market price of our ordinary shares could decline if one or more of these risks and uncertainties develop into actual events. You could lose all or part of your investment.
Risks Related to Business Environment and Economic Conditions
The cyclical nature of automotive sales and production can adversely affect our business.
Our business is directly related to automotive sales and automotive vehicle production by our customers. Automotive sales and production are highly cyclical and, in addition to general economic conditions, also depend on other factors, such as consumer confidence and consumer preferences. Lower global automotive sales result in substantially all of our automotive OEM customers significantly lowering vehicle production schedules, which has a direct impact on our earnings and cash flows. The most recent example of this was the 2009 downturn in which North American and Western Europe automotive production declined approximately 43% and 26%, respectively, below production levels in 2007. While the industry is recovering from the 2009 downturn, production volumes in North America and Western Europe remain below levels experienced prior to 2009. In addition, automotive sales and production can be affected by labor relations issues, regulatory requirements, trade agreements, the availability of consumer financing and other factors. Economic declines that result in a significant reduction in automotive sales and production by our customers have in the past had, and may in the future have, an adverse effect on our business, results of operations and financial condition.
Our sales are also affected by inventory levels and OEMs’ production levels. We cannot predict when OEMs will decide to increase or decrease inventory levels or whether new inventory levels will approximate historical inventory levels. Uncertainty and other unexpected fluctuations could have a material adverse effect on our business and financial condition.
A prolonged economic downturn or economic uncertainty could adversely affect our business and cause us to require additional sources of financing, which may not be available.
Our sensitivity to economic cycles and any related fluctuation in the businesses of our customers or potential customers may have a material adverse effect on our financial condition, results of operations or cash flows. If global economic conditions deteriorate or economic uncertainty increases, our customers and potential customers may experience deterioration of their businesses, which may result in the delay or cancellation of plans to purchase our products. If vehicle production were to remain at low levels for an extended period of time or if cash losses for customer defaults rise, our cash flow could be adversely impacted, which could result in our needing to seek additional financing to continue our operations. There can be no assurance that we would be able to secure such financing on terms acceptable to us, or at all.
Any changes in consumer credit availability or cost of borrowing could adversely affect our business.
Declines in the availability of consumer credit and increases in consumer borrowing costs have negatively impacted global automotive sales and resulted in lower production volumes in the past. Substantial declines in automotive sales and production by our customers could have a material adverse effect on our business, results of operations and financial condition.
A drop in the market share and changes in product mix offered by our customers can impact our revenues.
We are dependent on the continued growth, viability and financial stability of our customers. Our customers generally are OEMs in the automotive industry. This industry is subject to rapid technological change, vigorous
competition, short product life cycles and cyclical and reduced consumer demand patterns. When our customers are adversely affected by these factors, we may be similarly affected to the extent that our customers reduce the volume of orders for our products. As a result of changes impacting our customers, sales mix can shift which may have either favorable or unfavorable impact on revenue and would include shifts in regional growth, shifts in OEM sales demand, as well as shifts in consumer demand related to vehicle segment purchases and content penetration. For instance, a shift in sales demand favoring a particular OEM’s vehicle model for which we do not have a supply contract may negatively impact our revenue. A shift in regional sales demand toward certain markets could favorably impact the sales of those of our customers that have a large market share in those regions, which in turn would be expected to have a favorable impact on our revenue.
The mix of vehicle offerings by our OEM customers also impacts our sales. A decrease in consumer demand for specific types of vehicles where we have traditionally provided significant content could have a significant effect on our business and financial condition. Our sales of products in the regions in which our customers operate also depend on the success of these customers in those regions.
Declines in the market share or business of Daimler, Ford, GM, Peugeot and VW may have a disproportionate adverse impact on our revenues and profitability.
Daimler, Ford, GM, Peugeot and VW accounted for approximately 49% of our total net sales in the year ended December 31, 2010. Accordingly, our revenues may be disproportionately affected by decreases in any of their businesses or market share. Because our customers typically have no obligation to purchase a specific quantity of parts, a decline in the production levels of any of our major customers, particularly with respect to models for which we are a significant supplier, could disproportionately reduce our sales and thereby adversely affect our financial condition, operating results and cash flows. See “Business—Supply Relationships with Our Customers.”
Continued pricing pressures, OEM cost reduction initiatives and the ability of OEMs to re-source or cancel vehicle programs may result in lower than anticipated margins, or losses, which may have a significant negative impact on our business.
Cost-cutting initiatives adopted by our customers result in increased downward pressure on pricing. Our customer supply agreements generally require step-downs in component pricing over the period of production, typically one to two percent per year. In addition, our customers often reserve the right to terminate their supply contracts for convenience, which enhances their ability to obtain price reductions. OEMs have also possessed significant leverage over their suppliers, including us, because the automotive component supply industry is highly competitive, serves a limited number of customers, has a high fixed cost base and historically has had excess capacity. Based on these factors, and the fact that our customers’ product programs typically last a number of years and are anticipated to encompass large volumes, our customers are able to negotiate favorable pricing. Accordingly, as a Tier I supplier, we are subject to substantial continuing pressure from OEMs to reduce the price of our products. It is possible that pricing pressures beyond our expectations could intensify as OEMs pursue restructuring and cost cutting initiatives. If we are unable to generate sufficient production cost savings in the future to offset price reductions, our gross margin and profitability would be adversely affected. See “Business—Supply Relationships with Our Customers” for a detailed discussion of our supply agreements with our customers.
While we provide estimates of new business in this prospectus, these estimates could be materially different from actual results in light of the risks set forth above.
Our supply agreements with our OEM customers are generally requirements contracts, and a decline in the production requirements of any of our customers, and in particular our largest customers, could adversely impact our revenues and profitability.
We receive OEM purchase orders for specific components supplied for particular vehicles. In most instances our OEM customers agree to purchase their requirements for specific products but are not required to
purchase any minimum amount of products from us. The contracts we have entered into with most of our customers have terms ranging from one year to the life of the model (usually three to seven years, although customers often reserve the right to terminate for convenience). Therefore, a significant decrease in demand for certain key models or group of related models sold by any of our major customers or the ability of a manufacturer to re-source and discontinue purchasing from us, for a particular model or group of models, could have a material adverse effect on us. To the extent that we do not maintain our existing level of business with our largest customers because of a decline in their production requirements or because the contracts expire or are terminated for convenience, we will need to attract new customers or win new business with existing customers, or our results of operations and financial condition will be adversely affected. See “Business—Supply Relationships with Our Customers” for a detailed discussion of our supply agreements with our customers.
We have invested substantial resources in markets where we expect growth and we may be unable to timely alter our strategies should such expectations not be realized.
Our future growth is dependent on our making the right investments at the right time to support product development and manufacturing capacity in areas where we can support our customer base. We have identified the Asia Pacific and South American regions, and China, Brazil and India, in particular, as key markets likely to experience substantial growth, and accordingly have made and expect to continue to make substantial investments, both directly and through participation in various partnerships and joint ventures, in numerous manufacturing operations, technical centers and other infrastructure to support anticipated growth in those regions. If we are unable to deepen existing and develop additional customer relationships in these regions, we may not only fail to realize expected rates of return on our existing investments, but we may incur losses on such investments and be unable to timely redeploy the invested capital to take advantage of other markets, potentially resulting in lost market share to our competitors. Our results will also suffer if these regions do not grow as quickly as we anticipate.
Our business in China is subject to aggressive competition and is sensitive to economic and market conditions.
Maintaining a strong position in the Chinese market is a key component of our global growth strategy. The automotive supply market in China is highly competitive, with competition from many of the largest global manufacturers and numerous smaller domestic manufacturers. As the size of the Chinese market continues to increase, we anticipate that additional competitors, both international and domestic, will seek to enter the Chinese market and that existing market participants will act aggressively to increase their market share. Increased competition may result in price reductions, reduced margins and our inability to gain or hold market share. In addition, our business in China is sensitive to economic and market conditions that drive sales volume in China. If we are unable to maintain our position in the Chinese market or if vehicle sales in China decrease or do not continue to increase, our business and financial results could be materially adversely affected.
Disruptions in the supply of raw materials and other supplies that we and our customers use in our products may adversely affect our profitability.
We and our customers use a broad range of materials and supplies, including copper, aluminum and other metals, petroleum-based resins, chemicals, electronic components and semiconductors. A significant disruption in the supply of these materials for any reason could decrease our production and shipping levels, which could materially increase our operating costs and materially decrease our profit margins.
We, as with other component manufacturers in the automotive industry, ship products to our customers’ vehicle assembly plants throughout the world so they are delivered on a “just-in-time” basis in order to maintain low inventory levels. Our suppliers also use a similar method. However, this “just-in-time” method makes the logistics supply chain in our industry very complex and very vulnerable to disruptions.
Such disruptions could be caused by any one of a myriad of potential problems, such as closures of one of our or our suppliers’ plants or critical manufacturing lines due to strikes, mechanical breakdowns, electrical outages, fires, explosions or political upheaval, as well as logistical complications due to weather, volcanic eruptions, or other natural or nuclear disasters, mechanical failures, delayed customs processing and more. For example, we may experience some supply disruptions on account of the March 2011 earthquake and tsunami in Japan. See “—As a result of the March 2011 earthquake and tsunami in Japan, we may experience some supply disruptions from Japanese and other suppliers, which could adversely affect our ability to meet our customers’ production requirements” below. Additionally, as we grow in low cost countries, the risk for such disruptions is heightened. The lack of even a small single subcomponent necessary to manufacture one of our products, for whatever reason, could force us to cease production, even for a prolonged period. Similarly, a potential quality issue could force us to halt deliveries while we validate the products. Even where products are ready to be shipped, or have been shipped, delays may arise before they reach our customer. Our customers may halt or delay their production for the same reason if one of their other suppliers fails to deliver necessary components. This may cause our customers, in turn to suspend their orders, or instruct us to suspend delivery, of our products, which may adversely affect our financial performance.
When we fail to make timely deliveries in accordance with our contractual obligations, we generally have to absorb our own costs for identifying and solving the “root cause” problem as well as expeditiously producing replacement components or products. Generally, we must also carry the costs associated with “catching up,” such as overtime and premium freight.
Additionally, if we are the cause for a customer being forced to halt production, the customer may seek to recoup all of its losses and expenses from us. These losses and expenses could be significant, and may include consequential losses such as lost profits. Any supply-chain disruption, however small, could potentially cause the complete shutdown of an assembly line of one of our customers, and any such shutdown that is due to causes that are within our control could expose us to material claims of compensation. Where a customer halts production because of another supplier failing to deliver on time, it is unlikely we will be fully compensated, if at all.
Adverse developments affecting one or more of our suppliers could harm our profitability.
Any significant disruption in our supplier relationships, particularly relationships with sole-source suppliers, could harm our profitability. Furthermore, some of our suppliers may not be able to handle the commodity cost volatility and/or sharply changing volumes while still performing as we expect. To the extent our suppliers experience supply disruptions, such as we may experience in the aftermath of the March 2011 earthquake and tsunami in Japan, there is a risk for delivery delays, production delays, production issues or delivery of non-conforming products by our suppliers. Even where these risks do not materialize, we may incur costs as we try to make contingency plans for such risks.
As a result of the March 2011 earthquake and tsunami in Japan, we may experience some supply disruptions from Japanese and other suppliers, which could adversely affect our ability to meet our customers’ production requirements.
On March 11, 2011, an earthquake and tsunami occurred in Japan, causing severe damage to the region and resulting in a nuclear crisis at the Fukushima reactors and the surrounding region. These events have disrupted the production of suppliers based in Japan, some of which are our sole-source suppliers or are sole-source suppliers to other suppliers of ours, for certain products. We expect that we may experience some supply disruptions from our suppliers on account of the earthquake, tsunami and nuclear crisis in Japan, and if we are unable to adequately re-source these supplies in the near term, we may experience delays in the production of certain products, which may be for a prolonged period, or incur additional costs in order to avoid production interruptions. If we are able to obtain products from other sources, the quality of re-sourced products may make it more difficult for us to meet the stringent quality specifications of our customers, which could result in increased costs. Although to date we have not experienced any material disruptions and have been able to locate other supply sources, we can provide no assurance that we will be able to locate any alternative sources of supply in the future.
Moreover, we may be adversely affected if our OEM customers cease or slow production of vehicles on account of the Japanese crisis, which would negatively affect their purchase orders of our products.
The loss of business with respect to, or the lack of commercial success of, a vehicle model for which we are a significant supplier could adversely affect our financial performance.
Although we receive purchase orders from our customers, these purchase orders generally provide for the supply of a customer’s requirements for a particular vehicle model and assembly plant, rather than for the purchase of a specific quantity of products. The loss of business with respect to, or the lack of commercial success of, a vehicle model for which we are a significant supplier could reduce our sales and thereby adversely affect our financial condition, operating results and cash flows.
We operate in the highly competitive automotive supply industry.
The global automotive component supply industry is highly competitive. Competition is based primarily on price, technology, quality, delivery and overall customer service. There can be no assurance that our products will be able to compete successfully with the products of our competitors. Furthermore, the rapidly evolving nature of the markets in which we compete may attract new entrants, particularly in low-cost countries such as China, Brazil, India and Russia. Additionally, consolidation in the automotive industry may lead to decreased product purchases from us. As a result, our sales levels and margins could be adversely affected by pricing pressures from OEMs and pricing actions of competitors. These factors led to selective resourcing of business to competitors in the past and may also do so in the future. In addition, any of our competitors may foresee the course of market development more accurately than us, develop products that are superior to our products, have the ability to produce similar products at a lower cost than us, or adapt more quickly than us to new technologies or evolving customer requirements. As a result, our products may not be able to compete successfully with their products. These trends may adversely affect our sales as well as the profit margins on our products.
Increases in costs of the materials and other supplies that we use in our products may have a negative impact on our business.
Significant changes in the markets where we purchase materials, components and supplies for the production of our products may adversely affect our profitability, particularly in the event of significant increases in demand where there is not a corresponding increase in supply, inflation or other pricing increases. In recent periods there have been significant fluctuations in the global prices of copper, aluminum and petroleum-based resin products, and fuel charges, which have had and may continue to have an unfavorable impact on our business, results of operations or financial condition. Continuing volatility may have adverse effects on our business, results of operations or financial condition. We will continue efforts to pass some supply and material cost increases onto our customers, although competitive and market pressures have limited our ability to do that, particularly with domestic OEMs, and may prevent us from doing so in the future, because our customers are generally not obligated to accept price increases that we may desire to pass along to them. Even where we are able to pass price increases through to the customer, in some cases there is a lapse of time before we are able to do so. The inability to pass on price increases to our customers when raw material prices increase rapidly or to significantly higher than historic levels could adversely affect our operating margins and cash flow, possibly resulting in lower operating income and profitability. We expect to be continually challenged as demand for our principal raw materials and other supplies, including electronic components, is significantly impacted by demand in emerging markets, particularly in China, Brazil, India and Russia, and by the anticipated global economic recovery. We cannot provide assurance that fluctuations in commodity prices will not otherwise have a material adverse effect on our financial condition or results of operations, or cause significant fluctuations in quarterly and annual results of operations.
Our hedging activities to address commodity price fluctuations may not be successful in offsetting future increases in those costs or may reduce or eliminate the benefits of any decreases in those costs.
In order to mitigate short-term volatility in operating results due to the aforementioned commodity price fluctuations, we hedge a portion of near-term exposure to certain raw materials used in production. The results of our hedging practice could be positive, neutral or negative in any period depending on price changes in the hedged exposures. Our hedging activities are not designed to mitigate long-term commodity price fluctuations and, therefore, will not protect from long-term commodity price increases. Our future hedging positions may not correlate to actual raw material costs, which could cause acceleration in the recognition of unrealized gains and losses on hedging positions in operating results.
We face manufacturing challenges.
The volume and timing of sales to our customers may vary due to: variation in demand for our customers’ products; our customers’ attempts to manage their inventory; design changes; changes in our customers’ manufacturing strategy; and acquisitions of or consolidations among customers. Due in part to these factors, many of our customers do not commit to long-term production schedules. Our inability to forecast the level of customer orders with certainty makes it difficult to schedule production and maximize utilization of manufacturing capacity.
We rely on third-party suppliers for the components used in our products, and we rely on third-party manufacturers to manufacture certain of our assemblies and finished products. Our results of operations, financial condition and cash flows could be adversely affected if our third party suppliers lack sufficient quality control or if there are significant changes in their financial or business condition. If our third-party manufacturers fail to deliver products, parts and components of sufficient quality on time and at reasonable prices, we could have difficulties fulfilling our orders, sales and profits could decline, and our commercial reputation could be damaged.
From time to time, we have underutilized our manufacturing lines. This excess capacity means we incur increased fixed costs in our products relative to the net revenue we generate, which could have an adverse effect on our results of operations, particularly during economic downturns. If we are unable to improve utilization levels for these manufacturing lines and correctly manage capacity, the increased expense levels will have an adverse effect on our business, financial condition and results of operations. In addition, some of our manufacturing lines are located in China or other foreign countries that are subject to a number of additional risks and uncertainties, including increasing labor costs and political, social and economic instability.
We may not be able to respond quickly enough to changes in regulations, technology and technological risks, and to develop our intellectual property into commercially viable products.
Changes in legislative, regulatory or industry requirements or in competitive technologies may render certain of our products obsolete or less attractive. Our ability to anticipate changes in technology and regulatory standards and to successfully develop and introduce new and enhanced products on a timely basis are significant factors in our ability to remain competitive and to maintain or increase our revenues. We cannot provide assurance that certain of our products will not become obsolete or that we will be able to achieve the technological advances that may be necessary for us to remain competitive and maintain or increase our revenues in the future. We are also subject to the risks generally associated with new product introductions and applications, including lack of market acceptance, delays in product development or production and failure of products to operate properly. The pace of our development and introduction of new and improved products depends on our ability to implement successfully improved technological innovations in design, engineering and manufacturing, which requires extensive capital investment. Any capital expenditure cuts in these areas that we may determine to implement in the future to reduce costs and conserve cash could reduce our ability to develop and implement improved technological innovations, which may materially reduce demand for our products.
To compete effectively in the automotive supply industry, we must be able to launch new products to meet changing consumer preferences and our customers’ demand in a timely and cost-effective manner. Our ability to respond to competitive pressures and react quickly to other major changes in the marketplace including in the case of automotive sales, increased gasoline prices or consumer desire for and availability of vehicles using alternative fuels is also a risk to our future financial performance.
We cannot provide assurance that we will be able to install and certify the equipment needed to produce products for new product programs in time for the start of production, or that the transitioning of our manufacturing facilities and resources to full production under new product programs will not impact production rates or other operational efficiency measures at our facilities. Development and manufacturing schedules are difficult to predict, and we cannot provide assurance that our customers will execute on schedule the launch of their new product programs, for which we might supply products. Our failure to successfully launch new products, or a failure by our customers to successfully launch new programs, could adversely affect our results.
Changes in factors that impact the determination of our non-U.S. pension liabilities may adversely affect us.
Certain of our non-U.S. subsidiaries sponsor defined benefit pension plans, which generally provide benefits based on negotiated amounts for each year of service. Our primary non-U.S. plans are located in Mexico and the United Kingdom and were underfunded by $326 million as of March 31,June 30, 2011. The funding requirements of these benefit plans, and the related expense reflected in our financial statements, are affected by several factors that are subject to an inherent degree of uncertainty and volatility, including governmental regulation. In addition to the defined benefit pension plans, we have retirement obligations driven by requirements in many of the countries in which we operate. These legally required plans require payments at the time benefits are due. Obligations related to the defined benefit pension plans and statutorily required retirement obligations totaled $640$648 million at March 31,June 30, 2011, of which $14$13 million is included in accrued liabilities and $626$635 million is included in long-term liabilities in our consolidated balance sheet. Key assumptions used to value these benefit obligations and the cost of providing such benefits, funding requirements and expense recognition include the discount rate and the expected long-term rate of return on pension assets. If the actual trends in these factors are less favorable than our assumptions, this could have an adverse effect on our results of operations and financial condition.
We may suffer future asset impairment and other restructuring charges.
We have taken restructuring actions in recent years to realign and resize our production capacity and cost structure to meet current and projected operational and market requirements. If we are required to take further restructuring actions, the charges related to these actions may have a material adverse effect on our results of operations and financial condition. We cannot assure that any future restructurings will be completed as planned or achieve the desired results. Additionally, from time to time in the past, we have recorded asset impairment losses relating to specific plants and operations. Generally, we record asset impairment losses when we determine that our estimates of the future undiscounted cash flows from an operation will not be sufficient to recover the carrying value of that facility’s building, fixed assets and production tooling. We cannot assure that we will not incur such charges in the future.
Employee strikes and labor-related disruptions involving us or one or more of our customers or suppliers may adversely affect our operations.
Our business is labor-intensive and utilizes a number of work councils and other represented employees. A strike or other form of significant work disruption by our employees would likely have an adverse effect on our ability to operate our business. A labor dispute involving us or one or more of our customers or suppliers or that could otherwise affect our operations could reduce our sales and harm our profitability. A labor dispute involving another supplier to our customers that results in a slowdown or a closure of our customers’ assembly plants
where our products are included in the assembled parts or vehicles could also adversely affect our business and harm our profitability. In addition, our inability or the inability of any of our customers, our suppliers or our customers’ suppliers to negotiate an extension of a collective bargaining agreement upon its expiration could reduce our sales and harm our profitability. Significant increases in labor costs as a result of the renegotiation of collective bargaining agreements could also adversely affect our business and harm our profitability.
We may lose or fail to attract and retain key salaried employees and management personnel.
An important aspect of our competitiveness is our ability to attract and retain key salaried employees and management personnel. Our ability to do so is influenced by a variety of factors, including the compensation we award and the competitive market position of our overall compensation package. We may not be as successful as competitors at recruiting, assimilating and retaining highly skilled personnel. The loss of the services of any member of senior management or a key salaried employee could have an adverse effect on our business.
We are exposed to foreign currency fluctuations as a result of our substantial global operations, which may affect our financial results.
We have currency exposures related to buying, selling and financing in currencies other than the local currencies of the countries in which we operate. Approximately 65% of our net revenue for the year ended December 31, 2010 was invoiced in currencies other than the U.S. dollar, and we expect net revenue from non-U.S. markets to continue to represent a significant portion of our net revenue. Price increases caused by currency exchange rate fluctuations may make our products less competitive or have an adverse effect on our margins. Currency exchange rate fluctuations may also disrupt the business of our suppliers by making their purchases of raw materials more expensive and more difficult to finance.
Historically, we have reduced our exposure by aligning our costs in the same currency as our revenues or, if that is impracticable, through financial instruments that provide offsets or limits to our exposures, which are opposite to the underlying transactions. However, any measures that we may implement to reduce the effect of volatile currencies and other risks of our global operations may not be effective. We cannot provide assurance that fluctuations in currency exposures will not otherwise have a material adverse effect on our financial condition or results of operations, or cause significant fluctuations in quarterly and annual results of operations.
We face risks associated with doing business in non-U.S. jurisdictions.
The majority of our manufacturing and distribution facilities are in countries outside of the U.S., including Mexico and countries in Asia Pacific, Eastern and Western Europe, South America and Northern Africa. We also purchase raw materials and other supplies from many different countries around the world. For the threesix months ended March 31,June 30, 2011, approximately 68%69% of our net revenue came from sales outside the United States. International operations are subject to certain risks inherent in doing business abroad, including:
exposure to local economic, political and labor conditions;
unexpected changes in laws, regulations, trade or monetary or fiscal policy, including interest rates, foreign currency exchange rates and changes in the rate of inflation in the U.S. and other foreign countries;
tariffs, quotas, customs and other import or export restrictions and other trade barriers;
expropriation and nationalization;
difficulty of enforcing agreements, collecting receivables and protecting assets through non-U.S. legal systems;
reduced intellectual property protection;
limitations on repatriation of earnings;
withholding and other taxes on remittances and other payments by subsidiaries;
investment restrictions or requirements;
export and import restrictions;
violence and civil unrest in local countries; and
compliance with the requirements of applicable anti-bribery laws, including the U.S. Foreign Corrupt Practices Act.
Additionally, our global operations may also be adversely affected by political events, domestic or international terrorist events and hostilities or complications due to natural or nuclear disasters, including the March 2011 earthquake and tsunami in Japan. See “—As a result of the March 2011 earthquake and tsunami in Japan, we may experience some supply disruptions from Japanese and other suppliers, which could adversely affect our ability to meet our customers’ production requirements” above. These uncertainties could have a material adverse effect on the continuity of our business and our results of operations and financial condition.
Increasing our manufacturing footprint in Asian markets, including China, and our business relationships with Asian automotive manufacturers are important elements of our strategy. In addition, our strategy includes increasing revenue and expanding our manufacturing footprint in lower-cost regions. As a result, our exposure to the risks described above may be greater in the future. The likelihood of such occurrences and their potential impact on us vary from country to country and are unpredictable.
If we fail to manage our growth effectively or to integrate successfully any future acquisition or strategic alliance into our business, our business could be harmed.
We expect to pursue acquisitions and strategic alliances that leverage our technology capabilities, enhance our customer base, geographic penetration, and scale to complement our current businesses. While we believe that such transactions are an integral part of our long-term strategy, there are risks and uncertainties related to these activities. Such risks and uncertainties include difficulty in integrating acquired operations, technology and products and potential unknown liabilities associated with the acquired company.
Risks Related to Legal, Regulatory, Tax and Accounting Matters
We may incur material losses and costs as a result of warranty claims and product liability and intellectual property infringement actions that may be brought against us.
We face an inherent business risk of exposure to warranty claims and product liability in the event that our products fail to perform as expected and, in the case of product liability, such failure of our products results in bodily injury and/or property damage. The fabrication of the products we manufacture is a complex and precise process. Our customers specify quality, performance and reliability standards. If flaws in either the design or manufacture of our products were to occur, we could experience a rate of failure in our products that could result in significant delays in shipment and product re-work or replacement costs. Although we engage in extensive product quality programs and processes, these may not be sufficient to avoid product failures, which could cause us to:
incur increased costs such as warranty expense and costs associated with customer support;
experience delays, cancellations or rescheduling of orders for our products;
experience increased product returns or discounts; or
all of which could negatively affect our financial condition and results of operations.
If any of our products are or are alleged to be defective, we may be required to participate in a recall involving such products. Each vehicle manufacturer has its own practices regarding product recalls and other product liability actions relating to its suppliers. However, as suppliers become more integrally involved in the vehicle design process and assume more of the vehicle assembly functions, OEMs continue to look to their suppliers for contribution when faced with recalls and product liability claims. A recall claim brought against us, or a product liability claim brought against us in excess of our available insurance, may have a material adverse effect on our business. OEMs also require their suppliers to guarantee or warrant their products and bear the costs of repair and replacement of such products under new vehicle warranties. Depending on the terms under which we supply products to a vehicle manufacturer, a vehicle manufacturer may attempt to hold us responsible for some or all of the repair or replacement costs of defective products under new vehicle warranties when the OEM asserts that the product supplied did not perform as warranted. Although we cannot assure that the future costs of warranty claims by our customers will not be material, we believe our established reserves are adequate to cover potential warranty settlements. Our warranty reserves are based on our best estimates of amounts necessary to settle future and existing claims. We regularly evaluate the level of these reserves and adjust them when appropriate. However, the final amounts determined to be due related to these matters could differ materially from our recorded estimates.
In addition, as we adopt new technology, we face an inherent risk of exposure to the claims of others that we have allegedly violated their intellectual property rights. We cannot assure that we will not experience any material warranty, product liability or intellectual property claim losses in the future or that we will not incur significant costs to defend such claims.
We may be adversely affected by environmental regulation, litigation or other liabilities.
We are subject to various U.S. federal, state and local, and non-U.S., environmental, health and safety laws and regulations governing, among other things:
the generation, storage, handling, use, transportation, presence of, or exposure to hazardous materials;
the emission and discharge of hazardous materials into the ground, air or water;
the incorporation of certain chemical substances into our products, including electronic equipment; and
the health and safety of our employees.
We are also required to obtain permits from governmental authorities for certain operations. We cannot assure you that we have been or will be at all times in complete compliance with such laws, regulations and permits. If we violate or fail to comply with these laws, regulations or permits, we could be fined or otherwise sanctioned by regulators. We could also be held liable for any and all consequences arising out of human exposure to hazardous substances or other environmental damage.
Certain environmental laws impose liability, sometimes regardless of fault, for investigating or cleaning up contamination on or emanating from our currently or formerly owned, leased or operated property, as well as for damages to property or natural resources and for personal injury arising out of such contamination. These
environmental laws also assess liability on persons who arrange for hazardous substances to be sent to third party disposal or treatment facilities when such facilities are found to be contaminated. At this time, we are involved in various stages of investigation and cleanup related to environmental remediation matters at a number of present and former facilities in the U.S. and abroad. The ultimate cost to us of site cleanups is difficult to predict given the uncertainties regarding the extent of the required cleanup, the potential for ongoing environmental monitoring and maintenance that could be required for many years, the interpretation of applicable laws and regulations, alternative cleanup methods, and potential agreements that could be reached with governmental and third parties. While we have environmental reserves of approximately $24$23 million at March 31,June 30, 2011 for the cleanup of presently-known environmental contamination conditions, it cannot be guaranteed that actual costs will not significantly exceed these reserves. We also could be named a potentially responsible party at additional sites in the future and the costs associated with such future sites may be material.
In addition, environmental laws are complex, change frequently and have tended to become more stringent over time. While we have budgeted for future capital and operating expenditures to maintain compliance with environmental laws, we cannot assure that environmental laws will not change or become more stringent in the future. Therefore, we cannot assure that our costs of complying with current and future environmental and health and safety laws, and our liabilities arising from past or future releases of, or exposure to, hazardous substances will not adversely affect our business, results of operations or financial condition. For example, adoption of greenhouse gas rules in jurisdictions in which we operate facilities could require installation of emission controls, acquisition of emission credits, emission reductions, or other measures that could be costly, and could also impact utility rates and increase the amount we spend annually for energy.
We may identify the need for additional environmental remediation or demolition obligations relating to facility divestiture, closure and decommissioning activities.
As we sell, close and/or demolish facilities around the world, environmental investigations and assessments will continue to be performed. We may identify previously unknown environmental conditions or further delineate known conditions that may require remediation or additional costs related to demolition or decommissioning, such as abatement of asbestos containing materials or removal of polychlorinated biphenyls or storage tanks. Such costs could exceed our reserves.
We are involved from time to time in legal proceedings and commercial or contractual disputes, which could have an adverse impact on our profitability and consolidated financial position.
We are involved in legal proceedings and commercial or contractual disputes that, from time to time, are significant. These are typically claims that arise in the normal course of business including, without limitation, commercial or contractual disputes, including warranty claims and other disputes with customers and suppliers; intellectual property matters; personal injury claims; environmental issues; tax matters; and employment matters.
In addition, we conduct significant business operations in Brazil which are subject to the Brazilian federal, state and local labor, social security, environmental, tax and customs laws. While we believe we comply with such laws, they are complex, subject to varying interpretations, and we are often engaged in litigation regarding the application of these laws to particular circumstances. As of March 31,June 30, 2011, related claims totaling approximately $250$260 million had been asserted against us. As of March 31,June 30, 2011, we maintained reserves for these asserted claims that are substantially less than the amount of the claims asserted. While we believe our reserves are adequate, the final amounts required to resolve these matters could differ materially from our recorded estimates and our results of operations could be materially affected.
For further information regarding our legal matters, see “Business—Legal Proceedings.” No assurance can be given that such proceedings and claims will not have a material adverse effect on our profitability and consolidated financial position.
Developments or assertions by us or against us relating to intellectual property rights could materially impact our business.
We own significant intellectual property, including a large number of patents and tradenames, and are involved in numerous licensing arrangements. Our intellectual property plays an important role in maintaining our competitive position in a number of the markets we serve. Developments or assertions by or against us relating to intellectual property rights could negatively impact our business. Significant technological developments by others also could materially and adversely affect our business and results of operations and financial condition.
There is a significant risk that Delphi Automotive LLP and, as a result, Delphi Automotive PLC could be treated as a domestic corporation for U.S. federal income tax purposes, which could have a material impact on our future tax liability.
Delphi Automotive LLP, which acquired the automotive supply and other businesses of the Predecessor on October 6, 2009 (the “Acquisition Date”), was established on August 19, 2009 as a limited liability partnership incorporated under the laws of England and Wales. At the time of its formation, Delphi Automotive LLP elected to be treated as a partnership for U.S. federal income tax purposes. Prior to the Acquisition Date, the Internal Revenue Service (the “IRS”) issued Notice 2009-78 (the “Notice”) announcing its intent to issue regulations under Section 7874 of the Internal Revenue Code of 1986, as amended (the “Code”), with an effective date prior to the Acquisition Date. If regulations as described in the Notice are issued with the effective date indicated in the Notice and with no exceptions for transactions that were subject to binding commitments on that date, we believe there is a significant risk that Delphi Automotive LLP could be treated as a domestic corporation for U.S. federal income tax purposes, retroactive to the Acquisition Date. If Delphi Automotive LLP were treated as a domestic corporation for U.S. federal income tax purposes, we expect that, although we are incorporated under the laws of Jersey, we would also be treated as a domestic corporation for U.S. federal income tax purposes.
Delphi Automotive LLP filed an informational 2009 U.S. federal partnership tax return on September 15, 2010. In light of the Notice, the IRS is currently reviewing whether Section 7874 applies to Delphi Automotive LLP’s acquisition of the automotive supply and other businesses of the Predecessor. While we believe, based on the advice of counsel, that it is more likely than not that neither we, nor Delphi Automotive LLP, are a domestic corporation for U.S. federal income tax purposes, and therefore have not reserved any amounts on our financial statements in respect of this issue, no assurance can be given that the IRS will not contend that Delphi Automotive LLP, and therefore we, should each be treated as a domestic corporation for U.S. federal income tax purposes, or that, if we were to challenge any such contention by the IRS, that a court would not agree with the IRS.
If we were treated as a domestic corporation for U.S. federal income tax purposes, we would be subject to U.S. federal income tax on our worldwide taxable income, including some or all of the distributions from our subsidiaries as well as some of the undistributed earnings of our foreign subsidiaries that constitute “controlled foreign corporations.” This could have a material adverse impact on our future tax liability related to these distributions and earnings. Future cash distributions made by us to non-U.S. shareholders could be subject to U.S. income tax withholding at a rate of 30%, unless reduced or eliminated by a tax treaty. In addition, we could be liable for additional U.S. federal income taxes on such distributions and earnings, and for the failure by Delphi Automotive LLP to withhold U.S. income taxes on distributions to its non-U.S. members, for periods beginning on or after, the Acquisition Date, which liability could have a material adverse impact on our results of operations and financial condition.
Taxing authorities could challenge our historical and future tax positions.
The amount of tax we pay is subject to our interpretation of applicable tax laws in the jurisdictions in which we file. We have taken and will continue to take tax positions based on our interpretation of such tax laws. In particular,
we will seek to run ourselves in such a way that we are and remain tax resident in the United Kingdom. While we believe that we have complied with all applicable tax laws, there can be no assurance that a taxing authority will not have a different interpretation of the law and assess us with additional taxes. Should additional taxes be assessed, this may result in a material adverse effect on our results of operations and financial condition.
Our application of acquisition accounting could result in additional asset impairments and may make comparisons of our financial position and results of operations to prior periods more difficult.
As required by U.S. GAAP, we recognized and measured the fair value of the identifiable assets acquired and the liabilities assumed from the Predecessor. This resulted in the recognition of significant identifiable intangible assets which could be impaired in future periods. Additionally, the consolidated financial statements of Delphi Automotive LLP are not comparable to the consolidated statements of the Predecessor due to the effects of the consummation of the First Amended Joint Plan of Reorganization of Delphi Corporation and Certain Affiliates, Debtors and Debtors-In Possession (As Modified) and the change in the basis of presentation. This lack of comparability could limit interest and investment in our securities, including the ordinary shares.
Our operating results are exposed to variability as a result of the currently designed Long-Term Incentive Program for our key employees.
The recognition of compensation costs on a U.S. GAAP basis resulting from the execution of our Value Creation Plan, our Long-Term Incentive Program for key employees, is based on a variable formula that is likely to result in fluctuations impacting operating results. No assurance can be given that such impacts will not have a material impact on our profitability and consolidated financial position.
Risks Related to this Offering
There is no existing market for our ordinary shares, and our ordinary shares may trade at a discount from its initial offering price.
Prior to this offering, there has not been a public market for our ordinary shares and we cannot predict the extent of investor interest in us. The initial public offering price for our ordinary shares will be determined by negotiations between us and the representativerepresentatives of the underwriters and may not be indicative of prices that will prevail in the open market following this offering. Consequently, you may not be able to sell ordinary shares at prices equal to or greater than the price you paid in this offering.
An active and liquid trading market for our ordinary shares may not develop.
Prior to this offering, our ordinary shares were not traded on any market. An active and liquid trading market for our ordinary shares may not develop or be maintained after this offering. Liquid and active trading markets usually result in less price volatility and more efficiency in carrying out investors’ purchase and sale orders. The market price of our ordinary shares could vary significantly as a result of a number of factors, some of which are beyond our control. In the event of a drop in the market price of our ordinary shares, you could lose a substantial part or all of your investment in our ordinary shares. The initial public offering price will be negotiated between us and the representatives of the underwriters and may not be indicative of the market price of our ordinary shares after this offering. Consequently, you may not be able to sell our ordinary shares at prices equal to or greater than the price paid by you in the offering.
The market price and trading volume of our ordinary shares may be volatile, which could result in rapid and substantial losses for our shareholders.
The market price of our ordinary shares may be highly volatile and could be subject to wide fluctuations. In addition, the trading volume of our ordinary shares may fluctuate and cause significant price variations to occur.
Some of the factors that could negatively affect the price of our ordinary shares, or result in fluctuations in the price or trading volume of our ordinary shares, include:
variations in our quarterly operating results;
failure to meet the market’s earnings expectations;
publication of research reports about us or the automotive parts industry, or the failure of securities analysts to cover our ordinary shares after this offering;
departures of key personnel;
adverse market reaction to any indebtedness we may incur or securities we may issue in the future;
changes in market valuations of similar companies;
changes or proposed changes in laws or regulations, or differing interpretations thereof, affecting our business, or enforcement of these laws and regulations, or announcements relating to these matters;
litigation and governmental investigations; and
general market and economic conditions.
Provisions of our Articles of Association could delay or prevent a takeover of us by a third party.
Our Articles of Association could delay, defer or prevent a third party from acquiring us, despite any possible benefit to our shareholders, or otherwise adversely affect the price of our ordinary shares. For example, our amended Articles of Association will:
permit our Board of Directors to issue one or more series of preferred shares with rights and preferences designated by our board;
impose advance notice requirements for shareholder proposals and nominations of directors to be considered at shareholder meetings;
limit the ability of shareholders to remove directors without cause; and
require that all vacancies on our Board of Directors be filled by our directors.
These provisions may discourage potential takeover attempts, discourage bids for our ordinary shares at a premium over the market price or adversely affect the market price of, and the voting and other rights of the holders of, our ordinary shares. These provisions could also discourage proxy contests and make it more difficult for you and other shareholders to elect directors other than the candidates nominated by our Board of Directors. See “Description of Share Capital” for additional information on the anti-takeover measures that may be applicable to us.
Reports published by securities or industry analysts, including projections in those reports that exceed our actual results, could adversely affect our share price and trading volume.
We currently expect securities research analysts, including those affiliated with our underwriters, to establish and publish their own quarterly projections regarding our operating results. These projections may vary widely from one another and may not accurately predict the results we actually achieve. Our share price may decline if we fail to meet securities research analysts’ projections. Similarly, if one or more of the analysts who
covers us downgrades our shares or publishes inaccurate or unfavorable research about our business, our share price could decline. If one or more of these analysts ceases coverage of us or fails to publish reports on us regularly, our share price or trading volume could decline. Additionally, while we expect securities research analyst coverage, if no securities or industry analysts commence coverage of us, the trading price of our shares and the trading volume could decline.
Future sales of ordinary shares by existing shareholders could depress the market price of our ordinary shares.
After this offering, we will have ordinary shares outstanding. This includes the ordinary shares we and the selling shareholders are selling in this offering, which can be freely resold in the public market immediately after this offering unless purchased by any of our affiliates. We expect that the remaining ordinary shares, representing % of our total outstanding ordinary shares following this offering, will become available for resale in the public market as set forth under the heading “Shares Eligible for Future Sale.” All of our directors and executive officers, and the holders of all of our outstanding ordinary shares, are subject to lock-up agreements for a period of 180 days following the date of this prospectus; provided that 30% of such ordinary shares (other than shares owned by our directors and officers) will be released from lock-up restrictions on the 90th day following the date of this prospectus. The lock-up agreements are subject to extension in the case of an earnings release or material news or a material event relating to us. The underwritersGoldman, Sachs & Co. and J.P. Morgan Securities LLC may, in their sole discretion and without notice, release all or any portion of the ordinary shares subject to lock-up agreements. As restrictions on resale end, the market price of our ordinary shares could drop significantly if the holders of these shares sell them or are perceived by the market as intending to sell them. We will be required to file a shelf registration statement upon expiration of these lock-up periods to permit the resale of such shares. These factors could also make it more difficult for us to raise additional funds through future offerings of our ordinary shares or other securities.
The availability of ordinary shares for sale in the future could reduce the market price of our ordinary shares.
In the future, we may issue additional securities to raise capital. We may also acquire interests in other companies by using a combination of cash and our ordinary shares or just our ordinary shares. We may also issue securities convertible into our ordinary shares. Any of these events may dilute your ownership interest in our Company and have an adverse impact on the price of our ordinary shares. In addition, sales of a substantial amount of our ordinary shares in the public market, or the perception that these sales may occur, could reduce the market price of our ordinary shares. This could also impair our ability to raise additional capital through the sale of our securities.
You will suffer immediate and substantial dilution and may experience additional dilution in the future.
The initial public offering price per share of our ordinary shares will be substantially higher than the pro forma net tangible book value per share of our ordinary shares immediately after this offering. As a result, you will pay a price per share that substantially exceeds the book value of our assets after subtracting our liabilities. See “Dilution.”
Our board of directors and management have broad discretion in the use of our net proceeds from this offering and may not use them effectively.
Our management will have broad discretion in the application of the net proceeds from this offering and could spend the proceeds in ways that do not improve our operating results or enhance the value of our ordinary shares. Our shareholders may not agree with the manner in which our management chooses to allocate and spend the net proceeds. The failure by our management to apply these funds effectively could result in financial losses that could have a material adverse effect on our business and cause the price of our ordinary shares to decline. Pending their use, we may invest our net proceeds from this offering in a manner that does not produce income or that loses value. See “Use of Proceeds” in this prospectus.
We will incur increased costs as a result of being a publicly traded corporation.
We have no history operating as a publicly traded corporation. As a publicly traded corporation, we will incur additional legal, accounting and other expenses that we did not incur as a private company. This increase will be due to the increased accounting support services, filing annual and quarterly reports with the SEC, increased audit fees, investor relations, directors’ fees, directors’ and officers’ insurance, legal fees, stock exchange listing fees and registrar and transfer agent fees, which we expect to incur after the completion of this offering. In addition, we expect that complying with the rules and regulations implemented by the SEC and the NYSE will increase our legal and financial compliance costs and make activities more time-consuming and costly. In addition, we will incur additional costs associated with our publicly traded corporation reporting requirements.
The rights of shareholders of Jersey corporations differ in some respects from those of shareholders of U.S. corporations.
We are incorporated under the laws of Jersey. The rights of holders of ordinary shares are governed by Jersey law, including the Companies (Jersey) Law 1991, as amended, and by our Articles of Association. These rights differ in some respects from the rights of shareholders in corporations incorporated in the United States. See “Description of Share Capital—Comparison of United States and Jersey Corporate Law.”
SPECIAL NOTE REGARDING FORWARD-LOOKING STATEMENTS
This prospectus, as well as other presentations or statements made by us may contain forward-looking statements that reflect, when made, our current views with respect to current events and financial performance. Such forward-looking statements are subject to many risks, uncertainties and factors relating to our operations and business environment, which may cause our actual results to be materially different from any future results, express or implied, by such forward-looking statements. All statements that address future operating, financial or business performance or our strategies or expectations are forward-looking statements. In some cases, you can identify these statements by forward-looking words such as “may,” “might,” “will,” “should,” “expects,” “plans,” “anticipates,” “believes,” “estimates,” “predicts,” “projects,” “potential,” “outlook” or “continue,” and other comparable terminology. Factors that could cause actual results to differ materially from these forward-looking statements include, but are not limited to, those discussed under the heading “Risk Factors” in this prospectus, such as the following:
global economic conditions, including conditions affecting the credit market and the cyclical nature of automotive sales and production;
the potential disruptions in the supply of and changes in the competitive environment for raw material integral to our products;
our ability to maintain contracts that are critical to our operations;
our ability to attract, motivate and/or retain key executives; and
our ability to attract and retain customers.
New risks and uncertainties arise from time to time, and it is impossible for us to predict these events or how they may affect us. It should be remembered that the price of the ordinary shares and any income from them can go down as well as up. We disclaim any intention or obligation to update or revise any forward-looking statements, whether as a result of new information, future events and/or otherwise, except to the extent required by law.
USE OF PROCEEDS
We will receive net proceeds from this offering of approximately $ , or approximately $ if the underwriters exercise their option to purchase additional shares in full. We intend to use the net proceeds for general corporate purposes, primarily to fund our operations, to acquire capital equipment and to repay debt. We will not receive any proceeds from the ordinary shares being sold by the selling shareholders.
DIVIDEND POLICY
We have never declared or paid any cash dividends on our share capital. We currently anticipate that we will retain all available funds for use in the operation and expansion of our business, and do not anticipate paying any cash dividends in the foreseeable future.
CAPITALIZATION
The following table sets forth as of March 31,June 30, 2011 the cash and capitalization of:
Delphi Automotive LLP, on an actual basis;
Delphi Automotive LLP, on a pro forma as adjusted basis to give effect to (a) extinguishment of the Old Notes, (b) the modification of the Credit Agreement and (c) the issuance of Senior Notes, in each case as defined and described in “Unaudited Pro Forma Condensed Consolidated Financial Information”; and
us, on a pro forma as further adjusted basis to reflect the transaction by which Delphi Automotive LLP becomes our wholly-owned subsidiary and the sale by us of ordinary shares pursuant to this offering at an assumed price of $ per share, the midpoint of the range set forth on the cover page of the prospectus.
This table should be read in conjunction with in “Unaudited Pro Forma Condensed Consolidated Financial Information”, “Management’s Discussion and Analysis of Financial Condition and Results of Operations” and the financial statements of Delphi Automotive PLC and Delphi Automotive LLP, including the accompanying notes thereto, appearing elsewhere in this prospectus.
| | | | March 31, 2011 | | | June 30, 2011 | |
| | | Delphi Automotive LLP | | | Delphi
Automotive
PLC | | | Delphi
Automotive
LLP | | | Delphi
Automotive
PLC | |
| | | Actual | | | Pro Forma As
Adjusted | | | Pro Forma As
Further
Adjusted | | | Actual | | | Pro Forma As
Adjusted | |
| | | (in millions) | | | (in millions) | |
Cash and cash equivalents | | $ | 1,633 | | | $ | 1,336 | | | $ | | | | $ | 1,322 | | | $ | | |
Restricted cash | | | 22 | | | | 22 | | | | | | 17 | | | |
| Debt: | | | | | | | | | | |
Accounts receivable factoring | | $ | 159 | | | $ | 159 | | | $ | | | | $ | 130 | | | $ | | |
Senior credit facility | | | 2,488 | | | | 1,205 | | | | | | 1,031 | | | |
5.875% senior notes due 2019 | | | — | | | | 500 | | | | | | 500 | | | |
6.125% senior notes due 2021 | | | — | | | | 500 | | | | | | 500 | | | |
Capital leases and other debt(1) | | | 104 | | | | 104 | | | | | | 75 | | | |
| | | | | | | | | | | | | | | |
Less: current portion | | | 272 | | | | 261 | | | | | | 180 | | | |
| | | | | | | | | | | | | | | |
Total long-term debt | | | 2,479 | | | | 2,207 | | | | | | 2,056 | | | |
| | | | | | | | | | | | | | | |
Total debt | | $ | 2,751 | | | $ | 2,468 | | | $ | | | | $ | 2,236 | | | $ | | |
| | | | | | | | | | | | | | | |
Pre-IPO owners’ equity | | | | | | | | | | |
Membership interests | | $ | 1,278 | | | $ | 1,278 | | | | | $ | 1,578 | | | |
Accumulated other comprehensive loss: | | | | | | | | | | |
Employee benefit plans | | | 61 | | | | 61 | | | | | | 61 | | | |
Other | | | 96 | | | | 96 | | | | | | 132 | | | |
| | | | | | | | | | | | | | | |
Total accumulated other comprehensive income | | | 157 | | | | 157 | | | | | | 193 | | | |
| | | | | | | | | | | | | | | |
Total owners’ equity before noncontrolling interest | | | 1,435 | | | | 1,435 | | | | | | 1,771 | | | |
Noncontrolling interests | | | 472 | | | | 472 | | | | | | 471 | | | |
| | | | | | | | | | | | | | | |
Total pre-IPO owners’ equity | | $ | 1,907 | | | $ | 1,907 | | | | | $ | 2,242 | | | |
| | | | | | | | | | | | | | | |
| | | | March 31, 2011 | | | June 30, 2011 | |
| | | Delphi Automotive LLP | | | Delphi
Automotive
PLC | | | Delphi
Automotive
LLP | | | Delphi
Automotive
PLC | |
| | | Actual | | | Pro Forma As
Adjusted | | | Pro Forma As
Further
Adjusted | | | Actual | | | Pro Forma As
Adjusted | |
| | | (in millions) | | | (in millions) | |
Post-IPO shareholders’ equity: | | | | | | | | | | |
Preferred shares, $0.01 par value per share, shares authorized, issued and outstanding | | | — | | | | — | | | | | | — | | | |
Ordinary shares, $0.01 par value per share, shares authorized, issued and outstanding | | | — | | | | — | | | | | | — | | | |
Additional paid-in capital | | | — | | | | — | | | | | | — | | | |
Accumulated other comprehensive loss: | | | | | | | | | | |
Employee benefit plans | | | — | | | | — | | | | | | — | | | |
Other | | | — | | | | — | | | | | | — | | | |
| | | | | | | | | | | | | | | |
Total accumulated other comprehensive income | | | — | | | | — | | | | | | — | | | |
| | | | | | | | | | | | | | | |
Total shareholders’ equity before noncontrolling interest | | | — | | | | — | | | | | | — | | | |
Noncontrolling interests | | | — | | | | — | | | | | | — | | | |
| | | | | | | | | | | | | | | |
Total post-IPO shareholders’ equity | | $ | — | | | $ | — | | | $ | | | | $ | — | | | $ | | |
| | | | | | | | | | | | | | | |
Total capitalization | | $ | 4,658 | | | $ | 4,375 | | | $ | | | | $ | 4,478 | | | $ | | |
| | | | | | | | | | | | | | | |
| (1) | Capital leases and other debt is comprised of $80$50 million of short-term debt and $24$25 million of long-term debt. |
UNAUDITED PRO FORMA CONDENSED CONSOLIDATED FINANCIAL INFORMATION
The following unaudited pro forma condensed consolidated financial information (the “Pro Forma Financial Information”) sets forth selected historical consolidated financial information for Delphi Automotive LLP and its consolidated subsidiaries. The historical data provided as of March 31,June 30, 2011, for the threesix months ended March 31,June 30, 2011 and for the year ended December 31, 2010 are derived from Delphi Automotive LLP’s unaudited consolidated financial statements for the threesix months ended March 31,June 30, 2011 and the audited consolidated financial statements for the year ended December 31, 2010.
The Pro Forma Financial Information is provided for informational and illustrative purposes only. These tables should be read in conjunction with “Management’s Discussion and Analysis of Financial Condition and Results of Operations,” and the consolidated financial statements and related notes in the unaudited consolidated financial statements for the threesix months ended March 31,June 30, 2011 and the audited consolidated financial statements for the year ended December 31, 2010, included elsewhere in this prospectus.
The Pro Forma Financial Information gives effect to the transactions specified in “Pro Forma Adjustments” below as if they had occurred on January 1, 2010 for the unaudited pro forma condensed consolidated statements of operations for the year ended December 31, 2010 and the threesix months ended March 31,June 30, 2011, and gives effect to the “IPO Adjustments” as if they had occurred on March 31,June 30, 2011 for the unaudited pro forma condensed consolidated balance sheet. The pro forma adjustments and certain assumptions underlying these adjustments are described in the accompanying notes, which should be read in conjunction with the unaudited pro forma condensed consolidated financial information.
The Pro Forma Financial Information does not purport to project our future financial position or operating results as of any future date or for any future period. The unaudited pro forma condensed consolidated financial information is also not necessarily indicative of what our actual results of operations or financial position would have been had the transactions occurred on January 1, 2010 or March 31,June 30, 2011, as the case may be.
Pro Forma Adjustments
The “Pre-IPO Adjustments” column in the Pro Forma Financial Information includes the effects of the following transactions, which have been completed prior to this offering:
the extinguishment on March 31, 2011 of our outstanding $41 million in senior unsecured five-year notes (the “Old Notes”) issued in connection with our acquisition of certain assets of the Predecessor on the Acquisition Date at an aggregate purchase price of approximately $57 million;
the impact of the original credit agreement (the “Credit Agreement”) executed on March 31, 2011 among Delphi Automotive LLP, (for purposes of this description, “Parent”), Delphi Holdings, S.a.r.l., Delphi Corporation, (for purposes of this description, the “Borrower”), JPMorgan Chase Bank, N.A. as administrative agent, and J.P. Morgan Securities LLC as sole bookrunner and sole lead arranger, with respect to $3.0 billion in senior secured credit facilities (the “Credit Facility”Facilities”), of which $2.5 billion in term loans were used to redeem all outstanding Class A and Class C membership interests of Delphi Automotive LLP, and the amendment and modification to the Credit Agreementcredit agreement on May 17, 2011 in connection with the syndication thereof.thereof (the “Credit Agreement”). The modification of the Credit Agreement increased the amount of the Tranche A Term Loan from $250 million to $258 million, increased the commitments under the revolving credit facility from $500 million to $1.2 billion, reduced the amount of the Tranche B Term Loan from $2.25 billion to $950 million, and adjusted the interest rate options for all commitments (see “Management’s Discussion and Analysis of Financial Condition and Results of Operations—Liquidity and Capital Resources”); and
the issuance on May 17, 2011 of $500 million in senior unsecured notes due 2019 and $500 million in senior unsecured notes due 2021 (collectively, the “Senior Notes”) which, together with cash on hand, were used to repay amounts outstanding under the Credit Agreement.
The “IPO Adjustments” column in the Pro Forma Financial Information includes the effects of the following transactions in connection with this offering:
Delphi Automotive PLC’s acquisition of all outstanding unitsmembership interests of Delphi Automotive LLP from its existing unitequity holders in exchange for ordinary shares immediately prior to the closing of this offering; and
the issuance by us of ordinary shares in this offering and our application of the proceeds therefrom.therefrom; and
the accelerated vesting of the Class E-1 membership interests of Delphi Automotive LLP that will occur as a result of this offering.
For additional information regarding the foregoing pro forma adjustments, see the notes to the Pro Forma Financial Information.
DELPHI AUTOMOTIVE PLC
PRO FORMA CONDENSED CONSOLIDATED STATEMENT OF OPERATIONS
(Unaudited)
| | | | Three months ended March 31, 2011 | | | Six months ended June 30, 2011 | |
| | | Delphi Automotive LLP | | | Delphi Automotive PLC | | | Delphi Automotive LLP | | Delphi Automotive PLC | |
| | | Historical | | | Pre-IPO
Adjustments | | | Pro Forma | | | IPO
Adjustments | | | Pro Forma,
as Further
Adjusted | | | Historical | | Pre-IPO
Adjustments | | Pro Forma | | IPO
Adjustments | | Pro Forma,
as Further
Adjusted | |
| | | (dollars in millions, except share data) | | | (dollars in millions, except share data) | |
Net sales | | $ | 3,997 | | | $ | | | | $ | 3,997 | | | $ | | | | $ | | | | $ | 8,210 | | | $ | | | | $ | 8,210 | | | $ | | | | $ | | |
Operating expenses: | | | | | | | | | | | | | | | | | | | | |
Cost of sales | | | 3,353 | | | | — | | | | 3,353 | | | | | | | | 6,871 | | | | — | | | | 6,871 | | | | | |
Selling, general and administrative | | | 205 | | | | — | | | | 205 | | | | | | | | 445 | | | | — | | | | 445 | | | | | |
Amortization | | | 18 | | | | — | | | | 18 | | | | | | | | 37 | | | | — | | | | 37 | | | | | |
Restructuring | | | 9 | | | | — | | | | 9 | | | | | | | | 17 | | | | — | | | | 17 | | | | | |
| | | | | | | | | | | | | | | | | | | | | | | | | | | | | | |
Total operating expenses | | | 3,585 | | | | — | | | | 3,585 | | | | | | | | 7,370 | | | | — | | | | 7,370 | | | | | |
| | | | | | | | | | | | | | | | | | | | | | | | | | | | | | |
Operating income | | | 412 | | | | — | | | | 412 | | | | | | | | 840 | | | | — | | | | 840 | | | | | |
Interest expense | | | (6) | | | | (28)(a) | | | | (34) | | | | | | | | (47 | ) | | | (25 | )(a) | | | (72 | ) | | | | |
Loss on extinguishment of debt | | | (9) | | | | — | | | | (9) | | | | | | | | (17 | ) | | | — | | | | (17 | ) | | | | |
Other income, net | | | 29 | | | | — | | | | 29 | | | | | | | | 39 | | | | — | | | | 39 | | | | | |
| | | | | | | | | | | | | | | | | | | | | �� | | | | | | | | | | |
Income before income tax benefit | | | 426 | | | | (28) | | | | 398 | | | | | | | | 815 | | | | (25 | ) | | | 790 | | | | | |
Income tax (expense) benefit | | | (116) | | | | 10(b) | | | | (106) | | | | | | | | (189 | ) | | | 9 | (b) | | | (180 | ) | | | | |
| | | | | | | | | | | | | | | | | | | | | | | | | | | | | | |
Net income | | | 310 | | | | (18) | | | | 292 | | | | | | | | 626 | | | | (16 | ) | | | 610 | | | | | |
Net income attributable to noncontrolling interest | | | 19 | | | | — | | | | 19 | | | | | | | | 37 | | | | — | | | | 37 | | | | | |
| | | | | | | | | | | | | | | | | | | | | | | | | | | | | | |
Net income attributable to Delphi | | $ | 291 | | | $ | (18) | | | $ | 273 | | | $ | | | | $ | | | | $ | 589 | | | $ | (16 | ) | | $ | 573 | | | $ | | | | $ | | |
| | | | | | | | | | | | | | | | | | | | | | | | | | | | | | |
Weighted average ordinary shares outstanding: | | | | | | | | | | | | | | | | | | | | |
Basic | | | | | | | | | (c) | | | | | | | | | | | | | (c) | | |
| | | | | | | | | | | | | | | | | | | | | | | | | | | | | | |
Diluted | | | | | | | | | (c) | | | | | | | | | | | | | (c) | | |
| | | | | | | | | | | | | | | | | | | | | | | | | | | | | | |
Net income (loss) per share available to shareholders: | | | | | | | | | | | | | | | | | | | | |
Basic | | | | | | | | | (c) | | | | | | | | | | | | | (c) | | |
| | | | | | | | | | | | | | | | | | | | | | | | | | | | | | |
Diluted | | | | | | | | | (c) | | | | | | | | | | | | | (c) | | |
| | | | | | | | | | | | | | | | | | | | | | | | | | | | | | |
DELPHI AUTOMOTIVE PLC
PRO FORMA CONDENSED CONSOLIDATED STATEMENT OF OPERATIONS
(Unaudited)
| | | | Year ended December 31, 2010 | | | Year ended December 31, 2010 | |
| | | Delphi Automotive LLP | | | Delphi Automotive PLC | | | Delphi Automotive LLP | | | Delphi Automotive PLC | |
| | | Historical | | | Pre-IPO
Adjustments | | | Pro Forma | | | IPO
Adjustments | | Pro Forma,
as Further
Adjusted | | | Historical | | | Pre-IPO
Adjustments | | Pro Forma | | | IPO
Adjustments | | Pro Forma,
as Further
Adjusted | |
| | | (dollars in millions, except share data) | | | (dollars in millions, except share data) | |
Net sales | | $ | 13,817 | | | $ | | | | $ | 13,817 | | | $ | | | | $ | | | | $ | 13,817 | | | $ | | | | $ | 13,817 | | | $ | | | | $ | | |
Operating expenses: | | | | | | | | | | | | | | | | | | | | |
Cost of sales | | | 11,768 | | | | — | | | | 11,768 | | | | | | | | 11,768 | | | | — | | | | 11,768 | | | | | |
Selling, general and administrative | | | 815 | | | | — | | | | 815 | | | | | | | | 815 | | | | — | | | | 815 | | | | | |
Amortization | | | 70 | | | | — | | | | 70 | | | | | | | | 70 | | | | — | | | | 70 | | | | | |
Restructuring | | | 224 | | | | — | | | | 224 | | | | | | | | 224 | | | | — | | | | 224 | | | | | |
| | | | | | | | | | | | | | | | | | | | | | | | | | | | | | |
Total operating expenses | | | 12,877 | | | | — | | | | 12,877 | | | | | | | | 12,877 | | | | — | | | | 12,877 | | | | | |
| | | | | | | | | | | | | | | | | | | | | | | | | | | | | | |
Operating income | | | 940 | | | | — | | | | 940 | | | | | | | | 940 | | | | — | | | | 940 | | | | | |
Interest expense | | | (30) | | | | (116)(a) | | | | (146) | | | | | | | | (30) | | | | (116) | (a) | | | (146) | | | | | |
Other income, net | | | 51 | | | | — | | | | 51 | | | | | | | | 51 | | | | — | | | | 51 | | | | | |
| | | | | | | | | | | | | | | | | | | | | | | | | | | | | | |
Income before income tax benefit | | | 961 | | | | (116) | | | | 845 | | | | | | | | 961 | | | | (116) | | | | 845 | | | | | |
Income tax (expense) benefit | | | (258) | | | | 41(b) | | | | (217) | | | | | | | | (258) | | | | 41 | (b) | | | (217) | | | | | |
| | | | | | | | | | | | | | | | | | | | | | | | | | | | | | |
Net income | | $ | 703 | | | $ | (75) | | | $ | 628 | | | $ | | | | $ | | | | $ | 703 | | | $ | (75) | | | $ | 628 | | | $ | | | | $ | | |
Net income attributable to noncontrolling interest | | | 72 | | | | — | | | | 72 | | | | | | | | 72 | | | | — | | | | 72 | | | | | |
| | | | | | | | | | | | | | | | | | | | | | | | | | | | | | |
Net income attributable to Delphi | | $ | 631 | | | $ | (75) | | | $ | 556 | | | $ | | | | $ | | | | $ | 631 | | | $ | (75) | | | $ | 556 | | | $ | | | | $ | | |
| | | | | | | | | | | | | | | | | | | | | | | | | | | | | | |
Weighted average ordinary shares outstanding: | | | | | | | | | | | | | | | | | | | | |
Basic | | | | | | | | | (c | ) | | | | | | | | | | | | (c) | | |
| | | | | | | | | | | | | | | | | | | | | | | | | | | | | | |
Diluted | | | | | | | | | (c | ) | | | | | | | | | | | | (c) | | |
| | | | | | | | | | | | | | | | | | | | | | | | | | | | | | |
Net income (loss) per share available to shareholders: | | | | | | | | | | | | | | | | | | | | |
Basic | | | | | | | | | (c | ) | | | | | | | | | | | | (c) | | |
| | | | | | | | | | | | | | | | | | | | | | | | | | | | | | |
Diluted | | | | | | | | | (c | ) | | | | | | | | | | | | (c) | | |
| | | | | | | | | | | | | | | | | | | | | | | | | | | | | | |
Notes to Unaudited Pro Forma Condensed Consolidated Statements of Operations
Pre-IPO Adjustments
(a) The interest expense adjustments from the Credit Agreement and the issuance of the Senior Notes resulted in a net increase of $28$25 million and $116 million for the threesix months ended March 31,June 30, 2011 and the year ended December 31, 2010, respectively, and consists of the following (in millions):
| | | | Three months ended
March 31, 2011 | | Year ended
December 31, 2010 | | | Six months ended
June 30, 2011 | | Year ended
December 31, 2010 | |
Senior Notes (i) | | $ | 15 | | | $ | 60 | | | $ | 30 | | | $ | 60 | |
Credit Agreement (ii) | | | 10 | | | | 41 | | | | 21 | | | | 41 | |
Issuance cost and original issue discount (“OID”) amortization (iii) | | | 4 | | | | 18 | | | | 9 | | | | 18 | |
Elimination of interest expense and accretion on extinguished Old Notes (iv) | | | (1 | ) | | | (3 | ) | | | (1 | ) | | | (3 | ) |
Elimination of historical interest expense (including the amortization of debt issuance costs and OID) incurred pursuant to the modified Credit Agreement and Senior Notes (v) | | | | (34 | ) | | | — | |
| | | | | | | | | | | | |
Total adjustment | | $ | 28 | | | $ | 116 | | | $ | 25 | | | $ | 116 | |
| | | | | | | | | | | | |
| (i) | Reflects the issuance of the Senior Notes. Interest expense is based on the outstanding balance of $500 million of 5.875% senior notes due 2019 and $500 million of 6.125% senior notes due 2021. |
| (ii) | Reflects the issuance of $250 million of Tranche A Term Loan and $2.25 billion of Tranche B Term Loan as entered into on March 31, 2011. In conjunction with the modified Credit Agreement on May 17, 2011, $1.3 billion of the Tranche B Term Loan was repaid and the Tranche A Term Loan was increased by $8 million. The $1.2 billion revolving credit facility remains undrawn. |
Based on Delphi’s current elections pursuant to the terms of the modified Credit Agreement, the assumed interest rates were 3.00% per annum (adjusted LIBOR plus 2.75%) and 3.50% per annum (a LIBOR floor of 1.00% plus 2.50%) on the Tranche A Term Loan and the Tranche B Term Loan, respectively. On May 18, 2011, the adjusted LIBOR for the Tranche A Term Loan was 0.25% (0.19575% one-month LIBOR rounded to 0.25% pursuant to the terms of the Credit Agreement). See “Management’s Discussion and Analysis of Financial Condition and Results of Operations—Liquidity and Capital Resources.” Delphi may elect to change the selected interest rate over the term of the Credit FacilityFacilities in accordance with the provisions of the Credit Agreement. The applicable interest rates listed above for the revolving facility and the Tranche A Term Loan may increase or decrease from time to time by 0.25% based upon changes to Delphi’s corporate credit ratings. Accordingly, the interest rate will fluctuate during the term of the Credit Agreement based on changes in the Alternate Base Rate, LIBOR or future changes in Delphi’s corporate credit ratings.
| (iii) | Reflects amortization to interest expense of $86 million in debt issuance costs and $3 million of original issue discount pursuant to the Credit Agreement executed on March 31, 2011 and as subsequently modified on May 17, 2011, as well as $20 million of debt issuance costs related to the Senior Notes. Deferred debt issuance costs and OID are recognized as additional interest expense over the life of the respective debt commitment(s) utilizing the effective interest method. The following table summarizes the adjustments to interest expense (in millions): |
Additional Interest Expense from Debt Issuance Costs and OID Amortization
| | | | | | | | | | Amortization | | | | | | | | | Amortization | |
| | | Issuance
Costs | | | Debt
Maturity
(in months) | | | Three months ended
March 31, 2011 | | | Year ended
December 31, 2010 | | | Issuance
Costs | | | Debt
Maturity
(in months) | | | Six months ended
June 30, 2011 | | | Year ended
December 31, 2010 | |
Revolving credit facility | | $ | 30 | | | | 60 | | | $ | 2 | | | $ | 6 | | | $ | 30 | | | | 60 | | | $ | 3 | | | $ | 6 | |
Tranche A Term Loan | | | 7 | | | | 60 | | | | — | | | | 2 | | | | 7 | | | | 60 | | | | 1 | | | | 2 | |
Tranche B Term Loan | | | 49 | | | | 72 | | | | 2 | | | | 8 | | | | 49 | | | | 72 | | | | 4 | | | | 8 | |
8-Year Senior Notes | | | 10 | | | | 96 | | | | — | | | | 1 | | | | 10 | | | | 96 | | | | 1 | | | | 1 | |
10-Year Senior Notes | | | 10 | | | | 120 | | | | — | | | | 1 | | | | 10 | | | | 120 | | | | — | | | | 1 | |
Tranche A Term Loan OID | | | 1 | | | | 60 | | | | — | | | | — | | | | 1 | | | | 60 | | | | — | | | | — | |
Tranche B Term Loan OID | | | 2 | | | | 72 | | | | — | | | | — | | | | 2 | | | | 72 | | | | — | | | | — | |
| | | | | | | | | | | | | | | | | | | | | | |
Total | | $ | 109 | | | | | $ | 4 | | | $ | 18 | | | $ | 109 | | | | | $ | 9 | | | $ | 18 | |
| | | | | | | | | | | | | | | | | | | | | | |
| (iv) | Reflects the elimination of interest expense and accretion of the fair value premium previously recognized related to the $41 million senior unsecured five-year Old Notes. These Old Notes were issued in connection with the acquisition of certain assets of the Predecessor and had an Acquisition Date fair value of $49 million. The Old Notes paid 12% interest and were scheduled to mature on October 6, 2014. In addition, the $8 million fair value premium was being accreted as a credit to interest expense over the five year life of the Old Notes. The following table summarizes the adjustments to interest expense (in millions): |
| | Elimination of Interest Expense and Accretion Related to Old Notes | Elimination of Interest Expense and Accretion Related to Old Notes | | Elimination of Interest Expense and Accretion Related to Old Notes | |
| | | | Value | | Three months ended
March 31, 2011 | | Year ended
December 31, 2010 | | | Value | | Six months ended
June 30, 2011 | | Year ended
December 31, 2010 | |
Eliminate Interest Expense | | | | | | | | | | | | |
12% Old Notes | | $ | 41 | | | $ | (1 | ) | | $ | (5 | ) | | $ | 41 | | | $ | (1 | ) | | $ | (5 | ) |
| Eliminate Accretion of Fair Value Premium | Eliminate Accretion of Fair Value Premium | | | | | | Eliminate Accretion of Fair Value Premium | | | | | |
Fair Value Adjustment | | | 8 | | | | — | | | | 2 | | | | 8 | | | | — | | | | 2 | |
| | | | | | | | | | | | | | | | |
Total | | | | $ | (1 | ) | | $ | (3 | ) | | | | $ | (1 | ) | | $ | (3 | ) |
| | | | | | | | | | | | | | | | |
| (v) | Reflects the elimination of interest expense (including the amortization of debt issuance costs and OID) related to the modified Credit Agreement and Senior Notes included in the historical amounts for the six months ended June 30, 2011. The following table summarizes the adjustments to interest expense (in millions): |
| | | | | | | | | | | | |
| Elimination of Interest Expense | |
| | | |
| | | Interest Expense | | | Amortization | | | Total | |
Revolving credit facility | | $ | — | | | $ | 1 | | | $ | 1 | |
Tranche A Term Loan | | | 2 | | | | 1 | | | | 3 | |
Tranche B Term Loan | | | 20 | | | | 2 | | | | 22 | |
8-year Senior Notes | | | 4 | | | | — | | | | 4 | |
10-year Senior Notes | | | 4 | | | | — | | | | 4 | |
| | | | | | | | | | | | |
| | $ | 30 | | | $ | 4 | | | $ | 34 | |
| | | | | | | | | | | | |
(b) Income tax benefit related to the Pro Forma Adjustments for the six months ended June 30, 2011 and the year ended December 31, 2010 is $10$9 million and $41 million, respectively, based on applying the U.S. statutory tax rate of 35% to the Pro Forma Adjustments.
IPO Adjustments
(c) Reflects issuance of ordinary shares in exchange for Delphi Automotive LLP membership interests and ordinary shares in this offering.
DELPHI AUTOMOTIVE PLC
PRO FORMA CONDENSED CONSOLIDATED BALANCE SHEET
(Unaudited)
| | | | As of March 31, 2011 | | | As of June 30, 2011 | |
| | | Delphi Automotive LLP | | Delphi Automotive PLC | | | Delphi Automotive
LLP | | | Delphi Automotive PLC | |
| | | Historical | | Pre-IPO
Adjustments | | Pro Forma | | IPO
Adjustments | | Pro Forma,
as Further
Adjusted | | | Historical | | | IPO
Adjustments | | Pro Forma | |
| | | (in millions) | | | (in millions) | |
ASSETS | | | | | | | | | | | | | | | | |
Current assets: | | | | | | | | | | | | | | | | |
Cash and cash equivalents | | $ | 1,633 | | | $
|
|
| | $ | 1,336 | | | $ | | | | $ | | | | | 1,322 | | | $ | | | | $ | | |
| | | | | 1,000 | (a) | | | | | | | |
| | | | | (1,283 | )(b) | | | | | | | |
| | | | | (14 | )(c) | | | | | | | |
Restricted cash | | | 22 | | | | — | | | | 22 | | | | | | | | 17 | | | | | |
Accounts receivable | | | 2,794 | | | | — | | | | 2,794 | | | | | | | | 2,865 | | | | | |
Inventories | | | 1,088 | | | | — | | | | 1,088 | | | | | | | | 1,139 | | | | | |
Other current assets | | | 596 | | | | 3 | (c) | | | 599 | | | | | | | | 614 | | | | | |
| | | | | | | | | | | | | | | | | | | | | | | | |
Total current assets | | | 6,133 | | | | (294 | ) | | | 5,839 | | | | | | | | 5,957 | | | | | |
Long-term assets: | | | | | | | | | | | | | | | | |
Property, net | | | 2,162 | | | | — | | | | 2,162 | | | | | | | | 2,231 | | | | | |
Investments in affiliates | | | 267 | | | | — | | | | 267 | | | | | | | | 283 | | | | | |
Intangible assets, net | | | 655 | | | | — | | | | 655 | | | | | | | | 653 | | | | | |
Other long-term assets | | | 507 | | | | 11 | (c) | | | 518 | | | | | | | | 503 | | | | | |
| | | | | | | | | | | | | | | | | | | | | | | | |
Total long-term assets | | | 3,591 | | | | 11 | | | | 3,602 | | | | | | | | 3,670 | | | | | |
| | | | | | | | | | | | | | | | | | | | | | | | |
Total assets | | $ | 9,724 | | | $ | (283 | ) | | $ | 9,441 | | | $ | | | | $ | | | | | 9,627 | | | $ | | | | $ | | |
| | | | | | | | | | | | | | | | | | | | | | | | |
| LIABILITIES AND OWNERS’ EQUITY | | | | | | | | | | | | | | | | |
Current liabilities: | | | | | | | | | | | | | | | | |
Short-term debt | | $ | 272 | | | $ | (11 | )(b) | | $ | 261 | | | $ | | | | $ | | | | | 180 | | | $ | | | | $ | | |
Accounts payable | | | 2,429 | | | | — | | | | 2,429 | | | | | | | | 2,560 | | | | | |
Accrued liabilities | | | 1,312 | | | | — | | | | 1,312 | | | | | | | | 1,285 | | | | | |
| | | | | | | | | | | | | | | | | | | | | | | | |
Total current liabilities | | | 4,013 | | | | (11 | ) | | | 4,002 | | | | | | | | 4,025 | | | | | |
Long-term liabilities: | | | | | | | | | | | | | | | | |
Other long-term debt | | | 2,479 | | | | | | 2,207 | | | | | | | | 2,056 | | | | | |
| | | | | 1,000 | (a) | | | | | | | |
| | | | | (1,272 | )(b) | | | | | | | |
Pension and other postretirement benefit obligations | | | 707 | | | | — | | | | 707 | | | | | | | | 715 | | | | | |
Other long-term liabilities | | | 618 | | | | — | | | | 618 | | | | | | | | 589 | | | | | |
| | | | | | | | | | | | | | | | | | | | | | | | |
Total long-term liabilities | | | 3,804 | | | | (272 | ) | | | 3,532 | | | | | | | | 3,360 | | | | | |
| | | | | | | | | | | | | | | | | | | | | | | | |
Total liabilities | | | 7,817 | | | | (283 | ) | | | 7,534 | | | | | | | | 7,385 | | | | | |
| | | | | | | | | | | | | | | | | | | | | | | | |
| Pre-IPO owners’ equity | | | | | | | | | | | | | | | | |
Membership interests | | $ | 1,278 | | | $ | — | | | $ | 1,278 | | | $ | (1,278 | )(d) | | $ | | | | | 1,578 | | | $ | (1,578 | )(a) | | $ | | |
Accumulated other comprehensive loss: | | | | | | | | | | | | | | | | |
Employee benefit plans | | | 61 | | | | — | | | | 61 | | | | (61 | ) | | | | | 61 | | | | (61 | ) | | |
Other | | | 96 | | | | — | | | | 96 | | | | (96 | ) | | | | | 132 | | | | (132 | ) | | |
| | | | | | | | | | | | | | | | | | | | | | | | |
Total accumulated other comprehensive income | | | 157 | | | | — | | | | 157 | | | | (157 | ) | | | | | 193 | | | | (193 | ) | | |
| | | | | | | | | | | | | | | | | | | | | | | | |
Total owners’ equity before noncontrolling interest | | | 1,435 | | | | — | | | | 1,435 | | | | (1,435 | ) | | | | | 1,771 | | | | (1,771 | ) | | |
Noncontrolling interests | | | 472 | | | | — | | | | 472 | | | | (472 | ) | | | | | 471 | | | | (471 | ) | | |
| | | | | | | | | | | | | | | | | | | | | | | | |
Total Pre-IPO owners’ equity | | | 1,907 | | | | — | | | | 1,907 | | | | (1,907 | ) | | | | | 2,242 | | | | (2,242 | ) | | |
| | | | | | | | | | | | | | | | | | | | | | | | |
| Post-IPO owners’ equity | | | | | | | | | | | | | | | | |
Preferred shares, $0.01 par value per share, shares authorized, issued and outstanding | | | — | | | | — | | | | — | | | | | | | | — | | | | | |
Ordinary shares, $0.01 par value per share, shares authorized, issued and outstanding | | | — | | | | — | | | | — | | | | | (e) | | | | | — | | | | | (b) | | |
Additional paid-in capital | | | — | | | | — | | | | — | | | | 12 | (f) | | | | | — | | | | 10 | (c) | | |
Retained earnings (deficit) | | | — | | | | — | | | | — | | | | (12 | )(f) | | | | | — | | | | (10 | )(c) | | |
Accumulated other comprehensive loss: | | | | | | | | | | | | | | | | |
Employee benefit plans | | | — | | | | — | | | | — | | | | | | | | — | | | | | |
Other | | | — | | | | — | | | | — | | | | | | | | — | | | | | |
Total accumulated other comprehensive income | | | — | | | | — | | | | — | | | | | | | | — | | | | | |
| | | | | | | | | | | | | | | | | | | | | | | | |
Total shareholders’ equity before noncontrolling interest | | | — | | | | — | | | | — | | | | | | | | — | | | | | |
Noncontrolling interests | | | — | | | | — | | | | — | | | | | | | | — | | | | | |
| | | | | | | | | | | | | | | | | | | | | | | | |
Total Post-IPO shareholders’ equity | | $ | — | | | | — | | | $ | — | | | | | $ | | | | $ | — | | | | | $ | | |
| | | | | | | | | | | | | | | | | | | | | | | | |
Total liabilities and shareholders’ equity | | $ | 9,724 | | | $ | (283 | ) | | $ | 9,441 | | | $ | | | | $ | | | | $ | 9,627 | | | $ | | | | $ | | |
| | | | | | | | | | | | | | | | | | | | | | | | |
Notes to Unaudited Pro Forma Condensed Consolidated Balance Sheet
Pre-IPOIPO Adjustments
(a) Reflects the $1.0 billion in proceeds from the May 17, 2011 issuance of $500 million of 5.875% senior notes due 2019 and $500 million of 6.125% senior notes due 2021. Principal amounts are payable on the maturity dates.
(b) Reflects the May 17, 2011 pay down of the Tranche B Term Loan from $2.25 billion to $950 million using cash on hand of $283 million and the proceeds from the issuance of the Senior Notes of $1.0 billion referenced in (a) above. The corresponding $11 million original issue discount, or 0.5%, on the Tranche B Term Loan was reduced to $2 million as a result of (1) the $1.3 billion of Tranche B Term Loan repayment and (2) the modification of the discount on the remaining $950 million Tranche B Term Loan to 0.25%. The Tranche A Term Loan was increased from $250 million to $258 million.
(c) Reflects payment of debt issuance costs of $14 million related to the issuance of the Senior Notes and certain modifications to the Credit Agreement relating principally to the increased commitments under the revolving credit facility from $500 million to $1.2 billion.
IPO Adjustments
(d) Represents elimination of pre-IPO members’ equity to reflect transaction pursuant to which Delphi Automotive PLC becomes the owner of Delphi Automotive LLP.
(e)(b) Represents creation of shareholders’ equity as a result of the transaction pursuant to which Delphi Automotive PLC becomes the owner of Delphi Automotive LLP.
(f)(c) Represents accelerated vesting of the Class E-1 membership interests in connection with this offering. The unvested membership interests will fully vest in the event of a completed initial public offering if the resulting total equity valuation of the Company (based on the average closing price of our shares during the 15-day period beginning on the 30th day after the closing of this offering), plus the value of prior distributions made under the Limited Liability Partnership Agreement of Delphi Automotive LLP Agreement(as amended and restated, the “LLP Agreement”) to holders of membership interests (as well as the $4.4 billion paid to holders of Class A and C membership interests to repurchase their Class A and C membership interests), is at least $6 billion.
The fair value of the Class E-1 membership interests was estimated to be $19 million at the June 2010 grant date. The compensation expense related to the Class E-1 membership interests is recognized over the requisite service period on a straight-line basis with the amount of compensation cost recognized at any date equaling the portion of the grant-date value of the award that is vested at that date. Absent accelerated vesting, the Class E-1 membership interests are subject to continued service through the vesting dates as follows:
20% on November 1, 2010
40% on November 1, 2011
40% on November 1, 2012
The grant date fair value of $19 million is recognized as compensation expense over the vesting schedule as follows:
| | | | | | | | | | | | | | | | | | | | |
Vesting Period | | # of
Months in
Vesting
Period | | | Initial
Award in
Millions | | | | | Vesting Rate | | | | | Cost in
Millions | |
November 1, 2010 | | | 4 | | | $ | 19.0 | | | x | | | 20% | | | = | | $ | 3.8 | |
November 1, 2011 | | | 12 | | | $ | 19.0 | | | x | | | 40% | | | = | | $ | 7.6 | |
November 1, 2012 | | | 12 | | | $ | 19.0 | | | x | | | 40% | | | = | | $ | 7.6 | |
| | | | | | | | | | | | | | | | | | | | |
| | | | | | | | | | | | | 100% | | | | | $ | 19.0 | |
| | | | | | | | | | | | | | | | | | | | |
Based on the vesting schedule through June 30, 2011, approximately $9 million of compensation expense has been recognized, which represents the first 12 months of vesting ($3.8 million as of November 1, 2010 plus $5.1 million for the period from November 1, 2010 through June 30, 2011 (eight months of the vesting period ending November 1, 2011)). Accordingly, at June 30, 2011, there was $10 million of unrecognized compensation expense.
DILUTION
Our pro forma net tangible book value as of March 31,June 30, 2011 was $ or $ per ordinary share. Pro forma net tangible book value per share is determined by dividing our pro forma tangible net worth (which is equal to our total assets less total liabilities, calculated assuming we have acquired Delphi Automotive LLP), by the aggregate number of ordinary shares outstanding immediately prior to the offering but after giving effect to our issuance of shares to existing holders of Delphi Automotive LLP membership interests. After giving effect to our issuance and sale of the ordinary shares in this offering, at an assumed initial public offering price of $ per share, the midpoint of the range set forth on the cover page of this prospectus, and the receipt and application of the net proceeds therefrom, our pro forma net tangible book value at March 31,June 30, 2011 would have been $ or $ per share. This represents an immediate increase in pro forma net tangible book value to existing shareholders of $ per share and an immediate dilution to new investors of $ per share. The following table illustrates this per share dilution:
| | | | |
Assumed initial public offering price | | $ | | |
Pro forma net tangible book value per share as of March 31,June 30, 2011 | | $ | | |
Increase in pro forma net tangible book value per share attributable to new investors | | | | |
Pro forma net tangible book value per share after offering | | | | |
| | | | |
Dilution per share to new investors | | $ | | |
| | | | |
Dilution is determined by subtracting pro forma net tangible book value per share after the offering from the initial public offering price per share.
A $1.00 increase (decrease) in the assumed initial public offering price of $ per share (the midpoint of the range set forth on the cover page of this prospectus), would increase (decrease) our pro forma consolidated net tangible book value after this offering by $ and the dilution per share to new investors by $ , in each case assuming the number of shares offered, as set forth on the cover page of this prospectus, remains the same and after deducting the underwriting discounts and commissions and estimated offering expenses payable by us.
The following table sets forth, on a pro forma basis, as of March 31,June 30, 2011, the number of ordinary shares purchased from us, the total consideration paid, or to be paid, and the average price per share paid, or to be paid, by existing shareholders and by the new investors, at an assumed initial public offering price of $ per share, the midpoint of the range set forth on the cover page of this prospectus, before deducting estimated underwriting discounts and commissions and offering expenses payable by us:
| | | | | | | | | | | | | | | | |
| | | Shares Purchased | | | Total Consideration | | | Average Price
Per Share |
| | | Number | | Percent | | | Amount | | | Percent | | |
Existing shareholders(1) | | | | | % | | | $ | | | | | % | | | |
New investors | | | | | | | | | | | | | | | | |
Total | | | | | 100 | % | | $ | | | | | 100 | % | | |
| (1) | Reflects the price paid by the initial equityholders of Delphi Automotive LLP in connection with its formation in 2009 (other than holders whose equity was repurchased in March 2011). |
Sales by the selling shareholders in this offering will reduce the number of shares held by existing shareholders to or approximately %, shares or approximately % if the underwriters’ option is exercised in full, and will increase the number of shares to be purchased by new investors to or approximately %, shares or approximately % if the underwriters’ option is exercised in full, of the total ordinary shares outstanding after the offering.
The foregoing tables assume no exercise of the underwriters’ option to purchase additional shares and no issuance of any shares pursuant to the Value Creation Plan described under “Executive Compensation.” Based on the midpoint of the range on the front cover and assuming that value is maintained on December 31, 2012, shares would be issuable under the Value Creation Plan. At March 31,June 30, 2011, no options to purchase ordinary shares were outstanding. To the extent shares are issued under the Value Creation Plan, there will be further dilution to new investors.
A $1.00 increase (decrease) in the assumed initial public offering price of $ per share of ordinary shares (the midpoint of the price range set forth on the cover of this prospectus), would increase (decrease) total consideration paid by new investors in this offering and by all investors by $ million, and would increase (decrease) the average price per share paid by new investors by $ , in each case assuming the number of shares offered, as set forth on the cover page of this prospectus, remains the same and after deducting the underwriting discounts and commissions and estimated offering expenses payable by us.
SELECTED FINANCIAL AND OTHER DATA
Delphi Automotive PLC was formed on May 19, 2011, has nominal assets and no liabilities and will conduct no operations prior to the completion of this offering. Accordingly, the following presents historical financial information for Delphi Automotive LLP, which will become a wholly-owned subsidiary of Delphi Automotive PLC immediately prior to completion of this offering.
The following selected consolidated financial data of the Successor and the Predecessor have been derived from the audited and unaudited consolidated financial statements of the Successor and the Predecessor and should be read in conjunction with, and are qualified by reference to, “Management’s Discussion and Analysis of Financial Condition and Results of Operations” and the consolidated financial statements and notes thereto included elsewhere in this prospectus.
| | | | Successor | | | | Predecessor(1) | | | Successor | | | | Predecessor(1) | |
| | | Three months
ended March 31, | | Year ended
December 31,
2010 | | | Period
from
August 19
to
December 31,
2009 | | | | | Period from
January 1 to
October 6,
2009 | | | Year ended December 31, | | | Six months
ended June 30, | | Year ended
December 31,
2010 | | | Period
from
August 19
to
December 31,
2009 | | | | | Period from
January 1 to
October 6,
2009 | | | Year ended December 31, | |
| | 2011 | | 2010 | | | | 2008 | | 2007 | | 2006 | | | 2011 | | 2010 | | | | 2008 | | 2007 | | 2006 | |
| | | (dollars in millions, except per share data) | | | | (dollars in millions, except per share data) | | | (dollars in millions, except per share data) | | | | (dollars in millions, except per share data) | |
Statements of operations data: | | | | | | | | | | | | | | | | | | | | | | | | | | | | | | | | | | | | |
Net sales | | $ | 3,997 | | | $ | 3,410 | | | $ | 13,817 | | | $ | 3,421 | | | | | $ | 8,334 | | | $ | 16,808 | | | $ | 19,526 | | | $ | 19,329 | | | $ | 8,210 | | | $ | 6,856 | | | $ | 13,817 | | | $ | 3,421 | | | | | $ | 8,334 | | | $ | 16,808 | | | $ | 19,526 | | | $ | 19,329 | |
Depreciation and amortization | | | 117 | | | | 99 | | | | 421 | | | | 139 | | | | | | 540 | | | | 822 | | | | 871 | | | | 883 | | | | 233 | | | | 206 | | | | 421 | | | | 139 | | | | | | 540 | | | | 822 | | | | 871 | | | | 883 | |
Operating income (loss) | | | 412 | | | | 324 | | | | 940 | | | | (10 | ) | | | | | (1,118 | ) | | | (1,425 | ) | | | (1,557 | ) | | | (4,040 | ) | | | 840 | | | | 621 | | | | 940 | | | | (10 | ) | | | | | (1,118 | ) | | | (1,425 | ) | | | (1,557 | ) | | | (4,040 | ) |
Interest expense | | | (6 | ) | | | (8 | ) | | | (30 | ) | | | (8 | ) | | | | | — | | | | (434 | ) | | | (764 | ) | | | (423 | ) | | | (47 | ) | | | (16 | ) | | | (30 | ) | | | (8 | ) | | | | | — | | | | (434 | ) | | | (764 | ) | | | (423 | ) |
Reorganization items, net | | | — | | | | — | | | | — | | | | — | | | | | | 10,210 | | | | 5,147 | | | | (163 | ) | | | (92 | ) | | | — | | | | — | | | | — | | | | — | | | | | | 10,210 | | | | 5,147 | | | | (163 | ) | | | (92 | ) |
Income (loss) from continuing operations | | | 310 | | | | 235 | | | | 703 | | | | (3 | ) | | | | | 9,391 | | | | 3,163 | | | | (1,855 | ) | | | (4,598 | ) | | | 626 | | | | 468 | | | | 703 | | | | (3 | ) | | | | | 9,391 | | | | 3,163 | | | | (1,855 | ) | | | (4,598 | ) |
Net income (loss) | | | 310 | | | | 235 | | | | 703 | | | | (3 | ) | | | | | 9,347 | | | | 3,066 | | | | (2,997 | ) | | | (5,427 | ) | | | 626 | | | | 468 | | | | 703 | | | | (3 | ) | | | | | 9,347 | | | | 3,066 | | | | (2,997 | ) | | | (5,427 | ) |
Net income attributable to noncontrolling interests | | | 19 | | | | 20 | | | | 72 | | | | 15 | | | | | | 29 | | | | 29 | | | | 68 | | | | 37 | | | | 37 | | | | 39 | | | | 72 | | | | 15 | | | | | | 29 | | | | 29 | | | | 68 | | | | 37 | |
Net income (loss) attributable to Successor/Predecessor | | | 291 | | | | 215 | | | | 631 | | | | (18 | ) | | | | | 9,318 | | | | 3,037 | | | | (3,065 | ) | | | (5,464 | ) | | | 589 | | | | 429 | | | | 631 | | | | (18 | ) | | | | | 9,318 | | | | 3,037 | | | | (3,065 | ) | | | (5,464 | ) |
| | | | | | |
Net income (loss) per membership interests unit and per share data: (actual) | | | | | | | | | | | | | | | | | | | | | | | | | | | | | | | | | | | | |
Class A net income (loss) per membership interests unit | | $ | 43.50 | | | $ | 21.50 | | | $ | 65.35 | | | $ | (1.80 | ) | | | | | — | | | | — | | | | — | | | | — | | | $ | 43.50 | | | $ | 42.90 | | | $ | 65.35 | | | $ | (1.80 | ) | | | | | — | | | | — | | | | — | | | | — | |
Class B net income (loss) per membership interests unit | | | 531.79 | | | | 394.22 | | | | 1,156.98 | | | | (33.00 | ) | | | | | — | | | | — | | | | — | | | | — | | | | 1,370.85 | | | | 78.60 | | | | 1,156.98 | | | | (33.00 | ) | | | | | — | | | | — | | | | — | | | | — | |
Class C net income (loss) per membership interests unit | | | 253.78 | | | | 376.25 | | | | 1,064.88 | | | | (31.50 | ) | | | | | — | | | | — | | | | — | | | | — | | | | 253.78 | | | | 750.75 | | | | 1,064.88 | | | | (31.50 | ) | | | | | — | | | | — | | | | — | | | | — | |
Class E-1 net income per membership interests unit | | | 40.42 | | | | — | | | | — | | | | — | | | | | | — | | | | — | | | | — | | | | — | | | | 63.40 | | | | — | | | | — | | | | — | | | | | | — | | | | — | | | | — | | | | — | |
Income (loss) from continuing operations attributable to Predecessor | | | — | | | | — | | | | — | | | | — | | | | | $ | 16.58 | | | $ | 5.55 | | | $ | (3.41 | ) | | $ | (8.25 | ) | | | — | | | | — | | | | — | | | | — | | | | | $ | 16.58 | | | $ | 5.55 | | | $ | (3.41 | ) | | $ | (8.25 | ) |
Loss from discontinued operations attributable to Predecessor | | | — | | | | — | | | | — | | | | — | | | | | | (0.08 | ) | | | (0.17 | ) | | | (2.04 | ) | | | (1.49 | ) | | | — | | | | — | | | | — | | | | — | | | | | | (0.08 | ) | | | (0.17 | ) | | | (2.04 | ) | | | (1.49 | ) |
Income from cumulative effect of accounting change attributable to Predecessor | | | — | | | | — | | | | — | | | | — | | | | | | — | | | | — | | | | — | | | | 0.01 | | | | — | | | | — | | | | — | | | | — | | | | | | — | | | | — | | | | — | | | | 0.01 | |
| | | | | | | | | | | | | | | | | | | | | | | | | | | | | | | | | | | | | | | | | | | | | | | | | | | | |
Basic and diluted income (loss) per share attributable to Predecessor | | | — | | | | — | | | | — | | | | — | | | | | $ | 16.50 | | | $ | 5.38 | | | $ | (5.45 | ) | | $ | (9.73 | ) | | | — | | | | — | | | | — | | | | — | | | | | $ | 16.50 | | | $ | 5.38 | | | $ | (5.45 | ) | | $ | (9.73 | ) |
| | | | | | |
Per share data: (pro forma)(2) | | | | | | | | | | | | | | | | | | | | | | | | | | | | | | | | | | | | |
Income (loss) from continuing operations attributable to Successor | | | | | | | | | | | | | | | | | | | | | | | | | | | | | | | | | | | | |
Income (loss) from discontinued operations attributable to Successor | | | | | | | | | | | | | | | | | | | | | | | | | | | | | | | | | | | | |
Income (loss) from cumulative effect of accounting change attributable to Successor | | | | | | | | | | | | | | | | | | | | | | | | | | | | | | | | | | | | |
| | | | | | | | | | | | | | | | | | | | | | | | | | | | | | | | | | | | | | | | | | |
Income (loss) per share attributable to Successor | | | | | | | | | | | | | | | | | | | | | | | | | | | | | | | | | | | | |
Basic | | | | | | | | | | | | | | | | | | | | | | | | | | | | | | | | | | | | |
Diluted | | | | | | | | | | | | | | | | | | | | | | | | | | | | | | | | | | | | |
Weighted average shares outstanding | | | | | | | | | | | | | | | | | | | | | | | | | | | | | | | | | | | | |
| | | | Successor | | | | Predecessor(1) | | | Successor | | | | Predecessor(1) | |
| | | Three months
ended March 31, | | Year ended
December 31,
2010 | | | Period
from
August 19
to
December 31,
2009 | | | | | Period from
January 1 to
October 6,
2009 | | | Year ended December 31, | | | Six months
ended June 30, | | Year ended
December 31,
2010 | | | Period
from
August 19
to
December 31,
2009 | | | | | Period from
January 1 to
October 6,
2009 | | | Year ended December 31, | |
| | 2011 | | 2010 | | | | 2008 | | 2007 | | 2006 | | | 2011 | | 2010 | | | | 2008 | | 2007 | | 2006 | |
| | | (dollars in millions, except per share data) | | | | (dollars in millions, except per share data) | | | (dollars in millions, except per share data) | | | | (dollars in millions, except per share data) | |
| | | | | | |
Other financial data: | | | | | | | | | | | | | | | | | | | | | | | | | | | | | | | | | | | | |
Capital expenditures | | $ | 181 | | | $ | 93 | | | $ | 500 | | | $ | 88 | | | | | $ | 321 | | | $ | 771 | | | $ | 577 | | | $ | 560 | | | $ | 292 | | | $ | 179 | | | $ | 500 | | | $ | 88 | | | | | $ | 321 | | | $ | 771 | | | $ | 577 | | | $ | 560 | |
EBITDA(3) | | | 529 | | | | 423 | | | | 1,361 | | | | 129 | | | | | | (514 | ) | | | (211 | ) | | | (384 | ) | | | (3,214 | ) | | | 1,073 | | | | 827 | | | | 1,361 | | | | 129 | | | | | | (514 | ) | | | (211 | ) | | | (384 | ) | | | (3,214 | ) |
Adjusted EBITDA(3) | | | 538 | | | | 456 | | | | 1,633 | | | | 313 | | | | | | (229 | ) | | | 269 | | | | 731 | | | | (114 | ) | | | 1,090 | | | | 900 | | | | 1,633 | | | | 313 | | | | | | (229 | ) | | | 269 | | | | 731 | | | | (114 | ) |
EBITDA margin(4) | | | 13.2 | % | | | 12.4 | % | | | 9.9 | % | | | 3.8 | % | | | | | (6.2% | ) | | | (1.3% | ) | | | (2.0% | ) | | | (16.6% | ) | | | 13.1 | % | | | 12.1 | % | | | 9.9 | % | | | 3.8 | % | | | | | (6.2% | ) | | | (1.3% | ) | | | (2.0% | ) | | | (16.6% | ) |
Adjusted EBITDA margin(4) | | | 13.5 | % | | | 13.4 | % | | | 11.8 | % | | | 9.1 | % | | | | | (2.7% | ) | | | 1.6% | | | | 3.7% | | | | (0.6% | ) | | | 13.3 | % | | | 13.1 | % | | | 11.8 | % | | | 9.1 | % | | | | | (2.7% | ) | | | 1.6% | | | | 3.7% | | | | (0.6% | ) |
Net cash provided by (used in) operating activities | | | 156 | | | | 246 | | | | 1,142 | | | | 159 | | | | | | (257 | ) | | | 455 | | | | (98 | ) | | | 9 | | | | 499 | | | | 626 | | | | 1,142 | | | | 159 | | | | | | (257 | ) | | | 455 | | | | (98 | ) | | | 9 | |
Net cash provided by (used in) investing activities | | | 433 | | | | (98 | ) | | | (911 | ) | | | 885 | | | | | | (1,052 | ) | | | (958 | ) | | | (530 | ) | | | (554 | ) | | | 311 | | | | (260 | ) | | | (911 | ) | | | 885 | | | | | | (1,052 | ) | | | (958 | ) | | | (530 | ) | | | (554 | ) |
Net cash provided by (used in) financing activities | | | (2,204 | ) | | | 52 | | | | (126 | ) | | | 2,062 | | | | | | 315 | | | | 465 | | | | (58 | ) | | | (122 | ) | | | (2,757 | ) | | | (47 | ) | | | (126 | ) | | | 2,062 | | | | | | 315 | | | | 465 | | | | (58 | ) | | | (122 | ) |
| | | | Successor | | | | Predecessor(1) | | | Successor | | | | Predecessor(1) | |
| | | As of
March 31,
2011 | | As of
December 31,
2010 | | As of
December 31,
2009 | | | | As of
December 31,
2008 | | As of
December 31,
2007 | | As of
December 31,
2006 | | | As of
June 30,
2011 | | As of
December 31,
2010 | | As of
December 31,
2009 | | | | As of
December 31,
2008 | | As of
December 31,
2007 | | As of
December 31,
2006 | |
| | | (dollars in millions) | | | | (dollars in millions) | | | (dollars in millions) | | | | (dollars in millions) | |
Balance sheet and employment data: | | | | | | | | | | | | | | | | | | | | | | | | | | | | |
Cash and cash equivalents | | $ | 1,633 | | | $ | 3,219 | | | $ | 3,107 | | | | | $ | 959 | | | $ | 1,036 | | | $ | 1,608 | | | $ | 1,322 | | | $ | 3,219 | | | $ | 3,107 | | | | | $ | 959 | | | $ | 1,036 | | | $ | 1,608 | |
Total assets | | $ | 9,724 | | | $ | 11,082 | | | $ | 10,307 | | | | | $ | 10,306 | | | $ | 13,667 | | | $ | 15,392 | | | $ | 9,627 | | | $ | 11,082 | | | $ | 10,307 | | | | | $ | 10,306 | | | $ | 13,667 | | | $ | 15,392 | |
Total debt | | $ | 2,751 | | | $ | 289 | | | $ | 396 | | | | | $ | 4,229 | | | $ | 3,554 | | | $ | 3,340 | | | $ | 2,236 | | | $ | 289 | | | $ | 396 | | | | | $ | 4,229 | | | $ | 3,554 | | | $ | 3,340 | |
Working capital(5) | | $ | 1,453 | | | $ | 1,059 | | | $ | 1,217 | | | | | $ | 1,838 | | | $ | 2,772 | | | $ | 3,446 | | | $ | 1,444 | | | $ | 1,059 | | | $ | 1,217 | | | | | $ | 1,838 | | | $ | 2,772 | | | $ | 3,446 | |
Liabilities subject to compromise | | $ | — | | | $ | — | | | $ | — | | | | | $ | 14,583 | | | $ | 16,197 | | | $ | 17,416 | | | $ | — | | | $ | — | | | $ | — | | | | | $ | 14,583 | | | $ | 16,197 | | | $ | 17,416 | |
Stockholders’ deficit | | | N/A | | | | N/A | | | | N/A | | | | | $ | (14,266 | ) | | $ | (13,284 | ) | | $ | (12,055 | ) | | | N/A | | | | N/A | | | | N/A | | | | | $ | (14,266 | ) | | $ | (13,284 | ) | | $ | (12,055 | ) |
Owners’ equity (deficit) | | $ | 1,907 | | | $ | 6,099 | | | $ | 5,366 | | | | | | N/A | | | | N/A | | | | N/A | | | $ | 2,242 | | | $ | 6,099 | | | $ | 5,366 | | | | | | N/A | | | | N/A | | | | N/A | |
Global employees | | | 100,630 | | | | 99,700 | | | | 104,800 | | | | | | 146,600 | | | | 169,500 | | | | 171,400 | | | | 101,000 | | | | 99,700 | | | | 104,800 | | | | | | 146,600 | | | | 169,500 | �� | | | 171,400 | |
| (1) | The Predecessor adopted the accounting guidance in FASB ASC 852,Reorganizations, effective October 8, 2005 and has segregated in the financial statements for all reporting periods subsequent to such date and through the consummation of the transactions pursuant to the Modified Plan (as defined in “Note 1. General and Acquisition of Predecessor Businesses” to the audited consolidated financial statements included herein), transactions and events that were directly associated with the reorganization from the ongoing operations of the business. Our consolidated financial statements are not comparable to the consolidated financial statements of the Predecessor due to the effects of the consummation of the Modified Plan and the change in the basis of presentation. For more information, please refer to “Management’s Discussion and Analysis of Financial Condition and Results of Operations.” |
| (2) | Reflects issuance of ordinary shares in exchange for Delphi Automotive LLP membership interests and ordinary shares in this offering. |
| (3) | Our management utilizes EBITDA to evaluate performance. EBITDA was used as a performance indicator for the three-monthssix months ended March 31,June 30, 2011. |
Through December 31, 2010, our management relied on Adjusted EBITDA as a key performance measure. Our management believed that Adjusted EBITDA was a meaningful measure of performance and it was used by management and the Board of Managers of Delphi Automotive LLP to analyze Company and stand-alone segment operating performance and for planning and forecasting purposes. Effective January 1, 2011, our management began utilizing EBITDA as a key performance measure because our restructuring was substantially completed in 2010. EBITDA and Adjusted EBITDA should not be considered substitutes for results prepared in accordance with U.S. GAAP and should not be considered alternatives to net income (loss) attributable to Successor/Predecessor, which is the most directly comparable financial measure to EBITDA and Adjusted EBITDA that is in accordance with U.S. GAAP. EBITDA and Adjusted EBITDA, as determined and measured by us, should also not be compared to similarly titled measures reported by other companies.
In the threesix months ended March 31,June 30, 2011, we reached a final customer commercial settlement that resulted in an unusual warranty expense of $76 million. This amount adversely affected EBITDA and Adjusted EBITDA in such period.
The reconciliation of Adjusted EBITDA to EBITDA includes other transformation and rationalization costs related to 1) the implementation of information technology systems to support finance, manufacturing and product development initiatives, 2) certain plant consolidations and closures costs and 3) consolidation of many staff administrative functions into a global business service group. The reconciliation of EBITDA and Adjusted EBITDA to net income (loss) attributable to Successor/Predecessor follows:
| | | | Successor | | | | Predecessor(1) | | | Successor | | | | Predecessor(1) | |
| | | Three months
ended March 31, | | Year ended
December 31,
2010 | | | Period from
August 19
to December 31,
2009 | | | | | Period from
January 1 to
October 6,
2009 | | | Year ended December 31, | | | Six months
ended June 30, | | Year ended
December 31,
2010 | | | Period from
August 19
to December 31,
2009 | | | | | Period from
January 1 to
October 6,
2009 | | | Year ended December 31, | |
| | | 2011 | | 2010 | | 2008 | | 2007 | | 2006 | | | 2011 | | 2010 | | 2008 | | 2007 | | 2006 | |
| | | (dollars in millions) | | | | (dollars in millions) | | | (dollars in millions) | | | | (dollars in millions) | |
Adjusted EBITDA | | $ | 538 | | | $ | 456 | | | $ | 1,633 | | | $ | 313 | | | | | $ | (229 | ) | | $ | 269 | | | $ | 731 | | | $ | (114 | ) | | $ | 1,090 | | | | 900 | | | $ | 1,633 | | | $ | 313 | | | | | $ | (229 | ) | | $ | 269 | | | $ | 731 | | | $ | (114 | ) |
Transformation and rationalization charges: | | | | | | | | | | | | | | | | | | | | | | | | | | | | | | | | | | | | |
Employee termination benefits and other exit costs | | | (9 | ) | | | (26 | ) | | | (224 | ) | | | (126 | ) | | | | | (235 | ) | | | (326 | ) | | | (301 | ) | | | (242 | ) | | | (17 | ) | | | (56 | ) | | | (224 | ) | | | (126 | ) | | | | | (235 | ) | | | (326 | ) | | | (301 | ) | | | (242 | ) |
Other transformation and rationalization costs | | | — | | | | (7 | ) | | | (48 | ) | | | (58 | ) | | | | | (50 | ) | | | (154 | ) | | | (814 | ) | | | (2,858 | ) | | | — | | | | (17 | ) | | | (48 | ) | | | (58 | ) | | | | | (50 | ) | | | (154 | ) | | | (814 | ) | | | (2,858 | ) |
| | | | | | | | | | | | | | | | | | | | | | | | | | | | | | | | | | | | | | | | | | | | | | | | | | | | |
EBITDA | | $ | 529 | | | $ | 423 | | | $ | 1,361 | | | $ | 129 | | | | | $ | (514 | ) | | $ | (211 | ) | | $ | (384 | ) | | $ | (3,214 | ) | | $ | 1,073 | | | $ | 827 | | | $ | 1,361 | | | $ | 129 | | | | | $ | (514 | ) | | $ | (211 | ) | | $ | (384 | ) | | $ | (3,214 | ) |
| | | | | | | | | | | | | | | | | | | | | | | | | | | | | | | | | | | | | | | | | | | | | | | | | | | | |
Depreciation and amortization | | | (117 | ) | | | (99 | ) | | | (421 | ) | | | (139 | ) | | | | | (540 | ) | | | (822 | ) | | | (871 | ) | | | (883 | ) | | | (233 | ) | | | (206 | ) | | | (421 | ) | | | (139 | ) | | | | | (540 | ) | | | (822 | ) | | | (871 | ) | | | (883 | ) |
Goodwill impairment charges | | | — | | | | — | | | | — | | | | — | | | | | | — | | | | (325 | ) | | | — | | | | — | | | | — | | | | — | | | | — | | | | — | | | | | | — | | | | (325 | ) | | | — | | | | — | |
Discontinued operations | | | — | | | | — | | | | — | | | | — | | | | | | (64 | ) | | | (67 | ) | | | (302 | ) | | | 57 | | | | — | | | | — | | | | — | | | | — | | | | | | (64 | ) | | | (67 | ) | | | (302 | ) | | | 57 | |
| | | | | | | | | | | | | | | | | | | | | | | | | | | | | | | | | | | | | | | | | | | | | | | | | | | | |
Operating income (loss) | | $ | 412 | | | $ | 324 | | | $ | 940 | | | $ | (10 | ) | | | | $ | (1,118 | ) | | $ | (1,425 | ) | | $ | (1,557 | ) | | $ | (4,040 | ) | | $ | 840 | �� | | $ | 621 | | | $ | 940 | | | $ | (10 | ) | | | | $ | (1,118 | ) | | $ | (1,425 | ) | | $ | (1,557 | ) | | $ | (4,040 | ) |
| | | | | | | | | | | | | | | | | | | | | | | | | | | | | | | | | | | | | | | | | | | | | | | | | | | | |
Interest expense | | | (6 | ) | | | (8 | ) | | | (30 | ) | | | (8 | ) | | | | | — | | | | (434 | ) | | | (764 | ) | | | (423 | ) | | | (47 | ) | | | (16 | ) | | | (30 | ) | | | (8 | ) | | | | | — | | | | (434 | ) | | | (764 | ) | | | (423 | ) |
Other income, net | | | 3 | | | | 2 | | | | 34 | | | | (17 | ) | | | | | 24 | | | | 9 | | | | 47 | | | | 39 | | |
Other income (expense), net | | | | (1 | ) | | | 2 | | | | 34 | | | | (17 | ) | | | | | 24 | | | | 9 | | | | 47 | | | | 39 | |
Reorganization items | | | — | | | | — | | | | — | | | | — | | | | | | 10,210 | | | | 5,147 | | | | (163 | ) | | | (92 | ) | | | — | | | | — | | | | — | | | | — | | | | | | 10,210 | | | | 5,147 | | | | (163 | ) | | | (92 | ) |
| | | | | | | | | | | | | | | | | | | | | | | | | | | | | | | | | | | | | | | | | | | | | | | | | | | | |
Income from continuing operations before income taxes and equity income | | | 409 | | | | 318 | | | | 944 | | | | (35 | ) | | | | | 9,116 | | | | 3,297 | | | | (2,437 | ) | | | (4,516 | ) | | | 792 | | | | 607 | | | | 944 | | | | (35 | ) | | | | | 9,116 | | | | 3,297 | | | | (2,437 | ) | | | (4,516 | ) |
Income tax (expense) benefit | | | (116 | ) | | | (85 | ) | | | (258 | ) | | | 27 | | | | | | 311 | | | | (163 | ) | | | 547 | | | | (115 | ) | | | (189 | ) | | | (147 | ) | | | (258 | ) | | | 27 | | | | | | 311 | | | | (163 | ) | | | 547 | | | | (115 | ) |
Equity income (loss), net of tax | | | 17 | | | | 2 | | | | 17 | | | | 5 | | | | | | (36 | ) | | | 29 | | | | 35 | | | | 33 | | | | 23 | | | | 8 | | | | 17 | | | | 5 | | | | | | (36 | ) | | | 29 | | | | 35 | | | | 33 | |
Loss from discontinued operations, net of tax | | | — | | | | — | | | | — | | | | — | | | | | | (44 | ) | | | (97 | ) | | | (1,142 | ) | | | (835 | ) | | | — | | | | — | | | | — | | | | — | | | | | | (44 | ) | | | (97 | ) | | | (1,142 | ) | | | (835 | ) |
| | | | | | | | | | | | | | | | | | | | | | | | | | | | | | | | | | | | | | | | | | | | | | | | | | | | |
Net income (loss) | | $ | 310 | | | $ | 235 | | | $ | 703 | | | $ | (3 | ) | | | | $ | 9,347 | | | $ | 3,066 | | | $ | (2,997 | ) | | $ | (5,433 | ) | | $ | 626 | | | $ | 468 | | | $ | 703 | | | $ | (3 | ) | | | | $ | 9,347 | | | $ | 3,066 | | | $ | (2,997 | ) | | $ | (5,433 | ) |
Net income attributable to noncontrolling interest | | | 19 | | | | 20 | | | | 72 | | | | 15 | | | | | | 29 | | | | 29 | | | | 68 | | | | 34 | | | | 37 | | | | 39 | | | | 72 | | | | 15 | | | | | | 29 | | | | 29 | | | | 68 | | | | 34 | |
Cumulative effect of accounting change, net of tax | | | — | | | | — | | | | — | | | | — | | | | | | — | | | | — | | | | — | | | | 3 | | | | — | | | | — | | | | — | | | | — | | | | | | — | | | | — | | | | — | | | | 3 | |
| | | | | | | | | | | | | | | | | | | | | | | | | | | | | | | | | | | | | | | | | | | | | | | | | | | | |
Net income attributable to Successor/Predecessor | | $ | 291 | | | $ | 215 | | | $ | 631 | | | $ | (18 | ) | | | | $ | 9,318 | | | $ | 3,037 | | | $ | (3,065 | ) | | $ | (5,464 | ) | | $ | 589 | | | $ | 429 | | | $ | 631 | | | $ | (18 | ) | | | | $ | 9,318 | | | $ | 3,037 | | | $ | (3,065 | ) | | $ | (5,464 | ) |
| | | | | | | | | | | | | | | | | | | | | | | | | | | | | | | | | | | | | | | | | | | | | | | | | | | | |
| (4) | EBITDA margin is defined as EBITDA as a percentage of revenues. Adjusted EBITDA margin is defined as Adjusted EBITDA as a percentage of revenues. |
| (5) | Working capital is calculated herein as accounts receivable plus inventories less accounts payable. |
| (6) | Excludes temporary and contract workers. As of June 30, 2011, we employed approximately 38,000 temporary and contract workers. |
MANAGEMENT’S DISCUSSION AND ANALYSIS
OF FINANCIAL CONDITION AND RESULTS OF OPERATIONS
The following management’s discussion and analysis of financial condition and results of operations (“MD&A”) is intended to help you understand our business operations and financial condition.
Overview
We are a leading global vehicle components manufacturer and provide electrical and electronic, powertrain, safety and thermal technology solutions to the global automotive and commercial vehicle markets. We are one of the largest vehicle component manufacturers, and our customers include the 25 largest automotive OEMs in the world.
Within the MD&A, for the periods from August 19, 2009 to December 31, 2009, the year ended December 31, 2010 and the three and six months ended March 31,June 30, 2011, references to “Delphi,” the “Company,” the “Successor,” “we,” “us” or “our” refer to Delphi Automotive LLP and its subsidiaries. For the year ended December 31, 2008 and for the period from January 1, 2009 to October 6, 2009, references to the “Predecessor” refer to the former Delphi Corporation.
On August 19, 2009, Delphi Automotive LLP, a limited liability partnership organized under the laws of England and Wales, was formed for the purpose of acquiring certain assets and subsidiaries of the former Delphi Corporation, our Predecessor, which, along with certain of its U.S. subsidiaries, had filed voluntary petitions for bankruptcy in October 2005. On October 6, 2009, Delphi Automotive LLP acquired the major portion of the business of the Predecessor, other than the global steering business, the U.S. manufacturing facilities in which the hourly employees were represented by the UAW and certain non-productive U.S. assets, and Delphi Automotive LLP issued membership interests to a group of investors consisting of lenders to the Predecessor, GM and the PBGC. For additional information see “Note 1. General and Acquisition of Predecessor Business” to the audited consolidated financial statements included herein.
Our improved total net sales during 2010 and the first quarter ofsix months ended June 30, 2011 reflect increased OEM production volumes as compared to prior periods.the respective period of 2010. Global OEM production increased approximately 6%2% for the threesix months ended March 31,June 30, 2011 versus the corresponding period in 2010, and2010. The increase reflected continued improvements in OEM production volumes reflectreflecting the stabilization of the global economy. However, currenteconomy offset by global OEM production decreases of 3% for the three months ended June 30, 2011 versus 2010 as a result of the Japan earthquake and tsunami. Excluding the decrease in production in Japan and Japanese OEM production in North America, global OEM production increased 4% and 9% for the three and six months ended June 30, 2011 as compared to the three and six month periods ended June 30, 2010, and, as further described below, we have not been significantly impacted by the Japan earthquake and tsunami. Current OEM production volumes in North America and Western Europe continue to be substantially less than OEM production volumes prior to the disruptions in the economic and credit markets experienced in 2008 and 2009. As a result of the significant restructuring actions implemented by the Predecessor and continued by us in 2010, our reduced cost structure is enabling us to translate the total net sales growth achieved in the first quartersix months of 2011 into strong gross margin and improved operating earnings. While we continue to operate in a cyclical industry that is impacted by movements in the macro economy, our strong balance sheet coupled with our reduced cost structure position us to capitalize on further strengthening of the global economy and continued improvements in OEM production volumes.
Significant issues affected the Predecessor’s financial performance in 2008 and 2009, including a depressed global vehicle production environment for OEMs, pricing pressures and increasingly volatile commodity prices. In addition, the Predecessor was adversely impacted by U.S. labor legacy liabilities, which included noncompetitive wage and benefit levels and restrictive collectively-bargained labor agreement provisions which historically have inhibited the Predecessor’s responsiveness to market conditions, including exiting non-strategic, non-profitable operations or flexing the size of the unionized workforce when volume decreases. Although the
2006 UAW and International Union of Electronic, Electrical, Salaried, Machine and Furniture Workers-Communication Workers of America (“IUE-CWA”) U.S. employee workforce transition programs and the U.S. labor settlement agreements entered into in 2007, together with the effectiveness of the Amended GSA and the Amended MRA (both as defined and further discussed in “Note 3. Elements of Predecessor Transformation Plan” to the audited consolidated financial statements included herein), allowed the Predecessor to begin
reducing its legacy labor liabilities, transitioning its workforce to more competitive wage and benefit levels and exiting non-core product lines, these benefits were more than offset by the reductions in vehicle production. Also, during 2008 and 2009, the Predecessor’s operational challenges intensified as a result of the continued downturn in general economic conditions, including reduced consumer spending and confidence, high oil prices and the credit market crisis, all of which resulted in global vehicle manufacturers reducing production and taking other restructuring actions.
We benefited from the restructuring initiatives implemented throughout the last several years and in particular, in 2009 from the restructuring of the business that took place through the acquisition of the Predecessor’s global steering business and the UAW manufacturing facilities by GM, together with its subsidiaries and affiliates, in the U.S. as of the Acquisition Date, as defined and further discussed below. In addition, we benefited from the increase in OEM production volumes in the fourth quarter of 2009. Our results of operations are the result of the improvement in the cost structure and the operating leverage we can now employ with improvements in OEM production volumes versus the Predecessor. While production volume levels did improve in 2010 as compared to the production volume levels experienced in 2009, we may continue to face challenges, with production volumes globally still significantly lower than 2007 due to the lingering effects from the disruptions in the economy and credit markets in 2008 and 2009 and volatile commodity prices. Additionally, as a result of the Acquisition (as defined below), beginning in 2010, we incurred and expect to incur incremental, annual non-cash amortization charges of approximately $70 million related to the recognition of acquired intangible assets.
We typically experience fluctuations in revenue due to changes in OEM production schedules, vehicle sales mix and the net of new and lost business (which we refer to collectively as volume), increased prices attributable to escalation clauses in our supply contracts for recovery of increased commodity costs (which we refer to as commodity pass-through), fluctuations in foreign currency exchange rates (which we refer to as FX), contractual reductions of the sales price to the OEM (which we refer to as contractual price reductions) and engineering changes. Changes in sales mix can have either favorable or unfavorable impact on revenue. Such changes can be the result of shifts in regional growth, shifts in OEM sales demand, as well as shifts in consumer demand related to vehicle segment purchases and content penetration. For instance, a shift in sales demand favoring a particular OEM’s vehicle model for which we do not have a supply contract may negatively impact our revenue. A shift in regional sales demand toward certain markets could favorably impact the sales of those of our customers that have a large market share in those regions, which in turn would be expected to have a favorable impact on our revenue.
We typically experience (as described below) fluctuations in operating income due to:
Volume, net of contractual price reductions – changes in volume offset by contractual price reductions (which typically range from 1% to 3% of net sales);
Operational performance – changes to costs for materials and commodities or manufacturing variances; and
Other – including restructuring costs and any remaining variances not included in Volume, net of contractual price reductions or Operational performance.
We expect commodity cost volatility, particularly related to copper, aluminum and petroleum-based resin products, to have a continual impact on future earnings and/or operating cash flows. As such, we continually seek to mitigate our material-related cost exposures using a number of approaches, including combining purchase requirements with customers and/or other suppliers, using alternate suppliers or product designs, negotiating commodity cost contract escalation clauses into our vehicle manufacturer supply contracts, and hedging.
Trends, Uncertainties and Opportunities
Japan earthquake and tsunami. Our operations in Japan, which include primarily leased office space, suffered minor damage and interruption as a result of the earthquake and tsunami on March 11, 2011. We continue to assess the impact of the earthquake and resulting events in Japan on the supplier and customer base. Although we have no production facilities in Japan, we and our suppliers do obtain material and components from suppliers located in Japan. Approximately 200 of our suppliers are located in Japan, with approximately 20 located within 100 miles of the earthquake’s epicenter. While there have been disruptions across the industry, to date there have been only minor disruptions impacting us. We arecontinue to closely monitoringmonitor the availability of critical parts and customer schedules. As the situation in Japan continues to develop, we expect that supply interruptions may impact our operations and/or our customers’ vehicle production. If an alternate supply of key material or components is not available, the resultingThe second quarter reduction in vehicleOEM production could adversely affect our financial conditionschedules has not had a material adverse impact on us and operating results. However, to date we have been able to obtain all key components from alternate suppliers elsewhere.suppliers. In addition, to date no significant future supply or customer disruptions have been identified.
Rate of economic recovery. Our business is directly related to automotive sales and automotive vehicle production by our customers. Automotive sales depend on a number of factors, including economic conditions. The economy is recovering slowly from a recession that began in late 2007 and became increasingly severe with the global credit crisis in 2008 and 2009. The weaker economic conditions led to a substantial industry-wide decline in vehicle sales in 2008 and 2009. However, global automotive vehicle production increased over 20% from 2009 to 2010 and is expected to increase by an additional 5% in 2011. Any future economic declines that result in a significant reduction in automotive sales and production by our customers would have an adverse effect on our business, results of operations and financial condition. Additionally, volatility in oil and gasoline prices negatively impacts consumer confidence and automotive sales, and the mix of future sales (from trucks and sport utility vehicles toward smaller, fuel-efficient passenger cars). While our diversified customer and geographic revenue base have well positioned us to withstand the impact of industry downturns and benefit from industry upturns, shifts to vehicles with less content would adversely impact our profitability.
Emerging markets growth. Rising income levels in the emerging markets of China, Brazil, India and Russia are resulting in stronger growth rates in these markets. Our strong global presence and presence in these markets have positioned us to experience above-market growth rates. We continue to expand our established presence in emerging markets, positioning us to benefit from the expected growth opportunities in these regions. We will accomplish this by capitalizing on our long-standing relationships with the global OEMs and further enhancing our positions with the emerging market OEMs to continue expanding our worldwide leadership. We will continue to build upon our extensive geographic reach to capitalize on the fast-growing automotive markets particularly China, Brazil, India and Russia. We believe that our presence in low cost countries positions us to realize incremental margin improvements as the global balance of automotive production shifts towards the emerging markets.
We have a strong presence in China, where we have operated for nearly 20 years. All of our business segments have operations and sales in China. As a result, we have well-established relationships with all of the major OEMs in China. We generated approximately $1.8 billion in revenue from China in 2010. With only 21 of our 33 offered products currently locally manufactured, we believe we have the opportunity to expand additional product lines into China, and as a result, we see further growth potential.
Market driven products. Our product offerings satisfy the OEMs’ need to meet increasingly stringent government regulations and fulfill consumer preferences for products that address the mega trends of Safe, Green and Connected, leading to increased content per vehicle, greater profitability and higher margins. With these offerings, we are well-positioned to capitalize on demand for increased safety, fuel efficiency, emissions control and connectivity to the global information network. There has been a substantial increase in vehicle content and electrification requiring a complex and reliable electrical architecture and systems to operate, such as hybrid power electronics, electrical vehicle monitoring, lane departure warning systems, integrated electronic displays,
navigation systems and consumer electronics. Our ability to design a reliable electrical architecture that optimizes power distribution and/or consumption is key to satisfying the OEMs’ need to reduce emissions while
continuing to meet the demands of consumers. Additionally, our Powertrain Systems and Thermal Systems segments are also focused on addressing the demand for increased fuel efficiency and emission control by controlling fuel consumption and heat dissipation, which are principal factors influencing fuel efficiency and emissions.
Global capabilities. Many OEMs are adopting global vehicle platforms to increase standardization, reduce per unit cost and increase capital efficiency and profitability. As a result, OEMs are selecting suppliers that have the capability to manufacture products on a worldwide basis as well as the flexibility to adapt to regional variations. Suppliers with global scale and strong design, engineering and manufacturing capabilities, are best positioned to benefit from this trend. Our global footprint enables us to serve the global OEMs on a worldwide basis along with gaining market share with the emerging market OEMs. This regional model has largely migrated to service the North American market fromout of Mexico, the South American market fromout of Brazil, the European market fromout of Eastern Europe and North Africa and the Asia Pacific market fromout of China.
Product development. The automotive component supply industry is highly competitive, both domestically and internationally. Our ability to anticipate changes in technology and regulatory standards and to successfully develop and introduce new and enhanced products on a timely basis will be a significant factor in our ability to remain competitive. To compete effectively in the automotive supply industry, we must be able to launch new products to meet our customers’ demands in a timely manner. Our innovative technologies and robust global engineering and development capabilities have well positioned us to meet the increasingly stringent vehicle manufacturer demands.
OEMs are also increasingly looking to their suppliers to simplify vehicle design and assembly processes to reduce costs. As a result, suppliers that sell vehicle components directly to manufacturers (Tier I suppliers) have assumed many of the design, engineering, research and development and assembly functions traditionally performed by vehicle manufacturers. Suppliers that can provide fully-engineered solutions, systems and pre-assembled combinations of component parts are positioned to leverage the trend toward system sourcing.
Engineering, design & development. Our history and culture of innovation have enabled us to develop significant intellectual property and design and development expertise to provide advanced technology solutions that meet the demands of our customers. We have a team of more than 16,000 scientists, engineers and technicians focused on developing leading product solutions for our key markets, located at 15 major technical centers in Brazil, China, France, Germany, India, Luxembourg, Mexico, Poland, South Korea, the United Kingdom and the United States. We invest approximately $1 billion annually in engineering to maintain our portfolio of innovative products, and currently own approximately 6,000 patents. We also encourage “open innovation” and collaborate extensively with peers in the industry, government agencies and academic institutions. Our technology competencies are recognized by both customers and government agencies, who have co-invested approximately $300 million of additional funds annually in new product development, increasing our total spend accordingly, accelerating the pace of innovation and reducing the risk associated with successful commercialization of technological breakthroughs.
In the past, suppliers often incurred the initial cost of engineering, designing and developing automotive component parts, and recovered their investments over time by including a cost recovery component in the price of each part based on expected volumes. Recently, we and many other suppliers have negotiated for cost recovery payments independent of volumes. This trend reduces our economic risk.
Pricing.Cost-cutting initiatives adopted by our customers result in increased downward pressure on pricing. Our customer supply agreements generally require step-downs in component pricing over the periods of production and OEMs have historically possessed significant leverage over their outside suppliers because the automotive component supply industry is fragmented and serves a limited number of automotive OEMs. Our
profitability depends in part on our ability to generate sufficient production cost savings in the future to offset price reductions.
In 2010, we largely completed our restructuring activities, resulting in a lower fixed cost base, improved manufacturing footprint and reduced overhead. We dramatically reduced our U.S. and Western European footprints, realigned our selling, general and administrative cost structure and increased the variable nature of our employee base. As a result, 91% of our hourly workforce is located in low cost countries. Furthermore, we have substantial operational flexibility by leveraging a large workforce of temporary workers, which represented approximately 30% of the hourly workforce as of March 31,June 30, 2011. We are focused on maintaining a low fixed cost base to minimize our EBITDA breakeven, which we estimate to be 30% below the current production volumes, assuming constant product mix and based on 2010 results. We believe that our lean cost structure will allow us to remain profitable at all points of the traditional vehicle industry production cycle.
Efficient use of capital. The global vehicle components industry is generally capital intensive and a portion of a manufacturer’ssupplier’s capital equipment is frequently utilized for specific customer programs. Lead times for procurement of capital equipment are long and typically exceed start of production by one to two years. Substantial advantages exist for suppliers that can leverage their prior investments in capital equipment or amortize the investment over higher volume global customer programs.
Industry consolidation.Consolidation among worldwide suppliers is expected to continue as suppliers seek to achieve operating synergies and value stream efficiencies, acquire complementary technologies, and build stronger customer relationships as OEMs continue to expand globally. We believe companies with strong balance sheets and financial discipline are in the best position to take advantage of the industry consolidation trend. We have a strong balance sheet with gross debt of $2.5approximately $2.2 billion and substantial liquidity of approximately $2.5 billion of cash and cash equivalents and available financing under our revolving credit facilityRevolving Credit Facility (as defined in “—Liquidity and Capital Resources” below) as of March 31,June 30, 2011, (in each case after giving effect to the modification of our Credit Agreement and issuance of Senior Notes on May 17, 2011), and no significant U.S. defined benefit or OPEB liabilities. We intend to maintain strong financial discipline targeting industry-leading earnings growth, cash flow generation and return on invested capital and to maintain sufficient liquidity to sustain our financial flexibility throughout the industry cycle.
Disposition of the Predecessor and Acquisition Accounting
On October 6, 2009 (the “Acquisition Date”), the Predecessor (i) consummated the transactions contemplated by the Modified Plan (as defined in “Note 1. General and Acquisition of Predecessor Businesses” to the audited consolidated financial statements included herein) and (ii) exited chapter 11 as DPH Holdings Corp. and its subsidiaries and affiliates (“DPHH”), except that two of the Predecessor’s debtor subsidiaries became subsidiaries of Delphi Automotive LLP. A summary of significant terms of the Modified Plan follows:
We acquired the businesses (other than the global steering business and the manufacturing facilities in the U.S. at which the hourly employees are represented by the UAW of the Predecessor pursuant to the master disposition agreement (including all schedules and exhibits thereto, the “MDA”), and received $1,833 million from GM, of which $1,689 million was received on the Acquisition Date and $144 million was received during the Successor period from August 19 to December 31, 2009, and $209 million, net from certain of the debtor-in-possession (“DIP”) lenders to the Predecessor (collectively, the “Acquisition”).
GM acquired substantially all of the Predecessor’s global steering business and the manufacturing facilities in the U.S. at which the hourly employees were represented by the UAW.
The Predecessor’s debtor-in-possession financing was settled.
The Predecessor’s liabilities subject to compromise were extinguished.
If cumulative distributions to the members of Delphi Automotive LLP under certain provisions of our limited liability partnership agreement exceed $7.2 billion, we, as disbursing agent on behalf of DPHH, are required to pay to the holders of allowed general unsecured claims against the Predecessor, $32.50 for every $67.50 in excess of $7.2 billion distributed to the members, up to a maximum of $300 million.
| are required to pay to the holders of allowed general unsecured claims against the Predecessor, $32.50 for every $67.50 in excess of $7.2 billion distributed to the members, up to a maximum of $300 million.
|
The Predecessor’s equity holders did not receive recoveries on their claims.
As a result of the Acquisition, we acquired the major portion of the business of the Predecessor and this business constituted the entirety of the operations of the Successor. Accordingly, as required under the applicable accounting guidance, the financial information set forth herein reflects the consolidated results of operations of the Successor for the year ended December 31, 2010 and the period from its incorporation on August 19, 2009 to December 31, 2009 and of the Predecessor for the period from January 1, 2009 to October 6, 2009 and the year ended December 31, 2008. Delphi Automotive LLP had no material or substantive transactions from its organization on August 19, 2009 to the Acquisition Date.
In 2009, the Predecessor recognized a gain of approximately $10.2 billion for reorganization items as a result of the process of reorganizing the Debtors (as defined and further discussed in “Note 1. General and Acquisition of Predecessor Businesses” to the audited consolidated financial statements included herein) under chapter 11 of the United States Bankruptcy Code. This gain reflects the extinguishment of liabilities subject to compromise, OPEB settlement and the sale/ disposition of the Predecessor, offset by the PBGC termination of the U.S. pension plans and professional fees directly related to the reorganization.
We have recorded the assets acquired and the liabilities assumed from the Predecessor at estimated fair values in accordance with the guidance in FASB ASC 820,Fair Value Measurements and Disclosures. The fair values were estimated based on valuations performed by an independent valuation specialist utilizing three generally accepted business valuation approaches. For additional information see “Note 1. General and Acquisition of Predecessor Businesses” to the audited consolidated financial statements included herein.
In connection with the Acquisition, we did not acquire all of the assets or assume all of the liabilities of the Predecessor. As noted above, the assets we acquired and the liabilities we assumed from the Predecessor were generally recorded at fair value, resulting in a change from the Predecessor’s basis. Accordingly, our consolidated financial statements are not comparable to the consolidated financial statements of the Predecessor due to the effects of the consummation of the Modified Plan. For these reasons, we do not generally present financial information on a combined basis for the Predecessor period from January 1 to October 6, 2009 and the Successor period from August 19 to December 31, 2009 (“Full Year 2009”), except as noted below. We have compared consolidated net sales and operating income before depreciation and amortization, including long-lived asset and goodwill impairment (“EBITDA”) of the Successor for the year ended December 31, 2010 to the total net sales and Adjusted EBITDA for the Full Year 2009, and the Full Year 2009 net sales and EBITDA to net sales and EBITDA of the Predecessor for the year ended December 31, 2008. We believe these comparisons are most meaningful and useful in providing a thorough understanding of the financial statements. Where applicable, “Operations Not Acquired” is included in the tables below explaining the variance attributable to the acquisition by GM on October 6, 2009 of the manufacturing facilities in the U.S. at which the hourly employees were represented by the UAW.
Consolidated Results of Operations
Three and Six Months Ended March 31,June 30, 2011 versus Three and Six Months Ended March 31,June 30, 2010
Consolidated Results of Operations
The results of operations for the three and six months ended March 31,June 30, 2011 and 2010 were as follows:
| | | | Three months ended March 31, | | | Three months ended June 30, | | | | Six months ended June 30, | |
| | | 2011 | | | | 2010 | | | | Favorable/
(unfavorable) | | | 2011 | | | | 2010 | | | | Favorable/
(unfavorable) | | | | 2011 | | | | 2010 | | | | Favorable/
(unfavorable) | |
| | | (dollars in millions) | | | (dollars in millions) | | | | (dollars in millions) | |
Net sales | | $ | 3,997 | | | | | $ | 3,410 | | | | | $ | 587 | | | $ | 4,213 | | | | | $ | 3,446 | | | | | $ | 767 | | | | | $ | 8,210 | | | | | $ | 6,856 | | | | | $ | 1,354 | |
Cost of sales | | | 3,353 | | | | | | 2,848 | | | | | | (505 | ) | | | 3,518 | | | | | | 2,903 | | | | | | (615 | ) | | | | | 6,871 | | | | | | 5,751 | | | | | | (1,120 | ) |
| | | | | | | | | | | | | | | | | | | | | | | | | | | | | | | | | | | | | | | | | |
Gross margin | | | 644 | | | | 16.1 | % | | | 562 | | | | 16.5 | % | | | 82 | | | | 695 | | | | 16.5 | % | | | 543 | | | | 15.8 | % | | | 152 | | | | | | 1,339 | | | | 16.3 | % | | | 1,105 | | | | 16.1 | % | | | 234 | |
Selling, general and administrative | | | 205 | | | | | | 198 | | | | | | (7 | ) | | | 240 | | | | | | 199 | | | | | | (41 | ) | | | | | 445 | | | | | | 397 | | | | | | (48 | ) |
Amortization | | | 18 | | | | | | 14 | | | | | | (4 | ) | | | 19 | | | | | | 17 | | | | | | (2 | ) | | | | | 37 | | | | | | 31 | | | | | | (6 | ) |
Restructuring | | | 9 | | | | | | 26 | | | | | | 17 | | | | 8 | | | | | | 30 | | | | | | 22 | | | | | | 17 | | | | | | 56 | | | | | | 39 | |
| | | | | | | | | | | | | | | | | | | | | | | | | | | | | | | | | | | | | | | | | |
Operating income | | | 412 | | | | | | 324 | | | | | | 88 | | | | 428 | | | | | | 297 | | | | | | 131 | | | | | | 840 | | | | | | 621 | | | | | | 219 | |
Interest expense | | | (6 | ) | | | | | (8 | ) | | | | | 2 | | | | (41 | ) | | | | | (8 | ) | | | | | (33 | ) | | | | | (47 | ) | | | | | (16 | ) | | | | | (31 | ) |
Other income, net | | | 3 | | | | | | 2 | | | | | | 1 | | |
Other (expense) income, net | | | | (4 | ) | | | | | — | | | | | | (4 | ) | | | | | (1 | ) | | | | | 2 | | | | | | (3 | ) |
| | | | | | | | | | | | | | | | | | | | | | | | | | | | | | | | | | | | | | | | | |
Income before income taxes and equity income | | | 409 | | | | | | 318 | | | | | | 91 | | | | 383 | | | | | | 289 | | | | | | 94 | | | | | | 792 | | | | | | 607 | | | | | | 185 | |
Income tax expense | | | (116 | ) | | | | | (85 | ) | | | | | (31 | ) | | | (73 | ) | | | | | (62 | ) | | | | | (11 | ) | | | | | (189 | ) | | | | | (147 | ) | | | | | (42 | ) |
| | | | | | | | | | | | | | | | | | | | | | | | | | | | | | | | | | | | | | | | | |
Income before equity income | | | 293 | | | | | | 233 | | | | | | 60 | | | | 310 | | | | | | 227 | | | | | | 83 | | | | | | 603 | | | | | | 460 | | | | | | 143 | |
Equity income, net of tax | | | 17 | | | | | | 2 | | | | | | 15 | | | | 6 | | | | | | 6 | | | | | | — | | | | | | 23 | | | | | | 8 | | | | | | 15 | |
| | | | | | | | | | | | | | | | | | | | | | | | | | | | | | | | | | | | | | | | | |
Net income | | | 310 | | | | | | 235 | | | | | | 75 | | | | 316 | | | | | | 233 | | | | | | 83 | | | | | | 626 | | | | | | 468 | | | | | | 158 | |
Net income attributable to noncontrolling interest | | | 19 | | | | | | 20 | | | | | | (1 | ) | |
Net income attributable to noncontrolling interests | | | | 18 | | | | | | 19 | | | | | | (1 | ) | | | | | 37 | | | | | | 39 | | | | | | (2 | ) |
| | | | | | | | | | | | | | | | | | | | | | | | | | | | | | | | | | | | | | | | | |
Net income attributable to Delphi | | $ | 291 | | | | | $ | 215 | | | | | $ | 76 | | | $ | 298 | | | | | $ | 214 | | | | | $ | 84 | | | | | $ | 589 | | | | | $ | 429 | | | | | $ | 160 | |
| | | | | | | | | | | | | | | | | | | | | | | | | | | | | | | | | | | | | | | | | |
Total Net Sales
Below is a summary of our total net sales for the three months ended March 31,June 30, 2011 versus March 31,June 30, 2010.
| | | | | | | | | | | | | | | | | | | | | | | | | | | | | | | | | | |
| | | Three months ended March 31, | | | | | Variance due to: | |
| | | 2011 | | | 2010 | | | Favorable/
(unfavorable) | | | | | Volume, net
of
contractual
price
reductions | | | FX | | | Commodity
pass-
through | | | Other | | | Total | |
| | | (in millions) | | | | | (in millions) | |
Total net sales | | $ | 3,997 | | | $ | 3,410 | | | $ | 587 | | | | | $ | 599 | | | $ | 31 | | | $ | 60 | | | $ | (103) | | | $ | 587 | |
| | | | | | | | | | | | | | | | | | | | | | | | | | | | | | | | | | |
| | | Three months ended June 30, | | | | | Variance due to: | |
| | | 2011 | | | 2010 | | | Favorable/
(unfavorable) | | | | | Volume, net
of
contractual
price
reductions | | | FX | | | Commodity
pass-
through | | | Other | | | Total | |
| | | (in millions) | | | | | (in millions) | |
Total net sales | | $ | 4,213 | | | $ | 3,446 | | | $ | 767 | | | | | $ | 477 | | | $ | 240 | | | $ | 75 | | | $ | (25) | | | $ | 767 | |
Total net sales for the three months ended March 31,June 30, 2011 increased 17%22% compared to the three months ended March 31,June 30, 2010. The increase in total net sales resulted primarily from increased volume as a result of improved OEM production schedules in 2011 and favorable foreign currency impacts primarily related to the first quarterEuro.
Below is a summary of our total net sales for the six months ended June 30, 2011 versus June 30, 2010.
| | | | | | | | | | | | | | | | | | | | | | | | | | | | | | | | | | |
| | | Six months ended June 30, | | | | | Variance due to: | |
| | | 2011 | | | 2010 | | | Favorable/
(unfavorable) | | | | | Volume, net
of
contractual
price
reductions | | | FX | | | Commodity
pass-
through | | | Other | | | Total | |
| | | (in millions) | | | | | (in millions) | |
Total net sales | | $ | 8,210 | | | $ | 6,856 | | | $ | 1,354 | | | | | $ | 1,076 | | | $ | 272 | | | $ | 135 | | | $ | (129) | | | $ | 1,354 | |
Total net sales for the six months ended June 30, 2011 increased 20% compared to the six months ended June 30, 2010. The increase in total net sales resulted primarily from increased volume as a result of improved OEM production schedules in 2011. ExcludingOffsetting this increase was a decrease, included in other above, of $86 million related to 2010 sales related toof the occupant protection systems business, which was sold March 31, 2010, sales increased 21% in 2011.2010.
Operating Results
The information below summarizes the operating results for the three and six months ended March 31,June 30, 2011 as compared to the three and six months ended March 31,June 30, 2010.
Cost of Sales
Cost of sales is primarily comprised of material, labor, manufacturing overhead, freight, fluctuations in foreign currency exchange rates, product engineering, design and development expenses, depreciation and
amortization, warranty costs and other operating expenses. Gross margin is revenue less cost of sales and gross margin percentage is gross margin as a percent of net sales. Cost of sales increased $505$615 million for the three months ended March 31,June 30, 2011 compared to the three months ended March 31,June 30, 2010, as summarized below.
| | | | Three months ended March 31, | | | | Variance due to: | | | Three months ended June 30, | | | | Variance due to: | |
| | | 2011 | | 2010 | | Favorable/
(unfavorable) | | | | Volume(1) | | Operational
performance | | | Other | | Total | | | 2011 | | 2010 | | Favorable/
(unfavorable) | | | | Volume(1) | | Operational
performance | | | Other | | Total | |
| | | (dollars in millions) | | | | (in millions) | | | (dollars in millions) | | | | (in millions) | |
Cost of sales | | $ | 3,353 | | | $ | 2,848 | | | $ | (505 | ) | | | | $ | (409 | ) | | $ | 11 | | | $ | (107) | | | $ | (505 | ) | | $ | 3,518 | | | $ | 2,903 | | | $ | (615 | ) | | | | $ | (346 | ) | | $ | 31 | | | $ | (300) | | | $ | (615 | ) |
Gross margin | | $ | 644 | | | $ | 562 | | | $ | 82 | | | | | $ | 183 | | | $ | 20 | | | $ | (121 | ) | | $ | 82 | | | $ | 695 | | | $ | 543 | | | $ | 152 | | | | | $ | 131 | | | $ | 31 | | | $ | (10 | ) | | $ | 152 | |
Gross margin as percentage of net sales | | | 16.1 | % | | | 16.5 | % | | | | | | | | | | | | | | | 16.5 | % | | | 15.8 | % | | | | | | | | | | | | |
| (1) | Presented net of contractual price reductions for gross margin variance. |
The increase in cost of sales was driven by increases in volume and the following items included in other above:
$75 million of increased pass-through commodity costs, which were offset in sales through contract escalation clauses with our customers; and
$205 million due to fluctuations in foreign currency exchange rates.
These increases were partially offset by improved operational performance.
Cost of sales increased $1,120 million for the six months ended June 30, 2011 compared to the six months ended June 30, 2010, as summarized below.
| | | | | | | | | | | | | | | | | | | | | | | | | | | | | | |
| | | Six months ended June 30, | | | | | Variance due to: | |
| | | 2011 | | | 2010 | | | Favorable/
(unfavorable) | | | | | Volume(1) | | | Operational
performance | | | Other | | | Total | |
| | | (dollars in millions) | | | | | (in millions) | |
Cost of sales | | $ | 6,871 | | | $ | 5,751 | | | $ | (1,120 | ) | | | | $ | (762 | ) | | $ | 49 | | | $ | (407 | ) | | $ | (1,120 | ) |
Gross margin | | $ | 1,339 | | | $ | 1,105 | | | $ | 234 | | | | | $ | 314 | | | $ | 49 | | | $ | (129 | ) | | $ | 234 | |
Percentage of net sales | | | 16.3 | % | | | 16.1 | % | | | | | | | | | | | | | | | | | | | | | | |
| (1) | Presented net of contractual price reductions for gross margin variance. |
The increase in cost of sales was driven by increases in volume and the following items in other above:
$76 million due to an unusualincreased warranty expense in 2011 as a result of the March settlement related to certain components supplied by our Powertrain segment;
$60135 million due toof increased pass-through commodity costs, which were partially offset in sales through contract escalation clauses with our customers;
Increased depreciation of fixed assets, including tooling of $12$17 million; and
$37241 million due to fluctuations in foreign currency exchange rates.
These increases were partially offset by improved operational performance as well as $82$74 million related to the divestiture of the occupant protection systems business on March 31, 2010.
Selling, General and Administrative Expense
| | | | Three months ended March 31, | | | Three months ended June 30, | | | | Six months ended June 30, | |
| | | 2011 | | 2010 | | Favorable/
(unfavorable) | | | 2011 | | 2010 | | Favorable/
(unfavorable) | | | | 2011 | | 2010 | | Favorable/
(unfavorable) | |
| | | (dollars in millions) | | | (dollars in millions) | | | | (dollars in millions) | |
Selling, general and administrative expense | | $ | 205 | | | $ | 198 | | | $ | | (7) | | $ | 240 | | | $ | 199 | | | $ | | (41) | | | | $ | 445 | | | $ | 397 | | | $ | | (48) |
Percentage of net sales | | | 5.1 | % | | | 5.8 | % | | | | | 5.7 | % | | | 5.8 | % | | | | | | | 5.4 | % | | | 5.8 | % | | |
Selling, general and administrative expense (“SG&A”) includes administrative expenses, information technology costs and incentive compensation related costs, and continues to declinedeclined as a percent of sales during the first quarter ofthree and six months ended June 30, 2011 compared to 2010 due to maintaining administrative and information technology cost increases at or lower than the positiveincreasing rate of OEM volumes. Increases in SG&A were largely attributable to foreign exchange effects of cost savings initiatives on administrative costs and improved OEM volumes, partially offset by increased accruals for incentive compensation.
Amortization
| | | | | | | | | | | | |
| | | Three months ended March 31, | |
| | | 2011 | | | 2010 | | | Favorable/
(unfavorable) | |
| | | (in millions) | |
Amortization | | $ | 18 | | | $ | 14 | | | $ | | (4) |
| | | | | | | | | | | | | | | | | | | | | | | | | | |
| | | Three months ended June 30, | | | | | Six months ended June 30, | |
| | | 2011 | | | 2010 | | | Favorable/
(unfavorable) | | | | | 2011 | | | 2010 | | | Favorable/
(unfavorable) | |
| | | (in millions) | | | | | (in millions) | |
Amortization | | $ | 19 | | | $ | 17 | | | $ | | (2) | | | | $ | 37 | | | $ | 31 | | | $ | | (6) |
Amortization expense reflects the non-cash charge related to definite-lived intangible assets recognized as part of the Acquisition.
Restructuring
| | | | Three months ended March 31, | | | Three months ended June 30, | | | | | Six months ended June 30, | |
| | | 2011 | | 2010 | | Favorable/
(unfavorable) | | | 2011 | | 2010 | | Favorable/
(unfavorable) | | | | | 2011 | | 2010 | | Favorable/
(unfavorable) | |
| | | (dollars in millions) | | | (dollars in millions) | | | | | (dollars in millions) | |
Restructuring | | $ | 9 | | | $ | 26 | | | $ | 17 | | | $ | 8 | | | $ | 30 | | | $ | 22 | | | | | $ | 17 | | | $ | 56 | | | $ | 39 | |
Percentage of net sales | | | 0.2 | % | | | 0.8 | % | | | | | 0.2 | % | | | 0.9 | % | | | | | | | 0.2 | % | | | 0.8 | % | | |
The decrease in restructuring expense is due to a decline in workforce reductions and programs related to the rationalization of manufacturing and engineering processes, including plant closures, in the three and six months ended March 31,June 30, 2011 as compared to the three and six months ended March 31,June 30, 2010, as we had largely completed our significant restructuring programs by the end of 2010.
Refer to “Note 7. Restructuring” to the unaudited consolidated financial statements included herein for additional information.
Interest Expense
| | | | | | | | | | | | |
| | | Three months ended March 31, | |
| | | 2011 | | | 2010 | | | Favorable/
(unfavorable) | |
| | | (in millions) | |
Interest expense | | $ | 6 | | | $ | 8 | | | $ | 2 | |
| | | | | | | | | | | | | | | | | | | | | | | | | | |
| | | Three months ended June 30, | | | | | Six months ended June 30, | |
| | | 2011 | | | 2010 | | | Favorable/
(unfavorable) | | | | | 2011 | | | 2010 | | | Favorable/
(unfavorable) | |
| | | (in millions) | | | | | (in millions) | |
Interest expense | | $ | 41 | | | $ | 8 | | | $ | | (33) | | | | $ | 47 | | | $ | 16 | | | $ | | (31) |
The decreaseincrease in interest expense for the three and six months ended March 31,June 30, 2011 as compared to the three and six months ended March 31,June 30, 2010 is due to changes in debt balances, primarily related to various accounts receivable factoring facilitiesthe borrowings under the Credit Agreement and issuance of the Senior Notes, in Europe, which are all accountedconjunction with the redemption of the Class A and Class C membership interests. Refer to “Note 8. Debt” to the unaudited consolidated financial statements included herein for as short-term financings.additional information.
Other (Expense) Income, Net
| | | | | | | | | | | | |
| | | Three months ended March 31, | |
| | | 2011 | | | 2010 | | | Favorable/
(unfavorable) | |
| | | (in millions) | |
Other income, net | | $ | 3 | | | $ | 2 | | | $ | 1 | |
| | | | | | | | | | | | | | | | | | | | | | | | | | |
| | | Three months ended June 30, | | | | | Six months ended June 30, | |
| | | 2011 | | | 2010 | | | Favorable/
(unfavorable) | | | | | 2011 | | | 2010 | | | Favorable/
(unfavorable) | |
| | | (in millions) | | | | | (in millions) | |
Other (expense) income, net | | $ | | (4) | | $ | — | | | $ | | (4) | | | | $ | | (1) | | $ | 2 | | | $ | | (3) |
The increase in other income,expense for the three months ended June 30, 2011 as compared to the three months ended June 30, 2010 was primarily due to a loss on extinguishment of debt of $8 million and impairment of investments in available-for-sale securities of $6 million, offset by a decrease in net isforeign exchange losses related to intercompany loans of $12 million.
The increase in other expense for the six months ended June 30, 2011 as compared to the six months ended June 30, 2010 was primarily due to losses on extinguishment of debt of $17 million and impairment of investments in available-for-sale securities of $6 million, offset by a decrease in net foreign exchange losses related to intercompany loans of $16 million and an increase in interest income of $4 million and net foreign exchange gains related to intercompany loans of $4 million; offset by a debt extinguishment loss of $9$5 million.
Refer to “Note 14. Other (expense) income, net” to the unaudited consolidated financial statements included herein for additional information.
Income Taxes
| | | | | | | | | | | | |
| | | Three months ended March 31, | |
| | | 2011 | | | 2010 | | | Favorable/
(unfavorable) | |
| | | (in millions) | |
Income tax expense | | $ | 116 | | | $ | 85 | | | $ | | (31) |
| | | | | | | | | | | | | | | | | | | | | | | | | | |
| | | Three months ended June 30, | | | | | Six months ended June 30, | |
| | | 2011 | | | 2010 | | | Favorable/
(unfavorable) | | | | | 2011 | | | 2010 | | | Favorable/
(unfavorable) | |
| | | (in millions) | | | | | (in millions) | |
Income tax expense | | $ | 73 | | | $ | 62 | | | $ | | (11) | | | | $ | 189 | | | $ | 147 | | | $ | | (42) |
Our tax rate in both periods is affected by tax rates in the U.S. and non-U.S. jurisdictions, the relative amount of income we earn in such jurisdictions and the relative amount of losses for which no tax benefit was
recognized due to a valuation allowance. Income tax expense in the threesix months ended March 31,June 30, 2011 was also impacted unfavorably by a $10 million withholding tax expense related to the redemption of all the outstanding Class A and Class C membership interests on March 31, 2011 (for more information on this redemption, see “Relationships and Related Party Transactions—Redemption Agreements”).
Equity Income
| | | | | | | | | | | | |
| | | Three months ended March 31, | |
| | | 2011 | | | 2010 | | | Favorable/
(unfavorable) | |
| | | (in millions) | |
Equity income, net of tax | | $ | 17 | | | $ | 2 | | | $ | 15 | |
| | | | | | | | | | | | | | | | | | | | | | | | | | |
| | | Three months ended June 30, | | | | | Six months ended June 30, | |
| | | 2011 | | | 2010 | | | Favorable/
(unfavorable) | | | | | 2011 | | | 2010 | | | Favorable/
(unfavorable) | |
| | | (in millions) | | | | | (in millions) | |
Equity income, net of tax | | $ | 6 | | | $ | 6 | | | $ | — | | | | | $ | 23 | | | $ | 8 | | | $ | 15 | |
Equity income reflects our interest in the results of ongoing operations of entities accounted for as equity-method investments. Equity income increased during the threesix months ended March 31,June 30, 2011 as compared to the threesix months ended March 31,June 30, 2010 primarily due to the recognition of $8 million of gain on the sale of our 49.5% interest in Daesung Electric, Co., Ltd on January 31, 2011 (for more information on this transaction, see “Relationships and Related Party Transactions—Other Related Party Transactions”).
Results of Operations by Segment
We operate our core business along the following operating segments, which are grouped on the basis of similar product, market and operating factors:
Electronics and Safety, which includes component and systems integration expertise in audio and infotainment, body controls and security systems, displays, mechatronics, safety electronics and electric and hybrid electric vehicle power electronics, as well as advanced development of software.
Powertrain Systems, which includes extensive systems integration expertise in gasoline, diesel and fuel handling and full end-to-end systems including fuel injection, combustion, electronics controls, exhaust handling, test and validation capabilities, diesel and automotive aftermarket, and original equipment service.
Electrical/Electronic Architecture, which includes complete electrical architecture and component products.
Thermal Systems, which includes heating, ventilating and air conditioning systems, components for multiple transportation and other adjacent markets, and powertrain cooling and related technologies.
Eliminations and Other, which includes i) the elimination of inter-segment transactions, and ii) certain other expenses and income of a non-operating or strategic nature.
Through December 31, 2010, we evaluated performance based on stand-alone segment Adjusted EBITDA and accounted for inter-segment sales and transfers as if the sales or transfers were to third parties, at current market prices. Our management believed that Adjusted EBITDA was a meaningful measure of performance and it was used by management to analyze Company and stand-alone segment operating performance. Management also used Adjusted EBITDA for planning and forecasting purposes. Effective January 1, 2011, our management began utilizing segment EBITDA as a key performance measure because its restructuring was substantially completed by the end of 2010. Segment EBITDA and Adjusted EBITDA should not be considered substitutes for results prepared in accordance with U.S. GAAP and should not be considered alternatives to net income attributable to Delphi, which is the most directly comparable financial measure to EBITDA and Adjusted EBITDA that is in accordance with U.S. GAAP. Segment EBITDA and Adjusted EBITDA, as determined and measured by us, should also not be compared to similarly titled measures reported by other companies.
The reconciliation of EBITDA to net income attributable to Delphi for the three and six months ended March 31,June 30, 2011 is as follows:
| | | | Electronics
and Safety | | Powertrain
Systems | | Electrical/
Electronic
Architecture | | Thermal
Systems | | Eliminations
and Other | | | Total | | | Electronics
and Safety | | Powertrain
Systems | | Electrical/
Electronic
Architecture | | Thermal
Systems | | Eliminations
and Other | | | Total | |
| | | (in millions) | | | (in millions) | |
For the three months ended March 31, 2011: | | | | | | | | | | | | | |
For the three months ended June 30, 2011: | | | | | | | | | | | | | |
EBITDA | | $ | 105 | | | $ | 132 | | | $ | 240 | | | $ | 52 | | | $ | — | | | $ | 529 | | | $ | 93 | | | $ | 188 | | | $ | 217 | | | $ | 46 | | | $ | — | | | $ | 544 | |
Depreciation and amortization | | | (27 | ) | | | (47 | ) | | | (32 | ) | | | (11 | ) | | | — | | | | (117 | ) | | | (26 | ) | | | (46 | ) | | | (32 | ) | | | (12 | ) | | | — | | | | (116 | ) |
| | | | | | | | | | | | | | | | | | | | | | | | | | | | | | | | | | | | |
Operating income | | $ | 78 | | | $ | 85 | | | $ | 208 | | | $ | 41 | | | $ | — | | | $ | 412 | | | $ | 67 | | | $ | 142 | | | $ | 185 | | | $ | 34 | | | $ | — | | | $ | 428 | |
| | | | | | | | | | | | | | | | | | | | | | | | | | | | | | | | | | |
Interest expense | | | | | | | | | | | | | (6 | ) | | | | | | | | | | | | | (41 | ) |
Other income, net | | | | | | | | | | | | | 3 | | |
Other expense, net | | | | | | | | | | | | | | (4 | ) |
| | | | | | | | | | | | | | | | | | | | | | | | | | |
Income before income taxes and equity income | | | | | | | | | | | | | 409 | | | | | | | | | | | | | | 383 | |
Income tax expense | | | | | | | | | | | | | (116 | ) | | | | | | | | | | | | | (73 | ) |
Equity income | | | | | | | | | | | | | 17 | | | | | | | | | | | | | | 6 | |
| | | | | | | | | | | | | | | | | | | | | | | | | | |
Net income | | | | | | | | | | | | $ | 310 | | | | | | | | | | | | | $ | 316 | |
Net income attributable to noncontrolling interest | | | | | | | | | | | | | 19 | | | | | | | | | | | | | | 18 | |
| | | | | | | | | | | | | | | | | | | | | | | | | | |
Net income attributable to Delphi | | | | | | | | | | | | $ | 291 | | | | | | | | | | | | | $ | 298 | |
| | | | | | | | | | | | | | | | | | | | | | | | | | |
| | | | | Electronics
and Safety | | Powertrain
Systems | | Electrical/
Electronic
Architecture | | Thermal
Systems | | Eliminations
and Other | | | Total | |
| | | | (in millions) | |
For the six months ended June 30, 2011: | | | | | | | | | | | | | |
EBITDA | | | $ | 198 | | | $ | 320 | | | $ | 457 | | | $ | 98 | | | $ | — | | | $ | 1,073 | |
Depreciation and amortization | | | | (53 | ) | | | (93 | ) | | | (64 | ) | | | (23 | ) | | | — | | | | (233 | ) |
| | | | | | | | | | | | | | | | | | | |
Operating income | | | $ | 145 | | | $ | 227 | | | $ | 393 | | | $ | 75 | | | $ | — | | | | 840 | |
| | | | | | | | | | | | | | | | | | |
Interest expense | | | | | | | | | | | | | | (47 | ) |
Other expense, net | | | | | | | | | | | | | | (1 | ) |
| | | | | | | | | | | | | | |
Income before income taxes and equity income | | | | | | | | | | | | | | 792 | |
| | | | | | | | | | | | | |
Income tax expense | | | | | | | | | | | | | | (189 | ) |
| | | | | | | | | | | | | |
Equity income | | | | | | | | | | | | | | 23 | |
| | | | | | | | | | | | | | |
Net income | | | | | | | | | | | | | $ | 626 | |
| | | | | | | | | | | | | |
Net income attributable to noncontrolling interests | | | | | | | | | | | | | | 37 | |
| | | | | | | | | | | | | | |
Net income attributable to Delphi | | | | | | | | | | | | | $ | 589 | |
| | | | | | | | | | | | | | |
For the three and six months ended March 31,June 30, 2010, the reconciliation of Adjusted EBITDA to EBITDA includes other restructuring costs related to 1) the implementation of projects aimed at reducing the cost and improving the functionality of information technology systems and services to support finance, manufacturing and product development initiatives, 2) certain plant consolidations and closures costs, and 3) continued consolidation of many staff administrative functions into a global business service group,activities and 4) employee benefit plan settlements in Mexico.
The reconciliation of EBITDA to net income attributable to Delphi for the three and six months ended March 31,June 30, 2010 is as follows:
| | | | | | | | | | | | | | | | | | | | | | | | |
| | | Electronics
and Safety | | | Powertrain
Systems | | | Electrical/
Electronic
Architecture | | | Thermal
Systems | | | Eliminations
and Other | | | Total | |
| | | (in millions) | |
For the three months ended March 31, 2010: | | | | | | | | | | | | | | | | | | | | | | | | |
Adjusted EBITDA | | $ | 74 | | | $ | 128 | | | $ | 205 | | | $ | 49 | | | $ | — | | | $ | 456 | |
Restructuring charges: | | | | | | | | | | | | | | | | | | | | | | | | |
Employee termination benefits and other exit costs | | | (2 | ) | | | (12 | ) | | | (11 | ) | | | (1 | ) | | | — | | | | (26 | ) |
Other restructuring costs | | | (4 | ) | | | (1 | ) | | | (2 | ) | | | — | | | | — | | | | (7 | ) |
| | | | | | | | | | | | | | | | | | | | | | | | |
EBITDA | | $ | 68 | | | $ | 115 | | | $ | 192 | | | $ | 48 | | | $ | — | | | | 423 | |
| | | | | | | | | | | | | | | | | | | | | | | | |
Depreciation and amortization | | | (20 | ) | | | (42 | ) | | | (28 | ) | | | (9 | ) | | | — | | | | (99 | ) |
| | | | | | | | | | | | | | | | | | | | | | | | |
Operating income | | $ | 48 | | | $ | 73 | | | $ | 164 | | | $ | 39 | | | $ | — | | | $ | 324 | |
| | | | | | | | | | | | | | | | | | | | | | | | |
Interest expense | | | | | | | | | | | | | | | | | | | | | | | (8 | ) |
Other income, net | | | | | | | | | | | | | | | | | | | | | | | 2 | |
| | | | | | | | | | | | | | | | | | | | | | | | |
Income before income taxes and equity income | | | | | | | | | | | | | | | | | | | | | | | 318 | |
Income tax expense | | | | | | | | | | | | | | | | | | | | | | | (85 | ) |
Equity income | | | | | | | | | | | | | | | | | | | | | | | 2 | |
| | | | | | | | | | | | | | | | | | | | | | | | |
Net income | | | | | | | | | | | | | | | | | | | | | | $ | 235 | |
Net income attributable to noncontrolling interest | | | | | | | | | | | | | | | | | | | | | | | 20 | |
| | | | | | | | | | | | | | | | | | | | | | | | |
Net income attributable to Delphi | | | | | | | | | | | | | | | | | | | | | | $ | 215 | |
| | | | | | | | | | | | | | | | | | | | | | | | |
| | | | | | | | | | | | | | | | | | | | | | | | |
| | | Electronics
and Safety | | | Powertrain
Systems | | | Electrical/
Electronic
Architecture | | | Thermal
Systems | | | Eliminations
and Other | | | Total | |
| | | (in millions) | |
For the three months ended June 30, 2010: | | | | | | | | | | | | | | | | | | | | | | | | |
Adjusted EBITDA | | $ | 73 | | | $ | 117 | | | $ | 198 | | | $ | 56 | | | $ | — | | | $ | 444 | |
Restructuring charges: | | | | | | | | | | | | | | | | | | | | | | | | |
Employee termination benefits and other exit costs | | | (11 | ) | | | (1 | ) | | | (14 | ) | | | (4 | ) | | | — | | | | (30 | ) |
Other restructuring costs | | | (3 | ) | | | (3 | ) | | | (3 | ) | | | (1 | ) | | | — | | | | (10 | ) |
| | | | | | | | | | | | | | | | | | | | | | | | |
EBITDA | | $ | 59 | | | $ | 113 | | | $ | 181 | | | $ | 51 | | | $ | — | | | | 404 | |
| | | | | | | | | | | | | | | | | | | | | | | | |
Depreciation and amortization | | | (25 | ) | | | (42 | ) | | | (26 | ) | | | (11 | ) | | | (3 | ) | | | (107 | ) |
| | | | | | | | | | | | | | | | | | | | | | | | |
Operating income (loss) | | $ | 34 | | | $ | 71 | | | $ | 155 | | | $ | 40 | | | $ | (3 | ) | | $ | 297 | |
| | | | | | | | | | | | | | | | | | | | | | | | |
Interest expense | | | | | | | | | | | | | | | | | | | | | | | (8 | ) |
Other income, net | | | | | | | | | | | | | | | | | | | | | | | — | |
| | | | | | | | | | | | | | | | | | | | | | | | |
Income before income taxes and equity income | | | | | | | | | | | | | | | | | | | | | | | 289 | |
Income tax expense | | | | | | | | | | | | | | | | | | | | | | | (62 | ) |
Equity income | | | | | | | | | | | | | | | | | | | | | | | 6 | |
| | | | | | | | | | | | | | | | | | | | | | | | |
Net income | | | | | | | | | | | | | | | | | | | | | | $ | 233 | |
Net income attributable to noncontrolling interest | | | | | | | | | | | | | | | | | | | | | | | 19 | |
| | | | | | | | | | | | | | | | | | | | | | | | |
Net income attributable to Delphi | | | | | | | | | | | | | | | | | | | | | | $ | 214 | |
| | | | | | | | | | | | | | | | | | | | | | | | |
| | | | | | | | | | | | | | | | | | | | | | | | |
| | | Electronics
and Safety | | | Powertrain
Systems | | | Electrical/
Electronic
Architecture | | | Thermal
Systems | | | Eliminations
and Other | | | Total | |
| | | (in millions) | |
For the six months ended June 30, 2010: | | | | | | | | | | | | | | | | | | | | | | | | |
Adjusted EBITDA | | $ | 147 | | | $ | 245 | | | $ | 403 | | | $ | 105 | | | $ | — | | | $ | 900 | |
Restructuring charges: | | | | | | | | | | | | | | | | | | | | | | | | |
Employee termination benefits and other exit costs | | | (13 | ) | | | (13 | ) | | | (25 | ) | | | (5 | ) | | | — | | | | (56 | ) |
Other restructuring costs | | | (7 | ) | | | (4 | ) | | | (5 | ) | | | (1 | ) | | | — | | | | (17 | ) |
| | | | | | | | | | | | | | | | | | | | | | | | |
EBITDA | | $ | 127 | | | $ | 228 | | | $ | 373 | | | $ | 99 | | | $ | — | | | $ | 827 | |
| | | | | | | | | | | | | | | | | | | | | | | | |
Depreciation and amortization | | | (45 | ) | | | (84 | ) | | | (54 | ) | | | (20 | ) | | | (3 | ) | | | (206 | ) |
| | | | | | | | | | | | | | | | | | | | | | | | |
Operating income (loss) | | $ | 82 | | | $ | 144 | | | $ | 319 | | | $ | 79 | | | $ | (3 | ) | | $ | 621 | |
| | | | | | | | | | | | | | | | | | | | | | | | |
Interest expense | | | | | | | | | | | | | | | | | | | | | | | (16 | ) |
Other income, net | | | | | | | | | | | | | | | | | | | | | | | 2 | |
| | | | | | | | | | | | | | | | | | | | | | | | |
Income before income taxes and equity income | | | | | | | | | | | | | | | | | | | | | | | 607 | |
Income tax expense | | | | | | | | | | | | | | | | | | | | | | | (147 | ) |
Equity income | | | | | | | | | | | | | | | | | | | | | | | 8 | |
| | | | | | | | | | | | | | | | | | | | | | | | |
Net income | | | | | | | | | | | | | | | | | | | | | | $ | 468 | |
Net income attributable to noncontrolling interests | | | | | | | | | | | | | | | | | | | | | | | 39 | |
| | | | | | | | | | | | | | | | | | | | | | | | |
Net income attributable to Delphi | | | | | | | | | | | | | | | | | | | | | | $ | 429 | |
| | | | | | | | | | | | | | | | | | | | | | | | |
Net sales, gross margin as a percentage of net sales and EBITDA by segment for the three and six months ended March 31,June 30, 2011 and 2010 are as follows:
Net Sales by Segment
| | | | Three months ended March 31, | | | | Variance due to: | | | Three months ended June 30, | | | | Variance due to: | |
| | | 2011 | | 2010 | | Favorable/
(unfavorable) | | | | Volume, net
of contractual
price
reductions | | Commodity
pass-through | | | FX | | Other | | Total | | | 2011 | | 2010 | | Favorable/
(unfavorable) | | | | Volume, net
of contractual
price
reductions | | Commodity
pass-through | | | FX | | Other | | Total | |
| | | (in millions) | | | | (in millions) | | | (in millions) | | | | (in millions) | |
Electronics and Safety | | $ | 762 | | | $ | 720 | | | $ | 42 | | | | | $ | 131 | | | $ | — | | | $ | (3 | ) | | $ | (86 | ) | | $ | 42 | | | $ | 764 | | | $ | 674 | | | $ | 90 | | | | | $ | 63 | | | $ | — | | | $ | 45 | | | $ | (18 | ) | | $ | 90 | |
Powertrain Systems | | | 1,237 | | | | 970 | | | | 267 | | | | | | 261 | | | | — | | | | 12 | | | | (6 | ) | | | 267 | | | | 1,309 | | | | 1,016 | | | | 293 | | | | | | 217 | | | | — | | | | 81 | | | | (5 | ) | | | 293 | |
Electrical/Electronic Architecture | | | 1,613 | | | | 1,378 | | | | 235 | | | | | | 158 | | | | 58 | | | | 17 | | | | 2 | | | | 235 | | | | 1,741 | | | | 1,410 | | | | 331 | | | | | | 166 | | | | 73 | | | | 92 | | | | — | | | | 331 | |
Thermal Systems | | | 449 | | | | 392 | | | | 57 | | | | | | 50 | | | | 2 | | | | 5 | | | | — | | | | 57 | | | | 473 | | | | 399 | | | | 74 | | | | | | 42 | | | | 2 | | | | 30 | | | | — | | | | 74 | |
Eliminations and Other | | | (64 | ) | | | (50 | ) | | | (14 | ) | | | | | (1 | ) | | | — | | | | — | | | | (13 | ) | | | (14 | ) | | | (74 | ) | | | (53 | ) | | | (21 | ) | | | | | (11 | ) | | | — | | | | (8 | ) | | | (2 | ) | | | (21 | ) |
| | | | | | | | | | | | | | | | | | | | | | | | | | | | | | | | | | | | | | | | | | | | | | | | | | | | |
Total | | $ | 3,997 | | | $ | 3,410 | | | $ | 587 | | | | | $ | 599 | | | $ | 60 | | | $ | 31 | | | $ | (103 | ) | | $ | 587 | | | $ | 4,213 | | | $ | 3,446 | | | $ | 767 | | | | | $ | 477 | | | $ | 75 | | | $ | 240 | | | $ | (25 | ) | | $ | 767 | |
| | | | | | | | | | | | | | | | | | | | | | | | | | | | | | | | | | | | | | | | | | | | | | | | | | | | |
| | | | |
| | | | Six months ended June 30, | | | | Variance due to: | |
| | | | 2011 | | 2010 | | Favorable/
(unfavorable) | | | | Volume, net
of contractual
price
reductions | | Commodity
pass-through | | | FX | | Other | | Total | |
| | | | (in millions) | | | | (in millions) | |
Electronics and Safety | | | $ | 1,526 | | | $ | 1,394 | | | $ | 132 | | | | | $ | 193 | | | $ | — | | | $ | 42 | | | $ | (103 | ) | | $ | 132 | |
Powertrain Systems | | | | 2,546 | | | | 1,986 | | | | 560 | | | | | | 476 | | | | — | | | | 95 | | | | (11 | ) | | | 560 | |
Electrical/Electronic Architecture | | | | 3,354 | | | | 2,788 | | | | 566 | | | | | | 324 | | | | 131 | | | | 109 | | | | 2 | | | | 566 | |
Thermal Systems | | | | 922 | | | | 791 | | | | 131 | | | | | | 92 | | | | 4 | | | | 35 | | | | — | | | | 131 | |
Eliminations and Other | | | | (138 | ) | | | (103 | ) | | | (35 | ) | | | | | (9 | ) | | | — | | | | (9 | ) | | | (17 | ) | | | (35 | ) |
| | | | | | | | | | | | | | | | | | | | | | | | | | | |
Total | | | $ | 8,210 | | | $ | 6,856 | | | $ | 1,354 | | | | | $ | 1,076 | | | $ | 135 | | | $ | 272 | | | $ | (129 | ) | | $ | 1,354 | |
| | | | | | | | | | | | | | | | | | | | | | | | | | | |
Included in Other above are decreased sales of approximately $90$5 million and $98 million related to divestitures that occurred during 2010.the three and six months ended June 30, 2010, respectively.
Gross Margin Percentage by Segment
| | | | Three months ended
March 31, | | | Three months ended
June 30, | | Six months ended
June 30, | |
| | | 2011 | | 2010 | | | 2011 | | 2010 | | 2011 | | 2010 | |
Electronics and Safety | | | 16.0 | % | | | 12.5 | % | | | 15.2 | % | | | 12.5 | % | | | 15.6 | % | | | 12.5 | % |
Powertrain Systems | | | 13.6 | % | | | 16.5 | % | | | 18.0 | % | | | 15.4 | % | | | 15.9 | % | | | 15.9 | % |
Electrical/Electronic Architecture | | | 18.1 | % | | | 18.2 | % | | | 16.4 | % | | | 17.4 | % | | | 17.2 | % | | | 17.8 | % |
Thermal Systems | | | 13.8 | % | | | 14.5 | % | | | 12.1 | % | | | 15.5 | % | | | 12.9 | % | | | 15.0 | % |
Eliminations and Other | | | 0.0 | % | | | (8.0 | )% | | | 0.0 | % | | | 7.5 | % | | | 0.0 | % | | | 0.0 | % |
| | | | | | | | | | | | | | | | | | |
Total | | | 16.1 | % | | | 16.5 | % | | | 16.5 | % | | | 15.8 | % | | | 16.3 | % | | | 16.1 | % |
EBITDA by Segment
| | | | Three months ended March 31, | | | | Variance due to: | | | Three months ended June 30, | | | | Variance due to: | |
| | | 2011 | | | 2010 | | | Favorable/
(unfavorable) | | | | Volume, net of
contractual
price
reductions | | | Operational
performance | | Other | | Total | | | 2011 | | | 2010 | | | Favorable/
(unfavorable) | | | | Volume, net
of contractual
price
reductions | | | Operational
performance | | Other | | Total | |
| | | (in millions) | | | | (in millions) | | | (in millions) | | | | (in millions) | |
Electronics and Safety | | $ | 105 | | | $ | 68 | | | $ | 37 | | | | | $ | 40 | | | $ | 8 | | | $ | (11 | ) | | $ | 37 | | | $ | 93 | | | $ | 59 | | | $ | 34 | | | | | $ | 8 | | | $ | 27 | | | $ | (1 | ) | | $ | 34 | |
Powertrain Systems | | | 132 | | | | 115 | | | | 17 | | | | | | 91 | | | | (5 | ) | | | (69 | ) | | | 17 | | | | 188 | | | | 113 | | | | 75 | | | | | | 83 | | | | 2 | | | | (10 | ) | | | 75 | |
Electrical/Electronic Architecture | | | 240 | | | | 192 | | | | 48 | | | | | | 45 | | | | 19 | | | | (16 | ) | | | 48 | | | | 217 | | | | 181 | | | | 36 | | | | | | 37 | | | | 2 | | | | (3 | ) | | | 36 | |
Thermal Systems | | | 52 | | | | 48 | | | | 4 | | | | | | 7 | | | | (2 | ) | | | (1 | ) | | | 4 | | | | 46 | | | | 51 | | | | (5 | ) | | | | | 3 | | | | (2 | ) | | | (6 | ) | | | (5 | ) |
Eliminations and Other | | | — | | | | — | | | | — | | | | | | — | | | | — | | | | — | | | | — | | | | — | | | | — | | | | — | | | | | | — | | | | — | | | | — | | | | — | |
| | | | | | | | | | | | | | | | | | | | | | | | | | | | | | | | | | | | | | | | | | | | | | |
Total | | $ | 529 | | | $ | 423 | | | $ | 106 | | | | | $ | 183 | | | $ | 20 | | | $ | (97 | ) | | $ | 106 | | | $ | 544 | | | $ | 404 | | | $ | 140 | | | | | $ | 131 | | | $ | 29 | | | $ | (20 | ) | | $ | 140 | |
| | | | | | | | | | | | | | | | | | | | | | | | | | | | | | | | | | | | | | | | | | | | | | |
As noted in the table above, EBITDA for the three months ended March 31,June 30, 2011 as compared to the three months ended March June 30, 2010 was impacted by volume and contractual price reductions and operational performance improvements, as well as the following items included in Other in the table above:
$31 million due to increased accruals for incentive compensation in 2011 related to our salaried workforce; and
Offset by reduced restructuring of $22 million in 2011 related to reduced employee termination benefits and other exit costs.
EBITDA by Segment
| | | | | | | | | | | | | | | | | | | | | | | | | | | | | | |
| | | Six months ended June 30, | | | | | Variance due to: | |
| | | 2011 | | | 2010 | | | Favorable/
(unfavorable) | | | | | Volume, net
of contractual
price
reductions | | | Operational
performance | | | Other | | | Total | |
| | | (in millions) | | | | | (in millions) | |
Electronics and Safety | | $ | 198 | | | $ | 127 | | | $ | 71 | | | | | $ | 48 | | | $ | 35 | | | $ | (12 | ) | | $ | 71 | |
Powertrain Systems | | | 320 | | | | 228 | | | | 92 | | | | | | 174 | | | | (3 | ) | | | (79 | ) | | | 92 | |
Electrical/Electronic Architecture | | | 457 | | | | 373 | | | | 84 | | | | | | 82 | | | | 21 | | | | (19 | ) | | | 84 | |
Thermal Systems | | | 98 | | | | 99 | | | | (1 | ) | | | | | 10 | | | | (4 | ) | | | (7 | ) | | | (1 | ) |
Eliminations and Other | | | — | | | | — | | | | — | | | | | | — | | | | — | | | | — | | | | — | |
| | | | | | | | | | | | | | | | | | | | | | | | | | | | | | |
Total | | $ | 1,073 | | | $ | 827 | | | $ | 246 | | | | | $ | 314 | | | $ | 49 | | | $ | (117 | ) | | $ | 246 | |
| | | | | | | | | | | | | | | | | | | | | | | | | | | | | | |
As noted in the table above, EBITDA for the six months ended June 30, 2011 as compared to the six months ended June 30, 2010 was impacted by volume and contractual price reductions and operational performance improvements, as well as the following items included in Other in the table above:
$76 million due to an unusualincreased warranty expense in 2011 as a result of the March settlement related to certain components supplied by our Powertrain segment. Refer to “Note 10. Commitments and Contingencies” to the unaudited consolidated financial statements included herein for further information;
$1748 million due to increased accruals for incentive compensation in 2011 related to our salaried workforce; and
Offset by reduced restructuring of $17$39 million in 2011 related to reduced employee termination benefits and other exit costs.
Consolidated Results of Operations
2010 versus 2009
The results of operations for the year ended December 31, 2010 and the periods from August 19 to December 31, 2009 (“Successor Period of 2009”) and January 1 to October 6, 2009 (“Predecessor Period of 2009”) were as follows:
| | | | | | | | | | | | | | | | | | | | | | | | | | |
| | | Successor | | | | | Predecessor | |
| | | Year ended
December 31, 2010 | | | Period from August 19 to
December 31, 2009 | | | | | Period from January 1 to
October 6, 2009 | |
| | | (dollars in millions) | | | | | (dollars in millions) | |
Net sales | | $ | 13,817 | | | | | | | $ | 3,421 | | | | | | | | | $ | 8,334 | | | | | |
Cost of sales | | | 11,768 | | | | | | | | 3,047 | | | | | | | | | | 8,480 | | | | | |
| | | | | | | | | | | | | | | | | | | | | | | | | | |
Gross margin | | | 2,049 | | | | 14.8 | % | | | 374 | | | | 10.9 | % | | | | | (146 | ) | | | (1.8 | )% |
Selling, general and administrative | | | 815 | | | | | | | | 242 | | | | | | | | | | 734 | | | | | |
Amortization | | | 70 | | | | | | | | 16 | | | | | | | | | | 3 | | | | | |
Restructuring | | | 224 | | | | | | | | 126 | | | | | | | | | | 235 | | | | | |
| | | | | | | | | | | | | | | | | | | | | | | | | | |
Operating income (loss) | | | 940 | | | | | | | | (10 | ) | | | | | | | | | (1,118 | ) | | | | |
Interest expense | | | (30 | ) | | | | | | | (8 | ) | | | | | | | | | — | | | | | |
Other income (expense), net | | | 34 | | | | | | | | (17 | ) | | | | | | | | | 24 | | | | | |
Reorganization items | | | — | | | | | | | | — | | | | | | | | | | 10,210 | | | | | |
| | | | | | | | | | | | | | | | | | | | | | | | | | |
Income (loss) from continuing operations before income taxes and equity income (loss) | | | 944 | | | | | | | | (35 | ) | | | | | | | | | 9,116 | | | | | |
Income tax (expense) benefit | | | (258 | ) | | | | | | | 27 | | | | | | | | | | 311 | | | | | |
| | | | | | | | | | | | | | | | | | | | | | | | | | |
Income (loss) from continuing operations before equity income (loss) | | | 686 | | | | | | | | (8 | ) | | | | | | | | | 9,427 | | | | | |
Equity income (loss), net of tax | | | 17 | | | | | | | | 5 | | | | | | | | | | (36 | ) | | | | |
| | | | | | | | | | | | | | | | | | | | | | | | | | |
Income (loss) from continuing operations | | | 703 | | | | | | | | (3 | ) | | | | | | | | | 9,391 | | | | | |
Loss from discontinued operations, net of tax | | | — | | | | | | | | — | | | | | | | | | | (44 | ) | | | | |
| | | | | | | | | | | | | | | | | | | | | | | | | | |
Net income (loss) | | | 703 | | | | | | | | (3 | ) | | | | | | | | | 9,347 | | | | | |
Net income attributable to noncontrolling interest | | | 72 | | | | | | | | 15 | | | | | | | | | | 29 | | | | | |
| | | | | | | | | | | | | | | | | | | | | | | | | | |
Net income (loss) attributable to Successor/Predecessor | | $ | 631 | | | | | | | $ | (18 | ) | | | | | | | | $ | 9,318 | | | | | |
| | | | | | | | | | | | | | | | | | | | | | | | | | |
Total Net Sales
Total net sales for the year ended December 31, 2010 as compared to Full Year 2009 were as follows:
| | | | | | | | | | | | | | | | | | | | | | | | | | | | | | | | | | | | | | | | | | | | |
| | | Successor | | | | | Predecessor | | | | | Variance due to: | |
| | | Year ended
December 31,
2010 | | | Period
from
August 19
to
December
31, 2009 | | | | | Period from
January 1
to
October 6,
2009 | | | 2010 versus
full year 2009
favorable/
(unfavorable) | | | | | Operations
not
acquired | | | Volume, net
of
contractual
price
reductions | | | FX | | | Commodity
pass-
through | | | Other | | | Total | |
| | | (in millions) | | | | | (in millions) | | | | | (in millions) | |
Total net sales | | $ | 13,817 | | | $ | 3,421 | | | | | $ | 8,334 | | | $ | 2,062 | | | | | $ | (639 | ) | | $ | 2,725 | | | $ | (91) | | | $ | 145 | | | $ | (78) | | | $ | 2,062 | |
Total net sales in 2010 increased 18% compared to Full Year 2009 net sales. Excluding the sales impacts of the Operations Not Acquired, sales increased 24% in 2010. The increase in total net sales resulted primarily from increased volume as a result of rebounding OEM production schedules throughout 2010.
Cost of Sales
Cost of sales is primarily comprised of material, labor, manufacturing overhead, freight, fluctuations in foreign currency exchange rates, product engineering, design and development expenses, depreciation and amortization, warranty costs and other operating expenses.
| | | | | | | | | | | | | | |
| | | Successor | | | | | Predecessor | |
| | | Year ended
December 31, 2010 | | | Period from
August 19 to
December 31, 2009 | | | | | Period from
January 1 to
October 6, 2009 | |
| | | (dollars in millions) | | | | | (dollars in millions) | |
Cost of sales | | $ | 11,768 | | | $ | 3,047 | | | | | $ | 8,480 | |
Gross margin | | $ | 2,049 | | | $ | 374 | | | | | $ | (146 | ) |
Percentage of net sales | | | 14.8 | % | | | 10.9 | % | | | | | (1.8 | )% |
Successor
Cost of sales in the year ended 2010 was impacted by higher volume offset by favorable operational performance and our reduced cost structure due to previous restructuring actions. Additionally, cost of sales was impacted by the following items:
Warranty costs of $142 million;
Depreciation of fixed assets, including tooling, of $323 million; and
Pension and OPEB costs of $71 million.
Cost of sales in the Successor Period of 2009 was impacted by higher volume offset by favorable operational performance and our reduced cost structure due to previous restructuring actions. Additionally, cost of sales was impacted by the following items:
Warranty costs of $24 million;
Non-recurring $34 million non-cash charge as a result of the sale of inventory acquired from the Predecessor, which was required to be recorded at fair value as a result of the Acquisition;
Depreciation of fixed assets, including tooling, of $115 million; and
Pension and OPEB costs of $23 million.
Predecessor
Cost of sales in the Predecessor Period of 2009 was impacted by the relatively fixed cost nature of the Predecessor’s operations that inhibited the Predecessor’s ability to adjust its cost structure appropriately to the reduced volumes resulting from the economic and credit crises of 2008 and 2009 that adversely impacted OEM production levels. Additionally, cost of sales was impacted by the following items:
Warranty costs of $114 million;
Depreciation of fixed assets, including tooling, and including impairments, of $502 million; and
Pension and OPEB costs of $134 million.
Selling, General and Administrative Expense
| | | | | | | | | | | | | | |
| | | Successor | | | | | Predecessor | |
| | | Year ended
December 31, 2010 | | | Period from
August 19 to
December 31, 2009 | | | | | Period from
January 1 to
October 6, 2009 | |
| | | (dollars in millions) | | | | | (dollars in millions) | |
Selling, general and administrative expense | | $ | 815 | | | $ | 242 | | | | | $ | 734 | |
Percentage of net sales | | | 5.9 | % | | | 7.1 | % | | | | | 8.8 | % |
Successor
SG&A continues to decline as a percent of sales in the year ended December 31, 2010 and the Successor Period of 2009 as compared to the Predecessor Period of 2009 as a result of the positive effects of cost savings initiatives.
Predecessor
During the Predecessor Period of 2009, the impact of cost saving and restructuring initiatives had not yet been fully realized. In addition, reduced volumes during 2009 resulted in SG&A being a larger percentage of net sales due to the fixed nature of certain SG&A costs.
Amortization
| | | | | | | | | | | | | | |
| | | Successor | | | | | Predecessor | |
| | | Year ended
December 31, 2010 | | | Period from
August 19 to
December 31, 2009 | | | | | Period from
January 1 to
October 6, 2009 | |
| | | (in millions) | | | | | (in millions) | |
Amortization | | $ | 70 | | | $ | 16 | | | | | $ | 3 | |
Successor
Amortization for the year ended December 31, 2010 and the Successor Period of 2009 is a result of the recognition at fair value of approximately $766 million of intangible assets that we acquired as a part of the Acquisition.
Predecessor
During the Predecessor Period of 2009, amortization was insignificant.
Refer to “Note 8. Intangible Assets and Goodwill” to the audited consolidated financial statements included herein for additional information.
Restructuring
| | | | | | | | | | | | | | |
| | | Successor | | | | | Predecessor | |
| | | Year ended
December 31, 2010 | | | Period from
August 19 to
December 31, 2009 | | | | | Period from
January 1 to
October 6, 2009 | |
| | | (dollars in millions) | | | | | (dollars in millions) | |
Restructuring | | $ | 224 | | | $ | 126 | | | | | $ | 235 | |
Percentage of net sales | | | 1.6 | % | | | 3.7 | % | | | | | 2.8 | % |
Successor
During the year ended December 31, 2010, we continued our restructuring actions to align our manufacturing operations with current OEM production levels as well as continuing to relocate our manufacturing and engineering processes to lower cost locations. As such, we recognized employee termination and other related exit costs in conjunction with workforce reduction programs primarily in Europe of $174 million and $78 million during the year ended December 31, 2010 and the Successor Period of 2009, respectively. Similar actions to appropriately align North American manufacturing operations were also undertaken, resulting in $28 million and $34 million of charges during the year ended December 31, 2010 and the Successor Period of 2009, respectively.
Predecessor
As part of the Predecessor’s continuing restructuring activities in 2009 and in response to the depressed OEM production volumes of 2009, the Predecessor undertook significant restructuring actions. As a result, during the Predecessor Period of 2009, restructuring included approximately $69 million to realign manufacturing operations within North America to lower cost markets and reduce the workforce in line with the realigned manufacturing operations. Additionally, approximately $99 million of employee termination benefits and other exit costs were incurred in Europe, South America and Asia. The Predecessor also incurred $58 million for employee termination benefits resulting from the separation of certain salaried employees in North America.
Refer to “Note 11. Restructuring” to the audited consolidated financial statements included herein for additional information.
Interest Expense
| | | | | | | | | | | | | | |
| | | Successor | | | | | Predecessor | |
| | | Year ended
December 31, 2010 | | | Period from
August 19 to
December 31, 2009 | | | | | Period from
January 1 to
October 6, 2009 | |
| | | (in millions) | | | | | (in millions) | |
Interest expense | | $ | (30 | ) | | $ | (8 | ) | | | | $ | — | |
Successor
Interest expense for the year ended December 31, 2010 and the Successor Period of 2009 reflects the financing costs relating to our outstanding indebtedness subsequent to the Acquisition, including the $41 million in the Old Notes issued as part of the Acquisition as well as receivable factoring programs.
Predecessor
Interest expense for the Predecessor Period of 2009 includes the amortization of financing costs related to outstanding debtor-in-possession financing during the period and interest on debtor-in-possession financing, offset by the reversal of $415 million of accrued postpetition interest on prepetition debt and allowed unsecured claims, as more fully described in “Note 2. Significant Accounting Policies” to the audited consolidated financial statements included herein.
Other Income, Net
| | | | | | | | | | | | | | |
| | | Successor | | | | | Predecessor | |
| | | Year ended
December 31, 2010 | | | Period from
August 19 to
December 31, 2009 | | | | | Period from
January 1 to
October 6, 2009 | |
| | | (in millions) | | | | | (in millions) | |
Other income (expense), net | | $ | 34 | | | $ | (17 | ) | | | | $ | 24 | |
Successor
Other income, net during 2010 included $29 million of interest income, partially offset by a $9 million impairment of an investment in available-for-sale securities and an $8 million loss on the early extinguishment of debt that was revalued to fair value as part of acquisition accounting. Additionally, other income, net includes insurance and other recoveries and income from royalties.
During the Successor Period of 2009, other expense, net included $5 million of interest income, offset by $19 million of transactions costs related to the Acquisition.
Predecessor
Other income, net for the Predecessor Period of 2009 included $10 million of interest income.
Reorganization Items
| | | | |
| | | Predecessor | |
| | | Period from
January 1 to
October 6, 2009 | |
| | | (in millions) | |
Reorganization items, net | | $ | 10,210 | |
Predecessor
The following table details the components of bankruptcy-related reorganization items (refer to “Note 1. General and Acquisition of Predecessor Businesses” to the audited consolidated financial statements included herein for additional information):
| | | | |
| | | Predecessor | |
| | | (Income)/expense | |
| | | Period from
January 1 to
October 6, 2009 | |
| | | (in millions) | |
Sale / disposition of the Predecessor | | $ | (794 | ) |
Extinguishment of liabilities subject to compromise | | | (11,159 | ) |
PBGC termination of U.S. pension plans | | | 2,818 | |
Salaried OPEB settlement | | | (1,168 | ) |
Professional fees directly related to reorganization | | | 68 | |
Other | | | 25 | |
| | | | |
Total reorganization items | | $ | (10,210 | ) |
| | | | |
Income Taxes
| | | | | | | | | | | | |
| | | Successor | | | Predecessor | |
| | | Year ended
December 31, 2010 | | | Period from
August 19 to
December 31, 2009 | | | Period from
January 1 to
October 6, 2009 | |
| | | (in millions) | | | (in millions) | |
Income tax (expense) benefit | | $ | | (258) | | $ | 27 | | | $ | 311 | |
Our and the Predecessor’s tax rate in all periods is affected by the tax rates in the U.S. and non-U.S. jurisdictions, the relative amount of income we earn in such jurisdictions and the relative amount of losses for which no tax benefit was recognized due to a valuation allowance.
Successor
The annual effective tax rate in the year ended December 31, 2010 was impacted by a $2 million benefit related to tax contingencies for favorable tax settlements in various jurisdictions, a $21 million benefit related to valuation allowance changes in various countries outside the U.S., a $29 million benefit for U.S. primarily related to research and development credit, and a $15 million benefit due to changes in estimate related to tax law changes in Mexico.
During the Successor period of 2009, our tax rate was affected by the tax rates in non-U.S. jurisdictions, the relative amount of income we earn in such jurisdictions and the relative amount of losses for which no tax benefit would be recognized due to a valuation allowance.
Predecessor
The annual effective tax rate and the income tax benefit for the Predecessor Period of 2009 were favorably impacted by the recognition of $306 million and $52 million of tax benefits in continuing operations due to the elimination of the disproportionate tax effects in accumulated other comprehensive income related to the salaried pension and OPEB obligations, respectively, which were settled during the same period. Refer to “Note 16. Income Taxes” to the audited consolidated financial statements included herein.
Equity Income (Loss), Net of Tax
| | | | | | | | | | | | |
| | | Successor | | | Predecessor | |
| | | Year ended
December 31, 2010 | | | Period from
August 19 to
December 31, 2009 | | | Period from
January 1 to
October 6, 2009 | |
| | | (in millions) | | | (in millions) | |
Equity income (loss), net of tax | | $ | 17 | | | $ | 5 | | | $ | (36 | ) |
Successor
During both the year ended 2010 and the Successor Period of 2009, equity income reflects our interest in the results of ongoing operations of entities accounted for as equity-method investments, principally from our South Korean and Mexican joint ventures.
Predecessor
Equity income (loss), net of tax in the Predecessor Period of 2009 includes a $23 million impairment charge related to an investment in a non-consolidated affiliate, as well as the overall negative economic impact resulting from the industry downturn during 2009.
Loss from Discontinued Operations, Net of Tax
| | | | |
| | | Predecessor | |
| | | Period from
January 1 to
October 6, 2009 | |
| | | (in millions) | |
Loss from discontinued operations, net of tax | | $ | (44 | ) |
Predecessor
The loss from discontinued operations for the Predecessor Period of 2009 includes the losses related to the operations and assets held for sale of the halfshaft and steering system products (the “Steering Business”) and the Automotive Holdings Group (“AHG”), which included various non-core product lines and plant sites that did not fit our or the Predecessor’s strategic framework.
Results of Operations by Segment
The reconciliation of Adjusted EBITDA to EBITDA includes other transformation and rationalization costs related to 1) the implementation of information technology systems to support finance, manufacturing and product development initiatives, 2) certain plant consolidations and closures costs and 3) consolidation of many staff administrative functions into a global business service group. The reconciliation of EBITDA to net income (loss) attributable to Successor/Predecessor follows:
| | | | | | | | | | | | | | | | | | | | | | | | |
| | | Successor | |
| | | Electronics
and Safety | | | Powertrain
Systems | | | Electrical/
Electronic
Architecture | | | Thermal
Systems | | | Eliminations
and Other | | | Total | |
| | | (in millions) | |
2010: | | | | | | | | | | | | | | | | | | | | | | | | |
Adjusted EBITDA | | $ | 293 | | | $ | 423 | | | $ | 758 | | | $ | 165 | | | $ | (6 | ) | | $ | 1,633 | |
Transformation and rationalization charges: | | | | | | | | | | | | | | | | | | | | | | | | |
Employee termination benefits and other exit costs | | | (29 | ) | | | (49 | ) | | | (94 | ) | | | (52 | ) | | | — | | | | (224 | ) |
Other transformation and rationalization costs | | | (17 | ) | | | (13 | ) | | | (14 | ) | | | (4 | ) | | | — | | | | (48 | ) |
| | | | | | | | | | | | | | | | | | | | | | | | |
EBITDA | | $ | 247 | | | $ | 361 | | | $ | 650 | | | $ | 109 | | | $ | (6 | ) | | | 1,361 | |
| | | | | | | | | | | | | | | | | | | | | | | | |
Depreciation and amortization | | | (100 | ) | | | (170 | ) | | | (108 | ) | | | (42 | ) | | | (1 | ) | | | (421 | ) |
| | | | | | | | | | | | | | | | | | | | | | | | |
Operating income (loss) | | $ | 147 | | | $ | 191 | | | $ | 542 | | | $ | 67 | | | $ | (7 | ) | | | 940 | |
| | | | | | | | | | | | | | | | | | | | | | | | |
Interest expense | | | | | | | | | | | | | | | | | | | | | | | (30 | ) |
Other income, net | | | | | | | | | | | | | | | | | | | | | | | 34 | |
| | | | | | | | | | | | | | | | | | | | | | | | |
Income from continuing operations before income taxes and equity income | | | | | | | | | | | | | | | | | | | | | | | 944 | |
Income tax expense | | | | | | | | | | | | | | | | | | | | | | | (258 | ) |
Equity income, net of tax | | | | | | | | | | | | | | | | | | | | | | | 17 | |
| | | | | | | | | | | | | | | | | | | | | | | | |
Net income | | | | | | | | | | | | | | | | | | | | | | $ | 703 | |
Net income attributable to noncontrolling interest | | | | | | | | | | | | | | | | | | | | | | | 72 | |
| | | | | | | | | | | | | | | | | | | | | | | | |
Net income attributable to Successor | | | | | | | | | | | | | | | | | | | | | | $ | 631 | |
| | | | | | | | | | | | | | | | | | | | | | | | |
| | | | | | | | | | | | | | | | | | | | | | | | |
| | | Successor | |
| | | Electronics
and Safety | | | Powertrain
Systems | | | Electrical/
Electronic
Architecture | | | Thermal
Systems | | | Eliminations
and Other | | | Total | |
| | | (in millions) | |
August 19 – December 31, 2009: | | | | | | | | | | | | | | | | | | | | | | | | |
Adjusted EBITDA | | $ | 56 | | | $ | 79 | | | $ | 155 | | | $ | 21 | | | $ | 2 | | | $ | 313 | |
Transformation and rationalization charges: | | | | | | | | | | | | | | | | | | | | | | | | |
Employee termination benefits and other exit costs | | | (20 | ) | | | (50 | ) | | | (50 | ) | | | (5 | ) | | | (1 | ) | | | (126 | ) |
Other transformation and rationalization costs | | | (19 | ) | | | (20 | ) | | | (11 | ) | | | (8 | ) | | | — | | | | (58 | ) |
| | | | | | | | | | | | | | | | | | | | | | | | |
EBITDA | | $ | 17 | | | $ | 9 | | | $ | 94 | | | $ | 8 | | | $ | 1 | | | | 129 | |
| | | | | | | | | | | | | | | | | | | | | | | | |
Depreciation and amortization | | | (39 | ) | | | (52 | ) | | | (31 | ) | | | (17 | ) | | | — | | | | (139 | ) |
| | | | | | | | | | | | | | | | | | | | | | | | |
Operating (loss) income | | $ | (22 | ) | | $ | (43 | ) | | $ | 63 | | | $ | (9 | ) | | $ | 1 | | | | (10 | ) |
| | | | | | | | | | | | | | | | | | | | | | | | |
Interest expense | | | | | | | | | | | | | | | | | | | | | | | (8 | ) |
Other expense, net | | | | | | | | | | | | | | | | | | | | | | | (17 | ) |
| | | | | | | | | | | | | | | | | | | | | | | | |
Loss from continuing operations before income taxes and equity income | | | | | | | | | | | | | | | | | | | | | | | (35 | ) |
Income tax benefit | | | | | | | | | | | | | | | | | | | | | | | 27 | |
Equity income, net of tax | | | | | | | | | | | | | | | | | | | | | | | 5 | |
| | | | | | | | | | | | | | | | | | | | | | | | |
Net loss | | | | | | | | | | | | | | | | | | | | | | $ | (3 | ) |
Net income attributable to noncontrolling interest | | | | | | | | | | | | | | | | | | | | | | | 15 | |
| | | | | | | | | | | | | | | | | | | | | | | | |
Net loss attributable to Successor | | | | | | | | | | | | | | | | | | | | | | $ | (18 | ) |
| | | | | | | | | | | | | | | | | | | | | | | | |
| | | | | | | | | | | | | | | | | | | | | | | | |
| | | Predecessor | |
| | | Electronics
and Safety | | | Powertrain
Systems | | | Electrical/
Electronic
Architecture | | | Thermal
Systems | | | Eliminations
and Other | | | Total | |
| | | (in millions) | |
January 1 – October 6, 2009: | | | | | | | | | | | | | | | | | | | | | | | | |
Adjusted EBITDA | | $ | (214 | ) | | $ | (9 | ) | | $ | (18 | ) | | $ | 17 | | | $ | (5 | ) | | $ | (229 | ) |
Transformation and rationalization charges: | | | | | | | | | | | | | | | | | | | | | | | | |
Employee termination benefits and other exit costs | | | (91 | ) | | | (45 | ) | | | (99 | ) | | | (11 | ) | | | 11 | | | | (235 | ) |
Other transformation and rationalization costs | | | (14 | ) | | | (17 | ) | | | (15 | ) | | | (2 | ) | | | (2 | ) | | | (50 | ) |
| | | | | | | | | | | | | | | | | | | | | | | | |
EBITDA | | $ | (319 | ) | | $ | (71 | ) | | $ | (132 | ) | | $ | 4 | | | $ | 4 | | | | (514 | ) |
| | | | | | | | | | | | | | | | | | | | | | | | |
Depreciation and amortization | | | (177 | ) | | | (163 | ) | | | (147 | ) | | | (53 | ) | | | — | | | | (540 | ) |
Discontinued operations | | | — | | | | — | | | | — | | | | — | | | | (64 | ) | | | (64 | ) |
| | | | | | | | | | | | | | | | | | | | | | | | |
Operating loss | | $ | (496 | ) | | $ | (234 | ) | | $ | (279 | ) | | $ | (49 | ) | | $ | (60 | ) | | | (1,118 | ) |
| | | | | | | | | | | | | | | | | | | | | | | | |
Other income, net | | | | | | | | | | | | | | | | | | | | | | | 24 | |
Reorganization items | | | | | | | | | | | | | | | | | | | | | | | 10,210 | |
| | | | | | | | | | | | | | | | | | | | | | | | |
Income from continuing operations before income taxes and equity loss | | | | | | | | | | | | | | | | | | | | | | | 9,116 | |
Income tax benefit | | | | | | | | | | | | | | | | | | | | | | | 311 | |
Equity loss, net of tax | | | | | | | | | | | | | | | | | | | | | | | (36 | ) |
Loss from discontinued operations,
net of tax | | | | | | | | | | | | | | | | | | | | | | | (44 | ) |
| | | | | | | | | | | | | | | | | | | | | | | | |
Net income | | | | | | | | | | | | | | | | | | | | | | $ | 9,347 | |
Net income attributable to noncontrolling interest | | | | | | | | | | | | | | | | | | | | | | | 29 | |
| | | | | | | | | | | | | | | | | | | | | | | | |
Net income attributable to Predecessor | | | | | | | | | | | | | | | | | | | | | | $ | 9,318 | |
| | | | | | | | | | | | | | | | | | | | | | | | |
Net sales and gross margin as a percentage of net sales for the year ended December 31, 2010 and periods from August 19 to December 31 and January 1 to October 6, 2009 by segment are as follows:
Net Sales by Segment
| | | | | | | | | | | | | | | | | | | | | | | | | | | | | | | | | | | | | | | | |
| | | Successor | | | Predecessor | | | Variance due to: | |
| | | Year ended
December
31, 2010 | | | Period
from
August 19
to
December
31, 2009 | | | Period
from
January 1
to October
6, 2009 | | | 2010 versus
full year 2009
favorable/
(unfavorable) | | | Operations
not
acquired | | | Volume, net
of
contractual
price
reductions | | | Commodity
pass-
through | | | FX | | | Other | | | Total | |
| | | (in millions) | | | (in millions) | | | (in millions) | |
Electronics and Safety | | $ | 2,721 | | | $ | 761 | | | $ | 1,801 | | | $ | 159 | | | $ | (96 | ) | | $ | 294 | | | $ | — | | | $ | (38 | ) | | $ | (1 | ) | | $ | 159 | |
Powertrain Systems | | | 4,086 | | | | 957 | | | | 2,667 | | | | 462 | | | | (384 | ) | | | 879 | | | | — | | | | (36 | ) | | | 3 | | | | 462 | |
Electrical/ Electronic Architecture | | | 5,620 | | | | 1,325 | | | | 2,970 | | | | 1,325 | | | | — | | | | 1,215 | | | | 135 | | | | (26 | ) | | | 1 | | | | 1,325 | |
Thermal Systems | | | 1,603 | | | | 365 | | | | 1,008 | | | | 230 | | | | (172 | ) | | | 384 | | | | 10 | | | | 8 | | | | — | | | | 230 | |
Eliminations and Other | | | (213 | ) | | | 13 | | | | (112 | ) | | | (114 | ) | | | 13 | | | | (47 | ) | | | — | | | | 1 | | | | (81 | ) | | | (114 | ) |
| | | | | | | | | | | | | | | | | | | | | | | | | | | | | | | | | | | | | | | | |
Total | | $ | 13,817 | | | $ | 3,421 | | | $ | 8,334 | | | $ | 2,062 | | | $ | (639 | ) | | $ | 2,725 | | | $ | 145 | | | $ | (91 | ) | | $ | (78 | ) | | $ | 2,062 | |
| | | | | | | | | | | | | | | | | | | | | | | | | | | | | | | | | | | | | | | | |
Eliminations and Other includes $75 million of keep site facilitation reimbursements recognized by the Predecessor during the period from January 1 to October 6, 2009 as a result of the Amended MRA, which became effective in September 2008 (refer to “Note 3. Elements of Predecessor Transformation Plan” to the audited consolidated financial statements included herein for more information.)
Foreign exchange fluctuations are primarily related to the Euro.
Gross Margin Percentage by Segment
| | | | | | | | | | | | | | |
| | | Successor | | | | | Predecessor | |
| | | Year ended
December 31, 2010 | | | Period from
August 19 to
December 31, 2009 | | | | | Period from
January 1 to
October 6, 2009 | |
Electronics and Safety | | | 12.8 | % | | | 7.9 | % | | | | | (12.9 | )% |
Powertrain Systems | | | 13.8 | % | | | 10.1 | % | | | | | 2.6 | % |
Electrical/Electronic Architecture | | | 16.8 | % | | | 14.5 | % | | | | | 1.4 | % |
Thermal Systems | | | 12.4 | % | | | 5.5 | % | | | | | 3.2 | % |
Eliminations and Other | | | 1.4 | % | | | 38.5 | % | | | | | 49.1 | % |
Total | | | 14.8 | % | | | 10.9 | % | | | | | (1.8 | )% |
EBITDA by Segment
| | | | | | | | | | | | | | | | | | | | | | | | | | | | | | | | | | | | | | | | |
| | | Successor | | | | | Predecessor | | | | | Variance due to: | |
| | | Year ended
December 31,
2010 | | | Period from
August 19 to
December 31,
2009 | | | | | Period from
January 1
to
October 6,
2009 | | | 2010 versus
full year 2009
favorable/
(unfavorable) | | | | | Operations
not acquired | | | Volume, net
of
contractual
price
reductions | | | Operational
performance | | | Other | | | Total | |
| | | (in millions) | | | | | (in millions) | | (in millions) | |
Electronics and Safety | | $ | 247 | | | $ | 17 | | | | | $ | (319 | ) | | $ | 549 | | | | | $ | (10 | ) | | $ | 118 | | | $ | 211 | | | $ | 230 | | | $ | 549 | |
Powertrain Systems | | | 361 | | | | 9 | | | | | | (71 | ) | | | 423 | | | | | | 23 | | | | 283 | | | | 70 | | | | 47 | | | | 423 | |
Electrical/ Electronic Architecture | | | 650 | | | | 94 | | | | | | (132 | ) | | | 688 | | | | | | — | | | | 358 | | | | 161 | | | | 169 | | | | 688 | |
Thermal Systems | | | 109 | | | | 8 | | | | | | 4 | | | | 97 | | | | | | 14 | | | | 75 | | | | 41 | | | | (33 | ) | | | 97 | |
Eliminations and Other | | | (6 | ) | | | 1 | | | | | | 4 | | | | (11 | ) | | | | | (99 | ) | | | — | | | | — | | | | 88 | | | | (11 | ) |
| | | | | | | | | | | | | | | | | | | | | | | | | | | | | | | | | | | | | | | | |
Total | | $ | 1,361 | | | $ | 129 | | | | | $ | (514 | ) | | $ | 1,746 | | | | | $ | (72 | ) | | $ | 834 | | | $ | 483 | | | $ | 501 | | | $ | 1,746 | |
| | | | | | | | | | | | | | | | | | | | | | | | | | | | | | | | | | | | | | | | |
As noted in the table above, 2010 EBITDA as compared to Full Year 2009 EBITDA was impacted by Operations Not Acquired by the Successor, volume and contractual price reductions, and operational performance improvements, which include favorable manufacturing and engineering performance offset by unfavorable material and freight economics, as well as the following items included in Other in the table above:
$137 million of decreased costs associated with restructuring activities resulting in employee termination benefit cost reductions, including $82 million, $46 million and $55 million in the Electronics and Safety, Powertrain Systems and Electrical/Electronic Architecture, respectively, offset by increased costs of $36 million and $10 million in the Thermal Systems and Eliminations and Other segments, respectively.
Favorable foreign currency exchange impact of $29 million primarily due to the Euro, Brazilian Real, Polish Zloty and British pound, including $24 million, $4 million and $10 million in the Electronics and Safety, Powertrain Systems and Electrical/Electronic Architecture segments, respectively, which were partially offset by $9 million of unfavorable foreign currency exchange in the Thermal Systems segment.
$150 million of decreases in pension and OPEB, offset by favorable EBITDA from discontinued operations of $64 million in the Eliminations and Other segment.
Approximately $60 million of decreased SG&A as a result of the positive effects of cost savings initiatives.
Consolidated Results of Operations
2009 versus 2008
The results of operations for the Successor Period of 2009 from August 19 to December 31, 2009 and the Predecessor Period of 2009 from January 1 to October 6, 2009 and the year ended December 31, 2008 were as follows:
| | | | | | | | | | | | | | | | | | | | | | | | | | |
| | | Successor | | | | | Predecessor | |
| | | Period from August 19
to December 31, 2009 | | | | | Period from January 1
to October 6, 2009 | | | Year ended
December 31, 2008 | |
| | | (dollars in millions) | | | | | (dollars in millions) | |
Net sales | | $ | 3,421 | | | | | | | | | $ | 8,334 | | | | | | | $ | 16,808 | | | | | |
Cost of sales | | | 3,047 | | | | | | | | | | 8,480 | | | | | | | | 16,157 | | | | | |
| | | | | | | | | | | | | | | | | | | | | | | | | | |
Gross margin | | | 374 | | | | 10.9% | | | | | | (146 | ) | | | (1.8)% | | | | 651 | | | | 3.9% | |
Selling, general and administrative | | | 242 | | | | | | | | | | 734 | | | | | | | | 1,420 | | | | | |
Amortization | | | 16 | | | | | | | | | | 3 | | | | | | | | 5 | | | | | |
Goodwill impairment | | | — | | | | | | | | | | — | | | | | | | | 325 | | | | | |
Restructuring | | | 126 | | | | | | | | | | 235 | | | | | | | | 326 | | | | | |
| | | | | | | | | | | | | | | | | | | | | | | | | | |
Operating loss | | | (10 | ) | | | | | | | | | (1,118 | ) | | | | | | | (1,425 | ) | | | | |
Interest expense | | | (8 | ) | | | | | | | | | — | | | | | | | | (434 | ) | | | | |
Other (expense) income, net | | | (17 | ) | | | | | | | | | 24 | | | | | | | | 9 | | | | | |
Reorganization items | | | — | | | | | | | | | | 10,210 | | | | | | | | 5,147 | | | | | |
| | | | | | | | | | | | | | | | | | | | | | | | | | |
(Loss) income from continuing operations before income taxes and equity income (loss) | | | (35 | ) | | | | | | | | | 9,116 | | | | | | | | 3,297 | | | | | |
Income tax benefit (expense) | | | 27 | | | | | | | | | | 311 | | | | | | | | (163 | ) | | | | |
| | | | | | | | | | | | | | | | | | | | | | | | | | |
(Loss) income from continuing operations before equity income (loss) | | | (8 | ) | | | | | | | | | 9,427 | | | | | | | | 3,134 | | | | | |
Equity income (loss), net of tax | | | 5 | | | | | | | | | | (36 | ) | | | | | | | 29 | | | | | |
| | | | | | | | | | | | | | | | | | | | | | | | | | |
(Loss) income from continuing operations | | | (3 | ) | | | | | | | | | 9,391 | | | | | | | | 3,163 | | | | | |
Loss from discontinued operations, net of tax | | | — | | | | | | | | | | (44 | ) | | | | | | | (97 | ) | | | | |
| | | | | | | | | | | | | | | | | | | | | | | | | | |
Net (loss) income | | | (3 | ) | | | | | | | | | 9,347 | | | | | | | | 3,066 | | | | | |
Net income attributable to noncontrolling interest | | | 15 | | | | | | | | | | 29 | | | | | | | | 29 | | | | | |
| | | | | | | | | | | | | | | | | | | | | | | | | | |
Net (loss) income attributable to Successor/Predecessor | | $ | (18 | ) | | | | | | | | $ | 9,318 | | | | | | | $ | 3,037 | | | | | |
| | | | | | | | | | | | | | | | | | | | | | | | | | |
In 2008 and 2009, production volumes globally were significantly lower due to economic and credit market impacts. Consequently, during 2008 and 2009, the Predecessor’s operational challenges intensified as a result of the continued downturn in general economic conditions, including reduced consumer spending and confidence, high oil prices, particularly during 2008, and the credit market crisis, all of which resulted in the reduction of global vehicle production and in restructuring actions by manufacturers. We refer to the trends and conditions described in this paragraph as “recent consumer trends and market conditions.”
Total Net Sales
Total net sales for Full Year 2009 as compared to the year ended December 31, 2008 were as follows:
| | | | | | | | | | | | | | | | | | | | | | | | | | | | | | | | | | | | | | | | | | | | |
| | | Successor | | | | | Predecessor | | | | | Variance due to: | |
| | | Period
from
August 19
to
December
31, 2009 | | | | | Period
from
January 1
to
October
6, 2009 | | | Year
ended
December
31, 2008 | | | Full year
2009 versus
2008
favorable/
(unfavorable) | | | | | Operations
not
acquired | | | Volume
and
contractual
price
reductions | | | FX | | | Commodity
pass-
through | | | Other | | | Total | |
| | | (in
millions) | | | | | (in millions) | | | | | (in millions) | |
Total net sales | | $ | 3,421 | | | | | $ | 8,334 | | | $ | 16,808 | | | $ | (5,053 | ) | | | | $ | (160) | | | $ | (4,017) | | | $ | (685) | | | $ | (183 | ) | | $ | (8) | | | $ | (5,053) | |
Total Full Year 2009 net sales decreased 30% compared to 2008 net sales. Excluding the sales impact of the Operations not Acquired, sales decreased 29% in the Full Year 2009 period. The decrease in total net sales resulted primarily from decreased volume and contractual price reductions as a result of recent consumer trends and market conditions. In addition, Full Year 2009 net sales were impacted by unfavorable foreign currency exchange rates, decreased commodity pass-through costs and the net sales related to Operations not Acquired by us.
Operating Results
The information below summarizes the operating results for the Successor Period of 2009, the Predecessor Period of 2009 and the year ended December 31, 2008.
Cost of Sales
Cost of sales is primarily comprised of material, labor, manufacturing overhead, freight, fluctuations in foreign currency exchange rates, product engineering, design and development expenses, depreciation and amortization, warranty costs and other operating expenses.
| | | | | | | | | | | | | | |
| | | Successor | | | | | Predecessor | |
| | | Period from
August 19 to
December 31, 2009 | | | | | Period from
January 1 to
October 6, 2009 | | | Year ended
December 31, 2008 | |
| | | (dollars in millions) | | | | | (dollars in millions) | |
Cost of sales | | $ | 3,047 | | | | | $ | 8,480 | | | $ | 16,157 | |
Gross margin | | $ | 374 | | | | | $ | (146 | ) | | $ | 651 | |
Percentage of net sales | | | 10.9 | % | | | | | (1.8 | )% | | | 3.9 | % |
Successor
Cost of sales in the Successor Period of 2009 was impacted by increases in volume, offset by improved operational performance and our reduced cost structure due to previous restructuring actions. Additionally, cost of sales was impacted by the following items:
Warranty costs of $24 million;
Non-recurring $34 million non-cash charge as a result of the sale of inventory acquired from the Predecessor, which was required to be recorded at fair value as a result of the Acquisition;
Depreciation of fixed assets, including tooling, of $115 million; and
Pension and OPEB costs of $23 million.
Predecessor
Cost of sales in the Predecessor Period of 2009 was impacted by the relatively fixed cost nature of the Predecessor’s operations that inhibited the Predecessor’s ability to adjust its cost structure appropriately to the reduced volumes resulting from the economic and credit crises of 2008 and 2009 that adversely impacted OEM production levels. Additionally, cost of sales was impacted by the following items:
Warranty costs of $114 million;
Depreciation of fixed assets, including tooling, and impairments, of $502 million; and
Pension and OPEB costs of $134 million.
Cost of sales in the year ended December 31, 2008 was driven by volumes associated with recent consumer trends and market conditions. Additionally, cost of sales was impacted by the following items:
Warranty costs of $100 million, offset by the forgiveness of $112 million due under the warranty settlement agreement with GM;
Upon effectiveness of the Amended MRA (as defined and further discussed in “Note 3. Elements of Predecessor Transformation Plan” to the audited consolidated financial statements included herein), the Predecessor recorded a reduction to operating expenses of $189 million;
Employee workforce transition program costs of $69 million;
Depreciation of fixed assets, including tooling, and impairments, of $760 million; and
Pension and OPEB costs of $618 million.
Selling, General and Administrative Expense
| | | | | | | | | | | | | | |
| | | Successor | | | | | Predecessor | |
| | | Period from
August 19 to
December 31, 2009 | | | | | Period from
January 1 to
October 6, 2009 | | | Year ended
December 31, 2008 | |
| | | (dollars in millions) | | | | | (dollars in millions) | |
Selling, general and administrative expense | | $ | 242 | | | | | $ | 734 | | | $ | 1,420 | |
Percentage of net sales | | | 7.1 | % | | | | | 8.8 | % | | | 8.4 | % |
Successor
SG&A declined as a percent of sales during the Successor Period of 2009 as a result of the positive effects of cost savings initiatives.
Predecessor
During the Predecessor Period of 2009 and the year ended December 31, 2008, the impact of cost saving and restructuring initiatives had not yet been realized. In addition, reduced volumes during 2009 resulted in SG&A being a larger percentage of net sales due to the fixed nature of certain SG&A costs.
Amortization
| | | | | | | | | | | | | | |
| | | Successor | | | | | Predecessor | |
| | | Period from
August 19 to
December 31, 2009 | | | | | Period from
January 1 to
October 6, 2009 | | | Year ended
December 31, 2008 | |
| | | (in millions) | | | | | (in millions) | |
Amortization | | $ | 16 | | | | | $ | 3 | | | $ | 5 | |
Successor
During the Successor Period of 2009, amortization is a result of the recognition at fair value of approximately $766 million of intangible assets that we acquired as part of the Acquisition.
Predecessor
During the Predecessor Period of 2009 and the year ended December 31, 2008, amortization was insignificant.
Refer to “Note 8. Intangible Assets and Goodwill” to the audited consolidated financial statements included herein for additional information.
Goodwill Impairment
| | | | | | | | | | | | | | |
| | | Successor | | | | | Predecessor | |
| | | Period from
August 19 to
December 31, 2009 | | | | | Period from
January 1 to
October 6, 2009 | | | Year ended
December 31, 2008 | |
| | | (in millions) | | | | | (in millions) | |
Goodwill impairment | | $ | — | | | | | $ | — | | | $ | 325 | |
Predecessor
Goodwill impairment of $325 million was recorded in 2008, of which approximately $168 million related to our Electrical/Electronic Architecture segment and approximately $157 million related to our Electronics and Safety segment. The goodwill impairment was the result of a reduction in the estimated fair value of these segments due to consumer trends and market conditions experienced in 2008. Refer to “Note 8. Intangible Assets and Goodwill” to the audited consolidated financial statements included herein.
Restructuring
| | | | | | | | | | | | | | |
| | | Successor | | | | | Predecessor | |
| | | Period from
August 19 to
December 31, 2009 | | | | | Period from
January 1 to
October 6, 2009 | | | Year ended
December 31, 2008 | |
| | | (dollars in millions) | | | | | (dollars in millions) | |
Restructuring | | $ | 126 | | | | | $ | 235 | | | $ | 326 | |
Percentage of net sales | | | 3.7 | % | | | | | 2.8 | % | | | 1.9 | % |
Successor
During the Successor Period of 2009, we continued our restructuring actions to align our manufacturing operations with current OEM production levels as well as continuing to rationalize our manufacturing and engineering processes to lower cost locations. As such, we recognized employee termination and other related exit costs in conjunction with workforce reduction programs primarily in Europe of $78 million. Similar actions to appropriately align North American manufacturing operations were also undertaken, resulting in $34 million of charges.
Predecessor
As part of the Predecessor’s continuing restructuring activities in 2009 and in response to the depressed OEM production volumes of 2009, the Predecessor undertook significant restructuring actions. As a result, during the Predecessor Period of 2009, restructuring included approximately $69 million to realign manufacturing operations within North America to lower cost markets and reduce the workforce in line with the realigned manufacturing operations. Additionally, approximately $99 million of employee termination benefits and other exit costs were incurred in Europe, South America and Asia. The Predecessor also incurred $58 million for employee termination benefits resulting from the separation of certain salaried employees in North America.
Restructuring during the year ended December 31, 2008, included approximately $104 million to realign manufacturing operations within North America to lower cost markets and reduce the workforce in line with the realigned manufacturing operations. During 2008, the Predecessor identified certain salaried employees in North America for involuntary separation and recorded $131 million in employee termination benefits. Additionally approximately $39 million of employee termination benefits and other exit costs were incurred in Europe, South America and Asia. The Predecessor also incurred $22 million of contract termination costs.
Refer to “Note 11. Restructuring” to the audited consolidated financial statements included herein for additional information.
Interest Expense
| | | | | | | | | | | | | | |
| | | Successor | | | | | Predecessor | |
| | | Period from
August 19 to
December 31, 2009 | | | | | Period from
January 1 to
October 6, 2009 | | | Year ended
December 31, 2008 | |
| | | (in millions) | | | | | (in millions) | |
Interest expense | | $ | (8 | ) | | | | $ | — | | | $ | (434 | ) |
Successor
During the Successor Period of 2009, interest expense reflects the financing cost relating to our significantly lower outstanding indebtedness subsequent to the Acquisition, including the Old Notes issued as part of the Acquisition as well as receivable factoring programs.
Predecessor
Interest expense for the Predecessor Period of 2009 includes financing costs related to outstanding debtor-in-possession financing during the period, offset by the reversal of $415 million of accrued postpetition interest on prepetition debt and allowed unsecured claims, as more fully described in “Note 2. Significant Accounting Policies” to the audited consolidated financial statements included herein.
Interest expense for the year ended December 31, 2008 primarily relates to interest on outstanding debtor-in-possession financing.
Other Income, Net
| | | | | | | | | | | | | | |
| | | Successor | | | | | Predecessor | |
| | | Period from
August 19 to
December 31, 2009 | | | | | Period from
January 1 to
October 6, 2009 | | | Year ended
December 31, 2008 | |
| | | (in millions) | | | | | (in millions) | |
Other income (expense), net | | $ | (17 | ) | | | | $ | 24 | | | $ | 9 | |
Successor
During the Successor Period of 2009, other expense, net included $5 million of interest income, offset by $19 million of transactions costs related to the Acquisition.
Predecessor
Other income, net for the Predecessor Period of 2009 included $10 million of interest income.
During the year ended December 31, 2008, the Predecessor recognized a $49 million loss on extinguishment of debt associated with the recognition of unamortized debt issuance costs related to the outstanding
debtor-in-possession financing during the period and a $32 million gain from the sale of an investment accounted for under the cost method that had been previously fully impaired, partially offset by $16 million of expense related to an allowance recorded against a note receivable.
Reorganization Items
| | | | | | | | |
| | | Predecessor | |
| | | Period from
January 1 to
October 6, 2009 | | | Year ended
December 31, 2008 | |
| | | (in millions) | |
Reorganization items, net | | $ | 10,210 | | | $ | 5,147 | |
Predecessor
The following table details the components of bankruptcy-related reorganization items (refer to “Note 1. General and Acquisition of Predecessor Businesses” to the audited consolidated financial statements included herein for additional information):
| | | | | | | | |
| | | Predecessor | |
| | | (Income)/Expense | |
| | | Period from
January 1 to
October 6, 2009 | | | Year ended
December 31, 2008 | |
| | | (in millions) | |
Sale / disposition of the Predecessor | | $ | (794 | ) | | $ | — | |
Extinguishment of liabilities subject to compromise | | | (11,159 | ) | | | — | |
GM Amended GSA settlement | | | — | | | | (5,332 | ) |
PBGC termination of U.S. pension plans | | | 2,818 | | | | — | |
Salaried OPEB settlement | | | (1,168 | ) | | | — | |
Professional fees directly related to reorganization | | | 68 | | | | 107 | |
Write off of previously capitalized EPCA fees and expenses | | | — | | | | 79 | |
Other | | | 25 | | | | (1 | ) |
| | | | | | | | |
Total reorganization items | | $ | (10,210 | ) | | $ | (5,147 | ) |
| | | | | | | | |
Income Taxes
| | | | | | | | | | | | | | |
| | | Successor | | | | | Predecessor | |
| | | Period from
August 19 to
December 31, 2009 | | | | | Period from
January 1 to
October 6, 2009 | | | Year ended
December 31, 2008 | |
| | | (in millions) | | | | | (in millions) | |
Income tax benefit (expense) | | $ | 27 | | | | | $ | 311 | | | $ | (163 | ) |
Our and the Predecessor’s tax rate in all periods is affected by the tax rates in the U.S. and non-U.S. jurisdictions, the relative amount of income earned in such jurisdictions and the relative amount of losses for which no tax benefit was recognized due to a valuation allowance.
Successor
During the Successor Period of 2009, our tax rate was affected by the tax rates in non-U.S. jurisdictions, the relative amount of income we earn in such jurisdictions and the relative amount of losses for which no tax benefit would be recognized due to a valuation allowance.
Predecessor
The annual effective tax rate for the Predecessor Period of 2009 was favorably impacted by the recognition of $306 million and $52 million of tax benefits in continuing operations due to the elimination of the disproportionate tax effects in accumulated other comprehensive income related to the salaried pension and OPEB obligations, respectively, which were settled during the same period.
Although the Predecessor recorded a net reorganization gain of $5.3 billion in 2008 related to the effectiveness of the Amended GSA (as defined and further discussed in “Note 3. Elements of Predecessor Transformation Plan” to the audited consolidated financial statements included herein) which created approximately $1.2 billion of taxable income, it did not generate any U.S. tax expense due to the impact of a related change to the U.S. deferred tax assets for which a full valuation allowance is recorded. The Predecessor maintained a full valuation allowance for its deferred tax assets in certain non-U.S. jurisdictions as it is more likely than not that the benefits will not be recognized.
Equity Income (Loss), Net of Tax
| | | | | | | | | | | | | | |
| | | Successor | | | | | Predecessor | |
| | | Period from
August 19 to
December 31, 2009 | | | | | Period from
January 1 to
October 6, 2009 | | | Year ended
December 31, 2008 | |
| | | (in millions) | | | | | (in millions) | |
Equity income (loss) | | $ | 5 | | | | | $ | (36 | ) | | $ | 29 | |
Successor
During the Successor Period of 2009, equity income reflects our interest in the results of ongoing operations of entities accounted for as equity-method investments, principally from our South Korean and Mexican joint ventures.
Predecessor
The Predecessor Period of 2009 includes a $23 million impairment charge related to an investment in a non-consolidated affiliate, as well as the overall negative economic impact resulting from the industry downturn during 2009.
The year ended December 31, 2008, includes equity income and reflects our interest in the results of ongoing operations of entities accounted for as equity-method investments, principally from our South Korean and Mexican joint ventures.
Loss from Discontinued Operations, Net of Tax
| | | | | | | | |
| | | Predecessor | |
| | | Period from
January 1 to
October 6, 2009 | | | Year ended
December 31, 2008 | |
| | | (in millions) | |
Loss from discontinued operations, net of tax | | $ | (44 | ) | | $ | (97 | ) |
Predecessor
The loss from discontinued operations reflected in the Predecessor Period of 2009 and the year ended December 31, 2008, includes the losses related to the operations and assets held for sale of the Steering Business and AHG, which includes various non-core product lines and plant sites that did not fit the Predecessor’s strategic framework.
Results of Operations by Segment
The reconciliation of Adjusted EBITDA to EBITDA includes other transformation and rationalization costs related to 1) the implementation of information technology systems to support finance, manufacturing and product development initiatives, 2) certain plant consolidations and closures costs and 3) consolidation of many staff administrative functions into a global business service group. The reconciliation of EBITDA to net income (loss) attributable to Successor/Predecessor follows:
| | | | | | | | | | | | | | | | | | | | | | | | |
| | | Successor | |
| | | Electronics
and Safety | | | Powertrain
Systems | | | Electrical/
Electronic
Architecture | | | Thermal
Systems | | | Eliminations
and Other | | | Total | |
| | | (in millions) | |
August 19 – December 31, 2009: | | | | | | | | | | | | | | | | | | | | | | | | |
Adjusted EBITDA | | $ | 56 | | | $ | 79 | | | $ | 155 | | | $ | 21 | | | $ | 2 | | | $ | 313 | |
Transformation and rationalization charges: | | | | | | | | | | | | | | | | | | | | | | | | |
Employee termination benefits and other exit costs | | | (20 | ) | | | (50 | ) | | | (50 | ) | | | (5 | ) | | | (1 | ) | | | (126 | ) |
Other transformation and rationalization costs | | | (19 | ) | | | (20 | ) | | | (11 | ) | | | (8 | ) | | | — | | | | (58 | ) |
| | | | | | | | | | | | | | | | | | | | | | | | |
EBITDA | | $ | 17 | | | $ | 9 | | | $ | 94 | | | $ | 8 | | | $ | 1 | | | | 129 | |
| | | | | | | | | | | | | | | | | | | | | | | | |
Depreciation and amortization | | | (39 | ) | | | (52 | ) | | | (31 | ) | | | (17 | ) | | | — | | | | (139 | ) |
| | | | | | | | | | | | | | | | | | | | | | | | |
Operating (loss) income | | $ | (22 | ) | | $ | (43 | ) | | $ | 63 | | | $ | (9 | ) | | $ | 1 | | | | (10 | ) |
| | | | | | | | | | | | | | | | | | | | | | | | |
Interest expense | | | | | | | | | | | | | | | | | | | | | | | (8 | ) |
Other expense, net | | | | | | | | | | | | | | | | | | | | | | | (17 | ) |
| | | | | | | | | | | | | | | | | | | | | | | | |
Loss from continuing operations before income taxes and equity income | | | | | | | | | | | | | | | | | | | | | | | (35 | ) |
Income tax benefit | | | | | | | | | | | | | | | | | | | | | | | 27 | |
Equity income, net of tax | | | | | | | | | | | | | | | | | | | | | | | 5 | |
| | | | | | | | | | | | | | | | | | | | | | | | |
Net loss | | | | | | | | | | | | | | | | | | | | | | $ | (3 | ) |
Net income attributable to noncontrolling interest | | | | | | | | | | | | | | | | | | | | | | | 15 | |
| | | | | | | | | | | | | | | | | | | | | | | | |
Net loss attributable to Successor | | | | | | | | | | | | | | | | | | | | | | $ | (18 | ) |
| | | | | | | | | | | | | | | | | | | | | | | | |
| | | | | | | | | | | | | | | | | | | | | | | | |
| | | Predecessor | |
| | | Electronics
and Safety | | | Powertrain
Systems | | | Electrical/
Electronic
Architecture | | | Thermal
Systems | | | Eliminations
and Other | | | Total | |
| | | (in millions) | |
January 1 – October 6, 2009: | | | | | | | | | | | | | | | | | | | | | | | | |
Adjusted EBITDA | | $ | (214 | ) | | $ | (9 | ) | | $ | (18 | ) | | $ | 17 | | | $ | (5 | ) | | $ | (229 | ) |
Transformation and rationalization charges: | | | | | | | | | | | | | | | | | | | | | | | | |
Employee termination benefits and other exit costs | | | (91 | ) | | | (45 | ) | | | (99 | ) | | | (11 | ) | | | 11 | | | | (235 | ) |
Other transformation and rationalization costs | | | (14 | ) | | | (17 | ) | | | (15 | ) | | | (2 | ) | | | (2 | ) | | | (50 | ) |
| | | | | | | | | | | | | | | | | | | | | | | | |
EBITDA | | $ | (319 | ) | | $ | (71 | ) | | $ | (132 | ) | | $ | 4 | | | $ | 4 | | | | (514 | ) |
| | | | | | | | | | | | | | | | | | | | | | | | |
Depreciation and amortization | | | (177 | ) | | | (163 | ) | | | (147 | ) | | | (53 | ) | | | — | | | | (540 | ) |
Discontinued operations | | | — | | | | — | | | | — | | | | — | | | | (64 | ) | | | (64 | ) |
| | | | | | | | | | | | | | | | | | | | | | | | |
Operating loss | | $ | (496 | ) | | $ | (234 | ) | | $ | (279 | ) | | $ | (49 | ) | | $ | (60 | ) | | | (1,118 | ) |
| | | | | | | | | | | | | | | | | | | | | | | | |
Other income, net | | | | | | | | | | | | | | | | | | | | | | | 24 | |
Reorganization items | | | | | | | | | | | | | | | | | | | | | | | 10,210 | |
| | | | | | | | | | | | | | | | | | | | | | | | |
Income from continuing operations before income taxes and equity loss | | | | | | | | | | | | | | | | | | | | | | | 9,116 | |
Income tax benefit | | | | | | | | | | | | | | | | | | | | | | | 311 | |
Equity loss, net of tax | | | | | | | | | | | | | | | | | | | | | | | (36 | ) |
Loss from discontinued operations, net of tax | | | | | | | | | | | | | | | | | | | | | | | (44 | ) |
| | | | | | | | | | | | | | | | | | | | | | | | |
Net income | | | | | | | | | | | | | | | | | | | | | | $ | 9,347 | |
Net income attributable to noncontrolling interest | | | | | | | | | | | | | | | | | | | | | | | 29 | |
| | | | | | | | | | | | | | | | | | | | | | | | |
Net income attributable to Predecessor | | | | | | | | | | | | | | | | | | | | | | $ | 9,318 | |
| | | | | | | | | | | | | | | | | | | | | | | | |
| | | | | | | | | | | | | | | | | | | | | | | | |
| | | Predecessor | |
| | | Electronics
and Safety | | | Powertrain
Systems | | | Electrical/
Electronic
Architecture | | | Thermal
Systems | | | Eliminations
and Other | | | Total | |
| | | (in millions) | |
2008: | | | | | | | | | | | | | | | | | | | | | | | | |
Adjusted EBITDA | | $ | — | | | $ | 251 | | | $ | 195 | | | $ | 76 | | | $ | (253 | ) | | $ | 269 | |
Transformation and rationalization charges: | | | | | | | | | | | | | | | | | | | | | | | | |
U.S. employee workforce transition program charges | | | — | | | | — | | | | — | | | | — | | | | (69 | ) | | | (69 | ) |
GM settlement — MRA | | | 42 | | | | 94 | | | | 15 | | | | 88 | | | | (50 | ) | | | 189 | |
Employee termination benefits and other exit costs | | | (150 | ) | | | (69 | ) | | | (82 | ) | | | (25 | ) | | | — | | | | (326 | ) |
Loss on divestitures | | | (13 | ) | | | (14 | ) | | | — | | | | — | | | | — | | | | (27 | ) |
Other transformation and rationalization costs | | | (78 | ) | | | (44 | ) | | | (63 | ) | | | (14 | ) | | | (48 | ) | | | (247 | ) |
| | | | | | | | | | | | | | | | | | | | | | | | |
EBITDA | | $ | (199 | ) | | $ | 218 | | | $ | 65 | | | $ | 125 | | | $ | (420 | ) | | | (211 | ) |
| | | | | | | | | | | | | | | | | | | | | | | | |
Depreciation and amortization | | | (261 | ) | | | (269 | ) | | | (205 | ) | | | (87 | ) | | | — | | | | (822 | ) |
Goodwill impairment | | | (157 | ) | | | — | | | | (168 | ) | | | — | | | | — | | | | (325 | ) |
Discontinued operations | | | — | | | | — | | | | — | | | | — | | | | (67 | ) | | | (67 | ) |
| | | | | | | | | | | | | | | | | | | | | | | | |
Operating (loss) income | | $ | (617 | ) | | $ | (51 | ) | | $ | (308 | ) | | $ | 38 | | | $ | (487 | ) | | | (1,425 | ) |
| | | | | | | | | | | | | | | | | | | | | | | | |
Interest expense | | | | | | | | | | | | | | | | | | | | | | | (434 | ) |
Other income, net | | | | | | | | | | | | | | | | | | | | | | | 9 | |
Reorganization items | | | | | | | | | | | | | | | | | | | | | | | 5,147 | |
| | | | | | | | | | | | | | | | | | | | | | | | |
Income from continuing operations before income taxes and equity income | | | | | | | | | | | | | | | | | | | | | | | 3,297 | |
Income tax expense | | | | | | | | | | | | | | | | | | | | | | | (163 | ) |
Equity income, net of tax | | | | | | | | | | | | | | | | | | | | | | | 29 | |
Loss from discontinued operations, net of tax | | | | | | | | | | | | | | | | | | | | | | | (97 | ) |
| | | | | | | | | | | | | | | | | | | | | | | | |
Net income | | | | | | | | | | | | | | | | | | | | | | $ | 3,066 | |
Net income attributable to noncontrolling interest | | | | | | | | | | | | | | | | | | | | | | | 29 | |
| | | | | | | | | | | | | | | | | | | | | | | | |
Net income attributable to Predecessor | | | | | | | | | | | | | | | | | | | | | | $ | 3,037 | |
| | | | | | | | | | | | | | | | | | | | | | | | |
Net sales and gross margin as a percentage of net sales for the periods from August 19 to December 31 and January 1 to October 6, 2009 and the year ended December 31, 2008 by segment are as follows:
Net Sales by Segment
| | | | | | | | | | | | | | | | | | | | | | | | | | | | | | | | | | | | | | | | | | | | |
| | | Successor | | | | | Predecessor | | | | | Variance due to: | |
| | | Period
from
August 19
to
December
31, 2009 | | | | | Period
from
January 1
to
October
6, 2009 | | | Year ended
December
31, 2008 | | | Full year
2009 versus
2008
favorable/
(unfavorable) | | | | | Operations
not
acquired | | | Volume, net
of contractual
price
reductions | | | Commodity
pass-
through | | | FX | | | Other | | | Total | |
| | | (in
millions) | | | | | (in millions) | | | | | (in millions) | |
Electronics and Safety | | $ | 761 | | | | | $ | 1,801 | | | $ | 4,048 | | | $ | (1,486 | ) | | | | $ | (67 | ) | | $ | (1,263 | ) | | $ | — | | | $ | (155) | | | $ | (1) | | | $ | (1,486) | |
Powertrain Systems | | | 957 | | | | | | 2,667 | | | | 5,368 | | | | (1,744 | ) | | | | | (186 | ) | | | (1,224 | ) | | | — | | | | (328 | ) | | | (6 | ) | | | (1,744 | ) |
Electrical/ Electronic Architecture | | | 1,325 | | | | | | 2,970 | | | | 5,649 | | | | (1,354 | ) | | | | | — | | | | (1,043 | ) | | | (160 | ) | | | (152 | ) | | | 1 | | | | (1,354 | ) |
Thermal Systems | | | 365 | | | | | | 1,008 | | | | 2,121 | | | | (748 | ) | | | | | (110 | ) | | | (558 | ) | | | (23 | ) | | | (58 | ) | | | 1 | | | | (748 | ) |
Eliminations and Other | | | 13 | | | | | | (112 | ) | | | (378 | ) | | | 279 | | | | | | 203 | | | | 71 | | | | — | | | | 8 | | | | (3 | ) | | | 279 | |
| | | | | | | | | | | | | | | | | | | | | | | | | | | | | | | | | | | | | | | | | | | | |
Total | | $ | 3,421 | | | | | $ | 8,334 | | | $ | 16,808 | | | $ | (5,053 | ) | | | | $ | (160 | ) | | $ | (4,017 | ) | | $ | (183 | ) | | $ | (685 | ) | | $ | (8 | ) | | $ | (5,053 | ) |
| | | | | | | | | | | | | | | | | | | | | | | | | | | | | | | | | | | | | | | | | | | | |
Eliminations and Other includes $75 million of keep site facilitation reimbursements recognized by the Predecessor during the period from January 1 to October 6, 2009 as a result of the Amended MRA, which became effective in September 2008 (refer to “Note 3. Elements of Predecessor Transformation Plan” to the audited consolidated financial statements included herein for more information.)
Foreign exchange fluctuations are primarily related to the Mexican Peso, Euro, Chinese Renminbi, Turkish Lira and Brazilian Real.
Gross Margin Percentage by Segment
| | | | | | | | | | | | | | |
| | | Successor | | | | | Predecessor | |
| | | Period from
August 19 to
December 31, 2009 | | | | | Period from
January 1
to October
6, 2009 | | | Year
ended
December
31, 2008 | |
Electronics and Safety | | | 7.9 | % | | | | | (12.9 | %) | | | 0.7 | % |
Powertrain Systems | | | 10.1 | % | | | | | 2.6 | % | | | 9.1 | % |
Electrical/Electronic Architecture | | | 14.5 | % | | | | | 1.4 | % | | | 6.4 | % |
Thermal Systems | | | 5.5 | % | | | | | 3.2 | % | | | 9.7 | % |
Eliminations and Other | | | 38.5 | % | | | | | 49.1 | % | | | 114.3 | % |
Total | | | 10.9 | % | | | | | (1.8 | )% | | | 3.9 | % |
EBITDA by Segment
| | | | | | | | | | | | | | | | | | | | | | | | | | | | | | | | | | | | | | | | |
| | | Successor | | | | | Predecessor | | | | | Variance due to: | |
| | | Period
from
August 19
to
December
31, 2009 | | | | | Period
from
January 1
to
October
6, 2009 | | | Year ended
December
31, 2008 | | | Full year 2009
versus 2008
favorable/
(unfavorable) | | | | | Operations
not
Acquired | | | Volume, net
of
contractual
price
reductions | | | Operational
performance | | | Other | | | Total | |
| | | (in
millions) | | | | | (in millions) | | | | | (in millions) | |
Electronics and Safety | | $ | 17 | | | | | $ | (319 | ) | | $ | (199 | ) | | $ | (103 | ) | | | | $ | 2 | | | $ | (485 | ) | | $ | 363 | | | $ | 17 | | | $ | (103 | ) |
Powertrain Systems | | | 9 | | | | | | (71 | ) | | | 218 | | | | (280 | ) | | | | | 17 | | | | (503 | ) | | | 338 | | | | (132 | ) | | | (280 | ) |
Electrical/Electronic Architecture | | | 94 | | | | | | (132 | ) | | | 65 | | | | (103 | ) | | | | | — | | | | (418 | ) | | | 294 | | | | 21 | | | | (103 | ) |
Thermal Systems | | | 8 | | | | | | 4 | | | | 125 | | | | (113 | ) | | | | | 3 | | | | (173 | ) | | | 138 | | | | (81 | ) | | | (113 | ) |
Eliminations and Other | | | 1 | | | | | | 4 | | | | (420 | ) | | | 425 | | | | | | 137 | | | | (321 | ) | | | 260 | | | | 349 | | | | 425 | |
| | | | | | | | | | | | | | | | | | | | | | | | | | | | | | | | | | | | | | | | |
Total | | $ | 129 | | | | | $ | (514 | ) | | $ | (211 | ) | | $ | (174 | ) | | | | $ | 159 | | | $ | (1,900 | ) | | $ | 1,393 | | | $ | 174 | | | $ | (174 | ) |
| | | | | | | | | | | | | | | | | | | | | | | | | | | | | | | | | | | | | | | | |
As noted in the table above, Full Year 2009 EBITDA as compared to 2008 EBITDA was impacted by divestitures, volume, contractual price reductions, and operational performance improvements, which include favorable manufacturing and engineering performance offset by unfavorable material and freight economics, as well as the following items included in Other in the table above:
Increased warranty costs, primarily due to the forgiveness of $112 million due under the warranty settlement agreement with GM during 2008 and the absence of $28 million in warranty recovery in the Thermal Systems segment from an affiliated supplier recognized in 2008 related to previously incurred warranty costs.
$35 million of increased costs associated with restructuring activities resulting in employee termination benefit cost reductions, including $26 million and $67 million in the Powertrain Systems and
| | Electrical/Electronic Architecture segments, respectively, offset by decreased costs of $39 million, $9 million and $10 million in the Electronics and Safety, Thermal Systems and Eliminations and Other segments, respectively. |
Unfavorable foreign currency exchange impact of $174 million including $66 million, $78 million, $22 million and $8 million in the Electronics and Safety, Powertrain Systems, Electrical/Electronic Architecture and Thermal Systems segments, respectively.
Approximately $200 million of decreases in pension and OPEB in the Eliminations and Other segment.
$240 million of decreased SG&A as a result of the positive effects of cost savings initiatives.
Liquidity and Capital Resources
Overview of Capital Structure
As of March 31,June 30, 2011, after giving effect to the extinguishment of the Old Notes, the modification of our credit agreement and the issuance of the Senior Notes on May 17, 2011, each as described below, we had cash and cash equivalents of $1.3 billion and net debt (defined as outstanding debt less cash and cash equivalents) of $1.1 billion.$914 million. We also have access to additional liquidity pursuant to the terms of the revolving facilityRevolving Credit Facility as described below. Based on this, we believe we possess sufficient liquidity to fund our operations and capital investments in 2011 and beyond.
On March 31, 2011, Delphi Automotive LLPwe redeemed all outstanding Class A and Class C membership interests for $3,791 million and $594 million, respectively and we incurred transaction-related fees and expenses totaling approximately $181$180 million, including amounts paid to certain interest holders. In addition, we obtained necessary consents to the redemption of the Class A and Class C membership interests and modified and eliminated specific rights provided to these interest holders under its limited liability partnership agreement.the LLP Agreement. Subsequent to the redemption transaction on March 31, 2011, Delphi Automotive LLP’sour membership interest equity is comprised of a single voting class of membership interests, our Class B membership interests. In addition to this class of voting membership interests, non-voting Class E-1 membership interests are held by Delphi Automotive LLP’sour Board of Managers.
On July 12, 2011, the LLP Agreement was amended and restated by the Fourth Amended and Restated Limited Liability Partnership Agreement of Delphi Automotive LLP (the “Fourth LLP Agreement”). The Fourth LLP Agreement was undertaken to further position us for this offering. Refer to “Initial Public Offering Considerations” below and “Note 18. Subsequent Events” to the unaudited consolidated financial statements included herein for additional information.
Credit Agreement
To financeIn conjunction with the redemption of membership interests from Class A and Class C holders, Delphi Corporation entered into a credit agreement (the “Credit Agreement”) with JPMorgan Chase Bank, N.A., as lead arranger and administrative agent, with respect to $3.0 billion in senior secured credit facilities (the “Credit Facility”Facilities”). The Credit Agreementoriginal credit agreement was amended and modified on May 17, 2011 (the “Credit Agreement”) and now consists of a $1.2 billion 5-year senior secured revolving credit facility (the “revolving facility”“Revolving Credit Facility”), a $258 million senior secured 5-year term A loan (the “Tranche A Term Loan”) and a $950 million senior secured 6-year term B loan (the “Tranche B Term Loan”). As a result of the amendment, $1.3 billion of the Tranche B Term Loan was repaid, net of $6 million of related discount. During June 2011, $36.5 million and $137.5 million of the Tranche A Term Loan and Tranche B Term Loan, respectively, were repaid under the Credit Agreement. In conjunction with the June 2011 repayments, approximately $8 million of debt issuance costs were extinguished. The revolving facilityRevolving Credit Facility was undrawn at March 31,June 30, 2011. As of March 31,June 30, 2011, we had approximately $20$19 million in letters of credit issued under the Credit Agreement. Letters of credit issued under the Credit Agreement reduce availability under the revolving facility.Revolving Credit Facility.
The Credit Agreement carries an interest rate, at Delphi Corporation’s option, of either (a) the Administrative Agent’s Alternate Base Rate (“ABR” as defined in the Credit Agreement) plus (i) with respect to the revolving facilityRevolving Credit Facility and the Tranche A Term Loan, 1.75% per annum or (ii) with respect to the Tranche B Term Loan, 1.50% per annum, or (b) the London Interbank Offered Rate (the “Adjusted LIBO Rate” as defined in the Credit Agreement) (“LIBOR”) plus (i) with respect to the revolving facilityRevolving Credit Facility and the Tranche A Term Loan, 2.75% per annum or (ii) with respect to the Tranche B Term Loan, 2.50% per annum. The Tranche B Term Loan includes a LIBOR floor of 1.00%.
The interest rate period with respect to the LIBOR interest rate option can be set at one-, two-, three-, or six-months as selected by us in accordance with the terms of the Credit Agreement (or
other period as may be agreed to by all the applicable lenders), but payable no less than quarterly. Delphi Corporation may elect to change the selected interest rate over the term of the Credit FacilityFacilities in accordance with the provisions of the Credit Agreement. The applicable interest rates listed above for the revolving facilityRevolving Credit Facility and the Tranche A Term Loan may increase or decrease from time to time by 0.25% based upon changes to Delphi Automotive LLP’sour corporate credit ratings. Accordingly, the interest rate will fluctuate during the term of the Credit Agreement based on changes in the Alternate Base Rate,ABR, LIBOR or future changes in Delphi Automotive LLP’sour corporate credit ratings. Upon completion of this offering, the applicable interest rates for the Tranche A Term Loan and revolving facility will be reduced by 25 basis points.
The Credit Agreement also requires that Delphi Corporation pay certain commitment fees on the unused portion of the revolving facilityRevolving Credit Facility and certain letter of credit issuance and fronting fees.
Delphi Corporation is obligated to make quarterly principal payments throughout the terms of the Tranche A and Tranche B Term Loans according to the amortization schedule in the Credit Agreement. In conjunction with the June 2011 repayments, all quarterly principal payment obligations prior to maturity have been satisfied for the Tranche B Term Loan and quarterly principal payments have been satisfied through June 30, 2013 and partially satisfied for September 30, 2013 for the Tranche A Term Loan. Borrowings under the Credit Agreement are prepayable at Delphi Corporation’sour option without premium or penalty.penalty, provided that any prepayment of the Tranche B Term Loan is accompanied by a pro rata payment of the Tranche A Term Loan (based on the respective amounts then outstanding). Delphi Corporation may request that all or a portion of the Term Loans be converted to extend the scheduled maturity date(s) with respect to all or a portion of any principal amount of such Term Loans under certain conditions. The Credit Agreement also contains certain mandatory prepayment provisions in the event Delphi Automotive LLP generateswe generate excess cash flow (as defined in the Credit Agreement) or we receive net cash proceeds from any asset sale or casualty event.
As of March 31,June 30, 2011, Delphi Corporation selected the ABRone-month LIBOR interest rate option, as detailed in the table below, and the amounts outstanding, net of the discount (in millions) and rates effective as of March 31,June 30, 2011 were:
| | | | ABR plus | | | Borrowings as
of March 31,
2011 | | | Rates effective
as of
March 31,
2011 | | | LIBOR plus | | | Borrowings as
of June 30,
2011 | | | Rates effective
as of June 30,
2011 | |
Revolving Facility | | | 2.25% | | | $ | — | | | | — | % | |
Revolving Credit Facility | | | | 2.75% | | | $ | — | | | | — | % |
Tranche A Term Loan | | | 2.25% | | | $ | 250 | | | | 5.50 | % | | | 2.75% | | | $ | 221 | | | | 3.00 | % |
Tranche B Term Loan | | | 2.50% | | | $ | 2,250 | | | | 5.75 | % | | | 2.50% | | | $ | 810 | | | | 3.50 | %* |
Subsequent to March 31, 2011, Delphi Corporation elected to change to the LIBOR interest rate option for a one-month period for both the Tranche A Term Loan and the Tranche B Term Loan.
| * | Includes a LIBOR floor of 1.00%. |
The Credit Agreement contains certain covenants that limit, among other things, Delphi Automotive LLP’sour (and itsour subsidiaries’) ability to incur additional indebtedness or liens, to dispose of assets, to make certain investments, to prepay certain indebtedness and to pay dividends, or to make other distributions or redemptions, in respect of our equity interests. In addition, the Credit Agreement requires that Delphi Automotive LLPwe maintain a consolidated leverage ratio (the ratio of Consolidated Total Indebtedness to Consolidated EBITDA, each as defined in the Credit Agreement) of less than 2.75 to 1.0. The Credit Agreement also contains events of default customary for financings of this type. We were in compliance with the Credit Agreement covenants as of March 31,June 30, 2011.
The Tranche A Term Loan and the Tranche B Term Loan were each issued under the original Credit Agreement at a 0.5% discount and we paid approximately $92$86 million of additional debt issuance costs in connection with the Credit Facility.Facilities. The discount and debt issuance costs are being amortized over the life of the facility. The May modification to the Credit Facility.Agreement reduced the discount related to the Tranche B Term Loan to 0.25%.
All obligations under the Credit Agreement are borrowed by Delphi Corporation, a wholly-owned U.S. subsidiary of Delphi Automotive LLP, jointly and severally guaranteed by Delphi Corporation’sits direct and indirect parent companies and by certain of Delphi Automotive LLP’s existing and future direct and indirect domestic subsidiaries, subject to certain exceptions set forth in the Credit Agreement. All obligations under the Credit Agreement, including the guarantees of those obligations, are secured by certain assets of Delphi Corporation and the guarantors, including substantially all of the assets of Delphi Automotive LLP, and those of
Delphi Corporation and its domestic subsidiaries, and certain assets of Delphi Corporation’s direct and indirect parent companies.
Senior Notes
On May 17, 2011, Delphi Corporation, a wholly-owned U.S. subsidiary of Delphi Automotive LLP, issued $500 million of 5.875% senior notes due 2019 and $500 million of 6.125% senior notes due 2021 (the “Senior Notes”) in a transaction exempt from registration under Rule 144A and Regulation S of the Securities Act. The Senior Notes are fully and unconditionally guaranteed, jointly and severally, by Delphi Automotive LLP and certain of its existing and future subsidiaries. Interest is payable semi-annually on May 15 and November 15 of each year, beginning on November 15, 2011. Interest accrues from May 17, 2011. We paid approximately $23 million of additional debt issuance costs in connection with the Senior Notes. The net proceeds of approximately $1.0 billion together withas well as cash on hand were used to pay down amounts outstanding under Tranche B Term Loan of the Credit Agreement.
The indenture governing the Senior Notes limits, among other things, Delphi Automotive LLP’sour (and itsour subsidiaries’) ability to incur additional indebtedness or liens, dispose of assets, make certain restricted payments or investments, enter into transactions with affiliates or merge with or into other entities.
Acquisition Financing
In connection with the Acquisition, (i) Delphi Automotive LLP issued $41 million in the Old Notessenior unsecured five-year notes (the “Old Notes”) pursuant to a note purchase agreementNote Purchase Agreement (the “NPA”) with an Acquisition Date fair value of $49 million and (ii) entered into a senior secured delayed draw term loan facility (the “DDTL”) with a syndicate of lenders. The Old Notes paid 12% interest and were scheduled to mature on October 6, 2014. The DDTL permitted borrowings of up to $890 million, consisting of a U.S. tranche of up to $267 million in borrowings and a foreign tranche of up to $623 million in borrowings. There was no commitment fee associated with the DDTL, but, if drawn, we were required to pay interest at the rate of LIBOR plus 6.0% per annum, with a minimum LIBOR amount of 2.0% per annum. The DDTL had a term of 5 years. A majority of the holders of the Old Notes and the lenders under the DDTL were related parties as holders of the Class A and Class B membership interests. See “Relationships and Related Party Transactions.”
In connection with the redemption of the Class A and Class C membership interests on March 31, 2011 and entry into the Credit Agreement, each of the DDTL and the NPA was terminated (including the termination, discharge and release of all security and guarantees granted in connection with the DDTL)DDTL and the NPA) and we paid approximately $57 million to redeem the Old Notes in full. In connection with the termination of the Old Notes, we incurred early termination penalties and recognized a loss on extinguishment of debt of approximately $9 million in the first quarter of 2011.
Other Financing and Liquidity
Accounts receivable factoring—We maintain various accounts receivable factoring facilities in Europe that are accounted for as short-term debt. These uncommitted factoring facilities are available through various
financial institutions. As of March 31,June 30, 2011 and December 31, 2010, $159$130 million and $112 million, respectively, was outstanding under these accounts receivable factoring facilities.
Capital leases and other—As of March 31,June 30, 2011 and December 31, 2010, approximately $104$75 million and $130 million, respectively, of other debt issued by certain international subsidiaries was outstanding, primarily related to bank lines in Asia Pacific and capital lease obligations.
DOE grant—As part of the American Recovery & Reinvestment Act of 2009, we and the U.S. Department of Energy (“DOE”) finalized a grant agreement through which the DOE will reimburse us for 50% of project costs up to total reimbursements of $89 million associated with the development and manufacturing of power electronics related to electric and hybrid electric vehicles. The project period for this grant is January 2010
through December 2012. As of March 31,June 30, 2011, we have received from the DOE related project cost reimbursements of $33$44 million. During 2011 and 2012, we expect to receive related project cost reimbursements from the DOE of approximately $34$33 million and $28$27 million, respectively.
Warranty settlement—On April 30, 2011, Delphi paid €90 million (approximately $133 million at April 30, 2011 exchange rates) under the terms of a March 2011 warranty settlement. Delphi is also required to make a €60 million (approximately $89$86 million at AprilJune 30, 2011 exchange rates) payment on April 30, 2012 related to this settlement.
Tax distribution—Under the terms of the Third Amended and Restated Limited Liability PartnershipLLP Agreement, of Delphi Automotive LLP (the “Revised LLP Agreement”), if the Board of Managers determines that there is available cash (as defined in the Revised LLP Agreement), the Class B and E-1 members will receive a distribution of available cash to enable the members to pay projected tax liabilities attributable to tax book profits and losses by us that are attributable to their membership interests. Any tax distributions will be treated as an advance of amounts otherwise distributable to the members.
Contractual Commitments
The following table summarizes our expected cash outflows resulting from financial contracts and commitments as of December 31, 2010. We have not included information on our recurring purchases of materials for use in our manufacturing operations. These amounts are generally consistent from year to year, closely reflect our levels of production, and are not long-term in nature. The amounts below exclude as of December 31, 2010, the gross liability for uncertain tax positions of $82 million related to the items below. The amounts below also exclude estimated interest costs, which are approximately $20 million for 2011, primarily related to debt and capital lease obligations. Additionally, the principal maturities of debt exclude accretion of approximately $6 million related to the Old Notes. We do not expect a significant payment related to these obligations to be made within the next twelve months. We are not able to provide a reasonably reliable estimate of the timing of future payments relating to the non-current portion of obligations associated with uncertain tax positions. For more information, refer to “Note 16. Income Taxes” to the audited consolidated financial statements included herein.
| | | | | | | | | | | | | | | | | | | | |
| | | Payments due by Period | |
| | | Total | | | 2011 | | | 2012 & 2013 | | | 2014 & 2015 | | | Thereafter | |
| | | (in millions) | |
Debt and capital lease obligations | | $ | 283 | | | $ | 218 | | | $ | 13 | | | $ | 48 | | | $ | 4 | |
Operating lease obligations | | | 301 | | | | 80 | | | | 119 | | | | 78 | | | | 24 | |
Contractual commitments for capital expenditures | | | 116 | | | | 116 | | | | — | | | | — | | | | — | |
Other contractual purchase commitments, including information technology | | | 129 | | | | 81 | | | | 44 | | | | 4 | | | | — | |
| | | | | | | | | | | | | | | | | | | | |
Total | | $ | 829 | | | $ | 495 | | | $ | 176 | | | $ | 130 | | | $ | 28 | |
| | | | | | | | | | | | | | | | | | | | |
We also have significant obligations to make payments to management under our Value Creation Plan that are not reflected in the table above. See “Note 22. Share-Based Compensation” to the audited consolidated financial statements included herein for additional information.
Capital Expenditures
Supplier selection in the auto industry is generally finalized several years prior to the start of production of the vehicle. Therefore, current capital expenditures are based on customer commitments entered into previously, generally several years ago when the customer contract was awarded. As of December 31, 2010, we had approximately $116 million in outstanding cancelable and non-cancelable capital commitments. Capital expenditures by operating segment and geographic region for the periods presented were:
| | | | | | | | | | | | | | | | | | |
| | | Successor | | | | | Predecessor | |
| | | Year ended
December 31,
2010 | | | Period from
August 19 to
December 31,
2009 | | | | | Period from
January 1 to
October 6,
2009 | | | Year ended
December 31,
2008 | |
| | | (in millions) | | | | | (in millions) | |
Electronics and Safety | | $ | 59 | | | $ | 14 | | | | | $ | 58 | | | $ | 166 | |
Powertrain Systems | | | 186 | | | | 41 | | | | | | 167 | | | | 310 | |
Electrical/Electronic Architecture | | | 202 | | | | 21 | | | | | | 60 | | | | 179 | |
Thermal Systems | | | 35 | | | | 8 | | | | | | 29 | | | | 98 | |
Eliminations and Other | | | 18 | | | | 4 | | | | | | 7 | | | | 18 | |
| | | | | | | | | | | | | | | | | | |
Continuing operations capital expenditures | | | 500 | | | | 88 | | | | | | 321 | | | | 771 | |
| | | | | | | | | | | | | | | | | | |
Discontinued operations | | | — | | | | — | | | | | | 99 | | | | 187 | |
| | | | | | | | | | | | | | | | | | |
Total capital expenditures | | $ | 500 | | | $ | 88 | | | | | $ | 420 | | | $ | 958 | |
| | | | | | | | | | | | | | | | | | |
North America | | $ | 140 | | | $ | 21 | | | | | $ | 91 | | | $ | 278 | |
Europe, Middle East & Africa | | | 236 | | | | 51 | | | | | | 187 | | | | 329 | |
Asia Pacific | | | 87 | | | | 6 | | | | | | 28 | | | | 123 | |
South America | | | 37 | | | | 10 | | | | | | 15 | | | | 41 | |
| | | | | | | | | | | | | | | | | | |
Continuing operations capital expenditures | | | 500 | | | | 88 | | | | | | 321 | | | | 771 | |
| | | | | | | | | | | | | | | | | | |
Discontinued operations | | | — | | | | — | | | | | | 99 | | | | 187 | |
| | | | | | | | | | | | | | | | | | |
Total capital expenditures | | $ | 500 | | | $ | 88 | | | | | $ | 420 | | | $ | 958 | |
| | | | | | | | | | | | | | | | | | |
Cash Flows
Intra-month cash flow cycles vary by region, but in general we are users of cash through the first half of a typical month and we generate cash during the latter half of a typical month. Due to this cycle of cash flows, we may utilize short-term financing, including our Revolving Credit Facility, to manage our intra-month working capital needs. Our cash balance typically peaks at month end.
Cash in the U.S. is managed centrally through a U.S. cash pooling arrangement. During 2010, Delphi began the process of establishing a pan-European cash pool. As of March 31,June 30, 2011, certain European countries were participating in the European cash pool. Additional European countries are scheduled to join the European cash pool in the coming quarter. Delphi anticipates that the pan-European cash pool will become fully operational by the end of 2011. Outside the U.S. and those countries participating in the pan-European cash pool, cash may be managed through a country cash pool, a self-managed cash flow arrangement or a combination of the two depending on Delphi’s presence in the respective country.
Operating Activities. Net cash provided by operating activities totaled $156$499 million and $246$626 million for the threesix months ended March 31,June 30, 2011 and 2010, respectively. The $90$127 million decrease primarily reflects higher
working capital requirements resulting principally from increased volumes, partially offset by higher earnings. Cash flow from operating activities for the threesix months ended March 31,June 30, 2011 consisted of net earnings of $310$626 million increased by $117$233 million for non-cash charges for depreciation and amortization, partially offset by $282$387 million related to changes in operating assets and liabilities, net of restructuring and pension and other
postretirement contributions. Cash flow from operating activities for the threesix months ended March 31,June 30, 2010 consisted of net earnings of $235$468 million increased by $99$206 million for non-cash charges for depreciation and amortization, partially offset by $100$53 million related to changes in operating assets and liabilities, net of restructuring and pension and other postretirement contributions.
Net cash provided by operating activities totaled $1,142 million for the year ended December 31, 2010, which resulted primarily from improved operating earnings resulting from increased sales growth and improved operational performance resulting from previous restructuring activities. These improvements resulted in the significant cash flow generated from operations, which consisted of net earnings of $703 million increased by $421 million for non-cash charges for depreciation and amortization, partially offset by $9 million related to changes in operating assets and liabilities, net of restructuring and pension and other postretirement contributions.
Net cash provided by operating activities totaled $159 million for the Successor period from August 19 to December 31, 2009, which resulted primarily from the improvements in OEM production volumes during the fourth quarter of 2009, resulting in near break-even net earnings increased by $139 million for non-cash charges for depreciation and amortization. Net cash used in operating activities totaled $257 million for the Predecessor period from January 1 to October 6, 2009, which primarily reflected the decreased OEM production volumes during this period.
Net cash provided by operating activities totaled $455 million for the year ended December 31, 2008, reflecting the net cash received from GM totaling $1.1 billion as a result of the effectiveness of the Amended GSA and the Amended MRA as further described in “Note 3. Elements of Predecessor Transformation Plan” to the audited consolidated financial statements included herein. Offsetting this cash received, cash flow from operating activities was negatively impacted by operating challenges due to lower North American production volumes, related pricing pressures stemming from increasingly competitive markets and the overall slowdown in the global economy. Cash flow from operating activities was further reduced for the year ended December 31, 2008 by contributions to our U.S. and non-U.S. pension plans of $383 million and OPEB payments of $216 million, cash paid to employees in conjunction with the U.S. employee workforce transition programs of $219 million, payments of $442 million of interest and $78 million of incentive compensation to executives and U.S. salaried employees, and payments of $104 million of reorganization related costs.
Investing Activities. Net cash provided by investing activities totaled $433$311 million and net cash used in investing activities totaled $98$260 million for the threesix months ended March 31,June 30, 2011 and 2010, respectively. The increase is primarily due to the net change of $650$750 million related to maturities/purchases of time deposits, partially offset by an $88a $113 million increase in capital expenditures and $32$45 million decrease in proceeds from divestitures.
Net cash used in investing activities totaled $911 million for the year ended December 31, 2010, which resulted primarily from capital expenditures of $500 million, or approximately 3.6% of net sales. We continually focus on selectively expending capital to support new business as well as to maximize cost efficiencies. Net cash used was also impacted by the purchase of $550 million of time deposits, net of time deposit maturities during the year. Partially offsetting these items were net proceeds of $93 million received from divestitures and sales of property, principally the sale of the occupant protection systems business in Asia.
Net cash provided by investing activities totaled $885 million for the Successor period from August 19 to December 31, 2009, which resulted primarily from $862 million acquired from the Predecessor as a result of the Acquisition. In addition, cash used for capital expenditures of $88 million for the Successor period from August 19 to December 31, 2009 were offset by $74 million in proceeds from the sale of the brakes and
suspensions and occupant protection systems businesses and a $28 million decrease in restricted cash. Net cash used in investing activities totaled $1,052 million for the Predecessor period from January 1 to October 6, 2009, which resulted primarily from $862 million acquired by the Successor as a result of the Acquisition.
Additionally, cash used for capital expenditures of $321 million for the Predecessor period from January 1 to October 6, 2009 was offset by decreases in restricted cash of $142 million.
Cash flows used in investing activities totaled $958 million for the year ended December 31, 2008. The principal use of cash in 2008 reflected capital expenditures related to ongoing operations and an increase in restricted cash related to the U.S. employee workforce transition programs of approximately $230 million. The increase in restricted cash during the year ended December 31, 2008 primarily related to a total of the $323 million of cash collateral required under the debtor-in-possession credit facility, including $123 million related to outstanding letters of credit at December 31, 2008, offset by attrition payments. Offsetting the cash flows used in investing activities were proceeds from divestitures.
Financing Activities. Net cash used in financing activities totaled $2,204$2,757 million and net cash provided by financing activities totaled $52$47 million for the threesix months ended March 31,June 30, 2011 and 2010, respectively. Net cash used in financing activities for the threesix months ended March 31,June 30, 2011 was driven by the redemption of membership interests for $4,557$4,566 million, offset by the net proceeds received, net of repayments, from the issuance of debt to partially fund the redemption transaction net ofand the repayment of the Old Notes, of $2,339$1,866 million.
Net cash used in financing activities totaled $126 million for the year ended December 31, 2010, which resulted from $99 million of net repayments under debt agreements and $27 million of dividend payments to minority shareholders of consolidated affiliates.
Net cash provided by financing activities totaled $2,062 million for the Successor period from August 19 to December 31, 2009, which resulted from the $2,042 million of cash received associated with the issuance of Class A and Class B membership interests in us. Net cash provided by financing activities totaled $315 million for the Predecessor period from January 1 to October 6, 2009. During this period the Predecessor received $850 million under GM liquidity support agreements and repaid $488 million under the amended and restated debtor-in-possession facility and short-term debt agreements.
Net cash provided by financing activities was $465 million for the year ended December 31, 2008 and primarily reflected increased borrowings under the amended and restated debtor-in-possession credit facility.
Initial Public Offering Considerations
Under certain conditions with respect to an initial public offering or a change in control, as defined in the Board of Managers 2010 Class E-1 Interest Incentive Plan, any interests that have not yet vested may immediately vest. All unvested Class E-1 membership interests will fully vest in the event of a completed initial public offering if the resulting total equity valuation of the Company (based on the average closing price of our ordinary shares during the 15-day period beginning on the 30th day after the closing of the offering), plus the value of prior distributions made under the LLP Agreement to holders of membership interests (as well as $4.4 billion paid to repurchase Class A and Class C membership interests (see “Note 1. Description of Business” to the unaudited consolidated financial statements included herein) and any amounts distributed to holders of Class E-1 membership interests with respect to or to repurchase their Class E-1 membership interests), is at least $6 billion. In addition, upon the completion of an initial public offering, all outstanding membership interests will be converted to ordinary shares. Approximately $10 million of compensation expense will be recognized through the remainder of the vesting period. This amount would be recognized immediately if the criteria for immediate vesting are met.
The Fourth LLP Agreement was undertaken to further position us for a potential initial public offering, including, among other provisions, the creation of drag-along rights that require, if holders of a majority of Class B membership interests request, that all Class B membership interest holders sell a portion of their holdings in an initial public offering, with Delphi paying for the cost of the underwriting spread.
Pension Plans and Other Postretirement Benefits
Prior to the PBGC termination of the U.S. pension plans, the Predecessor sponsored pension plans covering employees in the U.S., which generally provided benefits of stated amounts for each year of service, as well as supplemental benefits for employees who qualified for retirement before normal retirement age. Certain employees also participated in non-qualified pension plans covering executives, which are based on targeted wage replacement percentages and are unfunded. The Predecessor froze the salaried plan, the Supplemental Executive Retirement Program, the ASEC Manufacturing Retirement Program, the Delphi Mechatronics Retirement Program and the PHI Non-Bargaining Retirement Plan (collectively, the “Pension Plans”) effective September 30, 2008. Additionally, the Predecessor reached agreement with its labor unions resulting in a freeze of traditional benefit accruals under the Delphi hourly-rate employees pension plan effective as of November 30, 2008.
The PBGC terminated the Pension Plans on July 31, 2009. Accordingly, the Predecessor recognized a pension curtailment and settlement loss of $2.8 billion included in reorganization items in the consolidated statements of operations for the three and nine month periods ended September 30, 2009. This loss included the reversal of $5.2 billion of liabilities subject to compromise related to the Pension Plans offset by the recognition of $5.0 billion of related unamortized losses previously recorded in accumulated other comprehensive income and the recognition of a $3.0 billion allowed general unsecured non-priority claim granted to the PBGC.
On February 4, 2009, the Predecessor filed a motion with the United States Bankruptcy Court for the Southern District of New York (the “Court”) seeking the authority to cease providing retiree OPEB benefits in
retirement to salaried employees, retirees, and surviving spouses after March 31, 2009. On February 24, 2009, the Court provisionally approved the Predecessor’s motion to terminate such benefits effective March 31, 2009 based on the Court’s finding that the Predecessor had met its evidentiary burdens, subject to the appointment of a retirees’ committee (the “Retirees’ Committee”) to review whether it believes that any of the affected programs involved vested benefits (as opposed to “at will” or discretionary, unvested benefits). On March 11, 2009, the Court issued a final order approving the Predecessor’s motion to terminate salaried OPEB benefits. The Court approved a settlement agreement (the “Settlement”), between the Predecessor and the Retirees’ Committee and the Delphi Salaried Retirees’ Association (the “Association”) settling any and all rights for the parties to appeal the Court’s March 11, 2009 final order authorizing the Predecessor to terminate salaried OPEB benefits. Pursuant to the Settlement, the Predecessor agreed to provide the Retirees’ Committee with consideration of $9 million to resolve pending litigation. The Predecessor recognized a salaried OPEB curtailment and settlement gain of $1,168 million included in reorganization items in the consolidated statement of operations for the period from January 1 to October 6, 2009. This settlement gain reflects the reversal of existing liabilities of $1,173 million ($1,181 million net of $8 million to pay salaried OPEB claims incurred but not reported as of March 31, 2009) and the recognition of previously unamortized net gains included in accumulated other comprehensive income of $4 million. The reorganization gain also reflects the impact of the $9 million consideration to be provided for the Settlement described above.
Certain of our non-U.S. subsidiaries sponsor defined benefit pension plans, which generally provide benefits based on negotiated amounts for each year of service. Our primary non-U.S. plans are located in France, Germany, Luxembourg, Mexico, Portugal and the UK. The UK and certain Mexican plans are funded. In addition, we have defined benefit plans in South Korea, Turkey and Italy for which amounts are payable to employees immediately upon separation. The obligations for these plans are recorded based on the vested obligation. We anticipate making required pension contributions of approximately $86 million in 2011.
Refer to “Note 14. Pension and Other Postretirement Benefits” to the audited consolidated financial statements included herein for further information on (1) historical benefit costs of the pension plans and other postretirement benefit plans, (2) the principal assumptions used to determine the pension and other postretirement expense and the actuarial value of the projected benefit obligation for the U.S. and non-U.S. pension plan and postretirement plans, (3) a sensitivity analysis of potential changes to pension obligations and expense that would result from changes in key assumptions and (4) funding obligations.
Environmental Matters
We are subject to the requirements of U.S. federal, state and local, and non-U.S., environmental and safety and health laws and regulations. These include laws regulating air emissions, water discharge, hazardous materials and waste management. We have an environmental management structure designed to facilitate and support our compliance with these requirements globally. Although it is our intent to comply with all such requirements and regulations, we cannot provide assurance that we are at all times in compliance. Environmental requirements are complex, change frequently and have tended to become more stringent over time. Accordingly, we cannot assure that environmental requirements will not change or become more stringent over time or that our eventual environmental remediation costs and liabilities will not be material.
Certain environmental laws assess liability on current or previous owners or operators of real property for the cost of removal or remediation of hazardous substances. In addition to clean-up actions brought by U.S. federal, state, local and non-U.S. agencies, plaintiffs could raise personal injury or other private claims due to the presence of hazardous substances on or from a property. We are currently in the process of investigating and cleaning up some of our current or former sites. In addition, there may be soil or groundwater contamination at several of our properties resulting from historical, ongoing or nearby activities.
At March 31,June 30, 2011 and December 31, 2010, the undiscounted reserve for environmental investigation and remediation was approximately $24$23 million (of which $4 million was recorded in accrued liabilities and $20$19 million was recorded in other long-term liabilities) and $23 million (of which $5 million was recorded in accrued
liabilities and $18 million was recorded in other long-term liabilities), respectively. We cannot ensure that environmental requirements will not change or become more stringent over time or that our eventual environmental remediation costs and liabilities will not exceed the amount of our current reserves. In the event that such liabilities were to significantly exceed the amounts recorded, our results of operations could be materially affected.
Legal Proceedings
For a description of our legal proceedings, see “Business—Legal Proceedings.”
Off-Balance Sheet Arrangements
We do not engage in any off-balance sheet financial arrangements that have or are reasonably likely to have a current or future effect on our financial condition, changes in financial condition, revenues or expenses, results of operations, liquidity, capital expenditures or capital resources.
Significant Accounting Policies and Critical Accounting Estimates
Our significant accounting policies are described in “Note 2. Significant Accounting Policies” to the audited consolidated financial statements included herein. Certain of our accounting policies require the application of significant judgment by management in selecting the appropriate assumptions for calculating financial estimates. By their nature, these judgments are subject to an inherent degree of uncertainty. These judgments are based on our historical experience, terms of existing contracts, our evaluation of trends in the industry, information provided by our customers and information available from other outside sources, as appropriate.
We consider an accounting estimate to be critical if:
It requires us to make assumptions about matters that were uncertain at the time we were making the estimate, and
Changes in the estimate or different estimates that we could have selected would have had a material impact on our financial condition or results of operations.
Acquisition Accounting
Upon the Acquisition as defined in “Note 1. General and Acquisition of Predecessor Businesses” to the audited consolidated financial statements included herein, the recorded amounts for the assets acquired and the liabilities assumed from the Predecessor were adjusted to reflect estimated fair values in accordance with the provisions of FASB ASC 805, Business Combinations. The fair values were estimated in accordance with the guidance in FASB ASC 820, Fair Value Measurements and Disclosures, and were based on three generally accepted business valuation approaches: the income, market, and cost approaches. Generally, the income and market approaches were used and weighted by the independent valuation specialists as appropriate.
The discounted cash flow (“DCF”) method is a form of the income approach commonly used to value business interests. The DCF method was based on Company-prepared projections which included a variety of estimates and assumptions. While we consider such estimates and assumptions reasonable, they are inherently subject to significant business, economic and competitive uncertainties, many of which are beyond our control and, therefore, may not be realized. Changes in these estimates and assumptions may have a significant effect on the determination of the fair value of the assets acquired and liabilities assumed in the Acquisition. Accordingly, there can be no assurance that the estimates, assumptions, and values reflected in the valuations will be realized, and actual results could vary materially.
Other estimates used in determining fair value include, but are not limited to, future cash flows or income related to intangibles, market rate assumptions, actuarial assumptions for benefit plans and appropriate discount rates. Our estimates of fair value are based upon assumptions believed to be reasonable, but that are inherently uncertain. Acquisition accounting along with the consummation of the Modified Plan and the disposition of the Predecessor has had a material effect on the financial statements. Refer to “Note 1. General and Acquisition of Predecessor Businesses” to the audited consolidated financial statements included herein for additional information.
Warranty Obligations
Estimating warranty obligations requires us to forecast the resolution of existing claims and expected future claims on products sold. We base our estimate on historical trends of units sold and payment amounts, combined with our current understanding of the status of existing claims and discussions with our customers. The key factors which impact our estimates are (1) the stated or implied warranty period; (2) OEM source; (3) OEM policy decisions regarding warranty claims; and (4) OEMs seeking to hold suppliers responsible for product warranties. These estimates are re-evaluated on an ongoing basis. Actual warranty obligations could differ from the amounts estimated requiring adjustments to existing reserves in future periods. Due to the uncertainty and potential volatility of the factors contributing to developing these estimates, changes in our assumptions could materially affect our results of operations.
Environmental Matters
Environmental remediation liabilities are recognized when a loss is probable and can be reasonably estimated. Such liabilities generally are not subject to insurance coverage. The cost of each environmental remediation is estimated by engineering, financial, and legal specialists based on current law and considers the estimated cost of investigation and remediation required and the likelihood that, where applicable, other responsible parties will be able to fulfill their legal obligations and commitments. The process of estimating environmental remediation liabilities is complex and dependent primarily on the nature and extent of historical information and physical data relating to a contaminated site, the complexity of the site, the uncertainty as to what remediation and technology will be required, and the outcome of discussions with regulatory agencies and, if applicable, other responsible parties. In future periods, new laws or regulations, advances in remediation technologies and additional information about the ultimate remediation methodology to be used could significantly change estimates by Delphi. Refer to “Note 15. Commitments and Contingencies” to the audited
consolidated financial statements included herein for additional details. We cannot ensure that environmental requirements will not change or become more stringent over time or that our eventual environmental costs and liabilities will not exceed the amount of current reserves. In the event that such liabilities were to significantly exceed the amounts recorded, our results of operations could be materially affected.
Restructuring
Accruals have been recorded in conjunction with our restructuring actions. These accruals include estimates primarily related to employee termination costs, contract termination costs and other related exit costs in conjunction with workforce reduction and programs related to the rationalization of manufacturing and engineering processes. Actual costs may vary from these estimates. These accruals are reviewed on a quarterly basis and changes to restructuring actions are appropriately recognized when identified.
Pensions
We use actuarial estimated and related actuarial methods to calculate our obligation and expense. We are required to select certain actuarial assumptions, which are determined based on current market conditions, historical information and consultation with and input from our actuaries and asset managers. Refer to “Note 14. Pension and Other Postretirement Benefits” to the audited consolidated financial statements included herein for
additional details. The key factors which impact our estimates are (1) discount rates; (2) asset return assumptions; and (3) actuarial assumptions such as retirement age and mortality which are determined as of the current year measurement date. We review our actuarial assumptions on an annual basis and make modifications to the assumptions based on current rates and trends when appropriate. Experience gains and losses, as well as the effects of changes in actuarial assumptions and plan provisions are amortized over the average future service period of employees.
The principal assumptions used to determine the pension and other postretirement expense and the actuarial value of the projected benefit obligation for the U.S. and non-U.S. pension plans and postretirement plans were:
Assumptions used to determine benefit obligations at December 31:
| | | | | | | | | | | | | | | | | | | | | | | | |
| | | Pension Benefits | | | Other Postretirement Benefits | |
| | | U.S. Plans | | | Non-U.S. Plans | | | | | | | |
| | | 2010 | | | 2009 | | | 2010 | | | 2009 | | | 2010 | | | 2009 | |
Weighted-average discount rate | | | 4.10% | | | | 5.00% | | | | 5.69 | % | | | 6.00 | % | | | 4.52 | % | | | 5.26 | % |
Weighted-average rate of increase in compensation levels | | | N/A | | | | N/A | | | | 3.88 | % | | | 3.90 | % | | | 4.50 | % | | | 4.50 | % |
Assumptions used to determine net expense for years ended December 31:
| | | | | | | | | | | | | | | | | | | | | | | | | | | | | | | | | | | | |
| | | Pension Benefits | | | | |
| | | U.S. Plans | | | Non-U.S. Plans | | | Other Postretirement Benefits | |
| | | 2010 | | | 2009 | | | 2008 | | | 2010 | | | 2009 | | | 2008 | | | 2010 | | | 2009 | | | 2008 | |
Weighted-average discount rate | | | 5.00% | | | | 6.16% | | | | 6.35 | % | | | 5.97 | % | | | 6.22 | % | | | 5.99 | % | | | 5.20% | | | | 6.12% | | | | 6.41% | |
Weighted-average rate of increase in compensation levels | | | N/A | | | | N/A | | | | 4.45 | % | | | 3.89 | % | | | 3.95 | % | | | 4.16 | % | | | 4.50% | | | | 4.50% | | | | 4.50% | |
Expected long-term rate of return on plan assets | | | N/A | | | | 8.25% | | | | 8.75 | % | | | 7.14 | % | | | 7.81 | % | | | 8.28 | % | | | N/A | | | | N/A | | | | N/A | |
We select discount rates by analyzing the results of matching each plan’s projected benefit obligations with a portfolio of high-quality fixed income investments rated AA- or higher by Standard and Poor’s.
In 2010, we no longer had any U.S. pension assets; therefore no U.S. asset rate of return calculation was necessary for 2010. The primary funded non-U.S. plans are in the United Kingdom and Mexico. For the determination of 2010 expense, we assumed a long-term asset rate of return of approximately 6.75% and 10.0% for the United Kingdom and Mexico, respectively. We evaluated input from local actuaries and asset managers, including consideration of recent fund performance and historical returns, in developing the long-term rate of return assumptions. The assumptions for the United Kingdom and Mexico are primarily conservative long-term, prospective rates.
Our pension expense for 2011 is determined at the December 31, 2010 measurement date. For purposes of analysis, the following table highlights the sensitivity of our pension obligations and expense to changes in key assumptions:
| | | | |
Change in Assumption | | Impact on Pension Expense | | Impact on PBO |
25 basis point (“bp”) decrease in discount rate | | + $2 million | | + $63 million |
25 bp increase in discount rate | | - $3 million | | - $59 million |
25 bp decrease in long-term return on assets | | + $2 million | | — |
25 bp increase in long-term return on assets | | - $2 million | | — |
The above sensitivities reflect the effect of changing one assumption at a time. It should be noted that economic factors and conditions often affect multiple assumptions simultaneously and the effects of changes in
key assumptions are not necessarily linear. The above sensitivities also assume no changes to the design of the pension plans and no major restructuring programs.
Based on information provided by our actuaries and asset managers, we believe that the assumptions used are reasonable; however, changes in these assumptions could impact our financial position, results of operations or cash flows. Refer to “Note 14. Pension and Other Postretirement Benefits” to the audited consolidated financial statements included herein for additional information.
Accounts Receivable Allowance
Establishing valuation allowances for doubtful accounts requires the use of estimates and judgment in regard to the risk exposure and ultimate realization. The allowance for doubtful accounts is established based upon analysis of trade receivables for known collectability issues, including bankruptcies, and aging of receivables at the end of each period. Changes to our assumptions could materially affect our recorded allowance.
Valuation of Long-Lived Assets, Intangible Assets and Investments in Affiliates and Expected Useful Lives
We periodically review the recoverability of our long-lived and indefinite-lived assets based on projections of anticipated future cash flows, including future profitability assessments of various manufacturing sites when events and circumstances warrant such a review. We estimate cash flows and fair value using internal budgets based on recent sales data, independent automotive production volume estimates and customer commitments and review of appraisals. The key factors which impact our estimates are (1) future production estimates; (2) customer preferences and decisions; (3) product pricing; (4) manufacturing and material cost estimates; and (5) product life / business retention. Any differences in actual results from the estimates could result in fair values different from the estimated fair values, which could materially impact our future results of operations and financial condition. We believe that the projections of anticipated future cash flows and fair value assumptions are reasonable; however, changes in assumptions underlying these estimates could affect our valuations.
Inventories
Inventories are stated at the lower of cost, determined on a first-in, first-out basis, or market, including direct material costs and direct and indirect manufacturing costs. Refer to “Note 4. Inventories” to the audited
consolidated financial statements included herein. Obsolete inventory is identified based on analysis of inventory for known obsolescence issues, and, as of December 31, 2010, the market value of inventory on hand in excess of one year’s supply is generally fully-reserved.
From time to time, payments may be received from suppliers. These payments from suppliers are recognized as a reduction of the cost of the material acquired during the period to which the payments relate. In some instances, supplier rebates are received in conjunction with or concurrent with the negotiation of future purchase agreements and these amounts are amortized over the prospective agreement period.
Income Taxes
We estimate whether recoverability of our deferred tax assets is more likely than not. We use historical and projected future operating results, based upon approved business plans, including a review of the eligible carryforward period, tax planning opportunities and other relevant considerations. The key factors that impact our estimates are (1) variances in future projected profitability, including by taxable entity; (2) tax attributes; and (3) tax planning alternatives. The valuation of deferred tax assets requires judgment and accounting for the deferred tax effect of events that have been recorded in the financial statements or in the tax returns and our
future projected profitability represents our best estimate of those future events. Changes in our estimates, due to unanticipated events or otherwise, could have a material effect on our financial condition and results of operations.
Additionally, the calculation of our tax expense/benefits and liabilities includes uncertainties in the application of complex tax regulations in a multitude of jurisdictions across our global operations. We recognize tax expense/benefits and liabilities based on our estimate of whether and to what extent additional taxes will be due. We adjust these liabilities based on changing facts and circumstances; however, due to the complexity of some of the uncertainties and the impact of the settlement of any tax audits, the ultimate resolutions may be materially different from our estimated liabilities. Refer to “Note 16. Income Taxes” to the audited consolidated financial statements included herein for additional information.
Delphi Automotive LLP filed an informational 2009 U.S. federal partnership tax return on September 15, 2010. In light of the Notice, the IRS is currently reviewing whether Section 7874 applies to Delphi Automotive LLP’s acquisition of the automotive supply and other businesses of the Predecessor. While we believe, based on the advice of counsel, that it is more likely than not that neither we, nor Delphi Automotive LLP are a domestic corporation for U.S. federal income tax purposes, and therefore have not reserved any amounts on our financial statements in respect of this issue, no assurance can be given that the IRS will not contend that Delphi Automotive LLP, and therefore we, should each be treated as a domestic corporation for U.S. federal income tax purposes, or that, if we were to challenge any such contention by the IRS, that a court would not agree with the IRS.
If we were treated as a domestic corporation for U.S. federal income tax purposes, we would be subject to U.S. federal income tax on our worldwide taxable income, including some or all of the distributions from our subsidiaries as well as some of the undistributed earnings of our foreign subsidiaries that constitute “controlled foreign corporations.” This could have a material adverse impact on our future tax liability related to these distributions and earnings. Future cash distributions made by us to non-U.S. shareholders could be subject to U.S. income tax withholding at a rate of 30%, unless reduced or eliminated by a tax treaty. In addition, we could be liable for additional U.S. federal income taxes on such distributions and earnings, and for the failure by Delphi Automotive LLP to withhold U.S. income taxes on distributions to its non-U.S. members, for periods beginning on or after, the Acquisition Date, which liability could have a material adverse impact on our results of operations and financial condition.
Fair Value Measurement of Derivative Instruments
In determining the fair value of our derivatives, we utilize valuation techniques as prescribed by FASB ASC 820-10, Fair Value Measurements and Disclosures, and also prioritize the use of observable inputs. The
availability of observable inputs varies amongst derivatives and depends on the type of derivative and how actively traded the derivative is. For many of our derivatives, the valuation does not require significant management judgment as the valuation inputs are readily observable in the market. For other derivatives, however, valuation inputs are not as readily observable in the market, and significant management judgment may be required.
All derivative instruments are required to be reported on the balance sheet at fair value unless the transactions qualify and are designated as normal purchases or sales. Changes in fair value are reported currently through earnings unless they meet hedge accounting criteria. Our derivative exposures are with counterparties with long-term investment grade credit ratings. We estimate the fair value of our derivative contracts using an income approach based on valuation techniques to convert future amounts to a single, discounted amount. Estimates of the fair value of foreign currency and commodity derivative instruments are determined using exchange traded prices and rates. We also consider the risk of non-performance in the estimation of fair value, and include an adjustment for non-performance risk in the measure of fair value of derivative instruments. The non-performance risk adjustment reflects the full CDS applied to the net commodity and foreign currency
exposures by counterparty. When we are in a net derivative asset position, the counterparty CDS rates are applied to the net derivative asset position. When we are in a net derivative liability position, estimates of peer companies’ CDS rates are applied to the net derivative liability position.
In certain instances where market data is not available, we use management judgment to develop assumptions that are used to determine fair value. This could include situations of market illiquidity for a particular currency or commodity or where observable market data may be limited. In those situations, we generally survey investment banks and/or brokers and utilize the surveyed prices and rates in estimating fair value.
As of December 31, 2010 and 2009, we were in a net derivative asset position of $76 million and $4 million, respectively, and there were no adjustments recorded for nonperformance risk as exposures were to counterparties with investment grade credit ratings. Refer to “Note 18. Fair Value of Financial Instruments, Derivatives and Hedging Activities” to the audited consolidated financial statements included herein for more information.
Share-Based Compensation
We expense the estimated fair value of the Value Creation Plan (as defined and further discussed in “Note 22. Share-Based Compensation” to the audited consolidated financial statements included herein), a long-term incentive plan for key employees. Estimating the fair value for share-based payments requires us to make assumptions regarding the nature of the payout of the award as well as our enterprise value. Any differences in actual results from management’s estimates could result in fair values different from estimated fair values, which could materially impact our future results of operations and financial condition. The following highlights the sensitivity to changes in our enterprise value:
| | |
Change in Estimate of Enterprise Value | | Impact on 2011
Operating Expense |
+ 10% | | + $12 million |
- 10% | | - $12 million |
The fair market value of the Class E-1 Interests (as defined and further discussed in “Note 22. Share-Based Compensation” to the audited consolidated financial statements included herein) was estimated based on a contemporaneous valuation performed by an independent valuation specialist, utilizing generally accepted valuation approaches. Under certain conditions with respect to an initial public offering or a change in control, as defined in the Board of Managers 2010 Class E-1 Interest Incentive Plan, any interests that have not yet vested may immediately become vested. Approximately $12$10 million of compensation expense will be recognized through the remainder of the vesting period. This amount would be recognized immediately as a charge to compensation expense if the criteria for immediate vesting are met.
Refer to “Note 22. Share-Based Compensation” to the audited consolidated financial statements included herein for additional information.
Recently Issued Accounting Pronouncements
Refer to “Note 2. Significant Accounting Policies” to the unaudited consolidated financial statements included herein for a complete description of recent accounting standards which we have not yet been required to implement which may be applicable to our operations. Additionally the significant accounting standards that have been adopted during the threesix months ended March 31,June 30, 2011 are described.
Quantitative and Qualitative Disclosures About Market Risk
We are exposed to market risks from changes in currency exchange rates and certain commodity prices. In order to manage these risks, we operate a centralized risk management program that consists of entering into a variety of derivative contracts with the intent of mitigating our risk to fluctuations in currency exchange rates and commodity prices. We do not enter into derivative transactions for speculative or trading purposes.
A discussion of our accounting policies for derivative instruments is included in “Note 2. Significant Accounting Policies” to the audited consolidated financial statements included herein and further disclosure is provided in “Note 18. Fair Value of Financial Instruments, Derivatives and Hedging Activities” to the audited consolidated financial statements included herein. We maintain risk management control systems to monitor exchange and commodity risks and related hedge positions. Positions are monitored using a variety of analytical techniques including market value and sensitivity analysis. The following analyses are based on sensitivity tests, which assume instantaneous, parallel shifts in currency exchange rates and commodity prices. For options and instruments with non-linear returns, appropriate models are utilized to determine the impact of shifts in rates and prices. Currently, we do not have any options or instruments with non-linear returns.
We have currency exposures related to buying, selling and financing in currencies other than the local currencies in which we operate. Historically, we have reduced our exposure through financial instruments (hedges) that provide offsets or limits to our exposures, which are opposite to the underlying transactions. We also face an inherent business risk of exposure to commodity prices risks, and have historically offset our exposure, particularly to changes in the price of various non-ferrous metals used in our manufacturing operations, through fixed price purchase agreements, commodity swaps and option contracts. We continue to manage our exposures to changes in currency rates and commodity prices using these derivative instruments.
There have been no material changes to our exposures to market risk since December 31, 2010, except related to interest rate risk.
Currency Exchange Rate Risk
Currency exposures may impact future earnings and/or operating cash flows. In some instances, we choose to reduce our exposures through financial instruments (hedges) that provide offsets or limits to our exposures. Currently our most significant currency exposures relate to the Mexican Peso, Euro, Chinese Yuan (Renminbi), Turkish Lira and Great Britain Pound. As of December 31, 2010 the net fair value asset of all financial instruments (hedges and underlying transactions) with exposure to currency risk was approximately $794 million and the net fair value asset at December 31, 2009 was $566 million. The potential loss or gain in fair value for such financial instruments from a hypothetical 10% adverse or favorable change in quoted currency exchange rates would be approximately $137 million and $87 million at December 31, 2010 and 2009, respectively. The impact of a 10% change in rates on fair value differs from a 10% change in the net fair value asset due to the existence of hedges. The model assumes a parallel shift in currency exchange rates; however, currency exchange rates rarely move in the same direction. The assumption that currency exchange rates change in a parallel fashion may overstate the impact of changing currency exchange rates on assets and liabilities denominated in currencies other than the U.S. dollar.
Commodity Price Risk
Commodity swaps/average rate forward contracts are executed to offset a portion of our exposure to the potential change in prices mainly for various non-ferrous metals used in the manufacturing of automotive components. The net fair value of our contracts was an asset of approximately $48 million and an asset of approximately $5 million at December 31, 2010 and 2009, respectively. If the price of the commodities that are being hedged by our commodity swaps/average rate forward contracts changed adversely or favorably by 10%, the fair value of our commodity swaps/average rate forward contracts would decrease or increase by $24 million
and $11 million at December 31, 2010 and 2009, respectively. The changes in the net fair value liability differ from 10% of those balances due to the relative differences between the underlying commodity prices and the prices in place in our commodity swaps/average rate forward contracts. These amounts exclude the offsetting impact of the price risk inherent in the physical purchase of the underlying commodities.
Interest Rate Risk
Our exposure to market risk associated with changes in interest rates relates primarily to our debt obligations. As of March 31,June 30, 2011, we had approximately $2.5$1.0 billion of floating rate debt principally related to the Credit Agreement. As previously noted, on May 17, 2011, in conjunction with the issuance of $1.0 billion of the Senior Notes and the syndication of the Credit Agreement, we entered into a modification to the Credit Agreement to make certain amendments, including a reduction of the amount drawn under the Credit Facility to $1,208 million and a reduction of certain interest rates applicable to the Credit Facility. The modified Credit Agreement carries an interest rate, at Delphi’sour option, of either (a) the ABR plus (i) with respect to the revolving facilityRevolving Credit Facility and the Tranche A Term Loan, 2.75%1.75% per annum or (ii) with respect to the Tranche B Term Loan, 2.50%1.50% per annum, or (b) LIBOR plus (i) with respect to the revolving facilityRevolving Credit Facility and the Tranche A Term Loan, 2.75% per annum or (ii) with respect to the Tranche B Term Loan, 2.50% per annum. The Tranche B Term Loan includes a LIBOR floor of 1.00%. The interest rate period with respect to the LIBOR interest rate option can be set at one-, two-, three-, or six-months as selected by Delphius in accordance with the terms of the Credit Agreement (or other period as may be agreed by the applicable lenders), but payable no less than quarterly. DelphiWe may elect to change the selected interest rate over the term of the Credit FacilityFacilities in accordance with the provisions of the Credit Agreement. The applicable interest rates listed above for the revolving facilityRevolving Credit Facility and the Tranche A Term Loan may increase or decrease from time to time by 0.25% based uponon changes to Delphi’sour corporate credit ratings. Accordingly, the interest rate will fluctuate during the term of the Credit Agreement based on changes in the Alternate Base Rate, LIBOR or future changes in Delphi’sour corporate credit ratings.
The table below indicates interest rate sensitivity on interest expense to floating rate debt based on amounts outstanding contemplating the modifications to the Credit Agreement.as of June 30, 2011.
| | | | | | | | |
| | | Tranche A
Term Loan | | | Tranche B
Term Loan | |
Change in Rate | | (impact to annual interest
expense in millions) | |
25 bps decrease | | | - $1 | | | | - $2 | |
25 bps increase | | | + $1 | | | | + $2 | |
BUSINESS
Our Company
We are a leading global vehicle components manufacturer and provide electrical and electronic, powertrain, safety and thermal technology solutions to the global automotive and commercial vehicle markets. We are one of the largest vehicle component manufacturers, and our customers include the 25 largest automotive OEMs in the world. We operate 110 manufacturing facilities and 15 major technical centers utilizing a regional service model that enables us to efficiently and effectively serve our global customers from low cost countries. We have a presence in 30 countries and have over 16,000 scientists, engineers and technicians focused on developing market relevant product solutions for our customers. In line with the growth in the emerging markets, we have been increasing our focus on these markets, in particular in China, where we have a major manufacturing base and strong customer relationships.
We believe we are well-positioned for growth from increasing global vehicle production volumes, increased demand for our Safe, Green and Connected products which are being added to vehicle content, and new business wins with existing and new customers. In order to transform its business portfolio and rationalize its cost structure, the former Delphi Corporation and certain of its U.S. subsidiaries filed for Chapter 11 protection in October 2005. As a result of the actions taken by the Predecessor and Delphi Automotive LLP’s continuing efforts following its acquisition of the majority of the Predecessor’s businesses in October 2009, we have substantially reduced our costs, aligned our product offerings with the faster-growing industry mega trends and re-aligned our manufacturing footprint into an efficient regional service model, allowing us to increase our profit margins.
We believe the automotive industry is being shaped by increasing government regulations for vehicle safety, fuel efficiency and emissions control, as well as rapidly increasing consumer demand for connectivity. These industry mega trends, which we refer to as “Safe,” “Green” and “Connected,” are driving higher growth in products that address these trends than growth in the automotive industry overall. We have reorganized our business into four diversified segments, which enable us to develop solutions and manufacture highly-engineered products that enable our customers to respond to these mega trends:
| | • | | Electrical / Electronic Architecture—This segment provides complete design of the vehicle’s electrical architecture, including connectors, wiring assemblies and harnesses, electrical centers and hybrid power distribution systems. Our products provide the critical electrical and electronics backbone that supports increased vehicle content and electrification, reduced emissions and higher fuel economy through weight savings. |
| | • | | Powertrain Systems—This segment provides systems integration of full end-to-end gasoline and diesel engine management systems including fuel handling, fuel injection, combustion, electronic controls and test and validation capabilities. We design solutions to optimize powertrain power and performance while helping our customers meet new emissions and fuel economy regulations. |
| | • | | Electronics and Safety—This segment provides critical components, systems and advanced software for passenger safety, security, comfort and infotainment, as well as vehicle operation, including body controls, reception systems, audio/video/navigation systems, hybrid vehicle power electronics, displays and mechatronics. Our products integrate and optimize electronic content, which improves fuel economy, reduces emissions, increases safety and provides occupant infotainment and connectivity. |
| | • | | Thermal Systems—This segment provides powertrain cooling and heating, ventilating and air conditioning (“HVAC”) systems, such as compressors, systems and controls, and heat exchangers for the vehicle markets. Our products improve the efficiency by which the powertrain and cabin temperatures are managed, which are critical factors in achieving increased fuel economy and reduced emissions. |
Our business is diversified across end-markets, regions, customers, vehicle platforms and products. Our customer base includes the 25 largest automotive OEMs in the world, and, in 2010, 24% of our net sales came from emerging markets (Asia Pacific and South America). Our six largest platforms in 2010 were with six different OEMs. In addition, in 2010 our products were found in 17 of the 20 top-selling vehicle models in the United States, in all of the 20 top-selling vehicle models in Europe and in 13 of the 20 top-selling vehicle models in China. We have further diversified our business by increasing our sales in the commercial vehicle market, which is typically on a different business cycle than the light vehicle market and has grown to 8% of our 2010 net sales. In addition, approximately 8% of our 2010 net sales arewere to the aftermarket, which meets the ongoing need for replacement parts required for vehicle servicing.
| (1) | Includes aftermarket sales, which comprised 8% of our 2010 revenue. |
| (2) | General Motors North America (“GMNA”) and General Motors International Operations (“GMIO”) are segments of General Motors Company (“GM”) and together represent 21% of our 2010 revenue. |
We have substantially restructured and transformed our business to achieve a lean cost structure and global footprint to compete profitably in our industry. Since 2005, we have reduced our product lines from 119 to 33, exited 11 businesses, closed over 70 sites, and decreased our global headcount, including temporary employees, by approximately 27%25%. As a result of our transformation, 91% of our hourly workforce is now located in low cost countries. In addition, approximately 30% of our hourly workforce is composed of temporary employees, making it easier for us to flex our workforce as volumes change. We no longer have any employees represented by the UAW. In addition, we do not have any significant U.S. defined benefit pension or OPEB obligations.
We have established a worldwide design and manufacturing footprint with a regional service model that enables us to efficiently and effectively serve our global customers from low cost countries. This regional model is structured primarily to service the North American market from Mexico, the South American market from Brazil, the European market from Eastern Europe and North Africa, and the Asia Pacific market from China. Our global scale and regional service model enables us to engineer globally and execute regionally to serve the largest OEMs, which are seeking suppliers that can serve them on a worldwide basis. Our footprint also enables us to adapt to the regional design variations the global OEMs require and serve the emerging market OEMs.
Together, our cost reductions and re-alignment of our manufacturing footprint have substantially increased our profit margins and operational flexibility. Our business model is now designed to be profitable at all points in the normal automotive business cycle. For example, in 2010, we would have maintained positive EBITDA even if volumes were 30% below actual industry production volumes (or global production of 55 million vehicles rather than 78 million vehicles), assuming constant pricing and product and regional mix and based on our fixed cost structure in 2010 of approximately $3.2 billion and our variable costs which approximated two-thirds of sales in 2010; actual pricing, product and regional mix would likely differ in any future downturn. Our business model also has operating leverage, from which we believe we will benefit as our production volumes increase due to forecasted industry growth, content growth, and new business wins. We do not believe we will need to add
substantial manufacturing capacity over the next several years to support this growth. We have had significant
success winning new business with existing and new customers on both global platforms and on regional specific platforms. In 2010, we won business that we estimate will represent $20 billion of gross anticipated revenues based on expected volumes and assumed pricing. In the first quarterhalf of 2011, this trend accelerated, with another $6.6$14.4 billion in new business awards, based on expected volumes and assumed pricing. Actual results could vary if these assumptions prove incorrect. See “Risk Factors—Risks Related to Business Environment and Economic Conditions—Continued pricing pressures, OEM cost reduction initiatives and the ability of OEMs to re-source or cancel vehicle programs may result in lower than anticipated margins, or losses, which may have a significant negative impact on our business.” We believe our operating leverage will enable us to generate increased profitability and higher margins from these new business wins.
Our Industry
The automotive parts industry provides components, systems, subsystems and modules to OEMs for the manufacture of new vehicles, as well as to the aftermarket for use as replacement parts for current production and older vehicles. Overall, we expect long-term growth of vehicle sales and production in the OEM market. Recently, the industry has seen increased customer sales and production schedules, and an improved sales mix with greater content. However, current OEM production volumes in North America and Western Europe remain substantially lower than OEM production volumes prior to the disruptions the economic and credit markets experienced in 2008 and 2009. Demand for automotive parts in the OEM market is generally a function of the number of new vehicles produced, which is primarily driven by macro-economic factors such as credit availability, interest rates, fuel prices, consumer confidence, employment and other trends. Although OEM demand is tied to actual vehicle production, participants in the automotive parts industry also have the opportunity to grow through increasing product content per vehicle by further penetrating business with existing customers and in existing markets, gaining new customers and increasing their presence in global markets. We believe that as a company with a global presence and advanced technology, engineering, manufacturing and customer support capabilities, we are well-positioned to take advantage of these opportunities.
We believe that continuously increasing demands of society have created the emergence of three “mega trends” that will serve as the basis for the next wave of market-driven technology advancement. Our challenge is to continue developing leading edge technology focused on addressing these mega trends, and apply that technology toward products with sustainable margins that enable our customers, both OEMs and others, to produce distinctive market-leading products. We have identified a core portfolio of products that draw on our technical strengths and align with these “mega trends” where we believe we can provide differentiation to our automotive, commercial vehicle and aftermarket customers. For more information on our core product portfolio refer to “—Products” below.
Safe. The first mega-trend, “Safe,” represents technologies aimed not just at protecting vehicle occupants when a crash occurs, but those that actually proactively reduce the risk of a crash occurring. OEMs continue to focus on improving occupant and pedestrian safety in order to meet increasingly stringent regulatory requirements in various markets. As a result, suppliers are competing intensely to develop and market new and alternative technologies, such as lane departure warning systems and collision avoidance technologies.
Green. The second mega-trend, “Green,” represents technologies designed to help reduce emissions, increase fuel economy and minimize the environmental impact of vehicles. OEMs continue to focus on improving fuel efficiency and reducing emissions in order to meet increasingly stringent regulatory requirements in various markets. As a result, suppliers are developing innovations that result in significant improvements in fuel economy, emissions and performance from gasoline and diesel internal combustion engines. At the same time, suppliers are also developing and marketing new and alternative technologies that support hybrid vehicles, electric vehicles and fuel cell products to improve fuel economy and emissions. Green is a key mega-trend today because of the convergence of several issues: climate change, higher oil prices, increased concern about oil dependence and recent and pending legislation in the U.S. and overseas regarding fuel economy and carbon dioxide emissions.
Connected. The third mega-trend, “Connected,” represents technologies designed to seamlessly integrate the highly complex electronic world in which automotive consumers live into the cars that they
drive, so that time in a vehicle is more productive and enjoyable. The technology content of vehicles continues to increase as consumers demand greater safety, personalization, entertainment, productivity and convenience while driving. Advanced technologies offering mobile voice and data communication such as those used in our mobile electronics products coupled with global positioning systems and in-vehicle entertainment continue to be key products in the transportation industry.
We expect these mega trends to create growth and opportunity for us. We are well-positioned to provide solutions and products to OEMs to expand the electronic and technological content of their vehicles. We believe electronics integration, which generally refers to products that combine integrated circuits, software algorithms, sensor technologies and mechanical components within the vehicle will allow OEMs to achieve substantial reductions in weight and mechanical complexity, resulting in easier assembly, enhanced fuel economy, improved emissions control and better vehicle performance.
Market Opportunities
Recovery of Developed Markets and Continued Emerging Markets Growth
According to J.D. Power & Associates, global vehicle production is forecast to grow at a CAGR of 6.8% from 2010 to 2015. In the near term, the mature markets, including North America and Western Europe, are expected to grow at 3.3% from 2010 to 2015 for an increase of approximately 6.9 million units, while the emerging markets are forecast to grow at 10.3% during the same period, for an increase of approximately 22.2 million units. We expect that nearly half of our total future growth will be generated from emerging markets, especially China, which now represents a larger market for automotive components than either the United States or Japan. As a consequence of this shift in demand, many automotive manufacturing and supply companies have located operations in China and have entered into strategic partnerships and supply arrangements designed to support increased production. The total market and the relative growth in the emerging markets are shown in the illustrations below.
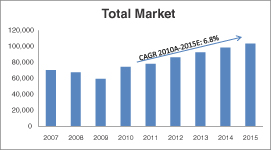
| | |
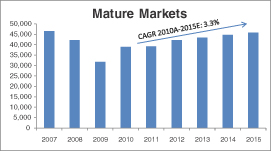 | | 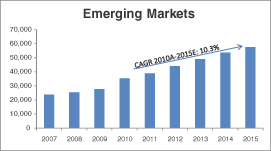 |
| Source: | J.D. Power & Associates |
Note: Vehicles in thousands. “Mature markets” refers to Australia, Japan, South Korea, North America (including Mexico) and Western Europe. “Emerging markets” refers to the rest of the world.
Demand for Increased Safety
OEMs continue to focus on improving occupant and pedestrian safety in order to meet increasingly stringent regulatory requirements in various markets, such as the recent proposal by the U.S. National Highway Traffic Safety Administration to mandate rear view cameras in all vehicles by 2014. As a result, suppliers are focused on developing technologies aimed at protecting vehicle occupants when a crash occurs, as well as those that proactively mitigate the risk of a crash occurring. Examples of new and alternative technologies are lane departure warning systems and collision avoidance technologies, which incorporate sophisticated electronics and advanced software. According to The Freedonia Group, the value of safety and security electronics content globally is expected to grow (based on increasing production and increased content per vehicle) in excess of 13% CAGR from 2009 to 2014, a trend which favors suppliers with the ability to fulfill demand for these important components and systems.
Trend of Increased Fuel Efficiency and Reduced Emissions
OEMs also continue to focus on improving fuel efficiency and reducing emissions in order to meet increasingly stringent regulatory requirements in various markets. On a worldwide basis, the relevant authorities in the European Union, the United States, China, India, Japan, Brazil, South Korea and Argentina have already instituted regulations requiring further reductions in emissions and/or increased fuel economy through 2014. In many cases, the same authorities have initiated legislation that would further tighten the standards through 2020 and beyond. Based on proposed European legislation, we believe OEMs may be required to reduce fleet average CO2 emissions for passenger cars by nearly 40% from 140 grams/kilometer, or approximately 39 miles/gallon, in 2008 to 85 grams/kilometer, or over 60 miles/gallon, by 2020. Based on the current regulatory environment, we believe that OEMs in other parts of the world, including the U.S. and China, will be subject to even greater reductions in CO2 emissions from their current levels over the next ten years. These standards will require meaningful innovation as OEMs and suppliers are forced to find ways to improve thermal management, engine management, electrical power consumption, vehicle weight and integration of alternative powertrains (e.g., electric/hybrid engines). According to The Freedonia Group, the value (i.e., the absolute dollar amount of demand, which may grow based on vehicle sales, more content per vehicle and higher prices for content) of powertrain and emissions electronics systems content globally, including fuel injection systems and engine management systems, is expected to grow (based on increasing production and increased content per vehicle) in excess of 11% CAGR from 2009 to 2014. We expect that as the market for these products expands, we will have the opportunity to obtain proportional growth in prices and margins in these areas, subject to competitive market dynamics.
Trend Towards Connectivity
The technology content of vehicles continues to increase as consumers demand greater safety, personalization, infotainment, productivity and convenience while driving. The automotive industry is focused on developing technologies designed to seamlessly integrate the highly complex electronic world in which automotive consumers live in the cars they drive, so that time in a vehicle is more productive and enjoyable. Advanced technologies offering mobile voice and data communication, while minimizing driver distraction, such as those used in our mobile electronics products coupled with global positioning systems and in-vehicle infotainment will continue to grow in importance. These and other related products are leading to higher electronic content per vehicle. According to The Freedonia Group, the value of OEM-installed infotainment systems globally, including communication and navigation equipment, backup monitors and heads up displays, entertainment systems, and other comfort and convenience systems are expected to increase (based on increasing production and increased content per vehicle) at CAGRs of approximately 20%, 28%, 10%, and 14%, respectively, from 2009 to 2014.
Standardization of Sourcing by OEMs
Many OEMs are adopting global vehicle platforms to increase standardization, reduce per unit cost and increase capital efficiency and profitability. As a result, OEMs are selecting suppliers that have the capability to manufacture products on a worldwide basis as well as the flexibility to adapt to regional variations. Suppliers with global scale and strong design, engineering and manufacturing capabilities, are best positioned to benefit from this trend. OEMs are also increasingly looking to their suppliers to simplify vehicle design and assembly processes to reduce costs. As a result, suppliers that sell vehicle components directly to manufacturers (Tier I suppliers) have assumed many of the design, engineering, research and development and assembly functions traditionally performed by vehicle manufacturers. Suppliers that can provide fully-engineered solutions, systems and pre-assembled combinations of component parts are positioned to leverage the trend toward system sourcing.
Shorter Product Development Cycles
As a result of government regulations and customer preferences, OEMs are requiring suppliers to respond faster with new designs and product innovations. While these trends are more prevalent in mature markets, the emerging markets are advancing rapidly towards the regulatory standards and consumer preferences of the more mature markets. Suppliers with strong technologies, robust global engineering and development capabilities will be best positioned to meet the OEM demands for rapid innovation.
Our Competitive Strengths
Global Market Leader
We are one of the world’s largest vehicle component manufacturers. We estimate that we hold the #1 or #2 position in product categories representing over 70% of our 2010 net sales, including electrical/electronic distribution systems, automotive connection systems, diesel engine management systems, and infotainment & driver interface. In addition, in 2010 our products were found in 17 of the 20 top-selling vehicle models in the United States, in all of the 20 top-selling vehicle models in Europe and in 13 of the 20 top-selling vehicle models in China.
Product Portfolio Tied to the Key Industry Mega Trends
Our product offerings satisfy the OEMs’ need to meet increasingly stringent government regulations and fulfill consumer preferences for products that address the mega trends of Safe, Green and Connected, leading to increased content per vehicle, greater profitability and higher margins. With these offerings, we are well-positioned to capitalize on demand for increased safety, fuel efficiency, emissions control and connectivity to the global information network. There has been a substantial increase in vehicle content and electrification requiring a complex and reliable electrical architecture and systems to operate, such as hybrid power electronics, electrical vehicle monitoring, lane departure warning systems, integrated electronic displays, navigation systems and consumer electronics. Our ability to design a reliable electrical architecture that optimizes power distribution and/or consumption is key to satisfying the OEMs’ need to reduce emissions while continuing to meet the demands of consumers. Additionally, our Powertrain Systems and Thermal Systems segments are also focused on addressing the demand for increased fuel efficiency and emission control by controlling fuel consumption and heat dissipation, which are principal factors influencing fuel efficiency and emissions.
Global and Diverse Customer Base
Our customer base includes the 25 largest automotive OEMs in the world. Our long-standing relationships with both the leading global OEMs and regional OEMs position us to benefit from the cyclical recovery in North America and Europe and secular growth in emerging markets. Our six largest platforms in 2010 were with six different OEMs. Our top five customers are Daimler AG (“Daimler”), Ford Motor Company (“Ford”), General
Motors Company (“GM”), PSA Peugeot Citroën (“Peugeot”) and Volkswagen Group (“VW”), collectively representing 49% of our 2010 revenue, with our largest customer representing only 21% of our 2010 revenue. We have further diversified our business by increasing our sales in the commercial vehicle market, which is typically on a different business cycle than the light vehicle market and now representsrepresented 8% of our 2010 net sales. In addition, approximately 8% of our 2010 net sales arewere to the aftermarket.
We have substantially expanded our presence in emerging markets to enable us to capture the rapid growth principally in China, Brazil, India and Russia. Our presence in these countries will, for example, enable us to continue growing our market share among the regional automotive OEMs in these countries, including AVTOVAZ, Brilliance China, Changan, Chery, China FAW, Geely, Mahindra & Mahindra, Tata Motors and Ulyanovsk.
Global Manufacturing Footprint and Regional Service Model
We have a global manufacturing footprint and regional service model that enable us to efficiently and effectively operate from primarily low cost countries. We operate 110 manufacturing facilities and 15 major technical centers with a presence in 30 countries throughout the world. We have located these technical and manufacturing facilities in close proximity to our customers, enabling us to rapidly meet customer support requirements and satisfy regional variations in global vehicle platforms, while minimizing supply chain costs. Our global footprint enables us to serve the global OEMs on a worldwide basis along with gaining market share with the emerging market OEMs. This regional model has largely migrated to service the North American market out of Mexico, the South American market out of Brazil, the European market out of Eastern Europe and North Africa and the Asia Pacific market out of China.
Leading Supplier in the China Automotive Market
We have a strong presence in China, where we have operated for nearly 20 years. All of our business segments have operations and sales in China, where we employ approximately 21,000 people (including temporary workers), including approximately 2,800 scientists, engineers and technicians. Our strong engineering capabilities allow us to provide full product design and system integration to the regional OEMs.OEMs in China. As a result, we are a supplier to every major automotive OEM in China, with whom we have well-established relationships, with all of the major automotive OEMs in China, including: Brilliance China, Changan, Chery, China FAW, Geely, Shanghai General Motors and Shanghai Volkswagen. The Delphi brand is recognized by OEMs in China as a leading supplier, and we estimate that we hold the #1 or #2 position in product categories representing over 75% of our 2010 China revenues. We conduct our business through twofully consolidated, wholly-owned subsidiaries and 12 majority controlled joint ventures.ventures over which we have management control. Our local partners in the joint ventures are not our competitors. This legal entity structure gives us control over our strategy and operational activities in the region. We generated approximately $1.8 billion in revenue from China in 2010. In support of our growing revenue, we anticipate these subsidiariesour facilities in China will expand their operations with the addition of four new manufacturing sites over the next two years. This legal entity structure gives us control over our strategy and operational activities in the region and results in consolidation of revenue and earnings in our financial statements. We generated approximately $1.8 billion in revenue from China in 2010. With only 21 of our 33 offered products currently locally manufactured, we believe we have the opportunity to expand additional product lines into China, and as a result, we see further growth potential.
Lean and Flexible Cost Structure
We have a world-class, lean manufacturing system that allows us to provide customers with quality products and just-in-time delivery at competitive costs. In 2010, we largely completed our restructuring activities, resulting in a lower fixed cost base, improved manufacturing footprint and reduced overhead. We dramatically reduced our U.S. and Western European footprints, realigned our selling, general and administrative cost structure and increased the variable nature of our employee base. As a result, 91% of our hourly workforce is located in low cost countries. Furthermore, we have substantial operational flexibility by leveraging a large workforce of temporary workers, which represented approximately 30% of the hourly workforce as of March 31,June 30, 2011. We are focused on maintaining a low fixed cost base to minimize our EBITDA breakeven, which we estimate to be
30% below the current production volumes, assuming constant product mix and based on 2010 results. We believe that our lean cost structure will allow us to remain profitable at all points of the traditional vehicle industry production cycle.
World-Class Engineering Capabilities
Our history and culture of innovation have enabled us to develop significant intellectual property and design and development expertise to provide advanced technology solutions that meet the demands of our customers. We have a team of more than 16,000 scientists, engineers and technicians focused on developing leading product solutions for our key markets, located at 15 major technical centers in Brazil, China, France, Germany, India, Luxembourg, Mexico, Poland, South Korea, the United Kingdom and the United States. We invest approximately $1 billion annually in engineering to maintain our portfolio of innovative products, and currently own approximately 6,000 patents. We also encourage “open innovation” and collaborate extensively with peers in the industry, government agencies and academic institutions. Our technology competencies are recognized by both customers and government agencies, who have co-invested approximately $300 million of additional funds annually in new product development, increasing our total spend accordingly, accelerating the pace of innovation and reducing the risk associated with successful commercialization of technological breakthroughs. One example of co-investment is that we received an $89 million grant from the U.S. Department of Energy for reimbursement for up to 50% of the project costs associated with the development and manufacturing of power electronics related to electric and hybrid electric vehicles.
Our heritage includes the first factory installed radio, and we were a developer and designer of digital satellite radios, non-CFC refrigerant systems, high efficiency heat & mass exchangers, halogen free cables, dual mode electronically scanning radar, gas direct injection, power electronics & high voltage architectures for hybrid electric vehicles and electric vehicles. We have been recognized for our long history of innovation as a winner of the prestigious Automotive News PACE Award. The Automotive News PACE awards honor superior innovation, technological advancement and business performance in the automotive industry and is judged by an independent panel of industry experts. Over the past two years we have been a winner three times and over the 17-year history of the PACE awards, we have received more awards than any other automotive supplier. In 2010, we launched approximately 800 new product programs around the globe. Our future pipeline has promise in collision mitigation with auto braking, electric cam phasing, software defined radio, 2-step continuous variable valvetrain, ammonia and particulate sensors, high power density inverter switches for hybrid electric vehicles and other Safe, Green and Connected solutions.
Significant Operating Leverage Leading to Higher Margins
Our business model has generated strong margins. We believe our operating leverage will enable us to generate increased profitability from higher OEM production volumes, increased content per vehicle and new business wins, and our profitability has been increasing with these trends. We generated gross margins of 16.1%16.3% for the threesix months ended March 31,June 30, 2011 as compared to 14.8% for the year ended December 31, 2010, and EBITDA margins of 13.2%13.1% as compared to 9.9% for the year ended December 31, 2010. Segment EBITDA margins were greater than 10% in each of our operating segments for the threesix months ended March 31,June 30, 2011.
Strong Cash Flow Generation and Balance Sheet
Our margins have also translated to strong cash flow generation. In 2010, we generated $781 million in cash flow before financing (which is defined as cash flows from operating activities and cash flows from investing activities (excluding investments in time deposits)). Furthermore, we have a strong balance sheet with gross debt of $2.5$2.2 billion and substantial liquidity of $2.5 billion as of March 31,June 30, 2011, (in each case after giving effect to the modification of our Credit Agreement and issuance of Senior Notes on May 17, 2011), and no significant U.S. defined benefit or OPEB liabilities. We intend to maintain strong financial discipline targeting industry-leading earnings growth, cash flow generation and return on invested capital and to maintain sufficient liquidity to sustain our financial flexibility throughout the industry cycle.
Experienced Management Team
Our management team has significant experience, a deep understanding of the vehicle components industry and a firm focus on sustaining our leadership and financial strength. This team has been responsible for implementing the key operational restructuring initiatives that have positioned us for sustainable leadership in our industry with a strong and competitive financial profile. Key accomplishments since 2005 have included:
Aligning our portfolio with the mega trends—Safe, Green, and Connected—by reducing our business units from 27 to 10 and our product lines from 119 to 33;
Diversifying our geographic, product and customer mix, resulting in only 33% of our 2010 net sales generated in the North American market and 21% from our largest customer;
Reducing our cost structure by repositioning 91% of our hourly workforce in low cost countries; reducing our manufacturing space by 62%, or 42 million square feet; and reducing total headcount by approximately 27%25%;
Sustaining our commitment to innovation by investing approximately $1 billion annually in engineering; and
Generating a record level of business bookings, including $20 billion in 2010 and $6.6$14.4 billion in the first quarterhalf of 2011.
Our Strategy
Our strategy is to develop and manufacture innovative market-relevant products for a diverse base of customers around the globe and leverage our lean and flexible cost structure to achieve strong earnings growth and returns on invested capital. Through our culture of innovation and world class engineering capabilities we will continue to employ our rigorous, forward-looking product development process to deliver new technologies that provide solutions to OEMs.
Leverage Our Engineering and Technological Prowess
We will continue to leverage our strong product portfolio tied to the industry’s key mega trends with our global footprint to increase our revenues. We remain committed to sustaining our substantial annual investment in research and development to maintain and enhance our leadership in each of our product lines. We expect to introduce new products and customized solutions that enable OEMs to meet the increasing fuel economy and emissions regulations as well as consumer demand for increased connectivity and active safety features. We will continue to focus on identifying the next market trends that we believe will position us to capture new growth.
Capitalize on Our Scale, Global Footprint and Established Position in Emerging Markets
We intend to generate sustained growth by capitalizing on the breadth and scale of our operating capabilities, our global footprint that provides us the important proximity to our customers’ manufacturing facilities and allows us to serve them in every region of the world in which they operate, and our established presence in high growth emerging markets.
We are one of only a few vehicle component manufacturers with the resources and scale of operations to provide our customers with complete end-to-end systems solutions. From the development and design of innovative new products, to world class engineering, manufacturing and supply-chain management capabilities, we have significant resources that we use to help our customers meet the changing demands of the market. We have engineering and production capabilities in every major auto-producing market in the world, including North
America, South America, Europe and Asia. As a result, we are able to capitalize on the global standardization of vehicle platforms by the largest OEMs, while adapting our products for regional variations and regional OEMs.
We continue to expand our significant presence in emerging markets, positioning us to benefit from the expected growth opportunities in these regions. We will accomplish this by capitalizing on our long-standing relationships with the global OEMs and further enhancing our positions with the emerging market OEMs, thereby continuing to expand our worldwide leadership. We will continue to build upon our extensive geographic reach to capitalize on the fast-growing automotive markets, particularly in China, Brazil, India and Russia. We believe that our presence in low cost countries positions us to realize incremental margin improvements as the global balance of automotive production shifts towards the emerging markets.
Leverage Our Lean and Flexible Cost Structure to Deliver Profitability and Cash Flow
We recognize the importance of maintaining a lean and flexible cost structure in order to deliver stable earnings and cash flow in a cyclical industry. We intend to focus on maximizing manufacturing output to meet increasing production requirements with minimal additions to our fixed-cost base. We will continue to utilize a meaningful amount of temporary workers to ensure we have the appropriate operational flexibility to scale our operations so that we maintain our profitability as industry production levels increase or contract.
Target the Right Business with the Right Customers
We are strategic in pursuing new business and customers. We conduct in-depth analysis of market share and product trends by region in order to prioritize research, development and engineering spend for the customers that we believe will be successful. We collaborate with these customers in our 15 major technical centers around the world to help develop innovative product solutions for their needs. As more OEMs design vehicles for global platforms, where the same vehicle architecture is shared among different regions, we are well suited to provide global design and engineering support while manufacturing these products for a specific regional market. In addition we are disciplined in our pursuit of new business to ensure that we earn appropriate returns on capital. We have a rigorous internal approval process that requires senior executive review and approval to ensure consistency with our strategic and financial goals.
Pursue Selected Acquisitions and Strategic Alliances
Acquisitions and strategic alliances represent an important element of our business strategy and we believe we have the financial flexibility to pursue these opportunities with our current capital structure and liquidity profile. We believe that there are opportunities to grow through acquisitions, given the trend by OEMs to source globally and from a smaller number of suppliers, and that strategic alliances will allow us to pursue new opportunities faster and with less risk and investment. We intend to pursue selected transactions that leverage our technology capabilities, enhance our customer base, geographic penetration and scale to complement our current businesses. These complementary opportunities will provide us with access to new technologies, expand our presence in existing markets and enable us to establish a presence in adjacent markets.
Our History and Structure
In October 2005, the former Delphi Corporation and certain of its U.S. subsidiaries (the “Debtors”) filed voluntary petitions for reorganization relief under Chapter 11 of the United States Bankruptcy Code (the “Bankruptcy Code”) in the United States Bankruptcy Court for the Southern District of New York (the “Bankruptcy Court”). Collectively, the Debtors’ October 2005 filings are herein referred to as the “Chapter 11 Filings.” On July 30, 2009, the Bankruptcy Court approved modifications to the First Amended Joint Plan Of Reorganization Of Delphi Corporation And Certain Affiliates, Debtors And Debtors-In-Possession (As Modified) (the “Modified Plan”), which incorporated the MDA among the Predecessor, GM Component Holdings LLC, Motors Liquidation Company (“Old GM”), GM and DIP Holdco 3, LLC, for the sale and
purchase of substantially all of the Predecessor’s businesses, and completed the emergence of the Predecessor from Chapter 11 in accordance with the Modified Plan. Through the Acquisition Date, the Debtors operated their businesses as “debtors-in-possession” under the jurisdiction of the Bankruptcy Court and in accordance with the applicable provisions of the Bankruptcy Code and orders of the Bankruptcy Court. The Predecessor’s non-U.S. subsidiaries were not included in the Chapter 11 Filings, continued their business operations without supervision from the Bankruptcy Court and were not subject to the requirements of the Bankruptcy Code.
On August 19, 2009, Delphi Automotive LLP, a limited liability partnership organized under the laws of England and Wales, was formed for the purpose of acquiring certain assets and subsidiaries of the Predecessor, as discussed below. At this time, three firms, GM and affiliates of Silver Point Capital and Elliott Management, agreed to take a controlling stake in Delphi Automotive LLP. These three equity holders had jointly established a plan to fund the restructuring of the business. As a part of this plan, these equityholders established a board of proven senior executives to assist the management team in the continued restructuring and repositioning of the business.
On the Acquisition Date, the Predecessor (i) consummated the transactions contemplated by the Modified Plan and (ii) exited Chapter 11 as DPH Holdings Corp. and its subsidiaries and affiliates (“DPHH”), except that two of the Predecessor’s debtor subsidiaries became subsidiaries of Delphi Automotive LLP. A summary of significant terms of the Modified Plan follows:
We acquired the businesses (other than the global steering business and the manufacturing facilities in the U.S. at which the hourly employees are represented by the UAW) of the Predecessor pursuant to the MDA, and received $1,833 million from GM (of which $1,689 million was received on the Acquisition Date and $144 million was received during the Successor period from August 19 to December 31, 2009), and $209 million, net from certain of the debtor-in-possession (“DIP”)DIP lenders to the Predecessor (collectively, the “Acquisition”).
GM acquired substantially all of the Predecessor’s global steering business and the manufacturing facilities in the U.S. at which the hourly employees were represented by the UAW.
The Predecessor’s debtor-in-possession financing was settled.
The Predecessor’s liabilities subject to compromise were extinguished.
If cumulative distributions to the members of Delphi Automotive LLP under certain provisions of our limited liability partnership agreement exceed $7.2 billion, we, as disbursing agent on behalf of DPHH, are required to pay to the holders of allowed general unsecured claims against the Predecessor, $32.50 for every $67.50 in excess of $7.2 billion distributed to the members, up to a maximum of $300 million.
The Predecessor’s equity holders did not receive recoveries on their claims.
As a result of the Acquisition, we acquired the major portion of the business of the Predecessor and this business constituted the entirety of the operations of the Successor. We also issued membership interests to a group of investors consisting of lenders to the Predecessor, GM and the PBGC.
On May 19, 2011, Delphi Automotive PLC, a Jersey public limited company, was formed. Delphi Automotive PLC has nominal assets and no liabilities and has conducted no operations prior to completion of this offering. Immediately prior to the closing of this offering, it will acquire all of the outstanding unitsmembership interests of Delphi Automotive LLP from its existing unitequity holders in exchange for ordinary shares and, as a result, Delphi Automotive LLP will become a wholly-owned subsidiary of Delphi Automotive PLC.
Products
Our organizational structure and management reporting support the management of these core product lines.
Electrical/Electronic Architecture. This segment offers complete Electrical/Electronic Architectures for our customer-specific needs that help reduce production cost, weight and mass, and improve reliability and ease of assembly.
High quality connectors are engineered primarily for use in the automotive and related markets, but also have applications in the aerospace, military and telematics sectors.
Electrical centers provide centralized electrical power and signal distribution and all of the associated circuit protection and switching devices, thereby optimizing the overall vehicle electrical system.
Distribution systems are integrated into one optimized vehicle electrical system that can utilize smaller cable and gauge sizes and ultra-thin wall insulation (which product line makes up approximately 35% of our total revenue for the year ended December 31, 2010).
Powertrain Systems. This segment offers high quality products for complete engine management systems (“EMS”) and other products to help optimize performance, emissions and fuel economy.
The gasoline EMS portfolio features fuel injection and air/fuel control, valvetrain, ignition, sensors and actuators, transmission control products, and powertrain electronic control modules with software, algorithms and calibration.
The diesel EMS product line offers high quality common rail system technologies.
The Powertrain Systems segment also supplies integrated fuel handling systems for gasoline, diesel, flexfuel and biofuel configurations, and innovative evaporative emissions systems that are recognized as industry-leading technologies.
We also include diesel and automotive aftermarket and original equipment service in the Powertrain Systems segment.
Electronics and Safety. This segment offers a wide range of electronic and safety equipment in the areas of controls, security, entertainment, communications, safety systems and power electronics.
Electronic controls products primarily consist of body computers and security systems.
Infotainment and driver interface portfolio primarily consists of receivers, advanced reception systems, digital receivers, satellite audio receivers, navigation systems, displays and mechatronics.
Safety electronics primarily includes occupant detection systems, collision warning systems, advanced cruise control technologies and collision sensing.
Electric and hybrid electric vehicle power electronics comprises power modules, inverters and converters and battery packs.
Thermal Systems. This segment offers energy efficient thermal system and component solutions for the automotive market and continues to develop applications for the non-automotive market. Our Automotive Thermal Products are designed to meet customers’ needs for powertrain thermal management and cabin thermal comfort (climate control).
Main powertrain cooling products include condenser, radiator, fan module and charge air cooling heat exchangers assemblies.
Climate control portfolio includes HVAC modules, with evaporator and heater core components, compressors and controls.
Competition
Although the overall number of our top competitors has decreased due to ongoing industry consolidation, the automotive parts industry remains extremely competitive. OEMs rigorously evaluate suppliers on the basis of product quality, price competitiveness, reliability and timeliness of delivery, product design capability, technical expertise and development capability, new product innovation, financial viability, application of lean principles, operational flexibility, customer service and overall management. In addition, our customers generally require that we demonstrate improved efficiencies, through cost reductions and/or price improvement, on a year-over-year basis.
Our competitors in each of our operating segments are as follows:
| | |
Segment | | Competitors |
Electrical/Electronic Architecture | | • FCI SA • Lear Corporation • Leoni AG • Molex Inc. • TE Connectivity, Ltd. (formerly Tyco International, Ltd.) • Sumitomo Corporation • Yazaki Corporation |
| |
Powertrain Systems | | • BorgWarner Inc. • Bosch Group • Continental AG • Denso Corporation • Hitachi, Ltd. • Magneti Marelli S.p.A. |
| |
Electronics and Safety | | • Aisin Seiki Co., Ltd. • Autoliv AB • Bosch Group • Continental AG • Denso Corporation • Harman International Industries • Panasonic Corporation |
| |
Thermal Systems | | • Denso Corporation • MAHLE Behr Industry • Sanden Corporation • Valeo Inc. • Visteon Corporation |
Customers
We sell our products and services to the major global OEMs in every region of the world. We also sell our products to the worldwide aftermarket for replacement parts, including the aftermarket operations of our OEM customers and to other distributors and retailers. The following table provides the percentage of net sales to our largest customers for the year ended December 31, 2010:
| | | | |
Customer | | % of our
revenue | |
General Motors Company | | | 21 | % |
Ford Motor Company | | | 9 | % |
Volkswagen Group | | | 8 | % |
Daimler AG | | | 6 | % |
PSA Peugeot Citroën | | | 5 | % |
Renault S.A. | | | 4 | % |
Shanghai General Motors Company Limited | | | 4 | % |
Fiat Group Automobiles S.p.A. | | | 3 | % |
Hyundai Kia Automotive Group | | | 3 | % |
Toyota Motor Corporation | | | 3 | % |
GM, including its subsidiaries and affiliates, is our largest customer, representing 21% of our revenue for the year ending December 31, 2010.
Supply Relationships with Our Customers
We typically supply products to our OEM customers through purchase orders, which are generally governed by general terms and conditions established by each OEM. Although the terms and conditions vary from customer to customer, they typically contemplate a relationship under which our customers place orders for their requirements of specific components supplied for particular vehicles. These relationships typically extend over the life of the related vehicle. Prices are negotiated with respect to each purchase order, which may be subject to adjustments under certain circumstances, such as cost reductions achieved by us and generally decrease over the term of the supply relationship. In most instances our OEM customers agree to purchase their requirements for specific products but are not required to purchase any minimum amount of products from us. The terms and conditions typically provide that we are subject to a warranty on the products supplied; in most cases, the duration of such warranty is coterminous with the warranty offered by the OEM to the end-user of the vehicle. We may also be subject to share in all or a part of recall costs if the OEM recalls its vehicles for defects attributable to our products.
Individual purchase orders are terminable for cause or non-performance and, in most cases, upon our insolvency and certain change of control events. In addition, many of our OEM customers have the option to terminate for convenience, which permits our customers to impose pressure on pricing during the life of the vehicle program, and have the ability to issue purchase contracts for less than the duration of the vehicle program, which potentially reduces our profit margins and increases the risk of our losing future sales under those purchase contracts. Additionally, our largest customer, GM, expressly reserves a right to terminate for competitiveness on certain of our long-term supply contracts. We manufacture and ship based on customer release schedules, normally provided on a weekly basis, which can vary due to cyclical automobile production or dealer inventory levels. For a further description of our commercial agreements with GM, please see “Relationships and Related Party Transactions.”
Although customer programs typically extend to future periods, and although there is an expectation that we will supply certain levels of OEM production during such future periods, customer agreements including applicable terms and conditions do not necessarily constitute firm orders. Firm orders are generally limited to
specific and authorized customer purchase order releases placed with our manufacturing and distribution centers for actual production and order fulfillment. Firm orders are typically fulfilled as promptly as possible from the conversion of available raw materials, sub-components and work-in-process inventory for OEM orders and from current on-hand finished goods inventory for aftermarket orders. The dollar amount of such purchase order releases on hand and not processed at any point in time is not believed to be significant based upon the timeframe involved.
Our Global Operations
Information concerning principal geographic areas for our continuing operations is set forth below. Net sales data reflects the manufacturing location for the year ended December 31, 2010, the periods from August 19 to December 31, 2009 and January 1 to October 6, 2009 and the year ended December 31, 2008. Net property data is as of December 31, 2010, 2009 and 2008.
| | | | | | | | | | | | | | | | | | | | | | | | | | | | | | |
| | | Successor | | | | | Predecessor | |
| | | Year ended
December 31, 2010 | | | Period from
August 19 to December 31,
2009 | | | | | Period from
January 1 to
October 6, 2009 | | | Year ended
December 31, 2008 | |
| | | Net sales | | | Net
property(1) | | | Net sales | | | Net
property(1) | | | | | Net sales | | | Net sales | | | Net
property(1) | |
| | | (in millions) | | | | | (in millions) | |
United States | | $ | 4,529 | | | $ | 417 | | | $ | 1,083 | | | $ | 430 | | | | | $ | 3,107 | | | $ | 6,994 | | | $ | 1,144 | |
Other North America | | | 76 | | | | 134 | | | | 16 | | | | 109 | | | | | | 24 | | | | 63 | | | | 252 | |
Europe, Middle East & Africa (2) | | | 5,892 | | | | 1,045 | | | | 1,448 | | | | 1,047 | | | | | | 3,330 | | | | 6,950 | | | | 1,388 | |
Asia Pacific | | | 2,177 | | | | 325 | | | | 590 | | | | 272 | | | | | | 1,223 | | | | 1,747 | | | | 386 | |
South America | | | 1,143 | | | | 146 | | | | 284 | | | | 102 | | | | | | 650 | | | | 1,054 | | | | 129 | |
| | | | | | | | | | | | | | | | | | | | | | | | | | | | | | |
Total | | $ | 13,817 | | | $ | 2,067 | | | $ | 3,421 | | | $ | 1,960 | | | | | $ | 8,334 | | | $ | 16,808 | | | $ | 3,299 | |
| | | | | | | | | | | | | | | | | | | | | | | | | | | | | | |
| (1) | Net property data represents property, plant and equipment, net of accumulated depreciation. |
| (2) | Includes our country of domicile, Jersey, and the country of our principal executive offices, the United Kingdom. We had no sales in Jersey in any period. We had net sales of $690 million, $159 million, $394 million and $1,047 million in the United Kingdom for the year ended December 31, 2010, the period from August 19 to December 31, 2009, the period from January 1 to October 6, 2009 and the year ended December 31, 2008 respectively. We had net property in the United Kingdom of $137 million, $141 million and $171 million as of December 31, 2010, 2009 and 2008, respectively. |
Research, Development and Intellectual Property
We maintain technical engineering centers in major regions of the world to develop and provide advanced products, processes and manufacturing support for all of our manufacturing sites, and to provide our customers with local engineering capabilities and design development on a global basis. As of March 31,June 30, 2011, we employed over 16,000 engineers, scientists and technicians around the world. Expenditures for research and development activities, which consists of engineering, were approximately $1.0 billion, $0.3 billion, $1.0 billion and $1.9 billion for the year ended December 31, 2010, the period from August 19 to December 31, 2009, the period from January 1 to October 6, 2009 and the year ended December 31, 2008, respectively. Each year we share some engineering expenses with OEMs and government agencies. While this amount varies from year-to-year, it is generally in the range of 20% to 25% of engineering expenses.
We believe that our engineering and technical expertise, together with our emphasis on continuing research and development, allow us to use the latest technologies, materials and processes to solve problems for our customers and to bring new, innovative products to market. We believe that continued engineering activities are critical to maintaining our pipeline of technologically advanced products. Given our strong financial discipline, we seek to effectively manage fixed costs and efficiently rationalize capital spending by critically evaluating the profit potential of new and existing customer programs, including investment in innovation and technology. We
maintain our engineering activities around our focused product portfolio and allocate our capital and resources to those products with distinctive technologies. We expect expenditures for engineering activities to be approximately $1.0 billion for the year ended December 31, 2011.
We maintain a large portfolio of patents in the operation of our business. While no individual patent or group of patents, taken alone, is considered material to our business, taken in the aggregate, these patents provide meaningful protection for our products and technical innovations. Similarly, while our trademarks (particularly those protecting the Delphi brand) are important to identify our position in the industry, we do not believe that any of these are individually material to our business. We are actively pursuing marketing opportunities to commercialize and license our technology to both automotive and non-automotive industries and we have selectively taken licenses from others to support our business interests. These activities foster optimization of our use of intellectual property rights.
Materials
We procure our raw materials from a variety of suppliers around the world. Generally, we seek to obtain materials in the region in which our products are manufactured in order to minimize transportation and other costs. The most significant raw materials we use to manufacture our products include aluminum, copper and resins. As of March 31,June 30, 2011, we have not experienced any significant shortages of raw materials and normally do not carry inventories of such raw materials in excess of those reasonably required to meet our production and shipping schedules.
Commodity cost volatility, most notably related to copper, aluminum, petroleum-based resin products and fuel is a challenge for us and our industry. We are continually seeking to manage these and other material-related cost pressures using a combination of strategies, including working with our suppliers to mitigate costs, seeking alternative product designs and material specifications, combining our purchase requirements with our customers and/or suppliers, changing suppliers, hedging of certain commodities and other means. In the case of copper, which primarily affects our Electrical/Electronic Architecture segment, and aluminum, which primarily affects our Thermal segment, contract escalation clauses have enabled us to pass on some of the price increases to our customers and thereby partially offset the impact of increased commodity costs on operating income for the related products. However, other than in the case of copper and aluminum, our overall success in passing commodity cost increases on to our customers has been limited. We will continue and increase our efforts to pass market-driven commodity cost increases to our customers in an effort to mitigate all or some of the adverse earnings impacts, including by seeking to renegotiate terms as contracts with our customers expire.
Seasonality
Our business is moderately seasonal, as our primary North American customers historically halt operations for approximately two weeks in July and approximately one week in December. Our European customers generally reduce production during the months of July and August and for one week in December. In addition, automotive production is traditionally reduced in the months of July, August and September due to the launch of parts production for new vehicle models. Accordingly, our results reflect this seasonality.
Employees
As of March 31,June 30, 2011, we employed approximately 101,000 people (5,000 in the U.S., and 96,000100,500 outside of the U.S.): 23,000 salaried employees and 78,000 hourly employees. In addition, we maintain an alternative workforce of 38,000 contract and temporary workers. Our represented employees are represented worldwide by numerous unions and works councils, including the IUE-CWA, the United Steel, Paper and Forestry, Rubber, Manufacturing, Energy, Allied Industrial and Service Workers International Union and its Local Union 87L (together, the “USW”), and Confederacion De Trabajadores Mexicanos. In the U.S., our employees are represented by only the IUE-CWA and the USW, with which we have competitive wage and benefit packages. We no longer have any employees represented by the UAW.
Environmental Compliance
We are subject to the requirements of U.S. federal, state and local, and non-U.S., environmental and safety and health laws and regulations. These include laws regulating air emissions, water discharge, hazardous materials and waste management. We have an environmental management structure designed to facilitate and support our compliance with these requirements globally. Although it is our intent to comply with all such requirements and regulations, we cannot provide assurance that we are at all times in compliance. Environmental requirements are complex, change frequently and have tended to become more stringent over time. Accordingly, we cannot assure that environmental requirements will not change or become more stringent over time or that our eventual environmental costs and liabilities will not be material.
Certain environmental laws assess liability on current or previous owners or operators of real property for the cost of removal or remediation of hazardous substances. In addition to clean-up actions brought by U.S. federal, state, local and non-U.S. agencies, plaintiffs could raise personal injury or other private claims due to the presence of hazardous substances on or from a property. We are currently in the process of investigating and cleaning up some of our current or former sites. In addition, there may be soil or groundwater contamination at several of our properties resulting from historical, ongoing or nearby activities.
At March 31,June 30, 2011, December 31, 2010 and December 31, 2009, the reserve for environmental investigation and remediation was approximately $24$23 million, $23 million and $21 million, respectively, of which $7 million, $8 million and $5 million, respectively, related to sites within the U.S. We cannot ensure that environmental requirements will not change or become more stringent over time or that our eventual environmental remediation costs and liabilities will not exceed the amount of our current reserves. In the event that such liabilities were to significantly exceed the amounts recorded, our results of operations could be materially affected.
Properties
As of March 31,June 30, 2011, we owned or leased 110 manufacturing locations and 15 major technical centers located with a presence in 30 countries. A manufacturing location may include multiple plants and may be wholly or partially owned or leased. We also have many smaller manufacturing locations, sales offices, warehouses, engineering centers, joint ventures and other investments strategically located throughout the world. The following table shows the regional distribution of our manufacturing locations by the operating segment that uses such facilities:
| | | | | | | | | | | | | | | | | | | | |
| | | North
America | | | Europe,
Middle East
& Africa | | | Asia
Pacific | | | South
America | | | Total | |
Electronics and Safety | | | 3 | | | | 10 | | | | 2 | | | | 1 | | | | 16 | |
Powertrain Systems | | | 4 | | | | 10 | | | | 5 | | | | 2 | | | | 21 | |
Electrical/Electronic Architecture | | | 24 | | | | 18 | | | | 11 | | | | 6 | | | | 59 | |
Thermal Systems | | | 5 | | | | 4 | | | | 4 | | | | 1 | | | | 14 | |
| | | | | | | | | | | | | | | | | | | | |
Total | | | 36 | | | | 42 | | | | 22 | | | | 10 | | | | 110 | |
| | | | | | | | | | | | | | | | | | | | |
In addition to these manufacturing locations, we had 15 major technical centers: five in North America; five in Europe, Middle East and Africa; four in Asia Pacific; and one in South America.
Of our 110 manufacturing locations and 15 major technical centers, which include facilities owned or leased by our consolidated subsidiaries, 69 are primarily owned and 56 are primarily leased.
Our world headquarters for operations is located in Troy, Michigan. We also maintain regional headquarters in Sao Paulo, Brazil; Shanghai, China; and Bascharage, Luxembourg.
We frequently review our real estate portfolio and develop footprint strategies to support our customers’ global plans, while at the same time supporting our technical needs and controlling operating expenses. We believe our evolving portfolio will meet current and anticipated future needs.
Legal Proceedings
We are from time to time subject to various legal actions and claims incidental to our business, including those arising out of alleged defects, breach of contracts, product warranties, intellectual property matters, and employment-related matters. It is our opinion that the outcome of such matters will not have a material adverse impact on our consolidated financial position, results of operations, or cash flows. With respect to warranty matters, although we cannot ensure that the future costs of warranty claims by customers will not be material, we believe our established reserves are adequate to cover potential warranty settlements. However, the final amounts required to resolve these matters could differ materially from our recorded estimates.
European Union Antitrust Investigation
We have received a request for information from antitrust authorities at the European Commission seeking information about conduct by us in connection with an investigation in the European Union related to the electrical and electronic components market. We are cooperating fully with the European authorities. We can provide no assurances as to the impact, if any, that may result from this investigation.
GM Warranty Settlement Agreement
In 2007, the Predecessor reached a tentative agreement with Old GM to resolve certain known warranty matters and the Court authorized the Predecessor to enter into a Warranty, Settlement, and Release Agreement (the “Warranty Settlement Agreement”) with Old GM resolving these warranty matters. Under the terms of the Warranty Settlement Agreement, the Predecessor agreed to pay Old GM up to an estimated $199 million, comprised of approximately $127 million to be paid in cash over time as noted below, and up to approximately $72 million to be paid in the form of delivery of replacement product.
In conjunction with overall negotiations regarding potential amendments to the plan of reorganization to enable the Predecessor to emerge from chapter 11, including discussions regarding support assisting the Predecessor in remaining compliant with the global operating Adjusted EBITDA covenants in its Amended and Restated DIP Credit Facility, Old GM agreed, on July 31, 2008, to forgive certain of the cash amounts due under the Warranty Settlement Agreement. As a result, the Predecessor recorded the extinguishment of this liability as a reduction of warranty expense in 2008, of which $56 million was included in cost of sales, which had a corresponding favorable impact on operating income, and $56 million was included in discontinued operations. We assumed the Warranty Settlement Agreement in connection with the Acquisition. The remaining exposure is not significant as of March 31,June 30, 2011.
Other Warranty Matters
In 2009, we received information regarding potential warranty claims related to certain components supplied by our Powertrain segment. In March 2011, we reached a settlement with our customer related to this matter. During the three months ended March 31, 2011, we recognized an unusual warranty expense in cost of sales of approximately $76 million as a result of the settlement agreement. In April 2011, Delphi made a payment of €90 million (approximatelyapproximately $133 million at April 30, 2011 exchange rates) related to this matter.
Brazil Matters
We conduct significant business operations in Brazil, which are subject to the Brazilian federal, state and local labor, social security, environmental, tax and customs laws. While we believe we comply with such laws, they are complex, subject to varying interpretations, and we are often engaged in litigation regarding the application of these laws to particular circumstances. In addition, we are also a party to commercial and labor litigation with private parties. As of March 31,June 30, 2011, related claims totaling approximately $250$260 million have been asserted against us in
Brazil. As of March 31,June 30, 2011, we maintain accruals for these asserted claims that are substantially less than the amount of the claims asserted. The amounts accrued represent claims that are deemed probable of loss and are reasonably estimable based on our analyses and assessment of the asserted claims and prior experience with similar matters. While we believe our accruals are adequate, the final amounts required to resolve these matters could differ materially from our recorded estimates and our results of operations could be materially affected.
Romania Value Added Tax (“VAT”) Assessment
During the first quarter of 2010, as a result of a tax audit for years 2006–2008, we received a tax assessment from the Romanian tax authorities in the amount of approximately $42 million based on the taxing authority’s assessment that we underpaid our VAT (mostly on export sales) by approximately $24 million and owe accrued interest and penalties of $18 million. We filed an appeal contesting the assessment and in October 2010, the Romanian tax authorities substantially reduced the amount of the assessment and decided to re-audit us. As of March 31,June 30, 2011, we maintain a reserve for this contingency that is substantially less than the amount of the initial assessment. While we believe our reserve is adequate, the final amounts required to resolve this initial assessment could differ materially from our recorded estimate.
MANAGEMENT
Board of Directors
The name, age (as of April 30,July 31, 2011) and other positions with us, if any, of each person expected to be a member of our Board of Directors upon closing of the offering are listed below. Each member of our Board of Directors is currently a member of Delphi Automotive LLP’s Board of Managers, and information below as to each member’s tenure on our board reflects their tenure on Delphi Automotive LLP’s board. Each directors’s address for the purposes of any communication is the address of our principal executive offices, which are located at Courtney Road, Hoath Way, Gillingham, Kent ME8 0RU, United Kingdom.
| | | | | | |
Name | | Age | | | Position |
John A. Krol | | | 74 | | | Chairman |
Gary L. Cowger | | | 64 | | | Director |
Nicholas M. Donofrio | | | 65 | | | Director |
Mark P. Frissora | | | 55 | | | Director |
Rajiv L. Gupta | | | 65 | | | Director |
J. Randall MacDonald | | | 62 | | | Director |
Sean O. Mahoney | | | 48 | | | Director |
Michael McNamara | | | 54 | | | Director |
Rodney O’Neal | | | 57 | | | Director; Chief Executive Officer and President |
Thomas W. Sidlik | | | 61 | | | Director |
Bernd Wiedemann | | | 68 | | | Director |
Lawrence A. Zimmerman | | | 68 | | | Director |
The members of the Board of Directors were selected as members of the Board of Managers of Delphi Automotive LLP based on a defined set of skills and backgrounds that were identified as critical for the Company at the time. The skills and experiences identified were automotive and non-automotive backgrounds, and strong operational, strategic, financial, technical, human capital management, and corporate governance experience.
Set forth below is a brief description of the business experience of each of the members of the Board of Directors.
John A. Krolhas been Chairman since 2009. He is the former Chairman and Chief Executive Officer of E.I. du Pont de Nemours & Company. Following four years of service in the U.S. Navy, he joined Du Pont as a chemist and, following sales, marketing, manufacturing, and senior business management positions, was appointed Vice Chairman of the company in 1992, CEO in 1995, then Chairman and CEO, retiring in December 1998. Subsequently, he has served on numerous corporate boards, including J.P. Morgan, MeadWestvaco, Milliken Company, and advisory boards of Bechtel Corporation and Teijin Ltd. Mr. Krol received a B.S. and M.S. degree in chemistry from Tufts University. Mr. Krol’s wide-ranging leadership experience, including as Chairman and CEO of a global public company and numerous board and chairman assignments, brings to the Board of Directors extensive expertise in corporate governance, as well as significant operational and strategic expertise, financial management, and strategic development.
Other Directorships:Tyco International Ltd., ACE, Ltd. and Chairman of Pacolet-Milliken Enterprises, Inc.
Gary L. Cowger has been a Director since November 2009. He retired as Group Vice President of Global Manufacturing and Labor Relations for General Motors in December 2009, a position which he held since April 2005. Mr. Cowger began his career with GM in 1965 and held a range of senior leadership positions in business and operations in several countries, including President of GM North America, Chairman and Managing
Director, Opel, AG, and President of GM de Mexico. In 2006, he was elected to the National Academy of Engineering and currently serves as Co-Chair of the Martin Luther King Memorial Foundation’s executive Leadership Cabinet. He is Chairman of the Board of Trustees of Kettering University and on the Board of Trustees of the Center for Creative Studies. Through his extensive experience in the automotive industry across global markets, Mr. Cowger provides industry and operational expertise and strengthens the Board’sBoard of Directors’ global perspective.
Nicholas M. Donofrio has been a Director since December 2009. He retired as Executive Vice President, Innovation & Technology at International Business Machines Corporation in October 2008. Mr. Donofrio began his career at IBM in 1964, and worked at the company for more than 40 years in various positions of increasing responsibility, including Division Director; Divisional Vice President for Advanced Workstations; General Manager, Large Scale Computing Division; and Senior Vice President, Technology & Manufacturing. Mr. Donofrio earned a B.S. from Rensselaer Polytechnic Institute and holds a Master’s degree from Syracuse University. Mr. Donofrio brings to the Board of Directors executive management skills and significant technological expertise.
Other Directorships:Advanced Micro Devices, Inc. and Bank of New York Mellon Corporation
Mark P. Frissora has been a Director since December 2009. He is Chairman and CEO of Hertz Global Holdings, Inc. Prior to joining Hertz in 2006, Mr. Frissora served as Chairman and CEO of Tenneco, Inc. from 2000. Mr. Frissora previously served for five years as a Vice President at Aeroquip-Vickers Corporation. From 1987 to 1991, he held various management positions at Philips N.V., including Director of Marketing and Director of Sales. Prior to Philips, he worked for ten years at General Electric Co. in brand management, marketing and sales. Mr. Frissora holds a B.A. degree from The Ohio State University and has completed advanced studies at both the University of Pennsylvania’s Wharton School and the Thunderbird International School of Management. Mr. Frissora contributes expertise in automotive operations, product development, marketing and sales. As the Chairman and CEO of a global public company, Mr. Frissora also contributes leadership and strategic and financial management skills.
Other Directorships: Walgreen Co., Hertz Global Holdings and NCR Corporation (2002-2009)
Rajiv L. Gupta has been a Director since November 2009. He is former Chairman and CEO of Rohm and Haas Company, which position he held from October 1999 to March 2009. Mr. Gupta began his career at Rohm and Haas in 1971 and served in a broad range of global operations and financial leadership roles. Mr. Gupta received a B.S. in Mechanical Engineering from the Indian Institute of Technology, a M.S. in Operations Research from Cornell University and an MBA in Finance from Drexel University. Mr. Gupta’s educational and professional experience, including as Chairman and CEO of a global public company and other board assignments, enable him to contribute his expertise in corporate leadership, strategic analysis, operations, and executive compensation matters.
Other Directorships:Hewlett Packard, Tyco International Ltd. and The Vanguard Group, Inc.
J. Randall MacDonald has been a Director since November 2009. He is Senior Vice President, Human Resources at IBM. From 1983 to 2000, prior to joining IBM, Mr. MacDonald held a variety of senior positions at GTE, including Executive Vice President, Human Resources and Administration. He also has held senior leadership assignments at Ingersoll-Rand Company, Inc. and Sterling Drug. Mr. MacDonald is a former board member of Covance, Inc., a global drug services company. He earned both undergraduate and graduate degrees from St. Francis University. Through Mr. MacDonald’s many years of senior leadership in the field, he is able to provide expertise in global human resources management and leadership assessment and development.
Sean O. Mahoney has been a Director since November 2009. He is a private investor with over two decades of experience in investment banking and finance. Mr. Mahoney spent 17 years in investment banking at Goldman, Sachs & Co., where he was a partner and head of the Financial Sponsors Group, followed by four
years at Deutsche Bank Securities, where he served as Vice Chairman, Global Banking. During his banking career, Mr. Mahoney acted as an advisor to companies across a broad range of industries and product areas. He earned his undergraduate degree from the University of Chicago and his graduate degree from Oxford University, where he was a Rhodes Scholar. Through his experience in investment banking and finance, Mr. Mahoney provides the Board of Directors with expertise in financial and business strategy, capital markets, financing, and mergers and acquisitions.
Michael McNamara has been a Director since November 2009. He is CEO of Flextronics International Ltd. Mr. McNamara has served as Flextronics’s CEO since 2006, and previously was the company’s Chief Operating Officer. Prior to joining Flextronics, he was President and CEO of Relevant Industries, which was acquired by Flextronics in 1994. Mr. McNamara holds a B.S. degree from the University of Cincinnati and an MBA from Santa Clara University. As a result of his experience as the CEO of a global technology manufacturer, Mr. McNamara provides leadership experience as well as expertise in the electronics industry and global supply chain management.
Other Directorships:Flextronics International Ltd. and MEMC Electronic Materials, Inc.
Rodney O’Neal has been a Director as of May 2011. Mr. O’Neal also serves as our President and Chief Executive Officer, and became President and Chief Executive Officer of Delphi Automotive LLP effective October 6, 2009. Mr. O’Neal was President and Chief Executive Officer of Old Delphi from January 2007. He was President and Chief Operating Officer of Old Delphi from January 1, 2005. Prior to that position, Mr. O’Neal served as President of Old Delphi’s former Dynamics, Propulsion and Thermal sector from January 2003 and as Executive Vice President and President of Old Delphi’s former Safety, Thermal and Electrical Architecture sector from January 2000. Previously, he had been Vice President and President of Delphi Interior Systems since November 1998 and General Manager of the former Delphi Interior & Lighting Systems since May 1997. Mr. O’Neal earned a B.S. from Kettering University and a Master’s Degree from Stanford University. Through his 40 years of experience at Delphi and its predecessor companies, Mr. O’Neal brings extensive management and industry expertise and a comprehensive understanding of Delphi’s business and operations.
Other Directorships: Goodyear Tire & Rubber Company and Sprint Nextel Corporation.
Thomas W. Sidlik has been a Director since December 2009. In 2007, he retired from the DaimlerChrysler AG Board of Management in Germany after a 34 year career in the automotive industry. He previously served as Chairman and CEO of Chrysler Financial Corporation, Chairman of the Michigan Minority Business Development Council, and Vice-Chairman of the National Minority Supplier Development Council in New York. He serves on the Board of Eastern Michigan University, where he has been Vice-Chairman and Chairman of the Board. He received a B.S. from New York University and an MBA from the University of Chicago. Mr. Sidlik’s experience on the board of a global automaker provides the Board of Directors with significant industry, management, and strategic expertise, as well as his comprehensive understanding of the issues of diversity in the corporate environment.
Bernd Wiedemann has been a Director since April 2010. He is Senior Advisor at IAV GmbH, a leading provider of engineering services to the automotive industry based in Germany. Mr. Wiedemann joined IAV after retiring from Volkswagen AG and is former Chief Executive Officer, Volkswagen Commercial Vehicles and Truck Division in Wolfsburg, Germany. A 37-year employee of Volkswagen, Mr. Wiedemann held senior executive positions including Executive Vice President, Volkswagen, South America (1994-1995); Executive Vice President, Autolatina (1992-1994) and Director, Passenger Car and Commercial Vehicle Development (1989-1992). Mr. Wiedemann received a Master’s degree from the Hannover Technical University, a doctorate from Brandenburg Technical University and is a professor at the Berlin Institute of Technology. Mr. Wiedemann’s extensive engineering expertise and his global OEM management experience enable him to provide engineering, product development, industry, and leadership expertise to the Board of Directors.
Lawrence A. Zimmerman has been a Director since November 2009. He is the former Vice Chairman and Chief Financial Officer of Xerox Corporation, a position he held from June 2002 until April 2011. He joined Xerox as CFO in 2002 after retiring from IBM. A 31-year employee of IBM, Mr. Zimmerman held senior executive positions including Vice President of Finance for IBM’s Europe, Middle East and Africa operations, and Corporate Controller. Mr. Zimmerman received a B.S. in finance from New York University in 1965 and an MBA from Adelphi University in 1967. Mr. Zimmerman brings to the Board of Directors significant experience leading the finance organization of a large global company, and contributes financial, risk management, and strategy expertise.
Other Directorships:Stanley Black & Decker, Inc. and Brunswick Corporation.
Executive Officers
The name, age (as of April 30,July 31, 2011), current positions and a description of the business experience of each of our executive officers are listed below. There are no family relationships among the executive officers or between any executive officer and a director. Our executive officers are elected annually by the Board of Directors and hold office until their successors are elected and qualified or until their earlier resignation or removal. Each of our executive officers is also an executive officer of Delphi Automotive LLP.
| | | | | | |
Name | | Age | | | Position(s) |
Rodney O’Neal | | | 57 | | | Chief Executive Officer & President; Director |
Kevin P. Clark | | | 49 | | | Vice President and Chief Financial Officer |
Kevin M. Butler | | | 5556 | | | Vice President, Human Resource Management and Global Business Services |
James A. Bertrand | | | 5354 | | | Vice President & President, Thermal Systems |
Francisco A. OrdoñezLùcia V. Moretti
| | | 6046 | | | Vice President & President, Delphi Product & Service Solutions |
Jeffrey J. Owens | | | 56 | | | Vice President & President, Electronics and Safety |
Steven Kiefer | | | 48 | | | Vice President & President, Powertrain Systems |
David M. Sherbin | | | 51 | | | Vice President, General Counsel, Secretary & Chief Compliance Officer |
James A. Spencer | | | 58 | | | Vice President & President, Electrical/Electronic Architecture & President, Latin America |
Mr. O’Neal – see “—Board of Directors” above.
Mr. Clarkwas named vice president and chief financial officer of Delphi Automotive LLP, effective July 2010. Previously, Mr. Clark was most recently a founding partner of Liberty Lane Partners, LLC, a private-equity investment firm focused on building and improving middle-market companies. Prior to that, Mr. Clark served as the chief financial officer of Fisher Scientific International Inc., a manufacturer, distributor and service provider to the global healthcare market. Mr. Clark served as Fisher-Scientific’s chief financial officer from the company’s initial public offering in 2001 through the completion of its merger with Thermo Electron Corporation in 2006. Prior to becoming chief financial officer, Mr. Clark served as Fisher-Scientific’s corporate controller and treasurer.
Mr. Butlerwas named vice president, human resource management and global business services of Delphi Automotive LLP, effective November 2009. Previously, Mr. Butler became vice president, human resources management and an officer of Old Delphi in 2000. Prior to that, Mr. Butler was general director of human resources at Delphi Delco Electronics Systems since 1997.
Mr. Bertrandwas named vice president of Delphi Automotive LLP and president of Delphi Thermal Systems, effective October 6, 2009. Prior to that, Mr. Bertrand was vice president of Old Delphi and president of
Delphi Automotive Holdings Group Division since January 2003. Prior to that, Mr. Bertrand served a dual role beginning in January 2003 as president of Delphi Automotive Holdings Group Division and president of Old Delphi’s former Safety & Interior Systems Division, to which he was named president in January 2000. Mr. Bertrand has been a vice president of Delphi since 1998.
Mr. OrdoñezMs. Morettiwas named vice president of Delphi Automotive LLP and president of Delphi Product and Service Solutions (DPSS), effective October 6, 2009. Previously, Mr. OrdoñezAugust 1, 2011. Ms. Moretti was vice president of Old Delphi and president of Delphi Product and Service Solutions effective March 2002. He served as finance manager for GM España from 1981 to 1984 and as financemost recently director of Delphi’s Interiorsthe Global Independent Aftermarket PBU at DPSS, a position she has held since her appointment in September 2010. Earlier, she has held a variety of assignments at Delphi, including director of Aftermarket for South America, director of global marketing for DPSS and Lighting businessmanaging director for DPSS Europe. Ms. Moretti began her career at Delphi in the early 1990s. He was named general manager of Productformer Energy and Service SolutionsEngine Management (now Powertrain) Division in October 1999.São Paulo, Brazil in 1998 and has worked in the aftermarket business since 2000.
Mr. Owenswas named vice president of Delphi Automotive LLP and president of Delphi Electronics & Safety Division, effective October 6, 2009. Previously Mr. Owens was vice president of Old Delphi and president of Delphi Electronics & Safety Division effective September 2001. He also served as president for Delphi Asia Pacific from 2006 to 2009. Previously, Mr. Owens served as general director of Business Line Management, effective October 2000.
Mr. Kiefer was named vice president of Delphi Automotive LLP and president of Delphi Powertrain Systems effective July 2011. Previously, Mr. Kiefer served as general director of engineering and executive director for the HVAC product line within Delphi Thermal Systems since 2009, and prior to that, as managing director Europe for Delphi Thermal Systems since 2005. Earlier, Mr. Kiefer served as chief engineer and business line executive in Delphi’s Engine and Energy Management (now Powertrain) Division in Luxembourg and in the Asia Pacific and North America regions. Before joining Delphi, Mr. Kiefer was an engineer for General Motors North American Car Group, serving in a variety of positions.
Mr. Sherbinwas named vice president, general counsel, secretary and chief compliance officer for Delphi Automotive LLP, effective October 6, 2009. Previously, Mr. Sherbin was vice president, general counsel for Old Delphi effective October 2005. He was appointed chief compliance officer in January 2006. Previously, Mr. Sherbin was vice president, general counsel and secretary for Pulte Homes, Inc., a national homebuilder, from January 2005 through September 2005. Mr. Sherbin joined Federal-Mogul Corporation, a global automotive supplier in 1997 and was named vice president, general counsel, secretary and chief compliance officer in 2003.
Mr. Spencerwas named vice president of Delphi Automotive LLP and president of Delphi Electrical/Electronic Architecture Division effective October 6, 2009. Previously, Mr. Spencer was President of Delphi Asia Pacific from 1999-2000. Mr. Spencer was vice president of Old Delphi and president of Delphi Electrical/Electronic Architecture Division, formerly Packard Electric Systems Division, since 1999. He also has served as president for Delphi Latin America effective July 2006.
Board Composition
As of May 19, 2011, our Board of Directors consisted of two directors, Messrs. Clark and Sherbin. Both are expected towill resign prior to this offering. Upon completion of this offering, we expect thatwhereupon our Board of Directors will consist of the 12 directors.directors named above. Our amended Articles of Association will provide that our Board of Directors will consist of no less than or more than persons. The exact number of members on our boardBoard of directorsDirectors will be determined from time to time by resolution of a majority of our full Board of Directors. Delphi Automotive PLC will hold a significant number of board meetings in the U.K., such that the Company should be regarded as managed and controlled in the U.K. for tax purposes.
Each of the members of the Board of Directors, other than Mr. O’Neal and Mr. Sidlik, qualifies as “independent” under the rules of the NYSE. Each of Messrs. Zimmerman, Donofrio, Frissora and Wiedemann satisfies the standards of independence required for audit committee members pursuant to Section 10A-3 of the Exchange Act.
Board Committees
Delphi Automotive LLP currently has three main committees, each as described below. We expect that, upon the completion of this offering, these committees will be maintained by Delphi Automotive PLC with the same membership and responsibilities.
The Audit and Finance Committee currently consists of Messrs. Zimmerman (Chair), Donofrio, Frissora and Wiedemann, each of whom is independent. Each of these managers is financially literate, and the Board of Managers has determined that Mr. Zimmerman meets the qualifications of the audit committee financial expert as defined under the Securities Exchange Act of 1934, as amended. The Audit and Finance Committee is responsible for oversight of the adequacy of our internal accounting and financial controls and the accounting principles and auditing practices and procedures to be employed in preparation and review of our financial statements. The Audit and Finance Committee is also responsible for the engagement of independent public auditors and the review of the scope of the audit to be undertaken by such auditors.
The Compensation and Human Resources Committee (the “Compensation Committee”) currently consists of Messrs. Gupta (Chair), Krol, MacDonald, Mahoney and McNamara, each of whom is independent. The Compensation Committee reviews and, as it deems appropriate, recommends to the Board of Managers policies, practices and procedures relating to the compensation of the CEO and other officers and the establishment and administration of executive benefit plans.
The Nominating and Governance Committee currently consists of Messrs. Krol (Chair), Cowger, Frissora, and Wiedemann, each of whom is independent. The Nominating and Governance Committee reviews and, as it deems appropriate, recommends to the Board of Managers policies and procedures relating to manager and board committee nominations and corporate governance policies.
EXECUTIVE COMPENSATION
Compensation Discussion and Analysis
Executive Summary
Delphi’s compensation program is aligned with the Company’s performance and constantly strives to reflect best practices. We have created a pay-for-performance program that aligns executive and shareholder interests by reinforcing the long-term growth, value creation and sustainability of Delphi. The structure is designed to encourage a high degree of execution, collaboration and teamwork and rewards individuals for the achievement of goals that ultimately create shareholder value. The objective of the compensation program is thus to attract, motivate and retain a talented management team that will continue providing unique solutions in a competitive marketplace and deliver value for all shareholders.
The Compensation Committee, in consultation with management and the Compensation Committee’s independent outside advisors, oversees our executive compensation program, which is comprised of base salary, annual incentive compensation and long-term incentive compensation. The Company operates with the objective of creating long-term value for shareholders by delivering real-world automotive innovations that provide our customers with solutions to address rapidly changing market needs.
The following analysis contains a discussion of our executive compensation program and our analysis of the compensation decisions affecting our named executive officers (“NEOs”) during the year ended December 31, 2010 and going forward as a public company. For clarity, the following definitions are provided:
| | • | | Board of Managers: The Board of Managers of Delphi Automotive LLP. We anticipate that each current member of our Board of Managers will become a member of our post-offering Board of Directors. |
| | • | | Officers: The Company’s top 13 executives who are elected to their position by the Board of Managers of Delphi Automotive LLP. They represent the top strategy-making and operational executives in the Company and include the NEOs. |
| | • | | Executives: The Company’s top approximately 300 leaders (including officers) who are covered by the Company’s executive compensation programs. |
| | • | | Salaried employees: Generally refer to the approximately 4,000 supervisory, technical and support employees in the United States. |
Background of Our 2010 Compensation Practices – What was the Environment for Compensation Decisions?
At the time Delphi Automotive LLP was formed on October 6, 2009, it was majority-owned by the debtor-in-possession lenders that financed its four-year bankruptcy. The formation of Delphi Automotive LLP took place in the middle of an unprecedented global financial crisis and plummeting consumer demand that threatened the global automotive market. The uncertainty regarding the future of some of our largest global customers, many of whom were weathering significant financial challenges themselves, including bankruptcy, raised serious questions as to whether key players in the automotive industry, including component suppliers, would survive.
Against this backdrop, our owners faced immediate challenges, the most prominent of which was to ensure that our workforce, particularly our management team, would continue to be engaged and motivated to overcome significant challenges and be ready to take advantage of opportunities when the market recovered. In early October 2009, our owners presented offer letters to approximately 4,500 U.S. employees (including executives and officers) offering them positions in the new company. Aiming to establish a solid foundation for our
compensation practices, these offer letters reflected Delphi Automotive LLP’s compensation philosophy, which focused on creating value and a culture that rewarded high performance, through the following themes:
The compensation framework as applied to salaried employees across all groups should be generally consistent, although the actual pay received by each employee will vary depending on the size, scope and complexity of his or her position, as well as on individual performance.
Executive compensation should include a long-term component that aligns the interests of the executives with our owners and promotes retention of executives who perform well.
| | • | | Executives should have a meaningful portion of their pay “at risk” (i.e., not guaranteed unless certain performance goals are achieved) in order to align employee compensation with company performance. |
In order to adapt our executive compensation structure to conform to this philosophy and to stay competitive during the global financial crisis, the following changes to our executive compensation practices were made, which were outlined in the offer letters:
Officers’ base salaries were reduced.
Perquisites for executives were eliminated.
Executive annual incentive targets were raised to partially offset the elimination of perquisites and base pay reductions, resulting in increased annual at-risk pay.
Benefits for eligible participants under the Supplemental Executive Retirement Program (the “SERP”) were substantially reduced, and certain eligible officers and executives were required to choose between receiving a severance payment or reduced SERP benefits in the event of a company-initiated termination.
Compensation Philosophy and Strategy – How do we pay executives?
General Philosophy. Investors expect a company’s executives to manage the company in a way that increases shareholder value over time, whether the company is public or private. In order to achieve success and meet the expectations of our investors, it is important that we ensure our compensation programs encourage executives to make sound decisions that drive long-term value creation.
Our Compensation Committee has defined the following key objectives of our compensation programs for executives as follows:
Promote Delphi’s overall business strategy and objectives, particularly as it relates to long-term value creation;
Pay for performance by linking total compensation to defined performance goals;
Attract and retain key executives by providing competitive total compensation opportunities; and
Align executive and investor interests by focusing executive behavior on driving long-term value creation.
Our compensation practices are aligned from the entry-level salaried employee to the executives, including the NEOs, though differences exist where appropriate for the business and in line with competitive practice. Accordingly, most of the philosophy and practices described for NEOs will apply generally to all executives and in some cases to all salaried employees.
Pay for Performance. Effectively aligning the goals of executive compensation with the interests of investors requires adopting compensation programs that motivate leadership to drive company performance to sustainable top quartile performance. Reinforcing the link between compensation and company performance was particularly important at the time of the formation of Delphi Automotive LLP, given the uncertainty in the automotive sector (specifically the automotive supply industry) and global financial markets in 2009. To that end, the Compensation Committee established short- and long-term incentive plans with targets focused on rewarding individuals for strong company performance. In addition, because we believe that individuals should be rewarded based on the results of their contributions, we also consider individual performance levels in awarding incentive compensation.
Long-Term Incentives and the Role of Equity. Another early focus of the Compensation Committee was to design a long-term incentive plan that focused on aligning our executives’ interests with the value-creation objectives of our investors. Ultimately, the Compensation Committee developed a plan with a one-time performance-based grant spanning a 39-month performance period (i.e., not an annual long-term incentive program), enabling our executives to share in the success of the Company based on the overall improvement in total company value during this period. The Compensation Committee further decided that awards for officers would settle in equity interests or shares.
Peer Group Analysis. Benchmarking is an integral aspect of our compensation system. To attract and retain our key executives, our goal is to provide compensation opportunities at competitive market rates. A key element of this process is selecting a relevant peer group against which we compare our elements of pay. Delphi’s 2010 peer group was made up of companies whose aggregate profile was comparable to Delphi in terms of size, industry, competition for executive talent and achievement of strong financial performance. The Compensation Committee determines the composition of our peer group on a yearly basis, taking into consideration the peer group recommended by its independent compensation consultant. Our intent is to create a compensation structure that targets the median of our selected peer companies, but also allows total compensation to exceed the median when company performance and individual experience, responsibilities and performance warrant.
Our 2010 peer group was comprised of the following companies:
| | | | |
| ArvinMeritor | | Federal-Mogul | | PACCAR |
| BorgWarner | | Genuine Parts Company | | Parker Hannifin |
| Corning Incorporated | | Goodyear | | Precision Castparts |
| Cummins | | ITT Corporation | | Tenneco |
| Dana Holding Corporation | | Johnson Controls | | Textron |
| Danaher Corporation | | Lear | | TRW Automotive Holdings |
| Dover | | Navistar International | | Visteon |
Total direct compensation for officers in 2010 was between the 50th – 75th percentiles of the peer group, and in 2011, market movement shifted the position to between the 50th – 65th percentiles. We target compensation for officers in the 50th percentile range. The Compensation Committee sets annual incentive financial performance metrics at stretch levels to drive high-level performance. We intend to monitor our compensation structure in relation to our peer group annually to ensure that target total direct compensation for our officers is appropriate considering our peer companies in terms of both size and overall company performance.
Role of the Committee and Use of Outside Consultants. The Compensation Committee is responsible for overseeing executive compensation and other human resources matters. Since November 2009, the Compensation Committee has retained Radford, an Aon Hewitt Consulting Company, to advise the committee on executive compensation matters. The scope of Radford’s work includes market assessment, data review and analysis. Radford reports directly to the Chairman of the Compensation Committee and takes direction solely from the Compensation Committee. Radford is invited to and attends Compensation Committee meetings that address matters relating to the services it provides to the committee. Radford does not perform any other work
for Delphi. In 2010, fees paid for services provided by Radford totaled $98,000. Aon Hewitt Consulting, Radford’s parent company, provides risk management and insurance services for Delphi, and the amounts paid for these services in 2010 were approximately $1.6 million.
Philosophy and Strategy Post-Offering. The Compensation Committee will continue applying the compensation philosophy and strategy described above to its design and oversight of executive compensation programs following the completion of this offering. To that end, our plan is to reserve shares of equity before or in connection with this offering for future long-term compensation to align the interests of management and shareholders. Future long-term incentive awards may be delivered in a variety of forms such as restricted stock, restricted stock units, stock options and performance shares. The future plan will have competitive and market-appropriate holding requirements.
Overview of Executive Compensation – What are the Elements of Pay?
With the objectives outlined in “Compensation Philosophy and Strategy—General Philosophy” in mind, we regularly undertake comprehensive review of our overall long-term business plan to identify the key strategic initiatives that should be linked to compensation. From there, we derive the annual short-term and long-term compensation performance metrics that will reward executives based on the actual performance of the Company. We also assess and review the level of risk in our compensation programs to ensure that they do not encourage inappropriate risk-taking.
Elements of Executive Compensation. In line with the philosophy described above, compensation of our executives, including the NEOs as displayed in the Summary Compensation Table below, is comprised of the following elements:
An annual incentive award;
A one-time long-term incentive award; and
Other compensation, which consists primarily of qualified and non-qualified defined contribution plans.
The following chart outlines these elements of compensation and indicates how they relate to the key objectives of our compensation programs for executives:
| | | | |
| Element | | Key Features | | Relationship to
Objectives |
Direct Compensation |
| | | |
| Base Salary | | • Commensurate with responsibilities, experience and performance • Reviewed on a periodic basis for competitiveness and individual performance • Targeted at the market median | | • Attract and retain key executives |
| | | |
Annual Incentive Plan | | • Compensation Committee approves a target incentive pool for each performance period based on selected financial and/or operational metrics • Each executive is granted a fixed award opportunity varying by level of responsibility • Actual payouts are determined by actual performance (at both the corporate and, where applicable, division level), then adjusted to reflect individual performance based on pre-established individual objectives | | • Pay for performance • Align executive and investor interests |
| | | |
Long-Term Incentive Plan (i.e., Management Value Creation Plan (“Value Creation Plan”)) | | • Target award granted commensurate with responsibilities, experience and performance • Participants were granted a one-time award for a 39-month performance period • Awards vest at the end of the performance period, with award values based on our company value as of December 31, 2012 • Following the closing of the offering, officers’ awards will settle at the completion of the performance period in Delphi equity and other executives’ awards will settle in cash • We intend to adopt a new equity compensation plan for future long-term incentive compensation | | • Pay for performance • Align executive and investor interests • Attract and retain key executives • Focus on long-term value creation |
| | | | |
| Element | | Key Features | | Relationship to
Objectives |
| Other Compensation |
| | | |
Salaried Retirement Savings Program, Salaried Retirement Equalization Savings Program and Supplemental Executive Retirement Program | | • Qualified defined contribution plan available to all salaried employees, including executives • Non-qualified defined contribution plan available to eligible employees, including executives, who exceed statutory limits under our qualified defined contribution plan • Defined benefit plan that was frozen as of September 2008 and provides reduced benefits to certain eligible executives who participated in the defined benefit plan that predates the formation of Delphi Automotive LLP | | • Attract and retain key executives |
Total Direct Compensation Mix. Our annual incentive and long-term incentive awards are considered “at-risk” pay because the recipients of these awards are not guaranteed any payment unless they achieve specified performance goals at corporate, division and individual levels. These annual and long-term incentive awards, along with base salary, make up our executives’ “total direct compensation.” Delphi strives to ensure that a majority of each executive’s total direct compensation is comprised of at-risk pay.
Mr. O’Neal’s annualized at-risk pay makes up 86% of his total direct compensation, which includes the 60% of his total direct compensation that is tied to long-term incentives; correspondingly, his base salary makes up 14% of his total direct compensation. Our remaining NEOs’ total direct compensation, on average, is comprised of 76% at-risk pay and 24% base salary, with long-term incentives constituting 49% of total direct compensation. The large proportion of at-risk pay, combined with a focus on long-term incentive awards, aligns the NEOs’ interests with the interests of Delphi’s investors.
The mix of compensation for our CEO and other NEOs are shown below:
2010 Target Compensation Structure. Our executives’ direct compensation is made up of three elements: base salary, an annual incentive award and a long-term incentive award. For 2010, the Compensation Committee approved the following annualized total direct compensation for the NEOs who were officers as of December 31, 2010:
| | | | | | | | | | | | | | | | | | |
2010 Total Direct Compensation | |
Name | | Division | | Base Salary | | | Annual Incentive
Target Award
(1) | | | Long-Term
Incentive Plan
Target Award
(2) | | | Total | |
Rodney O’Neal | | Corporate | | $ | 1,211,100 | | | $ | 2,195,000 | | | $ | 5,076,923 | | | $ | 8,483,023 | |
Kevin P. Clark (3) | | Corporate | | | 800,000 | | | | 800,000 | | | | 2,538,462 | | | | 4,138,462 | |
James A. Bertrand | | Thermal Systems | | | 573,600 | | | | 660,500 | | | | 1,038,462 | | | | 2,272,562 | |
Ronald M. Pirtle | | Powertrain Systems | | | 603,000 | | | | 687,000 | | | | 1,000,000 | | | | 2,290,000 | |
James A. Spencer | | Electronics/Electrical
Architecture | | | 560,100 | | | | 659,000 | | | | 1,076,923 | | | | 2,296,023 | |
| (1) | All annual incentive awards have been granted under our Annual Incentive Plan. |
| (2) | All long-term incentive awards have been granted under our Value Creation Plan. The awards are a one-time grant covering a 39-month performance period from October 2009 to December 2012. As of December 31, 2010, no portion of the awards had vested. Each award will “cliff” vest on the earlier of December 31, 2012 or a qualifying termination after a change in control and will settle in Delphi equity, which may be subject to an ownership or holding commitment. The awards are not subject to accelerated vesting in the event of a completed initial public offering. The amounts in the table represent annualized target values for 2010. |
| (3) | Mr. Clark’s base salary and annual incentive target are annualized for the full year. Mr. Clark’s actual salary and annual incentive target (as reported in the Summary Compensation Table and the Grants of Plan-Based Awards Table) were prorated based on his hire date in July 2010. |
Officer Annual Compensation Determination. Individual base salaries and annual incentive targets for the officers are established based on the scope and size of each officer’s responsibilities. At the beginning of each year we also define the key strategic objectives each officer is expected to achieve during that year, which are evaluated and approved by the Compensation Committee.
Base Salary. Base salary is intended to be commensurate with each executive’s responsibilities, experience and performance. For newly hired officers, the Compensation Committee conducts a market review of the position in terms of its size and scope of responsibility and also takes into account the individual’s compensation at his previous employer. Salaries for officers were established in the offer letter process previously discussed in “Background of Our 2010 Compensation Practices.” The net adjustments were an overall reduction in base salary of 19% for Mr. O’Neal and an average of 9% for all other NEOs, except Mr. Clark. Mr. Clark’s base salary was established when he was recruited by Delphi.
Annual Incentive Plan. Our Annual Incentive Plan is designed to motivate executives to drive company earnings, cash flow before financing and growth by measuring the executives’ performance against the current year business plan at the corporate and relevant division levels. The Compensation Committee, working with management, sets the annual incentive performance objectives and payout levels based on Delphi’s annual company business objectives, which are then reviewed and approved by the Board of Managers. For 2010 each NEO’s award payout was determined as follows:
Corporate performance metrics, weighted 100% for Messrs. O’Neal and Clark, and 25% for Messrs. Bertrand, Pirtle and Spencer
Division performance metrics, weighted 75% for Messrs. Bertrand, Pirtle and Spencer
Individual performance metrics, which allow for payment adjustments (within the total fund pool) reflective of each NEO’s performance against his individual goals
For 2010, both corporate and division performance objectives were based on three metrics: EBITDAR, cash flow before financing and growth. The Compensation Committee selected the following weightings in 2010 for both corporate and division performance metrics:
| | |
Weighting of Performance Metrics |
EBITDAR (1) | | 70% |
Cash flow before financing (2) | | 20% |
Growth (3) | | 10% |
| (1) | EBITDAR was an appropriate measurement of our underlying earnings for 2010 and a good indication of our performance. As Delphi was still implementing material elements of its post-formation reorganization, restructuring charges were included in the 2010 annual incentive plan but was not included in 2011, at which time we replaced EBITDAR with EBITDA. |
| (2) | Cash flow before financing measures the amount of cash generated by our operations, excluding financing activities. |
| (3) | The growth metric is based on our future business booked in the current fiscal year. In general, in order to achieve the target performance level, a specified percentage of our planned future sales for the next two calendar years must be booked by the end of the measurement period, in this case the end of fiscal year 2010. |
Similar to the process for determining base salary, the Compensation Committee establishes the annual incentive target for each officer based on his or her position and the size and scope of his or her responsibilities.
The EBITDAR and cash flow before financing metrics and the award payout levels related to those metrics are measured on a performance matrix, with threshold, target and maximum financial performance requirements and payout levels set by the Compensation Committee. Performance below the minimum threshold results in no payout, and performance above the maximum level is capped at a maximum payout, which ranges from 150% to 200% of the target award.
The growth metric is treated differently from the EBITDAR and cash flow before financing metrics, as it includes only a target level without threshold or maximum performance levels. If the growth metric is achieved, the target award level for that metric is paid. If the growth metric is not achieved, the growth portion of the award will not be paid.
The threshold, target and maximum payout levels for the NEOs in 2010 are shown below.
| | | | | | | | | | | | |
| | | Payout as a Percentage of the 2010 Target Award | |
Performance Level | | EBITDAR | | | Cash Flow Before
Financing | | | Growth | |
Threshold performance | | | 50 | % | | | 50 | % | | | 0 | % |
Target performance | | | 100 | % | | | 100 | % | | | 100 | % |
Maximum performance | | | 200 | % | | | 200 | % | | | 100 | % |
Once the combined payout is determined based on the three financial metrics at corporate and/or division level, the Compensation Committee, in conjunction with the CEO, assesses each officer’s performance based on the attainment of individual performance objectives. The CEO does not participate in the assessment of his own performance.
Consistent with Section 162(m) of the Code, annual incentive compensation awards for officers may not be increased based on individual performance but may be decreased if performance goals are not met. Annual incentive compensation for employees other than officers may be decreased or increased based on assessment of individual performance. The pool for annual incentive compensation cannot be increased, and, as a result, any increase to an individual’s award must be offset by a decrease in other individuals’ awards so that the aggregate award payouts do not exceed the generated fund dollars.
The table below shows the 2010 performance targets set for the corporate and division levels relevant to the NEOs who were officers as of December 31, 2010:
| | | | | | | | | | | | |
Division | | 2010 EBITDAR
Target | | | 2010 Cash Flow Before
Financing
Target | | | 2010 Growth
Target
(2011/2012 Bookings) | |
| | | |
| | | (in millions) | | | (in millions) | | | | |
Corporate | | $ | 822 | | | $ | 0 | | | | 99% /91 | % |
Electronics/Electrical Architecture | | $ | 317 | | | $ | 146 | | | | 98% /91 | % |
Thermal Systems | | $ | 72 | | | $ | 11 | | | | 100% /94 | % |
Powertrain Systems | | $ | 246 | | | $ | 18 | | | | 100% /91 | % |
The 2010 performance of all divisions exceeded target levels. As a result, award percentages based on corporate and division level metrics ranged from 189% to 200%. After first considering the Company’s strong performance, as discussed above, the Compensation Committee then evaluated each officer’s individual performance objectives to determine if any payout adjustments were warranted. These objectives related to specific customer relationships, improved cost structure initiatives (e.g., material cost), health and safety metrics as well as achieving specific financial improvement (e.g., margin expansion). Each NEO achieved his individual objectives. Adjustments to individual payouts of NEOs who are current officers, as listed below, were reflective of individual and divisional performance factors.
The Compensation Committee approved the following 2010 annual incentive awards for the NEOs who were officers as of December 31, 2010:
| | | | | | | | |
Name | | Annual Incentive Plan
Actual 2010 Payment (1) | | | % of Target Incentive | |
Rodney O’Neal | | $ | 4,390,000 | | | | 200 | % |
Kevin P. Clark (2) | | $ | 800,000 | | | | 200 | % |
James A. Bertrand | | $ | 1,321,000 | | | | 200 | % |
Ronald M. Pirtle | | $ | 1,236,600 | | | | 180 | % |
James A. Spencer | | $ | 1,318,000 | | | | 200 | % |
| (1) | These award amounts are reported in the Summary Compensation Table. |
| (2) | Mr. Clark received a prorated target award based on his hire date in July 2010. |
Long-Term Incentive Plan. In 2009, the Compensation Committee designed the Management Value Creation Plan (the “Value Creation Plan”) in order to link a significant portion of executive compensation to company value. Because targets are based upon equity interests, executives had a major component of their compensation structure aligned with the interests of the private company’s owners. Under the Value Creation Plan, an equity-based long-term incentive plan, participants were granted a one-time award for a 39-month performance period commencing in October 2009 and ending in December 2012, with vesting generally occurring on a “cliff” basis at the end of the performance period and award values based on our company value as of December 31, 2012.
If Delphi is a public company at the end of the performance period, our officers will receive their Value Creation Plan awards in ordinary shares, thus maintaining alignment with the shareholders. The Compensation Committee retains the discretion to settle some or all of the awards in cash.
In general, actual payouts under the Value Creation Plan are based on three factors:
Target award amount (“target value”);
Delphi’s company value as of December 31, 2012 (“company value”), which will be determined using a formula based on the average market price of the Company, including any qualified distributions, if we become a public company, or an independent valuation if we are not a public company; and
Target value divided by the total Value Creation Plan target fund of $135,000,000 (“target value percentage”).
Each individual participant’s target value is based on a market review of long-term incentive targets conducted by Radford. The Compensation Committee, with input from the CEO regarding the other executives, determined each executive’s target value based on his or her level of responsibility and the country or region in which he is located. Each year, the Compensation Committee also evaluates participants’ performance and may grant special awards in recognition of outstanding performance.
A company value of $2.5 billion must be achieved to receive a minimum award payment; above this level, the payout is determined primarily as a percentage of the target award. The target award will be paid if the company value, which is deemed to include distributions to holders of all membership interests and the approximately $4.4 billion paid to repurchase Class A and Class C membership interests, reaches $8.25 billion; and an amount more than the target award will be paid if the company value exceeds $8.25 billion.
Once Delphi becomes a public company, the company value will be based on the average market price of the Company between our first day of trading on a public exchange and the end of the performance period (i.e., December 31, 2012) as well as any cash-qualifying distributions. The Value Creation Plan provides for an independent valuation if we are not a publicly-traded company at the end of the performance period.
Upon a qualifying termination after a change in control, officers’ Value Creation Plan awards will vest earlier than December 31, 2012 and will settle in Delphi equity. Other executives’ awards will “cliff” vest upon the earlier of December 31, 2012 or a change in control and will settle in cash.
The Value Creation Plan amounts shown in the “2010 Total Direct Compensation Target” table in this Compensation Discussion and Analysis reflect the target values. In comparison, the values shown in the Grants of Plan-Based Awards table below are based on the Value Creation Plan grant date recognized in our financial reports in accordance with relevant accounting rules using the grant date of September 15, 2010, the date by which participants had to sign agreements in order to be eligible to participate in the program. The values reported in the Outstanding Equity Awards at Fiscal Year-End table below are based on our 2010 company value as evaluated formally by a third-party appraiser as of December 31, 2010. Such award values may therefore vary in the relevant tables.
In order to participate in the Value Creation Plan, each eligible executive was required to sign a confidentiality and non-interference agreement, which includes both non-compete and non-solicitation covenants, and a participation agreement. The confidentiality and non-interference agreement is discussed under “Other Considerations” below.
Other Compensation. As described above in “Background of our 2010 Compensation Practices,” perquisites for executives were eliminated at the time of the formation of Delphi Automotive LLP. Other than base salary, the annual incentive plan and the Value Creation Plan, the only other formal compensation programs available to our executives are the programs described below.
| | • | | Salaried Retirement Savings Program (“SRSP”). Along with other eligible Delphi salaried employees, our executives are eligible to participate in our broad-based defined contribution plan, the SRSP, which is a qualified plan under Section 401(k) of the Code. All contributions are subject to any contribution limits imposed by the Code. |
| | • | | Salaried Retirement Equalization Savings Program(“SRESP”). Under the SRESP, eligible employees, including our executives and officers, receive Delphi contributions in excess of the limits imposed upon the SRSP by the Internal Revenue Code. No guaranteed or above-market rates are earned; the investment options available are a subset of those available to all employees under the SRSP. Additional details regarding benefits and payouts under this plan are provided in “Non-Qualified Deferred Compensation” below. |
| | • | | Supplemental Executive Retirement Program(“SERP”). The Predecessor’s SERP was frozen (for purposes of credited service and compensation calculations) in September 2008, as described further under “Pension Benefits” below. A modified, reduced-benefit version of the plan was approved by the bankruptcy court for retention purposes as part of the formation of Delphi Automotive LLP. As a result, a specified group of executives with executive appointment dates predating September 2008 remain eligible for reduced supplemental benefits through the modified version of the plan. This plan is unfunded. Additional details regarding accruals and payouts under this plan are provided in “Pension Benefits” below. |
Compensation for Mr. Sheehan and Mr. Stipp.Mr. Sheehan was our CFO until he ceased employment with Delphi on March 1, 2010. As a result of his departure, Mr. Sheehan received a severance payment of $1,680,000 paid semi-monthly through August 2011, which is discussed in detail in the Summary Compensation Table below. He forfeited his annual incentive award and was not eligible to receive an award under the Value Creation Plan.
Mr. Stipp was our Acting CFO from March 1, 2010 to June 30, 2010. His compensation includes a one-time payment of $42,000 and his annual incentive target reflects an increase of $80,000, all as additional compensation for his service as Acting CFO. Corporate performance weighed 100% in Mr. Stipp’s annual incentive award. Because he was considered a non-officer executive at the beginning and end of 2010, his maximum annual incentive payout before individual performance adjustment was 150% of the target award and he was eligible for, and received, an upward adjustment in his annual incentive award. In addition, because he is not an officer, his Value Creation Plan award will settle in cash rather than equity.
2011 Departure of Mr. Pirtle.Mr. Pirtle ceased being an executive officer of Delphi on July 1, 2011 and will retire from Delphi on January 1, 2012. Because his retirement takes place after the end of 2010, it does not affect his 2010 compensation.
Risk Analysis
We conducted an internal audit of risks arising from our base pay, annual incentive plan, Value Creation Plan and other material incentive programs in effect at Delphi during 2010. This assessment included a review of the Compensation Committee’s minutes, interviews of senior Delphi Human Resources personnel, interviews of selected Delphi financial personnel, reviews of internal control audits and compliance-related activities and examination of documents supporting base pay and our material incentive compensation programs. Our review was designed to identify the controls over compensation practices at Delphi and to determine whether our compensation policies and practices for all employees create risks that are likely to have a material adverse effect on the Company. Based on this evaluation and the procedures performed, we concluded that our compensation programs do not create risks that are reasonably likely to have a material adverse effect on Delphi. Among the elements evaluated were the following:
Independent oversight by the Compensation Committee
Discrete segregation of duties between the review of financial results and the determination of final payouts to individuals
Inclusion of clawback language in the event of a material financial misstatement
Other Considerations
Clawback. As a matter of policy and applicable plan language, if our financial statements are materially misstated, then the Compensation Committee has the right to review the circumstances and determine if any participants should forfeit future awards or repay prior payouts. If the misstatement is due to fraud, then the participants responsible for the fraud will forfeit their rights to any future awards and must repay any excess amounts they received from prior awards due to the fraudulent behavior. As necessary, this policy will be revised to comply with the requirements for clawbacks under the Dodd-Frank Wall Street Reform and Consumer Protection Act.
Restrictive Covenants. As noted above in “Overview of Executive Compensation—Long-Term Incentive Plan,” all executives, including the NEOs, were required to sign confidentiality and non-interference agreements as a requirement for participation in the Value Creation Plan. The non-interference agreements include non-compete and non-solicitation covenants and prevent executives from:
Working for a competitor or otherwise directly or indirectly engaging in competition with us for 12 months after leaving the Company;
Soliciting or hiring employees for 24 months after leaving Delphi; and
Soliciting customers for 24 months after leaving Delphi.
If the terms of the confidentiality and non-interference agreement are violated, the Company has the right to cancel or rescind any final Value Creation Plan award within the bounds of applicable law.
No Tax Gross-Ups. We do not provide any tax gross-ups as part of our executive compensation plans or elements. Certain expatriate policy provisions, applicable to all salaried employees allow for gross-ups as reimbursement for additional taxes incurred due to expatriate status. During 2010, Mr. Pirtle was an expatriate employee and was eligible for tax gross-ups in connection with an international assignment.
Summary Compensation Table
The table below sets forth specified information regarding the compensation for 2010 of the Chief Executive Officer (Rodney O’Neal), the individuals who served as the Chief Financial Officer during 2010 (Kevin P. Clark, Keith D. Stipp and John D. Sheehan) and the next three most highly compensated executive officers (James A. Bertrand, Ronald M. Pirtle and James A. Spencer). We refer to these individuals as named executive officers (“NEOs”).
2010 Summary Compensation Table
| | | | | | | | | | | | | | | | | | | | | | | | | | | | | | | | |
Name and Principal Position | | Year | | | Salary ($) | | | Bonus ($) | | | Stock
Awards ($)(6) | | | Non-Equity
Incentive Plan
Compensation
($)(7) | | | Change in
Pension Value
and
Non-qualified
Deferred
Compensation
Earnings
($)(8) | | | All Other
Compensation
($)(9) | | | Total ($) | |
Rodney O’Neal President & Chief Executive Officer | | | 2010 | | | | $1,211,100 | | | | — | | | | $14,472,150 | | | | $4,390,000 | | | | $1,000,028 | | | | $61,225 | | | | $21,134,503 | |
Kevin P. Clark (1) Chief Financial Officer | | | 2010 | | | | $378,974 | | | | $2,500,000 | | | | $7,236,075 | | | | $800,000 | | | | — | | | | $210 | | | | $10,915,259 | |
James A. Bertrand Vice President and President, Delphi Thermal Systems | | | 2010 | | | | $573,600 | (4) | | | — | | | | $2,960,213 | | | | $1,321,000 | (4) | | | $549,759 | | | | $43,945 | | | | $5,448,517 | |
Ronald M. Pirtle (2) Former Vice President and President, Delphi Powertrain Systems and President, Delphi Europe, Middle East & Africa | | | 2010 | | | | $603,000 | | | | — | | | | $2,850,575 | | | | $1,236,600 | | | | $518,027 | | | | $240,684 | | | | $5,448,886 | |
James A. Spencer Vice President and President, Delphi Packard Electrical & Electronic Architecture and President, Delphi Latin America | | | 2010 | | | | $560,100 | | | | — | | | | $3,069,850 | | | | $1,318,000 | | | | $452,537 | | | | $29,929 | | | | $5,430,416 | |
Keith D. Stipp (3) Treasurer and Former Acting Chief Financial Officer | | | 2010 | | | | $400,000 | | | | $42,000 | | | | $1,253,000 | | | | $525,000 | | | | $35,416 | | | | $25,006 | | | | $2,280,422 | |
John D. Sheehan (4) Former Chief Financial Officer | | | 2010 | | | | $137,775 | | | | — | | | | — | | | | — | | | | — | | | | $850,778 | | | | $988,553 | |
| (1) | Mr. Clark joined Delphi in July 2010 as our CFO. His engagement letter included a signing bonus of $2,500,000 to recognize compensation he was required to forgo by joining Delphi, which is reported in the “Bonus” column. He is not eligible to participate in the SERP because he has not met the minimum employment requirements, and he elected not to participate in the SRESP in 2010. |
| (2) | Mr. Pirtle ceased being an executive officer of Delphi on July 1, 2011 and will retire from Delphi on January 1, 2012. Because his retirement takes place after the end of 2010, it does not affect his 2010 compensation. |
| (3) | Mr. Stipp was appointed Acting CFO upon the departure of Mr. Sheehan. He held that position from March 1, 2010 through June 30, 2010, when Mr. Clark joined Delphi. Because of Mr. Stipp’s increased responsibilities, he received a supplemental one-time payment of $42,000, reflected in the “Bonus” column. In addition, due to his increase in responsibilities, he received an $80,000 target increase to his annual incentive target award, from $250,000 to $330,000. Mr. Stipp’s current position as Treasurer makes him eligible for a cash award rather than an equity award under the Value Creation Plan. |
| (4) | Mr. Sheehan ceased employment with Delphi on March 1, 2010. He was granted a severance payment of $1,680,000 paid semi-monthly through August 2011. The actual payments received by Mr. Sheehan through December 31, 2010 totaled $840,000. Due to his departure, Mr. Sheehan forfeited his award under the annual incentive plan and did not receive an award under the Value Creation Plan. |
| (5) | Base salary and annual incentive awards are eligible for deferral under the SRESP. Mr. Bertrand was the only NEO who deferred a portion of his compensation through this program in 2010. His total base salary and annual incentive award, including the deferred portions, are presented in this Summary Compensation Table. His contributions to the SRESP are displayed in the 2010 Non-Qualified Deferred Compensation table below. |
| (6) | Under the Value Creation Plan, Delphi made a one-time grant of awards covering a 39-month performance period from October 2009 through December 2012 (in other words, not annual long-term incentive awards). As of December 31, 2010, no portion of these awards had vested. The awards generally will “cliff” vest on the earlier of December 31, 2012 or a qualifying termination after a change in control and settle in Delphi equity, which may be subject to an ownership or holding commitment. The awards are not subject to accelerated vesting in the event of this offering or any other initial public offering. As noted in the Grants of Plan-Based Awards table below, there is no maximum award under the Value Creation Plan. These awards are discussed in “Compensation Discussion and Analysis—Long-Term Incentive Plan” above. The award values reflected in the “Stock Awards” column for Messrs. O’Neal, Clark, Bertrand, Pirtle, Spencer and Stipp are the grant date fair value of their respective Value Creation Plan awards determined in accordance with FASB ASC Topic 718. These values reflect a discount to account for the illiquidity of Delphi equity due to our status as a non-public company. The grant date for accounting purposes was set at September 15, 2010, the last date on which each NEO could sign the confidentiality and non-interference agreement as required by the Value Creation Plan. For assumptions used in determining the fair value of these awards, see “Note 22. Share-Based Compensation” to the consolidated financial statements included herein. |
| (7) | The “Non-Equity Incentive Plan Compensation” column reflects payments made under our 2010 annual incentive plan. |
| (8) | Except for Mr. Clark, all of our active NEOs were eligible to participate in the SERP during 2010. The “Change in Pension Value and Non-qualified Deferred Compensation Earnings” column reflects the year-over-year change of our estimated liability on our balance sheet. Although the SERP is a frozen program (see “Pension Benefits” below for a discussion of the frozen plan) with fixed measurement parameters, the year-over-year balances change because the NEO’s age and the interest rates used to estimate the award value change each year. The numbers reported here show the impact of the year-over-year changed assumptions. There were no above-market or preferential earnings in respect of any non-qualified deferral compensation. |
| (9) | Amounts reported in the “All Other Compensation” reflect the following: |
| | | | | | | | | | | | | | | | | | | | |
Name | | Delphi
Contributions (a) | | | Expatriate
Payments (b) | | | Separation
Payments (c) | | | Life Insurance
(d) | | | Total | |
Rodney O’Neal | | | $59,419 | | | | — | | | | — | | | | $1,806 | | | | $61,225 | |
Kevin P. Clark | | | — | | | | — | | | | — | | | | $210 | | | | $210 | |
James A. Bertrand | | | $42,979 | | | | — | | | | — | | | | $966 | | | | $43,945 | |
Ronald M. Pirtle | | | $29,607 | | | | $209,271 | | | | — | | | | $1,806 | | | | $240,684 | |
James A. Spencer | | | $28,123 | | | | — | | | | — | | | | $1,806 | | | | $29,929 | |
Keith D. Stipp | | | $24,040 | | | | — | | | | — | | | | $966 | | | | $25,006 | |
John D. Sheehan | | | $10,537 | | | | — | | | | $840,000 | | | | $242 | | | | $850,778 | |
| (a) | This column reflects Delphi’s contributions to both the qualified SRSP and the non-qualified SRESP. For all participants in the SRSP, Delphi provides a contribution of 4% of base salary and annual incentive award. Beginning in March 2010, we also provided a matching contribution equal to 50% of the participant’s contributions to the program, up to a maximum of 7% of the participant’s base salary and annual incentive award. Additional details regarding the SRESP are provided in connection with the 2010 Non-Qualified Deferred Compensation table below. |
| (b) | During 2010, Mr. Pirtle was on an expatriate assignment in Luxembourg. As such, he received expatriate benefits that are typical of payments made to any employee on an expatriate assignment. The payments reported in this column include the following: $93,931 housing expenses; $35,821 cost of living adjustment; $36,220 tax equalization payments; $20,991 additional payment to reimburse Mr. Pirtle for expatriate-related income tax incurred by him; $17,708 for relocation costs; $3,850 for company vehicle; and $750 for tax preparation services. |
| (c) | Mr. Sheehan’s severance benefit is described in the “Potential Payments upon Termination or Change in Control” section below. Only 50% of his entire severance benefit was paid out as of the end of 2010. The remainder is payable in 2011, subject to his compliance with certain restrictive covenants, including confidentiality, non-compete and non-solicitation covenants. |
| (d) | This column reflects the amount imputed to each NEO’s income for premium payments made to his life insurance policy. |
Grants of Plan-Based Awards
The table below sets forth the threshold, target and maximum award payouts for plan-based awards that were granted to the NEOs in 2010.
2010 Grants of Plan-Based Awards
| | | | | | | | | | | | | | | | | | | | | | | | | | | | | | | | | | | | |
Name | | Grant
Date (4) | | | Compensation
Committee
Approval
Date (4) | | | Estimated Future Payouts Under
Non-Equity Incentive Plan
Awards (5)(6) | | | Estimated Future Payouts Under
Equity Incentive Plan Awards (7) | | | Grant Date
Fair Value
of Stock
Awards
($)(9) | |
| | | | Threshold
($) | | | Target ($) | | | Maximum
($) | | | Threshold
($) | | | Target ($) | | | Maximum
($)(8) | | |
Rodney O’Neal | | | 1/1/2010 | | | | | | | $ | 1,097,500 | | | $ | 2,195,000 | | | $ | 4,390,000 | | | | | | | | | | | | | | | | | |
| | | 9/15/2010 | | | | 6/22/2010 | | | | | | | | | | | | | | | $ | 2,310,000 | | | $ | 11,550,000 | | | | N/A | | | $ | 14,472,150 | |
Kevin P. Clark (1) | | | 7/1/2010 | | | | | | | $ | 200,000 | | | $ | 400,000 | | | $ | 800,000 | | | | | | | | | | | | | | | | | |
| | | 9/15/2010 | | | | 7/1/2010 | | | | | | | | | | | | | | | $ | 1,155,000 | | | $ | 5,775,000 | | | | N/A | | | $ | 7,236,075 | |
James A. Bertrand | | | 1/1/2010 | | | | | | | $ | 330,250 | | | $ | 660,500 | | | $ | 1,321,000 | | | | | | | | | | | | | | | | | |
| | | 9/15/2010 | | | | 6/22/2010 | | | | | | | | | | | | | | | $ | 472,500 | | | $ | 2,362,500 | | | | N/A | | | $ | 2,960,213 | |
Ronald M. Pirtle | | | 1/1/2010 | | | | | | | $ | 343,500 | | | $ | 687,000 | | | $ | 1,374,000 | | | | | | | | | | | | | | | | | |
| | | 9/15/2010 | | | | 6/22/2010 | | | | | | | | | | | | | | | $ | 455,000 | | | $ | 2,275,000 | | | | N/A | | | $ | 2,850,575 | |
James A. Spencer | | | 1/1/2010 | | | | | | | $ | 329,500 | | | $ | 659,000 | | | $ | 1,318,000 | | | | | | | | | | | | | | | | | |
| | | 9/15/2010 | | | | 6/22/2010 | | | | | | | | | | | | | | | $ | 490,000 | | | $ | 2,450,000 | | | | N/A | | | $ | 3,069,850 | |
Keith D. Stipp (2) | | | 1/1/2010 | | | | | | | $ | 165,000 | | | $ | 330,000 | | | $ | 495,000 | | | | | | | | | | | | | | | | | |
| | | 9/15/2010 | | | | 6/22/2010 | | | | | | | | | | | | | | | $ | 200,000 | | | $ | 1,000,000 | | | | N/A | | | $ | 1,253,000 | |
John D. Sheehan (3) | | | 1/1/2010 | | | | | | | $ | 290,000 | | | $ | 580,000 | | | $ | 1,160,000 | | | | | | | | | | | | | | | | | |
| (1) | Mr. Clark was granted a target annual incentive award and a target Value Creation Plan award in accordance with the terms of his offer letter. The target annual incentive award value reflected in the table was adjusted for his July 2010 hire date. |
| (2) | For his three months as Acting CFO, Mr. Stipp’s target annual incentive award was increased by $80,000 from $250,000 to $330,000. He is eligible to receive a cash award rather than an equity award under the Value Creation Plan. |
| (3) | Mr. Sheehan ceased employment with Delphi on March 1, 2010 and, as a result, forfeited his annual incentive award. He was not eligible to receive an award under the Value Creation Plan. |
| (4) | September 15, 2010 is the Value Creation Plan grant date recognized in our financial reports. The Compensation Committee approved final Value Creation Plan awards on June 22, 2010 and set the initial performance measurement date as of October 6, 2009, upon the formation of Delphi Automotive LLP. Please see footnote (9) below. |
| (5) | 2010 annual incentive awards were paid out on January 30, 2011. Actual amounts paid were as follows: Mr. O’Neal, $4,390,000; Mr. Clark, $800,000; Mr. Bertrand, $1,321,000; Mr. Pirtle, $1,236,600; Mr. Spencer, $1,318,000; and Mr. Stipp, $525,000. Mr. Sheehan forfeited his award upon his departure. |
| (6) | The threshold, target and maximum values under our annual incentive plan are measured based on the attainment of corporate and division performance metrics. The annual incentive plan also includes an individual assessment. While most NEOs are subject only to downward adjustment of annual incentive awards for individual performance, Mr. Stipp is eligible for an increase in his award and received such an increase in his 2010 annual incentive payout from 150% to 159% of his target award. |
| (7) | These equity incentive plan awards refer to our Value Creation Plan awards. Please see footnote (9) below. |
| (8) | There is no maximum payout under the Value Creation Plan. |
| (9) | This column reflects the grant date fair value of the target awards under the Value Creation Plan determined in accordance with FASB ASC Topic 718. These values reflect a discount to account for the illiquidity of Delphi equity due to our status as a non-public company. For assumptions used in determining the fair value of these awards, see “Note 22. Share-Based Compensation” to the consolidated financial statements included herein. Under the Value Creation Plan, Delphi made one-time grant of awards covering a 39-month performance period from October 2009 through December 2012 (in other words, not annual long-term incentive awards). As of December 31, 2010, no portion of these awards had vested. The awards generally will “cliff” vest on the earlier of December 31, 2012 or a qualifying termination after a change in control and settle in Delphi equity, which may be subject to an ownership or holding commitment. The awards are not subject to accelerated vesting in the event of the completion of this offering or any other initial public offering. These awards are discussed in “Compensation Discussion and Analysis—Long-Term Incentive Plan” above. |
Outstanding Equity Awards at Fiscal Year-End
The values displayed in the table below represent the estimated award value of each NEO’s Value Creation Plan target award as of December 31, 2010. They are based on a year-end company value analysis performed by a third-party appraiser.
2010 Outstanding Equity Awards at Fiscal Year-End
| | | | |
Name | | Stock Awards | |
| | Equity Incentive Plan
Awards:
Market or Payout
Value of Unearned
Shares, Units or
Other Rights That
Have Not Vested
($)(3) | |
Rodney O’Neal | | $ | 21,332,850 | |
Kevin P. Clark | | $ | 10,666,425 | |
James A. Bertrand | | $ | 4,363,538 | |
Ronald M. Pirtle | | $ | 4,201,925 | |
James A. Spencer | | $ | 4,525,150 | |
Keith D. Stipp (1) | | | — | |
John D. Sheehan (2) | | | — | |
| (1) | Mr. Stipp is not eligible to receive an equity award under the Value Creation Plan, but instead is eligible for a cash award. |
| (2) | Mr. Sheehan ceased employment with Delphi on March 1, 2010, prior to the grant of Value Creation Plan awards. |
| (3) | Under the Value Creation Plan, Delphi made one-time grant of awards covering a 39-month performance period from October 2009 through December 2012 (in other words, not annual long-term incentive awards). As of December 31, 2010, no portion of these awards had vested. The awards generally will “cliff” vest on the earlier of December 31, 2012 or a qualifying termination after a change in control and settle in Delphi equity, which may be subject to an ownership or holding commitment. The awards are not subject to accelerated vesting in the event of a completed initial public offering. These awards are discussed in “Compensation Discussion and Analysis—Long-Term Incentive Plan” above. Value Creation Plan awards are denominated in dollars rather than in shares. The values in this table reflect a discount to account for the illiquidity of Delphi equity due to our status as a non-public company. |
Pension Benefits
Certain executives, including the NEOs, are eligible to receive benefits under the SERP. The SERP was approved by the bankruptcy court for retention purposes as part of the formation of Delphi Automotive LLP.
The SERP is a modified and reduced-benefit form of the Predecessor’s supplemental executive defined benefit plan, which was frozen on September 30, 2008. As a result of the freeze, no new benefits have accrued and no new participants have been allowed to join the plan after this date, although a reduced portion of benefits continue to be available to executives who were eligible participants prior to the freeze date. This plan is a non-qualified and unfunded defined benefit plan that supplemented the benefits of an underlying qualified defined benefit pension plan. This qualified plan was assumed by the Pension Benefit Guaranty Corporation (the “PBGC”) in July 2009.
Eligibility
To qualify for participation in the SERP, eligible executives, including the NEOs, must meet both of the following requirements:
The executive was appointed to an executive position in the Predecessor as of September 30, 2008; and
The executive was employed by us on October 6, 2009, upon the formation of Delphi Automotive LLP.
To receive benefits under the SERP:
The executive must remain continuously employed by us until the earlier of separation, death or disability; and
At the time of termination of employment, death or disability, the executive must:
Have at least 10 years of service (unless the executive is involuntarily separated other than for cause, in which case the requirement is 5 years of service); and
Be at least 55 years of age (unless the executive is involuntarily separated other than for cause or dies in which events the eligible executive or the surviving spouse will begin receiving payment of benefits when the executive attains or would have attained age 55).
In addition, any participant, including a NEO, is only eligible for the SERP upon a voluntary termination if one of the two following requirements is met:
The participant has at least 10 years of service and is 60 years old as of the voluntary termination date; or
The participant has been employed by the Company for at least two years dating from October 6, 2009.
Of the NEOs, Messrs. O’Neal, Pirtle and Spencer meet the age and service requirements and are eligible to receive SERP benefits as of November 2011.
SERP Calculation Methods and Assumptions
The formulas of the SERP provide for a benefit that is based on eligible pay multiplied by eligible years of credited service. This benefit is then reduced by several factors, including the following:
An unreduced “age 62 benefit” calculated under the Predecessor’s qualified pension plan (the “SRP”)
Participant’s departure from the Company prior to age 62
SERP benefits are reduced by the above factors regardless of whether the participant actually receives these benefits. For example, participants who would otherwise receive a pension benefit under the SRP will actually receive their benefit from the PBGC at a substantially reduced level; however, the higher SRP amount will be used to calculate a reduction of the participant’s SERP benefits.
Under the SERP, a participant receives the higher of one of two formulas.
| | | | | | | | | | | | | | | | | | | | | | | | |
| ( | | 2% of average monthly base salary | | | X | | | Total years of credited service | | | ) | | | | — | | | Frozen Predecessor qualified plan benefit | | | — | | | Pro-rated Maximum primary Social Security benefit |
| | | | | | | | | | | | | | | | | | | | | | | | |
| ( | | 1.5% of average total direct compensation | | | X | | | Total years of credited service | | | ) | | | | — | | | Frozen Predecessor qualified plan benefit | | | — | | | Maximum primary Social Security benefit |
In the regular formula, average monthly base salary is calculated based on the participant’s monthly base salary for the highest-paid 48 months between January 1, 1999 and December 31, 2006. His or her total years of credited service are counted as of December 31, 2006.
The alternative formula bases the benefit on average total direct compensation, which is the average monthly base salary, as defined in the regular formula, plus an average of the highest four years of annual incentive awards earned during the period through and inclusive of 2006.
In both formulas, service is credited as of December 31, 2006, and under the alternative formula is capped at 35 years. Under both formulas, the benefit is further reduced by an additional 10%. The benefit will be paid out in the form of a five-year annuity.
Valuation Method and Assumptions
The actuarial present value of accumulated benefits for the SERP shown in the 2010 Pension Benefit table below is based on benefits accrued as of September 30, 2008, the last day on which benefits were accumulated under the Predecessor’s qualified plan. The amounts reflect the method and assumptions used in calculating our pension liability under U.S. GAAP as of that date, except that each participant is assumed to remain actively employed until the earliest he or she is eligible for unreduced benefits. The material assumptions used in the calculation were:
Discount rate: 4.1%, which is developed by RATE:Link, a globally consistent model for markets classified as having deep AA corporate bond markets.
Applicable Mortality Table based on Internal Revenue Service Revenue Ruling 2001-62.
All of the figures shown are estimates only; actual benefit amounts will be based on the age, interest rates, mortality rates and other circumstances in effect upon the actual termination of employment or death of the participant.
The table below sets forth information regarding benefits provided to and years of service credited to eligible NEOs under the SERP.
2010 Pension Benefits
| | | | | | | | | | | | | | | | |
Name | | Plan Name | | | Number of Years
of Credited
Service (3) | | | Present Value of
Accumulated
Benefit | | | Payments During
Last Fiscal Year | |
Rodney O’Neal | | | SERP | | | | 34.5 | | | $ | 7,463,734 | | | | — | |
Kevin P. Clark (1) | | | — | | | | — | | | | — | | | | — | |
James A. Bertrand | | | SERP | | | | 27.6 | | | $ | 3,522,656 | | | | — | |
Ronald M. Pirtle | | | SERP | | | | 32.9 | | | $ | 3,866,304 | | | | — | |
James A. Spencer | | | SERP | | | | 30.3 | | | $ | 3,577,424 | | | | — | |
Keith M. Stipp | | | SERP | | | | 22.6 | | | $ | 191,823 | | | | — | |
John D. Sheehan (2) | | | — | | | | — | | | | — | | | | — | |
| (1) | Mr. Clark joined Delphi in July 2010, after the SERP was frozen and is therefore ineligible for benefits under the program. |
| (2) | Mr. Sheehan ceased employment with Delphi on March 1, 2010. As discussed in further detail in the “Potential Payments upon Termination or Change in Control” section below, prior to his departure, he had the option to choose whether to receive payments upon termination of employment in accordance with the SERP or under our severance plan. Because Mr. Sheehan elected to receive benefits under the severance plan, he forfeited his SERP benefits. |
| (3) | Number of years of credited service includes service with the Predecessor. Unless he is age 60 or older, each NEO is also subject to a two-year employment requirement, commencing in October 2009, in order to be eligible for the SERP. |
Non-Qualified Deferred Compensation
The SRESP is a non-qualified deferred compensation program available to a limited number of employees, including the NEOs. Under the SRESP, participants receive Delphi contributions in excess of the limits imposed upon the SRSP, our 401(k) plan, by the Internal Revenue Code.
Plan Benefits
Employees who were eligible for SRESP deferrals in 2010, including the NEOs, were permitted to defer additional income above $245,000, which is the maximum income deferral level imposed upon the SRSP by the Internal Revenue Code in 2010, into a SRESP deferral account. They also received the following benefits:
All SRESP-eligible employees receive a Delphi contribution of 4% of their base salary and annual incentive award. This contribution occurs even if the individual does not elect to make deferrals into the SRESP.
Eligible employees who made deferral contributions under the SRESP received an additional Delphi matching contribution of 50% on the individual’s voluntary deferrals up to 7% of the base salary and annual incentive award over the qualified plan limit, which constitutes a maximum contribution by Delphi of 3.5% of each eligible employee’s base salary. The Delphi employee matching contribution commenced in March 2010.
Investment Options
Participants in the SRESP may select investment options for their deferred amounts. The investment options consist of a cross-section of the funds that are also available to participants in the SRSP and do not offer any guaranteed or above-market returns.
Deferral Election Process
The SRESP deferral election process is conducted prior to the year in which eligible income is earned. For the 2010 plan, deferral elections were required to be made by December 2009. During this process, eligible employees were allowed to make deferral elections related to their 2010 base salary and any annual incentive award based on 2010 performance that would be scheduled to be paid in 2011 (but no later than March 15, 2011).
Distributions
Eligible employees must also elect a distribution date for their deferred amounts. A base salary deferral must remain deferred for a minimum of one year, and any annual incentive deferral must remain deferred for a minimum of two years.
Vesting
All employee deferrals and Delphi contributions are immediately vested.
The values displayed in the table below include contributions to the NEOs’ SRESP accounts by the NEOs and by Delphi in 2010, as well as the aggregate balances of these accounts at the end of 2010.
2010 Non-Qualified Deferred Compensation
| | | | | | | | | | | | | | | | | | | | |
Name | | Executive
Contributions
in Last FY ($) | | | Registrant
Contributions
in Last FY
($)(4) | | | Aggregate
Earnings in
Last FY ($) | | | Aggregate
Withdrawals/
Distributions
($) (5) | | | Aggregate
Balance at
Last FYE ($) | |
Rodney O’Neal | | | — | | | $ | 49,619 | | | $ | 4,332 | | | $ | (31,340 | ) | | $ | 53,616 | |
Kevin P. Clark (1) | | | — | | | | — | | | | — | | | | — | | | | — | |
James A. Bertrand (2) | | $ | 28,795 | | | $ | 30,840 | | | $ | 44 | | | $ | (14,538 | ) | | $ | 59,552 | |
Ronald M. Pirtle | | | — | | | $ | 17,755 | | | $ | 1,072 | | | $ | (20,161 | ) | | $ | 18,482 | |
James A. Spencer | | | — | | | $ | 15,899 | | | $ | 2,573 | | | | — | | | $ | 22,269 | |
Keith M. Stipp | | | — | | | $ | 8,835 | | | $ | 2,275 | | | | — | | | $ | 19,175 | |
John D. Sheehan (3) | | | — | | | | — | | | $ | 151 | | | $ | (11,820 | ) | | | — | |
| (1) | Mr. Clark elected not to participate in the 2010 program. He was not eligible to receive any Delphi contributions or matching contributions until February 2011. |
| (2) | Mr. Bertrand elected to defer a portion of his salary and annual incentive award as permitted under the SRESP. His total salary and annual incentive award, including these deferred amounts, are reported in the Summary Compensation Table. |
| (3) | Mr. Sheehan ceased employment with Delphi on March 1, 2010. He had elected to receive payment of his previously-deferred compensation in January 2010 and had no remaining funds in his SRESP account at the time of his departure. |
| (4) | Our contributions to the NEOs’ SRESP accounts, along with contributions to the qualified SRSP, were disclosed in the “All Other Compensation” column in the Summary Compensation Table. |
| (5) | As with Mr. Sheehan’s withdrawals, the withdrawals of Messrs. O’Neal, Bertrand and Pirtle were made in accordance with the deferral election process described above. |
Potential Payments upon Termination or Change in Control
Employment Arrangements
As part of the formation of Delphi Automotive LLP, each NEO was required to sign a new offer letter with the Company. Messrs. O’Neal, Bertrand, Pirtle, Spencer, Stipp and Sheehan each received and signed an offer letter upon beginning their employment in October 2009. These offer letters described compensation and benefits provided to the NEOs under the annual incentive plan, the Value Creation Plan and other arrangements.
Mr. Clark received an offer letter upon commencement of his employment in July 2010. In addition to describing terms and conditions of employment consistent with those included in the other NEOs’ offer letters, Mr. Clark’s offer letter also includes severance provisions, which provide for 18 months of base pay plus 1.5 times annual bonus target in the event he is terminated by the Company without cause.
We have no individual change in control agreements with any of the NEOs, as all change in control agreements were eliminated upon the formation of Delphi Automotive LLP in October 2009. The only change in control provisions are those provided in the annual incentive plan and the Value Creation Plan, as described below.
Each eligible participating executive signed a Value Creation Plan participation agreement and non-interference and confidentiality agreement, described above in “Compensation and Discussion and Analysis.” The non-interference agreement includes both non-compete and non-solicitation covenants.
Annual Incentive Plan
In the event of a change in control, each executive’s annual incentive target award will be prorated for the time period between the plan start date and the effective change in control date. A payment will also be calculated for that time period based on actual performance and compared to the prorated target, with the executive receiving the larger of the two values. Payment of the award will be made by March 15th of the calendar year following the year in which a change in control occurs.
Following the closing of this offering, a change in control under the annual incentive plan occurs if any of the following events occurs:
A change in ownership or control of Delphi resulting in any person or group other than Delphi or a Delphi employee benefit plan acquiring securities of Delphi possessing more than 50% of the total combined voting power of Delphi’s equity securities outstanding after such acquisition;
The majority of the board as of the date of the initial public offering is replaced by persons whose election was not approved by a majority of the incumbent board; or
The sale of all or substantially all of the assets of Delphi, in one or a series of related transactions, to any person or group other than Delphi.
An initial public offering is not considered a change in control under the annual incentive plan.
If involuntarily terminated without “cause,” as defined under the Value Creation Plan and described below, each executive, including the NEOs, will also be eligible for a prorated portion of his or her annual incentive award. The period used to determine the prorated award will be the beginning of the performance period to the individual’s termination date.
Management Value Creation Plan
If involuntarily terminated without “cause,” each executive, including the NEOs, will receive a prorated portion of his or her Value Creation Plan award using the NEO’s termination date as the last date of the performance measurement period, with the proration occurring on an annual basis for a termination on or before December 31, 2011 and on a monthly basis for a termination after December 31, 2011. Any pro-rated portion will be paid at the time all other executives are paid.
“Cause” is defined in the Value Creation Plan as:
Conviction or indictment for a felony, or for any other crime that has or could be reasonably expected to have an adverse impact on performance of duties to Delphi or on the business or reputation of Delphi;
Conduct in connection with employment or service that is not taken in good faith and has resulted or could reasonably be expected to result in material injury to the business or reputation of Delphi;
Willful violation of Delphi’s material policies; or
Willful neglect in the performance of duties for Delphi, or willful or repeated failure or refusal to perform these duties.
Upon a change in control, each executive is eligible to receive his or her proportionate share of the Value Creation Plan award based on the proceeds we receive through the change in control plus any accrued
distributions as defined in the Value Creation Plan. The Value Creation Plan defines a change in control after the closing of this offering to include the same events described above for the change in control definition in the annual incentive plan. An initial public offering is not considered a change in control under the Value Creation Plan, and the awards are not subject to accelerated vesting in the event of a completed initial public offering.
The officers, including the NEOs, will receive their awards due to a change in control only if they incur a qualifying termination following the change in control. Under the Value Creation Plan, a qualifying termination after a change in control includes any termination either by Delphi without “cause” (as defined above) or by an officer as a result of any of the following:
A material diminution in base salary;
A material diminution in authority, duties or responsibilities from those in effect immediately prior to the change in control;
Relocation of the NEO’s principal place of employment more than 50 miles from its location immediately prior to the change in control; or
Any other action or inaction that is a material breach by Delphi of the agreement under which the NEO provides services to us.
Severance and SERP Payments
At the time of the formation of Delphi Automotive LLP, certain executives, including the NEOs, were required to choose between receiving consideration under our severance plan, the Separation Allowance Plan, or the SERP in the event that the executive was involuntarily terminated. This irrevocable election prevents an executive from receiving both severance and the non-qualified defined benefit retirement benefits in the event of an involuntary termination.
As such, if the executive is involuntarily terminated from Delphi, he or she will receive either a severance payment under the Separation Allowance Plan or a SERP payment, but not both. Because he is ineligible for the SERP, Mr. Clark would only be eligible to receive a severance payment under the Separation Allowance Plan should he be involuntarily terminated. The table below reflects the choices made by each NEO:
| | |
Name | | Selection |
Rodney O’Neal | | SERP |
Kevin P. Clark | | Separation Allowance Plan |
James A. Bertrand | | SERP |
Ronald M. Pirtle | | SERP |
James A. Spencer | | SERP |
Keith D. Stipp | | Separation Allowance Plan |
John D. Sheehan | | Separation Allowance Plan |
The table below describes the payments and benefits to which each NEO would have been entitled had his employment terminated on December 31, 2010 under various scenarios, including an involuntary termination of employment after a change in control of Delphi.
Potential Payments upon Termination or Change in Control
| | | | | | | | | | | | | | |
Name | | Termination Scenario | | Annual Incentive
Plan (1) | | | Value Creation
Plan (2) | | | Separation
Allowance Plan
(3) | |
Rodney O’Neal | | Voluntary termination | | $ | 4,390,000 | | | | — | | | | — | |
| | Termination for cause | | | — | | | | — | | | | — | |
| | Involuntary termination without cause (4) | | $ | 4,390,000 | | | | $ 5,333,213 | | | | — | |
| | After a change of control, involuntary termination without cause or voluntary termination for good reason | | $ | 4,390,000 | | | | $21,332,850 | | | | — | |
| | Voluntary termination after age 55 with at least 10 years of service (6) | | $ | 4,390,000 | | | | $ 5,333,213 | | | | — | |
| | Death (7) | | $ | 4,390,000 | | | | $ 5,333,213 | | | | — | |
| | Disability (8) | | $ | 4,390,000 | | | | $ 5,333,213 | | | | — | |
| | | | |
Kevin P. Clark | | Voluntary termination | | $ | 800,000 | | | | — | | | | — | |
| | Termination for cause | | | — | | | | — | | | | — | |
| | Involuntary termination without cause (4) | | $ | 800,000 | | | | $ 2,666,606 | | | $ | 2,400,000 | |
| | After a change of control, involuntary termination without cause or voluntary termination for good reason | | $ | 800,000 | | | | $10,666,425 | | | | — | |
| | Voluntary termination after age 55 with at least 10 years of service (6) | | $ | 800,000 | | | | — | | | | — | |
| | Death (7) | | $ | 800,000 | | | | $ 2,666,606 | | | | — | |
| | Disability (8) | | $ | 800,000 | | | | $ 2,666,606 | | | | — | |
| | | | |
James A. Bertrand | | Voluntary termination | | $ | 1,321,000 | | | | — | | | | — | |
| | Termination for cause | | | — | | | | — | | | | — | |
| | Involuntary termination without cause (4)(5) | | $ | 1,321,000 | | | | $ 1,090,884 | | | | — | |
| | After a change of control, involuntary termination without cause or voluntary termination for good reason | | $ | 1,321,000 | | | | $ 4,363,538 | | | | — | |
| | Voluntary termination after age 55 with at least 10 years of service (6) | | $ | 1,321,000 | | | | — | | | | — | |
| | Death (7) | | $ | 1,321,000 | | | | $ 1,090,884 | | | | — | |
| | Disability (8) | | $ | 1,321,000 | | | | $ 1,090,884 | | | | — | |
| | | | |
Ronald M. Pirtle | | Voluntary termination | | $ | 1,236,600 | | | | — | | | | — | |
| | Termination for cause | | | — | | | | — | | | | — | |
| | Involuntary termination without cause (4) | | $ | 1,236,600 | | | | $ 1,050,481 | | | | — | |
| | After a change of control, involuntary termination without cause or voluntary termination for good reason | | $ | 1,236,600 | | | | $ 4,201,925 | | | | — | |
| | Voluntary termination after age 55 with at least 10 years of service (6)(9) | | $ | 1,236,600 | | | | $ 1,050,481 | | | | — | |
| | Death (7) | | $ | 1,236,600 | | | | $ 1,050,481 | | | | — | |
| | Disability (8) | | $ | 1,236,600 | | | | $ 1,050,481 | | | | — | |
| | | | | | | | | | | | | | |
Name | | Termination Scenario | | Annual Incentive
Plan (1) | | | Value Creation
Plan (2) | | | Separation
Allowance Plan
(3) | |
James A. Spencer | | Voluntary termination | | $ | 1,318,000 | | | | — | | | | — | |
| | Termination for cause | | | — | | | | — | | | | — | |
| | Involuntary termination without cause (4) | | $ | 1,318,000 | | | $ | 1,131,288 | | | | — | |
| | After a change of control, involuntary termination without cause or voluntary termination for good reason | | $ | 1,318,000 | | | $ | 4,525,150 | | | | — | |
| | Voluntary termination after age 55 with at least 10 years of service (6) | | $ | 1,318,000 | | | $ | 1,131,288 | | | | — | |
| | Death (7) | | $ | 1,318,000 | | | $ | 1,131,288 | | | | — | |
| | Disability (8) | | $ | 1,318,000 | | | $ | 1,131,288 | | | | | |
| | | | |
Keith D. Stipp | | Voluntary termination | | $ | 525,000 | | | | — | | | | — | |
| | Termination for cause | | | — | | | | — | | | | — | |
| | Involuntary termination without cause (4) | | $ | 525,000 | | | $ | 461,750 | | | $ | 650,000 | |
| | After a change of control, involuntary termination without cause or voluntary termination for good reason | | $ | 525,000 | | | $ | 1,847,000 | | | | — | |
| | Voluntary termination after age 55 with at least 10 years of service (6) | | $ | 525,000 | | | | — | | | | — | |
| | Death (7) | | $ | 525,000 | | | $ | 461,750 | | | | — | |
| | Disability (8) | | $ | 525,000 | | | $ | 461,750 | | | | — | |
| | | | |
John D. Sheehan (10) | | Involuntary termination without cause | | | — | | | | — | | | $ | 1,680,000 | |
| (1) | In all scenarios except a voluntary termination, the NEO is entitled to a prorated award. If the NEO voluntarily terminates employment, he must have worked on the last business day of the year in order to receive his annual incentive award; if not, it is forfeited in its entirety. For each NEO, annual incentive award payments are subject to individual performance assessment and will be paid after the completion of the performance period. |
| (2) | Each NEO would be eligible to receive 25% of his Value Creation Plan award upon an involuntary separation, death or disability. Messrs. O’Neal, Pirtle and Spencer are over age 55 and have 10 years or more of service with the Company, and are therefore eligible to receive 25% of their Value Creation Plan awards upon voluntary departure. The values shown above are derived from the Outstanding Equity Awards at Fiscal Year-End Table. |
| (3) | Only Mr. Clark and Mr. Stipp have elected to receive payments under the Separation Allowance Plan. Mr. Clark’s Separation Allowance Plan payment is equal to 18 months of base salary, plus 1.5 times the value of his annual incentive plan target award. Mr. Stipp’s Separation Allowance Plan payment is equal to 12 months salary plus the value of his annual incentive plan target award. |
| (4) | For involuntary termination without cause, receipt of benefits under the SERP or Separation Allowance Plan is dependent on the selection made by the NEO in his offer letter. For NEOs who elected to receive benefits through the SERP, the payment values are the same as those included in the Pension Benefits Table. Mr. Clark is ineligible for the SERP (and, therefore, by default elected the Separation Allowance Plan), and Mr. Stipp elected to receive benefits through the Separation Allowance Plan rather than the SERP. |
| (5) | If involuntarily terminated without cause, Mr. Bertrand would be eligible for his SERP benefits but would not begin receiving payments until he reaches age 55. |
| (6) | Messrs. O’Neal, Pirtle and Spencer are the only NEOs who would be eligible for benefits upon voluntary departure after attaining age 55 and with 10 years or more of service with the Company, although none of them were eligible for SERP benefits upon a voluntary departure on December 31, 2010 (as discussed in “Pension Benefits” above). |
| (7) | In the event of death, an eligible NEO’s spouse is entitled to immediate payment through the SERP. Amounts are derived from the amounts shown in the Pension Benefits Table. In addition, any outstanding balance under the SRESP will be paid within 60 days of the NEO’s death to his beneficiary or estate. |
| (8) | In the event of termination from Delphi due to disability, Messrs. O’Neal, Pirtle and Spencer would receive the same benefit as a voluntary departure after attaining age 55 and with at least 10 years of service. Both Mr. Bertrand and Mr. Stipp would be eligible to receive benefits through the SERP. However, each would need to wait until he reaches age 55 to begin receiving payments. |
| (9) | Mr. Pirtle ceased being an executive officer of Delphi on July 1, 2011 and will retire from Delphi on January 1, 2012. Upon his retirement, 50% of his award under the Value Creation Plan will vest because he will depart after age 55 with more than 10 years of service, but the vested portion of the award will not be paid out until after December 31, 2012. |
| (10) | Mr. Sheehan ceased employment with Delphi on March 1, 2010. As a result, he forfeited his entire annual incentive award. Because Mr. Sheehan departed before the grant date of Value Creation Plan awards, he did not receive a Value Creation Plan award. He received payments through the Separation Allowance Plan per his election and was therefore |
| | ineligible for SERP payments. Mr. Sheehan received 50% of his payments in 2010 and will receive the remainder in 2011 subject to his compliance with certain restrictive covenants, including confidentiality, non-compete and non-solicitation covenants. |
In addition to the specific payments and benefits described above, the NEOs also would have been entitled to receive any benefits due under the terms of the SERP, described in further detail under “Pension Benefits,” as well as under the SRESP, described in further detail in connection with the 2010 Non-Qualified Deferred Compensation table above. As required by Section 409A of the Internal Revenue Code, all NEOs who have elected to participate in the SRESP must wait six months to receive a payment under the plan by reason of termination of employment. Payments for departure on December 31, 2010 would be made within 60 days after July 1, 2011. Mr. Clark did not participate in the SRESP in 2010 and was not eligible to receive any Delphi contributions. All amounts are estimates only, and actual amounts will vary depending upon the facts and circumstances applicable at the time of the triggering event.
Director Compensation
The formation of Delphi Automotive LLP took place in the middle of an unprecedented global financial crisis and plummeting consumer demand that threatened the global automotive market. The uncertainty regarding the future of some of our largest global customers, many of whom were weathering significant financial challenges themselves, including bankruptcy, raised serious questions as to whether key players in the automotive industry, including component suppliers, would survive. In the face of this environment, the owners were tasked with assembling a Board of Managers suitable for and capable of overseeing and guiding the management team of the new enterprise.
Rather than filling the board with representatives from the various owner constituencies, as many privately-held companies do, the owners decided to create a board comprised of proven senior executives who had experience managing world-class companies across a variety of industries. With the exception of the CEO, our Board of Managers is composed entirely of non-employee directors, each of whom was recruited by the owner representatives to join our Board of Managers after the formation of Delphi Automotive LLP. Meaningful equity interests were determined to be necessary to attract high caliber board members, with objectives aligned with owners’ interests. This was deemed particularly important in light of the highly dynamic and risky industry environment that existed at the time of the formation of Delphi Automotive LLP. Once we become a public company, board compensation will be established in line with competitive compensation practices. We anticipate that each current member of our Board of Managers will become a member of our post-offering Board of Directors.
Currently, our Board of Managers’ compensation is comprised of the following elements:
Special IPO incentive opportunity; and
One-time, three-year equity award.
Mr. O’Neal is compensated as an officer of the Company and does not receive additional compensation for his service as a board member.
Each member of our Board of Managers is a member of at least one committee and some members participate in two committees, as discussed in “Management—Board Committees.” The Board of Managers as a whole and each committee meet on a frequent basis. In 2010, the Board of Managers held 18 in-person or telephonic meetings. Each of the Audit Committee, Compensation Committee and Nominating and Governance Committee met between five and nine times during 2010. Additionally, members have participated in numerous special issue-specific meetings, as required. Attendance at all board and committee meetings exceeded 95%.
Annual Retainer
We pay annual retainers to members of our Board of Managers on a quarterly basis, at the end of each quarter. The Chairman of the Board of Managers receives an annual retainer of $200,000. Chairmen of the Audit and Compensation Committees receive annual retainers of $150,000. The Innovation and Technology Committee was formed in 2011 and its chairman will receive an annual retainer of $125,000 beginning April 2011. All other members of the Board of Managers receive annual retainers of $100,000. There are no additional fees for attending in-person or telephonic board or committee meetings. Compensation for members who have joined the Board of Managers or assume additional responsibilities during the year are prorated beginning with the effective date of the new responsibilities.
Special IPO Incentive Opportunity
To incentivize engagement and performance which results in a successful initial public offering, all current members of our Board of Managers are eligible to receive a $275,000 award payable following completion of an initial public offering. The cash incentive is to be paid if our implied company value, at the time of the initial public offering, is greater than $6 billion. If the implied company value of the offering does not exceed $6 billion, members will not receive the award. The implied company value represents the sum of all distributions to holders of all membership interests, the approximately $4.4 billion paid to repurchase Class A and Class C membership interests and any amounts distributed to holders of Class E-1 membership interests with respect to or to repurchase their Class E-1 membership interests, plus the fair market value of our ordinary shares issued in connection with the offering. The amount will be paid within 60 days of the closing of the initial public offering. Assuming that the offering is priced at the midpoint of the range set forth on the cover of this prospectus, we expect the implied company value to exceed $6 billion, resulting in the payout of these awards. Any member of the Board of Managers whose services are terminated prior to the offering will forfeit his or her award, unless terminated without cause within 90 days prior to the offering and a majority of independent members of the Board of Managers determine that the award should be paid.
Equity Award
Members of the Board of Managers were granted ownership interests under the Board of Managers 2010 Class E-1 Interest Incentive Plan to align their interests with those of our investors, thereby reinforcing value creation. As described above, another key purpose of the plan was to attract and retain experienced and highly qualified members of the Board of Managers.
Under the plan, Delphi made a one-time grant in June 2010 of membership interests that vest over a three-year period beginning in November 2009. Like the Value Creation Plan (i.e., the management long-term incentive program), the directors’ plan is a multi-year plan and not an annual long-term incentive program. The vesting schedule for directors’ ownership interests is as follows:
All unvested membership interests will fully vest in the event of a completed initial public offering if the resulting total equity valuation of the Company (based on the average closing price of Delphi shares during the 15-day period beginning on the 30th day after the closing of the offering), plus the value of prior distributions made under the LLP Agreement to holders of membership interests (as well as $4,385,400,000 paid to repurchase Class A and Class C membership interests and any amounts distributed to holders of Class E-1 membership interests with respect to or to repurchase their Class E-1 membership interests), is at least $6 billion. Assuming that the offering is priced at the midpoint of the range set forth on the cover of this prospectus, we expect this
value to exceed $6 billion. In addition, upon completion of our initial public offering, all outstanding membership interests will be converted to ordinary shares. Assuming that the offering is priced at the midpoint of the range set forth on the cover of this prospectus, each unit of membership interest will convert into ordinary shares of Delphi Automotive PLC.
Membership interests acquired under the plan generally may not be transferred prior to an initial public offering or a sale of the Company, and ordinary shares acquired through the offering may also be subject to transfer restrictions for up to 180 days after the offering (or a longer period if a similar lock-up is imposed on other holders of Delphi securities).
Each member of our Board of Managers received the same equity award in 2010, with the exception of the Chairman of the Board of Managers, who received a larger award due to his additional responsibilities. The 2010 individual cash retainer fees and equity awards are noted in the table below.
2010 Director Compensation
| | | | | | | | | | | | |
Name | | Fees Earned
or Paid in
Cash ($) | | | Stock Awards
($) (3)(4) | | | Total ($) | |
Gary L. Cowger | | $ | 100,000 | | | $ | 1,582,860 | | | $ | 1,682,860 | |
Nicholas M. Donofrio(1) | | $ | 100,000 | | | $ | 1,582,860 | | | $ | 1,682,860 | |
Mark P. Frissora | | $ | 100,000 | | | $ | 1,582,860 | | | $ | 1,682,860 | |
Rajiv L. Gupta | | $ | 150,000 | | | $ | 1,582,860 | | | $ | 1,732,860 | |
John A. Krol | | $ | 200,000 | | | $ | 3,165,720 | | | $ | 3,365,720 | |
J. Randall MacDonald | | $ | 100,000 | | | $ | 1,582,860 | | | $ | 1,682,860 | |
Sean O. Mahoney | | $ | 100,000 | | | $ | 1,582,860 | | | $ | 1,682,860 | |
Michael McNamara | | $ | 100,000 | | | $ | 1,582,860 | | | $ | 1,682,860 | |
Thomas W. Sidlik | | $ | 100,000 | | | $ | 1,582,860 | | | $ | 1,682,860 | |
Bernd Wiedemann (2) | | | $75,000 | | | $ | 1,582,860 | | | $ | 1,657,860 | |
Lawrence A. Zimmerman | | $ | 150,000 | | | $ | 1,582,860 | | | $ | 1,732,860 | |
| (1) | Mr. Donofrio became chairman of the Innovation and Technology Committee effective April 1, 2011. His annual retainer will increase to $125,000, with a prorated amount paid in the remainder of 2011. |
| (2) | Dr. Wiedemann joined the Delphi Board of Managers effective April 1, 2010. His cash retainer has been prorated accordingly. |
| (3) | Reflects the grant date fair value of the equity awards granted under the Board of Managers 2010 Class E-1 Interest Incentive Plan, which are one-time grants that vest over the three-year period from November 2009 to November 2012 (in other words, not an annual long-term incentive program). As of December 31, 2010, 20% of each respective award had vested. These awards are described in detail above. These values as set forth in the table were determined in accordance with FASB ASC Topic 718. The grant date for accounting purposes is June 30, 2010. For assumptions used in determining the fair value of the awards, see “Note 22. Share-Based Compensation” to the consolidated financial statements included herein. The year-end membership interest balances are: |
| | | | | | | | | | | | |
Name | | Vested
Interests:
12/31/2010 | | | Unvested
Interests:
12/31/2010 | | | Total
Interests:
12/31/2010 | |
Gary L. Cowger | | | 400 | | | | 1,600 | | | | 2,000 | |
Nicholas M. Donofrio | | | 400 | | | | 1,600 | | | | 2,000 | |
Mark P. Frissora | | | 400 | | | | 1,600 | | | | 2,000 | |
Rajiv L. Gupta | | | 400 | | | | 1,600 | | | | 2,000 | |
John A. Krol | | | 800 | | | | 3,200 | | | | 4,000 | |
J. Randall MacDonald | | | 400 | | | | 1,600 | | | | 2,000 | |
Sean O. Mahoney | | | 400 | | | | 1,600 | | | | 2,000 | |
Michael McNamara | | | 400 | | | | 1,600 | | | | 2,000 | |
Thomas W. Sidlik | | | 400 | | | | 1,600 | | | | 2,000 | |
Bernd Wiedemann | | | 400 | | | | 1,600 | | | | 2,000 | |
Lawrence A. Zimmerman | | | 400 | | | | 1,600 | | | | 2,000 | |
| (4) | In 2010 we provided loans to Messrs. Cowger, Frissora, Gupta, Krol, MacDonald, Mahoney and Sidlik to assist with their payment of taxes associated with an election under Section 83(b) of the Code which they made with respect to their equity awards. We also provided a loan to Mr. McNamara in 2011. These loans have been repaid in cash. As a result, no member of the Board of Managers currently has any loans outstanding with the Company at the time of this filing. |
Future Board Compensation
As a public company, board compensation will be established in line with competitive compensation practices.
RELATIONSHIPS AND RELATED PARTY TRANSACTIONS
Acquisition Financing
In connection with the acquisition of certain assets of the Predecessor by Delphi Automotive LLP and GM on the Acquisition Date, (i) we issued the Old Notes pursuant to a Note Purchase Agreement (the “NPA”)the NPA with an Acquisition Date fair value of $49 million and (ii) entered into the DDTL with a syndicate of lenders. A majority of the holders of the Old Notes and the lenders under the DDTL were related parties as holders of the Class A and Class B membership interests. In connection with the redemptions of our Class A and Class C membership interests as described below under “—Redemption Agreements,” we terminated the DDTL and repaid and extinguished the Old Notes at an aggregate purchase price of approximately $57 million.
The Old Notes paid 12% interest and had a maturity date of October 6, 2014. The Old Notes were recorded at $47 million in our consolidated balance sheet as of March 31, 2011, immediately before giving effect to the extinguishment of the Old Notes. The DDTL had included maximum available borrowing of $890 million, which was split into a U.S. tranche of up to $267 million in borrowings and a foreign tranche of up to $623 million in borrowings. There was no commitment fee associated with the DDTL, but, if drawn, we would have been required to pay interest at the rate of LIBOR plus 6.0% per annum, with a minimum LIBOR amount of 2.0% per annum. The DDTL had a term of 5 years.
The U.S. tranche under the DDTL was guaranteed by each of our U.S. subsidiaries as well as certain foreign subsidiaries. The foreign tranche under the DDTL was guaranteed by each of the guarantors under the U.S. tranche. In addition, subject to legal and other customary limitations, the DDTL required certain of our material foreign subsidiaries to become guarantors under the foreign tranche. The loans, guarantees and other obligations under the U.S. tranche were secured by substantially all of the assets of our U.S. subsidiaries. The loans, guarantees and other obligations under the foreign tranche were secured by all of the assets securing the U.S. tranche. Subject to legal and other customary limitations, the foreign tranche was also secured by substantially all of the assets of any of our material foreign subsidiaries that became guarantors under the foreign tranche. The Old Notes were unsecured and were guaranteed by the same Delphi entities that guaranteed the loans under the U.S. tranche of the DDTL.
The NPA and the DDTL contained affirmative and negative covenants that imposed restrictions on our financial and business operations, including our ability, among other things, to incur or secure other debt, make investments, sell assets, make distributions or repurchase stock or stock equivalents.
Agreements with GM
Commercial, Supply and Access Agreements
GM was, until March 31, 2011, a holder of Class A membership interests in Delphi Automotive LLP. We redeemed 100% of GM’s membership interests on March 31, 2011 for an aggregate purchase price of $3.8 billion as described below under “—Redemption Agreements.”
In connection with the MDA, we entered into three agreements with GM: the Access Agreement dated July 26, 2009 (the “Access Agreement”), the Commercial Agreement dated July 26, 2009 (the “Commercial Agreement”), and the Supply Agreement dated July 26, 2009 (the “Supply Agreement”). We terminated the Access Agreement in connection with our redemption of the Class A membership interests on March 31, 2011, other than with respect to GM’s license to use certain intellectual property under limited circumstances. The license will terminate on March 31, 2015, unless there is an event of default in respect of an access facility, in which case, the license will be perpetual. The Commercial Agreement and the Supply Agreement remain in place.
The Commercial Agreement governs the sale of products between GM and us out of and to the four Old Delphi sites that were sold to General Motors Components Holdings, LLC, a wholly owned subsidiary of GM, under the MDA (the “GMCH Sites”). Each party agreed to continue to sell such products to the other party, at the prices that were in effect as of January 1, 2009, with certain limited exceptions. The Commercial Agreement also grants to GM perpetual licenses with respect to certain intellectual property used to manufacture products at the GMCH Sites and certain other products that were in production on the date of the Commercial Agreement. The Commercial Agreement expires on October 6, 2012.
The Supply Agreement governs the terms of sale by us to GM of parts produced in North America that were under contract on October 6, 2009. It provides for reductions in pricing with respect to certain parts that are produced at our North American facilities, which occur on October 6, 2011 and October 6, 2012. We have also agreed to cooperate with GM in connection with GM’s resourcing of business governed by the Supply Agreement, including by providing tooling information and access to our facilities for the purpose of viewing production processes. Our supply obligations with respect to parts that are produced at our North American facilities continue until the end of the applicable vehicle program. In addition, under the Supply Agreement, we agreed that tooling (including engineering specifications and test reports) that was used only in connection with the manufacture of GM-component parts (or where any other use is immaterial) or that was otherwise paid for by GM or owned by GM was owned by GM. The tooling provisions provide for the immediate release of GM-owned tooling upon GM’s request, create a presumption in favor of GM in the event of any dispute over whether tooling is GM-owned tooling (subject to any other customer ownership rights), and prohibits the use of any tooling which was ever subject to a GM purchase order for the production of parts for sale in the aftermarket unless GM approves in writing.
Our sales to GM are governed by a number of agreements and purchasing arrangements, of which the Commercial Agreement and the Supply Agreement form only a part. Our total sales to GM, including its affiliates, for the threesix months ended March 31,June 30, 2011 were $803$1,650 million. Our total sales to GM, including its affiliates, for the year ended December 31, 2010, the period from October 6, 2009 through December 31, 2009, the period from January 1, 2009 through October 6, 2009 and the year ended December 31, 2008 were $2,838 million, $668 million, $2,197 million and $5,053 million, respectively.
Warranty Settlement Agreement
In addition, in connection with the Acquisition, we assumed the Warranty Settlement Agreement related to the warranty matters described in “Business—Legal Proceedings.” Under the Warranty Settlement Agreement, we are obligated to pay GM for repair claims related to these warranty matters.
Our total payments to GM in connection with the Warranty Settlement Agreement for the threesix months ended March 31,June 30, 2011, the year ended December 31, 2010, the period from August 19, 2009 through December 31, 2009, the period from January 1, 2009 through October 6, 2009 and the year ended December 31, 2008 were $1$2 million, $7 million, $2 million, $9 million and $14 million, respectively.
Redemption Agreements
On March 31, 2011, we entered into a redemption agreement with GM for the redemption of 1,750,000 of our Class A membership interests, representing all of our outstanding Class A membership interests, for a redemption price of approximately $3.8 billion, and a redemption agreement with the PBGC for the redemption of 100,000 of our Class C membership interests, representing all of our outstanding Class C membership interests, for a redemption price of $594 million. Upon the closings of the redemptions, GM and the PBGC ceased to be members of Delphi Automotive LLP.
Concurrently with the entry into the redemption agreements, we entered into a rights modification agreement dated March 31, 2011 with certain holders of our Class B membership interests to consent to the GM
and PBGC redemptions, the termination of the DDTL and the elimination of certain governance rights under our limited liability partnership agreement.
Registration Rights Agreement
Effective upon consummation of this offering, we will enter into a registration rights agreement (the “Registration Rights Agreement”) with our existing shareholders that will receive our ordinary shares in exchange for interests in Delphi Automotive LLP. The ordinary shares that will be issued to such holders will be issued in a private placement and will be subject to restrictions on resale under the Securities Act. The agreement will provide for the rights set forth below.
Demand Registration Rights. Upon the expiration of the applicable lock-up restrictions, each shareholder beneficially owning at least 10% of the total outstanding amount of our ordinary shares immediately after the consummation of this offering (an “affiliate shareholder”) will be entitled to request that we effect up to an aggregate of four demand registrations under the Registration Rights Agreement, and no more than one demand registration within any six-month period, covering the affiliate shareholders’ ordinary shares that are not subject to lock-up or transfer restrictions under Rule 144 (“registrable securities”). As described in “Shares Eligible for Future Sale—Lock-Up Agreements,” 30% of each shareholders’ ordinary shares (other than our directors and officers) will be released from lock-up restrictions on the 90th day after the date of this prospectus (the “early release date”), with the remaining ordinary shares held by each such shareholder being released on the 180th day after the date of this prospectus (the “lock-up expiration date”). The demand registration rights are subject to certain customary conditions and limitations, including customary underwriter cutback rights and deferral rights. No demand registration rights exist while a shelf registration is in effect.
Shelf Registration Rights. We are required to use best efforts to file a shelf registration statement covering 30% of each shareholder’s registrable securities and cause such registration statement to become effective no later than the early release date. We must use best efforts to effect the registration of the remaining 70% of each shareholder’s registrable securities on a shelf registration statement on the lock-up expiration date. We must keep these shelf registrations effective, subject to customary blackout rights, for so long as the shares held by such shareholders are not freely tradeable under Rule 144 of the Securities Act. Shareholders beneficially owning at least 5% of the total outstanding amount of our ordinary shares immediately after the consummation of this offering will have the right to cause us to undertake up to six underwritten offerings from the shelf registration, but no more than one underwritten offering in a six-month period. Each underwritten takedown constitutes a demand registration for purposes of the maximum number of demand registrations we are obligated to effectuate.
Piggyback Registration Rights. If we propose to register any ordinary shares (other than in a shelf registration or on a registration statement on Form S-4 or S-8) at any time 180 days after the date of this prospectus, our shareholders are entitled to notice of such registration and to include their registrable securities in that registration. The registration of shareholders’ registrable securities pursuant to a piggyback registration does not relieve us of the obligation to effect a demand registration as required under the Registration Rights Agreement. The managing underwriter has the right to limit the number of registrable securities included in a piggyback registration if the managing underwriter believes it would interfere with the successful marketing of the ordinary shares.
Subject to limited exceptions, the Registration Rights Agreement provides that we must pay all registration expenses in connection with a demand, piggyback or shelf registration. The Registration Rights Agreement contains customary indemnification and contribution provisions.
Other Related Party Transactions
On December 13, 2010, we entered into a Master Sale and Purchase Agreement whereby (1) our wholly-owned subsidiary, Delphi International S.a.r.l., sold its 49.5% interest in Daesung Electric Co., Ltd. to LS Mtron Ltd. for KRW 39,600,000,000 (U.S. $35 million), (2) Daesung Electric Co., Ltd. sold its entire 40% interest in
Delphi Electrical Centers (Shanghai) Company, Limited to Delphi Automotive Systems Singapore Pte. Ltd. for KRW 5,119,000,000 (U.S. $5 million) and (3) Daesung Electric Co., Ltd. sold certain assets and properties related to production of connectors to Delphi Korea LLC for up to KRW 4,400,000,000 (U.S. $4 million). Upon the closing of these transactions, Delphi Electrical Centers (Shanghai) Company became a wholly-owned subsidiary of Delphi Automotive Systems Singapore Pte. Ltd., which is a wholly-owned subsidiary of Delphi International S.a.r.l., and we had no remaining interest in Daesung Electric Co., Ltd. We closed the sale of Daesung Electric Co., Ltd. and the purchase of the 40% interest in Delphi Electrical Centers (Shanghai) Company on January 31, 2011. We expect to close the asset purchase portion of the transaction in June 2011 upon the completionsecond half of certain closing conditions.2011.
Under the terms of the agreement, LS Mtron Ltd. and Daesung Electric Co., Ltd. agreed to certain non-compete provisions. Additionally, Delphi Korea LLC is required to provide replacement connector products to Daesung Electric Co., Ltd. on an at-cost basis in connection with product warranty claims, subject to certain limitations and rights of reimbursements.
In October 2009, we entered into an engagement letter with Au Sable Associates, LLC (“Au Sable”). Thomas W. Sidlik, one of our directors, is the sole member of Au Sable. Prior to October 2009, Au Sable advised certain creditors of the Predecessor that became investors in Delphi. Following the Acquisition, we paid Au Sable an amount in excess of $120,000 in November 2009 for Mr. Sidlik’s service as head of the Delphi transition team. Neither Au Sable nor Mr. Sidlik have received any additional compensation from us for such services since then.
In addition, certain of our directors had loans from the Company outstanding prior to this offering, each of which was repaid in full. See “Executive Compensation.”
Statement Regarding Transactions with Affiliates
Upon the completion ofIn connection with this offering, we will adopt a policy regarding the approval of any transaction or series of transactions in which we or any of our subsidiaries is a participant, the amount involved exceeds $120,000, and a “related person” (as defined under SEC rules) has a direct or indirect material interest. Under the policy, a related person must promptly disclose to our general counsel any “related person transaction” (defined as any transaction involving us and in which any related person has a direct or indirect material interest) and all material facts about the transaction. The general counsel will then assess and promptly communicate that information to the Nominating and Governance Committee of our Board of Directors. Based on its consideration of all of the relevant facts and circumstances, this board committee will decide whether or not to approve such transaction and will generally not approve or ratify a transaction unless it shall have determined that, upon consideration of all relevant information, the transaction is in, or not inconsistent with, the best interests of the Company and its shareholders. If we become aware of an existing related person transaction that has not been pre-approved under this policy, the transaction will be referred to the Nominating and Governance Committee, which will evaluate all options available, including ratification, revision or termination of such transaction. On at least an annual basis, the Nominating and Governance Committee shall review previously approved related person transactions, under the standard described above, to determine whether such transactions should continue.
PRINCIPAL AND SELLING SHAREHOLDERS
The following table sets forth information regarding beneficial ownership of our ordinary shares as of , 2011 (after giving effect to our conversionthe exchange of Delphi Automotive LLP membership interests for ordinary shares immediately prior to a corporation)the completion of this offering) by:
each person whom we know to own beneficially more than 5% of our ordinary shares;
each of the directors and named executive officers individually; and
all directors and named executive officers as a group.
In accordance with the rules of the SEC, beneficial ownership includes voting or investment power with respect to securities and includes the shares issuable within 60 days of ., 2011. The number of ordinary shares outstanding after this offering includes ordinary shares being offered for sale by us in this offering. The percentage of beneficial ownership for the following table is based on ordinary shares that will be issued immediately prior to this offering in exchange for membership unitsinterests of Delphi Automotive LLP outstanding as of the date of such exchange, and ordinary shares outstanding after the completion of this offering, assuming no exercise of the underwriters’ option to purchase additional shares. Unless otherwise indicated, the address for each listed shareholder is: c/o Delphi Automotive LLP, 5725 Delphi Drive, Troy, MI 48098. To our knowledge, except as indicated in the footnotes to this table and pursuant to applicable community property laws, the persons named in the table have sole voting and investment power with respect to all ordinary shares.
| | | | | | | | | | |
| | | Shares Beneficially Owned Before
the Offering | | | | Shares Beneficially Owned After
the Offering (2) |
Name and Address of Beneficial Owner | | Number | | Percent | | Number of
Shares Being
Offered | | Number | | Percent |
Executive Officers and Directors: | | | | | | | | | | |
Rodney O’Neal | | (1) | | — | | — | | | | |
Kevin P. Clark | | (1) | | — | | — | | | | |
James A. Bertrand | | (1) | | — | | — | | | | |
James A. Spencer | | (1) | | — | | — | | | | |
John D. Sheehan | | — | | — | | — | | | | |
Ronald M. Pirtle(3) | | — | | — | | — | | | | |
Keith D. Stipp | | (1) | | — | | — | | | | |
John A. Krol | | | | | | | | | | |
Gary L. Cowger | | | | | | | | | | |
Nicholas M. Donofrio | | | | | | | | | | |
Mark P. Frissora | | | | | | | | | | |
Rajiv L. Gupta | | | | | | | | | | |
J. Randall MacDonald | | | | | | | | | | |
Sean O. Mahoney | | | | | | | | | | |
Michael McNamara | | | | | | | | | | |
Thomas W. Sidlik | | | | | | | | | | |
Bernd Wiedemann | | | | | | | | | | |
Lawrence A. Zimmerman | | | | | | | | | | |
| | | | | | | | | | |
Officers and directors as a group (18 persons) | | | | | | | | | | |
| | | | | | | | | | |
5% Shareholders: | | | | | | | | | | |
Paulson & Co. Inc. (4) | | | | | | | | | | |
Elliott Associates, L.P. (5)(6) | | | | | | | | | | |
Elliott International, L.P. (5)(6) | | | | | | | | | | |
Silver Point Capital LP – FSG (7) | | | | | | | | | | |
Oaktree Capital (8) | | | | | | | | | | |
| | | | | |
Other Selling Shareholders: | | | | | | | | | | |
| | | | | | | | | | |
| | | | | | | | | | |
| | | | | | | | | | |
| | | | | | | | | | |
| (1) | Members of our management participate in a Value Creation Plan that entitles them to shares based upon the value of our Company (including amounts used to repurchase unitsmembership interests of Delphi Automotive LLP prior to the date of this offering) as of December 31, 2012 (subject |
| | to earlier vesting upon the occurrence of certain events). See “Executive Compensation.” Because such shares are not issuable within 60 days, our management members are not deemed to have beneficial ownership of such shares in the table above. Based on the midpoint of the range set forth on the cover of the prospectus and assuming such price is in effect on December 31, 2012, Messrs. O’Neal, Clark, Bertrand and Spencer would be entitled to receive , , and shares under the Value Creation Plan, respectively. |
| (2) | Assumes no exercise of the underwriters’ option to purchase additional shares. See “Underwriting.” |
| (3) | Mr. Pirtle was a NEO during the fiscal year ended December 31, 2010. He ceased being an executive officer of Delphi on July 1, 2011 and will retire from Delphi on January 1, 2012. See “Executive Compensation.” |
| (4) | Represents shares held by various onshore and offshore investment funds and separately managed accounts (collectively, the “Funds”), all of which are affiliated with and managed by Paulson & Co. Inc. (“Paulson”). Paulson is an investment advisor that is registered under the Investment Advisors Act of 1940. In its role as investment advisor, or manager of the Funds, Paulson possesses voting and/or investment power over the ordinary shares owned by the Funds. Because John Paulson is the President and sole Director of Paulson, he may be deemed to have voting and/or investment power over such shares. Except for the purpose of determining beneficial ownership under Section 13(d) of the Securities Exchange Act of 1934, as amended, John Paulson and Paulson disclaim beneficial ownership of such securities. The address for the Funds is c/o Paulson & Co. Inc., 1251 Avenue of the Americas, NY, NY 10020. |
| (5) | Reflects ordinary shares held by DIP Holdco 5 LLC, a subsidiary of Elliott Associates, L.P. Paul E. Singer, Elliott Capital Advisors, L.P., a Delaware limited partnership which is controlled by Mr. Singer, and Elliott Special GP, LLC, a Delaware limited liability company which is controlled by Mr. Singer, are the general partners of Elliott Associates, L.P. Elliott Associates, L.P. has an address at 712 Fifth Avenue, 36th Floor, New York, New York 10019. |
| (6) | Reflects ordinary shares held by DIP Holdco 5 Ltd., a subsidiary of Elliott International, L.P. Hambledon, Inc., a Cayman Islands corporation controlled by Paul E. Singer, is the sole general partner of Elliott International, L.P. In addition, Elliott International Capital Advisors Inc., the investment manager of Elliott International, L.P. which is controlled by Mr. Singer, has shared power with Elliott International, L.P. to vote and dispose of the shares owned by Elliott International, L.P. Elliott Associates, L.P. and Elliott International, L.P. are funds under common management. Elliott International, L.P. has an address at c/o Elliott Management Corporation, 712 Fifth Avenue, 36th Floor, New York, New York 10019. |
| (7) | Includes shares held by: (i) SPCP Group, LLC (“SPCP”), a wholly-owned subsidiary of Silver Point Capital Fund, L.P. (“Fund”) and Silver Point Capital Offshore Master Fund, L.P. (“Offshore Fund”); (ii) SP Auto, Ltd. (“SP Auto”), a wholly-owned subsidiary of the Offshore Fund; and (iii) SPCP Group III, LLC (“SPCP Group III”). Silver Point Capital, L.P. (“Silver Point”) is the investment manager of the Fund and the Offshore Fund, and as a result has sole voting and investment power over the shares held, directly or indirectly, by the Fund and the Offshore Fund. Silver Point Capital Management, LLC (“Silver Point Management”) is the general partner of Silver Point. Silver Point Management is also the manager of SPCP Group III, and as a result has sole voting and investment power over the securities held by SPCP Group III. Because Edward A. Mulé and Robert J. O’Shea are the members of Silver Point Management, they may be deemed to have voting and investment power over the shares held, directly or indirectly, by the Fund, the Offshore Fund and SPCP Group III. The address for Silver Point and Silver Point Management is Two Greenwich Plaza, 1st Floor, Greenwich, CT 06830. |
| (8) | Represents all ordinary shares owned by OCM Opportunities Fund VIIb Delaware, L.P., Oaktree Opportunities Fund VIII Delaware, L.P., Oaktree Huntington Investment Fund, L.P., Oaktree Opportunities Fund VIII (Parallel 2), L.P., Oaktree FF Investment Fund, L.P. – Class B, Oaktree Value Opportunities Fund Holdings, L.P., OCM Opps PH Holding, L.P. and California Street Holdings 2, L.P. The mailing address for the owners listed above is 333 S. Grand Avenue, 28th Floor, Los Angeles, CA 90071. |
| | The general partner of each of OCM Opportunities Fund VIIb Delaware, L.P. and Oaktree Opportunities Fund VIII Delaware, L.P. is Oaktree Fund GP, LLC. The managing member of Oaktree Fund GP, LLC is Oaktree Fund GP I, L.P. |
| | The general partner of Oaktree Huntington Investment Fund, L.P. is Oaktree Huntington Investment Fund GP, L.P. The general partner of Oaktree Huntington Investment Fund GP, L.P. is Oaktree Huntington Investment Fund GP Ltd. The sole shareholder of Oaktree Huntington Investment Fund GP Ltd. is Oaktree Fund GP I, L.P. |
| | The general partner of Oaktree Opportunities Fund VIII (Parallel 2), L.P. is Oaktree Opportunities Fund VIII GP, L.P. The general partner of Oaktree Opportunities Fund VIII GP, L.P. is Oaktree Opportunities Fund VIII GP Ltd. The sole shareholder of Oaktree Opportunities Fund VIII GP Ltd. is Oaktree Fund GP I, L.P. |
| | The general partner of Oaktree FF Investment Fund, L.P. – Class B is Oaktree FF Investment Fund GP, L.P. The general partner of Oaktree FF Investment Fund GP, L.P. is Oaktree FF Investment Fund GP Ltd. The sole shareholder of Oaktree FF Investment Fund GP Ltd. is Oaktree Fund GP I, L.P. |
| | The general partner of Oaktree Value Opportunities Fund Holdings, L.P. is Oaktree Value Opportunities Fund GP, L.P. The general partner of Oaktree Value Opportunities Fund GP, L.P. is Oaktree Value Opportunities Fund GP Ltd. The sole shareholder of Oaktree Value Opportunities Fund GP Ltd. is Oaktree Fund GP I, L.P. |
| | The general partner of Oaktree Fund GP I, L.P. is Oaktree Capital I, L.P. The general partner of Oaktree Capital I, L.P. is OCM Holdings I, LLC. The managing member of OCM Holdings I, LLC is Oaktree Holdings, LLC. The managing member of Oaktree Holdings, LLC is Oaktree Capital Group, LLC. The holder of a majority of the voting units of Oaktree Capital Group, LLC is Oaktree Capital Group Holdings, L.P. The general partner of Oaktree Capital Group Holdings, L.P. is Oaktree Capital Group Holdings GP, LLC. The members of Oaktree Capital Group Holdings GP, LLC are Kevin Clayton, John Frank, Stephen Kaplan, Bruce Karsh, Larry Keele, David Kirchheimer, Howard Marks and Sheldon Stone. Each of the general partners, managing members, unit holders and members described above disclaims beneficial ownership of any ordinary shares beneficially or of record owned by any of OCM Opportunities Fund VIIb Delaware, L.P., Oaktree Opportunities Fund VIII Delaware, L.P., Oaktree Huntington Investment Fund, L.P., Oaktree Opportunities Fund VIII (Parallel 2), L.P., Oaktree FF Investment Fund, L.P. – Class B or Oaktree Value Opportunities Fund Holdings, L.P., except to the extent of any pecuniary interest therein. The address for all of the entities and individuals identified above is 333 S. Grand Avenue, 28th Floor, Los Angeles, CA 90071. |
| | The general partner of each of OCM Opps PH Holding, L.P. and California Street Holdings 2, L.P. is OCM FIE, LLC. The managing member of OCM FIE, LLC is Oaktree Capital Management, L.P. The general partner of Oaktree Capital Management, L.P. is Oaktree Holdings, Inc. The sole shareholder of Oaktree Holdings, Inc. is Oaktree Capital Group, LLC. The holder of a majority of the voting units of Oaktree Capital Group, LLC is Oaktree Capital Group Holdings, L.P. The general partner of Oaktree Capital Group Holdings, L.P. is Oaktree Capital Group Holdings GP, LLC. The members of Oaktree Capital Group Holdings GP, LLC are Kevin Clayton, John Frank, Stephen Kaplan, Bruce Karsh, Larry Keele, David Kirchheimer, Howard Marks and Sheldon Stone. Each of the general partners, managing members, unit holders and members described above disclaims beneficial ownership of any ordinary shares beneficially or of record owned by either of OCM Opps PH Holding, L.P. or California Street Holdings 2, L.P., except to the extent of any pecuniary interest therein. The address for all of the entities and individuals identified above is 333 S. Grand Avenue, 28th Floor, Los Angeles, CA 90071. |
DESCRIPTION OF SHARE CAPITAL
Following this offering, ourOur authorized share capital will consistconsists of ordinary shares, par value $0.01 per share, and preferred shares, par value $0.01 per share.
The following descriptions are summaries of the material terms of our Articles of Association and Memorandum of Association.Association (as amended, our “Articles of Association” and “Memorandum of Association”, respectively). Reference is made to the more detailed provisions of, and the descriptions are qualified in their entirety by reference to, the Articles of Association and Memorandum of Association, copies of which are filed with the SEC as exhibits to the registration statement of which this prospectus is a part, and applicable law.
Ordinary Shares
ThereFollowing this offering, there will be ordinary shares issued and outstanding, assuming no exercise of the underwriters’ option to purchase additional shares, after giving effect to the sale of the ordinary shares offered hereby. All outstanding ordinary shares are validly issued, fully paid and non-assessable, and the ordinary shares to be issued upon completion of this offering will be validly issued, fully paid and non-assessable. The ordinary shares do not have pre-emptive, subscription or redemption rights. Neither our Memorandum of Association or Articles of Association nor the laws of Jersey restrict in any way the ownership or voting of ordinary shares held by non-residents of Jersey.
Dividend and Liquidation Rights. Holders of ordinary shares are entitled to receive equally, share for share, any dividends that may be declared by the Board of Directors out of funds legally available therefor. If, in the future, we declare cash dividends, such dividends will be payable in U.S. dollars. In the event of our liquidation, after satisfaction of liabilities to creditors, holders of ordinary shares are entitled to share pro rata in our net assets. Such rights may be affected by the grant of preferential dividend or distribution rights to the holders of a class or series of preferred shares that may be authorized in the future. Declaration of a final dividend (not exceeding the amounts proposed by our Board of Directors) requires shareholder approval by adoption of an ordinary resolution. Failure to obtain such shareholder approval does not affect previously paid interim dividends.
Voting, Shareholder Meetings and Resolutions. Holders of ordinary shares have one vote for each ordinary share held on all matters submitted to a vote of shareholders. These voting rights may be affected by the grant of any special voting rights to the holders of a class or series of preferred shares that may be authorized in the future. An annual general meeting shall be held once every calendar year at the time (within a period of not more than 18 months after the last preceding annual general meeting) and at the place as may be determined by the Board of Directors. The quorum required for an ordinary meeting of shareholders consists of shareholders present in person or by proxy who hold or represent between them a majority of the outstanding ordinary shares.
An ordinary resolution (such as a resolution for the approval of the financial reports or the declaration of dividends) requires approval by the holders of a majority of the voting rights represented at a meeting, in person or by proxy, and voting thereon.
Amendments to Governing Documents. A special resolution (such as, for example, a resolution amending our Memorandum of Association or Articles of Association or approving any change in capitalization, or a liquidation or winding-up) requires approval of the holders of two-thirds of the voting rights represented at the meeting, in person or by proxy, and voting thereon. A special resolution can only be considered if shareholders receive at least fourteen days’ prior notice of the meeting at which such resolution will be considered.
Requirements for Advance Notification of Shareholder Nominations and Proposals. Our Articles of Association establish advance notice procedures with respect to shareholder proposals and nomination of candidates for election as directors.
Limits on Written Consents. Any action required or permitted to be taken by the shareholders must be effected at a duly called annual or special meeting of shareholders and may not be effected by any consent in writing in lieu of a meeting of such shareholders.
Transfer of Shares and Notices. Fully paid ordinary shares are issued in registered form and may be freely transferred pursuant to the Articles of Association unless the transfer is restricted or prohibited by another instrument. Each shareholder of record is entitled to receive at least fourteen days’ prior notice (excluding the day of notice and the day of the meeting) of an ordinary shareholders’ meeting and of any shareholders’ meeting at which a special resolution is to be adopted of at least fourteen days. For the purposes of determining the shareholders entitled to notice and to vote at the meeting, the Board of Directors may fix a date as the record date for any such determination.
Modification of Class Rights. The rights attached to any class (unless otherwise provided by the terms of issue of that class), such as voting, dividends and the like, may be varied with the consent in writing of the holders of two-thirds of the outstanding shares of such class, or with the adoption of a special resolution passed at a separate general meeting of the holders of the shares of that class.
Election and Removal of Directors. The ordinary shares do not have cumulative voting rights in the election of directors. As a result, the holders of ordinary shares that represent more than 50% of the voting power have the power to elect any of our directors who are up for election. All of our directors will be elected at each annual meeting.
Upon completion ofFollowing this offering, we expect that our Board of Directors will consist of 12 directors. Our amended Articles of Association will state that shareholders may only remove a director for cause. Our Board of Directors will have sole power to fill any vacancy occurring as a result of the death, disability, removal or resignation of a director or as a result of an increase in the size of the Board of Directors.
Applicability of U.K. Takeover Code. The U.K. City Code on Takeovers and Mergers will not apply to takeover transactions for the Company for so long as we have our central place of management and control for these purposes outside the United Kingdom and the Channel Islands. Our world headquarters for operations and our executive management are located in Troy, Michigan.
Preferred Shares
We have authorized preferred shares. The Board of Directors has the authority to issue the preferred shares in one or more series and to fix the rights, preferences, privileges and restrictions of such shares, including dividend rights, dividend rates, conversion rights, voting rights, terms of redemption, redemption prices, liquidation preferences and the number of shares constituting any series, without further vote or action by the shareholders. We currently do not have any plans to issue any preferred shares.
The purpose of authorizing the Board of Directors to issue preferred shares and to determine their rights and preferences is to eliminate delays associated with a shareholder vote on specific issuances. The issuance of preferred shares, while providing desirable flexibility in connection with possible equity financings, acquisitions and other corporate purposes, could have the effect of making it more difficult for a third party to acquire, or of discouraging a third party from acquiring, a majority of our outstanding voting shares.
Comparison of United States and Jersey Corporate Law
The following discussion is a summary of the material differences between United States and Jersey corporate law relevant to an investment in the ordinary shares. The following discussion is based upon laws and relevant interpretations thereof in effect as of the date of this prospectus, all of which are subject to change.
As in most United States jurisdictions, unless approved by a special resolution of our shareholders, our directors do not have the power to take certain actions, including an amendment of our Memorandum of Association or Articles of Association or an increase or reduction in our authorized capital. Directors of a Jersey corporation, without shareholder approval, in certain instances may, among other things, implement certain sales, transfers, exchanges or dispositions of assets, property, parts of the business or securities of the corporation; or any combination thereof, if they determine any such action is in the best interests of the corporation, its creditors or its shareholders.
As in most United States jurisdictions, the board of directors of a Jersey corporation is charged with the management of the affairs of the corporation. In most United States jurisdictions, directors owe a fiduciary duty to the corporation and its shareholders, including a duty of care, pursuant to which directors must properly apprise themselves of all reasonably available information, and a duty of loyalty, pursuant to which they must protect the interests of the corporation and refrain from conduct that injures the corporation or its shareholders or that deprives the corporation or its shareholders of any profit or advantage. Many United States jurisdictions have enacted various statutory provisions that permit the monetary liability of directors to be eliminated or limited. Jersey law protecting the interests of shareholders may not be as protective in all circumstances as the law protecting shareholders in United States jurisdictions. Under our Articles of Association, we are required to indemnify every present and former officer of ours out of our assets against any loss or liability incurred by such officer by reason of being or having been such an officer. The extent of such indemnities shall be limited in accordance with the provisions of the Companies (Jersey) Law 1991, as amended.
Listing
The Company will apply to list the ordinary shares on the NYSE under the symbol “DLPH”.
Transfer Agent and Registrar
The U.S. transfer agent and registrar for the ordinary shares is Computershare Trust Company, N.A. The U.S. transfer agent and registrar’s address is 250 Royall Street, Canton, MA 02021, Attention: Client Administration. Computershare Investor Services (Jersey) Limited will be the transfer agent and registrar for the ordinary shares in Jersey and its address is Queensway House, Hilgrove Street, St Helier, Jersey JE1 1ES.
TAX CONSIDERATIONS
The information presented under the caption “Jersey Tax Considerations” below is a discussion of the material Jersey tax consequences of investing in the ordinary shares. The information presented under the caption “U.K. Tax Considerations” below is a discussion of Delphi Automotive PLC’s status as a resident of the United Kingdom for U.K. tax purposes and of the material U.K. tax consequences of investing in the ordinary shares. The information presented under the caption “U.S. Federal Income Tax Considerations” below is a discussion of the material U.S. federal income tax consequences to U.S. Holders (as defined below) of investing in the ordinary shares.
You should consult your tax adviser regarding the applicable tax consequences to you of investing in ordinary shares under the laws of Jersey, the United Kingdom and the United States (federal, state and local) and any other applicable foreign jurisdiction.
Jersey Tax Considerations
Delphi Automotive PLC is not regarded as resident for tax purposes in Jersey. Therefore, Delphi Automotive PLC will not be liable to Jersey income tax other than on Jersey source income (except where such income is exempted from income tax pursuant to the Income Tax (Jersey) Law 1961, as amended) and dividends on ordinary shares may be paid by Delphi Automotive PLC without withholding or deduction for or on account of Jersey income tax. The holders of ordinary shares (other than residents of Jersey) will not be subject to any tax in Jersey in respect of the holding, sale or other disposition of such ordinary shares.
In Jersey, no stamp duty is levied on the issue or transfer of the ordinary shares except that stamp duty is payable on Jersey grants of probate and letters of administration, which will generally be required to transfer ordinary shares on the death of a holder of such ordinary shares. In the case of a grant of probate or letters of administration, stamp duty is levied according to the size of the estate (wherever situated in respect of a holder of ordinary shares domiciled in Jersey, or situated in Jersey in respect of a holder of ordinary shares domiciled outside Jersey) and is payable on a sliding scale at a rate of up to 0.75% of such estate.
Jersey does not otherwise levy taxes upon capital, inheritances, capital gains or gifts nor are there otherwise estate duties.
U.K. Tax Considerations
Delphi Automotive PLC intends to conduct its affairs, including by holding a significant number of its board meetings in the United Kingdom, such that it will be treated as managed and controlled in the United Kingdom and therefore be treated as resident in the United Kingdom for U.K tax purposes.
The following statements are a general guide to certain aspects of current U.K. tax law and the current published practice of HM Revenue and Customs (“HMRC”), both of which are subject to change, possibly with retrospective effect.
Dividends
Delphi Automotive PLC will not be required to deduct or withhold U.K. tax at source from dividend payments it makes.
Capital Gains
Holders of ordinary shares who are not resident or ordinarily resident in the U.K. will not generally be subject to U.K. taxation of capital gains on the disposal or deemed disposal of ordinary shares unless they are carrying on a trade, profession or vocation in the United Kingdom through a branch or agency (or, in the case of a corporate holder, carrying on a trade in the U.K. through a permanent establishment) in connection with which the ordinary shares are used, held or acquired.
Stamp duty and stamp duty reserve tax
No stamp duty reserve tax will be payable on the issue of the ordinary shares or on any transfer of the ordinary shares, provided that the ordinary shares are not registered in a register kept in the U.K. It is not intended that such a register will be kept in the U.K.
No stamp duty will be payable on the issue of the ordinary shares. No stamp duty will be payable on a transfer of the ordinary shares provided that (i) any instrument of transfer is not executed inside the U.K., and (ii) such instrument of transfer does not relate to any property situated, or any matter or thing done or to be done, in the U.K.
Tax position of U.K. resident holders of ordinary shares
The following statements are intended to apply to holders of ordinary shares who are only resident or (in the case of capital gains tax) ordinarily resident for tax purposes in the U.K., who hold the ordinary shares as investments and who are the beneficial owners of the ordinary shares. The statements may not apply to certain classes of holders of ordinary shares, such as dealers in securities and persons acquiring ordinary shares in connection with their employment. Prospective investors in ordinary shares who are in any doubt as to their tax position regarding the acquisition, ownership and disposition of the ordinary shares should consult their own tax advisers.
Dividends
Individuals
An individual holder who receives a dividend from Delphi Automotive PLC will be entitled to a tax credit which may be set off against his total income tax liability on the dividend. Such an individual holder’s liability to income tax is calculated on the aggregate of the dividend (the “declared dividend”) and the tax credit (such aggregate being the “gross dividend”) which will be regarded as the top slice of the individual’s income. The tax credit will be equal to 10% of the gross dividend (i.e. the tax credit will be one-ninth of the amount of the dividend).
An individual holder who is not liable to income tax in respect of the dividend will not be entitled to reclaim any part of the tax credit. An individual holder who is liable to income tax at the basic rate will be subject to income tax on the dividend at the rate of 10% of the gross dividend so that the tax credit will satisfy in full such holder’s liability to income tax on the dividend.
An individual holder liable to income tax at the higher rate will be subject to income tax on the gross dividend at 32.5% of the gross dividend, but will be able to set the tax credit off against part of this liability. The effect of the set off of the U.K. tax credit is that such a holder will have to account for additional tax equal to one-quarter of the declared dividend.
An individual holder liable to income tax at the additional rate will be subject to income tax on the gross dividend at 42.5% of the gross dividend, but will be able to set the tax credit off against part of this liability. The effect of that set off of the U.K. tax credit is that such a holder will have to account for additional tax equal to approximately 36.1% of the declared dividend.
Corporate shareholders within the charge to U.K. Corporation Tax
Holders of ordinary shares within the charge to U.K. corporation tax which are “small companies” for the purposes of Chapter 2 of Part 9A of the Corporation Tax Act 2009 (“CTA 2009”) (for the purposes of U.K. taxation of dividends) will not be subject to U.K. corporation tax on any dividend received from Delphi Automotive PLC provided certain conditions are met (including an anti-avoidance condition).
Other holders within the charge to U.K. corporation tax will not normally be subject to tax on dividends (including dividends from Delphi Automotive PLC).
If the conditions for exemption are not met or cease to be satisfied, or such a holder elects for an otherwise exempt dividend to be taxable, the holder will be subject to U.K. corporation tax on dividends received from Delphi Automotive PLC, at the rate of corporation tax applicable to that holder.
A corporate holder resident in the U.K. who is not liable to tax on dividends from Delphi Automotive PLC will not be entitled to reclaim any part of the tax credit.
Capital gains
Individuals
For individual holders, the principal factors that will determine the U.K. capital gains tax position on a disposal or deemed disposal of ordinary shares are the extent to which the holder realizes any other capital gains in the U.K. tax year in which the disposal is made, the extent to which the holder has incurred capital losses in that or earlier U.K. tax years, and the level of the annual allowance of tax-free gains in that U.K. tax year (the “annual exemption”). The annual exemption for the 2011/2012 U.K. tax year is £10,600.
If, after all allowable deductions, an individual holder’s taxable income for the year exceeds the basic rate U.K. income tax limit, a taxable chargeable gain accruing on a disposal or deemed disposal of the ordinary shares would be taxed at 28%. Otherwise, such a gain may be taxed at 18% or 28% or a combination of both rates.
A holder who is an individual and who has ceased to be resident or ordinarily resident in the U.K. for tax purposes for a period of less than five complete tax years and who disposes of ordinary shares during that period may also be liable on his return to the U.K. to tax on any capital gain realized, subject to any available exemptions or reliefs.
Companies
A disposal or deemed disposal of ordinary shares by a holder within the charge to U.K. corporation tax may give rise to a chargeable gain or allowable loss for the purposes of U.K. corporation tax, depending on the circumstances and subject to any available exemptions or reliefs. Corporation tax is charged on chargeable gains at the rate applicable to that company.
Holders within the charge to U.K. corporation tax will, for the purposes of computing chargeable gains, be allowed to claim an indexation allowance which applies to reduce capital gains (but not to create or increase an allowable loss) to the extent that such gains arise due to inflation.
U.S. Federal Income Tax Considerations
The following section is the opinion of Davis Polk & Wardwell LLP as to the material U.S. federal income tax consequences to the U.S. Holders described below of owning and disposing of ordinary shares. It does not describe all tax considerations that may be relevant to a particular person’s decision to acquire the ordinary shares.
As discussed above under “Risk Factors—Risks Related to Legal, Regulatory, Tax and Accounting matters,Matters,” the IRS has indicated its intention to issue regulations, which if issued with a retroactive effective date and with no exceptions for transactions that were subject to binding commitments on that date, could create a significant risk that Delphi Automotive PLC could be treated as a domestic corporation for U.S. federal income tax purposes. Although Delphi Automotive PLC believes that it is more likely than not that it is not a domestic
corporation for U.S. federal income tax purposes, no assurance can be given that the IRS will not contend that Delphi Automotive PLC should be treated as a domestic corporation for U.S. federal income tax purposes. If Delphi Automotive PLC were treated as a domestic corporation for U.S. federal income tax purposes, the U.S. tax consequences to holders of ordinary shares would be significantly different. In particular, future cash distributions made by us to holders who are not “U.S. Holders” could be subject to withholding tax at a 30% rate or a reduced rate specified by an applicable income tax treaty. Holders should consult their tax advisers about the U.S. tax consequences of holding ordinary shares if Delphi Automotive PLC were treated as a domestic corporation. The remainder of the discussion below assumes that Delphi Automotive PLC is not treated as a domestic corporation.
This discussion applies only to a U.S. Holder that holds ordinary shares as capital assets for tax purposes. In addition, it does not describe all of the tax consequences that may be relevant in light of the U.S. Holder’s particular circumstances, including alternative minimum tax consequences and tax consequences applicable to U.S. Holders subject to special rules, such as:
certain financial institutions;
dealers or traders in securities who use a mark-to-market method of tax accounting;
persons holding ordinary shares as part of a hedging transaction, straddle, wash sale, conversion transaction or integrated transaction or persons entering into a constructive sale with respect to the ordinary shares;
persons whose functional currency for U.S. federal income tax purposes is not the U.S. dollar;
entities classified as partnerships for U.S. federal income tax purposes;
tax-exempt entities, including an “individual retirement account” or “Roth IRA”;
persons that own or are deemed to own ten percent or more of our voting shares; or
persons holding ordinary shares in connection with a trade or business conducted outside of the United States.
If an entity that is classified as a partnership for U.S. federal income tax purposes holds ordinary shares, the U.S. federal income tax treatment of a partner will generally depend on the status of the partner and the activities of the partnership. Partnerships holding ordinary shares and partners in such partnerships should consult their tax advisers as to the particular U.S. federal income tax consequences of holding and disposing of the ordinary shares.
This discussion is based on the Internal Revenue Code of 1986, as amended (the “Code”), administrative pronouncements, judicial decisions, final, temporary and proposed Treasury regulations, and the income tax treaty between the United Kingdom and the United States (the “Treaty”) all as of the date hereof, any of which is subject to change, possibly with retroactive effect.
A “U.S. Holder” is a holder who, for U.S. federal income tax purposes, is a beneficial owner of ordinary shares, who is eligible for the benefits of the Treaty and is:
an individual citizen or resident of the United States;
a corporation, or other entity taxable as a corporation, created or organized in or under the laws of the United States, any state therein or the District of Columbia; or
an estate or trust the income of which is subject to U.S. federal income taxation regardless of its source.
U.S. Holders should consult their tax advisers concerning the U.S. federal, state, local and foreign tax consequences of owning and disposing of ordinary shares in their particular circumstances.
This discussion assumes that Delphi Automotive PLC is not, and will not become, a passive foreign investment company, as described below.
Taxation of Distributions
Distributions paid on ordinary shares, other than certain pro rata distributions of ordinary shares, will be treated as dividends to the extent paid out of our current or accumulated earnings and profits (as determined under U.S. federal income tax principles). Because Delphi Automotive PLC will not generally be required, and does not expect to continue, to maintain calculations of its earnings and profits under U.S. federal income tax principles, it is expected that distributions generally will be reported to U.S. Holders as dividends. Subject to applicable limitations, dividends paid to certain non-corporate U.S. Holders in taxable years beginning before January 1, 2013 may be taxable at favorable rates, up to a maximum rate of 15%. U.S. Holders should consult their tax advisers regarding the availability of the reduced tax rate on dividends in their particular circumstances. The amount of a dividend will include any amounts withheld by Delphi Automotive PLC in respect of any U.K. taxes. The amount of the dividend will generally be treated as foreign-source dividend income to U.S. Holders and will not be eligible for the dividends-received deduction generally available to U.S. corporations under the Code. Dividends will be included in a U.S. Holder’s income on the date of the U.S. Holder’s receipt of the dividend.
In the event of a change in U.K. law that requires withholding of U.K. taxes on future distributions made by Delphi Automotive PLC, subject to applicable limitations, some of which vary depending upon the U.S. Holder’s circumstances, any U.K. taxes withheld from distributions at a rate not exceeding the rate provided by the Treaty will be creditable against the U.S. Holder’s U.S. federal income tax liability. U.K. taxes withheld in excess of the rate applicable under the Treaty will not be eligible for credit against a U.S. Holder’s federal income tax liability. The rules governing foreign tax credits are complex, and U.S. Holders should consult their tax advisers regarding the creditability of foreign taxes in their particular circumstances. In lieu of claiming a foreign tax credit, U.S. Holders may, at their election, deduct foreign taxes, including any U.K. taxes, in computing their taxable income, subject to generally applicable limitations under U.S. law. An election to deduct foreign taxes instead of claiming foreign tax credits applies to all taxes paid or accrued in the taxable year to foreign countries and possessions of the United States.
Sale or Other Disposition of Ordinary Shares
For U.S. federal income tax purposes, gain or loss realized on the sale or other disposition of ordinary shares will be capital gain or loss, and will be long-term capital gain or loss if the U.S. Holder held the ordinary shares for more than one year. The amount of the gain or loss will equal the difference between the U.S. Holder’s tax basis in the ordinary shares disposed of and the amount realized on the disposition, in each case as determined in U.S. dollars. This gain or loss will generally be U.S.-source gain or loss for foreign tax credit purposes.
Passive Foreign Investment Company Rules
Delphi Automotive PLC believes that it is not currently a “passive foreign investment company” (a “PFIC”) for U.S. federal income tax purposes and does not expect to become one in the foreseeable future. In general, a foreign corporation is a PFIC for any taxable year if: (i) 75% or more of its gross income consists of passive income (such as dividends, interest, rents and royalties) or (ii) 50% or more of the average quarterly value of its assets consists of assets that produce, or are held for the production of, passive income. Because PFIC status depends on the composition of a company’s income and assets and the market value of its assets from time to time, there can be no assurance that Delphi Automotive PLC will not be a PFIC for any taxable year.
If Delphi Automotive PLC were a PFIC for any taxable year during which a U.S. Holder held ordinary shares, gain recognized by a U.S. Holder on a sale or other disposition (including certain pledges) of the ordinary shares would be allocated ratably over the U.S. Holder’s holding period for the ordinary shares. The amounts allocated to the taxable year of the sale or other disposition and to any year before Delphi Automotive PLC became a PFIC would be taxed as ordinary income. The amount allocated to each other taxable year would be subject to tax at the highest rate in effect for individuals or corporations, as appropriate, for that taxable year, and an interest charge would be imposed on the amount allocated to that taxable year. Further, to the extent that any distribution received by a U.S. Holder on its ordinary shares exceeds 125% of the average of the annual distributions on the ordinary shares received during the preceding three years or the U.S. Holder’s holding period, whichever is shorter, that distribution would be subject to taxation in the same manner as gain, described immediately above. Certain elections may be available that would result in alternative treatments (such as mark-to-market treatment) of the ordinary shares. U.S. Holders should consult their tax advisers to determine whether any of these elections would be available and, if so, what the consequences of the alternative treatments would be in their particular circumstances.
Information Reporting and Backup Withholding
Payments of dividends and sales proceeds that are made within the United States or through certain U.S.-related financial intermediaries generally are subject to information reporting, and may be subject to backup withholding, unless (i) the U.S. Holder is a corporation or other exempt recipient or (ii) in the case of backup withholding, the U.S. Holder provides a correct taxpayer identification number and certifies that it is not subject to backup withholding.
The amount of any backup withholding from a payment to a U.S. Holder will be allowed as a credit against the holder’s U.S. federal income tax liability and may entitle it to a refund, provided that the required information is timely furnished to the IRS.
Certain Reporting Obligations
If a U.S. Holder acquires ordinary shares in this offering for a price in excess of $100,000, the holder must file Internal Revenue Service (“IRS”) Form 926 for the holder’s taxable year in which the acquisition occurs. Failure by a U.S. Holder to timely comply with such reporting requirements may result in substantial penalties.
For taxable years beginning after March 18, 2010, new legislation requires certain U.S. Holders who are individuals to report information relating to shares of a non-U.S. person, subject to certain exceptions (including an exception for shares held in custodial accounts maintained by a U.S. financial institution). U.S. Holders are urged to consult their tax advisers regarding the effect, if any, of this legislation on their ownership and disposition of shares.
SHARES ELIGIBLE FOR FUTURE SALE
Prior to this offering, there has been no market for our ordinary shares. Future sales of substantial amounts of our ordinary shares in the public market could adversely affect market prices prevailing from time to time. Furthermore, because only a limited number of shares will be available for sale shortly after this offering due to existing contractual and legal restrictions on resale as described below, there may be sales of substantial amounts of our ordinary shares in the public market after the restrictions lapse. This may adversely affect the prevailing market price and our ability to raise equity capital in the future.
Upon completion of this offering, we will have ordinary shares outstanding assuming no exercise of the underwriters’ option to purchase additional shares. Of these shares, shares, or shares if the underwriters exercise their option in full, sold in this offering will be freely transferable without restriction or registration under the Securities Act, except for any shares purchased by one of our existing “affiliates,” as that term is defined in Rule 144 under the Securities Act. The remaining ordinary shares existing are “restricted shares” as defined in Rule 144. Restricted shares may be sold in the public market only if registered or if they qualify for an exemption from registration under Rule 144 of the Securities Act. As a result of the contractual lock-up period described below and the provisions of Rule 144, these shares will be available for sale in the public market as follows:
| | |
Number of Shares | | Date |
| | On the date of this prospectus. |
| | After 180 days from the date of this prospectus (subject, in some cases, to volume limitations). |
| | At various times after 180 days from the date of this prospectus (subject, in some cases, to volume limitations). |
As described below and under “Relationships and Related Party Transactions—Registration Rights Agreement,” we have agreed to use best efforts to effectuate a shelf registration for our shareholders when their shares are released from the lock-up agreements described below. Accordingly, while such shares would not be freely tradeable under Rule 144 until six months after this offering, 30% of such shares are expected to be freely tradeable pursuant to such shelf registration 90 days after the date of this prospectus.
Rule 144
In general, under Rule 144 as currently in effect, once we have been a reporting company subject to the reporting requirements of Section 13 or Section 15(d) of the Exchange Act for 90 days, an affiliate who has beneficially owned restricted ordinary shares for at least six months would be entitled to sell within any three-month period a number of shares that does not exceed the greater of either of the following:
1% of the number of ordinary shares then outstanding, which will equal shares immediately after this offering; and
the average weekly reported volume of trading of our ordinary shares during the four calendar weeks preceding the filing of a notice on Form 144 with respect to the sale.
However, the six month holding period increases to one year in the event we have not been a reporting company for at least 90 days. In addition, any sales by affiliates under Rule 144 are also limited by manner of sale provisions and notice requirements and the availability of current public information about us.
The volume limitation, manner of sale and notice provisions described above will not apply to sales by non-affiliates. For purposes of Rule 144, a non-affiliate is any person or entity who is not our affiliate at the time
of sale and has not been our affiliate during the preceding three months. Once we have been a reporting company for 90 days, a non-affiliate who has beneficially owned restricted ordinary shares for six months may rely on Rule 144 provided that certain public information regarding us is available. The six month holding period increases to one year in the event we have not been a reporting company for at least 90 days. However, a non-affiliate who has beneficially owned the restricted shares proposed to be sold for at least one year will not be subject to any restrictions under Rule 144 regardless of how long we have been a reporting company.
We are unable to estimate the number of shares that will be sold under Rule 144 since this will depend on the market price for our ordinary shares, the personal circumstances of the shareholder and other factors.
Registration Rights
Upon completion of this offering, the holders of all of our ordinary shares not sold in this offering will be entitled to various rights with respect to the registration of these shares under the Securities Act. Registration of these shares under the Securities Act would result in these shares becoming freely tradable without restriction under the Securities Act immediately upon the effectiveness of the registration, except for shares purchased by affiliates. See “Relationships and Related Party Transactions—Registration Rights Agreement.”
Incentive Compensation Shares
As of March 31,June 30, 2011, no options to purchase ordinary shares were outstanding. Pursuant to the Value Creation Plan described under “Executive Compensation,” members of management will receive equity on December 31, 2012 (subject to earlier vesting in certain circumstances) based upon the value of the Company, which is deemed to include distributions to holders of all membership interests of Delphi Automotive LLP and the approximately $4.4 billion paid to repurchase Class A and Class C membership interests. Based on the midpoint of the range on the front cover and assuming that value is maintained on December 31, 2012, �� shares would be issuable under such plan.
Upon completion of this offering, we intend to file a registration statementstatements under the Securities Act covering all ordinary shares issuable pursuant to our Value Creation Plan and our Long Term Incentive Plan. Shares registered under thisthese registration statementstatements will be available for sale in the open market, subject to Rule 144 volume limitations applicable to affiliates, vesting restrictions with us or the contractual restrictions described below.
Lock-Up Agreements
Our officers, directors and all of our existing shareholders have agreed, subject to limited exceptions, not to offer, pledge, sell, contract to sell, sell any option or contract to purchase, purchase any option or contract to sell, grant any option, right or warrant to purchase, or otherwise transfer or dispose of, directly or indirectly, any ordinary shares beneficially owned (as such term is used in Rule 13d-3 of the Securities Exchange Act of 1934, as amended) or any other securities so owned convertible into or exercisable or exchangeable for ordinary shares or enter into any swap or other arrangement that transfers to another, in whole or in part, any of the economic consequences of ownership of any ordinary shares or any securities convertible into or exercisable or exchangeable for ordinary shares for a period of 180 days after the date of this prospectus, without the prior written consent of Goldman, Sachs & Co. and J.P. Morgan Securities LLC; provided that the foregoing restrictions will cease to apply with respect to approximately ordinary shares held by these shareholders (other than our directors and officers) on the 90th day after the date of this prospectus.
UNDERWRITING
We,Delphi Automotive PLC, the selling shareholders and the underwriters named below have entered into an underwriting agreement with respect to the shares being offered. Subject to certain conditions, each underwriter has severally agreed to purchase the number of shares indicated in the following table. Goldman, Sachs & Co., J.P. Morgan Securities LLC, Merrill Lynch, Pierce, Fenner & Smith Incorporated, Barclays Capital Inc., Citigroup Global Markets Inc., Deutsche Bank Securities Inc. and Morgan Stanley & Co. LLC are the representatives of the underwriters.
| | |
Name | | Number of Shares |
Goldman, Sachs & Co. | | |
J.P. Morgan Securities LLC | | |
Merrill Lynch, Pierce, Fenner & Smith
Incorporated | | |
Barclays Capital Inc. | | |
Citigroup Global Markets Inc. | | |
Deutsche Bank Securities Inc. | | |
Morgan Stanley & Co. LLC | | |
Robert W. Baird & Co. Incorporated | | |
Credit Suisse Securities (USA) LLC | | |
Lazard Capital Markets LLC | | |
UBS Securities LLC | | |
CRT Capital Group LLC | | |
Guggenheim Securities, LLC | | |
Houlihan Lokey Capital, Inc. | | |
RBC Capital Markets, LLC | | |
Scotia Capital (USA) Inc. | | |
Ticonderoga Securities LLC | | |
The Williams Capital Group, L.P. | | |
UniCredit Capital Markets LLC | | |
| | |
Total | | |
| | |
The underwriters are committed to take and pay for all of the shares being offered, if any are taken, other than the shares covered by the option described below unless and until this option is exercised.
If the underwriters sell more shares than the total number set forth in the table above, the underwriters have an option to buy up to an additional shares from the Companyus and shares from the selling shareholders. They may exercise that option for 30 days. If any shares are purchased pursuant to this option, the underwriters will severally purchase shares in approximately the same proportion as set forth in the table above.
Pursuant to the Fourth Amended and Restated Limited Liability PartnershipLLP Agreement, of Delphi Automotive LLP, the selling shareholders are not required to pay any underwriting discount on shares sold by them, and we have agreed to pay a commission with respect to such shares to the underwriters in lieu thereof. The following tables show the per share and total underwriting discounts and commissions to be paid to the underwriters by us. Such amounts are shown assuming both no exercise and full exercise of the underwriters’ option to purchase additional shares.
| | | | | | | | |
| Underwriting Discounts Paid by the Company | | No Exercise | | | Full Exercise | |
Per Share | | $ | | | | $ | | |
Total | | $ | | | | $ | | |
| | | | | | | | |
Commissions Paid by the Company With Respect to Shares Sold by the Selling Shareholders | | No Exercise | | | Full Exercise | |
Per Share | | $ | | | | $ | | |
Total | | $ | | | | $ | | |
Shares sold by the underwriters to the public will initially be offered at the initial public offering price set forth on the cover of this prospectus. Any shares sold by the underwriters to securities dealers may be sold at a discount of up to $ per share from the initial public offering price. If all the shares are not sold at the
initial public offering price, the representatives may change the offering price and the other selling terms. The offering of the shares by the underwriters is subject to receipt and acceptance and subject to the underwriters’ right to reject any order in whole or in part.
The selling shareholders may be deemed to be “underwriters” within the meaning of the Securities Act with respect to the ordinary shares they are offering.
We and our officers, directors, and holders of of our ordinary shares, including the selling shareholders, have agreed with the underwriters, subject to certain exceptions, not to dispose of or hedge any of their ordinary shares or securities convertible into or exchangeable for ordinary shares during the period from the date of this prospectus continuing through the date 180 days after the date of this prospectus, except with the prior written consent of Goldman, Sachs & Co. and J.P. Morgan Securities LLC; provided that the foregoing restrictions will cease to apply to approximately ordinary shares held by the selling shareholders on the 90th day after the date of this prospectus (the “early release date”). The lock-up agreement does not apply to any existing employee benefit plans.
With respect to our shareholders (other than our directors and officers), the lock-up restrictions do not apply to
the contribution by a shareholder of LLP membership interests in Delphi Automotive LLP in exchange for ordinary shares or the sale by the selling shareholders of ordinary shares in this offering;
any pledge of equity interests that derives a significant part of its value from our equity securities or those of Delphi Automotive LLP created prior to July 12, 2011;
| | • | | the pledge to a financial institution of equity interests that derives a significant part of its value from our equity securities or equity securities of Delphi Automotive LLP created after the date of this prospectus,July 12, 2011,provided that the financial institution, upon any foreclosure, agrees to be bound in writing by the lock-up restrictions described above; |
| | • | | the transfer of ordinary shares as a bona fide gift or gifts,provided that the donee or donees thereof agree to be bound in writing by the lock-up restrictions described above; |
| | • | | the transfer of ordinary shares to any trust for the direct or indirect benefit of a shareholder or the immediate family of such shareholder,provided that the trustee of the trust agrees to be bound in writing by the lock-up restrictions described above; |
| | • | | the transfer of ordinary shares to any shareholder, member or partner of a shareholder or any subsidiary or other affiliate of such shareholder,provided that the recipient agrees to be bound in writing by the lock-up restrictions described above; or |
the transfer of ordinary shares that a shareholder acquires in the open market following completion of this offering;
andprovided furtherthat any such transfer pursuant to the fourth or fifth bullets in this paragraph shall not involve a disposition for value, andprovided further that, in the case of any transfer pursuant to the third, fourth, fifth or sixth bullets in this paragraph, no filing by any party (donor, donee, transferor or transferee) under the Exchange Act or other public announcement shall be required or shall be made voluntarily in connection with such transfer during the restricted period. See “Shares Eligible for Future Sale” for a discussion of certain transfer restrictions.
The 180-day restricted period (or, in the case of shares released from lock-up on the early release date, the 90-day restricted period, each a “restricted period”) described in the preceding paragraphs will be automatically extended if: (1) during the last 17 days of the restricted period we issue an earnings release or announce material news or a material event; or (2) prior to the expiration of the restricted period, the Company announces that it will release earnings results during the 15-day period following the last day of the restricted period, in which case the restrictions described in the preceding paragraph will continue to apply until the expiration of the 18-day
period beginning on the issuance of the earnings release of the announcement of the material news or material event.
Prior to the offering, there has been no public market for the shares. The initial public offering price has been negotiated among us and the representatives. Among the factors to be considered in determining the initial public offering price of the shares, in addition to prevailing market conditions, will be our historical performance, estimates of our business potential and earnings prospects, an assessment of our management and the consideration of the above factors in relation to market valuation of companies in related businesses.
We intend to list the ordinary shares on the NYSE under the symbol “DLPH”. In order to meet one of the requirements for listing the ordinary shares on the NYSE, the underwriters have undertaken to sell lots of 100 or more shares to a minimum of 400 beneficial holders.holders in the U.S.
In connection with the offering, the underwriters may purchase and sell ordinary shares in the open market. These transactions may include short sales, stabilizing transactions and purchases to cover positions created by short sales. Short sales involve the sale by the underwriters of a greater number of shares than they are required to purchase in the offering. “Covered” short sales are sales made in an amount not greater than the underwriters’ option to purchase additional shares from us and the selling shareholders in the offering. The underwriters may close out any covered short position by either exercising their option to purchase additional shares or purchasing shares in the open market. In determining the source of shares to close out the covered short position, the underwriters will consider, among other things, the price of shares available for purchase in the open market as compared to the price at which they may purchase additional shares pursuant to the option granted to them. “Naked” short sales are any sales in excess of such option. The underwriters must close out any naked short position by purchasing shares in the open market. A naked short position is more likely to be created if the underwriters are concerned that there may be downward pressure on the price of the ordinary shares in the open market after pricing that could adversely affect investors who purchase in the offering. Stabilizing transactions consist of various bids for or purchases of ordinary shares made by the underwriters in the open market prior to the completion of the offering.
The underwriters may also impose a penalty bid. This occurs when a particular underwriter repays to the underwriters a portion of the underwriting discount received by it because the representatives have repurchased shares sold by or for the account of such underwriter in stabilizing or short covering transactions.
Purchases to cover a short position and stabilizing transactions, as well as other purchases by the underwriters for their own accounts, may have the effect of preventing or retarding a decline in the market price of the our ordinary shares, and together with the imposition of the penalty bid, may stabilize, maintain or otherwise affect the market price of the ordinary shares. As a result, the price of the ordinary shares may be higher than the price that otherwise might exist in the open market. If these activities are commenced, they may be discontinued at any time. These transactions may be effected on the NYSE, in the over-the-counter market or otherwise.
The underwriters have informed us that they do not intend to confirm sales to discretionary accounts that exceed 5% of the total number of shares offered by them.
We,Delphi Automotive PLC, the selling shareholders and the underwriters have agreed to severally indemnify each other against certain liabilities, including liabilities under the Securities Act.
The underwriters and their respective affiliates are full service financial institutions engaged in various activities, which may include securities trading, commercial and investment banking, financial advisory, investment management, investment research, principal investment, hedging, financing and brokerage activities. Certain of the underwriters and their respective affiliates have, from time to time, performed, and may in the future perform, various financial advisory and investment banking services for the issuer, for which they received or will receive customary fees and expenses.
In the ordinary course of their various business activities, the underwriters and their respective affiliates may make or hold a broad array of investments and actively trade debt and equity securities (or related derivative securities) and financial instruments (including bank loans) for their own account and for the accounts of their customers, and such investment and securities activities may involve securities and/or instruments of the issuer. The underwriters and their respective affiliates may also make investment recommendations and/or publish or express independent research views in respect of such securities or instruments and may at any time hold, or recommend to clients that they acquire, long and/or short positions in such securities and instruments.
European Economic Area
In relation to each Member State of the European Economic Area which has implemented the Prospectus Directive (each, a Relevant Member State), each underwriter has represented and agreed that with effect from and including the date on which the Prospectus Directive is implemented in that Relevant Member State (the Relevant Implementation Date) it has not made and will not make an offer of shares to the public in that Relevant Member State prior to the publication of a prospectus in relation to the shares which has been approved by the competent authority in that Relevant Member State or, where appropriate, approved in another Relevant Member State and notified to the competent authority in that Relevant Member State, all in accordance with the Prospectus Directive, except that it may, with effect from and including the Relevant Implementation Date, make an offer of shares to the public in that Relevant Member State at any time:
(a) to legal entities which are authorized or regulated to operate in the financial markets or, if not so authorised or regulated, whose corporate purpose is solely to invest in securities;
(b) to any legal entity which has two or more of (1) an average of at least 250 employees during the last financial year; (2) a total balance sheet of more than €43,000,000 and (3) an annual net turnover of more than €50,000,000, as shown in its last annual or consolidated accounts;
(c) to fewer than 100 natural or legal persons (other than qualified investors as defined in the Prospectus Directive) subject to obtaining the prior consent of the representatives for any such offer; or
(d) in any other circumstances which do not require the publication by the Issuer of a prospectus pursuant to Article 3 of the Prospectus Directive.
For the purposes of this provision, the expression an “offer of shares to the public” in relation to any shares in any Relevant Member State means the communication in any form and by any means of sufficient information on the terms of the offer and the shares to be offered so as to enable an investor to decide to purchase or subscribe the shares, as the same may be varied in that Relevant Member State by any measure implementing the Prospectus Directive in that Relevant Member State and the expression Prospectus Directive means Directive 2003/71/EC and includes any relevant implementing measure in each Relevant Member State.
Notice to Residents of the United Kingdom
Each underwriter has represented and agreed that:
(a) it has only communicated or caused to be communicated and will only communicate or cause to be communicated an invitation or inducement to engage in investment activity (within the meaning of Section 21 of the FSMA) received by it in connection with the issue or sale of the shares in circumstances in which Section 21(1) of the FSMA does not apply to the Issuer; and
(b) it has complied and will comply with all applicable provisions of the FSMA with respect to anything done by it in relation to the shares in, from or otherwise involving the United Kingdom.
Notice to Residents of Switzerland
The shares may not be publicly offered in Switzerland and will not be listed on the SIX Swiss Exchange (“SIX”) or on any other stock exchange or regulated trading facility in Switzerland. This document has been prepared without regard to the disclosure standards for issuance prospectuses under art. 652a or art. 1156 of the Swiss Code of Obligations or the disclosure standards for listing prospectuses under art. 27 ff. of the SIX Listing Rules or the listing rules of any other stock exchange or regulated trading facility in Switzerland. Neither this document nor any other offering or marketing material relating to the shares or the offering may be publicly distributed or otherwise made publicly available in Switzerland.
Neither this document nor any other offering or marketing material relating to the offering, the Company, the shares have been or will be filed with or approved by any Swiss regulatory authority. In particular, this document will not be filed with, and the offer of shares will not be supervised by, the Swiss Financial Market Supervisory Authority FINMA (FINMA), and the offer of shares has not been and will not be authorized under the Swiss Federal Act on Collective Investment Schemes (“CISA”). The investor protection afforded to acquirers of interests in collective investment schemes under the CISA does not extend to acquirers of shares.
Notice to Residents of the Dubai International Financial Centre
This prospectus supplement relates to an Exempt Offer in accordance with the Offered Securities Rules of the Dubai Financial Services Authority (“DFSA”). This prospectus supplement is intended for distribution only to persons of a type specified in the Offered Securities Rules of the DFSA. It must not be delivered to, or relied on by, any other person. The DFSA has no responsibility for reviewing or verifying any documents in connection with Exempt Offers. The DFSA has not approved this prospectus supplement nor taken steps to verify the information set forth herein and has no responsibility for the prospectus supplement. The shares to which this prospectus supplement relates may be illiquid and/or subject to restrictions on their resale. Prospective purchasers of the shares offered should conduct their own due diligence on the shares. If you do not understand the contents of this prospectus supplement you should consult an authorized financial advisor.
Notice to Residents of Hong Kong
The shares may not be offered or sold by means of any document other than (i) in circumstances which do not constitute an offer to the public within the meaning of the Companies Ordinance (Cap.32, Laws of Hong Kong), or (ii) to “professional investors” within the meaning of the Securities and Futures Ordinance (Cap.571, Laws of Hong Kong) and any rules made thereunder, or (iii) in other circumstances which do not result in the document being a “prospectus” within the meaning of the Companies Ordinance (Cap.32, Laws of Hong Kong), and no advertisement, invitation or document relating to the shares may be issued or may be in the possession of any person for the purpose of issue (in each case whether in Hong Kong or elsewhere), which is directed at, or the contents of which are likely to be accessed or read by, the public in Hong Kong (except if permitted to do so under the laws of Hong Kong) other than with respect to shares which are or are intended to be disposed of only to persons outside Hong Kong or only to “professional investors” within the meaning of the Securities and Futures Ordinance (Cap. 571, Laws of Hong Kong) and any rules made thereunder.
Notice to Residents of Singapore
This prospectus has not been registered as a prospectus with the Monetary Authority of Singapore. Accordingly, this prospectus and any other document or material in connection with the offer or sale, or invitation for subscription or purchase, of the shares may not be circulated or distributed, nor may the shares be offered or sold, or be made the subject of an invitation for subscription or purchase, whether directly or indirectly, to persons in Singapore other than (i) to an institutional investor under Section 274 of the Securities and Futures Act, Chapter 289 of Singapore (the “SFA”), (ii) to a relevant person, or any person pursuant to
Section 275(1A), and in accordance with the conditions, specified in Section 275 of the SFA or (iii) otherwise pursuant to, and in accordance with the conditions of, any other applicable provision of the SFA.
Where the shares are subscribed or purchased under Section 275 by a relevant person which is: (a) a corporation (which is not an accredited investor) the sole business of which is to hold investments and the entire share capital of which is owned by one or more individuals, each of whom is an accredited investor; or (b) a trust (where the trustee is not an accredited investor) whose sole purpose is to hold investments and each beneficiary is an accredited investor, shares, debentures and units of shares and debentures of that corporation or the beneficiaries’ rights and interest in that trust shall not be transferable for 6 months after that corporation or that trust has acquired the shares under Section 275 except: (1) to an institutional investor under Section 274 of the SFA or to a relevant person, or any person pursuant to Section 275(1A), and in accordance with the conditions specified in Section 275 of the SFA; (2) where no consideration is given for the transfer; or (3) by operation of law.
Notice to Residents of Japan
The securities have not been and will not be registered under the Financial Instruments and Exchange Law of Japan (the Financial Instruments and Exchange Law) and each underwriter has agreed that it will not offer or sell any securities, directly or indirectly, in Japan or to, or for the benefit of, any resident of Japan (which term as used herein means any person resident in Japan, including any corporation or other entity organized under the laws of Japan), or to others for re-offering or resale, directly or indirectly, in Japan or to a resident of Japan, except pursuant to an exemption from the registration requirements of, and otherwise in compliance with, the Financial Instruments and Exchange Law and any other applicable laws, regulations and ministerial guidelines of Japan.
VALIDITY OF ORDINARY SHARES
The validity of the issuance of the ordinary shares offered hereby will be passed upon for us by Carey Olsen, Jersey, Channel Islands. Certain other matters will be passed upon for us by Davis Polk & Wardwell LLP, New York, New York. Certain legal matters in connection with this offering will be passed upon for the underwriters by Skadden, Arps, Slate, Meagher & Flom LLP, New York, New York.
EXPERTS
The balance sheet of Delphi Automotive PLC as of May 19, 2011, and the consolidated financial statements and schedule of Delphi Automotive LLP as of December 31, 2010 and 2009 and for the year ended December 31, 2010 and the period from August 19, 2009 through December 31, 2009 and the Predecessor for the period from January 1, 2009 through October 6, 2009 and the year ended December 31, 2008 included in this prospectus and registration statement have been audited by Ernst & Young LLP, independent registered public accounting firm, as stated in their reports thereon appearing elsewhere herein, and are included in reliance upon such reports given on the authority of such firm as experts in accounting and auditing.
WHERE YOU CAN FIND MORE INFORMATION
We have filed with the SEC a registration statement on Form S-1 under the Securities Act with respect to the ordinary shares offered hereby. This prospectus does not contain all of the information set forth in the registration statement and the exhibits and schedules thereto. For further information with respect to the Company and its ordinary shares, reference is made to the registration statement and the exhibits and any schedules filed therewith. Statements contained in this prospectus as to the contents of any contract or other
document referred to are not necessarily complete and in each instance, if such contract or document is filed as an exhibit, reference is made to the copy of such contract or other document filed as an exhibit to the registration statement, each statement being qualified in all respects by such reference. A copy of the registration statement, including the exhibits and schedules thereto, may be read and copied at the SEC’s Public Reference Room at 100 F Street, N.E., Washington, D.C. 20549. Information on the operation of the Public Reference Room may be obtained by calling the SEC at 1-800-SEC-0330. In addition, the SEC maintains an Internet website that contains reports, proxy statements and other information about issuers, like us, that file electronically with the SEC. The address of that site is www.sec.gov.
As a result of the offering, we will become subject to the full informational requirements of the Securities Exchange Act of 1934, as amended. We will fulfill our obligations with respect to such requirements by filing periodic reports and other information with the SEC. We intend to furnish our shareholders with annual reports containing consolidated financial statements certified by an independent public accounting firm. We also maintain an Internet site at www.delphi.com. Our website and the information contained therein or connected thereto shall not be deemed to be incorporated into this prospectus or the registration statement of which it forms a part.
INDEX TO CONSOLIDATED FINANCIAL STATEMENTS
| | | | |
Delphi Automotive PLC Balance Sheet | | | | |
| |
Report of Independent Registered Public Accounting Firm | | | F-2 | |
Delphi Automotive PLC Balance Sheet as of May 19, 2011 | | | F-3 | |
Note to Balance Sheet | | | F-4 | |
| |
Delphi Automotive LLP Audited Consolidated Financial Statements | | | | |
| |
Report of Independent Registered Public Accounting Firm | | | F-5 | |
Consolidated Statements of Operations of Delphi Automotive LLP (Successor) for the year ended December 31, 2010 and the period from August 19, 2009 to December 31, 2009 and Delphi Corporation (Predecessor) for the period from January 1, 2009 to October 6, 2009 and the year ended December 31, 2008 | | | F-6 | |
Consolidated Balance Sheets of Delphi Automotive LLP (Successor) as of December 31, 2010 and December 31, 2009 | | | F-7 | |
Consolidated Statements of Cash Flows of Delphi Automotive LLP (Successor) for the year ended December 31, 2010 and the period from August 19, 2009 to December 31, 2009 and Delphi Corporation (Predecessor) for the period from January 1, 2009 to October 6, 2009 and the year ended December 31, 2008 | | | F-8 | |
Consolidated Statements of Stockholders’ Equity (Deficit) and Comprehensive Income (Loss) of Delphi Corporation (Predecessor) for the period from January 1, 2009 to October 6, 2009 and the years ended December 31, 2008 and 2007 | | | F-10 | |
Consolidated Statements of Owners’ Equity and Comprehensive Income of Delphi Automotive LLP (Successor) for the year ended December 31, 2010 and the period from August 19, 2009 to December 31, 2009 | | | F-11 | |
Notes to Consolidated Financial Statements | | | F-12 | |
Schedule II – Valuation and Qualifying Accounts and Reserves Schedule for the year ended December 31, 2010, the period from August 19 to December 31, 2009, the period from January 1 to October 6, 2009 and the year ended December 31, 2008 | | | F-77 | |
| |
Delphi Automotive LLP Unaudited Consolidated Financial Statements | | | | |
| |
Consolidated Statements of Operations of Delphi Automotive LLP for the three and six months ended March 31,June 30, 2011 and 2010 (Unaudited) | | | F-78 | |
Consolidated Balance Sheets of Delphi Automotive LLP as of March 31,June 30, 2011 (Unaudited) and December 31, 2010 | | | F-79 | |
Consolidated Statements of Cash Flows of Delphi Automotive LLP for the threesix months ended March 31,June 30, 2011 and 2010 (Unaudited) | | | F-80 | |
Consolidated Statements of Comprehensive Income of Delphi Automotive LLP for the three and six months ended March 31,June 30, 2011 and 2010 (Unaudited) | | | F-81 | |
Consolidated Statement of Owners’ Equity of Delphi Automotive LLP for the threesix months ended March 31,June 30, 2011 (Unaudited) | | | F-82 | |
Notes to Consolidated Financial Statements | | | F-83 | |
Report of Independent Registered Public Accounting Firm
To the Board of Directors of Delphi Automotive PLC:
We have audited the accompanying balance sheet of Delphi Automotive PLC (the “Company”) as of May 19, 2011. This balance sheet is the responsibility of the Company’s management. Our responsibility is to express an opinion on this balance sheet based on our audit.
We conducted our audit in accordance with the standards of the Public Company Accounting Oversight Board (United States). Those standards require that we plan and perform the audit to obtain reasonable assurance about whether the balance sheet is free of material misstatement. We were not engaged to perform an audit of the Company’s internal control over financial reporting. Our audit included consideration of internal control over financial reporting as a basis for designing audit procedures that are appropriate in the circumstances, but not for the purpose of expressing an opinion on the effectiveness of the Company’s internal control over financial reporting. Accordingly, we express no such opinion. An audit also includes examining, on a test basis, evidence supporting the amounts and disclosures in the balance sheet, assessing the accounting principles used and significant estimates made by management, and evaluating the overall balance sheet presentation. We believe that our audit of the balance sheet provides a reasonable basis for our opinion.
In our opinion, the balance sheet referred to above presents fairly, in all material respects, the financial position of Delphi Automotive PLC at May 19, 2011, in conformity with U.S. generally accepted accounting principles.
| | |
/s/ Ernst & Young LLP | | |
| Detroit, Michigan | | |
| May 23, 2011 | | |
DELPHI AUTOMOTIVE PLC
BALANCE SHEET
| | | | |
| | | May 19,
2011 | |
ASSETS | | | | |
Cash and cash equivalents | | $ | 0.02 | |
| | | | |
| |
Total assets | | $ | 0.02 | |
| | | | |
| |
SHAREHOLDERS’ EQUITY | | | | |
| |
Shareholders’ equity: | | | | |
Ordinary shares, $0.01 par value per share, 10,000 shares authorized, 2 shares issued and outstanding | | $ | 0.02 | |
Additional paid-in capital | | | 0.00 | |
| | | | |
Total shareholders’ equity | | $ | 0.02 | |
| | | | |
See accompanying note to the balance sheet.
DELPHI AUTOMOTIVE PLC
NOTE TO BALANCE SHEET
In connection with this offering, Delphi Automotive PLC, a Jersey corporation, was formed on May 19, 2011. Delphi Automotive PLC has nominal assets and no liabilities and has conducted no operations. Immediately prior to the closing of this offering, it will acquire all of the outstanding unitsmembership interests of Delphi Automotive LLP from its existing unitequity holders in exchange for ordinary shares and, as a result, Delphi Automotive LLP will become a wholly-owned subsidiary of Delphi Automotive PLC.
Other than the initial capitalization of Delphi Automotive PLC, no other business has been transacted.
Subsequent Events - Delphi Automotive PLC has evaluated all events that have occurred subsequent to May 19, 2011 through May 23, 2011 (the date the financial statements were available to be issued).
Report of Independent Registered Public Accounting Firm
To the Board of Managers of Delphi Automotive LLP:
We have audited the accompanying consolidated balance sheets of Delphi Automotive LLP (Successor) as of December 31, 2010 and 2009, and the related consolidated statements of operations, owners’ equity/stockholders’ deficit and comprehensive income (loss), and cash flows for the year ended December 31, 2010 and the period from August 19, 2009 to December 31, 2009, and of the former Delphi Corporation (now known as DPH Holdings Corp.) (Predecessor) for the period from January 1, 2009 to October 6, 2009 and the year ended December 31, 2008. Our audits also included the financial statement schedule listed in the Index as Schedule II. These financial statements and schedule are the responsibility of the Company’s management. Our responsibility is to express an opinion on these financial statements and schedule based on our audits.
We conducted our audits in accordance with the standards of the Public Company Accounting Oversight Board (United States). Those standards require that we plan and perform the audit to obtain reasonable assurance about whether the financial statements are free of material misstatement. An audit includes examining, on a test basis, evidence supporting the amounts and disclosures in the financial statements. An audit also includes assessing the accounting principles used and significant estimates made by management, as well as evaluating the overall financial statement presentation. We believe that our audits provide a reasonable basis for our opinion.
In our opinion, the financial statements referred to above present fairly, in all material respects, the consolidated financial position of Delphi Automotive LLP (Successor) at December 31, 2010 and 2009 and the consolidated results of its operations and its cash flows for the year ended December 31, 2010 and the period from August 19, 2009 to December 31, 2009, and of the former Delphi Corporation (now known as DPH Holdings Corp.) (Predecessor) for the period from January 1, 2009 to October 6, 2009 and year ended December 31, 2008, in conformity with U.S. generally accepted accounting principles. Also, in our opinion, the related financial statement schedule, when considered in relation to the basic financial statements taken as a whole, presents fairly in all material respects the information set forth therein.
As discussed in Note 1 to the consolidated financial statements, the Successor acquired the automotive supply business (other than the global steering business and the UAW manufacturing facilities in the U.S.) of the Predecessor on October 6, 2009. Accordingly, the accompanying consolidated financial statements have been prepared in conformity with ASC 805, “Business Combinations,” for the Successor as a new entity with assets, liabilities and a capital structure not comparable to prior periods.
As discussed in Note 2 to the consolidated financial statements, in 2009, the Predecessor changed its method of accounting for consolidated net income (loss) attributed to the parent and non-controlling interests.
| | |
/s/ Ernst & Young LLP | | |
Detroit, Michigan February 18, 2011 | | |
DELPHI AUTOMOTIVE LLP
CONSOLIDATED STATEMENTS OF OPERATIONS
| | | | | | | | | | | | | | | | | | |
| | | Successor | | | | | Predecessor | |
| | | Year ended
December 31,
2010 | | | Period from
August 19 to
December 31,
2009 | | | | | Period from
January 1 to
October 6, 2009 | | | Year ended
December 31,
2008 | |
| | | (in millions) | | | | | (in millions) | |
Net sales: | | $ | 13,817 | | | $ | 3,421 | | | | | $ | 8,334 | | | $ | 16,808 | |
| | | | | |
Operating expenses: | | | | | | | | | | | | | | | | | | |
Cost of sales | | | 11,768 | | | | 3,047 | | | | | | 8,480 | | | | 16,157 | |
Selling, general and administrative | | | 815 | | | | 242 | | | | | | 734 | | | | 1,420 | |
Amortization (Note 8) | | | 70 | | | | 16 | | | | | | 3 | | | | 5 | |
Goodwill impairment (Note 8) | | | — | | | | — | | | | | | — | | | | 325 | |
Restructuring | | | 224 | | | | 126 | | | | | | 235 | | | | 326 | |
| | | | | | | | | | | | | | | | | | |
Total operating expenses | | | 12,877 | | | | 3,431 | | | | | | 9,452 | | | | 18,233 | |
| | | | | | | | | | | | | | | | | | |
| | | | | |
Operating income (loss) | | | 940 | | | | (10 | ) | | | | | (1,118 | ) | | | (1,425 | ) |
Interest expense (Note 2) | | | (30 | ) | | | (8 | ) | | | | | — | | | | (434 | ) |
Other income (expense), net (Note 19) | | | 34 | | | | (17 | ) | | | | | 24 | | | | 9 | |
Reorganization items, net (Note 1) | | | — | | | | — | | | | | | 10,210 | | | | 5,147 | |
| | | | | | | | | | | | | | | | | | |
| | | | | |
Income (loss) from continuing operations before income taxes and equity income (loss) | | | 944 | | | | (35 | ) | | | | | 9,116 | | | | 3,297 | |
Income tax (expense) benefit | | | (258 | ) | | | 27 | | | | | | 311 | | | | (163 | ) |
| | | | | | | | | | | | | | | | | | |
| | | | | |
Income (loss) from continuing operations before equity income (loss) | | | 686 | | | | (8 | ) | | | | | 9,427 | | | | 3,134 | |
Equity income (loss), net of tax | | | 17 | | | | 5 | | | | | | (36 | ) | | | 29 | |
| | | | | | | | | | | | | | | | | | |
| | | | | |
Income (loss) from continuing operations | | | 703 | | | | (3 | ) | | | | | 9,391 | | | | 3,163 | |
Loss from discontinued operations, net of tax | | | — | | | | — | | | | | | (44 | ) | | | (97 | ) |
| | | | | | | | | | | | | | | | | | |
| | | | | |
Net income (loss) | | | 703 | | | | (3 | ) | | | | | 9,347 | | | | 3,066 | |
Net income attributable to noncontrolling interest | | | 72 | | | | 15 | | | | | | 29 | | | | 29 | |
| | | | | | | | | | | | | | | | | | |
Net income (loss) attributable to Successor/Predecessor | | $ | 631 | | | $ | (18 | ) | | | | $ | 9,318 | | | $ | 3,037 | |
| | | | | | | | | | | | | | | | | | |
| | | | | |
Amounts attributable to Successor/Predecessor: | | | | | | | | | | | | | | | | | | |
Income (loss) from continuing operations | | $ | 631 | | | $ | (18 | ) | | | | $ | 9,363 | | | $ | 3,134 | |
Discontinued operations (Note 21) | | | — | | | | — | | | | | | (45 | ) | | | (97 | ) |
| | | | | | | | | | | | | | | | | | |
Net income (loss) attributable to Successor/Predecessor | | $ | 631 | | | $ | (18 | ) | | | | $ | 9,318 | | | $ | 3,037 | |
| | | | | | | | | | | | | | | | | | |
| | | | | |
Net income (loss) attributable to membership interest: | | | | | | | | | | | | | | | | | | |
Class A | | $ | 114 | | | $ | (3 | ) | | | | | — | | | | — | |
Class B | | | 410 | | | | (12 | ) | | | | | — | | | | — | |
Class C | | | 107 | | | | (3 | ) | | | | | — | | | | — | |
Class E-1 | | | — | | | | — | | | | | | — | | | | — | |
| | | | | | | | | | | | | | | | | | |
Total | | $ | 631 | | | $ | (18 | ) | | | | $ | 9,318 | | | $ | 3,037 | |
| | | | | | | | | | | | | | | | | | |
| | | | | |
Net income (loss) per membership interests unit | | | | | | | | | | | | | | | | | | |
Class A | | $ | 65.35 | | | $ | (1.80 | ) | | | | | — | | | | — | |
Class B | | | 1,156.98 | | | | (33.00 | ) | | | | | — | | | | — | |
Class C | | | 1,064.88 | | | | (31.50 | ) | | | | | — | | | | — | |
Class E-1 | | | — | | | | — | | | | | | — | | | | — | |
Basic and diluted income (loss) per share | | | | | | | | | | | | | | | | | | |
Continuing operations | | | — | | | | — | | | | | $ | 16.58 | | | $ | 5.55 | |
Discontinued operations | | | — | | | | — | | | | | | (0.08 | ) | | | (0.17 | ) |
| | | | | | | | | | | | | | | | | | |
Basic and diluted income (loss) per share | | | — | | | | — | | | | | $ | 16.50 | | | $ | 5.38 | |
| | | | | | | | | | | | | | | | | | |
See notes to consolidated financial statements.
DELPHI AUTOMOTIVE LLP
CONSOLIDATED BALANCE SHEETS
| | | | | | | | |
| | | Successor | |
| | | December 31, | |
| | | 2010 | | | 2009 | |
| | | (in millions) | |
ASSETS | | | | | | | | |
Current assets: | | | | | | | | |
Cash and cash equivalents | | $ | 3,219 | | | $ | 3,107 | |
Restricted cash (Note 2) | | | 47 | | | | 96 | |
Time deposits | | | 550 | | | | — | |
Accounts receivable, net | | | 2,307 | | | | 2,213 | |
Inventories (Note 4) | | | 988 | | | | 876 | |
Other current assets (Note 5) | | | 555 | | | | 543 | |
| | | | | | | | |
Total current assets | | | 7,666 | | | | 6,835 | |
| | |
Long-term assets: | | | | | | | | |
Property, net (Note 7) | | | 2,067 | | | | 1,960 | |
Investments in affiliates (Note 6) | | | 281 | | | | 270 | |
Intangible assets, net (Note 8) | | | 665 | | | | 750 | |
Other long-term assets (Note 5) | | | 403 | | | | 492 | |
| | | | | | | | |
Total long-term assets | | | 3,416 | | | | 3,472 | |
| | | | | | | | |
| | |
Total assets | | $ | 11,082 | | | $ | 10,307 | |
| | | | | | | | |
| | |
LIABILITIES AND OWNERS’ EQUITY | | | | | | | | |
Current liabilities: | | | | | | | | |
Short-term debt (Note 12) | | $ | 218 | | | $ | 302 | |
Accounts payable | | | 2,236 | | | | 1,872 | |
Accrued liabilities (Note 9) | | | 1,265 | | | | 1,252 | |
| | | | | | | | |
Total current liabilities | | | 3,719 | | | | 3,426 | |
| | |
Long-term liabilities: | | | | | | | | |
Pension and other postretirement benefit obligations (Note 14) | | | 677 | | | | 811 | |
Other long-term liabilities (Note 9) | | | 587 | | | | 704 | |
| | | | | | | | |
Total long-term liabilities | | | 1,264 | | | | 1,515 | |
| | | | | | | | |
| | |
Total liabilities | | | 4,983 | | | | 4,941 | |
| | | | | | | | |
| | |
Commitments and contingencies (Note 15) | | | | | | | | |
| | |
Owners’ equity: | | | | | | | | |
Membership interests (Note 17) | | | 5,550 | | | | 4,914 | |
Accumulated other comprehensive income (loss): | | | | | | | | |
Employee benefit plans (Note 14) | | | 59 | | | | 33 | |
Other | | | 32 | | | | (9 | ) |
| | | | | | | | |
Total accumulated other comprehensive income | | | 91 | | | | 24 | |
| | | | | | | | |
Total Delphi owners’ equity | | | 5,641 | | | | 4,938 | |
Noncontrolling interest | | | 458 | | | | 428 | |
| | | | | | | | |
| | |
Total owners’ equity | | | 6,099 | | | | 5,366 | |
| | | | | | | | |
Total liabilities and owners’ equity | | $ | 11,082 | | | $ | 10,307 | |
| | | | | | | | |
See notes to consolidated financial statements.
DELPHI AUTOMOTIVE LLP
CONSOLIDATED STATEMENTS OF CASH FLOWS
| | | | | | | | | | | | | | | | | | |
| | | Successor | | | | | Predecessor | |
| | | Year ended
December 31, | | | Period from
August 19 to
December 31, | | | | | Period from
January 1 to
October 6, | | | Year ended
December 31, | |
| | | 2010 | | | 2009 | | | | | 2009 | | | 2008 | |
| | | (in millions) | | | | | (in millions) | |
Cash flows from operating activities: | | | | | | | | | | | | | | | | | | |
Net income (loss) | | $ | 703 | | | $ | (3 | ) | | | | $ | 9,347 | | | $ | 3,066 | |
Adjustments to reconcile net income (loss) to net cash provided by (used in) operating activities: | | | | | | | | | | | | | | | | | | |
Depreciation | | | 351 | | | | 123 | | | | | | 537 | | | | 817 | |
Amortization | | | 70 | | | | 16 | | | | | | 3 | | | | 5 | |
Restructuring expense, net of cash paid | | | (67 | ) | | | (23 | ) | | | | | 57 | | | | (123 | ) |
Goodwill impairment | | | — | | | | — | | | | | | — | | | | 325 | |
Deferred income taxes | | | (14 | ) | | | (93 | ) | | | | | (380 | ) | | | (15 | ) |
Pension and other postretirement benefit expenses | | | 59 | | | | 23 | | | | | | 315 | | | | 598 | |
Equity (income) loss, net of dividends received | | | (7 | ) | | | (5 | ) | | | | | 44 | | | | (18 | ) |
Reorganization items (Note 3) | | | — | | | | — | | | | | | (10,210 | ) | | | (5,147 | ) |
GM settlement (Note 3) | | | — | | | | — | | | | | | — | | | | (189 | ) |
GM warranty settlement (Note 15) | | | — | | | | — | | | | | | — | | | | (56 | ) |
U.S. employee workforce transition program charges | | | — | | | | — | | | | | | — | | | | 69 | |
Loss on extinguishment of debt | | | 8 | | | | — | | | | | | — | | | | 49 | |
(Gain) loss on investments / assets held for sale | | | (20 | ) | | | — | | | | | | 3 | | | | (8 | ) |
Changes in operating assets and liabilities: | | | | | | | | | | | | | | | | | | |
Accounts receivable, net | | | (184 | ) | | | (85 | ) | | | | | 122 | | | | 1,168 | |
Inventories | | | (130 | ) | | | 40 | | | | | | 149 | | | | 416 | |
Other current assets | | | 66 | | | | 138 | | | | | | 154 | | | | 230 | |
Accounts payable | | | 354 | | | | 277 | | | | | | (123 | ) | | | (457 | ) |
Accrued and other long-term liabilities | | | 88 | | | | (94 | ) | | | | | (353 | ) | | | (375 | ) |
Other, net | | | (19 | ) | | | (111 | ) | | | | | 223 | | | | (215 | ) |
U.S. employee workforce transition program payments, net of reimbursement by GM | | | — | | | | — | | | | | | (28 | ) | | | (219 | ) |
Pension contributions and other postretirement benefit payments | | | (117 | ) | | | (44 | ) | | | | | (111 | ) | | | (599 | ) |
(Payments) receipts for GM settlement and reorganization items, net | | | — | | | | — | | | | | | (70 | ) | | | 1,115 | |
Other, net | | | 1 | | | | — | | | | | | (4 | ) | | | — | |
Discontinued operations (Note 21) | | | — | | | | — | | | | | | 68 | | | | 18 | |
| | | | | | | | | | | | | | | | | | |
Net cash provided by (used in) operating activities | | | 1,142 | | | | 159 | | | | | | (257 | ) | | | 455 | |
| | | | | | | | | | | | | | | | | | |
| | | | | |
Cash flows from investing activities: | | | | | | | | | | | | | | | | | | |
Capital expenditures | | | (500 | ) | | | (88 | ) | | | | | (321 | ) | | | (771 | ) |
Purchase of time deposits | | | (750 | ) | | | — | | | | | | — | | | | — | |
Maturity of time deposits | | | 200 | | | | — | | | | | | — | | | | — | |
Proceeds from sale of property | | | 22 | | | | — | | | | | | 20 | | | | 53 | |
Proceeds from divestitures, net | | | 71 | | | | 74 | | | | | | 16 | | | | 133 | |
Decrease (increase) in restricted cash | | | 49 | | | | 28 | | | | | | 142 | | | | (230 | ) |
Cash acquired from Delphi Corporation | | | — | | | | 862 | | | | | | (862 | ) | | | — | |
Other, net | | | (3 | ) | | | 9 | | | | | | (11 | ) | | | (36 | ) |
Discontinued operations | | | — | | | | — | | | | | | (36 | ) | | | (107 | ) |
| | | | | | | | | | | | | | | | | | |
Net cash (used in) provided by investing activities | | | (911 | ) | | | 885 | | | | | | (1,052 | ) | | | (958 | ) |
| | | | | | | | | | | | | | | | | | |
| | | | | |
Cash flows from financing activities: | | | | | | | | | | | | | | | | | | |
(Repayments of) proceeds from amended and restated debtor-in-possession facility | | | — | | | | — | | | | | | (244 | ) | | | 3,528 | |
| | | | | | | | | | | | | | | | | | |
| | | Successor | | | | | Predecessor | |
| | | Year ended
December 31, | | | Period from
August 19 to
December 31, | | | | | Period from
January 1 to
October 6, | | | Year ended
December 31, | |
| | | 2010 | | | 2009 | | | | | 2009 | | | 2008 | |
| | | (in millions) | | | | | (in millions) | |
Net repayments of borrowings from refinanced debtor-in-possession facility | | | — | | | | — | | | | | | — | | | | (2,746 | ) |
Accommodation agreement issuance costs | | | — | | | | — | | | | | | (40 | ) | | | (58 | ) |
Net borrowings under GM liquidity support agreements | | | — | | | | — | | | | | | 850 | | | | — | |
Net repayments under other short-term debt agreements | | | (49 | ) | | | (21 | ) | | | | | (244 | ) | | | (202 | ) |
Repayments under long-term debt agreements | | | (50 | ) | | | — | | | | | | — | | | | — | |
Proceeds from issuance of membership interests | | | — | | | | 2,042 | | | | | | — | | | | — | |
Proceeds from issuance of five-year notes | | | — | | | | 41 | | | | | | — | | | | — | |
Dividend payments of consolidated affiliates to minority shareholders | | | (27 | ) | | | — | | | | | | (13 | ) | | | (47 | ) |
Discontinued operations | | | — | | | | — | | | | | | 6 | | | | (10 | ) |
| | | | | | | | | | | | | | | | | | |
Net cash (used in) provided by financing activities | | | (126 | ) | | | 2,062 | | | | | | 315 | | | | 465 | |
| | | | | | | | | | | | | | | | | | |
| | | | | |
Effect of exchange rate fluctuations on cash and cash equivalents | | | 7 | | | | 1 | | | | | | 35 | | | | (39 | ) |
| | | | | | | | | | | | | | | | | | |
| | | | | |
Increase (decrease) in cash and cash equivalents | | | 112 | | | | 3,107 | | | | | | (959 | ) | | | (77 | ) |
Cash and cash equivalents at beginning of period | | | 3,107 | | | | — | | | | | | 959 | | | | 1,036 | |
| | | | | | | | | | | | | | | | | | |
Cash and cash equivalents at end of period | | $ | 3,219 | | | $ | 3,107 | | | | | $ | — | | | $ | 959 | |
| | | | | | | | | | | | | | | | | | |
See notes to consolidated financial statements.
DELPHI AUTOMOTIVE LLP
PREDECESSOR CONSOLIDATED STATEMENTS OF STOCKHOLDERS’ EQUITY (DEFICIT) AND COMPREHENSIVE INCOME (LOSS)
| | | | | | | | | | | | | | | | | | | | | | | | | | | | | | | | | | | | | | | | |
| | | | | | Additional
Paid-in
Capital | | | Retained
Earnings
(Accumulated
Deficit) | | | Accumulated Other
Comprehensive Loss | | | Treasury
Stock | | | Non-
controlling
Interest | | | Total
Stockholders’
equity
(Deficit) | |
| | | Common
Stock | | | | | Employee
Benefit
Plans | | | Other | | | Total | | | | |
| | | Shares | | | Amount | | | | | | | | | |
| | | (in millions) | |
Balance at December 31, 2007 | | | 565 | | | $ | 6 | | | $ | 2,756 | | | $ | (14,976 | ) | | $ | (1,679)(a) | | | $ | 467(b) | | | $ | (1,212 | ) | | $ | (25 | ) | | $ | 167 | | | $ | (13,284 | ) |
| | | | | | | | | | | | | | | | | | | | | | | | | | | | | | | | | | | | | | | | |
Adoption of FASB 158, net of tax | | | — | | | | — | | | | — | | | | (125 | ) | | | (12) | | | | — | | | | (12 | ) | | | — | | | | — | | | | (137 | ) |
| | | | | | | | | | | | | | | | | | | | | | | | | | | | | | | | | | | | | | | | |
Balance at January 1, 2008 | | | 565 | | | $ | 6 | | | $ | 2,756 | | | $ | (15,101 | ) | | $ | (1,691) | | | $ | 467 | | | $ | (1,224 | ) | | $ | (25 | ) | | $ | 167 | | | $ | (13,421 | ) |
| | | | | | | | | | | | | | | | | | | | | | | | | | | | | | | | | | | | | | | | |
Net income | | | — | | | | — | | | | — | | | | 3,037 | | | | — | | | | — | | | | — | | | | — | | | | 29 | | | | 3,066 | |
Currency translation adjustments and other, net of tax | | | — | | | | — | | | | — | | | | — | | | | — | | | | (440) | | | | (440 | ) | | | — | | | | (1 | ) | | | (441 | ) |
Net change in unrecognized loss on derivative instruments, net of tax | | | — | | | | — | | | | — | | | | — | | | | — | | | | (246) | | | | (246 | ) | | | — | | | | — | | | | (246 | ) |
Employee benefit plans liability adjustment, net of tax | | | — | | | | — | | | | — | | | | — | | | | (3,176) | | | | — | | | | (3,176 | ) | | | — | | | | — | | | | (3,176 | ) |
| | | | | | | | | | | | | | | | | | | | | | | | | | | | | | | | | | | | | | | | |
Total comprehensive loss | | | | | | | | | | | | | | | | | | | | | | | | | | | | | | | | | | | | | | | (797 | ) |
Share-based compensation expense | | | — | | | | — | | | | 10 | | | | — | | | | — | | | | — | | | | — | | | | — | | | | — | | | | 10 | |
Other | | | — | | | | — | | | | — | | | | — | | | | — | | | | — | | | | — | | | | — | | | | (26 | ) | | | (26 | ) |
Dividends | | | — | | | | — | | | | — | | | | — | | | | — | | | | — | | | | — | | | | — | | | | (32 | ) | | | (32 | ) |
Treasury shares issued | | | — | | | | — | | | | (19 | ) | | | — | | | | — | | | | — | | | | — | | | | 19 | | | | — | | | | — | |
| | | | | | | | | | | | | | | | | | | | | | | | | | | | | | | | | | | | | | | | |
Balance at December 31, 2008 | | | 565 | | | $ | 6 | | | $ | 2,747 | | | $ | (12,064 | ) | | $ | (4,867)(a) | | | $ | (219)(b) | | | $ | (5,086 | ) | | $ | (6 | ) | | $ | 137 | | | $ | (14,266 | ) |
| | | | | | | | | | | | | | | | | | | | | | | | | | | | | | | | | | | | | | | | |
Net income | | | — | | | | — | | | | — | | | | 9,318 | | | | — | | | | — | | | | — | | | | — | | | | 29 | | | | 9,347 | |
Currency translation adjustments and other, net of tax | | | — | | | | — | | | | — | | | | — | | | | — | | | | 170 | | | | 170 | | | | — | | | | 1 | | | | 171 | |
Net change in unrecognized loss on derivative instruments, net of tax | | | — | | | | — | | | | — | | | | — | | | | — | | | | 42 | | | | 42 | | | | — | | | | — | | | | 42 | |
Employee benefit plans liability adjustment, net of tax | | | — | | | | — | | | | — | | | | — | | | | 4,733 | | | | — | | | | 4,733 | | | | — | | | | — | | | | 4,733 | |
| | | | | | | | | | | | | | | | | | | | | | | | | | | | | | | | | | | | | | | | |
Total comprehensive income | | | | | | | | | | | | | | | | | | | | | | | | | | | | | | | | | | | | | | | 14,293 | |
Deconsolidation of noncontrolling interest | | | — | | | | — | | | | — | | | | — | | | | — | | | | — | | | | — | | | | — | | | | (7 | ) | | | (7 | ) |
Dividends | | | — | | | | — | | | | — | | | | — | | | | — | | | | — | | | | — | | | | — | | | | (20 | ) | | | (20 | ) |
Impact of the Acquisition | | | (565 | ) | | | (6 | ) | | | (2,747 | ) | | | 2,746 | | | | 134 | | | | 7 | | | | 141 | | | | 6 | | | | (140 | ) | | | — | |
| | | | | | | | | | | | | | | | | | | | | | | | | | | | | | | | | | | | | | | | |
Balance at October 6, 2009 | | | — | | | $ | — | | | $ | — | | | $ | — | | | $ | — | | | $ | — | | | $ | — | | | $ | — | | | $ | — | | | $ | — | |
| | | | | | | | | | | | | | | | | | | | | | | | | | | | | | | | | | | | | | | | |
| a. | Accumulated Other Comprehensive Loss – Employee Benefit Plans includes a loss of $4,867 million (net of a $490 million tax effect), and $1,679 million (net of a $457 million tax effect) for December 31, 2008 and 2007, respectively. |
| b. | Accumulated Other Comprehensive Loss – Other includes a loss of $22 million, and a gain of $415 million for December 31, 2008 and 2007, respectively, within currency translation adjustments and other; and a loss of $194 million and a gain of $52 million for December 31, 2008 and 2007, respectively, within net change in unrecognized gain on derivative instruments; and other loss of $3 million for 2008. |
See notes to consolidated financial statements.
DELPHI AUTOMOTIVE LLP
SUCCESSOR CONSOLIDATED STATEMENTS OF OWNERS’ EQUITY AND COMPREHENSIVE INCOME
| | | | | | | | | | | | | | | | | | | | | | | | | | | | | | | | | | | | | | |
| | | Membership Interests | | | Accumulated
Other
Comprehensive
Income (Loss) | | | | | Total Delphi
Owners’
Equity | | | Noncontrolling
Interest | | | Total
Owners’
Equity | |
| | Class A | | | Class B | | | Class C | | | Class E-1 | | | Total | | | | | | |
| | | (in millions) | |
Balance at August 19, 2009 | | $ | — | | | $ | — | | | $ | — | | | $ | — | | | $ | — | | | $ | — | | | | | $ | — | | | $ | — | | | $ | — | |
Net income (loss) | | | (3 | ) | | | (12 | ) | | | (3 | ) | | | — | | | | (18 | ) | | | — | | | | | | (18 | ) | | | 15 | | | | (3 | ) |
Currency translation adjustments and other, net of tax of $0 million | | | — | | | | — | | | | — | | | | — | | | | — | | | | (14) | | | (a) | | | (14 | ) | | | (2 | ) | | | (16 | ) |
Net change in unrecognized income on derivative instruments, net of tax of $0 million | | | — | | | | — | | | | — | | | | — | | | | — | | | | 5 | | | (b) | | | 5 | | | | — | | | | 5 | |
Employee benefit plans liability adjustment, net of tax of $10 million | | | — | | | | — | | | | — | | | | — | | | | — | | | | 33 | | | (c) | | | 33 | | | | — | | | | 33 | |
| | | | | | | | | | | | | | | | | | | | | | | | | | | | | | | | | | | | | | |
Total comprehensive income | | | | | | | | | | | | | | | | | | | | | | | | | | | | | 6 | | | | 13 | | | | 19 | |
Issuance of membership interests (Note 17) | | | 1,972 | | | | 2,418 | | | | 542 | | | | — | | | | 4,932 | | | | — | | | | | | 4,932 | | | | — | | | | 4,932 | |
Impact of the Acquisition (Note 1) | | | — | | | | — | | | | — | | | | — | | | | — | | | | — | | | | | | — | | | | 415 | | | | 415 | |
| | | | | | | | | | | | | | | | | | | | | | | | | | | | | | | | | | | |
Balance at December 31, 2009 | | $ | 1,969 | | | $ | 2,406 | | | $ | 539 | | | $ | — | | | $ | 4,914 | | | $ | 24 | | | (d) | | $ | 4,938 | | | $ | 428 | | | $ | 5,366 | |
| | | | | | | | | | | | | | | | | | | | | | | | | | | | | | | | | | | |
Net income | | | 114 | | | | 410 | | | | 107 | | | | — | | | | 631 | | | | — | | | | | | 631 | | | | 72 | | | | 703 | |
Currency translation adjustments and other, net of tax of $0 million | | | — | | | | — | | | | — | | | | — | | | | — | | | | (7) | | | (a) | | | (7 | ) | | | 3 | | | | (4 | ) |
Net change in unrecognized income on derivative instruments, net of tax of $31 million | | | — | | | | — | | | | — | | | | — | | | | — | | | | 48 | | | (b) | | | 48 | | | | — | | | | 48 | |
Employee benefit plans liability adjustment, net of tax of $7 million | | | — | | | | — | | | | — | | | | — | | | | — | | | | 26 | | | (c) | | | 26 | | | | — | | | | 26 | |
| | | | | | | | | | | | | | | | | | | | | | | | | | | | | | | | | | | | | | |
Total comprehensive income | | | | | | | | | | | | | | | | | | | | | | | | | | | | | 698 | | | | 75 | | | | 773 | |
Dividends | | | — | | | | — | | | | — | | | | — | | | | — | | | | — | | | | | | — | | | | (45 | ) | | | (45 | ) |
Restricted interests recognized (Note 22) | | | — | | | | — | | | | — | | | | 5 | | | | 5 | | | | — | | | | | | 5 | | | | — | | | | 5 | |
| | | | | | | | | | | | | | | | | | | | | | | | | | | | | | | | | | | |
Balance at December 31, 2010 | | $ | 2,083 | | | $ | 2,816 | | | $ | 646 | | | $ | 5 | | | $ | 5,550 | | | $ | 91 | | | (d) | | $ | 5,641 | | | $ | 458 | | | $ | 6,099 | |
| | | | | | | | | | | | | | | | | | | | | | | | | | | | | | | | | | | |
| a. | Accumulated Other Comprehensive Income includes a loss of $21 million (net of a $0 million tax effect) and $14 million (net of a $0 million tax effect) of currency translation adjustments and other for the year ended December 31, 2010 and the Successor period from August 19 to December 31, 2009, respectively. |
| b. | Accumulated Other Comprehensive Income includes income of $53 million (net of a $31 million tax effect) and $5 million (net of a $0 million tax effect) of net changes in unrecognized income on derivative instruments for the year ended December 31, 2010 and the Successor period from August 19 to December 31, 2009, respectively. |
| c. | Accumulated Other Comprehensive Income includes income of $59 million (net of a $17 million tax effect) and $33 million (net of a $10 million tax effect) of employee benefit plans liability adjustments for the year ended December 31, 2010 and the Successor period from August 19 to December 31, 2009, respectively. |
| d. | Accumulated Other Comprehensive Income totals $91 million (net of a $48 million tax effect), and $24 million (net of a $10 million tax effect) at December 31, 2010 and 2009, respectively. |
See notes to consolidated financial statements.
DELPHI AUTOMOTIVE LLP
NOTES TO CONSOLIDATED FINANCIAL STATEMENTS
| 1. | GENERAL AND ACQUISITION OF PREDECESSOR BUSINESSES |
Nature of operations—Delphi Automotive LLP, together with its subsidiaries and affiliates (“Delphi,” the “Company” or the “Successor”) is a supplier of vehicle electronics, transportation components, integrated systems and modules, and other electronic technology. Delphi operates globally and has a diverse customer base, including every major vehicle manufacturer.
Bankruptcy filing—On October 8, 2005 (the “Petition Date”), the former Delphi Corporation (now known as DPH Holdings Corp.) and certain of its United States (“U.S.”) subsidiaries (the “Initial Filers”) filed voluntary petitions for reorganization relief under chapter 11 of the United States Bankruptcy Code (the “Bankruptcy Code”) in the United States Bankruptcy Court for the Southern District of New York (the “Court”). The former Delphi Corporation and, as the context may require, its subsidiaries and affiliates, are referred to herein as the “Predecessor.” On October 14, 2005, three additional U.S. subsidiaries of the former Delphi Corporation (together with the Initial Filers, collectively, the “Debtors”) filed voluntary petitions for reorganization relief under chapter 11 of the Bankruptcy Code (collectively the Debtors’ October 8, 2005 and October 14, 2005 filings are referred to herein as the “Chapter 11 Filings”). On July 30, 2009, the Court approved modifications to the First Amended Joint Plan Of Reorganization Of Delphi Corporation And Certain Affiliates, Debtors And Debtors-In-Possession (As Modified)(the “Modified Plan”), which incorporated the master disposition agreement (including all schedules and exhibits thereto, the “MDA”) among the Predecessor, GM Component Holdings LLC, Motors Liquidation Company (“Old GM”), General Motors Company, together with its subsidiaries and affiliates (“GM”) and Delphi, for the sale and purchase of substantially all of the Predecessor’s businesses, and completed the emergence of the Predecessor from chapter 11 in accordance with the Modified Plan. Through October 6, 2009 (the “Acquisition Date”), the Debtors operated their businesses as “debtors-in-possession” under the jurisdiction of the Court and in accordance with the applicable provisions of the Bankruptcy Code and orders of the Court. The Predecessor’s non-U.S. subsidiaries were not included in the Chapter 11 Filings, continued their business operations without supervision from the Court and were not subject to the requirements of the Bankruptcy Code.
General and basis of presentation—Delphi is a limited liability partnership incorporated under the laws of England and Wales on August 19, 2009, for the purpose of acquiring certain assets of the Predecessor.
On the Acquisition Date, the Successor acquired the automotive supply business (other than the global steering business and the manufacturing facilities in the U.S. in which the hourly employees are represented by International Union, United Automobile, Aerospace and Agricultural Implement Workers of America (“UAW”)) of the Predecessor. As a result of the Acquisition, as defined below, Delphi acquired the major portion of the business of the Predecessor and this business constituted the entirety of the operations of the Successor. Accordingly, as required, the financial information set forth herein reflects: (i) the consolidated results of operations and cash flows of the Successor for the year ended December 31, 2010 and the period from its incorporation on August 19, 2009 to December 31, 2009 and of the Predecessor for the period from January 1, 2009 to October 6, 2009 and the year ended December 31, 2008 and (ii) the consolidated financial position of the Successor as of December 31, 2010 and 2009. The Successor had no material or substantive transactions from its incorporation on August 19, 2009 to the Acquisition Date. In accordance with Financial Accounting Standards Board Accounting Standards Codification (“FASB ASC”) 805,Business Combinations, as of the Acquisition Date, the Company recognized and measured the fair value of the identifiable assets acquired and the liabilities assumed from the Predecessor.
The Predecessor adopted the accounting guidance in FASB ASC 852,Reorganizations, effective October 8, 2005 and has segregated in the financial statements for all reporting periods subsequent to such date and through the consummation of the transactions pursuant to the Modified Plan on October 6, 2009, transactions and events that were directly associated with the reorganization from the ongoing operations of the business. The consolidated financial statements of Delphi are not comparable to the consolidated financial statements of the Predecessor due to the effects of the consummation of the Modified Plan and the change in the basis of presentation.
Consummation of the modified plan—On October 6, 2009, the Predecessor (i) consummated the transactions contemplated by the Modified Plan among the Predecessor, GM and Delphi and (ii) emerged from chapter 11 in accordance with the Modified Plan as DPH Holdings Corp. and its subsidiaries and affiliates (“DPHH”), except that two of the Predecessor’s debtor subsidiaries became subsidiaries of Delphi. A summary of significant terms of the Modified Plan follows:
Delphi acquired the businesses (other than the global steering business and the manufacturing facilities in the U.S. in which the hourly employees are represented by the UAW) of the Predecessor pursuant to the MDA, and received $1,833 million from GM, of which $1,689 million was received on the Acquisition Date and $144 million was received during the Successor period from August 19 to December 31, 2009, and $209 million from the debtor-in-possession (“DIP��DIP”) lenders to the Predecessors (collectively, the “Acquisition”).
GM acquired substantially all of the Predecessor’s global steering business and the manufacturing facilities in the U.S. at which the hourly employees were represented by the UAW.
The Predecessor’s debtor-in-possession financing was settled.
The Predecessor’s liabilities subject to compromise were extinguished.
If cumulative distributions to the members of Delphi Automotive LLP exceed $7.2 billion, Delphi, as disbursing agent on behalf of DPHH, is required to pay to the holders of allowed general unsecured claims against the Predecessor, $32.50 for every $67.50 in excess of $7.2 billion distributed to the members of Delphi Automotive LLP, up to a maximum of $300 million.
The Predecessor’s equity holders did not receive recoveries on their claims.
Reorganization items—The accounting guidance in FASB ASC 852 requires reorganization items such as revenues, professional fees directly related to the process of reorganizing the Debtors under chapter 11 of the Bankruptcy Code, realized gains and losses, provisions for losses, and interest income resulting from the reorganization and restructuring of the business to be separately disclosed. Professional fees directly related to the reorganization include fees associated with advisors to the Debtors, unsecured creditors, secured creditors and unions. The Predecessor’s reorganization items consisted of the following:
| | | | | | | | |
| | | Predecessor | |
| | | (Income)/Expense | |
| | | Period from
January 1 to
October 6, 2009 | | | Year ended
December 31,
2008 | |
| | | (in millions) | |
Sale / disposition of the Predecessor | | $ | (794 | ) | | $ | — | |
Extinguishment of liabilities subject to compromise | | | (11,159 | ) | | | — | |
GM Amended GSA settlement (Note 3) | | | — | | | | (5,332 | ) |
PBGC termination of U.S. pension plans (Note 14) | | | 2,818 | | | | — | |
Salaried OPEB settlement (Note 14) | | | (1,168 | ) | | | — | |
Professional fees directly related to reorganization | | | 68 | | | | 107 | |
Write off of previously capitalized EPCA fees and expenses | | | — | | | | 79 | |
Other | | | 25 | | | | (1 | ) |
| | | | | | | | |
Total reorganization items | | $ | (10,210 | ) | | $ | (5,147 | ) |
| | | | | | | | |
Disposition of the Predecessor—The Predecessor sold the automotive supply business (other than the global steering business and the UAW manufacturing facilities in the U.S. which were acquired by GM) to Delphi. Certain assets and liabilities were retained by DPHH and various liabilities were extinguished or settled, including the settlement of approximately $3.3 billion of DIP financing and $850 million outstanding under GM liquidity support agreements. A summary of the debt settled upon consummation of the Modified Plan is included below:
| | | | |
| | | (in millions) | |
First Priority Revolving Credit Facility | | $ | 230 | |
First Priority Term Loan | | | 310 | |
Second Priority Term Loan | | | 2,750 | |
| | | | |
DIP financing | | | 3,290 | |
GM liquidity support agreements | | | 850 | |
| | | | |
Total debt settled | | $ | 4,140 | |
| | | | |
The $794 million of gain from reorganization items for the period from January 1 to October 6, 2009 primarily relate to the extinguishment of liabilities. As these liabilities were extinguished, the respective carrying values, as noted below, were eliminated resulting in a gain from reorganization, as follows:
The extinguishment of accrued liabilities, resulting in a gain from reorganization items for the Predecessor of approximately $525 million. The extinguished accrued liabilities primarily included $260 million in interest accruals related to the Second Priority Term Loan settled under the terms of the Modified Plan and the extinguishment of the $210 million advance on working capital recovery for the global steering business provided in 2008 in connection with the Amended MRA (as defined and further discussed in Note 3. Elements of Predecessor Transformation Plan).
Certain other long-term liabilities, primarily workers’ compensation, that were extinguished as part of the bankruptcy process, resulting in a gain from reorganization of approximately $305 million.
The net other liabilities of the Predecessor that were not acquired by GM or Delphi, resulting in a gain from reorganization for the Predecessor of approximately $20 million.
The acquisition by GM of substantially all of the Predecessor’s global steering business and the manufacturing facilities in the U.S. at which employees were represented by the UAW in Kokomo, Indiana; Rochester, New York; Lockport, New York; and Grand Rapids, Michigan, for no cash consideration paid to Delphi. Under the MDA, in exchange for the sale of these businesses, GM waived certain claims, paid a portion of the DIP loans, agreed to pay certain administrative claims and assumed certain liabilities. The disposition of these businesses by the Predecessor resulted in a loss from reorganization of approximately $56 million.
The following table summarizes the $11,159 million of gain from reorganization items related to the extinguishment of liabilities subject to compromise:
| | | | |
Liabilities Assumed by Delphi: | | | (in millions | ) |
Pension and postretirement obligations | | $ | 68 | |
Cure payments | | | 18 | |
Other | | | 3 | |
| | | | |
Total claims reinstated | | | 89 | |
| | | | |
| |
Liabilities Extinguished: | | | | |
Pension and postretirement obligations | | | 135 | |
Supplemental executive retirement program obligations | | | 117 | |
PBGC general unsecured claim | | | 3,000 | |
GM allowed general unsecured and administrative claims | | | 4,128 | |
Allowed IUE-CWA and USW claims | | | 129 | |
Debt and notes payable (including junior subordinated notes due 2033) | | | 2,375 | |
Accounts payable | | | 731 | |
Securities & ERISA litigation liability | | | 351 | |
Other | | | 193 | |
| | | | |
Total claims extinguished | | | 11,159 | |
| | | | |
Total liabilities subject to compromise assumed by Delphi or retired | | $ | 11,248 | |
| | | | |
Acquisition accounting—Delphi has recorded the assets acquired and the liabilities assumed from the Predecessor at estimated fair values in accordance with the guidance in FASB ASC 820,Fair Value Measurements and Disclosures. The fair values were estimated based on valuations performed by an independent valuation specialist utilizing three generally accepted business valuation approaches: the income, market, and cost approaches. Generally, the income and market approaches were used and weighted by the independent valuation specialists as appropriate. A further description of each approach follows:
| • | | Income Approach: The income approach recognizes the value of an investment is premised on the receipt of future economic benefits. These benefits can include earnings, cost savings, tax deductions and the proceeds from disposition. The discounted cash flow (“DCF”) method is a form of the income approach commonly used to value business interests. The DCF method involves estimating future cash flows of a business and discounting them to their present value. The discount rate is selected based on consideration of the risks inherent in the investment and market rates of return available from alternative investments of similar type and quality as of the valuation date. More specifically, the DCF method bases the value of a company on the cash flow attributable to that company. This approach is based on the assumptions that: (i) a company is worth what it can generate in future cash flows to its owners; (ii) the future cash flows are reasonably predictable; and (iii) the cost of capital and investors’ required rates of return on invested capital can be estimated. This approach assumes that the income derived from a company will, to a large extent, determined the value of that company. |
The DCF method was based on Company-prepared projections which included a variety of estimates and assumptions. While the Company considers such estimates and assumptions reasonable, they are inherently subject to significant business, economic and competitive uncertainties, many of which are beyond the Company’s control and, therefore, may not be realized. Changes in these estimates and assumptions may have a significant effect on the determination of the fair value of the assets acquired and liabilities assumed in the Acquisition. Accordingly, there can be no assurance that the estimates, assumptions, and values reflected in the valuations will be realized, and actual results could vary materially. The following key assumptions were utilized in applying the DCF method:
Delphi provided its independent valuation specialist with projected net sales, expenses and cash flows, for the years ending December 31, 2010, 2011 and 2012 representing the Company’s best estimates at the time the analysis was prepared.
Discount rates to determine the present value of the future cash flows from 2010 through 2012 and the terminal values were based on the weighted average cost of capital (“WACC”). The WACCs measure the average cost per dollar of capital of an enterprise based on the individual costs of debt and equity and the business unit’s target capital structure. The WACC is derived based on a set of guideline public companies for each business unit, and is an indicator of the cost of capital for a market participant in the business unit’s industry. The cost of equity estimated using the capital asset pricing model was between 13.4% and 23.5%, with a median of 16.4%. The pre-tax cost of debt was estimated to be 8% based on the yield on Delphi’s guideline companies’ publicly traded bonds as of the Acquisition Date. The range of WACCs for the business units was between 10.3% and 18.8% with a median of 13.6%.
Terminal value for each business unit was based on the Gordon Growth Model using a range of long-term growth rates of 0% to 5%, with a median of 3%.
| • | | Market Approach: The market approach measures the value of a company through the analysis of recent sales or offerings of comparable companies. The guideline public companies method and the guideline merged or acquired company method are the most common forms of the market approach used to value business interests. Use of the market approach requires that comparable transactions be available, which may include: |
The recent sales price of the same or similar companies or assets in an arm’s-length transaction; or
The market price for the license of the same or similar assets to an independent third party.
In applying the market approach, unique sets of comparable guideline public companies were identified using the Capital IQ data services. Capital IQ was used as the source of data to determine the guideline public companies’ Total Invested Capital (“TIC” defined as Market value of equity + Market value of debt + Market value of preferred stock and minority interest). The TIC was then calculated as a multiple of Trailing Twelve Months (“TTM”) Revenue, TTM Earnings Before Interest, Tax, Depreciation and Amortization (“EBITDA”), TTM Earning Before Interest, and Tax (“EBIT”), Next Fiscal Year (“NFY”) Revenue, NFY EBITDA, NFY EBIT, and NFY+1 EBITDA. For the NFY financial data, revenue and earnings estimates were obtained from Capital IQ for the average analyst estimates for the guideline public companies. The business unit’s respective multiples were selected depending on circumstances specific to each business unit within the range of the multiples provided by the comparable companies.
Delphi utilized TTM Revenue multiples of 0.3x-1.0x, NFY Revenue multiples of 0.3x-0.8x, NFY EBITDA multiples of 4.0x-6.9x and NFY+1 EBITDA multiples of 3.2x-7.2x. The selected multiples were then applied to respective financial results of the business units to derive an implied value of TIC. The resulting values from TTM Revenue, NFY Revenue, NFY EBITDA, and NFY+1 EBITDA multiples were weighted according to unique characteristics of each business unit, mostly at 20%, 20%, 50%, and 10%, respectively to arrive at minority marketable value of TIC. No control premium was applied to determine the fair value of the TIC of the business units on a controlling basis in consideration of the difficult conditions within the automotive supplier industry.
| • | | Cost Approach: The cost approach considers reproduction or replacement cost as an indicator of value. The cost approach is based on the assumption that a prudent investor would pay no more for an entity than the amount for which he could replace or re-create it. Historical costs are often used to estimate the current cost of replacing the entity valued. In doing so, adjustments for physical deterioration and obsolescence are taken into account. When using the cost approach to value a business enterprise, the equity value is calculated as the appraised value of the individual assets that comprise the business less the value of the liabilities that encumber those assets. |
The following table summarizes the estimated provisional fair values of the assets acquired and liabilities assumed based on information that was available at the Acquisition Date. Measurement period adjustments were completed in 2010 and reflect new information obtained about facts and circumstances that existed as of the Acquisition Date, primarily related to changes in deferred taxes to reflect book to tax return reconciliations. Accordingly, the carrying amount of deferred tax assets and property, plant and equipment were retrospectively adjusted as of October 6, 2009. The impact of the retrospective adjustments was not material to Delphi’s results of operations or cash flows for the period from the Acquisition Date through December 31, 2009 and, therefore, was reflected in operating results in the year ended December 31, 2010.
| | | | | | | | | | | | |
| | | October 6, 2009
(As initially
reported) | | | Measurement
Period
Adjustments | | | October 6, 2009
(As adjusted) | |
| | | (in millions) | |
Fair value of membership interests issued | | $ | 4,932 | | | $ | — | | | $ | 4,932 | |
| | | | | | | | | | | | |
Recognized amounts of identifiable assets acquired and liabilities assumed | | | | | | | | | | | | |
Cash and cash equivalents(1) | | $ | 2,801 | | | $ | — | | | $ | 2,801 | |
Restricted cash | | | 124 | | | | — | | | | 124 | |
Accounts receivable | | | 2,160 | | | | — | | | | 2,160 | |
Inventory(2) | | | 964 | | | | — | | | | 964 | |
Property, plant and equipment(3) | | | 2,255 | | | | (169 | ) | | | 2,086 | |
Identifiable intangible assets(4) | | | 766 | | | | — | | | | 766 | |
Deferred tax assets | | | 305 | | | | 169 | | | | 474 | |
Other assets | | | 896 | | | | — | | | | 896 | |
Accounts payable | | | (1,585 | ) | | | — | | | | (1,585 | ) |
Pension liabilities(5) | | | (882 | ) | | | — | | | | (882 | ) |
Debt(6) | | | (419 | ) | | | — | | | | (419 | ) |
Deferred tax liabilities | | | (328 | ) | | | — | | | | (328 | ) |
Other liabilities(7) | | | (1,710 | ) | | | — | | | | (1,710 | ) |
Noncontrolling interests | | | (415 | ) | | | — | | | | (415 | ) |
| | | | | | | | | | | | |
Total identifiable net assets | | $ | 4,932 | | | $ | — | | | $ | 4,932 | |
| | | | | | | | | | | | |
Acquisition-related costs of $19 million were included in Other income (expense), net in the consolidated results of operations of the Successor for the period August 19 to December 31, 2009.
| 1. | Cash and cash equivalents acquired is as follows: |
| | | | |
| | | (in millions) | |
Cash from issuance of Class A membership interests | | $ | 1,689 | |
Cash from issuance of Class B membership interests | | | 209 | |
Cash acquired from the Predecessor | | | 862 | |
Proceeds from issuance of 5-Year Note | | | 41 | |
| | | | |
Total cash and cash equivalents acquired | | $ | 2,801 | |
| | | | |
| 2. | Inventory is recorded at fair value. Raw materials were valued at current replacement costs and work-in-process was valued at the estimated selling prices of finished goods less the sum of costs to complete, costs of disposal and reasonable profit allowances for completing and selling efforts based on profits for similar finished goods. Finished goods were valued at estimated selling prices less the sum of costs of disposal and reasonable profit allowances for the selling efforts. |
| 3. | Property, plant and equipment are recorded at fair value giving consideration to their highest and best use. Key assumptions used in the valuation of the Company’s property, plant and equipment were based on a combination of the cost or market approach, depending on whether market data was available. |
| 4. | Identifiable intangible assets are recorded at fair value and include customer relationships, trade names, patents and in-process research and development (“IPR&D”). The following approaches were considered in valuing the identifiable intangible assets: |
| | • | | Relief from Royalty (“RFR”) Method: This form of the income approach determines the value of an intangible asset by capitalizing future royalty payments (income) that are avoided (earned) since the intangible asset is owned rather than licensed. Royalty payments are estimated at the amount that a company would be willing to pay in the form of a royalty for the use of the intangible asset, assuming an outside party owned the rights to the intangible asset. The relief from royalty method is generally used to value trademarks, trade names, and some technologies. This methodology is most reliable when there are observable royalty rates charged for the use of comparable intangible assets. |
| | • | | Excess Earnings (“EE”) Method: Similar to the DCF method described above, the EE method calculates the value of an intangible asset by discounting its future cash flows. Cash flow is calculated by first estimating after-tax income, which is adjusted for non-cash charges. A contributory asset charge is also applied to reflect the costs associated with the use of other assets to generate the cash flow. The excess earnings method is often used to value customer relationships, technologies, and IPR&D. The EE method is the best approach to use when future economic benefits of the intangible asset can be reasonably estimated but need to be segregated from one or more assets that contribute to the production of the cash flow. |
The following table summarizes the estimated fair values as of the Acquisition Date of the identifiable intangible assets, the method and significant assumptions used to estimate the fair values and the weighted average amortization period of definite-lived intangible assets:
| | | | | | | | | | | | | | | | |
Identifiable Intangible Asset | | Valuation
Approach | | Royalty Rate | | Discount Rate | | | Weighted
Average
Amortization
Period
(Years) | | | Acquisition
Date Fair
Value | |
| | | | | | | | | | | | | (in millions) | |
Patents | | RFR | | 0.7%-1.2% | | | 14.4%-22.0% | | | | 13 | | | $ | 442 | |
Customer relationships | | EE | | N/A | | | 14.5%-22.4% | | | | 6 | | | | 140 | |
Trade names | | RFR | | 0.2%-1.0% | | | 14.5%-21.4% | | | | 20 | | | | 97 | |
IPR&D | | EE | | N/A | | | 22.4%-39.5% | | | | N/A | | | | 87 | |
| | | | | | | | | | | | | | | | |
Total identifiable intangible assets | | | | | | | | | | | | | | $ | 766 | |
| | | | | | | | | | | | | | | | |
| 5. | Pension obligations assumed are comprised primarily of plans outside the U.S. and were recorded at fair value as of the Acquisition Date. |
| 6. | Debt is comprised of foreign receivables factoring and other debt assumed from the Predecessor and the issuance of a $41 million five-year note with a 12% interest rate in conjunction with the Acquisition. Debt was recorded at fair value as of the Acquisition Date, which resulted in a $2 million net reduction to the nominal value of the debt. The difference between the fair value and nominal value of debt will be accreted to nominal value over the term of the indebtedness. |
| 7. | Contingent liability of up to $300 million required to be paid to the holders of allowed general unsecured claims against the Predecessor if cumulative distributions to the members exceed $7.2 billion not probable as of October 6, 2009 and therefore, recorded at zero. |
Pro forma results of consummation of the modified plan and acquisition accounting—The following table presents the unaudited pro forma results for the years ended December 31, 2009 and 2008. The unaudited pro forma financial information for the year ended December 31, 2009 adjusts the results of operations of the Predecessor through October 6, 2009 as though the consummation of the Modified Plan and the Acquisition had occurred at the beginning of fiscal 2008 and combines that with the results of operations of the Successor from
the Acquisition Date through December 31, 2009. The pro forma financial information is presented for informational purposes only and is not indicative of the results of operations that would have been achieved if the consummation of the Modified Plan and the Acquisition had occurred at the beginning of fiscal 2009. The unaudited pro forma results presented include adjustments to remove the businesses that were not acquired by the Successor, reductions to cost of sales related to the elimination of primarily all of the Predecessor’s U.S. pension and workforce postretirement health care benefits and employer-paid postretirement basic life insurance benefits (collectively “OPEB”) costs, an increase in interest expense related to the Successor’s new debt and the reversal of pre-petition interest expense, an elimination of the bankruptcy-related reorganization items and adjustments to depreciation and amortization expense related to the reduction in fair value of the property, plant and equipment and the increase in intangible assets on the Successor’s balance sheet.
| | | | | | | | |
| | | 2009 | | | 2008 | |
| | | (in millions) | |
Net sales | | $ | 11,116 | | | $ | 15,125 | |
Net loss | | | (846 | ) | | | (1,373 | ) |
| 2. | SIGNIFICANT ACCOUNTING POLICIES |
The significant accounting policies outlined below are applicable to both Delphi and the Predecessor, unless otherwise specifically indicated. Accordingly, except where otherwise indicated, references to “Delphi” within Note 2. Significant Accounting Policies should be understood to be related both to Delphi and the Predecessor.
Consolidation—The consolidated financial statements include the accounts of Delphi and domestic and non-U.S. subsidiaries in which Delphi holds a controlling financial or management interest and variable interest entities of which Delphi has determined that it is the primary beneficiary. Delphi’s share of the earnings or losses of non-controlled affiliates, over which Delphi exercises significant influence (generally a 20% to 50% ownership interest), is included in the consolidated operating results using the equity method of accounting. All significant intercompany transactions and balances between consolidated Delphi businesses have been eliminated. All adjustments, consisting of only normal recurring items, which are necessary for a fair presentation, have been included.
In December 2007, the FASB issued certain amendments to FASB ASC 810,Consolidation, which establishes new accounting and reporting standards for the noncontrolling interest in a subsidiary and for the deconsolidation of a subsidiary. The Predecessor adopted these amendments to FASB ASC 810 as of January 1, 2009 and the accompanying financial statements reflect these amendments for all periods presented.
Use of estimates—Preparation of consolidated financial statements in conformity with accounting principles generally accepted in the United States of America (“U.S. GAAP”) requires the use of estimates and assumptions that affect amounts reported therein. Generally, matters subject to estimation and judgment include amounts related to accounts receivable realization, inventory obsolescence, asset impairments, useful lives of intangible and fixed assets, deferred tax asset valuation allowances, income taxes, pension and other postretirement benefit plan assumptions, accruals related to litigation, warranty costs, environmental remediation costs, worker’s compensation accruals and healthcare accruals. Due to the inherent uncertainty involved in making estimates, actual results reported in future periods may be based upon amounts that differ from those estimates.
Subsequent events—Delphi has evaluated all events that have occurred subsequent to December 31, 2010 through February 18, 2011 (the date the financial statements were available to be issued).
Revenue recognition—Sales are recognized when there is evidence of a sales agreement, the delivery of goods has occurred, the sales price is fixed or determinable and the collectability of revenue is reasonably assured. Sales are generally recorded upon shipment of product to customers and transfer of title under standard commercial terms. In addition, if Delphi enters into retroactive price adjustments with its customers, these reductions to revenue are recorded when they are determined to be probable and estimable. From time to time,
Delphi enters into pricing agreements with its customers that provide for price reductions, some of which are conditional upon achieving certain joint cost saving targets. In these instances, revenue is recognized based on the agreed-upon price at the time of shipment.
Sales incentives and allowances are recognized as a reduction to revenue at the time of the related sale. In addition, from time to time, Delphi makes payments to customers in conjunction with ongoing and in limited circumstances future business. These payments to customers are recognized as a reduction to revenue at the time of the commitment to make these payments.
Shipping and handling fees billed to customers are included in net sales, while costs of shipping and handling are included in cost of sales.
We collect and remit taxes assessed by different governmental authorities that are both imposed on and concurrent with a revenue-producing transaction between us and our customers. These taxes may include, but are not limited to, sales, use, value-added, and some excise taxes. We report the collection of these taxes on a net basis (excluded from revenues).
Membership interests—At the Acquisition Date, the outstanding common stock of the Predecessor was cancelled and membership interests in Delphi were issued to Delphi’s owners. As of December 31, 2010 and 2009, Delphi’s investors held membership interests of $5.6 billion and $4.9 billion, respectively. Total membership interests and current period net income (loss) are allocated among the respective classes based on the cumulative distribution provisions of the Second Amended and Restated Limited Liability Partnership Agreement of Delphi Automotive LLP ( the(the “LLP Agreement”). Refer to Note 17. Membership Interests for additional information.
Predecessor weighted average shares and dividends—Basic and diluted income per share amounts were computed using weighted average shares outstanding for each respective period. As a result of the market price of shares as compared to the price associated with outstanding options in the period from January 1 to October 6, 2009 and year ended December 31, 2008, the effect of potentially dilutive securities has been excluded from the calculation of income per share as inclusion would have had an anti-dilutive effect.
Actual weighted average shares outstanding used in calculating basic and diluted income per share were:
| | | | | | | | |
| | | Period from
January 1 to
October 6,
2009 | | | Year ended
December 31,
2008 | |
| | | (in thousands) | |
Weighted average basic and diluted shares outstanding | | | 564,637 | | | | 564,361 | |
| | | | | | | | |
Securities excluded from the computation of diluted income per share because inclusion would have had an anti-dilutive effect:
| | | | | | | | |
| | | Period from
January 1 to
October 6,
2009 | | | Year ended
December 31,
2008 | |
| | | (in thousands) | |
Anti-dilutive securities | | | 43,346 | | | | 58,953 | |
| | | | | | | | |
The Company did not pay dividends during these periods.
Research and development—Costs are incurred in connection with research and development programs that are expected to contribute to future earnings. Such costs are charged against income as incurred. Research and
development expenses (including engineering) were $1.0 billion, $0.3 billion, $1.0 billion and $1.8 billion for the year ended December 31, 2010, the periods August 19 to December 31, 2009, January 1 to October 6, 2009, and the year ended December 31, 2008, respectively.
Cash and cash equivalents—Cash and cash equivalents are defined as short-term, highly liquid investments with original maturities of three months or less.
Time deposits—During 2010, Delphi entered into various time deposit agreements whereby certain of Delphi’s funds on deposit with financial institutions may not be withdrawn for a specified period of time. Time deposits with original maturity periods of three months or less have been included as Cash and cash equivalents in the consolidated balance sheet as of December 31, 2010, while time deposits with original maturity periods greater than three months have been separately stated in the consolidated balance sheet as of December 31, 2010. The carrying value of time deposits approximates fair value as of December 31, 2010.
Marketable securities—Marketable securities with maturities of three months or less are classified as cash and cash equivalents for financial statement purposes. Debt securities with maturities greater than three months are classified as held-to-maturity, and accordingly are recorded at cost in the consolidated financial statements. Equity securities with maturities greater than three months are classified as available-for-sale and are recorded in the consolidated financial statements at market value with changes in market value included in other comprehensive income (“OCI”). Available-for-sale securities with a cost basis of $13 million and $26 million and a carrying value of $12 million and $23 million were held as of December 31, 2010 and 2009, respectively. In the event debt or equity securities experience an other-than-temporary impairment in value, such impairment is recognized as a loss in the consolidated statement of operations. In 2010, Delphi recognized an other-than-temporary impairment of $9 million.
Restricted cash—Restricted cash includes balances on deposit at financial institutions that have issued letters of credit in favor of Delphi.
Accounts receivable—Delphi enters into agreements to sell certain of its accounts receivable, primarily in Europe. Since the agreements allow Delphi to maintain effective control over the receivables, these various accounts receivable factoring facilities were accounted for as short-term debt at December 31, 2010 and 2009. Collateral is not generally required related to these trade accounts receivable.
The allowance for doubtful accounts is established based upon analysis of trade receivables for known collectibility issues and the aging of the trade receivables at the end of each period and, generally, all accounts receivable balances greater than 90 days past due are fully reserved. As of December 31, 2010 and 2009, the accounts receivable reserve was $64 million and $33 million, respectively and the provision for doubtful accounts was $45 million, $33 million, $22 million and $63 million for the year ended December 31, 2010, the periods August 19 to December 31, 2009, January 1 to October 6, 2009, and the year ended December 31, 2008, respectively.
The Company exchanges certain amounts of accounts receivable, primarily in the Asia/Pacific region, for bank notes with original maturities greater than three months. The collection of such bank notes are included in operating cash flows based on the substance of the underlying transactions, which are operating in nature.
Inventories—As of December 31, 2010 and 2009, inventories are stated at the lower of cost, determined on a first-in, first-out basis, or market, including direct material costs and direct and indirect manufacturing costs, refer to Note 4. Inventories. Obsolete inventory is identified based on analysis of inventory for known obsolescence issues, and, generally, as of December 31, 2010, the market value of inventory on hand in excess of one year’s supply is fully-reserved.
From time to time, payments may be received from suppliers. These payments from suppliers are recognized as a reduction of the cost of the material acquired during the period to which the payments relate. In
some instances, supplier rebates are received in conjunction with or concurrent with the negotiation of future purchase agreements and these amounts are amortized over the prospective agreement period.
Property—Property, plant and equipment, including internally-developed internal use software and special tools, were adjusted to fair value as of October 6, 2009, which represents a new cost basis, and were adjusted for depreciation in subsequent periods. Major improvements that materially extend the useful life of property are capitalized. Expenditures for repairs and maintenance are charged to expense as incurred. For the Successor, depreciation is determined based on a straight-line method over the estimated useful lives of groups of property. For the Predecessor, depreciation was determined based on the estimated useful lives of groups of property generally using straight-line methods or using an accelerated method, which accumulates depreciation of approximately two-thirds of the depreciable cost during the first half of the estimated useful lives. Leasehold improvements under capital leases are depreciated over the period of the lease or the life of the property, whichever is shorter, with the depreciation applied directly to the asset account.
At December 31, 2010 and 2009, the special tools balance was $247 million and $258 million, respectively, included within property, net in the consolidated balance sheet. Special tools balances represent Delphi-owned tools, dies, jigs and other items used in the manufacture of customer components. Special tools also include unreimbursed pre-production tooling costs related to customer-owned tools for which the customer has provided a non-cancelable right to use the tool. Delphi-owned special tools balances are depreciated over the expected life of the special tool or the life of the related vehicle program, whichever is shorter. The unreimbursed costs incurred related to customer-owned special tools that are not subject to reimbursement are capitalized and depreciated over the expected life of the special tool or the life of the related vehicle program, whichever is shorter. Engineering, testing and other costs incurred in the design and development of production parts are expensed as incurred, unless the costs are reimbursable, as specified in a customer contract. As of December 31, 2010 and 2009, the Delphi-owned special tools balances were $220 million and $240 million, respectively, and the customer-owned special tools balances were $27 million and $18 million, respectively.
Valuation of long-lived assets—The carrying value of long-lived assets held for use including intangible assets is periodically evaluated when events or circumstances warrant such a review. The carrying value of a long-lived asset held for use is considered impaired when the anticipated separately identifiable undiscounted cash flows from the asset are less than the carrying value of the asset. In that event, a loss is recognized based on the amount by which the carrying value exceeds the fair value of the long-lived asset. Fair value is determined primarily using the anticipated cash flows discounted at a rate commensurate with the risk involved and our review of appraisals. Impairment losses on long-lived assets held for sale are determined in a similar manner, except that fair values are reduced for the cost to dispose of the assets. Refer to Note 21. Discontinued Operations and Note 7. Property, Net for more information.
Intangible assets—Intangible assets were $665 million and $750 million as of December 31, 2010 and 2009, respectively. In general, definite-lived intangible assets are being amortized over their useful lives, normally 6-20 years. Refer to Note 8. Intangible Assets and Goodwill for more information.
Warranty—Expected warranty costs for products sold are recognized at the time of sale of the product based on its estimate of the amount that eventually will be required to settle such obligations. These accruals are based on factors such as past experience, production changes, industry developments and various other considerations. These estimates are adjusted from time to time based on facts and circumstances that impact the status of existing claims. Refer to Note 10. Warranty Obligations.
Foreign currency translation—Assets and liabilities of non-U.S. subsidiaries that use a currency other than U.S. dollars as their functional currency are translated to U.S. dollars at end-of-period currency exchange rates. The consolidated statements of operations of non-U.S. subsidiaries are translated to U.S. dollars at average-period currency exchange rates. The effect of translation for non-U.S. subsidiaries is generally reported in OCI. The effect of remeasurement of assets and liabilities of non-U.S. subsidiaries that use the U.S. dollar as their
functional currency is primarily included in cost of sales. Also included in cost of sales are gains and losses arising from transactions denominated in a currency other than the functional currency of a particular entity. Net foreign currency transaction losses of $20 million, $2 million, $5 million and $29 million were included in the consolidated statements of operations for the year ended December 31, 2010, the periods from August 19 to December 31, 2009 and January 1 to October 6, 2009 and the year ended December 31, 2008, respectively.
Restructuring—Delphi continually evaluates alternatives to align the business with the changing needs of its customers and to lower the operating costs. This includes the realignment of its existing manufacturing capacity, facility closures, or similar actions in the normal course of business. These actions may result in voluntary or involuntary employee termination benefits, which are mainly pursuant to union or other contractual agreements. Voluntary termination benefits are accrued when an employee accepts the related offer. Involuntary termination benefits are accrued upon the commitment to a termination plan and the benefit arrangement is communicated to affected employees, or when liabilities are determined to be probable and estimable, depending on the existence of a substantive plan for severance or termination. Contract termination costs are recorded when contracts are terminated or when Delphi ceases to use the leased facility and no longer derives economic benefit from the contract. All other exit costs are expensed as incurred. Refer to Note 11. Restructuring. Refer to Note 3. Elements of Predecessor Transformation Plan for employee termination benefits and other exit costs related to non-core product lines. Pursuant to the Amended MRA (as defined in Note 3. Elements of Predecessor Transformation Plan), GM reimbursed the Predecessor for severance obligations paid by the Predecessor after January 1, 2009 in relation to all current and former UAW-represented hourly active, inactive, and retired employees.
Environmental liabilities—Environmental remediation liabilities are recognized when a loss is probable and can be reasonably estimated. Such liabilities generally are not subject to insurance coverage. The cost of each environmental remediation is estimated by engineering, financial, and legal specialists based on current law and considers the estimated cost of investigation and remediation required and the likelihood that, where applicable, other responsible parties will be able to fulfill their commitments. The process of estimating environmental remediation liabilities is complex and dependent primarily on the nature and extent of historical information and physical data relating to a contaminated site, the complexity of the site, the uncertainty as to what remediation and technology will be required, and the outcome of discussions with regulatory agencies and, if applicable, other responsible parties at multi-party sites. In future periods, new laws or regulations, advances in remediation technologies and additional information about the ultimate remediation methodology to be used could significantly change estimates by Delphi. Refer to Note 15. Commitments and Contingencies.
Asset retirement obligations—Asset retirement obligations are recognized in accordance with FASB ASC 410,Asset Retirement and Environmental Obligations. Conditional retirement obligations have been identified primarily related to asbestos abatement at certain sites. To a lesser extent, conditional retirement obligations also exist at certain sites related to the removal of storage tanks and polychlorinated biphenyl disposal costs. Asset retirement obligations were $4 million and $3 million at December 31, 2010 and 2009, respectively.
Customer concentrations—Sales to GM were approximately 21%, 20%, 26% and 30% of our total net sales for the year ended December 31, 2010, the period from August 19, 2009 to December 31, 2009, the period from January 1, 2009 to October 6, 2009 and the year ended December 31, 2008, respectively. Accounts and other receivables due from GM were $393 million and $354 million as of December 31, 2010 and 2009, respectively. No other single customer accounted for more than 10% of our consolidated net sales in any period presented.
Global sales to Ford Motor Company were approximately 9% of total sales during the year ended December 31, 2010.
Filings for reorganization relief under chapter 11 of the Bankruptcy Code by domestic customers and other companies in the automotive parts industry have not had a significant impact on Delphi’s results of operations for the year ended December 31, 2010, the periods from August 19 to December 31, 2009 and January 1 to October 6, 2009 and the year ended December 31, 2008.
Derivative financial instruments—All derivative instruments are required to be reported on the balance sheet at fair value unless the transactions qualify and are designated as normal purchases or sales. Changes in fair value are reported currently through earnings unless they meet hedge accounting criteria.
Exposure to fluctuations in currency exchange rates, interest rates and certain commodity prices are managed by entering into a variety of forward contracts and swaps with various counterparties. Such financial exposures are managed in accordance with the policies and procedures of Delphi. Delphi did not enter into derivative transactions for speculative or trading purposes. As part of the hedging program approval process, Delphi identifies the specific financial risk which the derivative transaction will minimize, the appropriate hedging instrument to be used to reduce the risk and the correlation between the financial risk and the hedging instrument. Purchase orders, sales contracts, letters of intent, capital planning forecasts and historical data are used as the basis for determining the anticipated values of the transactions to be hedged. Delphi does not enter into derivative transactions that do not have a high correlation with the underlying financial risk. Hedge positions, as well as the correlation between the transaction risks and the hedging instruments, are reviewed on an ongoing basis.
Foreign exchange forward contracts are accounted for as hedges of firm or forecasted foreign currency commitments to the extent they are designated and assessed as highly effective. All foreign exchange contracts are marked to market on a current basis. Commodity swaps are accounted for as hedges of firm or anticipated commodity purchase contracts to the extent they are designated and assessed as effective. All other commodity derivative contracts that are not designated as hedges are either marked to market on a current basis or are exempted from mark to market accounting as normal purchases. At December 31, 2010 and 2009, the exposure to movements in interest rates was not hedged with derivative instruments. Refer to Note 18. Fair Value of Financial Instruments, Derivatives and Hedging Activities for additional information.
Extended disability benefits—Costs associated with extended disability benefits provided to inactive employees are accrued throughout the duration of their active employment. Workforce demographic data and historical experience are utilized to develop projections of time frames and related expense for postemployment benefits. Pursuant to the Amended MRA (as defined in Note 3. Elements of Predecessor Transformation Plan), GM reimbursed the Predecessor for extended disability benefits paid by the Predecessor after January 1, 2009 in relation to all current and former UAW-represented hourly active, inactive, and retired employees. Refer to Note 3. Elements of Predecessor Transformation Plan for more information.
Workers’ compensation benefits—Workers’ compensation benefit accruals are actuarially determined and are subject to the existing workers’ compensation laws that vary by state. Accruals for workers’ compensation benefits represent the discounted future cash expenditures expected during the period between the incidents necessitating the employees to be idled and the time when such employees return to work, are eligible for retirement or otherwise terminate their employment. Delphi assumed only workers’ compensation liabilities associated with claims incurred after the Petition Date for the employees it hired. The remaining workers’ compensation liabilities of the Predecessor were discharged as part of the bankruptcy process, assumed by GM as part of its acquisition of substantially all of the Predecessor’s global steering business and the manufacturing facilities in the U.S. at which the employees were represented by the UAW, or remained liabilities of DPHH. Pursuant to the Amended MRA (as defined in Note 3. Elements of Predecessor Transformation Plan), GM reimbursed the Predecessor for workers compensation benefits paid by the Predecessor from January 1, 2009 through October 6, 2009 in relation to all current and former UAW-represented hourly active, inactive, and retired employees. Refer to Note 3. Elements of Predecessor Transformation Plan for more information.
Discontinued operations—In accordance with FASB ASC 360-10,Property, Plant, and Equipment, the general accounting principles applicable to the impairment or disposal of long-lived assets, a business component that is disposed of or classified as held for sale is reported as discontinued operations if the cash flows of the component have been or will be eliminated from the ongoing operations of an entity and that entity will no longer have any significant continuing involvement in the business component. The results of discontinued operations are aggregated and presented separately in the consolidated statements of operations and consolidated
statements of cash flows. Assets and liabilities of the discontinued operations are aggregated and reported separately as assets and liabilities held for sale in the consolidated balance sheet. Amounts presented for prior years are required to be reclassified to effect their classification as discontinued operations.
For periods ended October 6, 2009 and prior, amounts have been derived from the consolidated financial statements and accounting records of the Predecessor using the historical basis of assets and liabilities held for sale and historical results of operations related to the Predecessor’s global steering and halfshaft businesses (the “Steering Business”) and the Automotive Holdings Group (“AHG”), which includes various non-core product lines and plant sites that did not fit the Predecessor’s strategic framework. At the Acquisition Date, substantially all of the Steering Business was acquired from the Predecessor by GM. While the historical results of operations of the Steering Business and AHG include general corporate allocations of certain functions historically provided by the Predecessor, such as accounting, treasury, tax, human resources, facility maintenance, and other services, no amounts for these general corporate retained functions have been allocated to discontinued operations in the statements of operations. Expenses related to the service cost of employee pension and other postretirement benefit plans were allocated to discontinued operations in the statements of operations. Allocations have been made based upon a reasonable allocation method. Refer to Note 21. Discontinued Operations for more information.
Contractual interest expense and interest expense on unsecured claims—Contractual interest expense represents amounts due under the contractual terms of outstanding debt, including debt subject to compromise for which interest expense is not recognized in accordance with the provisions of FASB ASC 852,Reorganizations. Contractual interest expense was $494 million and $558 million for the period from January 1 to October 6, 2009, and the year ended December 31, 2008, respectively. In September 2007, the Predecessor began recording prior contractual interest expense related to certain prepetition debt because it became probable that the interest would become an allowed claim based on the provisions of the plan of reorganization filed with the Court in September 2007 and confirmed, as amended, on January 25, 2008. The plan of reorganization confirmed on January 25, 2008 also provided that certain holders of allowed unsecured claims against the Predecessor would be paid postpetition interest on their claims, calculated at the contractual non-default rate from the petition date through January 25, 2008, when the Predecessor ceased accruing interest on these claims. At December 31, 2008, the Predecessor had accrued interest of $415 million related to prepetition claims. As discussed in Note 3. Elements of Predecessor Transformation Plan, on July 30, 2009, the Court confirmed the Modified Plan, eliminating postpetition interest on prepetition debt and allowed unsecured claims. Therefore, the reversal of the $415 million of accrued interest was included as a reduction of interest expense in the consolidated statement of operations of the Predecessor for the period from January 1 to October 6, 2009.
Recently issued accounting pronouncements—In June 2009, the Financial Accounting Standards Board (“FASB”) issued guidance related to accounting for transfers of financial assets which changes the way entities account for securitizations and special-purpose entities, codified in FASB ASC 810,Consolidation, and FASB ASC 860,Transfers and Servicing. The adoption of this guidance on January 1, 2010 did not have a significant impact on Delphi’s financial statements.
In October 2009, the FASB issued Accounting Standards Update (“ASU”) 2009-13,Revenue Recognition—Multiple-Deliverable Revenue Arrangements—a consensus of the FASB Emerging Issues Task Force, which amends FASB ASC 605,Revenue Recognition, by modifying the criteria used to separate elements in a multiple-element arrangement, introducing the concept of “best estimate of selling price” for determining the selling price of a deliverable, establishing a hierarchy of evidence for determining the selling price of a deliverable, requiring use of the relative selling price method and prohibiting use of the residual method to allocate arrangement consideration among units of accounting, and expanding the disclosure requirements for all multiple-element arrangements within the scope of FASB ASC 605-25. The amended guidance is effective prospectively for revenue arrangements entered into or materially modified in fiscal years beginning on or after June 15, 2010. Alternatively, this amended guidance may be applied retrospectively for all prior periods. Delphi does not expect the adoption of ASU 2009 -13 to have a significant impact on its financial statements.
In April 2010, the FASB ratified Emerging Issues Task Force Issue No. 08-9,Milestone Method of Revenue Recognition (“Issue 08-9”). ASU 2010-17,Revenue Recognition—Milestone Method, which resulted from the ratification of Issue 08-9 and amends FASB ASC 605. ASU 2010-17 allows, but does not require, an entity to make an accounting policy election to recognize a payment that is contingent upon the achievement of a substantive milestone in its entirety in the period in which the milestone is achieved. The guidance in ASU 2010-17 is effective for fiscal years, and interim periods within those years, beginning on or after June 15, 2010, and may be applied prospectively to milestones achieved after the adoption date or retrospectively for all periods presented. Early adoption is permitted. Delphi does not expect the adoption of ASU 2010 -17 to have a significant impact on its financial statements.
In August 2010, the FASB issued ASU 2010-20,Receivables—Disclosures about the Credit Quality of Financing Receivables and the Allowance for Credit Losses. This guidance amends required disclosures about an entity’s allowance for credit losses and the credit quality of its financing receivables. The update will require entities to provide a greater level of disaggregated information about the credit quality of its financing receivables and its allowance for credit losses. The guidance is effective for public companies for interim and annual reporting periods ending on or after December 15, 2010 and for non-public companies, for annual reporting periods ending on or after December 15, 2011. In January 2011, the FASB issued ASU 2011-01Receivables – Deferral of the Effective Date of Disclosures about troubled debt restructurings in ASU 2010-20. This guidance temporarily delays the effective date of the disclosures about troubled debt restructurings for public entities. An effective date has yet to be determined. Delphi does not expect the adoption of ASU 2010-20 or 2011-01 to have a significant impact on its financial statements other than providing the new disclosures as required.
| 3. | ELEMENTS OF PREDECESSOR TRANSFORMATION PLAN |
GM—The Predecessor and Old GM entered into comprehensive settlement agreements consisting of the Global Settlement Agreement dated September 6, 2007 (as amended through December 7, 2007, (the “Original GSA”), and the Master Restructuring Agreement dated September 6, 2007 (as amended through December 7, 2007 (the “Original MRA”). The Original GSA and the Original MRA were approved in the order confirming the Predecessor’s initial plan of reorganization on January 25, 2008. The Original GSA and the Original MRA provided that they would not be effective until and unless the Predecessor emerged from chapter 11. However, as part of the Predecessor’s overall negotiations with its stakeholders to further amend the initial plan of reorganization and emerge from chapter 11 as soon as practicable, on September 12, 2008, the Predecessors and Old GM entered into an Amended and Restated Global Settlement Agreement (the “Amended GSA”) and an Amended and Restated Master Restructuring Agreement (the “Amended MRA”). The Court approved such amendments on September 26, 2008 and the Amended GSA and Amended MRA became effective on September 29, 2008. These amended agreements included provisions related to the transfer of certain legacy pension and other postretirement benefit obligations and became effective independent of and in advance of substantial consummation of an amended plan of reorganization, although provisions relating to the acceleration of payment terms were not immediately effective. The effectiveness of these agreements resulted in a material reduction in the Predecessor’s liabilities and future expenses related to U.S. hourly workforce benefit programs. Upon the Acquisition Date, the Amended MRA was terminated (except that Old GM agreed to remain responsible for certain of its obligations thereunder) and the MDA and certain ancillary agreements govern certain aspects of the relationship among GM and Delphi, as purchaser of the major portion of the Predecessor’s businesses.
Global settlement agreement—The Original GSA and the Amended GSA resolved outstanding issues between the Predecessor and Old GM, including: litigation commenced in March 2006 by the Predecessor to terminate certain supply agreements with Old GM; all potential claims and disputes with Old GM arising out of the separation of the Predecessor from Old GM in 1999, including certain post-separation claims and disputes; the proofs of claim filed by Old GM against the Predecessor in the Predecessor’s chapter 11 cases; Old GM’s treatment under the Predecessor’s original plan of reorganization; and various other legacy U.S. hourly
workforce benefit issues including commitments by the Predecessor and Old GM regarding other U.S. OPEB, pension obligations, and other Old GM contributions with respect to labor matters and releases.
In 2008, the Predecessor recorded a net reorganization gain of $5.3 billion. In addition, under the Amended GSA, the Predecessor received net cash from GM totaling $641 million on September 30, 2008, principally related to reimbursement of hourly OPEB benefit payments since January 1, 2007 and amounts paid by the Predecessor under special attrition programs.
The following table provides each component of the net reorganization gain recorded for the elements of the Amended GSA that were implemented during the third quarter of 2008 and which are described in more detail below. The table also reflects the net cash received on September 30, 2008 attributable to each of the elements of the Amended GSA:
| | | | | | | | |
| | | Reorganization
Gain (Loss) | | | Cash Received
From GM | |
| | | (in millions) | |
Hourly Pension Plan Settlement: | | | | | | | | |
Hourly Plan Partial Pension Transfer to GM | | $ | 2,083 | | | $ | — | |
Recognition of Hourly Plan related OCI amounts | | | (494 | ) | | | — | |
| | |
Hourly OPEB Settlement: | | | | | | | | |
GM assumption of OPEB obligation | | | 6,821 | | | | — | |
Recognition of OPEB related OCI amounts | | | 266 | | | | — | |
| | |
Allowed Claims and Other: | | | | | | | | |
Allowed GM administrative claim | | | (1,628 | ) | | | — | |
Allowed GM general unsecured claim | | | (2,500 | ) | | | — | |
Allowed IUE-CWA and USW claims | | | (129 | ) | | | — | |
OPEB reimbursement from GM | | | 353 | | | | 350 | |
Special attrition programs | | | 491 | | | | 230 | |
Other, net | | | 69 | | | | 61 | |
| | | | | | | | |
Total, net | | $ | 5,332 | | | $ | 641 | |
| | | | | | | | |
Hourly pension plan—partial pension transfer to GM—On September 26, 2008, the Predecessor received the consent of its labor unions and approval from the Court to transfer certain assets and liabilities of the Delphi Hourly-Rate Employees Pension Plan (the “Hourly Plan”) to the GM Hourly-Rate Employees Pension Plan. On September 29, 2008, the Predecessor transferred liabilities of approximately $2.6 billion and assets of approximately $0.5 billion of the Hourly Plan to the GM Hourly-Rate Employees Pension Plan, representing 30% and 10% of the projected benefit obligation and plan assets, respectively, as of September 29, 2008. The transfer was sufficient to avoid an accumulated funding deficiency for the Hourly Plan for plan year ended September 30, 2008. In consideration, Old GM received an allowed administrative bankruptcy claim equivalent to 77.5% of the net unfunded liabilities transferred, or $1.6 billion. The transfer was accounted for as a partial settlement of the Hourly Plan under the accounting guidance related to employer’s accounting for settlements and curtailments of defined benefit pension plans and for termination benefits in 2008. The Predecessor recognized a settlement loss of $494 million included in reorganization items in the consolidated statements of operations for the year ended December 31, 2008, which reflects the recognition of $494 million of previously unrecognized actuarial losses included in accumulated other comprehensive income. The amount of actuarial losses recognized represents the proportion of the projected benefit obligation transferred to Old GM relative to the total projected benefit obligation of the Hourly Plan.
Hourly OPEB settlement and OPEB reimbursement from GM—On September 23, 2008, the Predecessor received approval from the Court and on September 26, 2008 received the consent of its labor unions to cease
providing traditional U.S. hourly OPEB. In addition, upon effectiveness of the Amended GSA, Old GM assumed financial responsibility for all of the Predecessor’s traditional hourly OPEB liabilities from and after January 1, 2007, subject to certain reimbursement obligations by the Predecessor. Old GM assumed approximately $6.8 billion of postretirement benefit liabilities for certain of the Predecessor’s active and retired hourly employees. The assumption of the traditional hourly OPEB liability by Old GM and Old GM’s agreement to reimburse postretirement benefit expenses through the administrative transfer date of February 1, 2009 was accounted for as a settlement under the guidance related to employer’s accounting for postretirement benefits other than pensions, in the third quarter of 2008. The Predecessor recognized $266 million of previously unrecognized actuarial gains recorded in accumulated other comprehensive income during the year ended December 31, 2008. Additionally, on September 30, 2008, the Predecessor recognized $350 million as a reorganization gain for the reimbursement from Old GM for OPEB payments previously made by the Predecessor to the hourly workforce from and after January 1, 2007. During the Predecessor period from January 1 to October 6, 2009, Old GM and GM funded an additional $41 million of OPEB payments made to the hourly workforce. Refer to Note 14. Pension and Other Postretirement Benefits for further information.
GM general unsecured claim—With respect to Old GM’s claims in the Predecessor’s chapter 11 cases, Old GM under the Amended GSA had agreed to a general unsecured claim of $2.5 billion, primarily for OPEB and special attrition programs for the U.S. hourly workforce. However, under the Modified Plan and the MDA, Old GM and GM agreed to waive the general unsecured claim in the Predecessor’s chapter 11 cases. GM and certain related parties and the Predecessor and certain related parties have also exchanged broad, global releases, effective as of the effective date of the Amended GSA (which releases do not apply to certain surviving claims as set forth in the Amended GSA). In addition to providing a release to GM, the Predecessor agreed to withdraw with prejudice the sealed complaint filed against GM in the Court on October 5, 2007. In addition, the Modified Plan contains additional mutual releases between Old GM, GM and the Predecessor.
Allowed IUE-CWA and USW claims—General unsecured claims in the amounts of $126 million and $3 million were granted to the International Union of Electronic, Electrical, Salaried, Machine and Furniture Workers-Communication Workers of America (“IUE-CWA”) and the United Steel, Paper and Forestry, Rubber, Manufacturing, Energy, Allied Industrial and Service Workers International Union and its Local Union 87L (the “USW”), respectively, under the respective labor settlement agreements.
Special attrition programs—The reorganization gain recorded during the year ended December 31, 2008 included $491 million related to the 2006 and 2007 special attrition programs because these programs were directly related to the chapter 11 cases. On September 30, 2008, Old GM reimbursed the Predecessor $230 million related to the funding of various 2007 U.S. hourly workforce special attrition programs, consistent with the provisions of the U.S. labor union settlement agreements. Additionally, previously recognized Old GM general unsecured claims of $333 million primarily related to the 2006 U.S. hourly workforce attrition programs previously reimbursed by Old GM were forgiven and subsumed in the overall $2.5 billion allowed general unsecured claim granted to GM, as discussed above. As of December 31, 2008, the Predecessor’s receivable from Old GM related to the funding of the UAW buydown arrangements under the 2007 U.S. hourly workforce special attrition programs was $68 million. Refer to Note 13. U.S. Employee Workforce Transition Programs for more information.
Other, net—Other, net of $69 million recognized during 2008 includes a $51 million reimbursement from Old GM related to the U.S. labor settlement agreement with the IUE-CWA, dated August 5, 2007, of which $25 million was reimbursement of costs and expenses incurred by the Predecessor in connection with the execution and performance of the IUE-CWA labor agreement and $26 million was reimbursement to the Predecessor of a portion of the allowed claim under the IUE-CWA labor agreement.
Master restructuring agreement—The Amended MRA was intended to, among other things, govern certain aspects of the commercial relationship between the Predecessor and Old GM following the effectiveness of the Amended MRA and continuing after the Predecessor’s emergence from chapter 11. The Amended MRA
addressed the scope of Old GM’s existing and future business awards to the Predecessor and related pricing and sourcing arrangements, Old GM’s commitments with respect to reimbursement of specified ongoing U.S. hourly workforce labor costs, the disposition of certain of the Predecessor’s facilities, and the treatment of existing commercial agreements between the Predecessor and Old GM. The MDA superseded the Amended MRA, and the Amended MRA was terminated as of the Acquisition Date (except as set forth in the MDA).
Upon effectiveness of the Amended MRA in 2008, the Predecessor received net cash from GM totaling $559 million and recognized related pre-tax earnings of $355 million during the three and nine months ended September 30, 2008, of which $189 million was recorded in GM settlement in operating expenses and $166 million was recorded in discontinued operations.
The following table shows each component of the pre-tax earnings recorded upon effectiveness of the Amended MRA in 2008 and the cash received on September 30, 2008:
| | | | | | | | |
| | | GM
Settlement
Gain in Pre-
Tax Earnings | | | Cash Received
From GM | |
| | | (in millions) | |
Reimbursement of hourly labor costs | | $ | 272 | | | $ | 273 | |
Production cash burn breakeven reimbursement | | | 81 | | | | 74 | |
Working capital backstop – Steering Business | | | — | | | | 210 | |
Other | | | 2 | | | | 2 | |
| | | | | | | | |
Total, net | | $ | 355 | | | $ | 559 | |
| | | | | | | | |
Continuing operations | | $ | 189 | | | | | |
Discontinued operations | | $ | 166 | | | | | |
Existing and future business awards and related matters—The Amended MRA (i) addressed the scope of existing business awards, related pricing agreements, and extensions of certain existing supply agreements, including Old GM’s ability to move production to alternative suppliers, and the reorganized Predecessor’s rights to bid and qualify for new business awards; (ii) eliminated the requirement to implement price-downs with respect to certain businesses and restricted Old GM’s ability to re-source products manufactured at core U.S. operations through at least December 31, 2011 and Mexican operations through December 31, 2010; (iii) contained a commitment by Old GM to provide the Predecessor with an annual keep site facilitation fee of $110 million in 2009 and 2010 which was not contingent on the Predecessor’s emergence from chapter 11, payable in quarterly installments during these periods, which, consistent with the Predecessor’s policy, was recognized in earnings over the applicable, future production periods; and (iv) contained commitments by Old GM concerning the sale of certain of the Predecessor’s non-core businesses and additional commitments by Old GM if certain of the Predecessor’s businesses and facilities were not sold or wound down by specified future dates. On March 31, 2009, June 30, 2009 and September 30, 2009, the Predecessor received quarterly installments of the annual keep site facilitation fee of $27.5 million, of which approximately $75 million was recorded as net sales during the Predecessor period from January 1 to October 6, 2009.
Reimbursement of hourly labor costs—Old GM agreed to reimburse the Predecessor for hourly workforce labor costs in excess of $26 per hour, excluding certain costs, including hourly pension and OPEB contributions provided under the supplemental wage agreement, at specified UAW manufacturing facilities retained by the Predecessor. The economic substance of this provision of the Amended MRA was to lower the Predecessor’s labor costs at specified UAW-represented manufacturing facilities to $26 per hour, excluding certain costs, in order to maintain more competitive operations in the U.S. During the period from January 1 to October 6, 2009, the Predecessor received $106 million of reimbursement from GM of hourly labor costs in excess of $26 per hour. The Predecessor recorded $50 million and $25 million as a reduction to operating expenses during the period from January 1 to October 6, 2009 and the year ended December 31, 2008, respectively. The remaining $31 million was recognized in 2009 as a reduction to operating expenses in discontinued operations.
Production cash burn breakeven reimbursement—The Predecessor had agreed to continue manufacturing at certain non-core sites to meet Old GM’s production requirements and Old GM had agreed to provide the Predecessor with operating cash flow breakeven support, or production cash burn breakeven (“PCBB”), from January 1, 2008 through site-specified time periods to compensate the Predecessor for keeping these sites in production. Additionally, Old GM had agreed to reimburse capital spending in excess of $50,000 per month at the PCBB sites from January 1, 2008 through site-specified time periods. GM reimbursed the Predecessor $74 million on September 30, 2008 for the retroactive portion of the PCBB payments through August 2008. For the year ended December 31, 2008, the Predecessor recognized $11 million related to the retroactive portion of the PCBB payments as a reduction of operating expenses included in GM settlement. PCBB reimbursement, including capital spending, from Old GM was recognized contemporaneously as incurred, and was treated as a reduction to operating expenses, fixed assets or discontinued operations, as appropriate. During the period from January 1 to October 6, 2009, the Predecessor received $150 million of PCBB reimbursement from GM, of which $86 million was recorded as income from discontinued operations and $2 million was recorded as a reduction to the Predecessor’s operating expenses.
Working capital backstop—Steering Business—Old GM agreed to provide payments to the Predecessor for the Steering Business if the sales value was less than defined estimated working capital amounts of the businesses. In addition, Old GM agreed to provide payments to the Predecessor related to the Steering Business if it was not sold prior to the effectiveness of the MRA. Old GM provided a $210 million advance on working capital recovery to the Predecessor related to the Steering Business on September 30, 2008 which was recorded as a deferred liability upon receipt. As further discussed above, under the terms of the Modified Plan, Old GM acquired the Steering Business from the Predecessor on the Acquisition Date. The Steering Business was reported as a discontinued operation, refer to Note 21. Discontinued Operations for further information.
Reimbursement of hourly workers’ compensation and other benefits—Old GM agreed to reimburse the Predecessor for all current and future workers compensation, disability, supplemental unemployment benefits, and severance obligations paid by the Predecessor after January 1, 2009 in relation to all current and former UAW-represented hourly active, inactive, and retired employees. Consistent with the substance of the provision, the Predecessor recognized anticipated, future reimbursements from Old GM contemporaneously with the Predecessor’s incurrence of related cash payments. During the period from January 1 to October 6, 2009, the Predecessor received related reimbursements from GM of $28 million. The Predecessor recorded $35 million as a reduction to operating expenses during the period from January 1 to October 6, 2009.
Pensions—Subsequent to entering chapter 11, the Predecessor had generally limited its contributions to the Hourly Plan, the Delphi Retirement Program for Salaried Employees (the “Salaried Plan”), the ASEC Manufacturing Retirement Program, the Delphi Mechatronics Retirement Program, the PHI Bargaining Retirement Plan and the PHI Non-Bargaining Retirement Plan (collectively, the “U.S. Pension Plans”) to “normal cost” contributions, which are less than the minimum funding requirements established by the Internal Revenue Code and the Employee Retirement Income Security Act (“ERISA”). Following the Court’s approval of the Hourly and Salaried Pension Program Modification Motion on September 23, 2008, the Salaried Plan, the Mechatronic Plan, the ASEC Plan, and the PHI Non-Bargaining Plan were frozen effective September 30, 2008. The Hourly Plan was frozen on November 30, 2008. By freezing the U.S. pension plans, the Predecessor halted the accrual of normal cost payments going forward, thereby preserving liquidity.
On July 21, 2009, the Predecessor announced that the Pension Benefit Guaranty Corporation (the “PBGC”) was expected to make a determination whether to initiate the termination process for the U.S. pension plans. Also on July 21, 2009, the Predecessor reached agreement with the PBGC to settle the PBGC’s various claims against the Predecessor and its global affiliates (the “Predecessor-PBGC Settlement Agreement”). Pursuant to that settlement agreement, the PBGC received a $3 billion allowed general unsecured non-priority claim which received the same treatment given to holders of general unsecured claims as set forth in the Modified Plan. The PBGC received additional consideration from GM which, together with the PBGC’s allowed unsecured claim, was in consideration for, among other things, a full release of all causes of action, claims, and liens; the liability
to be assumed by the PBGC related to the possible termination of the U.S. pension plans; and the withdrawal of all notices of liens filed by the PBGC against the Predecessor’s global non-U.S. affiliates. The Predecessor-PBGC Settlement Agreement, which was subject to Court approval, was filed with the Court on July 21, 2009. In connection with seeking Court approval of the Predecessor-PBGC Settlement Agreement, the Predecessor sought a finding by the Court that such termination did not violate the Labor MOUs, the Union 1113/1114 Settlement Approval Orders, or the Local Agreement Between Delphi Connection Systems (formerly Packard-Hughes Interconnect) And Electronic And Space Technicians Local 1553, and any modifications thereto. On July 30, 2009, the Court approved the Predecessor-PBGC Settlement Agreement and made the finding that such agreement did not violate the Predecessor’s collective bargaining agreements. On August 10, 2009, the PBGC and the Predecessor executed a termination and trusteeship agreement, retroactive to July 31, 2009, with respect to the U.S. pension plans.
Labor—During the second quarter of 2007, the Predecessor signed an agreement with the UAW, and during the third quarter of 2007, the Predecessor signed agreements with the remainder of its principal U.S. labor unions, which were ratified by the respective unions and approved by the Court in the third quarter of 2007. Among other things, as approved and confirmed by the Court, this series of settlement agreements or memoranda of understanding among the Predecessor, its unions, and Old GM settled the Debtors’ motion under sections 1113 and 1114 of the Bankruptcy Code seeking authority to reject their U.S. labor agreements and to modify retiree benefits (the “1113/1114 Motion”). As applicable, these agreements also, among other things, modify, extend or terminate provisions of the existing collective bargaining agreements among the Predecessor and its unions and cover issues such as site plans, workforce transition and legacy pension and other postretirement benefits obligations as well as other comprehensive transformational issues.
Portions of these agreements became effective in 2007, and the remaining portions were tied to the effectiveness of the Original GSA and the Original MRA, and substantial consummation of a plan of reorganization approved by the Court. However, as noted above, the Predecessor filed amendments to the GSA and the MRA, which were approved by the Court and became effective on September 29, 2008.
Among other things, these agreements generally provided certain members of the union labor workforce options to retire, accept a voluntary severance package or accept lump sum payments in return for lower hourly wages. Refer to Note 13. U.S. Employee Workforce Transition Programs for more information.
Portfolio—In March 2006, the Predecessor identified non-core product lines and manufacturing sites that did not fit into its future, strategic framework, including brake and chassis systems, catalysts, cockpits and instrument panels, door modules and latches, ride dynamics, steering, halfshafts, wheel bearings and power products. With the exception of the catalyst and global exhaust product lines, included in the Powertrain Systems segment, the Company’s non-core product lines were included in discontinued operations, refer to Note 21. Discontinued Operations.
Costs recorded by the Predecessor related to the transformation plan for non-core product lines include employee termination benefits and other exit costs and U.S. employee workforce transition program charges and are further described in Note 11. Restructuring, Note 13. U.S. Employee Workforce Transition Programs and Note 21. Discontinued Operations.
Cost structure—The Predecessor implemented restructuring initiatives in pursuit of its transformation objective to reduce selling, general and administrative expenses. These initiatives included changing the model for delivery of financial services, information technology and certain sales administration activities; as well as the reduction of the global salaried workforce by leveraging attrition and using salaried separation plans, and the realignment of certain salaried benefit programs with business conditions. While the continually challenging economic environment persisted in 2009, further restructuring initiatives continued to be required. The Predecessor implemented a number of cash conservation measures, including a short-term salaried layoff plan, the suspension of 2009 pay increases and annual incentive payments for eligible employees, the cessation of
health care and life insurance benefits in retirement to salaried employees and retirees effective March 31, 2009 and a decrease in salaried severance payments in 2009. The PBGC’s termination of the U.S. Pension Plans effective July 31, 2009 (refer to Note 14. Pension and Other Postretirement Benefits) also had the effect of reducing the Predecessor’s cash needs.
A summary of inventories is shown below:
| | | | | | | | |
| | | Successor | |
| | | December 31,
2010 | | | December 31,
2009 | |
| | | (in millions) | |
Productive material | | $ | 544 | | | $ | 494 | |
Work-in-process | | | 159 | | | | 133 | |
Finished goods | | | 285 | | | | 249 | |
| | | | | | | | |
Total | | $ | 988 | | | $ | 876 | |
| | | | | | | | |
Other current assets consisted of the following:
| | | | | | | | |
| | | Successor | |
| | | December 31,
2010 | | | December 31,
2009 | |
| | | (in millions) | |
Income and other taxes receivable | | $ | 208 | | | $ | 184 | |
Prepaid insurance and other expenses | | | 87 | | | | 95 | |
Deferred income taxes (Note 16) | | | 136 | | | | 196 | |
Deposits to vendors | | | 12 | | | | 25 | |
Notes receivable | | | 33 | | | | 21 | |
Derivative financial instruments (Note 18) | | | 59 | | | | 4 | |
Other | | | 20 | | | | 18 | |
| | | | | | | | |
Total | | $ | 555 | | | $ | 543 | |
| | | | | | | | |
Other long-term assets consisted of the following:
| | | | | | | | |
| | | Successor | |
| | | December 31,
2010 | | | December 31,
2009 | |
| | | (in millions) | |
Deferred income taxes (Note 16) | | $ | 183 | | | $ | 276 | |
Notes receivable | | | 31 | | | | 33 | |
Income and other taxes receivable | | | 87 | | | | 110 | |
Deferred charges | | | 4 | | | | 5 | |
Other investments | | | 13 | | | | 19 | |
Derivative financial instruments (Note 18) | | | 17 | | | | 2 | |
Other | | | 68 | | | | 47 | |
| | | | | | �� | | |
Total | | $ | 403 | | | $ | 492 | |
| | | | | | | | |
| 6. | INVESTMENTS IN AFFILIATES |
As part of Delphi’s operations, it has investments in 10 non-consolidated affiliates accounted for under the equity method of accounting. These affiliates are not publicly traded companies and are located primarily in
South Korea, China and Mexico. Delphi’s ownership percentages vary generally from approximately 20% to 50%, with the most significant investments in Korea Delphi Automotive Systems Corporation (of which Delphi owns approximately 50%), Daesung Electric Co. Ltd (of which Delphi owns approximately 50%), Delphi-TVS Diesel Systems Ltd (of which Delphi owns approximately 50%), and Promotora de Partes Electricas Automotrices, S.A. de C.V. (of which Delphi owns approximately 40%). The aggregate investment in non-consolidated affiliates was $281 million and $270 million at December 31, 2010 and 2009, respectively. Dividends of $10 million, $0 million, $8 million and $11 million for the year ended December 31, 2010, the periods from August 19 to December 31, 2009 and January 1 to October 6, 2009 and the year ended December 31, 2008, respectively, have been received from non-consolidated affiliates. A $23 million impairment charge was recorded in the period from January 1 to October 6, 2009 related to Delphi’s investment in a non-consolidated affiliate.
The following is a summary of the combined financial information of significant affiliates accounted for under the equity method as of December 31, 2010 and 2009 and for the year ended December 31, 2010, the periods from August 19 to December 31, 2009 and January 1 to October 6, 2009 and the year ended December 31, 2008 (unaudited):
| | | | | | | | |
| | | Successor | |
| | | December 31, | |
| | | 2010 | | | 2009 | |
| | | (in millions) | |
Current assets | | $ | 888 | | | $ | 711 | |
Non-current assets | | | 545 | | | | 490 | |
| | | | | | | | |
Total assets | | $ | 1,433 | | | $ | 1,201 | |
| | | | | | | | |
Current liabilities | | $ | 587 | | | $ | 376 | |
Non-current liabilities | | | 227 | | | | 271 | |
Stockholders’ equity | | | 619 | | | | 554 | |
| | | | | | | | |
Total liabilities and stockholders’ equity | | $ | 1,433 | | | $ | 1,201 | |
| | | | | | | | |
| | | | | | | | | | | | | | | | | | |
| | | Successor | | | | | Predecessor | |
| | | Year ended
December 31,
2010 | | | Period from
August 19 to
December 31,
2009 | | | | | Period from
January 1 to
October 6,
2009 | | | Year ended
December 31,
2008 | |
| | | (in millions) | | | | | (in millions) | |
Net sales | | $ | 1,750 | | | $ | 369 | | | | | $ | 866 | | | $ | 2,477 | |
Gross profit | | $ | 215 | | | $ | 53 | | | | | $ | 56 | | | $ | 273 | |
Net income (loss) | | $ | 41 | | | $ | 5 | | | | | $ | (44 | ) | | $ | 53 | |
A summary of transactions with affiliates is shown below:
| | | | | | | | | | | | | | | | | | |
| | | Successor | | | | | Predecessor | |
| | | Year ended
December 31,
2010 | | | Period from
August 19 to
December 31,
2009 | | | | | Period from
January 1 to
October 6,
2009 | | | Year ended
December 31,
2008 | |
| | | (in millions) | | | | | (in millions) | |
Sales to affiliates | | $ | 62 | | | $ | 7 | | | | | $ | 8 | | | $ | 48 | |
Purchases from affiliates | | $ | 315 | | | $ | 51 | | | | | $ | 90 | | | $ | 267 | |
Property, net consisted of:
| | | | | | | | | | | | |
| | | | | | Successor | |
| | | Estimated Useful
Lives (Years) | | | December 31, | |
| | | | 2010 | | | 2009 | |
| | | | | | (in millions) | |
Land | | | — | | | $ | 163 | | | $ | 173 | |
Land and leasehold improvements | | | 3-20 | | | | 79 | | | | 61 | |
Buildings | | | 40 | | | | 492 | | | | 556 | |
Machinery, equipment, and tooling | | | 3-20 | | | | 1,470 | | | | 1,026 | |
Furniture and office equipment | | | 3-10 | | | | 104 | | | | 72 | |
Construction in progress | | | — | | | | 246 | | | | 195 | |
| | | | | | | | | | | | |
Total | | | | | | | 2,554 | | | | 2,083 | |
Less: accumulated depreciation | | | | | | | (487 | ) | | | (123 | ) |
| | | | | | | | | | | | |
Total property, net | | | | | | $ | 2,067 | | | $ | 1,960 | |
| | | | | | | | | | | | |
Delphi evaluates the recoverability of certain long-lived assets whenever events or changes in circumstances indicate that the carrying amount may not be recoverable. Estimates of future cash flows used to test the recoverability of long-lived assets include separately identifiable undiscounted cash flows expected to arise from the use and eventual disposition of the assets. Where estimated future cash flows are less than the carrying value of the assets, impairment losses are recognized based on the amount by which the carrying value exceeds the fair value of the assets. The fair value of the assets was determined based on the “held for use” classification. Delphi may incur significant impairment charges or losses on divestitures upon these assets being classified as “held for sale.” The following table summarizes the impairment charges included in cost of sales related to long-lived assets held for use for the year ended December 31, 2010, the periods from August 19 to December 31, 2009 and January 1 to October 6, 2009 and for the year ended December 31, 2008:
| | | | | | | | | | | | | | | | | | |
| | | Successor | | | | | Predecessor | |
Segment | | Year ended
December 31,
2010 | | | Period from
August 19 to
December 31,
2009 | | | | | Period from
January 1 to
October 6,
2009 | | | Year ended
December 31,
2008 | |
| | | (in millions) | | | | | (in millions) | |
Electronics and Safety | | $ | — | | | $ | — | | | | | $ | 37 | | | $ | 15 | |
Powertrain Systems | | | — | | | | 12 | | | | | | — | | | | — | |
Electrical/Electronic Architecture | | | — | | | | — | | | | | | 1 | | | | 2 | |
Thermal Systems | | | — | | | | 5 | | | | | | 2 | | | | 10 | |
Eliminations and Other | | | — | | | | — | | | | | | 1 | | | | — | |
| | | | | | | | | | | | | | | | | | |
Continuing operations | | | — | | | | 17 | | | | | | 41 | | | | 27 | |
Discontinued operations | | | — | | | | — | | | | | | — | | | | 10 | |
| | | | | | | | | | | | | | | | | | |
Total | | $ | — | | | $ | 17 | | | | | $ | 41 | | | $ | 37 | |
| | | | | | | | | | | | | | | | | | |
During the period from January 1 to October 6, 2009, the Predecessor’s Electronics and Safety segment recorded $37 million of long-lived asset impairment charges related to the exit of its occupant protection systems business in North America and Europe.
| 8. | INTANGIBLE ASSETS AND GOODWILL |
As further described in Note 1. General and Acquisition of Predecessor Businesses, Delphi acquired the following intangible assets in conjunction with the Acquisition:
| | | | | | | | | | | | | | | | | | | | | | | | |
| | | As of December 31, 2010 | | | As of December 31, 2009 | |
| | | Gross
Carrying
Amount | | | Accumulated
Amortization | | | Net
Carrying
Amount | | | Gross
Carrying
Amount | | | Accumulated
Amortization | | | Net
Carrying
Amount | |
| | | (in millions) | | | (in millions) | |
Amortized intangible assets: | | | | | | | | | | | | | | | | | | | | | | | | |
Patents and developed technology | | $ | 455 | | | $ | 48 | | | $ | 407 | | | $ | 442 | | | $ | 9 | | | $ | 433 | |
Customer relationships | | | 137 | | | | 32 | | | | 105 | | | | 140 | | | | 6 | | | | 134 | |
Trade names | | | 95 | | | | 6 | | | | 89 | | | | 97 | | | | 1 | | | | 96 | |
| | | | | | | | | | | | | | | | | | | | | | | | |
Total | | | 687 | | | | 86 | | | | 601 | | | | 679 | | | | 16 | | | | 663 | |
Unamortized intangible assets: | | | | | | | | | | | | | | | | | | | | | | | | |
In-process research & development | | | 64 | | | | — | | | | 64 | | | | 87 | | | | — | | | | 87 | |
| | | | | | | | | | | | | | | | | | | | | | | | |
Total | | $ | 751 | | | $ | 86 | | | $ | 665 | | | $ | 766 | | | $ | 16 | | | $ | 750 | |
| | | | | | | | | | | | | | | | | | | | | | | | |
Delphi incurs costs to renew or extend the term of the acquired intangible assets which are recognized as expense and not capitalized. The estimated useful lives of the Company’s amortized intangible assets range from 6 to 20 years. Amortization expense is estimated to be $70 million annually for the years ending December 31, 2011 and 2012, $68 million for the year ending December 31, 2013, $60 million for the year ending December 31, 2014 and $52 million for the year ending December 31, 2015.
A roll-forward of the gross carrying amounts for the years ended December 31, 2010 and 2009 is presented below:
| | | | | | | | |
| | | 2010 | | | 2009 | |
| | | (in millions) | |
Balance at January 1 | | $ | 766 | | | $ | — | |
Acquisitions | | | — | | | | 766 | |
Write-offs | | | (3 | ) | | | — | |
Foreign currency translation and other | | | (12 | ) | | | — | |
| | | | | | | | |
Balance at December 31 | | $ | 751 | | | $ | 766 | |
| | | | | | | | |
A roll-forward of the accumulated amortization for the years ended December 31, 2010 and 2009 is presented below:
| | | | | | | | |
| | | 2010 | | | 2009 | |
| | | (in millions) | |
Balance at January 1 | | $ | 16 | | | $ | — | |
Provisions | | | 70 | | | | 16 | |
Non-recurring charges (write-offs) | | | — | | | | — | |
Foreign currency translation and other | | | — | | | | — | |
| | | | | | | | |
Balance at December 31 | | $ | 86 | | | $ | 16 | |
| | | | | | | | |
As further described in Note 1. General and Acquisition of Predecessor Businesses, as a result of determining the fair value of assets acquired and liabilities assumed under the Acquisition, the January 1, 2009 balance of goodwill of $62 million was adjusted and there is no goodwill recognized in the consolidated balance sheets of the Successor as of December 31, 2010 and 2009.
During the year ended December 31, 2008, declining market conditions caused the implied fair values of the Electrical/Electronic Architecture segment and the Electronics and Safety segment to be less than their respective book values, which resulted in goodwill impairment, totaling $168 million and $157 million, respectively, related to the respective segments.
Accrued liabilities consisted of the following:
| | | | | | | | |
| | | Successor | |
| | | December 31, | |
| | | 2010 | | | 2009 | |
| | | (in millions) | |
Payroll-related obligations | | $ | 203 | | | $ | 199 | |
Employee benefits, including current pension obligations | | | 167 | | | | 56 | |
Income and other taxes payable | | | 220 | | | | 248 | |
Warranty obligations (Note 10) | | | 243 | | | | 181 | |
Restructuring (Note 11) | | | 115 | | | | 216 | |
Customer deposits | | | 22 | | | | 32 | |
Deferred income taxes (Note 16) | | | 4 | | | | 20 | |
Other | | | 291 | | | | 300 | |
| | | | | | | | |
Total | | $ | 1,265 | | | $ | 1,252 | |
| | | | | | | | |
Other long-term liabilities consisted of the following:
| | | | | | | | |
| | | Successor | |
| | | December 31, | |
| | | 2010 | | | 2009 | |
| | | (in millions) | |
Environmental (Note 15) | | $ | 18 | | | $ | 18 | |
Extended disability benefits | | | 8 | | | | 13 | |
Warranty obligations (Note 10) | | | 119 | | | | 151 | |
Restructuring (Note 11) | | | 54 | | | | 13 | |
Payroll-related obligations | | | 11 | | | | 12 | |
Accrued income taxes | | | 52 | | | | 61 | |
Long-term debt (Note 12) | | | 71 | | | | 94 | |
Deferred income taxes (Note 16) | | | 178 | | | | 275 | |
Other | | | 76 | | | | 67 | |
| | | | | | | | |
Total | | $ | 587 | | | $ | 704 | |
| | | | | | | | |
Expected warranty costs for products sold are recognized principally at the time of sale of the product based on estimates of the amount that will eventually be required to settle such obligations. These accruals are based on factors such as past experience, production changes, industry developments and various other considerations. These estimates are adjusted from time to time based on facts and circumstances that impact the status of existing claims.
Although Delphi has recognized its best estimate for its total aggregate warranty reserves across all of its operating segments as of December 31, 2010, the estimated reasonably possible amounts to ultimately resolve all matters is approximately $75 million in excess of the recorded reserves.
The table below summarizes the activity in the product warranty liability for the year ended December 31, 2010 and the periods from August 19 to December 31, 2009 and January 1 to October 6, 2009:
| | | | | | | | | | | | | | |
| | | Successor | | | | | Predecessor | |
| | | Year ended
December 31,
2010 | | | Period from
August 19 to
December 31,
2009 | | | | | Period from
January 1 to
October 6, 2009 | |
| | | (in millions) | | | | | (in millions) | |
Accrual balance at beginning of period | | $ | 332 | | | $ | — | | | | | $ | 364 | |
Fair value of liabilities assumed in the Acquisition | | | — | | | | 344 | | | | | | — | |
Provision for estimated warranties incurred during the period | | | 62 | | | | 9 | | | | | | 41 | |
Provision for changes in estimate for preexisting warranties | | | 80 | | | | 15 | | | | | | 73 | |
Settlements made during the period (in cash or in kind) | | | (99 | ) | | | (35 | ) | | | | | (92 | ) |
Gain from reorganization | | | — | | | | — | | | | | | (395 | ) |
Foreign currency translation and other | | | (13 | ) | | | (1 | ) | | | | | 9 | |
| | | | | | | | | | | | | | |
Accrual balance at end of period | | $ | 362 | | | $ | 332 | | | | | $ | — | |
| | | | | | | | | | | | | | |
In 2009, Delphi received information regarding potential warranty claims related to certain components supplied by Delphi’s Powertrain segment. Delphi recorded its best estimate of the warranty obligation related to this matter as of December 31, 2010 and 2009, respectively, and during 2010 reflected a change in the previous estimate of probable loss related to this matter by recognizing warranty expense in cost of sales of $75 million. This adjustment resulted in a corresponding $75 million decrease in net income attributable to Delphi, and the per unit impact for the Class A, B and C membership interests were $11.25, $137.52, and $65.63, respectively.
Refer to Note 15. Commitments and Contingencies, Ordinary Business Litigation for additional disclosure regarding warranty matters.
Delphi continually evaluates alternatives to align its business with the changing needs of its customers and to lower the operating costs of the Company. This includes the realignment of its existing manufacturing capacity, facility closures, or similar actions in the normal course of business. These actions may result in voluntary or involuntary employee termination benefits, which are mainly pursuant to union or other contractual agreements. Voluntary termination benefits are accrued when an employee accepts the related offer. Involuntary termination benefits are accrued when Delphi commits to a termination plan and the benefit arrangement is communicated to affected employees, or when liabilities are determined to be probable and estimable, depending on the existence of a substantive plan for severance or termination. Contract termination costs are recorded when contracts are terminated or when Delphi ceases to use the leased facility and no longer derives economic benefit from the contract. All other exit costs are accrued when incurred.
Delphi’s restructuring costs are undertaken as necessary to execute management’s strategy, streamline operations, take advantage of available capacity and resources, and ultimately achieve net cost reductions. These activities generally fall in one of two categories:
| | (1) | Realignment of existing manufacturing capacity and closure of facilities and other exit or disposal activities, as it relates to executing the Company’s strategy in the normal course of business. |
| | (2) | Transformation plan activities, including selling or winding down non-core product lines, transforming the salaried workforce to reduce general and administrative expenses. |
The following table summarizes the restructuring charges recorded for the year ended December 31, 2010, the periods from August 19 to December 31 and January 1 to October 6, 2009 and the year ended December 31, 2008 by operating segment:
| | | | | | | | | | | | | | | | | | |
| | | Successor | | | | | Predecessor | |
| Segment | | Year ended
December 31,
2010 | | | Period from
August 19 to
December 31,
2009 | | | | | Period from
January 1 to
October 6,
2009 | | | Year ended
December 31,
2008 | |
| | | (in millions) | | | | | (in millions) | |
Electronics and Safety | | $ | 29 | | | $ | 20 | | | | | $ | 91 | | | $ | 150 | |
Powertrain Systems | | | 49 | | | | 50 | | | | | | 45 | | | | 69 | |
Electrical/Electronic Architecture | | | 94 | | | | 50 | | | | | | 99 | | | | 82 | |
Thermal Systems | | | 52 | | | | 5 | | | | | | 11 | | | | 25 | |
Eliminations and Other | | | — | | | | 1 | | | | | | (11 | ) | | | — | |
| | | | | | | | | | | | | | | | | | |
Continuing operations | | | 224 | | | | 126 | | | | | | 235 | | | | 326 | |
Discontinued operations | | | — | | | | — | | | | | | 14 | | | | 146 | |
| | | | | | | | | | | | | | | | | | |
Total | | $ | 224 | | | $ | 126 | | | | | $ | 249 | | | $ | 472 | |
| | | | | | | | | | | | | | | | | | |
The table below summarizes the activity in the restructuring liability for the periods from January 1 to October 6, 2009 and August 19 to December 31, 2009 and the year ended December 31, 2010:
| | | | | | | | | | | | |
| | | Employee
Termination
Benefits
Liability | | | Other Exit
Costs Liability | | | Total | |
| | | (in millions) | |
Predecessor balance at December 31, 2008 | | $ | 205 | | | $ | 45 | | | $ | 250 | |
Provision for estimated expenses incurred during the period | | | 216 | | | | 55 | | | | 271 | |
Provision for changes in estimates for preexisting programs | | | (21 | ) | | | (1 | ) | | | (22 | ) |
Foreign currency and other | | | (1 | ) | | | (5 | ) | | | (6 | ) |
Payments made during the period | | | (159 | ) | | | (66 | ) | | | (225 | ) |
Gain from reorganization | | | (240 | ) | | | (28 | ) | | | (268 | ) |
| | | | | | | | | | | | |
Accrual balance at October 6, 2009 | | $ | — | | | $ | — | | | $ | — | |
| | | | | | | | | | | | |
Fair value of liabilities assumed in the Acquisition | | | 240 | | | | 21 | | | | 261 | |
Provision for estimated expenses incurred during the period | | | 121 | | | | 6 | | | | 127 | |
Provision for changes in estimates for preexisting programs | | | (1 | ) | | | — | | | | (1 | ) |
Payments made during the period | | | (141 | ) | | | (8 | ) | | | (149 | ) |
Foreign currency and other | | | (9 | ) | | | — | | | | (9 | ) |
| | | | | | | | | | | | |
Accrual balance at December 31, 2009 | | $ | 210 | | | $ | 19 | | | $ | 229 | |
| | | | | | | | | | | | |
Provision for estimated expenses incurred during the period | | | 194 | | | | 31 | | | | 225 | |
Provision for changes in estimates for preexisting programs | | | (1 | ) | | | — | | | | (1 | ) |
Payments made during the period | | | (260 | ) | | | (31 | ) | | | (291 | ) |
Foreign currency and other | | | 5 | | | | 2 | | | | 7 | |
| | | | | | | | | | | | |
Accrual balance at December 31, 2010 | | $ | 148 | | | $ | 21 | | | $ | 169 | |
| | | | | | | | | | | | |
Delphi and the Predecessor have initiated several programs to streamline operations and lower costs. The following are details of significant charges during 2010.
| | • | | Realignment of existing manufacturing capacity and closure of facilities. As part of Delphi’s ongoing efforts to lower costs and operate efficiently, the Company recorded $28 million of restructuring costs in North America, primarily related to the Electrical/Electronic Architecture segment’s continued |
| | efforts to reduce the workforce. The four reporting segments recorded $174 million of restructuring costs in conjunction with workforce reduction and programs related to the rationalization of manufacturing and engineering processes, including plant closures, primarily in Europe. The Electronics and Safety segment also incurred $8 million of costs related to the ongoing sales and wind-down of its occupant protection systems businesses during the year ended December 31, 2010. |
The following are details of significant charges during 2009.
| | • | | Realignment of existing manufacturing capacity and closure of facilities. As part of Delphi and the Predecessor’s ongoing efforts to lower costs and operate efficiently, the Electronics and Safety, Powertrain Systems, Electrical/Electronic Architecture and Thermal Systems segments executed initiatives to realign manufacturing operations within North America to lower cost markets and to reduce the workforce in line with the realigned manufacturing operations, and incurred approximately $34 million and $69 million of restructuring costs during the periods from August 19 to December 31, 2009 and January 1 to October 6, 2009, respectively. Additionally, European, South American and Asian operations in the Electronics and Safety and Electrical/Electronic Architecture segments incurred $78 million and $99 million of restructuring costs in the periods from August 19 to December 31, 2009 and January 1 to October 6, 2009, respectively, in conjunction with workforce reductions and programs related to the rationalization of manufacturing and engineering processes. Additionally, the Electronics and Safety segment incurred $5 million and $7 million of costs related to upcoming sales and wind-down of its occupant protection systems business in North America and Europe during periods from August 19 to December 31, 2009 and January 1 to October 6, 2009, respectively. |
| | • | | Transformation plan activities. As part of an effort to transform its salaried workforce and reduce general and administrative expenses, Delphi and the Predecessor identified certain salaried employees in North America during periods from August 19 to December 31, 2009 and January 1 to October 6, 2009 for involuntary separation and incurred $5 million and $58 million, respectively, in related employee termination benefits included in continuing operations. Delphi also incurred $6 million of U.S. salaried separations recorded in discontinued operations for the period from January 1 to October 6, 2009. As a result of the Amended MRA, $53 million of U.S. employee termination benefits were reimbursed by GM during the period from January 1 to October 6, 2009, of which $44 million and $9 million related to U.S. hourly separations and U.S. salaried separations, respectively. |
The following are details of significant charges during 2008.
| | • | | Realignment of existing manufacturing capacity and closure of facilities. As part of the Predecessor’s ongoing efforts to lower costs and operate efficiently, the Electronics and Safety segment transferred core products manufactured at a shared location in Portugal to a lower cost market and exit non-core products from that facility, and recognized employee termination benefits of $17 million during 2008. Additionally, the Electronics and Safety, Powertrain Systems, Electrical/Electronic Architecture and Thermal Systems segments executed initiatives to realign manufacturing operations within North America to lower cost markets, and incurred approximately $104 million of restructuring costs during 2008. In addition, the Electronics and Safety segment exited production of a non-profitable product line and recorded $22 million of contract termination costs. European operations in the Electronics and Safety and Electrical/Electronic Architecture segments incurred $12 million of restructuring costs in conjunction with workforce reductions and programs related to the rationalization of manufacturing and engineering process. The Powertrain Systems segment transferred certain operations to lower cost markets in eastern Europe and Asia Pacific during 2008 and incurred restructuring costs of $10 million. |
| | • | | Transformation plan activities. As part of an effort to transform its salaried workforce and reduce general and administrative expenses, the Predecessor identified certain salaried employees in North America during 2008 for involuntary separation and incurred $131 million in related employee termination benefits included in continuing operations, and incurred $31 million in discontinued operations. |
The following is a summary of debt outstanding as of December 31, 2010 and 2009:
| | | | | | | | |
| | | Successor | |
| | | 2010 | | | 2009 | |
| | | (in millions) | |
Accounts receivable factoring | | $ | 112 | | | $ | 110 | |
12.00%, unsecured notes, due 2014 | | | 47 | | | | 49 | |
German loan agreement | | | — | | | | 23 | |
Capital leases and other | | | 130 | | | | 214 | |
| | | | | | | | |
Total debt | | | 289 | | | | 396 | |
Less: current portion | | | (218 | ) | | | (302 | ) |
| | | | | | | | |
Long-term debt | | $ | 71 | | | $ | 94 | |
| | | | | | | | |
Under the terms of the Acquisition, (i) Delphi issued $41 million in senior unsecured five-year notes (the “Notes”) pursuant to a Note Purchase Agreement (the “NPA”) with an Acquisition Date fair value of $49 million and (ii) entered into a delayed draw term loan under the credit agreement (the “DDTL”) with a syndicate of lenders. The Notes pay 12% interest and mature on October 6, 2014 and are recorded at $47 million and $49 million in the consolidated balance sheet as of December 31, 2010 and 2009. The DDTL includes maximum available borrowing of $890 million, which is split into a U.S. tranche of up to $267 million in borrowings and a foreign tranche of up to $623 million in borrowings. There is no commitment fee associated with the DDTL, but, if drawn, Delphi is required to pay interest at the rate of LIBOR plus 6.0% per annum, with a minimum LIBOR amount of 2.0% per annum. The DDTL has a term of 5 years. A majority of the holders of the Notes and the lenders under the DDTL are related parties as holders of the Class A and Class B membership interests.
The U.S. tranche under the DDTL is guaranteed by each of Delphi’s U.S. direct and indirect parent companies and each of Delphi’s U.S. subsidiaries as well as certain foreign subsidiaries. The foreign tranche under the DDTL is currently guaranteed by each of the guarantors under the U.S. tranche. In addition, subject to legal and other customary limitations, the DDTL requires certain material foreign subsidiaries of Delphi to become guarantors under the foreign tranche and Delphi has begun to deliver such guarantees. The loans, guarantees and other obligations under the U.S. tranche are secured by substantially all of the assets of Delphi’s U.S. direct and indirect parent companies and each of Delphi’s U.S. subsidiaries. The loans, guarantees and other obligations under the foreign tranche are currently secured by all of the assets securing the U.S. tranche. Subject to legal and other customary limitations, the foreign tranche will be secured by substantially all of the assets of any material foreign subsidiaries of Delphi that become guarantors under the foreign tranche. The Notes are unsecured and are guaranteed by the same Delphi entities that guarantee the loans under the foreign tranche of the DDTL.
The NPA and the DDTL contain affirmative and negative covenants that impose restrictions on Delphi’s financial and business operations, including Delphi’s ability, among other things, to incur or secure other debt, make investments, sell assets, pay dividends or repurchase stock or stock equivalents. As of December 31, 2010, Delphi was in compliance with the covenants of the NPA and DDTL, no amounts were drawn under the DDTL, and the full $890 million under the DDTL remained available.
Accounts receivable factoring—Various accounts receivable factoring facilities are maintained in Europe and are accounted for as short-term debt. These uncommitted factoring facilities are available through various financial institutions. As of December 31, 2010 and 2009, $112 million and $110 million, respectively, were outstanding under these accounts receivable factoring facilities.
Capital leases and other—As of December 31, 2010 and 2009, approximately $130 million and approximately $214 million, respectively, of other debt issued by certain international subsidiaries was outstanding, primarily related to bank lines in Asia Pacific and capital lease obligations.
German loan agreement—During 2009, two of Delphi’s German subsidiaries entered into a loan agreement for up to €125 million with a German financial institution. This loan was drawn upon as needed during 2009 and 2010 to fund restructuring initiatives, capital investment and other ongoing cash needs. As of December 31, 2009, $23 million was outstanding under the loan agreement. During 2010, Delphi repaid the loan in full and terminated the loan agreement.
Interest—Cash paid for interest related to amounts outstanding totaled $30 million, $8 million, $157 million and $442 million for the year ended December 31, 2010, the periods August 19 to December 31, 2009 and January 1 to October 6, 2009, and the year ended December 31, 2008, respectively.
The principal maturities of debt, at nominal value, excluding the accretion related to the Notes of approximately $6 million are as follows:
| | | | |
Year | | Debt and
Capital Lease
Obligations | |
| | | (in millions) | |
2011 | | $ | 218 | |
2012 | | | 9 | |
2013 | | | 4 | |
2014 | | | 43 | |
2015 | | | 5 | |
Thereafter | | | 4 | |
| | | | |
Total | | $ | 283 | |
| | | | |
| 13. | U.S. EMPLOYEE WORKFORCE TRANSITION PROGRAMS |
The following table represents the movement in the U.S. employee workforce transition program liability for 2009 and 2008:
| | | | |
U.S. Employee Workforce Transition Program Liability | | | |
| | | (in millions) | |
Balance at December 31, 2008 | | | 123 | |
Buy-down wage liability adjustment | | | (17 | ) |
Payments | | | (28 | ) |
Gain from reorganization | | | (78 | ) |
| | | | |
Balance at October 6, 2009 | | $ | — | |
| | | | |
Fair value of liabilities assumed in the Acquisition | | | 14 | |
Payments | | | (14 | ) |
| | | | |
Balance at December 31, 2009 | | $ | — | |
| | | | |
2008 Reimbursement
As discussed in Note 3. Elements of Predecessor Transformation Plan, the net reorganization gain recorded for the elements of the Amended GSA that were implemented during 2008, included $491 million related to GM’s reimbursement of costs incurred under the 2006 and 2007 special attrition programs. GM reimbursed the Predecessor $230 million related to the funding of various 2007 U.S. hourly workforce special attrition programs, consistent with the provisions of the U.S. labor union settlement agreements. Additionally, previously recognized GM general unsecured claims of $333 million primarily related to the 2006 U.S. hourly workforce attrition programs previously reimbursed by GM had been forgiven and were subsumed in the overall $2.5 billion allowed
general unsecured claim granted to GM, which was waived under the MDA. The following table details this component of the reorganization gain and cash received:
| | | | | | | | |
Amended GSA Effectiveness | | Reorganization
Gain | | | Cash | |
| | | (in millions) | |
Amounts reimbursed for buyouts | | $ | 68 | | | $ | 68 | |
Amounts reimbursed for retirement incentives | | | — | | | | 7 | |
Amounts reimbursed for buy-downs | | | 90 | | | | 155 | |
Forgiveness of 2006 special attrition program allowed claim | | | 333 | | | | — | |
| | | | | | | | |
Total | | $ | 491 | | | $ | 230 | |
| | | | | | | | |
| 14. | PENSION AND OTHER POSTRETIREMENT BENEFITS |
Prior to the PBGC termination of the U.S. pension plans, (as further discussed in Note 3. Elements of Predecessor Transformation Plan), the Predecessor sponsored pension plans covering employees in the U.S., which generally provided benefits of stated amounts for each year of service, as well as supplemental benefits for employees who qualified for retirement before normal retirement age. Certain employees also participated in non-qualified pension plans covering executives, which are based on targeted wage replacement percentages and are unfunded. The Predecessor froze the Salaried Plan, the Supplemental Executive Retirement Program (“SERP”), the ASEC Manufacturing Retirement Program, the Delphi Mechatronics Retirement Program and the PHI Non-Bargaining Retirement Plan effective September 30, 2008. Additionally, the Predecessor reached agreement with its labor unions resulting in a freeze of traditional benefit accruals under the Hourly Plan effective as of November 30, 2008.
On September 26, 2008, the Predecessor received the consent of its labor unions and approval from the Court to transfer certain assets and liabilities of the Hourly Plan to the GM Hourly-Rate Employee Pension Plan, pursuant to section 414(l) of the Internal Revenue Code (the “414(l) Net Liability Transfer”), as agreed under the Amended GSA. The 414(l) Net Liability Transfer was to occur in two separate steps. On September 29, 2008, the Predecessor completed the first step of the 414(l) Net Liability Transfer, transferring liabilities of approximately $2.6 billion and assets of approximately $0.5 billion of the Hourly Plan to the GM Hourly-Rate Employees Pension Plan, representing 30% and 10% of the projected benefit obligation and plan assets, respectively, as of September 29, 2008. The 414(l) Net Liability Transfer was sufficient to avoid an accumulated funding deficiency for the Hourly Plan for plan year ended September 30, 2008. In consideration of the first step of the 414(l) Net Liability Transfer, Old GM received an allowed administrative bankruptcy claim equivalent to 77.5% of the net unfunded liabilities transferred, or $1.6 billion. The first step of the 414(l) Net Liability Transfer was accounted for as a partial settlement of the Hourly Plan under the accounting guidance related to employer’s accounting for settlements and curtailments of defined benefit pension plans and for termination benefits in the third quarter of 2008. The Predecessor recognized a settlement loss of $494 million included in reorganization items in the consolidated statements of operations for the year ended December 31, 2008, which reflects the recognition of $494 million of previously unrecognized actuarial losses included in accumulated other comprehensive income. The amount of actuarial losses recognized represents the proportion of the projected benefit obligation transferred to Old GM relative to the total projected benefit obligation of the Hourly Plan.
The second step of the 414(l) Net Liability Transfer (the “Second Pension Transfer”) was to occur upon the effectiveness of an amended plan of reorganization. In July 2009, GM advised the Predecessor that it would not assume the Hourly Plan and would not complete the Second Pension Transfer. GM and the PBGC negotiated a separate release and waiver agreement regarding a possible initiation by the PBGC of the plan termination process for the Hourly Plan, which provides consideration to the PBGC for certain releases to be granted to, among others, GM, the Predecessor, and the Predecessor’s global affiliates. On July 22, 2009, the PBGC initiated the process to terminate the Hourly Plan and the U.S. salaried and subsidiary pension plans. The Predecessor recognized a pension curtailment and settlement loss of $2.8 billion included in reorganization items in the
consolidated statement of operations for the period ended October 6, 2009. This loss included the reversal of $5.2 billion of liabilities subject to compromise related to the U.S. pension plans offset by the recognition of $5.0 billion of related unamortized losses previously recorded in accumulated other comprehensive income and the recognition of a $3.0 billion allowed general unsecured non-priority claim granted to the PBGC. For additional information regarding the PBGC termination of the Hourly Plan and the U.S. salaried and subsidiary pension plans, refer to Note 3. Elements of Predecessor Transformation Plan.
On February 4, 2009, the Predecessor filed a motion with the Court seeking the authority to cease providing retiree OPEB benefits in retirement to salaried employees, retirees, and surviving spouses after March 31, 2009. On February 24, 2009, the Court provisionally approved the Predecessor’s motion to terminate such benefits effective March 31, 2009 based on the Court’s finding that the Predecessor had met its evidentiary burdens, subject to the appointment of a retirees’ committee (the “Retirees’ Committee”) to review whether it believes that any of the affected programs involved vested benefits (as opposed to “at will” or discretionary, unvested benefits). On March 11, 2009, the Court issued a final order approving the Predecessor’s motion to terminate salaried OPEB benefits. The Court approved a settlement agreement (the “Settlement”), between the Predecessor and the Retirees’ Committee and the Delphi Salaried Retirees’ Association (the “Association”) settling any and all rights for the parties to appeal the Court’s March 11, 2009 final order authorizing the Predecessor to terminate salaried OPEB benefits to the U.S. District Court for the Southern District of New York (the “District Court”). Pursuant to the Settlement, the Predecessor agreed to provide the Retirees’ Committee with consideration of $9 million to resolve pending litigation, including withdrawing the appeals of the Retirees’ Committee and the Association to the District Court. The consideration provided by the Predecessor under the Settlement included an initial $1 million payment in May 2009 to a hardship fund, subsequent monthly payments of $1.25 million for five months beginning in June 2009, and a final $1 million payment in November 2009, which, under the terms of the Modified Plan, was paid by DPHH. In addition, the Predecessor contributed $500,000 toward the creation of a Voluntary Employees’ Beneficiary Association (“VEBA”) and agreed to reimburse up to an additional $250,000 of reasonable legal expenses incurred by the counsel for the Retirees’ Committee and the Association. Neither Delphi nor the Predecessor has any future funding obligations or commitments to the VEBA. Following the initial payment of $1.5 million by May 1, 2009, the District Court dismissed the appeal filed by the retirees with prejudice. The Predecessor recognized a salaried OPEB curtailment and settlement gain of $1,168 million included in reorganization items in the consolidated statement of operations for the period ended October 6, 2009. This settlement gain reflects the reversal of existing liabilities of $1,173 million ($1,181 million net of $8 million to pay salaried OPEB claims incurred but not reported as of March 31, 2009) and the recognition of previously unamortized net gains included in accumulated other comprehensive income of $4 million. The reorganization gain also reflects the impact of the $9 million consideration to be provided for the Settlement described above.
On September 23, 2008, the Predecessor received approval from the Court and on September 26, 2008 received the consent of its labor unions to cease providing traditional U.S. hourly OPEB. In addition, upon effectiveness of the Amended GSA, Old GM assumed financial responsibility for all of the Predecessor’s traditional hourly OPEB liabilities from and after January 1, 2007. GM assumed approximately $6.8 billion of postretirement benefit liabilities for certain of the Predecessor’s active and retired hourly employees. The assumption of the traditional hourly OPEB liability by Old GM and Old GM’s agreement to reimburse postretirement benefit expenses through the administrative transfer date of February 1, 2009 was accounted for as a curtailment and a settlement under the guidance related to employer’s accounting for postretirement benefits other than pensions. The Predecessor recognized a curtailment and settlement gain of $7.1 billion included in reorganization items in the consolidated statement of operations of the Predecessor for the year ended December 31, 2008, which reflects the assumption by Old GM of the net unfunded liability of $6.8 billion and the recognition of $266 million of previously unrecognized actuarial gains.
As a result of the salaried workforce transformation plan activities in North America discussed in Note 11. Restructuring, salaried separations in 2008 have resulted in significant reductions in expected future service, or
curtailments, of the Salaried Plan, OPEB and SERP. The Predecessor recorded net salaried pension curtailment losses of $75 million and salaried OPEB curtailment gains of $82 million for the year ended December 31, 2008.
The amounts shown below reflect the change in the U.S. defined benefit pension obligations during 2010 and 2009.
| | | | | | | | | | | | | | |
| | | Successor | | | | | Predecessor | |
| | | Year ended
December 31,
2010 | | | Period from
August 19 to
December 31,
2009 | | | | | Period from
January 1 to
October 6, 2009 | |
| | | (in millions) | | | | | (in millions) | |
Benefit obligation at beginning of period | | $ | 81 | | | $ | — | | | | | $ | 11,411 | |
Liabilities established / assumed in the Acquisition | | | — | | | | 81 | | | | | | — | |
Service cost | | | — | | | | — | | | | | | 12 | |
Interest cost | | | 4 | | | | 1 | | | | | | 393 | |
Actuarial loss | | | 5 | | | | — | | | | | | — | |
Benefits paid | | | (7 | ) | | | (1 | ) | | | | | (496 | ) |
Impact of transfers / settlements | | | — | | | | — | | | | | | (11,203 | ) |
Gain from reorganization | | | — | | | | — | | | | | | (117 | ) |
| | | | | | | | | | | | | | |
Benefit obligation at end of period | | $ | 83 | | | $ | 81 | | | | | $ | — | |
| | | | |
Change in plan assets: | | | | | | | | | | | | | | |
Fair value of plan assets at beginning of period | | $ | — | | | $ | — | | | | | $ | 6,147 | |
Actual return on plan assets | | | — | | | | — | | | | | | 547 | |
Delphi contributions | | | 7 | | | | 1 | | | | | | — | |
Benefits paid | | | (7 | ) | | | (1 | ) | | | | | (496 | ) |
Impact of transfers / settlements | | | — | | | | — | | | | | | (6,198 | ) |
| | | | | | | | | | | | | | |
Fair value of plan assets at end of period | | $ | — | | | $ | — | | | | | $ | — | |
| | | | |
Underfunded status | | $ | (83 | ) | | $ | (81 | ) | | | | $ | — | |
| | | | |
Amounts recognized in the consolidated balance sheets consist of: | | | | | | | | | | | | | | |
Current liabilities | | | (8 | ) | | | (7 | ) | | | | | — | |
Non-current liabilities | | | (75 | ) | | | (74 | ) | | | | | — | |
| | | | | | | | | | | | | | |
Total | | $ | (83 | ) | | $ | (81 | ) | | | | $ | — | |
| | | | |
Amounts recognized in accumulated other comprehensive income consist of (pre-tax): | | | | | | | | | | | | | | |
Actuarial loss | | $ | 5 | | | $ | — | | | | | $ | — | |
| | | | | | | | | | | | | | |
Total | | $ | 5 | | | $ | — | | | | | $ | — | |
| | | | | | | | | | | | | | |
The amounts shown below reflect the change in the non-U.S. defined benefit pension obligations during 2010 and 2009.
| | | | | | | | | | | | | | |
| | | Successor | | | | | Predecessor | |
| | | Year ended
December 31,
2010 | | | Period from
August 19 to
December 31,
2009 | | | | | Period from
January 1 to
October 6, 2009 | |
| | | (in millions) | | | | | (in millions) | |
Benefit obligation at beginning of period | | $ | 1,533 | | | $ | — | | | | | $ | 1,242 | |
Liabilities assumed in the Acquisition | | | — | | | | 1,540 | | | | | | — | |
Service cost | | | 38 | | | | 13 | | | | | | 32 | |
Interest cost | | | 84 | | | | 21 | | | | | | 76 | |
Plan participants’ contributions | | | 2 | | | | 1 | | | | | | 3 | |
Actuarial loss (gain) | | | 4 | | | | (25 | ) | | | | | — | |
Benefits paid | | | (66 | ) | | | (21 | ) | | | | | (106 | ) |
Impact of curtailments | | | (8 | ) | | | (2 | ) | | | | | 48 | |
Plan amendments and other | | | (9 | ) | | | (6 | ) | | | | | — | |
Exchange rate movements | | | (60 | ) | | | 12 | | | | | | 118 | |
Gain from reorganization | | | — | | | | — | | | | | | (1,413 | ) |
| | | | | | | | | | | | | | |
Benefit obligation at end of period | | $ | 1,518 | | | $ | 1,533 | | | | | $ | — | |
| | | | |
Change in plan assets: | | | | | | | | | | | | | | |
Fair value of plan assets at beginning of period | | $ | 798 | | | $ | — | | | | | $ | 622 | |
Assets acquired in the Acquisition | | | — | | | | 739 | | | | | | — | |
Actual return on plan assets | | | 95 | | | | 28 | | | | | | — | |
Expected return on plan assets | | | — | | | | — | | | | | | 63 | |
Delphi contributions | | | 109 | | | | 43 | | | | | | 81 | |
Plan participants’ contributions | | | 2 | | | | 1 | | | | | | 3 | |
Benefits paid | | | (66 | ) | | | (21 | ) | | | | | (106 | ) |
Exchange rate movements and other | | | (28 | ) | | | 8 | | | | | | 54 | |
Gain from reorganization | | | — | | | | — | | | | | | (717 | ) |
| | | | | | | | | | | | | | |
Fair value of plan assets at end of period | | $ | 910 | | | $ | 798 | | | | | $ | — | |
| | | | |
Underfunded status | | $ | (608 | ) | | $ | (735 | ) | | | | $ | — | |
Amounts recognized in the consolidated balance sheets consist of: | | | | | | | | | | | | | | |
Current liabilities | | | (13 | ) | | | (5 | ) | | | | | — | |
Non-current liabilities | | | (595 | ) | | | (730 | ) | | | | | — | |
| | | | | | | | | | | | | | |
Total | | $ | (608 | ) | | $ | (735 | ) | | | | $ | — | |
| | | | |
Amounts recognized in accumulated other comprehensive income consist of (pre-tax): | | | | | | | | | | | | | | |
Actuarial gain | | $ | (75 | ) | | $ | (40 | ) | | | | $ | — | |
Prior service cost (credit) | | | — | | | | (2 | ) | | | | | — | |
| | | | | | | | | | | | | | |
Total | | $ | (75 | ) | | $ | (42 | ) | | | | $ | — | |
| | | | | | | | | | | | | | |
The amounts shown below reflect the change in the other postretirement benefit obligations during 2010 and 2009.
| | | | | | | | | | | | |
| | | Successor | | | Predecessor | |
| | | Year ended
December 31,
2010 | | | Period from
August 19 to
December 31,
2009 | | | Period from
January 1 to
October 6,
2009 | |
| | | (in millions) | | | (in millions) | |
Benefit obligation at beginning of period | | $ | 7 | | | $ | — | | | $ | 1,201 | |
Liabilities assumed in the Acquisition | | | — | | | | 7 | | | | — | |
Service cost | | | — | | | | — | | | | 7 | |
Interest cost | | | 1 | | | | — | | | | 18 | |
Benefits paid | | | (1 | ) | | | — | | | | (30 | ) |
Impact of curtailments | | | (1 | ) | | | — | | | | — | |
Impact of transfers / settlements | | | — | | | | — | | | | (1,171 | ) |
Gain from reorganization | | | — | | | | — | | | | (25 | ) |
| | | | | | | | | | | | |
Benefit obligation at end of period | | $ | 6 | | | $ | 7 | | | $ | — | |
| | | |
Change in plan assets: | | | | | | | | | | | | |
Fair value of plan assets at beginning of period | | $ | — | | | $ | — | | | $ | — | |
Delphi contributions | | | 1 | | | | — | | | | 30 | |
Benefits paid | | | (1 | ) | | | — | | | | (30 | ) |
| | | | | | | | | | | | |
Fair value of plan assets at end of period | | $ | — | | | $ | — | | | $ | — | |
| | | |
Underfunded status | | $ | (6 | ) | | $ | (7 | ) | | $ | — | |
Amounts recognized in the consolidated balance sheets consist of: | | | | | | | | | | | | |
Current liabilities | | | (2 | ) | | | — | | | | — | |
Non-current liabilities | | | (4 | ) | | | (7 | ) | | | — | |
| | | | | | | | | | | | |
Total | | $ | (6 | ) | | $ | (7 | ) | | $ | — | |
Amounts recognized in accumulated other comprehensive income consist of (pre-tax): | | | | | | | | | | | | |
Actuarial loss | | $ | — | | | $ | — | | | $ | — | |
Prior service credit | | | — | | | | — | | | | — | |
| | | | | | | | | | | | |
Total | | $ | — | | | $ | — | | | $ | — | |
| | | | | | | | | | | | |
The projected benefit obligation (“PBO”), accumulated benefit obligation (“ABO”), and fair value of plan assets for pension plans with accumulated benefit obligations in excess of plan assets and with plan assets in excess of accumulated benefit obligations are as follows:
| | | | | | | | | | | | | | | | |
| | | U.S. Plans | | | Non-U.S. Plans | |
| | | 2010 | | | 2009 | | | 2010 | | | 2009 | |
| | | (in millions) | |
| | | Plans with ABO in Excess of Plan Assets | |
PBO | | $ | 83 | | | $ | 81 | | | $ | 1,402 | | | $ | 1,420 | |
ABO | | | 83 | | | | 81 | | | | 1,246 | | | | 1,264 | |
Fair value of plan assets at end of year | | | — | | | | — | | | | 807 | | | | 708 | |
| |
| | | Plans with Plan Assets in Excess of ABO | |
PBO | | $ | — | | | $ | — | | | $ | 116 | | | $ | 113 | |
ABO | | | — | | | | — | | | | 74 | | | | 77 | |
Fair value of plan assets at end of year | | | — | | | | — | | | | 103 | | | | 90 | |
| | | Total | |
PBO | | $ | 83 | | | $ | 81 | | | $ | 1,518 | | | $ | 1,533 | |
ABO | | | 83 | | | | 81 | | | | 1,320 | | | | 1,341 | |
Fair value of plan assets at end of year | | | — | | | | — | | | | 910 | | | | 798 | |
Benefit costs presented below were determined based on actuarial methods and included the following:
| | | | | | | | | | | | | | | | | | |
| | | U.S. Pension Plans | |
| | | Successor | | | | | Predecessor | |
| | | Year ended
December 31,
2010 | | | Period from
August 19 to
December 31,
2009 | | | | | Period from
January 1 to
October 6,
2009 | | | Year ended
December 31,
2008 | |
| | | (in millions) | | | | | (in millions) | |
Service cost (a) | | $ | — | | | $ | — | | | | | $ | 12 | | | $ | 128 | |
Interest cost | | | 4 | | | | 1 | | | | | | 393 | | | | 814 | |
Expected return on plan assets | | | — | | | | — | | | | | | (341 | ) | | | (833 | ) |
Settlement loss (gain) | | | — | | | | — | | | | | | (188 | ) | | | 494 | |
Curtailment loss-PBO | | | — | | | | — | | | | | | — | | | | 75 | |
Amortization of prior service costs | | | — | | | | — | | | | | | 15 | | | | 26 | |
Amortization of actuarial losses | | | — | | | | — | | | | | | 126 | | | | 21 | |
| | | | | | | | | | | | | | | | | | |
Net periodic benefit cost | | $ | 4 | | | $ | 1 | | | | | $ | 17 | | | $ | 725 | |
| | | | | | | | | | | | | | | | | | |
| (a) | Includes $23 million for the year ended December 31, 2008 of costs previously accrued related to the U.S. employee workforce transition programs. |
| | | | | | | | | | | | | | | | | | |
| | | Non-U.S. Pension Plans | |
| | | Successor | | | | | Predecessor | |
| | | Year ended
December 31,
2010 | | | Period from
August 19 to
December 31,
2009 | | | | | Period from
January 1 to
October 6,
2009 | | | Year ended
December 31,
2008 | |
| | | (in millions) | | | | | (in millions) | |
Service cost | | $ | 38 | | | $ | 13 | | | | | $ | 32 | | | $ | 50 | |
Interest cost | | | 84 | | | | 21 | | | | | | 76 | | | | 90 | |
Expected return on plan assets | | | (55 | ) | | | (12 | ) | | | | | (63 | ) | | | (86 | ) |
Settlement (gain) loss | | | (1 | ) | | | — | | | | | | — | | | | 55 | |
Curtailment (gain) loss | | | (9 | ) | | | (2 | ) | | | | | 48 | | | | 2 | |
Amortization of transition amount | | | — | | | | — | | | | | | — | | | | 1 | |
Amortization of prior service costs | | | — | | | | — | | | | | | 2 | | | | 7 | |
Amortization of actuarial losses | | | 3 | | | | — | | | | | | 14 | | | | 5 | |
| | | | | | | | | | | | | | | | | | |
Net periodic benefit cost | | $ | 60 | | | $ | 20 | | | | | $ | 109 | | | $ | 124 | |
| | | | | | | | | | | | | | | | | | |
| | | | | | | | | | | | | | | | | | |
| | | Other Postretirement Benefits | |
| | | Successor | | | | | Predecessor | |
| | | Year ended
December 31,
2010 | | | Period from
August 19 to
December 31,
2009 | | | | | Period from
January 1 to
October 6,
2009 | | | Year ended
December 31,
2008 | |
| | | (in millions) | | | | | (in millions) | |
Service cost | | $ | — | | | $ | — | | | | | $ | 7 | | | $ | 27 | |
Interest cost | | | 1 | | | | — | | | | | | 18 | | | | 428 | |
Settlement gain | | | — | | | | — | | | | | | (1,175 | ) | | | (7,087 | ) |
Curtailment gain-PBO | | | (1 | ) | | | — | | | | | | — | | | | (8 | ) |
Curtailment gain-prior service | | | — | | | | — | | | | | | — | | | | (74 | ) |
Amortization of prior service costs (credit) | | | — | | | | — | | | | | | (30 | ) | | | (108 | ) |
Amortization of actuarial losses | | | — | | | | — | | | | | | 9 | | | | 37 | |
| | | | | | | | | | | | | | | | | | |
Net periodic benefit cost | | $ | — | | | $ | — | | | | | $ | (1,171 | ) | | $ | (6,785 | ) |
| | | | | | | | | | | | | | | | | | |
Net periodic benefit cost above reflects $5 million and $32 million that was included in loss from discontinued operations of the Predecessor for the period from January 1 to October 6, 2009 and the year ended December 31, 2008, respectively.
Experience gains and losses, as well as the effects of changes in actuarial assumptions and plan provisions are amortized over the average future service period of employees. The estimated actuarial loss for the defined benefit pension plans that will be amortized from accumulated other comprehensive income into net periodic benefit cost in 2011 is $2 million.
The principal assumptions used to determine the pension and other postretirement expense and the actuarial value of the projected benefit obligation for the U.S. and non-U.S. pension plan and postretirement plans were:
Assumptions used to determine benefit obligations at December 31:
| | | | | | | | | | | | | | | | | | | | | | | | |
| | | Pension Benefits | | | Other Postretirement
Benefits | |
| | | U.S. Plans | | | Non-U.S. Plans | | | | | | | |
| | | 2010 | | | 2009 | | | 2010 | | | 2009 | | | 2010 | | | 2009 | |
Weighted-average discount rate | | | 4.10 | % | | | 5.00 | % | | | 5.69 | % | | | 6.00 | % | | | 4.52 | % | | | 5.26 | % |
Weighted-average rate of increase in compensation levels | | | N/A | | | | N/A | | | | 3.88 | % | | | 3.90 | % | | | 4.50 | % | | | 4.50 | % |
Assumptions used to determine net expense for years ended December 31:
| | | | | | | | | | | | | | | | | | | | | | | | | | | | | | | | | | | | |
| | | Pension Benefits | | | Other Postretirement Benefits | |
| | | U.S. Plans | | | Non-U.S. Plans | | | | | | | | | | |
| | | 2010 | | | 2009 | | | 2008 | | | 2010 | | | 2009 | | | 2008 | | | 2010 | | | 2009 | | | 2008 | |
Weighted-average discount rate | | | 5.00 | % | | | 6.16 | % | | | 6.35 | % | | | 5.97 | % | | | 6.22 | % | | | 5.99 | % | | | 5.20 | % | | | 6.12 | % | | | 6.41 | % |
Weighted-average rate of increase in compensation levels | | | N/A | | | | N/A | | | | 4.45 | % | | | 3.89 | % | | | 3.95 | % | | | 4.16 | % | | | 4.50 | % | | | 4.50 | % | | | 4.50 | % |
Expected long-term rate of return on plan assets | | | N/A | | | | 8.25 | % | | | 8.75 | % | | | 7.14 | % | | | 7.81 | % | | | 8.28 | % | | | N/A | | | | N/A | | | | N/A | |
Delphi selects discount rates by analyzing the results of matching each plan’s projected benefit obligations with a portfolio of high-quality fixed income investments rated AA-or higher by Standard and Poor’s.
In 2010, Delphi no longer has any U.S. pension assets; therefore no U.S. asset rate of return calculation was necessary for 2010. The primary funded non-U.S. plans are in the United Kingdom and Mexico. For the determination of 2010 expense, Delphi assumed a long-term asset rate of return of approximately 6.75% and 10.0% for the United Kingdom and Mexico, respectively. Delphi evaluated input from local actuaries and asset managers, including consideration of recent fund performance and historical returns, in developing the long-term rate of return assumptions. The assumptions for the United Kingdom and Mexico are primarily conservative long-term, prospective rates.
Delphi’s pension expense for 2011 is determined at the 2010 measurement date. For purposes of analysis, the following table highlights the sensitivity of the Company’s pension obligations and expense to changes in key assumptions:
| | | | |
Change in Assumption | | Impact on Pension Expense | | Impact on PBO |
25 basis point (“bp”) decrease in discount rate | | + $2 million | | + $ 63 million |
25 bp increase in discount rate | | - $3 million | | - $59 million |
25 bp decrease in long-term return on assets | | + $2 million | | — |
25 bp increase in long-term return on assets | | - $2 million | | — |
The above sensitivities reflect the effect of changing one assumption at a time. It should be noted that economic factors and conditions often affect multiple assumptions simultaneously and the effects of changes in key assumptions are not necessarily linear. The above sensitivities also assume no changes to the design of the pension plans and no major restructuring programs.
Pension Funding
The following benefit payments, which reflect expected future service, as appropriate, are expected to be paid:
| | | | | | | | | | | | |
| | | Projected
Pension
Benefit Payments | | | Projected
Postretirement
Benefit Payments | |
| | | U.S. Plans | | | Non-U.S. Plans | | | | |
| | | (in millions) | |
2011 | | $ | 8 | | | $ | 62 | | | $ | 1 | |
2012 | | | 9 | | | | 58 | | | | 1 | |
2013 | | | 9 | | | | 63 | | | | — | |
2014 | | | 9 | | | | 67 | | | | 1 | |
2015 | | | 5 | | | | 69 | | | | 1 | |
2016 – 2020 | | | 45 | | | | 441 | | | | 2 | |
Inclusive of the expected benefit payments above, Delphi anticipates making required pension contributions of approximately $80 million in 2011.
Delphi sponsors and the Predecessor sponsored defined contribution plans for certain U.S. hourly and salaried employees. Expense related to the contributions for these plans was $29 million, $4 million, $38 million and $23 million for the year ended December 31, 2010, the periods from August 19 to December 31, 2009 and January 1 to October 6, 2009 and the year ended December 31, 2008, respectively.
Plan Assets
The pension plans sponsored by Delphi and the Predecessor invest in a diversified portfolio consisting of an array of asset classes that attempts to maximize returns while minimizing volatility. These asset classes include developed market equities, emerging market equities, private equity, global high quality and high yield fixed income, real estate, and absolute return strategies.
The fair values of Delphi’s pension plan assets weighted-average asset allocations at December 31, 2010 and 2009, by asset category, are as follows:
| | | | | | | | | | | | | | | | |
| | | Fair Value Measurements at December 31, 2010 | |
Asset Category | | Total | | | Quoted Prices
in Active
Markets for
Identical
Assets
(Level 1) | | | Significant
Observable
Inputs
(Level 2) | | | Significant
Unobservable
Inputs
(Level 3) | |
| | | (in millions) | |
Cash | | $ | 185 | | | $ | 185 | | | $ | — | | | $ | — | |
Equity mutual funds | | | 388 | | | | — | | | | 388 | | | | — | |
Bond mutual funds | | | 234 | | | | — | | | | 234 | | | | — | |
Debt securities | | | 63 | | | | 63 | | | | — | | | | — | |
Equity securities | | | 40 | | | | 40 | | | | — | | | | — | |
| | | | | | | | | | | | | | | | |
Total | | $ | 910 | | | $ | 288 | | | $ | 622 | | | $ | — | |
| | | | | | | | | | | | | | | | |
| | | | | | | | | | | | | | | | |
| | | Fair Value Measurements at December 31, 2009 | |
Asset Category | | Total | | | Quoted Prices
in Active
Markets for
Identical
Assets
(Level 1) | | | Significant
Observable
Inputs
(Level 2) | | | Significant
Unobservable
Inputs
(Level 3) | |
| | | (in millions) | |
Cash | | $ | 15 | | | $ | 15 | | | $ | — | | | $ | | |
Equity mutual funds | | | 405 | | | | — | | | | 405 | | | | — | |
Bond mutual funds | | | 157 | | | | — | | | | 157 | | | | — | |
Real estate trust fund | | | 82 | | | | — | | | | — | | | | 82 | |
Alternative investments | | | 56 | | | | — | | | | — | | | | 56 | |
Debt securities | | | 57 | | | | 57 | | | | — | | | | — | |
Equity securities | | | 26 | | | | 26 | | | | — | | | | — | |
| | | | | | | | | | | | | | | | |
Total | | $ | 798 | | | $ | 98 | | | $ | 562 | | | $ | 138 | |
| | | | | | | | | | | | | | | | |
| | | | | | | | |
| | | Fair Value Measurements Using Significant
Unobservable Inputs (Level 3) | |
| | | Real Estate
Trust Fund | | | Alternative
Investments | |
| | | (in millions) | |
Beginning balance at December 31, 2008 | | $ | 75 | | | $ | 54 | |
Actual return on plan assets: | | | | | | | | |
Relating to assets still held at the reporting date | | | 9 | | | | 9 | |
Relating to assets sold during the period | | | (1 | ) | | | — | |
Purchases, sales, and settlements | | | (1 | ) | | | (7 | ) |
Transfers in and/or out of Level 3 | | | — | | | | — | |
| | | | | | | | |
Ending balance at December 31, 2009 | | $ | 82 | | | $ | 56 | |
| | | | | | | | |
Actual return on plan assets: | | | | | | | | |
Relating to assets still held at the reporting date | | | | | | | | |
Relating to assets sold during the period | | | (35 | ) | | | 2 | |
Purchases, sales, and settlements | | | (47 | ) | | | (58 | ) |
Transfers in and/or out of Level 3 | | | — | | | | — | |
| | | | | | | | |
Ending balance at December 31, 2010 | | $ | — | | | $ | — | |
| | | | | | | | |
15. COMMITMENTS AND CONTINGENCIES
Environmental Matters
Delphi is subject to the requirements of U.S. federal, state, local and foreign environmental and occupational safety and health laws and regulations. As of December 31, 2010 and December 31, 2009, the undiscounted reserve for environmental investigation and remediation was approximately $23 million (of which $5 million was recorded in accrued liabilities and $18 million was recorded in other long-term liabilities) and $21 million (of which $3 million was recorded in accrued liabilities and $18 million was recorded in other long-term liabilities), respectively. Delphi cannot ensure that environmental requirements will not change or become more stringent over time or that its eventual environmental remediation costs and liabilities will not exceed the amount of its current reserves. In the event that such liabilities were to significantly exceed the amounts recorded, Delphi’s results of operations could be materially affected.
Ordinary business litigation
Delphi is from time to time subject to various legal actions and claims incidental to its business, including those arising out of alleged defects, breach of contracts, product warranties, intellectual property matters, and employment-related matters. It is the opinion of Delphi that the outcome of such matters will not have a material adverse impact on the consolidated financial position, results of operations, or cash flows of Delphi. With respect to warranty matters, although Delphi cannot ensure that the future costs of warranty claims by customers will not be material, Delphi believes its established reserves are adequate to cover potential warranty settlements. However, the final amounts required to resolve these matters could differ materially from the Company’s recorded estimates.
GM warranty settlement agreement
As previously disclosed, Old GM alleged that catalytic converters supplied to Old GM for certain 2001 and 2002 vehicle platforms did not conform to specifications. In May 2007, Old GM informed the Predecessor that it had experienced higher than normal warranty claims with respect to certain 2003-2005 vehicle models due to instrument clusters. Effective December 2007, the responsibility for this product line was transferred to the Electronics and Safety segment. In 2007, the Predecessor reached a tentative agreement with Old GM to resolve these claims along with certain other known warranty matters. On September 27, 2007, the Court authorized the Predecessor to enter into a Warranty, Settlement, and Release Agreement (the “Warranty Settlement Agreement”) with Old GM resolving these and certain other known warranty matters. Under the terms of the Warranty Settlement Agreement, the Predecessor agreed to pay Old GM up to an estimated $199 million, comprised of approximately $127 million to be paid in cash over time as noted below, and up to approximately $72 million to be paid in the form of delivery by the Predecessor to Old GM of replacement product. The Warranty Settlement Agreement settled all outstanding warranty claims and issues related to any component or assembly supplied by the Predecessor to Old GM, which as of August 10, 2007 were (i) known by Old GM, subject to certain specified exceptions, (ii) believed by GM to be the Predecessor’s responsibility in whole or in part, and (iii) in Old GM’s normal investigation process, or which should have been within that process, but were withheld for the purpose of pursuing a claim against the Predecessor.
In conjunction with overall negotiations regarding potential amendments to the plan of reorganization to enable the Predecessor to emerge from chapter 11 as soon as practicable, including discussions regarding support assisting the Predecessor in remaining compliant with the global operating income before depreciation and amortization, including long-lived asset and goodwill impairment, transformation and rationalization charges related to plant consolidations, plant wind-downs, and discontinued operations (“EBITDAR”) covenants in its Amended and Restated DIP Credit Facility, Old GM agreed, on July 31, 2008, to forgive certain of the cash amounts due under the Warranty Settlement Agreement. As a result, the Predecessor recorded the extinguishment of this liability as a reduction of warranty expense in 2008, of which $56 million was included in cost of sales, which had a corresponding favorable impact on operating income, and $56 million was included in discontinued operations. Delphi assumed the Warranty Settlement Agreement in connection with the Acquisition.
Other warranty matters
The Predecessor began experiencing quality issues regarding parts supplied to Old GM from the Steering Business in 2005 and established warranty reserves to cover the estimated costs of various repairs that may be implemented. The reserve was subsequently reduced due to a settlement reached with GM and the settlement was paid in 2006. The Predecessor negotiated with its supplier to determine if any portion of the expense was recoverable, and in 2008, the Predecessor and the supplier reached an agreement whereby the supplier paid the Predecessor $17 million to resolve the matter. The $17 million was recorded as a reduction of warranty expense in discontinued operations.
The Predecessor also began experiencing quality issues regarding parts purchased by the Thermal Systems segment during 2006 and established warranty reserves of approximately $60 million to cover the cost of various
repairs that may be implemented. During 2008, the Predecessor recovered $28 million from an affiliated supplier and recorded it as a reduction of warranty expense. The reserve has subsequently been adjusted for payments, settlements and the impact of foreign currency exchange rate fluctuations. As of December 31, 2010 and 2009, the related reserve was $10 million and $11 million, respectively.
In 2009, Delphi received information regarding potential warranty claims related to certain components supplied by Delphi’s Powertrain segment. Delphi has recorded its best estimate of the warranty obligation related to this matter as of December 31, 2010, and during 2010 recognized warranty expense in cost of sales of approximately $75 million related to this matter.
Brazil matters
Delphi conducts significant business operations in Brazil that are subject to the Brazilian federal labor, social security, environmental, tax and customs laws, as well as a variety of state and local laws. While Delphi believes it complies with such laws, they are complex, subject to varying interpretations, and the Company is often engaged in litigation with government agencies regarding the application of these laws to particular circumstances. In addition, Delphi also is a party to commercial and labor litigation with private parties. As of December 31, 2010, related claims totaling approximately $240 million have been asserted against Delphi. As of December 31, 2010, the Company maintains accruals for these asserted claims that are substantially less than the amount of the claims asserted. The amounts accrued represent claims that are deemed probable of loss and are reasonably estimable based on the Company’s analyses and assessment of the asserted claims and prior experience with similar matters. While the Company believes its accruals are adequate, the final amounts required to resolve these matters could differ materially from the Company’s recorded estimates and Delphi’s results of operations could be materially affected.
Romania value added tax (“VAT”) assessment
During the first quarter of 2010, as a result of a tax audit for years 2006–2008, the Company received a tax assessment from the Romanian tax authorities in the amount of approximately $42 million based on the taxing authority’s assessment that the Company underpaid its VAT (mostly on export sales) by approximately $24 million and owes accrued interest and penalties of $18 million. The Company filed an appeal contesting the assessment and during October, 2010, the Romanian tax authorities substantially reduced the amount of the assessment and decided to re-audit the Company. As of December 31, 2010, the Company maintains a reserve for this contingency that is substantially less than the amount of the initial assessment. While the Company believes its reserve is adequate, the final amounts required to resolve this initial assessment could differ materially from the Company’s recorded estimate.
Operating leases
Rental expense totaled $98 million, $34 million, $76 million and $132 million for the year ended December 31, 2010, the periods from August 19 to December 31, 2009 and January 1 to October 6, 2009 and the year ended December 31, 2008, respectively. As of December 31, 2010, Delphi had minimum lease commitments under noncancelable operating leases totaling $301 million, which become due as follows:
| | | | |
Year | | Minimum Future
Operating Lease
Commitments | |
| | | (in millions) | |
2011 | | $ | 80 | |
2012 | | | 66 | |
2013 | | | 53 | |
2014 | | | 43 | |
2015 | | | 35 | |
Thereafter | | | 24 | |
| | | | |
Total | | $ | 301 | |
| | | | |
16. INCOME TAXES
Income (loss) from continuing operations before income taxes and equity income (loss) for U.S. and non-U.S. operations are as follows:
| | | | | | | | | | | | | | | | | | |
| | | Successor | | | | | Predecessor | |
| | | Year ended
December 31,
2010 | | | Period from
August 19 to
December 31,
2009 | | | | | Period from
January 1 to
October 6, 2009 | | | Year ended
December 31,
2008 | |
| | | (in millions) | | | | | (in millions) | |
U.S. income (loss) | | $ | 313 | | | $ | (86 | ) | | | | $ | 9,460 | | | $ | 4,067 | |
Non-U.S. income (loss) | | | 631 | | | | 51 | | | | | | (344 | ) | | | (770 | ) |
| | | | | | | | | | | | | | | | | | |
Income (loss) from continuing operations before income taxes and equity income/(loss) | | $ | 944 | | | $ | (35 | ) | | | | $ | 9,116 | | | $ | 3,297 | |
| | | | | | | | | | | | | | | | | | |
The Predecessor’s U.S. income of $9,460 million for the period from January 1 to October 6, 2009 includes a reorganization gain of $10,210 million primarily relating to the extinguishment of liabilities subject to compromise. The Predecessor’s non-U.S. loss of $770 million for the year ended December 31, 2008 includes an inter-company loss of $863 million related to an international restructuring transaction. This transaction involved the transfer of certain European subsidiaries to the Predecessor’s Luxembourg holding company in exchange for Euro denominated debt which created an inter-company gain in the U.S. and a corresponding foreign loss.
The provision (benefit) for income taxes is comprised of:
| | | | | | | | | | | | | | | | | | |
| | | Successor | | | | | Predecessor | |
| | | Year ended
December 31,
2010 | | | Period from
August 19 to
December 31,
2009 | | | | | Period from
January 1 to
October 6,
2009 | | | Year ended
December 31,
2008 | |
| | | (in millions) | | | | | (in millions) | |
Current income tax expense: | | | | | | | | | | | | | | | | | | |
U.S. federal | | $ | 98 | | | $ | 11 | | | | | $ | — | | | $ | — | |
Non-U.S. | | | 150 | | | | 51 | | | | | | 53 | | | | 176 | |
U.S. state and local | | | 10 | | | | — | | | | | | — | | | | (1 | ) |
| | | | | | | | | | | | | | | | | | |
Total current | | | 258 | | | | 62 | | | | | | 53 | | | | 175 | |
Deferred income tax (benefit) expense, net: | | | | | | | | | | | | | | | | | | |
U.S. federal | | | (17 | ) | | | (41 | ) | | | | | (358 | ) | | | (10 | ) |
Non-U.S. | | | 3 | | | | (50 | ) | | | | | (13 | ) | | | (8 | ) |
U.S. state and local | | | — | | | | (2 | ) | | | | | — | | | | — | |
| | | | | | | | | | | | | | | | | | |
Total deferred | | | (14 | ) | | | (93 | ) | | | | | (371 | ) | | | (18 | ) |
Investment tax credits | | | — | | | | — | | | | | | — | | | | (1 | ) |
Less: income tax benefit related to noncontrolling interest | | | 14 | | | | 4 | | | | | | 7 | | | | 7 | |
| | | | | | | | | | | | | | | | | | |
Total income tax expense (benefit) | | $ | 258 | | | $ | (27 | ) | | | | $ | (311 | ) | | $ | 163 | |
| | | | | | | | | | | | | | | | | | |
Cash paid or withheld for income taxes was $254 million, $20 million, $92 million and $141 million for the year ended December 31, 2010, the periods from August 19 to December 31, 2009 and January 1 to October 6, 2009 and the year ended December 31, 2008, respectively.
A reconciliation of the provision (benefit) for income taxes compared with the amounts at the U.S. federal statutory rate was:
| | | | | | | | | | | | | | | | | | |
| | | Successor | | | | | Predecessor | |
| | | Year ended
December 31,
2010 | | | Period from
August 19 to
December 31,
2009 | | | | | Period from
January 1 to
October 6,
2009 | | | Year ended
December 31,
2008 | |
| | | (in millions) | | | | | (in millions) | |
Tax at U.S. federal statutory income tax rate | | $ | 330 | | | $ | (12 | ) | | | | $ | 3,190 | | | $ | 1,154 | |
U.S. income taxed at other rates | | | 9 | | | | (1 | ) | | | | | 266 | | | | 114 | |
Non-U.S. income taxed at other rates | | | (31 | ) | | | (16 | ) | | | | | 56 | | | | 281 | |
Change in valuation allowance | | | (21 | ) | | | — | | | | | | (3,464 | ) | | | (1,403 | ) |
Tax Credits | | | (29 | ) | | | (10 | ) | | | | | — | | | | — | |
Change in tax law | | | (15 | ) | | | — | | | | | | (4 | ) | | | — | |
Other changes in tax reserves | | | (2 | ) | | | 9 | | | | | | | | | | | |
Other comprehensive income adjustment | | | — | | | | — | | | | | | (358 | ) | | | — | |
Withholding taxes | | | 24 | | | | 2 | | | | | | 3 | | | | 24 | |
Other adjustments | | | (7 | ) | | | 1 | | | | | | — | | | | (7 | ) |
| | | | | | | | | | | | | | | | | | |
Total income tax provision (benefit) | | $ | 258 | | | $ | (27 | ) | | | | $ | (311 | ) | | $ | 163 | |
| | | | | | | | | | | | | | | | | | |
Included in loss from discontinued operations are income tax provisions of $17 million and $14 million for the period from January 1 to October 6, 2009, and the year ended December 31, 2008, respectively.
Delphi’s tax rate is affected by the tax rates in the U.S. and foreign jurisdictions, the relative amount of income earned by jurisdiction, and the relative amount of losses for which no tax benefit was recognized due to a valuation allowance. During the period from January 1 through October 6, 2009 and the year ended December 31, 2008, the Company provided a full valuation allowance on its deferred tax assets in the U.S. due to a history of operating losses and other negative evidence. Since the acquisition, the Company has been in a net deferred tax liability position in the U.S. and no valuation allowance has been recorded. During the period from January 1 through October 6, 2009, the Company recognized tax benefits associated with gains from Other Comprehensive Income of $358 million (see discussion in Note 14).
Delphi currently experiences tax holidays in various non-U.S. jurisdictions with expiration dates from 2012 through 2023. The income tax benefits attributable to these tax holidays are approximately $5 million in 2010, $2 million for January 1 to October 6, 2009, $1 million for August 19 to December 31, 2009, and $10 million in 2008.
Deferred income taxes
Delphi accounts for income taxes and the related accounts under the liability method. Deferred income tax assets and liabilities reflect the impact of temporary differences between amounts of assets and liabilities for financial reporting purposes and the bases of such assets and liabilities as measured by tax laws. Significant components of the deferred tax assets and liabilities are as follows:
| | | | | | | | |
| | | Successor | |
| | | December 31 | |
| | | 2010 | | | 2009 | |
| | | (in millions) | |
Deferred tax assets: | | | | | | | | |
Pension and other employee benefits | | $ | 161 | | | $ | 220 | |
Net operating loss carryforwards | | | 466 | | | | 460 | |
Tax credits | | | 19 | | | | 18 | |
Warranty | | | 81 | | | | 40 | |
Other | | | 149 | | | | 253 | |
| | | | | | | | |
Total gross deferred tax assets | | | 876 | | | | 991 | |
Less: valuation allowances | | | (501 | ) | | | (552 | ) |
| | | | | | | | |
Total deferred tax assets | | $ | 375 | | | $ | 439 | |
| | |
Deferred tax liabilities: | | | | | | | | |
Fixed Assets | | $ | 18 | | | $ | 17 | |
Tax on unremitted profits of certain foreign subsidiaries | | | 16 | | | | 7 | |
Intangibles | | | 204 | | | | 238 | |
| | | | | | | | |
Total gross deferred tax liabilities | | | 238 | | | | 262 | |
| | | | | | | | |
Net deferred tax assets | | $ | 137 | | | $ | 177 | |
| | | | | | | | |
Net current and non-current deferred tax assets and liabilities are included in the consolidated balance sheets as follows:
| | | | | | | | |
| | | Successor | |
| | | December 31 | |
| | | 2010 | | | 2009 | |
| | | (in millions) | |
Current assets | | $ | 136 | | | $ | 196 | |
Current liabilities | | | (4 | ) | | | (20 | ) |
Long term assets | | | 183 | | | | 276 | |
Long term liabilities | | | (178 | ) | | | (275 | ) |
| | | | | | | | |
Total deferred tax asset | | $ | 137 | | | $ | 177 | |
| | | | | | | | |
The net deferred tax assets of $137 million as of December 31, 2010 are primarily comprised of deferred tax asset amounts from the U.K., Poland, Mexico, China and Brazil, offset by a deferred tax liability in the U.S.
Net operating loss and tax credit carryforwards
As of December 31, 2010, Delphi has recorded deferred tax assets of approximately $466 million for non-U.S. net operating loss (“NOL”) carryforwards with recorded valuation allowances of $411 million. These NOL’s are available to offset future taxable income and realization is dependent on generating sufficient taxable income prior to expiration of the loss carryforwards. The non-U.S. NOL’s relate primarily to France, Spain, and Luxembourg. The NOL carryforwards have expiration dates ranging from one year to an indefinite period.
Deferred tax assets include $19 million and $18 million of tax credit carryforwards at December 31, 2010 and 2009, respectively. These tax credit carryforwards expire in 2011 through 2029.
Cumulative undistributed foreign earnings
Except for withholding taxes of $16 million on undistributed earnings that are not indefinitely reinvested, no additional material provision has been made for U.S. or non-U.S. income taxes on the undistributed earnings of foreign subsidiaries as the Company has concluded that such earnings are either indefinitely reinvested or should not give rise to additional income tax liabilities as a result of the distribution of such earnings.
Uncertain tax positions
Delphi recognizes tax benefits only for tax positions that are more likely than not to be sustained upon examination by tax authorities. The amount recognized is measured as the largest amount of benefit that is greater than 50 percent likely of being realized upon ultimate settlement. Unrecognized tax benefits are tax benefits claimed in our tax returns that do not meet these recognition and measurement standards.
A reconciliation of the gross change in the unrecognized tax benefits balance, excluding interest and penalties is as follows:
| | | | | | | | | | | | | | |
| | | Successor | | | | | Predecessor | |
| | | Year ended
December 31,
2010 | | | Period from
August 19 to
December 31,
2009 | | | | | Period from
January 1 to
October 6,
2009 | |
| | | (in millions) | | | | | (in millions) | |
Balance at beginning of period | | $ | 83 | | | $ | — | | | | | $ | 79 | |
Liabilities assumed in the Acquisition | | | — | | | | 80 | | | | | | — | |
Additions related to current year | | | 9 | | | | 10 | | | | | | 1 | |
Additions related to prior year | | | 11 | | | | 1 | | | | | | 6 | |
Reductions related to prior year | | | (19 | ) | | | (6 | ) | | | | | (10 | ) |
Reductions due to expirations of statute of limitations | | | (1 | ) | | | (1 | ) | | | | | (1 | ) |
Settlements-cash | | | (1 | ) | | | (1 | ) | | | | | — | |
Gain from reorganization | | | — | | | | — | | | | | | (75 | ) |
| | | | | | | | | | | | | | |
Balance at end of period | | $ | 82 | | | $ | 83 | | | | | $ | — | |
| | | | | | | | | | | | | | |
A portion of our unrecognized tax benefits would, if recognized, reduce our effective tax rate. The remaining unrecognized tax benefits relate to tax positions for which only the timing of the benefit is uncertain. Recognition of these tax benefits would reduce our effective tax rate only through a reduction of accrued interest and penalties. As of December 31, 2010 and 2009, the amounts of unrecognized tax benefit that would reduce our effective tax rate were $52 million and $60 million, respectively.
Delphi recognizes interest and penalties as part of income tax expense. Total accrued liabilities for interest and penalties were $18 million and $20 million at December 31, 2010 and 2009, respectively. Total interest and penalties recognized as part of income tax expense (benefit) was a decrease of $3 million for the year ended December 31, 2010, a decrease of $3 million for the Successor period from August 19 to December 31, 2009, an increase of $1 million for the Predecessor period from January 1 to October 6, 2009.
Delphi files tax returns in multiple jurisdictions and is subject to examination by taxing authorities throughout the world. Taxing jurisdictions significant to Delphi include U.S., Brazil, China, France, Germany, Mexico, Poland and the U.K. Open tax years related to these foreign taxing jurisdictions remain subject to examination and could result in additional tax liabilities. In general, Delphi affiliates are no longer subject to income tax examinations by foreign tax authorities for years before 2002. It is reasonably possible that audit
settlements, the conclusion of current examinations or the expiration of the statute of limitations in several jurisdictions could impact the Company’s unrecognized tax benefits. However, Delphi does not expect the overall change in unrecognized tax benefits over the next twelve months to be significant.
In the U.S., federal income tax returns for years prior to 2009 have been effectively settled. Open tax years related to various states remain subject to examination, but are not considered to be material.
Tax return filing determinations and elections
The Company was established on August 19, 2009 as a limited liability partnership incorporated under the laws of England and Wales and it has elected to be treated as a partnership for U.S. federal income tax purposes. On September 17, 2009, the Internal Revenue Service (the “IRS”) issued Notice 2009-78 (the “Notice”) announcing its intent to issue regulations under Section 7874 of the Internal Revenue Code (titled “Rules Relating to Expatriated Entities and Their Foreign Parents”) with an effective date prior to the Acquisition Date. If regulations as described in the Notice are issued with the effective date indicated in the Notice, the Company believes there is a substantial risk that it could be treated as a domestic corporation for U.S. federal income tax purposes, retroactively as of the Acquisition Date. If the Company is treated as a domestic corporation for U.S. federal income tax purposes, it would be subject to U.S. federal income tax on its worldwide taxable income including some or all of the distributions from its subsidiaries as well as some of the undistributed earnings of its foreign subsidiaries that constitute “controlled foreign corporations.” This could have a material adverse impact on the Company’s future tax liability related to these distributions and earnings. Also, future cash distributions made by the Company to non-U.S. members could be subject to U.S. income tax withholding at a rate of 30%, unless reduced or eliminated by tax treaty.
Consistent with the election to be treated as a partnership for U.S. federal income tax purposes, the Company filed an informational 2009 U.S. federal partnership tax return on September 15, 2010. In light of the Notice, the IRS is currently reviewing whether section 7874 applied to Delphi’s acquisition of the automotive supply and other businesses of the Predecessor as part of the 2009 Compliance Assurance Process audit of the Predecessor. It is not clear as to when such review will be concluded or its outcome.
In conjunction with the consummation of the Modified Plan on the Acquisition Date, all outstanding shares of stock of the Predecessor were cancelled and Delphi issued membership interests in accordance with the terms of the Acquisition.
As more fully described in Note 1. General and Acquisition of Predecessor Businesses, in conjunction with the Acquisition and the consummation of the Modified Plan, on October 6, 2009, the Company and GM collectively acquired substantially all of the assets of the Predecessor, the Class A, B and C membership interests were issued to GM, certain investors, including former creditors of the Predecessor, and the PBGC, respectively, and the debt outstanding from the DIP lenders was settled. In June 2010, 24,000 Class E-1 membership interests were issued to the Board of Managers, as more fully described herein.
The Class A and Class B members received their membership interests in consideration for $1,833 million and $209 million of cash, respectively. In addition, the rights of the DIP lenders to receive certain assets of the Predecessor were assigned to the Company. These assets had a fair value of $2,890 million determined in accordance with FASB ASC 805,Business Combinations. The Class A and Class B members received non-controlling representation on Delphi’s Board of Managers, and, along with Class C members, rights to potential future distributions by Delphi as defined by the LLP Agreement. The PBGC interests were derived from negotiations between GM and the PBGC with respect to the Predecessor’s terminated U.S. pension plans. The Class E-1 membership interests were issued to the Board of Managers under the Class E-1 Interest Incentive Plan in order to attract and reward board members and to promote the creation of long-term value for interest holders of Delphi.
The fair value of the Class A, B and C membership interests issued on October 6, 2009 totaled $4,932 million, and was determined, as more fully described in Note 1. General and Acquisition of Predecessor Businesses, as follows:
| | | | |
| | | (in millions) | |
Fair value of Predecessor assets acquired, net of liabilities assumed | | $ | 2,890 | |
Fair value of cash contributed by GM | | | 1,833 | |
Fair value of cash contributed by investors, including DIP lenders | | | 209 | |
| | | | |
Fair value of net assets acquired | | $ | 4,932 | |
| | | | |
The fair value of the membership interests issued on the Acquisition Date was allocated between the respective classes based on the distribution provisions of the LLP Agreement. The distribution percentages vary by class of membership interest and by cumulative amount distributed, and, between classes, are not related or proportional to the number of membership interests held.
The following table summarizes the membership interests issued:
| | | | | | | | | | | | | | | | | | | | | | |
| | | Members | | Membership
Interests Issued | | | Date
Issued | | | Membership
Interests as of
December 31,
2010 | | | Membership
Interests as of
December 31,
2009 | | | Allocation of
Fair Value of
Membership
Interests as of
the Acquisition Date | |
| Class | | | | | | | | | | (in millions) | |
A | | GM | | | 1,750,000 | | | | October 2009 | | | $ | 2,083 | | | $ | 1,969 | | | $ | 1,972 | |
B | | DIP Lenders(1) | | | 354,500 | | | | October 2009 | | | | 2,816 | | | | 2,406 | | | | 2,418 | |
C | | PBGC | | | 100,000 | | | | October 2009 | | | | 646 | | | | 539 | | | | 542 | |
E-1 | | Board of Managers | | | 24,000 | | | | June 2010 | | | | 5 | | | | — | | | | — | |
| | | | | | | | | | | | | | | | | | | | | | |
| | | | | Total | | | | | | | $ | 5,550 | | | $ | 4,914 | | | $ | 4,932 | |
| | | | | | | | | | | | | | | | | | | | | | |
| (1) | Included a controlling equity stake for affiliates of Silver Point Capital and Elliot Management. Since October 6, 2009, Class B membership interests trade on the 144A market and, therefore, the holders of Class B membership interests change over time. |
Additionally, the LLP Agreement requires the consent of or provides special rights to Class A and certain Class B membership interest holders with respect to certain events, including changes in corporate governance, the execution of significant transactions and the issuance of additional securities.
In conjunction with the initiation of certain long-term incentive plans during 2010, for the 2010 Board of Managers Class E-1 Interest Incentive Plan (the “Plan”) and the Value Creation Plan (the “VCP”), which are both long-term incentive plans designed to assist the Company in attracting, retaining, motivating and rewarding the Board of Managers and key employees of the Company, and promoting the creation of long-term value, the distribution provisions of the LLP Agreement were modified to include provisions for the Class E-1 membership interests and the VCP. The LLP Agreement includes provisions related to future distribution amounts for the Class E-1 and key employee incentive plans based on rates/amounts as defined in the agreement (approximately 2.3%), with ratable reductions in the distribution percentages applied to the Class A, B and C members. Refer to Note 22. Share-Based Compensation for further information.
Total membership interests and current period net income are allocated between the respective classes based on the cumulative distribution provisions of the LLP Agreement. The distribution percentages vary by class of membership interest and by cumulative amount distributed, and, between classes, are not related or proportional to the number of membership interests held. The following table outlines the distribution provisions of the LLP Agreement, excluding the impact of any potential ratable reductions described above:
| | | | | | | | | | | | |
Cumulative Distribution Amount (excluding the impact of any potential ratable reductions) | | Class | |
| (in millions) | | A | | | B | | | C | |
$0 - $1,000 | | | 49.12 | % | | | 38.60 | % | | | 12.28 | % |
$1,000 - $2,000 | | | 57.78 | % | | | 27.78 | % | | | 14.44 | % |
$2,000 - $2,500 | | | 61.39 | % | | | 27.78 | % | | | 10.83 | % |
$2,500 - $2,642 | | | 68.61 | % | | | 27.78 | % | | | 3.61 | % |
$2,642 - $3,500 | | | 24.94 | % | | | 73.75 | % | | | 1.31 | % |
$3,500 - $3,642 | | | 19.69 | % | | | 73.75 | % | | | 6.56 | % |
$3,642 - $4,000 | | | 26.25 | % | | | 65.00 | % | | | 8.75 | % |
$4,000 - $5,500 | | | 17.50 | % | | | 65.00 | % | | | 17.50 | % |
$5,500 - $6,000 | | | 26.25 | % | | | 65.00 | % | | | 8.75 | % |
$6,000 - $7,000 | | | 31.50 | % | | | 65.00 | % | | | 3.50 | % |
$7,000+ (a) | | | 35.00 | % | | | 65.00 | % | | | — | |
| (a) | Under the terms of the Modified Plan, if cumulative distributions to the members exceed $7.2 billion, Delphi, as disbursing agent on behalf of DPHH, is required to pay to the holders of allowed general unsecured claims against the Predecessor, $32.50 for every $67.50 in excess of $7.2 billion distributed to the members, up to a maximum amount of $300 million. This contingency is not considered probable of occurring as of December 31, 2010. Accordingly, no provision for this matter has been recorded as of December 31, 2010. |
Under the terms of the LLP Agreement, distributions from Delphi are generally prohibited unless all of the following conditions are satisfied:
There are no principal amounts outstanding related to the DDTL;
The distribution occurs more than 18 months after the Acquisition Date;
After giving effect to a distribution, Delphi must have at least $800 million of cash and cash equivalents on hand; and
Delphi’s cash flow from operating activities during the six months prior to the distribution date was positive and Delphi is reasonably sure that its cash flows from operating activities will continue to be positive for six months following the distribution date.
Net income (loss) per membership interests unit
Total membership interest equity as of October 6, 2009 was allocated to the respective classes of membership interests across all tranches of the cumulative distribution schedule as defined by the LLP Agreement. In subsequent periods total membership interest equity at the end of the period is allocated to the respective classes of membership interests across all tranches of the cumulative distribution schedule as defined by the LLP Agreement. The allocation of the net income (loss) for the period is the difference between the ending and beginning of period allocation of membership interest equity as there were no distributions during this period.
Delphi computes net income (loss) per membership interests unit by dividing its net income (loss) attributable to membership interests by the weighted average number of units outstanding during the period. The overall computation and presentation of its net income (loss) per membership interests unit are made in accordance with FASB ASC 260,Earnings Per Share.
The following table summarizes the net income (loss) per membership interests unit for each period presented:
| | | | | | | | | | | | | | | | | | | | |
| | | Weighted Average
Membership
Interests | | | Year Ended
December 31,
2010
Net Income
Attributable to
Membership
Interests | | | Year Ended
December 31,
2010 Net
Income Per
Membership
Interests
Unit | | | Period from
August 19 to
December 31,
2009 Net Loss
Attributable to
Membership
Interests | | | Period from
August 19 to
December 31, 2009
Net Loss Per
Membership
Interests Unit | |
| Class | | | | | (in millions, except per unit data) | |
A | | | 1,750,000 | | | $ | 114 | | | $ | 65.35 | | | $ | (3 | ) | | $ | (1.80 | ) |
B | | | 354,500 | | | | 410 | | | | 1,156.98 | | | | (12 | ) | | | (33.00 | ) |
C | | | 100,000 | | | | 107 | | | | 1,064.88 | | | | (3 | ) | | | (31.50 | ) |
E-1 | | | 12,000 | | | | — | | | | N/A | | | | N/A | | | | N/A | |
| | | | | | | | | | | | | | | | | | | | |
| | | Total | | | $ | 631 | | | | | | | $ | (18 | ) | | | | |
| | | | | | | | | | | | | | | | | | | | |
| 18. | FAIR VALUE OF FINANCIAL INSTRUMENTS, DERIVATIVES AND HEDGING ACTIVITIES |
Financial Instruments
Delphi’s financial instruments include its accounts receivable factoring arrangements, capital leases and other debt issued by Delphi’s foreign subsidiaries and the Notes. The fair value of these financial instruments is based on quoted market prices for instruments with public market data or the current book value for instruments without a quoted public market price. As of December 31, 2010 and 2009, the total of the financial instruments listed above was recorded at $289 million and $396 million, respectively, and had estimated fair values of $293 million and $396 million, respectively. For all other financial instruments recorded at December 31, 2010 and 2009, fair value approximates book value.
Derivatives and Hedging Activities
Delphi is exposed to market risk, such as fluctuations in foreign currency exchange rates, commodity prices and changes in interest rates, which may result in cash flow risks. To manage the volatility relating to these exposures, Delphi aggregates the exposures on a consolidated basis to take advantage of natural offsets. For exposures that are not offset within its operations, Delphi enters into various derivative transactions pursuant to its risk management policies, which prohibit holding or issuing derivative financial instruments for trading purposes, and designation of derivative instruments is performed on a transaction basis to support hedge accounting. The changes in fair value of these hedging instruments are offset in part or in whole by corresponding changes in the fair value or cash flows of the underlying exposures being hedged. Delphi assesses the initial and ongoing effectiveness of its hedging relationships in accordance with its documented policy. As of December 31, 2010, Delphi has entered into derivative instruments to hedge cash flows extending out to April 2013.
As of December 31, 2010, the Company had the following outstanding notional amounts related to commodity and foreign currency forward contracts that were entered into to hedge forecasted exposures:
| | | | | | |
| | | Successor |
Commodity | | Quantity Hedged | | | Unit of Measure |
| | | (in thousands) |
Copper | | | 41,517 | | | pounds |
Primary Aluminum | | | 27,763 | | | pounds |
Secondary Aluminum | | | 18,830 | | | pounds |
Silver | | | 119 | | | troy ounces |
Gold | | | 6 | | | troy ounces |
Platinum | | | 1 | | | troy ounce |
| | |
Foreign Currency | | | | | | |
| | | (in millions) |
South Korean Won | | | 47,291 | | | KRW |
Hungarian Forint | | | 9,907 | | | HUF |
Mexican Peso | | | 4,770 | | | MXN |
Japanese Yen | | | 2,763 | | | JPY |
Chinese Yuan Renminbi | | | 399 | | | CNY |
Romanian Leu | | | 341 | | | RON |
New Turkish Lira | | | 157 | | | TRY |
Euro | | | 91 | | | EUR |
Brazilian Real | | | 88 | | | BRL |
Polish Zloty | | | 76 | | | PLN |
British Pound | | | 55 | | | GBP |
Singapore Dollar | | | 28 | | | SGD |
The Company had additional foreign currency forward contracts that individually amounted to less than $10 million.
The fair value of derivative financial instruments recorded in the consolidated balance sheets as of December 31, 2010 and 2009 are as follows:
| | | | | | | | | | | | |
| | | Successor | |
| | | Asset Derivatives | | | Liability Derivatives | |
| | | Balance Sheet Location | | December 31,
2010 | | | Balance Sheet Location | | December 31,
2010 | |
Designated derivatives instruments: | | (in millions) | |
Commodity derivatives | | Other Current Assets | | $ | 37 | | | Accrued Liabilities | | $ | — | |
Foreign currency derivatives | | Other Current Assets | | | 29 | | | Accrued Liabilities | | | — | |
Foreign currency derivatives* | | Accrued Liabilities | | | — | | | Other Current Assets | | | 7 | |
Commodity derivatives | | Other Long-Term Assets | | | 11 | | | Other Long-Term Liabilities | | | — | |
Foreign currency derivatives | | Other Long-Term Assets | | | 10 | | | Other Long-Term Assets | | | 4 | |
| | | | | | | | | | | | |
Total | | | | $ | 87 | | | | | $ | 11 | |
| | | | | | | | | | | | |
| | | | |
Derivatives not designated: | | | | | | | | | | | | |
None | | | | | | | | | | | | |
| | | | | | | | | | | | |
| | | Successor | |
| | | Asset Derivatives | | | Liability Derivatives | |
| | | Balance Sheet
Location | | December 31,
2009 | | | Balance Sheet Location | | December 31,
2009 | |
Designated derivatives instruments: | | (in millions) | |
Commodity derivatives | | Other Current Assets | | $ | 4 | | | Accrued Liabilities | | $ | 1 | |
Foreign currency derivatives* | | Accrued Liabilities | | | 2 | | | Accrued Liabilities | | | 2 | |
Commodity derivatives | | Other Long-Term Assets | | | 2 | | | Other Long-Term Liabilities | | | — | |
Foreign currency derivatives | | Other Long-Term Assets | | | — | | | Other Long-Term Liabilities | | | 1 | |
| | | | | | | | | | | | |
Total | | | | $ | 8 | | | | | $ | 4 | |
| | | | | | | | | | | | |
| | | | |
Derivatives not designated: | | | | | | | | | | | | |
None | | | | | | | | | | | | |
| * | Derivative instruments within this category are subject to master netting arrangements and are presented on a net basis in the consolidated balance sheets in accordance with accounting guidance related to the offsetting of amounts related to certain contracts. |
The fair value of the net asset position of Delphi’s derivative financial instruments increased from December 31, 2009 to December 31, 2010 primarily due to the increase in the market price of commodities and certain foreign currencies.
The effect of derivative financial instruments in the consolidated statement of operations of the Successor for the year ended December 31, 2010 is as follows:
| | | | | | | | | | | | |
| | | Successor | |
Year ended December 31, 2010 | | Gain
Recognized in
OCI
(Effective
Portion) | | | Gain
Reclassified
from OCI into
Income
(Effective
Portion) | | | Gain
Recognized in
Income
(Ineffective
Portion
Excluded from
Effectiveness
Testing) | |
| | | (in millions) | |
Designated derivatives instruments: | | | | | | | | | | | | |
Commodity derivatives | | $ | 58 | | | $ | 12 | | | $ | — | |
Foreign currency derivatives | | | 48 | | | | 15 | | | | — | |
| | | | | | | | | | | | |
Total | | $ | 106 | | | $ | 27 | | | $ | — | |
| | | | | | | | | | | | |
| | | | |
Year ended December 31, 2010 | | Gain Recognized
in Income | |
| | | (in millions) | |
Derivatives not designated: | | | | |
Commodity derivatives | | $ | 1 | |
Foreign currency derivatives | | | 4 | |
| | | | |
Total | | $ | 5 | |
| | | | |
The effect of derivative financial instruments in the consolidated statement of operations of the Successor for the period from August 19 to December 31, 2009 is as follows:
| | | | | | | | | | | | |
| | | Successor | |
Period from August 19 to December 31, 2009 | | Gain
Recognized in
OCI (Effective
Portion) | | | Gain
Reclassified
from OCI into
Income
(Effective
Portion) | | | Gain
Recognized in
Income
(Ineffective
Portion
Excluded from
Effectiveness
Testing) | |
| | | (in millions) | |
| | | |
Designated derivatives instruments: | | | | | | | | | | | | |
Commodity derivatives | | $ | 6 | | | $ | — | | | $ | — | |
Foreign currency derivatives | | | — | | | | — | | | | 1 | |
| | | | | | | | | | | | |
Total | | $ | 6 | | | $ | — | | | $ | 1 | |
| | | | | | | | | | | | |
The effect of derivative financial instruments in the consolidated statement of operations of the Predecessor for the period from January 1 to October 6, 2009 is as follows:
| | | | | | | | | | | | |
| | | Predecessor | |
Period from January 1 to October 6, 2009 | | Loss Recognized
in OCI
(Effective
Portion) | | | Loss
Reclassified
from OCI into
Income
(Effective
Portion) | | | Gain
Recognized in
Income
(Ineffective
Portion
Excluded from
Effectiveness
Testing) | |
| | | (in millions) | |
| | | |
Designated derivatives instruments: | | | | | | | | | | | | |
Commodity derivatives | | $ | (43 | ) | | $ | (164 | ) | | $ | 3 | |
Foreign currency derivatives | | | (111 | ) | | | (180 | ) | | | 2 | |
| | | | | | | | | | | | |
Total | | $ | (154 | ) | | $ | (344 | ) | | $ | 5 | |
| | | | | | | | | | | | |
| | | | |
| | | Gain
(Loss) Recognized
in Income | |
| | | (in millions) | |
Derivatives not designated: | | | | |
Commodity derivatives | | $ | (15 | ) |
Foreign currency derivatives | | | 7 | |
| | | | |
Total | | $ | (8 | ) |
| | | | |
The gain or loss reclassified from OCI into income for the effective portion of designated derivative instruments and the gain or loss recognized in income for the ineffective portion of designated derivative instruments excluded from effectiveness testing were recorded to cost of sales in the consolidated statements of operations for the year ended December 31, 2010 and the periods from August 19 to December 31, 2009 and January 1 to October 6, 2009. The gain or loss recognized in income for non-designated derivative instruments was recorded in other income (expense), net for the year ended December 31, 2010 and cost of sales for the periods from August 19 to December 31, 2009 and January 1 to October 6, 2009 in the consolidated statements of operations.
Gains and losses on derivatives qualifying as cash flow hedges are recorded in OCI, to the extent that hedges are effective, until the underlying transactions are recognized in earnings. Unrealized amounts in
accumulated OCI will fluctuate based on changes in the fair value of hedge derivative contracts at each reporting period. Net gains included in accumulated OCI as of December 31, 2010 were $54 million after-tax ($84 million pre-tax). Of this pre-tax total, a gain of approximately $61 million is expected to be included in cost of sales within the next 12 months and a gain of approximately $23 million is expected to be included in cost of sales in subsequent periods. Cash flow hedges are discontinued when Delphi determines it is no longer probable that the originally forecasted transactions will occur. The amount included in cost of sales related to hedge ineffectiveness was insignificant for both the year ended December 31, 2010 and the period from August 19 to December 31, 2009 and was a gain of $6 million and a loss of $12 million for the period from January 1 to October 6, 2009 and the year ended December 31, 2008, respectively.
Fair value measurements
Fair Value Measurements on a Recurring Basis
All derivative instruments are required to be reported on the balance sheet at fair value unless the transactions qualify and are designated as normal purchases or sales. Changes in fair value are reported currently through earnings unless they meet hedge accounting criteria. Delphi’s derivative exposures are with counterparties with long-term investment grade credit ratings. Delphi estimates the fair value of its derivative contracts using an income approach based on valuation techniques to convert future amounts to a single, discounted amount. Estimates of the fair value of foreign currency and commodity derivative instruments are determined using exchange traded prices and rates. Delphi also considers the risk of non-performance in the estimation of fair value, and includes an adjustment for non-performance risk in the measure of fair value of derivative instruments. The non-performance risk adjustment reflects the credit default spread (“CDS”) applied to the net commodity and foreign currency exposures by counterparty. When Delphi is in a net derivative asset position, the counterparty CDS rates are applied to the net derivative asset position. When Delphi is in a net derivative liability position, estimates of peer companies’ CDS rates are applied to the net derivative liability position.
In certain instances where market data is not available, Delphi uses management judgment to develop assumptions that are used to determine fair value. This could include situations of market illiquidity for a particular currency or commodity or where observable market data may be limited. In those situations, Delphi generally surveys investment banks and/or brokers and utilizes the surveyed prices and rates in estimating fair value.
As of December 31, 2010 and 2009, Delphi was in a net derivative asset position of $76 million and $4 million, respectively, and there were no adjustments recorded for nonperformance risk as exposures were to counterparties with investment grade credit ratings.
As of December 31, 2010 and 2009, Delphi had the following assets measured at fair value on a recurring basis:
| | | | | | | | | | | | | | | | |
| | | Successor | |
| As of December 31, 2010: | | Total | | | Quoted Prices in
Active
Markets Level
1 | | | Significant
Other
Observable
Inputs Level 2 | | | Significant
Unobservable
Inputs
Level 3 | |
| | | (in millions) | |
Time deposits | | $ | 550 | | | $ | — | | | $ | 550 | | | $ | — | |
Available-for-sale securities | | | 12 | | | | 12 | | | | — | | | | — | |
Commodity derivatives | | | 48 | | | | — | | | | 48 | | | | — | |
Foreign currency derivatives | | | 28 | | | | — | | | | 28 | | | | — | |
| | | | | | | | | | | | | | | | |
Total | | $ | 638 | | | $ | 12 | | | $ | 626 | | | $ | — | |
| | | | | | | | | | | | | | | | |
As of December 31, 2009: | | | | | | | | | | | | | | | | |
Available-for-sale securities | | $ | 23 | | | $ | 20 | | | $ | 3 | | | $ | — | |
Commodity derivatives | | | 5 | | | | — | | | | 5 | | | | — | |
| | | | | | | | | | | | | | | | |
Total | | $ | 28 | | | $ | 20 | | | $ | 8 | | | $ | — | |
| | | | | | | | | | | | | | | | |
As of December 31, 2010 and 2009, Delphi had the following liabilities measured at fair value on a recurring basis:
| | | | | | | | | | | | | | | | |
| | | Successor | |
| As of December 31, 2010: | | Total | | | Quoted Prices in
Active
Markets Level
1 | | | Significant
Other
Observable
Inputs Level 2 | | | Significant
Unobservable
Inputs
Level 3 | |
| | | (in millions) | |
None | | | | | | | | | | | | | | | | |
| | | | |
As of December 31, 2009: | | | | | | | | | | | | | | | | |
Foreign currency derivatives | | $ | 1 | | | $ | — | | | $ | 1 | | | $ | — | |
| | | | | | | | | | | | | | | | |
Total | | $ | 1 | | | $ | — | | | $ | 1 | | | $ | — | |
| | | | | | | | | | | | | | | | |
Fair Value Measurements on a Nonrecurring Basis
In addition to items that are measured at fair value on a recurring basis, Delphi also has items in its balance sheet that are measured at fair value on a nonrecurring basis. As these items are not measured at fair value on a recurring basis, they are not included in the tables above. Nonfinancial assets and liabilities that are measured at fair value on a nonrecurring basis include long-lived assets, goodwill and intangible assets, asset retirement obligations and liabilities for exit or disposal activities measured at fair value upon initial recognition. No impairment charges were recorded during the year ended December 31, 2010. During the periods from August 19 to December 31, 2009 and January 1 to October 6, 2009, product-line specific long-lived assets with a carrying value of $18 million and $87 million were adjusted to their fair value of $1 million and $46 million, resulting in impairment charges of $17 million and $41 million, respectively. Fair value of long-lived assets is determined primarily using the anticipated cash flows discounted at a rate commensurate with the risk involved and a review of appraisals. As such, Delphi has determined that the fair value measurements of long-lived assets fall in Level 3 of the fair value hierarchy.
| 19. | OTHER INCOME (EXPENSE), NET |
Other income (expense), net included:
| | | | | | | | | | | | | | | | | | |
| | | Successor | | | | | Predecessor | |
| | | Year ended
December 31,
2010 | | | Period from
August 19 to
December 31,
2009 | | | | | Period from
January 1 to
October 6,
2009 | | | Year ended
December 31,
2008 | |
| | | (in millions) | | | | | (in millions) | |
Interest income | | $ | 29 | | | $ | 5 | | | | | $ | 10 | | | $ | 36 | |
Impairment – investment in available-for-sale security | | | (9 | ) | | | — | | | | | | — | | | | — | |
Loss on extinguishment of debt | | | (8 | ) | | | — | | | | | | — | | | | (49 | ) |
Acquisition-related transaction costs | | | — | | | | (19 | ) | | | | | — | | | | — | |
Other, net | | | 22 | | | | (3 | ) | | | | | 14 | | | | 22 | |
| | | | | | | | | | | | | | | | | | |
Other income (expense), net | | $ | 34 | | | $ | (17 | ) | | | | $ | 24 | | | $ | 9 | |
| | | | | | | | | | | | | | | | | | |
During the year ended December 31, 2010, Delphi repaid $12 million of interest-free government-backed debt due in 2021 which required compensating cash collateral. The debt was previously adjusted to a $4 million fair value as a result of acquisition accounting and therefore Delphi recognized an $8 million loss on early extinguishment of debt. Other, net primarily includes insurance and other recoveries and income from royalties.
The Successor recognized $19 million of transaction costs related to the Acquisition for the period from August 19 to December 31, 2009.
During the year ended December 31, 2008, the Predecessor recognized a $49 million loss on extinguishment of debt associated with the recognition of unamortized debt issuance costs related to the Amended and Restated DIP Credit Facility and the Refinanced DIP Credit Facility. Other, net for the year ended December 31, 2008 includes a $32 million gain from the sale of an investment accounted for under the cost method that had been previously fully impaired, which was offset by $16 million of expense related to an allowance recorded against a note receivable.
On March 31, 2010, Delphi completed the sale of its occupant protection systems business in Asia (“Asian OPS Business”) to Autoliv AB. The pro forma total net sales of the Asian OPS Business for the Predecessor period from January 1 to October 6, 2009 and the Successor period from August 19 to December 31, 2009 were approximately $200 million. In total, Delphi received net proceeds of $73 million and recognized a gain on divestiture of $10 million, which is included in Cost of sales in the consolidated statement of operations of the Successor for the year ended December 31, 2010. The results of operations, including the gain or loss on divestiture were not significant to the consolidated financial statements in any period presented, and the divestitures did not meet the discontinued operations criteria.
| 21. | DISCONTINUED OPERATIONS |
The Court approval of Delphi’s plan to dispose of the Steering Business and the interiors and closures business triggered held for sale accounting in 2007. The Court approval of bidding procedures for the sale of the remaining assets of the chassis business on April 23, 2009 and subsequent approval of the sale triggered held for sale accounting for the Automotive Holdings Group in the second quarter of 2009.
Steering and halfshaft business
In conjunction with the consummation of the Modified Plan on the Acquisition Date, an affiliate of GM acquired the Steering Business. Refer to Note 1. General and Acquisition of Predecessor Businesses for further information. During the period from January 1 to October 6, 2009, the Predecessor recorded a loss of $24 million, net of tax, due to the results of operations and adjustment of assets held for sale to fair value of the Steering Business. During 2008, the Predecessor recorded a loss of $34 million, net of tax, due to the results of operations, adjustment of assets held for sale to fair value of the Steering Business as of December 31, 2008 and the effectiveness of the Amended MRA.
Automotive Holdings Group
AHG included various non-core product lines and plant sites that did not fit the Predecessor’s strategic framework. As part of the Acquisition, the global suspensions and brake business of AHG was acquired by Delphi. Substantially all of the remainder of AHG emerged from chapter 11 as part of DPHH, and, therefore, is not included in Delphi’s consolidated financial statements as of and for the period ended December 31, 2009.
Global suspension and brakes business sale—On March 31, 2009, the Predecessor announced that it had entered into an asset sale and purchase agreement with BeijingWest Industries Co., Ltd. (“BWI”) for the sale of Delphi’s remaining chassis business, the global suspension and brakes business, whereby BWI would acquire machinery and equipment, intellectual property and certain real property for a purchase price of approximately $90 million, which is subject to certain adjustments. Certain customer and supplier contracts were also to be assumed and/or assigned to BWI. The 2008 annual revenues for the global suspension and brakes business were $670 million. The closing of the sale occurred in October 2009 and Delphi received net proceeds of $82 million, which, under the terms of the Acquisition were transferred, net of Delphi’s costs in connection with the sale, to GM during the Successor period from August 19 to December 31, 2009. During the period from January 1 to October 6, 2009, a held for sale loss of $29 million was recognized by the Predecessor to reflect the revaluation of the disposal group to fair value based on the estimated proceeds of the sale agreement.
Results of discontinued operations
The Steering Business, through the Acquisition Date and the Automotive Holdings Group, through the date of the respective divestitures within the Automotive Holdings Group, are reported as discontinued operations in the consolidated statement of operations and statement of cash flows of the Predecessor for the period from January 1 to October 6, 2009 and the year ended December 31, 2008.
The results of the discontinued operations are summarized as follows:
| | | | | | | | |
| | | Predecessor | |
| | | Period from
January 1 to
October 6,
2009 | | | Year ended
December 31,
2008 | |
| | | (in millions) | |
Total sales | | $ | 1,524 | | | $ | 3,575 | |
| | |
Loss before income taxes (including equity income, net of tax) | | $ | (28 | ) | | $ | (83 | ) |
Provision for income taxes | | | (17 | ) | | | (14 | ) |
| | | | | | | | |
Loss attributable to discontinued operations | | $ | (45 | ) | | $ | (97 | ) |
| | | | | | | | |
| 22. | SHARE-BASED COMPENSATION |
Board of Managers Equity Award
In June 2010, the 2010 Board of Managers Class E-1 Interest Incentive Plan (the “Plan”) was authorized in order to attract and reward board members and to promote the creation of long-term value for interest holders of Delphi. On June 30, 2010, board members received 24,000 restricted interests of a newly created class of membership interests (“Class E-1 Interests”). The restricted interests are subject to continued service through applicable vesting dates as follows:
Under certain conditions with respect to an initial public offering or a change in control, as defined in the Plan, any interests that have not yet vested may immediately become vested. All unvested Class E-1 Interests will fully vest in the event of a completed initial public offering if the resulting total equity valuation of the Company (based on the average closing price of Delphi shares during the 15-day period beginning on the 30th day after the closing of the offering), plus the value of prior distributions made under the LLP Agreement to holders of membership interests and any amounts distributed to holders of Class E-1 Interests with respect to or to repurchase their Class E-1 Interests, is at least $6 billion. In addition, upon the completion of an initial public offering, all outstanding membership interests will be converted to ordinary shares.
Approximately $14 million of compensation expense will be recognized through the remainder of the vesting period. This amount would be recognized immediately if the criteria for immediate vesting are met.
The fair market value of the Class E-1 Interests was estimated to be $19 million, based on a contemporaneous valuation performed by an independent valuation specialist, utilizing generally accepted valuation approaches. Beginning in the third quarter of 2010, Delphi recognized compensation cost on a straight-line basis. Compensation expense recognized during the year ended December 31, 2010 totaled $5 million, net of tax. There were no cash flow impacts for the year ended December 31, 2010.
Executive Long Term Incentive Plan
During the second quarter of 2010, the Board of Managers approved and authorized the VCP, a long-term incentive plan designed to assist the Company in attracting, retaining, motivating and rewarding key employees of the Company, and promoting the creation of long-term value. Participants were granted an award in September 2010 for the period ending December 31, 2012. Each individual participant’s target value was based on the participants’ level of responsibility within the Company and the country in which the participant is located. The awards cliff vest fully at the end of the performance period, but may immediately become fully vested upon a change in control, as defined in the VCP, for certain participants. In the event of a qualified termination, as defined, the participant shall vest in a pro-rata percentage of their award as of the termination date. For any other termination, the award shall be forfeited.
The amounts to be settled under the VCP will be determined based on Delphi’s enterprise value and “accrued distributions” (as defined in the VCP) as of December 31, 2012, compared to a target enterprise value of $8.25 billion. An enterprise value of $2.5 billion must be achieved to receive a minimum award payout and above this level the payout is determined as a percentage of the target award. The authorized target amount of the awards is $135 million (of which $108 million are outstanding as of December 31, 2010), but the ultimate final
settlement amount of the awards could be higher or lower, depending on the enterprise value of Delphi at December 31, 2012. The estimated fair value of the awards granted as of December 31, 2010 was $171 million. In the event of a completed initial public offering, the estimated enterprise value will be based on the average closing market price of the Company between the first day of trading on a public exchange and the end of the performance period, plus any “accrued distributions”. Delphi recognized compensation cost in 2010 and will continue to recognize compensation cost, based on estimates of the enterprise value, over the requisite vesting periods of the awards. Compensation expense recognized during the year ended December 31, 2010 totaled $31 million ($21 million, net of tax). Based on the estimate of enterprise value as of December 31, 2010, unrecognized compensation expense on a pretax basis of approximately $140 million is anticipated to be recognized on a straight-line basis during 2011 and 2012. There were no cash flow impacts for the year ended December 31, 2010.
Final settlement can be made in cash, membership interests, common stock or a combination thereof as provided in the participation agreement or as otherwise determined by the Compensation Committee of the Board of Managers.
The VCP awards are accounted for as liability awards pursuant to FASB ASC 718,Compensation—Stock Compensation. Estimating the fair value of the liability awards under the VCP requires assumptions regarding the Company’s enterprise value. Any differences in actual results from management’s estimates could result in fair values different from estimated fair values, which could materially impact the Company’s future results of operations and financial condition. The fair market value of the liability awards under the VCP is based on contemporaneous valuations performed by an independent valuation specialist, utilizing generally accepted valuation approaches.
Significant Factors, Assumptions, and Methodologies Used in Estimating Fair Value of Enterprise Value for VCP Awards and Fair Value of E-1 Interests
The estimated fair value of the Class E-1 Interests were based on a contemporaneous valuation performed as of the grant date. The liability awards under the VCP were based on contemporaneous valuations performed periodically by an independent valuation specialist. Both the Class E-1 Interests and VCP valuations utilize appropriate weighting of the market and income approaches.
Market Approach: The market approach measures the value of a company through analysis of recent sales or offerings of comparable companies (see Note 1. General and Acquisition of Predecessor Businesses for further description of the market approach). Based on analysis of guideline public companies and guideline merged or acquired companies, Delphi utilized 2010 EBITDA multiples and 2011 EBITDA multiples of 4.5x-6.0x to value the Class E-1 Interests and VCP awards.
In addition to the guideline public company and guideline merged or acquired company approaches, the Company considered the trading price of its Class B membership interests by qualified institutional investors in determining the enterprise value of the Company.
Income Approach: The income approach derives the value of a company based on assumptions about the company’s future stream of cash flows (see Note 1. General and Acquisition of Predecessor Businesses for further description of the income approach). Delphi provided its independent valuation specialist with projected net sales, expenses and cash flows for the years ended December 31, 2010, 2011 and 2012 for the Class E-1 awards and for the years ended December 31, 2010, 2011, 2012 and 2013 for the VCP awards. These financial projections represent management’s best estimate at the time of the contemporaneous valuations. Discount rates used to determine the present value of future cash flows were based on the weighted average cost of capital which ranged from 11.6%-13.7%.
Predecessor Plans
At the Acquisition Date, all outstanding common stock of the Predecessor, including all stock options exercisable, were cancelled. Prior to the Acquisition Date, the Predecessor’s share-based compensation programs included stock options, restricted stock units, and stock appreciation rights. Approximately $10 million of share-based compensation cost was recognized during the year ended December 31, 2008. In May 2008, the Predecessor cancelled all non-vested restricted stock units, resulting in the recording of $7 million of unrecognized compensation cost.
Effective December 2010, Delphi realigned its segment reporting to reflect certain items previously included in the Eliminations and Other segment within its core business segments. Delphi operates its core business along the following operating segments, which are grouped on the basis of similar product, market and operating factors.
Electronics and Safety, which includes component and systems integration expertise in audio and infotainment, body controls and security systems, displays, mechatronics, safety electronics and electric and hybrid electric vehicle power electronics, as well as advanced development of software.
Powertrain Systems, which includes extensive systems integration expertise in gasoline, diesel and fuel handling and full end-to-end systems including fuel injection, combustion, electronics controls, exhaust handling, test and validation capabilities, diesel and automotive aftermarket, and original equipment service.
Electrical/Electronic Architecture, which includes complete electrical architecture and component products.
Thermal Systems, which includes heating, ventilating and air conditioning (“HVAC”) systems, components for multiple transportation and other adjacent markets, and powertrain cooling and related technologies.
Eliminations and Other, which includes i) the elimination of inter-segment transactions, and ii) certain other expenses and income of a non-operating or strategic nature.
The accounting policies of the segments are the same as those described in Note 2. Significant Accounting Policies, except that the disaggregated financial results for the segments have been prepared using a management approach, which is consistent with the basis and manner in which management internally disaggregates financial information for the purposes of assisting internal operating decisions. Generally, Delphi evaluates performance based on stand-alone segment EBITDAR and accounts for inter-segment sales and transfers as if the sales or transfers were to third parties, at current market prices. Through December 31, 2010, Delphi’s management believed that EBITDAR was a meaningful measure of performance and it was used by management to analyze Company and stand-alone segment operating performance. Management also used EBITDAR for planning and forecasting purposes. Effective January 1, 2011, Delphi’s management began utilizing segment operating income before depreciation and amortization, including long-lived asset and goodwill impairment (“EBITDA”) as a key performance measure because its restructuring was substantially completed in 2010. Segment EBITDA and EBITDAR should not be considered substitutes for results prepared in accordance with U.S. GAAP and should not be considered alternatives to net income (loss) attributable to Successor/Predecessor, which is the most directly comparable financial measure to EBITDA and EBITDAR that is in accordance with U.S. GAAP. Segment EBITDA and EBITDAR, as determined and measured by Delphi, should also not be compared to similarly titled measures reported by other companies.
Included below are sales and operating data for Delphi’s segments for the year ended December 31, 2010, periods from August 19 to December 31, 2009 and January 1 to October 6, 2009 and the year ended December 31, 2008, as well as balance sheet data as of December 31, 2010 and 2009.
| | | | | | | | | | | | | | | | | | | | | | | | |
| | | Successor | |
| | | Electronics
and Safety | | | Powertrain
Systems | | | Electrical/
Electronic
Architecture | | | Thermal
Systems | | | Eliminations
and
Other(a) | | | Total | |
| 2010: | | (in millions) | |
Net sales | | $ | 2,721 | | | $ | 4,086 | | | $ | 5,620 | | | $ | 1,603 | | | $ | (213 | ) | | $ | 13,817 | |
EBITDA | | $ | 247 | | | $ | 361 | | | $ | 650 | | | $ | 109 | | | $ | (6 | ) | | $ | 1,361 | |
EBITDAR | | $ | 293 | | | $ | 423 | | | $ | 758 | | | $ | 165 | | | $ | (6 | ) | | $ | 1,633 | |
Depreciation & Amortization | | $ | 100 | | | $ | 170 | | | $ | 108 | | | $ | 42 | | | $ | 1 | | | $ | 421 | |
Operating income (loss) (b) | | $ | 147 | | | $ | 191 | | | $ | 542 | | | $ | 67 | | | $ | (7 | ) | | $ | 940 | |
Equity income (loss) | | $ | (3 | ) | | $ | 2 | | | $ | 7 | | | $ | 8 | | | $ | 3 | | | $ | 17 | |
Net income attributable to noncontrolling interest | | $ | 1 | | | $ | 28 | | | $ | 31 | | | $ | 12 | | | $ | — | | | $ | 72 | |
| |
| | | Successor | |
| | | Electronics
and Safety | | | Powertrain
Systems | | | Electrical/
Electronic
Architecture | | | Thermal
Systems | | | Eliminations
and
Other(a) | | | Total | |
| August 19 – December 31, 2009: | | (in millions) | |
Net sales | | $ | 761 | | | $ | 957 | | | $ | 1,325 | | | $ | 365 | | | $ | 13 | | | $ | 3,421 | |
EBITDA | | $ | 17 | | | $ | 9 | | | $ | 94 | | | $ | 8 | | | $ | 1 | | | $ | 129 | |
EBITDAR | | $ | 56 | | | $ | 79 | | | $ | 155 | | | $ | 21 | | | $ | 2 | | | $ | 313 | |
Depreciation & Amortization | | $ | 39 | | | $ | 52 | | | $ | 31 | | | $ | 17 | | | $ | — | | | $ | 139 | |
Operating income (loss) (c) | | $ | (22 | ) | | $ | (43 | ) | | $ | 63 | | | $ | (9 | ) | | $ | 1 | | | $ | (10 | ) |
Equity income (loss) | | $ | 1 | | | $ | — | | | $ | 5 | | | $ | — | | | $ | (1 | ) | | $ | 5 | |
Net income attributable to noncontrolling interest | | $ | — | | | $ | 5 | | | $ | 9 | | | $ | 1 | | | $ | — | | | $ | 15 | |
| |
| | | Predecessor | |
| | | Electronics
and Safety | | | Powertrain
Systems | | | Electrical/
Electronic
Architecture | | | Thermal
Systems | | | Eliminations
and
Other(a) | | | Total | |
| January 1 – October 6, 2009: | | (in millions) | |
Net sales | | $ | 1,801 | | | $ | 2,667 | | | $ | 2,970 | | | $ | 1,008 | | | $ | (112 | ) | | $ | 8,334 | |
EBITDA | | $ | (319 | ) | | $ | (71 | ) | | $ | (132 | ) | | $ | 4 | | | $ | 4 | | | $ | (514 | ) |
EBITDAR | | $ | (214 | ) | | $ | (9 | ) | | $ | (18 | ) | | $ | 17 | | | $ | (5 | ) | | $ | (229 | ) |
Depreciation & Amortization | | $ | 177 | | | $ | 163 | | | $ | 147 | | | $ | 53 | | | $ | — | | | $ | 540 | |
Operating income (loss) (d) | | $ | (496 | ) | | $ | (234 | ) | | $ | (279 | ) | | $ | (49 | ) | | $ | (60 | ) | | $ | (1,118 | ) |
Equity income (loss) | | $ | (13 | ) | | $ | (9 | ) | | $ | 4 | | | $ | (12 | ) | | $ | (6 | ) | | $ | (36 | ) |
Net income attributable to noncontrolling interest | | $ | 1 | | | $ | 9 | | | $ | 12 | | | $ | 6 | | | $ | 1 | | | $ | 29 | |
| |
| | | Predecessor | |
| | | Electronics
and Safety | | | Powertrain
Systems | | | Electrical/
Electronic
Architecture | | | Thermal
Systems | | | Eliminations
and
Other(a) | | | Total | |
| 2008: | | (in millions) | |
Net sales | | $ | 4,048 | | | $ | 5,368 | | | $ | 5,649 | | | $ | 2,121 | | | $ | (378 | ) | | $ | 16,808 | |
EBITDA | | $ | (199 | ) | | $ | 218 | | | $ | 65 | | | $ | 125 | | | $ | (420 | ) | | $ | (211 | ) |
EBITDAR | | $ | — | | | $ | 251 | | | $ | 195 | | | $ | 76 | | | $ | (253 | ) | | $ | 269 | |
Depreciation & Amortization | | $ | 261 | | | $ | 269 | | | $ | 205 | | | $ | 87 | | | $ | — | | | $ | 822 | |
Goodwill impairment | | $ | 157 | | | $ | — | | | $ | 168 | | | $ | — | | | $ | — | | | $ | 325 | |
Operating (loss) income (e) | | $ | (617 | ) | | $ | (51 | ) | | $ | (308 | ) | | $ | 38 | | | $ | (487 | ) | | $ | (1,425 | ) |
Equity income | | $ | — | | | $ | 3 | | | $ | 9 | | | $ | 6 | | | $ | 11 | | | $ | 29 | |
Net income attributable to noncontrolling interest | | $ | — | | | $ | 13 | | | $ | 12 | | | $ | 4 | | | $ | — | | | $ | 29 | |
| | | | | | | | | | | | | | | | | | | | | | | | |
| | | Electronics
and Safety | | | Powertrain
Systems | | | Electrical/
Electronic
Architecture | | | Thermal
Systems | | | Eliminations
and
Other(a) | | | Total | |
| Balance as of: | | (in millions) | |
Successor - December 31, 2010 | | | | | | | | | | | | | | | | | | | | | | | | |
Investment in affiliates | | $ | 61 | | | $ | 53 | | | $ | 85 | | | $ | 60 | | | $ | 22 | | | $ | 281 | |
Capital expenditures | | $ | 59 | | | $ | 186 | | | $ | 202 | | | $ | 35 | | | $ | 18 | | | $ | 500 | |
Segment assets | | $ | 1,905 | | | $ | 3,718 | | | $ | 3,336 | | | $ | 898 | | | $ | 1,225 | | | $ | 11,082 | |
Successor - December 31, 2009 | | | | | | | | | | | | | | | | | | | | | | | | |
Investment in affiliates | | $ | 66 | | | $ | 56 | | | $ | 74 | | | $ | 54 | | | $ | 20 | | | $ | 270 | |
Capital expenditures (August 19-December 31, 2009) | | $ | 14 | | | $ | 41 | | | $ | 21 | | | $ | 8 | | | $ | 4 | | | $ | 88 | |
Segment assets | | $ | 2,326 | | | $ | 3,468 | | | $ | 3,082 | | | $ | 824 | | | $ | 607 | | | $ | 10,307 | |
Predecessor - October 6, 2009 | | | | | | | | | | | | | | | | | | | | | | | | |
Capital expenditures (January 1-October 6, 2009) | | $ | 58 | | | $ | 167 | | | $ | 60 | | | $ | 29 | | | $ | 7 | | | $ | 321 | |
| (a) | Eliminations and Other includes the elimination of inter-segment transactions and charges related to U.S. employee workforce transition programs in the amount of $69 million in 2008 (Refer to Note 13. U.S. Employee Workforce Transition Programs). |
| (b) | Includes charges recorded in 2010 related to costs associated with employee termination benefits and other exit costs of $29 million for Electronics and Safety, $49 million for Powertrain Systems, $94 million for Electrical/Electronic Architecture and $52 million for Thermal Systems. |
| (c) | Includes charges recorded from August 19 to December 31, 2009 related to long-lived asset impairments and costs associated with employee termination benefits and other exit costs of $20 million for Electronics and Safety, $62 million for Powertrain Systems, $50 million for Electrical/Electronic Architecture, $10 million for Thermal Systems, and $1 million for Eliminations and Other. |
| (d) | Includes charges recorded from January 1 to October 6, 2009 related to long-lived asset impairments and costs associated with employee termination benefits and other exit costs of $128 million for Electronics and Safety, $46 million for Powertrain Systems, $100 million for Electrical/Electronic Architecture, $13 million for Thermal Systems, and $(11) million for Eliminations and Other. |
| (e) | Includes charges recorded in 2008 related to long-lived asset and goodwill impairments and costs associated with employee termination benefits and other exit costs of $322 million for Electronics and Safety, $69 million for Powertrain Systems, $252 million for Electrical/Electronic Architecture and $35 million for Thermal Systems. |
The reconciliation of EBITDAR to EBITDA includes other transformation and rationalization costs related to 1) the implementation of information technology systems to support finance, manufacturing and product development initiatives, 2) certain plant consolidations and closures costs, and 3) consolidation of many staff administrative functions into a global business service group, and 4) employee benefit plan settlements in Mexico. The reconciliation of EBITDA to net income (loss) attributable to Successor/Predecessor follows:
| | | | | | | | | | | | | | | | | | | | | | | | |
| | | Successor | |
| | | Electronics
and Safety | | | Powertrain
Systems | | | Electrical/
Electronic
Architecture | | | Thermal
Systems | | | Eliminations
and Other | | | Total | |
| 2010: | | (in millions) | |
EBITDAR | | $ | 293 | | | $ | 423 | | | $ | 758 | | | $ | 165 | | | $ | (6 | ) | | $ | 1,633 | |
Transformation and rationalization charges: | | | | | | | | | | | | | | | | | | | | | | | | |
Employee termination benefits and other exit costs | | | (29 | ) | | | (49 | ) | | | (94 | ) | | | (52 | ) | | | — | | | | (224 | ) |
Other transformation and rationalization costs | | | (17 | ) | | | (13 | ) | | | (14 | ) | | | (4 | ) | | | — | | | | (48 | ) |
| | | | | | | | | | | | | | | | | | | | | | | | |
EBITDA | | $ | 247 | | | $ | 361 | | | $ | 650 | | | $ | 109 | | | $ | (6 | ) | | | 1,361 | |
| | | | | | | | | | | | | | | | | | | | | | | | |
Depreciation and amortization | | | (100 | ) | | | (170 | ) | | | (108 | ) | | | (42 | ) | | | (1 | ) | | | (421 | ) |
| | | | | | | | | | | | | | | | | | | | | | | | |
Operating income (loss) | | $ | 147 | | | $ | 191 | | | $ | 542 | | | $ | 67 | | | $ | (7 | ) | | | 940 | |
| | | | | | | | | | | | | | | | | | | | | | | | |
Interest expense | | | | | | | | | | | | | | | | | | | | | | | (30 | ) |
Other income, net | | | | | | | | | | | | | | | | | | | | | | | 34 | |
| | | | | | | | | | | | | | | | | | | | | | | | |
Income from continuing operations before income taxes and equity income | | | | | | | | | | | | | | | | | | | | | | | 944 | |
Income tax expense | | | | | | | | | | | | | | | | | | | | | | | (258 | ) |
Equity income, net of tax | | | | | | | | | | | | | | | | | | | | | | | 17 | |
| | | | | | | | | | | | | | | | | | | | | | | | |
Net income | | | | | | | | | | | | | | | | | | | | | | $ | 703 | |
Net income attributable to noncontrolling interest | | | | | | | | | | | | | | | | | | | | | | | 72 | |
| | | | | | | | | | | | | | | | | | | | | | | | |
Net income attributable to Successor | | | | | | | | | | | | | | | | | | | | | | $ | 631 | |
| | | | | | | | | | | | | | | | | | | | | | | | |
| | | | | | | | | | | | | | | | | | | | | | | | |
| | | Successor | |
| | | Electronics
and Safety | | | Powertrain
Systems | | | Electrical/
Electronic
Architecture | | | Thermal
Systems | | | Eliminations
and Other | | | Total | |
| August 19 – December 31, 2009: | | (in millions) | |
EBITDAR | | $ | 56 | | | $ | 79 | | | $ | 155 | | | $ | 21 | | | $ | 2 | | | $ | 313 | |
Transformation and rationalization charges: | | | | | | | | | | | | | | | | | | | | | | | | |
Employee termination benefits and other exit costs | | | (20 | ) | | | (50 | ) | | | (50 | ) | | | (5 | ) | | | (1 | ) | | | (126 | ) |
Other transformation and rationalization costs | | | (19 | ) | | | (20 | ) | | | (11 | ) | | | (8 | ) | | | — | | | | (58 | ) |
| | | | | | | | | | | | | | | | | | | | | | | | |
EBITDA | | $ | 17 | | | $ | 9 | | | $ | 94 | | | $ | 8 | | | $ | 1 | | | | 129 | |
| | | | | | | | | | | | | | | | | | | | | | | | |
Depreciation and amortization | | | (39 | ) | | | (52 | ) | | | (31 | ) | | | (17 | ) | | | — | | | | (139 | ) |
| | | | | | | | | | | | | | | | | | | | | | | | |
Operating (loss) income | | $ | (22 | ) | | $ | (43 | ) | | $ | 63 | | | $ | (9 | ) | | $ | 1 | | | | (10 | ) |
| | | | | | | | | | | | | | | | | | | | | | | | |
Interest expense | | | | | | | | | | | | | | | | | | | | | | | (8 | ) |
Other expense, net | | | | | | | | | | | | | | | | | | | | | | | (17 | ) |
| | | | | | | | | | | | | | | | | | | | | | | | |
Loss from continuing operations before income taxes and equity income | | | | | | | | | | | | | | | | | | | | | | | (35 | ) |
Income tax benefit | | | | | | | | | | | | | | | | | | | | | | | 27 | |
Equity income, net of tax | | | | | | | | | | | | | | | | | | | | | | | 5 | |
| | | | | | | | | | | | | | | | | | | | | | | | |
Net loss | | | | | | | | | | | | | | | | | | | | | | $ | (3 | ) |
Net income attributable to noncontrolling interest | | | | | | | | | | | | | | | | | | | | | | | 15 | |
| | | | | | | | | | | | | | | | | | | | | | | | |
Net loss attributable to Successor | | | | | | | | | | | | | | | | | | | | | | $ | (18 | ) |
| | | | | | | | | | | | | | | | | | | | | | | | |
| | | | | | | | | | | | | | | | | | | | | | | | |
| | | Predecessor | |
| | | Electronics
and Safety | | | Powertrain
Systems | | | Electrical/
Electronic
Architecture | | | Thermal
Systems | | | Eliminations
and Other | | | Total | |
| | | (in millions) | |
January 1 – October 6, 2009: | | | | |
EBITDAR | | $ | (214 | ) | | $ | (9 | ) | | $ | (18 | ) | | $ | 17 | | | $ | (5 | ) | | $ | (229 | ) |
Transformation and rationalization charges: | | | | | | | | | | | | | | | | | | | | | | | | |
Employee termination benefits and other exit costs | | | (91 | ) | | | (45 | ) | | | (99 | ) | | | (11 | ) | | | 11 | | | | (235 | ) |
Other transformation and rationalization costs | | | (14 | ) | | | (17 | ) | | | (15 | ) | | | (2 | ) | | | (2 | ) | | | (50 | ) |
| | | | | | | | | | | | | | | | | | | | | | | | |
EBITDA | | $ | (319 | ) | | $ | (71 | ) | | $ | (132 | ) | | $ | 4 | | | $ | 4 | | | | (514 | ) |
| | | | | | | | | | | | | | | | | | | | | | | | |
Depreciation and amortization | | | (177 | ) | | | (163 | ) | | | (147 | ) | | | (53 | ) | | | — | | | | (540 | ) |
Discontinued operations | | | — | | | | — | | | | — | | | | — | | | | (64 | ) | | | (64 | ) |
| | | | | | | | | | | | | | | | | | | | | | | | |
Operating loss | | $ | (496 | ) | | $ | (234 | ) | | $ | (279 | ) | | $ | (49 | ) | | $ | (60 | ) | | | (1,118 | ) |
| | | | | | | | | | | | | | | | | | | | | | | | |
Other income, net | | | | | | | | | | | | | | | | | | | | | | | 24 | |
Reorganization items | | | | | | | | | | | | | | | | | | | | | | | 10,210 | |
| | | | | | | | | | | | | | | | | | | | | | | | |
Income from continuing operations before income taxes and equity loss | | | | | | | | | | | | | | | | | | | | | | | 9,116 | |
Income tax benefit | | | | | | | | | | | | | | | | | | | | | | | 311 | |
Equity loss, net of tax | | | | | | | | | | | | | | | | | | | | | | | (36 | ) |
Loss from discontinued operations, net of tax | | | | | | | | | | | | | | | | | | | | | | | (44 | ) |
| | | | | | | | | | | | | | | | | | | | | | | | |
Net income | | | | | | | | | | | | | | | | | | | | | | $ | 9,347 | |
Net income attributable to noncontrolling interest | | | | | | | | | | | | | | | | | | | | | | | 29 | |
| | | | | | | | | | | | | | | | | | | | | | | | |
Net income attributable to Predecessor | | | | | | | | | | | | | | | | | | | | | | $ | 9,318 | |
| | | | | | | | | | | | | | | | | | | | | | | | |
| | | | | | | | | | | | | | | | | | | | | | | | |
| | | Predecessor | |
| | | Electronics
and Safety | | | Powertrain
Systems | | | Electrical/
Electronic
Architecture | | | Thermal
Systems | | | Eliminations
and Other | | | Total | |
| | | (in millions) | |
2008: | | | | | | | | | | | | | | | | | | | | | | | | |
EBITDAR | | $ | — | | | $ | 251 | | | $ | 195 | | | $ | 76 | | | $ | (253 | ) | | $ | 269 | |
Transformation and rationalization charges: | | | | | | | | | | | | | | | | | | | | | | | | |
U.S. employee workforce transition program charges | | | — | | | | — | | | | — | | | | — | | | | (69 | ) | | | (69 | ) |
GM settlement – MRA | | | 42 | | | | 94 | | | | 15 | | | | 88 | | | | (50 | ) | | | 189 | |
Employee termination benefits and other exit costs | | | (150 | ) | | | (69 | ) | | | (82 | ) | | | (25 | ) | | | — | | | | (326 | ) |
Loss on divestitures | | | (13 | ) | | | (14 | ) | | | — | | | | — | | | | — | | | | (27 | ) |
Other transformation and rationalization costs | | | (78 | ) | | | (44 | ) | | | (63 | ) | | | (14 | ) | | | (48 | ) | | | (247 | ) |
| | | | | | | | | | | | | | | | | | | | | | | | |
EBITDA | | $ | (199 | ) | | $ | 218 | | | $ | 65 | | | $ | 125 | | | $ | (420 | ) | | | (211 | ) |
| | | | | | | | | | | | | | | | | | | | | | | | |
Depreciation and amortization | | | (261 | ) | | | (269 | ) | | | (205 | ) | | | (87 | ) | | | — | | | | (822 | ) |
Goodwill impairment | | | (157 | ) | | | — | | | | (168 | ) | | | — | | | | — | | | | (325 | ) |
Discontinued operations | | | — | | | | — | | | | — | | | | — | | | | (67 | ) | | | (67 | ) |
| | | | | | | | | | | | | | | | | | | | | | | | |
Operating (loss) income | | $ | (617 | ) | | $ | (51 | ) | | $ | (308 | ) | | $ | 38 | | | $ | (487 | ) | | | (1,425 | ) |
| | | | | | | | | | | | | | | | | | | | | | | | |
Interest expense | | | | | | | | | | | | | | | | | | | | | | | (434 | ) |
Other income, net | | | | | | | | | | | | | | | | | | | | | | | 9 | |
Reorganization items | | | | | | | | | | | | | | | | | | | | | | | 5,147 | |
| | | | | | | | | | | | | | | | | | | | | | | | |
Income from continuing operations before income taxes and equity income | | | | | | | | | | | | | | | | | | | | | | | 3,297 | |
Income tax expense | | | | | | | | | | | | | | | | | | | | | | | (163 | ) |
Equity income, net of tax | | | | | | | | | | | | | | | | | | | | | | | 29 | |
Loss from discontinued operations, net of tax | | | | | | | | | | | | | | | | | | | | | | | (97 | ) |
| | | | | | | | | | | | | | | | | | | | | | | | |
Net income | | | | | | | | | | | | | | | | | | | | | | $ | 3,066 | |
Net income attributable to noncontrolling interest | | | | | | | | | | | | | | | | | | | | | | | 29 | |
| | | | | | | | | | | | | | | | | | | | | | | | |
Net income attributable to Predecessor | | | | | | | | | | | | | | | | | | | | | | $ | 3,037 | |
| | | | | | | | | | | | | | | | | | | | | | | | |
Information concerning principal geographic areas is set forth below. Net sales data reflects the manufacturing location and is for the year ended December 31, 2010, the periods from August 19 to December 31 and January 1 to October 6, 2009 and year ended December 31 2008. Net property data is as of December 31.
| | | | | | | | | | | | | | | | | | | | | | | | | | | | | | |
| | | Successor | | | | | Predecessor | |
| | | Year ended
December 31, 2010 | | | Period from August 19 to
December 31, 2009 | | | | | Period from
January 1 to
December 31,
2009 | | | Year ended
December 31, 2008 | |
| | | Net Sales | | | Net
Property(a) | | | Net Sales | | | Net
Property(a) | | | | | Net Sales | | | Net Sales | | | Net
Property(a) | |
| | | (in millions) | | | | | (in millions) | |
United States | | $ | 4,529 | | | $ | 417 | | | $ | 1,083 | | | $ | 430 | | | | | $ | 3,107 | | | $ | 6,994 | | | $ | 1,144 | |
Other North America | | | 76 | | | | 134 | | | | 16 | | | | 109 | | | | | | 24 | | | | 63 | | | | 252 | |
Europe, Middle East & Africa(b) | | | 5,892 | | | | 1,045 | | | | 1,448 | | | | 1,047 | | | | | | 3,330 | | | | 6,950 | | | | 1,388 | |
Asia Pacific | | | 2,177 | | | | 325 | | | | 590 | | | | 272 | | | | | | 1,223 | | | | 1,747 | | | | 386 | |
South America | | | 1,143 | | | | 146 | | | | 284 | | | | 102 | | | | | | 650 | | | | 1,054 | | | | 129 | |
| | | | | | | | | | | | | | | | | | | | | | | | | | | | | | |
Total | | $ | 13,817 | | | $ | 2,067 | | | $ | 3,421 | | | $ | 1,960 | | | | | $ | 8,334 | | | $ | 16,808 | | | $ | 3,299 | |
| | | | | | | | | | | | | | | | | | | | | | | | | | | | | | |
| (a) | Net property data represents property, plant and equipment, net of accumulated depreciation. |
| (b) | Includes our country of domicile, the United Kingdom. We have net sales of $690 million, $159 million, $394 million and $1,047 million in the United Kingdom for the year ended December 31, 2010, the period from August 19 to December 31, 2009, the period from January 1 to October 6, 2009 and the year ended December 31, 2008 respectively. We have net property in the United Kingdom of $137 million, $141 million and $171 million as of December 31, 2010, 2009 and 2008, respectively. |
| 24. | QUARTERLY DATA (UNAUDITED) |
The following is a condensed summary of the Company’s unaudited quarterly results of continuing operations for fiscal 2010 and 2009. The historical data included for the three months ended December 31, 2009 represents the Successor’s historical financial statements for the period from August 19, 2009 to December 31, 2009 (the Successor had no material or substantive transactions from its incorporation on August 19, 2009 to the Acquisition) and the data included for the three months ended March 31, June 30 and September 30, 2009 represents the Predecessor’s historical financial statements for the period from January 1, 2009 to October 6, 2009 (the activity from October 1 through October 6, 2009 is included in the three months ended September 30, 2009).
The historical data included for all 2009 periods and the data for the 2010 periods ended March 31, June 30 and September 30 has been reclassified to conform to the December 31, 2010 presentation. The Company has reclassified amounts from cost of sales and selling, general and administrative expenses to restructuring and has also included depreciation expense in cost of sales and selling, general and administrative expenses, as applicable. In addition, the 2010 periods ended March 31 and June 30 also include measurement period adjustments totaling $11 million of reduced depreciation expense.
| | | | | | | | | | | | | | | | | | | | |
| | | Successor | |
| | | Three months ended | |
| | | March 31, | | | June 30, | | | Sept. 30, | | | Dec. 31, | | | Total | |
| | | (in millions) | |
2010 | | | | | | | | | | | | | | | | | | | | |
Net sales | | $ | 3,410 | | | $ | 3,446 | | | $ | 3,309 | | | $ | 3,652 | | | $ | 13,817 | |
Cost of sales | | | 2,848 | | | | 2,903 | | | | 2,807 | | | | 3,210 | | | | 11,768 | |
| | | | | | | | | | | | | | | | | | | | |
Gross profit | | $ | 562 | | | $ | 543 | | | $ | 502 | | | $ | 442 | | | $ | 2,049 | |
| | | | | | | | | | | | | | | | | | | | |
Operating income | | $ | 324 | | | $ | 297 | | | $ | 206 | | | $ | 113 | | | $ | 940 | |
Net income | | $ | 235 | | | $ | 233 | | | $ | 144 | | | $ | 91 | | | $ | 703 | |
| | | | | | | | | | | | | | | | | | | | |
Net income attributable to Successor | | $ | 215 | | | $ | 214 | | | $ | 127 | | | $ | 75 | | | $ | 631 | |
| | | | | | | | | | | | | | | | | | | | |
Net income per membership interests unit | | | | | | | | | | | | | | | | | | | | |
Class A | | $ | 21.50 | | | $ | 21.40 | | | $ | 12.70 | | | $ | 9.75 | | | $ | 65.35 | |
Class B | | | 394.22 | | | | 392.38 | | | | 232.86 | | | | 137.52 | | | | 1,156.98 | |
Class C | | | 376.25 | | | | 374.50 | | | | 222.25 | | | | 91.88 | | | | 1,064.88 | |
Class E-1 | | | — | | | | — | | | | — | | | | — | | | | — | |
| | | |
| | | Predecessor | | | Successor | | | | |
| | | Three months ended | | | Three months
ended | | | | |
| | | March 31, | | | June 30, | | | Sept. 30, | | | Dec. 31, | | | Total | |
| | | (in millions, except per share amounts) | | | (in millions) | |
2009 | | | | | | | | | | | | | | | | | | | | |
Net sales | | $ | 2,409 | | | $ | 2,775 | | | $ | 3,150 | | | $ | 3,421 | | | $ | 11,755 | |
Cost of sales | | | 2,621 | | | | 2,830 | | | | 3,029 | | | | 3,047 | | | | 11,527 | |
| | | | | | | | | | | | | | | | | | | | |
Gross profit | | $ | (212 | ) | | $ | (55 | ) | | $ | 121 | | | $ | 374 | | | $ | 228 | |
| | | | | | | | | | | | | | | | | | | | |
Operating loss | | $ | (520 | ) | | $ | (357 | ) | | $ | (241 | ) | | $ | (10 | ) | | $ | (1,128 | ) |
Income (loss) from continuing
operations (a) | | $ | 538 | | | $ | (564 | ) | | $ | 9,417 | | | $ | (3 | ) | | $ | 9,388 | |
Income (loss) from discontinued operations, net of tax | | | 18 | | | | (28 | ) | | | (34 | ) | | | — | | | | (44 | ) |
| | | | | | | | | | | | | | | | | | | | |
Net income (loss) | | $ | 556 | | | $ | (592 | ) | | $ | 9,383 | | | $ | (3 | ) | | $ | 9,344 | |
| | | | | | | | | | | | | | | | | | | | |
Net income (loss) attributable to Successor/Predecessor | | $ | 552 | | | $ | (603 | ) | | $ | 9,369 | | | $ | (18 | ) | | $ | 9,300 | |
| | | | | | | | | | | | | | | | | | | | |
Basic and diluted (loss) income per share | | | | | | | | | | | | | | | | | | | | |
Continuing operations | | $ | 0.95 | | | $ | (1.02 | ) | | $ | 16.65 | | | $ | — | | | $ | — | |
Discontinued operations | | | 0.03 | | | | (0.05 | ) | | | (0.06 | ) | | | — | | | | — | |
| | | | | | | | | | | | | | | | | | | | |
Basic and diluted loss per share | | $ | 0.98 | | | $ | (1.07 | ) | | $ | 16.59 | | | $ | — | | | $ | — | |
| | | | | | | | | | | | | | | | | | | | |
Net loss per membership interests unit | | | | | | | | | | | | | | | | | | | | |
Class A | | $ | — | | | $ | — | | | $ | — | | | $ | (1.80 | ) | | $ | — | |
Class B | | | — | | | | — | | | | — | | | | (33.00 | ) | | | — | |
Class C | | | — | | | | — | | | | — | | | | (31.50 | ) | | | — | |
Common stock price | | | | | | | | | | | | | | | | | | | | |
High | | $ | 0.17 | | | $ | 0.12 | | | $ | 0.09 | | | $ | N/A | | | $ | N/A | |
Low | | $ | 0.03 | | | $ | 0.05 | | | $ | 0.04 | | | $ | N/A | | | $ | N/A | |
| (a) | Income (Loss) from continuing operations includes the reorganization gain of $11,159 million in the third quarter of 2009 related to the extinguishment of liabilities subject to compromise. |
SCHEDULE II – VALUATION AND QUALIFYING ACCOUNTS AND RESERVES
| | | | | | | | | | | | | | | | | | | | |
| | | | | | Additions | | | | | | | | | | |
| | | Balance at
Beginning of
Period | | | Charged to
Costs and
Expenses | | | Deductions | | | Other Activity | | | Balance at
End of Period | |
| | | (in millions) | |
Successor | | | | | | | | | | | | | | | | | | | | |
December 31, 2010: | | | | | | | | | | | | | | | | | | | | |
Allowance for doubtful accounts | | $ | 33 | | | $ | 45 | | | $ | (12 | ) | | $ | (2 | ) | | $ | 64 | |
Tax valuation allowance | | $ | 552 | | | $ | 8 | | | $ | (35 | ) | | $ | (24 | ) | | $ | 501 | |
| | | | | |
Period from August 19 to December 31, 2009: | | | | | | | | | | | | | | | | | | | | |
Allowance for doubtful accounts | | $ | — | | | $ | 33 | | | $ | — | | | $ | — | | | $ | 33 | |
Tax valuation allowance | | $ | 490 | | | $ | 46 | | | $ | — | | | $ | 16 | | | $ | 552 | |
| | | | | |
Predecessor | | | | | | | | | | | | | | | | | | | | |
Period from January 1 to October 6, 2009: | | | | | | | | | | | | | | | | | | | | |
Allowance for doubtful accounts | | $ | 134 | | | $ | 22 | | | $ | (47 | ) | | $ | (109 | ) | | $ | — | |
Tax valuation allowance | | $ | 9,144 | | | $ | (237 | ) | | $ | — | | | $ | (8,417 | )(1) | | $ | 490 | |
| | | | | |
December 31, 2008: | | | | | | | | | | | | | | | | | | | | |
Allowance for doubtful accounts | | $ | 112 | | | $ | 63 | | | $ | (34 | ) | | $ | (7 | ) | | $ | 134 | |
Tax valuation allowance | | $ | 9,744 | | | $ | (1,726 | ) | | $ | (8 | ) | | $ | 1,134 | | | $ | 9,144 | |
| (1) | Other activity represents the loss of Delphi’s U.S. net operating loss carry forwards and other tax attributes in connection with the October 6, 2009 acquisition of substantially all of the Predecessor’s businesses, resulting in a corresponding reduction in the valuation allowance. |
DELPHI AUTOMOTIVE LLP
CONSOLIDATED STATEMENTS OF OPERATIONS
(Unaudited)
| | | | | | | | |
| | | Three months ended
March 31, | |
| | | 2011 | | | 2010 | |
| | | (in millions) | |
Net sales | | $ | 3,997 | | | $ | 3,410 | |
Operating expenses: | | | | | | | | |
Cost of sales | | | 3,353 | | | | 2,848 | |
Selling, general and administrative | | | 205 | | | | 198 | |
Amortization | | | 18 | | | | 14 | |
Restructuring (Note 7) | | | 9 | | | | 26 | |
| | | | | | | | |
Total operating expenses | | | 3,585 | | | | 3,086 | |
| | | | | | | | |
Operating income | | | 412 | | | | 324 | |
Interest expense | | | (6 | ) | | | (8 | ) |
Other income, net (Note 14) | | | 3 | | | | 2 | |
| | | | | | | | |
Income before income taxes and equity income | | | 409 | | | | 318 | |
Income tax expense | | | (116 | ) | | | (85 | ) |
| | | | | | | | |
Income before equity income | | | 293 | | | | 233 | |
Equity income, net of tax | | | 17 | | | | 2 | |
| | | | | | | | |
Net income | | | 310 | | | | 235 | |
Net income attributable to noncontrolling interest | | | 19 | | | | 20 | |
| | | | | | | | |
Net income attributable to Delphi | | $ | 291 | | | $ | 215 | |
| | | | | | | | |
Net income attributable to membership interests: | | | | | | | | |
Class A | | $ | 76 | | | $ | 38 | |
Class B | | | 189 | | | | 139 | |
Class C | | | 25 | | | | 38 | |
Class E-1 | | | 1 | | | | — | |
| | | | | | | | |
Total | | $ | 291 | | | $ | 215 | |
| | | | | | | | |
Net income per membership interests unit | | | | | | | | |
Class A | | $ | 43.50 | | | $ | 21.50 | |
Class B | | | 531.79 | | | | 394.22 | |
Class C | | | 253.78 | | | | 376.25 | |
Class E-1 | | $ | 40.42 | | | $ | — | |
| | | | | | | | | | | | | | | | |
| | | Three months ended
June 30, | | | Six months ended
June 30, | |
| | | 2011 | | | 2010 | | | 2011 | | | 2010 | |
| | | (in millions) | |
Net sales | | $ | 4,213 | | | $ | 3,446 | | | $ | 8,210 | | | $ | 6,856 | |
Operating expenses: | | | | | | | | | | | | | | | | |
Cost of sales | | | 3,518 | | | | 2,903 | | | | 6,871 | | | | 5,751 | |
Selling, general and administrative | | | 240 | | | | 199 | | | | 445 | | | | 397 | |
Amortization | | | 19 | | | | 17 | | | | 37 | | | | 31 | |
Restructuring (Note 7) | | | 8 | | | | 30 | | | | 17 | | | | 56 | |
| | | | | | | | | | | | | | | | |
Total operating expenses | | | 3,785 | | | | 3,149 | | | | 7,370 | | | | 6,235 | |
| | | | | | | | | | | | | | | | |
Operating income | | | 428 | | | | 297 | | | | 840 | | | | 621 | |
Interest expense | | | (41 | ) | | | (8 | ) | | | (47 | ) | | | (16 | ) |
Other (expense) income, net (Note 14) | | | (4 | ) | | | — | | | | (1 | ) | | | 2 | |
| | | | | | | | | | | | | | | | |
Income before income taxes and equity income | | | 383 | | | | 289 | | | | 792 | | | | 607 | |
Income tax expense | | | (73 | ) | | | (62 | ) | | | (189 | ) | | | (147 | ) |
| | | | | | | | | | | | | | | | |
Income before equity income | | | 310 | | | | 227 | | | | 603 | | | | 460 | |
Equity income, net of tax | | | 6 | | | | 6 | | | | 23 | | | | 8 | |
| | | | | | | | | | | | | | | | |
Net income | | | 316 | | | | 233 | | | | 626 | | | | 468 | |
Net income attributable to noncontrolling interest | | | 18 | | | | 19 | | | | 37 | | | | 39 | |
| | | | | | | | | | | | | | | | |
Net income attributable to Delphi | | $ | 298 | | | $ | 214 | | | $ | 589 | | | $ | 429 | |
| | | | | | | | | | | | | | | | |
Net income attributable to membership interests: | | | | | | | | | | | | | | | | |
Class A | | $ | — | | | $ | 37 | | | $ | 76 | | | $ | 75 | |
Class B | | | 297 | | | | 140 | | | | 486 | | | | 279 | |
Class C | | | — | | | | 37 | | | | 25 | | | | 75 | |
Class E-1 | | | 1 | | | | — | | | | 2 | | | | — | |
| | | | | | | | | | | | | | | | |
Total | | $ | 298 | | | $ | 214 | | | $ | 589 | | | $ | 429 | |
| | | | | | | | | | | | | | | | |
Net income per membership interests unit | | | | | | | | | | | | | | | | |
Class A | | $ | — | | | $ | 21.40 | | | $ | 43.50 | | | $ | 42.90 | |
Class B | | | 837.61 | | | | 392.38 | | | | 1,370.85 | | | | 786.60 | |
Class C | | | — | | | | 374.50 | | | | 253.78 | | | | 750.75 | |
Class E-1 | | | 44.53 | | | | — | | | | 63.40 | | | | — | |
See notes to consolidated financial statements.
DELPHI AUTOMOTIVE LLP
CONSOLIDATED BALANCE SHEETS
| | | | March 31,
2011
(Unaudited) | | | December 31,
2010 | | | June 30,
2011
(Unaudited) | | | December 31,
2010 | |
| | | (in millions) | | | (in millions) | |
ASSETS | | | | | | | | |
Current assets: | | | | | | | | |
Cash and cash equivalents | | $ | 1,633 | | | $ | 3,219 | | | $ | 1,322 | | | $ | 3,219 | |
Restricted cash | | | 22 | | | | 47 | | | | 17 | | | | 47 | |
Time deposits | | | — | | | | 550 | | | | — | | | | 550 | |
Accounts receivable, net | | | 2,794 | | | | 2,307 | | | | 2,865 | | | | 2,307 | |
Inventories (Note 3) | | | 1,088 | | | | 988 | | | | 1,139 | | | | 988 | |
Other current assets (Note 4) | | | 596 | | | | 555 | | | | 614 | | | | 555 | |
| | | | | | | | | | | | |
Total current assets | | | 6,133 | | | | 7,666 | | | | 5,957 | | | | 7,666 | |
Long-term assets: | | | | | | | | |
Property, net | | | 2,162 | | | | 2,067 | | | | 2,231 | | | | 2,067 | |
Investments in affiliates | | | 267 | | | | 281 | | | | 283 | | | | 281 | |
Intangible assets, net | | | 655 | | | | 665 | | | | 653 | | | | 665 | |
Other long-term assets (Note 4) | | | 507 | | | | 403 | | | | 503 | | | | 403 | |
| | | | | | | | | | | | |
Total long-term assets | | | 3,591 | | | | 3,416 | | | | 3,670 | | | | 3,416 | |
| | | | | | | | | | | | |
Total assets | | $ | 9,724 | | | $ | 11,082 | | | $ | 9,627 | | | $ | 11,082 | |
| | | | | | | | | | | | |
LIABILITIES AND OWNERS’ EQUITY | | | | | | | | |
Current liabilities: | | | | | | | | |
Short-term debt (Note 8) | | $ | 272 | | | $ | 218 | | | $ | 180 | | | $ | 218 | |
Accounts payable | | | 2,429 | | | | 2,236 | | | | 2,560 | | | | 2,236 | |
Accrued liabilities (Note 5) | | | 1,312 | | | | 1,265 | | | | 1,285 | | | | 1,265 | |
| | | | | | | | | | | | |
Total current liabilities | | | 4,013 | | | | 3,719 | | | | 4,025 | | | | 3,719 | |
Long-term liabilities: | | | | | | | | |
Long-term debt (Note 8) | | | 2,479 | | | | 71 | | | | 2,056 | | | | 71 | |
Pension and other postretirement benefit obligations | | | 707 | | | | 677 | | | | 715 | | | | 677 | |
Other long-term liabilities (Note 5) | | | 618 | | | | 516 | | | | 589 | | | | 516 | |
| | | | | | | | | | | | |
Total long-term liabilities | | | 3,804 | | | | 1,264 | | | | 3,360 | | | | 1,264 | |
| | | | | | | | | | | | |
Total liabilities | | | 7,817 | | | | 4,983 | | | | 7,385 | | | | 4,983 | |
| | | | | | | | | | | | |
Commitments and contingencies (Note 10) | | | | | | | | |
Owners’ equity: | | | | | | | | |
Membership interests (Note 12) | | | 1,278 | | | | 5,550 | | | | 1,578 | | | | 5,550 | |
Accumulated other comprehensive income: | | | | | | | | |
Employee benefit plans | | | 61 | | | | 59 | | | | 61 | | | | 59 | |
Other | | | 96 | | | | 32 | | | | 132 | | | | 32 | |
| | | | | | | | | | | | |
Total accumulated other comprehensive income | | | 157 | | | | 91 | | | | 193 | | | | 91 | |
| | | | | | | | | | | | |
Total Delphi owners’ equity | | | 1,435 | | | | 5,641 | | | | 1,771 | | | | 5,641 | |
Noncontrolling interest | | | 472 | | | | 458 | | | | 471 | | | | 458 | |
| | | | | | | | | | | | |
Total owners’ equity | | | 1,907 | | | | 6,099 | | | | 2,242 | | | | 6,099 | |
| | | | | | | | | | | | |
Total liabilities and owners’ equity | | $ | 9,724 | | | $ | 11,082 | | | $ | 9,627 | | | $ | 11,082 | |
| | | | | | | | | | | | |
See notes to consolidated financial statements.
DELPHI AUTOMOTIVE LLP
CONSOLIDATED STATEMENTS OF CASH FLOWS
(Unaudited)
| | | | Three months ended
March 31, | | | Six months ended
June 30, | |
| | | 2011 | | 2010 | | | 2011 | | 2010 | |
| | | (in millions) | | | (in millions) | |
Cash flows from operating activities: | | | | | | | | |
Net income | | $ | 310 | | | $ | 235 | | | $ | 626 | | | $ | 468 | |
Adjustments to reconcile net income to net cash provided by operating activities: | | | | | | | | |
Depreciation | | | 99 | | | | 85 | | | | 196 | | | | 175 | |
Amortization | | | 18 | | | | 14 | | | | 37 | | | | 31 | |
Amortization of debt issuance costs | | | | 1 | | | | — | |
Restructuring expense, net of cash paid | | | (21 | ) | | | (49 | ) | | | (43 | ) | | | (105 | ) |
Deferred income taxes | | | 2 | | | | 3 | | | | (7 | ) | | | (7 | ) |
Pension and other postretirement benefit expenses | | | 19 | | | | 18 | | | | 38 | | | | 33 | |
Equity income, net of dividends received | | | (9 | ) | | | (2 | ) | | | (15 | ) | | | (8 | ) |
Gain on sale of investments / assets | | | (10 | ) | | | (7 | ) | |
Gain on sale of equity investment | | | | (8 | ) | | | — | |
Loss on extinguishment of debt | | | 9 | | | | — | | | | 17 | | | | — | |
Loss (gain) on sale of investments / assets | | | | 1 | | | | (13 | ) |
Changes in operating assets and liabilities: | | | | | | | | |
Accounts receivable, net | | | (487 | ) | | | (168 | ) | | | (555 | ) | | | (149 | ) |
Inventories | | | (100 | ) | | | (33 | ) | | | (149 | ) | | | (17 | ) |
Other current assets | | | (49 | ) | | | 63 | | | | (73 | ) | | | 120 | |
Accounts payable | | | 271 | | | | 115 | | | | 371 | | | | 165 | |
Accrued and other long-term liabilities | | | 156 | | | | 9 | | | | 103 | | | | (10 | ) |
Other, net | | | (35 | ) | | | (23 | ) | | | (8 | ) | | | (24 | ) |
Pension contributions and other postretirement benefit payments | | | (17 | ) | | | (14 | ) | | | (33 | ) | | | (33 | ) |
| | | | | | | | | | | | |
Net cash provided by operating activities | | | 156 | | | | 246 | | | | 499 | | | | 626 | |
| | | | | | | | | | | | |
Cash flows from investing activities: | | | | | | | | |
Capital expenditures | | | (181 | ) | | | (93 | ) | | | (292 | ) | | | (179 | ) |
Purchase of time deposits | | | — | | | | (100 | ) | | | — | | | | (200 | ) |
Maturity of time deposits | | | 550 | | | | — | | | | 550 | | | | — | |
Proceeds from sale of property | | | 12 | | | | 10 | | | | 14 | | | | 12 | |
Cost of acquisitions, net of cash acquired | | | | (17 | ) | | | — | |
Proceeds from divestitures, net | | | — | | | | 67 | | | | — | | | | 80 | |
Decrease in restricted cash | | | 25 | | | | 18 | | | | 30 | | | | 22 | |
Proceeds from sale of equity investment | | | 35 | | | | — | | | | 35 | | | | — | |
Acquisition of minority held shares | | | (5 | ) | | | — | | | | (5 | ) | | | — | |
Other, net | | | (3 | ) | | | — | | | | (4 | ) | | | 5 | |
| | | | | | | | | | | | |
Net cash provided by (used in) investing activities | | | 433 | | | | (98 | ) | | | 311 | | | | (260 | ) |
| | | | | | | | | | | | |
Cash flows from financing activities: | | | | | | | | |
Net borrowings under other short-term debt agreements | | | 14 | | | | 52 | | |
Proceeds from issuance of debt, net of issuance costs | | | 2,396 | | | | — | | |
Repayment of five-year notes | | | (57 | ) | | | — | | |
Net repayments under other short-term debt agreements | | | | (52 | ) | | | (37 | ) |
Proceeds from issuance of senior secured term loans, net of issuance costs | | | | 2,386 | | | | — | |
Repayment of senior secured term loans | | | | (1,440 | ) | | | — | |
Proceeds from issuance of senior notes, net of issuance costs | | | | 977 | | | | — | |
Repayment of senior unsecured five-year notes | | | | (57 | ) | | | — | |
Dividend payments of consolidated affiliates to minority shareholders | | | | (5 | ) | | | (10 | ) |
Redemption of membership interests | | | (4,557 | ) | | | — | | | | (4,566 | ) | | | — | |
| | | | | | | | | | | | |
Net cash (used in) provided by financing activities | | | (2,204 | ) | | | 52 | | | | (2,757 | ) | | | (47 | ) |
| | | | | | | | | | | | |
Effect of exchange rate fluctuations on cash and cash equivalents | | | 29 | | | | (11 | ) | | | 50 | | | | (43 | ) |
| | | | | | | | | | | | |
(Decrease) increase in cash and cash equivalents | | | (1,586 | ) | | | 189 | | | | (1,897 | ) | | | 276 | |
Cash and cash equivalents at beginning of period | | | 3,219 | | | | 3,107 | | | | 3,219 | | | | 3,107 | |
| | | | | | | | | | | | |
Cash and cash equivalents at end of period | | $ | 1,633 | | | $ | 3,296 | | | $ | 1,322 | | | $ | 3,383 | |
| | | | | | | | | | | | |
See notes to consolidated financial statements.
DELPHI AUTOMOTIVE LLP
CONSOLIDATED STATEMENTS OF COMPREHENSIVE INCOME
(Unaudited)
| | | | Three months ended
March 31, | | | Three months ended
June 30, | | Six months Ended
June 30, | |
| | | 2011 | | 2010 | | | 2011 | | 2010 | | 2011 | | 2010 | |
| | | (in millions) | | | (in millions) | |
Net income | | $ | 310 | | | $ | 235 | | | $ | 316 | | | $ | 233 | | | $ | 626 | | | $ | 468 | |
Other comprehensive income: | | | | | | | | | | | | |
Currency translation adjustments, net of tax of $0 million and $2 million, respectively | | | 67 | | | | (49 | ) | |
Net change in unrecognized (loss) income on derivative instruments, net of tax of $2 million and $0 million, respectively | | | (1 | ) | | | 40 | | |
Employee benefit plans adjustment, net of tax of $1 million and $(4) million, respectively | | | 2 | | | | 15 | | |
Currency translation adjustments | | | | 50 | | | | (65 | ) | | | 117 | | | | (114 | ) |
Net change in unrecognized gain on derivative instruments, net of tax of $6 million, $1 million, $9 million and $1 million, respectively | | | | (12 | ) | | | (47 | ) | | | (13 | ) | | | (7 | ) |
Employee benefit plans adjustment, net of tax of $0 million, $1 million, $(1) million and $(3) million, respectively | | | | — | | | | (2 | ) | | | 2 | | | | 13 | |
| | | | | | | | | | | | | | | | | | |
Other comprehensive income | | | 68 | | | | 6 | | |
Other comprehensive income (loss) | | | | 38 | | | | (114 | ) | | | 106 | | | | (108 | ) |
| | | | | | | | | | | | | | | | | | |
Comprehensive income | | | 378 | | | | 241 | | | | 354 | | | | 119 | | | | 732 | | | | 360 | |
Comprehensive income attributable to noncontrolling interest | | | 21 | | | | 21 | | | | 20 | | | | 19 | | | | 41 | | | | 39 | |
| | | | | | | | | | | | | | | | | | |
Comprehensive income attributable to Delphi | | $ | 357 | | | $ | 220 | | | $ | 334 | | | $ | 100 | | | $ | 691 | | | $ | 321 | |
| | | | | | | | | | | | | | | | | | |
See notes to consolidated financial statements.
DELPHI AUTOMOTIVE LLP
CONSOLIDATED STATEMENT OF OWNERS’ EQUITY
(Unaudited)
| | | | Membership interests | | | | | | | | | | | Membership interests | | | | | | | | | |
| | | | | Accumulated
other
comprehensive
income (loss) | | | Total Delphi
owners’
equity | | | Noncontrolling
interest | | | Total
owners’
equity | | | | | Accumulated
other
comprehensive
income (loss) | | | Total Delphi
owners’
equity | | | Noncontrolling
interest | | | Total
owners’
equity | |
| | | Class A | | Class B | | Class C | | Class E-1 | | Total | | | Class A | | Class B | | Class C | | Class E-1 | | Total | |
| | | (in millions) | | | | | | | | | | | (in millions) | | | | | | | | | |
Balance at December 31, 2010 | | $ | 2,083 | | | $ | 2,816 | | | $ | 646 | | | $ | 5 | | | $ | 5,550 | | | $ | 91 | (a) | | $ | 5,641 | | | $ | 458 | | | $ | 6,099 | | | $ | 2,083 | | | $ | 2,816 | | | $ | 646 | | | $ | 5 | | | $ | 5,550 | | | $ | 91 | (a) | | $ | 5,641 | | | $ | 458 | | | $ | 6,099 | |
Net income | | | 76 | | | | 189 | | | | 25 | | | | 1 | | | | 291 | | | | — | | | | 291 | | | | 19 | | | | 310 | | | | 76 | | | | 486 | | | | 25 | | | | 2 | | | | 589 | | | | — | | | | 589 | | | | 37 | | | | 626 | |
Currency translation adjustments and other, net of tax | | | — | | | | — | | | | — | | | | — | | | | — | | | | 65 | (b) | | | 65 | | | | 2 | | | | 67 | | |
Net change in unrecognized income on derivative instruments, net of tax | | | — | | | | — | | | | — | | | | — | | | | — | | | | (1 | )(c) | | | (1 | ) | | | — | | | | (1 | ) | |
Currency translation adjustments and other | | | | — | | | | — | | | | — | | | | — | | | | — | | | | 113 | (b) | | | 113 | | | | 4 | | | | 117 | |
Net change in unrecognized gain on derivative instruments, net of tax | | | | — | | | | — | | | | — | | | | — | | | | — | | | | (13 | )(c) | | | (13 | ) | | | — | | | | (13 | ) |
Employee benefit plans liability adjustment, net of tax | | | — | | | | — | | | | — | | | | — | | | | — | | | | 2 | (d) | | | 2 | | | | — | | | | 2 | | | | — | | | | — | | | | — | | | | — | | | | — | | | | 2 | (d) | | | 2 | | | | — | | | | 2 | |
Dividends | | | | — | | | | — | | | | — | | | | — | | | | — | | | | — | | | | — | | | | (21 | ) | | | (21 | ) |
Restricted interests recognized (Note 16) | | | — | | | | — | | | | — | | | | 2 | | | | 2 | | | | — | | | | 2 | | | | — | | | | 2 | | | | — | | | | — | | | | — | | | | 4 | | | | 4 | | | | — | | | | 4 | | | | — | | | | 4 | |
Acquisition of noncontrolling interest | | | 1 | | | | 1 | | | | — | | | | — | | | | 2 | | | | — | | | | 2 | | | | (7 | ) | | | (5 | ) | |
Acquisition of noncontrolling interests | | | | 1 | | | | 1 | | | | — | | | | — | | | | 2 | | | | — | | | | 2 | | | | (7 | ) | | | (5 | ) |
Redemption of membership interests | | | (2,160 | ) | | | (1,731 | ) | | | (671 | ) | | | (5 | ) | | | (4,567 | ) | | | — | | | | (4,567 | ) | | | — | | | | (4,567 | ) | | | (2,160 | ) | | | (1,731 | ) | | | (671 | ) | | | (5 | ) | | | (4,567 | ) | | | — | | | | (4,567 | ) | | | — | | | | (4,567 | ) |
| | | | | | | | | | | | | | | | | | | | | | | | | | | | | | | | | | | | | | | | | | | | | | | | | | | | | | |
Balance at March 31, 2011 | | $ | — | | | $ | 1,275 | | | $ | — | | | $ | 3 | | | $ | 1,278 | | | $ | 157 | (e) | | $ | 1,435 | | | $ | 472 | | | $ | 1,907 | | |
Balance at June 30, 2011 | | | $ | — | | | $ | 1,572 | | | $ | — | | | $ | 6 | | | $ | 1,578 | | | $ | 193 | (e) | | $ | 1,771 | | | $ | 471 | | | $ | 2,242 | |
| | | | | | | | | | | | | | | | | | | | | | | | | | | | | | | | | | | | | | | �� | | | | | | | | | | | | | | | |
| (a) | As of December 31, 2010, Accumulated Other Comprehensive Income totaled $91 million (net of a $48 million tax effect) and included: a loss of $21 million (net of a $0 million tax effect) of currency translation adjustments and other, income of $53 million (net of a $31 million tax effect) of unrecognized income on derivative instruments and income of $59 million (net of a $17 million tax effect) of employee benefit plans liability adjustments. |
a loss from currency translation adjustments and other of $21 million;
income from unrecognized gain on derivative instruments of $53 million (net of a $31 million tax effect); and
income from employee benefit plans liability adjustments of $59 million (net of a $17 million tax effect).
| (b) | Accumulated Other Comprehensive Income includes income of $65$113 million (net of a $0 million tax effect) of currency translation adjustments and other for the threesix months ended March 31,June 30, 2011. |
| (c) | Accumulated Other Comprehensive Income includes a loss of $1$13 million (net of a $2$9 million tax effect) of net changes in unrecognized incomegains on derivative instruments for the threesix months ended March 31,June 30, 2011. |
| (d) | Accumulated Other Comprehensive Income includes income of $2 million (net of a $1 million tax effect) of employee benefit plans liability adjustments for the threesix months ended March 31,June 30, 2011. |
| (e) | As of March 31,June 30, 2011, Accumulated Other Comprehensive Income totaled $157$193 million (net of a $47$40 million tax effect) and includes: income of $44 million (net of a $0 million tax effect) of currency translation adjustments and other, income of $52 million (net of a $29 million tax effect) of unrecognized income on derivative instruments and income of $61 million (net of a $18 million tax effect) of employee benefit plans liability adjustments. |
currency translation adjustments and other of $92 million;
unrecognized gain on derivative instruments of $40 million (net of a $22 million tax effect); and
employee benefit plans liability adjustments of $61 million (net of a $18 million tax effect).
See notes to consolidated financial statements.
DELPHI AUTOMOTIVE LLP
NOTES TO CONSOLIDATED FINANCIAL STATEMENTS
(Unaudited)
| 1. | DESCRIPTION OF BUSINESS |
Nature of operations—Delphi Automotive LLP, together with its subsidiaries and affiliates (“Delphi” or the “Company”) is a supplier of vehicle electronics, transportation components, integrated systems and modules, and other electronic technology. Delphi operates globally and has a diverse customer base, including every major vehicle manufacturer. The consolidated financial statements and notes thereto included in this report should be read in conjunction with Delphi’s consolidated financial statements and notes thereto included in Delphi’s 2010 Consolidated Financial Statements.
General and basis of presentation—Delphi is a limited liability partnership incorporated under the laws of England and Wales on August 19, 2009, for the purpose of acquiring certain assets of the former Delphi Corporation (now known as DPH Holdings Corp. (“DPHH”) (“Old Delphi”)).
Acquisition and acquisition accounting—On October 6, 2009 (the “Acquisition Date”), Delphi acquired the businesses (other than the global steering business and the manufacturing facilities in the United States (“U.S.”) in which the hourly employees are represented by the International Union, United Automobile, Aerospace and Agricultural Implement Workers of America) of Old Delphi (the “Acquisition”).
Redemption of membership interests—On March 31, 2011, Delphi redeemed all outstanding Class A and Class C membership interests held by General Motors Company (“GM”) and the Pension Benefit Guaranty Corporation (“PBGC”), respectively, for approximately $4.4 billion. In conjunction with this transaction, Delphi obtained necessary consents to the redemption of the Class A and Class C membership interests and modified and eliminated specific rights provided to certain interest holders under the Second Amended and Restated Limited Liability Partnership Agreement of Delphi Automotive LLP (the “LLP Agreement”). In addition, on April 26, 2011, the LLP Agreement was amended and restated by the Third Amended and Restated Limited Liability Partnership Agreement of Delphi Automotive LLP (the “Revised LLP Agreement”) to adjust the distribution rights among the holders of the remaining classes of membership interests to reflect the redemption of GM’s and the PBGC’s interests and to modify and eliminate specific rights as mentioned above. As a result of these transactions, the owners’ equity of Delphi is comprised of a single voting class of membership interests, the Company’s Class B membership interests. In addition to this class of voting membership interests, non-voting Class E-1 membership interests are held by Delphi’s Board of Managers. The redemption transaction was funded by a $3.0 billion credit facility entered into on March 31, 2011 (including a $500 million revolver which was undrawn at March 31, 2011) and existing cash. In conjunction with the credit facility, Delphi extinguished the existing senior unsecured five-year notes and the undrawn delayed draw term loan. In May 2011, the credit facility was amended to adjust the commitments and terms, and in July 2011, the Revised LLP Agreement was also amended to further position the Company for an initial public offering. Refer to Note 8. Debt, and Note 12. Membership Interests and Note 18. Subsequent Events for additional disclosures.
| 2. | SIGNIFICANT ACCOUNTING POLICIES |
Consolidation—The consolidated financial statements include the accounts of Delphi and domestic and non-U.S. subsidiaries in which Delphi holds a controlling financial or management interest and variable interest entities of which Delphi has determined that it is the primary beneficiary. Delphi’s share of the earnings or losses of non-controlled affiliates, over which Delphi exercises significant influence (generally a 20% to 50% ownership interest), is included in the consolidated operating results using the equity method of accounting. All significant intercompany transactions and balances between consolidated Delphi businesses have been eliminated. All adjustments, consisting of only normal recurring items, which are necessary for a fair presentation, have been included. The results for interim periods are not necessarily indicative of results that may be expected from any other interim period or for the full year and may not necessarily reflect the consolidated results of operations, financial position and cash flows of Delphi in the future.
Use of estimates—Preparation of consolidated financial statements in conformity with generally accepted accounting principles in the United States of America (“U.S. GAAP”) requires the use of estimates and assumptions that affect amounts reported therein. Generally, matters subject to estimation and judgment include amounts related to accounts receivable realization, inventory obsolescence, asset impairments, useful lives of intangible and fixed assets, deferred tax asset valuation allowances, income taxes, pension and other postretirement benefit plan assumptions, accruals related to litigation, warranty costs, environmental remediation costs, worker’s compensation accruals, share-based compensation accruals and healthcare accruals. Due to the inherent uncertainty involved in making estimates, actual results reported in future periods may be based upon amounts that differ from those estimates.
Subsequent events—Delphi has evaluated all events that have occurred subsequent to March 31,June 30, 2011 through May 2,July 27, 2011 (the date the financial statements were available to be issued).
Cash and cash equivalents—Cash and cash equivalents are defined as short-term, highly liquid investments with original maturities of three months or less.
Time deposits—During 2010, Delphi entered into various time deposit agreements whereby certain of Delphi’s funds on deposit with financial institutions could not be withdrawn for a specified period of time. Time deposits with original maturity periods of three months or less were included as Cash and cash equivalents in the consolidated balance sheet as of December 31, 2010, while time deposits with original maturity periods greater than three months were separately stated in the consolidated balance sheet as of December 31, 2010. The carrying value of time deposits approximated fair value as of December 31, 2010. Delphi did not have any time deposits as of March 31,June 30, 2011.
Marketable securities—Marketable securities with original maturities of three months or less are classified as cash and cash equivalents for financial statement purposes. Debt securities with original maturities greater than three months are classified as held-to-maturity, and accordingly are recorded at cost in the consolidated financial statements. Equity securities with maturities greater than three months are classified as available-for-sale and are recorded in the consolidated financial statements at market value with changes in market value included in other comprehensive income (“OCI”). Available-for-sale securities with a cost basis of $13$7 million and $13 million and a carrying value of $10$4 million and $12 million were held as of March 31,June 30, 2011 and December 31, 2010, respectively. In the event debt or equity securities experience an other-than-temporary impairment in value, such impairment is recognized as a loss in the consolidated statement of operations. In the three and six months ended June 30, 2011, Delphi recognized an other-than-temporary impairment on available-for-sale equity securities of $6 million and a loss on sale of equity securities of $2 million.
Intangible assets—Intangible assets were $655$653 million and $665 million as of March 31,June 30, 2011 and December 31, 2010, respectively. In general, definite-lived intangible assets are being amortized over their useful lives, normally 6-20 years. Amortization expense was $18$19 million and $14$37 million for the three and six months ended March 31,June 30, 2011 and $17 million and $31 million for the three and six months ended June 30, 2010, respectively.
Debt issuance costs—The costs incurred related to the issuance of long-term debt are deferred and amortized into interest expense over the life of the debt using the effective interest method. Deferred amounts associated with debt extinguished prior to maturity are expensed.
Customer concentrations—Sales to GM were approximately 20% of our total net sales for both the three and six months ended March 31,June 30, 2011 and 2010. Accounts and other receivables due from GM were $521$508 million and $393 million as of March 31,June 30, 2011 and December 31, 2010, respectively. No other single customer accountedaccounts for more than 10%a significant portion of our consolidated net sales in any period presented.
Reclassifications—Certain prior period amounts have been reclassified in the consolidated statements of operations within operating expenses for the three and six months ended March 31,June 30, 2010 to conform to the current
year presentation. The Company has reclassified amounts from cost of sales and selling, general and administrative expenses to restructuring and has also included depreciation expense in cost of sales and selling, general and administrative expenses, as applicable.
Membership interests—At the Acquisition Date, the outstanding common stock of the PredecessorOld Delphi was cancelled and membership interests in Delphi were issued to Delphi’s owners. As ofOn March 31, 2011, Delphi redeemed all outstanding Class A and
Class C membership interests. As of June 30, 2011 and December 31, 2010, Delphi’s investors held membership interests of $1.3$1.6 billion and $5.6 billion, respectively. Total membership interests and current period net income (loss) are allocated among the respective outstanding classes based on the cumulative distribution provisions of the Revised LLP Agreement. Refer to Note 12. Membership Interests for additional information.
Recently issued accounting pronouncements—In June 2009, the Financial Accounting Standards Board (“FASB”) issued guidance related to accounting for transfers of financial assets which changes the way entities account for securitizations and special-purpose entities, codified in FASB Accounting Standard Codification (“ASC”) 810,Consolidation, and FASB ASC 860,Transfers and Servicing. The adoption of this guidance on January 1, 2010 did not have a significant impact on Delphi’s financial statements.
In October 2009, the FASB issued Accounting Standards Update (“ASU”) 2009-13,Revenue Recognition—Multiple-Deliverable Revenue Arrangements – a consensus of the FASB Emerging Issues Task Force, which amends FASB ASC 605,Revenue Recognition, by modifying the criteria used to separate elements in a multiple-element arrangement, introducing the concept of “best estimate of selling price” for determining the selling price of a deliverable, establishing a hierarchy of evidence for determining the selling price of a deliverable, requiring use of the relative selling price method and prohibiting use of the residual method to allocate arrangement consideration among units of accounting, and expanding the disclosure requirements for all multiple-element arrangements within the scope of FASB ASC 605-25. The amended guidance is effective prospectively for revenue arrangements entered into or materially modified in fiscal years beginning on or after June 15, 2010. The adoption of this guidance did not have a significant impact on Delphi’s financial statements.
In April 2010, the FASB ratified Emerging Issues Task Force Issue No. 08-9,Milestone Method of Revenue Recognition (“Issue 08-9”). ASU 2010-17,Revenue Recognition—Milestone Method, which resulted from the ratification of Issue 08-9 and amends FASB ASC 605. ASU 2010-17 allows, but does not require, an entity to make an accounting policy election to recognize a payment that is contingent upon the achievement of a substantive milestone in its entirety in the period in which the milestone is achieved. The guidance in ASU 2010-17 is effective for fiscal years, and interim periods within those years, beginning on or after June 15, 2010, and may be applied prospectively to milestones achieved after the adoption date or retrospectively for all periods presented. The adoption of this guidance did not have a significant impact on Delphi’s financial statements.
In August 2010, the FASB issued ASU 2010-20,Receivables—Disclosures about the Credit Quality of Financing Receivables and the Allowance for Credit Losses. This guidance amends required disclosures about an entity’s allowance for credit losses and the credit quality of its financing receivables. The update will require entities to provide a greater level of disaggregated information about the credit quality of its financing receivables and its allowance for credit losses. The guidance is effective for public companies for interim and annual reporting periods ending on or after December 15, 2010 and for non-public companies, for annual reporting periods ending on or after December 15, 2011. In January 2011, the FASB issued ASU 2011-01Receivables—Deferral of the Effective Date of Disclosures about troubled debt restructurings in ASU 2010-20. This guidance temporarily delaysdelayed the effective date of the disclosures about troubled debt restructurings for public entities. An effective date has yet to be determined. Delphi does not expect theThe adoption of ASU 2010-20 and 2011-01 did not have a significant impact on Delphi’s financial statements.
In April 2011, the FASB issued ASU 2011-02,A Creditor’s Determination of Whether a Restructuring is a Troubled Debt Restructuring. This guidance clarifies the definition of what constitutes a concession given by a
creditor and clarifies guidance on whether a debtor is experiencing financial difficulties both for purposes of recording an impairment loss and for disclosure of troubled debt restructuring. The guidance in ASU 2011-02 is effective for public companies with interim and annual periods beginning after June 15, 2011 and for nonpublic companies with fiscal years, and interim periods within those years, ending on or 2011-01after December 15, 2012. The adoption of this guidance is not expected to have a significant impact on Delphi’s financial statements.
In May 2011, the FASB issued ASU 2011-04,Amendments to Achieve Common Fair Value Measurement and Disclosure Requirements in US GAAP and IFRSs, which updates the definition of fair value and measurement criteria to bring them into agreement with IFRSs (which are also changed to agree with US GAAP). The guidance is effective for interim and annual periods beginning after December 15, 2011. Early adoption is not permitted. Delphi is evaluating the effects of this guidance but does not expect it to have a significant impact on Delphi’s financial statements.
In June 2011, the FASB issued ASU 2011-05,Presentation of Comprehensive Income. This guidance requires presentation of all non-owner changes in equity to be presented in one continuous statement of comprehensive income or in two separate but consecutive statements. It also prohibits the inclusion of comprehensive income items in the statement of equity. Also, the amendments in this update do not change the items that must be reported in other comprehensive income or when an item of other comprehensive income must be reclassified to net income. The guidance is effective for public companies for fiscal years, and interim periods within those years, beginning after December 15, 2011 and for nonpublic companies for fiscal years, and interim periods within those years, ending after December 15, 2012. Early adoption is permitted. Delphi is evaluating the effects of this guidance but does not expect it to have a significant impact on its financial statements other than providing the new disclosures as required.presentation.
Inventories are stated at the lower of cost, determined on a first-in, first-out basis, or market, including direct material costs and direct and indirect manufacturing costs. A summary of inventories is shown below:
| | | | March 31,
2011 | | | December 31,
2010 | | | June 30,
2011 | | | December 31,
2010 | |
| | | (in millions) | | | (in millions) | |
Productive material | | $ | 629 | | | $ | 544 | | | $ | 654 | | | $ | 544 | |
Work-in-process | | | 156 | | | | 159 | | | | 160 | | | | 159 | |
Finished goods | | | 303 | | | | 285 | | | | 325 | | | | 285 | |
| | | | | | | | | | | | |
Total | | $ | 1,088 | | | $ | 988 | | | | 1,139 | | | $ | 988 | |
| | | | | | | | | | | | |
Other current assets consisted of the following:
| | | | March 31,
2011 | | | December 31,
2010 | | | June 30,
2011 | | | December 31,
2010 | |
| | | (in millions) | | | (in millions) | |
Income and other taxes receivable | | $ | 256 | | | $ | 208 | | | $ | 289 | | | $ | 208 | |
Prepaid insurance and other expenses | | | 56 | | | | 87 | | | | 65 | | | | 87 | |
Deferred income taxes | | | 136 | | | | 136 | | | | 143 | | | | 136 | |
Deposits to vendors | | | 12 | | | | 12 | | | | 14 | | | | 12 | |
Notes receivable | | | 41 | | | | 33 | | | | 26 | | | | 33 | |
Debt issuance costs (Note 8) | | | 16 | | | | — | | | | 10 | | | | — | |
Derivative financial instruments (Note 13) | | | 59 | | | | 59 | | | | 51 | | | | 59 | |
Other | | | 20 | | | | 20 | | | | 16 | | | | 20 | |
| | | | | | | | | | | | |
Total | | $ | 596 | | | $ | 555 | | | $ | 614 | | | $ | 555 | |
| | | | | | | | | | | | |
Other long-term assets consisted of the following:
| | | | March 31,
2011 | | | December 31,
2010 | | | June 30,
2011 | | | December 31,
2010 | |
| | | (in millions) | | | (in millions) | |
Deferred income taxes | | $ | $192 | | | $ | $183 | | | $ | 185 | | | $ | $183 | |
Notes receivable | | | 31 | | | | 31 | | | | 24 | | | | 31 | |
Debt issuance costs (Note 8) | | | 76 | | | | — | | | | 88 | | | | — | |
Income and other taxes receivable | | | 92 | | | | 87 | | | | 101 | | | | 87 | |
Other investments | | | 9 | | | | 13 | | | | 4 | | | | 13 | |
Derivative financial instruments (Note 13) | | | 15 | | | | 17 | | | | 6 | | | | 17 | |
Other | | | 92 | | | | 72 | | | | 95 | | | | 72 | |
| | | | | | | | | | | | |
Total | | $ | $507 | | | $ | $403 | | | $ | 503 | | | $ | $403 | |
| | | | | | | | | | | | |
Accrued liabilities consisted of the following:
| | | | March 31,
2011 | | | December 31,
2010 | | | June 30,
2011 | | | December 31,
2010 | |
| | | (in millions) | | | (in millions) | |
Payroll-related obligations | | $ | 235 | | | $ | 203 | | | $ | 270 | | | $ | 203 | |
Employee benefits, including current pension obligations | | | 67 | | | | 167 | | | | 87 | | | | 167 | |
Income and other taxes payable | | | 326 | | | | 220 | | | | 299 | | | | 220 | |
Warranty obligations (Note 6) | | | 240 | | | | 243 | | | | 197 | | | | 243 | |
Restructuring (Note 7) | | | 100 | | | | 115 | | | | 81 | | | | 115 | |
Customer deposits | | | 24 | | | | 22 | | | | 23 | | | | 22 | |
Deferred income taxes | | | 5 | | | | 4 | | | | 5 | | | | 4 | |
Derivative financial instruments (Note 13) | | | | 10 | | | | — | |
Other | | | 315 | | | | 291 | | | | 313 | | | | 291 | |
| | | | | | | | | | | | |
Total | | $ | 1,312 | | | $ | 1,265 | | | $ | 1,285 | | | $ | 1,265 | |
| | | | | | | | | | | | |
Other long-term liabilities consisted of the following:
| | | | March 31,
2011 | | | December 31,
2010 | | | June 30,
2011 | | | December 31,
2010 | |
| | | (in millions) | | | (in millions) | |
Environmental (Note 10) | | $ | 20 | | | $ | 18 | | | $ | 19 | | | $ | 18 | |
Extended disability benefits | | | 9 | | | | 8 | | | | 9 | | | | 8 | |
Warranty obligations (Note 6) | | | 208 | | | | 119 | | | | 141 | | | | 119 | |
Executive long-term incentive plan | | | | 79 | | | | 31 | |
Restructuring (Note 7) | | | 56 | | | | 54 | | | | 54 | | | | 54 | |
Payroll-related obligations | | | 11 | | | | 11 | | | | 11 | | | | 11 | |
Accrued income taxes | | | 51 | | | | 52 | | | | 46 | | | | 52 | |
Deferred income taxes | | | 169 | | | | 178 | | | | 179 | | | | 178 | |
Other | | | 94 | | | | 76 | | | | 51 | | | | 45 | |
| | | | | | | | | | | | |
Total | | $ | 618 | | | $ | 516 | | | $ | 589 | | | $ | 516 | |
| | | | | | | | | | | | |
Expected warranty costs for products sold are recognized principally at the time of sale of the product based on estimates of the amount that will eventually be required to settle such obligations. These accruals are based on factors such as past experience, production changes, industry developments and various other considerations. These estimates are adjusted from time to time based on facts and circumstances that impact the status of existing claims. Delphi has recognized its best estimate for its total aggregate warranty reserves across all of its operating segments as of March 31,June 30, 2011. The estimated reasonably possible amounts to ultimately resolve all matters is not materially different from the recorded reserves.
The table below summarizes the activity in the product warranty liability for the threesix months ended March 31,June 30, 2011:
| | | | Warranty
obligations | | | Warranty
obligations | |
| | | (in millions) | | | (in millions) | |
Accrual balance at beginning of period | | $ | 362 | | | $ | 362 | |
Provision for estimated warranties incurred during the period | | | 19 | | | | 46 | |
Provision for changes in estimate for pre-existing warranties | | | 74 | | | | 76 | |
Settlements made during the period (in cash or in kind) | | | (23 | ) | | | (172 | ) |
Foreign currency translation and other | | | 16 | | | | 26 | |
| | | | | | |
Accrual balance at end of period | | $ | 448 | | | $ | 338 | |
| | | | | | |
In 2009, Delphi received information regarding potential warranty claims related to certain components supplied by Delphi’s Powertrain segment. In March 2011, Delphi reached a settlement with its customer related to this matter. During the three months ended March 31, 2011, Delphimatter and reflected a change in its previous estimate of probable loss as a result of the settlement agreement by recognizing $76 million of warranty expense in cost of sales. This adjustment resulted in a corresponding $76 million decrease in net income attributable to Delphi, and theDelphi. The per unit impact for the Class A, and C membership interests for the three months ended March 31, 2011 were $11.36 and $66.28, respectively. The per unit impact for the Class B C and E-1 membership interests for the six months ended June 30, 2011 were $11.36, $138.89 $66.28 and $10.56, respectively. In April 2011, Delphi made a payment of €90 million (approximately $127$133 million at March 31,April 30, 2011 exchange rates) related to this matter.
Refer to Note 10. Commitments and Contingencies, Ordinary Business Litigation for additional disclosure regarding warranty matters.
Delphi continually evaluates alternatives to align its business with the changing needs of its customers and to lower the operating costs of the Company. This includes the realignment of its existing manufacturing capacity, facility closures, or similar actions in the normal course of business. These actions may result in voluntary or involuntary employee termination benefits, which are mainly pursuant to union or other contractual agreements. Voluntary termination benefits are accrued when an employee accepts the related offer. Involuntary termination benefits are accrued when Delphi commits to a termination plan and the benefit arrangement is communicated to affected employees, or when liabilities are determined to be probable and estimable, depending on the existence of a substantive plan for severance or termination. Contract termination costs are recorded when contracts are terminated or when Delphi ceases to use the leased facility and no longer derives economic benefit from the contract. All other exit costs are accrued when incurred.
Delphi’s restructuring costs are undertaken as necessary to executeimplement management’s strategy, streamline operations, take advantage of available capacity and resources, and ultimately achieve net cost reductions. These
activities generally fallrelate to the realignment of existing manufacturing capacity and closure of facilities and other exit or disposal activities, as it relates to executing the Company’s strategy in onethe normal course of two categories:business and transforming the salaried workforce to reduce general and administrative expenses.
| (1) | Realignment of existing manufacturing capacity and closure of facilities and other exit or disposal activities, as it relates to executing the Company’s strategy in the normal course of business. |
| (2) | Transformation plan activities, including selling or winding down non-core product lines and transforming the salaried workforce to reduce general and administrative expenses. |
The following table summarizes the restructuring charges recorded for the three and six months ended March 31,June 30, 2011 and 2010 by operating segment:
| | | | Three months ended
March 31, | | | Three months
ended
June 30, | | | Six months
ended
June 30. | |
Segment | | 2011 | | | 2010 | | | 2011 | | | 2010 | | | 2011 | | | 2010 | |
| | | (in millions) | | |
Electronics and Safety | | $ | 2 | | | $ | 2 | | | $ | — | | | $ | 11 | | | $ | 2 | | | $ | 13 | |
Powertrain Systems | | | 4 | | | | 12 | | | | 2 | | | | 1 | | | | 6 | | | | 13 | |
Electrical/Electronic Architecture | | | 2 | | | | 11 | | | | 6 | | | | 14 | | | | 8 | | | | 25 | |
Thermal Systems | | | 1 | | | | 1 | | | | — | | | | 4 | | | | 1 | | | | 5 | |
Eliminations and Other | | | — | | | | — | | | | — | | | | — | | | | — | | | | — | |
| | | | | | | | | | | | | | | | | | |
Total | | $ | 9 | | | $ | 26 | | | $ | 8 | | | $ | 30 | | | $ | 17 | | | $ | 56 | |
| | | | | | | | | | | | | | | | | | |
The table below summarizes the activity in the restructuring liability for the threesix months ended March 31,June 30, 2011:
| | | | Employee
termination
benefits
liability | | Other exit
costs liability | | Total | | | Employee
termination
benefits
liability | | Other exit
costs liability | | Total | |
| | | (in millions) | | | (in millions) | |
Accrual balance at December 31, 2010 | | $ | 148 | | | $ | 21 | | | $ | 169 | | | $ | 148 | | | $ | 21 | | | $ | 169 | |
Provision for estimated expenses incurred during the period | | | 8 | | | | 1 | | | | 9 | | | | 15 | | | | 2 | | | | 17 | |
Payments made during the period | | | (28 | ) | | | (2 | ) | | | (30 | ) | | | (48 | ) | | | (12 | ) | | | (60 | ) |
Foreign currency and other | | | 7 | | | | 1 | | | | 8 | | | | 7 | | | | 1 | | | | 9 | |
| | | | | | | | | | | | | | | | | | |
Accrual balance at March 31, 2011 | | $ | 135 | | | $ | 21 | | | $ | 156 | | |
Accrual balance at June 30, 2011 | | | $ | 122 | | | $ | 13 | | | $ | 135 | |
| | | | | | | | | | | | | | | | | | |
The following are details
As part of significant chargesDelphi’s ongoing efforts to lower costs and operate efficiently, the Company recorded $8 million and $17 million of restructuring costs primarily in Asia, Europe and Mexico, primarily related to plant closures and programs related to the rationalization of manufacturing and engineering processes during the three and six months ended March 31, 2011.June 30, 2011, respectively.
| • | | Realignment of existing manufacturing capacityAs part of Delphi’s ongoing efforts to lower costs and operate efficiently, the four reporting segments continued the execution of efforts to reduce employment in North America, and incurred approximately $5 million and closure of facilities. As part of Delphi’s ongoing efforts to lower costs and operate efficiently, the Company recorded $9 million of restructuring costs in Asia and Europe, primarily related to plant closures and programs related to the rationalization of manufacturing and engineering processes.
|
The following are details of significant charges during the three and six months ended March 31,June 30, 2010, respectively. Additionally, European, South American and Asian operations in the four reporting segments incurred $29 million and $45 million of restructuring costs in conjunction with employment reductions and programs related to the rationalization of manufacturing and engineering processes during the three and six months ended June 30, 2010. The Electronics and Safety segment also incurred less than $1 million and $1 million of costs related to the ongoing sales and wind-down of its occupant protection systems businesses during the three and six months ended June 30, 2010.
| • | | Realignment of existing manufacturing capacity and closure of facilities. As part of Delphi’s ongoing efforts to lower costs and operate efficiently, the four reporting segments continued the execution of efforts to reduce headcount in North America, and incurred approximately $4 million of restructuring costs during the first quarter of 2010. Additionally, European, South American and Asian operations in the Powertrain and Electrical/Electronic Architecture segments incurred $16 million of restructuring costs in conjunction with headcount reductions and programs related to the rationalization of manufacturing and engineering processes. The Electronics and Safety segment also incurred $1 million of costs related to the ongoing sales and wind-down of its occupant protection systems businesses.
|
In addition, as part of an effort to transform its salaried workforce and reduce general and administrative expenses, Delphi identified certain salaried employees in North America during the three and six months ended June 30, 2010 for involuntary separation and incurred less than $1 million and $2 million in related employee termination benefits, respectively.
| • | | Transformation plan activities. As part of an effort to transform its salaried workforce and reduce general and administrative expenses, Delphi identified certain salaried employees in North America during the first quarter of 2010 for involuntary separation and incurred $2 million in related employee termination benefits.
|
Credit agreementAgreement—
In March 2011, in conjunction with the redemption of membership interests from Class A and Class C holders, Delphi entered into athe original credit agreement (the “Credit Agreement”) with JPMorgan Chase Bank, N.A., as lead arranger and administrative agent, with respect to $3.0 billion in senior secured credit facilities (the “Credit Facilities”). The Credit Facilities consistoriginal credit agreement was amended and modified on May 17, 2011 (the “Credit Agreement”) and consists of a $500 million$1.2 billion 5-year senior secured revolving credit facility (the “Revolving Credit Facility”), a $250$258 million senior secured 5-year term A loan (the “Tranche A Term Loan”) and a $2.25 billion$950 million senior secured 6-year term B loan (the “Tranche B Term Loan”). As a result of the amendment, $1.3 billion of the Tranche B Term Loan was repaid, net of $6 million of related discount. During June 2011, $36.5 million and $137.5 million of the Tranche A Term Loan and Tranche B Term Loan, respectively, were repaid under the Credit Agreement. In conjunction with the June 2011 repayments, approximately $8 million of debt issuance costs were extinguished. The Revolving Credit Facility remainedwas undrawn at March 31,June 30, 2011. The terms of the Credit Agreement provide for certain modifications to the pricing, terms and structure of the Credit Facilities to allow for the syndication of portions of the Credit Facilities to additional lenders.
The Revolving Facility includes a $100 million sublimit for the issuance of letters of credit. As of March 31,June 30, 2011, the CompanyDelphi had approximately $20$19 million in letters of credit issued under the Credit Agreement. Letters of credit issued under the Credit Agreement reduce availability under the Revolving Credit Facility.
The Credit Agreement carries an interest rate, at Delphi’s option, of either (a) the Administrative Agent’s Alternate Base Rate (“ABR” as defined in the Credit Agreement) plus (i) with respect to the Revolving Credit Facility and the Tranche A Term Loan, 2.25%1.75% per annum or (ii) with respect to the Tranche B Term Loan, 2.50%1.50% per annum, or (b) the London Interbank Offered Rate (the “Adjusted LIBO Rate” as defined in the Credit Agreement) (“LIBOR”) plus (i) with respect to the Revolving Credit Facility and the Tranche A Term Loan, 3.25%2.75% per annum or (ii) with respect to the Tranche B Term Loan, 3.50%2.50% per annum. The Tranche B Term Loan includes a LIBOR floor of 1.50%1.00%.
The interest rate period with respect to the LIBOR interest rate option can be set at one-, two-, three-, or six-months as selected by Delphi in accordance with the terms of the Credit Agreement (or other period as may be agreed by the applicable lenders), but payable no less than quarterly. Delphi may elect to change the selected interest rate over the term of the Credit Facilities in accordance with the provisions of the Credit Agreement. The applicable interest rates listed above for the Revolving Facility and the Tranche A Term Loan may increase or decrease from time to time by 0.25% based upon changes to Delphi’s corporate credit ratings. Accordingly, the interest rate will fluctuate during the term of the Credit Agreement based on changes in the Alternate Base Rate,ABR, LIBOR or future changes in Delphi’s corporate credit ratings. The Credit Agreement also requires that Delphi pay certain commitment fees on the unused portion of the Revolving Credit Facility and certain letter of credit issuance and fronting fees.
Delphi is obligated to make quarterly principal payments throughout the terms of the Tranche A and Tranche B Term Loans according to the amortization schedule in the Credit Agreement. In conjunction with the June 2011 repayments, all quarterly principal payment obligations prior to maturity have been satisfied for the Tranche B Term Loan and quarterly principal payments have been satisfied through June 30, 2013 for the Tranche A Term Loan. Borrowings under the Credit Agreement are prepayable at Delphi’s option without premium or penalty, provided that any prepayment of the Tranche B Term Loan is accompanied by a pro rata payment of the Tranche A Term Loan (based on the respective amounts then outstanding). Delphi may request that all or a portion of the Term Loans be converted to extend the scheduled maturity date(s) with respect to all or a portion of any principal amount of such Term Loans under certain conditions. The Credit Agreement also contains certain mandatory prepayment provisions in the event Delphi generates excess cash flow (as defined in the Credit Agreement) or Delphi receives net cash proceeds from any asset sale or casualty event.
As of March 31,June 30, 2011, Delphi selected the ABRone-month LIBOR interest rate option, as detailed in the table below, and the amounts outstanding, net of the discount (in millions) and rates effective as of March 31,June 30, 2011 were:
| | | | ABR plus | | Borrowings as of
March 31, 2011 | | | Rates effective
as of
March 31,
2011 | | | LIBOR plus | | Borrowings as of
June 30, 2011 | | | Rates effective
as of June 30,
2011 | |
Revolving Facility | | | 2.25 | % | | $ | — | | | | — | % | | | 2.75 | % | | $ | — | | | | — | % |
Tranche A Term Loan | | | 2.25 | % | | $ | 250 | | | | 5.50 | % | | | 2.75 | % | | $ | 221 | | | | 3.00 | % |
Tranche B Term Loan | | | 2.50 | % | | $ | 2,250 | | | | 5.75 | % | | | 2.50 | % | | $ | 810 | | | | 3.50 | %* |
Subsequent to March 31, 2011, Delphi elected to change to the LIBOR interest rate option for a one-month period for both the Tranche A Term Loan and the Tranche B Term Loan.
| * | Includes a LIBOR floor of 1.00% |
The Credit Agreement contains certain covenants that limit, among other things, Delphi’s (and Delphi’s subsidiaries’) ability to incur additional indebtedness or liens, to dispose of assets, to make certain investments, to prepay certain indebtedness and to pay dividends, or to make other distributions or redemptions, in respect of Delphi’s equity interests. In addition, the Credit Agreement requires that Delphi maintain a consolidated leverage ratio (the ratio of Consolidated Total Indebtedness to Consolidated EBITDA, each as defined in the Credit Agreement) of less than 2.75 to 1.0. The Credit Agreement also contains events of default customary for financings of this type. Delphi was in compliance with the Credit Agreement covenants as of March 31,June 30, 2011.
The Tranche A Term Loan and the Tranche B Term Loan were each issued under the Original Credit Agreement at a 0.5% discount and Delphi paid approximately $92$86 million of additional debt issuance costs in connection with the Credit Facilities. The discount and debt issuance costs are being amortized over the life of the facility. The Credit Agreement reduced the discount related to the Tranche B Term Loan to 0.25%.
All obligations under the Credit Agreement are borrowed by Delphi Corporation, a wholly-owned U.S. subsidiary of Delphi Automotive LLP jointly and severally guaranteed by Delphi Corporation’sits direct and indirect parent companies and by certain of Delphi Automotive LLP’s existing and future direct and indirect domestic subsidiaries, subject to certain exceptions set forth in the Credit Agreement. All obligations under the Credit Agreement, including the guarantees of those obligations, are secured by certain assets of Delphi Corporation and the guarantors, including the equity interests in Delphi, substantially all of the assets of Delphi Corporation and its domestic subsidiaries, and certain assets of Delphi Corporation’s direct and indirect parent companies.
Senior Notes
On May 17, 2011, we entered into a modification to the Credit Agreement. Additionally, on May 17, 2011, Delphi Corporation, a wholly-owned U.S. subsidiary of Delphi Automotive LLP, issued $500 million of 5.875% senior notes due 2019 and $500 million of 6.125% senior notes due 2021. Refer2021 (the “Senior Notes”) in a transaction exempt from registration under Rule 144A and Regulation S of the Securities Act. The Senior Notes are fully and unconditionally guaranteed, jointly and severally, by Delphi Automotive LLP and certain of its existing and future subsidiaries. Interest is payable semi-annually on May 15 and November 15 of each year, beginning on November 15, 2011. Interest accrues from May 17, 2011. Delphi paid approximately $23 million of additional debt issuance costs in connection with the Senior Notes. The net proceeds of approximately $1.0 billion as well as cash on hand were used to Note 18. Subsequent Events for further information.pay down amounts outstanding under the Tranche B Term Loan of the Credit Agreement.
The indenture governing the Senior Notes limits, among other things, Delphi’s (and its subsidiaries) ability to incur additional indebtedness or liens, dispose of assets, make certain restricted payments or investments, enter into transactions with affiliates or merge with or into other entities. As of June 30, 2011 the Company was in compliance with the provisions of the Senior Notes.
Acquisition Financing
Notes and DDTL—In connection with the Acquisition, (i) Delphi issued $41 million in senior unsecured five-year notes (the “Notes”) pursuant to a Note Purchase Agreement (the “NPA”) with an Acquisition Date fair value of $49 million and (ii) entered into a senior secured delayed draw term loan facility (the “DDTL”) with a syndicate of lenders. The Notes paid 12% interest and were scheduled to mature on October 6, 2014. The DDTL permitted borrowings of up to $890 million, consisting of a U.S. tranche of up to $267 million in borrowings and a foreign tranche of up to $623 million in borrowings. There was no commitment fee associated with the DDTL, but, if drawn, Delphi was required to pay interest at the rate of LIBOR plus 6.0% per annum, with a minimum LIBOR amount of 2.0% per annum. The DDTL had a term of 5 years. A majority of the holders of the Notes and the lenders under the DDTL were related parties as holders of the Class A and Class B membership interests.
In conjunction with the redemption of the Class A and Class C membership interests on March 31, 2011 and entry intoexecution of the Credit Agreement, each of the DDTL and the NPA was terminated (including the termination, discharge and release of all security and guarantees granted in connection with the DDTL and the NPA) and Delphi paid approximately $57 million to redeem the Notes in full. In connection with the termination of the Notes, Delphi incurred early termination penalties and recognized a loss on extinguishment of debt of approximately $9 million in the first quarter ofsix months ended June 30, 2011.
Other Financing
Accounts receivable factoring—Various accounts receivable factoring facilities are maintained in Europe and are accounted for as short-term debt. These uncommitted factoring facilities are available through various financial institutions. As of March 31,June 30, 2011 and December 31, 2010, $159$130 million and $112 million, respectively, were outstanding under these accounts receivable factoring facilities.
Capital leases and other—As of March 31,June 30, 2011 and December 31, 2010, approximately $104$75 million and approximately $130 million, respectively, of other debt issued by certain international subsidiaries was outstanding, primarily related to bank lines in Asia Pacific and capital lease obligations.
Interest—Cash paid for interest related to amounts outstanding totaled $7$35 million and $8$16 million for the threesix months ended March 31,June 30, 2011 and 2010, respectively.
| 9. | PENSION AND OTHER POSTRETIREMENT BENEFITS |
Certain of Delphi’s non-U.S. subsidiaries sponsor defined benefit pension plans, which generally provide benefits based on negotiated amounts for each year of service. Delphi’s primary non-U.S. plans are located in France, Germany, Luxembourg, Mexico, Portugal and the United Kingdom (“UK”). The UK and certain Mexican plans are funded. In addition, Delphi has defined benefit plans in South Korea, Turkey and Italy forunder which amounts are payable to employees immediately upon separation. The obligations for these plans are recorded based on the vested obligation.
Delphi’s U.S. subsidiaries sponsor a Supplemental Executive Retirement Program (“SERP”) for those employees who were U.S. executives prior to September 30, 2008 and were still U.S. executives on October 7, 2009, the effective date of the program. This program is unfunded. Executives receive the benefits over 5 years after an involuntary or voluntary separation from Delphi. The SERP is closed to new members and was frozen effective September 30, 2008.
The amounts shown below reflect the defined benefit pension expense for the three and six month periods ended March 31,June 30, 2011 and 2010:
| | | | Pension benefits | | | Pension benefits | |
| | | Non-U.S. plans | | U.S. plans | | | Non-U.S. plans | | U.S. plans | |
| | | Three months ended March 31, | | | Three months ended June 30, | |
| | | 2011 | | 2010 | | 2011 | | | 2010 | | | 2011 | | 2010 | | 2011 | | | 2010 | |
| | | (in millions) | | | (in millions) | |
Service cost | | $ | 11 | | | $ | 9 | | | $ | — | | | $ | — | | | $ | 12 | | | $ | 9 | | | $ | — | | | $ | — | |
Interest cost | | | 22 | | | | 21 | | | | 1 | | | | 1 | | | | 23 | | | | 21 | | | | 1 | | | | 1 | |
Expected return on plan assets | | | (15 | ) | | | (13 | ) | | | — | | | | — | | | | (16 | ) | | | (14 | ) | | | — | | | | — | |
Settlements and curtailments | | | | — | | | | (2 | ) | | | — | | | | — | |
| | | | | | | | | | | | | | | | | | | | | | | | |
Net periodic benefit cost | | $ | 18 | | | $ | 17 | | | $ | 1 | | | $ | 1 | | | $ | 19 | | | $ | 14 | | | $ | 1 | | | $ | 1 | |
| | | | | | | | | | | | | | | | | | | | | | | | |
| | | | | | | | | | | | | | | | |
| | | Pension benefits | |
| | | Non-U.S. plans | | | U.S. plans | |
| | | Six months ended June 30, | |
| | | 2011 | | | 2010 | | | 2011 | | | 2010 | |
| | | (in millions) | |
Service cost | | $ | 23 | | | $ | 18 | | | $ | — | | | $ | — | |
Interest cost | | | 45 | | | | 42 | | | | 2 | | | | 2 | |
Expected return on plan assets | | | (31 | ) | | | (27 | ) | | | — | | | | — | |
Settlements and curtailments | | | — | | | | (2 | ) | | | — | | | | — | |
| | | | | | | | | | | | | | | | |
Net periodic benefit cost | | $ | 37 | | | $ | 31 | | | $ | 2 | | | $ | 2 | |
| | | | | | | | | | | | | | | | |
Delphi also maintains other postretirement benefit plans. The cost of these plans is not significantmaterial to Delphi.
| 10. | COMMITMENTS AND CONTINGENCIES |
European Union antitrust investigation
Delphi has received a request for information from antitrust authorities at the European Commission seeking information about conduct by Delphi in connection with an investigation in the European Union related to the electrical and electronic components market. Delphi is cooperating fully with the European authorities. Delphi can provide no assurances as to the impact, if any, that may result from this investigation.
Environmental matters
Delphi is subject to the requirements of U.S. federal, state and local, and non-U.S., environmental and safety and health laws and regulations. At March 31,June 30, 2011 and December 31, 2010, the undiscounted reserve for environmental investigation and remediation was approximately $24$23 million (of which $4 million was recorded in accrued liabilities and $20$19 million was recorded in other long-term liabilities) and $23 million (of which $5 million was recorded in accrued liabilities and $18 million was recorded in other long-term liabilities), respectively. Delphi cannot ensure that environmental requirements will not change or become more stringent over time or that its eventual environmental remediation costs and liabilities will not exceed the amount of its current reserves. In the event that such liabilities were to significantly exceed the amounts recorded, Delphi’s results of operations could be materially affected.
Ordinary business litigation
Delphi is from time to time subject to various legal actions and claims incidental to its business, including those arising out of alleged defects, breach of contracts, product warranties, intellectual property matters, and
employment-related matters. It is the opinion of Delphi that the outcome of such matters will not have a material adverse impact on the consolidated financial position, results of operations, or cash flows of Delphi. With respect to warranty matters, although Delphi cannot ensure that the future costs of warranty claims by customers will not be material, Delphi believes its established reserves are adequate to cover potential warranty settlements. However, the final amounts required to resolve these matters could differ materially from the Company’s recorded estimates.
Warranty matters
In 2009, Delphi received information regarding potential warranty claims related to certain components supplied by Delphi’s Powertrain segment. In March 2011, Delphi reached a settlement with its customer related to this matter. During the three months ended March 31, 2011, Delphimatter and recognized additional warranty expense in cost of sales of approximately $76 million as a result of the settlement agreement.million. In April 2011, Delphi made a payment of €90 million (approximately $127$133 million at March 31,April 30, 2011 exchange rates) related to this matter.
Brazil matters
Delphi conducts significant business operations in Brazil that are subject to the Brazilian federal labor, social security, environmental, tax and customs laws, as well as a variety of state and local laws. While Delphi believes it complies with such laws, they are complex, subject to varying interpretations, and the Company is often engaged in litigation with government agencies regarding the application of these laws to particular circumstances. In addition, Delphi also is a party to commercial and labor litigation with private parties. As of March 31,June 30, 2011, related claims totaling approximately $250$260 million have been asserted against Delphi. As of March 31,June 30, 2011, the Company maintains accruals for these asserted claims that are substantially less than the amount of the claims asserted. The amounts accrued represent claims that are deemed probable of loss and are reasonably estimable based on the Company’sour analyses and assessment of the asserted claims and prior experience with similar matters. While the Company believes its accruals are adequate, the final amounts required to resolve these matters could differ materially from the Company’s recorded estimates and Delphi’s results of operations could be materially affected.
Romania value added tax (“VAT”) assessment
During the first quarter of 2010, as a result of a tax audit for years 2006–2008, the Company received a tax assessment from the Romanian tax authorities in the amount of approximately $42 million based on the taxing authority’s assessment that the Company underpaid its VAT (mostly on export sales) by approximately $24 million and owes accrued interest and penalties of $18 million. The Company filed an appeal contesting the assessment and during October 2010, the Romanian tax authorities substantially reduced the amount of the assessment and decided to re-audit the Company. As of March 31,June 30, 2011, the Company maintains a reserve for this contingency that is substantially less than the amount of the initial assessment. While the Company believes its reserve is adequate, the final amounts required to resolve this initial assessment could differ materially from the Company’s recorded estimate.
A reconciliation of the provision for income taxes compared with the amounts at the U.S. federal statutory rate was:
| | | | Three months ended
March 31, | | | Six months ended
June 30, | |
| | | 2011 | | 2010 | | | 2011 | | 2010 | |
| | | (in millions) | | | (in millions) | |
Tax at U.S. federal statutory income tax rate | | $ | 143 | | | $ | 111 | | | $ | 277 | | | $ | 212 | |
U.S. income taxed at other rates | | | 3 | | | | 1 | | | | 3 | | | | 4 | |
Non-U.S. income taxed at other rates | | | (43 | ) | | | (29 | ) | | | (107 | ) | | | (67 | ) |
Change in valuation allowance | | | (4 | ) | | | 1 | | | | (5 | ) | | | (2 | ) |
Other changes in tax reserves | | | 1 | | | | (4 | ) | | | 2 | | | | (7 | ) |
Withholding taxes | | | 16 | | | | 4 | | | | 26 | | | | 9 | |
Other adjustments | | | — | | | | 1 | | | | (7 | ) | | | (2 | ) |
| | | | | | | | | | | | |
Total income tax provision | | $ | 116 | | | $ | 85 | | | $ | 189 | | | $ | 147 | |
| | | | | | | | | | | | |
Delphi’s tax rate in both years is affected by the tax rates in the U.S. and foreign jurisdictions, the relative amount of income earned by jurisdiction, jurisdictions with a statutory tax rate less than the U.S. rate of 35% and the relative amount of losses for which no tax benefit was recognized due to a valuation allowance. The effective tax rate in the threesix months ended March 31,June 30, 2011 was impacted by $10 million withholding tax expense related to the redemption of all the outstanding Class A and Class C membership interests held by GM and the PBGC, respectively.
Cash paid for income taxes was approximately $55$155 million and $36$91 million, respectively, for the threesix months ended March 31,June 30, 2011 and 2010.
Tax return filing determinations and elections
The Company was established on August 19, 2009 as a limited liability partnership incorporated under the laws of England and Wales. At the time of its formation, the Company elected to be treated as a partnership for U.S. federal income tax purposes. Prior to the Acquisition Date, the Internal Revenue Service (the “IRS”) issued Notice 2009-78 (the “Notice”) announcing its intent to issue regulations under Section 7874 of the Internal Revenue Code of 1986, as amended (the “Code”) with an effective date prior to the Acquisition Date. If regulations as described in the Notice are issued with the effective date indicated in the Notice and with no exceptions for transactions that were subject to binding commitments on that date, the Company believes there is a substantial risk that it could be treated as a domestic corporation for U.S. federal income tax purposes, retroactive to the Acquisition Date.
The Company filed an informational 2009 U.S. federal partnership tax return on September 15, 2010. In light of the Notice, the IRS is currently reviewing whether sectionSection 7874 applies to the Company’sDelphi’s acquisition of the automotive supply and other businesses of the Predecessor.Old Delphi. While Delphi believes, based on the advice of counsel, that it is more likely than not that the Company is not a domestic corporation for U.S. federal income tax purposes, and therefore has not reserved any amounts on our financial statements in respect of this issue, no assurance can be given that the IRS will not contendtake the position that the Company should be treated as a domestic corporation for U.S. federal income tax purposes, or that, if the Company were to challenge any such contention by the IRS, that a court would not agree with the IRS.
If the Company were treated as a domestic corporation for U.S. federal income tax purposes, it would be subject to U.S. federal income tax on its worldwide taxable income, including some or all of the distributions
from its subsidiaries as well as some of the undistributed earnings of its foreign subsidiaries that constitute
“controlled “controlled foreign corporations.” This could have a material adverse impact on the Company’s future tax liability related to these distributions and earnings. In addition, the CompanyDelphi could be liable for its failure to withhold U.S. income taxes on distributions to its non-U.S. members, for periods beginning on or after the Acquisition Date, which liability could have a material adverse impact on ourthe Company’s results of operations and financial condition.
Delphi issued membership interests in accordance with the terms of the Acquisition on the Acquisition Date. The Class A and Class B membership interests entitled the holders to non-controlling representation on Delphi’s Board of Managers, and, along with Class C and Class E-1 membership interests, entitled the holders to potential, future distributions by Delphi. Additionally, prior to the redemption of the Class A and Class C membership interests as more fully described below, the LLP Agreement required the consent of or provided special rights to Class A and certain Class B membership interest holders with respect to certain events, including changes in corporate governance, the execution of significant transactions and the issuance of additional securities.
On March 31, 2011, Delphi redeemed all outstanding Class A and Class C membership interests for $3,791 million and $594 million, respectively. In conjunction with the redemption transaction, Delphi incurred transaction-related fees and expenses totaling approximately $180 million, including amounts paid to certain membership interest holders. In addition, Delphi obtained necessary consents to the redemption of the Class A and Class C membership interests and modified and eliminated specific rights provided to these membership interest holders under the LLP Agreement. Subsequent to the redemption transaction on March 31, 2011, Delphi’s membership interest equity is comprised of a single voting class of membership interests, the Company’s Class B membership interests. In addition to this class of voting membership interests, non-voting Class E-1 membership interests are held by our Board of Managers.
The amounts paid to redeem the outstanding Class A and Class C membership interests were $1,736 million in excess of the total recorded carrying value of the Class A and Class C membership interests. The excess was reflected as a pro-rata reduction to the recorded carrying value of the remaining membership interests (the Class B and Class E-1 membership interests).
In conjunction with the redemption transaction, the LLP Agreement was amended by the Revised LLP Agreement to adjust the distribution rights among the holders of the remaining classes of membership interests and to reflect the elimination of specific rights as mentioned above. Additionally in July 2011, the Revised LLP Agreement was amended and restated by the Fourth Amended and Restated Limited Liability Partnership Agreement of Delphi Automotive LLP to further position the Company for an initial public offering. Refer to Note 18. Subsequent Events for additional information.
The following table summarizes the membership interests issued:
| | | | Number of
membership
interests
issued and
outstanding
as of
December 31,
2010 | | | Number of
membership
interests
redeemed
during the
three months
ended
March 31,
2011 | | Number of
membership
interests
outstanding
as of
March 31,
2011 | | | Number of
membership
interests
issued and
outstanding
as of
December 31,
2010 | | | Number of
membership
interests
redeemed
during the
six months
ended
June 30,
2011 | | Number of
membership
interests
outstanding
as of
June 30,
2011 | |
A | | | 1,750,000 | | | | (1,750,000 | ) | | | — | | | | 1,750,000 | | | | (1,750,000 | ) | | | — | |
B | | | 354,500 | | | | — | | | | 354,500 | | | | 354,500 | | | | — | | | | 354,500 | |
C | | | 100,000 | | | | (100,000 | ) | | | — | | | | 100,000 | | | | (100,000 | ) | | | — | |
E-1 | | | 24,000 | | | | — | | | | 24,000 | | | | 24,000 | | | | — | | | | 24,000 | |
Current period net income and other changes to membership interestinterests in the current period are allocated to the respective outstanding classes based on the cumulative distribution provisions of the Revised LLP Agreement. The distributions vary by class of membership interestinterests and by cumulative amount distributed, and, between classes, are not related or proportional to the number of membership interests held.
Subsequent to the redemption transaction, net income and other changes to membership interestinterests will be allocated based on the cumulative distribution provisions of the Revised LLP Agreement.
In conjunction with the adoption in 2010 of the 2010 Board of Managers Class E-1 Interest Incentive Plan and the Value Creation Plan (the “VCP”), both of which are long-term incentive plans designed to assist the Company in attracting, retaining, motivating and rewarding the Board of Managers and key employees of the Company, and promoting the creation of long-term value, the Revised LLP Agreement includes provisions that address the Class E-1 membership interests and the VCP. The Revised LLP Agreement includes provisions related to potential distributions, or alternatively, allocations of equity, to the Class E-1 members and employee incentive plans based on rates/amounts as defined in the agreement (approximately 3.7% for the first approximately $1.6 billion of distributions and approximately 3.4% for distributions thereafter) with ratable reductions in the distribution percentages applied to Class B members.
In addition, under the terms of the Revised LLP Agreement, if the Board of Managers determines that there is available cash (as defined in the Revised LLP Agreement), the Class B and E-1 members will receive a distribution of available cash to enable the members to pay projected tax liabilities attributable to tax book profits and losses by Delphi that are attributable to their membership interests. Any tax distributions will be treated as an advance of amounts otherwise distributable to the members.
Additionally, under the terms of the Acquisition and the Revised LLP Agreement, if cumulative distributions to the members of Delphi under certain provisions of the Revised LLP agreement exceed $7.2 billion, Delphi, as disbursing agent on behalf of DPHH, is required to pay to the holders of allowed general unsecured claims against Old Delphi, $32.50 for every $67.50 in excess of $7.2 billion distributed to the members, up to a maximum amount of $300 million. This contingency is not considered probable of occurring as of March 31,June 30, 2011. Accordingly, no provision for this matter has been recorded as of March 31,June 30, 2011.
Net income (loss) per membership interests unit
Total membership interest equity as of October 6, 2009 was allocated to the respective outstanding classes of membership interests across all tranches of the cumulative distribution schedule as defined by the LLP Agreement. In subsequent periods total membership interest equity at the end of the period is allocated to the respective outstanding classes of membership interests across all tranches of the cumulative distribution schedule as defined by the LLP Agreement. The allocation of the net income (loss) for the period is the difference between the ending and beginning of period allocation of membership interest equity as there were no distributions during this period.
Delphi computes net income (loss) per membership interests unit by dividing its net income (loss) attributable to membership interests by the weighted average number of units outstanding during the period. The overall computation and presentation of its net income (loss) per membership interests unit are made in accordance with FASB ASC 260,Earnings Per Share.
The following table summarizestables summarize the net income per membership interests unit:
| | | | Weighted Average
Membership
Interests | | | Three Months
Ended March 31,
2011
Net Income
Attributable to
Membership
Interests | | | Three Months
Ended March 31,
2011
Net Income Per
Membership
Interests Unit | | |
| Class | | | | | (in millions, except per unit data) | | |
A | | | 1,750,000 | | | $ | 76 | | | $ | 43.50 | | |
B | | | 354,500 | | | | 189 | | | | 531.79 | | |
C | | | 100,000 | | | | 25 | | | | 253.78 | | |
E-1 | | | 24,000 | | | | 1 | | | | 40.42 | | |
| | | | | | | | |
| | | Total | | | $ | 291 | | | | |
| | | | | | | | | | | | | | | | | | | |
| | | Three months ended
June 30, 2011 | | | Six months ended
June 30, 2011 | |
| | | Weighted Average
Membership
Interests | | | Year Ended
December 31,
2010
Net Income
Attributable to
Membership
Interests | | | Year Ended
December 31,
2010
Net Income Per
Membership
Interests Unit | | | Weighted average
membership
interests | | | Net income
attributable to
membership
interests | | | Net income per
membership
interests unit | | | Weighted average
membership
interests | | Net income
attributable to
membership
interests | | | Net income per
membership
interests unit | |
| Class | | | | | (in millions, except per unit data) | | | (in millions, except per unit data) | |
A | | | 1,750,000 | | | $ | 114 | | | $ | 65.35 | | | | * | | | $ | * | | | $ | * | | | | 1,750,000 | ** | | $ | 76 | | | $ | 43.50 | |
B | | | 354,500 | | | | 410 | | | | 1,156.98 | | | | 354,500 | | | | 297 | | | | 837.61 | | | | 354,500 | | | | 486 | | | | 1,370.85 | |
C | | | 100,000 | | | | 107 | | | | 1,064.88 | | | | * | | | | * | | | | * | | | | 100,000 | ** | | | 25 | | | | 253.78 | |
E-1 | | | 12,000 | | | | — | | | | N/A | | | | 24,000 | | | | 1 | | | | 44.53 | | | | 24,000 | | | | 2 | | | | 63.40 | |
| | | | | | | | | | | | | | | | | | | | | |
| | | Total | | | $ | 631 | | | | | | Total | | | $ | 298 | | | | | | Total | | | $ | 589 | | | |
| | | | | | | | | | | | | | | | | | | | | |
| | | | Weighted Average
Membership
Interests | | | Three Months
Ended March 31,
2010
Net Income
Attributable to
Membership
Interests | | | Three Months
Ended March 31,
2010 Net Income
Per Membership
Interests Unit | | |
| Class | | | | | (in millions, except per unit data) | | |
A | | | 1,750,000 | | | $ | 38 | | | $ | 21.50 | | |
B | | | 354,500 | | | | 139 | | | | 394.22 | | |
C | | | 100,000 | | | | 38 | | | | 376.25 | | |
| | | | | | | | |
| | | Total | | | $ | 215 | | | | |
| | | | | | | | |
| * | Not applicable due to redemption of membership interests on March 31, 2011. |
| ** | Weighted average membership interests for the period outstanding through March 31, 2011. |
| | | | | | | | | | | | | | | | | | | | |
| | | |
| | | | | | Three months ended
June 30, 2010 | | | Six months ended
June 30, 2010 | |
| | | Weighted average
membership
interests | | | Net income
attributable to
membership
interests | | | Net income per
membership
interests unit | | | Net income
attributable to
membership
interests | | | Net income per
membership
interests unit | |
| Class | | | | | (in millions, except per unit data) | | | | |
A | | | 1,750,000 | | | $ | 37 | | | $ | 21.40 | | | $ | 75 | | | $ | 42.90 | |
B | | | 354,500 | | | | 140 | | | | 392.38 | | | | 279 | | | | 786.60 | |
C | | | 100,000 | | | | 37 | | | | 374.50 | | | | 75 | | | | 750.75 | |
| | | | | | | | | | | | | | | | | | | | |
| | | Total | | | $ | 214 | | | | | | | $ | 429 | | | | | |
| | | | | | | | | | | | | | | | | | | | |
| 13. | FAIR VALUE OF FINANCIAL INSTRUMENTS, DERIVATIVES AND HEDGING ACTIVITIES |
Financial instruments
Delphi’s financial instruments include its accounts receivable factoring arrangements, capital leases and other debt issued by Delphi’s foreign subsidiaries, the Tranche A Term Loan, and the Tranche B Term Loan.Loan and the Senior Notes. The fair value of these financial instruments is based on quoted market prices for instruments with public market data or the current book value for instruments without a quoted public market price. As of March 31,June 30, 2011 and December 31, 2010, the total of the financial instruments listed above was recorded at $2,751$2,236 million and $289 million, respectively, and had estimated fair values of $2,751$2,236 million and $293 million, respectively. For all other financial instruments recorded at March 31,June 30, 2011 and December 31, 2010, fair value approximates book value.
Derivatives and hedging activities
Delphi is exposed to market risk, such as fluctuations in foreign currency exchange rates, commodity prices and changes in interest rates, which may result in cash flow risks. To manage the volatility relating to these exposures, Delphi aggregates the exposures on a consolidated basis to take advantage of natural offsets. For exposures that are not offset within its operations, Delphi enters into various derivative transactions pursuant to its risk management policies, which prohibit holding or issuing derivative financial instruments for trading purposes, and designation of derivative instruments is performed on a transaction basis to support hedge accounting. The changes in fair value of these hedging instruments are offset in part or in whole by corresponding changes in the fair value or cash flows of the underlying exposures being hedged. Delphi assesses the initial and ongoing effectiveness of its hedging relationships in accordance with its documented policy. As of March 31,June 30, 2011, Delphi has entered into derivative instruments to hedge cash flows extending out to JuneOctober 2013.
As of March 31,June 30, 2011, the Company had the following outstanding notional amounts related to commodity and foreign currency forward contracts that were entered into to hedge forecasted exposures:
| | | | | | |
Commodity | | Quantity
hedged | | | Unit of
measure |
| | | (in thousands) |
Copper | | | 67,25760,435 | | | pounds |
Primary Aluminum | | | 27,75224,509 | | | pounds |
Secondary Aluminum | | | 15,72213,775 | | | pounds |
Silver | | | 10796 | | | troy ounces |
Gold | | | 53 | | | troy ounces |
Platinum
| | | 1 | | | troy ounce |
| | | | | | |
Foreign currency | | Quantity
hedged | | | Unit of
measure |
| | | (in millions) |
Hungarian Forint | | | 8,418 | | | HUF |
South Korean Won | | | 10,7498,355 | | | KRW |
Hungarian Forint
| | | 8,602 | | | HUF |
Mexican Peso | | | 4,8665,798 | | | MXN |
Japanese Yen | | | 2,5552,059 | | | JPY |
Chinese Yuan Renminbi | | | 397499 | | | CNY |
Romanian Leu | | | 297 | | | RON |
New Turkish Lira | | | 147175 | | | TRY |
Euro | | | 119126 | | | EUR |
British Pound | | | 57 | | | GBP |
Brazilian Real | | | 6756 | | | BRL |
British Pound
| | | 67 | | | GBP |
Polish Zloty | | | 6047 | | | PLN |
Singapore Dollar | | | 2419 | | | SGD |
The Company had additional foreign currency forward contracts that individually amounted to less than $10 million.
The fair value of derivative financial instruments recorded in the consolidated balance sheets as of March 31,June 30, 2011 and December 31, 2010 are as follows:
| | | | Asset derivatives | | | Liability derivatives | | | Asset derivatives | | | Liability derivatives | |
| | | Balance sheet location | | March 31,
2011 | | | Balance sheet location | | March 31,
2011 | | | Balance sheet location | | June 30,
2011 | | | Balance sheet location | | June 30,
2011 | |
| | | (in millions) | | | (in millions) | |
Designated derivatives instruments: | | | | | | | | | | | | | | | | |
Commodity derivatives | | Other Current Assets | | $ | 32 | | | Accrued Liabilities | | $ | — | | | Other Current Assets | | $ | 27 | | | Accrued Liabilities | | $ | — | |
Foreign currency derivatives | | Other Current Assets | | | 40 | | | Accrued Liabilities | | | 8 | | | Other Current Assets | | | 43 | | | Accrued Liabilities | | | 10 | |
Foreign currency derivatives* | | Accrued Liabilities | | | — | | | Other Current Assets | | | 13 | | | Accrued Liabilities | | | — | | | Other Current Assets | | | 19 | |
Commodity derivatives | | Other Long-Term
Assets | | | 10 | | | Other Long-Term
Liabilities | | | — | | | Other Long-Term
Assets | | | 4 | | | Other Long-Term
Liabilities | | | — | |
Foreign currency derivatives | | Other Long-Term
Assets | | | 10 | | | Other Long-Term
Assets | | | 5 | | | Other Long-Term
Assets | | | 9 | | | Other Long-Term
Assets | | | 7 | |
| | | | | | | | | | | | | | | | | | | | |
Total | | | | $ | 92 | | | | | $ | 26 | | | | | $ | 83 | | | | | $ | 36 | |
| | | | | | | | | | | | | | | | | | | | |
Derivatives not designated: | | | | | | | | | | | | | | | | |
None | | | | | | | | | | | | | | | | |
| | | | Asset derivatives | | | Liability derivatives | | | Asset derivatives | | | Liability derivatives | |
| | | Balance sheet location | | December 31,
2010 | | | Balance sheet location | | December 31,
2010 | | | Balance sheet location | | December 31,
2010 | | | Balance sheet location | | December 31,
2010 | |
| | | (in millions) | | | (in millions) | |
Designated derivatives instruments: | | | | | | | | | | | | | | | | |
Commodity derivatives | | Other Current Assets | | $ | 37 | | | Accrued Liabilities | | $ | — | | | Other Current Assets | | $ | 37 | | | Accrued Liabilities | | $ | — | |
Foreign currency derivatives | | Other Current Assets | | | 29 | | | Accrued Liabilities | | | — | | | Other Current Assets | | | 29 | | | Accrued Liabilities | | | — | |
Foreign currency derivatives* | | Accrued Liabilities | | | — | | | Other Current Assets | | | 7 | | | Accrued Liabilities | | | — | | | Other Current Assets | | | 7 | |
Commodity derivatives | | Other Long-Term
Assets | | | 11 | | | Other Long-Term
Liabilities | | | — | | | Other Long-Term
Assets | | | 11 | | | Other Long-Term
Liabilities | | | — | |
Foreign currency derivatives | | Other Long-Term
Assets | | | 10 | | | Other Long-Term
Assets | | | 4 | | | Other Long-Term
Assets | | | 10 | | | Other Long-Term
Assets | | | 4 | |
| | | | | | | | | | | | | | | | | | | | |
Total | | | | $ | 87 | | | | | $ | 11 | | | | | $ | 87 | | | | | $ | 11 | |
| | | | | | | | | | | | | | | | | | | | |
Derivatives not designated: | | | | | | | | | | | | | | | | |
None | | | | | | | | | | | | | | | | |
| * | Derivative instruments within this category are subject to master netting arrangements and are presented on a net basis in the consolidated balance sheets in accordance with accounting guidance related to the offsetting of amounts related to certain contracts. |
The fair value of the net asset position of Delphi’s derivative financial instruments decreased from December 31, 2010 to March 31,June 30, 2011 primarily due to a decreasedecreases in the forward rates of commodities partially offset by an increase in the forward rates ofand certain foreign currencies.
The effect of derivative financial instruments in the consolidated statement of operations for the three months ended March 31,June 30, 2011 is as follows:
| Three months ended March 31, 2011 | | Gain
recognized in
OCI (effective
portion) | | Gain
reclassified
from OCI into
income
(effective
portion) | | Gain
recognized in
income
(ineffective
portion
excluded from
effectiveness
testing) | | |
Three months ended June 30, 2011 | | | (Loss) gain
recognized in
OCI (effective
portion) | | Gain
reclassified
from OCI into
income
(effective
portion) | | Loss
recognized in
income
(ineffective
portion
excluded from
effectiveness
testing) | |
| | | (in millions) | | | (in millions) | |
Designated derivatives instruments: | | | | | | | | | | | | |
Commodity derivatives | | $ | 6 | | | $ | 12 | | | $ | — | | | $ | (1 | ) | | $ | 11 | | | $ | (1 | ) |
Foreign currency derivatives | | | 12 | | | | 8 | | | | — | | | | 1 | | | | 9 | | | | — | |
| | | | | | | | | | | | | | | | | | |
Total | | $ | 18 | | | $ | 20 | | | $ | — | | | $ | — | | | $ | 20 | | | $ | (1 | ) |
| | | | | | | | | | | | | | | | | | |
| | | | Gain
recognized in
income | | | Loss
recognized in
income | |
Derivatives not designated: | | | | |
Commodity derivatives | | $ | — | | | $ | — | |
Foreign currency derivatives | | | 1 | | | | (1 | ) |
| | | | | | |
Total | | $ | 1 | | | $ | (1 | ) |
| | | | | | |
The effect of derivative financial instruments in the consolidated statement of operations for the three months ended March 31,June 30, 2010 is as follows:
| Three months ended March 31, 2010 | | Gain
recognized in
OCI (effective
portion) | | Gain
reclassified
from OCI into
income
(effective
portion) | | Gain
recognized in
income
(ineffective
portion
excluded from
effectiveness
testing) | | |
Three months ended June 30, 2010 | | | Loss
recognized in
OCI (effective
portion) | | Gain
reclassified
from OCI into
income
(effective
portion) | | Gain
recognized in
income
(ineffective
portion
excluded from
effectiveness
testing) | |
| | | (in millions) | | | (in millions) | |
Designated derivatives instruments: | | | | | | | | | | | | |
Commodity derivatives | | $ | 17 | | | $ | 1 | | | $ | — | | | $ | (26 | ) | | $ | 4 | | | $ | — | |
Foreign currency derivatives | | | 27 | | | | 3 | | | | — | | | | (12 | ) | | | 5 | | | | — | |
| | | | | | | | | | | | | | | | | | |
Total | | $ | 44 | | | $ | 4 | | | $ | — | | | $ | (38 | ) | | $ | 9 | | | $ | — | |
| | | | | | | | | | | | | | | | | | |
| | | | |
| | | Gain
recognized in
income | |
Derivatives not designated: | | | | |
Commodity derivatives | | $ | — | |
Foreign currency derivatives | | | 3 | |
| | | | |
Total | | $ | 3 | |
| | | | |
| | | | |
| | Gain
recognized in
income | |
Derivatives not designated: | | | | |
Commodity derivatives | | $ | — | |
Foreign currency derivatives | | | — | |
| | | | |
Total | | $ | — | |
| | | | |
The effect of derivative financial instruments in the consolidated statement of operations for the six months ended June 30, 2011 is as follows:
| | | | | | | | | | | | |
Six months ended June 30, 2011 | | Gain
recognized in
OCI (effective
portion) | | | Gain
reclassified
from OCI into
income
(effective
portion) | | | Loss
recognized in
income
(ineffective
portion
excluded from
effectiveness
testing) | |
| | | (in millions) | |
Designated derivatives instruments: | | | | | | | | | | | | |
Commodity derivatives | | $ | 5 | | | $ | 23 | | | $ | (1 | ) |
Foreign currency derivatives | | | 13 | | | | 17 | | | | — | |
| | | | | | | | | | | | |
Total | | $ | 18 | | | $ | 40 | | | $ | (1 | ) |
| | | | | | | | | | | | |
| | | | | | | | | | | | |
| | | | | | | | | Gain
recognized in
income | |
Derivatives not designated: | | | | | | | | | | | | |
Commodity derivatives | | | | | | | | | | $ | — | |
Foreign currency derivatives | | | | | | | | | | | — | |
| | | | | | | | | | | | |
Total | | | | | | | | | | $ | — | |
| | | | | | | | | | | | |
The effect of derivative financial instruments in the consolidated statement of operations for the six months ended June 30, 2010 is as follows:
| | | | | | | | | | | | |
Six months ended June 30, 2010 | | (Loss) gain
recognized in
OCI (effective
portion) | | | Gain
reclassified
from OCI into
income
(effective
portion) | | | Gain
recognized in
income
(ineffective
portion
excluded from
effectiveness
testing) | |
| | | (in millions) | |
Designated derivatives instruments: | | | | | | | | | | | | |
Commodity derivatives | | $ | (9 | ) | | $ | 5 | | | $ | — | |
Foreign currency derivatives | | | 15 | | | | 8 | | | | — | |
| | | | | | | | | | | | |
Total | | $ | 6 | | | $ | 13 | | | $ | — | |
| | | | | | | | | | | | |
| | | | | | | | | | | | |
| | | | | | | | | Gain
recognized in
income | |
Derivatives not designated: | | | | | | | | | | | | |
Commodity derivatives | | | | | | | | | | $ | — | |
Foreign currency derivatives | | | | | | | | | | | 3 | |
| | | | | | | | | | | | |
Total | | | | | | | | | | $ | 3 | |
| | | | | | | | | | | | |
The gain or loss reclassified from OCI into income for the effective portion of designated derivative instruments and the gain or loss recognized in income for the ineffective portion of designated derivative instruments excluded from effectiveness testing were recorded to cost of sales in the consolidated statements of operations for the three and six months ended March 31,June 30, 2011 and 2010. The gain or loss recognized in income for non-designated derivative instruments was recorded in other income, net for the three and six months ended March 31,June 30, 2011 and 2010.
Gains and losses on derivatives qualifying as cash flow hedges are recorded in OCI, to the extent that hedges are effective, until the underlying transactions are recognized in earnings. Unrealized amounts in accumulated OCI will fluctuate based on changes in the fair value of hedge derivative contracts at each reporting period. Net gains included in accumulated OCI as of March 31,June 30, 2011 were $52$40 million after-tax ($8163 million pre-tax). Of this pre-tax total, a gain of approximately $63$54 million is expected to be included in cost of sales within the next 12 months and a gain of approximately $18$9 million is expected to be included in cost of sales in subsequent periods. Cash flow hedges are discontinued when Delphi determines it is no longer probable that the originally forecasted transactions will occur. The amount included in cost of sales related to hedge ineffectiveness was insignificant for the threesix months ended March 31,June 30, 2011 and 2010.
Fair value measurements
Fair value measurements on a recurring basis
All derivative instruments are required to be reported on the balance sheet at fair value unless the transactions qualify and are designated as normal purchases or sales. Changes in fair value are reported currently through earnings unless they meet hedge accounting criteria. Delphi’s derivative exposures are with counterparties with long-term investment grade credit ratings. Delphi estimates the fair value of its derivative contracts using an income approach based on valuation techniques to convert future amounts to a single, discounted amount. Estimates of the fair value of foreign currency and commodity derivative instruments are determined using exchange traded prices and rates. Delphi also considers the risk of non-performance in the estimation of fair value, and includes an adjustment for non-performance risk in the measure of fair value of derivative instruments. The non-performance risk adjustment reflects the credit default spread (“CDS”) applied to the net commodity and foreign currency exposures by counterparty. When Delphi is in a net derivative asset position, the counterparty CDS rates are applied to the net derivative asset position. When Delphi is in a net derivative liability position, estimates of peer companies’ CDS rates are applied to the net derivative liability position.
In certain instances where market data is not available, Delphi uses management judgment to develop assumptions that are used to determine fair value. This could include situations of market illiquidity for a particular currency or commodity or where observable market data may be limited. In those situations, Delphi generally surveys investment banks and/or brokers and utilizes the surveyed prices and rates in estimating fair value.
As of March 31,June 30, 2011 and December 31, 2010, Delphi was in a net derivative asset position of $66$47 million and $76 million, respectively, and there were no adjustments recorded for nonperformance risk as exposures were to counterparties with investment grade credit ratings.
As of March 31,June 30, 2011 and December 31, 2010, Delphi had the following assets measured at fair value on a recurring basis:
| As of March 31, 2011: | | Total | | Quoted prices
in active
markets
level 1 | | Significant
other
observable
inputs level 2 | | Significant
unobservable
inputs level 3 | | |
As of June 30, 2011: | | | Total | | Quoted prices
in active
markets
level 1 | | Significant
other
observable
inputs level 2 | | Significant
unobservable
inputs level 3 | |
| | | (in millions) | | | (in millions) | |
Available-for-sale securities | | $ | 10 | | | $ | 10 | | | $ | — | | | $ | — | | | $ | 4 | | | $ | 4 | | | $ | — | | | $ | — | |
Commodity derivatives | | | 42 | | | | — | | | | 42 | | | | — | | | | 31 | | | | — | | | | 31 | | | | — | |
Foreign currency derivatives | | | 32 | | | | — | | | | 32 | | | | — | | | | 26 | | | | — | | | | 26 | | | | — | |
| | | | | | | | | | | | | | | | | | | | | | | | |
Total | | $ | 84 | | | $ | 10 | | | $ | 74 | | | $ | — | | | $ | 61 | | | $ | 4 | | | $ | 57 | | | $ | — | |
| | | | | | | | | | | | | | | | | | | | | | | | |
As of December 31, 2010: | | | | | | | | | | | | | | | | |
Time deposits | | $ | 550 | | | $ | — | | | $ | 550 | | | $ | — | | | $ | 550 | | | $ | — | | | $ | 550 | | | $ | — | |
Available-for-sale securities | | | 12 | | | | 12 | | | | — | | | | — | | | | 12 | | | | 12 | | | | — | | | | — | |
Commodity derivatives | | | 48 | | | | — | | | | 48 | | | | — | | | | 48 | | | | — | | | | 48 | | | | — | |
Foreign currency derivatives | | | 28 | | | | — | | | | 28 | | | | — | | | | 28 | | | | — | | | | 28 | | | | — | |
| | | | | | | | | | | | | | | | | | | | | | | | |
Total | | $ | 638 | | | $ | 12 | | | $ | 626 | | | $ | — | | | $ | 638 | | | $ | 12 | | | $ | 626 | | | $ | — | |
| | | | | | | | | | | | | | | | | | | | | | | | |
As of March 31,June 30, 2011 and December 31, 2010, Delphi had the following liabilities measured at fair value on a recurring basis:
| As of March 31, 2011: | | Total | | Quoted prices
in active
markets
level 1 | | Significant
other
observable
inputs level 2 | | Significant
unobservable
inputs level 3 | | |
As of June 30, 2011: | | | Total | | Quoted prices
in active
markets
level 1 | | Significant
other
observable
inputs level 2 | | Significant
unobservable
inputs level 3 | |
| | | (in millions) | | | (in millions) | |
Foreign currency derivatives | | $ | 8 | | | $ | — | | | $ | 8 | | | $ | — | | | $ | 10 | | | $ | — | | | $ | 10 | | | $ | — | |
| | | | | | | | | | | | | | | | | | | | | | | | |
Total | | $ | 8 | | | $ | — | | | $ | 8 | | | $ | — | | | $ | 10 | | | $ | — | | | $ | 10 | | | $ | — | |
| | | | | | | | | | | | | | | | | | | | | | | | |
As of December 31, 2010: | | | | | | | | | | | | | | | | |
None | | | | | | | | | | | | | | | | |
Fair value measurements on a nonrecurring basis
In addition to items that are measured at fair value on a recurring basis, Delphi also has items in its balance sheet that are measured at fair value on a nonrecurring basis. As these items are not measured at fair value on a recurring basis, they are not included in the tables above. Nonfinancial assets and liabilities that are measured at fair value on a nonrecurring basis include long-lived assets, intangible assets, asset retirement obligations and liabilities for exit or disposal activities measured at fair value upon initial recognition. No impairment charges were recorded during the three and six months ended March 31,June 30, 2011. Fair value of long-lived assets is determined primarily using the anticipated cash flows discounted at a rate commensurate with the risk involved and a review of appraisals. As such, Delphi has determined that the fair value measurements of long-lived assets fall in Level 3 of the fair value hierarchy.
| 14. | OTHER (EXPENSE) INCOME, NET |
Other (expense) income, net included:
| | | | Three months ended
March 31, | | | Three months ended
June 30, | | Six months ended
June 30, | |
| | | 2011 | | 2010 | | | 2011 | | 2010 | | 2011 | | 2010 | |
| | | (in millions) | | | (in millions) | |
Interest income | | $ | 9 | | | $ | 5 | | | $ | 7 | | | $ | 6 | | | $ | 16 | | | $ | 11 | |
Impairment—investment in available-for-sale security | | | | (6 | ) | | | — | | | | (6 | ) | | | — | |
Loss on extinguishment of debt | | | (9 | ) | | | — | | | | (8 | ) | | | — | | | | (17 | ) | | | — | |
Other, net | | | 3 | | | | (3 | ) | | | 3 | | | | (6 | ) | | | 6 | | | | (9 | ) |
| | | | | | | | | | | | | | | | | | |
Other income, net | | $ | 3 | | | $ | 2 | | | $ | (4 | ) | | $ | — | | | $ | (1 | ) | | $ | 2 | |
| | | | | | | | | | | | | | | | | | |
During the three and six months ended June 30, 2011, Delphi recognized a $6 million impairment of an investment in available-for-sale securities. As further discussed in Note 8. Debt, Delphi paid $36.5 million and $137.5 million of the Tranche A Term Loan and Tranche B Term Loan, respectively and paid $57 million to extinguish the Notes and recognized a loss on extinguishment of debt of $9$8 million and $17 million during the three and six months ended March 31, 2011.June 30, 2011, respectively.
| 15. | ACQUISITIONS AND DIVESTITURES |
Acquisitions
In May 2011, Delphi completed the acquisition of a manufacturer of specialized diesel testing equipment for a purchase price of $19 million. The acquisition was not material to the Company’s consolidated financial statements. In connection with the acquisition, the Company recorded goodwill of $8 million. The purchase price allocation may be subsequently adjusted to reflect final valuation studies.
Sale of Daesung investment
On January 31, 2011, Delphi completed the sale of its 49.5% ownership interest in Daesung Electric, Co., Ltd. Delphi received $35 million in net proceeds and recognized a gain on divestiture of $8 million, which is included in equity income, net of tax, in the consolidated statement of operations for the threesix months ended March 31,June 30, 2011.
Sale of occupant protection systems
On March 31, 2010, Delphi completed the sale of its occupant protection systems business in Asia to Autoliv AB. Delphi received net proceeds of $63$71 million and recognized a gain on divestiture of $6$10 million, which is included in cost of sales in the consolidated statement of operations for the threesix months ended March 31,June 30, 2010. The results of operations, including the gain or loss on divestiture were not significant to the consolidated financial statements in any period presented, and this divestiture did not meet the discontinued operations criteria.
| 16. | SHARE-BASED COMPENSATION |
Board of Managers Equity Award
In June 2010, the 2010 Board of Managers Class E-1 Interest Incentive Plan (the “Plan”) was authorized in order to attract and reward board members and to promote the creation of long-term value for interest holders of Delphi. On June 30, 2010, 24,000 restricted interests of a newly created class of membership interests, (“Class E-1 Interests”)membership interests, were issued to board members. The restricted interests are subject to continued service through applicable vesting dates as follows:
Under certain conditions with respect to an initial public offering or a change in control, as defined in the Plan, any interests that have not yet vested may immediately become vested.vest. All unvested Class E-1 Interestsmembership interests will fully vest in the event of a completed initial public offering if the resulting total equity valuation of the Company (based on the average closing price of Delphi shares during the 15-day period beginning on the 30th day after the closing of the offering), plus the value of prior distributions made under the LLP Agreement to
holders of membership interests (as well as the $4.4 billion paid to repurchase Class A and Class C membership interests (See Note 1. Description of Business) and any amounts distributed to holders of Class E-1 Interestsmembership interests with respect to or to repurchase their Class E-1 Interests)membership interests), is at least $6 billion. In addition, upon the completion of an initial public offering, all outstanding membership interests will be converted to ordinary shares.
Approximately $12$10 million of compensation expense will be recognized through the remainder of the vesting period. This amount would be recognized immediately if the criteria for immediate vesting are met.
At the time of issuance, the fair market value of the Class E-1 Interestsmembership interests was estimated to be $19 million, based on a contemporaneous valuation performed by an independent valuation specialist, utilizing generally accepted valuation approaches. Beginning in the third quarter of 2010, Delphi recognized compensation cost on a straight-line basis. Compensation expense recognized during the three and six months ended March 31,June 30, 2011 totaled $2 million and $4 million, net of tax.tax, respectively. There were no cash flow impacts for the three and six months ended March 31,June 30, 2011.
Executive Long Term Incentive Plan
During the second quarter of 2010, the Board of Managers approved and authorized the VCP, a long-term incentive plan designed to assist the Company in attracting, retaining, motivating and rewarding key employees of the Company, and promoting the creation of long-term value. Participants were granted an award in September 2010 for the period ending December 31, 2012. Each individual participant’s target value was based on the participants’ level of responsibility within the Company and the country in which the participant is located. The awards cliff vest fully at the end of the performance period, but may immediately become fully vestedvest upon a change in control, as defined in the VCP, for certain participants. In the event of a qualified termination, as defined, the participant shall vest in a pro-rata percentage of their award as of the termination date. For any other termination, the award shall be forfeited.
The amounts to be settled under the VCP will be determined based on Delphi’s enterprise value and accumulated distributions (as well as $4.4 billion paid to repurchase Class A and Class C membership interests and any amounts distributed to holders of Class E-1 Interestmembership interests to repurchase their Class E-1 Interest),membership interests) as of December 31, 2012, compared to a target enterprise value of $8.25 billion. An enterprise value of $2.5 billion must be achieved to receive a minimum award payout and above this level the payout is determined as a percentage of the target award. The authorized target amount of the awards is $135 million (of which $108$107 million are outstanding as of March 31,June 30, 2011), but the ultimate final settlement amount of the awards could be higher or lower, depending on the enterprise value of Delphi at December 31, 2012. The estimated fair value of the awards granted as of March 31,June 30, 2011 was $179$200 million. In the event of a completed initial public offering, the estimated enterprise value will be based on the average closing market price of the Company between the first day of trading on a public exchange and the end of the performance period, plus any distributions to holders of all membership interests and the approximately $4.4 billion paid to repurchase Class A and Class C membership interests. Delphi recognized compensation cost in 2010 and will continue to recognize compensation cost, based on estimates of the enterprise value, over the requisite vesting periods of the awards. Compensation expense recognized during the three and six months ended March 31,June 30, 2011 totaled $17$31 million ($1324 million, net of tax). and $48 million ($38 million, net of tax), respectively. Based on the estimate of enterprise value as of March 31,June 30, 2011, unrecognized compensation expense on a pretax basis of approximately $133$121 million is anticipated to be recognized on a straight-line basis during the remainder of 2011 and 2012. There were no cash flow impacts for the three and six months ended March 31,June 30, 2011.
Final settlement can be made in cash, membership interests, common stock or a combination thereof as provided in the participation agreement or as otherwise determined by the Compensation and Human Resources Committee of the Board of Managers.
The VCP awards are accounted for as liability awards pursuant to FASB ASC 718,Compensation-Stock Compensation. Estimating the fair value of the liability awards under the VCP requires assumptions regarding the Company’s enterprise value. Any differences in actual results from management’s estimates could result in fair values different from estimated fair values, which could materially impact the Company’s future results of operations and financial condition. The fair market value of the liability awards under the VCP is based on contemporaneous valuations performed by an independent valuation specialist, utilizing generally accepted valuation approaches.
Significant Factors, Assumptions, and Methodologies Used in Estimating Fair Value of Enterprise Value for VCP Awards and Fair Value of E-1 Membership Interests
The estimated fair value of the Class E-1 Interestsmembership interests were based on a contemporaneous valuation performed as of the grant date. The liability awards under the VCP were based on contemporaneous valuations performed periodically by an independent valuation specialist. Both the Class E-1 Interestsmembership interests and VCP valuations utilize appropriate weighting of the market and income approaches.
Market Approach: The market approach measures the value of a company through analysis of recent sales or offerings of comparable companies. Based on analysis of guideline public companies and guideline merged or acquired companies, Delphi utilized 2010 operating income before depreciation and amortization, including long-lived asset and goodwill impairment (“EBITDA”) multiples and 2011 EBITDA multiples of 4.5x-6.25x to value the Class E-1 Interestsmembership interests and VCP awards.
In addition to the guideline public company and guideline merged or acquired company approaches, the Company considered the trading price of its Class B membership interests by qualified institutional investors in determining the enterprise value of the Company.
Income Approach: The income approach derives the value of a company based on assumptions about the company’s future stream of cash flows. Delphi provided its independent valuation specialist with projected net sales, expenses and cash flows for the years ended December 31, 2010, 2011 and 2012 for the Class E-1 awards and for the years ended December 31, 2010, 2011, 2012 and 2013 for the VCP awards. These financial projections represent management’s best estimate at the time of the contemporaneous valuations. Discount rates used to determine the present value of future cash flows were based on the weighted average cost of capital which ranged from 11.6%-13.7%.
Delphi operates its core business along the following operating segments, which are grouped on the basis of similar product, market and operating factors:
Electronics and Safety, which includes component and systems integration expertise in audio and infotainment, body controls and security systems, displays, mechatronics, safety electronics and electric and hybrid electric vehicle power electronics, as well as advanced development of software.
Powertrain Systems, which includes extensive systems integration expertise in gasoline, diesel and fuel handling and full end-to-end systems including fuel injection, combustion, electronics controls, exhaust handling, test and validation capabilities, diesel and automotive aftermarket, and original equipment service.
Electrical/Electronic Architecture, which includes complete electrical architecture and component products.
Thermal Systems, which includes heating, ventilating and air conditioning systems, components for multiple transportation and other adjacent markets, and powertrain cooling and related technologies.
Eliminations and Other, which includes i) the elimination of inter-segment transactions, and ii) certain other expenses and income of a non-operating or strategic nature.
The accounting policies of the segments are the same as those described in Note 2. Significant Accounting Policies, except that the disaggregated financial results for the segments have been prepared using a management approach, which is consistent with the basis and manner in which management internally disaggregates financial information for the purposes of assisting internal operating decisions. Through December 31, 2010, Delphi evaluated performance based on standalonestand-alone segment operating income before depreciation and amortization, including long-lived asset and goodwill impairment charges and transformation and rationalization charges (“EBITDAR”) and accounted for inter-segment sales and transfers as if the sales or transfers were to third parties, at current market prices. Delphi’s management believed that EBITDAR was a meaningful measure of performance and it was used by management to analyze Company and stand-alone segment operating performance. Management also used EBITDAR for planning and forecasting purposes. Effective January 1, 2011, Delphi’s management began utilizing segment EBITDA as a key performance measure because its
restructuring was substantially completed by the end of 2010. Segment EBITDA and EBITDAR should not be considered substitutes for results prepared in accordance with U.S. GAAP and should not be considered alternatives to net income (loss) attributable to Delphi, which is the most directly comparable financial measure to EBITDA and EBITDAR that is in accordance with U.S. GAAP. Segment EBITDA and EBITDAR, as determined and measured by Delphi, should also not be compared to similarly titled measures reported by other companies.
Included below are sales and operating data for Delphi’s segments for the three and six months ended March 31,June 30, 2011 and 2010.
| For the three months ended March 31, 2011: | | Electronics
and Safety | | Powertrain
Systems | | Electrical/
Electronic
Architecture | | Thermal
Systems | | Eliminations
and Other | | Total | | |
For the three months ended June 30, 2011: | | | Electronics
and Safety | | Powertrain
Systems | | Electrical/
Electronic
Architecture | | Thermal
Systems | | Eliminations
and Other | | Total | |
| | | (in millions) | | | (in millions) | |
Net sales | | $ | 746 | | | $ | 1,236 | | | $ | 1,578 | | | $ | 437 | | | $ | — | | | $ | 3,997 | | | $ | 747 | | | $ | 1,308 | | | $ | 1,700 | | | $ | 458 | | | $ | — | | | $ | 4,213 | |
Inter-segment net sales | | | 16 | | | | 1 | | | | 35 | | | | 12 | | | | (64 | ) | | | — | | | | 17 | | | | 1 | | | | 41 | | | | 15 | | | | (74 | ) | | | — | |
| | | | | | | | | | | | | | | | | | | | | | | | | | | | | | | | | | | | |
Total net sales | | $ | 762 | | | $ | 1,237 | | | $ | 1,613 | | | $ | 449 | | | $ | (64 | ) | | $ | 3,997 | | | $ | 764 | | | $ | 1,309 | | | $ | 1,741 | | | $ | 473 | | | $ | (74 | ) | | $ | 4,213 | |
| | | | | | | | | | | | | | | | | | | | | | | | | | | | | | | | | | | | |
EBITDA | | $ | 105 | | | $ | 132 | | | $ | 240 | | | $ | 52 | | | $ | — | | | $ | 529 | | | $ | 93 | | | $ | 188 | | | $ | 217 | | | $ | 46 | | | $ | — | | | $ | 544 | |
Depreciation & Amortization | | $ | 27 | | | $ | 47 | | | $ | 32 | | | $ | 11 | | | $ | — | | | $ | 117 | | | $ | 26 | | | $ | 46 | | | $ | 32 | | | $ | 12 | | | $ | — | | | $ | 116 | |
Operating income | | $ | 78 | | | $ | 85 | | | $ | 208 | | | $ | 41 | | | $ | — | | | $ | 412 | | | $ | 67 | | | $ | 142 | | | $ | 185 | | | $ | 34 | | | $ | — | | | $ | 428 | |
Equity income (loss) | | $ | 8 | | | $ | 1 | | | $ | 7 | | | $ | 2 | | | $ | (1 | ) | | $ | 17 | | | $ | — | | | $ | — | | | $ | 4 | | | $ | 3 | | | $ | (1 | ) | | $ | 6 | |
Net income attributable to noncontrolling interest | | $ | — | | | $ | 8 | | | $ | 8 | | | $ | 3 | | | $ | — | | | $ | 19 | | | $ | — | | | $ | 8 | | | $ | 8 | | | $ | 2 | | | $ | — | | | $ | 18 | |
| For the three months ended March 31, 2010: | | Electronics
and Safety | | Powertrain
Systems | | Electrical/
Electronic
Architecture | | Thermal
Systems | | Eliminations
and Other | | Total | | |
For the three months ended June 30, 2010: | | | Electronics
and Safety | | Powertrain
Systems | | Electrical/
Electronic
Architecture | | Thermal
Systems | | Eliminations
and Other | | Total | |
| | | (in millions) | | | (in millions) | |
Net sales | | $ | 698 | | | $ | 969 | | | $ | 1,351 | | | $ | 381 | | | $ | 11 | | | $ | 3,410 | | | $ | 656 | | | $ | 1,015 | | | $ | 1,381 | | | $ | 390 | | | $ | 4 | | | $ | 3,446 | |
Inter-segment net sales | | | 22 | | | | 1 | | | | 27 | | | | 11 | | | | (61 | ) | | | — | | | | 18 | | | | 1 | | | | 29 | | | | 9 | | | | (57 | ) | | | — | |
| | | | | | | | | | | | | | | | | | | | | | | | | | | | | | | | | | | | |
Total net sales | | $ | 720 | | | $ | 970 | | | $ | 1,378 | | | $ | 392 | | | $ | (50 | ) | | $ | 3,410 | | | $ | 674 | | | $ | 1,016 | | | $ | 1,410 | | | $ | 399 | | | $ | (53 | ) | | $ | 3,446 | |
| | | | | | | | | | | | | | | | | | | | | | | | | | | | | | | | | | | | |
EBITDA | | $ | 68 | | | $ | 115 | | | $ | 192 | | | $ | 48 | | | $ | — | | | $ | 423 | | | $ | 59 | | | $ | 113 | | | $ | 181 | | | $ | 51 | | | $ | — | | | $ | 404 | |
EBITDAR | | $ | 74 | | | $ | 128 | | | $ | 205 | | | $ | 49 | | | $ | — | | | $ | 456 | | | $ | 73 | | | $ | 117 | | | $ | 198 | | | $ | 56 | | | $ | — | | | $ | 444 | |
Depreciation & Amortization | | $ | 20 | | | $ | 42 | | | $ | 28 | | | $ | 9 | | | $ | — | | | $ | 99 | | | $ | 25 | | | $ | 42 | | | $ | 26 | | | $ | 11 | | | $ | 3 | | | $ | 107 | |
Operating income | | $ | 48 | | | $ | 73 | | | $ | 164 | | | $ | 39 | | | $ | — | | | $ | 324 | | | $ | 34 | | | $ | 71 | | | $ | 155 | | | $ | 40 | | | $ | (3 | ) | | $ | 297 | |
Equity income (loss) | | $ | (2 | ) | | $ | 1 | | | $ | 1 | | | $ | 1 | | | $ | 1 | | | $ | 2 | | | $ | 1 | | | $ | — | | | $ | 2 | | | $ | 1 | | | $ | 2 | | | $ | 6 | |
Net income attributable to noncontrolling interest | | $ | 1 | | | $ | 7 | | | $ | 8 | | | $ | 4 | | | $ | — | | | $ | 20 | | | $ | — | | | $ | 7 | | | $ | 9 | | | $ | 3 | | | $ | — | | | $ | 19 | |
| | | | | | | | | | | | | | | | | | | | | | | | |
For the six months ended June 30, 2011: | | Electronics
and Safety | | | Powertrain
Systems | | | Electrical/
Electronic
Architecture | | | Thermal
Systems | | | Eliminations
and Other | | | Total | |
| | | (in millions) | |
Net sales | | $ | 1,493 | | | $ | 2,544 | | | $ | 3,278 | | | $ | 895 | | | $ | — | | | $ | 8,210 | |
Inter-segment net sales | | | 33 | | | | 2 | | | | 76 | | | | 27 | | | | (138 | ) | | | — | |
| | | | | | | | | | | | | | | | | | | | | | | | |
Total net sales | | $ | 1,526 | | | $ | 2,546 | | | $ | 3,354 | | | $ | 922 | | | $ | (138 | ) | | $ | 8,210 | |
| | | | | | | | | | | | | | | | | | | | | | | | |
EBITDA | | $ | 198 | | | $ | 320 | | | $ | 457 | | | $ | 98 | | | $ | — | | | $ | 1,073 | |
Depreciation & Amortization | | $ | 53 | | | $ | 93 | | | $ | 64 | | | $ | 23 | | | $ | — | | | $ | 233 | |
Operating income | | $ | 145 | | | $ | 227 | | | $ | 393 | | | $ | 75 | | | $ | — | | | $ | 840 | |
Equity income (loss) | | $ | 8 | | | $ | 1 | | | $ | 11 | | | $ | 5 | | | $ | (2 | ) | | $ | 23 | |
Net income attributable to noncontrolling interests | | $ | — | | | $ | 16 | | | $ | 16 | | | $ | 5 | | | $ | — | | | $ | 37 | |
| | | | | | |
For the six months ended June 30, 2010: | | Electronics
and Safety | | | Powertrain
Systems | | | Electrical/
Electronic
Architecture | | | Thermal
Systems | | | Eliminations
and Other | | | Total | |
| | | (in millions) | |
Net sales | | $ | 1,354 | | | $ | 1,984 | | | $ | 2,732 | | | $ | 771 | | | $ | 15 | | | $ | 6,856 | |
Inter-segment net sales | | | 40 | | | | 2 | | | | 56 | | | | 20 | | | | (118 | ) | | | — | |
| | | | | | | | | | | | | | | | | | | | | | | | |
Total net sales | | $ | 1,394 | | | $ | 1,986 | | | $ | 2,788 | | | $ | 791 | | | $ | (103 | ) | | $ | 6,856 | |
| | | | | | | | | | | | | | | | | | | | | | | | |
EBITDA | | $ | 127 | | | $ | 228 | | | $ | 373 | | | $ | 99 | | | $ | — | | | $ | 827 | |
EBITDAR | | $ | 147 | | | $ | 245 | | | $ | 403 | | | $ | 105 | | | $ | — | | | $ | 900 | |
Depreciation & Amortization | | $ | 45 | | | $ | 84 | | | $ | 54 | | | $ | 20 | | | $ | 3 | | | $ | 206 | |
Operating income (loss) | | $ | 82 | | | $ | 144 | | | $ | 319 | | | $ | 79 | | | $ | (3 | ) | | $ | 621 | |
Equity income (loss) | | $ | (1 | ) | | $ | 1 | | | $ | 3 | | | $ | 2 | | | $ | 3 | | | $ | 8 | |
Net income attributable to noncontrolling interests | | $ | 1 | | | $ | 14 | | | $ | 17 | | | $ | 7 | | | $ | — | | | $ | 39 | |
The reconciliation of EBITDA to net income attributable to Delphi for the three and six months ended March 31,June 30, 2011 is as follows:
| For the three months ended March 31, 2011: | | Electronics
and Safety | | Powertrain
Systems | | Electrical/
Electronic
Architecture | | Thermal
Systems | | Eliminations
and Other | | Total | | |
For the three months ended June 30, 2011: | | | Electronics
and Safety | | Powertrain
Systems | | Electrical/
Electronic
Architecture | | Thermal
Systems | | Eliminations
and Other | | Total | |
| | | (in millions) | | | (in millions) | |
EBITDA | | $ | 105 | | | $ | 132 | | | $ | 240 | | | $ | 52 | | | $ | — | | | $ | 529 | | | $ | 93 | | | $ | 188 | | | $ | 217 | | | $ | 46 | | | $ | — | | | $ | 544 | |
Depreciation and amortization | | | (27 | ) | | | (47 | ) | | | (32 | ) | | | (11 | ) | | | — | | | | (117 | ) | | | (26 | ) | | | (46 | ) | | | (32 | ) | | | (12 | ) | | | — | | | | (116 | ) |
| | | | | | | | | | | | | | | | | | | | | | | | | | | | | | | | | | | | |
Operating income | | $ | 78 | | | $ | 85 | | | $ | 208 | | | $ | 41 | | | $ | — | | | $ | 412 | | | $ | 67 | | | $ | 142 | | | $ | 185 | | | $ | 34 | | | $ | — | | | | 428 | |
| | | | | | | | | | | | | | | | | | | | | | | | | | | | | | | | | | |
Interest expense | | | | | | | | | | | | | (6 | ) | | | | | | | | | | | | | (41 | ) |
Other income, net | | | | | | | | | | | | | 3 | | | | | | | | | | | | | | (4 | ) |
| | | | | | | | | | | | | | | | | | | | | | | | | | |
Income before income taxes and equity income | | | | | | | | | | | | | 409 | | | | | | | | | | | | | | 383 | |
Income tax expense | | | | | | | | | | | | | (116 | ) | | | | | | | | | | | | | (73 | ) |
Equity income | | | | | | | | | | | | | 17 | | | | | | | | | | | | | | 6 | |
| | | | | | | | | | | | | | | | | | | | | | | | | | |
Net income | | | | | | | | | | | | $ | 310 | | | | | | | | | | | | | $ | 316 | |
Net income attributable to noncontrolling interest | | | | | | | | | | | | | 19 | | | | | | | | | | | | | | 18 | |
| | | | | | | | | | | | | | | | | | | | | | | | | | |
Net income attributable to Delphi | | | | | | | | | | | | $ | 291 | | | | | | | | | | | | | $ | 298 | |
| | | | | | | | | | | | | | | | | | | | | | | | | | |
| | | | | | | | | | | | | | | | | | | | | | | | |
For the six months ended June 30, 2011: | | Electronics
and Safety | | | Powertrain
Systems | | | Electrical/
Electronic
Architecture | | | Thermal
Systems | | | Eliminations
and Other | | | Total | |
| | | (in millions) | |
EBITDA | | $ | 198 | | | $ | 320 | | | $ | 457 | | | $ | 98 | | | $ | — | | | $ | 1,073 | |
Depreciation and amortization | | | (53 | ) | | | (93 | ) | | | (64 | ) | | | (23 | ) | | | — | | | | (233 | ) |
| | | | | | | | | | | | | | | | | | | | | | | | |
Operating income | | $ | 145 | | | $ | 227 | | | $ | 393 | | | $ | 75 | | | $ | — | | | | 840 | |
| | | | | | | | | | | | | | | | | | | | | | | | |
Interest expense | | | | | | | | | | | | | | | | | | | | | | | (47 | ) |
Other expense, net | | | | | | | | | | | | | | | | | | | | | | | (1 | ) |
| | | | | | | | | | | | | | | | | | | | | | | | |
Income before income taxes and equity income | | | | | | | | | | | | | | | | | | | | | | | 792 | |
Income tax expense | | | | | | | | | | | | | | | | | | | | | | | (189 | ) |
Equity income | | | | | | | | | | | | | | | | | | | | | | | 23 | |
| | | | | | | | | | | | | | | | | | | | | | | | |
Net income | | | | | | | | | | | | | | | | | | | | | | $ | 626 | |
Net income attributable to noncontrolling interests | | | | | | | | | | | | | | | | | | | | | | | 37 | |
| | | | | | | | | | | | | | | | | | | | | | | | |
Net income attributable to Delphi | | | | | | | | | | | | | | | | | | | | | | $ | 589 | |
| | | | | | | | | | | | | | | | | | | | | | | | |
For the three and six months ended March 31,June 30, 2010, the reconciliation of EBITDAR to EBITDA includes other restructuring costs related to 1) the implementation of projects aimed at reducing the cost and improving the functionality of information technology systems to support finance, manufacturing and product development initiatives, 2) certain plant consolidations and closures costs, and 3) continued consolidation of many staff administrative functions into a global business service group,activities, and 4) employee benefit plan settlements in Mexico. The reconciliation of EBITDA to net income attributable to Delphi for the three and six months ended March 31,June 30, 2010 is as follows:
| For the three months ended March 31, 2010: | | Electronics
and Safety | | Powertrain
Systems | | Electrical/
Electronic
Architecture | | Thermal
Systems | | Eliminations
and Other | | Total | | |
For the three months ended June 30, 2010: | | | Electronics
and Safety | | Powertrain
Systems | | Electrical/
Electronic
Architecture | | Thermal
Systems | | Eliminations
and Other | | Total | |
| | | (in millions) | | | (in millions) | |
EBITDAR | | $ | 74 | | | $ | 128 | | | $ | 205 | | | $ | 49 | | | $ | — | | | $ | 456 | | | $ | 73 | | | $ | 117 | | | $ | 198 | | | $ | 56 | | | $ | — | | | $ | 444 | |
Restructuring charges: | | | | | | | | | | | | | | | | | | | | | | | | |
Employee termination benefits and other exit costs | | | (2) | | | | (12) | | | | (11) | | | | (1) | | | | — | | | | (26) | | | | (11) | | | | (1) | | | | (14) | | | | (4) | | | | — | | | | (30) | |
Other restructuring costs | | | (4) | | | | (1) | | | | (2) | | | | — | | | | — | | | | (7) | | | | (3) | | | | (3) | | | | (3) | | | | (1) | | | | — | | | | (10) | |
| | | | | | | | | | | | | | | | | | | | | | | | | | | | | | | | | | | | |
EBITDA | | $ | 68 | | | $ | 115 | | | $ | 192 | | | $ | 48 | | | $ | — | | | $ | 423 | | | $ | 59 | | | $ | 113 | | | $ | 181 | | | $ | 51 | | | $ | — | | | $ | 404 | |
| | | | | | | | | | | | | | | | | | | | | | | | | | | | | | | | | | | | |
Depreciation and amortization | | | (20) | | | | (42) | | | | (28) | | | | (9) | | | | — | | | | (99) | | | | (25) | | | | (42) | | | | (26) | | | | (11) | | | | (3) | | | | (107) | |
| | | | | | | | | | | | | | | | | | | | | | | | | | | | | | | | | | | | |
Operating income | | $ | 48 | | | $ | 73 | | | $ | 164 | | | $ | 39 | | | $ | — | | | $ | 324 | | |
Operating income (loss) | | | $ | 34 | | | $ | 71 | | | $ | 155 | | | $ | 40 | | | $ | (3) | | | $ | 297 | |
| | | | | | | | | | | | | | | | | | | | | | | | | | | | | | | | | | | |
Interest expense | | | | | | | | | | | | | (8) | | | | | | | | | | | | | | (8) | |
Other income, net | | | | | | | | | | | | | 2 | | | | | | | | | | | | | | — | |
| | | | | | | | | | | | | | | | | | | | | | | | | | |
Income before income taxes and equity income | | | | | | | | | | | | | 318 | | | | | | | | | | | | | | 289 | |
Income tax expense | | | | | | | | | | | | | (85) | | | | | | | | | | | | | | (62) | |
Equity income | | | | | | | | | | | | | 2 | | | | | | | | | | | | | | 6 | |
| | | | | | | | | | | | | | | | | | | | | | | | | | |
Net income | | | | | | | | | | | | $ | 235 | | | | | | | | | | | | | $ | 233 | |
Net income attributable to noncontrolling interest | | | | | | | | | | | | | 20 | | |
Net income attributable to noncontrolling interests | | | | | | | | | | | | | | 19 | |
| | | | | | | | | | | | | | | | | | | | | | | | | | |
Net income attributable to Delphi | | | | | | | | | | | | $ | 215 | | | | | | | | | | | | | $ | 214 | |
| | | | | | | | | | | | | | | | | | | | | | | | | | |
| | | | | | | | | | | | | | | | | | | | | | | | |
For the six months ended June 30, 2010: | | Electronics
and Safety | | | Powertrain
Systems | | | Electrical/
Electronic
Architecture | | | Thermal
Systems | | | Eliminations
and Other | | | Total | |
| | | (in millions) | |
EBITDAR | | $ | 147 | | | $ | 245 | | | $ | 403 | | | $ | 105 | | | $ | — | | | $ | 900 | |
Restructuring charges: | | | | | | | | | | | | | | | | | | | | | | | | |
Employee termination benefits and other exit costs | | | (13 | ) | | | (13 | ) | | | (25 | ) | | | (5 | ) | | | — | | | | (56 | ) |
Other restructuring costs | | | (7 | ) | | | (4 | ) | | | (5 | ) | | | (1 | ) | | | — | | | | (17 | ) |
| | | | | | | | | | | | | | | | | | | | | | | | |
EBITDA | | $ | 127 | | | $ | 228 | | | $ | 373 | | | $ | 99 | | | $ | — | | | $ | 827 | |
| | | | | | | | | | | | | | | | | | | | | | | | |
Depreciation and amortization | | | (45 | ) | | | (84 | ) | | | (54 | ) | | | (20 | ) | | | (3 | ) | | | (206 | ) |
| | | | | | | | | | | | | | | | | | | | | | | | |
Operating income (loss) | | $ | 82 | | | $ | 144 | | | $ | 319 | | | $ | 79 | | | $ | (3 | ) | | $ | 621 | |
| | | | | | | | | | | | | | | | | | | | | | | | |
Interest expense | | | | | | | | | | | | | | | | | | | | | | | (16 | ) |
Other income, net | | | | | | | | | | | | | | | | | | | | | | | 2 | |
| | | | | | | | | | | | | | | | | | | | | | | | |
Income before income taxes and equity income | | | | | | | | | | | | | | | | | | | | | | | 607 | |
Income tax expense | | | | | | | | | | | | | | | | | | | | | | | (147 | ) |
Equity income | | | | | | | | | | | | | | | | | | | | | | | 8 | |
| | | | | | | | | | | | | | | | | | | | | | | | |
Net income | | | | | | | | | | | | | | | | | | | | | | $ | 468 | |
Net income attributable to noncontrolling interests | | | | | | | | | | | | | | | | | | | | | | | 39 | |
| | | | | | | | | | | | | | | | | | | | | | | | |
Net income attributable to Delphi | | | | | | | | | | | | | | | | | | | | | | $ | 429 | |
| | | | | | | | | | | | | | | | | | | | | | | | |
Included below is balance sheet data for Delphi’s segments as of March 31,June 30, 2011 and December 31, 2010.
| | | | Electronics
and Safety | | Powertrain
Systems | | Electrical/
Electronic
Architecture | | Thermal
Systems | | Eliminations
and Other | | Total | | | Electronics
and Safety | | Powertrain
Systems | | Electrical/
Electronic
Architecture | | Thermal
Systems | | Eliminations
and Other | | Total | |
| | | (in millions) | | | (in millions) | |
Balance as of: | | | | | | | | | | | | | | | | | | | | | | | | |
March 31, 2011 Segment assets | | $ | 2,047 | | | $ | 4,080 | | | $ | 3,650 | | | $ | 984 | | | $ | (1,037 | ) | | $ | 9,724 | | |
June 30, 2011 Segment assets | | | $ | 1,963 | | | $ | 4,213 | | | $ | 4,064 | | | $ | 1,015 | | | $ | (1,628 | ) | | $ | 9,627 | |
December 31, 2010 Segment assets | | $ | 1,905 | | | $ | 3,718 | | | $ | 3,336 | | | $ | 898 | | | $ | 1,225 | | | $ | 11,082 | | | $ | 1,905 | | | $ | 3,718 | | | $ | 3,336 | | | $ | 898 | | | $ | 1,225 | | | $ | 11,082 | |
On May 17,July 12, 2011, we entered into a modification to the CreditRevised LLP Agreement with a syndicate of lenders to make certain amendments, including (a) increasingwas amended and restated by the amount of the Tranche A Term Loan from $250 million to $258 millionFourth Amended and the amount of commitments under the revolving facility from $500 million to $1.2 billion, (b) reducing the amount of the Tranche B Term Loan from $2.25 billion to $950 million and (c) reducing certain interest rates applicable to the Credit Facilities.
The modification to the CreditRestated Limited Liability Partnership Agreement adjusts the LIBOR interest rate option as follows: LIBOR plus (i) with respect to the revolving facility and the Tranche A Term Loan, 2.75% per annum or (ii) with respect to the Tranche B Term Loan, 2.50% per annum. The Tranche B Term Loan includes a LIBOR floor of 1.00%. Additionally, the discount related to the Tranche B term loan was reduced to 0.25%.
Additionally, on May 17, 2011, Delphi Corporation, a wholly-owned U.S. subsidiary of Delphi Automotive LLP issued $500 million of 5.875% senior notes due 2019 and $500 million of 6.125% senior notes due 2021 (the “Senior Notes”“Fourth LLP Agreement”) in. The Fourth LLP Agreement was undertaken to further position the Company for a transaction exempt from registration under Rule 144Apotential initial public offering. Key provisions of the Securities Act. The Senior Notes are fullyFourth LLP Agreement include (i) creating drag-along rights that require, if holders of a majority of Class B membership interests request, that all Class B membership interest holders sell a portion of their holdings in an initial public offering, with the Company paying for the cost of the underwriting spread; (ii) establishing a pricing mechanism for the drag-along; and unconditionally guaranteed, jointly and severally, by Delphi Automotive LLP and certain(iii) providing a 180 day lockup in an initial public offering for holders of its existing and future subsidiaries. Interest is payable semi-annually on May 15 and November 15the Class B membership interests with a 90 day early release for 30% of each year, beginning on November 15, 2011. Interest accrues from May 17, 2011. The net proceeds of approximately $1.0 billion and cash on hand were used to pay down amounts outstanding under the Credit Agreement.their shares.
SHARES
DELPHI AUTOMOTIVE PLC
Ordinary Shares

| | | | |
| Goldman, Sachs & Co. | | J.P. Morgan |
| |
| BofA Merrill Lynch | | Barclays Capital |
| | | | |
| |
Citi | | Deutsche Bank Securities |
| |
| Morgan Stanley | | |
| | | | | | | | |
| Baird | | Credit Suisse | | Lazard Capital Markets | | | UBS Investment Bank | |
| | | | | | | | |
| CRT Capital Group LLC | | Guggenheim Securities | | Houlihan Lokey | | | RBC Capital Markets | |
| | | | | | | | |
| Scotia Capital | | Ticonderoga Securities | | The Williams Capital Group, L.P. | | | UniCredit Capital Markets | |
Through and including , 2011 (the 25th day after the date of this prospectus), all dealers effecting transactions in these securities, whether or not participating in this offering, may be required to deliver a prospectus. This is in addition to a dealer’s obligation to deliver a prospectus when acting as an underwriter and with respect to an unsold allotment or subscription.
PART II
INFORMATION NOT REQUIRED IN PROSPECTUS
Item 13. Other Expenses of Issuance and Distribution.
| | | | |
| | | Amount To
Be Paid | |
Registration fee | | $ | 11,610 | |
FINRA filing fee | | | 10,500 | |
Listing fees | | | * | |
Transfer agent’s fees | | | * | |
Printing and engraving expenses | | | * | |
Legal fees and expenses | | | * | |
Accounting fees and expenses | | | * | |
Blue Sky fees and expenses | | | * | |
Miscellaneous | | | * | |
| | | | |
Total | | $ | * | |
| | | | |
* To be filed by amendment
Each of the amounts set forth above, other than the Registration fee and the FINRA filing fee, is an estimate.
Item 14. Indemnification of Directors and Officers.
Under the Registrant’s Articles of Association, the Registrant is required to indemnify every present and former officer of the Registrant out of the assets of the Registrant against any loss or liability incurred by such officer by reason of being or having been such an officer. The extent of such indemnities shall be limited in accordance with the provisions of the Companies (Jersey) Law 1991, as amended.
Item 15. Recent Sales of Unregistered Securities.
The Registrant, a Jersey public limited company, was formed on May 19, 2011. Since its formation, the Registrant has sold the following securities without registration under the Securities Act of 1933:
On May 19, 2011, the Registrant issued 2 ordinary shares for aggregate consideration of $0.02 pursuant to Section 4(2) under the Securities Act of 1933.
Item 16. Exhibits and Financial Statement Schedules.
| | (a) | The following exhibits are filed as part of this Registration Statement: |
II-1
| | |
Exhibit Number | | Description |
| 1.1 | | Form of Underwriting Agreement** |
| 2.1 | | Master Disposition Agreement among Delphi Corporation, GM Components Holdings, LLC, General Motors Company, Motors Liquidation Company (fka General Motors Corporation), DIP Holdco 3, LLC, and the other sellers and other buyers party thereto, dated July 26, 2009 (filed with the Registration Statement on Form S-1 (File No. 333-174493) of Delphi Automotive PLC on June 30, 2011)2009(2) |
| 3.1 | | Articles of Association** |
| 3.2 | | Memorandum of Association** |
| 4.1 | | Form of Ordinary Share Certificate** |
| 4.2 | | Senior Notes Indenture, dated as of May 17, 2011, among Delphi Corporation, the guarantors party thereto, Wilmington Trust Company, as trustee, and Deutsche Bank Company Americas, as registrar, paying agent and authenticating agent (including forms of notes) (filed with the Registration Statement on Form S-1 (File No. 333-174493)(2) |
| 4.3 | | Fourth Amended and Restated Limited Liability Partnership Agreement of Delphi Automotive PLC on June 30, 2011)LLP dated as of July 12, 2011* |
| 5.1 | | Opinion of Carey Olsen** |
| 10.1 | | Redemption Agreement between Delphi Automotive LLP and General Motors Holding LLC, dated as of March 31, 2011 (filed with the Registration Statement on Form S-1 (File No. 333-174493) of Delphi Automotive PLC on June 30, 2011)2011(2) |
| 10.2 | | Rights Modification Agreement dated as of March 31, 2011, by and among Delphi Automotive LLP and each of the holders of Class B membership interests party thereto (filed with the Registration Statement on Form S-1 (File No. 333-174493) of Delphi Automotive PLC on June 30, 2011)thereto(2) |
| 10.3 | | Amended and Restated Credit Agreement among Delphi Automotive LLP, as Parent, Delphi Holdings S.A.R.L., as Intermediate Holdco, Delphi Corporation, as Borrower, the Lenders party thereto, JPMorgan Chase Bank, N.A., as Administrative Agent, Citibank, N.A., as Syndication Agent, Bank of America, N.A., Barclays Bank plc and Deutsche Bank Trust Company Americas, as Co-Documentation Agents, and J.P. Morgan Securities LLC, as Sole Bookrunner and Sole Lead Arranger, dated as of May 17, 2011 (filed with the Registration Statement on Form S-1 (File No. 333-174493) of Delphi Automotive PLC on June 30, 2011)2011(2) |
| 10.4 | | Form of Registration Rights Agreement** |
| 10.5 | | Delphi Automotive LLP Board of Managers 2010 Class E-1 Interest Incentive Plan** |
| 10.6 | | Form of Restricted Interest Grant Notice and Agreement** |
| 10.7 | | Delphi Automotive LLP 2010 Management Value Creation Plan** |
| 10.8 | | Form of Non-Officer Executive Participation Agreement pursuant to the Delphi Automotive LLP 2010 Management Value Creation Plan** |
| 10.9 | | Form of Officer Participation Agreement pursuant to the Delphi Automotive LLP 2010 Management Value Creation Plan** |
| 10.10 | | Form of Confidentiality and Noninterference Agreement pursuant to the Delphi Automotive LLP 2010 Management Value Creation Plan** |
| 10.11 | | Form of Delphi Automotive LLP Letter re: Special Bonus for Initial Public Offering or Sale of the Company** |
| 10.12 | | Delphi LLC Annual Incentive Plan (filed with the Registration Statement on Form S-1 (File No. 333-174493) of Delphi Automotive PLC on June 30, 2011)Plan(2) |
| 10.13 | | Delphi Corporation Supplemental Executive Retirement Program (filed with the Registration Statement on Form S-1 (File No. 333-174493) of Delphi Automotive PLC on June 30, 2011)Program(2) |
| 10.14 | | Delphi Corporation Salaried Retirement Equalization Savings Program (filed with the Registration Statement on Form S-1 (File No. 333-174493) of Delphi Automotive PLC on June 30, 2011)Program(2) |
II-2
| | |
Exhibit Number | | Description |
| 10.15 | | Delphi Automotive PLC Long Term Incentive Plan** |
| 10.16 | | Offer letter for Rodney O’Neal, dated October 2, 2009 (filed with the Registration Statement on Form S-1 (File No. 333-174493) of Delphi Automotive PLC on June 30, 2011)2009(2) |
| 10.17 | | Offer letter for James A. Bertrand, dated October 2, 2009 (filed with the Registration Statement on Form S-1 (File No. 333-174493) of Delphi Automotive PLC on June 30, 2011)2009(2) |
| 10.18 | | Offer letter for Ronald M. Pirtle, dated October 2, 2009 (filed with the Registration Statement on Form S-1 (File No. 333-174493) of Delphi Automotive PLC on June 30, 2011)2009(2) |
| 10.19 | | Offer letter for James A. Spencer, dated October 2, 2009 (filed with the Registration Statement on Form S-1 (File No. 333-174493) of Delphi Automotive PLC on June 30, 2011)2009(2) |
| 10.20 | | Offer letter for Keith D. Stipp, dated October 2, 2009 (filed with the Registration Statement on Form S-1 (File No. 333-174493) of Delphi Automotive PLC on June 30, 2011)2009(2) |
| 10.21 | | Offer letter for John D. Sheehan, dated October 2, 2009 (filed with the Registration Statement on Form S-1 (File No. 333-174493) of Delphi Automotive PLC on June 30, 2011)2009(2) |
| 10.22 | | Offer letter for Kevin P. Clark, dated June 10, 2010 (filed with the Registration Statement on Form S-1 (File No. 333-174493) of Delphi Automotive PLC on June 30, 2011)2010(2) |
| 10.23 | | Executive Release of Claims, Separation, Non-Solicitation and Non-Compete Agreement between Delphi Corporation and John D. Sheehan, dated February 22, 2010 (filed with the Registration Statement on Form S-1 (File No. 333-174493) of Delphi Automotive PLC on June 30, 2011)2010(2) |
| 21.1 | | Subsidiaries of the Registrant** |
| 23.1 | | Consent of Ernst & Young LLP* |
| 23.2 | | Consent of Carey Olsen (included in Exhibit 5.1) |
| 23.3 | | Consent of J.D. Power & Associates (filed with the Registration Statement on Form S-1 (File No. 333-174493) of Delphi Automotive PLC on June 30, 2011)Associates* |
| 24.1 | | Power of Attorney (includedAttorney(1) |
| 99.1 | | Consent of John A. Krol** |
| 99.2 | | Consent of Gary L. Cowger** |
| 99.3 | | Consent of Nicholas M. Donofrio** |
| 99.4 | | Consent of Mark P. Frissora** |
| 99.5 | | Consent of Rajiv L. Gupta** |
| 99.6 | | Consent of J. Randall MacDonald** |
| 99.7 | | Consent of Sean O. Mahoney** |
| 99.8 | | Consent of Michael McNamara** |
| 99.9 | | Consent of Rodney O’Neal** |
| 99.10 | | Consent of Thomas W. Sidlik** |
| 99.11 | | Consent of Bernd Wiedemann** |
| 99.12 | | Consent of Lawrence A. Zimmerman** |
| ** | To be filed by amendment. |
| (1) | Included on signature page to the Registration Statement on Form S-1 (File No. 333-174493) of Delphi Automotive PLC filed on May 25, 2011)2011. |
** | To be filed by amendment.with the Registration Statement on Form S-1 (File No. 333-174493) of Delphi Automotive PLC on June 30, 2011. |
II-3
| | (b) | The following financial statement schedule is filed as part of this Registration Statement: |
| | | | |
| | | Page No. | |
| Valuation and qualifying accounts and reserves schedule for the year ended December 31, 2010, the period from August 19 to December 31, 2009, the period from January 1 to October 6, 2009 and the year ended December 31, 2008. | | | F-76F-77 | |
Item 17. Undertakings
The undersigned hereby undertakes:
| | (a) | The undersigned registrant hereby undertakes to provide to the underwriters at the closing specified in the underwriting agreement certificates in such denominations and registered in such names as required by the underwriters to permit prompt delivery to each purchaser. |
| | (b) | Insofar as indemnification for liabilities arising under the Securities Act of 1933 may be permitted to directors, officers and controlling persons of the registrant pursuant to the provisions referenced in Item 14 of this Registration Statement, or otherwise, the registrant has been advised that in the opinion of the Securities and Exchange Commission such indemnification is against public policy as expressed in the Act and is, therefore, unenforceable. In the event that a claim for indemnification against such liabilities (other than the payment by the registrant of expenses incurred or paid by a director, officer, or controlling person of the registrant in the successful defense of any action, suit or proceeding) is asserted by such director, officer or controlling person in connection with the securities being registered hereunder, the registrant will, unless in the opinion of its counsel the matter has been settled by controlling precedent, submit to a court of appropriate jurisdiction the question of whether such indemnification by it is against public policy as expressed in the Act and will be governed by the final adjudication of such issue. |
| | (c) | The undersigned registrant hereby undertakes that: |
| | (1) | For purposes of determining any liability under the Securities Act of 1933, the information omitted from the form of prospectus filed as part of this Registration Statement in reliance upon Rule 430A and contained in a form of prospectus filed by the Registrant pursuant to Rule 424(b)(1) or (4) or 497(h) under the Securities Act shall be deemed to be part of this Registration Statement as of the time it was declared effective. |
| | (2) | For the purpose of determining any liability under the Securities Act of 1933, each post-effective amendment that contains a form of prospectus shall be deemed to be a new Registration Statement relating to the securities offered therein, and the offering of such securities at that time shall be deemed to be the initial bona fide offering thereof. |
II-4
SIGNATURES
Pursuant to the requirements of the Securities Act of 1933, the Registrant has duly caused this Registration Statement to be signed on its behalf by the undersigned, thereunto duly authorized, in the City of Troy, State of Michigan, on the 12th1st day of July,August, 2011.
| | |
| DELPHI AUTOMOTIVE PLC |
| |
| By: | | /s/ David M. Sherbin |
| | Name: David M. Sherbin |
| | Title: Director |
Pursuant to the requirements of the Securities Act of 1933, as amended, this registration statement has been signed by the following persons in the capacities and on the dates indicated.
| | | | |
Signature | | Title | | Date |
| | |
* | | Principal Executive Officer | | July 12,August 1, 2011 |
| Rodney O’Neal | | | | |
| | |
* | | Principal Financial Officer and Director | | July 12,August 1, 2011 |
| Kevin P. Clark | | | | |
| | |
* | | Principal Accounting Officer | | July 12,August 1, 2011 |
| Allan J. Brazier | | | | |
| | |
/s/ David M. Sherbin | | Director | | July 12,August 1, 2011 |
| David M. Sherbin | | | | |
| * | The undersigned, by signing his name hereto, does execute this Registration Statement on behalf of the persons identified above pursuant to a power of attorney previously filed in connection with this Registration Statement. |
| | |
| |
| By: | | /s/ David M. Sherbin |
| | David M. Sherbin Attorney-in-Fact |
II-5