As filed with the Securities and Exchange Commission on December 29, 2011March 14, 2012
Registration No. 333-176603
UNITED STATES
SECURITIES AND EXCHANGE COMMISSION
Washington, D.C. 20549
Amendment No. 34
to
FORM S-1
REGISTRATION STATEMENT
UNDER
THE SECURITIES ACT OF 1933
Forum Energy Technologies, Inc.
(Exact name of registrant as specified in its charter)
| Delaware | 3533 | 61-1488595 | ||
(State or other jurisdiction of incorporation or organization) | (Primary Standard Industrial Classification Code Number) | (I.R.S. Employer Identification No.) |
920 Memorial City Way, Suite 800
Houston, Texas 77024
(281) 949-2500
(Address, including zip code, and telephone number, including area code, of registrant’s principal executive offices)
James L. McCulloch
Senior Vice President, General Counsel and Secretary
Forum Energy Technologies, Inc.
920 Memorial City Way, Suite 800
Houston, Texas 77024
(281) 949-2500
(Name, address, including zip code, and telephone number, including area code, of agent for service)
Copies to:
W. Matthew Strock Sarah K. Morgan Vinson & Elkins L.L.P. 1001 Fannin, Suite 2500 Houston, Texas 77002-6760 (713) 758-2222 | J. David Kirkland, Jr. Tull R. Florey Baker Botts L.L.P. 910 Louisiana Houston, Texas 77002-4995 (713) 229-1234 |
Approximate date of commencement of proposed sale to the public: As soon as practicable after the effective date of this Registration Statement.
If any of the securities being registered on this Form are to be offered on a delayed or continuous basis pursuant to Rule 415 under the Securities Act of 1933 check the following box:¨
If this Form is filed to register additional securities for an offering pursuant to Rule 462(b) under the Securities Act, please check the following box and list the Securities Act registration statement number of the earlier effective registration statement for the same offering.¨
If this Form is a post-effective amendment filed pursuant to Rule 462(c) under the Securities Act, check the following box and list the Securities Act registration statement number of the earlier effective registration statement for the same offering.¨
If this Form is a post-effective amendment filed pursuant to Rule 462(d) under the Securities Act, check the following box and list the Securities Act registration statement number of the earlier effective registration statement for the same offering.¨
Indicate by check mark whether the registrant is a large accelerated filer, an accelerated filer, a non-accelerated filer, or a smaller reporting company. See the definitions of “large accelerated filer,” “accelerated filer” and “smaller reporting company” in Rule 12b-2 of the Exchange Act.
Large accelerated filer ¨ | Accelerated filer ¨ | Non-accelerated filer x | Smaller reporting company ¨ | |||
| (Do not check if a smaller reporting company) |
The registrant hereby amends this Registration Statement on such date or dates as may be necessary to delay its effective date until the registrant shall file a further amendment which specifically states that this Registration Statement shall thereafter become effective in accordance with Section 8(a) of the Securities Act of 1933 or until this Registration Statement shall become effective on such date as the Securities and Exchange Commission, acting pursuant to said Section 8(a), may determine.
The information in this prospectus is not complete and may be changed. We and the selling stockholders may not sell these securities until the registration statement filed with the Securities and Exchange Commission is effective. This prospectus is not an offer to sell these securities and we and the selling stockholders are not soliciting offers to buy these securities in any state where the offer or sale is not permitted.
Subject to completion, dated December 29, 2011March 14, 2012
Prospectus
shares
Forum Energy Technologies, Inc.
Common stock
Forum Energy Technologies, Inc. is offering shares of its common stock and the selling stockholders are offering shares of common stock. This is an initial public offering of our common stock. We anticipate that the initial public offering price of our common stock will be between $ and $ per share. In addition, we intend to offer to sell $50 million of shares of our common stock in a private placement to a private equity firm concurrently with this offering.
We have been approved to list our common stock on the New York Stock Exchange under the symbol “FET.”
| Per share | Total | |||||||
Initial public offering price | $ | $ | ||||||
Underwriting discounts and commissions | $ | $ | ||||||
Proceeds to Forum Energy Technologies, Inc., before expenses | $ | $ | ||||||
Proceeds to selling stockholders, before expenses | $ | $ | ||||||
Forum Energy Technologies, Inc. has granted the underwriters an option for a period of 30 days to purchase up to additional shares of common stock and the selling stockholders have granted the underwriters an option for a period of 30 days to purchase up to additional shares of common stock. We will not receive any proceeds from the sale of shares by the selling stockholders.
Delivery of the shares of common stock is expected to be made on or about , 2012.
Investing in our common stock involves risks. See “Risk factors” beginning on page 22.23.
Neither the Securities and Exchange Commission nor any other state securities commission has approved or disapproved of these securities, or determined if this prospectus is truthful or complete. Any representation to the contrary is a criminal offense.
| J.P. Morgan | ||||||||
| BofA Merrill Lynch | ||||||||
| Credit Suisse | ||||||||
| Citigroup | ||||||||
| Deutsche Bank Securities | ||||||||
Senior Co-Managers
Simmons & Company International | Tudor, Pickering, Holt & Co. |
Junior Co-Managers
Capital One Southcoast | Dahlman Rose & Company | FBR | ||
Howard Weil Incorporated | Johnson Rice & Company L.L.C. |
, 2012
| 1 | ||||
| 16 | ||||
Management’s discussion and analysis of financial condition and results of operations | ||||
| 169 | ||||
| 171 | ||||
| 178 | ||||
Material U.S. federal income and estate tax considerations to non-U.S. holders | 180 | |||
| 184 | ||||
| 192 | ||||
| 192 | ||||
| 193 | ||||
| F-1 | ||||
| A-1 | ||||
You should rely only on the information contained in this prospectus and any free writing prospectus prepared by or on behalf of us or to which we have referred you. Neither we nor any of the selling stockholders has authorized anyone to provide you with information different from that contained in this prospectus and any free writing prospectus. We and the selling stockholders are offering to sell shares of common stock and seeking offers to buy shares of common stock only in jurisdictions where offers and sales are permitted. The information in this prospectus is accurate only as of the date of this prospectus, regardless of the time of delivery of this prospectus or any sale of the common stock.
Until , 2012, all dealers that buy, sell or trade our common stock, whether or not participating in this offering, may be required to deliver a prospectus. This requirement is in addition to the dealers’ obligation to deliver a prospectus when acting as underwriters and with respect to their unsold allotments or subscriptions.
i
Industry and market data
The market data and certain other statistical information used throughout this prospectus are based on independent industry publications, government publications or other published independent sources. Some data is also based on our good faith estimates and our management’s understanding of industry conditions.
ii
This summary provides a brief overview of information contained elsewhere in this prospectus. Because it is abbreviated, this summary does not contain all of the information that you should consider before investing in our common stock. You should read the entire prospectus carefully before making an investment decision, including the information presented under the headings “Risk factors,” “Cautionary note regarding forward-looking statements” and “Management’s discussion and analysis of financial condition and results of operations” and the historical consolidated financial statements and related notes thereto included elsewhere in this prospectus. Unless otherwise indicated, information presented in this prospectus assumes that the underwriters’ option to purchase additional common stock is not exercised. We have provided definitions for certain industry terms used in this prospectus in the “Glossary” beginning on page A-1 of this prospectus.
In this prospectus, unless the context otherwise requires, the terms “we,” “us,” “our” and the “Company” refer to Forum Energy Technologies, Inc. and its subsidiaries. In this prospectus, unless the context otherwise requires, the term “SCF” refers to SCF-V, L.P., SCF-VI, L.P. and SCF-VII, L.P., collectively, or any of them individually.
Unless the context otherwise requires, the pro forma financial and operational data presented in this prospectus give effect to: (i) our acquisition of: Wood Flowline Products, LLC, completed in February 2011 (the “Wood Flowline Acquisition”); Phoinix Global LLC, completed in April 2011 (the “Phoinix Acquisition”); Specialist ROV Tooling Services, Ltd., completed in May 2011 (the “Specialist Acquisition”); Cannon Services LP, completed in July 2011 (the “Cannon Acquisition”); SVP Products Inc., completed in July 2011 (the “SVP Acquisition”); AMC Global Group Ltd., completed in July 2011 (the “AMC Acquisition”); P-Quip Ltd., completed in July 2011 (the “P-Quip Acquisition”); and Davis-Lynch LLC, completed in July 2011 (the “Davis-Lynch Acquisition”); and (ii) this offering, the concurrent private placement and the use of proceeds therefrom, in each case as described in our unaudited pro forma condensed combined financial data included elsewhere in this prospectus. We refer to the transactions described in the preceding clause (i) as the “2011 Acquisitions.” Please read “Management’s discussion and analysis of financial condition and results of operations—Recent acquisitions.2011 Acquisitions.”
Forum Energy Technologies, Inc.
Overview
We are a global oilfield products company, serving the subsea, drilling, completion, production and processinfrastructure sectors of the oil and natural gas industry. We design and manufacture products, and engage in aftermarket services, parts supply and related services that complement our product offering. Our product offering and related services include a mix of highly engineered capital products and frequently replaced items that are consumed in the exploration and development of oil and natural gas reserves. In 2010,2011, approximately 41%40% of our pro forma revenue was derived from the sale of capital products, while approximately 52%53% was derived from consumable products, spare parts or aftermarket services, with the balance of the revenue coming from rental or other sources. Our capital products are directed at drilling rig new build, upgrade and refurbishment projects; subsea construction and development services; the placement of production equipment on a per well basis; and downstream capital projects. Our highly engineered systems are critical components used on drilling rigs or in the course of subsea
operations, while our consumable products are vital to maintaining efficient and safe operations at well sites, within the supporting infrastructure and at processing centers and refineries. Our revenues are generated throughout land and offshore markets and across several international regions, with 43%39% of our 20102011 pro forma revenue derived outside of the United States.
We seek to design, manufacture and supply reliable, cost effective products that create value for our broad and diverse customer base, which includes oil and gas operators, land and offshore drilling contractors, well service, stimulation and intervention service providers, subsea construction and service companies, pipeline operators and refinery and petrochemical plant operators, among others. We believe that we differentiate ourselves from our competitors on the basis of the quality of our products, the level of related service and support we provide and the collaborative approach we take with our customers to help them solve critical problems. Our goal is to be the supplier of choice for our customers by offering innovative, reliable and cost effective products, and by investing in long-term relationships that add value to our customers’ operations.
Our business consists of two segments:
Drilling and Subsea Segment. We design and manufacture products and provide related services to the drilling, well construction, completion, intervention and subsea construction and services markets. This segment contributed $626$755 million, or 66%61% to our 20102011 pro forma revenue.
| • | Subsea technologies. We design and manufacture subsea capital equipment; specialty components and tooling; and applied products for subsea pipelines; and we also provide a broad suite of complementary subsea technical services and rental items. We have a core focus on the design and manufacture of unmanned submarines known in the industry as remotely operated vehicles (“ROVs”) as well as other specialty subsea vehicles. We believe that our Perry™ and Sub-Atlantic™ vehicle brands are among the most respected in the industry. Our related technical services complement our vehicle offering by providing the market with a broad selection of critical product solutions and rental items that enhance our customers’ ability to operate in harsh subsea environments. We have a long tradition of working with customers to develop innovative product solutions to address the increasingly complex challenges of deepwater operations. |
| • | Downhole |
| • | Drilling |
Production and Infrastructure Segment. We design and manufacture products and provide related equipment and services to the well stimulation, completion, production and infrastructure markets. This segment contributed $329$491 million, or 34%39% to our 20102011 pro forma revenue.
| • | Flow equipment. We design, manufacture and provide flow equipment to the well stimulation, testing and flowback markets. Our product offering includes the critical components typically found in the flow equipment train from the well stimulation pressure pump to the manifold at the wellhead. These components routinely encounter high pressures, requiring frequent refurbishment or replacement. We also provide related flow equipment recertification and refurbishment services, which are critical to the safe and reliable operation of well completion activities. |
| • |
|
| • | Valve solutions. We design, manufacture and provide a wide range of industrial valves that principally serve the upstream, midstream and downstream markets of the oil and gas value chain. We provide a comprehensive suite of ball, gate, globe, check and butterfly valves across a wide range of sizes and applications. Our manufacturing and supply chain systems enable us to design and produce high-quality, engineered valves, as well as provide standardized products, while maintaining competitive pricing and minimizing capital requirements. |
The following table summarizes our key product lines, grouped by our two business segments:
| Drilling and | Production and | |||||||||
| ||||||||||
| Drilling | Downhole | Subsea technologies | Flow equipment | Surface equipment | Valve solutions | |||||
| ||||||||||
• Tubular handling equipment
• Wrangler™ Roughnecks
• Wrangler™ Catwalks
• Specialized torque machines and bucking units
• Crane systems
• Drill floor instrumentation and monitoring systems
• Choke and kill manifold mud systems
• Coiled tubing and wireline blowout preventers
• Drilling and production valves, chokes and flowline connections
• Centrifugal pumps and fluid end-components
• Patented mud pump liner retention and mud pump rod piston systems
• Specialty oilfield bearings |
• Davis-Lynch™ float equipment
• Centralizers
• Stage cementing tools
• Inflatable packers
• Flotation collars
• Cementing plugs
• Fill and circulate tools for running casing
• Casing hangars
• Surge reduction equipment
• Cannon™ downhole protection systems
• Customized downhole protection installation tools |
• Perry™
•
• Remote
• Specialty
• Subsea
• Rescue
• Tether
• ROV
• Standardized
• Dynamic
• Geotechnical
• Related |
• Triplex and
• Swivel
• Pup joints
• Swages
• Hammer
• Crossovers
•
• Chokes
• Relief valves
• Bull plugs
• Pressure
• Flowback
• Flow | • Pressure vessels
• Tanks
• Separators
• Vapor
• Scrubbers
• Well test
• Compressor
• Pipeline
• EDGE™
• Lease • Processing
|
• Flanged
• Threaded and
• Butterfly
• Metal seated
• Trunnion
• Full opening
• Pressure seal
• Cast iron | |||||
Current trends in our industry
We are currently focused on the following trends that we believe will positively affect our business in the coming years. The majority of these are secular growth trends that we believe will outpace general industry growth.
| • | Increasing complexity of well construction. As conventional sources of oil and gas are depleted, our industry continues to develop new well construction technologies and techniques that allow operators to recover more hydrocarbons from each well and make previously uneconomic reservoirs profitable. These techniques, most pronounced in the global deepwater and North American land market, include drilling deeper, more highly deviated well paths |
| • | Growing service intensity associated with unconventional resources. The dramatic growth in the development of unconventional shale and tight sand formations, principally in North America, is placing increasing demands on the service equipment. In the U.S., |
| • | Increasing investment in subsea equipment and related services. As the industry develops more deepwater fields, the amount of subsea infrastructure is expected to continue to increase and the ability of service companies and producers to control operations in a safe and effective manner will become more challenging. Subsea infrastructure is also becoming more complex given the focus on larger, more interconnected fields in ultra deepwater environments. This growing complexity is expected to result in greater demand for technologies and products, such as ROVs, that are specifically designed to help service companies and producers gain situational awareness and preserve operational effectiveness. In addition, maintaining and servicing this additional subsea infrastructure is expected to become a larger market as the number of subsea well completions increases and the population of producing subsea wells ages. |
| • | Heightened focus on product maintenance and certification. Our customers and the relevant regulatory authorities are increasingly focused on product and equipment integrity, particularly in applications or environments in which products are exposed to high pressure, high temperature or corrosive elements. We have observed many of our customers implementing more regular and rigorous maintenance and recertification programs for equipment with long useful lives, which we believe could increase the demand for aftermarket services and parts across many product categories. |
| • | Increased capital spending in the oil and gas industry. The growing global demand for energy has resulted in substantial capital spending increases by oil and natural gas producers. |
According to Spears & Associates, annual global oilfield capital spending has increased from $85 billion in 2000 to |
| • | Recovery in global drilling activity and new rig replacement cycle. As global drilling activity has steadily recovered since the 2009 economic downturn, there has been a corresponding increase in new build rig activity as operators require newer technology to meet increasingly challenging drilling conditions, with a focus on mobility, drilling efficiency, power and safety. According to RigLogix, as of |
| • | Development of heavy oil reserves in Canada. Canadian heavy oil reserves offer a large, stable and reliable source of oil for North America. Recent advances in technologies and development practices have lowered both the cost of producing these reserves and the environmental impact of these operations. The lowered cost of production, combined with a stable and robust outlook for oil prices, have enabled the heavy oil producers to undertake long-term development initiatives. The Canadian Association of Petroleum Producers (“CAPP”) has estimated total Canadian heavy oil crude production, including oils sands, will increase from 1,845 Mbpd in 2010 to |
While we believe that these trends will benefit us, our markets may be adversely affected by industry conditions that are beyond our control. Any prolonged substantial reduction in oil and gas prices would likely affect oil and gas drilling and production levels and therefore would affect demand for the products and services we provide. For more information on this and other risks to our business and our industry, please read “Risk factors—Risks related to our business.”
Our business strategy
Our objective is to build a leading global oilfield products company that supplies high quality, mission critical products and related aftermarket services, serving customers globally across the oil and gas value chain. We intend to accomplish that objective and capitalize on the key long-term industry growth trends through the execution of the following strategic elements:
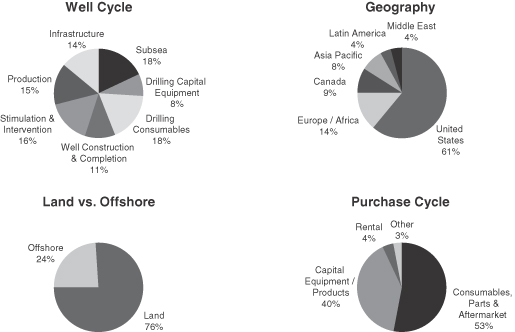
Tailor our product offering and capacity to customer spending. On an annual basis, we conduct a bottoms-up analysis of the sources and drivers of our revenue. Our analysis is focused on various types of revenue splits and exposures, including: (1) phases of the life cycle of the well; (2) geographic exposure by shipment destination; (3) land or offshore application; and (4) product purchase cycles; and (5) commodity mix.cycles. This process relies on a combination of financial analysis and management estimation. Our analysis of our 20102011 pro forma revenues is as follows:
 |  | |||
 |  | |||

| ||||
As part of the bottoms-up analysis described above, we also estimate the broad industry drivers of our business. We believe that our 20102011 pro forma revenue growth was strongly driven by North American unconventional resource developments and global deepwater development activity, shallow offshore activity and international land activity, with lessermeaningful contributions from Canadian
heavy oil developments and downstream activity. Although acquisitions may cause fluctuations in our business mix, we intend to preserve and enhance the diversity of our business as a core part of our strategy. We believe this diversity reduces the impact of the volatility of any single equipment spend cycle or well cycle phase or equipment spend cycle on our financial performance. A description of how we define each of the categories within each revenue split above is included in the “Glossary” beginning on page A-1 of this prospectus.
Leverage our product lines’ strengths across our platform. Each of our respectiveOur product lines hashave particular strengths that can be leveraged across theour entire platform. We intend to cross-fertilize technologies, share product development initiatives and leverage key geographic, supply chain and customer strengths to grow and improve the profitability of our overall business.
Expand our geographic presence. We intend to enhance our access to key global markets and to grow or establish our presence across thekey North American unconventional resource basins. We also plan to build upon our existing presence in the North American, North Sea, Middle East, South American and Asia Pacific regions through deployment of sales, distribution, service and manufacturing resources. We believe this expansion will provide more points of contact with our customers, allowing us to respond more quickly to their needs.
Invest in manufacturing capacity and excellence. We focus on the continuous improvement of our manufacturing processes and quality controls, which are vital to ensuring product reliability. We also continue to invest in expanding our manufacturing capacity by increasing output, upgrading machinery or adding “roofline” in strategically important geographies. We believe that in certain product lines, particularly those sold into the North American unconventional resource plays, locating manufacturing and service capabilities in close proximity to field locations improves response time, reduces freight costs and enhances customer service.
Pursue disciplined growth through acquisitions. We have a track record of successfully growing our earnings and product offerings by making attractive acquisitions. We intend to continue to selectively pursue acquisitions that increase our exposure to the most important growth trends in the oil and gas industry, fill critical product gaps andor expand our geographic scope. With a strong balance sheet and sufficient financial resources, we believe that we can continue to acquire companies in high growth product areas and expose the acquired product lines to new customers and distribution channels, while preserving the entrepreneurial attributes that made them attractive on a stand-alone basis.
Develop new products. We conduct strategic reviews to identify underserved market opportunities and invest in continuous product development efforts. While our product development efforts involve formal research and engineering projects, we most often generate product development ideas, concepts and opportunities while working closely with our customers in the normal course of business. Our focus on customer service as well as our strong aftermarket offering facilitates product development opportunities that may not be captured as part of a formalized research and engineering project. We believe this process allows us to enhance our exposure to key secular trends and serve our customers’ needs more effectively. We have developed strong working relationships with our major customers, several of which routinely approach us with requests for solutions to specific application challenges. We plan to continue to improve our new product engineering capabilities and leverage our expertise to address customer needs. Recent examples include the landoffshore and offshoreland versions of our Wrangler
Roughneck™, a critical makeup and breakout tool for tubulars on a drilling rig, and our subsea ROVDrill™, a unique tool designed to perform subsea drilling functions independent of the support vessel while using only the associated ROV for power and control.
Focus on product quality and customer service. We have a track record of providing innovative, reliable, fit-for-purpose products at competitive prices while remaining responsive to the needs of our customers. We work closely and flexibly with our customers on delivery timing and service after the sale. We seek to ensure that our businesses have the facilities and personnel to maintain the highest level of safety, quality and service as we grow around the world.
Our competitive strengths
We believe that we are well positioned to execute our strategy based on the following competitive strengths:
Broad product offering with exposure to key long-term industry trends and a diverse customer base. Our exposure to a mix of consumable products, capital products and aftermarket parts and services enables us to participate in the construction, capacity expansion, maintenance, upgrade and refurbishment phases of the energy cycle. In addition, we have exposure to multiple sectors of the oil and gas industry and a diverse mix of customers across the full oil and gas value chain. We believe our broad product offering, diversified exposure to industry trends and extensive customer base reduces our dependence on any one phase, purchase cycle, segment or region and should result in more stable financial results.
Focus on critical peripheral products. Many of our products, particularly those serving the drilling and well stimulation markets, are non-discretionary components that represent a small percentage of the life cycle cost associated with large capital equipment. We believe that focusing on specialized, peripheral products affords us full exposure to the most powerful investment trends in the oil and gas industry while insulating us from the intense competitive environment and construction risks often associated with selling the largest capital equipment packages.
Solid base of recurring revenues from consumable products. In 2010,2011, we generated approximately 52%53% of our pro forma revenues from consumable products, spare parts or aftermarket parts and services, which are critical to large capital equipment or energy infrastructure. In some cases, these products must be replaced multiple times throughout the life cycle of the related capital equipment or infrastructure installations. These products have replacement cycles ranging from a few months to a few years, resulting in a stable base of recurring revenues. We often complement these products with a recertification and refurbishment service, which helps us preserve strong customer relations. We have also observed that our customers often return to the same vendors for replacement parts, lending further revenue stability and visibility.
Experienced management team with proven public company track record. Our executive officers and senior operational managers have an average of over 30 years of experience in the oilfield manufacturing and service industry. Each of our top three operational executives served as the chief operational officer of one or more large publicly held oilfield service companies or of a significant division thereof. We believe their collective background provides our management team with an in-depth understanding of our customers’ needs, enhances our ability to deliver customer-driven solutions and allows us to operate effectively throughout industry cycles. Several
members of our management team were executives or directors at one of the five companies that combined to form Forum Energy Technologies, Inc. in August 2010.
Multiple avenues for growth and strong cash flows. We are focused on a core set of product platforms that we believe offer strong long-term growth. The breadth of our product offering affords us multiple organic growth avenues in which to deploy our capital, and we invest in the highest value opportunities that meet our return objectives and further our strategic goals. Similarly, we believe the scope of available acquisition opportunities will be enhanced by the numerous strategic directions available to us. In the face of particularly strong competition for acquisitions in a specific sector, we can deploy capital to other areas of our Company that afford better relative value. We also believe that our breadth and size allows us to meaningfully change
our financial profile and business composition with modestly sized acquisitions. Finally, our manufacturing operations are not capital intensive to maintain or expand, which allows us to generate strong cash flow. This provides us with capacity to finance organic growth opportunities with internally generated resources.
Proven ability to grow earnings and improve product offering through a focused acquisition strategy. We have a strong track record of strategically targeting key product opportunities, completing accretive transactions and effectively integrating these businesses. We have a disciplined acquisition strategy that allows us to develop proprietary deal flow by identifying emerging industry trends, identifying existing platforms positioned to capitalize on these trends, and in some cases isolating acquisition opportunities that are largely missed by our competitors due to smaller size and scale. Each of the original five companies that combined to form Forum Energy Technologies, Inc. was itself the result of a similar acquisition strategy focused on a specific industry growth theme. Our current acquisition strategy is a continuation of that successful model. Since the Combination in August 2010, we have completed eight acquisitions, three of which were focused on enhancing existing product offerings, while the remaining five permitted us to establish two new product offering platforms:offerings: downhole productstechnologies and flow equipment related to well stimulation. These new offerings enhanced our exposure to the growing well completion market.
Customer responsive product innovation. We have grown our business by being responsive to customer needs and developing strong relationships at multiple levels of our customers’ organizations. We believe our ability to develop new products is enhanced because of these customer relationships. Our experienced engineering and technical staff has partnered with our customers to design and develop new products that add value to their operations or reduce their total cost of doing business. As a result, we have developed and commercialized a number of new products that have improved the efficiency and safety of our customers’ operations including our powered Wrangler™ catwalk and iron roughnecks, powered mousehole tool, Perry ROVDrill™, low profile urban gas processing unit and others.
Recent developments
| • | Acquisition opportunity. Consistent with our acquisition strategy, we are continuously engaged in discussions with potential sellers regarding our possible purchase of assets and operations that are strategic and complementary to our existing operations. We have entered into a non-binding letter of intent and are currently in negotiations with the owners of a privately-held oilfield services company. This company provides products and services that are complementary to, but not the same as, certain of our existing product lines. We have not completed our due diligence, including our evaluation of the financial performance of the assets, and we have not reached agreement with the owners on all material business points. Based on the information provided to us to date, we believe that the aggregate value for the company is in the range of $115 million to $140 million, and we expect to pay the purchase price in cash using available cash and borrowings from our senior secured credit facility. We have not signed a purchase and sale agreement with respect to this potential acquisition and if we do, we expect such agreement would be subject to customary conditions to closing. We cannot provide any assurance that we will successfully complete these negotiations, execute a definitive purchase and sale agreement or ultimately close an acquisition in the near term or at all. |
| • | Established consumable flow equipment product line. In late 2010, we launched a strategic effort to expand our product offering to include consumable products used in the well stimulation and completion processes. Our initial focus was on the consumable flow equipment and pressure control equipment used in the well stimulation, testing and flowback processes. In 2011, we closed three acquisitions to form our core platform with an aggregate capital deployment of approximately $115 million. Taken together, these acquisitions have established |
our consumable flow equipment platform within our Production and Infrastructure Segment. These acquisitions provide us with a full product offering, expert managers, key customer relationships and critical expertise in the design, engineering and manufacture of the full range and sizes of flow equipment. Moreover, as recertification and refurbishment operations are critical to ensuring the reliable and safe operation of a pressure pumping company’s fleet, we operate a fleet of sophisticated mobile recertification and refurbishment tractor trailers, which we can deploy to the customer’s yard or to the well site. |
| • | Established downhole |
| • | Strengthened subsea |
| • | Strengthened drilling |
| • | Recent product developments. We invest in continuous product development efforts to enhance our exposure to key, long-term growth trends in the oil and natural gas industry and support our ability to serve our customers needs more effectively. Recent product developments include: |
| • | “Tomahawk” Observation Class ROV. In March 2012, we launched a new multi-role observation class ROV called the Tomahawk. The Tomahawk is the latest addition to our long line of Sub-Atlantic™ branded observation class ROVs, which includes the Comanche, |
Mohican, Super Mohawk, Mohawk, Mojave and Navajo Electric ROV Systems. We developed the Tomahawk in response to our customers’ needs for a dependable and adaptable multi-role ROV that can deploy and operate in demanding environments. The Tomahawk uses the subCAN™ high-speed communications data network system. Rated to a depth of 3,000 metres, the Tomahawk is designed for survey, well intervention and drilling support operations in deep-water conditions, such as in Brazil, West Africa and the Gulf of Mexico. |
| • | ROVDrill™ achieves technical milestone. The ROVDrill™ is a unique tool designed to perform subsea drilling functions independent of the support vessel while using only the associated ROV for power and control. During the first quarter of 2011, the ROVDrill™ successfully completed a drilling program to validate subsurface mineral deposits for a mining customer. We believe this technology also has significant applications outside the mining industry, implications for the existing seafloor coring market and applications for use in better understanding geologic fault lines. |
| • | Wrangler™ roughneck completes initial drilling |
a vital piece of drilling rig equipment. We designed this product to meet the growing need for a high-torque tool optimized for drilling complex wells. Our initial unit successfully concluded a three well land drilling program for a key customer during which it completed over 4,000 connections. We also recently developed and sold an offshore version of this tool to a major contractor. We believe this technology has significant applications in unconventional resource basins and in the growing offshore drilling market. |
Risk factors
Investing in our common stock involves risks. In particular, the following considerations may offset our competitive strengths or have a negative effect on our business strategy, which could cause a decrease in the price of our common stock and result in a loss of all or a portion of your investment:
We derive a substantial portion of our revenues from companies in or affiliated with the oil and natural gas industry, a historically cyclical industry, with levels of activity that are significantly affected by the levels and volatility of oil and natural gas prices. As a result, this cyclicality may cause fluctuations in our revenues and results of our operations.
Our inability to control the inherent risks of acquiring and integrating businesses could disrupt our business, dilute stockholder value and adversely affect our operating results going forward.
Our operating history may not be sufficient for investors to evaluate our business and prospects.
Growing our business organically through the expansion of our existing product lines and facilities subjects us to risks of construction delaydelays and cost overruns.
We may be unable to employ a sufficient number of skilled and qualified workers.
The current pace of spending for drilling rigs and other capital intensive equipment may not be sustainable over time, and our financial results may suffer to the extent they are dependent on sales of such equipment.
Our business depends upon our ability to obtain key raw materials and specialized equipment from suppliers. Increased costs of raw materials and other components may result in increased operating expenses.
We are subject to the risk of supplier concentration.
Our operations and our customers’ operations are subject to a variety of governmental laws and regulations that may increase our costs, limit the demand for our products and services or restrict our operations.
The markets in which we operate are highly competitive, and some of our competitors hold substantial market share and have substantially greater resources than we do. We may not be able to compete successfully in this environment and, in particular, against a much larger competitor.
L.E. Simmons & Associates, Incorporated (“LESA”), through SCF, will control the outcome of stockholder voting and may exercise this voting power in a manner adverse to you.
We have renounced any interest in specified business opportunities, and SCF and its director nominees on our board of directors generally have no obligation to offer us those opportunities. LESA may allocate any potential opportunities to its other portfolio companies where LESA determines, in its discretion, such opportunities are the most logical strategic and operational fit.
For a discussion of these risks and other considerations that could negatively affect us, including risks related to this offering and our common stock, see “Risk factors” beginning on page 2221 and “Cautionary note regarding forward-looking statements.”
The combination
SCF Partners, L.P. (“SCF Partners”) is a private equity firm that has specialized in investments in the oilfield services sector since it was founded in 1989. From May 2005 to August 2007, SCF Partners made investments in product and manufacturing companies targeted at specific oilfield growth trends. During that time, SCF Partners acquired Forum Oilfield Technologies, Inc. (“FOT”), Global Flow Technologies, Inc. (“Global Flow”), Triton Group Holdings, LLC (“Triton”), Allied Production Services, Inc. (“Allied”) and Subsea Services International, Inc. (“Subsea”). In addition to growing organically after their acquisition by SCF Partners, FOT, Global Flow, Triton, Allied and Subsea completed, in the aggregate, 28 acquisitions from May 2005 to January 2009. For more information regarding the development of FOT, Global Flow, Triton, Allied and Subsea through organic growth and acquisitions please read “Business—Business history.”
Beginning in 2009, and in collaboration with SCF Partners, several of the companies initiated long-term strategic discussions concerning the formation of a broadly based oilfield products company that would be capitalized to take advantage of growth opportunities as the industry recovered from the industry wide downcycle that occurred in 2009. On August 2, 2010, each of FOT,
Global Flow, Triton, Allied and Subsea were combined (referred to in this prospectus as the “Combination”). In the Combination, FOT became the parent company and was renamed Forum Energy Technologies, Inc.
The strategic rationale for the Combination was based on the following key objectives and benefits:
| • | Increase access to growth capital. Many of the Combination companies projected that there would be significant growth opportunities |
| • | Enhance ability to serve our customers and improve cross selling of products. A larger platform with better financing would instill greater confidence in customers and better position the business to pursue |
programs, consumable product inventory management and other long-term strategic supplier arrangements. In addition, access to a more expansive geographic platform would provide several of the Combination companies with a greater capacity to provide aftermarket service. Finally, the management teams believed that we would have more opportunities to reach certain targeted customers and the ability to leverage those interactions to drive incremental revenue opportunities. For example, management believed that Allied’s customer relationships with producers would provide introductory opportunities for Global Flow’s valve business, which generally is pulled through distribution companies to the producer. |
| • | Leverage the strengths of each company across the combined Company. Each of the Combination companies had particular strengths, many of which would benefit one or more of the others. For example, the controls technology expertise imbedded within Triton’s ROV development group could provide FOT’s tubular handling capital equipment development effort with access to highly skilled engineers who had solutions to controls technology challenges. A second example involved Global Flow’s robust supply chain system, which involved outsourced manufacturing and critical vendor relationships in Asia. The combined management believed that access to this supply chain and the knowledge that produced it would accelerate similar efforts across the other companies. |
| • | Enhance financial stability. Each of the Combination companies was subject to different industry drivers, many of which have historically experienced different cycles. The management teams believed that a combined company participating in each of these varying cycles would provide an enhanced measure of stability to the business and to the long-term planning process by decreasing the volatility of its financial results. |
| • | Internally source products. Some of the Combination companies used products of other Combination companies in their manufacturing process. The management teams believed there would be an opportunity to generate incremental business by internally sourcing some of these products. |
Having concluded the Combination, we believe that the investment thesis and the associated operational benefits to us have been proven. As integration has proceeded, we have discovered benefits and opportunities incremental to those described above. We believe that the operational and financial benefits realized through the Combination have: (1) enhanced our growth potential; (2) offered ongoing synergistic opportunities; (3) provided the opportunity to develop broader and more diversified product lines; (4) enabled us to compete with larger companies; (5) provided an opportunity to leverage discrete internal initiatives across a broader platform; and (6) established a good foundation for long-term growth. Several of these opportunities are under development and we believe that there will be strong benefits to the business as we continue to grow.
Stock split
Prior to the completion of this offering, we expect our board to approve a proposal to amend our certificate of incorporation to give effect to a for stock split of our issued and outstanding common stock. For additional information, see “Stock split.”
Corporate information
Our principal executive offices are located at 920 Memorial City Way, Suite 800, Houston, Texas 77024, and our telephone number at that address is (281) 949-2500. Our website is available athttp://www.f-e-t.com. Information on our website or any other website is not incorporated by reference herein and does not constitute a part of this prospectus.
Common stock offered by Forum Energy Technologies, Inc. | shares ( shares if the underwriters’ option is exercised in full) |
Common stock offered by the selling stockholders | shares ( shares if the underwriters’ option is exercised in full) |
Total common stock offered | shares ( shares if the underwriters’ option is exercised in full) |
Common stock to be outstanding after the offering | shares ( shares if the underwriters’ option is exercised in full), including shares to be sold in a concurrent private placement. See ”—Concurrent Private Placement.” |
Common stock owned by the selling stockholders after the offering | shares ( shares if the underwriters’ option allotment is exercised in full) |
Over-allotment option | We have granted the underwriters an option for a period of 30 days to purchase up to additional shares of our common stock and the selling stockholders have granted the underwriters an option for a period of 30 days to purchase up to additional shares of our common stock. |
Use of proceeds | We will receive net proceeds of approximately $ million from the sale of the common stock by us in this offering, assuming an initial public offering price of $ per share (the midpoint of the price range set forth on the cover page of this prospectus) and after deducting estimated expenses and underwriting discounts and commissions. Each $1.00 increase (decrease) in the public offering price would increase (decrease) our net proceeds by approximately $ million. We intend to use all of the net proceeds from this offering and any proceeds from any exercise of the underwriters’ option to purchase additional common stock from us to repay outstanding borrowings under the revolving portion of our senior secured credit facility. We will not receive any of the proceeds from the sale of shares of our common stock by the selling stockholders. See “Use of proceeds.” |
Dividend policy | We do not anticipate paying any cash dividends on our common stock. In addition, our senior secured credit facility contains restrictions on making cash dividends. |
Risk factors | You should carefully read and consider the information beginning on page |
New York Stock Exchange (“NYSE”) symbol | FET |
Concurrent Private Placement | We intend to offer to sell $50 million of shares of our common stock at the public offering price less the underwriting discount, or shares of our common stock assuming an initial public offering price of $ per share (the midpoint of the price range set forth on the cover page of this prospectus), in a private placement to a private equity firm not affiliated with SCF concurrently with this offering. We intend to use the net proceeds from the concurrent private placement to repay outstanding borrowings under the revolving portion of our senior secured credit facility. If the price at which we offer the shares of common stock to the public is above the range set forth on the cover of this prospectus, the purchaser may elect not to purchase any shares of our common stock or to buy only a portion of the shares offered to it. The shares of common stock to be sold in the concurrent private placement are not being offered pursuant to this prospectus and will be subject to certain restrictions on resale in accordance with the Securities Act of 1933, as amended (the “Securities Act”). |
Conflicts of interest | We may use more than 5% of the net proceeds of this offering to repay indebtedness owed by us to affiliates of the underwriters that are lenders under our credit agreement. See “Use of proceeds.” Accordingly, this offering will be made in compliance with the applicable provisions of Rule 5121 of the Financial Industry Regulatory Authority, Inc. This rule requires that a “qualified independent underwriter” meeting certain standards participate in the preparation of the registration statement and prospectus and exercise the usual standards of due diligence with respect thereto. Tudor, Pickering, Holt & Co. Securities, Inc. has agreed to act as a “qualified independent underwriter” within the meaning of Rule 5121 in connection with this offering. See “Underwriting (conflicts of interest).” |
Other Outstanding Shares
The number of shares of common stock that will be outstanding after the offering and the concurrent private placement includes shares of restricted common stock issued to officers and other employees under our stock incentive plan that are subject to vesting. As of December 27, 2011,March 9, 2012, there were 16,64516,644 shares of restricted stock outstanding that remain subject to vesting.
The number of shares of common stock that will be outstanding after the offering excludes:
209,804206,847 shares issuable upon the exercise of options outstanding as of December 27, 2011March 9, 2012 under our stock incentive plan;
193,292193,214 shares issuable upon the exercise of warrants outstanding as of December 27, 2011;March 9, 2012;
an aggregate of 173,551176,509 shares of common stock reserved and available for future issuance as of December 27, 2011March 9, 2012 under our stock incentive plan; and
an aggregate of up to 15,253 shares, which may be issued as contingent consideration based on certain operating results of companies previously acquired.
Summary historical and pro forma financial data
You should read the following summary historical consolidated and pro forma condensed combined financial data in conjunction with “Unaudited pro forma condensed combined financial data,” “Selected historical consolidated financial data,” “Management’s discussion and analysis of financial condition and results of operations” and the historical consolidated combined financial statements and related notes thereto included elsewhere in this prospectus. The financial data included in this prospectus may not be indicative of our future results of operations, financial position and cash flows.
The summary historical financial data as of December 31, 20092010 and 20102011 and for the years ended December 31, 2008, 2009, 2010 and 20102011 are derived from our audited consolidated financial statements and the related notes thereto included elsewhere in this prospectus. The historical financial data as of September 30, 2011 and for the nine months ended September 30, 2010 and 2011 are derived from our unaudited consolidated financial statements and the related notes thereto included elsewhere in this prospectus, have been prepared on a basis consistent with the audited financial statements and the notes thereto and include all adjustments, consisting of normal recurring adjustments, necessary for a fair presentation of the financial data.
The summary pro forma condensed combined financial data for the year ended December 31, 2010 and the nine months ended September 30, 2011 are derived from the unaudited pro forma financial statements of Forum Energy Technologies, Inc. included in this prospectus under “Unaudited pro forma condensed combined financial data.” The pro forma financial data for the year ended December 31, 2010 gives effect to the 2011 Acquisitions, the issuance by us of shares of common stock pursuant to this offering and the application of the net proceeds therefrom as described in “Use of proceeds,” in each case as if each such transaction had occurred on January 1, 2010. The pro forma financial data for the nine months ended September 30, 2011 gives effect to the 2011 Acquisitions, the issuance by us of shares of common stock pursuant to this offering and the concurrent private placement and the application of the net proceeds therefrom as described in “Use of proceeds,”proceeds” and “—The offering—Concurrent private placement, “ respectively, in each case as if each such transaction had occurred on January 1, 2011. For additional information regarding the estimates and adjustments made to prepare the pro forma financial data, please see “Unaudited pro forma condensed combined financial data” included elsewhere in this prospectus.
| Actual | Pro forma | Actual | Pro forma | |||||||||||||||||||||||||||||||||||||||||
| Year ended December 31, | Nine months ended September 30, | Year ended December 31, | Nine months ended September 30, | Year ended December 31, | Year ended December 31, | |||||||||||||||||||||||||||||||||||||||
| 2008 | 2009 | 2010 | 2010 | 2011 | 2010 | 2011 | 2009 | 2010 | 2011 | 2011 | ||||||||||||||||||||||||||||||||||
| (unaudited) | (unaudited) | (unaudited) | ||||||||||||||||||||||||||||||||||||||||||
| (in thousands, except per share information) | ||||||||||||||||||||||||||||||||||||||||||||
|
|
| ||||||||||||||||||||||||||||||||||||||||||
Statement of income data: | ||||||||||||||||||||||||||||||||||||||||||||
Net sales | $ | 972,551 | $ | 677,378 | $ | 747,335 | $ | 545,751 | $ | 791,412 | $ | 955,449 | $ | 909,026 | $ | 677,378 | $ | 747,335 | $ | 1,128,131 | $ | 1,245,745 | ||||||||||||||||||||||
Cost of sales | 691,824 | 491,463 | 533,078 | 390,851 | 542,832 | 637,111 | 596,824 | 491,463 | 533,078 | 765,670 | 819,662 | |||||||||||||||||||||||||||||||||
|
|
|
| |||||||||||||||||||||||||||||||||||||||||
Gross profit | 280,727 | 185,915 | 214,257 | 154,900 | 248,580 | 318,338 | 312,202 | 185,915 | 214,257 | 362,461 | 426,083 | |||||||||||||||||||||||||||||||||
|
|
|
| |||||||||||||||||||||||||||||||||||||||||
Operating expenses | ||||||||||||||||||||||||||||||||||||||||||||
Selling, general and administrative expenses | 146,943 | 128,562 | 141,441 | 100,263 | 129,626 | 185,571 | 152,762 | 128,562 | 141,441 | 186,774 | 209,821 | |||||||||||||||||||||||||||||||||
Contingent consideration | — | — | — | — | 6,000 | — | 6,000 | — | — | 12,100 | 12,100 | |||||||||||||||||||||||||||||||||
Transaction expenses | — | — | — | — | 3,434 | — | — | — | — | 3,608 | — | |||||||||||||||||||||||||||||||||
Impairment of goodwill and other intangible assets | 44,015 | 7,009 | — | — | — | — | 7,009 | — | — | — | ||||||||||||||||||||||||||||||||||
(Gain) loss on sales of assets | (619 | ) | 137 | (461 | ) | (471 | ) | (520 | ) | (461 | ) | (520 | ) | 137 | (461 | ) | (634 | ) | (634 | ) | ||||||||||||||||||||||||
|
|
|
| |||||||||||||||||||||||||||||||||||||||||
Total operating expenses | 190,339 | 135,708 | 140,980 | 99,792 | 138,540 | 185,110 | 158,242 | 135,708 | 140,980 | 201,848 | 221,287 | |||||||||||||||||||||||||||||||||
|
|
|
| |||||||||||||||||||||||||||||||||||||||||
Income from operations | 90,388 | 50,207 | 73,277 | 55,108 | 110,040 | 133,228 | 153,960 | 50,207 | 73,277 | 160,613 | 204,796 | |||||||||||||||||||||||||||||||||
|
|
|
| |||||||||||||||||||||||||||||||||||||||||
Other expense | ||||||||||||||||||||||||||||||||||||||||||||
Expenses related to the Combination | — | — | 6,968 | 6,919 | — | 6,968 | — | — | 6,968 | — | — | |||||||||||||||||||||||||||||||||
Deferred loan costs written off | — | — | 6,082 | 6,082 | — | 6,082 | — | — | 6,082 | — | — | |||||||||||||||||||||||||||||||||
Interest expense | 24,704 | 19,451 | 18,189 | 15,417 | 13,723 | 31,747 | 20,830 | 19,451 | 18,189 | 19,532 | 25,272 | |||||||||||||||||||||||||||||||||
Other, net | (2,065 | ) | (1,088 | ) | (2,308 | ) | (2,189 | ) | 1,261 | (2,486 | ) | 1,175 | (1,088 | ) | (2,308 | ) | 378 | 292 | ||||||||||||||||||||||||||
|
|
|
| |||||||||||||||||||||||||||||||||||||||||
Total other expense | 22,639 | 18,363 | 28,931 | 26,229 | 14,984 | 42,311 | 22,005 | 18,363 | 28,931 | 19,910 | 25,564 | |||||||||||||||||||||||||||||||||
|
|
|
| |||||||||||||||||||||||||||||||||||||||||
Income from continuing operations before income taxes | 67,749 | 31,844 | 44,346 | 28,879 | 95,056 | 90,917 | 131,955 | 31,844 | 44,346 | 140,703 | 179,232 | |||||||||||||||||||||||||||||||||
Provision for income tax expense | 32,938 | 11,011 | 20,297 | 15,685 | 33,176 | 35,715 | 45,456 | 11,011 | 20,297 | 47,110 | 59,961 | |||||||||||||||||||||||||||||||||
|
|
|
| |||||||||||||||||||||||||||||||||||||||||
Income from continuing operations | 34,811 | 20,833 | 24,049 | 13,194 | 61,880 | 55,202 | 86,499 | 20,833 | 24,049 | 93,593 | 119,271 | |||||||||||||||||||||||||||||||||
Loss from discontinued operations, net of taxes | (396 | ) | (1,342 | ) | — | — | — | — | — | (1,342 | ) | — | — | — | ||||||||||||||||||||||||||||||
|
|
|
| |||||||||||||||||||||||||||||||||||||||||
Net income | 34,415 | 19,491 | 24,049 | 13,194 | 61,880 | 55,202 | 86,499 | 19,491 | 24,049 | 93,593 | 119,271 | |||||||||||||||||||||||||||||||||
Less: Income attributable to noncontrolling interest | (39 | ) | (155 | ) | (111 | ) | (123 | ) | (267 | ) | (111 | ) | (267 | ) | (155 | ) | (111 | ) | (251 | ) | (251 | ) | ||||||||||||||||||||||
|
|
|
| |||||||||||||||||||||||||||||||||||||||||
Net income attributable to common stockholders | $ | 34,376 | $ | 19,336 | $ | 23,938 | $ | 13,071 | $ | 61,613 | $ | 55,091 | $ | 86,232 | $ | 19,336 | $ | 23,938 | $ | 93,342 | $ | 119,020 | ||||||||||||||||||||||
|
|
|
| |||||||||||||||||||||||||||||||||||||||||
Weighted average shares outstanding | ||||||||||||||||||||||||||||||||||||||||||||
Basic | 1,232 | 1,304 | 1,454 | 1,422 | 1,671 | 1,304 | 1,454 | 1,710 | ||||||||||||||||||||||||||||||||||||
Diluted | 1,261 | 1,322 | 1,468 | 1,424 | 1,769 | 1,322 | 1,468 | 1,824 | ||||||||||||||||||||||||||||||||||||
Earnings per share | ||||||||||||||||||||||||||||||||||||||||||||
Basic | $ | 27.90 | $ | 14.83 | $ | 16.46 | $ | 9.19 | $ | 36.87 | $ | 14.83 | $ | 16.46 | $ | 54.59 | $ | |||||||||||||||||||||||||||
Diluted | 27.26 | 14.63 | 16.31 | 9.18 | 34.83 | 14.63 | 16.31 | 51.17 | ||||||||||||||||||||||||||||||||||||
| As of December 31, | As of December 31, | |||||||||||||||||||
| 2009 | 2010 | As of September 30, 2011 | 2010 | 2011 | ||||||||||||||||
| (in thousands) | (unaudited) | |||||||||||||||||||
|
|
| ||||||||||||||||||
Balance sheet data: | ||||||||||||||||||||
Cash and cash equivalents | $ | 26,894 | $ | 20,348 | $ | 36,928 | $ | 20,348 | $ | 20,548 | ||||||||||
Net property, plant and equipment | 96,747 | 90,632 | 121,679 | 90,632 | 124,840 | |||||||||||||||
Total assets | 840,226 | 818,332 | 1,564,106 | 818,332 | 1,607,315 | |||||||||||||||
Long-term debt | 236,937 | 204,715 | 684,295 | 204,715 | 660,379 | |||||||||||||||
Total stockholders’ equity | 401,927 | 462,523 | 619,650 | 462,523 | 654,493 | |||||||||||||||
|
|
| ||||||||||||||||||
| Pro forma | Pro forma | |||||||||||||||||||||||||||||||||||||||||||
| Year ended December 31, | Nine months ended September 30, | Year ended December 31, | Nine months ended September 30, | Year ended December 31, | Year ended December 31, | |||||||||||||||||||||||||||||||||||||||
| 2008 | 2009 | 2010 | 2010 | 2011 | 2010 | 2011 | 2009 | 2010 | 2011 | 2011 | ||||||||||||||||||||||||||||||||||
| (unaudited) | (unaudited) | (unaudited) | ||||||||||||||||||||||||||||||||||||||||||
| (in thousands) | ||||||||||||||||||||||||||||||||||||||||||||
|
|
| ||||||||||||||||||||||||||||||||||||||||||
Other financial data: | ||||||||||||||||||||||||||||||||||||||||||||
Net cash provided by operating activities | $ | 112,463 | $ | 107,751 | $ | 65,981 | $ | 27,892 | $ | 18,624 | $ | 107,751 | $ | 65,981 | $ | 39,275 | ||||||||||||||||||||||||||||
Net cash used in investing activities | $ | (160,937 | ) | $ | (10,914 | ) | $ | (19,216 | ) | $ | (8,941 | ) | $ | (534,681 | ) | $ | (10,914 | ) | $ | (19,216 | ) | $ | (550,114 | ) | ||||||||||||||||||||
Net cash provided by / (used in) financing activities | $ | 58,871 | $ | (94,532 | ) | $ | (54,265 | ) | $ | (26,465 | ) | $ | 531,947 | $ | (94,532 | ) | $ | (54,265 | ) | $ | 510,148 | |||||||||||||||||||||||
EBITDA(1) (unaudited) | $ | 127,328 | $ | 89,578 | $ | 95,640 | $ | 68,930 | $ | 136,458 | $ | 170,345 | $ | 187,870 | $ | 89,578 | $ | 95,640 | $ | 200,759 | $ | 252,345 | ||||||||||||||||||||||
Adjusted EBITDA (1) (unaudited) | $ | 171,343 | $ | 96,587 | $ | 108,690 | $ | 81,931 | $ | 145,892 | $ | 183,395 | $ | 193,870 | $ | 96,587 | $ | 108,690 | $ | 216,467 | $ | 264,445 | ||||||||||||||||||||||
|
|
| ||||||||||||||||||||||||||||||||||||||||||
| (1) | EBITDA and Adjusted EBITDA are non-GAAP financial measures. For definitions and a reconciliation of these measures to our net income, see “—Non-GAAP financial measure” below. |
Non-GAAP financial measure
EBITDA is a supplemental non-GAAP financial measure that is used by management and external users of our consolidated financial statements, such as industry analysts, investors, lenders and rating agencies.
We define EBITDA as net income attributable to common stockholders before interest expense, taxes, depreciation and amortization and loss from discontinued operations. EBITDA is not a measure of net income or cash flows as determined by U.S. generally accepted accounting principles (“GAAP”).
We define Adjusted EBITDA as EBITDA discussed above further adjusted for (1) impairment loss related to goodwill and other intangible assets, (2) expenses related to the Combination, (3) deferred loan costs written-off (4) contingent consideration for acquisitions and (5) transaction expenses for acquisitions.
Management believes EBITDA and Adjusted EBITDA are useful because they allow us to more effectively evaluate our operating performance and compare the results of our operations from period to period without regard to our financing methods or capital structure. We exclude the items listed above from net income in arriving at these measures because these amounts can vary substantially from company to company within our industry depending upon accounting methods and book values of assets, capital structures and the method by which the assets were acquired. These measures should not be considered as an alternative to, or more meaningful than, net income or cash flows from operating activities as determined in accordance with GAAP or as an indicator of our operating performance or liquidity. Certain items excluded from these measures are significant components in understanding and assessing a company’s financial performance, such as a company’s cost of capital and tax structure, as well as the historic costs of depreciable assets, none of which are components of these measures. Our computations of these measures may not be comparable to other similarly titled measures of other companies. We believe that these are widely followed measures of operating performance and may also be used by investors to measure our ability to meet debt service requirements.
The following tables present a reconciliation of the non-GAAP financial measure of EBITDA and Adjusted EBITDA to the GAAP financial measure of net income.
| Pro forma | Pro forma | |||||||||||||||||||||||||||||||||||||||||||
| Year ended December 31, | Nine months ended September 30, | Year ended December 31, | Nine months ended September 30, | Year ended December 31, | Year ended December 31, | |||||||||||||||||||||||||||||||||||||||
| 2008 | 2009 | 2010 | 2010 | 2011 | 2010 | 2011 | 2009 | 2010 | 2011 | 2011 | ||||||||||||||||||||||||||||||||||
| (unaudited) | (unaudited) | (unaudited) | ||||||||||||||||||||||||||||||||||||||||||
| (in thousands) | ||||||||||||||||||||||||||||||||||||||||||||
|
|
| ||||||||||||||||||||||||||||||||||||||||||
EBITDA Reconciliation: | ||||||||||||||||||||||||||||||||||||||||||||
Net income attributable to common stockholders | $ | 34,376 | $ | 19,336 | $ | 23,938 | $ | 13,071 | $ | 61,613 | $ | 55,091 | $ | 86,232 | $ | 19,336 | $ | 23,938 | $ | 93,342 | $ | 119,020 | ||||||||||||||||||||||
Interest expense | 24,704 | 19,451 | 18,189 | 15,417 | 13,723 | 31,747 | 20,830 | 19,451 | 18,189 | 19,532 | 25,272 | |||||||||||||||||||||||||||||||||
Depreciation and amortization | 34,914 | 38,438 | 33,216 | 24,757 | 27,946 | 47,792 | 35,352 | 38,438 | 33,216 | 40,775 | 48,092 | |||||||||||||||||||||||||||||||||
Income tax expense | 32,938 | 11,011 | 20,297 | 15,685 | 33,176 | 35,715 | 45,456 | 11,011 | 20,297 | 47,110 | 59,961 | |||||||||||||||||||||||||||||||||
Loss from discontinued operation | 396 | 1,342 | — | — | — | — | — | 1,342 | — | — | — | |||||||||||||||||||||||||||||||||
|
|
|
| |||||||||||||||||||||||||||||||||||||||||
EBITDA | $ | 127,328 | $ | 89,578 | $ | 95,640 | $ | 68,930 | $ | 136,458 | $ | 170,345 | $ | 187,870 | $ | 89,578 | $ | 95,640 | $ | 200,759 | $ | 252,345 | ||||||||||||||||||||||
|
|
|
| |||||||||||||||||||||||||||||||||||||||||
Adjusted EBITDA Reconciliation: | ||||||||||||||||||||||||||||||||||||||||||||
EBITDA | $ | 127,328 | $ | 89,578 | $ | 95,640 | $ | 68,930 | $ | 136,458 | $ | 170,345 | $ | 187,870 | $ | 89,578 | $ | 95,640 | $ | 200,759 | $ | 252,345 | ||||||||||||||||||||||
Impairment of goodwill and other intangible assets | 44,015 | 7,009 | — | — | — | — | — | 7,009 | — | — | — | |||||||||||||||||||||||||||||||||
Expenses related to the Combination | — | — | 6,968 | 6,919 | — | 6,968 | — | — | 6,968 | — | — | |||||||||||||||||||||||||||||||||
Deferred loan costs written off | — | — | 6,082 | 6,082 | — | 6,082 | — | — | 6,082 | — | — | |||||||||||||||||||||||||||||||||
Contingent consideration for acquisitions | — | — | — | — | 6,000 | — | 6,000 | — | — | 12,100 | 12,100 | |||||||||||||||||||||||||||||||||
Transaction expenses for acquisitions | — | — | — | — | 3,434 | — | — | — | — | 3,608 | — | |||||||||||||||||||||||||||||||||
|
|
|
| |||||||||||||||||||||||||||||||||||||||||
Adjusted EBITDA | $ | 171,343 | $ | 96,587 | $ | 108,690 | $ | 81,931 | $ | 145,892 | $ | 183,395 | $ | 193,870 | $ | 96,587 | $ | 108,690 | $ | 216,467 | $ | 264,445 | ||||||||||||||||||||||
You should carefully consider the risks described below before making an investment decision. Our business, financial condition, results of operations or cash flow could be materially adversely affected by any of these risks. The trading price of our common stock could decline due to any of these risks, and you may lose all or part of your investment.
Risks related to our business
We derive a substantial portion of our revenues from companies in or affiliated with the oil and natural gas industry, a historically cyclical industry, with levels of activity that are significantly affected by the levels and volatility of oil and natural gas prices. As a result, this cyclicality may cause fluctuations in our revenues and results of our operations.
We have experienced, and expect to continue to experience, fluctuations in revenues and operating results due to economic and business cycles. The willingness of oil and natural gas operators to make capital expenditures to explore for and produce oil and natural gas and the willingness of oilfield service companies to invest in capital equipment depends largely upon prevailing industry conditions that are influenced by numerous factors over which we have no control, such as:
the supply of and demand for oil and natural gas;
the level of prices, and expectations about future prices, of oil and natural gas;
the cost of exploring for, developing, producing and delivering oil and natural gas;
the level of drilling activity and drilling day rates;
the expected decline rates of current and future production;
the discovery rates of new oil and natural gas reserves;
the ability of our customers to access new markets or areas of production or to continue to access current markets;
weather conditions, including hurricanes, that can affect oil and natural gas operations over a wide area;
more stringent restrictions in environmental regulation on activities that may impact the environment;
moratoriums on drilling activity resulting in a cessation or disruption of operations;
domestic and worldwide economic conditions;
political instability in oil and natural gas producing countries;
conservation measures and technological advances affecting energy consumption;
the price and availability of alternative fuels; and
merger and divestiture activity among oil and natural gas producers and drilling contractors.
The oil and natural gas industry historically has experienced significant volatility. For example, since January 1, 2008, the WTI Cushing crude oil spot price has ranged from a low of $30.52 per
Bbl on December 23, 2008 to a high of $146.30 per Bbl on July 11, 2008. Since January 1, 2008, the Henry Hub natural gas spot price has ranged from a low of $1.64 per Mcf on September 4, 2009 to a high of $13.41 per Mcf on July 2, 2008. The Henry Hub natural gas spot price on December 9, 2011March 8, 2012 was $3.41$2.22 per MMBtu, while the WTI Cushing crude oil spot price on December 9, 2011March 8, 2012 was $98.34$106.58 per barrel.
The recent substantial decrease in North American natural gas prices has resulted in a drop in drilling activity in certain North American areas that primarily produce dry gas, such as the Haynesville shale basin in Louisiana, the Fayetteville shale gas basin in Arkansas and the dry gas portion of the Marcellus shale basin in the Northeast. We have seen a decrease in activity from customers who conduct operations in those areas, some of whom previously provided substantial revenues to us. A continuation of these low natural gas prices, or a further weakening of them, could cause other customers to curtail drilling and reduce our revenues further from these areas. Any prolonged reduction in the overall level of exploration and development activities, whether resulting from changes in oil and natural gas prices or otherwise, could adversely impact our business in many ways by negatively affecting:
revenues, cash flows, and profitability;
the ability to maintain or increase borrowing capacity;
the ability to obtain additional capital to finance our business and the cost of that capital; and
the ability to attract and retain skilled personnel needed in the event of an upturn in the demand for services.
Our inability to control the inherent risks of acquiring and integrating businesses could disrupt our business, dilute stockholder value and adversely affect our operating results going forward.
We have pursued and intend to continue to pursue strategic acquisitions of complementary assets and businesses in the future, which could distract management from day-to-day tasks. Acquisitions involve numerous risks, including:
unanticipated costs and exposure to unforeseen liabilities;
difficulty in integrating the operations and assets of the acquired businesses;
potential loss of key employees and customers of the acquired company;
potential inability to properly establish and maintain effective internal controls over an acquired company; and
risk of entering markets in which we have limited prior experience.
Our failure to achieve consolidation savings, to incorporate the acquired businesses and assets into our existing operations successfully or to minimize any unforeseen operational difficulties could have a material adverse effect on our business. In addition, we may incur liabilities arising from events prior to the acquisition or prior to our establishment of adequate compliance oversight. While we generally seek to obtain indemnities for liabilities for events occurring before such acquisitions, these are limited in amount and duration or may be held to be unenforceable or the seller may not be able to indemnify us. We may also incur indebtedness to finance future acquisitions and also may issue equity securities in connection with such acquisitions. Debt service requirements could represent a burden on our results of operations and financial condition and the issuance of additional equity securities could be dilutive to our existing stockholders.
In addition to potential future acquisitions, the ongoing integration of our business in connection with the Combination and the eight acquisitions we have completed since the Combination presents a number of risks that could affect our results of operations. In particular, integrating the businesses from the Combination and our subsequent acquisitions is difficult and involves a number of special risks, including the diversion of management’s attention to the assimilation of the operations, the unpredictability of costs related to the Combination and our subsequent acquisitions and the difficulty of integration of the businesses, products, services,
technology and employees. The ability to achieve the anticipated benefits of the Combination and each of our other recent acquisitions will depend, in part, upon whether the integration of the various businesses, products, services, technology and employees is accomplished in an efficient and effective manner, and there can be no assurance that this will occur.
The difficulties of such integration may be increased by the geographic breadth of the combined operations and the necessity of integrating and combining different corporate cultures. The inability of management to successfully integrate any one or all of the businesses could have a material adverse effect on our business, operating results and financial condition. Moreover, there can be no assurance that we will be able to gain market share or penetrate new markets successfully or that we will obtain the anticipated or desired benefits of the Combination and our other recent or future acquisitions. Despite management’s belief that each of our products, services and operations will provide an increased breadth of services and sufficient “critical mass” in key operating areas, there can be no assurance that each of the services will gain acceptance by our other business segments or our current customers or that they will enable us to gain market share or penetrate new markets. If we fail to manage these risks successfully, our results of operations could be adversely affected.
Our operating history may not be sufficient for investors to evaluate our business and prospects.
We are a recently combined company with a short combined operating history. In addition, we have completed eight acquisitions since the Combination. These factors may make it more difficult for investors to evaluate our business and prospects and to forecast our future operating results. The historical consolidated financial statements included in this prospectus are based on the separate businesses of FOT, Global Flow, Triton, Allied and Subsea for the periods prior to the Combination. The unaudited pro forma condensed combined financial statements included in this prospectus are based on the separate financial statements of our company and the eight businesses we have acquired prior to the dates of such acquisitions. As a result, the historical and pro forma financial data may not give you an accurate indication of what our actual results would have been if the Combination or the 2011 Acquisitions had been completed at the beginning of the periods presented or of what our future results of operations are likely to be. Our future results will depend on our ability to efficiently manage our combined operations and execute our business strategy.
If we cannot continue operating our manufacturing facilities at current levels, our results of operations could be adversely affected.
We operate a number of manufacturing facilities. The equipment and management systems necessary for such operations may break down, perform poorly or fail, resulting in fluctuations in manufacturing efficiencies. Such fluctuations may affect our ability to deliver products to our customers on a timely basis.
Growing our business organically through the expansion of our existing product lines and facilities subjects us to risks of construction delays and cost overruns.
One of the ways that we grow our businesses is through the construction of new facilities and expansions to our existing facilities. These projects, and any other capital asset construction projects which we may commence, are subject to similar risks of delay or cost overrun inherent in any construction project resulting from numerous factors, including the following:
difficulties or delays in obtaining land;
shortages of key equipment, materials or skilled labor;
unscheduled delays in the delivery of ordered materials and equipment;
unanticipated cost increases;
weather interferences; and
difficulties in obtaining necessary permits or in meeting permit conditions.
We may be unable to employ a sufficient number of skilled and qualified workers.
The delivery of our products and services requires personnel with specialized skills and experience. Our ability to be productive and profitable will depend upon our ability to employ and retain skilled workers. In addition, our ability to expand our operations depends in part on our ability to increase the size of our skilled labor force. The demand for skilled workers is high, the supply is limited and the cost to attract and retain qualified personnel has increased over the past few years. For example, we have experienced shortages of drilling rig equipment engineers, software engineers and code welders, which, in some instances, has slowed the productivity of certain of our operations. Furthermore, a significant increase in the wages paid by competing employers could result in a reduction of our skilled labor force, increases in the wage rates that we must pay, or both. If any of these events were to occur, our capacity and profitability could be diminished, our ability to respond quickly to customer demands or strong market conditions may be inhibited and our growth potential could be impaired.
The current pace of spending for drilling rigs and other capital intensive equipment may not be sustainable over time, and our financial results may suffer to the extent they are dependent on sales of such equipment.
In various segments of the energy industry there is significantly increased demand for construction of capital intensive equipment, some of which has a long life once introduced into the industry. This could produce excess supply of equipment for many years, reducing dayrates and undermining the economics for new capital equipment orders. In addition, many oil field products manufacturers have increased manufacturing capacity to accommodate the increased demand for capital intensive equipment. If these levels of activity do not continue, an increased competitive environment for capital equipment could result, which could lead to lower prices and utilization for our customers and a decreased demand for capital equipment products. Similarly, excess manufacturing capacity in our industry could lead to increased competition. Our strategy is to serve a variety of segments and spend cycles, but to the extent our financial results are impacted by capital equipment construction, our results may decline should an excess supply of capital equipment materialize.
Our business depends upon our ability to obtain key raw materials and specialized equipment from suppliers. Increased costs of raw materials and other components may result in increased operating expenses.
Should our current suppliers be unable to provide the necessary raw materials or finished products or otherwise fail to deliver such materials and products timely and in the quantities required, resulting delays in the provision of products or services to customers could have a material adverse effect on our business. In particular, because many of our products are manufactured out of steel, we are particularly susceptible to fluctuations in steel prices. Our results of operations may be adversely affected by our inability to manage the rising costs and availability of raw materials and components used in our products.
If suppliers cannot provide adequate quantities of materials to meet customers’ demands on a timely basis or if the quality of the materials provided does not meet established standards, we may lose customers or experience lower profitability.
Some of our customer contracts require us to compensate customers if we do not meet specified delivery obligations. We expect to rely on numerous suppliers to provide required materials and in many instances these materials must meet certain specifications. Managing a geographically diverse supply base inherently poses significant logistical challenges. Furthermore, the ability of third party suppliers to deliver materials to our specifications may be affected by events beyond our control. As a result, there is a risk that we could experience diminished supplier performance resulting in longer than expected lead times and/or product quality issues. For example, we have in the past experienced issues with the quality of certain forgings used to produce materials that are used in our products. As a result, we were required to seek alternative suppliers for those forgings, which resulted in increased costs and a disruption in our supply chain. We have also been required in certain circumstances to provide better economic terms to some of our suppliers in exchange for their agreement to increase their capacity in order to satisfy our supply needs. The occurrence of any of the foregoing factors could have a negative impact on our ability to deliver products to customers within committed time frames.
We are subject to the risk of supplier concentration.
Certain of our product lines depend on a limited number of third party suppliers and vendors. As a result of this concentration in some of our supply chains, our business and operations could be negatively affected if our key suppliers were to experience significant disruptions affecting the price, quality, availability or timely delivery of their products. For example, we have a limited number of vendors for our bearings product lines. The partial or complete loss of any one of our key suppliers, or a significant adverse change in the relationship with any of these suppliers, through consolidation or otherwise, would limit our ability to manufacture and sell certain of our products.
Our operations and our customers’ operations are subject to a variety of governmental laws and regulations that may increase our costs, limit the demand for our products and services or restrict our operations.
Our business and our customers’ businesses may be significantly affected by:
federal, state and local and non-U.S. laws and other regulations relating to oilfield operations, worker safety and protection of the environment;
changes in these laws and regulations; and
the level of enforcement of these laws and regulations.
In addition, we depend on the demand for our products and services from the oil and gas industry. This demand is affected by changing taxes, price controls and other laws and regulations relating to the oil and gas industry in general. For example, the adoption of laws and regulations curtailing exploration and development drilling for oil and gas for economic or other policy reasons could adversely affect our operations by limiting demand for our products. In addition, some non-U.S. countries may adopt regulations or practices that give advantage to indigenous oil companies in bidding for oil leases, or require indigenous companies to perform oilfield services currently supplied by international service companies. To the extent that such
companies are not our customers, or we are unable to develop relationships with them, our business may suffer. We cannot determine the extent to which our future operations and earnings may be affected by new legislation, new regulations or changes in existing regulations.
Because of our non-U.S. operations and sales, we are also subject to changes in non-U.S. laws and regulations that may encourage or require hiring of local contractors or require non-U.S. contractors to employ citizens of, or purchase supplies from, a particular jurisdiction. If we fail to comply with any applicable law or regulation, our business, results of operations or financial condition may be adversely affected.
If we are unable to accurately predict customer demand or if customers cancel their orders on short notice, we may hold excess or obsolete inventory, which would reduce gross margins. Conversely, insufficient inventory would result in lost revenue opportunities and potentially in loss of market share and damaged customer relationships.
Customers can generally cancel or defer purchase orders on short notice without incurring a significant penalty. As a result, we cannot accurately predict what or how many products such customers will need in the future. Anticipating demand is difficult because our customers face unpredictable demand for their own products and are increasingly focused on cash preservation and tighter inventory management.
Orders are placed with our suppliers based on forecasts of customer demand and, in some instances, we may establish buffer inventories to accommodate anticipated demand. For example, we often build certain capital equipment, such as ROVs, before receiving customer orders, and we keep our standardized downhole protection systems and certain of our flow iron products in stock and readily available for delivery on short notice from customers. Our forecasts of customer demand are based on multiple assumptions, each of which may introduce errors into the estimates. In addition, many of our supplies,suppliers, such as those for certain of our standardized valves, require a longer lead time to provide products than our customers demand for delivery of our finished products. If we overestimate customer demand, we may allocate resources to the purchase of material or manufactured products that we may not be able to sell when we expect to, if at all. As a result, we would hold excess or obsolete inventory, which would reduce gross margin and adversely affect financial results. Conversely, if we underestimate customer demand or if insufficient manufacturing capacity is available, we would miss revenue opportunities and potentially lose market share and damage our customer relationships. In addition, any future significant cancellations or deferrals of product orders or the return of previously sold products could materially and adversely affect profit margins, increase product obsolescence and restrict our ability to fund our operations.
The markets in which we operate are highly competitive, and some of our competitors hold substantial market share and have substantially greater resources than we do. We may not be able to compete successfully in this environment and, in particular, against a much larger competitor.
The markets in which we operate are highly competitive and our products and services are subject to competition from significantly larger businesses. One competitor in particular holds substantial market share in our largest product line’s market and has substantially greater resources than we do. We have several other competitors that also are large national and multi-national companies that have longer operating histories, greater financial, technical and other resources and greater name recognition than we do. Some of our competitors may be able to
respond more quickly to new or emerging technologies and services and changes in customer requirements. In addition, several of our competitors provide a much broader array of services and have a stronger presence in more geographic markets. Our larger competitors may be able to use their size and purchasing power to seek economies of scale and pricing concessions. Furthermore, some of our customers are also our competitors and they may cease buying from us. We also have competitors outside of the United States with lower structural costs due to labor and raw material cost in and around their manufacturing centers.
New competitors also could enter these markets. We consider product quality, performance, price, distribution capabilities and breadth of product offerings to be the primary competitive factors. Competitors may be able to offer more attractive pricing, duplicate strategies, or develop enhancements to products that could offer performance features that are superior to our products. In addition, we may not be able to retain key employees of entities that we acquire in the future and those employees may choose to compete against us. Competitive pressures, including those described above, and other factors could adversely affect our competitive position, resulting in a loss of market share or decreases in prices. In addition, some competitors are based in foreign countries and have cost structures and prices based on foreign currencies. Accordingly, currency fluctuations could cause U.S. dollar-priced products to be less competitive than our competitors’ products that are priced in other currencies. For more information about our competitors, please read “Business—Competition.”
Our products are used in operations that are subject to potential hazards inherent in the oil and gas industry and, as a result, we are exposed to potential liabilities that may affect our financial condition and reputation.
Our products are used in potentially hazardous drilling, completion and production applications in the oil and gas industry where an accident or a failure of a product can potentially have catastrophic consequences. Risks inherent to these applications, such as equipment malfunctions and failures, equipment misuse and defects, explosions, blowouts and uncontrollable flows of oil, natural gas or well fluids and natural disasters, on land or in deepwater or shallow-water environments, can cause personal injury, loss of life, suspension of operations, damage to formations, damage to facilities, business interruption and damage to or destruction of property, surface water and drinking water resources, equipment and the environment. In addition, we provide certain services that could cause, contribute to or be implicated in these events. If our products or services fail to meet specifications or are involved in accidents or failures, we could face warranty, contract or other litigation claims, which could expose us to substantial liability for personal injury, wrongful death, property damage, loss of oil and gas production, pollution and other environmental damages. Our insurance policies may not be adequate to cover all liabilities. Further, insurance may not be generally available in the future or, if available,
insurance premiums may make such insurance commercially unjustifiable. Moreover, even if we are successful in defending a claim, it could be time-consuming and costly to defend.
In addition, the frequency and severity of such incidents will affect operating costs, insurability and relationships with customers, employees and regulators. In particular, our customers may elect not to purchase our services if they view our safety record as unacceptable, which could cause us to lose customers and substantial revenues. In addition, these risks may be greater for us because we may acquire companies that have not allocated significant resources and management focus to safety and have a poor safety record requiring rehabilitative efforts during the integration process.process and we may incur liabilities for losses before such rehabilitation occurs.
Our operations are subject to environmental and operational safety laws and regulations that may expose us to significant costs and liabilities.
Our operations are subject to numerous stringent and complex laws and regulations governing the discharge of materials into the environment, health and safety aspects of our operations, or otherwise relating to human health and environmental protection. These laws and regulations may, among other things, regulate the management and disposal of hazardous and non-hazardous wastes; require acquisition of environmental permits related to our operations; restrict the types, quantities, and concentrations of various materials that can be released into the environment; limit or prohibit operational activities in certain ecologically sensitive and other protected areas; regulate specific health and safety criteria addressing worker protection; require compliance with operational and equipment standards; impose testing, reporting and record- keeping requirements; and require remedial measures to mitigate pollution from former and ongoing operations. Failure to comply with these laws and regulations or to obtain or comply with permits may result in the assessment of administrative, civil and criminal penalties, imposition of remedial or corrective action requirements and the imposition of injunctions to prohibit certain activities or force future compliance. Certain environmental laws may impose joint and several liability, without regard to fault or legality of conduct, on classes of persons who are considered to be responsible for the release of a hazardous substance into the environment. In addition, these risks may be greater for us because the companies we acquire or have acquired may not have allocated sufficient resources and management focus to environmental compliance, potentially requiring rehabilitative efforts during the integration process or exposing us to liability before such rehabilitation occurs.
The trend in environmental regulation has been to impose increasingly stringent restrictions and limitations on activities that may impact the environment. The implementation of new laws and regulations could result in materially increased costs, stricter standards and enforcement, larger fines and liability and increased capital expenditures and operating costs, particularly for our customers.
We may incur liabilities, fines, penalties or additional costs, or we may be unable to sell to certain customers if we do not maintain safe operations.
If we fail to comply with safety regulations or maintain an acceptable level of safety at our facilities we may incur fines, penalties or other liabilities, or may be held criminally liable. We may incur additional costs to upgrade equipment or conduct additional training, or otherwise incur costs in connection with compliance with safety regulations. Failure to maintain safe operations or achieve certain safety performance metrics could disqualify the Company from doing business with certain customers, particularly major oil companies.
Our executive officers and certain key personnel are critical to our business and these officers and key personnel may not remain with us in the future.
Our future success depends in substantial part on our ability to hire and retain our executive officers and other key personnel. In particular, we are highly dependent on certain of our executive officers, including our President, Chief Executive Officer and Chairman, C. Christopher Gaut, and the Presidents of each of our divisions, Charles E. Jones and Wendell R. Brooks. These individuals possess extensive expertise, talent and leadership, and they are critical to our success. The diminution or loss of the services of these individuals, or other integral key personnel affiliated with entities that we acquire in the future, could have a material adverse effect on our business. Furthermore, we may not be able to enforce all of the provisions in any employment agreement we have entered into with certain of our executive officers and such employment agreements may not otherwise be effective in retaining such individuals. In addition, we may not be able to retain key employees of entities that we acquire in the future. This may impact our ability to successfully integrate or operate the assets we acquire.
The industry in which we operate is undergoing continuing consolidation that may impact results of operations.
Some of our largest customers have consolidated and are using their size and purchasing power to achieve economies of scale and pricing concessions. This consolidation may result in reduced capital spending by such customers or the acquisition of one or more of our other primary customers, which may lead to decreased demand for our products and services. If we cannot maintain sales levels for customers that have consolidated or replace such revenues with
increased business activities from other customers, this consolidation activity could have a significant negative impact on results of operations or financial condition. We are unable to predict what effect consolidations in the industries may have on prices, capital spending by customers, selling strategies, competitive position, ability to retain customers or ability to negotiate favorable agreements with customers.
If we are unable to continue operating successfully overseas or to successfully expand into new international markets, our revenues may decrease.
For the year ended December 31, 2010,2011, we derived approximately 43%39% of our pro forma revenue from sales outside the United States (based on product destination). In addition, one of our key growth strategies is to market products in international markets. We may not succeed in marketing, developing a recognized brand, selling, distributing products and generating revenues in these new international markets.
Our non-U.S. operations will subject us to special risks.
For the year ended December 31, 2010,2011, we derived approximately 43%39% of our pro forma revenue from sales outside of the United States (based on product destination), primarily from Canada, the United Kingdom and Singapore. Additionally, as of December 31, 2010,2011, approximately 47%28% of our total long-lived assets resided outside of the United States, primarily in Canada and the United Kingdom. We are subject to the various risks inherent in conducting business operations in locations outside of the United States. These risks may include changes in regional, political or economic conditions, local laws and policies, including taxes, trade protection measures, and unexpected changes in regulatory requirements governing the operations of companies that operate outside of the United States. In addition, if a dispute arises from international operations,
courts outside of the United States may have exclusive jurisdiction over the dispute, or we may not be able to subject persons outside of the United States to the jurisdiction of U.S. courts.
Our exposure to currency exchange rate fluctuations may result in fluctuations in our cash flows and could have an adverse effect on our results of operations.
From time to time, fluctuations in currency exchange rates could be material to us depending upon, among other things, our manufacturing locations and the sourcing for our raw materials and components. In particular, we are sensitive to fluctuations in currency exchange rates between the United States dollar and each of the Canadian dollar, the British pound sterling, and, to a lesser degree, the Mexican Peso, the Euro, the Chinese Yuan and the Singapore dollar. There may be instances in which costs and revenue will not be matched with respect to currency denomination. As a result, to the extent that we continue our expansion on a global basis, management expects that increasing portions of revenue, costs, assets and liabilities will be subject to fluctuations in foreign currency valuations. We may experience economic loss and a negative impact on earnings or net assets solely as a result of foreign currency exchange rate fluctuations. Further, the markets in which we operate could restrict the removal or conversion of the local or foreign currency, resulting in our inability to hedge against these risks.
Our business operations in countries outside of the United States are subject to a number of U.S. federal laws and regulations, including restrictions imposed by the Foreign Corrupt Practices Act as well as trade sanctions administered by the Office of Foreign Assets Control and the Commerce Department.
Local laws and customs in many countries differ significantly from those in the United States. In many countries, particularly in those with developing economies, it is common to engage in
business practices that are prohibited by U.S. regulations applicable to us. The United States Foreign Corrupt Practices Act (“FCPA”) and similar anti-bribery laws in other jurisdictions, including the UK Bribery Act 2010, prohibit corporations and individuals, including us and our employees, from engaging in certain activities to obtain or retain business or to influence a person working in an official capacity. We are responsible for any violations by our employees, contractors and agents, whether based within or outside of the United States, for violations of the FCPA. We may also be held responsible for any violations by an acquired company that occur prior to an acquisition, or subsequent to the acquisition but before we are able to institute our compliance procedures. In addition, our non-U.S. competitors that are not subject to the FCPA or similar laws may be able to secure business or other preferential treatment in such countries by means that such laws prohibit with respect to us. The UK Bribery Act 2010 is broader in scope than the FCPA and applies to public and private sector corruption and contains no facilitating payments exception. A violation of any of these laws, even if prohibited by our policies, could have a material adverse effect on our business. Actual or alleged violations could damage our reputation, be expensive to defend, and impair our ability to do business.
Compliance with U.S. regulations on trade sanctions and embargoes administered by the United States Department of the Treasury’s Office of Foreign Assets Control (“OFAC”) also poseposes a risk to us. We cannot provide products or services to certain countries subject to U.S. trade sanctions. Furthermore, the laws and regulations concerning import activity, export recordkeeping and reporting, export control and economic sanctions are complex and constantly changing. Any failure to comply with applicable legal and regulatory trading obligations could result in criminal and civil penalties and sanctions, such as fines, imprisonment, debarment from governmental contracts, seizure of shipments and loss of import and export privileges.
Unionization efforts and labor regulations in certain areas in which we operate could materially increase our costs or limit our flexibility.
We are not a party to any collective bargaining agreements, other than in our Monterrey, Mexico facility. We operate in certain states within the United States and in international areas that have a history of unionization and we may become the subject of a unionization campaign. If some or all of our workforce were to become unionized and collective bargaining agreement terms, including any renegotiation of our Monterrey, Mexico collective bargaining agreement, were significantly different from our current compensation arrangements or work practices, our costs could be increased, our flexibility in terms of work schedules and reductions in force could be limited, and we could be subject to strikes or work slowdowns among other things.
We may incur liabilities to customers as a result of warranty claims.
We provide warranties as to the proper operation and conformance to specifications of the products we manufacture or install. Failure of our products to operate properly or to meet specifications may increase costs by requiring additional engineering resources and services, replacement of parts and equipment or monetary reimbursement to a customer. We have in the past received warranty claims, and we expect to continue to receive them in the future. To the extent that we incur substantial warranty claims in any period, our reputation, ability to obtain future business and earnings could be adversely affected.
We are subject to litigation risks that may not be covered by insurance.
In the ordinary course of business, we become the subject of various claims, lawsuits and administrative proceedings seeking damages or other remedies concerning our commercial operations, products, employees and other matters, including occasional claims by individuals
alleging exposure to hazardous materials as a result of our products or operations. Some of these claims relate to the activities of businesses that we have acquired, even though these activities may have occurred prior to our acquisition of such businesses. Our insurance does not cover all of our potential losses, and we are subject to various self-insured retentions and deductibles under our insurance. A judgment may be rendered against us in cases in which we could be uninsured or beyond the amounts that we currently have reserved or anticipate incurring for such matters.
The number and cost of our current and future asbestos claims could be substantially higher than we have estimated and the timing of payment of claims could be sooner than we have estimated.
One of our subsidiaries has been and continues to be named as a defendant in asbestos related product liability actions. The actual amounts expended on asbestos-related claims in any year may be impacted by the number of claims filed, the volume of pre-trial proceedings, and the number of trials and settlements. As of December 31, 2010,2011, our subsidiary had a recorded liability of $250,000 net of anticipated insurance recoveries of $750,000, for the estimated indemnity cost associated with the resolution of its current open claims and future claims anticipated to be filed during the next five years.
Due to a number of uncertainties that may result in significant changes in the current estimate, the actual costs of resolving these pending claims could be substantially higher than the current estimate. Among these are uncertainties as to the ultimate number and type of claims filed, the amounts of claim costs, the impact of bankruptcies of other companies with asbestos claims or of our insurers, and potential legislative changes and uncertainties surrounding the litigation
process from jurisdiction to jurisdiction and from case to case. In addition, future claims beyond the five-year forecast period are possible, but the accrual does not cover losses that may arise from such additional future claims and, therefore, we have not accrued a liability for such additional future claims.
Significant costs are incurred in defending asbestos claims and these costs are recorded at the time incurred. Receipt of reimbursement from our insurers may be delayed for a variety of reasons. In particular, if our primary insurer claimsinsurers claim that certain policy limits have been exhausted, we may be delayed in receiving reimbursement as a result of the transition from one set of insurers to another. TheOur excess insurerinsurers may also dispute the claimclaims of exhaustion, or may rely on certain policy requirements to delay or deny claims. Furthermore, the various per occurrence and aggregate limits in different insurance policies may result in extended negotiations or the denial of reimbursement for particular claims. For more information on the cost sharing agreements related to this risk, please read “Business—Legal proceedings.”
Our senior secured credit facility contains certain covenants that may inhibit our ability to make certain investments, incur additional indebtedness and engage in certain other transactions, which could adversely affect our ability to meet our goals.
The credit agreement governing our senior secured credit facility contains various covenants that, among other things, limit our ability to grant certain liens, make certain loans and investments, make distributions, enter into mergers or acquisitions unless certain conditions are satisfied, enter into hedging transactions, change our lines of business, prepay certain indebtedness, enter into certain affiliate transactions or engage in certain asset dispositions. Additionally, the credit agreement governing our senior secured credit facility limits our ability to incur additional indebtedness with certain exceptions.
The credit agreement governing our senior secured credit facility also contains financial covenants, which, among other things, require us, on a consolidated basis, to maintain specified financial ratios or conditions summarized as follows:
Total funded debt to EBITDA (defined as the “Leverage Ratio” in the credit agreement) of not more than 3.75 to 1.0 for fiscal quarters ending through December 31, 2012, 3.50 to 1.0 for fiscal quarters ending from January 1, 2013 through December 31, 2013, 3.25 to 1.0 for fiscal quarters ending from January 1, 2014 through December 31, 2014, and 3.00 to 1.0 for fiscal quarters ending thereafter (provided, that following any senior, unsecured high yield issuance by our company, the maximum Leverage Ratio test will be 4.00 to 1.00 for each fiscal quarter after such issuance);
EBITDA to interest expense (defined as the “Interest Coverage Ratio” in the credit agreement) of not less than 3.0 to 1.0; and
Following any senior, unsecured high yield note issuance by our company, total secured funded debt to EBITDA (defined as the “Senior Secured Leverage Ratio” in the credit agreement) of not more than 2.50 to 1.00.
As a result of these covenants, we will be limited in the manner in which we conduct our business, and we may be unable to engage in favorable business activities or finance future operations or capital needs. A failure to comply with the covenants, ratios or tests in our senior secured credit facility or other covenants of our indebtedness could result in an event of default under our senior secured credit facility or other indebtedness, which, if not cured or waived, could have a material adverse affect on our business, financial condition and results of operations.
Our indebtedness could restrict our operations and make us more vulnerable to adverse economic conditions.
As of December 8, 2011,March 9, 2012, we had approximately $676$644.3 million of borrowings under our senior secured credit facility, $3.6$5.4 million of outstanding letters of credit and capacity to borrow an additional $224$250.3 million under the revolving portion of our senior secured credit facility. Our level of indebtedness may adversely affect our operations and limit our growth, and we may have difficulty making debt service payments on our indebtedness as such payments become due. Our level of indebtedness may affect our operations in several ways, including the following:
our indebtedness may increase our vulnerability to general adverse economic and industry conditions;
the covenants contained in the agreements that govern our indebtedness limit our ability to borrow funds, dispose of assets, pay dividends and make certain investments;
our debt covenants also affect our flexibility in planning for, and reacting to, changes in the economy and in its industry;
any failure to comply with the financial or other covenants of our indebtedness could result in an event of default, which could result in some or all of our indebtedness becoming immediately due and payable;
our indebtedness could impair our ability to obtain additional financing in the future for working capital, capital expenditures, acquisitions or other general corporate purposes; and
our business may not generate sufficient cash flows from operations to enable us to meet our obligations under our indebtedness.
If we fail to develop or maintain an effective system of internal controls, we may not be able to accurately report our financial results or prevent fraud.
Effective internal controls over financial processes and reporting are necessary for us to provide reliable financial reports and effectively prevent fraud and to operate successfully. Our efforts to continue to develop and maintain internal controls may not be successful and we may be unable to maintain adequate controls in the future. In addition, the entities that we acquire in the future may not maintain effective systems of internal controls or we may encounter difficulties integrating our system of internal controls with those of acquired entities. If we are unable to maintain effective internal controls and, as a result, fail to provide reliable financial reports and effectively prevent fraud, our reputation and operating results would be harmed.
We may be impacted by disruptions in the political, regulatory, economic and social conditions of the foreign countries in which we are expected to conduct business.
Instability and unforeseen changes in the international markets in which we conduct business, including economically and politically volatile areas such as North Africa, the Middle East, Latin America and the Asia Pacific region, could cause or contribute to factors that could have an adverse effect on the demand for the products and services we provide. For example, we have previously transferred management and operations from certain Latin American countries, due to the presence of political turmoil, to other countries in the region that are more politically stable.
In addition, worldwide political, economic, and military events have contributed to oil and natural gas price volatility and are likely to continue to do so in the future. Depending on the market prices
of oil and natural gas, oil and natural gas exploration and development companies may cancel or curtail their drilling programs, thereby reducing demand for our products and services.
Climate change legislation or regulations restricting emissions of greenhouse gases could increase our operating costs or reduce demand for our products.
Environmental advocacy groups and regulatory agencies in the United States and other countries have focused considerable attention on the emissions of carbon dioxide, methane and other greenhouse gases and their potential role in climate change. The U.S. Environmental Protection Agency (the “EPA”) has already begun to regulate greenhouse gas emissions under the federal Clean Air Act. The adoption of additional legislation or regulatory programs to reduce emissions of greenhouse gases could require us to incur increased operating costs to comply with new emissions-reduction or reporting requirements. Any such legislation or regulatory programs could also increase the cost of consuming, and thereby reduce demand for, hydrocarbons that our customers produce. Consequently, legislation and regulatory programs to reduce emissions of greenhouse gases could have an adverse effect on our business, financial condition and results of operations. Finally, some scientists have concluded that increasing concentrations of greenhouse gases in the Earth’s atmosphere may produce climate changes that have significant physical effects, such as increased frequency and severity of storms, droughts, and floods and other climatic events.
Adverse weather conditions adversely affect demand for services and operations.
Adverse weather conditions, such as hurricanes, tornadoes, ice or snow, may damage or destroy our facilities, interrupt or curtail our operations, or our customers’ operations, cause supply disruptions and result in a loss of revenue, which may or may not be insured. For example, certain of our facilities located in Oklahoma and Pennsylvania have experienced suspensions in operations due to tornado activity or extreme cold weather conditions.
A natural disaster, catastrophe or other event could result in severe property damage, which could curtail our operations.
Some of our operations involve risks of, among other things, property damage, which could curtail our operations. For example, disruptions in operations or damage to a manufacturing plant could reduce our ability to produce products and satisfy customer demand. In particular, we have offices and manufacturing facilities in Houston, Texas, and in various places throughout the Gulf Coast region of the United States. These offices and facilities are particularly susceptible to severe tropical storms and hurricanes, which may disrupt our operations. If one or more manufacturing facilities we own are damaged by severe weather or any other disaster, accident, catastrophe or event, our operations could be significantly interrupted. Similar interruptions could result from damage to production or other facilities that provide supplies or other raw materials to our plants or other stoppages arising from factors beyond our control. These interruptions might involve significant damage to, among other things, property and repairs might take from a week or less for a minor incident to many months or more for a major interruption.
Potential legislation or regulations restricting the use of hydraulic fracturing could reduce demand for our products.
Hydraulic fracturing is an important and common practice in the oil and gas industry, which involves the injection of water, sand and chemicals under pressure into a formation to fracture the surrounding rock and stimulate production of hydrocarbons. Certain environmental advocacy groups have suggested that additional federal, state and local laws and regulations may be
needed to more closely regulate the hydraulic fracturing process, and have made claims that hydraulic fracturing techniques are harmful to surface water and drinking water resources. TheVarious governmental entities (within and outside the United States) are in the process of studying, restricting, regulating or preparing to regulate hydraulic fracturing, directly or indirectly. For example, the EPA has already begun to regulate certain hydraulic fracturing operations involving diesel under the auspices of the Underground Injection Control program under the federal Safe Drinking Water Act. Legislation has been proposed at the federal, stateAct, and local levels to restrict or further regulate certain hydraulic fracturing activities, and the EPA is conducting a study to determine if additional regulation of hydraulic fracturing is warranted. The adoption of legislation or regulatory programs that restrict hydraulic fracturing could adversely affect, reduce or delay well drilling and completion activities, increase the cost of drilling and production, and thereby reduce demand for our products and services.
Our financial results could be adversely impacted by the Macondo well incident and the resulting changes in regulation of offshore oil and natural gas exploration and development activity.
The United States Department of the Interior has issued Notices to Lessees and Operators (NTLs), implemented additional safety and certification requirements applicable to drilling activities in the U.S. Gulf of Mexico, imposed additional requirements with respect to exploration, development and production activities in U.S. waters and delayed the approval of drilling plans and well permits in both deepwater and shallow-water areas. The delays caused by new regulations and requirements have and will continue to have an overall negative effect on Gulf of Mexico drilling activity, and to a certain extent, our financial results.
The Macondo well incident and resulting moratorium on drilling has caused offshore drilling delays, increased federal regulation of offshore drilling, and could result in increased state, international and additional federal regulation of our and our customers’ operations that could
negatively impact our earnings, prospects and the availability and cost of insurance coverage. There have been a variety of proposals to change existing laws and regulations that could affect offshore development and production, including proposals to significantly increase the minimum financial responsibility demonstration required under the federal Oil Pollution Act of 1990. Any increased regulation of the exploration and production industry as a whole that arises out of the Macondo well incident or otherwise could result in fewer companies being financially qualified to operate offshore in the United States, result in higher operating costs for our customers and reduce demand for our products and services. Additionally, a similar incident in another region could result in increased regulation in that market or in other offshore markets and could have a similar effect.
We may not be able to satisfy technical requirements, testing requirements, code requirements or other specifications under contracts and contract tenders.
Many of our products are used in harsh environments and severe service applications. Our contracts with customers and customer requests for bids often set forth detailed specifications or technical requirements (including that they meet certain industrial code requirements, such as API, ASME or similar codes, or that our processes and facilities maintain ISO or similar certifications) for our products and services, which may also include extensive testing requirements. We anticipate that such code testing requirements will become more common in our contracts. We cannot assure you that our products or facilities will be able to satisfy the specifications or requirements, or that we will be able to perform the full-scale testing necessary to prove that the product specifications are satisfied in future contract bids or under existing contracts, or that the costs of modifications to our products or facilities to satisfy the specifications and testing will not adversely affect our results of operations. If our products or facilities are unable to satisfy such requirements, or we are unable to perform or satisfy any
required full-scale testing, our customers may cancel their contracts and/or seek new suppliers, and our business, results of operations or financial position may be adversely affected.
Our success depends on our ability to implement new technologies and services.
Our success depends on the ongoing development and implementation of new product designs and improvements, and on our ability to protect and maintain critical intellectual property assets related to these developments. If we are not able to obtain patent or other intellectual property protection of our technology, we may not be able to recoup development costs or fully exploit systems, services and technologies in a manner that allows us to meet evolving industry requirements at prices acceptable to our customers. In addition, some of our competitors are large national and multinational companies that may be able to devote greater financial, technical, manufacturing and marketing resources to research and development of new systems, services and technologies than we are able to do. We have not spent material amounts on research and development activities during the three most recent fiscal years.
Our success will be affected by the use and protection of our proprietary technology. There are limitations to our intellectual property rights in our proprietary technology, and thus our right to exclude others from the use of such proprietary technology.
Our success will be affected by our development and implementation of new product designs and improvements and by our ability to protect and maintain critical intellectual property assets related to these developments. Although in many cases our products are not protected by any registered intellectual property rights, in other cases we rely on a combination of patents and trade secret laws to establish and protect this proprietary technology.
We currently hold multiple U.S. and international patents and have multiple pending patent applications for products and processes. Patent rights give the owner of a patent the right to exclude third parties from making, using, selling, and offering for sale the inventions claimed in the patents in the applicable country. Patent rights do not necessarily grant the owner of a patent the right to practice the invention claimed in a patent, but merely the right to exclude others from practicing the invention claimed in the patent. It may also be possible for a third party to design around our patents. Furthermore, patent rights have strict territorial limits. Some of our work will be conducted in international waters and would, therefore, not fall within the scope of any country’s patent jurisdiction. We may not be able to enforce our patents against infringement occurring in international waters and other “non-covered” territories. Also, we do not have patents in every jurisdiction in which we conduct business and our patent portfolio will not protect all aspects of our business and may relate to obsolete or unusual methods, which would not prevent third parties from entering the same market.
In addition, by customarily entering into confidentiality and/or license agreements with our employees, customers and potential customers and suppliers, we attempt to limit access to and
distribution of our technology. Our rights in our confidential information, trade secrets, and confidential know-how will not prevent third parties from independently developing similar information. Publicly available information (e.g. information in expired issued patents, published patent applications, and scientific literature) can also be used by third parties to independently develop technology. We cannot provide assurance that this independently developed technology will not be equivalent or superior to our proprietary technology.
Our competitors may infringe upon, misappropriate, violate or challenge the validity or enforceability of our intellectual property and we may not able to adequately protect or enforce our intellectual property rights in the future.
We may be adversely affected by disputes regarding intellectual property rights and the value of our intellectual property rights is uncertain.
As discussed above, we may become involved in legal proceedings from time to time to protect and enforce our intellectual property rights. Third parties from time to time may initiate litigation against us by asserting that the conduct of our business infringes, misappropriates or otherwise violates intellectual property rights. We may not prevail in any such legal proceedings related to such claims, and our products and services may be found to infringe, impair, misappropriate, dilute or otherwise violate the intellectual property rights of others. Any legal proceeding concerning intellectual property could be protracted and costly and is inherently unpredictable and could have a material adverse effect on our business, regardless of its outcome. Further, our intellectual property rights may not have the value that management believes them to have and such value may change over time as we and others develop new product designs and improvements.
A failure of our information technology infrastructure could adversely impact our business and results of operations.
The efficient operation of our business is dependent on our information technology (“IT”) systems. Accordingly, we rely upon the capacity, reliability and security of our IT hardware and software infrastructure and our ability to expand and update this infrastructure in response to our changing needs. Despite our implementation of security measures, our IT systems are vulnerable to computer viruses, natural disasters, incursions by intruders or hackers, failures in hardware or software, power fluctuations, cyber terrorists and other similar disruptions. The failure of our IT systems to perform as anticipated for any reason or any significant breach of security could disrupt our business and result in numerous adverse consequences, including reduced effectiveness and efficiency of our operations and that of our customers, inappropriate disclosure of confidential information, increased overhead costs, and loss of intellectual property, which could have a material adverse effect on our business and results of operations. In addition, we may be required to incur significant costs to prevent damage caused by these disruptions or security breaches in the future.
In the past we have incurred certain impairment charges. We may incur additional impairment charges in future years.
We evaluate our long-lived assets, including property and equipment, for potential impairment whenever events or changes in circumstances indicate that the carrying amount of a long-lived asset may not be recoverable. In performing our review for impairment, future cash flows expected to result from the use of the asset and its eventual value upon disposal are estimated. If the undiscounted future cash flows are less than the carrying amount of the assets, the asset is impaired. The amount of the impairment is measured as the difference between the carrying value and the estimated fair value of the asset. The fair value is determined either through the use of an external valuation, or by means of an analysis of discounted future cash flows based on expected utilization. The impairment loss recognized represents the excess of the asset’s carrying value as compared to its estimated fair value.
For goodwill and intangible assets with indefinite lives, an assessment for impairment is performed annually or whenever an event indicating impairment may have occurred. Goodwill is reviewed for impairment by comparing the carrying value of each reporting unit’s net assets, including allocated goodwill, to the estimated fair value of the reporting unit. We have foursix reporting units. We determine the fair value of our reporting units using a discounted cash flow
approach. Determining the fair value of a reporting unit requires judgment and the use of significant estimates and assumptions. If the reporting unit’s carrying value is greater than its fair value, a second step is performed whereby the implied fair value of goodwill is estimated by allocating the fair value of the reporting unit in a hypothetical purchase price allocation analysis.
We recognize a goodwill impairment charge for the amount by which the carrying value of goodwill exceeds its reassessed fair value. For the yearyears ended December 31, 2010 and 2011 no impairment loss was recorded, but for the yearsyear ended December 31, 2008 and 2009, we recorded an impairment chargescharge of $44.0 million and $7.0 million, respectively.$7 million.
If we determine that the carrying value of our long-lived asset,assets, goodwill or intangible assets is less than their fair value, we may be required to record additional charges in the future.
Risks related to our common stock
The initial public offering price of our common stock may not be indicative of the market price of our common stock after this offering. In addition, an active liquid trading market for our common stock may not develop and our common stock price may be volatile.
Prior to this offering, our common stock was not traded on any market. An active and liquid trading market for our common stock may not develop or be maintained after this offering. Liquid and active trading markets usually result in less price volatility and more efficiency in carrying out investors’ purchase and sale orders. The market price of our common stock could vary significantly as a result of a number of factors, some of which are beyond our control. In the event of a drop in the market price of our common stock, you could lose a substantial part or all of your investment in our common stock. The initial public offering price will be negotiated between us and representatives of the underwriters, based on numerous factors which we discuss in the “Underwriting (conflicts of interest)” section of this prospectus, and may not be indicative of the market price of our common stock after this offering. Consequently, you may not be able to sell shares of our common stock at prices equal to or greater than the price paid by you in the offering.
The following factors could affect our common stock price:
our operating and financial performance;
quarterly variations in the rate of growth of our financial indicators, such as net income per share, net income, EBITDA and revenues;
changes in revenue or earnings estimates or publication of reports by equity research analysts;
speculation in the press or investment community;
sales of our common stock by us or other stockholders, or the perception that such sales may occur;
general market conditions, including fluctuations in commodity prices; and
domestic and international economic, legal and regulatory factors unrelated to our performance.
The trading markets in general have experienced extreme volatility that has often been unrelated to the operating performance of particular companies. These broad market fluctuations may adversely affect the trading price of our common stock.
We will incur increased costs as a result of being a public company.
As a privately held company, we have not been responsible for the corporate governance and financial reporting practices and policies required of a publicly traded company. As a publicly traded company with listed equity securities we will need to comply with new laws, regulations and requirements, including corporate governance provisions of the Sarbanes-Oxley Act of 2002, and rules and regulations of the SEC and the NYSE. Complying with these statutes, regulations and requirements will occupy a significant amount of time of our board of directors and management and will significantly increase our costs and expenses. We will need to:
institute a more comprehensive compliance function;
design, establish, evaluate and maintain a system of internal controls over financial reporting in compliance with the requirements of Section 404 of the Sarbanes-Oxley Act of 2002 and the related rules and regulations of the SEC and the Public Company Accounting Oversight Board, or “PCAOB”;
comply with rules promulgated by the NYSE;
prepare and distribute periodic public reports in compliance with our obligations under the federal securities laws;
establish new internal policies, such as those relating to disclosure controls and procedures and insider trading;
involve and retain to a greater degree outside counsel and accountants in the above activities; and
establish an investor relations function.
In addition, we also expect that being a public company subject to these rules and regulations will require us to accept less director and officer liability insurance coverage than we desire or to incur substantial costs to obtain coverage. These factors could also make it more difficult for us to attract and retain qualified members of our board of directors, particularly to serve on our Audit Committee, qualified executive officers and key personnel.
Future sales of our common stock in the public market could lower our stock price, and any additional capital raised by us through the sale of equity may dilute your ownership in us.
We may sell additional shares of common stock in subsequent public offerings. After the completion of this offering and the concurrent private placement, we will have outstanding shares of common stock (assuming the full exercise of the underwriters’ over-allotment option). Following the completion of this offering and the concurrent private placement, SCF will own shares, or approximately % of our total outstanding shares (assuming the full exercise of the underwriters’ over-allotment option), all of which are subject to a lock-up agreement between SCF and the underwriters described in “Underwriting (conflicts of interest),” but may be sold into the market in the future. SCF is a party to a registration rights agreement with us which requires us to effect the registration of its shares in certain circumstances no earlier than the expiration of the lock-up period contained in the underwriting agreement entered into in connection with this offering.
As soon as practicable after this offering, we intend to file a registration statement with the SEC on Form S-8 providing for the registration of shares of our common stock issued or reserved for
issuance under our stock incentive plan. Subject to the satisfaction of vesting conditions and the expiration of lock-up agreements, shares registered under this registration statement on Form S-8 will be available for resale immediately in the public market without restriction.
We cannot predict the size of future issuances of our common stock or the effect, if any, that future issuances and sales of shares of our common stock will have on the market price of our common stock. Sales of substantial amounts of our common stock (including shares issued in connection with an acquisition), or the perception that such sales could occur, may adversely affect prevailing market prices of our common stock.
Provisions in our organizational documents and under Delaware law could delay or prevent a change in control of our company, which could adversely affect the price of our common stock.
The existence of some provisions in our organizational documents and under Delaware law could delay or prevent a change in control of our Company that a stockholder may consider favorable, which could adversely affect the price of our common stock. Certain provisions of our amended and restated certificate of incorporation and amended and restated bylaws, which will be effective as of the closing of this offering, could make it more difficult for a third party to acquire control of our Company, even if the change of control would be beneficial to our stockholders. These provisions include:
a classified board of directors, so that only approximately one-third of our directors are elected each year;
the ability of our board of directors to issue preferred stock without stockholder approval;
limitations on the removal of directors; and
limitations on the ability of our stockholders to call special meetings.
In addition, our amended and restated bylaws establish advance notice provisions for stockholder proposals and nominations for elections to the board of directors to be acted upon at meetings of stockholders.
Purchasers of common stock will experience immediate and substantial dilution.
Assuming an initial public offering price of $ per share (the mid-point of the price range set forth on the cover page of this prospectus), and assuming we complete the concurrent private placement described in “Prospectus summary—The offering—Concurrent private placement,” purchasers of our common stock in this offering will experience an immediate and substantial dilution of $ per share in the net tangible book value per share of common stock from the initial public offering price, and our pro forma net tangible book value as of September 30,December 31, 2011, after giving effect to this offering and the concurrent private placement, would be $ per share. You will incur further dilution if outstanding options to purchase common stock are exercised. In addition, our certificate of incorporation allows us to issue significant numbers of additional shares, including shares that may be issued under our long-term incentive plans. Please read “Dilution” for a complete description of the calculation of net tangible book value.
We have no current intention to pay future dividends.
We do not currently anticipate declaring or paying any cash dividends to holders of our common stock in the foreseeable future. We currently intend to retain future earnings, if any, to fund the development and growth of our business. Our future dividend policy is within the discretion of
our board of directors and will depend upon various factors, including our results of operations, financial condition, capital requirements and investment opportunities. In addition, our senior
secured credit facility prohibits us from paying cash dividends unless all the following conditions are met: (i) no default exists under our senior secured credit facility or would result from the payment of such dividends; (ii) after giving effect to the payment of such dividends, we have a pro forma leverage ratio that is less than or equal to 2.50 to 1.0 and the borrowing availability under our senior secured credit facility is at least $40 million; (iii) the aggregate amount of cash dividends and other Restricted Payments (as defined in the credit agreement) paid in any fiscal quarter does not exceed 50% of our consolidated EBITDA for the prior four fiscal quarters; and (iv) the aggregate amount of cash dividends and other Restricted Payments paid in any four consecutive fiscal quarters does not exceed 50% of our consolidated EBITDA for the prior four fiscal quarters. Please read “Dividend policy.”
We will be a “controlled company” within the meaning of the NYSE rules and will qualify for and have the ability to rely on exemptions from certain NYSE corporate governance requirements.
Because SCF will own a majority of our outstanding common stock following the completion of this offering, we will be a “controlled company” as that term is set forth in Section 303A of the NYSE Listed Company Manual. Under the NYSE rules, a company of which more than 50% of the voting power is held by another person or group of persons acting together is a “controlled company” and may elect not to comply with certain NYSE corporate governance requirements, including:
the requirement that a majority of its board of directors consist of independent directors;
the requirement that its nominating and governance committee be composed entirely of independent directors with a written charter addressing the committee’s purpose and responsibilities; and
the requirement that its compensation committee be composed entirely of independent directors with a written charter addressing the committee’s purpose and responsibilities.
These requirements will not apply to us as long as we remain a “controlled company.” Following this offering and so long as SCF owns a majority of our outstanding common stock, we have the option to utilize these exemptions. Accordingly, should we choose to utilize such exemptions, you may not have the same protections afforded to stockholders of companies that are subject to all of the corporate governance requirements of the NYSE. SCF’s significant ownership interest could adversely affect investors’ perceptions of our corporate governance.
Risks related to our relationship with SCF
L.E. Simmons & Associates, Incorporated (“LESA”), through SCF, will control the outcome of stockholder voting and may exercise this voting power in a manner adverse to you.
After the offering, SCF will hold approximately shares of our common stock, (orequal to approximately % of the outstanding common stock following completion of this offering and the concurrent private placement (or % if the over-allotment option is exercised in full). LESA is the ultimate general partner of SCF and will be in a position to control the outcome of most matters requiring a stockholder vote, including the election of directors, adoption of amendments to our charter and bylaws and approval of transactions involving a change of control. LESA’s interests may differ from yours, and SCF may vote its common stock in a manner that may adversely affect you.
Certain of our directors may have conflicts of interest because they are also directors or officers of SCF. The resolution of these conflicts of interest may not be in our or your best interests.
Certain of our directors, namely David C. Baldwin and Andrew L. Waite, are currently officers of LESA. In addition, a trust in which the children of our Chief Executive Officer, C. Christopher Gaut, are primary beneficiaries will continue to hold an ownership interest in the general partner of each of SCF-VI, L.P. and SCF-VII, L.P. after the offering. These positions may create conflicts of interest because these directors and Mr. Gaut have an ownership interest in SCF-VI, L.P. and SCF-VII, L.P. and/or responsibilities to SCF and its owners. Duties as directors or officers of LESA may conflict with such individuals’ duties as one of our directors or officers regarding business dealings and other matters between SCF and us. The resolution of these conflicts may not always be in our or your best interest. Please read “—We have renounced any interest in specified business opportunities, and SCF and its director nominees on our board of directors generally have no obligation to offer us those opportunities.”
We have renounced any interest in specified business opportunities, and SCF and its director nominees on our board of directors generally have no obligation to offer us those opportunities.
Our certificate of incorporation provides that, so long as we have a director or officer who is affiliated with SCF (an “SCF Nominee”) and for a continuous period of one year thereafter, we renounce any interest or expectancy in any business opportunity in which any member of the SCF group participates or desires or seeks to participate in and that involves any aspect of the energy equipment or services business or industry, other than (i) any business opportunity that is brought to the attention of an SCF Nominee solely in such person’s capacity as a director or officer of our Company and with respect to which no other member of the SCF group independently receives notice or otherwise identifies such opportunity and (ii) any business opportunity that is identified by the SCF group solely through the disclosure of information by or on behalf of our Company. We refer to SCF and its other affiliates and its portfolio companies as the SCF group. We are not prohibited from pursuing any business opportunity with respect to which we have renounced any interest.
SCF has investments in other oilfield service companies that may compete with us, and SCF and its affiliates, other than our Company, may invest in other such companies in the future. LESA, the ultimate general partner of SCF, has an internal policy that discourages it from investing in two or more portfolio companies with substantially overlapping industry segments and geographic areas. However, LESA’s internal policy does not restrict the management or operation of its other individual portfolio companies from competing with us. Pursuant to LESA’s policy, LESA may allocate any potential opportunities to the existing portfolio company where LESA determines, in its discretion, such opportunities are the most logical strategic and operational fit. As a result, LESA or its affiliates may become aware, from time to time, of certain business opportunities, such as acquisition opportunities, and may direct such opportunities to its other portfolio companies, in which case we may not become aware of or otherwise have the ability to pursue such opportunities. Furthermore, LESA does not have a specific policy with regard to allocation of financial professionals and they are under no obligation to provide us with financial professionals, other than pursuant to the Secondment Agreement dated as of August 2, 2010 by and among LESA, W. Patrick Connelly and us, which expires on August 2, 2012.
Cautionary note regarding forward-looking statements
This prospectus contains forward-looking statements that are subject to a number of risks and uncertainties, many of which are beyond our control. All statements, other than statements of historical fact included in this prospectus, regarding our strategy, future operations, financial position, estimated revenues and losses, projected costs, prospects, plans and objectives of management are forward-looking statements. When used in this prospectus, the words “could,” “believe,” “anticipate,” “intend,” “estimate,” “expect,” “may,” “continue,” “predict,” “potential,” “project” and similar expressions are intended to identify forward-looking statements, although not all forward-looking statements contain such identifying words.
Forward-looking statements may include statements about:
business strategy;
cash flows and liquidity;
the volatility of oil and natural gas prices;
our ability to successfully manage our growth, including risks and uncertainties associated with integrating and retaining key employees of the businesses we acquire;
the availability of raw materials and specialized equipment;
availability of skilled and qualified labor;
our ability to accurately predict customer demand;
competition in the oil and gas industry;
governmental regulation and taxation of the oil and natural gas industry;
environmental liabilities;
political and social issues affecting the countries in which we do business;
our ability to deliver our backlog in a timely fashion;
our ability to implement new technologies and services;
availability and terms of capital;
general economic conditions;
benefits of the Combination and our acquisitions;
availability of key management personnel;
operating hazards inherent in our industry;
the continued influence of SCF;
the ability to establish and maintain effective internal controls over financial reporting;
the ability to operate effectively as a public traded company;
financial strategy, budget, projections and operating results;
uncertainty regarding our future operating results; and
plans, objectives, expectations and intentions contained in this prospectus that are not historical.
All forward-looking statements speak only as of the date of this prospectus; we disclaim any obligation to update these statements unless required by law and we caution you not to place undue reliance on them. Although we believe that our plans, intentions and expectations reflected in or suggested by the forward-looking statements we make in this prospectus are reasonable, we can give no assurance that these plans, intentions or expectations will be achieved. We disclose important factors that could cause our actual results to differ materially from our expectations under “Risk factors” and “Management’s discussion and analysis of financial condition and results of operations” and elsewhere in this prospectus. These cautionary statements qualify all forward-looking statements attributable to us or persons acting on our behalf.
We will receive net proceeds of approximately $ million from the sale of the common stock by us in this offering, assuming an initial public offering price of $ per share (the midpoint of the price range set forth on the cover page of this prospectus) and after deducting estimated expenses and underwriting discounts and commissions of approximately $ million. If the over-allotment option is exercised in full, we estimate that our net proceeds will be approximately $ million. We will not receive any of the proceeds from any sale of shares of our common stock by the selling stockholders.
We intend to use all of the net proceeds from this offering and any proceeds from any exercise of the underwriters’ over-allotment option, together with the proceeds from the concurrent private placement, to repay outstanding borrowings under the revolving portion of our senior secured credit facility. Our senior secured credit facility matures in August 2014October 2016 and bore interest at a rate of 2.75% per annum as of December 8, 2011.March 9, 2012. Our outstanding borrowings under our senior secured credit facility were incurred to fund acquisitions and other capital expenditures. Affiliates of the underwriters are lenders under our senior secured credit facility and, accordingly, will receive a portion of the proceeds of this offering. See “Underwriting (conflicts of interest).” While we do not currently have any plans to immediately borrow additional amounts under the senior secured credit facility, we may at any time reborrow amounts repaid under the senior secured credit facility to the extent available.available, including to fund the acquisition opportunity described under “Prospectus summary—Recent developments,” if completed.
We estimate that the selling stockholders will receive net proceeds of approximately $ million from the sale of shares of common stock in this offering based upon the assumed initial offering price of $ per share, after deducting underwriting discounts and commissions. If the underwriters’ over-allotment option to purchase additional shares is exercised in full, we estimate that the selling stockholders’ net proceeds will be approximately $ million. We will pay all expenses related to this offering, other than underwriting discounts and commissions related to the shares sold by the selling stockholders.
An increase or decrease in the initial public offering price of $1.00 per share of common stock would cause the net proceeds that we will receive from the offering, after deducting estimated expenses and underwriting discounts and commissions, to increase or decrease by approximately $ million or by approximately $ million if the underwriters’ over-allotment option is exercised in full.
Prior to the completion of this offering, we expect the majority of our stockholders to approve, by written consent, an amendment to our certificate of incorporation to effect a stock split on a for basis. The stock split is expected to be effected simultaneously for all our then-existing common stock and the exchange ratio will be the same for all of our shares of issued and outstanding common stock. The stock split will affect all of our stockholders uniformly and will not affect any stockholder’s percentage ownership interests in us. Shares of common stock issued pursuant to the stock split will remain fully paid and nonassessable.
We do not anticipate declaring or paying any cash dividends to holders of our common stock in the foreseeable future. We currently intend to retain future earnings, if any, to fund the development and growth of our business. Our future dividend policy is within the discretion of our board of directors and will depend upon various factors, including our results of operations, financial condition, capital requirements and investment opportunities. In addition, our senior secured credit facility prohibits us from paying any cash dividends unless all of the following conditions are met: (i) no default exists under our senior secured credit facility or would result from the payment of such dividends, (ii) after giving effect to the payment of such dividends, we have a pro forma leverage ratio that is less than or equal to 2.50 to 1.0 and the borrowing availability under our senior secured credit facility is at least $40 million, (iii) the aggregate amount of cash dividends and other Restricted Payments (as defined in the credit agreement) paid in any fiscal quarter does not exceed 50% of our consolidated EBITDA (as defined in the credit agreement) for the prior four fiscal quarters and (iv) the aggregate amount of cash dividends and other Restricted Payments paid in any four consecutive fiscal quarters does not exceed 50% of our consolidated EBITDA for the prior four fiscal quarters.
The following table sets forth our capitalization as of September 30,December 31, 2011:
on an actual basis; and
on an as adjusted basis to give effect to this offering and the application of the net proceeds as set forth under “Use of proceeds.proceeds”; and
on an as further adjusted basis to give effect to the concurrent private placement and the application of the net proceeds as set forth under “The offering—Concurrent private placement.”
You should read the following table in conjunction with “Use of proceeds,” “Selected historical consolidated financial data,” “Management’s discussion and analysis of financial condition and results of operations” and our historical consolidated financial statements and related notes thereto appearing elsewhere in this prospectus.
| As of September 30, 2011 | As of December 31, 2011 | |||||||||||||||||||
| Actual | As adjusted | Actual | As adjusted | As further adjusted(3) | ||||||||||||||||
| (in thousands) | (in thousands) | |||||||||||||||||||
|
|
| ||||||||||||||||||
Cash and cash equivalents | $ | 36,928 | $ | $ | 20,548 | $ | $ | |||||||||||||
|
|
|
| |||||||||||||||||
Long-term debt, including current maturities: | ||||||||||||||||||||
Long-term debt, excluding current maturities: | ||||||||||||||||||||
Senior secured credit facility(1)(2) | $ | 684,000 | $ | $ | 363,694 | $ | $ | |||||||||||||
Term loan(2) | 300,000 | |||||||||||||||||||
Other long-term debt | 295 | 1,861 | ||||||||||||||||||
Less: current maturities | (5,176 | ) | ||||||||||||||||||
|
|
|
| |||||||||||||||||
Total long-term debt | 684,295 | 660,379 | ||||||||||||||||||
|
|
|
| |||||||||||||||||
Stockholders’ equity: | ||||||||||||||||||||
Common stock, $0.01 par value; shares authorized (actual, pro forma for anticipated for stock split); shares issued and outstanding (as adjusted) | 19 | |||||||||||||||||||
Common stock, $0.01 par value; shares authorized (actual, pro forma for anticipated for stock split); shares issued and outstanding (as adjusted); shares issued and outstanding (as further adjusted) | 18 | |||||||||||||||||||
Additional paid-in capital(1) | 422,539 | 425,127 | ||||||||||||||||||
Warrants | 27,097 | 27,097 | ||||||||||||||||||
Retained earnings | 212,416 | 244,145 | ||||||||||||||||||
Treasury stock | (25,877) | (25,877) | ||||||||||||||||||
Accumulated other comprehensive loss | (16,544) | (16,017) | ||||||||||||||||||
|
|
|
| |||||||||||||||||
Total stockholders’ equity(1) | 619,650 | 654,493 | ||||||||||||||||||
|
|
|
| |||||||||||||||||
Total capitalization(1) | $ | 1,303,945 | $ | $ | 1,335,420 | $ | $ | |||||||||||||
|
|
| ||||||||||||||||||
| (1) | Each $1.00 increase or decrease in the assumed initial public offering price of $ per share, the midpoint of the range set forth on the cover page of this prospectus, would increase or decrease the amount of borrowings outstanding under our senior secured credit facility, additional paid-in capital, total stockholders’ equity and total capitalization by approximately $ million, assuming the number of shares offered by us, as set forth on the cover page of this prospectus, remains the same and after deducting the estimated underwriting discounts and commissions and estimated expenses payable by us. |
| (2) |
| (3) | If the price at which we offer the securities to the public is above the range set forth on the cover of |
Purchasers of the common stock in this offering will experience immediate and substantial dilution in the net tangible book value per share of the common stock for accounting purposes. Our net tangible book value as of September 30,December 31, 2011, after giving pro forma effect to the transactions described under “Stock split,” was approximately $ million, or $ per share of common stock. Pro forma net tangible book value per share is determined by dividing our pro forma tangible net worth (tangible assets less total liabilities) by the total number of outstanding shares of common stock that will be outstanding immediately prior to the closing of this offering.offering and the concurrent private placement. After giving effect to our anticipated stock split and the sale of the shares in this offering and the concurrent private placement and assuming the receipt of the estimated net proceeds (after deducting estimated discounts and expenses of this offering)offering and the concurrent private placement), our adjusted pro forma net tangible book value as of September 30,December 31, 2011 would have been approximately $ million, or $ per share. This represents an immediate increase in the net tangible book value of $ per share to our existing stockholders and an immediate dilution (i.e., the difference between the offering price and the adjusted pro forma net tangible book value after this offering) to new investors purchasing shares in this offering of $ per share. The following table illustrates the per share dilution to new investors purchasing shares in this offering:
Assumed initial public offering price per share | $ | |||
Pro forma net tangible book value per share as of | ||||
Increase per share attributable to the new investor in the concurrent private placement | ||||
Increase per share attributable to new investors in this offering | ||||
As adjusted pro forma net tangible book value per share after giving effect to our stock split, | ||||
Dilution in pro forma net tangible book value per share to new investors in this offering | $ | |||
| ||||
The following table summarizes, on an adjusted pro forma basis as of September 30,December 31, 2011, the total number of shares of common stock owned by existing stockholders and to be owned by the new investor in the concurrent private placement and new investors in this offering, the total consideration paid, and the average price per share paid by our existing stockholders and to be paid by the new investor in the concurrent private placement and new investors in this offering at $ , the midpoint of the range of the initial public offering prices set forth on the cover page of this prospectus, calculated before deduction of estimated discounts and commissions:
| Shares acquired | Total consideration | Average price per share | ||||||||||||||
| Number Percent | Amount | Percent | ||||||||||||||
| ||||||||||||||||
Existing stockholders(1) | % | $ | % | $ | ||||||||||||
New investor in the concurrent private placement(2) | ||||||||||||||||
New investors in this offering | — | — | — | — | ||||||||||||
Total | % | $ | % | $ | ||||||||||||
| ||||||||||||||||
| (1) | The number of shares disclosed for the existing stockholders includes shares being sold by the selling stockholders in this offering. The number of shares disclosed for the new investors in this offering does not include the shares being purchased by the new investors from the selling stockholders in this offering. |
| (2) | If the price at which we offer the shares of common stock to the public is above the range set forth on the cover of this prospectus, the private equity firm that has been offered shares of our common stock pursuant to the concurrent private placement may elect not to purchase any common stock or to buy only a portion of the common stock. See “Prospectus summary—The offering—Concurrent private placement.” |
Assuming the underwriters’ over-allotment option is exercised in full, sales by us in this offering will reduce the percentage of shares held by existing stockholders to % and will increase the number of shares held by new investors to , or % on an adjusted pro forma basis as of September 30,December 31, 2011.
A $1.00 increase or decrease in the assumed initial public offering price of $ per share, which is the midpoint of the range set forth on the cover page of this prospectus, would increase or decrease our as adjusted pro forma net tangible book value as of September 30,December 31, 2011 by approximately $ million, the as adjusted pro forma net tangible book value per share after this offering by $ per share and the dilution in pro forma as adjusted net tangible book value per share to new investors in this offering by $ per share, assuming the number of shares offered by us, as set forth on the cover page of this prospectus, remains the same and after deducting the estimated underwriting discounts and commissions and estimated offering expenses payable by us.
Unaudited pro forma condensed combined financial data
We have completed the following acquisitions since the Combination in August 2010:
| Name of acquisition | Date completed | |||
| ||||
Wood Flowline Products, LLC | February 4, 2011 | |||
Phoinix Global LLC | April 29, 2011 | |||
Specialist ROV Tooling Services, Ltd. | May 16, 2011 | |||
Cannon Services LP | July 1, 2011 | |||
SVP Products Inc. | July 1, 2011 | |||
AMC Global Group Ltd. | July 1, 2011 | |||
P-Quip Ltd. | July 5, 2011 | |||
Davis-Lynch LLC | July 29, 2011 | |||
| ||||
The unaudited pro forma condensed combined statement of income for the year ended December 31, 20102011 gives effect to the eight acquisitions completed in 2011 as if each had occurred on January 1, 2010.2011. Under the rules and regulations of the SEC, the Davis-Lynch Acquisition was individually significant and the Wood Flowline Acquisition, the Phoinix Acquisition, the Specialist Acquisition, the Cannon Acquisition, the SVP Acquisition, the AMC Acquisition and the P-Quip Acquisition were each individually insignificant but, in the aggregate, are significant. Regulation S-X requires the presentation of audited financials for any significant acquisitions and for a substantial majority of the individually insignificant acquisitions when acquired businesses are individually insignificant, but significant in the aggregate. The unaudited pro forma condensed combined financial data has been prepared from our historical consolidated financial statements and related notes, the audited financials statements of Davis-Lynch, Wood Flowline, AMC Global, P-Quip and Cannon Services and the unaudited interim financial statements of Davis-Lynch and Cannon Services, each as included elsewhere in this prospectus, and the unaudited interim financial statements of Wood Flowline, AMC Global, P-Quip, Phoinix, Cannon Services, Specialist and SVP not included in this prospectus.
The pro forma financial data for the year ended December 31, 20102011 also gives effect to the issuance by us of shares of common stock pursuant to this offering and the concurrent private placement and the application of the net proceeds therefrom as described in “Use of proceeds,”proceeds” and “Prospectus summary—The offering—Concurrent private placement,“ respectively, in each case as if each such transaction had occurred on January 1, 2010. The pro forma condensed combined financial data for the nine months ended September 30, 2011 gives effect to the 2011 Acquisitions, the issuance by us of shares of common stock pursuant to this offering and the application of the net proceeds therefrom as described in “Use of proceeds,” in each case as if each such transaction had occurred on January 1, 2010.2011.
The unaudited pro forma condensed combined financial data included in this prospectus is not intended to represent what our financial position is or results of operations would have been if the acquisitions had occurred on any particular date or to project our results of operations for any future period. Since the Company and each of the acquired businesses were not under common control or management for some of or any period presented, the unaudited pro forma condensed combined financial results may not be comparable to, or indicative of, future performance.
The unaudited pro forma condensed combined statements of operations included herein have been prepared pursuant to the rules and regulations of the SEC. Certain information and certain footnote disclosures normally included in financial statements prepared in accordance with U.S.
GAAP have been condensed or omitted pursuant to these rules and regulations; however, management believes that the disclosures are adequate to make the information presented not misleading.
The unaudited pro forma condensed combined financial data does not reflect any cost savings, operating synergies or revenue enhancements that the combined company may achieve as a result of the acquisition, the costs to combine our operations and the acquisitions or the costs necessary to achieve these cost savings, operating synergies and revenue enhancements.
You should read the following tables in conjunction with the historical financial statements and related notes thereto appearing elsewhere in this prospectus.
Pro forma condensed combined statement of income
Year ended December 31, 2010
| Forum | Acquisitions(a) | Pro forma | Offering adjustments(c) | Pro forma, as adjusted | ||||||||||||||||
| (In thousands, except per share data) | ||||||||||||||||||||
| (Unaudited) | ||||||||||||||||||||
| ||||||||||||||||||||
Net sales | $ | 747,335 | $ | 208,114 | $ | 955,449 | $ | — | $ | 955,449 | ||||||||||
Costs of sales | 533,078 | 104,033 | 637,111 | — | 637,111 | |||||||||||||||
|
| |||||||||||||||||||
Gross profit | 214,257 | 104,081 | 318,338 | — | 318,338 | |||||||||||||||
Selling, general and administrative expenses | 141,441 | 44,130 | 185,571 | — | 185,571 | |||||||||||||||
Contingent consideration | ||||||||||||||||||||
Transaction expenses | ||||||||||||||||||||
(Gain) Loss on sale of assets | (461 | ) | (461 | ) | — | (461 | ) | |||||||||||||
|
| |||||||||||||||||||
Operating income | 73,277 | 59,951 | 133,228 | — | 133,228 | |||||||||||||||
|
| |||||||||||||||||||
Interest expense, net | 18,189 | 26,392 | 44,581 | (12,834 | ) | 31,747 | ||||||||||||||
Expenses related to the Combination | 6,968 | 6,968 | — | 6,968 | ||||||||||||||||
Deferred loan costs written off | 6,082 | 6,082 | — | 6,082 | ||||||||||||||||
Other (income), net | (2,308 | ) | (178 | ) | (2,486 | ) | — | (2,486 | ) | |||||||||||
|
| |||||||||||||||||||
Income before income taxes | 44,346 | 33,737 | 78,083 | 12,834 | 90,917 | |||||||||||||||
Income tax expense | 20,297 | 10,926 | 31,223 | 4,492 | 35,715 | |||||||||||||||
|
| |||||||||||||||||||
Net income | $ | 24,049 | $ | 22,811 | $ | 46,860 | $ | 8,342 | $ | 55,202 | ||||||||||
Less: Income attributable to noncontrolling interests | (111 | ) | — | (111 | ) | — | (111 | ) | ||||||||||||
|
| |||||||||||||||||||
Net income attributable to common stockholders | $ | 23,938 | $ | 22,811 | $ | 46,749 | $ | 8,342 | $ | 55,091 | ||||||||||
|
| |||||||||||||||||||
Earnings per share: | ||||||||||||||||||||
Basic | $ | 16.46 | ||||||||||||||||||
Diluted | $ | 16.31 | ||||||||||||||||||
Weighted average shares: | ||||||||||||||||||||
Basic | 1,454 | |||||||||||||||||||
Diluted | 1,468 | |||||||||||||||||||
| ||||||||||||||||||||
Nine months ended September 30, 2011
| Forum | Acquisitions(b) | Pro forma | Offering adjustments(c) | Pro forma, as adjusted | Forum | Acquisitions(a) | Pro forma | Offering adjustments(b) | Pro forma, as adjusted | |||||||||||||||||||||||||||||||
| (In thousands, except per share data) | (In thousands, except per share data) | |||||||||||||||||||||||||||||||||||||||
| (Unaudited) | (Unaudited) | |||||||||||||||||||||||||||||||||||||||
|
|
| ||||||||||||||||||||||||||||||||||||||
Net Sales | $ | 791,412 | $ | 117,614 | $ | 909,026 | $ | 909,026 | ||||||||||||||||||||||||||||||||
Net sales | $ | 1,128,131 | $ | 117,614 | $ | 1,245,745 | $ | 1,245,745 | ||||||||||||||||||||||||||||||||
Costs of sales | 542,832 | 53,992 | 596,824 | 596,824 | 765,670 | 53,992 | 819,662 | 819,662 | ||||||||||||||||||||||||||||||||
|
|
|
| |||||||||||||||||||||||||||||||||||||
Gross profit | 248,580 | 63,622 | 312,202 | — | 312,202 | 362,461 | 63,622 | 426,083 | — | 426,083 | ||||||||||||||||||||||||||||||
Selling, general and administrative expenses | 129,626 | 23,136 | 152,762 | — | 152,762 | 186,774 | 23,047 | 209,821 | — | 209,821 | ||||||||||||||||||||||||||||||
Contingent consideration | 6,000 | 6,000 | 6,000 | 12,100 | — | 12,100 | 12,100 | |||||||||||||||||||||||||||||||||
Transaction expenses | 3,434 | (3,434 | ) | — | — | 3,608 | (3,608 | ) | — | — | ||||||||||||||||||||||||||||||
(Gain) Loss on sale of assets | (520 | ) | (520 | ) | (520 | ) | (634 | ) | — | (634 | ) | (634 | ) | |||||||||||||||||||||||||||
|
|
|
| |||||||||||||||||||||||||||||||||||||
Income from operations | 110,040 | 43,920 | 153,960 | — | 153,960 | 160,613 | 44,183 | 204,796 | — | 204,796 | ||||||||||||||||||||||||||||||
|
|
|
| |||||||||||||||||||||||||||||||||||||
Interest expense, net | 13,723 | 13,594 | 27,317 | (6,487 | ) | 20,830 | 19,532 | 13,594 | 33,126 | (7,854 | ) | 25,272 | ||||||||||||||||||||||||||||
Other, net | 1,261 | (86 | ) | 1,175 | — | 1,175 | ||||||||||||||||||||||||||||||||||
Other (income), net | 378 | (86 | ) | 292 | — | 292 | ||||||||||||||||||||||||||||||||||
|
|
|
| |||||||||||||||||||||||||||||||||||||
Income before income taxes | 95,056 | 30,412 | 125,468 | 6,487 | 131,955 | 140,703 | 30,675 | 171,378 | 7,854 | 179,232 | ||||||||||||||||||||||||||||||
Income tax expense | 33,176 | 10,009 | 43,185 | 2,269 | 45,456 | 47,110 | 10,102 | 57,212 | 2,749 | 59,961 | ||||||||||||||||||||||||||||||
|
|
|
| |||||||||||||||||||||||||||||||||||||
Net income | 61,880 | 20,403 | 82,283 | 4,217 | 86,499 | $ | 93,593 | $ | 20,573 | $ | 114,166 | $ | 5,105 | $ | 119,271 | |||||||||||||||||||||||||
Less: Income attributable to noncontrolling interests | (267 | ) | — | (267 | ) | — | (267 | ) | (251 | ) | — | (251 | ) | — | (251 | ) | ||||||||||||||||||||||||
|
|
|
| |||||||||||||||||||||||||||||||||||||
Net income attributable to common stockholders | $ | 61,613 | $ | 20,403 | $ | 82,016 | $ | 4,217 | $ | 86,232 | $ | 93,342 | $ | 20,573 | $ | 113,915 | $ | 5,105 | $ | 119,020 | ||||||||||||||||||||
|
|
|
| |||||||||||||||||||||||||||||||||||||
Earnings per share: | ||||||||||||||||||||||||||||||||||||||||
Basic | $ | 36.87 | $ | 54.59 | $ | 63.22 | ||||||||||||||||||||||||||||||||||
Diluted | $ | 34.83 | $ | 51.17 | $ | 59.45 | ||||||||||||||||||||||||||||||||||
Weighted average shares: | ||||||||||||||||||||||||||||||||||||||||
Basic | 1,671 | 1,710 | 1,802 | |||||||||||||||||||||||||||||||||||||
Diluted | 1,769 | 1,824 | 1,916 | |||||||||||||||||||||||||||||||||||||
|
|
| ||||||||||||||||||||||||||||||||||||||
Note 1. Pro forma adjustments related to the statements of income
(a) The following schedule presents pro forma adjustments related to the inclusion of the acquisitions described above in the unaudited pro forma condensed combined financial data for the year ended December 31, 2010.
| Year ended December 31, 2010 | ||||||||||||||||||||||||||||||||||||
| Davis- Lynch | Wood Flowline | AMC Global(i)(j) | P-Quip(i)(j) | Cannon services | Other individual acquisitions | Acquisition adjustments | Ref. | Acquisitions combined | ||||||||||||||||||||||||||||
| (In thousands) | ||||||||||||||||||||||||||||||||||||
| ||||||||||||||||||||||||||||||||||||
Revenue | $ | 89,152 | $ | 28,524 | $ | 17,103 | $ | 11,116 | $ | 29,684 | $ | 46,926 | $ | (14,391 | ) | (d | ) | $ | 208,114 | |||||||||||||||||
Cost of sales | 37,381 | 18,739 | 9,496 | 4,977 | 16,039 | 30,783 | (14,391 | ) | (d | ) | 104,033 | |||||||||||||||||||||||||
| 1,009 | (e | ) | ||||||||||||||||||||||||||||||||||
|
|
|
| |||||||||||||||||||||||||||||||||
Gross profit | 51,771 | 9,785 | 7,607 | 6,139 | 13,645 | 16,143 | (1,009 | ) | 104,081 | |||||||||||||||||||||||||||
Selling, general and administrative expenses | 13,943 | 1,576 | 2,002 | 1,469 | 5,869 | 7,124 | 12,147 | (f | ) | 44,130 | ||||||||||||||||||||||||||
|
|
|
| |||||||||||||||||||||||||||||||||
Operating income (loss) | 37,828 | 8,209 | 5,605 | 4,670 | 7,776 | 9,019 | (13,156 | ) | 59,951 | |||||||||||||||||||||||||||
Interest expense | — | 81 | — | — | 105 | 26,206 | (g | ) | 26,392 | |||||||||||||||||||||||||||
Other expense (income), net | (477 | ) | 4 | (17 | ) | (8 | ) | (38 | ) | 358 | (178 | ) | ||||||||||||||||||||||||
|
|
|
| |||||||||||||||||||||||||||||||||
Income before income taxes | 38,305 | 8,124 | 5,622 | 4,678 | 7,814 | 8,556 | (39,362 | ) | 33,737 | |||||||||||||||||||||||||||
Income tax expense | 1,570 | 2,843 | 1,574 | 1,310 | 2,735 | 2,834 | (1,940 | ) | (h | ) | 10,926 | |||||||||||||||||||||||||
|
|
|
| |||||||||||||||||||||||||||||||||
Net Income | $ | 36,735 | $ | 5,281 | $ | 4,048 | $ | 3,368 | $ | 5,079 | $ | 5,722 | $ | (37,422 | ) | $ | 22,811 | |||||||||||||||||||
| ||||||||||||||||||||||||||||||||||||
(b) The following schedule presents the pro forma adjustments related to the inclusion of the acquisitions described above in the unaudited pro forma condensed combined financial data for the nine monthsyear ended September 30,December 31, 2011.
| One month ended January 31, 2011 | Four months ended April 30, 2011 | Five months ended May 31, 2011 | Seven months ended July 31, 2011 | Six months ended June 30, 2011 | One month ended January 31, 2011 | Four months ended April 30, 2011 | Five months ended May 31, 2011 | Seven months ended July 31, 2011 | Six months ended June 30, 2011 | |||||||||||||||||||||||||||||||||||||||||||||||||||||||||||||||||||||||||||||||
| Wood Flowline | Phoinix | Specialist | Davis- Lynch | AMC Global(i)(j) | P-Quip(i)(j) | Cannon services | SVP | Acquisition adjustments | Ref. | Acquisitions combined | Wood Flowline | Phoinix | Specialist | Davis- Lynch | AMC Global(i)(j) | P-Quip(h)(i) | Cannon services | SVP | Acquisition adjustments | Ref. | Acquisitions combined | |||||||||||||||||||||||||||||||||||||||||||||||||||||||||||||||||||
| (In thousands) | (In thousands) | |||||||||||||||||||||||||||||||||||||||||||||||||||||||||||||||||||||||||||||||||||||||
|
|
| ||||||||||||||||||||||||||||||||||||||||||||||||||||||||||||||||||||||||||||||||||||||
Revenue | $ | 4,259 | $ | 14,621 | $ | 1,855 | $ | 61,040 | $ | 9,650 | $ | 9,495 | $ | 13,544 | $ | 16,364 | $ | (13,214 | ) | (d | ) | $ | 117,614 | $ | 4,259 | $ | 14,621 | $ | 1,855 | $ | 61,040 | $ | 9,650 | $ | 9,495 | $ | 13,544 | $ | 16,364 | $ | (13,214 | ) | (c | ) | $ | 117,614 | ||||||||||||||||||||||||||||||||||||||||||
Cost of sales | 2,559 | 9,933 | 993 | 27,726 | 2,402 | 5,406 | 5,633 | 12,006 | (13,214 | ) | (d | ) | 53,992 | 2,559 | 9,933 | 993 | 27,726 | 2,402 | 5,406 | 5,633 | 12,006 | (13,214 | ) | (c | ) | 53,992 | ||||||||||||||||||||||||||||||||||||||||||||||||||||||||||||||
| 548 | (e | ) | 548 | (d | ) | |||||||||||||||||||||||||||||||||||||||||||||||||||||||||||||||||||||||||||||||||||
|
|
|
|
|
| |||||||||||||||||||||||||||||||||||||||||||||||||||||||||||||||||||||||||||||||||||
Gross profit | 1,700 | 4,688 | 862 | 33,314 | 7,248 | 4,089 | 7,911 | 4,358 | (548 | ) | 63,622 | 1,700 | 4,688 | 862 | 33,314 | 7,248 | 4,089 | 7,911 | 4,358 | (548 | ) | 63,622 | ||||||||||||||||||||||||||||||||||||||||||||||||||||||||||||||||||
Selling, general and administrative expenses | 253 | 1,231 | 244 | 7,782 | 2,063 | 831 | 3,472 | 1,331 | 5,929 | (f | ) | 23,136 | 253 | 1,231 | 244 | 7,782 | 2,063 | 831 | 3,472 | 1,331 | 5,840 | (e | ) | 23,047 | ||||||||||||||||||||||||||||||||||||||||||||||||||||||||||||||||
Transaction expenses | (3,434 | ) | (f | ) | (3,434 | ) | (3,608 | ) | (e | ) | (3,608 | ) | ||||||||||||||||||||||||||||||||||||||||||||||||||||||||||||||||||||||||||||
|
|
|
|
|
| |||||||||||||||||||||||||||||||||||||||||||||||||||||||||||||||||||||||||||||||||||
Operating income (loss) | 1,447 | 3,457 | 618 | 25,532 | 5,185 | 3,258 | 4,439 | 3,027 | (3,043 | ) | 43,920 | |||||||||||||||||||||||||||||||||||||||||||||||||||||||||||||||||||||||||||||
Income from operations | 1,447 | 3,457 | 618 | 25,532 | 5,185 | 3,258 | 4,439 | 3,027 | (2,780 | ) | 44,183 | |||||||||||||||||||||||||||||||||||||||||||||||||||||||||||||||||||||||||||||
Interest expense | 16 | — | — | — | 13,578 | (g | ) | 13,594 | 16 | — | — | — | 13,578 | (f | ) | 13,594 | ||||||||||||||||||||||||||||||||||||||||||||||||||||||||||||||||||||||||
Other expense (income), net | — | 24 | (112 | ) | 2 | — | (86 | ) | — | 24 | (112 | ) | 2 | — | (86 | ) | ||||||||||||||||||||||||||||||||||||||||||||||||||||||||||||||||||||||||
|
|
|
|
|
| |||||||||||||||||||||||||||||||||||||||||||||||||||||||||||||||||||||||||||||||||||
Income before income taxes | 1,431 | 3,433 | 618 | 25,644 | 5,183 | 3,258 | 4,439 | 3,027 | (16,621 | ) | 30,412 | 1,431 | 3,433 | 618 | 25,644 | 5,183 | 3,258 | 4,439 | 3,027 | (16,358 | ) | 30,675 | ||||||||||||||||||||||||||||||||||||||||||||||||||||||||||||||||||
Income tax expense | 501 | 1,202 | 172 | 1,120 | 1,451 | 912 | 1,554 | 1,059 | 2,038 | (h | ) | 10,009 | 501 | 1,202 | 172 | 1,120 | 1,451 | 912 | 1,554 | 1,059 | 2,131 | (g | ) | 10,102 | ||||||||||||||||||||||||||||||||||||||||||||||||||||||||||||||||
|
|
|
|
|
| |||||||||||||||||||||||||||||||||||||||||||||||||||||||||||||||||||||||||||||||||||
Net Income | 930 | 2,231 | 446 | 24,524 | 3,732 | 2,346 | 2,885 | 1,968 | (18,659 | ) | 20,403 | 930 | 2,231 | 446 | 24,524 | 3,732 | 2,346 | 2,885 | 1,968 | (18,489 | ) | 20,573 | ||||||||||||||||||||||||||||||||||||||||||||||||||||||||||||||||||
Less: income attributable to noncontrolling interests | — | — | ||||||||||||||||||||||||||||||||||||||||||||||||||||||||||||||||||||||||||||||||||||||
|
|
|
|
|
| |||||||||||||||||||||||||||||||||||||||||||||||||||||||||||||||||||||||||||||||||||
Net income attributable to common stockholders | $ | 930 | $ | 2,231 | $ | 446 | $ | 24,524 | $ | 3,732 | $ | 2,346 | $ | 2,885 | $ | 1,968 | $ | (18,659 | ) | $ | 20,403 | $ | 930 | $ | 2,231 | $ | 446 | $ | 24,524 | $ | 3,732 | $ | 2,346 | $ | 2,885 | $ | 1,968 | $ | (18,489 | ) | $ | 20,573 | ||||||||||||||||||||||||||||||||||||||||||||||
|
|
| ||||||||||||||||||||||||||||||||||||||||||||||||||||||||||||||||||||||||||||||||||||||
(c)(b) The offering adjustments in the unaudited pro forma condensed combined statementsstatement of income for the year ended December 31, 2010 and the nine months ended September 30, 2011 assume the application of $279$50 million of net proceeds from the concurrent private placement and $232.5 million of net proceeds from this offering to repay a portion of the outstanding indebtedness under the revolving portion of our senior secured credit facility. The resulting reduction of interest expense from the repayment of our senior secured credit facility was $12.8 million and $6.5$7.9 million for the year ended December 31, 2010 and the nine months ended September 30, 2011, respectively.2011. This resulting reduction of interest expense was calculated using the weighted average of the interest rates applicable to the borrowings under the various tranches of our senior secured credit facility as of December 31, 2010 and September 30, 2011, which were 4.6% and 3.1%, respectively.was 2.78%. If the net proceeds from the offering of our common stock increases or decreases by $10 million, we would accordingly repay $289 million or $269 millionthe amount of outstanding indebtedness under our senior secured credit facility that will be repaid will increase or decrease by $10 million, as applicable, which would change pro forma interest expense by $0.5$0.3 million for the year ended December 31, 2010 and $0.2 million for the nine months ended September 30, 2011. A one-eighth percentage point change in the interest rate would change pro forma interest expense by $0.3$0.4 million for the year ended December 31, 2010 and $0.3 million for2011. Additionally, if the nine months ended September 30, 2011.price at which we offer the shares of common stock to the public is above the range set forth on the cover of this prospectus, the private equity firm that has been offered shares of our common stock
(d)
pursuant to the concurrent private placement may elect not to purchase any common stock or to buy only a portion of the common stock. See “Prospectus summary—The offering—Concurrent private placement.”
(c) Intercompany revenue and cost of sales have been eliminated in the consolidation of the pro forma results. Certain acquired businesses have had sales to other entities within our Company prior to their
acquisition by us. In the pro forma results, these sales are treated as intercompany sales and therefore have been eliminated in the consolidated total.
(e)(d) Depreciation reflects the adjusted fixed assets assuming the acquisitions occurred January 1, 2010.2011. Asset values were determined based upon third-party and internal appraisals. We estimated the average useful lives of the fixed assets to range from 7 to 30 years. The amount of depreciation related to this adjustment was approximately $1.0 million and $0.5 million for the pro forma condensed combined statements of income for the year ended December 31, 2010 and the nine months ended September 30, 2011, respectively.2011.
(f)(e) Amortization of intangible assets has been reflected as if the intangible assets purchased as part of the business combinations had been acquired on January 1, 2010.2011. The intangible assets include noncompete agreements, customer-related intangibles, backlog, patents and tradenames. For our significant acquisitions, asset values were determined based upon third-party appraisals. We estimated the remaining useful lives, ranging from 5 to 15 years, of all acquired intangible assets and amortized those assets over their estimated remaining useful lives. The amount of amortization related to this adjustment was approximately $12.1 million and $5.9 million for the pro forma condensed combined statementsstatement of income for the year ended December 31, 2010 and the nine months ended September 30, 2011, respectively.2011. Non-recurring transaction expenses of $3.6 million related to acquisitions have been eliminated.
(g)(f) Interest expense reflects the estimated interest related to the debt incurred for the acquisitions as if the acquisitions occurred January 1, 2010.2011. The interest rate used in the pro forma adjustments for the year ended December 31, 2010 and nine months ended September 30, 2011 was the interest rate in effect at the time of each acquisition. The pro forma amount of interest expense for the debt related to the acquisitions for the year ended December 31, 2010 and nine months ended September 30, 2011 was approximately $26.2 million and $13.6 million, respectively.million. A 1/8% change in the variable rate of interest for the year ended December 31, 2010 and nine months ended September 30, 2011 would have reduced or increased net income by approximately $0.4 million and $0.2 million, respectively.million.
(h)(g) In preparing the pro forma condensed combined statements of income for the year ended December 31, 2010 and nine months ended September 30, 2011, we used the statutory tax rate in effect for the applicable jurisdiction at the time of each acquisition.
(i)(h) The historical profit and loss accounts and balance sheet of AMC and P-Quip have been prepared in accordance with generally accepted accounting principles in the United Kingdom (“UK GAAP”). Such principles differ in certain respects from generally accepted accounting principles in the United States (“US GAAP”). There were no significant differences between UK GAAP and US GAAP that would require adjustments within this pro forma financial data. Additionally, for the purpose of presenting the unaudited pro forma condensed combined financial data, the adjusted income statements of AMC and P-Quip for the periodsperiod ended December 31, 2010 and June 30, 2011 have been translated into U.S. dollars at the average rates for the periodsperiod ended December 31, 2010 and June 30, 2011, respectively.2011.
(j) The pro forma statement of income of the AMC Acquisition for the year ended December 31, 2010 was derived from the audited financial statements for the fiscal year ended April 30, 2011, minus the results of operations for the four months ended April 30, 2011, plus the results of operations for the four months ended April 30, 2010, as shown in the schedule below.(i) The currency exchange rates used to convert AMC’s results of operations from British pound sterling
to U.S. dollars for the twelve months ended December 31, 2010AMC and the six months ended June 30, 2011 were 1.55 and 1.62, respectively.
| AMC | Twelve months Ended April 30, 2011 | Four months ended April 30, 2011 | Four months ended April 30, 2010 | Twelve months ended December 31, 2010 | ||||||||||||
| (in 000’s of British sterling pound) | ||||||||||||||||
| ||||||||||||||||
Net Sales | £ | 12,833 | £ | 4,691 | £ | 2,922 | £ | 11,064 | ||||||||
Cost of Sales | 5,756 | 1,324 | 1,711 | 6,143 | ||||||||||||
|
| |||||||||||||||
Gross Profit | 7,077 | 3,367 | 1,211 | 4,921 | ||||||||||||
Selling, general and administrative expenses | 1,920 | 880 | 255 | 1,265 | ||||||||||||
|
| |||||||||||||||
Income from operations | 5,157 | 2,487 | 956 | 3,626 | ||||||||||||
Interest, expense, net | ||||||||||||||||
Other, net | �� | (2 | ) | 4 | (5 | ) | (11 | ) | ||||||||
|
| |||||||||||||||
Income before income taxes | 5,159 | 2,483 | 961 | 3,637 | ||||||||||||
Income tax expense | 1,522 | 695 | 269 | 1,018 | ||||||||||||
|
| |||||||||||||||
Net income | £ | 3,637 | £ | 1,788 | £ | 692 | £ | 2,619 | ||||||||
| ||||||||||||||||
The pro forma statement of income of the P-Quip Acquisition for the year ended December 31, 2010 was derived from the audited financial statements for the fiscal year ended May 31, 2011, minus the results of operations for the five months ended May 31, 2011, plus the results of operations for the five months ended May 31, 2010, as shown in the schedule below. The currency exchange rates used to convert P-Quip’s results of operations from British pound sterling to U.S. dollars for the twelve months ended December 31, 2010 and the six months ended June 30, 2011 were 1.55 and 1.62, respectively.was 1.62.
| P-QUIP | Twelve months ended May 31, 2011 | Five months ended May 31, 2011 | Five months ended May 31, 2010 | Twelve months ended December 31, 2010 | ||||||||||||
| (in 000’s of British sterling pound) | ||||||||||||||||
| ||||||||||||||||
Net Sales | £ | 9,097 | £ | 4,898 | £ | 2,992 | £ | 7,191 | ||||||||
Cost of Sales | 4,659 | 2,753 | 1,314 | 3,220 | ||||||||||||
|
| |||||||||||||||
Gross Profit | 4,438 | 2,145 | 1,678 | 3,971 | ||||||||||||
Selling, general and administrative expenses | 1,122 | 495 | 323 | 950 | ||||||||||||
|
| |||||||||||||||
Income from operations | 3,316 | 1,650 | 1,355 | 3,021 | ||||||||||||
Interest, expense, net | ||||||||||||||||
Other, net | (5 | ) | (5 | ) | ||||||||||||
|
| |||||||||||||||
Income before income taxes | 3,321 | 1,650 | 1,355 | 3,026 | ||||||||||||
Income tax expense | 579 | 374 | 200 | 847 | ||||||||||||
|
| |||||||||||||||
Net income | £ | 2,742 | £ | 1,276 | £ | 1,155 | £ | 2,179 | ||||||||
| ||||||||||||||||
Selected historical consolidated financial data
You should read the following selected historical financial data in conjunction with “Unaudited pro forma condensed combined financial data,” “Management’s discussion and analysis of financial condition and results of operations” and our historical consolidated financial statements and related notes thereto included elsewhere in this prospectus. We believe that the assumptions underlying the preparation of our financial statements are reasonable. The financial data included in this prospectus may not be indicative of our future results of operations, financial position and cash flows.
The selected historical financial data as of December 31, 20092010 and 20102011 and for the years ended December 31, 2008, 2009, 2010 and 20102011 are derived from our audited historical consolidated financial statements and related notes thereto included elsewhere in this prospectus. The selected historical data as of December 31, 2009 and for the year ended December 31, 2008 have been derived from our audited consolidated financial statements, which are not included in this prospectus. The selected historical financial data as of December 31, 2006, 2007 and 2008 and for the yearsyear ended December 31, 2006 and 2007 have been derived from our unaudited consolidated financial statements, which are not included in this prospectus. The historical financial data as of September 30, 2011 and for the nine months ended September 30, 2010 and 2011 are derived from our unaudited consolidated financial statements and related notes thereto included elsewhere in this prospectus and have been prepared on a basis consistent with the audited financial statements and the notes thereto and include all adjustments, consisting of normal recurring adjustments, necessary for a fair presentation of the financial data.
| Year ended December 31, | Nine months ended September 30, | Year ended December 31, | ||||||||||||||||||||||||||||||||||||||||||||||
| 2006 | 2007 | 2008 | 2009 | 2010 | 2010 | 2011 | 2007 | 2008 | 2009 | 2010 | 2011 | |||||||||||||||||||||||||||||||||||||
| (unaudited) | (unaudited) | (unaudited) | ||||||||||||||||||||||||||||||||||||||||||||||
| (in thousands, except per share information) | (in thousands, except per share information) | |||||||||||||||||||||||||||||||||||||||||||||||
|
|
|
|
|
|
| ||||||||||||||||||||||||||||||||||||||||||
Income Statement Data: | ||||||||||||||||||||||||||||||||||||||||||||||||
Net sales | $ | 230,607 | $ | 635,077 | $ | 972,551 | $ | 677,378 | $ | 747,335 | $ | 545,751 | $ | 791,412 | $ | 635,077 | $ | 972,551 | $ | 677,378 | $ | 747,335 | $ | 1,128,131 | ||||||||||||||||||||||||
Cost of sales | 144,762 | 444,769 | 691,824 | 491,463 | 533,078 | 390,851 | 542,832 | 444,769 | 691,824 | 491,463 | 533,078 | 765,670 | ||||||||||||||||||||||||||||||||||||
|
|
|
| |||||||||||||||||||||||||||||||||||||||||||||
Gross profit | 85,845 | 190,308 | 280,727 | 185,915 | 214,257 | 154,900 | 248,580 | 190,308 | 280,727 | 185,915 | 214,257 | 362,461 | ||||||||||||||||||||||||||||||||||||
|
|
|
| |||||||||||||||||||||||||||||||||||||||||||||
Operating expenses | ||||||||||||||||||||||||||||||||||||||||||||||||
Selling, general and administrative expenses | 43,896 | 93,694 | 146,943 | 128,562 | 141,441 | 100,263 | 129,626 | 93,694 | 146,943 | 128,562 | 141,441 | 186,774 | ||||||||||||||||||||||||||||||||||||
Contingent consideration | — | — | — | — | — | — | 6,000 | — | — | — | — | 12,100 | ||||||||||||||||||||||||||||||||||||
Transaction expenses | — | — | — | — | — | — | 3,434 | — | — | — | — | 3,608 | ||||||||||||||||||||||||||||||||||||
Impairment of goodwill and other intangible assets | — | — | 44,015 | 7,009 | — | — | — | — | 44,015 | 7,009 | — | — | ||||||||||||||||||||||||||||||||||||
(Gain) loss on sale of assets | (2,018 | ) | — | (619 | ) | 137 | (461 | ) | (471 | ) | (520 | ) | — | (619 | ) | 137 | (461 | ) | (634 | ) | ||||||||||||||||||||||||||||
|
|
|
| |||||||||||||||||||||||||||||||||||||||||||||
Total operating expenses | 41,878 | 93,694 | 190,339 | 135,708 | 140,980 | 99,792 | 138,540 | 93,694 | 190,339 | 135,708 | 140,980 | 201,848 | ||||||||||||||||||||||||||||||||||||
|
|
|
| |||||||||||||||||||||||||||||||||||||||||||||
Income from operations | 43,967 | 96,614 | 90,388 | 50,207 | 73,277 | 55,108 | 110,040 | 96,614 | 90,388 | 50,207 | 73,277 | 160,613 | ||||||||||||||||||||||||||||||||||||
|
|
|
| |||||||||||||||||||||||||||||||||||||||||||||
Other expense (income) | ||||||||||||||||||||||||||||||||||||||||||||||||
Expenses related to the Combination | — | — | — | — | 6,968 | 6,919 | — | — | — | — | 6,968 | | — | | ||||||||||||||||||||||||||||||||||
Deferred loan costs written off | — | — | — | — | 6,082 | 6,082 | — | — | — | — | 6,082 | — | ||||||||||||||||||||||||||||||||||||
Interest expense | 6,712 | 21,718 | 24,704 | 19,451 | 18,189 | 15,417 | 13,723 | 21,718 | 24,704 | 19,451 | 18,189 | 19,532 | ||||||||||||||||||||||||||||||||||||
Other, net | 33 | 1,201 | (2,065 | ) | (1,088 | ) | (2,308 | ) | (2,189 | ) | 1,261 | 1,201 | (2,065 | ) | (1,088 | ) | (2,308 | ) | 378 | |||||||||||||||||||||||||||||
|
|
|
| |||||||||||||||||||||||||||||||||||||||||||||
Total other expense (income) | 6,745 | 22,919 | 22,639 | 18,363 | 28,931 | 26,229 | 14,984 | |||||||||||||||||||||||||||||||||||||||||
Total other expense | 22,919 | 22,639 | 18,363 | 28,931 | 19,910 | |||||||||||||||||||||||||||||||||||||||||||
|
|
|
| |||||||||||||||||||||||||||||||||||||||||||||
Income from continuing operations before income taxes | 37,222 | 73,695 | 67,749 | 31,844 | 44,346 | 28,879 | 95,056 | 73,695 | 67,749 | 31,844 | 44,346 | 140,703 | ||||||||||||||||||||||||||||||||||||
Provision for income tax expense | 13,104 | 28,282 | 32,938 | 11,011 | 20,297 | 15,685 | 33,176 | 28,282 | 32,938 | 11,011 | 20,297 | 47,110 | ||||||||||||||||||||||||||||||||||||
|
|
|
| |||||||||||||||||||||||||||||||||||||||||||||
Income from continuing operations | 24,118 | 45,413 | 34,811 | 20,833 | 24,049 | 13,194 | 61,880 | 45,413 | 34,811 | 20,833 | 24,049 | 93,593 | ||||||||||||||||||||||||||||||||||||
Loss from discontinued operations, net of taxes | — | — | (396 | ) | (1,342 | ) | — | — | — | — | (396 | ) | (1,342 | ) | — | — | ||||||||||||||||||||||||||||||||
|
|
|
| |||||||||||||||||||||||||||||||||||||||||||||
Net income | 24,118 | 45,413 | 34,415 | 19,491 | 24,049 | 13,194 | 61,880 | 45,413 | 34,415 | 19,491 | 24,049 | 93,593 | ||||||||||||||||||||||||||||||||||||
Less: Income attributable to noncontrolling interest | (55 | ) | (95 | ) | (39 | ) | (155 | ) | (111 | ) | (123 | ) | (267 | ) | (95 | ) | (39 | ) | (155 | ) | (111 | ) | (251 | ) | ||||||||||||||||||||||||
|
|
|
| |||||||||||||||||||||||||||||||||||||||||||||
Net income attributable to common stockholders | $ | 24,063 | $ | 45,318 | $ | 34,376 | $ | 19,336 | $ | 23,938 | $ | 13,071 | $ | 61,613 | $ | 45,318 | $ | 34,376 | $ | 19,336 | $ | 23,938 | $ | 93,342 | ||||||||||||||||||||||||
|
|
|
| |||||||||||||||||||||||||||||||||||||||||||||
Weighted average shares outstanding | ||||||||||||||||||||||||||||||||||||||||||||||||
Basic | 463 | 1,023 | 1,232 | 1,304 | 1,454 | 1,422 | 1,671 | 1,023 | 1,232 | 1,304 | 1,454 | 1,710 | ||||||||||||||||||||||||||||||||||||
Diluted | 476 | 1,043 | 1,261 | 1,322 | 1,468 | 1,424 | 1,769 | 1,043 | 1,261 | 1,322 | 1,468 | 1,824 | ||||||||||||||||||||||||||||||||||||
Earnings per share | ||||||||||||||||||||||||||||||||||||||||||||||||
Basic | $ | 51.97 | $ | 44.30 | $ | 27.90 | $ | 14.83 | $ | 16.46 | $ | 9.19 | $ | 36.87 | $ | 44.30 | $ | 27.90 | $ | 14.83 | $ | 16.46 | $ | 54.59 | ||||||||||||||||||||||||
Diluted | $ | 50.55 | $ | 43.45 | $ | 27.26 | $ | 14.63 | $ | 16.31 | $ | 9.18 | $ | 34.83 | $ | 43.45 | $ | 27.26 | $ | 14.63 | $ | 16.31 | $ | 51.17 | ||||||||||||||||||||||||
|
|
| ||||||||||||||||||||||||||||||||||||||||||||||
| As of December 31, | As of September 30, | As of December 31, | ||||||||||||||||||||||||||||||||||||||||||
| 2006 | 2007 | 2008 | 2009 | 2010 | 2011 | 2007 | 2008 | 2009 | 2010 | 2011 | ||||||||||||||||||||||||||||||||||
| (in thousands) | (unaudited) | (unaudited) | (unaudited) | (unaudited) | (unaudited) | (unaudited) | ||||||||||||||||||||||||||||||||||||||
|
|
|
| |||||||||||||||||||||||||||||||||||||||||
Balance Sheet Data: | ||||||||||||||||||||||||||||||||||||||||||||
Cash and cash equivalents | $ | 7,227 | $ | 32,687 | $ | 19,941 | $ | 26,894 | $ | 20,348 | 36,928 | $ | 32,687 | $ | 19,941 | $ | 26,894 | $ | 20,348 | $ | 20,548 | |||||||||||||||||||||||
Net property, plant and equipment | 23,497 | 72,479 | 109,194 | 96,747 | 90,632 | 121,679 | 72,479 | 109,194 | 96,747 | 90,632 | 124,840 | |||||||||||||||||||||||||||||||||
Total assets | 266,745 | 822,400 | 961,022 | 840,226 | 818,332 | 1,564,106 | 822,400 | 961,022 | 840,226 | 818,332 | 1,607,315 | |||||||||||||||||||||||||||||||||
Long-term debt | 110,952 | 326,696 | 321,962 | 236,937 | 204,715 | 684,295 | 326,696 | 321,962 | 236,937 | 204,715 | 660,379 | |||||||||||||||||||||||||||||||||
Total stockholders’ equity | 94,414 | 306,052 | 376,961 | 401,927 | 462,523 | 619,650 | 306,052 | 376,961 | 401,927 | 462,523 | 654,493 | |||||||||||||||||||||||||||||||||
|
|
| ||||||||||||||||||||||||||||||||||||||||||
| Year ended December 31, | Nine months ended September 30, | Year ended December 31, | ||||||||||||||||||||||||||||||||||||||||||||||
| 2006 | 2007 | 2008 | 2009 | 2010 | 2010 | 2011 | 2007 | 2008 | 2009 | 2010 | 2011 | |||||||||||||||||||||||||||||||||||||
| (in thousands) | (unaudited) | (unaudited) | (unaudited) | (unaudited) | (unaudited) | |||||||||||||||||||||||||||||||||||||||||||
|
|
|
| |||||||||||||||||||||||||||||||||||||||||||||
Other financial data: | ||||||||||||||||||||||||||||||||||||||||||||||||
Net cash provided by operating activities | $ | 13,770 | $ | 40,171 | $ | 112,463 | $ | 107,751 | $ | 65,981 | $ | 27,892 | $ | 18,624 | $ | 40,171 | $ | 112,463 | $ | 107,751 | $ | 65,981 | $ | 39,275 | ||||||||||||||||||||||||
Net cash used in investing activities | $ | (88,224 | ) | $ | (388,350 | ) | $ | (160,937 | ) | $ | (10,914 | ) | $ | (19,216 | ) | $ | (8,941 | ) | $ | (534,681 | ) | $ | (388,350 | ) | $ | (160,937 | ) | $ | (10,914 | ) | $ | (19,216 | ) | $ | (550,114 | ) | ||||||||||||
Net cash provided by / (used in) financing activities | $ | 72,985 | $ | 369,797 | $ | 58,871 | $ | (94,532 | ) | $ | (54,265 | ) | $ | (26,465 | ) | $ | 531,947 | $ | 369,797 | $ | 58,871 | $ | (94,532 | ) | $ | (54,265 | ) | $ | 510,148 | |||||||||||||||||||
|
|
| ||||||||||||||||||||||||||||||||||||||||||||||
Management’s discussion and analysis of
financial condition and results of operations
The following discussion and analysis of our financial condition and results of operations should be read in conjunction with “Selected historical consolidated financial data” and our financial statements and related notes appearing elsewhere in this prospectus. This discussion contains forward-looking statements based on our current expectations, estimates and projections about our operations and the industry in which we operate. Our actual results may differ materially from those anticipated in these forward-looking statements as a result of a variety of risks and uncertainties, including those described in this prospectus under “Cautionary note regarding forward-looking statements” and “Risk factors.” We assume no obligation to update any of these forward-looking statements.
Overview
We are a global oilfield products company, serving the subsea, drilling, completion, production and processinfrastructure sectors of the oil and natural gas industry. We design and manufacture products, and engage in aftermarket services, parts supply and related services that complement our product offering. Our product offering and related services include a mix of highly engineered capital products and frequently replaced items that are consumed in the exploration and development of oil and natural gas reserves. We seek to design, manufacture and supply reliable, cost effective products that create value for our broad and diverse customer base, which includes oil and gas operators, land and offshore drilling contractors, well stimulation and intervention service providers, subsea construction and service companies, pipeline operators and refinery and petrochemical plant operators, among others. We believe that we differentiate ourselves from our competitors on the basis of the quality of our products, the level of related service and support we provide and the collaborative approach we take with our customers to help them solve critical problems.
On August 2, 2010, we completed the Combination, through which FOT, Global Flow, Triton, Allied and Subsea were combined and became Forum Energy Technologies, Inc. Prior to the Combination, SCF Partners, through two of its private equity funds, controlled a majority of the voting interests in each of FOT, Global Flow, Triton and Subsea. SCF also held a controlling position with respect to Allied by virtue of its ownership of a substantial portion of Allied’s issued and outstanding common stock and its contractual right to fill a majority of the directors’ seats comprising the Allied Board of Directors. As a result, the mergers consummated in connection with the Combination are accounted for using the reorganization accounting method for entities under common control. Under this method of accounting, the consolidated financial statements and the discussions herein include the operating results of FOT, Global Flow, Triton, Allied and Subsea from the date on which each became controlled by SCF, which was May 2005, June 2005, February 2007, August 2007 and January 2007, respectively.
We operate in two business segments:
| • | Drilling and Subsea Segment. We design and manufacture products and provide related services to the drilling, well construction, completion, intervention and subsea construction and services markets. Through this segment, we offer drilling products, including capital equipment and a broad line of products consumed in the drilling process; downhole products, including cementing and casing tools and a range of downhole protection solutions; and subsea products, including capital equipment, specialty components and tooling, and applied products |
for subsea pipelines. We also provide a broad suite of complementary subsea technical services and rental items. |
| • | Production and Infrastructure Segment. We design and manufacture products and provide related equipment and services to the well stimulation, completion, production and infrastructure markets. Through this segment, we supply surface production and process equipment, specialty pipeline construction equipment, a broad range of industrial and process valves and well stimulation and flow equipment, as well as provide related support services. |
Recent acquisitions2011 Acquisitions
We have madecompleted eight acquisitions this year,in 2011, three of which are now included in the Production and Infrastructure Segment and five in the Drilling and Subsea Segment. The three Production and Infrastructure acquisitions comprise our new consumable flow equipment product line. For Drilling and Subsea, two of the acquisitions form our new downhole productstechnologies line, two are additions to our drilling productstechnologies offering, and one is an addition to subsea productstechnologies offering.
We established our flow equipment platform in 2011 through the completion of three acquisitions. In February 2011, we acquired Wood Flowline Products, LLC (“WFP”), based out of Davis, Oklahoma, which sells flow equipment components used in fracturing and flowback operations and provides related inspection, recertification and refurbishment services. In April 2011, we acquired Phoinix Global LLC (“Phoinix”), based in Alice, Texas, which offers fluid ends for frac pressure pumps, plug valves, relief valves, chokes, manifolds, manifold trailers and flow equipment transport trucks. In July 2011, we acquired SVP Products (“SVP”), based in Odessa, Texas, which provides recertification and refurbishment of flow equipment used in the well stimulation and flowback processes. SVP added access to critical growth basins in North America and had previously served as a channel to market for WFP and Phoinix products. The SVP Acquisition helps tie WFP and Phoinix into a stronger single product line, and provides a broader geographic footprint and critical customer relationships.
We formed our downhole productstechnologies platform in July 2011 through the acquisition of Cannon Services Ltd. (“Cannon”), based in Stafford, Texas, which provides standard and customized clamp and stamped metal protection systems used to shield downhole control lines and gauges during their installation and to provide protection during production enhancement operations.
We considerably strengthened our newly established position in the downhole market in July 2011 through the acquisition of Davis-Lynch LLC (“Davis-Lynch”), based in Pearland, Texas which increases our ability to offer the mission critical products used during the completion phase of oil and natural gas well construction. Davis-Lynch is a 64 year old market leading manufacturer of proprietary downhole cementing and casing products which designs, manufactures and provides a full range of centralizers, float equipment, stage cementing tools, inflatable packers, flotation collars, cementing plugs, fill and circulation tools for running casing, casing hangars and surge reduction equipment.
We have madecompleted two acquisitions this yearin 2011 to add to our drilling productstechnologies capabilities. In July 2011, we acquired AMC Global Group, Ltd. (“AMC”), based in Aberdeen, Scotland, which designs and manufactures specialized torque equipment for tubular connections, including high torque stroking units, fully rotational torque units, portable torque units for field deployment and related control systems, and provides aftermarket service. Simultaneously, we acquired P-Quip, Ltd. (“P-Quip”), based in Kilbirnie, Scotland, which is a manufacturer of proprietary mud pump
fluid end assemblies, mud pump rod systems, liner retention systems, valve cover retention systems and other drilling flow control products. Both the AMC and P-Quip product lines serve to enhance the safety and efficiency of modern drilling operations. They are complementary to our focus on tubular handling and drilling flow control products.
In May 2011, we completed the Specialist Acquisition, which enhanced our subsea productstechnologies offering. Specialist designs and manufactures or assembles specialized ROV tooling for sale and rental and is based in Aberdeen, Scotland.
For additional information regarding our recent acquisitions,2011 Acquisitions, please read Note 163 to our audited consolidated financial statements included elsewhere in this prospectus.
Evaluation of operations
We manage our operations through the two business segments described above. We have focused on implementing financial reporting and controls at all of our operations to accelerate the availability of critical information necessary to support informed decision making. We use a number of financial and non-financial measures to routinely analyze and evaluate, on a segment and corporate level, the performance of our business, including the following:
Safety;
Revenue growth;
Gross margin percentage;
Selling, general and administrative expenses as a percentage of total revenue;
Operating income and operating margin percentage;
Earnings per share; and
Free cash flow.
At the beginning of each year, we establish annual, quarterly and monthly plans for each product line based on our assessment of market conditions and opportunities. We re-evaluatereevaluate and update these plans on at least a quarterly basis.
Safety. We measure safety by tracking the total recordable incident rate (“TRIR”), which is reviewed on a monthly basis. TRIR is a measure of the rate of recordable workplace injuries, defined below, normalized and stated on the basis of 100 workers for an annual period. The factor is derived by multiplying the number of recordable injuries in a calendar year by 200,000 (i.e., the total hours for 100 employees working 2,000 hours per year) and dividing this value by the total hours actually worked in the year. A recordable injury includes occupational death, nonfatal occupational illness and other occupational injuries that involve loss of consciousness, restriction of work or motion, transfer to another job, or medical treatment other than first aid.
Revenue growth. We compare actual revenue achieved each month to the most recent estimate for that month and to the annual plan for the month established at the beginning of the year. We monitor our revenue to analyze trends in the relative performance of each of our product lines as compared to standard revenue drivers or market metrics applicable to that product. We are particularly interested in identifying positive or negative trends and investigating to understand the root causes. We also evaluate changes in the mix of products sold and the resultant impact on reported gross margins.
Gross margin percentage. We define gross margin percentage as our gross margin, or net sales minus cost of sales, divided by our net sales. Our management continually evaluates our
consolidated gross margin percentage and our gross margin percentage by segment to determine how each segment is performing. This metric aids management in capital resource allocation and pricing decisions.
Selling, general and administrative expenses as a percentage of total revenue. Selling, general and administrative expenses include payroll related costs for sales, marketing, administrative, accounting, information technology, certain engineering and human resources functions; audit, legal and other professional fees; insurance; franchise taxes not based on income; travel and entertainment; advertising and promotions; bad debt expense; and other office and administrative related costs. Our management continually evaluates the level of our selling, general and administrative expenses in relation to our revenue and makes appropriate changes in light of activity levels to preserve and improve our profitability while meeting the on-going support and regulatory requirements of the business.
Operating income and operating margin percentage. We define operating income as revenue less cost of goods sold less selling, general and administrative expenses. We define our operating margin percentage as operating income divided by revenue. These metrics assist management in evaluating the performance of each segment as a whole, especially to determine whether the amount of administrative burden is appropriate to support current business activity levels.
Earnings per share. We calculate fully-diluted earnings per share as prescribed under GAAP, that is net income divided by common shares outstanding, giving effect for the assumed exercise of all outstanding options and warrants with a strike price less than the average fair value of the shares over the period covered for the calculation. We believe this measure is important as it reflects the sum total of operating results and all attendant capital decisions, showing in one number the amount earned for the stockholders of our Company.
Free cash flow. We define free cash flow as net income, increased by non-cash charges included in net income (e.g., depreciation and amortization and deferred income taxes), increased or decreased by changes in net working capital, less capital expenditures. We believe that this measure is important because it encompasses both profitability and capital management in evaluating results. Free cash flow represents the business’ contribution in the generation of funds available to pay debt outstanding, invest in other areas, or return funds to our stockholders.
General trends and outlook
Sales of our products and services are driven primarily by traditional energy industry activity indicators, which include current and expected commodity prices, drilling rig counts, well completions and workover activity, geological characteristics of producing wells, which determine the intensity of services provided per well, oil and gas production levels, and customers’ capital budgets. Oil and gas prices and the level of customer activity have been characterized by significant volatility in recent years. Oil and gas prices fell from previously historic levels beginning in mid-2008 and continued into 2009. As a result of the economic downturn that began in 2008 and the resulting decrease in commodity prices, customers significantly curtailed capital spending throughout 2009. Global economies generally improved and stabilized in 2010 and, as a result of rising expectations for energy demand and steady increases in oil prices from the depressed levels witnessed in 2009, our customers substantially increased their capital spending in 2010 and the first half of 2011.
More recently, there has been a substantial decrease in North American natural gas prices, which has resulted in a drop in drilling activity in areas that primarily produce dry gas, such as the Haynesville shale basin in
Louisiana, the Fayetteville shale gas basin in Arkansas and the dry gas portion of the Marcellus shale basin in the Northeast. We have seen a decrease in activity from customers who conduct operations in those areas, some of whom previously provided substantial revenues to us. A continuation of these low natural gas prices, or a further weakening of them, could cause customers, whose operations are heavily concentrated in these natural gas shale basins, to curtail drilling and reduce our revenues further from these areas. Conversely, the price of oil has strengthened recently, and drilling activity appears to have increased in areas with significant oil or liquids production. This increase in activity appears to have offset the decrease in dry gas areas, though it is unclear that such increases can continue to offset the decreased North American activity in dry natural gas areas.
We believe other drivers of industry demand should remain favorable in most of our geographic markets. In addition to increased capital spending in the oil and gas industry generally, we have also identified the following trends in the oil and gas industry that we believe will positively affect our business in the coming years: (i) the increasing complexity of well construction, (ii) the growing service intensity associated with unconventional resources, (iii) the increasing investment in subsea equipment and related services, (iv) the heightened focus on product maintenance and certification, (v) the recovery in global drilling activity and new rig replacement cycle and (vi) the development of heavy oil reserves in Canada. For more information regarding these industry trends, see “Business—Current trends in our industry.” Our customer targeting efforts, informal and formal product development projects, aftermarket service offerings and mergers and acquisitions initiatives are focused on enhancing our exposure to these trends.
Any decrease in commodity prices or in the capital spending programs of our customers would adversely impact our business, financial condition or results of operations. Please see “Risk factors—We derive a substantial portion of our revenues from companies in or affiliated with the oil and natural gas industry, a historically cyclical industry, with levels of activity that are significantly affected by the levels and volatility of oil and natural gas prices. As a result, this cyclicality may cause fluctuations in our revenues and results of our operations.”
Factors affecting the comparability of our pro forma and our future results of operations to our historical results of operations
Our pro forma results of operations and our future results of operations may not be comparable to our historical results of operations for the periods presented, primarily for the reasons described below:
The historical consolidated financial statements included in this prospectus are based on the separate businesses of FOT, Global Flow, Triton, Allied and Subsea for the periods prior to the Combination. As a result, the historical financial data may not give you an accurate indication of what our actual results would have been if the Combination had been completed at the beginning of the periods presented or of what our future results of operations are likely to be.
Since the Combination, we have grown our business both organically and through strategic acquisitions. We have expanded and diversified our product portfolio and business lines with the acquisition of eight businesses in 2011 for a total consideration (net of cash acquired) of approximately $590$578 million. These acquisitions accounted for 53%57% of our pro forma net income and 46%47% of our pro forma Adjusted EBITDA for the nine monthsyear ended September 30,December 31, 2011. The historical financial data for prior years does not include the results of any of the acquired companies for the periods presented and, as such, does not give you an accurate indication of what our future results are likely to be.
As we integrate the acquired companies and further implement controls, processes and infrastructure to operate in compliance with the regulatory requirements applicable to companies with publicly traded shares, it is likely that we will incur incremental selling, general and administrative expenses relative to historical periods.
Our future results will depend on our ability to efficiently manage our combined operations and execute our business strategy.
Results of operations
| Year ended December 31, | ||||||||||||
| 2009 | 2010 | 2011 | ||||||||||
|
|
|
|
|
|
| ||||||
| (in thousands of dollars, except per share information) | ||||||||||||
Revenue: | ||||||||||||
Drilling and Subsea | $ | 455,019 | $ | 474,306 | $ | 659,430 | ||||||
Production and Infrastructure | 222,359 | 273,029 | 468,701 | |||||||||
|
|
|
| |||||||||
Total revenue | $ | 677,378 | $ | 747,335 | $ | 1,128,131 | ||||||
Cost of sales: | ||||||||||||
Drilling and Subsea | $ | 325,147 | $ | 327,848 | $ | 433,836 | ||||||
Production and Infrastructure | 166,316 | 205,230 | 331,834 | |||||||||
|
|
|
| |||||||||
Total cost of sales | $ | 491,463 | $ | 533,078 | $ | 765,670 | ||||||
Gross profit: | ||||||||||||
Drilling and Subsea | $ | 129,872 | $ | 146,458 | $ | 225,594 | ||||||
Production and Infrastructure | 56,043 | 67,799 | 136,867 | |||||||||
|
|
|
| |||||||||
Total gross profit | $ | 185,915 | $ | 214,257 | $ | 362,461 | ||||||
Selling, general and administrative expenses: | ||||||||||||
Drilling and Subsea | $ | 86,101 | $ | 92,924 | $ | 107,667 | ||||||
Production and Infrastructure | 42,461 | 45,186 | 58,870 | |||||||||
Corporate | — | 3,331 | 20,237 | |||||||||
|
|
|
| |||||||||
Total selling, general and administrative expenses | $ | 128,562 | $ | 141,441 | $ | 186,774 | ||||||
Impairment of goodwill and intangible assets | ||||||||||||
Drilling and Subsea | $ | 5,545 | $ | — | $ | — | ||||||
Production and Infrastructure | 1,464 | — | — | |||||||||
Total impairment of goodwill and intangible assets | $ | 7,009 | $ | — | $ | — | ||||||
Operating income: | ||||||||||||
Drilling and Subsea | $ | 38,226 | $ | 53,534 | $ | 117,927 | ||||||
Production and Infrastructure | 12,118 | 22,613 | 77,997 | |||||||||
Corporate | — | (3,331 | ) | (20,237 | ) | |||||||
|
|
|
| |||||||||
Total segment operating income | $ | 50,344 | $ | 72,816 | $ | 175,687 | ||||||
Contingent consideration | — | — | (12,100 | ) | ||||||||
Transaction expenses | — | — | (3,608 | ) | ||||||||
Gain/(loss) on sale of assets | (137 | ) | 461 | 634 | ||||||||
|
|
|
| |||||||||
Income from operations | 50,207 | 73,277 | 160,613 | |||||||||
Interest expense, net | 19,451 | 18,189 | 19,532 | |||||||||
Expenses related to the Combination | — | 6,968 | — | |||||||||
Deferred loan costs written off | — | 6,082 | — | |||||||||
Other (income) expense, net | (1,088 | ) | (2,308 | ) | 378 | |||||||
|
|
|
| |||||||||
Income before income taxes | 31,844 | 44,346 | 140,703 | |||||||||
Income tax expense | 11,011 | 20,297 | 47,110 | |||||||||
Loss from discontinued operations, net of taxes | 1,342 | — | — | |||||||||
|
|
|
| |||||||||
Net income | 19,491 | 24,049 | 93,593 | |||||||||
Income (loss) attributable to non-controlling interest | (155 | ) | (111 | ) | (251 | ) | ||||||
|
|
|
| |||||||||
Income attributable to common stockholders | $ | 19,336 | $ | 23,938 | $ | 93,342 | ||||||
|
|
|
| |||||||||
Weighted average shares outstanding | ||||||||||||
Basic | 1,304 | 1,454 | 1,710 | |||||||||
Diluted | 1,322 | 1,468 | 1,824 | |||||||||
Earnings per share | ||||||||||||
Basic | $ | 14.83 | $ | 16.46 | $ | 54.59 | ||||||
Diluted | $ | 14.63 | $ | 16.31 | $ | 51.17 | ||||||
|
|
| ||||||||||
Results of operations
| Year ended December 31, | Nine months ended September 30, | |||||||||||||||||||
| 2008 | 2009 | 2010 | 2010 | 2011 | ||||||||||||||||
|
|
|
|
|
|
|
|
|
|
| ||||||||||
| (unaudited) | ||||||||||||||||||||
| (in thousands of dollars, except per share information) | ||||||||||||||||||||
Revenue: | ||||||||||||||||||||
Drilling and Subsea | $ | 658,804 | $ | 455,019 | $ | 474,306 | $ | 346,382 | $ | 465,898 | ||||||||||
Production and Infrastructure | 313,747 | 222,359 | 273,029 | 199,369 | 325,514 | |||||||||||||||
|
| |||||||||||||||||||
Total revenue | $ | 972,551 | $ | 677,378 | $ | 747,335 | $ | 545,751 | $ | 791,412 | ||||||||||
Cost of sales: | ||||||||||||||||||||
Drilling and Subsea | $ | 454,129 | $ | 325,147 | $ | 327,848 | $ | 240,894 | $ | 310,116 | ||||||||||
Production and Infrastructure | 237,695 | 166,316 | 205,230 | 149,957 | 232,716 | |||||||||||||||
|
| |||||||||||||||||||
Total cost of sales | $ | 691,824 | $ | 491,463 | $ | 533,078 | $ | 390,851 | $ | 542,832 | ||||||||||
Gross profit: | ||||||||||||||||||||
Drilling and Subsea | $ | 204,675 | $ | 129,872 | $ | 146,458 | $ | 105,488 | $ | 155,782 | ||||||||||
Production and Infrastructure | 76,052 | 56,043 | 67,799 | 49,412 | 92,798 | |||||||||||||||
|
| |||||||||||||||||||
Total gross profit | $ | 280,727 | $ | 185,915 | $ | 214,257 | $ | 154,900 | $ | 248,580 | ||||||||||
Selling, general and administrative expenses: | ||||||||||||||||||||
Drilling and Subsea | $ | 98,395 | $ | 86,101 | $ | 92,924 | $ | 65,740 | $ | 72,304 | ||||||||||
Production and Infrastructure | 48,548 | 42,461 | 45,186 | 33,473 | 42,069 | |||||||||||||||
Corporate | — | — | 3,331 | 1,050 | 15,253 | |||||||||||||||
|
| |||||||||||||||||||
Total selling, general and administrative expenses | $ | 146,943 | $ | 128,562 | $ | 141,441 | $ | 100,263 | $ | 129,626 | ||||||||||
Impairment of goodwill and intangible assets | ||||||||||||||||||||
Drilling and Subsea | $ | 39,239 | $ | 5,545 | $ | — | — | — | ||||||||||||
Production and Infrastructure | 4,776 | 1,464 | — | — | — | |||||||||||||||
Total impairment of goodwill and intangible assets | $ | 44,015 | $ | 7,009 | $ | — | — | — | ||||||||||||
Operating income: | ||||||||||||||||||||
Drilling and Subsea | $ | 67,041 | $ | 38,226 | $ | 53,534 | $ | 39,748 | $ | 83,478 | ||||||||||
Production and Infrastructure | 22,728 | 12,118 | 22,613 | 15,939 | 50,729 | |||||||||||||||
Corporate | — | — | (3,331 | ) | (1,050 | ) | (15,253 | ) | ||||||||||||
|
| |||||||||||||||||||
Total segment operating income | 89,769 | 50,344 | 72,816 | 54,637 | 118,954 | |||||||||||||||
Contingent consideration | $ | — | $ | — | $ | — | $ | — | $ | 6,000 | ||||||||||
Transaction expenses | — | — | — | — | 3,434 | |||||||||||||||
Gain/(loss) on sale of assets | 619 | (137 | ) | 461 | 471 | 520 | ||||||||||||||
|
| |||||||||||||||||||
Income from operations | 90,388 | 50,207 | 73,277 | 55,108 | 110,040 | |||||||||||||||
Interest expense, net | 24,704 | 19,451 | 18,189 | 15,417 | 13,723 | |||||||||||||||
Expenses related to the Combination | — | — | 6,968 | 6,919 | — | |||||||||||||||
Deferred loan costs written off | — | — | 6,082 | 6,082 | — | |||||||||||||||
Other (income) expense, net | (2,065 | ) | (1,088 | ) | (2,308 | ) | (2,189 | ) | 1,261 | |||||||||||
|
| |||||||||||||||||||
Income before income taxes | 67,749 | 31,844 | 44,346 | 28,879 | 95,056 | |||||||||||||||
Income tax expense | 32,938 | 11,011 | 20,297 | 15,685 | 33,176 | |||||||||||||||
Loss from discontinued operations, net of taxes | 396 | 1,342 | — | — | — | |||||||||||||||
|
| |||||||||||||||||||
Net income | 34,415 | 19,491 | 24,049 | 13,194 | 61,880 | |||||||||||||||
Income (loss) attributable to non-controlling interest | (39 | ) | (155 | ) | (111 | ) | (123 | ) | (267 | ) | ||||||||||
|
| |||||||||||||||||||
Income attributable to common stockholders | $ | 34,376 | $ | 19,336 | $ | 23,938 | $ | 13,071 | $ | 61,613 | ||||||||||
|
| |||||||||||||||||||
Weighted average shares outstanding | ||||||||||||||||||||
Basic | 1,232 | 1,304 | 1,454 | 1,422 | 1,671 | |||||||||||||||
Diluted | 1,261 | 1,322 | 1,468 | 1,424 | 1,769 | |||||||||||||||
Earnings per share | ||||||||||||||||||||
Basic | $ | 27.90 | $ | 14.83 | $ | 16.46 | $ | 9.19 | $ | 36.87 | ||||||||||
Diluted | 27.26 | 14.63 | 16.31 | 9.18 | 34.83 | |||||||||||||||
| ||||||||||||||||||||
Nine monthsYear ended September 30,December 31, 2011 compared to nine monthsyear ended September 30,December 31, 2010
Revenue
Our revenue for the nine monthsyear ended September 30,December 31, 2011 increased $245.7$381 million, or 45.0%51.0%, compared to the nine monthsyear ended September 30,December 31, 2010. For the nine monthsyear ended September 30,December 31, 2011, our Drilling and Subsea Segment and our Production and Infrastructure Segment comprised 58.9%58.5% and 41.1%41.5% of our total revenue, respectively, compared to 63.5% and 36.5%, respectively, for the nine monthsyear ended September 30,December 31, 2010. The revenue increase by operating segment was comprised as follows:
Drilling and Subsea Segment—Revenue increased $119.5$185.1 million, or 34.5%39.0%, to $465.9$659.4 million during the nine monthsyear ended September 30,December 31, 2011 compared to the nine monthsyear ended September 30,December 31, 2010. The increase in revenue over the 2010 period was primarily due to the following:
$51.992.3 million of this increase was revenue from the acquisitions of AMC, P-Quip, Davis- Lynch, Cannon and Specialist.
$72.1 million of this increase was from increased drilling products sales attributable to higher drilling activity in the United States and Canada as reflected by the 23%21.5% increase in the average North American drilling rig count between the two periods. The higher revenue related to land rigs was in line with the higher rig count, partially offset by an $9.4a $6.5 million decrease in sales of capital equipment for new offshore rig construction.
$42.9 million of this increase was revenue from the 2011 acquisitions of AMC, P-Quip, Davis-Lynch, Cannon and Specialist.
| • | $ |
Production and Infrastructure Segment—Revenue increased $126.2$195.7 million, or 63.3%71.7%, to $325.5$468.7 million during the nine monthsyear ended September 30,December 31, 2011 compared to the nine monthsyear ended September 30,December 31, 2010. The increase in revenue over the 2010 period was primarily due to the following:
The $72.3$116.8 million of revenuethe increase was from the three acquisitions in 2011 acquisitions that make up our new flow equipment product line.
$36.952.8 million forof the increase was increased production equipment sales, which was generated from a combination of higher capital spending for surface production equipment by existing customers and the addition of sales to new customers.
$17.026.1 million fromof the increase was valve solutions due to moreincreased project orders and sales in the upstream market, and an increase in our Canadian market presence.
Cost of sales and gross margin percentage
Our overall cost of sales increased $152.0$232.6 million, or 38.9%43.6%, for the nine monthsyear ended September 30,December 31, 2011 compared to the nine monthsyear ended September 30,December 31, 2010. Overall gross margin percentage for the nine monthsyear ended September 30,December 31, 2011 was 31.4%32.1% compared to 28.4%28.7% for the nine monthsyear ended September 30,December 31, 2010.
Drilling and Subsea Segment—Cost of sales increased $69.2$106 million, or 28.7%32.3%, for the nine monthsyear ended September 30,December 31, 2011 compared to the nine monthsyear ended September 30,December 31, 2010 primarily due to increased
shipments, including $18.9$45.8 million attributable to the AMC, P-Quip, Davis-Lynch and Cannon acquisitions. Drilling and Subsea gross margin percentage for the nine monthsyear ended September 30,December 31, 2011 was 33.4%34.2% compared to 30.5%30.9% for the nine monthsyear ended September 30,December 31, 2010. The increase in gross margin percentage resulted from efficiencies achieved on higher production volumes and the benefit of the higher margins provided by the product lines acquired in recent acquisitions.the 2011 Acquisitions.
Production and Infrastructure Segment—Cost of sales increased $82.8$126.6 million, or 55.2%61.7%, for the nine monthsyear ended September 30,December 31, 2011 compared to the nine monthsyear ended September 30,December 31, 2010 primarily due to the $45.6$72.3 million attributable to the acquisitions making up our flow equipment product line and increased product shipments. Gross margin percentage improved for the nine monthsyear ended September 30,December 31, 2011 to 28.5%29.2% from 24.8% for the nine monthsyear ended September 30,December 31, 2010. The increase in segment gross margin percentage resulted from efficiencies achieved on higher production volumes and the acquisition of the higher margin flow equipment product line.
Selling, general and administrative expenses
Selling, general and administrative expenses increased $29.4$45.3 million, or 29.3%32.1%, for the nine monthsyear ended September 30,December 31, 2011 compared to the nine monthsyear ended September 30,December 31, 2010. As a percentage of revenue, selling, general and administrative expenses declined to 16.4%16.6% for the nine monthsyear ended September 30,December 31, 2011 from 18.4%18.9% for the nine monthsyear ended September 30,December 31, 2010. The reasons for the increase in selling, general and administrative expenses by segment and for corporate wasCorporate were as follows:
Drilling and Subsea Segment—Selling, general and administrative expenses for this segment increased by $6.6$14.7 million, inor 15.9%, for the nine monthsyear ended September 30,December 31, 2011 compared to the nine monthsyear ended September 30,December 31, 2010, of which $6.5$16.4 million is attributable to the AMC, P-Quip, Davis-Lynch, Cannon and Cannon acquisitions.Specialist acquisitions and is offset by various reductions in the administrative costs at the Subsea locations. As a percentage of revenue, these expenses declined to 15.5%16.3% for the nine monthsyear ended September 30,December 31, 2011 from 19.0%19.6% in the nine monthsyear ended September 30,December 31, 2010. The reduction was achieved by keeping administrative costs effectively constant during a period of increased production.
Production and Infrastructure Segment—Selling, general and administrative expenses for this segment increased $8.6$13.7 million, or 25.7%30.3%, for the nine monthsyear ended September 30,December 31, 2011 compared to the nine monthsyear ended September 30,December 31, 2010. The increase in expenses was due to payroll related costs incurred to support higher activity levels, especially for production equipment, and approximately $4.9$8.2 million was attributable to expenses incurred by the newly acquired flow equipment product line. As a percentage of revenue, these expenses declined to 12.9%12.6% for the nine monthsyear ended September 30,December 31, 2011 from 16.8%16.5% in the nine monthsyear ended September 30,December 31, 2010. The reduction was achieved by keeping administrative costs effectively constant during a period of increased production.
Corporate—Selling, general and administrative expenses for Corporate were $15.3$20.2 million for the nine monthsyear ended September 30,December 31, 2011 compared to $1.1$3.3 million for the nine monthsyear ended September 30,December 31, 2010. Corporate costs began to be separately reported in third quarter of 2010 as a result of the formationCombination of Forum through the Combination of legacy entities. Prior to the Combination, Corporate expenses were not shown separately as these similar costs prior to the Combination were imbedded in the segment results of the combined legacy companies that combined.entities. Corporate costs included, among other items, payroll related costs for general management and
management of finance and administration, legal, human resources and information technology; professional fees for legal, accounting and related services; and marketing costs.
Operating income and operating margin percentage
Operating income increased $102.9 million, or 141%, for the year ended December 31, 2011 compared to the year ended December 31, 2010. Overall operating margin percentage for the year ended December 31, 2011 was 15.6% compared to 9.7% for the year ended December 31, 2010.
Drilling and Subsea Segment—Operating income increased $43.7$64.4 million, or 110%120%, for the nine monthsyear ended September 30,December 31, 2011, compared to the nine monthsyear ended September 30,December 31, 2010. Operating margin percentage increased to 17.9% for the nine monthsyear ended September 30,December 31, 2011 from 11.5%11.3% for the nine monthsyear ended September 30,December 31, 2010. Operating margin percentage increased primarily because of lower selling, general and administrative expenses as a percentage of revenue as well as higher gross profit margins between periods.
Production and Infrastructure Segment—Operating income increased $34.8$55.4 million, or 218%245%, for the nine monthsyear ended September 30,December 31, 2011, compared to the nine monthsyear ended September 30,December 31, 2010. Operating margin percentage increased to 15.6%16.6% for the nine monthsyear ended September 30,December 31, 2011 from 8.0%8.3% for the nine monthsyear ended September 30,December 31, 2010. TheAll product lines contributed to the increased operating income and operating margin percentage wasprimarily due to the higher gross margins achieved from the acquired flow equipment product line.revenue.
Interest expense
We incurred $13.7$19.5 million of interest expense during the nine monthsyear ended September 30,December 31, 2011, a decreasean increase of $1.7$1.3 million from the nine monthsyear ended September 30,December 31, 2010. The decreaseincrease in interest expense was attributable to the reduction inhigher debt levels betweenin the periods as total debt decreased from $271.9 million at January 1, 2010 to $207.9 million at December 31, 2010. This lower debt level remained during most of the firstsecond half of 2011 resulting in lower interest expense. Debt levels increased during the third quarter of 2011 related to the acquisitions, but this debt was not outstanding for the entire nine-month period. Also, interest expense is lower than in the prior year period due to the interest paid onborrowings for acquisitions. In August 2010, we redeemed the mandatorily redeemable preferred stock that was fully redeemed in 2010.of Global Flow, eliminating preferred dividends classified as interest expense.
Taxes
Tax expense includes current income taxes expected to be due based on taxable income to be reported during the periods in the various jurisdictions in which we conduct business, and deferred income taxes based on changes in the tax effect of temporary differences between the bases of assets and liabilities for financial reporting and tax purposes at the beginning and end of the respective periods. The effective tax rate, calculated by dividing totalprovision for income tax expense by income from continuing operations before income taxes, was 34.9%45.7% and 54.3%33.5% for the nine monthsyears ended September 30,December 31, 2010 and 2011, and 2010, respectively. The tax provision for the nine months of 2011 fiscal year is lower than the comparable period in 2010 fiscal year primarily due to certainnonrecurring expenses incurred as part of the Combination in 2010 included in profit before taxes, but not deductible for tax purposes and due to adjustments for prior year taxes resulting from recently filed tax returns.purposes.
Year ended December 31, 2010 compared to year ended December 31, 2009
Revenue
Our revenue for the year ended December 31, 2010 increased $70.0$70 million, or 10.3%, compared to the year ended December 31, 2009. For the year ended December 31, 2010, our Drilling and Subsea Segment and our Production and Infrastructure Segment comprised 63.5% and 36.5% of
our total revenue, respectively, compared to 67.2% and 32.8%, respectively, for the year ended December 31, 2009. The revenue increase by operating segment was as follows:
Drilling and Subsea Segment—Revenue increased $19.3 million, or 4.2%, to $474.3 million during the year ended December 31, 2010 compared to the year ended December 31, 2009. Revenue in the
drilling product lines increased by approximately $22.1 million, primarily as a result of the approximately 45% increase in the average North American drilling rig count between the two periods. Orders for drilling products to be used on land rigs did not accelerate until the second half of 2010, as customers exhausted their existing consumables inventories in the first half of the year and as their ability to use equipment and supplies from previously stacked rigs diminished in the face of higher rig utilization. This revenue increase attributable to improvements in the land rig market was partially offset by a reduction in sales of manifolds and cranes used on offshore rigs.
Production and Infrastructure Segment—Revenue increased $50.7 million, or 22.8%, to $273.0$273 million during the year ended December 31, 2010 compared to the year ended December 31, 2009. The increase in revenue from sales of production equipment and valve products was approximately $37.9 million and $12.8 million, respectively. The increase in production equipment revenue was attributable to improved market conditions, the increased sales due to an enhancement of an existing product line for approximately $20.0$20.4 million, the successful addition of several new customers for approximately $9.0$9.3 million and expansion into new geographic markets in the United States for approximately $4.0$4 million. The increase in valve products revenue was attributable to improved market conditions.
Cost of sales and gross margin percentage
Our overall cost of sales increased $41.6 million, or 8.5%, for the year ended December 31, 2010 compared to the year ended December 31, 2009. Overall gross margin percentage for the year ended December 31, 2010 was 28.7% compared to 27.4% for the year ended December 31, 2009.
Drilling and Subsea Segment—Cost of sales increased $2.7 million, or 0.8%, for the year ended December 31, 2010 compared to the year ended December 31, 2009 due to increases in shipments as reflected in higher revenue. Gross margin percentage for the year ended December 31, 2010 was 30.9% compared to 28.5% for the year ended December 31, 2009. The increase in gross margin percentage resulted primarily from efficiencies achieved on increased production of our drilling products and from implementation of manufacturing process improvements for certain of our drilling products, in particular our catwalk systems and blowout preventers.
Production and Infrastructure Segment—Cost of sales increased $38.9 million, or 23.4%, for the year ended December 31, 2010 compared to the year ended December 31, 2009 due to increases in shipments as reflected in higher revenue. Gross margin percentage was down slightly for the year ended December 31, 2010 to 24.8% compared to 25.2% for the year ended December 31, 2009. The slight decrease was attributable to lower margins on the mix of valves sold during 2010, partially offset by cost controls implemented in 2009, that remained in place during 2010.
Selling, general and administrative expenses
Selling, general and administrative expenses increased $12.9 million, or 10.0%, for the year ended December 31, 2010 compared to the year ended December 31, 2009. As a percentage of revenue, selling, general and administrative expenses decreased slightly to 18.9% for the year ended December 31, 2010 from 19.0% for the year ended December 31, 2009. The increase in
selling, general and administrative expenses by segment and for corporate was as follows:
Drilling and Subsea Segment—Selling, general and administrative expenses increased $6.8 million, or 7.9%, for the year ended December 31, 2010, compared to the year ended December 31, 2009. As a percentage of revenue, these expenses increased to 19.6% for the year ended December 31, 2010 from 18.9% in the year ended December 31, 2009. The increase in these expenses exceeded
revenue growth due to: (1) costs incurred to close the Jupiter, Florida ROV manufacturing facility; and (2) additional stock-based compensation expense related to the Combination.
Production and Infrastructure Segment—Selling, general and administrative expenses increased $2.7 million, or 6.4%, for the year ended December 31, 2010, compared to the year ended December 31, 2009. As a percentage of revenue, these expenses declined to 16.5% for the year ended December 31, 2010 from 19.1% in the year ended December 31, 2009. The increase in dollar costs was due to increased payroll-related expenses to support activity, especially for production equipment as this product line was introduced into new geographic locations.
Corporate—Selling, general and administrative expenses for corporate was $3.3 million for the year ended December 31, 2010. Corporate costs are not shown separately prior to the Combination as these similar costs were imbedded in the segment results of the legacy companies before August 2, 2010.
Operating income and operating margin percentage
Drilling and Subsea Segment—Operating income increased $15.3 million, or 40.0%, during the year ended December 31, 2010 compared to the year ended December 31, 2009. Operating margin percentage increased to 11.3% for 2010 compared to 8.4% for 2009. The increases in operating income and operating margins primarily resulted from higher gross margins during 2010 as compared to 2009, offset slightly by the increase in selling, general and administrative costs for the same period. Additionally, a loss of $5.5 million was recognized during the year ended December 31, 2009 for impairment of goodwill caused by the change in market conditions and declining operating results and outlook related to certain subsea product lines.
Production and Infrastructure Segment—Operating income increased $10.5 million, or 86.6%, during the year ended December 31, 2010 compared to the year ended December 31, 2009 primarily due to the increased revenue as discussed above. Operating margin percentage increased to 8.3% in the year ended December 31, 2010 from 5.4% in 2009 as a result of efficiencies achieved on the higher activity levels and overall selling, general and administrative costs rising at a lesser rate than revenue. Further, a loss of $1.5 million was recognized during the year ended December 31, 2009 for impairment of certain trademark intangible assets.
Interest expense
We incurred $18.2 million of interest expense during the year ended December 31, 2010, a decrease of $1.3 million from the year ended December 31, 2009. This decrease was attributable to a reduction in total debt from approximately $289.9 million at the end of 2009 to $208.0$208 million at the end of 2010, partially offset by increased amortization of approximately $1.8 million of upfront loan costs in connection with the execution of our senior secured credit facility.
Taxes
The effective tax rate, calculated by dividing total tax expense by income before income taxes, was 45.8%45.7% for the year ended December 31, 2010 and 34.6%34.5% for the year ended December 31, 2009. The tax rate for 2010 is higher than for 2009 primarily due to certain expenses incurred as
part of the Combination included in profit before taxes not being deductible for tax purposes. In addition, our U.S. statutory rate in 2010 is 35% while several of the legacy companies in the Combination were taxed at a statutory rate of 34% in 2009 due to the size of their respective operations.
Year ended December 31, 2009 compared to year ended December 31, 2008
Revenue
Our revenue for the year ended December 31, 2009 decreased $295.2 million, or 30.4%, compared to the year ended December 31, 2008. For the year ended December 31, 2009, our Drilling and Subsea Segment and our Production and Infrastructure Segment comprised 67.2% and 32.8% of our total revenue, respectively, compared to 67.7% and 32.3%, respectively, for the year ended December 31, 2008. The revenue decrease by operating segment was as follows:
Drilling and Subsea Segment—Revenue decreased $203.8 million, or 30.9%, to $455.0 million during the year ended December 31, 2009 compared to the year ended December 31, 2008. Approximately $136.0 million of this decrease resulted from a decline in drilling product sales due to the sudden and steep reduction in drilling activity reflected by the 42% drop in North American rig count over the periods. As a result of the economic downturn that began in 2008 and the decrease in commodity prices, customers significantly curtailed drilling and completion spending throughout 2009. Consumable products sales and repair services experienced the largest declines in revenue with certain capital products such as manifolds and catwalks remaining more resilient as they worked off 2008 backlog. The remaining decrease resulted from a decline in subsea product sales, primarily because the economic downturn negatively impacted the number of ROVs sold in 2009 and other products and services related to subsea activity.
Production and Infrastructure Segment—Revenue decreased $91.4 million, or 29.1%, to $222.4 million during the year ended December 31, 2009 compared to the year ended December 31, 2008. The decrease in revenue resulted from our customers’ reduced activity levels in the face of the economic downturn that began in 2008 and the resulting lower commodity prices.
Cost of sales and gross margin percentage
Our overall cost of sales decreased $200.4 million, or 29.0%, for the year ended December 31, 2009 compared to the year ended December 31, 2008. Overall gross margin percentage for the year ended December 31, 2009 decreased to 27.4% compared to 28.9% for the year ended December 31, 2008.
Drilling and Subsea Segment—Cost of sales decreased $129.0 million, or 28.4%, for the year ended December 31, 2009 compared to the year ended December 31, 2008 due to decreases in shipments as reflected in lower revenue. Gross margin percentage for the year ended December 31, 2009 was 28.5% compared to 31.1% for the year ended December 31, 2008. The decrease in gross margin percentage was caused by the severe reduction in production levels in our manufacturing facilities due to decreased customer demand. In response to the economic downturn, our business reacted early and swiftly to preserve margins by closing four North American facilities and significantly reducing its worldwide workforce.
Production and Infrastructure Segment—Cost of sales decreased $71.4 million, or 30.0%, for the year ended December 31, 2009 compared to the year ended December 31, 2008 due to decreases in shipments as reflected in lower revenue. Gross margin percentage for the year ended
December 31, 2009 improved to 25.2% compared to 24.2% for the year ended December 31, 2008. The improvement in gross margin percentage year over year was achieved as a result of management’s focus on controlling costs. We also achieved better margins from our Gainesville, Texas production equipment manufacturing facility in 2009 as it began operations in mid-2008 and reached full production levels by late 2008.
Selling, general and administrative expenses
Selling, general and administrative expenses decreased $18.4 million, or 12.5%, for the year ended December 31, 2009 compared to the year ended December 31, 2008. As a percentage of revenue, selling, general and administrative expenses increased to 19.0% for the year ended December 31, 2009 from 15.1% for the year ended December 31, 2008. The decrease in selling, general and administrative expenses by each segment was as follows:
Drilling and Subsea Segment—Selling, general and administrative expenses decreased $12.3 million, or 12.5%, for the year ended December 31, 2009, compared to the year ended December 31, 2008. As a percentage of revenue, these expenses increased to 18.9% for the year ended December 31, 2009 from 14.9% in the year ended December 31, 2008. The dollar decrease in these expenses was a result of cutting costs across the Drilling and Subsea Segment in 2009. Costs were eliminated by closing several facilities, reducing headcount for sales and administrative support personnel, reducing commissions on lower sales volumes and decreasing marketing costs.
Production and Infrastructure Segment—Selling, general and administrative expenses decreased $6.1 million, or 12.5%, for the year ended December 31, 2009, compared to the year ended December 31, 2008. As a percentage of revenue, these expenses increased to 19.1% for the year ended December 31, 2009 from 15.5% in the year ended December 31, 2008. The dollar decrease was a result of implementing cost saving measures, such as reducing headcount and eliminating certain incentive bonuses.
Operating income and operating margin percentage
Drilling and Subsea Segment—Operating income decreased $28.8 million, or 43.0%, during the year ended December 31, 2009 compared to the year ended December 31, 2008. Operating income includes an impairment loss of $39.2 million in 2008 and $5.5 million in 2009. Operating margin percentage, excluding these impairment charges, was 9.6% and 16.1% in 2009 and 2008, respectively. The decrease in this adjusted operating income amount and margin percentage was due to the reduction in revenue and gross margins as discussed above, the increased selling, general and administrative expenses as a percentage of revenue also discussed above and a $5.5 million loss incurred in 2009 due to an impairment of goodwill related to the change in market conditions and declining operating results related to certain subsea product lines, partially offset by a $39.2 million loss incurred by this segment during 2008 due to an impairment of goodwill and the intangible assets of customer relationships and non-compete contracts. The 2008 impairment loss was as a result of the change in market conditions for the repair and refurbishment business and the business’ declining operating results.
Production and Infrastructure Segment—Operating income decreased $10.6 million, or 46.7%, during the year ended December 31, 2009 compared to the year ended December 31, 2008, primarily due to the decreased revenue as discussed above. Operating margin percentage decreased to 5.4% for 2009 from 7.2% in 2008. Furthermore, we incurred a $1.5 million loss during the year ended December 31, 2009 for the impairment of certain trademark intangible
assets, and a $4.8 million loss during the year ended December 31, 2008 for the impairment of goodwill and certain trademarks, both losses caused by declining economic conditions and operating results.
Interest expense
We incurred $19.5 million of interest expense during the year ended December 31, 2009, a decrease of $5.3 million from the year ended December 31, 2008. This decrease is attributable to the substantial reduction in debt levels as all of the businesses focused on reducing investments in working capital and curtailing capital spending. Over the course of the year, debt levels were reduced from approximately $371.8 million at the beginning of 2009 to $289.9 million at the end of the year.
Taxes
The effective tax rate was 34.6% for the year ended December 31, 2009 and 48.6% for the year ended December 31, 2008. The tax rate for 2009 is lower than for 2008 primarily due to the impairment of goodwill recorded in 2008 for which there was no tax benefit.
Liquidity and capital resources
Sources and uses of liquidity
Our internal sources of liquidity are cash on hand and cash flows from operations, while our primary external sources include our senior secured credit facility described below, trade credit and sales of our common stock. Our primary uses of capital have been for acquisitions, on-goingongoing maintenance or growth capital expenditures, inventories and sales on credit to our customers. We continually monitor potential capital sources, including equity and debt financing, in order to meet our investment and target liquidity requirements. Our future success and growth will be highly dependent on our ability to continue to access outside sources of capital.
Our total 20112012 capital expenditure budget is $60.2$62.7 million, which consists of, among other items, investments in expanding our rental fleet of subsea equipment, expanding certain manufacturing facilities and purchasing of machinery and equipment. This budget does not include expenditures for potential business acquisitions.
While we have budgeted $60.2 million for the year endingended December 31, 2011, the actual amount of capital expenditures may fluctuate based on market conditions. Forincurred was $41.2 million, and the first nine monthsbalance of 2011, we have incurred $29.6$19.0 million is included in the budget for capital2012. These expenditures which has beenwere funded from borrowings under our senior secured credit facility and internally generated funds. We believe the net proceeds from this offering and the concurrent private placement, together with cash flows from operations and additional borrowings under our senior secured credit facility, should be sufficient to fund our capital requirements for the remainder of 2011 and for 2012.
Although we do not budget for acquisitions, pursuing growth through acquisitions is a significant part of our business strategy. We have expanded and diversified our product portfolio and business lines with the acquisition of eight businesses in 2011 for a total consideration (net of cash acquired) of approximately $590$578 million. We used cash on hand and borrowings under our senior secured credit facility to finance these acquisitions. We continue to actively review acquisition opportunities on an ongoing basis. Our ability to make significant additional acquisitions for cash will require us to obtain additional equity or debt financing, which we may not be able to obtain on terms acceptable to us or at all.
On August 2, 2010, we entered into a senior secured revolving credit facility, under which we could borrow up to $450 million. Effective June 29, 2011, we amended our revolving credit facility to, among other things, increase the commitment to $750 million. On October 4, 2011, we amended and restated the credit agreement governing our revolving credit facility to, among other things, convert $300 million of indebtedness thereunder to a term loan and decrease the revolving commitment thereunder to $600 million.million, and to extend the facility’s maturity to October 2016. For more information regarding our revolving credit facility, see “—Our senior secured credit facility.”
Our cash flows for the years ended December 31, 2008, 2009, and 2010 and for the nine months ended September 30, 2010 and 2011 are presented below (in millions):
| Year ended December 31, | Nine months ended September 30, | Year ended December 31, | ||||||||||||||||||||||||||||||
| 2008 | 2009 | 2010 | 2010 | 2011 |
|
|
| |||||||||||||||||||||||||
|
| 2009 | 2010 | 2011 | ||||||||||||||||||||||||||||
Net cash provided by operating activities | $ | 112.5 | $ | 107.8 | $ | 66.0 | $ | 27.9 | $ | 18.6 | $ | 107.8 | $ | 66.0 | $ | 39.3 | ||||||||||||||||
Net cash used in investing activities | (160.9 | ) | (10.9 | ) | (19.2 | ) | (8.9 | ) | (534.7 | ) | (10.9 | ) | (19.2 | ) | (550.1 | ) | ||||||||||||||||
Net cash provided by/(used in) financing activities | 58.9 | (94.5 | ) | (54.3 | ) | (26.5 | ) | 531.9 | (94.5 | ) | (54.3 | ) | 510.1 | |||||||||||||||||||
Net increase (decrease) in cash and cash equivalents | (12.7 | ) | 7.0 | (6.5 | ) | (7.0 | ) | 16.6 | 7.0 | (6.5 | ) | 0.2 | ||||||||||||||||||||
Free cash flow (unaudited) | 72.9 | 92.7 | 46.4 | 19.1 | (11.0) | 92.7 | 46.4 | (1.9 | ) | |||||||||||||||||||||||
| ||||||||||||||||||||||||||||||||
A reconciliation of free cash flow to cash flow from operating activities is as follows:follows (in millions):
| Year ended December 31, | Nine months ended September 30, | Year ended December | ||||||||||||||||||||||||||||||
| 2008 | 2009 | 2010 | 2010 | 2011 |
|
|
| |||||||||||||||||||||||||
|
| 2009 | 2010 | 2011 | ||||||||||||||||||||||||||||
Free cash flow—Reconciliation: | ||||||||||||||||||||||||||||||||
Free cash flow-Reconciliation: | ||||||||||||||||||||||||||||||||
Cash flow from operating activities | $ | 112.5 | $ | 107.8 | $ | 66.0 | $ | 27.9 | $ | 18.6 | $ | 107.8 | $ | 66.0 | $ | 39.3 | ||||||||||||||||
Capital expenditures for property and equipment | (39.6 | ) | (15.1 | ) | (19.6 | ) | (8.8 | ) | (29.6 | ) | (15.1 | ) | (19.6 | ) | (41.2 | ) | ||||||||||||||||
|
|
|
|
| ||||||||||||||||||||||||||||
Free cash flow | $ | 72.9 | $ | 92.7 | $ | 46.4 | $ | 19.1 | $ | (11.0 | ) | $ | 92.7 | $ | 46.4 | $ | (1.9 | ) | ||||||||||||||
|
|
|
|
| ||||||||||||||||||||||||||||
Cash flows provided by operating activities
Net cash provided by operating activities was $66.0$39.3 million for the year ended December 31, 2011 and $66 million for the year ended December 31, 2010. This $26.7 million reduction in operating cash flow was primarily due to our investment in working capital due to higher business activity levels as we strategically stocked inventories in our regional distribution centers in order to meet the increased demand.
Net cash provided by operating activities was $66 million for the year ended December 31, 2010 and $107.8 million for the year ended December 31, 2009. This $41.8 million reduction in operating cash flow was primarily due to the significant changes in market conditions, with our business contracting during the global economic downturn in 2009, allowing for reductions in our investments in working capital, and a return to growth with modest investments in working capital during 2010 as the economy recovered. Net cash provided by operating activities was $18.6 million for the nine months ended September 30, 2011, and net cash provided by operations was $27.9 million for the nine months ended September 30, 2010. This change in cash flows was also driven by our investment in working capital due to higher business activity levels as we strategically stocked inventories in our regional distribution centers in order to meet the increased demand.
Net cash provided by operating activities was $112.5 million for the year ended December 31, 2008 and $107.8 million for the year ended December 31, 2009. This $4.7 million reduction in operating cash flow was primarily due to the significant changes in market conditions, with our
business contracting during the global economic downturn in 2009, partially offset by a reduction in working capital investments in the year ended December 31, 2009.
Our operating cash flows are sensitive to a number of variables, the most significant of which is the level of drilling and production activity for oil and natural gas reserves. These activity levels are in turn impacted by the volatility of oil and natural gas prices, regional and worldwide economic activity and its effect on demand for hydrocarbons, weather, infrastructure capacity to reach markets and other variable factors. These factors are beyond our control and are difficult to predict. For additional information on the impact of changing prices on our financial position, see “—Quantitative and qualitative disclosures about market risk” below.
Cash flows used in investing activities
Net cash used in investing activities was $550.1 million and $19.2 million for the years ended December 31, 2011 and December 31, 2010, respectively, a $530.9 million increase. Of this increase, $510 million was used to fund the cash portion of consideration for our eight acquisitions, while the remaining amount was primarily attributable to increased investments in property and equipment. Other than capital required for acquisitions, we expect to fund all maintenance and other growth capital expenditures from our current cash on hand and from internally generated funds.
Net cash used in investing activities of $19.2 million for the year ended December 31, 2010 was $8.3 million higher than for the year ended December 31, 2009. The increase was primarily attributable to investingincreased investments in property and equipment as market conditions improved. Other than capital required for acquisitions, we expect to fund all maintenance and other growth capital expenditures from our current cash on hand and from internally generated funds. Net cash used in investing activities was $534.7 million and $8.9 million for the nine months ended September 30, 2011 and September 30, 2010, respectively, a $525.8 million increase. Of this increase, $505.4 million was for our eight recent acquisitions while the remaining amount was primarily attributable to increased investments in property and equipment.
Net cash used in investing activities was $160.9 million for the year ended December 31, 2008 compared to $10.9 million for the year ended December 31, 2009. This change was primarily due to $134.0 million of cash used for acquisitions of businesses for the year ended December 31, 2008 compared to $1.7 million in the year ended December 31, 2009.
Cash flows provided by financing activities
Net cash provided by financing activities was $510.1 million for the year ended December 31, 2011, primarily from net draws on our senior secured credit facility of $458.4 million and
proceeds from stock issuances of $57 million. Net cash used in financing activities was $54.3 million and $94.5 million for the years ended December 31, 2010 and December 31, 2009, respectively. For the year ended December 31, 2010, we usedwhich was primarily attributable to a net pay down on our long-term debt of $83.4 million to pay downand our long-term debt, and in conjunction with the Combination we repurchasedrepurchase of $25 million of our common stock and we issuedin conjunction with the Combination, offset by proceeds from stock issuances of $64.9 million in new shares for cash.million. The remaining use of cash was primarily for debt issue costs. For the year ended December 31, 2009, we paid down long-term debt by $94.5 million from internally generated cash flows from operations. Net cash provided by financing activities was $531.9 million for the nine months ended September 30, 2011, primarily from draws on our senior secured credit facility and proceeds from stock issuances, and cash used in financing activities was $26.5 million for the nine months ended September 30, 2010, for the repayment of long-term debt and purchases of stock offset by proceeds from stock issuances.
Net cash used in financing activities was $58.9 million for the year ended December 31, 2008 compared to cash provided by financing activities of $94.5 million for the year ended December 31, 2009. This change was due to $94.1 million in net payments on long-term debt forFor the year ended December 31, 2009, compared to $36.3we had a net pay down of long-term debt of $94.5 million in net borrowings in the year ended December 31, 2008. Also, we received an insignificant amount of proceeds from stock issuances in the year ended December 31, 2009, but we received $25.7 million in proceedsinternally generated cash flows from stock issuances in the year ended December 31, 2008.operations.
Our senior secured credit facility
We have an amended and restated senior secured credit facility (the “credit agreement”) with Wells Fargo Bank, National Association, as Administrative Agent, and certain other financial institutions. The credit agreement provides for a $300.0$300 million term loan and a $600.0$600 million revolving credit facility, including up to $75.0$75 million for letters of credit and up to $25.0$25 million in swingline loans, and matures in October 2016.
As of September 30, 2011, we had borrowings of $684 million under the credit agreement. We had undrawn availability under our senior secured credit facility of approximately $210 million at December 31, 2010 and approximately $60 million at September 30, 2011. Effective June 29, 2011, we amended our senior secured credit facility to, among other things, increase the commitment to $750 million. On October 4, 2011, we amended and restated the credit agreement to, among other things, convert $300 million of indebtedness thereunder to a term loan and decrease the revolving commitment thereunder to $600 million.million, and to extend the facility’s maturity to October 2016. As of December 8, 2011,March 9, 2012, we had $676$644.3 million of revolving loans outstandingborrowings under our senior secured credit facility and $3.6$5.4 million of outstanding letters of credit resulting in $224and capacity to borrow an additional $250.3 million under the revolving portion of availability as of that date.our senior secured credit facility.
It is anticipated that future borrowings under the credit agreement will be available for working capital and general corporate purposes, for permitted mergers and acquisitions, and for permitted distributions. It is anticipated that the senior secured credit facility under the credit agreement will be available to be drawn on and repaid during the term thereof so long as we are in compliance with the terms of the credit agreement, including certain financial covenants.
The credit agreement contains various covenants that, among other things, limit our ability to grant certain liens, make certain loans and investments, make distributions, enter into mergers or acquisitions unless certain conditions are satisfied, enter into hedging transactions, change our lines of business, prepay certain indebtedness, enter into certain affiliate transactions or engage in certain asset dispositions. Additionally, the credit agreement limits our ability to incur additional indebtedness with certain exceptions.
The credit agreement also contains financial covenants, which, among other things, require us, on a consolidated basis, to maintain specified financial ratios or conditions summarized as follows:
Total funded debt to adjusted EBITDA (defined as the “Leverage Ratio” in the credit agreement) of not more than 3.75 to 1.0 for fiscal quarters ending through December 31, 2012, 3.50 to 1.0 for fiscal quarters ending from January 1, 2013 through December 31, 2013, 3.25 to 1.0 for fiscal quarters ending from January 1, 2014 through December 31, 2014 and 3.00 to 1.0 for fiscal quarters ending thereafter (provided that following any senior, unsecured high yield note issuance by the Company, the maximum Leverage Ratio test will be 4.00 to 1.00 for each fiscal quarter after such issuance);
EBITDA to interest expense (defined as the “Interest Coverage Ratio” in the credit agreement) of not less than 3.0 to 1.0; and
Following any senior, unsecured high yield note issuance by the Company, total secured funded debt to EBITDA (defined as the “Senior Secured Leverage Ratio” in the credit agreement) of not more than 2.50 to 1.00.
We were in compliance with the aforementioned financial covenants at December 31, 2010 and September 30, 2011.
Under the credit agreement, EBITDA is defined to generally exclude the effect of non-cash items, and to give pro forma effect to acquisitions and non-ordinary course asset sales (with adjustments to EBITDA of the acquired businesses or related to the sold assets to be made in accordance with the guidelines for pro forma presentations set forth by the SEC or in a manner otherwise reasonably acceptable to the Administrative Agent under the credit agreement). All of the obligations under the credit agreement are secured by first priority liens (subject to permitted liens) on substantially all of the assets of the Company and its domestic restricted subsidiaries, with exceptions for real property and certain other assets set forth in the credit agreement. Additionally, all of the obligations under the credit agreement are guaranteed by the wholly-owned domestic subsidiaries of the Company.
We have the ability to elect the interest rate applicable to borrowings under the credit agreement. Interest under the credit agreement may be determined by reference to (1) the London interbank offered rate, or LIBOR, plus an applicable margin between 1.75% and 3.00% per annum (with the applicable margin depending upon our ratio of total funded debt to EBITDA) or (2) the Adjusted Base Rate plus an applicable margin between 0.25% and 1.50% per annum (with the applicable margin depending upon our ratio of total funded debt to EBITDA). The Adjusted Base Rate will be equal to the highest of (1) the Federal Funds Rate, as published by the Federal Reserve Bank of New York, plus one half of 1.0%, (2) the prime rate of Wells Fargo Bank, National Association, as established from time to time at its principal U.S. office and (3) daily LIBOR for an interest period of one-month plus 1.0%. The weighted average interest ratesrate at September 30, 2011 and December 31, 20102011 on all outstanding principal amounts of indebtedness under our senior secured credit facility (prior to the amendment and restatement) were 2.7% and 3.0%, respectively.was 2.78%.
Interest is payable quarterly for base rate loans and at the end of applicable interest periods for LIBOR loans, except that if the interest period for a LIBOR loan is longer than three months, interest is paid at the end of each three-month period.
If an event of default exists under the credit agreement, the lenders have the right to accelerate the maturity of the obligations outstanding under the credit agreement and exercise other rights and remedies. Each of the following constitutes an event of default under the credit agreement:
Failure to pay any principal when due or any interest, fees or other amount within certain grace periods;
Representations and warranties in the credit agreement or other loan documents being incorrect or misleading in any material respect;
Failure to perform or otherwise comply with the covenants in the credit agreement or other loan documents, subject, in certain instances, to grace periods;
Impairment of security under the loan documents affecting collateral having a fair market value in excess of $5.0$5 million;
The actual or asserted invalidity of any material provisions of the guarantees of the indebtedness under the credit agreement;
Default by us or our restricted subsidiaries on the payment of any other indebtedness with a principal amount in excess of $20.0$20 million, any default in the performance of any obligation or condition with respect to such indebtedness beyond the applicable grace period if the effect of the default is to permit or cause the acceleration of the indebtedness, or such indebtedness will be declared due and payable prior to its scheduled maturity;
Bankruptcy or insolvency events involving us or our restricted subsidiaries;
The entry, and failure to pay, of one or more adverse judgments in excess $20.0$20 million, upon which enforcement proceedings are commenced or that are not stayed pending appeal; and
The occurrence of a change in control (as defined in the credit agreement).
This offering will not constitute a change in control so long as no “person” or “group” (as such terms are used in Sections 13(d) and 14(d) of the Securities Exchange Act of 1934 with certain exclusions) other than SCF becomes the beneficial owner, directly or indirectly, of 33% or more of our voting stock.
We have entered into derivative contracts to hedge our exposure to interest rate fluctuations on $158.1$97.5 million of the debt outstanding at September 30,December 31, 2011. See “—Quantitative and qualitative disclosures about market risk” below for details regarding these contracts.
Obligations and commitments
Our debt, lease and financial obligations as of December 31, 20102011 will mature and become due and payable according to the following table (amounts in thousands of U.S. dollars):
| 2011 | 2012-2014 | 2015 | After 2015 | Total | 2012 | 2013-2015 | 2016 | After 2016 | Total | |||||||||||||||||||||||||||||||
|
|
| ||||||||||||||||||||||||||||||||||||||
Senior secured credit facility | $ | — | $ | 204,000 | $ | — | $ | — | $ | 204,000 | $ — | $ — | $363,694 | $ — | $363,694 | |||||||||||||||||||||||||
Term loan | 3,750 | 82,500 | 213,750 | — | 300,000 | |||||||||||||||||||||||||||||||||||
Other debt | 3,209 | 715 | — | — | 3,924 | 1,426 | 195 | 240 | — | 1,861 | ||||||||||||||||||||||||||||||
Derivative liability | 2,194 | 2,162 | — | — | 4,356 | 185 | 1,588 | — | — | 1,773 | ||||||||||||||||||||||||||||||
Operating leases | 10,033 | 13,424 | 1,403 | 6,236 | 31,096 | 13,444 | 21,703 | 3,838 | 13,961 | 52,946 | ||||||||||||||||||||||||||||||
Letters of credit | 8,260 | 1,169 | — | — | 9,429 | 3,808 | 156 | 205 | — | 4,169 | ||||||||||||||||||||||||||||||
|
|
|
| |||||||||||||||||||||||||||||||||||||
Total | $ | 23,696 | $ | 221,470 | $ | 1,403 | $ | 6,236 | $ | 252,805 | $22,613 | $106,142 | $581,727 | $13,961 | $724,443 | |||||||||||||||||||||||||
|
|
| ||||||||||||||||||||||||||||||||||||||
Critical accounting policies and estimates
The discussion and analysis of our financial condition and results of operations are based upon our consolidated financial statements, which have been prepared in accordance with accounting principles generally accepted in the United States. The preparation of our financial statements requires us to make estimates and assumptions that affect the reported amounts of assets, liabilities, revenues and expenses and related disclosure of contingent assets and liabilities. Certain accounting policies involve judgments and uncertainties to such an extent that there is a reasonable likelihood that materially different amounts could have been reported under different conditions, or if different assumptions had been used. We evaluate our estimates and assumptions on a regular basis. We base our estimates on historical experience and various other assumptions that are believed to be reasonable under the circumstances, the results of which form the basis for making judgments about the carrying values of assets and liabilities that are
not readily apparent from other sources. Actual results may differ from these estimates and assumptions used in preparation of our consolidated financial statements. We provide expanded discussion of our more significant accounting policies, estimates and judgments below. We believe that these accounting policies reflect our more significant estimates and assumptions used in preparation of our consolidated financial statements.
Revenue recognition
The substantial majority of our revenue is recognized when the associated goods are shipped and title passes to the customer or when services have been rendered, as long as all of the criteria for recognition described in Note 2 to our consolidated financial statements have been met. The only revenue recognition criteria requiring judgment on these sales is assurance of collectability. We carefully evaluate credit worthinesscreditworthiness of our customers before extending payment terms other than cash upfront, and historically we have not incurred significant losses for bad debt.
Revenue generated from long-term contracts, typically longer than six months in duration, is recognized on the percentage-of-completion method of accounting. Approximately 14%10% of our 20102011 revenue was accounted for on this basis. There are significant estimates and judgments involved in recognizing revenue over the term of the contract. We generally recognize revenue and cost of goods sold each period based upon the advancement of the work-in-progress. The percentage complete is determined based on the ratio of costs incurred to-dateto date to total estimated costs for the project. The percentage-of-completion method requires management to calculate reasonably dependable estimates of progress towards completion and total contract costs. Each period these long-term contracts are re-evaluatedreevaluated and may result in upward or downward revisions in estimated total costs, which are accounted for in the period of the change to reflect a catch up adjustment for the cumulative impact from inception of the contract to date in the period of the revision. Whenever revisions of estimated contract costs and contract value indicates that the contract costs will exceed estimated revenue, thus creating a loss, a provision for the total estimated loss is recorded in that period.
Revenue from the rental of equipment or providing of services is recognized over the period when the asset is rented or services are rendered and collectability is reasonably assured. Rates for asset rental and service provision are priced on a per day, per man hour, or similar basis. There are typically delays in receiving some field tickets reporting utilization of equipment or personnel requiring us to make estimates for revenue recognition in the period. In the following period, these estimates are adjusted to actual field tickets received late.
Fair value of common stock
In connection with the Combination, the fair value of FOT’s common stock was determined using common market pricing principles. This valuation was reviewed by an independent valuation firm utilizing similar principles which rendered fairness opinions in connection with the approval of the Combination by the boards of directors or independent special committees, as applicable, of each of the combining companies. Following the completion of the Combination, we developed a methodology to consistently value our stock on a regular basis to support a variety of corporate and strategic activities. Among these activities are public company benchmarking, accounting for share-based compensation awards and valuing the total purchase price for acquisitions when our shares comprise a part of the consideration. We use the same fair value for our common stock in effect at any particular time across each of these corporate and strategic activities. The methodology we developed used common market pricing principles to produce a fair value per
share of common stock that reflects equity market pricing fundamentals, industry activity levels, our business and financial performance and our organizational maturity. This methodology was designed to be robust enough to be applied in a consistent manner at each evaluation point to reflect developments in our industry, while at the same time being simple enough so as to minimize management judgment or bias in the calculation of the fair value of our stock.
Our management presented this methodology and the resulting fair value of our common stock to our board of directors at its first regularly scheduled meeting following the Combination for its review and approval. Since the approval of this methodology by the board of directors, management has presented the calculation of the fair value using the same methodology to the board of directors for its review and approval at each subsequent regularly scheduled board meeting, and in July 2011 after we completed a number of acquisitions simultaneously. Management and our board of directors monitor developments at our company and are prepared to re-evaluatereevaluate and modify the fair value of our common stock in the event that other such significant developments warrant such a re-evaluationreevaluation and modification between regularly scheduled board meetings.
The basic tenets of our methodology are as follows:
| • | General concept. We use normalized comparable public company trading multiples and apply those multiples to our corresponding financial results and financial projections in order to calculate an implied equity value. We then apply an illiquidity discount to that implied equity value and use that adjusted implied equity value to calculate the fair value per share. |
| • | Use of public company comparables. Our board of directors reviewed and approved a group of comparable public companies whose equity market pricing reflected the market’s view on key sector, geographic and product type exposure fundamentals similar to those that drive our business. Our board of directors regularly reviews with management the group of comparable companies used for purposes of this analysis and has made modifications to the group of comparable public companies when, in its discretion, such companies were no longer valid comparables or when market data about a company is no longer available. Otherwise, we use the same group of public company comparables each time we perform the fair value methodology. |
| • | Normalization. In order to mitigate short term volatility, our methodology averages four identical sets of trading multiples of the comparable public companies over different periods of time. The four periods of time include a current set of multiples and a set from each of the prior three quarters. This helps mitigate short term volatility of the underlying multiples and the resulting impact on the fair value of our common stock while still taking into account changes in the perceptions of the public markets of the fair value of other companies in our industry. |
| • | Selected multiples and weighting. Our methodology uses a weighted mix of EBITDA and book value multiples from our public company comparables. We further average the following time periods for each EBITDA-based multiple: (1) prior calendar year; (2) trailing twelve months; (3) current calendar year forecast; and (4) forward two calendar year forecasts. We also average the following book value multiples: (1) enterprise value to adjusted book value; (2) enterprise value to tangible adjusted book value; and (3) market value of equity to book value of equity. Each of these sets of multiples are averaged across the normalization periods described above to produce a time series average multiple for the applicable metric across the applicable period and applied against our corresponding financial results. |
| • | Illiquidity discount. Because our common stock is not publicly traded, common valuation practice dictates that we apply an illiquidity discount to the implied equity value produced by the public company multiples we use in our fair value methodology. This illiquidity discount also refers to the discount investors typically apply to the equity value of a company completing its initial public offering relative to established publicly traded peers, subject to changing capital market environments. Historically we utilized an illiquidity discount of 30% through the February 2011 board meeting. Our board of directors |
approved this illiquidity discount on the basis of its belief that, in a sale of our common stock in an arms-length transaction, such a discount to the value of our common stock would be applied by the buyer due to the lack of liquidity in the stock and the low prospects for liquidity of that stock in the near term. Commencing with the fair value determination at the meeting of our board of directors in May 2011, the illiquidity discount was reduced to 20%. This reflected our board of directors belief that the prospects for the creation of a liquid market in the near to medium term had been enhanced as a result of our consideration of this offering and our increased organizational maturity. At the same time, our board of directors recognized that there were substantial risks associated with the completion of a transaction that provided liquidity to the holders of our common stock. Thus, our board of directors concluded that it was still appropriate to apply a liquidity discount to the implied equity value of our company. At the board of directors meeting in August 2011, the illiquidity discount was returned to 30%. This was decided in order to reflect: (1) the uncertainty over the timing of this offering due to heightened concerns over the possibility of a return to recession in the world economy, and (2) our assessment that potential public investors of companies like ours were becoming more risk averse, which we believed could impact the valuations of less seasoned companies with a less liquid flotation of shares. Our board of directors reaffirmed this view at our regularly scheduled meetings in December 2011 |
We have applied this methodology consistently since the Combination.
Share-based compensation
We account for awards of share-based compensation at fair value on the date granted to employees and recognize the compensation expense in the financial statements over the requisite service period. Fair value of the share-based compensation was measured using the Black-Scholes model for most of the outstanding options and a binomial model for certain share-based compensation instruments issued by one of the legacy companies. These models require assumptions and estimates for inputs, especially the estimate of the volatility in the value of the underlying share price, that affect the resultant values and hence the amount of compensation expense recognized. We determine the estimate of volatility periodically based on the averages for the stocks of comparable publicly traded companies.
Inventories
Inventory, consisting of finished goods and materials and supplies held for resale, is carried at the lower of cost or market. We continuously evaluate our inventories, based on an analysis of stocking levels, historical sales experience and future sales forecasts, to determine obsolete, slow-moving and excess inventory. While we have policies for calculating and recording reserves against inventory carrying values, we exercise judgment in establishing and applying these policies.
Business combinations, goodwill and other intangible assets
Goodwill acquired in connection with business combinations represents the excess of consideration over the fair value of net assets acquired. Certain assumptions and estimates are employed in determining the fair value of assets acquired, evaluating the fair value of liabilities assumed, as well as in determining the allocation of goodwill to the appropriate reporting unit. These estimates may be affected by factors such as changing market conditions, technological
advances in the oil and natural gas industry or changes in regulations governing that industry. The most significant assumptions requiring the most judgment involve identifying and estimating the fair value of intangible assets and the associated useful lives for establishing amortization periods. To finalize purchase accounting for significant acquisitions, we utilize the services of independent valuation specialists to assist in the determination of the fair value of acquired intangible assets.
There are also significant judgments involved in estimating the value of any contingent purchase consideration, for example, additional cash or stock consideration to be earned based on the future results of the acquired business. The value of this potential additional consideration is required to be estimated and recorded as part of the purchase accounting for the acquisition in the period when the transaction is effective. Each quarter these estimates must be re-evaluatedreevaluated based on actual results achieved and changes in circumstances, and the contingent consideration marked-to-market with any change in value reflected in profit and loss for the period.
For goodwill and intangible assets with indefinite lives, an assessment for impairment is performed annually or whenever an event indicating impairment may have occurred. We typically complete our annual impairment test for goodwill and other indefinite-lived intangibles using an assessment date of December 31. Goodwill is reviewed for impairment by comparing the carrying value of each reporting unit’s net assets, including allocated goodwill, to the estimated fair value of the reporting unit. As of December 31, 2010,2011, we had foursix reporting units. We determine the fair value of our reporting units using a discounted cash flow approach. Determining the fair value of a reporting unit requires judgment and the use of significant estimates and assumptions. Such estimates and assumptions include revenue growth rates, future operating margins, the weighted average cost of capital, and future market conditions, among others. We believe that the estimates and assumptions used in our impairment assessments are reasonable. If the reporting unit’s carrying value is greater than its fair value, a second step is performed whereby the implied fair value of goodwill is estimated by allocating the fair value of the reporting unit in a hypothetical purchase price allocation analysis. We recognize a goodwill impairment charge for the amount by which the carrying value of goodwill exceeds its reassessed fair value. At December 31, 2010,2011, we performed our annual impairment test on each of our reporting units and concluded that there had been no impairment because the estimated fair values of each of those reporting units substantially exceeded its carrying value.
In the third quarter of 2010, we implemented a change in accounting estimate to adjust the useful lives of certain of our customer relationship and distributor relationship intangible assets. This change resulted in an approximately $2.2 million reduction in the amortization expense in the year ended December 31, 2010, and an increase to net income of $1.4 million (or $1.00 per diluted share). We extended the useful lives of these intangible assets based on positive changes in customer attrition rates and due to several factors pursuant to the Combination which further strengthen these relationships.
Income taxes
We follow the liability method of accounting for income taxes. Under this method, deferred income tax assets and liabilities are determined based upon temporary differences between the carrying amounts and tax bases of our assets and liabilities at the balance sheet date, and are measured using enacted tax rates and laws that will be in effect when the differences are expected to reverse. We record a valuation reserve whenever management believes that it is
more likely than not that any deferred tax asset will not be realized. We must apply judgment in assessing the realizability of deferred tax assets, including estimating our future taxable income, to predict whether a future cash tax reduction will be realized from the deferred tax asset. Any changes in the valuation allowance due to changes in circumstances and estimates are recognized in income tax expense in the period the change occurs.
The accounting guidance for income taxes requires that we recognize the financial statement benefit of a tax position only after determining that the relevant tax authority would more likely than not sustain the position following an audit. If a tax position meets the “more likely than not” recognition criteria, the accounting guidance requires the tax position be measured at the largest amount of benefit greater than 50% likely of being realized upon ultimate settlement. If management determines that likelihood of sustaining the realization of the tax benefit is less than or equal to 50%, then the tax benefit is not recognized in the financial statements.
We have operations in countries other than the United States. Consequently, we are subject to the jurisdiction of a number of taxing authorities. The final determination of tax liabilities involves the interpretation of local tax laws, tax treaties, and related authorities in each jurisdiction. Changes in the operating environment, including changes in tax law or interpretation of tax law and currency repatriation controls, could impact the determination of our tax liabilities for a given tax year.
Property and equipment
Property and equipment is stated at cost less accumulated depreciation. Depreciation is computed using the straight-line method based on the estimated useful lives of assets, generally 3 to 19 years. We have established standard lives for certain classes of assets.
We review long-lived assets for potential impairment whenever events or changes in circumstances indicate that the carrying amount of a long-lived asset may not be recoverable. In performing the review for impairment, future cash flows expected to result from the use of the asset and its eventual disposal are estimated. If the undiscounted future cash flows are less than the carrying amount of the assets, the asset is impaired. The amount of the impairment is measured as the difference between the carrying value and the estimated fair value of the asset. The fair value is determined either through the use of an external valuation, or by means of an analysis of discounted future cash flows based on expected utilization. The impairment loss recognized represents the excess of the assets carrying value as compared to its estimated fair value.
Effective January 1, 2010, we implemented a change in accounting estimate to adjust the useful lives of marine electronic survey equipment held for rent. This change resulted in an approximately $3.2 million reduction in the depreciation expense in the year ended December 31, 2010, an increase to net income of $2.1 million (or $1.43 per diluted share). We extended the useful lives of these long-lived assets based on our review of their historical service lives, technological improvements in the assets and proven longer useful mechanical and technical lives.
Recognition of provisions for contingencies
In the ordinary course of business, we are subject to various claims, suits and complaints. We, in consultation with internal and external advisors, will provide for a contingent loss in the
consolidated financial statements if it is probable that a liability has been incurred at the date of the consolidated financial statements and the amount can be reasonably estimated. If it is determined that the reasonable estimate of the loss is a range and that there is no best estimate within the range, provision will be made for the lower amount of the range. Legal costs are expensed as incurred.
An assessment is made of the areas where potential claims may arise under the contract warranty clauses. Where a specific risk is identified and the potential for a claim is assessed as probable and can be reasonably estimated, an appropriate warranty provision is recorded. Warranty provisions are eliminated at the end of the warranty period except where warranty claims are still outstanding. The liability for product warranty is included in other accrued liabilities on the consolidated balance sheet.
Recent accounting pronouncements
In January 2010,May 2011, the Financial Accounting Standards Board (“FASB”) issued Accounting Standards Update (“ASU”) No. 2010-06 “Improving Disclosuresexpanded the fair value measurements and disclosures guidance about Fair Value Measurements” (“ASU No. 2010-06”) as an updateitems marked to Accounting Standards Codification Topic 820, “Fair Value Measurements and Disclosures” (“ASC Topic 820”). ASU No. 2010-06 requires additional disclosures about transfers between Levels 1 and 2fair value that are categorized within Level 3 of the fair value hierarchy to include qualitative explanations of the valuation methodology used and disclosures about purchases, sales, issuances and settlementssensitivity analysis of the inputs into the valuation. The amendment also requires that items that are not measured at fair value, but for which the fair value is disclosed, also disclose the level in the roll forward of activity in Level 3 fair value measurements. ASU No. 2010-06hierarchy in which those items were categorized. This pronouncement is effective for interim and annual reporting periods beginning after December 15, 2009, exceptus for the disclosures about purchases, sales, issuances, and settlements in the rollforwardfiscal year beginning January 1, 2012. The adoption of activity in Level 3 fair value measurements. Those disclosures are effective for fiscal years beginning after December 15, 2010, and for interim periods within those fiscal years. We adopted the required provisions of ASU No. 2010-06. There was no significant impact tothis pronouncement will not have a material effect our consolidated financial statements.
In June 2011, the FASB issued an update to ASCAccounting Standards Codification Topic 220,Presentation “Presentation of Comprehensive IncomeIncome” (“ASC Topic 220”). This ASUupdate provides that an entity that reports items of other comprehensive income has the option to present comprehensive income in either 1) a single statement that presents the components of net income and total net income, the components of other comprehensive income and total other comprehensive income, and a total for comprehensive income; or 2) a two-statement approach which presents the components of net income and total net income in a first statement, immediately followed by a financial statement that presents the components of other comprehensive income, a total for other comprehensive income, and a total for comprehensive income. The option in current GAAP that permits the presentation of other comprehensive income in the statement of changes in equity was eliminated. The guidance will be applied retrospectively and is effective for the Companyus for annual periods beginning on January 1, 2012. Early adoption is permitted. The adoption of this guidance will not have a material impact on our consolidated financial statements.
In December 2010,September 2011, the FASB issued FASB ASU 2010-28, which affects entities evaluatingamended the Intangibles - Goodwill and Other Topic of the ASC that allows an entity to make a qualitative assessment to determine whether further impairment testing on goodwill for impairment under FASB ASC 350-20. ASU 2010-28, among other things, requires entities with a zero or negative carrying value to assess, considering qualitative factors, whetheris necessary. If, after assessing the relevant information, an entity determines it is more likely than not that goodwillthe fair value is more than the carrying amount, the quantitative impairment exists.test is not required. If an entity concludes thatdetermines it is more likely than not that goodwillthe fair value is less than the carrying amount, then the quantitative impairment exists, the entity must perform step 2 of the goodwill impairment test. ASU 2010-28test is required. This pronouncement is effective for annual and interim goodwill impairment tests performed during an entity’s fiscal year beginning after December 15, 2010, with early adoption not permitted. We do not believe the adoption of this ASU will have a material impact on the Company’s financial position or results of operations.for
fiscal years beginning after December 15, 2011. We will adopt this pronouncement for the fiscal year beginning January 1, 2012 and do not expect this pronouncement to have a material effect on our consolidated financial statements.
Off-balance sheet arrangements
As of December 31, 2010 and September 30, 2011, we had no off-balance sheet instruments or financial arrangements, other than operating leases entered into in the ordinary course of business.
Inflation
Global inflation has been relatively low in recent years and did not have a material impact on our results of operations during 20092010 and 2010.2011. Although the impact of inflation has been insignificant in recent years, it is still a factor in the global economy and we tend to experience inflationary pressure on the cost of raw materials and components used in our products.
Quantitative and qualitative disclosures about market risk
We are currently exposed to market risk from changes in foreign currency and changes in interest rates. From time to time, we may enter into derivative financial instrument transactions to manage or reduce our market risk, but we do not enter into derivative transactions for speculative purposes. A discussion of our market risk exposure in financial instruments follows.
Non-U.S. currency exchange rates
In certain regions, we conduct our business in currencies other than the U.S. dollar and the functional currency is the applicable local currency. We operate primarily in the U.S., Canadian and UK markets, and as a result our primary exposure to fluctuations in currency exchange rates relates to fluctuations between the U.S. dollar and each of the Canadian dollar, the British pound sterling, and, then, to a lesser degree, the Mexican Peso, the Euro and the Singapore dollar. In countries in which we operate in the local currency, the effects of currency fluctuations are largely mitigated because local expenses of such operations are also generally denominated in the local currency. However, there may be instances in which costs and revenue will not be matched with respect to currency denomination and we may experience economic loss and a negative impact on earnings or net assets solely as a result of foreign currency exchange rate fluctuations. To the extent that we continue our expansion on a global basis, management expects that increasing portions of revenue, costs, assets and liabilities will be subject to fluctuations in foreign currency valuations.
Assets and liabilities for which the functional currency is the local currency are translated using the exchange rates in effect at the balance sheet date, resulting in translation adjustments that are reflected as accumulated other comprehensive income in the stockholders’ equity section on our balance sheet. We recorded an adjustment of approximately $5.2$4.9 million to decrease our equity account for the nine monthsyear ended September 30,December 31, 2011 to reflect the net impact of the weakening of other applicable currencies against the U.S. dollar, most of which reflected the relative weakening of the Canadian dollar and the British pound sterling.
Interest rates
We are subject to interest rate risk on our floating interest rate borrowings. Floating rate debt, where the interest rate fluctuates periodically, exposes us to short-term changes in market interest rates.
While all of the long-term debt outstanding under our senior secured credit facility is structured on floating interest rate terms, approximately 77%85% of our long-term debt outstanding as of September 30,December 31, 2011 was effectively subject to fully floating interest rate terms after giving effect to derivative hedging arrangements. A one percentage point increase in the interest rates on our $684.3 million of indebtednesslong-term debt outstanding under our senior secured credit facility and term loan as of September 30,December 31, 2011 would cause a $5.3$5.6 million pre-tax annual increase in interest expense.
Hedging and use of derivative instruments
We utilize interest rate derivative instruments to hedge our exposure to variable cash flows on a portion of our floating rate debt (i.e., cash flow hedges). These instruments are not used for trading or speculative purposes. We record the fair value of these interest rate derivative instruments on our balance sheet as either derivative assets or derivative liabilities, as applicable.
Fair value was estimated using a discounted cash flow approach.
Of these derivative instruments, $54 million qualifyqualified for hedge accounting during the year ended December 31, 2011 as they reduce the interest rate risk of the underlying hedged item and were formally designated by us as cash flow hedges at inception. These expired in March and November 2011. These derivative instruments result in financial impacts that are inversely correlated to those of the items being hedged. Since the terms of the hedged item and the instruments substantially coincide, the hedge is expected to offset changes in expected cash flows due to fluctuations in the variable rate and, therefore, we currently do not expect any ineffectiveness. Changes in the fair value of the instruments designated as cash flow hedges are deferred in accumulated other comprehensive income, net of tax, to the extent the contracts are effective as hedges, until settlement of the underlying hedged transaction. If the necessary correlation ceases to exist or if physical delivery of the hedged item becomes improbable, we would discontinue hedge accounting and apply mark-to-market accounting, with any changes in the fair values of the derivative instruments then recognized in earnings. Amounts paid or received from interest rate derivative instruments are charged or credited to interest expense and matched with the cash flows and interest expense of the debt being hedged, resulting in an adjustment to the effective interest rate.
As of September 30,During the year ended December 31, 2011, we had an interest rate swap agreementagreements to convert variable interest payments related to $34 million of debt to fixed interest payments. This swap expiresThese swaps expired in March and November 2011 and hashad a fixed rate of 4.9%, plus the applicable margin. As of September 30,During the year ended December 31, 2011, we also had an interest rate collar arrangement to reduce the variability in interest payments related to $20 million of floating rate debt. This interest rate collar instrument expiresexpired in November 2011 and hashad a floor interest rate of 4.4%, plus the applicable margin, and a cap interest rate of 5.4%, plus the applicable margin. After giving effect to all the derivative instruments we had as of September 30, 2011, the net effective interest rate under our senior secured credit facility as of June 30, 2011 was 3.1%. Our balance sheet at September 30, 2011 included a current derivative liability of $0.3 million related to these interest rate swap agreements.
Approximately $104 million of our derivative instrumentsswaps were not identified and designated for hedge accounting at inception. Of these swaps, $75.0$75 million expire in August 2013 and have a fixed rate of 1.83% plus the applicable margin and $29 million of the swaps expire in March 2012 and has a fixed rate of 1.99%, plus the applicable margin. These derivatives are recorded at fair value, which is measured using the market approach valuation technique. At December 31, 2010, and September 30, 2011, the fair value of these swap agreements was recorded as a long-term
fair value of the swap agreements was recorded as a long-term liability of $2.2 million. At December 31, 2011, the fair value of the swap agreements was recorded as a current and long-term liability of $0.2 million and $2.1$1.6 million, respectively. Related to these swaps, we recorded $0.9$0.4 million as interest income and $0.4 million of interest expense and $1.0 million as interest income in the year ended December 31, 2010 and 2009,2011, respectively. After giving effect to all the derivative instruments we had as of December 31, 2011, the net effective interest rate under our senior secured credit facility was 3.1%.
The counterparties to our interest rate derivative instruments are major international financial institutions with investment grade credit ratings.
Our company
We are a global oilfield products company, serving the subsea, drilling, completion, production and processinfrastructure sectors of the oil and natural gas industry. We design and manufacture products and also engage in aftermarket services, parts supply and related services that complement our product offering. Our product offering and related services include a mix of highly engineered capital products and frequently replaced items that are consumed in the exploration and development of oil and natural gas reserves. In 2010,2011, approximately 41%40% of our pro forma revenue was derived from the sale of capital products, while approximately 52%53% was derived from consumable products, spare parts or aftermarket services, with the balance of the revenue coming from rental or other sources. Our capital products are directed at drilling rig new build, upgrade and refurbishment projects; subsea construction and development services; the placement of production equipment on a per well basis and downstream capital projects. Our highly engineered systems are critical components used on drilling rigs or in the course of subsea operations, while our consumable products are vital to maintaining efficient and safe operations at well sites, within the supporting infrastructure and at processing centers and refineries. Our revenues are generated throughout land and offshore markets and across several international regions, with 43%39% of our 20102011 pro forma revenue derived outside of the United States.
We seek to design, manufacture and supply reliable, cost effective products that create value for our broad and diverse customer base, which includes oil and gas operators, heavy oil producers, land and offshore drilling contractors, well service, stimulation and intervention service providers, subsea construction and service companies, land and offshore pipeline construction companies, pipeline operators and refinery and petrochemical plant operators. Other customers include land and offshore mining companies, telecommunication companies, offshore renewable wind farm operators, government agencies and scientific research organizations. We believe that we differentiate ourselves from our competitors on the basis of the quality of our products, the level of related service and support we provide and the collaborative approach we take with our customers to help them solve critical problems. Our goal is to be the supplier of choice for our customers by offering innovative, reliable and cost effective products, and by investing in long-term relationships that add value to our customers’ operations.
Our business consists of two segments:
Drilling and Subsea Segment. We design and manufacture products and provide related services to the drilling, well construction, completion, intervention and subsea construction and services markets. This segment contributed $626$755 million, or 66%61% to our 20102011 pro forma revenue.
| • | Subsea technologies. We design and manufacture subsea capital equipment; specialty components and tooling; and applied products for subsea pipelines; and we also provide a broad suite of complementary subsea technical services and rental items. We have a core focus on the design and manufacture of unmanned submarines known in the industry as ROVs as well as other specialty subsea vehicles. We believe that our Perry™ and Sub-Atlantic™ vehicle brands are among the most respected in the industry. Our related technical services complement our vehicle offering by providing the market with a broad selection of critical product solutions and rental items that enhance our customers’ ability to operate in harsh subsea environments. We have a long tradition of working with customers to develop |
innovative product solutions to address the increasingly complex challenges of deepwater operations. |
| • | Downhole |
| • | Drilling |
Production and Infrastructure Segment. We design and manufacture products and provide related equipment and services to the well stimulation, completion, production and infrastructure markets. This segment contributed $329$491 million, or 34%39% to our 20102011 pro forma revenue.
| • | Flow equipment. We design, manufacture and provide flow equipment to the well stimulation, testing and flowback markets. Our product offering includes the critical components typically found in the flow equipment train from the well stimulation pressure pump to the manifold at the wellhead. These components routinely encounter high pressures, requiring frequent refurbishment or replacement. We also provide related flow equipment recertification and refurbishment services, which are critical to the safe and reliable operation of well completion activities. |
| • |
|
| • | Valve solutions. We design, manufacture and provide a wide range of industrial valves that principally serve the upstream, midstream and downstream markets of the oil and gas value chain. We provide a comprehensive suite of ball, gate, globe, check and butterfly valves across a wide range of sizes and applications. Our manufacturing and supply chain systems enable us to design and produce high-quality, engineered valves, as well as provide standardized products, while maintaining competitive pricing and minimizing capital requirements. |
Current trends in our industry
We are currently focused on the following trends that we believe will positively affect our business in the coming years. The majority of these are secular growth trends that we believe will outpace general industry growth.
| • | Increasing complexity of well construction. As conventional sources of oil and gas are depleted, our industry continues to develop new well construction technologies and techniques that allow operators to recover more hydrocarbons from each well and make previously uneconomic reservoirs profitable. These techniques, most pronounced in the global deepwater and North American land market, include drilling deeper, more highly deviated well paths |
| • | Growing service intensity associated with unconventional resources. The dramatic growth in the development of unconventional shale and tight sand formations, principally in North America, is placing increasing demands on |
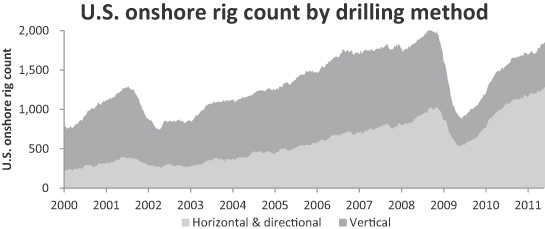
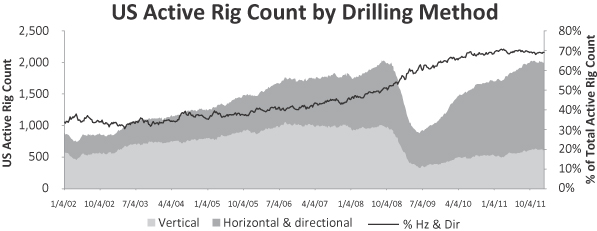
Source: Baker Hughes Incorporated
| • | Increasing investment in subsea equipment and related services. As the industry develops more deepwater fields, the amount of subsea infrastructure is expected to continue to increase and the ability of service companies and producers to control operations in a safe and effective manner will become more challenging. Demand for subsea equipment and systems is increasing in response to large exploration discoveries in frontier offshore |

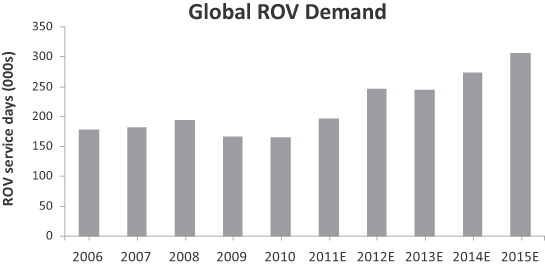
Source: Infield Systems Limited
| • | Heightened focus on product maintenance and certification. Our customers and the relevant regulatory authorities are increasingly focused on product and equipment integrity, particularly in applications or environments in which products are exposed to high pressure, high temperature or corrosive elements. In many of our product areas, our customers require recertification of products on a periodic or per use basis. Depending on the product, our recertification process tests certify a variety of measurable factors, such as integrity of metallurgy, wall thickness and pressure tests. We have observed many of our customers implementing more regular and rigorous maintenance and recertification programs for equipment with long useful lives, which we believe could increase the demand for aftermarket services and parts across many product categories. We believe that the demand from our service customers stems from a desire to increase utilization, and that they welcome a reliable |
supplier who can coordinate maintenance and recertification cycles to increase utilization of their equipment. Importantly, we have also observed that operator producers encourage service companies to obtain third party recertification to help increase the level of safety on the well site. |
| • | Increased capital spending in the oil and gas industry. The growing global demand for energy has resulted in substantial capital spending increases by oil and natural gas producers. According to Spears & Associates, annual global oilfield capital spending has increased from $85 billion in 2000 to |
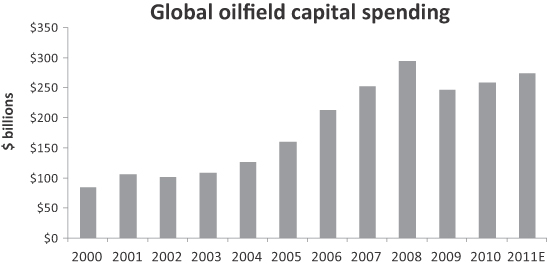
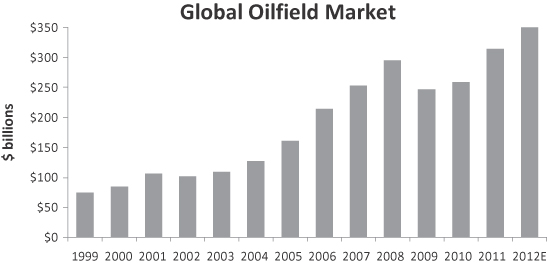
Source: Spears & Associates
| • | Recovery in global drilling activity and new rig replacement cycle. As global drilling activity has steadily recovered since the 2009 economic downturn, there has been a corresponding increase in new build rig activity as operators require newer technology to meet increasingly challenging drilling conditions, with a focus on mobility, drilling efficiency, power and safety. According to RigLogix, as of |
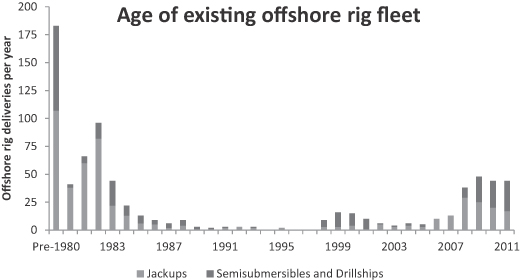
Source: RigLogix
| • | Development of heavy oil reserves in Canada. Canadian heavy oil reserves offer a large, stable and reliable source of oil for North America. Recent advances in technologies and development practices have lowered both the cost of producing these reserves and the environmental impact of these operations. The lowered cost of production, combined with a stable and robust outlook for oil prices, have enabled the heavy oil producers to undertake long-term development initiatives. CAPP has estimated total Canadian heavy oil crude production, including oils sands, will increase from 1,845 Mbpd in 2010 to |

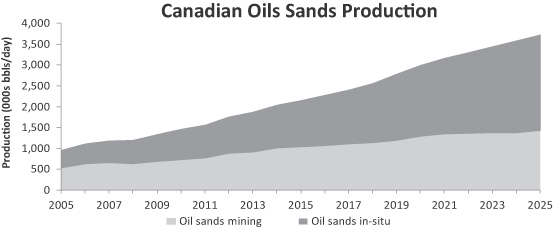
Source: Canadian Association of Petroleum Producers
While we believe that these trends will benefit us, our markets may be adversely affected by industry conditions that are beyond our control. Any prolonged substantial reduction in oil and gas prices would likely affect oil and gas drilling and production levels and therefore would affect demand for the products and services we provide. For more information on this and other risks to our business and our industry, please read “Risk factors—Risks related to our business.”
Our business strategy
Our objective is to build a leading global oilfield products company that supplies high quality, mission critical products and related aftermarket services, serving customers globally across the oil and gas value chain. We intend to accomplish this through organic growth of our existing product capability and by disciplined acquisition of small to medium sized companies to strengthen our current offering or fill targeted product gaps. Our intent is to offer a broad range of capital equipment, replacement parts and consumable items that support the drilling, completion and production phases of the well development cycle, as well as the related land and subsea infrastructure requirements. A core part of our strategy is to preserve and enhance our current business mix of onshore and offshore products; our balanced exposure to a variety of attractive global markets; and our broad range of capital equipment and consumable products that support the development of oil, gas, heavy oil, and other natural resources.
We intend to be our customers’ supplier of choice by offering safer, more effective products and by investing in long-term relationships that add value to our Company and our customers’
operations. We design and manufacture products and engage in aftermarket services, parts supply and related services that complement our product offering. Our offering is enhanced by designing, manufacturing and providing the highest quality products, and not by competing with purchasers of our equipment by operating our equipment in a services capacity. We measure our success in terms of customer satisfaction, safety and financial performance.
We intend to accomplish our strategic objectives and capitalize on the key long-term industry growth trends through the execution of the following elements:
Tailor our product offering and capacity to customer spending. On an annual basis, we conduct a bottoms-up analysis of the sources and drivers of our revenue. Our analysis is focused on various types of revenue splits and exposures, including: (1) phases of the life cycle of the well; (2) geographic exposure by shipment destination; (3) land or offshore application; and (4) product purchase cycles; and (5) commodity mix.cycles. This process relies on a combination of financial analysis and management estimation. Our analysis of our 20102011 pro forma revenues is as follows:
| | |||
| | |||
| ||||
As part of the bottoms-up analysis described above, we also estimate the broad industry drivers of our business. We believe that our 20102011 pro forma revenue growth was strongly driven by North American unconventional resource developments and global deepwater development activity, shallow offshore activity and international land activity, with lessermeaningful contributions from Canadian
heavy oil developments and downstream activity. Although acquisitions may cause fluctuations in our business mix, we intend to preserve and enhance the diversity of our business as a core part of our strategy. We believe this diversity reduces the impact of the volatility of any single equipment spend cycle or well cycle phase or equipment spend cycle on our financial performance. A description of how we define each of the categories within each revenue split above is included in the “Glossary” beginning on page A-1 of this prospectus.
Leverage our product lines’ strengths across our platform. Each of our respectiveOur product lines hashave particular strengths that can be leveraged across theour entire platform. We intend to cross-fertilize technologies, share product development initiatives and leverage key geographic, supply chain
and customer strengths to grow and improve the profitability of our overall business. For example, we have an ongoing effort to leverage our sophisticated subsea ROV controls systems and engineers to improve our control system offering associated with our drilling capital equipment. In addition, we are using our surface production equipment distribution footprint to accelerate our ability to serve completion product customers in new geographies. We are also leveraging our relationships with oil and natural gas producers through other product lines to pull through our valve brands from their traditional distribution channels.
Expand our geographic presence. We intend to enhance our access to key global markets and to grow or establish our presence across thekey North American unconventional resource basins. We also plan to build upon our existing presence in the North American, North Sea, Middle East, South American and Asia Pacific regions through deployment of sales, distribution, service and manufacturing resources. We have recently established sales offices in Brazil, Australia and Australia,China, and we are actively expanding these locations. In the Middle East, we currently have a sales office in Dubai and are seeking to expand our presence in the Middle East over the long-term. In new international markets, we often build critical mass through a sales, service and marketing focused presence, which we follow with more significant manufacturing investments. We believe this expansion strategy provides more points of contact with our customers, allowing us to respond more quickly to their needs. Within North America, some of the largest products we offer through our Production and Infrastructure Segment are most effectively manufactured in close proximity to these unconventional resource plays. For example, our surface production and process equipment achieves a significant shipping cost advantage if we manufacture it in the target basin. It also affords us the opportunity to help manage our customer’s inventory of production and process equipment to ensure timely installation when a well comes on stream. For this reason, we are in the process of openingrecently opened two new pressure vessel and tank manufacturing facilities in Pennsylvania to provide equipment and installation service into the developing Utica and Marcellus resource play.plays. Our pipeline equipment, flow equipment business and related recertification and refurbishment service benefit from this type of expanded geographical footprint by providing a local presence for customers operating in this area.
Invest in manufacturing capacity and excellence. We focus on the continuous improvement of our manufacturing processes and quality controls, which are vital to ensuring product reliability. We also continue to invest in expanding our manufacturing capacity by increasing output, upgrading machinery or adding “roofline” in strategically important geographies. We believe that in certain product lines, particularly those sold into the North American unconventional resource plays, locating manufacturing and service capabilities in close proximity to field locations improves response time, reduces freight costs and enhances customer service.
Pursue disciplined growth through acquisitions. We have a track record of successfully growing our earnings and product offerings by making attractive acquisitions. We intend to continue to
selectively pursue acquisitions that increase our exposure to the most important growth trends in the oil and gas industry, fill critical product gaps andor expand our geographic scope. With a strong balance sheet and sufficient financial resources, we believe that we can continue to acquire companies in high growth product areas and expose the acquired product lines to new customers and distribution channels, while preserving the entrepreneurial attributes that made them attractive on a stand-alone basis.
Develop new products. We conduct strategic reviews to identify underserved market opportunities and invest in continuous product development efforts. While our product development efforts involve formal research and engineering projects, we most often generate
product development ideas, concepts and opportunities while working closely with our customers in the normal course of business. Our focus on customer service as well as our strong aftermarket offering facilitates product development opportunities that may not be captured as part of a formalized research and engineering project. We believe this process allows us to enhance our exposure to key secular trends and serve our customers’ needs more effectively. We have developed strong working relationships with our major customers, several of which routinely approach us with requests for solutions to specific application challenges. We plan to continue to improve our new product engineering capabilities and leverage our expertise to address customer needs. Recent examples include the landoffshore and offshoreland versions of our Wrangler™ Roughneck, a critical makeup and breakout tool for tubulars on a drilling rig, and our subsea ROVDrill™, a unique tool designed to perform subsea drilling functions independent of the support vessel while using only the associated ROV for power and control.
Focus on product quality and customer service. We have a track record of providing innovative, reliable, fit-for-purpose products at competitive prices while remaining responsive to the needs of our customers. We work closely and flexibly with our customers on delivery timing and service after the sale. We seek to ensure that our businesses have the facilities and personnel to maintain the highest level of safety, quality and service as we grow around the world.
Our competitive strengths
We believe that we are well positioned to execute our strategy based on the following competitive strengths:
Broad product offering with exposure to key long-term industry trends and a diverse customer base. Our exposure to a mix of consumable products, capital products and aftermarket parts and services enables us to participate in the construction, capacity expansion, maintenance, upgrade and refurbishment phases of the energy cycle. In addition, we have exposure to multiple sectors of the oil and gas industry and a diverse mix of customers across the full oil and gas value chain. We believe our broad product offering, diversified exposure to industry trends and extensive customer base reduces our dependence on any one phase, purchase cycle, segment or region and should result in more stable financial results.
Focus on critical peripheral products. Many of our products, particularly those serving the drilling and well stimulation markets, are non-discretionary components that represent a small percentage of the life cycle cost associated with large capital equipment. We believe that focusing on specialized, peripheral products affords us full exposure to the most powerful investment trends in the oil and gas industry while insulating us from the intense competitive environment and construction risks often associated with selling the largest capital equipment packages.
Solid base of recurring revenues from consumable products. In 2010,2011, we generated approximately 52%53% of our pro forma revenues from consumable products, spare parts or aftermarket parts and services, which are critical to large capital equipment or energy infrastructure. In some cases, these products must be replaced multiple times throughout the life cycle of the related capital equipment or infrastructure installations. These products have replacement cycles ranging from a few months to a few years, resulting in a stable base of recurring revenues. We often complement these products with a recertification and refurbishment service, which helps us preserve strong customer relations. We have also observed that our customers often return to the same vendors for replacement parts, lending further revenue stability and visibility.
Experienced management team with proven public company track record. Our executive officers and senior operational managers have an average of over 30 years of experience in the oilfield manufacturing and service industry. Each of our top three operational executives served as the chief operational officer of one or more large publicly held oilfield service companies or of a significant division thereof. We believe their collective background provides our management team with an in-depth understanding of our customers’ needs, enhances our ability to deliver customer-driven solutions and allows us to operate effectively throughout industry cycles. Several members of our management team were executives or directors at one of the five companies that combined to form Forum Energy Technologies, Inc. in August 2010.
Multiple avenues for growth and strong cash flows. We are focused on a core set of product platforms that we believe offer strong long-term growth. The breadth of our product offering affords us multiple organic growth avenues in which to deploy our capital, and we invest in the highest value opportunities that meet our return objectives and further our strategic goals. Similarly, we believe the scope of available acquisition opportunities will be enhanced by the numerous strategic directions available to us. In the face of particularly strong competition for acquisitions in a specific sector, we can deploy capital to other areas of our Company that afford better relative value. We also believe that our breadth and size allows us to meaningfully change our financial profile and business composition with modestly sized acquisitions. Finally, our manufacturing operations are not capital intensive to maintain or expand, which allows us to generate strong cash flow. This provides us with capacity to finance organic growth opportunities with internally generated resources.
Proven ability to grow earnings and improve product offering through a focused acquisition strategy. We have a strong track record of strategically targeting key product opportunities, completing accretive transactions, and effectively integrating these businesses. We have a disciplined acquisition strategy that allows us to develop proprietary deal flow by identifying emerging industry trends, identifying existing platforms positioned to capitalize on these trends, and in some cases isolating acquisition opportunities that are largely missed by our competitors due to smaller size and scale. Each of the original five companies that combined to form Forum Energy Technologies, Inc. was itself the result of a similar acquisition strategy focused on a specific industry growth theme. Our current acquisition strategy is a continuation of that successful model. For example, shortly after the Combination, we undertook a focused effort to target key product lines that enhanced our existing offerings. We consummated three acquisitions, including Specialist, which complements our existing subsea productstechnologies offering, and AMC and P-Quip, both of which enhance our drilling producttechnologies offering. After the Combination, we also undertook a strategic effort to identify two new product areas that would provide us exposure to targeted growth markets:the growing well completion market. These efforts yielded the creation of two new lines of business that offer: (1) downhole products,technologies, and (2) flow equipment related to well
stimulation. In the downhole market, we focused on proprietary and niche consumable products related to the well construction, completion and production enhancement processes, which included Davis-Lynch and Cannon Services. We successfully completed these two acquisitions in 2011 to form our new downhole productstechnologies line. Similarly, in the well stimulation market we developed and executed an acquisition strategy focused on consumable flow equipment used in well fracturing and flowback processes. We have made three acquisitions in 2011 in this area, including WFP, Phoinix and SVP Products. Combined with the follow-on deployment of organic growth capital, our flow equipment product line is our fastest growing.
Customer responsive product innovation. We have grown our business by being responsive to customer needs and developing strong relationships at multiple levels of our customers’ organizations. We believe our ability to develop new products is enhanced because of these customer relationships. Our experienced engineering and technical staff has partnered with our customers to design and develop new products that add value to their operations or reduce their total cost of doing business. As a result, we have developed and commercialized a number of new products that have improved the efficiency and safety of our customers’ operations including our powered Wrangler™ catwalk and iron roughnecks, powered mousehole tool, Perry ROVDrill™, low profile urban gas processing unit and others.
Business segments
We operate two business segments: Drilling and Subsea and Production and Infrastructure. The table below provides a summary of the proportional revenue contributions from our two business segments and our primary geographic markets over the last three years.
| Percentage of revenue year ended December 31, | Percentage of revenue year ended December 31, | |||||||||||||||||||||||||||||||
| 2008 | 2009 | 2010 | Pro forma 2010 | 2009 | 2010 | 2011 | Pro forma 2011 | |||||||||||||||||||||||||
|
|
| ||||||||||||||||||||||||||||||
Drilling and Subsea | 68% | 67% | 63% | 66% | 67% | 63% | 58% | 61% | ||||||||||||||||||||||||
Production and Infrastructure | 32% | 33% | 37% | 34% | 33% | 37% | 42% | 39% | ||||||||||||||||||||||||
|
|
|
|
|
|
|
| |||||||||||||||||||||||||
Total | 100% | 100% | 100% | 100% | 100% | 100% | 100% | 100% | ||||||||||||||||||||||||
United States | 56% | 52% | 55% | 52% | 55% | 63% | ||||||||||||||||||||||||||
Canada | 11% | 8% | 9% | 8% | 9% | 9% | ||||||||||||||||||||||||||
Other International | 33% | 40% | 36% | 40% | 36% | 28% | ||||||||||||||||||||||||||
|
|
|
|
|
| |||||||||||||||||||||||||||
Total | 100% | 100% | 100% | 100% | 100% | 100% | ||||||||||||||||||||||||||
Drilling and Subsea Segment
We design and manufacture products and provide related services to the drilling, well construction, completion, intervention and subsea construction and services markets. The top five customers in our Drilling and Subsea Segment together accounted for approximately 27.8%13.7% of that segment’s revenue during the year ended December 31, 2010,2011, with no single customer representing as much as 10% of our consolidated revenue during this same period. We offer these products and related services through three primary business lines.
Subsea technologiesTechnologies
We design and manufacture subsea capital equipment, specialty components and applied products for subsea pipelines, and also provide a broad suite of complementary subsea technical services and rental items. We have a core focus on the design and manufacture of ROVs as well as other specialty subsea vehicles. We believe that our vehicle brands are among the most respected in the industry. Our related technical services complement our vehicle offering by providing the market with a broad selection of critical product solutions and rental items that enhance our customers’ ability to operate in harsh subsea environments. We have a long tradition of working with customers to develop innovative product solutions to address the increasingly complex challenges of deepwater operations.
The primary drivers impacting our subsea business are global offshore activity, subsea construction spending, subsea pipeline construction, and growth in deepwater resource developments.development. A majority of our subsea sales are driven by capital projects, with a smaller portion associated with field development activity and general offshore operations expenditures. We believe that the increasing complexity of deepwater developmentsdevelopment will create demand for our full range of subsea products and related services.
Subsea vehicles
We are a leading designer and manufacturer of a wide range of ROVs to the offshore subsea construction, observation and related service markets. The market for subsea ROVs can be segmented into three broad classes of vehicles based on size and category of operations: (1) large work-class vehicles for subsea construction activities, (2) drilling-class vehicles for use around an offshore rig and (3) observation-class vehicles for inspection and light manipulation. We are a leading provider of work-class and observation-class vehicles.
We believe that our Perry and Sub-Atlantic branded ROVs are among the most reliable, best performing and well-known in the industry. We design and manufacture large work-class ROVs through our Perry brand. These vehicles are among the heaviest duty, most powerful subsea ROVs in the market and are principally used in deepwater construction applications. Throughout its over 50 year history, Perry has delivered over 500 such systems. The largest vehicles, our Triton® series of work-class ROVs, weigh as much as five and one-half tons, provide up to 250 horsepower, have payload capacities exceeding 500 pounds and are capable of working in depths exceeding 4,000 meters. Our Sub-Atlantic branded vehicles have served the observation class market since 1997. Among the smallest class of ROVs in the industry, these all-electrical vehicles are principally used for inspection, survey, and light manipulation and serve a wide range of industries. We currently offer six sub-classes of all-electric ROVs with a broad range of capabilities.
In addition to ROVs, we design and manufacture specialty vehicles that are primarily used in subsea trenching operations. Larger than a work-class ROV, these vehicles travel along the sea floor conducting digging, installation and burial operations. Providing over 1,200 horsepower, the largest of these subsea trenchers can cut over three meters deep into the seafloor to lay pipelines, power cables or communications cables. Our Perry branded specialty vehicles have dug and buried a significant amount of the existing subsea communications cables that exist around the world today. In addition to ROVs and trenchers, we also design, engineer and manufacture small submarines used to perform rescue operations for large military submarines.
As the complexity of subsea architecture has increased with operating depths, the subsea industry has come to rely increasingly on ROVs to conduct complex tasks to ensure safe, reliable and efficient operations. Underpinning the reliability of the most sophisticated ROVs that operate in the harsh deepwater environment is the ROV control system. The Perry branded ICE™ Real Time Control System is an advanced ROV control system designed for deepwater, work class ROV applications. ICE™ is a proprietary, all-in-one solution offering onboard processing, data communication, sensor circuitry, advanced diagnostics and power regulation. Similarly, as the demands have increased on our smaller, observation class ROVs, we have engineered and developed a robust, user-friendly control system to serve this growing market. For use with our Sub-Atlantic branded vehicles, we have developed the new subCAN™ control system, which connects to standard topside equipment running a Windows® based graphical user interface. This enables control of, and communication with, both the ROV and associated equipment. To
preserve our competitiveness in the subsea sector, we believe we must be a leader in the core control systems associated with ROVs because we believe that the market for sophisticated subsea control and manipulation is growing and will extend beyond ROVs to other critical seafloor equipment.
Our subsea vehicle customers are primarily large offshore construction companies, but also include a range of non-oil and gas industry entities, such as navies, fire departments, maritime science and geosciences research organizations, offshore wind power companies and other industries operating in marine environments. Subsea vehicle sales are principally driven by large subsea construction spending cycles, and capital build programs at the offshore and subsea services companies. Our large installed base, combined with the 50-year track record of the Perry brand and our strong customer service orientation, are key factors in our ability to compete successfully in this sector.
Subsea products
In addition to subsea vehicles, we are a leading manufacturer of unique subsea products and components. Our suite of subsea products leverages our core strength in vehicles, but also provides a broad selection of niche subsea product solutions that result from our many years of experience with vehicles.
We design and manufacture a group of important products that are used in and around vehicles. For example, we manufacture key ROV components, such as a wide range of Sub-Atlantic branded ROV thrusters. We design and manufacture thrusters for incorporation into our own vehicles as well for sale to other ROV manufacturers. We also design and manufacture a tether management system (“TMS”). The TMS stores and deploys the ROV tether, thus decoupling the ROV from the motion of the surface vessel and enabling operations within a larger radius. The TMS is critical to the reliable and safe operation of subsea vehicles, and we have a long history of manufacturing these systems for use across our entire range of ROVs. We also provide a broad suite of subsea tooling, both industry standard and custom designed for unique subsea applications. Industry standard tooling includes hot stabs, cable cutters, torque tools and indicators. Our recent acquisition of Specialist complemented and enhanced our range of subsea tooling, and has provided us with a greater capacity to respond to customer needs. Our customers frequently come to us with unique subsea challenges and we attempt to quickly develop custom tools to solve these specialized problems. Examples of our specialized tooling include: a riser repair system, a manipulator for nuclear decommissioning and control systems for subsea well intervention. In addition to tooling associated with ROVs, we also manufacture hydraulic power units, valve packs, and control systems.
Among our newest subsea products is an innovative seafloor coring tool named ROVDrill™. Lowered to the seafloor and powered by a work class ROV, it is capable of retrieving geologic core samples using conventional diamond drilling techniques in water depths that exceed 3,000 meters. With a relatively small footprint, the ROVDrill™ can be flown into any region of the world on short notice and be deployed on any of a wide range of vessels, without the need for large specialized vessels or drill shipsdrillships of limited availability that command a high day rate. We are in the process of commercializing the third generation of this tool, after recently performing work in the South Pacific to support a customer in delineating the extent of a subsea mineral deposit.
We also develop simulation software under the VMAX™ brand that allows customers to simulate complex deepwater operations before deploying expensive equipment spreads. This product is
both a stand-alone product and can also be a value-added component of our largest ROVs. Our latest version of this product is an extensive upgrade that allows oil and gas operators, service companies and engineering firms to have full control of subsea field scenario development while providing cutting edge graphical advancements and customized user interface. As the complexity and difficulty of deepwater projects increase, we believe that the demand for this and other cost-saving and safety-enhancing tools will increase.
In addition to vehicle-related subsea products, our Offshore Joint Services (“OJS”) brand is a leading provider of applied protective coatings on rigid subsea pipeline field joints, spools, and structures. The OJS brand has a 25 year history and is a worldwide leader in this sector. Our field joint coatings address the corrosion protection, thermal insulation and concrete weight coating infill requirements. We offer proprietary and patented applied products that we believe provide significant speed, quality, reliability, safety, and environmental benefits to our customers. We believe that the chemistry of these fast curing applied products, along with the specialized machinery and crew used to apply the product, are vital ingredients in providing a safe and reliable product that will withstand the pipe-laying process and decades of use on the seafloor.
We mobilize for offshore pipeline construction operations globally out of facilities in Houston, Texas and Batam, Indonesia. Our primary customers in this product line are offshore construction companies that own or lease the pipe laying vessel. From time to time, we are directly hired by operators, oil and gas exploration and production companies and welding subcontractors. These services are performed at our customers’ sites, either onboard an offshore pipe lay vessel or at an onshore fabrication yard.
TechnicalSubsea technical services and subsea rental lines
We also maintain an extensive fleet of subsea rental items and provide our customers with complementary subsea technical services. Among the technical services we offer is the provisioning of ROV pilots and other offshore personnel on a contract basis for those customers who do not employ their own on a full time basis. Branded UKPS, this business line operates out of a main office in Great Yarmouth, United Kingdom, and serves subsea construction and offshore service companies globally.
Our VisualSoft™ product line provides another related technical product that reinforces our strength in subsea vehicles and products. We sell or rent VisualWorks and VisualDVR Digital Video Systems that provide a complete solution for digital video capture, playback, processing and reporting of pipeline, structural or other inspection survey data. These products are often used in conjunction with the operation of inspection class ROVs or diving personnel when
conducting survey work. VisualWorks systems are also in operation supporting clients involved in detailed inspection surveys of flooded tunnels and mines, underwater archaeological sites and seabed environments. This equipment is complementary to our inspection class vehicles and augments our capabilities and offering to our customers.
Operating for more than fourteen years, Geoscience Earth and Marine Science (“GEMS”) is our geophysical and geotechnical engineering group that provides consulting services to the oil and gas, and marine industries. We typically provide an interpretation service based on the analysis of third party subsea data provided by clients. In recent years, the business has broadened into managing every phase of project development, including scope of work, liaising with data acquirers, interpretation and analysis. The majority of the work performed by GEMS is in the Gulf of Mexico, although it also carries out work internationally, particularly in West Africa. Our
primary customer base consists of oil and gas operator producers. These services are focused on the earliest stages of life of field development and provide us with unique insights into future subsea construction and development work, which we believe provides us with a competitive advantage.
We also have an extensive rental fleet of critical subsea equipment and products. Our DPS Offshore branded rental fleet provides electronic marine equipment for survey, ROV and dynamic positioning applications. Importantly, our customers often rely on our expertise in the provisioning of this equipment and ask us to design a customized rental equipment package for their intended operation or application. We often sell equipment from this fleet as well. In keeping with our efforts to provide top quality customer service, we offer fleet management services to our customers, including equipment repair and calibration, as well as the provision of specialist personnel to assist with equipment integration and installation. To compete with other rental companies we endeavor to provide better quality customer service, equipment breadth, flexibility and speed of response. As with a number of our subsea business lines, the principal customers are subsea construction contractors, survey companies and offshore vessel companies. The main rental fleet locations are in Aberdeen, Scotland; Great Yarmouth, United Kingdom; Houston, Texas; and Singapore. The business line also has long standing agent relationships in Norway and the Middle East.
Key subsea technologies product lines
Capital equipment | • Perry™ work class remote operating vehicles • Sub-Atlantic™ observation class remote operating vehicles • Remote operating seafloor coring tools (ROVDrill™) • Specialty vehicles • Rescue submarines • Tether management systems | |
Operating items, components, and / or consumable products | • ROV thrusters, valve packs, hot stabs • Seafloor coring tools and accessories • Standardized and specialized ROV tooling • Subsea pipeline infill joint coatings and related applied products | |
Technical & aftermarket services and rental items | • Simulation software for complex subsea operations • ROV simulator rental items • Geotechnical and geosciences consultancy services • ROV pilot provisioning services • Offshore/subsea dynamic positioning rental equipment |
Downhole ProductsTechnologies
In late 2010, we undertook a strategic initiative to build a platform that would provide us exposure to the growing market of downhole products associated with the increasing complexity of well construction and completion. We targeted niche downhole products that were consumed during the well construction, completion and production enhancement processes, as well as those that were associated with the growth in intelligent well construction. Our objective in 2011 and 2012 is to build a downhole productstechnologies platform with the critical expertise and proprietary products to position the Company as a long-term, market leading downhole productstechnologies provider. Since July 2011, we have made two acquisitions to begin building our downhole productstechnologies business and we have focused on two areas: (i) casing and cementing products and (ii) downhole protection solutions.
Casing and Cementing Productscementing products
Through our recently acquired Davis-Lynch™ downhole well construction and completion tools product line, we are a market leading designer and manufacturer of proprietary, mission critical products used in the construction of oil and gas wells. We design and manufacture a full range of centralizers, float equipment, stage cementing tools, inflatable packers, flotation collars, cementing plugs, fill and circulation tools for running casing, casing hangars and surge reduction equipment. Our products are used in the construction of onshore and offshore wells, and the 64 year old “Davis-Lynch™” brand is a well-known and trusted name in the industry. Our objective is to use our global sales and distribution infrastructure to grow this product line, while also continuing to look for opportunities to expand the depth of the product line through product development efforts and targeted acquisition opportunities. The key drivers of this product line
are the growth in the complexity of onshore and offshore completion market globally and the increasing number of stages being employed in the North American unconventional shale plays.
Downhole Protection Solutionsprotection solutions
We offer a full range of associated downhole protection solutions through our 25 year old Cannon Services™ brand. The clamp and protection system is a critical component of complex well completion and is used to shield the downhole control lines and gauges during installation and to provide protection during production enhancement operations. We design and manufacture a full range of downhole protection solutions for ESP cabling, encapsulated control lines, sub-surface safety valves (“SSSV”) and permanent downhole gauges, including gauges used in intelligent wells and the steam-assisted gravity drainage (“SAGD”) wells of the Canadian heavy oil developments. We provide both standard and highly customized protection systems, and we supply the full range of alloys for various downhole environments. While we provide standardized protection systems, we have a core strength in working directly with reservoir engineers and our service company customers to design unique protection solutions to complex well design challenges.
The key driver of our downhole productstechnologies business is the construction and completion of new wells. In particular, we believe that the growing complexity of onshore and offshore well construction and the increasing use of artificial lift to increase production from oil and gas wells have created a long-term growth market. We believe our focus on niche downhole products provides exposure to attractive investment trends in the downhole oil and gas market while insulating us from the intense competitive environment often associated with providing the associated installation or completion services. Our primary customers in this business line are producers and service companies providing completion, ESP and other intervention services to the producers.
A representative sampling of our key downhole products is listed below.
Key downhole technologies product lines
| Products | ||
| Well construction and completion tools | • Centralizers • Float equipment • Stage cementing tools • Inflatable packers • Flotation collars • Cementing plugs • Fill and circulate tools for running casing • Casing hangars • Surge reduction equipment | |
| Downhole protection systems | • Standard and Customized protection systems for: • ESP cabling • Permanent downhole gauges • Encapsulated control lines and flatpacks • Customized guards for safety valves • Specialized stream-assisted gravity drainage (SAGD) gauge protection systems • Specialized installation tools |
Drilling productsTechnologies
We provide both drilling consumables and capital equipment, including powered and manual tubular handling equipment, specialized torque equipment, customized offline crane systems, drilling data acquisition management systems, pumps, valves, manifolds, drilling fluid end-components, pressure control equipment for both coiled tubing and wireline well intervention operations and a broad line of items consumed in the drilling process. We have a core focus on products that enhance our customers’ handling of tubulars on the drilling rig. Our drilling capital equipment offering is concentrated on targeted, high value added products and equipment where we have identified a clear market opportunity.
The primary drivers impacting our drilling productstechnologies business are global drilling and workover activity, the level of capital investment in drilling rigs, and the severity of the conditions under which the rigs and well service equipment operate. Although a portion of our rig-related sales is directed at new rigs, a larger portion is associated with equipment replacement and rig upgrades as drilling contractors modify their existing rigs to improve efficiency and to operate in increasingly challenging drilling conditions associated with the development of unconventional resource plays or service intensive offshore drilling. We also believe that the increasing use of well stimulation in mature fields will contribute to demand for increased well service activity, which in turn should drive demand for our well intervention products.
Tubular handling
Our core strength and focus in drilling productstechnologies is in powered and manual tubular handling equipment used on drilling rigs. Our Wrangler™ branded systems reduce direct human involvement in the handling of pipe during drilling operations, improving both the safety and efficiency of operations. For example, we believe our proprietary catwalk product improves rig safety by mechanizing the lifting and lowering of tubulars to and from the drill floor while reducing direct exposure of rig personnel to this potentially dangerous task. Furthermore, our catwalks improve efficiency by eliminating or reducing the need for traditional drill pipe and casing “pick-up and lay-down” equipment with associated personnel. We recently developed a make-up and break-out tool called the Wrangler Roughneck™, which we believe is a vital piece of equipment on the drilling rig. It was designed to address a growing need for a spinning and torque tool with a more durable and economical design to adequately handle premium drill pipe connections, which are associated with higher torque requirements. As another example, our proprietary powered mousehole tool increases rig efficiency by spinning up joints of drill pipe or bottom hole assemblies offline, while the rig continues to drill, saving significant amounts of time. As our industry drills deeper wells with longer laterals, the weight of the drill string increases, which drives demand for tools capable of holding the string without damaging it.
In 2011, we complemented our tubular handling offering through the acquisition of AMC, based in Aberdeen, Scotland. Through our AMC product brand, we design and manufacture specialized torque equipment for tubular connections, including high torque stroking (or “bucking”) units, fully rotational torque units, portable torque units for field deployment and related control systems, and we provide aftermarket service. As well construction becomes more complex, we expect the increasing amount of downhole tools and equipment required to drive the need for more specialized and capable torque machines. We intend to support the growth of this complementary product offering through our existing global distribution and sales network.
We also design and manufacture a range of value-added offline activity cranes, multi-purpose cranes and personnel transfer solutions. Many of these cranes are fit-for-purpose, multi-axis cranes that provide access to hard-to-reach places and eliminate the need for manual interface. To provide added utility to our customers on these key pieces of equipment, we manufacture specialty cranes, as well as several of our tubular handling capital equipment products to fit specified rig configurations.
Our tradition of product innovation also extends to manual tubular handling equipment. We have designed and developed products in conjunction with our customers to address specific problems encountered when drilling in deepwater and other challenging environments. Our lightweight 1,000 ton elevators and 1,000 ton slips allow a drilling rig to safely support up to two million pounds of drill pipe without damaging it. Originally designed to solve a specific customer’s challenge of handling landing strings in deepwater, these products now serve broader applications in deeper wells both onshore and offshore. As a further example of customer responsiveness, we integrated a specially designed skidding system into our catwalk product line. This transforms the catwalk into a self-propelled device that is more efficient for pad drilling, and allows it to easily move with the rig to the next well location. Through the drilling productstechnologies business, we intend to continue to leverage existing product lines to create integrated systems that completely automate the pipe handling functions. We expect to continue to work with our customers to design and develop products to upgrade their drilling rigs for safer and more efficient operation.
Drilling flow control and intervention
Our pressure control products used for well intervention operations are sold directly to oilfield service companies and also to equipment rental companies. These products include both coiled tubing and wireline blowout preventers and their accessories. We also conduct aftermarket refurbishment and recertification service on our pressure control equipment. We expect the repair and replacement of these components to become more frequent as service contractors conduct operations in increasingly challenging environments associated with increased well depths, greater wellbore deviations and longer laterals, which are often accompanied by higher pressures and temperatures. In particular, as coiled tubing and other intervention operations address evolving industry needs, we intend to support this growing area with reliable and innovative products. For example, in response to recent changes in the coiled tubing market, we recently completed the design of a 4-1/16 inch 15,000 psi coiled tubing blowout preventer, which is now in production with a growing backlog. We are also in the final engineering stages of a 75 inch 10,00015,000 psi blowout preventer for this growing market. We expect these products to allow us to serve this evolving market.
We recently added to our flow control offering through the acquisition of UK-based P-Quip, which designs and manufactures a range of patented liner retention and mud pump rod piston systems. These systems are sold directly to mud pump manufacturers and drilling contractors, and are focused on improving the efficiency, serviceability and safety of mud pump operations on the rig. They are complementary to our existing SPD mud pump product line, and we believe they have a strong brand in the marketplace. We plan to grow this product line using our existing global sales and distribution network, especially in North America where this UK-based product line has only recently begun to achieve penetration.
We also manufacture data acquisition and management products that include integrated drill floor instrumentation and monitoring systems. These systems manage and provide real-time monitoring and logging of drilling data to drilling contractors and oil and natural gas producers. They measure, collect, store and display drilling data on a real-time basis, substantially increasing drilling efficiency and improving the well construction process. The drilling data can be monitored by local rig supervisors as well as transmitted to remote customer locations for monitoring the drilling process.
Examples of our consumable drilling products include inserts and dies, as well as manual elevators, tongs and slips. As rigs drill these products are consumed and need to be replaced periodically, resulting in a recurring revenue opportunity for our Company. We are also among the largest providers of oilfield bearings to the North American market, where we provide original equipment manufacturers and repair businesses the bearings they need to serve the drilling and well stimulation markets.
In addition to designing and manufacturing capital products and providing consumable products, we also repair and service drilling equipment for both land and offshore rigs. Many of our service employees work in the field addressing problems at the rig site, which we believe further enhances our relationships with customers. Our experienced service employees, in combination with our specialized repair facilities, enable us to survey rigs in the field, design comprehensive upgrade packages and refurbish existing rig equipment.
Our ability to source low cost raw materials and components, such as steel castings and forgings is critical to our ability to manufacture our drilling products competitively. In order to purchase
raw materials and components in a cost effective manner we have developed a broad international sourcing capability and we maintain quality assurance and testing programs to analyze and test these raw materials and components. In addition, we believe we have established a reputation among our customers for high-quality products, reliable after-sale support and product innovation.
Key drilling product lines
Capital equipment | • Tubular handling equipment such as powered mousehole tools, powered elevators • Wrangler™ Roughnecks • Wrangler™ Catwalks • Specialized torque machines and bucking units • Customized crane systems • Drill floor electronic instrumentation and data monitoring systems • Choke and kill manifold mud systems and related components • Coiled tubing and wireline blowout preventers and related products | |
| Operating items, components, and / or consumable products | • Drilling and production valves, chokes and flowline connections • Manual tubular handling equipment such as slips, inserts, dies and manual tongs • Centrifugal pumps and fluid end-components for mud pumps • Patented mud pump liner retention and mud pump rod piston systems • Specialty oilfield bearings | |
Technical & aftermarket services and rental items | • Drilling equipment field service, repair, refurbishment and upgrade • Workover BOP aftermarket service and recertification • |
Production and Infrastructure Segment
We design and manufacture products and provide related equipment and services to the well stimulation, completion, production and infrastructure markets. The top five customers in our Production and Infrastructure Segment together accounted for approximately 35.9%27.0% of that segment’s revenue during the year ended December 31, 2010,2011, with no single customer representing as much as 10% of our consolidated revenue during this same period. We offer these products and related services through three primary business lines.
Flow equipmentEquipment
In late 2010, we undertook a strategic initiative to build a platform that would provide us exposure to the rapidly growing completion products sector of the oil and gas industry. We targeted the products that were consumed during the stimulation and flowback processes to take advantage of the recurring revenue inherent in the flow equipment market. The complete set of equipment used by a well stimulation, or pressure pumping, company is referred to as a “frac spread” and is often measured by the amount of pressure pumping horsepower the frac spread produces. While the capital equipment associated with provided new, incremental horsepower to the industry has been increasing as well completion practices are evolving, we chose to focus on the consumable components of the frac spread that experience high rates of wear and replacement. We believe this strategy enables us to capture a greater share of the total spend over the useful life of the typical frac spread.
Our objective in 2011 and 2012 is to build a top three player in the North American flow equipment market that provides all of the critical components typically found in the flow equipment train from the frac pressure pump to the manifold at the wellhead, with the full range of sizes suitable for both the stimulation and flow back markets. We also believe that it is vital to the long-term sustainability of this product line that we invest in and expand the associated recertification and refurbishment offering across the major unconventional basins in North America.
Since February 2011, we have made three acquisitions to begin building our flow equipment product line. The management teams of these companies are experts in this sector and share our common vision for the type of business we intend to create. Prior to our acquisition, these companies had a track record of collaboration to satisfy customer needs. The platform provided by these acquisitions offers us critical expertise in the design, engineering, and manufacture of the full range and sizes of swivel joints, triplex and quintuplex fluid-end assemblies, manifolds and manifold trailers, as well as the full suite of pressure control plug, choke, and relief valves. As recertification and refurbishment operations are critical to ensuring the reliable and safe operation of a pressure pumping company’s fleet, we operate a fleet of sophisticated mobile recertification and refurbishment tractor trailers, which can deploy to the customer’s yard or to the well site. We currently serve several of the key unconventional basins, and we are in the process of using the full Production and Infrastructure Segment footprint to expand this business line’s coverage area.
The key driver of this platform is the completion of new wells. In particular, we believe that the growing use of fracturing to develop the oil and gas reserves in shale or tight sands basins across North America has created a long-term growth market. We also believe that the growing service intensity associated with this trend will support sustained growth in the sale of consumable products associated with the stimulation and flowback markets. Our primary customers in this business line are pressure pumping and flowback service companies, although we also generate sales to original equipment manufacturers of pressure pumping units when they assemble new frac spreads. While we benefit from the ongoing new build cycle of pressure pumping equipment, our business model is focused on developing deep relationships with the service companies by providing top quality products and reliable recertification and refurbishment services.
A representative sampling of our key products and related services is listed below. We manufacture a full range of sizes and materials including those needed for sour service to deal with high H2S concentrations.
Key flow equipment product lines
| Consumable flow equipment | • Swivel joints, including large diameter • Pup joints • Swages • Hammer unions • Crossovers | |
Consumable pressure control equipment | • Triplex and quintuplex fluid end assemblies • • Chokes • Relief valves • Bull plugs | |
Capital equipment (equipped with associated consumable products) | • Pressure pumping manifold trailers • Flowback manifolds skids • Flow equipment trucks | |
| Aftermarket services | • Refurbishment and recertification • Mobile recertification • Replacement parts and internals for flow equipment • Online flow line management |
Surface process and onshore pipeline equipmentProduction Equipment
Our surface production equipment platform provides engineered process systems and field services from the wellhead to inside the refinery fence. We serve the upstream, midstream and downstream segments in oil and gas production equipment and services. Once a well has been drilled, completed and brought on stream, we provide the well operator-producer with the process equipment necessary to make the oil or gas ready for transmission. We design, develop and fabricate tanks, a broad range of separators, packaged production systems and American Society of Mechanical Engineers (“ASME”) coded and non-coded pressure vessels, skidded vessels with gas measurement, modular process plants, headers and manifolds, process equipment and flow control and separators to help clean and process oil or gas as it travels from the wellhead and along the transmission line to the refinery. Our customers are principally oil and gas operator producers, and we are positioning our manufacturing and staging locations strategically across North America to best serve the key emerging shale and unconventional resource plays.
A key to our competiveness is manufacturing tanks and pressure vessels in close proximity to their location of use to reduce freight costs, as well as helping our customers manage and anticipate their production equipment needs as their drilling programs progress. We also provide specialized trucks and crews that install the production equipment on the well site, which allows us to capture more value for the product we provide and affords our customers a more streamlined process for bringing a well on production. We continually seek to improve our designs to better serve our customers’ evolving requirements. For example, we have developed
and installed low profile skid mounted process systems that our customer requested for processing natural gas near urban areas. In working with another customer, we developed a modular production processing system that left the plant “installation ready”, and we subsequently provided the installation service for that customer as well. This system reduced the installation time from days to hours and allowed our customer to initiate production from the new wells sooner and with greater reliability. Importantly, we have specialized equipment and service crews that allow us to stage, deliver and install the equipment described above, further streamlining the total well development process that has become so important in the “manufacturing” of shale resource basins.
We also provide industrial construction and manufacturing services for clients in the refining and chemicals industries from our Pasadena, Texas facility, which is strategically located to service this market. We have the engineering expertise and track record in this facility to design and manufacture highly specialized skid mounted systems for a broad array of customers, such as offshore production companies and government related aeronautical customers. This facility also has the flexibility to support incremental production of code pressure vessels destined for use in nearby emerging shale basins, such as the Eagle Ford in South Texas. In early 2010, we acquired the EDGE™ desalination and dehydration product line and a non-exclusive license to manufacture and sell dual frequency technology for use in desalination applications. This product line acquisition also gave us access to an installed base of over 500 systems in oil refineries worldwide. We believe this product line will generate solid, steady results in the future.
We maintain a fleet of specialized onshore pipeline bending, line-up, and construction equipment that we rent to pipeline construction contractors under the brand C&L. Our bending machines, mandrels and bending sets are used to bend pipe to conform to the contours of the land. We also rent internal line up clamps that align and hold together two sections of pipe so they can be welded to each other. Finally, we provide rental equipment to facilitate pipe handling. The C&L brand has been a recognized name in the North American market for over 15 years, and retains a strong reputation for the condition and maintenance of its equipment. Equipment condition directly impacts reliability in the field, which in turn affects construction company productivity. Much of the equipment we offer is niche, pipeline diameter specific equipment, and contractors generally prefer to rent size-specific equipment rather than own it since the diameter of pipelines they build varies from job to job. Demand for these products is largely driven by the increasing need for greenfield gathering systems in new shale resource basins as well as the construction of transmission lines that bring the resource from new regions of supply in emerging shale basins to existing markets.
A representative sampling of the key products and related services in our surface production and processing equipment are listed below.
Key surface production, process, pipeline equipment products
| Upstream | • Steel and fiberglass tanks • Separators: • High / Low Pressure • Vertical / Horizontal • Two / Three Phase • Sand separators • Vapor recovery units • Horizontal and vertical heater treaters • Free water knockouts | • Scrubbers • Gas conditioning and treating products • Gas production units • Water heating units • Fluid storage and measurement units • Well test units • Dehydration skids • Gas measurement skids • Bubble towers | ||
| Midstream | • Skid mounted compressor headers and manifolds • Glycol towers • TEG dehydration units • Control valve skids • Slug catchers • Process piping spools • Pig launchers and receivers | • Pipeline bending and construction equipment • Pigging separators • Gas measurement skids • Regeneration units • Filter separators • Scrubbers • Fuel gas skid units | ||
| Downstream/ Measurement & Monitoring | • EDGE™ Desalination and Dehydration • LACT units • Calibrated meter provers • Sales gas skids | • Condensate meter skids • Custody transfer skids • Prover tanks • Spare parts and other specialty equipment |
Valve solutionsSolutions
We design, manufacture and provide a wide range of industrial valves that principally serve the upstream, midstream and downstream markets of the oil and gas value chain. To a lesser extent, our valves serve general industrial, power and process industry customers as well as the mining industry. We provide a comprehensive suite of ball, gate, globe, check and butterfly valves across a wide range of sizes and application. We believe the worldwide market for industrial valves like ours is approximately $12 billion, with 55% of the market being in the United States. By percentage of our 20102011 full year revenue, our valve solutions business is made up of the following types: 45%54% ball valves, 30%17% butterfly valves and 25%29% multi-turn valves.
We market our valves to our customers and end users through our four recognized brands: PBV, DSI, Quadrant and ABZ. Much of our production is sold through distribution channels, with marketing efforts targeting end users for pull through of our products. Our global sales force and representatives cover 30 countries, with significant affiliated distribution in Canada and South Africa. Our Canadian affiliate provides significant exposure to the growing heavy oil spend cycle while our South African affiliate serves chemical, petrochemical and refining customers. We
have recently established a presence in both Australia and Brazil to enhance our exposure to those growing markets. After rigorous testing, our valve products in this segment have been included on the Approved Manufacturers List (“AML”) of many end users. A key component of our future growth will lay in our ability to increase our presence on more AMLs in key markets outside of North America. To accomplish this, we intend to continue to market our valves to end users and aggressively expand our international presence. During 2010, 43%2011, 42% of our valve solutions business line revenue was derived from outside of the United States.
Our manufacturing and supply chain systems enable us to design and produce high-quality, engineered valves, as well as provide standardized products, while maintaining competitive pricing and minimizing capital requirements. We manufacture and warehouse our highly engineered PBV ball valves inside of our 300,000 square foot valve manufacturing and warehouse facility in Stafford, Texas and utilize our international manufacturing partners to produce components and completed products for a number of our other valve brands. We have developed stringent quality control procedures over many years in close collaboration with our manufacturing partners, and have invested significant resources to bring our partners’ level of reliability and quality up to the very best standards in the industry.
Valve product lines
Our valve solutions products fit broadly into the quarter-turn and multi-turn valve categories. With the exception of our mud valves, which are part of our drilling productstechnologies line, and the valves we market through our flow equipment business, the quarter-turn category includes valves that open and close with 90 degrees of rotation. These valves are typically more compact, lightweight and high performance than multi-turn valves and are generally designed for specific applications. Quarter-turn products consist of butterfly valves and ball mounted valves of both floating and trunnion designs. When in the open position, ball valves provide a seamless media path, which is an important feature for applications that require pigging of the piping system. Multi-turn products, consisting of gate and globe valves, are considered the workhorse of the industry. Their robust design allows them to work under a very broad range of operating conditions. We also manufacture a variety of check valves, which prevent backflow of media. Every type of valve has applications in all segments of the energy value chain and in industrial processes. Many permutations of valve design have evolved to match the large variety of temperature, pressure, media, flow conditions and customer preferences in the energy and general industrial settings.
We manufacture our valves to conform to the standards of the American Petroleum Institute (“API”), American National Standards Institute (“ANSI”), American Bureau of Shipping (“ABS”), and International Organization for Standardization (“ISO”) and other relevant standards governing the design and manufacture of industrial valves. Though our valve solutions segment, we participate in the API’s standard-setting process. In addition to published standards, we have deep knowledge of specific design standards and manufacturing procedures demanded by large global energy players.
A representative sampling of the key products and associated brands in our valve solutions product lines are listed below.
Key valve solutions products
| Upstream | • Flanged floating ball valves (Quadrant) • Threaded and socket welded ball valves (Quadrant) • Butterfly valves (Quadrant) • Metal seated ball valves (PBV) • Trunnion mounted ball valves (PBV) | |
| Midstream | • Trunnion mounted ball valves (PBV) • Flanged floating ball valve (PBV) • Full opening check valves (PBV) • Threaded and stockweld valves (PBV) | |
| Downstream | • Cast steel gate, globe, and check valves (DSI), available in 1/2” to 48” • Forged steel gate, globe, and check valves (DSI) • Pressure seal valves (DSI) • Cast iron valves (DSI) • Threaded and socket weld ball valves (PBV/Quadrant) • Flanged floating ball valves (PBV/Quadrant) • Multi-port ball valve (Quadrant) • Triple offset butterfly valves (ABZ) | |
| Mining, other | • Resilient seated butterfly valves • High performance butterfly valves (ABZ), available in 2” to 60” • Pneumatic and electric actuated butterfly valves |
Business history
SCF Partners is a private equity firm that has specialized in investments in the oilfield services sector since it was founded in 1989. In May 2005, SCF formed FOT in connection with its acquisition of Access Oil Tools, a pipe-handling tool manufacturer and supplier. FOT was founded largely to create a capital equipment provider focused on the drilling sector. Over time, FOT added other complementary businesses to provide a balanced mix of capital and consumable goods to the drilling industry. From 2005 through 2008, FOT experienced rapid growth both organically and through thirteen acquisitions, which included businesses that provide manual and powered pipe handling equipment for drilling rigs; wireline and coiled tubing blowout preventers; drilling rig instrumentation; choke and kill manifolds; drilling mud valves, chokes and pumps; specialty bearing distribution; offline multipurpose activity cranes; and other products and technologies that support drilling operations. All but one of these acquisitions was consummated prior to 2008.
In June 2005, SCF became the controlling stockholder of Global Flow, a manufacturer of industrial valves. Global Flow presented an opportunity for global expansion due to its international supply chain and channels to market, and offered a valve platform around which to develop a larger valve focused business. From 2005 to 2007, Global Flow acquired three
complementary valve businesses to create a company with exposure to the upstream, midstream, and downstream markets.
In February 2007, Triton was formed following the acquisition of Perry Slingsby Systems by SCF. Perry Slingsby Systems, a leading manufacturer of work-class ROVs, was identified as a platform company around which to create a subsea focused business that specializes in providing products and related services to the international offshore oil and gas industry. Triton targeted the global growth in deepwater and offshore resource developments. Triton grew rapidly through organic efforts and through acquisitions. Triton acquired eight companies by the end of 2008, which provided complementary offerings such as observation-class ROVs; ROV tooling and other subsea rental items; ROV pilot provisioning services; geotechnical services; simulation software for complex subsea operations; and others. Half of these acquisitions occurred prior to 2008.
In August 2007, Allied was formed by SCF through the near simultaneous acquisition and merger of four companies focused on the growing process and infrastructure requirements associated with unconventional gas and liquids developments in North America.
Finally, Subsea, a provider of subsea pipeline infield joint coatings and other applied products, was formed by SCF through the acquisition of OJS in January 2007. In 2008, Subsea subsequently acquired a specialty pipeline construction rental equipment business focused on the onshore market to create a broader pipeline infrastructure equipment business.
During the industry-wide downcycle in 2009, FOT, Global Flow, Triton, Allied and Subsea focused on working capital management, margin preservation and customer targeting, and generally positioned themselves for competitive growth in 2010. Beginning in 2009, and in collaboration with SCF Partners, several of the companies initiated strategic discussions concerning the formation of a broadly based oilfield products company that would be capitalized to take advantage of growth opportunities as the industry recovered. After a thorough review involving the management and independent board members of each of the five companies, FOT, Global Flow, Triton, Allied and Subsea were combined on August 2, 2010 in the Combination. In the Combination, FOT became the parent company and was renamed Forum Energy Technologies, Inc. The primary objectives of the Combination were to provide the shareholders and management of the constituent companies a broader platform for growth and access to new equity and debt capital, resulting in an enhanced ability to take advantage of growth opportunities.
During the strategic discussions leading up to the Combination process, key members of management identified the following objectives and benefits of consummating the Combination:
| • | Increase access to growth capital. Many of the Combination companies projected that there would be significant growth opportunities available during a recovery from the 2009 economic downturn, both in terms of organic and acquisition growth. |
manufacturing and aftermarket service facilities in emerging basins, such as in the Marcellus and Macae, Brazil; (2) substantially increasing the size of our subsea equipment rental fleet; (3) creating alternative financing models to help customers accelerate their purchase of key capital equipment; and (4) creating a dedicated new product engineering and development capability. |
| • | Enhance ability to serve our customers and improve cross selling of products. Several of the Combination companies perceived that their relatively small scale inhibited their ability to make a qualitative step change in their relationship with certain large, key customers. A larger platform with better financing would instill greater confidence in customers and better position the business to pursue |
| • | Leverage the strengths of each company across the combined Company. Each of the Combination companies had particular strengths, many of which would benefit one or more of the others. For example, the controls technology expertise imbedded within Triton’s ROV development group could provide FOT’s tubular handling capital equipment development effort with access to highly skilled engineers who had solutions to controls technology challenges. A second example involved Global Flow’s robust supply chain system, which involved outsourced manufacturing and critical vendor relationships in Asia. The combined management believed that access to this supply chain and the knowledge that produced it would accelerate similar efforts across the other companies. |
| • | Enhance financial stability. Each of the Combination companies was subject to different industry drivers, many of which have historically experienced different cycles. The management teams believed that a combined company participating in each of these varying cycles would provide an enhanced measure of stability to the business and to the long-term planning process by decreasing the volatility of its financial results. |
| • | Internally source products. Some of the Combination companies used products of other Combination companies in their manufacturing process. For example, Allied’s surface production equipment business used a large quantity of valves, such as those produced by Global Flow, in the production of skidded process systems. The management teams believed there would be an opportunity to generate incremental business by internally sourcing some of these products. |
Having concluded the Combination, we believe that the investment thesis and the associated operational benefits to us have been proven. As integration has proceeded, we have discovered benefits and opportunities incremental to those described above. We believe that the operational and financial benefits realized through the Combination have: (1) enhanced our growth potential; (2) offered ongoing synergistic opportunities; (3) provided the opportunity to develop broader and more diversified product lines; (4) enabled us to compete with larger companies; (5) provided an opportunity to leverage discrete internal initiatives across a broader
platform; and (6) established a good foundation for long-term growth. Several of these opportunities are under development and we believe that there will be strong benefits to the business as we continue to grow.
Backlog and Bookings
Consistent with our strategy of preserving a balanced mix of capital goods, consumable products, repair parts, and rental services, a majority of our business does not require lengthy lead times, and we therefore believe that the size of our backlog is mostly representative of the activity level of our capital equipment related businesses. Substantially all of the orders and commitments included in our backlog as of September 30,December 31, 2011 were scheduled to be delivered within six months.
We had the following backlog as of the dates indicated, consisting of written orders or commitments believed to be firm contracts for our products:
| Actual | Actual | |||||||||||||||
| As of December 31, 2010 | As of September 30, 2011 | As of December 31, 2010 | As of December 31, 2011 | |||||||||||||
|
|
| ||||||||||||||
| (in millions) | ||||||||||||||||
Drilling and Subsea Segment | 97.5 | 198.5 | $ | 97.5 | $217.0 | |||||||||||
Production and Infrastructure Segment | $ | 52.7 | $ | 148.5 | 52.7 | 190.6 | ||||||||||
|
|
|
| |||||||||||||
Total | $ | 150.2 | $ | 347.0 | $ | 150.2 | $407.6 | |||||||||
Our consumable and repair products are predominantly off-the-shelf items requiring short lead-times, and our related refurbishment or other services are also not contracted with much lead time. Our consumable products, spare parts and aftermarket or other services comprised 52%53% of the pro forma revenue we generated in fiscal 2010.2011. The majority of these products and related services have lead-times shorter than six months. The composition of our backlog is reflective of our mix of capital equipment, consumable products, aftermarket and other related items. Our backlog mix by key product line as of December 31, 2011 is shown below.
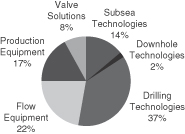
Given this product mix in our backlog, we believe that an appropriate measure of our business’ ongoing activity is the level of quarterly bookings, which consist of written orders or commitments believed to be firm contracts for our products or related services.
We had the following bookings level during the quarterly period ended on the date indicated below:
Actual, Quarter Ended 2011 | ||||
|
|
| ||
| Bookings (In millions) | ||||
Drilling and Subsea Segment | $ | 236.7 | ||
Production and Infrastructure Segment | 147.2 | |||
|
| |||
Total | $ | 383.9 | ||
Actual, Quarter Ended 2011 | ||||
| Bookings (In millions) | ||||
Drilling and Subsea Segment | $200.3 | |||
Production and Infrastructure Segment | 191.2 | |||
Total | $391.5 | |||
We can give no assurance that our level of bookings or backlog will remain at current levels. The thirdfourth quarter 2011 bookings figures shown above rely in part on management estimation, particularly as it relates to the contribution period for acquisitions shortly after the transaction closed. Sales of our products are affected by prices for oil and natural gas, which may fluctuate significantly. Additional future declines in oil and natural gas prices and production or additional regulatory provisions could reduce new customer orders, possibly causing a decline in our future
bookings and backlog levels. Substantially all of our projects currently included in our backlog are subject to change and/or termination at the option of the customer. In the case of a change or termination, the customer is required to pay us for work performed and other costs necessarily incurred as a result of the change or termination. In the past, terminations and cancellations have not been material to our overall operating results.
Seasonality
A substantial portion of our business is not significantly impacted by changing seasons. A small portion of the revenue we generate from selected Canadian operations may benefit from higher first quarter activity levels, as operators take advantage of the winter freeze to gain access to remote drilling and production areas. In the past, some of our revenue in Canada has declined during the second quarter due to warming weather conditions that resulted in thawing, softer ground, difficulty accessing drill sites and road bans that curtailed drilling activity. However, in 2010,In 2011, however, this business generated substantially less than 50% of our total fiscal 2010 Canadian revenue. We also experience some exposure to seasonality through the portion of our subsea rental business that serves the North Sea. It is customary for activity related to this rental equipment to slow down between the months of November and February. However, revenue exposed to this type of seasonality comprised less than 5% of our overall revenue in fiscal 2010.
Competition
The markets in which we operate are highly competitive. We compete with a number of companies, some of which have financial and other resources greater than us. The principal competitive factors in our markets are the quality, price and availability of products and services and a company’s responsiveness to customer needs and reputation for safety. We believe several factors give us a strong competitive position. In particular, we believe our products and services in each segment are at least comparable in price, quality, performance and dependability. We seek to differentiate ourselves from our competitors by providing a rapid response to the needs of our customers, a high level of customer service, and innovative product development initiatives. We have not spent material amounts on research and development activities during the three most recent fiscal years and some of our competitors are capable of expending greater
amounts of money on formal research and engineering efforts than we can spend. However, weWe believe, however, that our product development efforts are greatly enhanced by the investments of management time and energy we make to improve our customer service and to work with our customers on their specific product needs and challenges.
WhileAlthough we have no single competitor across all of our product lines, the companies we compete with across the greatest number of our product lines include Cameron International Corporation and FMC Technologies.
Drilling and Subsea Segment
Subsea productsTechnologies. We have no one direct competitor across all of our product and service lines. We hold established market leading positions in several of our core businesses on a global basis, and we compete with a small number of competitors. The most significant competitor we have across our subsea business is Schilling Robotics, a subsidiary of FMC Technologies Inc. Our principal competitors in some of our subsea business lines are as follows:
Vehicles and products—Schilling Robotics (45% owned by(subsidiary of FMC Technologies, Inc.); Soil Machine Dynamics; and Saab Seaeye (a wholly owned subsidiary of Saab Underwater Systems AB); and
Subsea rental equipment—Ashtead Technology Rental; Seatronics Ltd. (a subsidiary of Acteon Group Ltd) and Fugro N.V.
Downhole productsTechnologies. We have no one direct competitor across all of our downhole product lines. However, the most direct competitor we face across our downhole product lines is Weatherford International, Ltd. Our principal competitors can be separated into these categories:
Casing and cementing tools—Weatherford International, Ltd.; Halliburton Company (however, Halliburton focuses on production for internal use); Frank’s Casing Crews & Rentals, Inc.; Varel International Energy Services Inc.; Ray Oil Tool; and
Downhole protection solutions—Lasalle Engineering Limited (a subsidiary of Schlumberger Ltd., which focuses on production for Schlumberger’s internal use in services capacity); Tube-Tec (a subsidiary of Polymer Holdings Ltd.), providing cast protectors principally to the North Sea market.
Drilling productsTechnologies. Our drilling, intervention and flow control products businessproduct lines compete in a highly consolidated market. Principal competitors include: LeTourneau Technologies (a divisionsubsidiary of Cameron International Corporation), National Oilwell Varco, Inc., Maritime Hydraulics, Canrig (a division of Nabors Industries), Blohm + Voss GmbH, Pason Systems, Inc., Cameron International Corporation, Southwest Oilfield Products, Double Life Corporation, Inc., and Oteco, Inc.
Production and Infrastructure Segment
Flow equipmentEquipment. We have two large competitors in this businessproduct line, and a number of smaller competitors. The largest competitors are FMC Technologies and Weir SPM.
Surface production and process productsProduction Equipment. The most direct competitor we have across this businessproduct line is Natco Group Inc. (a divisionsubsidiary of Cameron International Corporation). Our principal competitors by product type are as follows:
Vessels and Separators—Exterran; Valerus Compression Services; Energy WeldFab; Natco Group Inc.; Sivalls; Challenger Tank and Manufacturing;
Tanks—Palmer Tanks; Permian Tank and Manufacturing; Challenger Tank and Manufacturing (owned by Dover Corp.); Smith Pipe of Abilene; and
Desalter product line—Cameron International Corporation.
Valve productsSolutions. Our valve products businessproduct line competes withhas a number of competitors in each of its market segments. Our largest competitors have similar or greater scope of product offering. Among these larger competitors are Cameron International, Velan, Inc., Balon Corporation, and CIRCOR International, Inc.
Properties
The following tables describe the material facilities owned or leased by us as of December 8, 2011:March 9, 2012:
Drilling and Subsea facilities:
| Location | Leased or owned | Principal/Most Significant Use | ||
|
|
| ||
Liberty, TX | Leased | Drilling Aftermarket | ||
Victoria, TX | Leased | Drilling Aftermarket | ||
Tyler, TX | Leased | Drilling | ||
Broussard, LA | Leased | Drilling | ||
| Owned | Drilling | ||
Dubai, UAE | Leased | Drilling | ||
| Drilling | |||
Aberdeenshire, UK | Leased | Drilling | ||
Tioga, ND | Leased | Drilling Technologies Distribution | ||
Broussard, LA | Owned | Drilling | ||
San Antonio, TX | Owned | Drilling | ||
Singapore | Leased | Drilling | ||
Monterrey, Mexico | Leased | Drilling | ||
Tyne & Wear, UK | Leased | Drilling | ||
Leduc, Canada | Leased | Drilling | ||
Aberdeen, UK | Leased | Drilling | ||
Caithness, UK | Leased | Drilling | ||
Kilbirnie, UK | Leased | Drilling | ||
Houston, TX | Leased | Drilling Headquarters, Engineering | ||
Katy, TX | Leased | Offshore Pipeline Construction | ||
Batam, Indonesia | Leased | Offshore Pipeline Construction | ||
Houston, TX | Leased | ROV Engineering, Sales, Software | ||
Kirkbymoorside, UK | Leased | ROV Manufacturing | ||
Aberdeenshire, UK | Leased | ROV Manufacturing | ||
Aberdeenshire, UK | Leased | ROV Sales and Services | ||
Norfolk, UK | Leased | ROV Sales and Services | ||
Houston, TX | Leased | ROV Sales and Services | ||
Singapore | Leased | ROV Sales and Services | ||
Aberdeenshire, UK | Leased | ROV Software & Technology | ||
| Leased | ROV Software & Technology | ||
Houston, TX | Leased | Seafloor Geoservices | ||
Aberdeenshire, UK | Leased | Subsea Management | ||
Stafford, TX | Owned | Downhole | ||
Pearland, TX | Owned | Downhole | ||
|
|
|
Production and Infrastructure facilities:
| Location | Leased or Owned | Principal/ Most Significant Use | ||
|
|
| ||
Alice, TX | Leased | Flow Equipment Manufacturing | ||
Davis, OK | Owned | Flow Equipment Manufacturing | ||
Odessa, TX | Leased | Flow Equipment Recertification / Distribution | ||
Decatur, TX | Leased | Flow Equipment Recertification / Distribution | ||
Longview, TX | Leased | Flow Equipment Recertification / Distribution | ||
Clearfield, PA | Owned | Production Equipment Manufacturing | ||
Pasadena, TX | Leased | Production Equipment Manufacturing | ||
Chickasha, OK | Owned | Production Equipment Manufacturing | ||
Guthrie, OK | Leased | Production Equipment Manufacturing | ||
Elmore City, OK | Leased | Production Equipment Manufacturing | ||
Gainesville, TX | Leased | Production Equipment Manufacturing | ||
Smithton, PA | Leased | Production Equipment Manufacturing | ||
Cotulla, TX | Leased | Production Equipment Service Center | ||
Greenwood, LA | Leased | Production Equipment Service Center | ||
| Leased | Valve Distribution | ||
Edmonton, Canada | Leased | Valve Distribution | ||
Vereeniging, South Africa | Leased | Valve Distribution | ||
Madison, KS | Leased | Valve Manufacturing | ||
Stafford, TX | Leased | Valve Manufacturing | ||
Broussard, LA | Leased | Valve Manufacturing | ||
Conroe, TX | Leased | Pipeline Construction Equipment | ||
|
|
|
New product development and intellectual property
We have dedicated resources toward the development of new technology and equipment to enhance the safety and efficiency of drilling, completion, well servicing and production processes. Our sales and earnings are influenced by our ability to successfully introduce new or improved products to the market. We currently hold multiple U.S. and international patents and have a number of pending patent applications.
Although in the aggregate our patents and licenses are important to us, we do not regard any single patent or license as critical or essential to our business as a whole. Of greatest importance to our new product development efforts is our ability to preserve excellent customer relations and stay close enough to our customers’ operations so that we can observe opportunities to make changes to our products that would yield the maximum benefit to our customers. In general, in the conduct of our operations, we depend on our technological capabilities, customer service oriented culture and application of our know-how to distinguish ourselves from our competitors, rather than our right to exclude others through patents or exclusive licenses. We also consider the quality and timely delivery of our products, the service we provide to our customers, and the technical knowledge and skill of our personnel to be more important than our registered intellectual property in our ability to compete. While we stress the importance of our research and development programs, the technical challenges and market uncertainties associated with the development and
associated with the development and successful introduction of new products are such that we cannot assure you that we will realize any particular amount of future revenue from the products resulting from our research and development programs.
Suppliers and raw materials
We acquire component parts, products and raw materials from suppliers, including foundries, forge shops, and original equipment manufacturers. The prices we pay for our raw materials may be affected by, among other things, energy, steel and other commodity prices, tariffs and duties on imported materials and foreign currency exchange rates. Certain of our component parts, products or raw materials, such as bearings, are only available from a limited number of suppliers. Please see “Risk factors—Risks related to our business—We are subject to the risk of supplier concentration.”
We have experienced increased costs in recent years due to rising steel prices. There is also strong demand for forgings, castings and outsourced coating services necessary for us to make our products. We cannot assure you that we will be able to continue to purchase these raw materials on a timely basis or at acceptable prices.
We generally try to purchase our raw materials from multiple suppliers so we are not dependent on any one supplier, but this is not always possible.
Inventories and working capital
An important consideration for many of our customers in selecting a vendor is timely availability of the product. Often customers will pay a premium for earlier or immediate availability because of the cost of delays in critical operations. We aim to stock our consumable products in regional warehouses around the world so we can have these products available for our customers when needed. This availability is especially critical for our bearing and valve products, causing us to carry substantial inventories for these products. For critical capital items in which demand is expected to be strong, we often build certain items before we have a firm order. Our having such goods available on short notice can be of great value to our customers.
We typically offer our customers payment terms of net 30 days. For sales into certain countries we might require payment upfront or credit support through a letter of credit. For longer term projects we typically require stage payments as important milestones are reached. On average we collect our receivables in about sixty days from shipment resulting in a substantial investment in accounts receivable. Likewise, standard terms with our vendors are net 30 days. For critical items sourced from significant vendors we have settled accounts more quickly, sometimes in exchange for early payment discounts.
Employees
As of December 8, 2011,March 9, 2012, we had approximately 3,0003,100 employees. Of our total employees, approximately 2,200 were in the United States, 500515 were in the United Kingdom, 130140 were in Canada and 170200 were located in other locations. We are not a party to any collective bargaining agreements, other than in our Monterrey, Mexico facility, and we consider our relations with our employees to be satisfactory.
Operating risk and insurance
We maintain insurance coverage of types and amounts that we believe to be customary and reasonable for companies of our size and with similar operations. In accordance with industry practice, however, we do not maintain insurance coverage against all of the operating risks to which our business is exposed. Therefore, there is a risk our insurance program may not be sufficient to cover any particular loss or all losses.
Currently, our insurance program includes, among other things, general liability, umbrella liability, sudden and accidental pollution, personal property, vehicle, workers’ compensation, and employer’s liability coverage. We are self-insured to the extent that we are required to pay up to $25,000 in the form of deductibles andor retentions for general liability, property and vehicle liability coverage,coverage; up to $100,000 for flood, earthquake or engineers professional liabilityliability; or the full amount of a particular claim, if it is excluded from the coverage provided under our insurance program.
Environmental, health and safety regulation
Our operations are subject to numerous stringent and complex laws and regulations governing the discharge of materials into the environment, health and safety aspects of our operations, or otherwise relating to human health and environmental protection. Failure to comply with these laws or regulations or to obtain or comply with permits may result in the assessment of administrative, civil and criminal penalties, imposition of remedial or corrective action requirements, and the imposition of injunctions to prohibit certain activities or force future compliance.
The trend in environmental regulation has been to impose increasingly stringent restrictions and limitations on activities that may impact the environment, and thus, any changes in environmental laws and regulations or in enforcement policies that result in more stringent and costly waste handling, storage, transport, disposal, or remediation requirements could have a material adverse effect on our operations and financial position. Moreover, accidental releases or spills of regulated substances may occur in the course of our operations, and we cannot assure you that we will not incur significant costs and liabilities as a result of such releases or spills, including any third party claims for damage to property, natural resources or persons.
The following is a summary of the more significant existing environmental, health and safety laws and regulations to which our business operations are subject and for which compliance may have a material adverse impact on our capital expenditures, results of operations or financial position.
Hazardous substances and waste
The Resource Conservation and Recovery Act (“RCRA”) and comparable state statutes, regulate the generation, transportation, treatment, storage, disposal and cleanup of hazardous and non-hazardous wastes. Under the auspices of the EPA, the individual states administer some or all of the provisions of RCRA, sometimes in conjunction with their own, more stringent requirements. We are required to manage the transportation, storage and disposal of hazardous and non-hazardous wastes in compliance with RCRA.
The Comprehensive Environmental Response, Compensation, and Liability Act (“CERCLA”), also known as the Superfund law, imposes joint and several liability, without regard to fault or
legality of conduct, on classes of persons who are considered to be responsible for the release of a hazardous substance into the environment. These persons include the owner or operator of the site where the release occurred, and anyone who disposed or arranged for the disposal of a hazardous substance released at the site. We currently own, lease, or operate numerous properties that have been used for manufacturing and other operations for many years. We also contract with waste removal services and landfills. These properties and the substances disposed or released on them may be subject to CERCLA, RCRA and analogous state laws. Under such laws, we could be required to remove previously disposed substances and wastes, remediate contaminated property, or perform remedial operations to prevent future contamination. In addition, it is not uncommon for neighboring landowners and other third-parties to file claims for personal injury and property damage allegedly caused by hazardous substances released into the environment.
Water discharges
The Federal Water Pollution Control Act (the “Clean Water Act”) and analogous state laws impose restrictions and strict controls with respect to the discharge of pollutants, including spills and leaks of oil and other substances, into waters of the United States. The discharge of pollutants into regulated waters is prohibited, except in accordance with the terms of a permit issued by the EPA or an analogous state agency. A responsible party includes the owner or operator of a facility from which a discharge occurs. The Clean Water Act and analogous state laws provide for administrative, civil and criminal penalties for unauthorized discharges and, together with the Oil Pollution Act of 1990, impose rigorous requirements for spill prevention and response planning, as well as substantial potential liability for the costs of removal, remediation, and damages in connection with any unauthorized discharges.
Air emissions
The federal Clean Air Act and comparable state laws regulate emissions of various air pollutants through air emissions permitting programs and the imposition of other emission control requirements. In addition, the EPA has developed, and continues to develop, stringent regulations governing emissions of toxic air pollutants at specified sources. Non-compliance with air permits or other requirements of the federal Clean Air Act and associated state laws and regulations can result in the imposition of administrative, civil and criminal penalties, as well as the issuance of orders or injunctions limiting or prohibiting non-compliant operations.
Climate change
In December 2009, the EPA determined that emissions of carbon dioxide, methane and other “greenhouse gases” present an endangerment to public health and the environment because emissions of such gases are, according to the EPA, contributing to warming of the earth’s atmosphere and other climatic changes. Based on these findings, the EPA has begun adopting and implementing regulations to restrict emissions of greenhouse gases under existing provisions of the federal Clean Air Act. The EPA recently adopted two sets of rules regulating greenhouse gas emissions under the Clean Air Act, one of which requires a reduction in emissions of greenhouse gases from motor vehicles and the other of which regulates emissions of greenhouse gases from certain large stationary sources, effective January 2, 2011. The EPA’s rules relating to emissions of greenhouse gases from large stationary sources of emissions are currently subject to a number of legal challenges, but the federal courts have thus far declined to issue any
injunctions to prevent the EPA from implementing, or requiring state environmental agencies to implement, the rules. The EPA has also adopted rules requiring the reporting of greenhouse gas emissions from specified large greenhouse gas emission sources in the United States, including petroleum refineries, on an annual basis, beginning in 2011 for emissions occurring after January 1, 2010, as well as onshore oil and natural gas production facilities, on an annual basis, beginning in 2012 for emissions occurring in 2011.
In addition, the United States Congress has from time to time considered adopting legislation to reduce emissions of greenhouse gases and almost one-half of the states have already taken legal measures to reduce emissions of greenhouse gases primarily through the planned development of greenhouse gas emission inventories and/or regional greenhouse gas cap and trade programs. Most of these cap and trade programs work by requiring major sources of emissions, such as electric power plants, or major producers of fuels, such as refineries and gas processing plants, to acquire and surrender emission allowances. The number of allowances available for purchase is reduced each year in an effort to achieve the overall greenhouse gas emission reduction goal.
The adoption of legislation or regulatory programs to reduce emissions of greenhouse gases could require us to incur increased operating costs, such as costs to purchase and operate emissions control systems, to acquire emissions allowances or comply with new regulatory or reporting requirements. Any such legislation or regulatory programs could also increase the cost of consuming, and thereby reduce demand for, the oil and natural gas produced by our customers. Consequently, legislation and regulatory programs to reduce emissions of greenhouse gases could have an adverse effect on our business, financial condition and results of operations. Finally, it should be noted that some scientists have concluded that increasing concentrations of greenhouse gases in the earth’s atmosphere may produce climate changes that have significant physical effects, such as increased frequency and severity of storms, droughts, and floods and other climatic events. If any such effects were to occur, they could have an adverse effect on our business, financial condition, results of operations and cash flow.
Employee health and safety
We are subject to a number of federal and state laws and regulations, including the federal Occupational Safety and Health Act (“OSHA”) and comparable state statutes, establishing requirements to protect the health and safety of workers. In addition, the OSHA hazard communication standard, the EPA community right-to-know regulations under Title III of the federal Superfund Amendment and Reauthorization Act and comparable state statutes require that information be maintained concerning hazardous materials used or produced in our operations and that this information be provided to employees, state and local government authorities and the public. Substantial fines and penalties can be imposed and orders or injunctions limiting or prohibiting certain operations may be issued in connection with any failure to comply with laws and regulations relating to worker health and safety.
We also operate in non-U.S. jurisdictions, which may impose similar liabilities against us.
Legal proceedings
From time to time, we have various claims, lawsuits and administrative proceedings that are pending or threatened, all arising in the ordinary course of business, with respect to commercial, product liability and employee matters.
Asbestos litigation
One of our subsidiaries has been named as one of many defendants in a number of product liability claims for alleged exposure to asbestos. These lawsuits are typically filed on behalf of plaintiffs who allege exposure to some asbestos, against numerous defendants, often 40 or more, who may have manufactured or distributed products containing asbestos. The injuries alleged by plaintiffs in these cases range from mesothelioma to other cancers to asbestosis. The earliest claims against our subsidiary were filed in New Jersey in 1998, and our subsidiary currently has active cases in Missouri, New Jersey, New York and Illinois. These claims do not currently include requests for a specific amount of damages. The product line with asbestos exposure was acquired by our subsidiary in 1986. Our subsidiary has been successful in obtaining dismissals in most lawsuits where the exposure is alleged to have occurred prior to our acquisition of the product line. The law in some states requires purchasers of product lines to assume responsibility for incidents occurring prior to the acquisition date under so called “successor liability” laws, and the law in other states is ambiguous in this regard. Most claimants alleging illnesses due to asbestos sue on the basis of exposure prior to 1986, as by that date the hazards of asbestos exposure were well known and asbestos had begun to fall into disuse in industrial settings. To date, asbestos claims have not had a material adverse effect on our business, financial condition, results of operations, or cash flow, as our annual out-of-pocket costs over the last five years has been less than $200,000. There are typically approximately forty to eightyfewer than 100 cases filed against our subsidiary each year, and a similar number of cases are dismissed, settled or otherwise disposed of each year. We currently have approximately 135fewer than 160 lawsuits pending against this subsidiary. Our subsidiary has over $17 million in face amount of per occurrence and over $23 million of aggregate primary insurance coverage. In addition, our subsidiary has over $950 million in face amount of excess coverage applicable to the claims. There can be no guarantee that all of this can be collected due to policy conditions and insurer insolvencies in the past or in the future. In February 2011, we entered into an agreement with seven of our primary insurers under which they have agreed to pay 80% of the costs of handling or settling each claim against the affected subsidiary. After an initial period, and under certain circumstances, our subsidiary and the subscribing underwriters may withdraw from this agreement.
Portland Harbor Superfund litigation
In May 2009, one of our subsidiaries (which is presently a dormant company with nominal assets except for rights under insurance policies) was named along with many defendants in a suit filed by the Port of Portland, Oregon seeking reimbursement of costs related to a five-year study of contaminated sediments at the port. In March 2010, the subsidiary also received a notice letter from the EPA indicating that it had been identified as a potentially responsible party with respect to environmental contamination in the “study area” for the Portland Harbor Superfund Site. Under a 1997 indemnity agreement, our subsidiary is indemnified by a third party with respect to losses relating to environmental contamination. As required under the indemnity agreement, our subsidiary provided notice of these claims, and the indemnitor has assumed responsibility and is providing a defense of the claims. Although we believe that it is unlikely that our subsidiary contributed to the contamination at the Portland Harbor Superfund Site, the potential liability of our subsidiary and the ability of the indemnitor to fulfill its indemnity obligations cannot be quantified at this time.
Executive officers and directors
Set forth below are the names, ages and positions of our executive officers and directors as of December 29, 2011.March 9, 2012. All directors are elected for a term of one year or serve until their successors are elected and qualified or upon earlier of death, disability, resignation or removal. All executive officers hold office until their successors are elected and qualified or upon earlier of death, disability, resignation or removal. There are no family relationships among any of our directors or executive officers. The address of each director and executive officer is: 920 Memorial City Way, Suite 800, Houston, Texas 77024.
| Name | Age | Position | ||
| ||||
C. Christopher Gaut | 55 | President, Chief Executive Officer and Chairman of the Board | ||
Charles E. Jones | 52 | Executive Vice President; President—Drilling and Subsea | ||
Wendell R. Brooks | 62 | Executive Vice President; President—Production and Infrastructure | ||
James W. Harris | Senior Vice President and Chief Financial Officer | |||
James L. McCulloch | 59 | Senior Vice President, General Counsel and Secretary | ||
W. Patrick Connelly | 36 | Vice President—Strategic Development | ||
Michael D. Danford | 49 | Vice President—Human Resources | ||
Pablo G. Mercado | 35 | Vice President—Corporate Development | ||
Evelyn M. Angelle | 44 | Director | ||
David C. Baldwin | Director | |||
John A. Carrig | 59 | Director | ||
Michael McShane | 57 | Director | ||
Franklin Myers | 59 | Director | ||
Louis A. Raspino | 59 | Director | ||
John Schmitz | 51 | Director | ||
Andrew L. Waite | Director | |||
| ||||
C. Christopher Gaut. Mr. Gaut has served as our President, Chief Executive Officer and Chairman of the board of directors since August 2010 and as one of our directors since December 2006. He served as a consultant to LESA, the ultimate general partner of SCF, from November 2009 to August 2010. Mr. Gaut served at Halliburton Company, a leading diversified oilfield service company, as President of the Drilling and Evaluation Division and prior to that as Chief Financial Officer, from March 2003 through April 2009. From April 2009 through November 2009, Mr. Gaut was a private investor. Prior to joining Halliburton Company in 2003, Mr. Gaut was the Co-Chief Operating Officer of Ensco International, a provider of offshore contract drilling services. He also served as Ensco’s Chief Financial Officer from 1988 until 2003. Mr. Gaut is currently a member of the Board of Directors of Ensco plc. Mr. Gaut holds an A.B. in Engineering Sciences from Dartmouth College and an M.B.A. from The Wharton School at the University of Pennsylvania.
Charles E. Jones. Mr. Jones has served as an Executive Vice President and the President of our Drilling and Subsea SegmentDivision since the Combination in August 2010. He served as FOT’s President and Chief Executive Officer from October 2007 to the Combination. Prior to joining FOT, from January 2003 until October 2007, Mr. Jones was the Executive Vice President and Chief Operating Officer of Hydril Company, a supplier of drilling equipment to the oil and gas industry. Mr. Jones served as Vice President of Hydril Company’s Pressure Control segment from November 2001 until January 2003. Prior to serving in that position, he served as the Managing Director, Pressure Control for Hydril beginning in March 1998. From March 1996 until March 1998, Mr. Jones served as a Director of the subsea business for Cooper Cameron Corporation, a provider of flow equipment products, systems and services to oil, gas and process industries. From April 1995 until March 1996, Mr. Jones served as an Engineering Manager for Subsea Offshore (formerly Dresser Industries), a provider of ROV and remote intervention systems. Mr. Jones holds a B.S. in Mechanical Engineering from the University of Houston and, in 2002, he completed the Harvard Business School Advanced Management Program.
Wendell R. Brooks. Mr. Brooks has served as an Executive Vice President and the President of our Production and Infrastructure SegmentDivision since August 2010. He served as Chief Executive Officer and President of Allied Production Services, Inc. from October 2007 until August 2010. Prior to that, from 1996 to October 2007, he was the Group Director for the well support business of John Wood Group Plc, a public Scottish company traded on the London Stock Exchange. Mr. Brooks also served on the Board of Directors of Wood Group during that time. Mr. Brooks has also been President of Del Norte Inc. and was employed by Geosource, Inc. from 1975 to 1984 where he was involved in business development and served as President of two divisions. Mr. Brooks has a B.B.A. from the University of Texas at Arlington and an M.B.A. from the Harvard Business School.
James W. Harris. Mr. Harris has served as our Senior Vice President and Chief Financial Officer since the Combination in August 2010. From December 2005 until the Combination, Mr. Harris served as FOT’s Executive Vice President and Chief Financial Officer. Mr. Harris was Vice President, Controller of VeriCenter, Inc., a provider of information technology services, and General Manager of its AppSite Hosting service line from January 2004 through November 2005. Prior to joining VeriCenter, from August 1999 through December 2001, Mr. Harris worked for Enron Energy Services, Inc., as a Vice President and thereafter served as a consultant through December 2003. Mr. Harris began his career at PriceWaterhouse from January 1985 until February 1994, with his final position being a Senior Tax Manager, and at Baker Hughes Incorporated from February 1994 until May 1999 in various positions, including Vice President, Tax and Controller. Mr. Harris received his B.S. and his Masters of Accounting from Brigham Young University and his M.B.A. from Rice University. Mr. Harris is a certified public accountant.
James L. McCulloch. Mr. McCulloch has served as our Senior Vice President, General Counsel and Secretary since October 2010. Mr. McCulloch was a private investor from January 2008 until joining the Company, and since February 2008 has also served on the Board of Directors of Sunland Inc., a privately held pipeline construction and services company. In 1983 Mr. McCulloch joined Global Marine Inc., a leading international offshore drilling contractor, as Assistant General Counsel and served in a variety of capacities within the legal department until being named Senior Vice President and General Counsel in 1995. In 2001 Global Marine merged with Santa Fe International Corporation, an international land and offshore drilling contractor, to form GlobalSantaFe Corporation, the second largest offshore drilling company in the world, where Mr. McCulloch continued to serve as Senior Vice President and General Counsel until the
company’s merger with Transocean Inc. in December 2007. Prior to joining Global Marine,
Mr. McCulloch worked for a privately held shipping company based in Tampa, Florida and as an associate with the Phelps Dunbar law firm in New Orleans, Louisiana. Mr. McCulloch received his B.A. from Tulane University and his J.D. from Tulane University School of Law.
W. Patrick Connelly. Mr. Connelly provides services pursuant to a Secondment Agreement between us and LESA. Please see, “Certain relationships and related party transactions—Transactions with our significant stockholder prior to the Combination.” Mr. Connelly has served as our Vice President of Strategic Development since August 2010. In this capacity, Mr. Connelly is responsible for the development and execution of a range of strategic initiatives, including mergers and acquisitions, new product line concept development, strategic marketing initiatives, long-term capital formation, and other similar efforts. Before joining our Company, Mr. Connelly worked at SCF Partners, where he played an instrumental role in the merger and recapitalization of the five SCF Partners’ portfolio companies that formed Forum Energy Technologies, Inc. Mr. Connelly received his B.S. in Mathematics and Systems Engineering from the U.S. Military Academy at West Point, an M.B.A. from Harvard Business School and a Masters of Public Administration from the Harvard Kennedy School of Government. Prior to joining SCF Partners, he served as an active duty infantry officer in the United States Army for over six years, and participated in operational deployments throughout the Balkans, North Africa, and Iraq.
Michael D. Danford. Mr. Danford has served our Vice President—Human Resources since August 2010. He served as Vice President Human Resources for FOT from November 2007 until August 2010. Prior to joining our Company, from August 2007 through November 2007, he worked at Trico Marine Services Inc. as Vice President—Human Resources. From 1997 through July 2007, Mr. Danford served as Director of Human Resources and Vice President Human Resources for Hydril Company. From 1991 to 1997, Mr. Danford served in various human resources roles for Baker Hughes Incorporated. Prior to joining Baker Hughes Incorporated, Mr. Danford served as a recruiter and as an employee relations representative in the human resources department for Compaq Computer from 1990 to 1991. Mr. Danford holds a B.S. degree in Computer Science from the University of Louisiana at Monroe (formerly Northeast Louisiana University).
Pablo G. Mercado. Mr. Mercado has served as our Vice President, Corporate Development since November 2011. Prior to joining our Company, from May 2005 to October 2011, Mr. Mercado was an investment banker in the Oil and Gas Group of Credit Suisse Securities (USA) LLC where he worked with oilfield services companies and other companies in the oil and gas industry, most recently as a Director. From 1998 to 2001 and 2003 to May 2005, Mr. Mercado was an investment banker at other firms, primarily working with companies in the oil and gas industry. Mr. Mercado holds a B.B.A. in Business Administration from the Cox School of Business, a B.A. in Economics from the Dedman College at Southern Methodist University, and a Master of Business Administration from The University of Chicago Booth School of Business.
Evelyn M. Angelle. Ms. Angelle was appointed as a director of the Company in February 2011. Since January 2011, Ms. Angelle has served as Senior Vice President and Chief Accounting Officer for Halliburton. From January 2008 until January 2011, Ms. Angelle was Vice President, Corporate Controller and Principal Accounting Officer for Halliburton, responsible for financial reporting, planning, budgeting, financial analysis and accounting services. From December 2007 until January 2008, Ms. Angelle was Vice President of Operations Finance for Halliburton, leading Finance employees located around the world. From April 2005 until November 2007, she has also served as Vice President of Investor Relations, for Halliburton, for which she oversaw Halliburton
overseeing Halliburton’s communications and relationships with investors and analysts. Prior to that, she was responsible for internal and
external reporting of consolidated financial statements, technical accounting research and consultation, and income tax accounting. Before joining Halliburton, Ms. Angelle worked for 15 years in the audit department of Ernst & Young LLP, where she specialized in serving large, multinational public companies and provided technical accounting and consultation to clients and other professionals. She is a certified public accountant in Texas and a certified management accountant. She currently serves on the executive committee of Junior Achievement of Southeast Texas and on the boardBoard of directorsDirectors for Junior Achievement USA. As a result of her professional experience, Ms. Angelle possesses particular knowledge in accounting, internal controls and public company disclosure compliance. In addition, she brings added judgment about investor relations and the financial management of a large organization.
David C. Baldwin. Mr. Baldwin was appointed as a director of the Company in May 2005. Mr. Baldwin is currently a Managing Director of LESA, the ultimate general partner of SCF and a private equity firm, and has held various positions since joining LESA in 1991. Prior to joining LESA, Mr. Baldwin was a drilling and production engineer with Union Pacific Resources, an independent natural gas and oil exploration and production company. Mr. Baldwin serves as a director of Rockwater Energy Solutions, Inc., a private energy services company and served as a director of Complete Production Services, Inc., a provider of specialized oil and gas completion and production services, from September 2002 through September 2007. Mr. Baldwin’s extensive experience in identifying strategic growth trends in the energy industry and evaluating potential transactions makes him well qualified to serve on our board. Further, his service as Managing Director of the general partner of our largest stockholder provides a valuable perspective into its insights and interests.
John A. Carrig. Mr. Carrig was appointed as a director of the Company in July 2011. He retired from ConocoPhillips on March 1, 2011, having most recently served as President and Chief Operating Officer since 2008, where he was responsible for global Exploration and Production, Refining and Marketing, Commercial, Project Development and Procurement and the Health, Safety and Environment functions. Mr. Carrig served as Executive Vice President, Finance, and Chief Financial Officer from 2002 to 2008. Prior to the merger with Conoco Inc. in 2002, Mr. Carrig was with Phillips Petroleum Company, where he was named Senior Vice President and Chief Financial Officer in 2001. In 2000, he joined Phillips’ management committee as Senior Vice President and Treasurer. From 1996 to 2000, he was Vice President and Treasurer. Mr. Carrig served as Treasurer in 1995, and Assistant Treasurer in 1994. He joined Phillips in 1978 as a tax attorney. He has been a private investor and engaged in charitable endeavors since his retirement from ConocoPhillips. The board selected Mr. Carrig due to the length and breadth of his experience in the oil and gas industry, the perspective he brings as a result of his long service as an executive of a major public company with global reach and his strategic, financial and management acumen. In addition, Mr. Carrig brings valuable insight as a result of his long history as a customer for oilfield equipment and services.
Michael McShane. Mr. McShane was appointed as a director of the Company in September 2010. Mr. McShane also currently serves as an Operating Partner to Advent International, an international private equity fund. Mr. McShane ishas been a director of Spectra Energy Corp., a provider of natural gas infrastructure, since April 2008, Complete Production Services, Inc., a provider of specialized oil and gas completion and production services, from March 2007 until February 2012, Superior Energy Services, Inc., a provider of specialized oilfield services and equipment, since the completion of Superior Energy’s acquisition of Complete Production Services in February 2012, and Oasis Petroleum Inc., an exploration and production company, and Globalogix, a privately held company that provides comprehensive services to upstream oil and gas producers and operators, since June 2007. Previously, Mr. McShane
May 2010. Previously, Mr. McShane served as a director and President and Chief Executive Officer of Grant Prideco, Inc., a manufacturer and supplier of oilfield drill pipe and other drill stem products, from June 2002 until April 2008, having also served as Chairman of the Board from May 2003 through April 2008. Prior to joining Grant Prideco, Mr. McShane was Senior Vice President—Finance and Chief Financial Officer and director of BJ Services Company, a provider of pressure pumping, cementing, stimulation and coiled tubing services for oil and gas operators, from 1990 to June 2002 and Vice President—Finance from 1987 to 1990 while BJ Services Company was a division of Baker Hughes Incorporated. Mr. McShane joined BJ Services Company in 1987 from Reed Tool Company, where he was employed for seven years in various financial management positions. The board selected Mr. McShane because of his expansive knowledge of the oil and gas industry, as well as relationships with chief executives and other senior management at oil and natural gas companies and oilfield service companies throughout the world. He brings to the board his experiences as a senior leader and chief financial officer within the oilfield service industry, as well as his leadership as chairman and chief executive officer of a leading North American drill bit technology and drill pipe manufacturer. Mr. McShane also provides the board with a producer perspective that is valuable in strategic discussions.
Franklin Myers. Mr. Myers was appointed as a director of the Company in September 2010.2010 and the Lead Independant Director of the board in December 2011. Mr. Myers served as Senior Advisor to Cameron International Corporation, a publicly traded provider of flow equipment products, from April 2008 through March 2009, prior to which, from 2003 through March 2008, he served as the Senior Vice President and Chief Financial Officer. From 1995 to 2003, he served at various times as Senior Vice President and President of a division within Cooper Cameron Corporation as well as General Counsel and Secretary. Prior to joining Cooper Cameron Corporation in 1995, Mr. Myers served as Senior Vice President and General Counsel of Baker Hughes Incorporated, and as attorney and partner at the law firm of Fulbright & Jaworski. Mr. Myers serves on the Board of Directors of ION Geophysical Corporation, a technology-focused seismic solutions company, Comfort Systems USA, Inc., a national heating, ventilation and cooling company, and HollyFrontier Corporation, a refining and marketing company. Mr. Myers also serves as an operating advisor for Paine Partners, a private equity fund. Mr. Myers’ extensive experience as both a financial and legal executive makes him uniquely qualified as a valuable member of our board. Mr. Myers has been responsible for numerous successful finance and acquisition transactions throughout his career, and his expertise gained through those experiences has proven to be a significant resource for our board. In addition, Mr. Myers’ service on Boardsboards of Directorsdirectors of other NYSE-listed companies enables Mr. Myers to observe and advise on favorable governance practices pursued by other public companies.
Louis A. Raspino. Mr. Raspinowas elected as a director of the Company in January 2012. He was named President, Chief Executive Officer and a director of Pride International, Inc., a contract drilling company, in June 2005 and served in that capacity untilits acquisition by Ensco Plc in May 2011. Mr. Raspino has been a private investor since June 2011. He joined Pride International in December 2003 as Executive Vice President and Chief Financial Officer. From July 2001 until December 2003, he served as Senior Vice President, Finance and Chief Financial Officer of Grant Prideco, Inc. From February 1999 until March 2001, he held various senior financial positions, including Vice President of Finance for Halliburton Company. From October 1997 until July 1998, he was a Senior Vice President at Burlington Resources, Inc. From 1978 until its merger with Burlington Resources, Inc. in 1997, he held a variety of increasingly responsible positions at Louisiana Land and Exploration Company, most recently as Senior Vice President, Finance and Administration and Chief Financial Officer. Mr. Raspino also is a director of Dresser-Rand Group
Inc. Mr. Raspino’s significant experience as an executive officer of other energy companies, service as a member of other boards of directors, and his operational, strategic and financial expertise in the oil and gas business makes Mr. Raspino well qualified to serve on our board.
John Schmitz. Mr. Schmitz was appointed as a director of the Company in September 2010. Mr. Schmitz currently serves as the Chairman and Chief Executive Officer of Select Energy Services, LLC, an oil and gas service company, a position he has held since January 2007. In addition, Mr. Schmitz has served as the President of HEP Oil Company from March 1992 to the present. Prior to his current involvement at Select Energy Services, LLC and HEP Oil Company, Mr. Schmitz served as the North Texas Division Manager for Complete Production Services, a provider of specialized services and products focused on helping oil and gas companies develop hydrocarbon reserves, reduce costs and enhance production. Mr. Schmitz has keen insight into emerging trends in North American shale plays and the types of equipment needed to service producers’ requirements. He also has knowledge of other manufacturers’ capabilities and their reputations for quality and deliverability, providing an interesting perspective on our evaluation of potential acquisitions.
Andrew L. Waite. Mr. Waite was appointed as a director in August 2010. Mr. Waite is a Managing Director of LESA, the ultimate general partner of SCF, and has been an officer of that company since October 1995. He was previously Vice President of Simmons & Company International, where he served from August 1993 to September 1995. From 1984 to 1991, Mr. Waite held a number of engineering and project management positions with the Royal Dutch/Shell Group, an integrated energy company. Mr. Waite served on the Board of Directors of Complete Production Services, Inc., a provider of specialized oil and gas completion and production services, from 2005 to 2009, Hornbeck Offshore Services, Inc., a provider of marine services to exploration and production oilfield service, offshore construction and military customers, from 2000 to 2006 and Oil States International, Inc., a leading manufacturer of equipment for deepwater production facilities products and subsea pipeline,pipelines and a leading service provider to the oil and gas industry, from 1995 to 2006. Mr. Waite’s extensive experience in identifying strategic growth trends in the energy industry and evaluating potential transactions makes him well qualified to serve on our board. Further, his service as Managing Director of the general partner of our largest stockholder provides a valuable perspective into its insights and interests.
Board of directors
The number of members of our board of directors is determined from time to time by resolution of the board of directors. Our board of directors currently consists of eightnine members, including our Chief Executive Officer, who serves as the Chairman of the board of directors, Mr. Myers, the Lead Independent Director of the board of directors, and two members designated by SCF, Mr. Baldwin and Mr. Waite. Following the completion of this offering, our directors will be divided into three classes serving staggered three-year terms. Class I, Class II and Class III directors will serve until our annual meetings of stockholders in 2012, 2013, 2014 and 2014,2015, respectively. At each annual meeting of stockholders held after the initial classification, directors will be elected to succeed the class of directors whose terms have expired. This classification of our board of directors could have the effect of increasing the length of time necessary to change the composition of a majority of the board of directors. In general, at least two annual meetings of stockholders will be necessary for stockholders to effect a change in a majority of the members of the board of directors.
Additionally, in connection with the concurrent private placement we intend to amend our stockholders agreement upon the closing of the concurrent private placement to require us and our stockholders that are party to the stockholders agreement to take all action required to cause the board of directors to include one member designated by the private equity firm. We will also agree to use our reasonable best efforts to cause the private equity firm’s designee to remain on the board, to cause the designee to be in the class of directors with an initial term that has as close to three years remaining as possible and to cause the Nominating, Governance and Compensation Committee of the board of directors to include the designee. Once the private equity firm’s designee has served a term on the board of directors following the completion of this offering, we have no further obligations to appoint or otherwise nominate a designee to the board of directors.
Our board of directors reviewed the independence of our directors using the independence standards of the NYSE and, based on this review, determined that Ms. Angelle and Messrs. Carrig, McShane, Myers, Raspino and Schmitz are independent within the meaning of the NYSE listing standards currently in effect.
Because SCF will own a majority of our outstanding common stock following the completion of this offering, we will be a “controlled company” as that term is set forth in Section 303A of the NYSE Listed Company Manual. Under the NYSE rules, a “controlled company” may elect not to comply with certain NYSE corporate governance requirements, including: (1) the requirement that a majority of our board of directors consist of independent directors, (2) the requirement that our nominating and governance committee be composed entirely of independent directors with a written charter addressing the committee’s purpose and responsibilities, and (3) the requirement that our compensation committee be composed entirely of independent directors with a written charter addressing the committee’s purpose and responsibilities. Even though these requirements will not apply to us as long as we remain a “controlled company,” we intend to comply with these NYSE corporate governance requirements at the completion of this offering. We expect that our board of directors will continue to consist of a majority of independent directors and that, at the completion of this offering, our Nominating, Governance
and Compensation Committee will consist entirely of independent directors. We also expect that it will have a written charter addressing such committee’s purpose and responsibilities.
In evaluating director candidates, we will assess whether a candidate possesses the integrity, judgment, knowledge, experience, skills and expertise that are likely to enhance the board’s ability to manage and direct the affairs and business of the Company, including, when applicable, to enhance the ability of committees of the board to fulfill their duties and the quality of the board’s deliberations and decisions. In evaluating directors, we consider diversity in its broadest sense, including persons diverse in perspectives, personal and professional experiences, geography, gender, race and ethnicity. This process has resulted in a board that is comprised of highly qualified directors that reflect diversity as we define it.
Committees of the board of directors
Our board of directors has established an audit committee and a nominating, governance and compensation committee, and may have such other committees as the board of directors shall determine from time to time. Each of the standing committees of the board of directors currently has the composition and responsibilities described below.
Audit committee
Our board established an audit committee in February 2011 that is currently comprised of three members, Ms. Angelle, Mr. Myers and Mr. Schmitz. Ms. Angelle serves as our committee chairwoman. SEC rules require that a public company disclose whether or not its audit committee has an “audit committee financial expert” as a member. An “audit committee financial expert” is defined as a person who, based on his or her experience, possesses the attributes outlined in such rules. Our board of directors determined that Ms. Angelle satisfies the definition of “audit committee financial expert.”
Our Audit Committee performs substantially similar functions to the audit committee of a public company. For instance, the Audit Committee oversees, reviews, acts on and reports on various auditing and accounting matters to our board of directors, including: the selection of our independent accountants, the scope of our annual audits, fees to be paid to the independent accountants, the performance of our independent accountants and our accounting practices. In addition, the Audit Committee oversees our compliance programs relating to legal and regulatory requirements. We have adopted an audit committee charter that will be effective upon the completion of this offering that defines the committee’s primary duties in a manner consistent with the rules of the SEC and NYSE or market standards.
Nominating, governance and compensation committee
Our board of directors established a Nominating, Governancenominating, governance and Compensation Committeecompensation committee in February 2011. It is comprised of fourfive members, Messrs. Baldwin, Carrig, McShane, Raspino and Waite. Mr. Baldwin serves as our committee chairman. Our Nominating, Governance and Compensation Committee performs substantially similar functions to the compensation committee and nominating and governance committee of a public company.
At the completion of this offering, we anticipate that the Nominating, Governance and Compensation Committee will consist entirely of “independent” directors under the applicable rules of the NYSE and the SEC. The Nominating, Governance and Compensation Committee will
establish salaries, incentives and other forms of compensation for officers and other employees other than the Chief Executive Officer, it will make recommendations to the board with respect to compensation of the Chief Executive Officer, and it will administer our incentive compensation and benefit plans. The Nominating, Governance and Compensation Committee will also identify, evaluate and recommend qualified nominees to serve on our board of directors, develop and oversee our internal corporate governance processes and maintain a management succession plan. We have adopted a charter that will be effective upon the completion of this offering that defines the committee’s primary duties in a manner consistent with the rules of the SEC and NYSE or market standards.
Compensation committee interlocks and insider participation
None of our officers or employees will be members of the Nominating, Governance and Compensation Committee. None of our executive officers serve on the board of directors or compensation committee of a company that has an executive officer that serves on our board or Nominating, Governance and Compensation Committee. No member of our board is an executive officer of a company in which one of our executive officers serves as a member of the board of directors or compensation committee of that company.
Executive sessions of our board of directors
Our independent directors are provided the opportunity to meet in executive session at each regularly scheduled meeting of our board. The director presiding over such meetings rotates among the directors eligible to participate in such executive sessions.
The board of directors has elected Mr. Myers, an independent director, to serve as the Lead Independent Director. In this capacity Mr. Myers provides, in conjunction with the Chairman, leadership and guidance to the board of directors. As the Lead Independent Director, Mr. Myers also establishes the agenda for each meetingserves as chairman of executive sessions of the boardindependent directors of directors.our board.
Risk oversight
The board is actively involved in oversight of risks that could affect us. This oversight function is conducted primarily through committees of our board, but the full board retains responsibility for general oversight of risks. The Audit Committee is charged with oversight of our system of internal controls and risks relating to financial reporting, legal, regulatory and accounting compliance. Our board will continue to satisfy its oversight responsibility through full reports from the Audit Committee chair regarding the committee’s considerations and actions, as well as through regular reports directly from officers responsible for oversight of particular risks within our Company. In addition, we have internal audit systems in place to review adherence to policies and procedures, which are supported by a separate internal audit department.
Code of ethics for chief executive officer, chief financial officer, controller and certain other officers
Prior to the closing of this offering, our board will adoptWe have adopted a Code of Ethics for our Chief Executive Officer, our Chief Financial Officer and all other financial and accounting officers.officers that will be effective upon completion of the offering. Following the adoptioneffectiveness of our Code of Ethics, any change to, or waiver from, the Code of Ethics will be will be promptly disclosed as required by applicable U.S. federal securities laws and the corporate governance rules of the NYSE.
Code of conduct
In February 2011, our board adopted a Code of Conduct, which sets forth the standards of behavior expected of each of our employees, officers, directors and agents. The Code of Conduct describedescribes the responsibility of our employees, officers, directors and agents to:
Protect our assets and customer assets;
Foster a safe and healthy work environment;
Deal fairly with customers and other third parties;
Conduct international business properly;
Report misconduct; and
Protect employees from retaliation.
Employees, officers and directors are required to certify annually that they have read, understand and will comply with this Code of Conduct.
Corporate governance guidelines
Our board of directors has adopted corporate governance guidelines in accordance with the corporate governance rules of the NYSE.
Executive compensation and other information
Compensation discussion and analysis
This compensation discussion and analysis, or CD&A, provides information about our compensation objectives and policies for the executives who served as our principal executive officer, our principal financial officer and our other three most highly-compensated executive officers during fiscal year 2011, and is intended to place in perspective the information contained in the executive compensation tables that follow this discussion. This CD&A provides a general description of our compensation program and specific information about its various components.
Throughout this discussion, the following individuals are referred to as the “Named Executive Officers” or “NEOs” and are included in the Summary Compensation Table:
C. Christopher Gaut—President, Chief Executive Officer and Chairman of the Board
James W. Harris—Senior Vice President and Chief Financial Officer
Charles E. Jones—Executive Vice President; President, Drilling and Subsea
Wendell R. Brooks—Executive Vice President; President, Production and Infrastructure
James L. McCulloch—Senior Vice President, General Counsel and Secretary
Although this CD&A focuses on the information in the following tables and related footnotes, as well as the supplemental narratives relating to the last completed fiscal year, we also describe compensation actions taken before or after the last completed fiscal year to the extent such discussion enhances the understanding of our executive compensation disclosure. Contemporaneous with this offering, we will make adjustments to our compensatory practices to be utilized in 2012 and later years that we believe will be more appropriate for a company with public stockholders. This CD&A discusses the compensatory practices in place during 2011 and highlights changes we will implement upon the consummation of this offering.
Historical note: the Combination
With the exception of Messrs. Gaut and McCulloch, each of our NEOs was, prior to the Combination, an executive of a company that participated in the Combination. Messrs. Jones and Harris were, respectively, President, and Senior Vice President and Chief Financial Officer, of FOT; and Mr. Brooks was President of Allied. Mr. Gaut was a director of FOT. Each of those executives was granted an employment agreement with us as of August 2, 2010. Mr. McCulloch was granted an employment agreement with us as of October 25, 2010, the date of his employment. Each NEO who was an executive of a company that participated in the Combination maintained his prior base compensation notwithstanding any change in title or duties. The base compensation for Messrs. Gaut and McCulloch was determined by our board of directors in a manner consistent with the compensation philosophy described in this prospectus.
Executives’ personal net worth at risk
Following the Combination, each NEO was given the opportunity to invest a portion of his personal net worth in shares of our common stock, in contrast to the practice at most companies of simply granting equity awards as compensation. As a group, our NEOs invested over $6.8 million of their personal assets in shares of our common stock, providing a direct stake in our future prospects. We believe that these personal investments align the interest of our NEOs with those of our stockholders in a meaningful way, and provide a true risk/reward balance.
Elements of our executive compensation program
Our compensation and benefits programs have historically consisted of the following components, which are described in greater detail below:
Base salary;
Annual cash bonus awards;
Long-term equity-based incentives; and
401(k) and health benefits.
Key components of our compensation philosophy
Our overall compensation philosophy is to provide competitive pay to our executives that rewards strong corporate performance. Our philosophy with respect to cash compensation is that target total cash should be at or near the market median. Base salaries will typically be set slightly below the market median while our annual incentive award targets are designed to be slightly above the market median. The result of this design is the opportunity for our executives to earn cash compensation at or near the market median in a year where our performance has met our target goals. We believe that this philosophy provides a strong link for our executives to short termannual corporate goals and we expect to continue to design our cash compensation elements post-offering in a similar fashion.
While we have not established strict guidelines for our grants of equity awards following the consummation of this offering, it is and will be our philosophy that long-term compensation should account for a significant portion of total direct compensation. For this reason we expect to make annual grants of equity-based awards to the executives, while placing long-term restrictions on the awards. Our objective is to be a high growth, high performing oilfield services company and we want to link a significant portion of our executives’ compensation to the long-term interests of our stockholders. To implement this strong link to our executives’ total compensation potential, we anticipate that the capital accumulation opportunities resulting from our long-term grants will be at or above the market median and will represent a significant portion of total compensation to each NEO.
Overall, our compensation program will be designed to pay our executives near the market median in a target performance year and reward them with higher than median total compensation in years of superior performance relative to our internal performance metrics and our direct competitors. This compensation philosophy will allow us to attract and retain executives who will be committed to our strategic corporate plan.
Role of the compensation committee in setting compensation
Our board of directors established a Nominating, Governance and Compensation Committee in February 2011, which performs substantially similar functions to the compensation committee and nominating and corporate governance committee of a public company. The Nominating, Governance and Compensation Committee is generally responsible for designing, implementing, and administering our executive compensation programs and, in doing so, the Nominating, Governance and Compensation Committee is guided by the compensation philosophy stated above. References to “the Committee” within this CD&A refer to the Nominating, Governance and Compensation Committee.
On an annual basis the Committee will review and approve total compensation and the process will include:
Selecting and engaging an external, independent consultant;
Reviewing and selecting companies to be included in our peer group;
Reviewing market data on all major elements of executive compensation; and
Reviewing performance results against operating plans and incentive plan targets.
A complete listing of our Committee’s responsibilities is included in the committee charter which will be available for view on our corporate website.
Role of management in setting compensation
Our Chief Executive Officer (“CEO”) will beis involved in recommending the compensation of our executive officers, excluding his own compensation which will be discussed and determined in executive sessions of the Committee.compensation. Each year the CEO will makemakes recommendations to the Committee regarding such components as salary adjustments, target annual incentive opportunities, and the value of long-term incentive awards. In making his recommendations, the CEO will considerconsiders such components as experience level, individual performance, overall contribution to company performance, and market data for similar positions. The Committee will taketakes the CEO’s recommendations under advisement, but the Committee will makemakes all final decisions regarding executive officer compensation other than with respect to the CEO. Our CEO’s compensation is reviewed and discussed by the Committee, who then makes recommendations regarding his compensation to our board of directors. Our board of directors ultimately makes decisions regarding the CEO’s compensation.
Our CEO will attendattends Committee meetings as necessary. He will excuseexcuses himself from any meeting when the Committee deems it advisable to meet in executive session or when the Committee meets to discuss and make determinationsitems which would directly or indirectly impact the CEO’s compensation. The Committee may also consult other employees, including the remaining NEOs,Named Executive Officers, when making compensation decisions, but the Committee will beis under no obligation to involve the NEOsNamed Executive Officers in its decision making process.
Role of the compensation consultant in setting compensation
The Committee has engaged the services of Pearl Meyer & Partners (“PM&P”) as its independent executive compensation consultant. PM&P’s current role is to advise the Committee on matters relating to executive compensation to help guide, develop, and implement our executive compensation programs. PM&P does not report directly to management and any requests management may have of PM&P throughout the course of its engagement will be approved by the Committee before any work is undertaken. PM&P may perform work for the Company outside of the scope of its engagement by the Committee, such as compensation surveys, but the Committee will review and approve all such assignments in order to ensure that the independence of its compensation consultant is not compromised.
Comparator compensation peer group
We have developed a comparator peer group which is composed of specific peer companies within the energy industry. Our peer group was developed with the assistance of PM&P and used to analyze our NEO compensation in May and August 2011. This peer group will be used to determine direct market levels of the main elements of executive compensation (base salary, annual incentives, long-term incentives, as well as total direct compensation). The peer group will
also be used to gauge industry practices regarding the structure and mechanics of annual and long-term incentive plans, employment agreements, severance and change in control policies, and employee benefits. We intend to utilize and maintain a peer group going forward. The composition of the peer group will be reviewed by the Committee on an annual basis to ensure that we have and maintain an appropriate group of comparator companies. Certain changes to the peer group were made with respect to the 2012 year, as discussed in greater detail below.
Criteria for selecting peer companies for compensation benchmarking is based on a number of factors. The peer companies selected should reflect an optimum mix of the following criteria listed below in their relative order of importance:
Competitive market:
Competing Talent—companies with executive talent similar to that valued by us;
Direct Competitors—in same or similar industry sector for products or services; and
Competing Industry—companies in the same general industry sector having similar talent pools.
Size and demographics:
Firms with competitive posture that are generally similar in revenue or market cap size;
Firms as described above which are significantly larger or smaller but whose data can be statistically normalized in the analysis;
Firms with a competitive posture and comparable area of operations;
Firms in the same or similar competitive posture that experience similar market cycles; and
Firms that serve the same sector of the industry.
Investor perspective:
Firms that analysts would track similarly or look at as similar investment opportunities.
The initial comparator peer group approved by the Committee in 2011 includes the following 16 companies (table includes company name and ticker symbol):
BAS | Basic Energy Services, Inc. | LUFK | Lufkin Industries, Inc. | |||
CAM | Cameron International Corporation | NR | Newpark Resources, Inc. | |||
CPX | Complete Production Services, Inc. | OII | Oceaneering International, Inc. | |||
DRC | Dresser-Rand Group Inc. | OIS | Oil States International, Inc. | |||
DRQ | Dril-Quip, Inc. | RBN | Robbins & Myers, Inc. | |||
EXH | Exterran Holdings, Inc. | TISI | Team, Inc. | |||
FTI | FMC Technologies, Inc. | TESO | Tesco Corporation | |||
KEG | Key Energy Services, Inc. | TTI | TETRA Technologies, Inc. | |||
| ||||||
A different peer group may be utilized in the future to track performance. The performance peer group will be a more selective group of our direct competitors and may be utilized for tracking performance tied to long-term incentive awards.
Role of market data
PM&P uses compensation data gathered from the peer group as well as supplemental data from published market surveys to benchmark our executive compensation. The supplemental survey data will allow the Committee to consider compensation levels through the broader energy industry compared to the oilfield services focused data of the peer group. Survey data also provides market norms for executive positions which may not be reported as named executive officers in the peer group data. The Committee will periodically commission PM&P to conduct a market-based compensation study. The first such study was completed in May 2011. Additional details on the findings of the PM&P 2011 study are included below under “—Findings of recent compensation study.”
Elements of compensation for our named executive officers
Base salary. Base salary is the fixed annual compensation we pay to each Named Executive Officer for performing specific job responsibilities, experience and requisite skills. It represents the minimum income a Named Executive Officer may receive in any year. Base salaries are determined for each Named Executive Officer based on the executive’s position and responsibility. We review the base salaries for each Named Executive Officer annually as well as at the time of any promotion or significant change in job responsibilities, and in connection with each review we consider individual and company performance over the course of that year. The employment agreements we maintain with the Named Executive Officers (described in greater detail below) provide that base salaries will generally not be reduced during the annual review unless the decrease is in connection with a similar reduction applicable to all of our executive officers, and if so, the decrease could be a reduction of up to 10% of the executive’s base salary.
The table below sets out the annual base salaries of our NEOs in 2010 and 2011. In August 2011 the Committee reviewed the executive compensation report provided by PM&P and found our base salaries, except for those of Mr. Harris and Mr. McCulloch, to be within the middle range of the market. Effective August 29, 2011 the salaries of both Mr. Harris and Mr. McCulloch were increased by $25,000 per year, bringing them into the middle range of the market. Base salaries will be reviewed on an annual basis and we will consider adjustments again in the first quarter of 2012.
| 2010 Annual base salary | 2011 Annual base salary | Percentage increase | ||||||||||
| ||||||||||||
C. Christopher Gaut | $ | 625,000 | $ | 625,000 | 0% | |||||||
James W. Harris | $ | 300,000 | $ | 325,000 | 8.3% | |||||||
Charles E. Jones | $ | 475,000 | $ | 475,000 | 0% | |||||||
Wendell R. Brooks | $ | 375,000 | $ | 375,000 | 0% | |||||||
James L. McCulloch | $ | 285,000 | $ | 310,000 | 8.8% | |||||||
| ||||||||||||
Bonuses and annual incentive awards. Our annual incentive awards for 2011 will be formulaic and performance based. Our payouts will be expressed as a percentage of an executive’s base salary as laid out in the table below. Each year the Committee will review bonus targets as well as target and actual total cash compensation paid to the named executive officers of our peer group to gauge the competitive level of our targets and ultimate payouts. Below we have highlighted our annual incentive plan effective in 2011.
2011
Our 2011 Management Incentive Plan (the “MIP”), which was approved and adopted by our board of directors in February 2011, is designed to incentivize and reward key executives who have a significant impact on our achievement of overall corporate performance goals. The Committee approved NEO participants and their target bonus levels for the MIP and will continue to do so orfor future plans.
The following table sets out the current NEO target and maximum bonus levels for 2011 expressed as a percentage of annual base salary:
| Executive | Target bonus (% of base) | Maximum bonus (% of base) | ||
| ||||
C. Christopher Gaut | 125% | 250% | ||
James W. Harris | 80% | 160% | ||
Charles E. Jones | 100% | 200% | ||
Wendell R. Brooks | 100% | 200% | ||
James L. McCulloch | 80% | 160% | ||
| ||||
MIP payout curve
The MIP has a built in threshold such that zero bonus is paid if we achieve anything less than 75% of the established performance goals for the year. When actual performance is 125% or greater than the target performance level, referred to as “Over-Achievement,“over-achievement,” the participant is eligible to receive an amount of up to two times (2X) the target award.
MIP performance metrics
Under the MIP, performance is measured in terms of operating income and earnings per share. For our Named Executive Officers,Messrs. Gaut, Harris and McCulloch, operating income accountsaccounted for two-thirds (66.67%) of an award while earnings per share accountsaccounted for the other one-third (33.33%). For Messrs. Jones and Brooks, operating income of our company as a whole accounted for 37.5% of their potential award, operating income of their respective division accounted for 50.0%, and earnings per share
of the Company accounted for 12.5%. MIP performance targets arewere developed by management and recommended to the Committee, which will makemade the final determination of performance targets. Our 2011 performance targets were originally set in
accordance with our 2011 operating plan, butand were later adjusted for the 2011 Acquisitions, and will be subject to final adjustment when the assessment of consideration allocation is finalized. The targets will be similarly adjusted for any additional acquisitions completed during the calendar year.Acquisitions. As mentioned in our compensation philosophy above, we have set our bonus payout targets for the 2011 year at a level that is slightly above the market median. Our cash compensation policy provides that we pay slightly below median base salaries and utilize bonus targets slightly above median to allow our executives the opportunity to earn median or above total cash compensation, but only when our corporate performance is at target levels or above. At the time of this filing, we do not have our financial results for 2011 that are necessary to determine the actual payouts due to our Named Executive Officers, but we believe that our program motivates our NEOs to support our high growth objectives.
Long-term equity based incentives and adjustment of certain pre-combination equity awards
The pre-Combination companies historically granted equity awards to our NEOs (other than Messrs. Gaut and McCulloch, who were not employed by any such company prior to the Combination), and we expect to do so in the future through our Forum Energy Technologies, Inc. 2010 Stock Incentive Plan (the “2010 Plan”). We believe that long-term equity awards are the strongest link between executive pay and stockholder interests.
Prior to the Combination, Allied maintained the Allied Production Services, Inc. 2007 Long Term Incentive Plan, Global Flow maintained the Global Flow Technologies, Inc. 2005 Stock Incentive Plan, and Subsea maintained the Subsea Services International, Inc. 2007 Stock Incentive Plan (each, a “Pre-Combination Equity Plan”). Certain of our Named Executive Officers held equity-based awards under a Pre-Combination Equity Plan that were based on the underlying securities of their previous employing entities, whose common stock was exchanged for our common stock in connection with the Combination. In connection with the Combination, each stock option and restricted stock award outstanding under a Pre-Combination Equity Plan (including each stock option and restricted stock award held by certain of our Named Executive Officers) was converted into an award with respect to our common stock based on the exchange ratio utilized in the Combination for purposes of our acquisition of the corporate sponsor of such plan. Restricted stock awards outstanding under a Pre-Combination Equity Plan were converted into restricted shares of our common stock by multiplying the number of restricted shares still subject to the original award by the applicable exchange ratio. At the time of the Combination, both vested and unvested stock options outstanding under a Pre-Combination Equity Plan were converted into an option to acquire the number of shares of our common stock that resulted from multiplying the applicable exchange ratio by the number of shares still subject to the original award. The exercise price under each stock option was adjusted by dividing the exercise price of the original underlying stock option award by the same exchange ratio applicable to the adjustment utilized for determining the number of converted shares. The exchange ratios for our common stock used in connection with the Combination were as follows: (1) for Allied, 0.4623; (2) for Global Flow, 0.9886; and (3) for Subsea, 0.3168. The material terms of the restricted stock and stock option awards granted under a Pre-Combination Equity Plan that were converted in connection with the Combination, such as vesting or expiration schedules, remained unchanged following the Combination. In addition, at the effective time of the Combination, we assumed each Pre-Combination Equity Plan, with the result that all obligations under each such plan became our obligations.
On a going forward basis, we plan for long-term equity grants to be a significant portion of our NEO total compensation. We granted options to our NEOs in 2010 in conjunction with the Combination, and in Mr. McCulloch’s case at the time of his initial employment with us, and we
expect to continue to grant options in the future. Options are inherently performance based and we believe provide a strong link between our executives’ and stockholders’ long-term interests. We may grant restricted stock to balance the compensation risk associated with options and to provide value in equity which is tied to retention by placing a vesting requirement on the restricted stock grants. Another reason we may grant restricted stock is to conserve our share pool. Fewer full value shares are required to deliver a targeted equity value than would be required if the grant were made in options alone. We may also consider adding performance based awards to the mix of equity granted to our NEOs and may adopt a program for doing so in the future. We have not yet formally established a mix of equity vehicles (i.e., the percentages of each year’s grant made up of options, restricted stock and possibly performance based shares) but plan to do so in the future to provide a balanced approach which considers the motivation of our executives, the interests of our stockholders, as well as the practices common within our peer group.
We granted a significant amount of equity-based awards in connection with the Combination and, as a result, we determined that the payment of additional grants to our NEOs during the 2011 year was not warranted; however, we anticipate that our future grants of long-term incentives will occur annually. Future grant levels will be determined by the Committee. The Committee will consider input from management and will seek the guidance of its compensation consultant in an effort to make competitive grants to each NEO.
For more information about our 2010 Plan, please see “—2010 Stock incentive plan” below.
Employee benefits
Our 401(k) Plan is designed to allow all employees, including the participating NEOs,Named Executive Officers, to contribute on a pre-tax basis. Contributions to the 401(k) Plan are not taxable to employees until withdrawn from the 401(k) Plan. Each participant may elect to contribute up to 75% of his pre-tax compensation to the 401(k) Plan as pre-tax contributions (but limited by the statutory maximum of $16,500 for 2011). Additionally, participants age 50 years and older may make a “catch-up contribution” to the 401(k) Plan each year up to an amount set by statute ($5,500 for 2011). We currently match 100% of participant contributions up to 3% of compensation, and we match 50% of any additional contributions up to 5% of compensation, for a total potential matching contribution of 4% of compensation. We also have the discretion to provide a profit sharing contribution to each participant depending on our company’s performance for the applicable year. Because of the statutory limits on amounts contributed to qualified plans, our NEOsNamed Executive Officers generally do not receive the full potential matching contribution under the 401(k) Plan.
We also provide medical, dental and vision coverage to all our employees, as well as basic life and disability coverage.
Employment agreements
We believe that it is important to formally document the employment relationship that we have agreed to maintain with our Named Executive Officers in the form of employment agreements. We entered into employment agreements with each of the Named Executive Officers, except for Mr. McCulloch, effective August 2, 2010. We also entered into an employment agreement with
Mr. McCulloch, effective October 25, 2010. These employment agreements are designed to
provide an individual with an understanding of how the employment relationship may be extended or terminated, the compensation and benefits that we provide during the term of employment and the obligations each party has in the event of termination of the officer’s employment.
We believe that severance protections, particularly in the context of a change in control transaction, play a critical role in attracting and retaining key executive officers. Providing this type of protection is common in the oilfield services industry. In addition, these benefits serve our interests by promoting a continuity of management in the context of an actual or threatened change in control transaction.
The material terms of these agreements are set forth below under “Summary compensation table” and “Grants of plan-based awards for 2010.2011.” The severance provisions within the employment agreements are set forth in detail in “Potential payments upon termination and change in control” below.
Change in control arrangements
The individual equity award agreements that govern the stock option and restricted stock awards under the 2010 Plan currently contain certain change in control protections for the NEOs, described in greater detail in the “Potential payments upon termination and change in control” section below. We provide such protections because we believe that the occurrence, or potential occurrence, of a change in control transaction will create uncertainty regarding the continued employment of our executive officers. By having certain change in control related benefits in place, we alleviate the uncertainty and put our executives in a position to make decisions in the best interest of our stockholders.
Perquisites
We do not provide for any perquisites or any other personal benefits for our executive officers that are not available to other employees.
Findings of recent compensation study
During 2011 PM&P conducted an independent review of all our executives’ compensation and presented the findings of the review to the Committee. Our peer group plus PM&P’s database were used to assess all three elements of pay: base, annual bonus and long-term compensation.
Regarding base pay, with the exception of the base salary in force from the pre-Combination company role for one of the NEOs, the average base pay levels for the NEOs, including the CEO, was slightly above the 25th percentile of the market (actually 29th percentile for the NEOs – and 34th percentile for entire officer group other than Mr. Jones).
Bonus opportunity levels provided by our annual bonus plan were slightly above market median levels. This finding supports our philosophy that variable, at-risk pay presents our executives with the opportunity to earn market median or higher total cash in superior performance years. We have implemented formal performance measures for funding and payout of the MIP.
Long-term incentive awards were also analyzed by PM&P and were assessed as middle of the market relative to annual grants made by our peer group. The initial equity awards were at or below median when compared to typical awards to a management team at a new company and management team.company.
Executive compensation mix
The charts below set out our current pay mix for our CEO and other NEOs collectively based on 2011 annual base salary and the target bonus for 2011. Although it is our philosophy that equity based awards should account for a significant portion of total direct compensation, given the significant equity grants made at the end of 2010, we willdid not make further equity grants to our NEOs with respect to the 2011 year.in 2011.

2011 compensation decisions
Base salary
With the exception of Messrs. Gaut and McCulloch, each of the NEOs was employed prior to the Combination by a company that participated in the Combination. Each of those NEOs had his previous salary continue at the same level following the Combination, although in some cases the individual no longer held the same position in the combined company that he previously held in the pre-Combination company. In the case of Mr. Gaut, his salary was determined by our board of directors consistent with the compensation philosophy set forth herein. As previously discussed, changes were made during the 2011 year solely with respect to Messrs. Harris and McCulloch, to bring them closer tointo the middle range of our market.
Annual bonus payments for fiscal year 2011
As described in greater detail above, awards under our MIP with respect to the 2011 calendar year will bewere determined following an analysis of our financial results for the 2011 year. We expect thatOur Committee recommended the 2011 MIP payments, if any, will be calculated and paidbonus payout for Mr. Gaut to the participants priorboard of directors, who approved the payment, and approved the payout for each of our other Named Executive Officers in February 2012.
| Executive | 2011 MIP Payment ($) | 2011 Payment as % of Base Salary | ||||||
| ||||||||
C. Christopher Gaut | 1,397,834 | 224% | ||||||
James W. Harris | 441,343 | 136% | ||||||
Charles E. Jones | 803,463 | 169% | ||||||
Wendell R. Brooks | 705,563 | 188% | ||||||
James L. McCulloch | 419,872 | 136% | ||||||
| ||||||||
The 2011 MIP comprised two financial measures for Messrs. Gaut, Harris and McCulloch: operating income and pre-tax earnings per share. The target performance measure for operating income was $150,000,000, and the Company achieved segment operating income of $175,687,000, or 117.1% of target. The pre-tax earnings per share target measure was $64.73,
and the Company achieved $85.56 per share, or 132% of target. For Messrs. Jones and Brooks, the 2011 MIP comprised three performance measures: operating income and pre-tax earnings per share for the Company as a whole, as set forth above, and operating income for their respective divisions. The operating income target for Mr. Jones’ division was $102,103,000, and his division achieved $117,927,000, or 115.5% of target. The operating income target for Mr. Brooks’ division was $60,681,000, and his division achieved $77,997,000, or 128.5% of target. In accordance with the terms of the MIP, each performance measure was adjusted as necessary for acquisitions consummated during the year. The achievement of financial measures for each executive resulted in the payments set forth above, and no discretionary adjustments were made thereto by the Committee.
2011 equity grants
Certain of our Named Executive Officers held equity-based awards that were granted under equity plans in effect prior to the Combination and, after the Combination, such awards
continued to be outstanding and remained subject to the terms of the applicable plan and award agreement. Mr. Gaut’s employment agreement, which was entered into when he was hired as our CEO in August 2010, provided him with a new stock option grant under the 2010 Plan covering 61,557 shares of our common stock at an exercise price of $284.29 per share. This was awarded to him in connection with the closing of the Combination and was conditioned upon Mr. Gaut investing $3.5 million of his personal net worth in the Company. Our other NEOs also received grants in 2010 which we believe provided the NEOs with a significant stake in our Company, and aligned their interests with those of our shareholders. Due to the value of the 2010 grants, weWe did not make additional grants during the 2011 calendar year.
2010 Stock incentive plan
Objective
In connection with the Combination, we adopted an amendment and restatement of the Forum Oilfield Technologies, Inc. 2005 Stock Incentive Plan, as amended (prior to such amendment and restatement, the “Prior Plan”), which changed, among other things, the name of the plan to the Forum Energy Technologies, Inc. 2010 Stock Incentive Plan. The 2010 Plan provides us with the flexibility to make grants of options, restricted stock awards, performance awards, phantom stock awards, stock appreciation rights and bonus stock awards to our employees, consultants and directors serving on our board of directors.
Eligibility
Employees, consultants and members of our board of directors are eligible for awards under the 2010 Plan. The Committee will select the participants from time to time for the grants of awards.
Administration
The 2010 Plan will be administered by the Committee. The Committee will have the authority to select participants and to determine the terms and conditions of awards. The Committee will have the power to construe the 2010 Plan, adopt rules and regulations for administering the 2010 Plan and to make all other determinations necessary or advisable for administering the 2010 Plan. Any decisions of the Committee will be conclusive. The Committee will have the ability to delegate certain of its authority as provided under the 2010 Plan. Subject to the consent of the
employee, consultant or director who has been granted an award, the Committee will be authorized to amend outstanding award agreements from time to time in any manner not inconsistent with the terms of the 2010 Plan.
Shares available for awards
Pursuant to the 2010 Plan, the aggregate maximum number of shares of our common stock that may be issued under the 2010 Plan, and the aggregate maximum number of shares of our common stock that may be issued under the 2010 Plan through incentive stock options, will not exceed 400,000 shares (inclusive of the shares subject to outstanding awards granted under and the shares that remained available under the Prior Plan). To the extent that an award terminates or is forfeited, any shares of our common stock subject to such award will again be available for the grant of an award under the 2010 Plan. In addition, shares surrendered in payment of the exercise price or purchase price of an award, and shares withheld for payment of applicable
employment taxes and/or withholding obligations associated with an award will again be available for the grant of an award under the 2010 Plan. Any shares of our common stock delivered pursuant to an award may consist, in whole or in part, of authorized and unissued shares or (where permitted by applicable law) previously issued shares of our common stock that have been reacquired. Further, the following limitations apply with respect to awards granted under the Plan:
the maximum number of shares of our common stock that may be subject to awards denominated in shares of our common stock granted to any one individual during the term of the 2010 Plan may not exceed 50% of the aggregate maximum number of shares of our common stock that may be issued under the 2010 Plan; and
the maximum amount of compensation that may be paid under all performance awards denominated in cash (including the fair market value of any shares of our common stock paid in satisfaction of such performance awards) granted to any one individual during any calendar year may not exceed $20,000,000 and any payment due with respect to a performance award must be paid no later than 10 years after the date of the grant of the award.
The 2010 Plan provides that if we effect a subdivision or consolidation, or a payment of a stock dividend without receipt of consideration, on the shares of our common stock, the number of shares subject to the award, and the purchase price thereunder (if applicable) are proportionately adjusted. If we recapitalize, reclassify or otherwise change our capital structure, outstanding awards will be adjusted so that the award will thereafter cover the number and class of shares to which the holder would have been entitled if he had been the holder of record of the shares covered by such award immediately prior to the recapitalization, reclassification or other change in our capital structure. Further, the aggregate number of shares available under the 2010 Plan and the individual award limitations described above may also be appropriately adjusted by the Committee.
Awards
At the discretion of the Committee, awards under the 2010 Plan may be made in the forms described below. Each award will be evidenced by an award agreement setting out the specific terms and conditions applicable to the award.
Options. The 2010 Plan provides for two types of options: incentive stock options and non-statutory stock options. Incentive stock options may only be awarded to individuals who are employed by us or one of our subsidiaries at the time of grant. The Committee will determine the purchase price per share of our common stock subject to an option; however, the purchase price will not be less than the fair market value of a share of our common stock on the date of the grant of such option. The purchase price will be paid in the manner prescribed by the Committee. The Committee will also determine the term of each option (up to a maximum term of 10 years), the time at which an option may be exercised and the method by which payment of the purchase price may be made. Option awards may include the right to surrender the optioned shares in exchange for a payment in the amount of the fair market value of the shares for which the option is surrendered over the exercise price for such shares (a “stock appreciation right”). The term of each stock appreciation right may not exceed 10 years from the date of grant.
Restricted Stock Awards. Pursuant to a restricted stock award, shares of our common stock will be issued or delivered to the participant, subject to certain restrictions on the disposition thereof
and certain obligations to forfeit the shares to us as may be determined in the discretion of the Committee. The restrictions on disposition and the forfeiture restrictions for a restricted stock award may lapse upon the satisfaction of one or more of the performance criteria set forth in the 2010 Plan and determined by the Committee (which are listed below under “—Performance awards”), the holder’s continued employment or service to us over a specified period of time, the occurrence of any event or the satisfaction of any other condition specified by the Committee, or any combination of the foregoing factors.
The participant may not sell, transfer, pledge, exchange, hypothecate, or otherwise dispose of the shares until the expiration of the restriction period. However, upon the issuance of shares of our common stock pursuant to a restricted stock award, except as otherwise determined by the Committee, the holder will have all the rights of a holder of our common stock with respect to the shares, including the right to vote the shares and to receive all dividends and other distributions paid with respect to the shares.
Performance awards. For performance awards granted under the 2010 Plan, the Committee will establish the maximum number of shares of common stock subject to, or the maximum value of, each performance award and the performance period over which the performance applicable to the award will be measured. The performance measures to which a performance award are subject will be determined by the Committee and will be based on one or more of the following performance measures: (a) the price of a share of our common stock, (b) our earnings per share, (c) our market share, (d) the market share of one of our business units designated by the Committee, (e) our sales, (f) the sales of one of our business units designated by the Committee, (g) our or any business unit’s operating income or operating income margin, as designated by the Committee, (h) our or any business unit’s net income or net income margin (before or after taxes), as designated by the Committee, (i) our or any business unit’s cash flow or return on investment, as designated by the Committee, (j) our or any business unit’s earnings or earnings margin before or after interest, taxes, depreciation, and/or amortization, as designated by the Committee, (k) the economic value added, (l) our return on capital, assets or stockholders’ equity, (m) our total stockholders’ return or (n) any combination of the foregoing.
Payment of a performance award may be made in cash, shares of our common stock or a combination thereof, as determined by the Committee.
Phantom stock. The Committee will be authorized to grant phantom stock awards under the 2010 Plan. These are awards of rights to receive (including restricted stock units which give a participant the right to receive) shares of our common stock (or the fair market value thereof), or rights to receive amounts equal to share appreciation over a specific period of time. These awards vest over a period of time to be established by the Committee, without satisfaction of any performance criteria or objectives. The Committee may, in its discretion, require payment or other conditions of the recipient of a phantom stock award. A phantom stock award may include a stock appreciation right that is granted independently of a stock option. Payment of a phantom stock award may be made in cash, shares of our common stock, or a combination thereof.
Bonus stock awards. The Committee will also be authorized to grant bonus stock awards under the 2010 Plan. Bonus stock awards are unrestricted shares of our common stock that are subject to such terms and conditions as the Committee may determine and they need not be subject to performance criteria or objectives or to forfeiture.
Corporate change
The 2010 Plan provides that, upon a Corporate Change (as defined below), the Committee may accelerate the vesting and exercise date of options and stock appreciation rights, cancel options and stock appreciation rights and cause us to make payments in respect thereof in cash or adjust the outstanding options and stock appreciation rights as appropriate to reflect the Corporate Change. Upon the occurrence of a Corporate Change, the Committee may fully vest any restricted stock awards then outstanding and, upon such vesting, all restrictions applicable to the restricted stock will terminate. The 2010 Plan provides that a Corporate Change occurs if:
we are dissolved and liquidated;
we are not the surviving entity in any merger, consolidation or reorganization (or survive only as a subsidiary of an entity);
we sell, lease or exchange or agree to sell, lease or exchange all or substantially all of our assets;
any person, entity or group acquires or gains ownership or control of more than 50% of the outstanding shares of our voting stock; or
after a contested election of directors, the persons who were directors before such election cease to constitute a majority of our board of directors.
Transferability of awards
Generally, awards granted under the 2010 Plan may not be transferred other than (i) by will or the laws of descent and distribution, (ii) pursuant to a qualified domestic relations order as defined by the Code or Title I of the Employee Retirement Income Security Act of 1974, as amended or (iii) with the consent of the Committee. Each incentive stock option is not transferable other than by will or the laws of descent and distribution and is exercisable during the holder’s lifetime only by the holder or the holder’s guardian or legal representative.
Amendment and termination of 2010 Plan
Our board of directors, in its discretion, may terminate the 2010 Plan at any time with respect to any shares of our common stock for which awards have not been granted. Our board of directors also has the right to alter or amend the 2010 Plan or any part thereof from time to time; provided that no change in the 2010 Plan may be made that would materially impair the rights of a participant without the consent of the participant. In addition, our board of directors may not, without approval of our stockholders, amend the 2010 Plan to increase the aggregate maximum number of shares our common stock that may be issued under the 2010 Plan, increase the aggregate maximum number of shares of our common stock that may be issued under the 2010 Plan through incentive stock options, change the class of individuals eligible to receive awards under the 2010 Plan or amend or delete the restrictions on the repricing of options.
Actions Taken After the 2011 Year
2012 Base Salaries and 2012 MIP
Our Committee approved the 2012 base salaries, and the 2012 MIP target bonus opportunities for each of our Named Executive Officers other than Mr. Gaut. Our board of directors approved Mr. Gaut’s base salary and MIP target bonus opportunity. Our Committee also approved the design of the 2012 MIP.
| Executive | 2012 Base Salary ($) | Increase % from 2011 Base Salary | Target bonus (% of base) | Maximum bonus (% of base) | ||||
C. Christopher Gaut | 625,000 | 0% | 125% | 250% | ||||
James W. Harris | 341,250 | 5.0% | 80% | 160% | ||||
Charles E. Jones | 475,000 | 0% | 100% | 200% | ||||
Wendell R. Brooks | 375,000 | 0% | 100% | 200% | ||||
James L. McCulloch | 320,500 | 3.39% | 80% | 160% |
2012 MIP payout curve
The 2012 MIP is designed similarly to the 2011 MIP in respect of the operating income measure, in that there is a threshold performance level, a target level and an over-achievement level. The 2012 MIP threshold level is 70%, the target level is set at 100%, while the over-achievement level is set at 120%. The bonus award will be a linear interpolation between those levels for actual performance, as shown below.
2012 MIP performance metrics
Performance for the 2012 MIP will vary from the 2011 MIP in that it will be measured in terms of operating income and a safety measure, instead of operating income and earnings per share. The Committee decided that maintaining operating income as a measure would align the interests of the executives with those of its shareholders. Safety is an overriding value of the Company.
The safety measure is based on the Total Recordable Incident Rate (“TRIR”), which is a measure of the recordable workplace injuries that occur during the year, calculated by multiplying the number of recordable injuries in a calendar year by 200,000 (100 employees working 2,000 hours per year), and dividing this value by the total man-hours actually worked in the year. For our Named Executive Officers, the operating income performance will account for 80% of the overall bonus potential while TRIR levels will account for 20% of the bonus potential. The operating income measure will be derived from the 2012 Financial Plan set by our board of directors, adjusted for acquisitions during the year.The safety measures have been designed in order to incentivize improvements in TRIR for the Company as a whole, for each division and for each product line. The targets for each product line were established with reference to past safety results and the average TRIR for the oil and gas manufacturing industry, as reported in 2010 by the U.S. Department of Labor. Threshold and over-achievement levels were set at points recommended by management in order to create stretch goals while at the same time maintaining the incentive of each product line throughout the year, and not as percentages of target TRIR. For Messrs. Gaut, Harris and McCulloch, TRIR performance for the Company as a whole accounts for 6.8% of their MIP target, and the performance of each product line accounts for 2.2%. For Messrs. Jones and Brooks, TRIR performance for the Company as a whole accounts for 6.8% of their MIP target, and the performance of each product line within their respective division accounts for 4.4%.
Employment Agreements
Our Committee has determined that certain amendments should be made to each of our Named Executive Officer’s employment agreements during the 2012 year (with the exception of Mr. Jones, whose employment agreement already contains the protections described below), and we are in the process of amending those agreements. After a thorough review of the potential change in control payments that our Named Executive Officers could receive pursuant to their employment agreements and equity compensation awards, the Committee recognized that the Named Executive Officers could be subject to significant excise taxes in the event that we consummated a change in control in the near future. In general, certain executive officers that receive payments that are contingent on a change in control can be subject to excise taxes in addition to the normal income taxes associated with that payment if the change in control-related payments exceed certain thresholds. Each executive’s threshold amount is based upon the compensation that the individual has received over the five year period prior to the change in control.
In view of the recent compensation history of each of our Named Executive Officers, including the fact that they have been limited in their ability to realize value from equity-based compensation awards due to the illiquid nature of the Company’s shares, but that such awards would be accelerated in the event of a change in control, it was apparent to the Committee, and in Mr. Gaut’s case to the board of directors, that excise taxes could offset a material amount of compensation in the event of a change in control. The Committee discussed this hypothetical situation with PM&P, and determined that it would be appropriate to remove any possible conflicts of interest that could exist between our Named Executive Officers and our stockholders in assessing any potential change in control transaction by providing the Named Executive Officers with limited tax protection for change in control-related payments. We have chosen to provide tax protections until December 31, 2014 because the equity awards that have been previously granted to our Named Executive Officers, as well as a sufficient number of equity awards that we have granted to them in connection with this offering, will become vested and/or exercisable during this period and will sufficiently increase each executive’s threshold compensation amount to alleviate the excise tax concern. All tax protections included in the Named Executive Officers’ employment agreements (with the exception of Mr. Jones, whose protection will continue) will thus sunset on December 31, 2014.
2012 Peer Group
The Committee, with the assistance of PM&P, reviewed our 2011 peer group in February 2012 to determine whether any changes should be made to the group for 2012. Our Committee determined that it was appropriate to revise our peer group to include only those companies more comparable to our revenue size. With respect to the 2012 compensation decisions, the peer group that the Committee and our board of directors will analyze will be composed of the following companies (tables includes company name and ticker symbol):
| ATW | Atwood Oceanics, Inc. | OII | Oceaneering International, Inc | |||
| BAS | Basic Energy Services, Inc. | OIS | Oil States International, Inc. | |||
| BRS | Bristow Group, Inc. | PKD | Parker Drilling Co. | |||
| CLB | Core Laboratories NV | PTEN | Patterson-UTI Energy, Inc. | |||
| DRC | Dresser-Rand Group Inc. | RBN | Robbins & Myers, Inc. | |||
| HLX | Helix Energy Solutions Group, Inc. | RDC | Rowan Companies, Inc. | |||
| KEG | Key Energy Services, Inc. | CKH | SEACOR Holdings Inc. | |||
| LUFK | Lufkin Industries, Inc. | TDW | Tidewater Inc. | |||
Other policies and practices
Clawbacks
Payments made under our incentive plans, as well as any other payments and benefits which an NEO receives pursuant to a company plan or other arrangement, shall be subject to a clawback to
the extent necessary to comply with the requirements of the Dodd-Frank Wall Street Reform and Consumer Protection Act or any other SEC guidelines. Our clawback policies will be reviewed annually.
Risk assessment
Our board of directors has reviewed our compensation policies as generally applicable to our employees and believes that our policies do not encourage excessive and unnecessary risk-taking, and that the level of risk that they do encourage is not reasonably likely to have a material adverse effect on us. In the future our Committee will perform this assessment and if a likelihood of a material risk exists, it will enlist additional resources for a full assessment.
Our compensation philosophy and culture support the use of base salary, certain performance-based compensation, and benefit plans that are generally uniform in design and operation throughout our organization and with all levels of employees. These compensation policies and practices are centrally designed and administered, and are substantially identical between our business segments. In addition, the following specific factors, in particular, reduce the likelihood of excessive risk-taking:
Our overall compensation levels are competitive with the market;
Our compensation mix is balanced among (i) fixed components like salary and benefits and (ii) annual incentives that reward our overall financial performance, business unit financial performance, operational measures and individual performance;
We intend to always have a strategic long-term plan;
Our annual corporate goals will be established with specific consideration given to behavioral risk;
We will implement appropriate performance measures each year, whether absolute or relative;
We have established maximum payouts to cap any performance incentives in place; and
We have clawback provisions built into the MIP.
In summary, although a portion of the compensation provided to Named Executive Officers is based on our performance or individual successes of the employee, we believe our compensation programs do not encourage excessive and unnecessary risk-taking by executive officers (or other employees) because these programs are designed to encourage employees to remain focused on both our short- and long-term operational and financial goals. We set performance goals that we believe are reasonable in light of our past performance and market conditions.
Accounting and tax considerations
Under Section 162(m) of the Internal Revenue Code of 1986, as amended (the “Code”), a limitation was placed on tax deductions of any publicly-held corporation for individual compensation to certain executives of such corporation exceeding $1,000,000 in any taxable year, unless the compensation is performance-based. An exception applies to this deductibility limitation for a limited period of time in the case of companies that become publicly-traded.
When Section 162(m) of the Code applies to us, we reserve the right to use our judgment to authorize compensation payments that do not comply with the exemptions in Section 162(m) of
the Code when we believe that such payments are appropriate and in the best interest of the stockholders, after taking into consideration changing business conditions or the executive’s individual performance and/or changes in specific job duties and responsibilities.
If an executive is entitled to nonqualified deferred compensation benefits that are subject to Section 409A of the Code, and such compensation does not comply with Section 409A of the Code, then the benefits are taxable in the first year they are not subject to a substantial risk of forfeiture and are subject to certain additional adverse tax consequences. We intend to design such arrangements to comply with (or be exempt from) Section 409A of the Code to the extent that the design is also appropriate for our business goals with respect to that arrangement.
All equity awards to our employees, including executive officers, and to our directors will be granted and reflected in our consolidated financial statements, based upon the applicable accounting guidance, at fair market value on the grant date in accordance with FASB Accounting Standards Codification, Topic 718, “Compensation—Stock compensation.”
Summary compensation table
The following table shows information concerning the annual compensation for services provided to us by our Named Executive Officers during the 2010 and 2011 fiscal years.
Summary compensation table
| Name and Principal Position | Year | Salary(1) | Bonus(2) | Stock Awards(3) | Option Awards(3) | Non-Equity Plan | All Other Compensation(4) | Total | Year | Salary ($) | Bonus ($) | Stock Awards ($)(1) | Option Awards ($)(1) | Non-Equity Incentive Plan Compensation ($)(2) | All Other Compensation ($)(3) | Total ($) | ||||||||||||||||||||||||||||||||
|
|
| ||||||||||||||||||||||||||||||||||||||||||||||
C. Christopher Gaut | 2011 | $ | 625,000 | $ | — | $ | — | | $ | — | $ | — | | $ | — | $ | 625,000 | 2011 | 625,000 | — | — | — | 1,397,834 | 14,700 | 2,037,534 | |||||||||||||||||||||||
Chief Executive Officer and Chairman of the Board | 2010 | $ | 252,404 | $ | 625,000 | $ | — | $ | 6,462,254 | $ | 320,182 | $ | 7,659,840 | 2010 | 252,404 | 625,000 | — | 6,462,254 | — | 320,182 | 7,659,840 | |||||||||||||||||||||||||||
James W. Harris | 2011 | $ | 307,692 | $ | — | $ | — | $ | — | | $ | — | | $ | — | $ | 307,692 | 2011 | 307,692 | — | — | — | 441,343 | 19,639 | 768,674 | |||||||||||||||||||||||
Sr. Vice President and Chief Financial Officer | 2010 | $ | 276,178 | $ | 234,203 | $ | 122,529 | $ | 689,614 | $ | 71,559 | $ | 1,394,083 | 2010 | 276,178 | 234,203 | 122,529 | 689,614 | — | 71,559 | 1,394,083 | |||||||||||||||||||||||||||
Charles E. Jones | 2011 | $ | 475,000 | $ | — | $ | — | $ | — | $ | — | $ | — | $ | 475,000 | 2011 | 475,000 | — | — | — | 801,563 | 23,237 | 1,299,800 | |||||||||||||||||||||||||
Executive Vice President; President—Drilling and Subsea | 2010 | $ | 475,000 | $ | 671,345 | $ | 749,957 | $ | 997,310 | $ | 10,917 | $ | 2,904,529 | 2010 | 475,000 | 671,345 | 749,957 | 997,310 | — | 10,917 | 2,904,529 | |||||||||||||||||||||||||||
Wendell R. Brooks | 2011 | $ | 375,000 | $ | — | $ | — | $ | — | $ | — | $ | — | $ | 375,000 | 2011 | 375,000 | — | — | — | 705,563 | 14,700 | 1,095,263 | |||||||||||||||||||||||||
Executive Vice President; President—Production & Infrastructure | 2010 | $ | 344,100 | $ | 397,708 | $ | — | $ | 734,860 |
| $ | 14,700 | $ | 1,491,368 | 2010 | 344,100 | 397,708 | — | 734,860 | — | 14,700 | 1,491,368 | ||||||||||||||||||||||||||
James L. McCulloch | 2011 | $ | 292,692 | $ | — | $ | — | $ | — | $ | — | $ | — | $ | 292,692 | 2011 | 292,692 | — | — | — | 419,872 | 12,250 | 724,814 | |||||||||||||||||||||||||
Sr. Vice President and Chief Financial Officer | 2010 | $ | 49,327 | $ | — | $ | 500,350 | $ | 618,180 | $ | — | $ | 1,167,857 | |||||||||||||||||||||||||||||||||||
Sr. Vice President, General Counsel and Secretary | 2010 | 49,327 | — | 500,350 | 618,180 | — | — | 1,167,857 | ||||||||||||||||||||||||||||||||||||||||
|
|
| ||||||||||||||||||||||||||||||||||||||||||||||
| (1) |
| We did not grant stock awards or option awards to our Named Executive Officers during the 2011 calendar year. The amounts disclosed in the |
| (3) | All amounts reflected in this column for 2011 represent contributions that we made to each Named Executive Officer’s 401(k) Plan |
Grants of plan-based awards for 2011
We did not grant any plan-based awards to our Named Executive Officers during the 2011 calendar year.
Employment agreements
In connection with the Combination, we entered into employment agreements with Messrs. Gaut, Harris, Jones and Brooks. We also entered into an employment agreement with Mr. McCulloch dated October 25, 2010.
The employment agreements we entered into with Messrs. Gaut, Harris, Jones, Brooks, and McCulloch are each dated effective as of August 2, 2010, except as noted above with respect to Mr. McCulloch, and they contain substantially similar provisions with the exception of the determination of the amount of the severance benefit described below under “Quantification of payments.” The initial term of each employment agreement will terminate on the second anniversary of its effective date, provided that commencing on such second anniversary, the term will be automatically extended for successive one-year periods unless either party gives 60-days
prior written notice of its intention to not renew the term of employment. The employment term can also be terminated at any time upon prior written notice by us or the executive. TheEach employment agreement provides that the annual base salary stated in each offor the agreements is as follows:executive will not be less than the following: Mr. Gaut, $625,000; Mr. Harris, $300,000; Mr. Jones, $475,000; Mr. Brooks, $375,000; and Mr. McCulloch, $285,000. Each executive will be eligible to participate in, and may be awarded an annual bonus under, our annual cash incentive bonus program if certain performance targets are met for the performance period, which is expected to be each calendar year. Mr. Gaut’s employment agreement also contains an additional provision that provided him with a one-time stock option grant in connection with the consummation of the Combination covering 61,557 shares of our common stock, which will vest in four equal installments on each year anniversary of the grant date. Mr. Jones’ employment agreement also included excise tax protection in the event of a change in control, as this provision was included in his prior agreement. Under each of the employment agreements, if the executive’s employment is terminated prior to the expiration of the term by the executive for good reason, by notice of non-renewal by us, or by our action for any reason other than the executive’s death or disability or for cause, subject to the executive’s execution and nonrevocation of a release within the period specified in the employment agreement, the executive will be entitled to receive certain severance payments and benefits from us. Please see the “Potential payments upon termination and change in control” section below for a more detailed description of the terms and payments provided under each of the employment agreements.
Outstanding equity awards at 2011 fiscal year end
The Named Executive Officers (other than Mr. McCulloch) held equity-based awards prior to the Combination. The pre-Combination equity awards that were issued to the Named Executive Officers by Allied, Global Flow and Subsea were adjusted and converted into awards that are now based on our common stock. Awards that were granted by FOT prior to the Combination
were not adjusted in connection with the Combination. The awards disclosed below reflect awards that were granted to the Named Executive Officers at their previous employing entities as well as awards that we granted to the Named Executive Officers under the 2010 Plan (including under the terms of such plan as it existed prior to its amendment and restatement as described above under “2010 Stock incentive plan”). Expiration dates are also shown for each individual award. Additionally, no performance-based equity grants have been made to the Named Executive Officers.
For a detailed explanation of the exchange ratios utilized for the conversion of equity-based awards in connection with the Combination, please see “Elements of compensation for our named executive officers—Long-term equity based incentives and adjustment of certain pre-combination equity awards.”
Outstanding equity awards as of December 31, 2011
| Number of securities underlying unexercised options | Number of securities underlying unexercised options | Option exercise price | Option expiration date | Number of shares of stock that have not vested | Market of stock have not | |||||||||||||||||||
| exercisable | unexercisable | |||||||||||||||||||||||
| ||||||||||||||||||||||||
C. Christopher Gaut | 15,390 | 46,167 | (2) | $ | 284.29 | 8/1/2020 | ||||||||||||||||||
| 49 | (3) | 29,400 | ||||||||||||||||||||||
| 156 | (4) | 93,600 | ||||||||||||||||||||||
James W. Harris | 263 | 87 | (5) | $ | 320 | 1/31/2012 | ||||||||||||||||||
| 425 | 425 | (6) | $ | 225 | 6/30/2014 | |||||||||||||||||||
| 1,500 | 4,500 | (2) | $ | 284.29 | 8/1/2020 | |||||||||||||||||||
| 143 | 426 | (7) | $ | 284.29 | 11/29/2020 | 323 | (8) | 193,800 | ||||||||||||||||
Charle E. Jones | 6,000 | 0 | $ | 300 | 9/29/2012 | |||||||||||||||||||
| 1,150 | 1,150 | (6) | $ | 225 | 6/30/2014 | |||||||||||||||||||
| 2,375 | 7,125 | (2) | $ | 284.29 | 8/1/2020 | |||||||||||||||||||
| 1,978 | (9) | 1,186,800 | ||||||||||||||||||||||
Wendell R. Brooks | 3,467 | 0 | $ | 216.31 | 9/30/2017 | |||||||||||||||||||
| 3,467 | 0 | $ | 216.31 | 10/21/2017 | ||||||||||||||||||||
| 347 | 115 | (10) | $ | 216.31 | 11/20/2018 | |||||||||||||||||||
| 173 | 173 | (11) | $ | 216.31 | 12/16/2019 | |||||||||||||||||||
| 1,750 | 5,250 | (2) | $ | 284.29 | 8/1/2020 | |||||||||||||||||||
James L. McCulloch | 1,500 | 4,500 | (12) | $ | 284.29 | 10/25/2020 | ||||||||||||||||||
| 1,320 | (13) | 749,760 | ||||||||||||||||||||||
| ||||||||||||||||||||||||
| (1) | Amounts in this column were calculated by assuming a market value of our common stock of $600.00 per share. |
| (2) | Options vest annually in equal installments over a three year period on each of August 2, 2012, 2013 and 2014. |
| (3) | Restricted stock vests 100% on July 28, 2012. |
| (4) | Restricted stock vests annually in equal installments over a two year period on each of September 15, 2012 and 2013. |
| (5) | Options vest 100% on February 1, 2012. |
| (6) | Options vest annually in equal installments over a two year period on each of July 1, 2012 and 2013. |
| (7) | Options vest annually in equal installments over a three year period on each of November 29, 2012, 2013 and 2014. |
| (8) | Restricted stock vests annually in equal installments over a three year period on each of November 29, 2012, 2013 and 2014. |
| (9) | Restricted stock vests annually in equal installments over a four year period on each of November 1, 2011, 2012, 2013 and 2014. |
| (10) | Options vest annually in equal installments over a two year period on each of November 21, 2012 and 2013. |
| (11) | Options vest annually in equal installments over a two year period on each of December 17, 2012 and 2013. |
| (12) | Options vest annually in equal installments over a three year period on each of October 25, 2012, 2013 and 2014. |
| (13) | Restricted stock vests annually in equal installments over a three year period on each of October 25, 2012, 2013 and 2014. |
Options exercised and stock vested in the 2011 fiscal year
None of the NEOs exercised a stock option award during 2011. Values shown in the table below were calculated by multiplying the number of shares of restricted stock that vested by the market value of our common stock on the date of vesting.
Stock vested for the year ended December 31, 2011
| Stock Awards | ||||||||
| Number of shares acquired on vesting | Value realized on vesting | |||||||
| ||||||||
C. Christopher Gaut | 628 | $ | 326,454 | |||||
James W. Harris | 108 | $ | 61,344 | |||||
Charles E. Jones | 3,888 | $ | 2,208,384 | |||||
Wendell R. Brooks | 939 | $ | 533,352 | |||||
James L. McCulloch | 440 | $ | 249,920 | |||||
| ||||||||
Pension benefits
We maintain a 401(k) Plan for our employees, including our Named Executive Officers, but at this time our Named Executive Officers do not participate in a pension plan.
Non-qualified deferred compensation
We do not provide our Named Executive Officers with a deferred compensation plan at this time.
Potential payments upon termination and change in control
The employment agreements we maintain with our Named Executive Officers will provide the executives with severance benefits upon certain terminations of employment, and the individual award agreements that govern our stock option and restricted stock awards under the 2010 Plan contain accelerated vesting provisions that will apply upon our Change in Control (as defined below).
The employment agreements for each of our Named Executive Officers contain similar termination provisions. Under the employment agreements, if the executive’s employment is terminated prior to the expiration of the term by the executive for good reason (as defined below), by notice of non-renewal by us, or by our action for any reason other than his death or disability (as defined below) or for cause (as defined below), subject to the executive’s execution and nonrevocation of a release within the period specified in the employment agreement, the executive will be entitled to receive the following benefits: (1) a lump sum payment of an amount equal to the applicable “severance multiple” times the sum of his annual base salary at the time of the termination plus a specified percentage of his annual base salary, (provided that Mr. Twellman’s payment will be made over a 24-month period rather than in a lump sum), (2) a lump sum payment of an amount equal to his unpaid bonus for the prior calendar year, if any, payable at the same time such bonus is paid to active executives, (3) a lump sum payment of an amount equal to his bonus for the calendar year in which his termination occurs, if any, as determined in good faith by our board of directors in accordance with the performance criteria
established pursuant to the employment agreement, prorated through and including the date of termination, payable at the same time as such bonus is paid to active executives and (4) if he elects COBRA continuation coverage for himself and his eligible dependents, monthly reimbursement of the differential between the COBRA premium and the active executive contribution amount for such coverage under our group health plans for up to eighteen months.
The employment agreements provide that the “severance multiple” in clause (1) above is two for each of our Named Executive Officers unless the executive’s termination of employment occurs on or within two years after the occurrence of a Change in Control, in which case the “severance multiple” is three. The employment agreements for our Named Executive Officers (other than Mr. Jones) provide that in the event any payments to the executives constitute excess parachute payments within the meaning of Section 280G of the Code, payments under the employment agreement will be reduced to an amount that would no longer create an excess parachute payment or be paid in full, whichever produces the better net after-tax position for the executive. Please read “—Actions Taken After the 2011 Year—Employment Agreements.” Consistent with Mr. Jones’s prior employment agreement with FOT, his employment agreement provides that any payments or benefits to which he may be entitled (whether under the employment agreement or otherwise) which would be subject to a parachute payment excise tax under Section 4999 of the Code will be grossed up so that he will receive an additional payment from us sufficient to cover such excise tax and all excise taxes imposed on such additional payment. If a Named Executive Officer’s employment is terminated for any reason other than those described above, the executive will continue to receive his compensation and benefits to be provided by us until the date of termination, and the compensation and benefits will terminate contemporaneously with the termination of his employment. Under the terms of the employment agreements, subject to certain exceptions, the executives may not compete in the market in which we and our respective affiliates engage during his employment and for two years following the termination of his employment.
The employment agreements define the term “Good Reason” as any of the following events: (1) a material decrease in annual base salary (other than as part of a decrease of up to 10% for all of our executive officers), (2) in the case of Mr. Gaut, the executive’s demotion from his current position with the Company, and in the case of Messrs. Harris, Jones, Brooks and McCulloch a material diminution in the executive’s authority, duties or responsibilities (other than certain changes in management structure primarily affecting reporting responsibility); or (3) an involuntary relocation of the geographic location of the executive’s principal place of employment by more than 75 miles. “Disability” is generally defined as an executive’s inability to perform the executive’s duties or fulfill his obligations under the employment agreement by reason of any physical or mental impairment for a continuous period of not less than three months. The employment agreements state that a termination for “Cause” will occur when an executive has (a) engaged in gross negligence or willful misconduct in the performance of his duties with respect to us, (b) materially breached any material provision of his employment agreement or any written corporate policy, (c) willfully engaged in conduct that is materially injurious to us, or (d) been convicted of, pleaded no contest to, or received adjudicated probation or deferred adjudication in connection with a felony involving fraud, dishonesty or moral turpitude.
In terms of the severance benefits payable to our Named Executive Officers under the circumstances described above that are based on the “severance multiple,” the following table sets out the formula for determining the amount of such benefits for the Named Executive Officers’ under the agreements.
| Executive | Current base salary (“B”) | Annual bonus target (“T”) as a percent of base | Severance amount for termination not within 2 years after a change in control | Severance amount for termination within 2 years after a change in control | ||||||||||||
| ||||||||||||||||
C. Christopher Gaut | $ | 625,000 | 125% | 2 times (B+T) | 3 times (B+T) | |||||||||||
Charles E. Jones | $ | 475,000 | 100% | 2 times (B+T) | 3 times (B+T) | |||||||||||
Wendell R. Brooks | $ | 375,000 | 100% | 2 times (B+T) | 3 times (B+T) | |||||||||||
James W. Harris | $ | 325,000 | 80% | 2 times (B+T) | 3 times (B+T) | |||||||||||
James L. McCulloch | $ | 310,000 | 80% | 2 times (B+T) | 3 times (B+T) | |||||||||||
| ||||||||||||||||
| Executive | Base salary as of December 31, 2011 (“B”) | 2011 annual bonus target (“T”) as a percent of base | Severance amount for termination not within 2 years after a change in control | Severance amount for termination within 2 years after a change in control | ||||||||||||
| ||||||||||||||||
C. Christopher Gaut | $ | 625,000 | 125% | 2 times (B+T) | 3 times (B+T) | |||||||||||
Charles E. Jones | $ | 475,000 | 100% | 2 times (B+T) | 3 times (B+T) | |||||||||||
Wendell R. Brooks | $ | 375,000 | 100% | 2 times (B+T) | 3 times (B+T) | |||||||||||
James W. Harris | $ | 325,000 | 80% | 2 times (B+T) | 3 times (B+T) | |||||||||||
James L. McCulloch | $ | 310,000 | 80% | 2 times (B+T) | 3 times (B+T) | |||||||||||
| ||||||||||||||||
“Change in Control” is generally defined in the employment agreements to occur upon (1) the acquisition by an individual, entity or group (within the meaning of the Exchange Act) of the beneficial ownership of fifty percent or more of either (a) our then outstanding shares of common stock, or (b) the combined voting power of our then outstanding voting securities entitled to vote in our election of directors; (2) the date the individuals who, immediately following the time when our stock becomes publicly traded, constitute our board of directors (and certain approved individuals who become directors after such time) cease to constitute a majority of the board of directors; or (3) the consummation of a corporate transaction (merger, reorganization, consolidation, or a sale of all or substantially all of our assets) unless, following that transaction, all or substantially all of the individuals and entities that were the beneficial owners of our outstanding common stock and outstanding voting securities prior to the transaction still beneficially own more than fifty percent of those shares of common stock or voting power of the resulting entity following the transaction, and at least a majority of the members of the board of directors of the ultimate parent entity resulting from the transaction were members of our board of directors at the time of the execution of the agreement that led to the transaction. The employment agreements include a modified definition of the term “Change in Control” that applies before our stock becomes publicly traded.
The restricted stock and stock option award agreements under our 2010 Plan have accelerated vesting provisions in the event of our Change in Control (the 2010 Plan and award agreements contain substantially the same definition of a Change in Control as provided within the Named Executive Officer’s employment agreement). If a Change in Control occurs during the period of time that the award is still outstanding, any unvested portion of the award will immediately vest so long as the executive has been continuously employed with us from the date of grant until the Change in Control event.
Quantification of payments
The table below discloses the amount of compensation and/or benefits due to the Named Executive Officers in the event of their termination of employment and/or in the event we undergo a Change in Control. The amounts disclosed assume such termination and/or the occurrence of such Change in Control was effective December 31, 2011, and using the price of
our common stock on that date of $600.00. The column titled “Termination without cause, for good reason, or due to non-extension by company not within a two year period following a change in control” utilizes the 2 times (B+T) formula above, while the column titled “Termination without cause, for good reason, or due to non-extension by company within a two year period following a change in control” utilizes the 3 times (B+T) formula. COBRA premiums reflected below are based upon the monthly premiums in effect for each of the Named Executive Officers
with respect to medical, dental and vision expenses effective as of January 1, 2012 for a period of eighteen months. Mr. Jones’ Change in Control payment reflects our estimation of the payment that would be necessary to gross him up for the excise taxes he could be required to pay following a Change in Control. The amounts below constitute estimates of the amounts that would be paid out to the Named Executive Officers upon their respective terminations and/or upon a Change in Control under such arrangements, but final amounts can only be determined with certainty upon the actual event. The actual amounts to be paid out are dependent on various factors, which may or may not exist at the time a Named Executive Officer is actually terminated and/or a Change in Control actually occurs. Therefore, such amounts and disclosures should be considered “forward-looking statements.”
| Named Executive Officer | Termination due to death or disability ($) | Termination without cause, for good reason, or due to non-extension by company not within a two year period following a change in control ($) | Termination without cause, for good reason, or due to non-extension by company within a two year period following a change in control ($) | Change in control without termination ($) | Termination due to death or disability ($) | Termination without cause, for good reason, or due to non-extension by company not within a two year period following a change in control ($) | Termination without cause, for good reason, or due to non-extension by company within a two year period following a change in control ($) | Change in control without termination ($) | ||||||||||||||||||||||||
|
|
| ||||||||||||||||||||||||||||||
C. Christopher Gaut | ||||||||||||||||||||||||||||||||
Salary | NA | 1,250,000 | 1,875,000 | — | NA | 1,250,000 | 1,875,000 | — | ||||||||||||||||||||||||
Bonus Amounts | NA | 1,562,500 | 2,343,750 | — | NA | 1,562,500 | 2,343,750 | — | ||||||||||||||||||||||||
COBRA Premiums | NA | 17,180 | 17,180 | — | NA | 17,180 | 17,180 | — | ||||||||||||||||||||||||
Change in Control Payments | NA | NA | NA | — | NA | NA | NA | — | ||||||||||||||||||||||||
Accelerated Equity Vesting | NA | 14,698,384 | 14,698,384 | 14,698,384 | NA | 14,698,384 | 14,698,384 | 14,698,384 | ||||||||||||||||||||||||
|
|
|
| |||||||||||||||||||||||||||||
Total | — | 17,531,064 | 18,934,314 | 14,698,384 | — | 17,528,064 | 18,934,314 | 14,698,384 | ||||||||||||||||||||||||
James W. Harris | ||||||||||||||||||||||||||||||||
Salary | NA | 650,000 | 975,000 | — | NA | 650,000 | 975,000 | — | ||||||||||||||||||||||||
Bonus Amounts | NA | 520,000 | 780,000 | — | NA | 520,000 | 780,000 | — | ||||||||||||||||||||||||
COBRA Premiums | NA | 17,180 | 17,180 | — | NA | 17,180 | 17,180 | — | ||||||||||||||||||||||||
Change in Control Payments | NA | NA | NA | — | NA | NA | NA | — | ||||||||||||||||||||||||
Accelerated Equity Vesting | NA | 1,932,822 | 1,932,822 | 1,932,822 | NA | 1,932,822 | 1,932,822 | 1,932,822 | ||||||||||||||||||||||||
|
|
|
| |||||||||||||||||||||||||||||
Total | — | 3,120,002 | 3,705,002 | 1,932,822 | — | 3,120,002 | 3,705,002 | 1,932,822 | ||||||||||||||||||||||||
Charles E. Jones | ||||||||||||||||||||||||||||||||
Salary | NA | 950,000 | 1,425,000 | — | NA | 950,000 | 1,425,000 | — | ||||||||||||||||||||||||
Bonus Amounts | NA | 950,000 | 1,425,000 | — | NA | 950,000 | 1,425,000 | — | ||||||||||||||||||||||||
COBRA Premiums | NA | 21,929 | 21,929 | — | NA | 21,929 | 21,929 | — | ||||||||||||||||||||||||
Change in Control Payments | NA | NA | 1,195,976 | — | NA | NA | 1,195,976 | — | ||||||||||||||||||||||||
Accelerated Equity Vesting | NA | 3,867,484 | 3,867,484 | 3,867,484 | NA | 3,867,484 | 3,867,484 | 3,867,484 | ||||||||||||||||||||||||
|
|
|
| |||||||||||||||||||||||||||||
Total | — | 5,789,413 | 7,935,389 | 3,867,484 | — | 5,789,413 | 7,935,389 | 3,867,484 | ||||||||||||||||||||||||
|
|
| ||||||||||||||||||||||||||||||
| Named Executive Officer | Termination due to death or disability ($) | Termination without cause, for good reason, or due to non-extension by company not within a two year period following a change in control ($) | Termination without cause, for good reason, or due to non-extension by company within a two year period following a change in control ($) | Change in control without termination ($) | Termination due to death or disability ($) | Termination without cause, for good reason, or due to non-extension by company not within a two year period following a change in control ($) | Termination without cause, for good reason, or due to non-extension by company within a two year period following a change in control ($) | Change in control without termination ($) | ||||||||||||||||||||||||
|
|
| ||||||||||||||||||||||||||||||
Wendell R. Brooks | ||||||||||||||||||||||||||||||||
Salary | NA | 750,000 | 1,125,000 | — | NA | 750,000 | 1,125,000 | — | ||||||||||||||||||||||||
Bonus Amounts | NA | 750,000 | 1,125,000 | — | NA | 750,000 | 1,125,000 | — | ||||||||||||||||||||||||
COBRA Premiums | NA | 26,447 | 26,447 | — | NA | 26,447 | 26,447 | — | ||||||||||||||||||||||||
Change in Control Payments | NA | NA | NA | — | NA | NA | NA | — | ||||||||||||||||||||||||
Accelerated Equity Vesting | NA | 3,458,180 | 3,458,180 | 3,458,180 | NA | 3,458,180 | 3,458,180 | 3,458,180 | ||||||||||||||||||||||||
|
|
|
| |||||||||||||||||||||||||||||
Total | — | 4,984,627 | 5,734,627 | 3,458,180 | — | 4,984,627 | 5,734,627 | 3,458,180 | ||||||||||||||||||||||||
James L. McCulloch | ||||||||||||||||||||||||||||||||
Salary | NA | 620,000 | 930,000 | — | NA | 620,000 | 930,000 | — | ||||||||||||||||||||||||
Bonus Amounts | NA | 496,000 | 744,000 | — | NA | 496,000 | 744,000 | — | ||||||||||||||||||||||||
COBRA Premiums | NA | 22,194 | 22,194 | — | NA | 22,194 | 22,194 | — | ||||||||||||||||||||||||
Change in Control Payments | NA | NA | NA | — | NA | NA | NA | — | ||||||||||||||||||||||||
Accelerated Equity Vesting | NA | 2,212,695 | 2,212,695 | 2,212,695 | NA | 2,212,695 | 2,212,695 | 2,212,695 | ||||||||||||||||||||||||
|
|
|
| |||||||||||||||||||||||||||||
Total | — | 3,350,889 | 3,908,889 | 2,212,695 | — | 3,350,889 | 3,908,889 | 2,212,695 | ||||||||||||||||||||||||
Total | NA | 34,775,995 | 40,218,221 | 26,169,565 | NA | 34,772,995 | 40,218,221 | 26,169,565 | ||||||||||||||||||||||||
|
|
| ||||||||||||||||||||||||||||||
Director compensation
Directors fees
All non-employee directors, with the exception of Mr. Baldwin and Mr. Waite, have received an annual retainer of $50,000. The Chairman of the Audit Committee has received an additional annual retainer of $15,000, and the other members of that committee have received an additional annual retainer of $5,000. We have not paid board of directors meeting fees or committee meeting fees to our directors.
Both Mr. Baldwin and Mr. Waite are Managing Directors of LESA, the ultimate general partner of SCF. It is LESA’s policy that its directors and others associated with it do not receive retainers for board service until the company on whose board they serve becomes publicly traded.
In August 2011 PMPPM&P benchmarked our director compensation using compensation data gathered from the same peer group used to analyze compensation for our executive officers, as well as supplemental data from published market surveys, in order to determine whether, and to what extent, it would be appropriate to increase director compensation following an initial public offering. Directors serving on public company boards are exposed to enhanced liability and assume duties and responsibilities over and above those required of private company directors.
As a result of the benchmarking survey, and with the assistance of PMP,PM&P, it was determined that upon the completion of an initial public offering all non-employee directors, including
Mr. Baldwin and Mr. Waite, will receive an annual retainer of $60,000. The Chairman of the Audit Committee will receive an additional annual retainer of $15,000, and the other members of that committee will receive additional annual retainers of $7,500. The Chairman of any other committee will receive an additional annual retainer of $10,000 and members of other committees will receive an additional annual retainer of $5,000.
Director equity-based compensation
We anticipate that each non-employee director will receive equity-based compensation. In 2010 we granted stock options to our non-employee directors, with the exception of Mr. Baldwin and Mr. Waite, in accordance with a formula determined by the Boardour board of Directors.directors. In 2011 we granted initial stock options to Ms. Angelle and Mr. Carrig upon their joining of the Boardour board of Directors,directors, and granted annual stock options in accordance with our formula to the non-employee members of the board (in Ms. Angelle’s case on a prorated basis in view of her appointment to the Board in February 2011), except for Mr. Baldwin, Mr. Waite and Mr. Carrig, the latter of whom had only recently been appointed to the Boardour board of Directors.directors. It has been determined to grant restricted shares or restricted share units to non-employee directors, including Mr. Baldwin and Mr. Waite, on an annual basis after our initial public offering in the amount of $125,000. The annual awards will have a one year vesting period from the date of grant. Mr. Raspino joined the board in January 2012.
Director Compensation for the year ended December 31, 2011
| Name(1) | Fees Paid in | Option Awards($)(3) | Total($) | |||||||||
|
|
|
|
|
|
| ||||||
Evelyn M. Angelle | 48,750 | 67,633 | 116,383 | |||||||||
John A. Carrig | 27,500 | 39,162 | 66,662 | |||||||||
Michael McShane | 53,750 | 38,941 | 92,291 | |||||||||
Franklin Myers | 53,750 | 42,406 | 96,156 | |||||||||
John Schmitz | 53,750 | 42,406 | 96,156 | |||||||||
|
|
|
|
|
|
| ||||||
| (1) | Messrs. Baldwin and Waite did not receive any compensation for their services as directors during 2011. |
| (2) | Amounts reflect installments of our annual retainer as well as meeting fees or additional retainer fees for committee participation. |
| (3) | Amounts in the “Option Awards” column represent the grant-date fair value in 2011 as determined in accordance with the FASB Accounting Standards Topic 718. Ms. Angelle received grants of 253 options on February 24, 2011 with an exercise price of $395 and of 88 options on August 17, 2011 with an exercise price of $568. |
| Input | Input Values | |||||||||||
|
|
|
|
|
|
| ||||||
| 2/24/2011 | 7/25/2011 | 8/17/2011 | ||||||||||
Exercise Price | $ | 395.00 | $ | 565.00 | $ | 568.00 | ||||||
Volatility | 43.9% | 36.3% | 42.0% | |||||||||
Risk-free Rate | 2.62% | 2.01% | 1.27% | |||||||||
Term | 6.25 | 6.25 | 6.25 | |||||||||
Dividend Yield | 0.0% | 0.0% | 0.0% | |||||||||
Black-Scholes Value | $ | 183.53 | $ | 221.25 | $ | 240.95 | ||||||
|
|
|
|
|
|
| ||||||
As of December 31, 2011, the total number of shares of common stock subject to outstanding stock option awards held by each director is as follows: Ms. Angelle, 341; Mr. Carrig, 177; Mr. McShane, 779; Mr. Myers, 539; and Mr. Schmitz, 529.
Certain relationships and related party transactions
The descriptions set forth below are qualified in their entirety by reference to the applicable agreements.
The Combination
The Combination closed on August 2, 2010. Immediately prior to the Combination, SCF owned the following amounts of each of the five companies involved in the Combination (before giving effect to the application of the exchange ratios used with respect to the Combination to convert the shares of each company into shares of our common stock):
| Company | No. of shares | Percentage ownership | ||||||
| ||||||||
FOT | 465,226 | 64.4% | ||||||
Global Flow | 163,000 | 87.9% | ||||||
Allied | 130,000 | 46.2% | ||||||
Triton | 621,767 | 79.1% | ||||||
Subsea | 170,000 | 89.9% | ||||||
| ||||||||
Immediately following the completion of the transactions contemplated by the Combination and the related transactions, SCF would have been deemed to have beneficially owned a total of 1,518,792 shares of our common stock (calculated pursuant to Rule 13d-3 under the Securities Exchange Act of 1934). This beneficial ownership would have consisted of (1) 991,162 shares of common stock issued to SCF in connection with the Combination, (2) 175,876 shares of common stock issued to SCF in connection with its original subscription of approximately $50.0$50 million immediately following the Combination, (3) warrants to purchase 87,938 shares of our common stock issued to SCF in connection with its original $50.0$50 million subscription at the closing of the Combination, (4) 175,877 shares of common stock issuable to SCF had it exercised its subscription right for the remaining $50.0$50 million of committed capital in full immediately following the closing of the Combination, and (5) warrants to purchase 87,939 shares of our common stock issuable to SCF had it exercised its subscription right for the remaining $50.0$50 million of committed capital in full immediately following the closing of the Combination. For a discussion of the Combination, please see “Business—Business history,” and for a discussion of the subscription rights of, and related issuance of warrants to, SCF, please see “—Subscription and warrant agreements.”
As described in “Business—Legal proceedings—Asbestos litigation,” one of the companies that merged into us in connection with the Combination had a subsidiary with potential exposure to asbestos liability. Pursuant to the Combination Agreement that effected the Combination (the “Combination Agreement”), certificates representing 26,395 shares of our common stock in the aggregate that would otherwise have been issued to the shareholders of the entity with litigation exposure, including SCF, at the time of the Combination (the “Escrow Stockholders”) are currently held in escrow pending determination of our subsidiary’s future asbestos liability exposure. At any time prior to the Escrow Termination Date (as defined in the Combination Agreement and described below), we may elect to disburse all or any portion of the shares of our common stock held in escrow to the Escrow Stockholders. In addition, we may deliver at any time prior to the date that is 120 days prior to August 2, 2014, an irrevocable written notice, indicating our intent to engage a valuation firm to prepare a final valuation report, in which case
the process of disbursing and/or retaining the shares of common stock held in escrow, as provided for in the Combination Agreement, will begin.
On the Escrow Termination Date, we will disburse to each Escrow Stockholder such pro rata portion of the shares of common stock held in escrow on the Escrow Termination Date, minus an amount of escrow shares having an aggregate fair market value as of the time the escrow termination materials are delivered equal to such Escrow Stockholder’s pro rata portion of the Indemnification Amount (as defined in the Combination Agreement, and which generally relates to any increase in the overall anticipated future discounted costs our subsidiary expects to incur in defending the asbestos litigation following the Escrow Termination Date relative to the overall anticipated future discounted costs our subsidiary expected to incur in connection with such defense at the time of the Combination) (if any). Under the terms of the Combination Agreement, each Escrow Stockholder has the ability to elect to fund its pro rata portion of any Indemnification Amount in cash or using the shares of our common stock held in escrow. Thereafter, (i) the Escrow Stockholders will possess such disbursed shares of our common stock (if any), and will have no further obligation to us with respect thereto, and (ii) we will retain all of the remaining shares (if any), and will have no further obligation to any Escrow Stockholder with respect thereto. The Escrow Stockholders will owe no obligation to us for any Indemnification Amount in excess of the value of the shares of common stock held in escrow.
The Combination Agreement defines the Escrow Termination Date as the earlier of (i) the date the Indemnification Amount (as defined in the Combination Agreement) is determined to be zero in accordance with the terms of the Combination Agreement, (ii) the date of consummation of a transaction that results in a change of control or (iii) August 2, 2014 or, if a Dispute Notice (as defined in the Combination Agreement) is delivered, in lieu of such date, the date that the arbitrating accountant delivers its final written decisions regarding such dispute.
Transactions with our significant stockholder prior to the combination
FOT was a party to that certain Financial Advisory Agreement dated May 31, 2005 with LESA, as amended from time to time, pursuant to which we paid $62,500 per quarter for on-going advisory and consulting services in connection with our operations. In August 2010, this agreement was terminated by the parties and is no longer in effect.
We are a party to that certain Secondment Agreement dated August 2, 2010 with LESA and Mr. Connelly. Pursuant to the Secondment Agreement, LESA assigned Mr. Connelly to us for a period of two years to perform, among other things, strategic development services in return for a monthly cash payment by us to LESA in the amount of $25,000.
Allied was a party to that certain Financial Advisory Agreement dated August 20, 2007 with LESA, pursuant to which Allied paid LESA $31,250 per quarter for on-going advisory and consulting services in connection with Allied’s operations. In August 2010, this agreement was terminated by the parties and is no longer in effect.
Global Flow was a party to that certain Financial Advisory Agreement dated June 30, 2005 with LESA, pursuant to which Global Flow paid $62,500 per quarter for on-going advisory and consulting services in connection with Global Flow’s operations. This agreement has been terminated by the parties and is no longer in effect.
Triton was a party to that certain Financial Advisory Agreement dated February 2, 2007 between PSSI Holdings, Inc., a Delaware corporation, TGH (UK) Limited, incorporated in England, and
LESA, pursuant to which Triton paid $62,500 per quarter for on-going advisory and consulting services in connection with Triton’s operations. This agreement has been terminated by the parties and is no longer in effect.
Subsea was a party to that certain Financial Advisory Agreement dated January 8, 2007 with LESA, pursuant to which Subsea paid $37,500 per quarter for on-going advisory and consulting services in connection with Subsea’s operations. This agreement has been terminated by the parties and is no longer in effect.
Transactions with our directors, officers and key operations managers
Allied was a party to that certain Financial Advisory Agreement dated as of August 20, 2007 with B-29 Investments, LP, as amended from time to time, pursuant to which Allied paid B-29 Investments, LP $31,250 per quarter for on-going advisory and consulting services in connection with Allied’s operations. On December 31, 2009, B-29 Investments, LP assigned to Sunray Capital, all of its rights, interests, duties and obligations in, under and to the Financial Advisory Agreement. John Schmitz, one of our directors, and Steven Schmitz, John Schmitz’s brother, are principals of Sunray Capital. This agreement has been terminated by the parties and is no longer in effect.
Allied was a party to that certain Stock Option Agreement, dated August 20, 2007 with B-29 Investments, LP, as amended from time to time, pursuant to which Allied granted to B-29 Investments, LP the right and option to purchase, in one or more transactions, all or any part of an aggregate 30,000 shares of Allied Common Stock at a purchase price of $200 per share at any time prior to August 20, 2017. John Schmitz, one of our directors, and Steven Schmitz, John Schmitz’s brother serve as officers, directors and employees of B-29 Investments, LP. This agreement has been terminated by the parties and is no longer in effect.
Allied leased a manufacturing facility in Cooke County, Texas from B-29 Properties, LLC, an affiliate of B-29 Investments, LP, from October 2010 to September 2011 for approximately $50,560 in base rent per month in the aggregate. Allied leased an undeveloped property in Cooke County, Texas from B-29 Properties, LLC, an affiliate of B-29 Investments, LP, from October 2010 to September 2011 for approximately $1,235 in base rent per month in the aggregate. Allied leased a manufacturing facility in Logan County, Oklahoma from B-29 Properties, LLC, from August 2007 to September 2011 for approximately $12,500 per month. In September 2011, B-29 Investments, LP sold the facilities and property subject to these leases to Mesa Real Estate Partners, LP.
Allied leases a manufacturing facility in Clearfield, Pennsylvania to Select Energy Services, LLC, for approximately $13,000 per month. Select Energy Services, LLC is an affiliate of B-29 Investments, LP.
Subscription and warrant agreements
In connection with the Combination and pursuant to a Subscription Agreement dated August 20, 2010, we offered each of our stockholders who were accredited investors or non-U.S. persons (as such term is defined for purposes of the Securities Act of 1933)Act) the opportunity to purchase shares of our common stock worth $115 million in the aggregate, up to their pro-rata ownership of the Company. In connection with this subscription offer, we issued to those stockholders who purchased shares of our common stock a warrant to purchase additional shares of our common stock on the basis of one warrant share for every two shares purchased in the subscription offer. The warrants were exercisable upon their issuance and will remain exercisable until the date that is the 30 month anniversary following the consummation of this offering. The initial exercise price of the warrants was $284.29 per share, and the exercise price increases by 0.5% of the then-currentthen-
current exercise price on the last day of each month following their original issuance. The following table identified each related person who participated in the subscription offer:
| Related person | No. of shares purchased | Purchase price | No. of warrant shares | No. of shares purchased | Purchase price | No. of warrant shares | ||||||||||||||||||
|
|
| ||||||||||||||||||||||
Michael McShane | 47 | $ | 13,361 | 23 | 47 | $ | 13,361 | 23 | ||||||||||||||||
Franklin Myers | 171 | $ | 48,613 | 85 | 171 | $ | 48,613 | 85 | ||||||||||||||||
Jonathan Fairbanks(1) | 1,708 | $ | 485,567 | 854 | 1,708 | $ | 485,567 | 854 | ||||||||||||||||
E. Gregory Hottle(2) | 1,230 | $ | 349,676 | 615 | 1,230 | $ | 349,676 | 615 | ||||||||||||||||
James W. Harris | 1,158 | $ | 329,207 | 579 | 1,158 | $ | 329,207 | 579 | ||||||||||||||||
Wendell R. Brooks | 821 | $ | 233,402 | 410 | 821 | $ | 233,402 | 410 | ||||||||||||||||
Michael Danford | 100 | $ | 28,429 | 50 | ||||||||||||||||||||
Michael D. Danford | 100 | $ | 28,429 | 50 | ||||||||||||||||||||
|
|
| ||||||||||||||||||||||
| (1) | Mr. Fairbanks was a director of FOT prior to the completion of the Combination. |
| (2) | Mr. Hottle was an executive officer of FOT prior to the completion of the Combination. |
In connection with the Combination and pursuant to that certain Subscription Agreement dated July 16, 2010, each of SCF-VII, L.P., Sunray Capital and Messrs. Gaut and Connelly subscribed to purchase 175,876, 17,587, 12,311 and 1,055 shares of our common stock in exchange for a cash payment of $49,999,788.04, $4,999,808.23, $3,499,894.19 and $299,925.95, respectively.
In connection with the purchase of these shares of our common stock pursuant to the Subscription Agreement, each of SCF-VII, L.P., Sunray Capital and Messrs. Gaut and Connelly received a warrant to purchase 87,938, 8,794, 6,156 and 528 shares of our common stock, respectively. Each of these warrants entitle the holder to purchase shares of our common stock at a purchase price per share of $284.29, subject to a monthly increase of the then-current exercise price by 0.5%, and expire on the 30 month anniversary of the completion of this offering. For more information about these warrants, please see “Description of capital stock—Warrants.”
The terms of that Subscription Agreement also include an additional equity commitment by SCF-VII, L.P. to purchase $50.0$50 million of our shares of common stock on or before August 3, 2011. In June 2011, SCF-VII, L.P. purchased an additional 168,236 shares of our common stock pursuant to this equity commitment in exchange for a cash payment of $50.0$50 million. In connection with the purchase of these shares, SCF-VII, L.P. also received a warrant to purchase 84,118 shares of our common stock pursuant to the Subscription Agreement.
Pursuant to a Subscription Agreement dated October 25, 2010 between Forum Energy Technologies, Inc. and Mr. James L. McCulloch, Mr. McCulloch subscribed to purchase 7,035 shares of our common stock in exchange for a cash payment of $1,999,980.
Pursuant to a Subscription Agreement dated November 18, 2010 between Forum Energy Technologies, Inc. and Mr. Charles E. Jones, Mr. Jones subscribed to purchase 2,638 shares of our common stock in exchange for a cash payment of $749,957.
Pursuant to a Subscription Agreement dated August 2, 2011 between Forum Energy Technologies, Inc. and Mr. John A. Carrig, Mr. Carrig subscribed to purchase 884 shares of our common stock in exchange for a cash payment of $499,460.
Pursuant to a Subscription Agreement dated August 3, 2011 between Forum Energy Technologies, Inc. and Ms. Evelyn M. Angelle, Ms. Angelle subscribed to purchase 176 shares of our common stock in exchange for a cash payment of $99,440.
Pursuant to a Subscription Agreement dated December 2, 2011 between Forum Energy Technologies, Inc. and Mr. Pablo G. Mercado, Mr. Mercado subscribed to purchase 176 shares of our common stock in exchange for a cash payment of $99,968.
Pursuant to a Subscription Agreement dated January 31, 2012 between Forum Energy Technologies, Inc. and Mr. Louis A. Raspino, Mr. Raspino subscribed to purchase 833 shares of our common stock in exchange for a cash payment of $499,800.
Stock repurchases
In connection with the Combination, we offered to purchase shares of our common stock from our stockholders immediately after giving effect to the Combination at the price per share used for purposes of the Combination. Our offer was subject to a pro rata cutback among the shareholders who elected to participate in the repurchase offer and was subject to an aggregate cap of $25.0$25 million. In connection with this share repurchase offer, Mr. James R. Burke and Mr. Joe S. Ramey, who were a director and an executive officer of FOT prior to the Combination, elected to participate in the offer by selling 10,000 shares in exchange for $2,842,900 and 2,750 shares in exchange for $781,797, respectively.
Registration rights agreement
Demand registration rights
Under our Amended and Restated Forum Stockholders Agreement (the “Amended Forum Stockholders Agreement”), from and after 180 days following an initial public offering, SCF has the right to demand on five occasions that we register all or any portion of SCF’s Registrable Securities (as such term is defined in the Amended Forum Stockholders Agreement) so long as the Registrable Securities proposed to be sold on an individual registration statement have an aggregate gross offering price of at least $20.0$20 million (or at least $10.0$10 million if we are then eligible to register such sale on a Form S-3 registration statement (or any comparable or successor form) (a “Demand Registration”). Holders of SCF’s Registrable Securities may not require us to effect more than one Demand Registration in any six-month period. After such time that we become eligible to use Form S-3 (or comparable form) for the registration under the Securities Act of any of our securities, any demand request by SCF with a reasonably anticipated aggregate offering price of $100.0$100 million may be for a “shelf” registration statement pursuant to Rule 415 under the Securities Act; provided that any such “shelf” registration statement Demand Request will count as two Demand Requests.
We may delay the filing of a demand registration statement until a date not later than 60 days after the required filing date if (A) we are engaged in confidential negotiations or other confidential business activities which would require disclosure in the registration statement and our board of directors determines in good faith that such disclosure would be materially
detrimental to us or (B) we have experienced some other material non-public event or is in possession of material non-public information concerning us. We may also delay the filing if, prior to receiving a demand request, we are already proceeding with another offering or pursuant to a demand by another requesting holder. If we delay the filing of a demand registration statement for any of the foregoing reasons, then we must deliver a certificate signed by our Chief Executive Officer stating we are delaying the filing and the basis for the delay.
Piggyback registration rights
If we propose to file a registration statement under the Securities Act relating to an offering of our common stock for our Company or for the account of any holder of our common stock (other than a registration statement filed relating to securities offered in connection with benefit plans or acquisitions or any registration statement filed in connection with an exchange offer or offering
solely to our stockholders), we will provide written notice to holders of Registrable Securities no less than 15 days, provided that, in the case of an initial public offering, we are not obligated to provide written notice of any proposed filing of a registration statement to the Holders of the Registrable Securities until no less than 15 days before the anticipated filing date of a registration statement (or a pre-effective amendment thereof) that first identifies SCF as a selling stockholder in such registration statement. If SCF elects not to register any Registrable Securities in our initial public offering, then no other holder of Registrable Securities is entitled to register any Registrable Securities in our initial public offering. Upon notice and written request of holders of Registrable Securities, we will use our commercially reasonable efforts to include in such registration, and any related underwriting, all of the Registrable Securities included in such requests. To the extent a stockholder is not a party to the Amended Forum Stockholders Agreement, such stockholder may not be entitled to the registration rights set forth therein.
If the managing underwriter of a proposed underwritten offering advises us that in its opinion the total amount of securities to be included in such offering is sufficiently large to materially and adversely affect the price or success of the offering, then the securities to be included in such offering will be allocated first to the requesting holders if the registration statement is pursuant to a demand request or, if not, then to us, and then pro rata among the holders of piggyback securities on the basis of the number of Registrable Securities then held by each such holder.
In connection with the concurrent private placement, the private equity firm will become a party to the Amended Forum Stockholders Agreement and, as such, will be entitled to the piggyback registration rights described above.
Holdback agreements
Each holder of Registrable Securities is subject to certain lock-up provisions that restrict transfer during the period beginning 14 days prior to, and continuing for a period not to exceed 180 days after, the date of a final prospectus for this offering, or 90 days for any subsequent underwritten public offering of our equity securities, except as part of such registration (subject to an extension of such lock-up period in certain circumstances).
Registration procedures and expenses
The Amended Forum Stockholders Agreement contains customary procedures relating to underwritten offerings and the filing of registration statements. We have agreed to pay all registration expenses incurred in connection with any registration, including all registration, qualification and filing fees, printing expenses, accounting fees, escrow fees, legal fees of the Company, reasonable fees of one counsel to the holders of Registrable Securities, blue sky fees
and expenses and the expense of any special audits incident to or required by any such registration. All underwriting discounts and selling commissions and stock transfer taxes applicable to securities registered by holders and fees of counsel to any such holder (other than as described above) will be payable by holders of Registrable Securities.
Indemnification and contribution
The Amended Forum Stockholders Agreement also contains customary indemnification and contribution provisions by us for the benefit of holders participating in any registration. Each holder participating in any registration agrees to indemnify us in respect of information provided by such holder to us for use in connection with such registration; provided that such
indemnification will be limited to the net proceeds actually received by such indemnifying holder from the sale of Registrable Securities.
Concurrent Private Placement
We intend to offer to sell shares of our common stock in a private placement to a private equity firm not affiliated with SCF concurrently with this offering. Upon the closing of the private placement, we intend to amend our stockholders agreement to require us and our stockholders that are parties to the stockholders agreement to take all action required to cause the board of directors to include one member designated by the private equity firm. We also agreed to use our reasonable best efforts to cause the private equity firm’s designee to remain on the Board and to cause the designee to be in the class of directors with an initial term that has as close to three years remaining as possible and cause the Nominating, Governance and Compensation Committee of the board of directors to include the designee. In addition, in connection with the concurrent private placement, the private equity firm will become a party to the stockholders agreement and, as such, will be entitled to registration rights. Please read “Prospectus summary—The offering—Concurrent private placement,” “Management—Board of directors” and “—Registration Rights.”
Procedures for approval of related person transactions
A “Related Party Transaction” is a transaction, arrangement or relationship in which we or any of our subsidiaries was, is or will be a participant, the amount of which involved exceeds $120,000, and in which any related person had, has or will have a direct or indirect material interest. A “Related Person” means:
any person who is, or at any time during the applicable period was, one of our executive officers or one of our directors;
any person who is known by us to be the beneficial owner of more than 5.0% of our common stock;
any immediate family member of any of the foregoing persons, which means any child, stepchild, parent, stepparent, spouse, sibling, mother-in-law, father-in-law, son-in-law, daughter-in-law, brother-in-law or sister-in-law of a director, executive officer or a beneficial owner of more than 5.0% of our common stock, and any person (other than a tenant or employee) sharing the household of such director, executive officer or beneficial owner of more than 5.0% of our common stock; and
any firm, corporation or other entity in which any of the foregoing persons is a partner or principal or in a similar position or in which such person has a 10.0% or greater beneficial ownership interest.
Our board of directors intends to adopt a written related party transactions policy prior to the completion of this offering. Pursuant to this policy, the Audit Committee expects to review all material facts of all Related Party Transactions and either approve or disapprove entry into the Related Party Transaction, subject to certain limited exceptions. In determining whether to approve or disapprove entry into a Related Party Transaction, the Audit Committee expects to take into account, among other factors, the following: (1) whether the Related Party Transaction is on terms
no less favorable than terms generally available to an unaffiliated third-party under the same or similar circumstances and (2) the extent of the Related Person’s interest in the transaction. Further, the policy would require that all Related Party Transactions required to be disclosed in our filings with the SEC be so disclosed in accordance with applicable laws, rules and regulations.
Principal and selling stockholders
The following table sets forth information with respect to the beneficial ownership of our common stock as of December 27, 2011March 9, 2012 by:
each of our Named Executive Officers;
each of our directors;
all of our directors and executive officers as a group;
each person known to us to beneficially own 5% or more of our outstanding common stock; and
each of the selling stockholders.
Except as otherwise indicated, the persons or entities listed below have sole voting and investment power with respect to all shares of our common stock beneficially owned by them, except to the extent this power may be shared with a spouse. All information with respect to beneficial ownership has been furnished by the respective directors, executive officers, 5% or more stockholders or the selling stockholders, as the case may be.
Name and address of beneficial owner | Shares beneficially owned prior to the offering | Shares beneficially owned after offering(2) | Shares beneficially owned prior to the offering | Shares beneficially owned after offering and concurrent private placement(2)(3) | ||||||||||||||||||||||||
| Number | Percentage(1) | Shares being offered | Number | Percentage | Number | Percentage(1) | Shares being offered | Number | Percentage | |||||||||||||||||||
|
|
| ||||||||||||||||||||||||||
Selling Stockholders: | ||||||||||||||||||||||||||||
5% or more Stockholders: | ||||||||||||||||||||||||||||
SCF-V, L.P. | 626,367 | 31.2% | 626,367 | 31.2% | ||||||||||||||||||||||||
SCF-VI, L.P. | 364,795 | 18.2% | 364,795 | 18.1% | ||||||||||||||||||||||||
SCF-VII, L.P. | 516,168 | 25.7% | 516,168 | 25.7% | ||||||||||||||||||||||||
Directors and Executive Officers: | ||||||||||||||||||||||||||||
C. Christopher Gaut | 35,563 | 1.9% | 35,563 | 1.9% | ||||||||||||||||||||||||
Charles E. Jones | 19,141 | 1.0% | 19,141 | 1.0% | ||||||||||||||||||||||||
Wendell R. Brooks | 13,370 | * | 13,370 | * | ||||||||||||||||||||||||
James W. Harris | 8,917 | * | 8,917 | * | ||||||||||||||||||||||||
James L. McCulloch | 10,295 | * | 10,295 | * | ||||||||||||||||||||||||
Steven W. Twellman | 7,192 | * | ||||||||||||||||||||||||||
Evelyn Angelle | 239 | * | ||||||||||||||||||||||||||
Evelyn M. Angelle | 239 | * | ||||||||||||||||||||||||||
David C. Baldwin(5) | — | — | ||||||||||||||||||||||||||
John A. Carrig | 884 | * | 884 | * | ||||||||||||||||||||||||
David C. Baldwin(4) | — | — | ||||||||||||||||||||||||||
Michael McShane | 579 | * | 579 | * | ||||||||||||||||||||||||
Franklin Myers | 1,023 | * | 1,023 | * | ||||||||||||||||||||||||
Louis A. Raspino | 833 | * | ||||||||||||||||||||||||||
John Schmitz | 78,987 | 4.3% | 78,987 | 4.3% | ||||||||||||||||||||||||
Andrew L. Waite | — | — | — | — | ||||||||||||||||||||||||
All directors and executive officers as a group (16 persons) | 180,357 | 9.5% | 173,998 | 9.5% | ||||||||||||||||||||||||
|
|
| ||||||||||||||||||||||||||
| *less | than 1%. |
| (1) | Based upon an aggregate of |
| (2) | Assumes no exercise of the underwriters’ over-allotment option to purchase additional shares of our common stock. |
| (3) | If the price at which we offer the shares of common stock to the public is above the range set forth on the cover of this prospectus, the private equity firm that has been offered shares of our common stock pursuant to the concurrent private placement may elect not to purchase any common stock or to buy only a portion of the common stock. See “Prospectus Summary—The offering—Concurrent private placement.” |
| (4) | L.E. Simmons is the natural person who has voting and investment control over the securities owned by SCF. Mr. Simmons serves as the President and sole member of the board of directors of LESA, the ultimate general partner of SCF. Because SCF-V, L.P., SCF-VI, L.P. and SCF-VII, L.P. are controlled by LESA, each of these entities may be considered to be a group for purposes of Section 13(d)(3) under the Securities Exchange Act of 1934. As a group, SCF beneficially owns 1,507,330 shares of our common stock, or 75.1% of our common stock, in the aggregate. This beneficial ownership includes 626,367 shares of our common stock currently outstanding and held by SCF-V, L.P., 364,795 shares of our common stock currently outstanding and held by SCF-VI, L.P., 344,112 shares of our common stock currently outstanding and held by SCF-VII, L.P. and 172,056 shares of our common stock issuable upon the exercise of warrants (assuming such warrants are exercised by the payment of the applicable exercise price in cash and assuming the previously described purchase right was exercised on December 27, 2011) issued and issuable by us to SCF-VII, L.P., in each case as further described under “Certain relationships and related party transactions—Subscription and warrant agreements.” |
| Mr. Baldwin serves as a managing director of LESA, the ultimate general partner of SCF. As such, Mr. Baldwin may be deemed to have dispositive power over the shares of common stock owned by SCF. Mr. Baldwin disclaims beneficial ownership of such shares of common stock owned by SCF. |
| Mr. Waite serves as a managing director of LESA, the ultimate general partner of SCF. As such, Mr. Waite may be deemed to have dispositive power over the shares of common stock owned by SCF. Mr. Waite disclaims beneficial ownership of such shares of common stock owned by SCF. |
| The number of shares beneficially owned includes the following shares that are subject to stock options and warrants that were exercisable as of, or will become exercisable within 60 days of, |
| Holder | Option shares | Warrant shares | Option shares | Warrant shares | ||||||||||||
|
|
| ||||||||||||||
C. Christopher Gaut | 15,389 | 6,155 | 15,389 | 6,155 | ||||||||||||
Charles E. Jones | 9,525 | — | 9,525 | — | ||||||||||||
Wendell R. Brooks | 9,204 | 410 | 9,204 | 410 | ||||||||||||
James W. Harris | 2,417 | 579 | 2,417 | 579 | ||||||||||||
James L. McCulloch | 1,500 | — | 1,500 | — | ||||||||||||
W. Patrick Connelly | — | 527 | — | 527 | ||||||||||||
Michael D. Danford | 1,325 | 50 | 1,325 | 50 | ||||||||||||
Steven W. Twellman | 5,936 | — | ||||||||||||||
Evelyn Angelle | 63 | — | ||||||||||||||
Evelyn M. Angelle | 63 | — | ||||||||||||||
Michael McShane | 338 | 23 | 338 | 23 | ||||||||||||
John Schmitz | 88 | 8,793 | 88 | 8,793 | ||||||||||||
|
|
| ||||||||||||||
Upon completion of the stock split, and this offering and the concurrent private placement, the authorized capital stock of Forum Energy Technologies, Inc. will consist of shares of common stock, par value $0.01 per share, of which shares of common stock will be issued and outstanding, and shares of preferred stock, par value $0.01 per share, of which no shares will be issued and outstanding.
We will adopt an amended and restated certificate of incorporation and amended and restated bylaws concurrently with the completion of this offering. The following summary of the capital stock and our amended and restated certificate of incorporation and our amended and restated bylaws does not purport to be complete and is qualified in its entirety by reference to the provisions of applicable law and to our amended and restated certificate of incorporation and amended and restated bylaws, which are filed as exhibits to the registration statement of which this prospectus is a part.
Common stock
Except as provided by law or in a preferred stock designation, holders of our common stock are entitled to one vote for each share held of record on all matters submitted to a vote of the stockholders. Because holders of our common stock have the exclusive right to vote for the election of directors and do not have cumulative voting rights, the holders of a majority of the shares of our common stock can elect all of the members of the board of directors standing for election, subject to the rights, powers and preferences of any outstanding series of preferred stock. Subject to the rights and preferences of any preferred stock that we may issue in the future, the holders of our common stock are entitled to receive:
dividends as may be declared by our board of directors; and
all of our assets available for distribution to holders of our common stock in liquidation, pro rata, based on the number of shares held.
There are no redemption or sinking fund provisions applicable to our common stock. All outstanding shares of our common stock are fully paid and non-assessable, and the shares of common stock to be issued upon completion of this offering will be fully paid and non-assessable.
Preferred stock
Subject to the provisions of our amended and restated certificate of incorporation and legal limitations, our board of directors will have the authority, without further vote or action by our stockholders:
to issue up to shares of preferred stock in one or more series; and
to fix the rights, preferences, privileges and restrictions of our preferred stock, including provisions related to dividends, conversion, voting, redemption, liquidation and the number of shares constituting the series or the designation of that series, which may be superior to those of our common stock.
There will be no shares of preferred stock outstanding upon the closing of this offering, and we have no present plans to issue any preferred stock.
The issuance of shares of preferred stock by our board of directors as described above may adversely affect the rights of the holders of our common stock. For example, preferred stock may rank prior to our common stock as to dividend rights, liquidation preference or both, may have full or limited voting rights and may be convertible into shares of our common stock. The issuance of shares of preferred stock may discourage third-party bids for our common stock or may otherwise adversely affect the market price of our common stock. In addition, preferred stock may enable our board of directors to make it more difficult or to discourage attempts to obtain control of us through a hostile tender offer, proxy contest, merger or otherwise, or to make changes in our management.
Anti-takeover effects of provisions of our amended and restated certificate of incorporation, our amended and restated bylaws and Delaware law
Some provisions of Delaware law, our amended and restated certificate of incorporation and our amended and restated bylaws could make certain change of control transactions more difficult, including acquisitions of us by means of a tender offer, a proxy contest or otherwise, as well as removal of our incumbent officers and directors. These provisions may also have the effect of preventing changes in our management. It is possible that these provisions could make it more difficult to accomplish or could deter transactions that stockholders may otherwise consider to be in their best interest or in our best interests, including transactions that might result in a premium over the market price for our shares.
These provisions, summarized below, are intended to discourage coercive takeover practices and inadequate takeover bids. These provisions are also designed to encourage persons seeking to acquire control of us to first negotiate with our board of directors. We believe that the benefits of increased protection and our potential ability to negotiate with the proponent of an unsolicited proposal to acquire or restructure us outweigh the disadvantages of discouraging these proposals because, among other things, negotiation of these proposals could result in an improvement of their terms.
Opt out of Section 203 of the Delaware General Corporation Law
In our amended and restated certificate of incorporation, we will elect not to be subject to the provisions of Section 203 of the Delaware General Corporation Law (the “DGCL”) regulating corporate takeovers until the date on which the SCF group is no longer the holder of at least 15% of our outstanding common stock. On and after such date, we will be subject to the provisions of Section 203 of the DGCL. In general, those provisions prohibit a Delaware corporation, including those whose securities are listed for trading on the NYSE, from engaging in any business combination with any interested stockholder for a period of three years following the date that the stockholder became an interested stockholder, unless:
the transaction is approved by the board of directors before the date the interested stockholder attained that status;
upon consummation of the transaction that resulted in the stockholder becoming an interested stockholder, the interested stockholder owned at least 85% of the voting stock of the corporation outstanding at the time the transaction commenced; or
on or after the date the interested stockholder attained that status, the business combination is approved by the board of directors and authorized at a meeting of stockholders by at least two-thirds of the outstanding voting stock that is not owned by the interested stockholder.
Amended and Restated Certificate of Incorporation and Amended and Restated Bylaws
Among other things, upon the completion of this offering, our amended and restated certificate of incorporation and amended and restated bylaws will:
establish advance notice procedures with regard to stockholder proposals relating to the nomination of candidates for election as directors or new business to be brought before meetings of our stockholders. These procedures provide that notice of stockholder proposals must be timely given in writing to our corporate secretary prior to the meeting at which the action is to be taken. Generally, to be timely, notice must be received at our principal executive offices not less than 90 days nor more than 120 days prior to the first anniversary date of the annual meeting for the preceding year. Our amended and restated bylaws specify the requirements as to form and content of all stockholders’ notices. These requirements may preclude stockholders from bringing matters before the stockholders at an annual or special meeting to the extent they do not comply with the requirements in these advance notice procedures;
provide our board of directors the ability to authorize the issuance of undesignated preferred stock. This makes it possible for our board of directors to issue, without stockholder approval, preferred stock with voting or other rights or preferences that could impede the success of any attempt to change control of us;
provide that the authorized number of directors may be changed only by resolution of the board of directors;
at any time after the first date on which the SCF group no longer collectively owns 50% or more of the outstanding shares of our common stock (the “Trigger Date”), provide that all vacancies, including newly created directorships, may, except as otherwise required by law, be filled by the affirmative vote of a majority of directors then in office, even if less than a quorum (prior to the Trigger Date, such vacancies, including newly created directorships, may also be filled by the holders of not less than a majority in voting power of the outstanding shares of our common stock);
at any time after the Trigger Date, provide that any action required or permitted to be taken by the stockholders must be effected at a duly called annual or special meeting of stockholders and may not be effected by any consent in writing in lieu of a meeting of such stockholders, subject to the rights of the holders of any series of preferred stock (prior to the Trigger Date, such actions may be taken without a meeting by written consent of holders of common stock having not less than the minimum number of votes that would be necessary to authorize such action at a meeting);
at any time after the Trigger Date, provide that our certificate of incorporation and bylaws may be amended by the affirmative vote of the holders of at least two-thirds of our then outstanding common stock (prior to the Trigger Date, our certificate of incorporation and bylaws may be amended by the affirmative vote of the holders of a majority of our then outstanding common stock);
provide that special meetings of our stockholders may only be called by the board of directors, the chief executive officer, the president, the secretary, the chairman of the board or by stockholders holding a majority of the outstanding shares entitled to vote generally in the election of directors;
provide for our board of directors to be divided into three classes of directors, with each class as nearly equal in number as possible, serving staggered three year terms, other than directors who may be elected by holders of preferred stock, if any. For more information on the classified board of directors, please read “Management” beginning on page 129.122. This system of electing and removing directors may tend to discourage a third party from making a tender offer or otherwise attempting to obtain control of us, because it generally makes it more difficult for stockholders to replace a majority of the directors;
at any time after the Trigger Date, provide that a member of our board of directors may only be removed for cause and only by the affirmative vote of the holders of at least two-thirds of our then outstanding common stock (prior to the Trigger Date, our board of directors may be removed at any time, with or without cause, by the affirmative vote of the holders of a majority of our then outstanding common stock); and
provide that we renounce any interest in the business opportunities of the SCF group or any of their officers, directors, agents, stockholders, members, partners, affiliates and subsidiaries (other than our directors that are presented business opportunities in their capacity as our directors) and that they have no obligation to offer us those opportunities. For more information, please read “—Renouncement of business opportunities.”
Warrants
Overview
In connection with the consummation of the Combination, we offered each of our stockholders who were accredited investors or non-U.S. persons (as such term is defined for purposes of the Securities Act of 1933)Act) the opportunity to purchase shares of our common stock worth $115 million in the aggregate, up to their pro rata ownership of us. In connection with this subscription offer, we issued to those stockholders who purchased shares of our common stock a warrant to purchase additional shares of our common stock on the basis of one warrant share for every two shares purchased in the subscription offer. The warrants were exercisable upon their issuance and will remain exercisable until the date that is the 30 month anniversary following the consummation of this offering. The initial exercise price of the warrants was $284.29 per share, and the exercise price increases by 0.5% of the then-current exercise price on the last day of each month following their original issuance. One of our directors exercised warrants to purchase 85 shares of our common stock on March 31, 2011, and one of our stockholders exercised warrants to purchase 78 shares of our common stock on January 12, 2012. The warrants do not confer upon the holder any voting or any other rights of our stockholders.
Exercise of the warrants
The warrants were issued pursuant to a Warrant Agreement by and between the holders of the warrants and us. The warrants may be exercised, in whole or in part, either for cash or on a cashless basis, subject to the limitations described below.
Cash exercise
Upon the completion of this offering, the holder of any warrant may no longer exercise such warrant by the payment of cash for the applicable exercise price of such warrant exercised. Notwithstanding the preceding sentence, unless otherwise determined by the holders of warrants representing not less than 80% of the shares of our common stock then subject to
purchase pursuant to outstanding warrants, at any time after the completion of this offering, a holder of a warrant may exercise such warrant for cash if such exercise occurs during (1) the 60 days prior to the expiration time or (2) at any time after we have publicly announced or delivered notice that we have entered into a definitive agreement that would result in a reclassification or reorganization of our common stock or a merger or consolidation into another entity or that involves our common stock or a sale of all or substantially all of our assets and ending on the consummation or abandonment of such transaction. Any such exercise for cash, however, must be in compliance with applicable federal and state securities laws and in accordance with a valid exemption from registration in connection with the issuance of our common stock underlying such warrant, in each case as we determine.
Conversion rights
In addition to the cash exercise method described above, following the completion of this offering, holders of warrants will have the right (but not the obligation) to require us to convert a warrant, in whole or in part, into shares of our common stock (the “Conversion Right”) pursuant to the Warrant Agreement. Upon exercise of the Conversion Right, we will deliver to the holder of the warrant (without payment by such holder of the exercise price) the number of shares of our common stock equal to (x) the aggregate fair market value of the shares of our common stock for which the Conversion Right is exercised less the aggregate exercise price applicable to such shares of our common stock (and any taxes allocated to the holder of such warrant in connection with such exercise) divided by (y) the fair market value of one share of our common stock immediately prior to the exercise of the Conversion Right. In addition, if less than 20% of the aggregate shares of our common stock originally subject to the Warrant Agreement remain subject to purchase upon exercise, we will have the right, by delivery of a written notice to the holders of the warrants that remain outstanding, to cause the exercise of all warrants pursuant to the Conversion Right. In addition, all warrants outstanding as of the expiration time will be deemed to have been exercised pursuant to the Conversion Right.
Adjustments
The exercise price of the warrants and the number of shares of our common stock issuable upon exercise of the warrants are subject to adjustment in certain circumstances, including in the event we (1) make a distribution payable in our common stock, subdivide our outstanding common stock into a larger number or combine our outstanding shares of common stock into a smaller number, (2) issue rights, options, warrants or equivalent rights to all or substantially all of the holders of our common stock (and not to the holders of warrants) entitling our stockholders to subscribe for or purchase shares of our common stock at a price less than fair market value or (3) distribute (A) shares of any class other than our common stock, (B) evidences of our indebtedness, (C) cash or other assets or (D) rights or warrants other than as described above.
Renouncement of business opportunities
SCF has investments in other oilfield service companies that may compete with us, and SCF and its affiliates, other than us, may invest in such other companies in the future. SCF, its other affiliates and its portfolio companies are referred to as the SCF group. Our amended and restated certificate of incorporation will provide that, until we have had no directors that are SCF Nominees for a continuous period of one year, we renounce any interest in any business opportunity in which any
member of the SCF group participates or desires or seeks to participate in and that involves any aspect of the energy equipment or services business or industry, other than:
any business opportunity that is brought to the attention of an SCF Nominee solely in such person’s capacity as our director or officer and with respect to which no other member of the SCF group independently receives notice or otherwise identifies such opportunity; or
any business opportunity that is identified by the SCF group solely through the disclosure of information by or on behalf of us.
In addition, LESA, the ultimate general partner of SCF, has an internal policy that discourages it from investing in two or more portfolio companies with substantially overlapping industry segments and geographic areas. However, LESA’s internal policy does not restrict the management or operation of its other individual portfolio companies from competing with us. Pursuant to LESA’s policy, LESA may allocate any potential opportunities to the existing portfolio company where LESA determines, in its discretion, such opportunities are the most logical strategic and operational fit. Thus, members of the SCF group, which includes any SCF Nominees, may pursue opportunities in the oilfield services industry for their own account or present such opportunities to us or one of SCF’s other portfolio companies. Our amended and restated certificate of incorporation will provide that the SCF group, which includes any SCF Nominees, has no obligation to offer such opportunities to us, even if the failure to provide such opportunity would have a competitive impact on us. We are not prohibited from pursuing any business opportunity with respect to which we have renounced any interest.
Our certificate of incorporation further provides that any amendment to or adoption of any provision inconsistent with the certificate of incorporation’s provisions governing the renouncement of business opportunities must be approved by the holders of at least 80% of the voting power of the outstanding stock of the corporation entitled to vote thereon.
Amendment of the bylaws
Our board of directors may amend or repeal the bylaws and adopt new bylaws by the affirmative vote of a majority of the whole board of directors. Prior to the Trigger Date, the stockholders may amend or repeal the bylaws and adopt new bylaws by a majority vote at any annual meeting or special meeting for which notice of the proposed amendment, repeal or adoption was contained in the notice for such special meeting. On and after the Trigger Date, the affirmative vote of the holders of at least two-thirds of our then outstanding common stock will be required to amend or repeal the bylaws.
Limitation of liability and indemnification of officers and directors
Our directors will not be personally liable to us or our stockholders for monetary damages for breach of fiduciary duty as a director, except, if required by Delaware law, for liability:
for any breach of the duty of loyalty to us or our stockholders;
for acts or omissions not in good faith or involving intentional misconduct or a knowing violation of law;
for unlawful payment of a dividend or unlawful stock purchases or redemptions; or
for any transaction from which the director derived an improper personal benefit.
As a result, neither we nor our stockholders have the right, through stockholders’ derivative suits on our behalf, to recover monetary damages against a director for breach of fiduciary duty as a director, including breaches resulting from grossly negligent behavior, except in the situations described above. We intend to enter into indemnification agreements with each of our current and future directors and officers.
Registration rights
For a description of our Registration Rights Agreement, please read “Certain relationships and related party transactions—Registration rights agreement.”
Transfer agent and registrar
The transfer agent and registrar for the common stock isAmerican Stock Transfer & Trust Company, LLC.
Listing; public market
There is no established market for our shares of common stock. We have been approved to list on the NYSE under the ticker symbol “FET,” subject to completion of the offering and compliance with certain conditions. The development and maintenance of a public market for our common stock, having the desirable characteristics of depth, liquidity and orderliness, depends on the existence of willing buyers and sellers, the presence of which is not within our control or that of any market maker. The number of active buyers and sellers of shares of our common stock at any particular time may be limited, which may have an adverse effect on the price at which shares of our common stock can be sold.
Shares eligible for future sale
Prior to this offering, there has been no public market for our common stock. Future sales of our common stock in the public market, or the availability of such shares for sale in the public market, could adversely affect market prices prevailing from time to time. As described below, only a limited number of shares will be available for sale shortly after this offering due to contractual and legal restrictions on resale. Nevertheless, sales of a substantial number of shares of our common stock in the public market after such restrictions lapse, or the perception that those sales may occur, could adversely affect the prevailing market price at such time and our ability to raise equity-related capital at a time and price we deem appropriate.
Sales of restricted shares
Upon the closing of this offering and the concurrent private placement, we will have outstanding an aggregate of shares of common stock. Of these shares, all of the shares of common stock to be sold in this offering will be freely tradable without restriction or further registration under the Securities Act, unless the shares are held by any of our “affiliates” as such term is defined in Rule 144 of the Securities Act. All remaining shares of common stock held by existing stockholders and the shares issued in the concurrent private placement will be deemed “restricted securities” as such term is defined under Rule 144. The restricted securities were, or will be, issued and sold by us in private transactions and are eligible for public sale only if registered under the Securities Act or if they qualify for an exemption from registration under Rule 144 or Rule 701 under the Securities Act, which rules are summarized below.
As a result of the lock-up agreements described below and the provisions of Rule 144 and Rule 701 under the Securities Act, the shares of our common stock (excluding the shares to be sold in this offering) that will be available for sale in the public market are as follows:
shares will be eligible for sale on the date of this prospectus or prior to 180 days after the date of this prospectus;
shares will be eligible for sale beginning six months after the date of this prospectus and when permitted under Rule 144;
shares will be eligible for sale upon the expiration of the lock-up agreements, beginning 180 days after the date of this prospectus (subject to extension) and when permitted under Rule 144 or Rule 701; and
shares will be eligible for sale, upon exercise of vested options, upon the expiration of the lock-up agreements, beginning 180 days after the date of this prospectus (subject to extension).
Lock-up agreements
We, all of our directors and officers, certain of our principal stockholders and the selling stockholders have agreed not to sell any common stock for a period of 180 days from the date of this prospectus, subject to certain exceptions and extensions. See “Underwriting (conflicts of interest)” for a description of these lock-up provisions.
Rule 144
In general, under Rule 144 as currently in effect, once we have been a reporting company subject to the reporting requirements of Section 13 or 15(d) of the Exchange Act for 90 days, a person (or persons whose shares are aggregated) who is not deemed to have been an affiliate of ours at any time during the three months preceding a sale, and who has beneficially owned restricted
securities within the meaning of Rule 144 for a least six months (including any period of consecutive ownership of preceding non-affiliated holders) would be entitled to sell those shares, subject only to the availability of current public information about us. A non-affiliated person who has beneficially owned restricted securities within the meaning of Rule 144 for at least one year would be entitled to sell those shares without regard to the provisions of Rule 144.
Once we have been a reporting company subject to the reporting requirements of Section 13 or 15(d) of the Exchange Act for 90 days, a person (or persons whose shares are aggregated) who is deemed to be an affiliate of ours and who has beneficially owned restricted securities within the meaning of Rule 144 for at least six months would be entitled to sell within any three-month period a number of shares that does not exceed the greater of one percent of the then outstanding shares of our common stock or the average weekly trading volume of our common stock reported through the NYSE during the four calendar weeks preceding the filing of notice of the sale. Such sales are also subject to certain manner of sale provisions, notice requirements and the availability of current public information about us.
Rule 701
In general, under Rule 701, any of our employees, directors, officers, consultants or advisors who purchases shares from us in connection with a compensatory stock or option plan or other written agreement pursuant to Rule 701 before the effective date of the registration statement for this offering is entitled to sell such shares 90 days after the effective date of this offering in reliance on Rule 144, without having to comply with the holding period requirement of Rule 144 and, in the case of non-affiliates, without having to comply with the public information, volume limitation or notice filing provisions of Rule 144. The SEC has indicated that Rule 701 will apply to typical stock options granted by an issuer before it becomes subject to the reporting requirements of the Exchange Act, along with the shares acquired upon exercise of such options, including exercises after the date of this prospectus.
Stock issuable under employee plans
We intend to file a registration statement on Form S-8 under the Securities Act to register stock issuable under our 2010 Plan. This registration statement is expected to be filed following the effective date of the registration statement of which this prospectus is a part and will be effective upon filing. Accordingly, shares registered under such registration statement will be available for sale in the open market following the effective date, unless such shares are subject to vesting restrictions with us, Rule 144 restrictions applicable to our affiliates or the lock-up restrictions described above.
Registration rights
For a description of our Registration Rights Agreement, please read “Certain relationships and related party transactions—Registration rights agreement.”
Material U.S. federal income and estate tax considerations
to non-U.S. holders
The following is a general discussion of the material U.S. federal income and estate tax considerations relating to the acquisition, ownership and disposition of our common stock by non-U.S. holders (as defined below). The following discussion is based on current provisions of the Code, the U.S. Treasury regulations promulgated thereunder, and administrative and judicial interpretations thereof, all as in effect on the date hereof, and all of which are subject to change or differing interpretations, possibly with retroactive effect. For the purpose of this discussion, a non-U.S. holder is any beneficial owner of our common stock that is not, for U.S. federal income tax purposes, any of the following:
an individual who is a citizen or resident of the United States (as determined for U.S. federal income tax purposes);
a corporation (or other entity treated as a corporation for U.S. federal income tax purposes) created or organized in or under the laws of the United States, any state thereof or the District of Columbia;
a partnership (or other entity treated as a partnership for U.S. federal income tax purposes);
an estate the income of which is subject to U.S. federal income tax regardless of its source; or
a trust (x) if a U.S. court is able to exercise primary supervision over the administration of the trust and one or more U.S. persons (within the meaning of Section 7701(a)(30) of the Code) have authority to control all substantial decisions of the trust or (y) that has made a valid election to be treated as a U.S. person.
If a partnership (or an entity treated as a partnership for U.S. federal income tax purposes) holds our common stock, the tax treatment of a partner in the partnership will generally depend on the status of the partner and the activities of the partnership. Partnerships that hold our common stock, and partners in such partnerships, should consult their own tax advisors regarding the tax consequences of the acquisition, ownership and disposition of our common stock.
This discussion is limited to non-U.S. holders that will hold our common stock as a capital asset within the meaning of Section 1221 of the Code (generally, property held for investment). This discussion does not address all of the U.S. federal income and estate tax consequences that may be relevant to a non-U.S. holder in light of such holder’s particular circumstances, nor does it deal with special situations, such as:
tax consequences to non-U.S. holders that may be subject to special treatment under U.S. federal income tax laws, including, without limitation, U.S. expatriates, individuals who are not present in the United States for 183 days or more in a year, but who maintain status as non-resident aliens for U.S. federal income tax purposes; insurance companies, tax-exempt or governmental organizations, mutual funds, dealers or traders in securities or currency, banks or other financial institutions, investors whose functional currency is other than the U.S. dollar, “controlled foreign corporations,” “passive foreign investment companies,” common trust funds, certain trusts, and hybrid entities;
tax consequences to investors that hold our common stock as part of a hedge, straddle, synthetic security, conversion transaction or other integrated investment;
any gift tax consequences;
any alternative minimum tax consequences; or
any aspects of state, local or non-U.S. taxation.
Prospective investors should consult their own tax advisors regarding the U.S. federal income and estate tax consequences to them in light of their own particular circumstances, as well as any tax consequences arising under the U.S. federal gift or alternative minimum tax laws and the laws of any state, local or non-U.S. taxing jurisdiction, the effect of any changes in applicable tax law and their entitlement to benefits under any applicable tax treaty.
Distributions on our common stock
We have not made any distributions on our common stock, and we do not plan to make any distributions in the foreseeable future. However, if we do make distributions of cash or other property on our common stock, those distributions will constitute dividends for U.S. tax purposes to the extent paid from our current or accumulated earnings and profits, as determined under U.S. federal income tax principles. To the extent those distributions exceed our current and accumulated earnings and profits, the distributions will constitute a return of capital and will first reduce a non-U.S. holder’s adjusted tax basis in our common stock, but not below zero, and then will be treated as gain from the sale of our common stock (see “—Gain on disposition of common stock).
Any dividends paid to a non-U.S. holder of our common stock generally will be subject to withholding of U.S. federal income tax at a rate of 30%, or such lower rate as may be specified by an applicable tax treaty, of the gross amount of the dividend. To receive the benefit of a reduced treaty rate, a non-U.S. holder must provide us with an Internal Revenue Service (“IRS”) Form W-8BEN (or successor form) or other appropriate version of IRS Form W-8 certifying qualification for the reduced rate. A non-U.S. holder of our common stock that is eligible for a reduced rate of U.S. federal withholding tax under an income tax treaty may obtain a refund from the IRS of any excess amounts withheld by timely filing an appropriate claim for refund with the IRS.
Dividends received by a non-U.S. holder that are effectively connected with a trade or business conducted by the non-U.S. holder in the United States (and, if an applicable tax treaty so provides, are attributable to a permanent establishment or fixed base maintained by the non-U.S. holder in the United States) generally will be exempt from the withholding tax described above and instead will be subject to U.S. federal income tax on a net income basis at the same graduated rates generally applicable to U.S. persons. To obtain this exemption from withholding tax, the non-U.S. holder must provide us with an IRS Form W-8ECI properly certifying eligibility for such exemption. In addition to the income tax described above, dividends received by a corporate non-U.S. holder that are effectively connected with a trade or business conducted by the corporate non-U.S. holder in the United States (and, if an applicable tax treaty so provides, are attributable to a permanent establishment or fixed base maintained by the corporate non-U.S. holder in the United States) may be subject to a branch profits tax at a rate of 30% or such lower rate as may be specified by an applicable tax treaty.
Gain on disposition of common stock
A non-U.S. holder generally will not be subject to U.S. federal income tax on any gain realized upon the sale or other disposition of our common stock unless:
the gain is effectively connected with a trade or business conducted by the non-U.S. holder in the United States (and, if an applicable tax treaty so provides, is attributable to a permanent establishment or fixed base maintained by the non-U.S. holder in the United States), in which case the non-U.S. holder generally will be subject to U.S. federal income tax on any gain realized upon the sale or other disposition on a net income basis at the same graduated rates generally applicable to U.S. persons (furthermore, the branch profits tax described above also may apply to a corporate non-U.S. holder); or
we are or have been a “U.S. real property holding corporation” (“USRPHC”) for U.S. federal income tax purposes at any time within the shorter of the five-year period preceding the date of the sale or other disposition and the non-U.S. holder’s holding period.
Generally, a corporation is a USRPHC if the fair market value of its “United States real property interests” equals or exceeds 50% of the sum of the fair market value of its worldwide real property interests and its other assets used or held for use in a trade or business (all as determined for U.S. federal income tax purposes). For this purpose, real property interests include land, improvements and associated personal property. We believe that we are not presently, and have not been within the preceding five year period, a USRPHC for U.S. federal income tax purposes. If we are a USRPHC at any time during the applicable testing period described above, then, provided that our common stock is considered to be “regularly traded on an established securities market” (within the meaning of Section 897 of the Code and the applicable Treasury regulations) at any time during the calendar year in which the future sale or other disposition occurs, and the non-U.S. holder does not own (directly, indirectly or constructively) at any time during the five-year period ending on the date of the sale or other disposition more than 5% of our common stock, gains realized upon the sale or other disposition of our common stock generally will not be subject to U.S. federal income tax pursuant to the thirdsecond bullet point above. If we are a USRPHC at any time during the applicable testing period described above and our common stock is not considered to be “regularly traded on an established securities market,” upon a future sale or other disposition of our common stock, a non-U.S. holder will be subject to U.S. federal income tax on a net income basis at the same graduated rates generally applicable to U.S. persons and will be subject to U.S. federal income tax withholding on the amount realized from such sale or other disposition at a 10% rate. Non-U.S. holders should consult their own tax advisors with respect to the application of the foregoing rules to their ownership and disposition of our common stock.
U.S. federal estate tax
Our common stock owned or treated as owned by an individual who is not a citizen or resident of the United States (as specifically defined for U.S. federal estate tax purposes) at the time of death will be included in the individual’s gross estate for U.S. federal estate tax purposes and may be subject to U.S. federal estate tax unless an applicable estate tax treaty provides otherwise.
Information reporting and backup withholding
Generally, we must report annually to the IRS the amount of dividends paid to each non-U.S. holder, the name and address of the recipient, and the amount, if any, of tax withheld with respect to those dividends, regardless of whether withholding was required. In addition, except as described below, payments of the proceeds from the sale or other disposition of our common stock are potentially subject to information reporting to the IRS. Pursuant to tax treaties or other agreements, the IRS may make its reports available to tax authorities in the recipient’s country of residence.
Dividends and the proceeds from the sale or other disposition of our common stock are potentially subject to backup withholding (at the applicable rate, which is currently 28%). In general, backup withholding (and information reporting with respect to the proceeds of a sale or other disposition of our common stock) will not apply to payments to a non-U.S. holder if the holder has provided the required certification that it is a non-U.S. holder, such as providing an IRS Form W-8BEN or IRS Form W8-ECI (or appropriate substitute or successor form). Notwithstanding the foregoing, backup withholding (and information reporting) may apply if either we or a broker or other paying agent has actual knowledge, or reason to know, that the beneficial owner is a U.S. person.
Backup withholding is not an additional tax. Any amounts withheld under the backup withholding rules will be allowed as a refund or credit against a holder’s U.S. federal income tax liability, provided that the required information is furnished to the IRS in a timely manner.
Non-U.S. holders should consult their own tax advisors regarding the application of the information reporting and backup withholding rules to them.
Foreign account tax compliance act withholding
Enacted legislation generally will impose, effective for payments made after December 31, 2012, a withholding tax of 30% on dividends on, and the gross proceeds of a sale or other disposition of, our common stock paid to certain foreign entities unless various information and due diligence requirements are satisfied. Non-U.S. holders should consult their own tax advisers regarding the potential application and impact of these new requirements to them based on their particular circumstances.
Underwriting (conflicts of interest)
We and the selling stockholders are offering the shares of common stock described in this prospectus through a number of underwriters. J.P. Morgan Securities LLC, Merrill Lynch, Pierce, Fenner & Smith Incorporated, Credit Suisse Securities (USA) LLC, Citigroup Global Markets Inc. and Deutsche Bank Securities Inc. are acting as representatives of the underwriters. We and the selling stockholders have entered into an underwriting agreement with the underwriters. Subject to the terms and conditions of the underwriting agreement, we and the selling stockholders have agreed to sell to the underwriters, and each underwriter has severally agreed to purchase, at the public offering price less the underwriting discount set forth on the cover page of this prospectus, the number of shares of common stock listed next to its name in the following table.
| Name | Number of shares | |
| ||
J.P. Morgan Securities LLC | ||
Merrill Lynch, Pierce, Fenner & Smith | ||
Incorporated | ||
Credit Suisse Securities (USA) LLC | ||
Citigroup Global Markets Inc. | ||
Deutsche Bank Securities Inc. | ||
Simmons & Company International | ||
Tudor, Pickering, Holt & Co. Securities, Inc. | ||
Capital One Southcoast, Inc. | ||
Dahlman Rose & Company, LLC | ||
FBR Capital Markets & Co. | ||
Howard Weil Incorporated | ||
Johnson Rice & Company L.L.C. | ||
| ||
Total | ||
| ||
The underwriters are committed to purchase all the shares of our common stock offered by us and the selling stockholders if they purchase any shares. The underwriting agreement also provides that if an underwriter defaults, the purchase commitments of non-defaulting underwriters may also be increased or the offering may be terminated.
The underwriters propose to offer the common stock directly to the public at the initial public offering price set forth on the cover page of this prospectus and to certain dealers at that price less a concession not in excess of $ per share. Any such dealers may resell shares to certain other brokers or dealers at a discount of up to $ per share from the initial public offering price. After the initial public offering of the shares, the offering price and other selling terms may be changed by the underwriters. Sales of shares made outside of the United States may be made by affiliates of the underwriters. The representatives have advised us that the underwriters do not intend to confirm discretionary sales in excess of 5% of the common stock offered in this offering.
The underwriters have an option to buy up to additional shares of common stock from us and up to additional shares of common stock from selling stockholders to cover sales of shares by the underwriters which exceed the number of shares specified in the table above. The underwriters have 30 days from the date of this prospectus to exercise this over-allotment option. If any shares are purchased with this over-allotment option, the underwriters will purchase shares in approximately the same proportion as shown in the table above. If any additional shares of common stock are purchased, the underwriters will offer the additional shares on the same terms as those on which the shares are being offered.
The underwriting fee is equal to the public offering price per share of common stock, less the amount paid by the underwriters to us and the selling stockholders per share of common stock. The underwriting fee is $ per share. The following table shows the per share and total underwriting discounts and commissions that we and the selling stockholders are to pay to the underwriters, assuming both no exercise and full exercise of the underwriters’ option to purchase additional shares.
| Per share | Total | |||||||||||||||
| Without over- allotment exercise | With full over- allotment exercise | Without over- allotment exercise | With full over- allotment exercise | |||||||||||||
| ||||||||||||||||
Underwriting discounts and commissions paid by us | $ | $ | $ | $ | ||||||||||||
Expenses payable by us | $ | $ | $ | $ | ||||||||||||
Underwriting discounts and commissions paid by the selling stockholders | $ | $ | $ | $ | ||||||||||||
Expenses payable by the selling stockholders | $ | $ | $ | $ | ||||||||||||
| ||||||||||||||||
We estimate that the total expenses of this offering to us, including registration, filing and listing fees, printing fees, and legal and accounting expenses, but excluding the underwriting discounts and commissions, will be approximately $ .
A prospectus in electronic format may be made available on the websites maintained by one or more underwriters, or selling group members, if any, participating in the offering. The underwriters may agree to allocate a number of shares to underwriters and selling group members for sale to their online brokerage account holders. Internet distributions will be allocated by the representatives to underwriters and selling group members that may make Internet distributions on the same basis as other allocations.
We have agreed that we will not (1) offer, pledge, announce the intention to sell, sell, contract to sell, sell any option or contract to purchase, purchase any option or contract to sell, grant any option, right, or warrant to purchase, or otherwise transfer or dispose of, directly or indirectly, or file with the SEC a registration statement under the Securities Act (other than any registration statement on Form S-8) relating to, any shares of our common stock or securities convertible into or exchangeable or exercisable for any shares of our common stock, or publicly disclose the intention to make any offer, sale, pledge, disposition, or filing, or (2) enter into any swap or other arrangement that transfers all or a portion of the economic consequences associated with the ownership of any shares of common stock or any such other securities (regardless of whether any of these transactions are to be settled by the delivery of shares of common stock or such other securities, in cash or otherwise), in each case without the prior written consent of J.P. Morgan Securities LLC, for a period of 180 days after the date of this prospectus, other than the shares of our common stock to be sold hereunder and the shares of common stock to be sold in the concurrent private placement, common stock contingently issuable under existing acquisition contracts, common stock issued in connection with future acquisitions (subject to a cap of 5%10% of the shares outstanding upon completion of this offering and provided that the recipients of any shares of common stock agree to be bound by the same restrictions on sales), any stock options, restricted stock awards, phantom stock awards, and other equity-based incentive awards to be issued to our directors, officers, employees or consultants in accordance with our stock incentive plan and in compliance with the requirements of the NYSE, and any shares of our common stock to be issued upon the exercise of options or other awards or the vesting or other equity-based incentive awards granted under our stock-based compensation plans.
Notwithstanding the foregoing, if (A) during the last 17 days of the 180-day restricted period, we issue an earnings release or material news or a material event relating to our Company occurs; or (B) prior to the expiration of the 180-day restricted period, we announce that we will release earnings results during the 16-day period beginning on the last day of the 180-day period, the restrictions described above shall continue to apply until the expiration of the 18-day period beginning on the issuance of the earnings release or the occurrence of the material news or material event.
Our directors and executive officers and certain of our principal stockholders and the selling stockholders have entered into lock-up agreements with the underwriters pursuant to which each of these persons or entities, with limited exceptions, for a period of 180 days after the date of this prospectus, may not, without the prior written consent of J.P. Morgan Securities LLC, (1) offer, pledge, sell, contract to sell, sell any option or contract to purchase, purchase any option or contract to sell, grant any option, right or warrant to purchase, or otherwise transfer or dispose of, directly or indirectly, any shares of our common stock or any securities convertible into or exercisable or exchangeable for our common stock (including, without limitation, common stock or such other securities which may be deemed to be beneficially owned by such persons in accordance with the rules and regulations of the SEC and securities which may be issued upon exercise of a stock option or warrant), or publicly disclose the intention to make any offer, sale, pledge, or disposition, (2) enter into any swap or other agreement that transfers, in whole or in part, any of the economic consequences of ownership of the common stock or such other securities, whether any such transaction described in clause (1) or (2) above is to be settled by delivery of common stock or such other securities, in cash, or otherwise, or (3) make any demand for or exercise any right with respect to the registration of any shares of our common stock or any security convertible into or exercisable or exchangeable for our common stock. The lock-up agreements will not restrict the shares of common stock sold by the selling stockholders in this offering or the transfer of common stock as bona fide gifts, so long as, among other things, the transferee agrees to be bound by the restrictions in the lock-up agreements. Subject to certain restrictions, the lock-up agreements also will not restrict the establishment of a trading plan pursuant to Rule 10b5-1 under the Exchange Act for the transfer of shares of our common stock.
Notwithstanding the foregoing, if (A) during the last 17 days of the 180-day restricted period, we issue an earnings release or material news or a material event relating to our Company occurs; or (B) prior to the expiration of the 180-day restricted period, we announce that we will release earnings results during the 16-day period beginning on the last day of the 180-day period, the restrictions described above shall continue to apply until the expiration of the 18-day period beginning on the issuance of the earnings release or the occurrence of the material news or material event.
At our request, the underwriters have reserved for sale, at the initial public offering price, up to 3% of the shares offered by this prospectus for sale to some of our directors, officers, employees, business associates and related persons. If these persons purchase reserved shares, this will reduce the number of shares available for sale to the general public. Any reserved shares that are not so purchased will be offered by the underwriters to the general public on the same terms as the other shares offered by this prospectus.
We and the selling stockholders have agreed to indemnify the underwriters against certain liabilities, including liabilities under the Securities Act.
We have been approved to list our common stock on the NYSE under the symbol “FET.”
In connection with this offering, the underwriters may engage in stabilizing transactions, which involves making bids for, purchasing, and selling shares of common stock in the open market for the purpose of preventing or retarding a decline in the market price of the common stock while
this offering is in progress. These stabilizing transactions may include making short sales of the common stock, which involves the sale by the underwriters of a greater number of shares of common stock than they are required to purchase in this offering, and purchasing shares of common stock on the open market to cover positions created by short sales. Short sales may be “covered” shorts, which are short positions in an amount not greater than the underwriters’ over-allotment option referred to above, or may be “naked” shorts, which are short positions in excess of that amount. The underwriters may close out any covered short position either by exercising their over-allotment option, in whole or in part, or by purchasing shares in the open market. In making this determination, the underwriters will consider, among other things, the price of shares available for purchase in the open market compared to the price at which the underwriters may purchase shares through the over-allotment option. A naked short position is more likely to be created if the underwriters are concerned that there may be downward pressure on the price of the common stock in the open market that could adversely affect investors who purchase in this offering. To the extent that the underwriters create a naked short position, they will purchase shares in the open market to cover the position.
The underwriters have advised us that, pursuant to Regulation M of the Securities Act, they may also engage in other activities that stabilize, maintain, or otherwise affect the price of the common stock, including the imposition of penalty bids. This means that if the representatives of the underwriters purchase common stock in the open market in stabilizing transactions or to cover short sales, the representatives can require the underwriters that sold those shares as part of this offering to repay the underwriting discount received by them.
These activities may have the effect of raising or maintaining the market price of the common stock or preventing or retarding a decline in the market price of the common stock, and, as a result, the price of the common stock may be higher than the price that otherwise might exist in the open market. If the underwriters commence these activities, they may discontinue them at any time. The underwriters may carry out these transactions on the NYSE, in the over-the-counter market, or otherwise.
Prior to this offering, there has been no public market for our common stock. The initial public offering price will be determined by negotiations between us and the representatives of the underwriters. In determining the initial public offering price, we and the representatives of the underwriters expect to consider a number of factors including:
the information set forth in this prospectus and otherwise available to the representatives;
our prospects and the history and prospects for the industry in which we compete;
an assessment of our management;
our prospects for future earnings;
the general condition of the securities markets at the time of this offering;
the recent market prices of, and demand for, publicly traded common stock of generally comparable companies; and
other factors deemed relevant by the underwriters and us.
Neither we nor the underwriters can assure investors that an active trading market will develop for our common stock, or that the shares will trade in the public market at or above the initial public offering price.
European economic area
In relation to each Member State of the European Economic Area which has implemented the Prospectus Directive (each, a “Relevant Member State”), each underwriter has represented and agreed that with effect from and including the date on which the Prospectus Directive is implemented in that Relevant Member State (the “Relevant Implementation Date”) it has not made and will not make an offer of shares to the public in that Relevant Member State prior to the publication of a prospectus in relation to the shares which has been approved by the competent authority in that Relevant Member State or, where appropriate, approved in another Relevant Member State and notified to the competent authority in that Relevant Member State, all in accordance with the Prospectus Directive and the 2010 PD Amending Directive to the extent implemented, except that it may, with effect from and including the Relevant Implementation Date, make an offer of shares to the public in that Relevant Member State at any time:
| (1) | to any legal entity which is a qualified investor as defined in the Prospectus Directive or the 2010 PD Amending Directive if the relevant provision has been implemented; |
| (2) | to fewer than (i) 100 natural or legal persons per Relevant Member State (other than qualified investors as defined in the Prospectus Directive or the 2010 PD Amending Directive if the relevant provision has been implemented) or (ii) if the Relevant Member State has implemented the relevant provision of the 2010 PD Amending Directive, 150 natural or legal persons per Relevant Member State (other than qualified investors as defined in the Prospectus Directive or the 2010 PD Amending Directive if the relevant provision has been implemented), subject to obtaining the prior consent of the relevant Dealer or Dealers nominated by the Issuer for any such offer; or |
| (3) | in any circumstances falling within Article 3(2) of the Prospectus Directive or Article 3(2) of the 2010 PD Amending Directive to the extent implemented. |
For the purposes of this provision, the expression an “offer of shares to the public,” in relation to any shares in any Relevant Member State, means the communication in any form and by any means of sufficient information on the terms of the offer and the shares to be offered so as to enable an investor to decide to purchase or subscribe the shares, as the same may be varied in that Member State by any measure implementing the Prospectus Directive in that Member State and the expression Prospectus Directive means Directive 2003/71/EC and includes any relevant implementing measure in each Relevant Member State and the expression 2010 PD Amending Directive means Directive 2010/73/EC.
Each underwriter has represented and agreed that:
| (1) | it has only communicated or caused to be communicated and will only communicate or cause to be communicated an invitation or inducement to engage in investment activity (within the meaning of Section 21 of the Financial Services and Markets Act 2000 (UK) (“FSMA”)) received by it in connection with the issue or sale of the shares in circumstances in which Section 21(1) of the FSMA does not apply to us; and |
| (2) | it has complied and will comply with all applicable provisions of the FSMA with respect to anything done by it in relation to the shares in, from or otherwise involving the United Kingdom. |
Notice to prospective investors in Switzerland
This document does not constitute an issue prospectus within the meaning of Art. 652a of the Swiss Code of Obligations. The shares of common stock may not be sold directly or indirectly in or into Switzerland except in a manner which will not result in a public offering within the meaning of the Swiss Code of Obligations. Our common stock will not be listed on the SWX Swiss Exchange and, therefore, the documents relating to our common stock, including, but not limited to, this document, do not claim to comply with the disclosure standards of the listing rules of SWX Swiss Exchange and corresponding prospectus schemes annexed to the listing rules of the SWX Swiss Exchange. This document as well as any other material relating to our common stock is personal and confidential and does not constitute an offer to any other person. This document may only be used in Switzerland by those investors to whom it has been handed out in connection with the offering described herein and may neither directly nor indirectly be distributed or made available to other persons without our express consent. It may not be used in connection with any other offer and shall in particular not be copied and/or distributed to the public in (or from) Switzerland. Neither this document nor any other offering materials relating to the shares of common stock may be distributed, published, or otherwise made available in Switzerland except in a manner which will not constitute a public offer of the shares of common stock in Switzerland.
Notice to prospective investors in Hong Kong
The shares may not be offered or sold by means of any document other than (1) in circumstances which do not constitute an offer to the public within the meaning of the Companies Ordinance (Cap.32, Laws of Hong Kong), or (2) to “professional investors” within the meaning of the Securities and Futures Ordinance (Cap.571, Laws of Hong Kong) and any rules made thereunder or (3) in other circumstances which do not result in the document being a “prospectus” within the meaning of the Companies Ordinance (Cap.32, Laws of Hong Kong), and no advertisement, invitation or document relating to the shares may be issued or may be in the possession of any person for the purpose of issue (in each case whether in Hong Kong or elsewhere), which is directed at, or the contents of which are likely to be accessed or read by, the public in Hong Kong (except if permitted to do so under the laws of Hong Kong) other than with respect to shares which are or are intended to be disposed of only to persons outside Hong Kong or only to “professional investors” within the meaning of the Securities and Futures Ordinance (Cap. 571, Laws of Hong Kong) and any rules made thereunder.
Notice to prospective investors in Singapore
This prospectus has not been registered as a prospectus with the Monetary Authority of Singapore. Accordingly, this prospectus and any other document or material in connection with the offer or sale, or invitation for subscription or purchase, of the shares may not be circulated or distributed, nor may the shares be offered or sold, or be made the subject of an invitation for subscription or purchase, whether directly or indirectly, to persons in Singapore other than (1) to an institutional investor under Section 274 of the Securities and Futures Act, Chapter 289 of
Singapore (the “SFA”), (2) to a relevant person, or any person pursuant to Section 275(1A), and in accordance with the conditions, specified in Section 275 of the SFA or (3) otherwise pursuant to, and in accordance with the conditions of, any other applicable provision of the SFA.
Where the shares are subscribed or purchased under Section 275 by a relevant person which is: (1) a corporation (which is not an accredited investor) the sole business of which is to hold
investments and the entire share capital of which is owned by one or more individuals, each of whom is an accredited investor; or (2) a trust (where the trustee is not an accredited investor) whose sole purpose is to hold investments and each beneficiary is an accredited investor, shares, debentures and units of shares and debentures of that corporation or the beneficiaries’ rights and interest in that trust shall not be transferable for 6 months after that corporation or that trust has acquired the shares under Section 275 except: (1) to an institutional investor under Section 274 of the SFA or to a relevant person, or any person pursuant to Section 275(1A), and in accordance with the conditions, specified in Section 275 of the SFA; (2) where no consideration is given for the transfer; or (3) by operation of law.
Notice to prospective investors in Japan
The securities have not been and will not be registered under the Financial Instruments and Exchange Law of Japan (the “Financial Instruments and Exchange Law”) and each underwriter has agreed that it will not offer or sell any securities, directly or indirectly, in Japan or to, or for the benefit of, any resident of Japan (which term as used herein means any person resident in Japan, including any corporation or other entity organized under the laws of Japan), or to others for re-offering or resale, directly or indirectly, in Japan or to a resident of Japan, except pursuant to an exemption from the registration requirements of, and otherwise in compliance with, the Financial Instruments and Exchange Law and any other applicable laws, regulations and ministerial guidelines of Japan.
Notice to prospective investors in the Dubai International Finance Centre
This prospectus relates to an Exempt Offer in accordance with the Offered Securities Rules of the Dubai Financial Services Authority (“DFSA”). This prospectus is intended for distribution only to persons of a type specified in the Offered Securities Rules of the DFSA. It must not be delivered to, or relied on by, any other person. The DFSA has no responsibility for reviewing or verifying any documents in connection with Exempt Offers. The DFSA has not approved this prospectus nor taken steps to verify the information set forth herein and has no responsibility for this prospectus. The securities to which this prospectus relates may be illiquid and/or subject to restrictions on their resale. Prospective purchasers of the securities offered should conduct their own due diligence on the securities. If you do not understand the contents of this prospectus you should consult an authorized financial advisor.
Relationships with underwriters and their affiliates
The underwriters and their respective affiliates are full service financial institutions engaged in various activities, which may include securities trading, commercial and investment banking, financial advisory, investment management, investment research, principal investment, hedging, financing and brokerage activities. The underwriters and their affiliates have provided in the past to us and our affiliates and may provide from time to time in the future certain commercial
banking, financial advisory, investment banking, and other services in the ordinary course of their business, for which they have received and may continue to receive customary fees and commissions. Affiliates of each of the underwriters are lenders under our credit agreement. See “—Conflicts of interest.”
In the ordinary course of their various business activities, the underwriters and their respective affiliates may make or hold a broad array of investments and actively trade debt and equity
securities (or related derivative securities) and financial instruments (including bank loans) for their own account and for the accounts of their customers, and such investment and securities activities may involve our securities and/or instruments. The underwriters and their respective affiliates may also make investment recommendations and/or publish or express independent research views in respect of such securities or instruments. In addition, from time to time, certain of the underwriters and their affiliates may at any time hold, on behalf of themselves or their customers, or recommend to clients that they acquire, long or short positions in our equity or debt securities or loans.
Conflicts of interest
Affiliates of J.P. Morgan Securities LLC, Merrill Lynch, Pierce, Fenner & Smith Incorporated, Credit Suisse Securities (USA) LLC, Citigroup Global Markets Inc. and Deutsche Bank Securities Inc. are lenders under our credit agreement and may receive more than 5% of the net proceeds of this offering in connection with the repayment of amounts under our credit agreement. Accordingly, this offering is being made in compliance with the requirements of Rule 5121 of the Financial Industry Regulatory Authority, Inc. In accordance with this rule, Tudor, Pickering, Holt & Co. Securities Inc. has assumed the responsibilities of acting as a “qualified independent underwriter.” In its role as a qualified independent underwriter, Tudor, Pickering, Holt & Co. Securities Inc. has participated in due diligence and the preparation of the registration statement of which this prospectus is a part. Tudor, Pickering, Holt & Co. Securities Inc. will not receive any additional fees for serving as a qualified independent underwriter in connection with this offering. Such underwriters will not confirm sales of the shares to any account over which they exercise discretionary authority without the prior written approval of the customer. We have agreed to indemnify Tudor, Pickering, Holt & Co. Securities Inc. against certain liabilities incurred in connection with acting as a “qualified independent underwriter,” including liabilities under the Securities Act.
The validity of our common stock offered by this prospectus will be passed upon for Forum Energy Technologies, Inc., by Vinson & Elkins L.L.P., Houston, Texas. Certain legal matters in connection with this offering will be passed upon for the underwriters by Baker Botts L.L.P., Houston, Texas. Baker Botts L.L.P. represents us from time to time in matters unrelated to this offering.
The audited financial statements of Forum Energy Technologies, Inc. included in this prospectus, except as they relate to 2008 and 2009 financial statements of Allied Production Services, Inc. (“Allied”), Subsea Services International, Inc. (“Subsea”) and Triton Group Holdings LLC (“Triton”), have been audited by PricewaterhouseCoopers LLP, an independent registered public accounting firm. Such financial statements, except as they relate to Allied, Subsea and Triton, have been so included in reliance on the report (which contains an explanatory paragraph relating to the Company’s combination as described in Note 1 to the financial statements) of such independent registered public accounting firm given on the authority of such firm as experts in auditing and accounting.
The audited 2008 financial statements of Allied and the audited 2008 and 2009 financial statements of Subsea and Triton, not separately presented in this prospectus, have been audited by Deloitte & Touche LLP, Pannell Kerr Forster of Texas, P.C., and Deloitte LLP, respectively, each an independent registered public accounting firm, whose reports thereon appear herein. The audited financial statements of Forum Energy Technologies, Inc., to the extent they relate to Allied, Subsea or Triton, have been so included in reliance on the reports of such independent registered public accounting firms given on the authority of said firms as experts in auditing and accounting.
The consolidated financial statements of Allied Production Services, Inc. and Subsidiaries at December 31, 2009, and for the year then ended, not presented separately herein in this Prospectus and Registration Statement have been audited by Ernst & Young LLP, independent registered public accounting firm, as set forth in their report thereon appearing elsewhere herein. The audited financial statements of Forum Energy Technologies, Inc. and Subsidiaries are included in reliance upon such report given on the authority of such firm as experts in accounting and auditing.
The financial statements of Davis-Lynch, Inc. as of December 31, 2009 and 2010 and for each of the threetwo years in the period ended December 31, 2010 included in this prospectus have been so included in reliance on the report of UHY LLP, an independent registered public accounting firm, given on the authority of said firm as experts in auditing and accounting.
The financial statements of Wood Flowline LLC as of December 31, 2010 and for the year then ended included in this prospectus have been so included in reliance on the report of PricewaterhouseCoopers LLP, an independent registered public accounting firm, given on the authority of said firm as experts in auditing and accounting.
The financial statements of AMC Global Group Limited as of April 30, 2011 and for the year then ended included in this prospectus have been so included in reliance on the report of
PricewaterhouseCoopers LLP (which contains an explanatory paragraph relating to differences in accounting principles as described in Note 2), an independent registered public accounting firm, given on the authority of said firm as experts in auditing and accounting.
The financial statements of P-Quip Limited as of May 31, 2011 and for the year then ended included in this prospectus have been so included in reliance on the report of PricewaterhouseCoopers LLP (which contains an explanatory paragraph relating to differences in accounting principles as described in Note 2), an independent registered public accounting firm, given on the authority of said firm as experts in auditing and accounting.
The financial statements of Cannon Services, Ltd as of December 31, 2010 and for the year then ended included in this prospectus have been so included in reliance on the report of PricewaterhouseCoopers LLP, an independent registered public accounting firm, given on the authority of said firm as experts in auditing and accounting.
Where you can find more information
We have filed with the SEC a registration statement on Form S-1 (including the exhibits, schedules and amendments thereto) under the Securities Act, with respect to the shares of our common stock offered hereby. This prospectus does not contain all of the information set forth in the registration statement and the exhibits and schedules thereto. For further information with respect to us and the common stock offered hereby, we refer you to the registration statement and the exhibits and schedules filed therewith. Statements contained in this prospectus as to the contents of any contract, agreement or any other document are summaries of the material terms of this contract, agreement or other document. With respect to each of these contracts, agreements or other documents filed as an exhibit to the registration statement, reference is made to the exhibits for a more complete description of the matter involved. A copy of the registration statement, and the exhibits and schedules thereto, may be inspected without charge at the public reference facilities maintained by the SEC at 100 F Street NE, Washington, D.C. 20549. Copies of these materials may be obtained, upon payment of a duplicating fee, from the Public Reference Section of the SEC at 100 F Street NE, Washington, D.C. 20549. Please call the SEC at 1-800-SEC-0330 for further information on the operation of the public reference facility. The SEC maintains a website that contains reports, proxy and information statements and other information regarding registrants that file electronically with the SEC. The address of the SEC’s website ishttp://www.sec.gov.
After we have completed this offering, we will file annual, quarterly and current reports, proxy statements and other information with the SEC. We maintain a website athttp://www.f-e-t.com and we expect to make our periodic reports and other information filed with or furnished to the SEC available, free of charge, through our website, as soon as reasonably practicable after those reports and other information are electronically filed with or furnished to the SEC. Information on our website or any other website is not incorporated by reference into this prospectus and does not constitute a part of this prospectus. We will provide electronic or paper copies of our filings free of charge upon request.
Forum Energy Technologies, Inc. and subsidiaries
Index to consolidated financial statements
December 31, 2008, 2009, 2010 and 20102011
| Page(s) | |||||||
Forum Energy Technologies, Inc. Consolidated Financial Statements | |||||||
Audited Financial Statements | |||||||
Consolidated Balance Sheets at December 31, | |||||||
Consolidated Statements of Income For the Years Ended December 31, | |||||||
Consolidated Statements of Cash Flows For the Years Ended December 31, | |||||||
| |||||||
| |||||||
| |||||||
| |||||||
Davis-Lynch, Inc. Financial Statements | |||||||
Audited Financial Statements for the Year Ended December 31, 2010 | |||||||
Interim Financial Statements for the Six Months Ended June 30, 2010 and 2011 | |||||||
Report of independent registered public accounting firm
To the Stockholders of
Forum Energy Technologies, Inc.
In our opinion, based on our audits and the reports of other auditors, the accompanying consolidated balance sheets and the related consolidated statements of income, of stockholders’ equity and of cash flows present fairly, in all material respects, the financial position of Forum Energy Technologies, Inc. (formerly Forum Oilfield Technologies, Inc.) and its subsidiaries (“the Company”) at December 31, 20092010 and 2010,2011, and the results of their operations and their cash flows for each of the three years in the period ended December 31, 20102011 in conformity with accounting principles generally accepted in the United States of America. These financial statements are the responsibility of the Company’s management. Our responsibility is to express an opinion on these financial statements based on our audits. We did not audit the 2008 and 2009 financial statements of Allied Production Services, Inc. (“Allied”), Subsea Services International, Inc. (“SSI”) and Triton Group Holdings LLC (“Triton”), all wholly-owned subsidiaries of the Company, whose statements reflect total assets of $382,438,000 as of December 31, 2009, and total revenues of $380,496,000 and $287,279,000 for the yearsyear ended December 31, 2008 and 2009, respectively.2009. Those statements were audited by other auditors whose reports thereon have been furnished to us, and our opinion expressed herein, insofar as it relates to the amounts included for Allied, SSI and Triton, is based solely on the reports of the other auditors. We conducted our audits of these statements in accordance with the standards of the Public Company Accounting Oversight Board (United States). Those standards require that we plan and perform the audit to obtain reasonable assurance about whether the financial statements are free of material misstatement. An audit includes examining, on a test basis, evidence supporting the amounts and disclosures in the financial statements, assessing the accounting principles used and significant estimates made by management, and evaluating the overall financial statement presentation. We believe that our audits and the reports of other auditors provide a reasonable basis for our opinion.
As discussed in Note 1 to the consolidated financial statements, on August 2, 2010 the Company completed the combination of the Company with Allied, SSI, Triton and Global Flow Technologies, Inc. Prior to the combination, all of the companies were under the common control of three private equity funds with the same sponsor.
/s/ PricewaterhouseCoopers LLP
Houston, Texas
August 31, 2011March 14, 2012
Report of independent registered public accounting firm
To the Board of Directors of
Triton Group Holdings LLC
We have audited the consolidated balance sheet of Triton Group Holdings LLC (the “Company”) as of December 31, 2009, and the related consolidated statements of income, comprehensive income, members’ equity, and cash flows of Triton Group Holdings LLC (the “Company”) (a wholly owned subsidiary of Forum Energy Technologies, Inc.) for the two years then ended.year ended December 31, 2009. These financial statements are the responsibility of the Company’s management. Our responsibility is to express an opinion on these financial statements based on our audits.audit.
We conducted our auditsaudit in accordance with the standards of the Public Company Accounting Oversight Board (United States). Those standards require that we plan and perform the audit to obtain reasonable assurance about whether the financial statements are free of material misstatement. The Company is not required to have, nor were we engaged to perform, an audit of its internal control over financial reporting. Our auditsaudit included consideration of internal control over financial reporting as a basis for designing audit procedures that are appropriate in the circumstances, but not for the purpose of expressing an opinion on the effectiveness of the Company’s internal control over financial reporting. Accordingly, we express no such opinion. An audit also includes examining, on a test basis, evidence supporting the amounts and disclosures in the financial statements, assessing the accounting principles used and significant estimates made by management, as well as evaluating the overall financial statement presentation. We believe that our audits provideaudit provides a reasonable basis for our opinion.
In our opinion, such financial statements present fairly, in all material respects, the consolidated financial positionresults of operations and cash flows of Triton Group Holdings LLC as offor the year ended December 31, 2009 and the results of its operations and its cash flows for the two years then ended in conformity with accounting principles generally accepted in the United States of America.
/s/ DELOITTE LLP
Aberdeen, United Kingdom
July 14, 2010
REPORT OF INDEPENDENT REGISTERED PUBLIC ACCOUNTING FIRMReport of independent registered public accounting firm
The Board of Directors and Shareholders of Allied Production Services, Inc.
We have audited the consolidated balance sheet of Allied Production Services, Inc. and Subsidiaries as of December 31, 2009, and the related consolidated statements of operations, shareholders’ equity, and cash flows for the year then ended (not presented separately herein). These financial statements are the responsibility of the Company’s management. Our responsibility is to express an opinion on these financial statements based on our audit.
We conducted our audit in accordance with the standards of the Public Company Accounting Oversight Board (United States). Those standards require that we plan and perform the audit to obtain reasonable assurance about whether the financial statements are free of material misstatement. We were not engaged to perform an audit of the Company’s internal control over financial reporting. Our audit included consideration of internal control over financial reporting as a basis for designing audit procedures that are appropriate in the circumstances, but not for the purpose of expressing an opinion on the effectiveness of the Company’s internal control over financial reporting. Accordingly, we express no such opinion. An audit also includes examining, on a test basis, evidence supporting the amounts and disclosures in the financial statements, assessing the accounting principles used and significant estimates made by management, and evaluating the overall financial statement presentation. We believe that our audit provides a reasonable basis for our opinion.
In our opinion, the financial statements referred to above present fairly, in all material respects, the consolidated financial position of Allied Production Services, Inc. and Subsidiaries at December 31, 2009, and the consolidated results of their operations and their cash flows for the year then ended, in conformity with U.S. generally accepted accounting principles.
/s/ Ernst & Young LLP
Houston, Texas
August 26, 2011
Report ofindependent registered public accounting firm
To the Board of Directors and Management of
Allied Production Services, Inc.
We have audited the consolidated statements of operations and cash flows of Allied Production Services, Inc. and subsidiaries (the “Company”), for the year ended December 31, 2008. The statements of operations and cash flows are the responsibility of the Company’s management. Our responsibility is to express an opinion on the statements of operations and cash flows based on our audit.
We conducted our audit in accordance with auditing standards of the Public Company Accounting Oversight Board (United States). Those standards require that we plan and perform the audit to obtain reasonable assurance about whether the statements of operations and cash flows are free of material misstatement. The Company is not required to have, nor were we engaged to perform, an audit of its internal control over financial reporting. Our audit included consideration of internal control over financial reporting as a basis for designing audit procedures that are appropriate in the circumstances, but not for the purpose of expressing an opinion on the effectiveness of the Company’s internal control over financial reporting. Accordingly, we express no such opinion. An audit also includes examining, on a test basis, evidence supporting the amounts and disclosures in the statements of operations and cash flows, assessing the accounting principles used and significant estimates made by management, as well as evaluating the overall statements of operations and cash flows presentation. We believe that our audit provides a reasonable basis for our opinion.
In our opinion, such consolidated statements of operations and cash flows present fairly, in all material respects, the results of operations and cash flows of the Company for the year ended December 31, 2008, in conformity with accounting principles generally accepted in the United States of America.
/s/ Deloitte & Touche LLP
Dallas, Texas
May 29, 2009
Report of independent registered public accounting firm
Board of Directors and Shareholders of
Subsea Services International, Inc.
We have audited the accompanying consolidated balance sheets of Subsea Services International, Inc. (the “Company”) as of December 31, 2008 and 2009 and the related consolidated statements of income, changes in stockholders’ equity, and cash flows of Subsea Services International, Inc. (the “Company”) for the years then ended.year ended December 31, 2009. These financial statements are the responsibility of the Company’s management. Our responsibility is to express an opinion on these financial statements based on our audits.
We conducted our audits in accordance with the standards of the Public Company Accounting Oversight Board (United States). Those standards require that we plan and perform the audits to obtain reasonable assurance about whether the financial statements are free of material misstatement. The Company is not required to have, nor were we engaged to perform, an audit of its internal control over financial reporting. Our audits included consideration of internal control over financial reporting as a basis for designing audit procedures that are appropriate in the circumstances, but not for the purposes of expressing an opinion on the effectiveness of the Company’s internal control over financial reporting. Accordingly, we express no such opinion. An audit also includes examining, on a test basis, evidence supporting the amounts and disclosures in the financial statements, assessing the accounting principles used and significant estimates made by management, as well as evaluating the overall financial statement presentation. We believe that our audits provide a reasonable basis for our opinion.
In our opinion, the financialconsolidated statements referred to above presentof income, changes in stockholders’ equity, and cash flows of Subsea Services International, Inc. for the year ended December 31, 2009 are presented fairly, in all material respects, the consolidated financial position of Subsea Services International, Inc. as of December 31, 2008 and 2009, and the consolidated results of its operations and its cash flows for the years then ended in conformity with United States generally accepted accounting principlesprinciples.
/s/ Pannell Kerr Forster of Texas, P.C.
Houston, Texas
March 30, 2010
Forum Energy Technologies, Inc. and subsidiaries
Consolidated balance sheets
at December 31, 20092010 and 20102011
| 2010 | 2011 | |||||||||||||||
| 2009 | 2010 |
| ||||||||||||||
| (in thousands of dollars, except share information) | (in thousands of dollars, except share information) | |||||||||||||||
|
| |||||||||||||||
Assets | ||||||||||||||||
Current assets | ||||||||||||||||
Cash and cash equivalents | $ | 26,894 | $ | 20,348 | $ | 20,348 | $ | 20,548 | ||||||||
Accounts receivable—trade, net | 106,377 | 117,656 | 117,656 | 228,686 | ||||||||||||
Inventories, net | 168,628 | 173,777 | ||||||||||||||
Inventories | 173,777 | 324,638 | ||||||||||||||
Prepaid expenses and other current assets | 21,232 | 18,051 | 18,051 | 14,372 | ||||||||||||
Costs and estimated profits in excess of billings | 7,060 | 3,660 | 3,660 | 11,706 | ||||||||||||
Deferred income taxes, net | 9,768 | 8,615 | 8,615 | 18,636 | ||||||||||||
Current assets of discontinued operations | 230 | — | ||||||||||||||
|
|
|
| |||||||||||||
Total current assets | 340,189 | 342,107 | 342,107 | 618,586 | ||||||||||||
Property and equipment, net of accumulated depreciation | 96,747 | 90,632 | 90,632 | 124,840 | ||||||||||||
Deferred financing costs, net | 7,249 | 6,458 | 6,458 | 10,131 | ||||||||||||
Intangibles, net | 91,615 | 80,159 | 80,159 | 241,314 | ||||||||||||
Goodwill | 300,576 | 294,381 | 294,381 | 600,827 | ||||||||||||
Other long-term assets | 3,850 | 4,595 | 4,595 | 11,617 | ||||||||||||
|
|
|
| |||||||||||||
Total assets | $ | 840,226 | $ | 818,332 | $ | 818,332 | $ | 1,607,315 | ||||||||
|
|
|
| |||||||||||||
Liabilities and Equity | ||||||||||||||||
Current liabilities | ||||||||||||||||
Current portion of long-term debt and capital lease obligations | $ | 34,940 | $ | 3,209 | $ | 3,209 | $ | 5,176 | ||||||||
Accounts payable—trade | 50,484 | 61,981 | 61,981 | 97,642 | ||||||||||||
Accrued liabilities and other current liabilities | 43,246 | 44,542 | 44,542 | 92,251 | ||||||||||||
Contingent consideration liability | — | 41,800 | ||||||||||||||
Deferred revenue | 6,729 | 7,130 | 7,130 | 12,692 | ||||||||||||
Billings in excess of costs and profits recognized | 12,659 | 7,889 | 7,889 | 4,906 | ||||||||||||
Derivative instruments | 445 | 2,194 | 2,194 | 185 | ||||||||||||
Liabilities from discontinued operations | 773 | — | ||||||||||||||
|
|
|
| |||||||||||||
Total current liabilities | 149,276 | 126,945 | 126,945 | 254,652 | ||||||||||||
Long-term debt, net of current portion | 236,937 | 204,715 | 204,715 | 660,379 | ||||||||||||
Deferred income taxes, net | 24,928 | 20,368 | 20,368 | 35,103 | ||||||||||||
Derivative instruments | 5,562 | 2,162 | 2,162 | 1,588 | ||||||||||||
Other long-term liabilities | 3,093 | 1,065 | 1,065 | 461 | ||||||||||||
Mandatorily redeemable preferred stock | 18,062 | — | ||||||||||||||
|
|
|
| |||||||||||||
Total liabilities | 437,858 | 355,255 | 355,255 | 952,183 | ||||||||||||
|
|
|
| |||||||||||||
Commitments and contingencies | ||||||||||||||||
Equity | ||||||||||||||||
Preferred stock | 62 | — | ||||||||||||||
Series A and B units | 2,064 | — | ||||||||||||||
Common stock, $0.01 par value, 8,000,000 shares authorized, 1,555,514 and 1,317,290 shares issued and outstanding, respectively | 13 | 16 | ||||||||||||||
Common stock, $0.01 par value, 8,000,000 shares authorized, 1,555,514 and 1,836,325 shares issued and outstanding, respectively | 16 | 18 | ||||||||||||||
Additional paid-in capital | 281,144 | 342,217 | 342,217 | 425,127 | ||||||||||||
Warrants | — | 7,825 | 7,825 | 27,097 | ||||||||||||
Retained earnings | 126,865 | 150,803 | 150,803 | 244,145 | ||||||||||||
Treasury stock | (661 | ) | (25,823 | ) | (25,823 | ) | (25,877 | ) | ||||||||
Accumulated other comprehensive loss | (7,560 | ) | (12,515 | ) | (12,515 | ) | (16,017 | ) | ||||||||
|
|
|
| |||||||||||||
Total stockholders’ equity | 401,927 | 462,523 | 462,523 | 654,493 | ||||||||||||
Noncontrolling interest in subsidiary | 441 | 554 | 554 | 639 | ||||||||||||
|
|
|
| |||||||||||||
Total equity | 402,368 | 463,077 | 463,077 | 655,132 | ||||||||||||
|
|
|
| |||||||||||||
Total liabilities and equity | $ | 840,226 | $ | 818,332 | $ | 818,332 | $ | 1,607,315 | ||||||||
|
|
| ||||||||||||||
The accompanying notes are an integral part of these consolidated financial statements.
Forum Energy Technologies, Inc. and subsidiaries
Consolidated statements of income
For the years ended December 31, 2008, 2009, 2010 and 20102011
| 2008 | 2009 | 2010 | 2009 | 2010 | 2011 | |||||||||||||||||||
| (in thousands of dollars, except share information) |
| |||||||||||||||||||||||
|
| (in thousands of dollars, except share information) | ||||||||||||||||||||||
Net sales | $ | 972,551 | $ | 677,378 | $ | 747,335 | $ | 677,378 | $ | 747,335 | $ | 1,128,131 | ||||||||||||
Cost of sales | 691,824 | 491,463 | 533,078 | 491,463 | 533,078 | 765,670 | ||||||||||||||||||
|
|
|
| |||||||||||||||||||||
Gross profit | 280,727 | 185,915 | 214,257 | 185,915 | 214,257 | 362,461 | ||||||||||||||||||
|
|
|
| |||||||||||||||||||||
Operating expenses | ||||||||||||||||||||||||
Selling, general and administrative expenses | 146,943 | 128,562 | 141,441 | 128,562 | 141,441 | 186,774 | ||||||||||||||||||
Contingent consideration | — | — | 12,100 | |||||||||||||||||||||
Transaction expenses | — | — | 3,608 | |||||||||||||||||||||
Impairment of goodwill and other intangible assets | 44,015 | 7,009 | — | 7,009 | — | — | ||||||||||||||||||
(Gain) loss on sale of assets | (619 | ) | 137 | (461 | ) | 137 | (461 | ) | (634 | ) | ||||||||||||||
|
|
|
| |||||||||||||||||||||
Total operating expenses | 190,339 | 135,708 | 140,980 | 135,708 | 140,980 | 201,848 | ||||||||||||||||||
|
|
|
| |||||||||||||||||||||
Income from operations | 90,388 | 50,207 | 73,277 | 50,207 | 73,277 | 160,613 | ||||||||||||||||||
|
|
|
| |||||||||||||||||||||
Other expense (income) | ||||||||||||||||||||||||
Expenses related to the combination | — | — | 6,968 | — | 6,968 | — | ||||||||||||||||||
Deferred loan costs written off | — | — | 6,082 | — | 6,082 | — | ||||||||||||||||||
Interest expense | 24,704 | 19,451 | 18,189 | 19,451 | 18,189 | 19,532 | ||||||||||||||||||
Other, net | (2,065 | ) | (1,088 | ) | (2,308 | ) | (1,088 | ) | (2,308 | ) | 378 | |||||||||||||
|
|
|
| |||||||||||||||||||||
Total other expense (income) | 22,639 | 18,363 | 28,931 | |||||||||||||||||||||
Total other expense | 18,363 | 28,931 | 19,910 | |||||||||||||||||||||
|
|
|
| |||||||||||||||||||||
Income from continuing operations before income taxes | 67,749 | 31,844 | 44,346 | 31,844 | 44,346 | 140,703 | ||||||||||||||||||
Provision for income tax expense | 32,938 | 11,011 | 20,297 | 11,011 | 20,297 | 47,110 | ||||||||||||||||||
|
|
|
| |||||||||||||||||||||
Income from continuing operations | 34,811 | 20,833 | 24,049 | 20,833 | 24,049 | 93,593 | ||||||||||||||||||
Loss from discontinued operations, net of taxes | (396 | ) | (1,342 | ) | — | (1,342 | ) | — | — | |||||||||||||||
|
|
|
| |||||||||||||||||||||
Net income | 34,415 | 19,491 | 24,049 | 19,491 | 24,049 | 93,593 | ||||||||||||||||||
Less: Income attributable to noncontrolling interest | (39 | ) | (155 | ) | (111 | ) | (155 | ) | (111 | ) | (251 | ) | ||||||||||||
|
|
|
| |||||||||||||||||||||
Net income attributable to common stockholders | $ | 34,376 | $ | 19,336 | $ | 23,938 | $ | 19,336 | $ | 23,938 | $ | 93,342 | ||||||||||||
|
|
|
| |||||||||||||||||||||
Weighted average shares outstanding | ||||||||||||||||||||||||
Basic | 1,232 | 1,304 | 1,454 | 1,304 | 1,454 | 1,710 | ||||||||||||||||||
Diluted | 1,261 | 1,322 | 1,468 | 1,322 | 1,468 | 1,824 | ||||||||||||||||||
Earnings per share | ||||||||||||||||||||||||
Basic | $ | 27.90 | $ | 14.83 | $ | 16.46 | $ | 14.83 | $ | 16.46 | $ | 54.59 | ||||||||||||
Diluted | 27.26 | 14.63 | 16.31 | 14.63 | 16.31 | 51.17 | ||||||||||||||||||
|
|
| ||||||||||||||||||||||
The accompanying notes are an integral part of these consolidated financial statements.
Forum Energy Technologies, Inc. and subsidiaries
Consolidated statements of changes in stockholders’ equity
For the years ended December 31, 2008, 2009, 2010 and 20102011
| Preferred shares | Triton series A and B | Common stock | Additional paid-in capital | Treasury stock | Warrants | Retained earnings | Accumulated other comprehensive income/(loss) | Total common stockholders’ equity | Non controlling interest | Total equity | ||||||||||||||||||||||||||||||||||||||||||||||
| Shares | Amount | Units | Amount | Shares | Amount | |||||||||||||||||||||||||||||||||||||||||||||||||||
| (in thousands of dollars, except share information) | ||||||||||||||||||||||||||||||||||||||||||||||||||||||||
| ||||||||||||||||||||||||||||||||||||||||||||||||||||||||
Balance at January 1, | 62,000 | $ | 31 | 20,425 | $ | 223 | 1,205,655 | $ | 12 | $ | 227,572 | $ | — | $ | — | $ | 73,418 | $ | 4,662 | $ | 305,918 | $ | 133 | $ | 306,051 | |||||||||||||||||||||||||||||||
Share based compensation expense | — | — | — | — | — | — | 2,177 | — | — | — | — | 2,177 | — | 2,177 | ||||||||||||||||||||||||||||||||||||||||||
Issuance of equity | — | — | — | — | 34,160 | — | 19,743 | — | — | — | — | 19,743 | — | 19,743 | ||||||||||||||||||||||||||||||||||||||||||
Issuance of restricted stock | — | — | — | — | 2,142 | — | — | — | — | — | — | — | — | — | ||||||||||||||||||||||||||||||||||||||||||
Repurchase of stock | — | — | — | — | — | — | — | (410 | ) | — | — | — | (410 | ) | — | (410 | ) | |||||||||||||||||||||||||||||||||||||||
Excess tax benefit from share based compensation | — | — | — | — | — | — | 424 | — | — | — | — | 424 | — | 424 | ||||||||||||||||||||||||||||||||||||||||||
Issuance of stock for acquisitions | — | — | — | — | 15,625 | — | 5,547 | — | — | — | — | 5,547 | — | 5,547 | ||||||||||||||||||||||||||||||||||||||||||
Issuance of preferred stock | 6,820 | 31 | — | — | — | — | 6,820 | — | — | — | — | 6,851 | — | 6,851 | ||||||||||||||||||||||||||||||||||||||||||
Issuance of Series A and B units | — | — | 22,637 | 768 | — | — | — | — | — | — | — | 768 | — | 768 | ||||||||||||||||||||||||||||||||||||||||||
Exercise of warrants | — | — | — | — | 57,857 | 1 | 16,242 | 16,243 | — | 16,243 | ||||||||||||||||||||||||||||||||||||||||||||||
Comprehensive income: | ||||||||||||||||||||||||||||||||||||||||||||||||||||||||
Net income | — | — | — | — | — | — | — | — | — | 34,376 | — | 34,376 | 39 | 34,415 | ||||||||||||||||||||||||||||||||||||||||||
Loss on foreign currency translation, net of tax of $0 | — | — | — | — | — | — | — | — | — | — | (12,278 | ) | (12,278 | ) | (135 | ) | (12,413 | ) | ||||||||||||||||||||||||||||||||||||||
Loss on derivative instruments, net of tax of $1,292 | — | — | — | — | — | — | — | — | — | — | (2,401 | ) | (2,401 | ) | — | (2,401 | ) | |||||||||||||||||||||||||||||||||||||||
|
| |||||||||||||||||||||||||||||||||||||||||||||||||||||||
Comprehensive income / (loss) | 19,697 | (96 | ) | 19,601 | ||||||||||||||||||||||||||||||||||||||||||||||||||||
|
| |||||||||||||||||||||||||||||||||||||||||||||||||||||||
Balance at December 31, 2008 | 68,820 | 62 | 43,062 | 991 | 1,315,439 | 13 | 278,525 | (410 | ) | — | 107,794 | (10,017 | ) | 376,958 | 37 | 376,995 | ||||||||||||||||||||||||||||||||||||||||
| ||||||||||||||||||||||||||||||||||||||||||||||||||||||||
| Preferred shares | Triton series A and B | Common stock | Additional paid-in capital | Treasury stock | Warrants | Retained earnings | Accumulated other comprehensive income/(loss) | Total common stockholders’ equity | Non controlling interest | Total equity | ||||||||||||||||||||||||||||||||||||||||||||||
| Shares | Amount | Units | Amount | Shares | Amount | |||||||||||||||||||||||||||||||||||||||||||||||||||
| ||||||||||||||||||||||||||||||||||||||||||||||||||||||||
| (in thousands of dollars, except share information) | ||||||||||||||||||||||||||||||||||||||||||||||||||||||||
Balance at January 1, 2009 | 68,820 | $ | 62 | 43,062 | $ | 991 | 1,315,439 | $ | 13 | $ | 278,525 | $ | (410 | ) | $ | — | $ | 107,794 | $ | (10,017 | ) | $ | 376,958 | $ | 37 | $ | 376,995 | |||||||||||||||||||||||||||||
Share based compensation expense | 235 | — | — | 1,184 | — | — | 1,832 | — | — | — | — | 3,016 | — | 3,016 | ||||||||||||||||||||||||||||||||||||||||||
Exercise of stock options | — | — | — | — | 607 | — | 76 | — | — | — | — | 76 | — | 76 | ||||||||||||||||||||||||||||||||||||||||||
Issuance of common stock | — | — | — | — | 3,643 | — | 255 | — | — | — | — | 255 | — | 255 | ||||||||||||||||||||||||||||||||||||||||||
Issuance of restricted stock | — | — | — | — | 1,248 | — | — | — | — | — | — | — | — | — | ||||||||||||||||||||||||||||||||||||||||||
Repurchase of stock | — | — | — | — | (291 | ) | — | (97 | ) | (251 | ) | — | — | — | (348 | ) | — | (348 | ) | |||||||||||||||||||||||||||||||||||||
Excess tax benefit from share based compensation | — | — | — | — | — | — | (47 | ) | — | — | — | — | (47 | ) | — | (47 | ) | |||||||||||||||||||||||||||||||||||||||
Issuance of stock for acquisitions | — | — | — | — | — | — | 600 | — | — | — | — | 600 | — | 600 | ||||||||||||||||||||||||||||||||||||||||||
Surrendered restricted stock | — | — | — | — | (3,356 | ) | — | — | — | — | — | — | — | — | — | |||||||||||||||||||||||||||||||||||||||||
Forfeiture of Series A and B | — | — | (3,095 | ) | (111 | )�� | — | — | — | — | — | — | — | (111 | ) | — | (111 | ) | ||||||||||||||||||||||||||||||||||||||
Adoption of uncertain tax positions | — | — | — | — | — | — | — | — | — | (265 | ) | — | (265 | ) | (265 | ) | ||||||||||||||||||||||||||||||||||||||||
Comprehensive income | ||||||||||||||||||||||||||||||||||||||||||||||||||||||||
Net income | — | — | — | — | — | — | — | — | — | 19,336 | — | 19,336 | 155 | 19,491 | ||||||||||||||||||||||||||||||||||||||||||
Gain on foreign currency translation, net of tax of $0 | — | — | — | — | — | — | — | — | — | — | 1,409 | 1,409 | 249 | 1,658 | ||||||||||||||||||||||||||||||||||||||||||
Gain on derivative instruments, net of tax of $564 | — | — | — | — | — | — | — | — | — | — | 1,048 | 1,048 | — | 1,048 | ||||||||||||||||||||||||||||||||||||||||||
|
| |||||||||||||||||||||||||||||||||||||||||||||||||||||||
Comprehensive income | 21,793 | 404 | 22,197 | |||||||||||||||||||||||||||||||||||||||||||||||||||||
|
| |||||||||||||||||||||||||||||||||||||||||||||||||||||||
Balance at December 31, 2009 | 69,055 | 62 | 39,967 | 2,064 | 1,317,290 | 13 | 281,144 | (661 | ) | — | 126,865 | (7,560 | ) | 401,927 | 441 | 402,368 | ||||||||||||||||||||||||||||||||||||||||
| ||||||||||||||||||||||||||||||||||||||||||||||||||||||||
The accompanying notes are an integral part of these consolidated financial statements.
Forum Energy Technologies, Inc. and subsidiaries
Consolidated statements of changes in stockholders’ equity
For the years ended December 31, 2008, 2009, 2010 and 20102011 (continued)
| Preferred shares | Triton series A and B | Common stock | Additional paid-in capital | Treasury stock | Warrants | Retained earnings | Accumulated other comprehensive income/(loss) | Total common stockholders’ equity | Non controlling interest | Total equity | Preferred shares | Triton series A and B | Common stock | Additional paid-in capital | Treasury stock | Warrants | Retained earnings | Accumulated other comprehensive income/(loss) | Total common stockholders’ equity | Non controlling interest | Total equity | |||||||||||||||||||||||||||||||||||||||||||||||||||||||||||||||||||||||||||||||||||||||||||
| Shares | Amount | Units | Amount | Shares | Amount | Shares | Amount | Units | Amount | Shares | Amount | |||||||||||||||||||||||||||||||||||||||||||||||||||||||||||||||||||||||||||||||||||||||||||||||||||||
| (in thousands of dollars, except share information) |
| |||||||||||||||||||||||||||||||||||||||||||||||||||||||||||||||||||||||||||||||||||||||||||||||||||||||||||||||
|
| (in thousands of dollars, except share information) | ||||||||||||||||||||||||||||||||||||||||||||||||||||||||||||||||||||||||||||||||||||||||||||||||||||||||||||||
Share based compensation expense | 235 | — | — | 1,184 | — | — | 1,832 | — | — | — | — | 3,016 | — | 3,016 | — | — | — | 403 | — | — | 4,733 | — | — | — | — | 5,136 | — | 5,136 | ||||||||||||||||||||||||||||||||||||||||||||||||||||||||||||||||||||||||||||||||||||
Exercise of stock options | — | — | — | — | 607 | — | 76 | — | — | — | — | 76 | — | 76 | — | — | — | — | 500 | — | 50 | — | — | — | — | 50 | — | 50 | ||||||||||||||||||||||||||||||||||||||||||||||||||||||||||||||||||||||||||||||||||||
Issuance of common stock | — | — | — | — | 3,643 | — | 255 | — | — | — | — | 255 | — | 255 | — | — | — | — | 9,673 | — | 2,750 | — | — | — | — | 2,750 | — | 2,750 | ||||||||||||||||||||||||||||||||||||||||||||||||||||||||||||||||||||||||||||||||||||
Issuance of restricted stock | — | — | — | — | 1,248 | — | — | — | — | — | — | — | — | — | — | — | — | — | 5,129 | — | — | — | — | — | — | — | — | — | ||||||||||||||||||||||||||||||||||||||||||||||||||||||||||||||||||||||||||||||||||||
Repurchase of stock | — | — | — | — | (291 | ) | — | (97 | ) | (251 | ) | — | — | — | (348 | ) | — | (348 | ) | — | — | — | — | (3,107 | ) | — | (838 | ) | (166 | ) | — | — | — | (1,004 | ) | — | (1,004 | ) | ||||||||||||||||||||||||||||||||||||||||||||||||||||||||||||||||||||||||||
Excess tax benefit from share based compensation | — | — | — | — | — | — | (47 | ) | — | — | — | — | (47 | ) | — | (47 | ) | — | — | — | — | — | — | 38 | — | — | — | — | 38 | — | 38 | |||||||||||||||||||||||||||||||||||||||||||||||||||||||||||||||||||||||||||||||||
Issuance of stock for acquisitions | — | — | — | — | — | — | 600 | — | — | — | — | 600 | — | 600 | ||||||||||||||||||||||||||||||||||||||||||||||||||||||||||||||||||||||||||||||||||||||||||||||||||
Surrendered restricted stock | — | — | — | — | (3,356 | ) | — | — | — | — | — | — | — | — | — | |||||||||||||||||||||||||||||||||||||||||||||||||||||||||||||||||||||||||||||||||||||||||||||||||
Forfeiture of Series A and B | — | — | (3,095 | ) | (111 | ) | — | — | — | — | — | — | — | (111 | ) | — | (111 | ) | ||||||||||||||||||||||||||||||||||||||||||||||||||||||||||||||||||||||||||||||||||||||||||||||
Adoption of uncertain tax positions | — | — | — | — | — | — | — | — | — | (265 | ) | — | (265 | ) | (265 | ) | ||||||||||||||||||||||||||||||||||||||||||||||||||||||||||||||||||||||||||||||||||||||||||||||||
Items related to the combination: | ||||||||||||||||||||||||||||||||||||||||||||||||||||||||||||||||||||||||||||||||||||||||||||||||||||||||||||||||
Issuance of common stock | — | — | — | — | 218,536 | 2 | 62,126 | — | — | — | — | 62,128 | — | 62,128 | ||||||||||||||||||||||||||||||||||||||||||||||||||||||||||||||||||||||||||||||||||||||||||||||||||
Issuance of warrants | — | — | — | — | — | — | (7,825 | ) | — | 7,825 | — | — | — | — | — | |||||||||||||||||||||||||||||||||||||||||||||||||||||||||||||||||||||||||||||||||||||||||||||||||
Purchase of stock related to the tender offer at the time of the combination | — | — | — | — | — | — | — | (24,996 | ) | — | — | — | (24,996 | ) | — | (24,996 | ) | |||||||||||||||||||||||||||||||||||||||||||||||||||||||||||||||||||||||||||||||||||||||||||||||
Purchase of stock related to the conversion of shares | (69,055 | ) | (62 | ) | (39,967 | ) | (2,467 | ) | 7,133 | 1 | 39 | — | — | — | — | (2,489 | ) | — | (2,489 | ) | ||||||||||||||||||||||||||||||||||||||||||||||||||||||||||||||||||||||||||||||||||||||||||||
Comprehensive income | ||||||||||||||||||||||||||||||||||||||||||||||||||||||||||||||||||||||||||||||||||||||||||||||||||||||||||||||||
Net income | — | — | — | — | — | — | — | — | — | 19,336 | — | 19,336 | 155 | 19,491 | — | — | — | — | — | — | — | — | — | 23,938 | — | 23,938 | 111 | 24,049 | ||||||||||||||||||||||||||||||||||||||||||||||||||||||||||||||||||||||||||||||||||||
Gain on foreign currency translation, net of tax of $0 | — | — | — | — | — | — | — | — | — | — | 1,409 | 1,409 | 249 | 1,658 | ||||||||||||||||||||||||||||||||||||||||||||||||||||||||||||||||||||||||||||||||||||||||||||||||||
Gain on derivative instruments, net of tax of $564 | — | — | — | — | — | — | — | — | — | — | 1,048 | 1,048 | — | 1,048 | ||||||||||||||||||||||||||||||||||||||||||||||||||||||||||||||||||||||||||||||||||||||||||||||||||
Loss on foreign currency translation, net of tax of $0 | — | — | — | — | — | — | — | — | — | — | (6,315 | ) | (6,315 | ) | 2 | (6,313 | ) | |||||||||||||||||||||||||||||||||||||||||||||||||||||||||||||||||||||||||||||||||||||||||||||||
Gain on derivative instruments, net of tax of $732 | — | — | — | — | — | — | — | — | — | — | 1,360 | 1,360 | — | 1,360 | ||||||||||||||||||||||||||||||||||||||||||||||||||||||||||||||||||||||||||||||||||||||||||||||||||
|
|
|
| |||||||||||||||||||||||||||||||||||||||||||||||||||||||||||||||||||||||||||||||||||||||||||||||||||||||||||||
Comprehensive income | 21,793 | 404 | 22,197 | 18,983 | 113 | 19,096 | ||||||||||||||||||||||||||||||||||||||||||||||||||||||||||||||||||||||||||||||||||||||||||||||||||||||||||
|
|
|
| |||||||||||||||||||||||||||||||||||||||||||||||||||||||||||||||||||||||||||||||||||||||||||||||||||||||||||||
Balance at December 31, 2009 | 69,055 | 62 | 39,967 | 2,064 | 1,317,290 | 13 | 281,144 | (661 | ) | — | 126,865 | (7,560 | ) | 401,927 | 441 | 402,368 | ||||||||||||||||||||||||||||||||||||||||||||||||||||||||||||||||||||||||||||||||||||||||||||||||
|
| |||||||||||||||||||||||||||||||||||||||||||||||||||||||||||||||||||||||||||||||||||||||||||||||||||||||||||||||
Balance at December 31, 2010 | — | $ | — | — | $ | — | 1,555,154 | $ | 16 | $ | 342,217 | $ | (25,823 | ) | $ | 7,825 | $ | 150,803 | $ | (12,515 | ) | $ | 462,523 | $ | 554 | $ | 463,077 | |||||||||||||||||||||||||||||||||||||||||||||||||||||||||||||||||||||||||||||||||||||
|
| |||||||||||||||||||||||||||||||||||||||||||||||||||||||||||||||||||||||||||||||||||||||||||||||||||||||||||||||
The accompanying notes are an integral part of these consolidated financial statements.
Forum Energy Technologies, Inc. and subsidiaries
Consolidated statements of changes in stockholders’ equity
For the years ended December 31, 2008, 2009, 2010 and 20102011 (continued)
| Preferred shares | Triton series A and B | Common stock | Additional paid-in capital | Treasury stock | Warrants | Retained earnings | Accumulated other comprehensive income/(loss) | Total common stockholders’ equity | Non controlling interest | Total equity | ||||||||||||||||||||||||||||||||||||||||||||||
| Shares | Amount | Units | Amount | Shares | Amount | |||||||||||||||||||||||||||||||||||||||||||||||||||
| (in thousands of dollars, except share information) | ||||||||||||||||||||||||||||||||||||||||||||||||||||||||
| ||||||||||||||||||||||||||||||||||||||||||||||||||||||||
Share based compensation expense | — | — | — | 403 | — | — | 4,733 | — | — | — | — | 5,136 | — | 5,136 | ||||||||||||||||||||||||||||||||||||||||||
Exercise of stock options | — | — | — | — | 500 | — | 50 | — | — | — | — | 50 | — | 50 | ||||||||||||||||||||||||||||||||||||||||||
Issuance of common stock | — | — | — | — | 9,673 | — | 2,750 | — | — | — | — | 2,750 | — | 2,750 | ||||||||||||||||||||||||||||||||||||||||||
Issuance of restricted stock | — | — | — | — | 5,129 | — | — | — | — | — | — | — | — | — | ||||||||||||||||||||||||||||||||||||||||||
Repurchase of stock | — | — | — | — | (3,107 | ) | — | (838 | ) | (166 | ) | — | — | — | (1,004 | ) | — | (1,004 | ) | |||||||||||||||||||||||||||||||||||||
Excess tax benefit from share based compensation | — | — | — | — | — | — | 38 | — | — | — | — | 38 | — | 38 | ||||||||||||||||||||||||||||||||||||||||||
Items related to the combination: | ||||||||||||||||||||||||||||||||||||||||||||||||||||||||
Issuance of common stock | — | — | — | — | 218,536 | 2 | 62,126 | — | — | — | — | 62,128 | — | 62,128 | ||||||||||||||||||||||||||||||||||||||||||
Issuance of warrants | — | — | — | — | — | — | (7,825 | ) | — | 7,825 | — | — | — | — | — | |||||||||||||||||||||||||||||||||||||||||
Purchase of stock related to the tender offer at the time of the combination | — | — | — | — | — | — | — | (24,996 | ) | — | — | — | (24,996 | ) | — | (24,996 | ) | |||||||||||||||||||||||||||||||||||||||
Purchase of stock related to the conversion of shares | (69,055 | ) | (62 | ) | (39,967 | ) | (2,467 | ) | 7,133 | 1 | 39 | — | — | — | — | (2,489 | ) | — | (2,489 | ) | ||||||||||||||||||||||||||||||||||||
Comprehensive income | ||||||||||||||||||||||||||||||||||||||||||||||||||||||||
Net income | — | — | — | — | — | — | — | — | — | 23,938 | — | 23,938 | 111 | 24,049 | ||||||||||||||||||||||||||||||||||||||||||
Loss on foreign currency translation, net of tax of $0 | — | — | — | — | — | — | — | — | — | — | (6,315 | ) | (6,315 | ) | 2 | (6,313 | ) | |||||||||||||||||||||||||||||||||||||||
Gain on derivative instruments, net of tax of $732 | — | — | — | — | — | — | — | — | — | — | 1,360 | 1,360 | — | 1,360 | ||||||||||||||||||||||||||||||||||||||||||
|
| |||||||||||||||||||||||||||||||||||||||||||||||||||||||
Comprehensive income | 18,983 | 113 | 19,096 | |||||||||||||||||||||||||||||||||||||||||||||||||||||
|
| |||||||||||||||||||||||||||||||||||||||||||||||||||||||
Balance at December 31, 2010 | — | $ | — | — | $ | — | 1,555,154 | $ | 16 | $ | 342,217 | $ | (25,823 | ) | $ | 7,825 | $ | 150,803 | $ | (12,515 | ) | $ | 462,523 | $ | 554 | $ | 463,077 | |||||||||||||||||||||||||||||
| ||||||||||||||||||||||||||||||||||||||||||||||||||||||||
Common stock | Additional paid-in capital | Treasury stock | Warrants | Retained earnings | Accumulated other comprehensive income/(loss) | Total common stockholders’ equity | Non controlling interest | Total equity | ||||||||||||||||||||||||||||||||
| Shares | Amount | |||||||||||||||||||||||||||||||||||||||
| ||||||||||||||||||||||||||||||||||||||||
Stock issuance related to acquisition | 92,396 | 1 | 38,954 | — | — | — | — | 38,955 | — | 38,955 | ||||||||||||||||||||||||||||||
Stock issuance | 176,029 | 1 | 54,110 | — | — | — | — | 54,111 | — | 54,111 | ||||||||||||||||||||||||||||||
Restricted stock issuance | 1,790 | — | — | — | — | — | — | — | — | — | ||||||||||||||||||||||||||||||
Restricted stock purchase | 4,075 | — | 1,610 | — | — | — | — | 1,610 | — | 1,610 | ||||||||||||||||||||||||||||||
Restricted stock withheld | (325 | ) | — | — | (54 | ) | — | — | — | (54 | ) | — | (54 | ) | ||||||||||||||||||||||||||
Stock based compensation expense | — | — | 5,156 | — | — | — | — | 5,156 | — | 5,156 | ||||||||||||||||||||||||||||||
Exercised stock options | 7,121 | — | 1,300 | — | — | — | — | 1,300 | — | 1,300 | ||||||||||||||||||||||||||||||
Warrant issuance | — | — | (19,278 | ) | — | 19,278 | — | — | — | — | — | |||||||||||||||||||||||||||||
Exercise of warrants | 85 | — | 31 | — | (6 | ) | — | — | 25 | — | 25 | |||||||||||||||||||||||||||||
Excess tax benefit from share based compensation | — | — | 1,027 | — | — | — | — | 1,027 | — | 1,027 | ||||||||||||||||||||||||||||||
Comprehensive income | ||||||||||||||||||||||||||||||||||||||||
Net income | — | — | — | — | — | 93,342 | — | 93,342 | 251 | 93,593 | ||||||||||||||||||||||||||||||
Change in foreign currency translation | — | — | — | — | — | — | (4,928 | ) | (4,928 | ) | (166 | ) | (5,094 | ) | ||||||||||||||||||||||||||
Gain on derivative instruments, net of tax of $768 | — | — | — | — | — | — | 1,426 | 1,426 | — | 1,426 | ||||||||||||||||||||||||||||||
|
| |||||||||||||||||||||||||||||||||||||||
Comprehensive income | 89,840 | 85 | 89,925 | |||||||||||||||||||||||||||||||||||||
|
|
|
|
|
|
|
| |||||||||||||||||||||||||||||||||
Balance at December 31, 2011 | 1,836,325 | $ | 18 | $ | 425,127 | $ | (25,877 | ) | $ | 27,097 | $ | 244,145 | $ | (16,017 | ) | $ | 654,493 | $ | 639 | $ | 655,132 | |||||||||||||||||||
| ||||||||||||||||||||||||||||||||||||||||
The accompanying notes are an integral part of these consolidated financial statements.
Forum Energy Technologies, Inc. and subsidiaries
Consolidated statements of cash flows
For the years ended December 31, 2008, 2009, 2010 and 20102011
| 2008 | 2009 | 2010 | 2009 | 2010 | 2011 | |||||||||||||||||||
(in thousands of dollars, except share information) |
| |||||||||||||||||||||||
|
| (in thousands of dollars, except share information) | ||||||||||||||||||||||
Cash flows from operating activities | ||||||||||||||||||||||||
Net income | $ | 34,415 | $ | 19,491 | $ | 24,049 | $ | 19,491 | $ | 24,049 | $ | 93,593 | ||||||||||||
Adjustments to reconcile net income to net cash provided by operating activities | ||||||||||||||||||||||||
Deferred loan costs written off | — | — | 6,082 | — | 6,082 | — | ||||||||||||||||||
Contingent consideration | — | — | 12,100 | |||||||||||||||||||||
Noncash interest expense from mandatorily redeemable preferred stock | 972 | 1,464 | — | 1,464 | — | — | ||||||||||||||||||
Impairment of goodwill and other intangible assets | 44,015 | 7,009 | — | 7,009 | — | — | ||||||||||||||||||
Unrealized loss (gain) on interest rate swap | 809 | 1,001 | 441 | 1,001 | 441 | (389 | ) | |||||||||||||||||
Share-based compensation expense | 2,947 | 3,016 | 5,136 | 3,016 | 5,136 | 5,156 | ||||||||||||||||||
Depreciation expense | 21,330 | 24,221 | 21,889 | 24,221 | 21,889 | 26,245 | ||||||||||||||||||
Amortization of deferred loan costs | 1,532 | 1,401 | 1,784 | 1,401 | 1,784 | 2,102 | ||||||||||||||||||
Amortization of intangible assets | 13,584 | 14,217 | 11,327 | 14,217 | 11,327 | 14,530 | ||||||||||||||||||
Provision for doubtful accounts | 1,236 | 2,865 | 955 | 2,865 | 955 | 2,867 | ||||||||||||||||||
Loss (gain) on disposal of fixed assets | (1,515 | ) | 67 | (182 | ) | 67 | (182 | ) | (280 | ) | ||||||||||||||
Deferred income taxes | (893 | ) | (8,123 | ) | (1,178 | ) | (8,123 | ) | (1,178 | ) | (1,482 | ) | ||||||||||||
Changes in operating assets and liabilities | ||||||||||||||||||||||||
Accounts receivable—trade | 12,213 | 38,443 | (13,132 | ) | 38,443 | (13,132 | ) | (62,350 | ) | |||||||||||||||
Income taxes receivable | 352 | (810 | ) | 2,575 | (810 | ) | 2,575 | — | ||||||||||||||||
Inventories | (37,589 | ) | 60,428 | (5,745 | ) | 60,428 | (5,745 | ) | (90,634 | ) | ||||||||||||||
Prepaid expenses and other current assets | (9,355 | ) | 1,338 | (297 | ) | 1,338 | (297 | ) | (10,477 | ) | ||||||||||||||
Cost and estimated profit in excess of billings | (3,839 | ) | 1,420 | 2,550 | 1,420 | 2,550 | (5,210 | ) | ||||||||||||||||
Accounts payable, deferred revenue and other accrued liabilities | 35,982 | (61,846 | ) | 14,167 | (61,846 | ) | 14,167 | 56,256 | ||||||||||||||||
Billings in excess of costs and estimated profits earned | (3,733 | ) | 2,149 | (4,440 | ) | 2,149 | (4,440 | ) | (2,752 | ) | ||||||||||||||
|
|
|
| |||||||||||||||||||||
Net cash provided by operating activities | 112,463 | 107,751 | 65,981 | 107,751 | 65,981 | 39,275 | ||||||||||||||||||
|
|
|
| |||||||||||||||||||||
Cash flows from investing activities | ||||||||||||||||||||||||
Capital expenditures for property and equipment | (39,642 | ) | (15,078 | ) | (19,624 | ) | (15,078 | ) | (19,624 | ) | (41,163 | ) | ||||||||||||
Proceeds from sale of property and equipment | 12,887 | 6,089 | 670 | 6,089 | 670 | 1,062 | ||||||||||||||||||
Capitalized costs related to patents | (143 | ) | (200 | ) | (262 | ) | (200 | ) | (262 | ) | (156 | ) | ||||||||||||
Acquisition of businesses, net of cash acquired | (134,039 | ) | (1,725 | ) | — | (1,725 | ) | — | (509,857 | ) | ||||||||||||||
|
|
|
| |||||||||||||||||||||
Net cash used in investing activities | (160,937 | ) | (10,914 | ) | (19,216 | ) | (10,914 | ) | (19,216 | ) | (550,114 | ) | ||||||||||||
|
|
| ||||||||||||||||||||||
The accompanying notes are an integral part of these consolidated financial statements.
Forum Energy Technologies, Inc. and subsidiaries Consolidated statements of cash flows
Years ended December 31, 2008, 2009, 2010 and 20102011 (continued)
| 2008 | 2009 | 2010 | 2009 | 2010 | 2011 | |||||||||||||||||||
(in thousands of dollars, except share information) |
| |||||||||||||||||||||||
|
| (in thousands of dollars, except share information) | ||||||||||||||||||||||
Cash flows from financing activities | ||||||||||||||||||||||||
Payment of capital lease obligations | (208 | ) | (182 | ) | (627 | ) | (182 | ) | (627 | ) | (310 | ) | ||||||||||||
Borrowings due to acquisitions | 1,725 | — | 509,857 | |||||||||||||||||||||
Borrowings on long-term debt | 132,064 | 8,214 | 323,916 | 6,489 | 323,916 | 10,490 | ||||||||||||||||||
Repayment of long-term debt | (95,750 | ) | (102,342 | ) | (407,360 | ) | (102,342 | ) | (407,360 | ) | (61,973 | ) | ||||||||||||
Deferred financing costs | (2,526 | ) | — | (6,671 | ) | — | (6,671 | ) | (5,935 | ) | ||||||||||||||
Purchased stock due to the combination | — | — | (3,327 | ) | — | (3,327 | ) | — | ||||||||||||||||
Treasury stock | — | (251 | ) | (25,162 | ) | |||||||||||||||||||
Purchases of stock | (251 | ) | (25,162 | ) | (54 | ) | ||||||||||||||||||
Excess tax expense (benefits) from stock based compensation | (424 | ) | (47 | ) | 38 | (47 | ) | 38 | 1,027 | |||||||||||||||
Proceeds from stock issuance | 25,715 | 76 | 64,928 | |||||||||||||||||||||
Proceeds from stock issuances | 76 | 64,928 | 57,046 | |||||||||||||||||||||
|
|
|
| |||||||||||||||||||||
Net cash (used in) provided by financing activities | 58,871 | (94,532 | ) | (54,265 | ) | (94,532 | ) | (54,265 | ) | 510,148 | ||||||||||||||
|
|
|
| |||||||||||||||||||||
Effect of exchange rate changes on cash | (23,143 | ) | 4,648 | 954 | 4,648 | 954 | 891 | |||||||||||||||||
|
|
|
| |||||||||||||||||||||
Net increase (decrease) in cash and cash equivalents | (12,746 | ) | 6,953 | (6,546 | ) | 6,953 | (6,546 | ) | 200 | |||||||||||||||
Cash and cash equivalents | ||||||||||||||||||||||||
Beginning of year | 32,687 | 19,941 | 26,894 | 19,941 | 26,894 | 20,348 | ||||||||||||||||||
|
|
|
| |||||||||||||||||||||
End of year | $ | 19,941 | $ | 26,894 | $ | 20,348 | $ | 26,894 | $ | 20,348 | $ | 20,548 | ||||||||||||
|
|
|
| |||||||||||||||||||||
Supplemental cash flow disclosures | ||||||||||||||||||||||||
Interest paid | $ | 23,289 | $ | 17,817 | $ | 14,219 | $ | 17,817 | $ | 14,219 | $ | 17,700 | ||||||||||||
Income taxes paid | 31,926 | 24,586 | 25,009 | 24,586 | 25,009 | 29,127 | ||||||||||||||||||
Noncash investing and financing activities | ||||||||||||||||||||||||
Acquisition of equipment via capital lease | $ | 969 | $ | 1,424 | $ | — | $ | 1,424 | $ | — | $ | — | ||||||||||||
Acquisition via contingent consideration and stock | 600 | — | 68,754 | |||||||||||||||||||||
Insurance policy financed through notes payable | 3,736 | 2,672 | 3,809 | 2,672 | 3,809 | 1,717 | ||||||||||||||||||
Common stock issued for acquisitions | 23,147 | 600 | — | |||||||||||||||||||||
|
|
| ||||||||||||||||||||||
The accompanying notes are an integral part of these consolidated financial statements.
Forum Energy Technologies, Inc. and subsidiaries
Notes to consolidated financial statements
December 31, 2008, 2009, 2010 and 20102011
1. Nature of operations and combination
Forum Energy Technologies, Inc. (“FET” or the “Company”), a Delaware corporation, is a global provideroilfield products company, serving the subsea, drilling, completion, production and process sectors of manufactured technologiesthe oil and applied products to the energynatural gas industry. The manufacturedCompany designs and manufactures products, include, among other products, pipe handling tools, pressure control equipment, remotely operated vehicles and a wide range ofengages in aftermarket services, parts supply and related subsea products, surface production equipment and industrial valves.services that complement the Company’s product offering. The Company is owned by three private equity funds with the same sponsor, certain current and former employees and directors of the Company and former owners of acquired companies.
On August 2, 2010, the Company completed the combination (“Combination”) of Forum Oilfield Technologies, Inc. (“FOT”), Triton Group Holdings LLC (“Triton”), Subsea Services International, Inc. (“SSI”), Global Flow Technologies, Inc. (“GFT”) and Allied Production Services, Inc. (“Allied”) pursuant to which the shareholders of the companies other than FOT exchanged all of their common stock for common stock of FOT. In conjunction with the Combination, FOT changed its name to Forum Energy Technologies, Inc.
The shareholders of each company received the following number of FET shares for each share of the respective companies:
Allied | .4623 shares | |||
Global Flow | .9886 shares | |||
Subsea | .3168 shares | |||
Triton | .3562 shares | |||
| ||||
Prior to the Combination, the private equity funds controlled a majority of the voting interests in FOT, Triton, SSI, and GFT. The same owner was also in a controlling position with respect to Allied by virtue of its ownership of 46.2% of Allied’s issued and outstanding voting stock and its contractual right to fill three of the five directors’ seats comprising the full Allied Board. The mergers of the entities into the combined Company are accounted for using reorganization accounting (i.e., “as if” pooling of interest) for entities under common control. Under this method of accounting, the historical financial statements of each entity are included in the combined financial statements from the date on which the majority owner obtained control of the company. These consolidated financial statements include the results of FOT, Triton, SSI, GFT and Allied and all of their subsidiaries.
2. Summary of significant accounting policies
Basis of presentation
The accompanying consolidated financial statements include the accounts of FET and its majority-owned subsidiaries and are prepared in accordance with accounting principles generally accepted in the United States of America (“United States GAAP”).
Forum Energy Technologies, Inc. and subsidiaries
Notes to consolidated financial statements
December 31, 2008, 2009 and 2010 (continued)
Principles of consolidation
The consolidated financial statements include the accounts of the Company and its wholly and majority owned subsidiaries after elimination of intercompany balances and transactions. Noncontrolling interest principally represents ownership by others of the equity in our consolidated majority owned South Africa subsidiary.
Reclassifications
Certain reclassifications have been made in prior period financial statements to conform with current period presentation. Reclassifications have no impact on the Company’s financial position, results of operations, or cash flows.
Use of estimates
The preparation of financial statements in conformity with United States GAAP requires management to make estimates and assumptions that affect the reported amounts of assets and liabilities and disclosure of contingent assets and liabilities as of the date of the financial statements and the reported amounts of revenues and expenses during the reporting period.
In the preparation of these consolidated financial statements, estimates and assumptions have been made by management including costs to complete contracts, an assessment of percentage of completion of projects, the selection of useful lives of tangible and intangible assets, fair value of reporting units used for goodwill impairment testing, expected future cash flows from long lived assets to support impairment tests, provisions necessary for trade receivables and income tax contingencies. Actual results could differ from these estimates.
The financial reporting of contracts depends on estimates, which are assessed continually during the term of those contracts. Recognized revenues and income are subject to revisions as the contract progresses to completion and changes in estimates are reflected in the period in which the facts that give rise to the revisions become known. Additional information that enhances and refines the estimating process that is obtained after the balance sheet date, but before issuance of the financial statements is reflected in the financial statements.
Cash and cash equivalents
Cash and cash equivalents consist of cash on deposit and high quality, short term money market instruments with an original maturity of three months or less. Cash equivalents are stated at cost plus accrued interest, which approximates fair value.
Accounts receivable-trade
Trade accounts receivables are carried at their estimated collectible amounts. Trade credit is generally extended on a short-term basis; thus receivables do not bear interest, although a finance charge may be applied to amounts past due. The Company maintains an allowance for
Forum Energy Technologies, Inc. and subsidiaries
Notes to consolidated financial statements
December 31, 2008, 2009 and 2010 (continued)
doubtful accounts for estimated losses that may result from the inability of its customers to make required payments. Such allowances are based upon several factors including but not limited to, credit approval practices, industry and customer historical experience as well as the current and projected financial condition of the specific customer. Accounts receivable outstanding longer than contractual terms are considered past due. The Company writes off accounts receivable to
the allowance for doubtful accounts when they become uncollectible. Any payments subsequently received on receivables previously written off are credited to the allowance for doubtful accounts.
The change in amounts of the allowance for doubtful accounts during the three year period endingended December 31, 20102011 is as follows (in thousands):
| Period ended | Item | Balance at beginning of period | Charged to expenses | Deductions or other | Balance at end of period | Item | Balance at beginning of period | Charged to expenses | Deductions or other | Balance at end of period | ||||||||||||||||||||||||||
|
|
| ||||||||||||||||||||||||||||||||||
December 31, 2008 | Allowance for doubtful accounts | $ | 2,557 | $ | 1,235 | $ | (500 | ) | $ | 3,292 | ||||||||||||||||||||||||||
December 31, 2009 | Allowance for doubtful accounts | 3,292 | 2,865 | (2,306 | ) | 3,851 | Allowance for doubtful accounts | $ | 3,292 | $ | 2,865 | $ | (2,306 | ) | $ | 3,851 | ||||||||||||||||||||
December 31, 2010 | Allowance for doubtful accounts | 3,851 | 956 | (682 | ) | 4,125 | Allowance for doubtful accounts | 3,851 | 955 | (681 | ) | 4,125 | ||||||||||||||||||||||||
December 31, 2011 | Allowance for doubtful accounts | 4,125 | 2,867 | (1,197 | ) | 5,795 | ||||||||||||||||||||||||||||||
|
|
| ||||||||||||||||||||||||||||||||||
Inventories
Inventory consisting of finished goods and materials and supplies held for resale is carried at the lower of cost or market. For certain subsidiaries, cost, which includes the cost of raw materials and labor for finished goods, is determined on a first-in first-out basis. For other subsidiaries, this cost is determined on an average cost basis. Market means current replacement cost except that (1) market should not exceed net realizable value and (2) market should not be less than net realizable value reduced by an allowance for a normal profit margin. The Company continuously evaluates inventories, based on an analysis of inventory levels, historical sales experience and future sales forecasts, to determine obsolete, slow-moving and excess inventory. Adjustments to reduce such inventory to its estimated recoverable value have been recorded by management.
Property and equipment
Property and equipment are stated at cost less accumulated depreciation. Equipment held under capital leases are stated at the present value of minimum lease payments. Expenditures for property and equipment and for items which substantially increase the useful lives of existing assets are capitalized at cost and depreciated over their estimated useful life utilizing the straight-line method. Routine expenditures for repairs and maintenance are expensed as incurred. Depreciation is computed using the straight-line method based on the estimated useful lives of assets, generally 3 to 19 years. Plant and equipment held under capital leases are amortized straight-line over the shorter of the lease term or estimated useful life of the asset.
Forum Energy Technologies, Inc. and subsidiaries
Notes to consolidated financial statements
December 31, 2008, 2009 and 2010 (continued)
Gains or losses resulting from the disposition of assets are recognized in income, and the related asset cost and accumulated depreciation are removed from the accounts. Assets acquired in connection with business combinations are recorded at fair value.
Rental equipment consists of equipment leased to customers under operating leases. Rental equipment is recorded at cost and depreciated using the straight-line method over the estimated useful lives of three to ten years.
Effective January 1, 2010, we implemented a change in accounting estimate to adjust the useful life of marine electronic survey equipment. This change resulted in an approximately $3.2 million reduction in the depreciation expense in the year ended December 31, 2010, an increase to net income of $2.1 million (or $1.43 per diluted share). We extended the useful lives of these long-lived assets based on our review of their historical service lives, technological improvements in the assets and proven longer useful mechanical and technical lives.
The Company reviews long-lived assets for potential impairment whenever events or changes in circumstances indicate that the carrying amount of a long-lived asset may not be recoverable. In performing the review for impairment, future cash flows expected to result from the use of the asset and its eventual disposal are estimated. If the undiscounted future cash flows are less than the carrying amount of the assets, the asset is impaired. The amount of the impairment is measured as the difference between the carrying value and the estimated fair value of the asset. The fair value is determined either through the use of an external valuation, or by means of an analysis of discounted future cash flows based on expected utilization. The impairment loss recognized represents the excess of the assets carrying value as compared to its estimated fair value. For the years ended December 31, 2008, 2009, 2010 and 2010,2011, no impairments were recorded.
To the extent that asset retirement obligations are incurred, the Company records the fair value of an asset retirement obligation as a liability in the period in which the associated legal obligation is incurred. The fair values of these obligations are recorded as liabilities on a discounted basis. The costs associated with these liabilities are capitalized as part of the related assets and depreciated. Over time, the liabilities are accreted for any change in their present value. Asset retirement obligations at December 31, 20092010 or 20102011 are not significant.
Goodwill and intangible assets
For goodwill and intangible assets with indefinite lives, an assessment for impairment is performed annually or whenever an event indicating impairment may have occurred. The Company completes its annual impairment test for goodwill and other indefinite-lived intangibles using an assessment date of December 31. Goodwill is reviewed for impairment by comparing the carrying value of each reporting unit’s net assets (including allocated goodwill) to the fair value of the reporting unit. We have foursix reporting units. We determine the fair value of our reporting units using a discounted cash flow approach. Determining the fair value of a reporting unit requires judgment and the use of significant estimates and assumptions. Such estimates and assumptions include revenue growth rates, operating margins, weighted average costs of capital and future market conditions, among others. We believe that the estimates and
Forum Energy Technologies, Inc. and subsidiaries
Notes to consolidated financial statements
December 31, 2008, 2009 and 2010 (continued)
assumptions used in our impairment assessments are reasonable. If the reporting unit’s carrying value is greater than its fair value, a second step is performed whereby the implied fair value of goodwill is estimated by allocating the fair value of the reporting unit in a hypothetical purchase price allocation analysis consistent with that described inASC 805, Business Combinations. The Company recognizes a goodwill impairment charge for the amount by which the carrying value of goodwill exceeds its fair value. The impairment test is a fair value test which includes assumptions such as growth and discount rates. Any impairment losses are reflected in operating income. In December 2008, an impairment loss of $39.8 million was recorded and in 2009, an impairment loss of $5.5 million was recorded. In December 2010 and 2011, no impairment loss waslosses were recorded.
Intangible assets with definite lives comprised of customer and distributor relationships, non-compete agreements, and patents are amortized on a straight-line basis over the life of the
intangible asset, generally 3 to 17 years. These assets are tested for impairment whenever events or changes in circumstances indicate that their carrying amount may not be recoverable. In 2008 and 2009, the Company recorded an impairment chargescharge of $4.2 million and $1.5 million, respectively, which areis classified within impairment of goodwill and other intangible assets on the consolidated statement of income. No impairmentimpairments to intangible assets waswere recorded at December 31, 2010.2010 and 2011.
In the third quarter of 2010, we implemented a change in accounting estimate to adjust the useful lives of certain of our customer relationship and distributor relationship intangible assets. This change resulted in an approximate $2.2 million reduction in the amortization expense in the year ended December 31, 2010, an increase to net income of $1.4 million (or $1.00 per diluted share). We extended the useful lives of these intangible assets based on positive changes in customer attrition rates and due to several factors pursuant to the Combination which would further strengthen these relationships.
Recognition of provisions for contingencies
In the ordinary course of business, the Company is subject to various claims, suits and complaints. The Company, in consultation with internal and external advisors, will provide for a contingent loss in the consolidated financial statements if it is probable that a liability has been incurred at the date of the consolidated financial statements and the amount can be reasonably estimated. If it is determined that the reasonable estimate of the loss is a range and that there is no best estimate within the range, provision will be made for the lower amount of the range. Legal costs are expensed as incurred.
An assessment is made of the areas where potential claims may arise under the contract warranty clauses. Where a specific risk is identified and the potential for a claim is assessed as probable and can be reasonably estimated, an appropriate warranty provision is recorded. Warranty provisions are eliminated at the end of the warranty period except where warranty claims are still outstanding. The liability for product warranty is included in other accrued liabilities on the consolidated balance sheet.
Forum Energy Technologies, Inc. and subsidiaries
Notes to consolidated financial statements
December 31, 2008, 2009 and 2010 (continued)
Changes in the Company’s warranty liability were as follows (in thousands):
| Period ended | Item | Balance at beginning of period | Charged to expense | Deductions or other | Balance at end of period | Item | Balance at beginning of period | Charged to expense | Deductions or other | Balance at end of period | ||||||||||||||||||||||||||||||
|
|
| ||||||||||||||||||||||||||||||||||||||
December 31, 2008 | Warranty accrual | $ | 6,277 | $ | 5,067 | $ | (3,924 | ) | $ | 7,420 | ||||||||||||||||||||||||||||||
December 31, 2009 | Warranty accrual | 7,420 | 3,210 | (5,149 | ) | 5,481 | Warranty accrual | $ | 7,420 | $ | 3,210 | $ | (5,149 | ) | $ | 5,481 | ||||||||||||||||||||||||
December 31, 2010 | Warranty accrual | 5,481 | 2,281 | (1,054 | ) | 6,708 | Warranty accrual | 5,481 | 2,281 | (1,054 | ) | 6,708 | ||||||||||||||||||||||||||||
December 31, 2011 | Warranty accrual | 6,708 | 1,232 | (3,026 | ) | 4,914 | ||||||||||||||||||||||||||||||||||
|
|
| ||||||||||||||||||||||||||||||||||||||
Revenue recognition and deferred revenue
Revenue is recognized when all of the following criteria have been met: (a) persuasive evidence of an arrangement exists, (b) delivery of the equipment has occurred or services have been rendered, (c) the price of the product or service is fixed and determinable and (d) collectability is reasonably assured. Revenue from product sales, including shipping costs, is recognized as title passes to the customer, which generally occurs when items are shipped from the Company’s facilities. Revenue from services is recognized when the service is completed to the customer’s specifications.
Customers are sometimes billed in advance of services performed or products manufactured, and the Company recognizes the associated liability as deferred revenue. On a contract by contract basis, cost and profit in excess of billings represents the cumulative revenue recognized less the cumulative billings to the customer. Billings in excess of costs and profits represents the cumulative billings to the customer less the cumulative revenue recognized.
Revenue generated from long-term contracts typically longer than six months in duration are recognized on the percentage-of-completion method of accounting. The Company recognizes revenue and cost of goods sold each period based upon the advancement of the work-in-progress unless the stage of completion is insufficient to enable a reasonably certain forecast of profit to be established. In such cases, no profit is recognized during the period. The percentage-of-completion is calculated based on the ratio of costs incurred to-date to total estimated costs, taking into account the level of completion. The percentage-of-completion method requires management to calculate reasonably dependable estimates of progress toward completion of contract revenues and contract costs. Whenever revisions of estimated contract costs and contract values indicate that the contract costs will exceed estimated revenues, thus creating a loss, a provision for the total estimated loss is recorded in that period.
Primarily related to our remotely operated vehicles product lines, which may take longer to manufacture, accounting estimates during the course of multi-year projects may change. The effect of such a change, which can be upward as well as downward, is accounted for in the period of change and the cumulative income recognized to date is adjusted to reflect the latest estimates. These revisions to estimates are accounted for on a prospective basis.
On a contract by contract basis, cost and profit in excess of billings represents the cumulative revenue recognized less the cumulative billings to the customer. Billings in excess of costs and profits represents the cumulative billings to the customer less the cumulative revenue recognized.
Revenue from the rental of equipment or providing of services is recognized over the period when the asset is rented or services are rendered and collectability is reasonably assured. Rates for asset rental and service provision are priced on a per day, per man hour, or similar basis.
Forum Energy Technologies, Inc. and subsidiaries
Notes to consolidated financial statements
December 31, 2008, 2009 and 2010 (continued)
Concentration of credit risk
Financial instruments which potentially subject the Company to credit risk include trade accounts receivable. Trade accounts receivable consist of uncollateralized receivables from domestic and internationally based customers. For the years ended December 31, 2008, 2009, 2010 and 2010,2011, no one customer accounted for 10% or more of the total revenue or 10% or more of the total account receivable balance at the end of the respective period.
Share-based compensation
The Company accounts for awards of share-based compensation under the proper accounting guidance. This guidance and the related interpretations require companies to measure all employee share-based compensation awards at fair value on the date they are granted to employees and recognize compensation cost in their financial statements over the requisite service period. The Company has stock-based compensation plans for its employees, directors, and consultants of the Company and its subsidiaries. Compensation expense is recorded for restricted stock over the applicable vesting period based on the fair value of the stock on the date of grant. Options are issued with an exercise price equal to the fair value of the stock on the date of grant. Compensation expense is recorded for the fair value of the stock options, and is recognized over the period of the underlying security’s vesting schedule. Consideration paid on the exercise of stock options is credited to share capital and additional paid-in capital.
Fair value of the share-based compensation was measured by use of the Black-Scholes model for most of the outstanding options and a Binomial model for certain legacy share-based compensation instruments issued by Triton. The following sections address the assumptions used related to the Black-Scholes pricing model.
Expected life
The expected term of stock options represents the period the stock options are expected to remain outstanding and is based on the simplified method which is the weighted average vesting term plus the original contractual term divided by two.
Expected volatility
Expected volatility measures the amount that a stock price has fluctuated or is expected to fluctuate during a period. Since the Company’s stock is not publicly traded, the Company determines volatility based on an analysis of comparable companies.
Dividend yield
The Company has never declared or paid any cash dividends and does not plan to pay cash dividends in the foreseeable future. Therefore, a zero expected dividend yield was used in the valuation model.
Forum Energy Technologies, Inc. and subsidiaries
Notes to consolidated financial statements
December 31, 2008, 2009 and 2010 (continued)
Risk-free interest rate
The risk-free interest rate is based on United States Treasury zero-coupon issues with remaining terms similar to the expected term on the options.
Forfeitures
The applicable accounting guidance also requires the Company to estimate forfeitures at the time of grant, and revise those estimates in subsequent periods if actual forfeitures differ from those estimates. The Company uses historical data to estimate pre-vesting option forfeitures and record stock-based compensation expense only for those awards that are expected to vest. If the Company’s actual forfeiture rate is materially different from its estimate, the stock-based compensation expense could be different from what the Company has recorded in the current period.
Fair value of common stock
The value of the Company’s stock at the time of each option grant used to establish the strike price, and the value applied in each acquisition transaction, was estimated by management, and approved by the Company’s Board of Directors, in accordance with an internal valuation model. These valuation models are based upon an average of cash flow and book value multiples of comparable companies. The comparable companies selected reflect the market’s view on key sector, geographic, and product type exposure that are similar to those that impact the Company’s business. The value is further subject to judgmental factors such as prevailing market conditions, changes in oilfield service indices and the overall outlook for the Company and its products in general.
Income taxes
The Company follows the liability method of accounting for income taxes. Under this method, deferred income tax assets and liabilities are determined based upon temporary differences between the carrying amounts and tax bases of the Company’s assets and liabilities at the balance sheet date, and are measured using enacted tax rates and laws that will be in effect when the differences are expected to reverse. The effect on deferred tax assets and liabilities of a change in the tax rates is recognized in income in the period in which the change occurs. The Company records a valuation reserve in each reporting period when management believes that it is more likely than not that any deferred tax asset created will not be realized.
The accounting guidance for income taxes requires that the Company recognize the financial statement benefit of a tax position only after determining that the relevant tax authority would more likely than not sustain the position following an audit. If a tax position meets the “more likely than not” recognition criteria, the accounting guidance requires the tax position be measured at the largest amount of benefit greater than 50% likely of being realized upon ultimate settlement.
Forum Energy Technologies, Inc. and subsidiaries
Notes to consolidated financial statements
December 31, 2008, 2009 and 2010 (continued)
Earnings per share
Basic earnings per share for all periods presented equals net income divided by the weighted average number of the shares of the Company’s common stock outstanding during the period. Diluted earnings per share is computed by dividing net income by the weighted average number of shares of the Company’s common stock outstanding during the period as adjusted for the dilutive effect of the Company’s stock options, restricted share plans and warrants.
The exercise price of each option is based on the fair value of the Company’s stock at the date of grant. The diluted earnings per share calculation excludes 14 thousand stock options for the year ended December 31, 2008, 26 thousand stock options for the year ended December 31, 2009, and excludes 440 thousand stock options and warrants for the year ended December 31, 2010 and excludes 12 thousand stock options and warrants for the year ended December 31, 2011, because increasinghigher fair values duringat the yeartime of grant resulted in these options’ exercise prices being greater than the average market price over the entire year in the respective periods.
The following is a reconciliation of the number of shares used for the basic and diluted earnings per share computations:
| December 31, | December 31, | |||||||||||||||||||||||
| 2008 | 2009 | 2010 | 2009 | 2010 | 2011 | |||||||||||||||||||
| (shares in thousands) |
| |||||||||||||||||||||||
|
| (shares in thousands) | ||||||||||||||||||||||
Basic weighted average shares outstanding | 1,232 | 1,304 | 1,454 | 1,304 | 1,454 | 1,710 | ||||||||||||||||||
Dilutive effect of stock option and restricted share plan | 29 | 18 | 14 | 18 | 14 | 114 | ||||||||||||||||||
|
|
|
| |||||||||||||||||||||
Diluted weighted average shares outstanding | 1,261 | 1,322 | 1,468 | 1,322 | 1,468 | 1,824 | ||||||||||||||||||
|
|
| ||||||||||||||||||||||
Non-United StatesNon-U.S. local currency translation
The Company operates globally and its primary functional currency is the United StatesU.S. dollar ($). The majority of the Company’s non-United Statesnon-U.S. subsidiaries have designated the local currency as their functional currency. Financial statements of these foreign operations are translated into United StatesU.S. dollars using the current rate method whereby assets and liabilities are translated at the balance sheet rate and income and expenses are translated into United StatesU.S. dollars at the average exchange
rates in effect during the period. The resultant translation adjustments are reported as a component of accumulated other comprehensive income within stockholders’ equity.
Hedging and use of derivative instruments
The Company utilizes interest rate swap and collar agreements to hedge the exposure to variable cash flows on a portion of its floating rate debt (i.e., cash flow hedges). The instruments are not used for trading or speculative purposes. The Company records these interest rate derivative instruments on the consolidated balance sheet as either derivative assets or derivative liabilities as applicable.
Forum Energy Technologies, Inc. and subsidiaries
Notes to consolidated financial statements
December 31, 2008, 2009 and 2010 (continued)
Certain derivative instruments qualify for hedge accounting as they reduce the interest rate risk of the underlying hedged item and were formally designated as cash flow hedges at inception. These derivative instruments result in financial impacts that are inversely correlated to those of the items being hedged. Since the terms of the hedged item and the instruments substantially coincide, the hedge is expected to offset changes in expected cash flows due to fluctuations in the variable rate and, therefore, the Company currently does not expect any ineffectiveness. Changes in the fair value of the instruments designated as cash flow hedges are deferred in accumulated other comprehensive income, net of tax, to the extent the contracts are effective as hedges, until settlement of the underlying hedged transaction. If the necessary correlation ceases to exist or if physical delivery of the hedged item becomes improbable, the Company would discontinue hedge accounting and apply mark-to-market accounting with any changes in the fair values of the derivative instruments then recognized in earnings. Amounts paid or received from interest rate derivative instruments are charged or credited to interest expense and matched with the cash flows and interest expense of the debt being hedged, resulting in an adjustment to the effective interest rate.
The Company adjusts the balance of these derivative instruments to fair value on a recurring basis. The Company’s fair value measurements are based on projected future interest rates as provided by the counterparties to the interest rate swap agreements and the fixed rates that the Company is obligated to pay under these agreements. The Company determines the value of derivative financial instruments using composite quotes obtained from market pricing services or, in certain cases, active-market quotes obtained from financial institutions. The established fair value hierarchy divides fair value measurement into three broad levels: Level 1 inputs are quoted prices (unadjusted) in active markets for identical assets or liabilities that the reporting entity has the ability to access at the measurement date; Level 2 inputs are inputs other than quoted prices included within Level 1 that are observable for the assets or liability, either directly or indirectly; and Level 3 inputs are unobservable inputs for the asset or liability which reflect the best judgment of the Company. The Company’s measurements fall in Level 3.
Certain derivative instruments do not qualify for hedge accounting. These derivatives are also recorded at fair value, with the changes in fair value being recorded into earnings.
Fair value of financial instruments
The carrying amounts for financial instruments classified as current assets and current liabilities approximate fair value, due to the short maturity of such instruments. The book values of other financial instruments, such as the Company’s long-term debt, approximates fair value because interest rates charged are similar to other financial instruments with similar terms and maturities.
Noncontrolling interest
Effective January 1, 2009, the Company adopted newly issued accounting guidance that changed the accounting for, and reporting of, minority interest (now referred to as noncontrolling interest). Noncontrolling interests are now classified as equity in the consolidated balance sheet.
Forum Energy Technologies, Inc. and subsidiaries
Notes to consolidated financial statements
December 31, 2008, 2009 and 2010 (continued)
The new guidance also changed the way the consolidated statement ofsheets. Net earnings is presented by requiring net earnings to include the net earnings for both controlling and noncontrolling interests, with disclosure of both amounts on the consolidated statementstatements of earnings.
Fair value measurements
The Company has adopted the authoritative guidance for fair value measurements as they relate to nonfinancial assets and liabilities that are measured at fair value on a nonrecurring basis. The guidance defines fair value, establishes a framework for measuring fair value when an entity is required to use a fair value measure for recognition or disclosure purposes and expands the disclosures about fair value measures. The adoption did not have a material impact on the Company’s financial statements. The Company previously adopted the guidance as it relates to financial assets and liabilities that are measured at fair value and for nonfinancial assets and liabilities that are measured at fair value on a recurring basis.
Recent accounting pronouncements
In January 2010,May 2011, the Financial Accounting Standards Board (“FASB”) issued Accounting Standards Update (“ASU”) No. 2010-06 “Improving Disclosuresexpanded the fair value measurements and disclosures guidance about Fair Value Measurements” (“ASU No. 2010-06”) as an updateitems marked to Accounting Standards Codification Topic 820, “Fair Value Measurements and Disclosures” (“ASC Topic 820”). ASU No. 2010-06 requires additional disclosures about transfers between Levels 1 and 2fair value that are categorized within Level 3 of the fair value hierarchy to include qualitative explanations of the valuation methodology used and disclosures about purchases, sales, issuances and settlementssensitivity analysis of the inputs into the valuation. The amendment also requires that items that are not measured at fair value, but for which the fair value is disclosed, also disclose the level in the roll forward of activity in Level 3 fair value measurements. ASU No. 2010-06hierarchy in which those items were categorized. This pronouncement is effective for interim and annual reporting periods beginning after December 15, 2009, exceptthe Company for the disclosures about purchases, sales, issuances, and settlements in the rollforwardfiscal year beginning January 1, 2012. The adoption of activity in Level 3 fair value measurements. Those disclosures are effective for fiscal years beginning after December 15, 2010, and for interim periods within those fiscal years. The Company adopted the required provisions of ASU No. 2010-06. There was no significant impact tothis pronouncement will not have a material effect on the Company’s Consolidated Financial Statements.consolidated financial statements.
In June 2011, the FASB issued an update to ASCAccounting Standards Codification Topic 220,Presentation “Presentation of Comprehensive IncomeIncome” (“ASC Topic 220”). This ASUupdate provides that an entity that reports items of other comprehensive income has the option to present comprehensive income in either 1) a single statement that presents the components of net income and total net income, the components of other comprehensive income and total other comprehensive income, and a total for comprehensive income; or 2) a two-statement approach which presents the components of net income and total net income in a first statement, immediately followed by a financial statement that presents the components of other comprehensive income, a total for other comprehensive income, and a total for comprehensive income. The option in current GAAP that permits the presentation of other comprehensive income in the statement of changes in equity was eliminated. The guidance will be applied retrospectively and is effective for the Company for annual periods beginning on January 1, 2012. Early adoption is permitted. The adoption of this guidance will not have a material impact on the Company’s financial statements.
In September 2011, the FASB amended the Intangibles - Goodwill and Other Topic of the ASC that allows an entity to make a qualitative assessment to determine whether further impairment testing on goodwill is necessary. If, after assessing the relevant information, an entity determines it is more likely than not that the fair value is more than the carrying amount, the quantitative impairment test is not required. If an entity determines it is more likely than not that the fair value is less than the carrying amount, then the quantitative impairment test is required. This pronouncement is effective for annual and interim goodwill impairment tests performed for
Forum Energy Technologies, Inc. and subsidiaries
Notes to consolidated financial statements
December 31, 2008, 2009 and 2010 (continued)
In December 2010, the FASB issued FASB ASU 2010-28, which affects entities evaluating goodwill for impairment under FASB ASC 350-20. ASU 2010-28, among other things, requires entities with a zero or negative carrying value to assess, considering qualitative factors, whether it is more likely than not that goodwill impairment exists. If an entity concludes that it is more likely than not that goodwill impairment exists, the entity must perform step 2 of the goodwill impairment test. ASU 2010-28 is effective for impairment tests performed during an entity’s fiscal yearyears beginning after December 15, 2010, with early adoption2011. The Company will adopt this pronouncement for the fiscal year beginning January 1, 2012 and does not permitted. We do not believe the adoption ofexpect this ASU willpronouncement to have a material impacteffect on its consolidated financial statements.
3. Acquisitions
The Company completed eight acquisitions during fiscal year 2011. The following summarizes the six largest acquisitions.
Wood Flowline Products, LLC
In February 2011, the Company purchased Wood Flowline Products, LLC (“WFP”). WFP manufactures pressure control and flow equipment products that are principally used in the fracturing and well stimulation process. WFP also provides on-site recertification and refurbishment services of the associated flow equipment products. This acquisition provides the Company new exposure to the growing well completions sector, specifically focused on the development of North American unconventional shale and tight sands resources. The results of WFP’s operations have been included in the Company’s consolidated financial statements beginning February 1, 2011 and are included in the Company’s Production and Infrastructure segment. The Company incurred acquisition related fees and expenses of $0.4 million. WFP recorded revenue and net income of $57.5 million and $12.4 million, respectively, from the time of acquisition through December 31, 2011. The total purchase consideration of $58.0 million included: (1) cash of $32.7 million, (2) 35,000 shares of common stock of the Company valued at $340 per share based on an internal valuation and (3) two separate contingent consideration payments which may be payable in cash and/or shares of Company stock based upon WFP’s 2011 and 2012 calendar year earnings as defined in the purchase and sale agreement. The fair value of the contingent consideration was estimated to be $13.4 million based on an internal valuation of the earnings level that the acquired company is expected to achieve. The total consideration has been allocated on a preliminary basis to the assets acquired and liabilities assumed, including identifiable intangible assets, based on their respective fair values as of the acquisition date. The fair value of the contingent consideration payment was remeasured as of December 31, 2011 at $22.1 million and is included in “Contingent consideration liability” in the consolidated balance sheet. The change in fair value of $8.7 million is included in “Contingent consideration” in the consolidated statements of operations.
The following table summarizes the preliminary fair values of the assets acquired and the liabilities assumed as of the acquisition date (in thousands):
Current assets, net of cash acquired | $ | 12,733 | ||
Property and equipment | 3,239 | |||
Intangible assets (primarily customer relationships) | 16,800 | |||
Tax deductible goodwill | 29,893 | |||
Current liabilities | (4,654 | ) | ||
|
| |||
Net assets acquired | $ | 58,011 | ||
| ||||
Phoinix Global LLC
In April 2011, the Company purchased Phoinix Global LLC (“Phoinix”), a provider of high pressure flow control equipment and products utilized in the well stimulation and flow back processes of oil and gas well completion based in Alice, Texas. This acquisition adds to the Company’s
flow equipment products capabilities through a product offering that includes fluid-ends for hydraulic fracturing pressure pumps, plug valves, relief valves, chokes, manifolds, manifold trailers and flow equipment transport trucks. The results of the Phoinix operations have been included in the Company’s consolidated financial statements beginning May 1, 2011 and are included in the Company’s Production and Infrastructure segment. The Company incurred acquisition related fees and expenses of $0.3 million. Phoinix recorded revenue and net income of $58.5 million and $10.1 million, respectively, from the time of acquisition through December 31, 2011. The total purchase consideration of $47.9 million included: (1) cash of $23.6 million, (2) 20,252 shares of common stock of the Company valued at $395 per share based on an internal valuation and (3) two separate contingent consideration payments which may be payable in cash based upon Phoinix’s 2011 and 2012 calendar year earnings as defined in the purchase and sale agreement. The fair value of the contingent consideration was estimated to be $16.3 million based on an internal valuation of the earnings level that the acquired company is expected to achieve. The total consideration has been allocated on a preliminary basis to the assets acquired and liabilities assumed, including identifiable intangible assets, based on their respective fair values as of the acquisition date. The fair value of the contingent consideration payment was remeasured as of December 31, 2011 at $19.7 million and is included in “Contingent consideration liability” in the consolidated balance sheet. The change in fair value of $3.4 million is included in “Contingent consideration” in the consolidated statements of operations.
The following table summarizes the preliminary fair values of the assets acquired and the liabilities assumed as of the acquisition date (in thousands):
Current assets, net of cash acquired | $ | 11,686 | ||
Property and equipment | 1,350 | |||
Intangible assets (primarily customer relationships) | 17,200 | |||
Tax-deductible goodwill | 25,002 | |||
Current liabilities | (7,322 | ) | ||
|
| |||
Net assets acquired | $ | 47,916 | ||
| ||||
Cannon Services
In July 2011, the Company acquired Cannon Services (“Cannon”), based in Stafford, Texas. Cannon is a provider of standard and customized clamp and stamped metal protection systems used to shield the downhole control lines and gauges during their installation and provide protection during production enhancement operations. This acquisition, along with the acquisition of Davis-Lynch, formed the new product platform targeting niche downhole products that are consumed during the well construction, completion, intervention and production enhancement processes, as well as those associated with the growth in intelligent well construction. The results of Cannon’s operations have been included in the Company’s consolidated financial statements beginning July 1, 2011 and are included in the Company’s Drilling and Subsea segment. The Company incurred acquisition related fees and expenses of $0.4 million. Cannon recorded revenues and net income of $15.3 million and $3.2 million, respectively from the time of acquisition through December 31, 2011. The total purchase consideration of $58.3 million included: (1) $47.6 million of cash and (2) 20,944 shares of common stock valued at $513 per share based on an internal valuation.
The following table summarizes the preliminary fair values of the assets acquired and the liabilities assumed as of the acquisition date (in thousands):
Current assets, net of cash acquired | $ | 10,500 | ||
Property and equipment | 4,326 | |||
Intangible assets (primarily customer relationships) | 18,800 | |||
Tax-deductible goodwill | 26,880 | |||
Current liabilities | (2,166 | ) | ||
|
| |||
Net assets acquired | $ | 58,340 | ||
| ||||
AMC Global Group, Ltd.
In July 2011, the Company acquired AMC Global Group, Ltd. (“AMC”), based in Aberdeen, Scotland. AMC designs and manufactures specialized torque equipment for tubular connections, including high torque stroking units, fully rotational torque units and portable torque units for field deployment and related control systems, and provides aftermarket service. This acquisition enhanced the product offerings in our drilling products line. The results of AMC’s operations have been included in the Company’s consolidated financial statements beginning July 1, 2011 and are included in the Company’s Drilling and Subsea segment. The Company incurred acquisition related fees and expenses of $0.5 million. AMC recorded revenues and net income of $10.6 million and $1.7 million, respectively from the time of acquisition through December 31, 2011. The total purchase consideration of $54.8 million included: (1) $46.5 million of cash and (2) 16,200 shares of common stock valued at $513 per share based on an internal valuation.
The following table summarizes the preliminary fair values of the assets acquired and the liabilities assumed as of the acquisition date (in thousands):
Current assets, net of cash acquired | $ | 15,674 | ||
Property and equipment | 363 | |||
Intangible assets (primarily customer relationships) | 15,240 | |||
Non-tax-deductible goodwill | 31,575 | |||
Current liabilities | (4,109 | ) | ||
Deferred tax liabilities | (3,963 | ) | ||
|
| |||
Net assets acquired | $ | 54,780 | ||
| ||||
P-Quip, Ltd.
In July 2011, the Company acquired P-Quip, Ltd. (“P-Quip”), based in Kilbirnie, Scotland. P-Quip manufactures proprietary mud pump fluid end assemblies, mud pump rod systems, liner retention systems, valve cover retention systems and other drilling flow control products. This acquisition enhanced the product offerings in our drilling products line. The results of P-Quip’s operations have been included in the Company’s consolidated financial statements beginning July 5, 2011 and are included in the Company’s Drilling and Subsea segment. The Company incurred acquisition related fees and expenses of $0.4 million. P-Quip recorded revenues and net income of $11.7 million and $3.7 million, respectively from the time of acquisition through December 31, 2011. The total purchase consideration included $33.5 million of cash.
The following table summarizes the preliminary fair values of the assets acquired and the liabilities assumed as of the acquisition date (in thousands):
Current assets, net of cash acquired | $ | 11,932 | ||
Property and equipment | 114 | |||
Intangible assets (primarily customer relationships) | 12,032 | |||
Non-tax-deductible goodwill | 16,162 | |||
Current liabilities | (3,618 | ) | ||
Deferred tax liabilities | (3,128 | ) | ||
|
| |||
Net assets acquired | $ | 33,494 |
Davis-Lynch LLC
In July 2011, the Company acquired Davis-Lynch LLC (“Davis-Lynch”), based in Pearland, Texas. Davis-Lynch is a provider of proprietary, downhole cementing and casing products. This acquisition along with the acquisition of Cannon Services, formed the new product platform targeting niche downhole products that are consumed during the well construction, completion, intervention and production enhancement processes, as well as those associated with the growth in intelligent well construction. The results of Davis-Lynch’s operations have been included in the Company’s consolidated financial statements beginning August 1, 2011 and are included in the Company’s Drilling and Subsea segment. The Company incurred acquisition related fees and expenses of $0.9 million. Davis-Lynch recorded revenues and net income of $51.5 million and $11.4 million, respectively from the time of acquisition through December 30, 2011. The total purchase consideration included $317.6 million of cash.
The following table summarizes the preliminary fair values of the assets acquired and the liabilities assumed as of the acquisition date (in thousands):
| ||||
Current assets, net of cash acquired | $ | 52,917 | ||
Property and equipment | 9,480 | |||
Intangible assets (primarily customer relationships) | 93,000 | |||
Tax-deductible goodwill | 170,047 | |||
Current liabilities | (7,861 | ) | ||
|
| |||
Net assets acquired | $ | 317,583 | ||
| ||||
The following table provides pro forma information related to all acquisitions in the aggregate (in thousands, except per share data):
| Year ended December 31, 2010 | Year ended December 31, 2011 | |||||||
| ||||||||
Revenue | $ | 955,449 | $ | 1,245,745 | ||||
Net income attributable to common stockholders | 46,749 | 113,915 | ||||||
Basic earnings per share | 30.24 | 63.22 | ||||||
Diluted earnings per share | 29.97 | 59.45 | ||||||
| ||||||||
The pro forma information for the years ended December 31, 2010 and 2011 assumes the acquisitions listed above occurred as of January 1, 2010.
The combined results of operations of the acquired businesses have been adjusted to reflect additional depreciation of fixed assets and amortization of intangible assets subject to amortization. Pro forma interest expense was calculated on notes payable and draws on the Company’s financial position oravailable line of credit at a rate of 4.7%, as if the businesses were acquired at the beginning of the period.
Although the Company believes the accounting policies and procedures used to prepare the pro forma schedules are reasonable, these pro forma results do not purport to be indicative of operations.the actual results which would have been achieved had the acquisition been consummated on January 1, 2010. The amounts shown are not intended to be a projection of future results.
3.4. Inventories
The significant components of inventory are as follows:
| December 31, | December 31, | |||||||||||||||
| 2009 | 2010 | 2010 | 2011 | |||||||||||||
| (in thousands) |
| |||||||||||||||
|
| (in thousands) | ||||||||||||||
Raw materials and parts | $ | 64,105 | $ | 63,234 | $ | 63,234 | $ | 102,301 | ||||||||
Work in process | 11,807 | 19,534 | 19,534 | 50,341 | ||||||||||||
Finished goods | 101,651 | 101,115 | 101,115 | 184,331 | ||||||||||||
|
|
|
| |||||||||||||
| 177,563 | 183,883 | 183,883 | 336,973 | |||||||||||||
Inventory reserve | (8,935 | ) | (10,106 | ) | (10,106 | ) | (12,335 | ) | ||||||||
|
|
|
| |||||||||||||
Inventories, net | $ | 168,628 | $ | 173,777 | $ | 173,777 | $ | 324,638 | ||||||||
|
|
| ||||||||||||||
The change in the amounts of the inventory reserve during the three year period endingended December 31, 20102011 is as follows (in thousands):
| Period ended | Item | Balance at beginning of period | Charged to expenses | Deductions or other | Balance at end of period | Item | Balance at beginning of period | Charged to expenses | Deductions or other | Balance at end of period | ||||||||||||||||||||||||||
|
|
| ||||||||||||||||||||||||||||||||||
December 31, 2008 | Reserve for inventory obsolescence | $ | 6,162 | $ | 3,518 | $ | (1,958 | ) | $ | 7,722 | ||||||||||||||||||||||||||
December 31, 2009 | Reserve for inventory obsolescence | 7,722 | 4,821 | (3,608 | ) | 8,935 | Reserve for inventory obsolescence | $ | 7,722 | $ | 4,821 | $ | (3,608 | ) | $ | 8,935 | ||||||||||||||||||||
December 31, 2010 | Reserve for inventory obsolescence | 8,935 | 1,244 | (73 | ) | 10,106 | Reserve for inventory obsolescence | 8,935 | 1,244 | (73 | ) | 10,106 | ||||||||||||||||||||||||
December 31, 2011 | Reserve for inventory obsolescence | 10,106 | 5,805 | (3,576 | ) | 12,335 | ||||||||||||||||||||||||||||||
|
|
| ||||||||||||||||||||||||||||||||||
Forum Energy Technologies, Inc. and subsidiaries
Notes to consolidated financial statements
December 31, 2008, 2009 and 2010 (continued)
4.5. Property and equipment
Property and equipment consists of the following as of December 31:
| Estimated useful lives | 2009 | 2010 | Estimated useful lives | 2010 | 2011 | |||||||||||||||
| (in years) | (in thousands) |
| ||||||||||||||||||
|
| (in years) | (in thousands) | |||||||||||||||||
Land | $ | 1,206 | $ | 2,026 | $ | 2,026 | $ | 2,064 | ||||||||||||
Buildings and leasehold improvements | 7-20 | 20,104 | 23,848 | 7-20 | 23,848 | 39,092 | ||||||||||||||
Computer equipment | 3-5 | 8,233 | 9,433 | 3-5 | 9,433 | 12,484 | ||||||||||||||
Machinery and equipment | 5-10 | 70,371 | 66,640 | 5-10 | 66,640 | 78,146 | ||||||||||||||
Furniture and fixtures | 3-10 | 1,432 | 2,215 | 3-10 | 2,215 | 9,819 | ||||||||||||||
Vehicles | 3-5 | 5,585 | 6,304 | 3-5 | 6,304 | 9,103 | ||||||||||||||
Construction in progress | 2,037 | 853 | 853 | 6,550 | ||||||||||||||||
|
|
|
| |||||||||||||||||
| 108,968 | 111,319 | 111,319 | 157,258 | |||||||||||||||||
Less: Accumulated depreciation | (42,918 | ) | (55,746 | ) | (55,746 | ) | (67,379 | ) | ||||||||||||
|
|
|
| |||||||||||||||||
Property and equipment, net | 66,050 | 55,573 | 55,573 | 89,879 | ||||||||||||||||
|
|
|
| |||||||||||||||||
Rental equipment | 45,805 | 57,962 | 57,962 | 95,707 | ||||||||||||||||
Less: Accumulated depreciation | (15,108 | ) | (22,903 | ) | (22,903 | ) | (60,746 | ) | ||||||||||||
|
|
|
| |||||||||||||||||
Rental equipment, net | 30,697 | 35,059 | 35,059 | 34,961 | ||||||||||||||||
|
|
|
| |||||||||||||||||
Total property and equipment, net | $ | 96,747 | $ | 90,632 | $ | 90,632 | $ | 124,840 | ||||||||||||
|
|
| ||||||||||||||||||
5.6. Goodwill and intangible assets
Goodwill
The changes in the amount of goodwill from January 1, 20092010 to December 31, 2010,2011, are as follows:
| Drilling and Subsea | Production and Infrastructure | Total | ||||||||||||||||||||||||||||||||||||||||||||||
| Drilling and Subsea | Production and Infrastructure | Total | 2010 | 2011 | 2010 | 2011 | 2010 | 2011 | ||||||||||||||||||||||||||||||||||||||||
| 2009 | 2010 | 2009 | 2010 | 2009 | 2010 |
| ||||||||||||||||||||||||||||||||||||||||||
| (in thousands) | (in thousands) | |||||||||||||||||||||||||||||||||||||||||||||||
|
| |||||||||||||||||||||||||||||||||||||||||||||||
Goodwill Balance at January 1, net | 281,037 | 281,647 | 18,209 | 18,929 | $ | 299,246 | $ | 300,576 | $ | 281,647 | $ | 275,528 | $ | 18,929 | $ | 18,853 | $ | 300,576 | $ | 294,381 | ||||||||||||||||||||||||||||
Goodwill impairment | (5,545 | ) | — | — | — | (5,545 | ) | — | ||||||||||||||||||||||||||||||||||||||||
Purchase price adjustments | (4,439 | ) | — | — | — | (4,439 | ) | — | ||||||||||||||||||||||||||||||||||||||||
Acquisition | — | 249,140 | — | 59,102 | — | 308,242 | ||||||||||||||||||||||||||||||||||||||||||
Impact of non-United States local currency translation | 10,594 | (6,119 | ) | 720 | (76 | ) | 11,314 | (6,195 | ) | (6,119 | ) | (1,649 | ) | (76 | ) | (147 | ) | (6,195 | ) | (1,796 | ) | |||||||||||||||||||||||||||
|
|
|
| |||||||||||||||||||||||||||||||||||||||||||||
Goodwill Balance at December 31, net | 281,647 | 275,528 | 18,929 | 18,853 | $ | 300,576 | $ | 294,381 | $ | 275,528 | $ | 523,019 | $ | 18,853 | $ | 77,808 | $ | 294,381 | $ | 600,827 | ||||||||||||||||||||||||||||
|
|
| ||||||||||||||||||||||||||||||||||||||||||||||
The Company performs its annual impairment tests of goodwill as of December 31. For the year ended December 31, 2009, the Company recognized a goodwill impairment loss of $5.5 million relating to certain Triton subsidiaries primarily due to the change in market conditions and declining operating results. There was no impairment of goodwill during the yearyears ended
Forum Energy Technologies, Inc. and subsidiaries
Notes to consolidated financial statements
December 31, 2008, 20092010 and 2010 (continued)
December 31, 2010.2011. The fair values were determined using the net present value of the expected future cash flows.flows for each reporting unit. Accumulated impairment losses on goodwill were $40.0 million as of December 31, 20092010 and 2010,2011, respectively.
Intangible assets
At December 31, 20092010 and 2010,2011, intangible assets consist of the following, respectively:
| December 31, 2009 | December 31, 2010 | |||||||||||||||||||||||||||||||
| Gross carrying amount | Accumulated amortization | Net amortizable intangibles | Amortization period (in years) | Gross carrying amount | Accumulated amortization | Net amortizable intangibles | Amortization period (in years) | |||||||||||||||||||||||||
| (In thousands) |
| |||||||||||||||||||||||||||||||
|
| (In thousands) | ||||||||||||||||||||||||||||||
Customer relationships | $ | 71,698 | $ | (20,396 | ) | $ | 51,302 | 4-15 | $ | 70,837 | $ | (26,907 | ) | $ | 43,930 | 4-15 | ||||||||||||||||
Patents and technology | 5,389 | (1,015 | ) | 4,374 | 5-17 | 5,764 | (1,626 | ) | 4,138 | 5-17 | ||||||||||||||||||||||
Non-compete agreements | 4,074 | (2,688 | ) | 1,386 | 3-6 | 4,047 | (3,598 | ) | 449 | 3-6 | ||||||||||||||||||||||
Trade names | 15,174 | (2,736 | ) | 12,438 | 10-15 | 15,312 | (3,865 | ) | 11,447 | 10-15 | ||||||||||||||||||||||
Contracts | 260 | (260 | ) | — | <1 | 260 | (260 | ) | — | <1 | ||||||||||||||||||||||
Distributor relationships | 22,160 | (5,566 | ) | 16,594 | 8-15 | 22,160 | (7,486 | ) | 14,674 | 8-15 | ||||||||||||||||||||||
Trademark | 5,521 | — | 5,521 | Indefinite | 5,521 | — | 5,521 | Indefinite | ||||||||||||||||||||||||
|
|
|
| |||||||||||||||||||||||||||||
| $ | 124,276 | $ | (32,661 | ) | $ | 91,615 | $ | 123,901 | $ | (43,742 | ) | $ | 80,159 | |||||||||||||||||||
|
|
| ||||||||||||||||||||||||||||||
| December 31, 2010 | December 31, 2011 | |||||||||||||||||||||||||||||||
| Gross carrying amount | Accumulated amortization | Net amortizable intangibles | Amortization period (in years) | Gross carrying amount | Accumulated amortization | Net amortizable intangibles | Amortization period (in years) | |||||||||||||||||||||||||
| (In thousands) |
| |||||||||||||||||||||||||||||||
|
| (In thousands) | ||||||||||||||||||||||||||||||
Customer relationships | $ | 70,837 | $ | (26,907 | ) | $ | 43,930 | 4-15 | $ | 211,933 | $ | (36,160 | ) | $ | 175,773 | 4-15 | ||||||||||||||||
Patents and technology | 5,764 | (1,626 | ) | 4,138 | 5-17 | 19,172 | (2,676 | ) | 16,496 | 5-17 | ||||||||||||||||||||||
Non-compete agreements | 4,047 | (3,598 | ) | 449 | 3-6 | 5,234 | (4,108 | ) | 1,126 | 3-6 | ||||||||||||||||||||||
Trade names | 15,312 | (3,865 | ) | 11,447 | 10-15 | 35,076 | (6,088 | ) | 28,988 | 10-15 | ||||||||||||||||||||||
Contracts | 260 | (260 | ) | — | <1 | 260 | (260 | ) | — | <1 | ||||||||||||||||||||||
Distributor relationships | 22,160 | (7,486 | ) | 14,674 | 8-15 | 22,160 | (8,750 | ) | 13,410 | 8-15 | ||||||||||||||||||||||
Trademark | 5,521 | — | 5,521 | Indefinite | 5,521 | — | 5,521 | Indefinite | ||||||||||||||||||||||||
|
|
|
| |||||||||||||||||||||||||||||
| $ | 123,901 | $ | (43,742 | ) | $ | 80,159 | $ | 299,356 | $ | (58,042 | ) | $ | 241,314 | |||||||||||||||||||
|
|
| ||||||||||||||||||||||||||||||
Amortization expense was $13.6 million, $14.2 million, $11.3 million and $11.3$14.5 million for the years ended December 31, 2008, 2009, 2010 and 2010,2011, respectively. The total weighted average amortization period is 1314 years and the estimated amortization expense for the next five years is as follows (in thousands):
| Year ending December 31, | ||||
| ||||
2011 | $ | 8,470 | ||
2012 | 8,223 | |||
2013 | 7,927 | |||
2014 | 7,250 | |||
2015 | 6,979 | |||
| ||||
Forum Energy Technologies, Inc. and subsidiaries
Notes to consolidated financial statements
December 31, 2008, 2009 and 2010 (continued)
| Year ending December 31, | ||||
| ||||
2012 | $ | 20,328 | ||
2013 | 20,045 | |||
2014 | 19,222 | |||
2015 | 18,954 | |||
2016 | 18,878 | |||
| ||||
In 2009, the Company concluded that the fair value of its trademarks was less than the carrying values and the assets were impaired. Accordingly, the Company recorded impairment charges of $1.5 million in the year ended December 31, 2009. Accumulated impairment losses on the trademark were $1.7 million as of December 31, 20092010 and 2010.2011.
6.7. Debt and mandatorily redeemable preferred stock
Notes payable and lines of credit as of December 31, 20092010 and 20102011 consist of the following:
| 2009 | 2010 | |||||||||||
| (in thousands) | ||||||||||||
| ||||||||||||
$450 million senior secured revolving credit facility | (f | ) | $ | — | $ | 204,000 | ||||||
FOT debt | ||||||||||||
US revolving line of credit and Canadian dollar revolving line of credit, interest at LIBOR plus applicable margin | (a | ) | 99,629 | — | ||||||||
GFT debt | ||||||||||||
Revolving credit loan payable, interest at LIBOR rate plus 1.75% | (b | ) | 16,100 | — | ||||||||
Revolving credit loan payable, interest at US prime rate | (b | ) | 232 | — | ||||||||
Term note payable, interest at LIBOR rate plus 3.0% | (b | ) | 2,453 | — | ||||||||
Triton | ||||||||||||
Facility A, interest of LIBOR plus the applicable margin | (c | ) | 40,729 | — | ||||||||
Facility B, interest at LIBOR plus the applicable margin | (c | ) | 44,251 | — | ||||||||
Facility C, interest at LIBOR plus the applicable margin | (c | ) | 44,251 | — | ||||||||
Revolving credit facility, interest at LIBOR plus the applicable margin | (c | ) | 1,500 | — | ||||||||
SSI | ||||||||||||
Notes payable to a financial institution, interest of rates based upon the bank’s prime rate | (d | ) | 12,750 | — | ||||||||
Allied | ||||||||||||
Credit agreement, interest at various rates based on leverage ratios | (e | ) | 5,800 | — | ||||||||
Other debt | (g | ) | 4,182 | 3,924 | ||||||||
|
| |||||||||||
Total debt | 271,877 | 207,924 | ||||||||||
Less: current maturities | (34,940 | ) | (3,209 | ) | ||||||||
|
| |||||||||||
Long-term debt | $ | 236,937 | $ | 204,715 | ||||||||
| ||||||||||||
| 2010 | 2011 | |||||||
| ||||||||
| (in thousands) | ||||||||
Senior secured revolving credit facility | $ | 204,000 | $ | 363,694 | ||||
Term loan | — | 300,000 | ||||||
Other debt | 3,924 | 1,861 | ||||||
|
| |||||||
Total debt | 207,924 | 665,555 | ||||||
Less: current maturities | (3,209 | ) | (5,176 | ) | ||||
|
| |||||||
Long-term debt | $ | 204,715 | $ | 660,379 | ||||
| ||||||||
Debt as of December 31, 2009
(a) FOT had a $240 million US revolving line of credit and C$13.2 million (Canadian dollar) revolving line of credit, with the principal due in November 2011. Amounts outstanding at December 31, 2009 were $88.5 million and $11.1 million under the US and Canadian lines, respectively. Interest was payable every 30, 60 or 90 days based on interest rate elections. Amounts outstanding are collateralized by substantially all of Forum’s assets. Weighted average
Forum Energy Technologies, Inc. and subsidiaries
Notes to consolidated financial statements
December 31, 2008, 2009 and 2010 (continued)
interest rate (without the effect of hedging) at December 31, 2009 on all outstanding principal was 2.1%. FOT was in compliance with the covenants related to this facility at December 31, 2009. This line of credit was replaced by the Company’s senior secured credit facility in August 2010.
(b) GFT had a revolving line of credit of up to $35 million and a term loan in the amount of $19 million. Under the provisions of the term loan, amounts borrowed are subject to interest at the LIBOR rate plus 3%. Amounts outstanding at December 31, 2009 were $2.5 million at an interest rate of 3.28%. Under the revolving line of credit, GFT had borrowings of $0.2 million at the base rate of 3.25% and $16.1 million at the Eurodollar rate of 2.00%. The facility was secured by substantially all the assets of GFT. In conjunction with the Combination, this debt was paid through the funds obtained from the Company’s senior secured credit facility.
(c) Triton, in December 2009, through its UK and US subsidiaries, had a credit agreement and provided for up to $58.4 million and £54.6 million in term loans and credit facility borrowings, comprised of revolving facility commitments of up to $15.0 million and Facility A, Facility B and Facility C commitments of $16.8 million and £16.2 million, $13.3 million and £19.2 million, and $13.3 million and £19.2 million, respectively, at the effective date of the agreement. This credit agreement required quarterly payments of principal and interest with a maturity date for the revolving facility of December 31, 2013 and Facility A of between December 31, 2012 and December 31, 2013. The Facility B and Facility C commitments were repayable in full on their respective maturity dates of December 31, 2014 and December 31, 2015. Interest rates for the revolving and term loans under this credit agreement are based on interest rates tied to a margin calculation, LIBOR and a mandatory cost rate, if applicable, ranging from 2.5% to 5.5%. This debt was secured by debentures, bonds floating charges and pledges over certain of the Company’s subsidiary entities. In conjunction with the Combination, this debt was paid through the funds obtained from the Company’s senior secured credit facility.
(d) SSI had various notes payable to a financial institution. Each had annual interest at the greater of the bank’s Prime Rate in effect plus 1.25% or 5.75% (6.25% at December 31, 2009) and matured at various dates. The notes payable were secured by all assets of SSI. In conjunction with the Combination, this debt was paid through the funds obtained from the Company’s senior secured credit facility.
(e) Allied had a credit agreement, which gave Allied the ability to borrow up to $15.0 million under a revolver arrangement for working capital needs. The borrowing base was $16.1 million at December 31, 2009, and is calculated based upon 80% of receivables, 50% of finished goods inventory and 75% of the fixed asset values, all of which are subject to certain exclusions. Allied had $5.8 million outstanding under the credit agreement as of December 31, 2009. In conjunction with the Combination, this debt was paid through the funds obtained from the Company’s senior secured credit facility.
Forum Energy Technologies, Inc. and subsidiaries
Notes to consolidated financial statements
December 31, 2008, 2009 and 2010 (continued)
Debt as of December 31, 2010
(f) In conjunction with the Combination, FET entered into a senior secured credit facility with several financial institutions. The credit facility providesprovided for a $450.0$450 million revolving credit facility, including up to $75.0$75 million of letters of credit and up to $25.0$25 million in swingline loans, and matureswas to mature in August 2014. In addition, the Company hashad the ability to increase the commitments under this facility by up to $150 million. Effective October 4, 2011, the Company amended our senior secured credit facility to, among other things, increase the commitment to $900 million, which included a $300 million term loan, and to extend the facility’s maturity to October 2016.
Amounts outstanding at December 31, 2010 were $204 million. Interest is payable every 30, 60 or 90 days based on interest rate elections. Amounts outstanding are collateralized by substantially all of FET’s assets. Weighted average interest rates (without the effect of hedging) at December 31, 2010 wasand 2011 were 3.0% and 2.78%. The credit facility allows management to elect how interest will be computed which may be determined by reference to the London interbank offered rate, or LIBOR, plus an applicable margin between 2.0% and 3.75% per annum or a base rate plus an applicable margin between 0.5% and 2.25% per annum (with the applicable margin depending upon FET’s ratio of total funded debt to EBITDA).
This credit facility contains covenants which require FET to maintain certain financial ratios. These covenants are as follows:
Total funded debt to EBITDA (as defined in the credit facility) of not more than 3.75 to 1.0 for periods ending through June 30, 2011,December 31, 2012, 3.50 to 1.0 for periods ending from JulyJanuary 1, 20112013 through June 30, 2012,December 31, 2013, 3.25 to 1.0 for periods ending from JulyJanuary 1, 20122014 through June 30, 2013December 31, 2014 and 3.00 to 1.0 for periods ending thereafter; and
EBITDA to interest expense ratio (as defined in the credit facility) of not less than 3.0 to 1.0; and
Total balance sheet debt to total capitalization (as defined in the credit facility) of not more than 0.65 to 1.0.
Availability under the credit facility, considering the covenants discussed above, was approximately $210$230 million at December 31, 2010.2011. The Company is in compliance with the aforementioned financial covenants at December 31, 2010.
Subsequent to December 31, 2010, we amended our credit facility to increase the commitment and we had significant increases in our debt amount related to acquisitions. See footnote 16, Subsequent Events.2011.
Other debt
(g) Other debt consists primarily of upfront annual insurance premiums that have been financed and capital lease obligations.
Forum Energy Technologies, Inc. and subsidiaries
Notes to consolidated financial statements
December 31, 2008, 2009 and 2010 (continued)
Debt issue costs
In conjunction with entering into the new senior secured facility, the Company incurred approximately $6.7$12.1 million in loan costs that have been capitalized and are amortized to interest expense over the term of the facility. As a result, approximately $1.8 million wasand $2.1 million were amortized to interest expense for the yearyears ended December 31, 2010.2010 and 2011, respectively. Due to the payment of the debt and replacement of the facilities held by certain combining entities, the related debt issue costs of $6.1 million that had been previously capitalized were fully written off in August 2010.
Future payments
Future principal payments under long-term debt, by year, are as follows (in thousands):
| Year ending December 31, | ||||||||
|
|
| ||||||
2011 | $ | 3,209 | ||||||
2012 | 715 | $ | 5,176 | |||||
2013 | — | 18,869 | ||||||
2014 | 204,000 | 30,059 | ||||||
2015 | 33,767 | |||||||
2016 | 577,684 | |||||||
Thereafter | — | — | ||||||
|
| |||||||
| $ | 207,924 | $ | 665,555 | |||||
|
|
| ||||||
Allied and GFT redeemable preferred shares
Allied had issued shares of preferred stock to an investment advisor in lieu of payment of management fees. These shares were redeemable at $100 per share and paid an 8% dividend. As of December 31, 2009, there were 624 shares of its preferred stock outstanding. In conjunction with the Combination, these shares and the accrued dividends were redeemed for cash.
As part of GFT acquisitions prior to 2009, GFT had authorized and issued mandatorily redeemable preferred stock. Below is a description of each of Series of redeemable preferred shares. In conjunction with the Combination, these shares and the accrued annual dividends were redeemed for cash for the following amounts:
| ||||
| ||||
| ||||
Mandatorily redeemable Series B
As of December 31, 2009, 100,000 Series B preferred shares of GFT (“Series B”) were authorized and outstanding with a par value of $.001 per share. The Series B preferred stock (“Series B”) ranked senior to Series C and Series D preferred shares. The holders of Series B shares were
Forum Energy Technologies, Inc. and subsidiaries
Notes to consolidated financial statements
December 31, 2008, 2009 and 2010 (continued)
entitled to receive dividends at the rate of 6% per annum. Dividends were cumulative and payable on each anniversary of the date of issuance commencing with the fifth anniversary of that date. Each share of Series B preferred stock shall convert into one share of Series C preferred stock. For those Series B shares not converted to Series C shares in 2010, mandatory redemption began in 2011. The holders of Series B preferred shares, except as otherwise expressly provided by applicable law in the certificate of incorporation, were not entitled to vote. Due to the terms of the Series B preferred stock, the Company had recorded the value of the outstanding shares plus accreted interest as a liability.
Mandatorily redeemable Series C
As of December 31, 2009, 47,000 Series C preferred shares of GFT (“Series C”) were authorized with a par value of $.001. No shares were outstanding at December 31, 2009 but were outstanding at the time of the Combination and redemption due to the mandatory conversion of Series B preferred shares to Series C preferred shares. The Series C preferred shares (“Series C”) ranked senior to Series D preferred shares. The holder of Series C shares were entitled to receive dividends at the rate of 7% per annum. Dividends were cumulative and payable on each anniversary of the issue date commencing with the sixth anniversary of the issue date. The redemption value was equal to the issue price of the shares plus all unpaid, accreted interest. The Company had the right at any time to redeem Series C shares. The holders of Series C preferred shares, except as otherwise expressly provided by applicable law in the certificate of incorporation, were not entitled to vote.
Mandatorily redeemable Series D
As of December 31, 2009, 62,000 Series D preferred shares of GFT (“Series D”) were authorized and outstanding with a par value of $.001 per share. The holders of Series D preferred shares (“Series D”) were entitled to receive dividends at the rate of 6% per annum. In the event that all outstanding shares of Series D were not redeemed on the mandatory redemption date, the remaining outstanding shares of Series D were to continue to accrue dividends at the annual rate of 8% from the mandatory redemption date to the date on which there were no longer any shares of Series D outstanding. Dividends were cumulative and payable at the mandatory redemption date. The redemption value was equal to the issue price of the shares plus all unpaid, accreted interest. The Company had the right at any time to redeem Series D shares. The holders of Series D preferred shares, except as otherwise expressly provided by applicable law in the certificate of incorporation, were not entitled to vote. Due to the terms of the Series D preferred stock, the Company recorded the value of the outstanding shares plus accreted interest as a liability and accrued dividends are included in earnings as interest expense.
Forum Energy Technologies, Inc. and subsidiaries
Notes to consolidated financial statements
December 31, 2008, 2009 and 2010 (continued)
7.8. Income taxes
The components of the Company’s income before tax for the years ended December 31, 2008, 2009, 2010 and 20102011 are as follows:
| 2008 | 2009 | 2010 | ||||||||||
| (in thousands) | ||||||||||||
| ||||||||||||
United States | $ | 42,391 | $ | 18,026 | $ | 24,162 | ||||||
Non United States | 25,358 | 13,818 | 20,184 | |||||||||
|
| |||||||||||
Income from continuing operations before taxes | $ | 67,749 | $ | 31,844 | $ | 44,346 | ||||||
| ||||||||||||
| 2009 | 2010 | 2011 | ||||||||||
| ||||||||||||
| (in thousands) | ||||||||||||
U.S. | $ | 18,026 | $ | 24,162 | $ | 88,968 | ||||||
Non-U.S. | 13,818 | 20,184 | 51,735 | |||||||||
|
| |||||||||||
Income from continuing operations before taxes | $ | 31,844 | $ | 44,346 | $ | 140,703 | ||||||
| ||||||||||||
The Company’s provision (benefit) for income taxes from continuing operations for the years ended December 31, 2008, 2009, 2010 and 20102011 are as follows:
| 2009 | 2010 | 2011 | ||||||||||||||||||||||
| 2008 | 2009 | 2010 |
| |||||||||||||||||||||
| (in thousands) | (in thousands) | |||||||||||||||||||||||
|
| |||||||||||||||||||||||
Current | ||||||||||||||||||||||||
United States Federal and state | $ | 24,341 | $ | 4,334 | $ | 13,869 | ||||||||||||||||||
Non-United States | 13,429 | 8,111 | 7,606 | |||||||||||||||||||||
U.S. Federal and state | $ | 4,334 | $ | 13,869 | $ | 34,351 | ||||||||||||||||||
Non-U.S. | 8,111 | 7,606 | 14,241 | |||||||||||||||||||||
|
|
|
| |||||||||||||||||||||
Total Current | 37,770 | 12,445 | 21,475 | 12,445 | 21,475 | 48,592 | ||||||||||||||||||
|
|
|
| |||||||||||||||||||||
Deferred | ||||||||||||||||||||||||
United States Federal and state | (496 | ) | (2,241 | ) | 132 | |||||||||||||||||||
Non-United States | (4,336 | ) | 807 | (1,310 | ) | |||||||||||||||||||
U.S. Federal and state | (2,241 | ) | 132 | 386 | ||||||||||||||||||||
Non-U.S. | 807 | (1,310 | ) | (1,868 | ) | |||||||||||||||||||
|
|
|
| |||||||||||||||||||||
Total Deferred | (4,832 | ) | (1,434 | ) | (1,178 | ) | (1,434 | ) | (1,178 | ) | (1,482 | ) | ||||||||||||
|
|
|
| |||||||||||||||||||||
Provision for income tax expense | $ | 32,938 | $ | 11,011 | $ | 20,297 | $ | 11,011 | $ | 20,297 | $ | 47,110 | ||||||||||||
|
|
| ||||||||||||||||||||||
Forum Energy Technologies, Inc. and subsidiaries
Notes to consolidated financial statements
December 31, 2008, 2009 and 2010 (continued)
The reconciliation between the actual provision for income taxes from continuing operations and that computed by applying the United StatesU.S. statutory rate to income from continuing operations before income tax and noncontrolling interests are outlined below. In 2008 and 2009, the United States statutory rate for purposes of this reconciliation is less than the corporate statutory rate of 35% as certain of the companies party to the Combination were subject to tax at 34% for United States purposes, which differs from the 35% that the Company is subject to in 2010.
| 2008 | 2009 | 2010 | ||||||||||||||||||||||
| (In thousands) | ||||||||||||||||||||||||
| ||||||||||||||||||||||||
Income tax expense at the statutory rate | $23,374 | 34.5 | % | $11,048 | 34.7 | % | $15,521 | 35.0% | ||||||||||||||||
Change resulting from | ||||||||||||||||||||||||
Impairment of goodwill and other intangible assets | 11,497 | 17.0 | % | — | — | — | — | |||||||||||||||||
State taxes, net of federal tax benefit | 1,131 | 1.7 | % | 423 | 1.3 | % | 1,172 | 2.6% | ||||||||||||||||
Non-United States operations | (1,090 | ) | (1.6 | )% | (2,003 | ) | (6.3 | )% | (1,273 | ) | (2.9)% | |||||||||||||
Nondeductible expenses | 1,636 | 2.4 | % | 797 | 2.5 | % | 3,936 | 8.9% | ||||||||||||||||
Domestic incentives | (779 | ) | (1.1 | )% | (446 | ) | (1.4 | )% | (1,107 | ) | (2.5)% | |||||||||||||
Prior year federal, non-U.S. and state tax | (3,698 | ) | (5.5 | )% | 2,048 | 6.4 | % | 1,431 | 3.2% | |||||||||||||||
Other | 867 | 1.2 | % | (856 | ) | (2.7 | )% | 617 | 1.4% | |||||||||||||||
|
| |||||||||||||||||||||||
| $32,938 | 48.6 | % | $11,011 | 34.5 | % | $20,297 | 45.7% | |||||||||||||||||
| ||||||||||||||||||||||||
Forum Energy Technologies, Inc. and subsidiaries
Notes to consolidated financial statements
December 31, 2008, 2009 and 2010 (continued)
| 2009 | 2010 | 2011 | ||||||||||||||||||||||
| ||||||||||||||||||||||||
| (In thousands) | ||||||||||||||||||||||||
Income tax expense at the statutory rate | $ | 11,145 | 35.0% | $ | 15,521 | 35.0% | $ | 49,246 | 35.0% | |||||||||||||||
Surtax exemption | (97 | ) | (0.3)% | — | — | — | — | |||||||||||||||||
State taxes, net of federal tax benefit | 423 | 1.3% | 1,172 | 2.6% | 3,193 | 2.3% | ||||||||||||||||||
Non-U.S. operations | (2,003 | ) | (6.3)% | (1,273 | ) | (2.9)% | (4,495 | ) | (3.2)% | |||||||||||||||
Nondeductible expenses | 797 | 2.5% | 3,936 | 8.9% | 758 | 0.5% | ||||||||||||||||||
Domestic incentives | (446 | ) | (1.4)% | (1,107 | ) | (2.5)% | (1,179 | ) | (0.8)% | |||||||||||||||
Prior year federal, non-U.S. and state tax | 2,048 | 6.4% | 1,431 | 3.2% | (169 | ) | (0.1)% | |||||||||||||||||
Other | (856 | ) | (2.7)% | 617 | 1.4% | (244 | ) | (0.2)% | ||||||||||||||||
|
| |||||||||||||||||||||||
| $ | 11,011 | 34.5% | $ | 20,297 | 45.7% | $ | 47,110 | 33.5% | ||||||||||||||||
| ||||||||||||||||||||||||
The primary components of deferred taxes include:
| 2010 | 2011 | |||||||||||||||
| 2009 | 2010 |
| ||||||||||||||
| (in thousands) | (in thousands) | |||||||||||||||
|
| |||||||||||||||
Deferred Tax Assets | ||||||||||||||||
Reserves and accruals | $ | 3,249 | $ | 4,788 | $ | 4,788 | $ | 8,347 | ||||||||
Inventory | 4,868 | 5,091 | 5,091 | 9,905 | ||||||||||||
Stock awards | 787 | 2,668 | 2,668 | 3,118 | ||||||||||||
Interest rate swaps | 1,670 | 1,442 | 1,442 | 621 | ||||||||||||
Non-United States tax credit carryforwards | 2,831 | 3,541 | ||||||||||||||
Non-U.S. tax credit carryforwards | 3,541 | 3,081 | ||||||||||||||
NOL and other tax credit carryforwards | 2,223 | 1,579 | 1,579 | 1,332 | ||||||||||||
Other | 1,648 | 19 | 19 | — | ||||||||||||
|
|
|
| |||||||||||||
Total deferred tax assets | 17,276 | 19,128 | 19,128 | 26,404 | ||||||||||||
|
|
|
| |||||||||||||
Deferred Tax Liabilities | ||||||||||||||||
Property and equipment | (3,529 | ) | (4,235 | ) | (4,235 | ) | (10,077 | ) | ||||||||
Goodwill and intangible assets | (25,593 | ) | (23,487 | ) | (23,487 | ) | (30,519 | ) | ||||||||
Unremitted non-United States earnings | (650 | ) | (740 | ) | ||||||||||||
Unremitted non-U.S. earnings | (740 | ) | (740 | ) | ||||||||||||
Prepaid expenses and other | (1,171 | ) | (2,419 | ) | (2,419 | ) | (1,535 | ) | ||||||||
|
|
|
| |||||||||||||
Total deferred tax liabilities | (30,943 | ) | (30,881 | ) | (30,881 | ) | (42,871 | ) | ||||||||
|
|
|
| |||||||||||||
Net deferred tax liabilities | $ | (13,667 | ) | $ | (11,753 | ) | $ | (11,753 | ) | $ | (16,467 | ) | ||||
|
|
| ||||||||||||||
At December 31, 2010,2011 the Company had $3.7$3.6 million of United StatesU.S. net operating loss carryforwards that expire in 2027. The companyCompany also had $1.0$0.5 million of non-United States foreignnon-U.S. net operating loss carryforwards with indefinite expiration dates. All of the United StatesU.S. net operating losses relate to companies acquired by the Company. Use of these losses are subject to limitations under Section 382 of the Internal Revenue Code. The Company anticipates being able to fully utilize the losses prior to their expiration.
At December 31, 2010,2011, the Company had $3.5$3.1 million of foreign tax credit carryforwards that are expected to be utilized in the carryforward period.
Goodwill from certain acquisitions is tax deductible due to the acquisition structure as an asset purchase or due to tax elections made by the Company and the respective sellers at the time of acquisition.
The Company is required to evaluate whether it is more likely than not that deferred tax assets will be realized. The Company believes that it is more likely than not that deferred tax assets at December 31, 20092010 and 20102011 will be utilized to offset future taxable income and the reversal of taxable temporary differences. Consequently, no valuation allowance has been recorded in the financial statements.
The Company is required to evaluate the need to provide United StatesU.S. income taxes on the undistributed earnings of non-United Statesnon-U.S. subsidiaries. Taxes are provided as necessary with
Forum Energy Technologies, Inc. and subsidiaries
Notes to consolidated financial statements
December 31, 2008, 2009 and 2010 (continued)
respect to non-United Statesnon-U.S. earnings that are not permanently reinvested. For all other non-United States subsidiaries,non-U.S. earnings, no United StatesU.S. taxes are provided because such earnings are intended to be reinvested indefinitely to finance non-United Statesnon-U.S. activities.
The Company is the parent of a group of domestic companies which are included in the United States consolidated federal tax income short-period tax return. As a result of the Combination in August 2010, the Company will filefiled pre-acquisition tax returns for all of the parties to the Combination except FOT. The Company will filefiled a 2010 consolidated tax return which will includeincluded the full year earnings of FOT and the post-combination earnings of the other companies. The Company also files income tax returns in various states and non-United Statesnon-U.S. jurisdictions. With few exceptions, the Company is no longer subject to income tax examination by tax authorities in these jurisdictions prior to 2007.
The Company accounts for uncertain tax positions in accordance with guidance in FASB ASC 740 which prescribes the minimum recognition threshold a tax position taken or expected to be taken in a tax return is required to meet before being recognized in the financial statements. A reconciliation of the beginning and ending amount of uncertain tax positions is as follows:
| (In thousands) | ||||
| ||||
Balance at January 1, 2010 | $ | 542 | ||
Additional based on tax positions related to prior years | 1,553 | |||
Reduction based on tax positions related to prior years | — | |||
|
| |||
Balance at December 31, 2010 | $ | 2,095 | ||
| ||||
| (In thousands) | ||||
| ||||
Balance at January 1, 2011 | $ | 2,095 | ||
Additional based on tax positions related to prior years | — | |||
Reduction based on tax positions related to prior years | — | |||
|
| |||
Balance at December 31, 2011 | $ | 2,095 | ||
| ||||
The total amount of uncertain tax positions that, if recognized, would affect the Company’s effective tax rate was approximately $1.7 million as of December 31, 2010.2011. The difference between this amount and the amount reflected in the tabular reconciliation above relates primarily to deferred United StatesU.S. federal and non-United Statesnon-U.S. income tax benefits on uncertain tax positions related to United StatesU.S. federal and non-United Statesnon-U.S. income taxes. The Company does not anticipate any significant changes to the unrecognized tax benefits within the next twelve months.
The Company recognizes interest and penalties related to uncertain tax positions within the provision for income taxes in the consolidated statement of income. As of December 31, 20092010 and 2010,2011, we had accrued approximately $0.1 million, and $0.1 million, respectively, in interest and penalties. During the yearyears ended December 31, 2009, we recognized $0.1 million in net interest2010 and penalties charges related to uncertain tax positions. During the year ended December 31, 2010,2011, we recognized no change in the interest and penalties related to uncertain tax positions.
As of December 31, 2010,2011, the uncertain tax positions and accrued interest and penalties were not expected to be settled within one year and therefore are classified with other long-term liabilities. Increases as a result of positions taken during 2010There were no increases or decreases to the balance in prior years were $1.6 million of which approximately $0.1 million were offset by tax benefits recognized in the current year2011.
Forum Energy Technologies, Inc. and subsidiaries9. Derivatives
Notes to consolidated financial statements
During the year ended December 31, 2008, 2009 and 2010 (continued)
and therefore did not have an impact on the effective tax rate in 2010. The remaining $1.5 million increase relates primarily to uncertain tax positions that were not previously accrued and, consequently had an unfavorable impact on the effective tax rate in 2010.
8. Derivatives
As of December 31, 2010,2011, the Company had interest rate swap agreements to convert variable interest payments related to $49$34 million of floating rate debt to fixed interest payments. These swaps expireexpired in March and November 2011 and have a weighted average fixed rate of 5.1% plus2011. During the applicable margin. As ofyear ended December 31, 2010,2011, the Company also had an interest rate collar arrangement to reduce the variability in interest payments related to $20 million in floating rate debt. This interest rate collar instrument expiresexpired in November 2011 and has a floor interest rate of 4.36%, plus the applicable margin, and a cap interest rate of 5.36%, plus the applicable margin. The Company’s balance sheet at December 31, 2009 and 2010 included a derivative liability of approximately $4.3 million and $2.2 million, respectively.
2011. These instruments which the Company haswere designated as cash flow hedging instruments meet the specific hedge criteria provided by the derivatives and hedging accounting guidance and any changes in their fair values arewere recognized in accumulated other comprehensive income or loss. Since the termsThe Company’s consolidated balance sheets at December 31, 2010 and 2011 included a derivative liability of the hedged itemapproximately $2.2 million and the instruments substantially coincide, the hedge is expected to offset changes in expected cash flows due to fluctuations in the variable rate and, therefore, the Company currently does not expect any ineffectiveness.
The counterparties to the Company’s interest rate swap agreements are major international financial institutions with good credit ratings so nonperformance is not expected from them.zero, respectively.
Certain derivative instruments were not designated for hedge accounting at inception. These derivatives are also recorded at fair value, which is measured using the market approach valuation technique. GFT and Triton had entered theseThese interest rate swap agreements were entered into to hedge the interest rate risk exposure associated with a their respective debt. At December 31, 2009, the fair value of the swap agreements was recorded as a current and long-term liability of $0.4 million and $1.3 million, respectively.exposure. At December 31, 2010, the fair value of the swap agreements was recorded as a long-term liability of $2.2 million. At December 31, 2011, the fair value of the swap agreements was recorded as a current and long-term liability of $0.2 million and $1.6 million, respectively. Related to these swaps, the Company recorded $1.0 million of interest expense and $0.4 million as interest income and $0.4 million of interest expense in the yearyears ended December 31, 20092010 and 2010,2011, respectively.
Forum Energy Technologies, Inc. and subsidiaries
Notes to consolidated financial statements
December 31, 2008, 2009 and 2010 (continued)
Our financial assets and liabilities are measured at fair value on a recurring basis. There were no outstanding financial assets as of December 31, 20092010 and 2010.2011. The following fair value hierarchy table presents information about the Company’s financial liabilities measured at fair value on a recurring basis as of December 31, 20092010 and 2010:2011:
| Quoted prices in active markets for identical assets (Level 1) | Significant other observable inputs (Level 2) | Significant unobservable inputs (Level 3) | Balance as of December 31, 2010 | |||||||||||||||||||||||||||||
| Quoted prices in active markets for identical assets (Level 1) | Significant other observable inputs (Level 2) | Significant unobservable inputs (Level 3) | Balance as of December 31, 2009 |
| ||||||||||||||||||||||||||||
| (in thousands) | (in thousands) | |||||||||||||||||||||||||||||||
|
| |||||||||||||||||||||||||||||||
Liabilities | ||||||||||||||||||||||||||||||||
Interest rate derivatives | $ | — | $ | — | $ | 6,007 | $ | 6,007 | $ | — | $ | — | $ | 4,356 | $ | 4,356 | ||||||||||||||||
|
|
|
| |||||||||||||||||||||||||||||
Total Liabilities | $ | — | $ | — | $ | 6,007 | $ | 6,007 | $ | — | $ | — | $ | 4,356 | $ | 4,356 | ||||||||||||||||
|
|
| ||||||||||||||||||||||||||||||
| Quoted prices in active markets for identical assets (Level 1) | Significant other observable inputs (Level 2) | Significant unobservable inputs (Level 3) | Balance as of December 31, 2010 | |||||||||||||
| (in thousands) | ||||||||||||||||
| ||||||||||||||||
Liabilities | ||||||||||||||||
Interest rate derivatives | $ | — | $ | — | $ | 4,356 | $ | 4,356 | ||||||||
|
| |||||||||||||||
Total Liabilities | $ | — | $ | — | $ | 4,356 | $ | 4,356 | ||||||||
| ||||||||||||||||
| Quoted prices in active markets for identical assets (Level 1) | Significant other observable inputs (Level 2) | Significant unobservable inputs (Level 3) | Balance as of December 31, 2011 | |||||||||||||
| ||||||||||||||||
| (in thousands) | ||||||||||||||||
Liabilities | ||||||||||||||||
Interest rate derivatives | $ | — | $ | — | $ | 1,773 | $ | 1,773 | ||||||||
|
| |||||||||||||||
Total Liabilities | $ | — | $ | — | $ | 1,773 | $ | 1,773 | ||||||||
| ||||||||||||||||
The following table sets forth a reconciliation of changes for the years ended December 31, 2008, 2009, 2010 and 20102011 in the fair value of financial liabilities classified as Level 3 in the fair value hierarchy.
| December 31, | ||||||||||||
| 2008 | 2009 | 2010 | ||||||||||
| (in thousands) | ||||||||||||
| ||||||||||||
Balance at beginning of period | $ | (2,254 | ) | $ | (6,618 | ) | $ | (6,007 | ) | |||
Total Gains or (Losses) (Realized or Unrealized): | ||||||||||||
Included in Earnings | (809 | ) | (1,001 | ) | (441 | ) | ||||||
Included in Other Comprehensive Income | (3,555 | ) | 1,612 | 2,092 | ||||||||
Purchases, Issuances and Settlements | — | — | — | |||||||||
Transfers In and/or Out of Level 3 | — | — | — | |||||||||
|
| |||||||||||
Balance at end of period | $ | (6,618 | ) | $ | (6,007 | ) | $ | (4,356 | ) | |||
| ||||||||||||
| December 31, | ||||||||||||
| 2009 | 2010 | 2011 | ||||||||||
| ||||||||||||
| (in thousands) | ||||||||||||
Balance at beginning of period | $ | (6,618 | ) | $ | (6,007 | ) | $ | (4,356 | ) | |||
Total Gains or (Losses) (Realized or Unrealized): | ||||||||||||
Included in Earnings | (1,001 | ) | (441 | ) | 389 | |||||||
Included in Other Comprehensive Income | 1,612 | 2,092 | 2,194 | |||||||||
Purchases, Issuances and Settlements | — | — | — | |||||||||
Transfers In and/or Out of Level 3 | — | — | — | |||||||||
|
| |||||||||||
Balance at end of period | $ | (6,007 | ) | $ | (4,356 | ) | $ | (1,773 | ) | |||
| ||||||||||||
Forum Energy Technologies, Inc. and subsidiaries
Notes to consolidated financial statements
December 31, 2008, 2009 and 2010 (continued)
9.10. Commitments and contingencies
Litigation
In the ordinary course of business, the Company is, and in the future, could be involved in various pending or threatened legal actions, some of which may or may not be covered by insurance. Management has reviewed pending judicial and legal proceedings, reasonably anticipated costs and expenses in connection with such proceedings, and availability and limits of insurance coverage, and has established reserves that are believed to be appropriate in light of those outcomes that are believed to be probable and can be estimated. The reserve accrued at December 31, 20102011 is insignificant. In the opinion of management, the amount of ultimate liability, if any, with respect to these actions will not have a material adverse effect on the Company’s financial statements.
Portland Harbor Superfund litigation
In May 2009, one of our subsidiaries (which is presently a dormant company with nominal assets except for rights under insurance policies) was named along with many defendants in a suit filed by the Port of Portland, Oregon seeking reimbursement of costs related to a five-year study of contaminated sediments at the port. In March 2010, the subsidiary also received a notice letter from the EPA indicating that it had been identified as a potentially responsible party with respect to environmental contamination in the “study area” for the Portland Harbor Superfund Site. Under a 1997 indemnity agreement, our subsidiary is indemnified by a third party with respect to losses relating to environmental contamination. As required under the indemnity agreement, our
subsidiary provided notice of these claims, and the indemnitor has assumed responsibility and is providing a defense of the claims. Although we believe that it is unlikely that our subsidiary contributed to the contamination at the Portland Harbor Superfund Site, the potential liability of our subsidiary and the ability of the indemnitor to fulfill its indemnity obligations cannot be quantified at this time.
Forum Energy Technologies, Inc. and subsidiaries
Notes to consolidated financial statements
December 31, 2008, 2009 and 2010 (continued)
Operating leases
The Company has operating leases for warehouse, office space, manufacturing facilities and equipment. The leases generally require the Company to pay certain expenses including taxes, insurance, maintenance, and utilities. The minimum future lease commitments under noncancelable leases in effect at December 31, 20102011 are as follows for the respective years ended December 31:follows:
| (In thousands) | (In thousands) | |||||||
|
|
| ||||||
2011 | $ | 10,033 | ||||||
2012 | 6,758 | $ | 13,444 | |||||
2013 | 4,339 | 10,726 | ||||||
2014 | 2,327 | 6,579 | ||||||
2015 | 1,403 | 4,398 | ||||||
2016 | 3,838 | |||||||
Thereafter | 6,236 | 13,961 | ||||||
|
| |||||||
| $ | 31,096 | |||||||
|
| $ | 52,946 | |||||
|
| |||||||
Total rent expense was $7.5 million, $9.2 million, $11.6 million and $11.6$11.0 million under operating leases for the years ended December 31, 2008, 2009, 2010 and 2010,2011, respectively.
Letters of credit and guarantees
The Company executes letters of credit and guarantees in the normal course of business to secure the delivery of product from specific vendors and also to guarantee the Company fulfilling certain performance obligations relating to certain large contracts. At December 31, 2010,2011, the Company had $9.4$4.2 million in letters of credit and guarantees.credit.
10.11. Stockholders’ equity and employee benefit plans
Combination
On August 2, 2010, the Company completed the Combination pursuant to which the shareholders of the companies exchanged all of their common stock for common stock of FOT. In conjunction with the Combination, FOT changed its name to Forum Energy Technologies, Inc.
The shareholders received the following number of FET shares for each share of the respective companies.
Triton | .3562 shares | |||
Subsea | .3168 shares | |||
Global Flow | .9886 shares | |||
Allied | .4623 shares | |||
| ||||
Forum Energy Technologies, Inc. and subsidiaries
Notes to consolidated financial statements
December 31, 2008, 2009 and 2010 (continued)
In conjunction with the Combination, other events occurred including;
the conversion of options to purchase shares of the legacy companies’ shares to options to purchase FET shares,
the conversion of certain restricted legacy shares to FET restricted shares,
conversion of certain legacy options and shares to cash
an offer by the majority shareholder to purchase shares from other shareholders, and
an offer for shareholders to purchase additional FET shares.
Conversion of options and restricted shares
FOT
While FOT changed its name to FET, option holders of FOT common stock retained their options unchanged. FOT restricted stock was also unchanged due to the Combination.
Allied, GFT and SSI options
The options related to Allied, GFT and Subsea were converted based on the conversion ratios described above. The respective exercise price changed in proportion so that the total expected proceeds from the now converted options to purchase FET shares would be the same as the expected proceeds from the legacy options.
Triton Series A and B units
Triton had issued Series A and B time-based management units which vested over time into common units. Depending on certain factors such as whether the person was an accredited investor or the person’s country of residency, the Series A units converted into:
options to purchase FET shares at a ratio of .25 options per each Series A unit, or
restricted or unrestricted FET shares based on the legacy vesting schedule at a ratio of .171 share per each Series A unit, and/or cash.
Depending on certain factors, the Series B units converted into:
options to purchase FET shares at a ratio of .4809 options per each Series B unit, or
cash.
SSI and GFT convertible preferred stock
In 2008 and 2009, SSI granted to its major shareholder and to certain members of management 7,055 restricted convertible preferred stock awards. The preferred stock accrued an 18%
Forum Energy Technologies, Inc. and subsidiaries
Notes to consolidated financial statements
December 31, 2008, 2009 and 2010 (continued)
cumulative and compounding dividend payable in common stock. Accrued but not declared dividends amounted to $2.0 million at December 31, 2009. In conjunction with the Combination, these shares and the accrued common stock dividends were converted to SSI common stock and, in turn, converted to FET shares at the applicable ratio.
As of December 31, 2009, in relation to GFT’s convertible preferred shares, 62,000 shares were outstanding with a par value of $.001 per share. The Series A preferred stock (“Series A”) ranked senior to all other GFT capital stock. In conjunction with the Combination, these shares were converted to FET shares at the applicable ratio.
Allied and GFT redeemable preferred shares
The redeemable preferred shares previously issued by Allied and GFT were redeemed for cash in conjunction with the Combination. See more discussion under the “Debt and redeemable preferred shares” footnote.
Offer to purchase shares
In conjunction with the Combination, the Company purchased 87,938 FET shares or approximately $25 million at a price of $284.29 each share. The amount is included in Treasury Stock in the Company’s Consolidated Balance Sheet.consolidated balance sheet.
Offer to sell shares
In conjunction with the Combination, the Company offered to sell FET shares to certain accredited investors at a price of $284.29 per share. In addition to this offer, purchasers obtained a warrant to purchase additional FET shares equal to one-half of the number of FET shares purchased. The warrants are discussed below. Detail of the purchased shares is as follows:
| Purchaser | Shares purchased | Amount | Warrants granted | Shares purchased | Amount | Warrants granted | ||||||||||||||||||
|
|
| ||||||||||||||||||||||
Majority shareholder | 175,876 | $ | 50.0 million | 87,938 | 175,876 | $ | 50.0 million | 87,938 | ||||||||||||||||
All others | 42,660 | $ | 12.1 million | 21,321 | 42,660 | $ | 12.1 million | 21,321 | ||||||||||||||||
|
|
| ||||||||||||||||||||||
Capital from the majority shareholder
In addition to the above $50 million from the majority shareholder, the same shareholder is committed to purchasingpurchased an additional $50 million of common shares by Augustin June 2011. The commitment to purchaseBased on the shares is at a price per share of $284.29 plus a 5% annual increase or approximately $298.50 per share, at August 2011.83,752 warrants were issued. Similar to the initial purchase of shares, the shareholder will receivereceived a warrant to purchase a share of common stock for every two shares purchased. Based on the August 2011 price, warrants of 83,752 would be issued.
Warrants
The warrants issued pursuant to the above offers to sell shares have an initial exercise price of $284.29 per FET share and are exercisable any time up to the expiration date. The exercise price
Forum Energy Technologies, Inc. and subsidiaries
Notes to consolidated financial statements
December 31, 2008, 2009 and 2010 (continued)
increases 0.5% at the end of each month which equates to an annual increase of 6%. The warrants expire the earlier of five years from the initial issuance or 2.5 years after the consummation of an initial public offering of the Company stock or if other events occur such as a merger with another company.
The warrants outstanding as of December 31, 20102011 were recorded to stockholders’ equity at their fair value. AFor the warrants issued in August 2010, a fair value of $71.62 per warrant was determined using the Black-Scholes pricing model with the following assumptions:
Expected life of 5 years
Volatility of 36.2%
Dividend yield of 0%
Risk-free interest rate of 2.05%
For the warrants issued in June 2011, a fair value of $229.18 per warrant was determined using the Black-Scholes pricing model with the following assumptions:
Expected life of 4 years
Volatility of 38.7%
Dividend yield of 0%
Risk-free interest rate of 0.99%
Employee benefit plans
Each of the legacy entities maintained separate employee savings plans such as contributory profit sharing plans and/or 401(k) savings plan, which benefit eligible employees. Employees are allowed to make contributions to the respective plan in which they participate up to certain limits. The companies made employer contributions either at their discretion or as a matching percentage. The expense under these various plans were $3.5 million, $2.9 million, $3.3 million and $3.3$4.3 million for the years ended December 31, 2008, 2009, 2010 and 2010,2011, respectively.
11.12. Stock based compensation
FET share-based compensation plan
In August 2010, the Company created the 2010 Stock Incentive Plan (the “Plan”) to allow for employees, directors and consultants of the Company and its subsidiaries to maintain stock ownership in the Company through award of stock options, restricted stock or any combination thereof. When certain legacy Triton units were converted, the options granted in 2010 were from this Plan.
Forum Energy Technologies, Inc. and subsidiaries
Notes to consolidated financial statements
December 31, 2008, 2009 and 2010 (continued)
Stock options
The exercise price of each option is based on the fair value of the Company’s stock at the date of grant. Options may be exercised over a ten-year period and generally vest annually in equal increments over four years. The Company’s policy for issuing stock upon a stock option exercise is to issue new shares. The following tables provide additional information related to the options:
2010 Activity | Number of shares | Weighted average exercise price | Remaining weighted average contractual life in years | Intrinsic value | Number of shares | Weighted average exercise price | Remaining weighted average contractual life in years | Intrinsic value | ||||||||||||||||||||||||
| (in thousands) |
| |||||||||||||||||||||||||||||||
|
|
| (in thousands) | |||||||||||||||||||||||||||||
Beginning balance | — | $ | — | $ | — | — | $ | — | $ | — | ||||||||||||||||||||||
Granted | 133,782 | 284 | 145,196 | 289 | ||||||||||||||||||||||||||||
Exercised | — | — | — | — | ||||||||||||||||||||||||||||
Forfeited | — | — | — | — | ||||||||||||||||||||||||||||
|
| |||||||||||||||||||||||||||||||
Total outstanding | 133,782 | 284 | 9.6 | $ | 7,453 | 145,196 | 289 | 9.4 | $ | 7,369 | ||||||||||||||||||||||
|
|
|
| |||||||||||||||||||||||||||||
Options exercisable | — | $ | — | — | $ | — | 5,434 | $ | 309 | 6.6 | $ | 168 | ||||||||||||||||||||
|
|
| ||||||||||||||||||||||||||||||
The above intrinsic value at December 31, 2010, is the amount by which the fair value of the underlying share exceeds the exercise price of an option as of December 31, 2010.
The assumptions used in the Black-Scholes to estimate the fair value of the options granted in 2010 are as follows:
| ||||
| 2010 | ||||
| ||||
Weighted average fair value | $ | 105 | ||
Assumptions | ||||
Expected life (in years) | 6.25 | |||
Volatility | 34% | |||
Dividend yield | 0.0% | |||
Risk free interest rate | 1.54% - 2.0% | |||
| ||||
| 2011 Activity | Number of shares | Weighted average exercise price | Remaining weighted average contractual life in years | Intrinsic value | ||||||||||||
| ||||||||||||||||
| (in thousands) | ||||||||||||||||
Beginning balance | 145,196 | $ | 289 | 9.4 | $ | 7,369 | ||||||||||
Granted | 13,615 | 505 | ||||||||||||||
Exercised | (113 | ) | 284 | |||||||||||||
Forfeited | (1,730 | ) | 307 | |||||||||||||
|
| |||||||||||||||
Total outstanding | 156,968 | 308 | 8.5 | $ | 45,880 | |||||||||||
|
|
|
| |||||||||||||
Options exercisable | 43,839 | $ | 301 | — | $ | 13,126 | ||||||||||
| ||||||||||||||||
Forum Energy Technologies, Inc. and subsidiaries
Notes to consolidated financial statements
The above intrinsic value at December 31, 2008, 2009 and 2010 (continued)2011, is the amount by which the fair value of the underlying share exceeds the exercise price of an option as of December 31, 2011.
The assumptions used in the Black-Scholes to estimate the fair value of the options granted in 2011 are as follows:
| ||||
| 2011 | ||||
| ||||
Weighted average fair value | $ | 188 | ||
Assumptions | ||||
Expected life (in years) | 6.25 | |||
Volatility | 34% | |||
Dividend yield | 0.0% | |||
Risk free interest rate | 1.19% - 2.64% | |||
| ||||
The intrinsic value of the options exercised during 2011 was less than $0.1 million. The above intrinsic value at December 31, 2011, is the amount by which the fair value of the underlying share exceeds the exercise price of an option as of December 31, 2011.
FOT share-based compensation plan
FOT’s 2005 Stock Incentive Plan (the “FOT Plan”) permitted employees, directors and consultants of FOT and its subsidiaries to maintain stock ownership in the Company through award of stock options, restricted stock or any combination thereof. For stock options, the exercise price of each option is based on the fair value of the Company’s stock at the date of grant and the options may be exercised over a five-year period and vest annually in equal increments over three or four years. The Company’s policy for issuing stock upon a stock option exercise is to issue new shares. The following tables provide additional information related to the options:
2008 Activity | Number of shares | Weighted average exercise price | Remaining weighted average contractual life in years | Intrinsic value | ||||||||||||||||||||||||||||
| 2009 Activity | Number of shares | Weighted average exercise price | Remaining weighted average contractual life in years | Intrinsic value | ||||||||||||||||||||||||||||
| (in thousands) |
| |||||||||||||||||||||||||||||||
|
| (in thousands) | ||||||||||||||||||||||||||||||
Beginning balance | 34,079 | $ | 215 | $ | — | 32,281 | $ | 221 | $ | — | ||||||||||||||||||||||
Granted | 4,610 | 320 | 11,380 | 225 | ||||||||||||||||||||||||||||
Exercised | (706 | ) | 132 | (607 | ) | 125 | ||||||||||||||||||||||||||
Forfeited | (5,702 | ) | 273 | (6,539 | ) | 190 | ||||||||||||||||||||||||||
|
| |||||||||||||||||||||||||||||||
Total outstanding | 32,281 | 221 | 3.1 | $ | 2,222 | 36,515 | 230 | 2.9 | $ | — | ||||||||||||||||||||||
|
|
|
| |||||||||||||||||||||||||||||
Options exercisable | 9,870 | 156 | 2.6 | $ | 1,325 | 9,543 | $ | 161 | 1.6 | $ | 614 | |||||||||||||||||||||
|
|
| ||||||||||||||||||||||||||||||
2009 Activity | Number of shares | Weighted average exercise price | Remaining weighted average contractual life in years | Intrinsic value | ||||||||||||||||||||||||||||
| 2010 Activity | Number of shares | Weighted average exercise price | Remaining weighted average contractual life in years | Intrinsic value | ||||||||||||||||||||||||||||
| (in thousands) |
| |||||||||||||||||||||||||||||||
|
| (in thousands) | ||||||||||||||||||||||||||||||
Beginning balance | 32,281 | $ | 221 | $ | — | 36,515 | $ | 221 | 2.9 | $ | — | |||||||||||||||||||||
Granted | 11,380 | 225 | — | — | ||||||||||||||||||||||||||||
Exercised | (607 | ) | 125 | (500 | ) | 100 | ||||||||||||||||||||||||||
Forfeited | (6,539 | ) | 190 | (1,900 | ) | 181 | ||||||||||||||||||||||||||
|
| |||||||||||||||||||||||||||||||
Total outstanding | 36,515 | 230 | 2.9 | $ | — | 34,115 | 234 | 2.9 | $ | — | ||||||||||||||||||||||
|
|
|
| |||||||||||||||||||||||||||||
Options exercisable | 9,543 | 161 | 1.6 | $ | 614 | 24,742 | $ | 223 | 1.4 | $ | 2,890 | |||||||||||||||||||||
|
|
| ||||||||||||||||||||||||||||||
2010 Activity | Number of shares | Weighted average exercise price | Remaining weighted average contractual life in years | Intrinsic value | ||||||||||||
| (in thousands) | ||||||||||||||||
| ||||||||||||||||
Beginning balance | 36,515 | $ | 221 | 2.9 | $ | — | ||||||||||
Granted | — | — | ||||||||||||||
Exercised | (500 | ) | 100 | |||||||||||||
Forfeited | (1,900 | ) | 181 | |||||||||||||
|
| |||||||||||||||
Total outstanding | 34,115 | 234 | 2.9 | $ | — | |||||||||||
|
|
|
| |||||||||||||
Options exercisable | 24,742 | 223 | 1.4 | $ | 2,890 | |||||||||||
| ||||||||||||||||
Forum Energy Technologies, Inc. and subsidiaries
Notes to consolidated financial statements
December 31, 2008, 2009 and 2010 (continued)
The intrinsic value of options exercised during 2008 was approximately $0.1 million. The above intrinsic value at December 31, 2008, is the amount by which the fair value of the underlying share exceeds the exercise price of an option as of December 31, 2008.
| 2011 Activity | Number of shares | Weighted average exercise price | Remaining weighted average contractual life in years | Intrinsic value | ||||||||||||
| ||||||||||||||||
| (in thousands) | ||||||||||||||||
Beginning balance | 34,115 | $ | 221 | 2.9 | $ | — | ||||||||||
Granted | — | — | ||||||||||||||
Exercised | (6,508 | ) | 189 | |||||||||||||
Forfeited | (4,334 | ) | 160 | |||||||||||||
|
| |||||||||||||||
Total outstanding | 23,273 | 261 | 1.6 | $ | 7,896 | |||||||||||
|
|
|
| |||||||||||||
Options exercisable | 16,935 | $ | 270 | 1.3 | $ | 5,583 | ||||||||||
| ||||||||||||||||
The intrinsic value of the options exercised during 2009 was approximatelyless than $0.1 million. The above intrinsic value at December 31, 2009 is the amount by which the fair value of the underlying share exceeds the exercise price of an option as of December 31, 2009.
The intrinsic value of the options exercised during 2010 was approximately $0.1 million. The above intrinsic value at December 31, 2010 is the amount by which the fair value of the underlying share exceeds the exercise price of an option as of December 31, 2010.
The intrinsic value of the options exercised during 2011 was approximately $2.7 million. The above intrinsic value at December 31, 2011 is the amount by which the fair value of the underlying share exceeds the exercise price of an option as of December 31, 2011.
The assumptions used in the Black-Scholes to estimate the fair value of the options granted in 2008 and 2009 are as follows:
| 2008 | 2009 | 2009 | ||||||||||
|
|
| ||||||||||
Weighted average fair value | $ | 72.22 | $ | 67.01 | $ | 67.01 | ||||||
Assumptions | ||||||||||||
Expected life (in years) | 3.8 | 3.8 | 3.8 | |||||||||
Volatility | 25.2% | 38.9% | 39% | |||||||||
Dividend yield | 0.0% | 0.0% | 0.0% | |||||||||
Risk free interest rate | 2.10% | 0.32% | 0.32% | |||||||||
|
|
| ||||||||||
Allied share-based compensation plan
Stock option awards granted under the Allied plan generally vest over a four-year period, with one-fourth vesting in each successive year so that the option is fully exercisable after four years. Such awards generally have ten-year contractual terms.
The following provides additional information related to the options:
2008 Activity | Number of shares | Weighted average exercise price | Remaining weighted average contractual life in years | Intrinsic value | ||||||||||||||||||||||||||||
| 2009 Activity | Number of shares | Weighted average exercise price | Remaining weighted average contractual life in years | Intrinsic value | ||||||||||||||||||||||||||||
| (in thousands) |
| |||||||||||||||||||||||||||||||
|
| (in thousands) | ||||||||||||||||||||||||||||||
Beginning balance | 24,905 | $ | 216 | $ | 1,835 | 25,298 | $ | 216 | 9.0 | $ | 1,864 | |||||||||||||||||||||
Granted | 1,225 | 216 | 1,987 | 216 | ||||||||||||||||||||||||||||
Exercised | — | — | (23 | ) | 216 | |||||||||||||||||||||||||||
Forfeited | (832 | ) | 216 | (184 | ) | 216 | ||||||||||||||||||||||||||
|
| |||||||||||||||||||||||||||||||
Total outstanding | 25,298 | 216 | 9.0 | $ | 1,864 | 27,078 | 216 | 8.2 | $ | 235 | ||||||||||||||||||||||
|
|
|
| |||||||||||||||||||||||||||||
Options exercisable | 16,317 | 216 | 9.0 | $ | 1,202 | 18,624 | $ | 216 | 8.0 | $ | 162 | |||||||||||||||||||||
|
|
| ||||||||||||||||||||||||||||||
| 2010 Activity | Number of shares | Weighted average exercise price | Remaining weighted average contractual life in years | Intrinsic value | ||||||||||||
| ||||||||||||||||
| (in thousands) | ||||||||||||||||
Beginning balance | 27,078 | $ | 216 | 8.2 | $ | 235 | ||||||||||
Granted | — | — | ||||||||||||||
Exercised | — | — | ||||||||||||||
Forfeited | (14,064 | ) | 216 | |||||||||||||
|
| |||||||||||||||
Total outstanding | 13,014 | 216 | 7.2 | $ | 1,610 | |||||||||||
|
|
|
| |||||||||||||
Options exercisable | 8,458 | $ | 216 | 7.0 | $ | 1,046 | ||||||||||
| ||||||||||||||||
Forum Energy Technologies, Inc. and subsidiaries
Notes to consolidated financial statements
December 31, 2008, 2009 and 2010 (continued)
2009 Activity | Number of shares | Weighted average exercise price | Remaining weighted average contractual life in years | Intrinsic value | ||||||||||||
| (in thousands) | ||||||||||||||||
| ||||||||||||||||
Beginning balance | 25,298 | $ | 216 | 9.0 | $ | 1,864 | ||||||||||
Granted | 1,987 | 216 | ||||||||||||||
Exercised | (23 | ) | 216 | |||||||||||||
Forfeited | (184 | ) | 216 | |||||||||||||
|
| |||||||||||||||
Total outstanding | 27,078 | 216 | 8.2 | $ | 235 | |||||||||||
|
|
|
| |||||||||||||
Options exercisable | 18,624 | $ | 216 | 8.0 | $ | 162 | ||||||||||
| ||||||||||||||||
2010 Activity | Number of shares | Weighted average exercise price | Remaining weighted average contractual life in years | Intrinsic value | ||||||||||||||||||||||||||||
| 2011 Activity | Number of shares | Weighted average exercise price | Remaining weighted average contractual life in years | Intrinsic value | ||||||||||||||||||||||||||||
| (in thousands) |
| |||||||||||||||||||||||||||||||
|
| (in thousands) | ||||||||||||||||||||||||||||||
Beginning balance | 27,078 | $ | 216 | 8.2 | $ | 235 | 13,014 | $ | 216 | 7.2 | $ | 1,610 | ||||||||||||||||||||
Granted | — | — | — | — | ||||||||||||||||||||||||||||
Exercised | — | — | — | — | ||||||||||||||||||||||||||||
Forfeited | (14,064 | ) | 216 | (577 | ) | 216 | ||||||||||||||||||||||||||
|
| |||||||||||||||||||||||||||||||
Total outstanding | 13,014 | 216 | 7.2 | $ | 1,610 | 12,437 | 216 | 6.2 | $ | 4,772 | ||||||||||||||||||||||
|
|
|
| |||||||||||||||||||||||||||||
Options exercisable | 8,458 | $ | 216 | 7.0 | $ | 1,046 | 11,241 | $ | 216 | 6.0 | $ | 4,313 | ||||||||||||||||||||
|
|
| ||||||||||||||||||||||||||||||
The assumptions used in the Black-Scholes to estimate the fair value of the options granted in 2008 and 2009 are as follows:
| 2008 | 2009 | 2009 | ||||||||||
|
|
| ||||||||||
Weighted average fair value | $ | 29.50 | $ | 38.87 | $ | 38.87 | ||||||
Assumptions | ||||||||||||
Expected life (in years) | 6.25 | 6.25 | 6.25 | |||||||||
Volatility | 45% | 50% | 50% | |||||||||
Dividend yield | 0.0% | 0.0% | 0.0% | |||||||||
Risk free interest rate | 4.25% | 2.79% | 2.79% | |||||||||
|
|
| ||||||||||
GFT share based compensation plan
GFT had its 2005 Stock Incentive Plan (“the GFT Plan”) which provided for the granting of nonqualified stock options, restricted stock awards, or any combination of the foregoing, as is best suited to the circumstances of the particular employee, consultant or director as provided herein. Option awards under the Plan vest 33% on the first anniversary of the grant date and 33% each year for the following two years and expire seven years from the grant date.
Forum Energy Technologies, Inc. and subsidiaries
Notes to consolidated financial statements
December 31, 2008, 2009 and 2010 (continued)
The following provides additional information related to the options:
2008 Activity | Number of shares | Weighted average exercise price | Remaining weighted average contractual life in years | Intrinsic value | ||||||||||||||||||||||||||||
| 2009 Activity | Number of shares | Weighted average exercise price | Remaining weighted average contractual life in years | Intrinsic value | ||||||||||||||||||||||||||||
| (in thousands) |
| |||||||||||||||||||||||||||||||
|
| (in thousands) | ||||||||||||||||||||||||||||||
Beginning balance | 17,093 | $ | 133 | 5.9 | $ | 3,104 | 17,093 | $ | 133 | 5.9 | $ | 3,104 | ||||||||||||||||||||
Granted | — | — | ||||||||||||||||||||||||||||||
Exercised | — | — | ||||||||||||||||||||||||||||||
Forfeited | — | — | ||||||||||||||||||||||||||||||
|
| |||||||||||||||||||||||||||||||
Total outstanding | 17,093 | 133 | 4.9 | $ | 2,691 | 17,093 | 133 | 4.9 | $ | 2,691 | ||||||||||||||||||||||
|
|
|
| |||||||||||||||||||||||||||||
Options exercisable | 8,217 | 120 | 4.9 | $ | 1,391 | 8,217 | $ | 120 | 4.9 | $ | 1,391 | |||||||||||||||||||||
|
|
| ||||||||||||||||||||||||||||||
2009 Activity | Number of shares | Weighted average exercise price | Remaining weighted average contractual life in years | Intrinsic value | ||||||||||||
| (in thousands) | ||||||||||||||||
| ||||||||||||||||
Beginning balance | 17,093 | $ | 133 | 4.9 | $ | 2,691 | ||||||||||
Granted | — | |||||||||||||||
Exercised | — | |||||||||||||||
Forfeited | (1,088 | ) | 133 | |||||||||||||
|
| |||||||||||||||
Total outstanding | 16,005 | 133 | 3.9 | $ | 1,467 | |||||||||||
|
|
|
| |||||||||||||
Options exercisable | 13,346 | 127 | 3.8 | $ | 1,305 | |||||||||||
| ||||||||||||||||
2010 Activity | Number of shares | Weighted average exercise price | Remaining weighted average contractual life in years | Intrinsic value | ||||||||||||
| (in thousands) | ||||||||||||||||
| ||||||||||||||||
Beginning balance | 16,005 | $ | 133 | 3.9 | $ | 1,467 | ||||||||||
Granted | — | |||||||||||||||
Exercised | — | |||||||||||||||
Forfeited | (1,212 | ) | 129 | |||||||||||||
|
| |||||||||||||||
Total outstanding | 14,793 | 134 | 2.9 | $ | 3,052 | |||||||||||
|
|
|
| |||||||||||||
Options exercisable | 14,793 | 134 | 2.9 | $ | 3,052 | |||||||||||
| ||||||||||||||||
| 2010 Activity | Number of shares | Weighted average exercise price | Remaining weighted average contractual life in years | Intrinsic value | ||||||||||||
| ||||||||||||||||
| (in thousands) | ||||||||||||||||
Beginning balance | 16,005 | $ | 133 | 3.9 | $ | 1,467 | ||||||||||
Granted | — | |||||||||||||||
Exercised | — | |||||||||||||||
Forfeited | (1,212 | ) | 129 | |||||||||||||
|
| |||||||||||||||
Total outstanding | 14,793 | 134 | 2.9 | $ | 3,052 | |||||||||||
|
|
|
| |||||||||||||
Options exercisable | 14,793 | $ | 134 | 2.9 | $ | 3,052 | ||||||||||
| ||||||||||||||||
Forum Energy Technologies, Inc. and subsidiaries
| 2011 Activity | Number of shares | Weighted average exercise price | Remaining weighted average contractual life in years | Intrinsic value | ||||||||||||
| ||||||||||||||||
| (in thousands) | ||||||||||||||||
Beginning balance | 14,793 | $ | 134 | 2.9 | $ | 3,052 | ||||||||||
Granted | — | |||||||||||||||
Exercised | (500 | ) | ||||||||||||||
Forfeited | — | 101 | ||||||||||||||
|
| |||||||||||||||
Total outstanding | 14,293 | 135 | 1.9 | $ | 6,649 | |||||||||||
|
|
|
| |||||||||||||
Options exercisable | 14,293 | $ | 135 | 1.9 | $ | 6,649 | ||||||||||
| ||||||||||||||||
Notes to consolidated financial statements
The intrinsic value of the options exercised during 2011 was approximately $0.3 million. The above intrinsic value at December 31, 2008, 2009 and 2010, (continued)
is the amount by which the fair value of the underlying share exceeds the exercise price of an option as of December 31, 2010.
SSI share-based compensation plan
Effective January 2007, the Company established the Subsea Services International, Inc. 2007 Stock Incentive Plan (“SSI Plan”). Awards granted under this plan generally vest over three years and have a six year contractual term. The following provides more information related to these options:
2008 Activity | Number of shares | Weighted average exercise price | Remaining weighted average contractual life in years | Intrinsic value | ||||||||||||||||||||||||||||
| 2009 Activity | Number of shares | Weighted average exercise price | Remaining weighted average contractual life in years | Intrinsic value | ||||||||||||||||||||||||||||
| (in thousands) |
| |||||||||||||||||||||||||||||||
|
| (in thousands) | ||||||||||||||||||||||||||||||
Beginning balance | 1,467 | $ | 316 | 6.2 | $ | — | 942 | $ | 316 | 5.2 | $ | — | ||||||||||||||||||||
Granted | — | 587 | ||||||||||||||||||||||||||||||
Exercised | — | — | ||||||||||||||||||||||||||||||
Forfeited | (525 | ) | 316 | — | — | |||||||||||||||||||||||||||
|
|
|
| |||||||||||||||||||||||||||||
Total outstanding | 942 | 316 | 5.2 | $ | — | 1,529 | 316 | 4.2 | $ | — | ||||||||||||||||||||||
|
|
|
| |||||||||||||||||||||||||||||
Options exercisable | 314 | 316 | 4.4 | $ | — | 629 | $ | 316 | 3.4 | $ | — | |||||||||||||||||||||
|
|
| ||||||||||||||||||||||||||||||
2009 Activity | Number of shares | Weighted average exercise price | Remaining weighted average contractual life in years | Intrinsic value | ||||||||||||
| (in thousands) | ||||||||||||||||
| ||||||||||||||||
Beginning balance | 942 | $ | 316 | 5.2 | $ | — | ||||||||||
Granted | 587 | 316 | ||||||||||||||
Exercised | — | |||||||||||||||
Forfeited | ||||||||||||||||
|
| |||||||||||||||
Total outstanding | 1,529 | 316 | 4.2 | $ | — | |||||||||||
|
|
|
| |||||||||||||
Options exercisable | 629 | 316 | 3.4 | $ | — | |||||||||||
| ||||||||||||||||
2010 Activity | Number of shares | Weighted average exercise price | Remaining weighted average contractual life in years | Intrinsic value | ||||||||||||
| (In thousands) | ||||||||||||||||
| ||||||||||||||||
Beginning balance | 1,529 | $ | 316 | 4.2 | $ | — | ||||||||||
Granted | 316 | 316 | ||||||||||||||
Exercised | — | |||||||||||||||
Forfeited | — | — | ||||||||||||||
|
|
|
| |||||||||||||
Total outstanding | 1,845 | 316 | 3.2 | $ | 45 | |||||||||||
|
|
|
| |||||||||||||
Options exercisable | 1,137 | 316 | 2.4 | $ | 28 | |||||||||||
| ||||||||||||||||
Forum Energy Technologies, Inc. and subsidiaries
Notes to consolidated financial statements
December 31, 2008, 2009 and 2010 (continued)
| 2010 Activity | Number of shares | Weighted average exercise price | Remaining weighted average contractual life in years | Intrinsic value | ||||||||||||
| ||||||||||||||||
| (in thousands) | ||||||||||||||||
Beginning balance | 1,529 | $ | 316 | 4.2 | $ | — | ||||||||||
Granted | 316 | 316 | ||||||||||||||
Exercised | — | |||||||||||||||
Forfeited | — | — | ||||||||||||||
|
| |||||||||||||||
Total outstanding | 1,845 | 316 | 3.2 | $ | 45 | |||||||||||
|
|
|
| |||||||||||||
Options exercisable | 1,137 | $ | 316 | 2.4 | $ | 28 | ||||||||||
| ||||||||||||||||
| 2011 Activity | Number of shares | Weighted average exercise price | Remaining weighted average contractual life in years | Intrinsic value | ||||||||||||
| ||||||||||||||||
| (In thousands) | ||||||||||||||||
Beginning balance | 1,845 | $ | 316 | 3.2 | $ | 45 | ||||||||||
Granted | — | |||||||||||||||
Exercised | — | |||||||||||||||
Forfeited | (661 | ) | 316 | |||||||||||||
|
| |||||||||||||||
Total outstanding | 1,184 | 316 | 2.5 | $ | 337 | |||||||||||
|
|
|
| |||||||||||||
Options exercisable | 846 | $ | 316 | 2.0 | $ | 241 | ||||||||||
| ||||||||||||||||
Restricted stock for FET combined
Restricted stock vests over a three or four year period from the date of grant. Further information about the restricted stock follows:
| Restricted stock | |||||||
| |||||||
| |||||||
| |||||||
| |||||||
| |||||||
| |||||||
| |||||||
2009 Activity | |||||||
Nonvested at the beginning of the year | 12,138 | ||||||
Granted | 1,248 | ||||||
Vested | (5,498 | ) | |||||
Cancelled | (600 | ) | |||||
|
| ||||||
Nonvested at the end of the year | 7,288 | ||||||
|
| ||||||
2010 Activity | |||||||
Nonvested at the beginning of the year | 7,288 | ||||||
Granted | 6,576 | ||||||
Vested | (4,133 | ) | |||||
Cancelled | (649 | ) | |||||
|
| ||||||
Nonvested at the end of the year | 9,082 | ||||||
2011 Activity | |||||||
Nonvested at the beginning of the year | 9,082 | ||||||
Granted | 11,712 | ||||||
Vested | �� | (4,306 | ) | ||||
Cancelled | (29 | ) | |||||
Nonvested at the end of the year | 16,459 | ||||||
| |||||||
The weighted average grant date fair value of the restricted stock was $341, $225, $282 and $282$508 per share during the years ended December 31, 2008, 2009, 2010 and 2010,2011, respectively.
For all the plans, the total amount of compensation expense recorded was approximately $2.9 million, $3.3 million, $5.1 million and $5.1$5.2 million for the years ended December 31, 2008, 2009, 2010 and 2010,2011, respectively. As of December 31, 2010,2011, the Company expects to record compensation expense of approximately $15.6$12.1 million over the remaining term of the restricted stock and options of approximately four3 years. Future stock option grants will result in additional compensation expense.
12.13. Related party transactions
FOT has related party transactions, including sales and leasing activity with certain former owners of acquired companies or certain stockholders. The dollar amounts related to these related party activities are not significant to the Company’s consolidated financial statements. For GFT, in conjunction with the acquisition of one of its subsidiaries, the Company entered into various operating lease agreements with the former principals for office and warehouse space. For the
Forum Energy Technologies, Inc. and subsidiaries
Notes to consolidated financial statements
December 31, 2008, 2009 and 2010 (continued)
years ended December 31, 2008, 2009, 2010 and 2010,2011, the Company paid $0.3 million each year in lease payments to these affiliates. GFT also utilizes a certain agent, which is owned by a former owner. The amount paid to this agent for the years ended December 31, 20092010 and 20102011 was $0.2 million each year.and $0.1 million, respectively.
Allied leases two facilities from a stockholder in FET. Allied paid $0.7$0.8 million, $0.8$0.9 million and $0.9 million in lease payments for the years ended December 31, 2008, 2009, 2010 and 2010,2011, respectively. Allied purchased inventory and services from a shareholder of $5.0 million, $3.1 million, $4.2 million and $4.2$4.8 million from a shareholder for the years ended December 31, 2008, 2009, 2010 and 2010,2011, respectively. The Company sold $1.6 million, $0.1 million $1.6 million and $0.1$4 million of equipment and services to a shareholder during the years ended December 31, 2008, 2009, 2010 and 2010,2011, respectively.
13.14. Business segments
The Company’s operations are divided into the following operating segments, which are our reportable segments: (1) Drilling and Subsea, (2) Production and Infrastructure and (3) Corporate. Our Drilling and Subsea segment designs, manufactures, and provides products and related services to the drilling and intervention sectors as well as to the subsea services and construction sectors. The company’sCompany’s Production and Infrastructure segment designs, manufactures and provides surface process and pipeline equipment, specialty pipeline construction equipment, a broad range of valves, surface completion and flow equipment, and offer supporting aftermarket services.
The Company’s reportable segments are strategic units that offer distinct products and services. They are managed separately since each business segment requires different marketing strategies due to customer specifications. Operating segments have not been aggregated as part of a reportable segment. The Company evaluates the performance of its reportable segments based on operating income. This segmentation is representative of the manner in which our Chief Operating Decision Maker (“CODM”) and our Board of Directors views the business. We consider the CODM to be the Chief Executive Officer.
Forum Energy Technologies, Inc. and subsidiaries
Notes to consolidated financial statements
December 31, 2008, 2009 and 2010 (continued)
Summary financial data by segment follows (in thousands):
| Year ended December 31, 2008 | Year ended December 31, 2009 | |||||||||||||||||||||||||||||||||||||||||||||||
| Drilling and subsea | Production and infrastructure | Corporate | Consolidated | Gain/(Loss) on sale of | Total | Drilling and subsea | Production and infrastructure | Corporate | Consolidated | Gain/(Loss) on sale of | Total | |||||||||||||||||||||||||||||||||||||
|
|
| ||||||||||||||||||||||||||||||||||||||||||||||
Revenues | $ | 658,804 | $ | 313,747 | $ | — | $ | 972,551 | $ | — | $ | 972,551 | $ | 455,019 | $ | 222,359 | $ | — | $ | 677,378 | $ | — | $ | 677,378 | ||||||||||||||||||||||||
Depreciation and amortization | 27,475 | 7,439 | — | 34,914 | — | 34,914 | 30,296 | 8,142 | — | 38,438 | — | 38,438 | ||||||||||||||||||||||||||||||||||||
Operating income | 67,041 | 22,728 | — | 89,769 | 619 | 90,388 | 38,226 | 12,118 | — | 50,344 | (137 | ) | 50,207 | |||||||||||||||||||||||||||||||||||
Capital expenditures | 32,066 | 7,576 | — | 39,642 | — | 39,642 | 12,487 | 2,591 | — | 15,078 | — | 15,078 | ||||||||||||||||||||||||||||||||||||
|
|
| ||||||||||||||||||||||||||||||||||||||||||||||
| Year ended December 31, 2009 | ||||||||||||||||||||||||
| Drilling and subsea | Production and infrastructure | Corporate | Consolidated | Gain/(Loss) on sale of assets not part of segment income | Total | |||||||||||||||||||
| ||||||||||||||||||||||||
Revenues | $ | 455,019 | $ | 222,359 | $ | — | $ | 677,378 | $ | — | $ | 677,378 | ||||||||||||
Depreciation and amortization | 30,296 | 8,142 | — | 38,438 | — | 38,438 | ||||||||||||||||||
Operating income | 38,226 | 12,118 | — | 50,344 | (137 | ) | 50,207 | |||||||||||||||||
Capital expenditures | 12,487 | 2,591 | — | 15,078 | — | 15,078 | ||||||||||||||||||
Total Assets | 664,586 | 175,640 | — | 840,226 | — | 840,226 | ||||||||||||||||||
Goodwill | 281,647 | 18,929 | — | 300,576 | — | 300,576 | ||||||||||||||||||
| ||||||||||||||||||||||||
| Year ended December 31, 2010 | ||||||||||||||||||||||||
| Drilling and subsea | Production and infrastructure | Corporate | Consolidated | Gain/(Loss) on sale of | Total | |||||||||||||||||||
| ||||||||||||||||||||||||
Revenues | $ | 474,306 | $ | 273,029 | $ | — | $ | 747,335 | $ | — | $ | 747,335 | ||||||||||||
Depreciation and amortization | 25,777 | 7,439 | — | 33,216 | — | 33,216 | ||||||||||||||||||
Operating income | 53,533 | 22,614 | (3,331 | ) | 72,816 | 461 | 73,277 | |||||||||||||||||
Capital expenditures | 13,188 | 6,436 | — | 19,624 | — | 19,624 | ||||||||||||||||||
Total assets | 637,395 | 179,686 | 1,251 | 818,332 | — | 818,332 | ||||||||||||||||||
Goodwill | 275,528 | 18,853 | — | 294,381 | — | 294,381 | ||||||||||||||||||
| ||||||||||||||||||||||||
Forum Energy Technologies, Inc. and subsidiaries
Notes to consolidated financial statements
December 31, 2008, 2009 and 2010 (continued)
| Year ended December 31, 2010 | ||||||||||||||||||||||||
| Drilling and subsea | Production and infrastructure | Corporate | Consolidated | Gain/(Loss) on sale of assets not part of segment income | Total | |||||||||||||||||||
| ||||||||||||||||||||||||
Revenues | $ | 474,306 | $ | 273,029 | $ | — | $ | 747,335 | $ | — | $ | 747,335 | ||||||||||||
Depreciation and amortization | 25,777 | 7,439 | — | 33,216 | — | 33,216 | ||||||||||||||||||
Operating income | 53,533 | 22,614 | (3,331 | ) | 72,816 | 461 | 73,277 | |||||||||||||||||
Capital expenditures | 13,188 | 6,436 | — | 19,624 | — | 19,624 | ||||||||||||||||||
Total Assets | 637,395 | 179,686 | 1,251 | 818,332 | — | 818,332 | ||||||||||||||||||
Goodwill | 275,528 | 18,853 | — | 294,381 | — | 294,381 | ||||||||||||||||||
| ||||||||||||||||||||||||
| Year ended December 31, 2011 | ||||||||||||||||||||||||||||||||
| Drilling and subsea | Production and infrastructure | Corporate | Consolidated | Gain/(Loss) on sale of | Contingent Consideration not part of segment income | Transaction expenses not part of segment income | Total | |||||||||||||||||||||||||
| ||||||||||||||||||||||||||||||||
Revenues | $ | 659,430 | $ | 468,701 | $ | — | $ | 1,128,131 | $ | — | $ | — | $ | — | $ | 1,128,131 | ||||||||||||||||
Depreciation and amortization | 30,853 | 9,845 | 77 | 40,775 | — | — | — | 40,775 | ||||||||||||||||||||||||
Operating income | 117,927 | 77,997 | (20,237 | ) | 175,687 | 634 | (12,100 | ) | (3,608 | ) | 160,613 | |||||||||||||||||||||
Capital expenditures | 22,774 | 13,621 | 4,768 | 41,163 | — | — | — | 41,163 | ||||||||||||||||||||||||
Total assets | 1,193,128 | 388,570 | 25,617 | 1,607,315 | — | — | — | 1,607,315 | ||||||||||||||||||||||||
Goodwill | 523,019 | 77,808 | — | 600,827 | — | — | — | 600,827 | ||||||||||||||||||||||||
| ||||||||||||||||||||||||||||||||
For internal management reporting, and therefore in the above segment information, Corporate includes expenses associated with the Company’s Corporate Office, as well as the Company’s interest income, interest expense and acquisition-related costs of the Company.corporate office.
Revenues by shipping location and long-lived assets by country were as follows (in thousands):
| Year ended December 31, | Year ended December 31, | |||||||||||||||||||||||
| 2008 | 2009 | 2010 | 2009 | 2010 | 2011 | |||||||||||||||||||
|
| |||||||||||||||||||||||
Revenues: | Revenues: |
| ||||||||||||||||||||||
United States | $ | 547,141 | $ | 352,578 | $ | 408,615 | $ | 352,578 | $ | 408,615 | $ | 707,092 | ||||||||||||
Europe & Africa | 131,600 | 119,204 | 162,694 | |||||||||||||||||||||
Canada | 102,494 | 55,100 | 69,624 | 55,100 | 69,624 | 102,916 | ||||||||||||||||||
Asia-Pacific | 86,800 | 105,419 | 89,323 | |||||||||||||||||||||
Middle East | 23,000 | 18,245 | 33,318 | |||||||||||||||||||||
Latin America | 18,697 | 28,300 | 26,228 | 28,300 | 26,228 | 32,788 | ||||||||||||||||||
Europe & Africa | 173,673 | 131,600 | 119,204 | |||||||||||||||||||||
Middle East | 42,381 | 23,000 | 18,245 | |||||||||||||||||||||
Asia-Pacific | 88,165 | 86,800 | 105,419 | |||||||||||||||||||||
|
|
|
| |||||||||||||||||||||
Total revenues | $ | 972,551 | $ | 677,378 | $ | 747,335 | $677,378 | $747,335 | $1,128,131 | |||||||||||||||
| ||||||||||||||||||||||||
| Year ended December 31, | As of December 31, | |||||||||||||||
| 2009 | 2010 | 2010 | 2011 | |||||||||||||
|
| |||||||||||||||
Long-lived assets: | Long-lived assets: |
| ||||||||||||||
United States | $ | 271,598 | $ | 254,615 | $ | 254,615 | $ | 712,517 | ||||||||
Europe & Africa | 191,487 | 190,384 | ||||||||||||||
Canada | 16,969 | 17,545 | 17,545 | 72,974 | ||||||||||||
Asia-Pacific | 7,776 | 7,495 | ||||||||||||||
Middle East | 3,251 | 3,199 | ||||||||||||||
Latin America | 1,584 | 1,551 | 1,551 | 2,160 | ||||||||||||
Europe & Africa | 198,277 | 191,487 | ||||||||||||||
Middle East | 3,264 | 3,251 | ||||||||||||||
Asia-Pacific | 8,345 | 7,776 | ||||||||||||||
|
|
|
| |||||||||||||
Total long lived assets | $ | 500,037 | $ | 476,225 | $ | 476,225 | $ | 988,729 | ||||||||
| ||||||||||||||||
Revenues by product lines were as follows (in thousands):
| Year ended December 31, | ||||||||||||
| 2008 | 2009 | 2010 | ||||||||||
| ||||||||||||
Revenues: | ||||||||||||
Drilling Technologies | $ | 391,428 | $ | 255,425 | $ | 277,573 | ||||||
Subsea Technologies | 267,376 | 199,594 | 196,733 | |||||||||
Valve Solutions | 200,627 | 134,673 | 147,472 | |||||||||
Production Equipment | 113,120 | 87,686 | 125,557 | |||||||||
|
| |||||||||||
Total revenues | $ | 972,551 | $ | 677,378 | $ | 747,335 | ||||||
| ||||||||||||
Forum Energy Technologies, Inc. and subsidiaries
Notes to consolidated financial statements
December 31, 2008, 2009 and 2010 (continued)
14. Acquisitions
During the year ended December 31, 2008, the Company completed the acquisition of six companies. There were no significant acquisitions in 2009 or 2010. The Company allocated the total purchase consideration to the assets acquired and liabilities assumed based on their respective fair values as of the acquisition date. In making its purchase price allocations, the assets and liabilities acquired in these acquisitions are valued based upon estimated fair values of the tangible assets and appraisals of the intangible assets. The estimates used in valuing all intangible assets were based upon assumptions believed to be reasonable at the date of acquisition. The 2008 acquisitions are discussed below.
Dynamic Positioning Services Ltd.
In March 2008, the Company acquired Dynamic Positioning Services Ltd (“DPS”). Based in Aberdeen, Scotland, DPS specializes in equipment rental, product sales, engineering sales, engineering solutions and personnel supply to leading oil and gas companies worldwide. The financial operating results of DPS are included in the Company’s consolidated financial statements beginning from March 14, 2008. The Company acquired DPS for total consideration of $84.9 million. Total consideration included $74.6 million in cash, contingent deferred loan notes of $3.4 million and common stock valued at $6.3 million. The Company incurred acquisition related fees and expenses of $0.6 million. Such consideration has been allocated to the assets acquired and liabilities assumed, including identifiable intangible assets, based on their respective fair values as of the acquisition date. Such allocation resulted in goodwill of $45.3 million. The following table summarizes the fair values of the assets acquired and the liabilities assumed as of the acquisition date (in thousands):
Cash and cash equivalents | $ | 280 | ||
Accounts receivable | 6,777 | |||
Inventory | 350 | |||
Revenue equipment, property and equipment | 20,823 | |||
Non-tax-deductible Goodwill | 45,313 | |||
Intangible assets (primarily customer relationships) | 17,655 | |||
Deferred tax asset | 1,457 | |||
Other assets | 6,923 | |||
|
| |||
Total assets acquired | 99,578 | |||
Accounts payable | (3,022 | ) | ||
Accrued liabilities | (721 | ) | ||
Deferred tax liability | (4,943 | ) | ||
Other liabilities | (1,783 | ) | ||
Long-term debt | (4,160 | ) | ||
|
| |||
Total liabilities assumed | (14,629 | ) | ||
|
| |||
Total net assets acquired | $ | 84,949 | ||
| ||||
Forum Energy Technologies, Inc. and subsidiaries
Notes to consolidated financial statements
December 31, 2008, 2009 and 2010 (continued)
Associated Dynamic, Ltd.
In July 2008, the Company purchased Associated Dynamics, Ltd. (“ADI”). ADI is a wholesaler of bearings used in the drilling industry primarily selling to distributors and original equipment manufacturers. This acquisition provides access to a global distribution network for the Company’s drilling consumables product line. The results of ADI’s operations are included in the consolidated financial statements of the Company beginning August 1, 2008. The purchase was for cash of $17.6 million, plus common stock of the Company valued at $5.5 million. Such consideration has been allocated to the assets acquired and liabilities assumed, including identifiable intangible assets, based on their respective fair values as of the acquisition date. Such allocation resulted in goodwill of $7.3 million. The following table summarizes the fair values of the assets acquired and the liabilities assumed as of the acquisition date (in thousands):
Current assets, net of cash acquired | $ | 12,952 | ||
Property and equipment | 148 | |||
Other assets | 323 | |||
Intangible assets (primarily customer relationships) | 6,200 | |||
Non-tax-deductible goodwill | 7,329 | |||
Current liabilities | (1,768 | ) | ||
Deferred income tax (asset) liability, net | (1,991 | ) | ||
|
| |||
Net assets acquired | $ | 23,193 | ||
|
| |||
Cash consideration, net of cash acquired | $ | 17,646 | ||
Issuance of stock | 5,547 | |||
|
| |||
Total consideration | $ | 23,193 | ||
| ||||
Forum Energy Technologies, Inc. and subsidiaries
Notes to consolidated financial statements
December 31, 2008, 2009 and 2010 (continued)
Equipment and Technical Services Inc.
In December 2008, the Company acquired Equipment and Technical Services Inc. (“ETS”). Based in Houston, ETS specializes in equipment rental, sales and technical support to the marine and offshore industries. The financial operating results of ETS are included in the Company’s consolidated financial statements beginning from December 23, 2008. The Company acquired ETS for total consideration of $27.4 million. Total consideration included $17.0 million in cash and common stock valued at $8.5 million. The Company incurred acquisition related fees and expenses of $1.9 million. Such consideration has been allocated to the assets acquired and liabilities assumed, including identifiable intangible assets, based on their respective fair values as of the acquisition date. Such allocation resulted in goodwill of $14.6 million. The following table summarizes the fair values of the assets acquired and the liabilities assumed as of the acquisition date (in thousands):
Cash and cash equivalents | $ | 1,185 | ||
Accounts receivable | 5,278 | |||
Inventory | 101 | |||
Revenue equipment, property and equipment | 7,230 | |||
Non-tax-deductible Goodwill | 14,578 | |||
Intangible assets (primarily customer relationships) | 2,770 | |||
Other assets | 529 | |||
|
| |||
Total assets acquired | 31,671 | |||
Accounts payable | (889 | ) | ||
Accrued liabilities | (73 | ) | ||
Deferred tax liability | (1,069 | ) | ||
Other liabilities | (2,265 | ) | ||
|
| |||
Total liabilities assumed | (4,296 | ) | ||
|
| |||
Total net assets acquired | $ | 27,375 | ||
| ||||
Forum Energy Technologies, Inc. and subsidiaries
Notes to consolidated financial statements
December 31, 2008, 2009 and 2010 (continued)
Other acquisitions
In addition to the acquisitions previously mentioned, the Company had three other acquisitions during the year ended December 31, 2008. Total consideration was $31.0 million, which consisted of $25.3 million in cash, loan notes of $2.1 million and common stock valued at $2.8 million. The Company incurred acquisition related fees and expenses of $0.8 million. Such consideration was allocated to the assets acquired and liabilities assumed, including identifiable intangible assets, based on their respective fair values as of the respective acquisition dates. The following table summarizes the fair values of the assets acquired and the liabilities assumed as of the acquisition dates (in thousands):
Cash and cash equivalents | $ | 3,208 | ||
Accounts receivable | 4,654 | |||
Revenue equipment, property and equipment | 6,143 | |||
Non-tax-deductible Goodwill | 13,962 | |||
Intangible assets (primarily customer relationships) | 8,599 | |||
Other assets | 165 | |||
|
| |||
Total assets acquired | 36,731 | |||
Accounts payable | (1,149 | ) | ||
Accrued liabilities | (248 | ) | ||
Deferred tax liability | (2,711 | ) | ||
Other liabilities | (1,614 | ) | ||
|
| |||
Total liabilities assumed | (5,722 | ) | ||
|
| |||
Total net assets acquired | $ | 31,009 | ||
| ||||
Pro forma information related to the acquisition (unaudited)
The following table provides pro forma information related to the acquisitions (in thousands, except per share data):
| Year ended December 31, 2008 | ||||
| ||||
Revenue | $ | 1,010,296 | ||
Net income | 39,282 | |||
Basic earnings per share | 30.76 | |||
Diluted earnings per share | 30.08 | |||
| ||||
The pro forma information for the year ended December 31, 2008 assumes the acquisitions listed above occurred at the beginning of the period.
Revenues: Drilling Technologies Subsea Technologies Downhole Technologies Production Equipment Valve Solutions Flow Equipment Total revenues The combined results of operations of the acquired businesses have been adjusted to reflect additional depreciation of fixed assets and amortization of intangible assets subject to amortization. Pro forma interest expense was calculated on notes payable and draws on the Company’s available line of credit at a rate of 7%, as if the businesses were acquired at the beginning of the period. Year ended December 31, 2009 2010 2011 $ 255,425 $ 277,573 $ 372,046 199,594 196,733 220,944 — — 66,440 87,686 125,557 178,110 134,673 147,472 173,836 — — 116,755 $ 677,378 $ 747,335 $ 1,128,131
Forum Energy Technologies, Inc. and subsidiaries
Notes to consolidated financial statements
December 31, 2008, 2009 and 2010 (continued)
Although the Company believes the accounting policies and procedures used to prepare the pro forma schedules are reasonable, these pro forma results do not purport to be indicative of the actual results which would have been achieved had the acquisition been consummated on January 1, 2008. The amounts shown are not intended to be a projection of future results.
15. Discontinued operations
Due to deteriorating economic conditions and the uncertainty surrounding the political climate, during 2009 GFT discontinued the valve operations of its Venezuelan subsidiary. For the year ended December 31, 2008 and 2009, the subsidiary incurred losses of $0.4 million and $1.3 million, respectively.million.
The assets and liabilities classified asresults of discontinued operations as offor the year ended December 31, 2009 were as follows (in thousands):
| 2009 | ||||
| ||||
Assets | ||||
Accounts receivable | $ | 230 | ||
|
| |||
Total assets of discontinued operations | $ | 230 | ||
|
| |||
Liabilities | ||||
Accounts payable | $ | 10 | ||
Other liabilities | 763 | |||
|
| |||
Total liabilities of discontinued operations | $ | 773 | ||
| ||||
| ||||
Net sales | $ | 104 | ||
Operating loss from discontinued operations | (1,342 | ) | ||
(Provision) benefit from income taxes | — | |||
Loss from discontinued operations | $ | (1,342 | ) | |
| ||||
The Company reclassified the results of discontinued operations were as follows (in thousands):
| 2008 | 2009 | |||||||
| ||||||||
Net sales | $ | 2,937 | $ | 104 | ||||
|
| |||||||
Operating loss from discontinued operations | (396 | ) | (1,342 | ) | ||||
(Provision) benefit from income taxes | — | — | ||||||
|
| |||||||
Loss from discontinued operations | $ | (396 | ) | $ | (1,342 | ) | ||
| ||||||||
The Company has reclassifiedfor the subsidiary from continuing operations to discontinued operations, for periods presented, the results of operations and assets and liabilities for the subsidiary.
16. Subsequent events
The Company has evaluated subsequent events through the date these financial statements were issued.
Effective June 29, 2011, we amended our senior secured credit facility to, among other things, increase the commitment to $750 million. In conjunction with the acquisitions made subsequent to December 31, 2010, discussed below, the Company borrowed on its credit facility an amount of approximately $520 million.
Forum Energy Technologies, Inc. and subsidiaries
Notes to consolidated financial statements
December 31, 2008, 2009 and 2010 (continued)
Subsequent to December 31, 2010, there were eight acquisitions, of which, the significant ones are discussed below.
In February 2011, the Company purchased Wood Flowline Products, LLC (“WFP”). WFP manufactures pressure control and flow equipment products that are principally used in the fracturing and well stimulation process. WFP also provides on-site recertification and refurbishment services of the associated flow equipment products. This acquisition provides the Company new exposure to the growing well completions sector, specifically focused on the development of North American unconventional shale and tight sands resources. The results of WFP’s operations have been included in the Company’s consolidated financial statements beginning February 1, 2011 and will be included in the Company’s Production and Infrastructure segment. The Company incurred acquisition related fees and expenses of $0.4 million. WFP recorded revenue and earnings of $22.1 million and $4.9 million, respectively, from the time of acquisition through June 30, 2011. The purchase price included: (1) cash of $32.7 million, (2) 35,000 shares of common stock of the Company valued at $340 per share based on an internal valuation and (3) two separate contingent consideration payments which may be payable in cash and/or shares of Company stock based upon WFP’s 2011 and 2012 calendar year earnings as defined in the purchase and sale agreement. The fair value of the contingent consideration was estimated to be $13.4 million based on an internal valuation of the earnings level that the acquired company is expected to achieve. The total consideration has been allocated on a preliminary basis to the assets acquired and liabilities assumed, including identifiable intangible assets, based on their respective fair values as of the acquisition date. The fair value of the contingent consideration payment was remeasured as of June 30, 2011 at $16.2 million and is included in “Contingent consideration liability” in the consolidated balance sheet. The change in fair value of $2.8 million is included in “Contingent consideration” in the consolidated statements of operations.
The following table summarizes the preliminary fair values of the assets acquired and the liabilities assumed as of the acquisition date (in thousands):
Current assets, net of cash acquired | $ | 12,733 | ||
Property and equipment | 3,239 | |||
Intangible assets (primarily customer relationships) | 16,800 | |||
Non-tax-deductible goodwill | 29,893 | |||
Current liabilities | (4,654 | ) | ||
|
| |||
Net assets acquired | $ | 58,011 | ||
| ||||
In April 2011, the Company purchased Phoinix Global LLC (“Phoinix”), a provider of high pressure flow control equipment and products utilized in the well stimulation and flow back processes of oil and gas well completion based in Alice, Texas. This acquisition adds to the Company’s completion products capabilities through a product offering that includes fluid-ends for frac pressure pumps, plug valves, relief valves, chokes, manifolds, manifold trailers and flow equipment transport trucks. The results of the Phoinix operations have been included in the Company’s consolidated financial statements beginning May 1, 2011 and will be included in the
Forum Energy Technologies, Inc. and subsidiaries
Notes to consolidated financial statements
December 31, 2008, 2009 and 2010 (continued)
Company’s Production and Infrastructure segment. The Company incurred acquisition related fees and expenses of $0.2 million. Phoinix recorded revenue and earnings of $10.6 million and $1.7 million, respectively, from the time of acquisition through June 30, 2011. The purchase price included: (1) cash of $23.6 million (subject to working capital adjustments), (2) 20,252 shares of common stock of the Company valued at $395 per share based on an internal valuation and (3) two separate contingent consideration payments which may be payable in cash based upon Phoinix’s 2011 and 2012 calendar year earnings as defined in the purchase and sale agreement. The fair value of the contingent consideration was estimated to be $16.3 million based on an internal valuation of the earnings level that the acquired company is expected to achieve. The total consideration has been allocated on a preliminary basis to the assets acquired and liabilities assumed, including identifiable intangible assets, based on their respective fair values as of the acquisition date. The Company is still assessing the economic characteristics of certain customer relationships. The Company expects to substantially complete this assessment during the third quarter of 2011 and may adjust amounts recorded to reflect any revised evaluations. The fair value of the contingent consideration payment was remeasured as of June 30, 2011 at $19.3 million and is included in “Contingent consideration liability” in the consolidated balance sheet. The change in fair value of $3.0 million is included in “Contingent consideration” in the consolidated statements of operations.
The following table summarizes the preliminary fair values of the assets acquired and the liabilities assumed as of the acquisition date (in thousands):
Current assets, net of cash acquired | $ | 11,496 | ||
Property and equipment | 1,350 | |||
Intangible assets (primarily customer relationships) | 17,600 | |||
Non-tax-deductible goodwill | 24,570 | |||
Current liabilities | (7,132 | ) | ||
|
| |||
Net assets acquired | $ | 47,884 | ||
| ||||
In July 2011, the Company acquired Cannon Services (“Cannon”), based in Stafford, Texas, and is a provider of standard and customized clamp and stamped metal protection systems used to shield the downhole control lines and gauges during their installation and provide protection during production enhancement operations. The purchase price included: (1) $48.7 million of cash (subject to working capital adjustments) and (2) 20,944 shares of common stock. The results of Cannon’s operations will be included in the Company’s consolidated financial statements beginning July 1, 2011.
In July 2011, the Company acquired AMC Global Group, Ltd. (“AMC”), based in Aberdeen, Scotland, and designs and manufactures specialized torque equipment for tubular connections, including high torque stroking units, fully rotational torque units and portable torque units for field deployment and related control systems, and provides aftermarket service. The purchase price included: (1) $42.5 million of cash (subject to working capital adjustments) and (2) 16,200 shares of common stock. The results of AMC’s operations will be included in the Company’s consolidated financial statements beginning July 1, 2011.
Forum Energy Technologies, Inc. and subsidiaries
Notes to consolidated financial statements
December 31, 2008, 2009 and 2010 (continued)
In July 2011, the Company acquired P-Quip, Ltd. (“P-Quip”), based in Kilbirnie, Scotland, a manufacturer of proprietary mud pump fluid end assemblies, mud pump rod systems, liner retention systems, valve cover retention systems and other drilling flow control products. The purchase price included $32.4 million of cash (subject to working capital adjustments). The results of P-Quip’s operations will be included in the Company’s consolidated financial statements beginning July 1, 2011.
On July 29, 2011, the Company acquired Davis-Lynch LLC (“Davis-Lynch”), a provider of proprietary, downhole cementing and casing products based in Pearland, Texas. The purchase price included $316.0 million of cash (subject to working capital adjustments). The results of Davis-Lynch’s operations will be included in the Company’s consolidated financial statements beginning August 1, 2011.
Forum Energy Technologies, Inc. and subsidiaries
Consolidated balance sheets
at December 31, 2010 and September 30, 2011
(Unaudited)
| December 31, | September 30, | |||||||
| (in thousands of dollars, except share information) | 2010 | 2011 | ||||||
| ||||||||
Assets | ||||||||
Current assets | ||||||||
Cash and cash equivalents | $ | 20,348 | $ | 36,928 | ||||
Accounts receivable—trade, net | 117,656 | 217,616 | ||||||
Inventories, net | 173,777 | 285,764 | ||||||
Prepaid expenses and other current assets | 18,051 | 12,757 | ||||||
Costs and estimated profits in excess of billings | 3,660 | 25,323 | ||||||
Deferred income taxes, net | 8,615 | 6,563 | ||||||
|
| |||||||
Total current assets | 342,107 | 584,951 | ||||||
Property and equipment, net of accumulated depreciation | 90,632 | 121,679 | ||||||
Deferred financing costs, net | 6,458 | 7,164 | ||||||
Intangibles, net | 80,159 | 239,535 | ||||||
Goodwill | 294,381 | 603,872 | ||||||
Other long-term assets | 4,595 | 6,904 | ||||||
|
| |||||||
Total assets | $ | 818,332 | $ | 1,564,106 | ||||
|
| |||||||
Liabilities and Equity | ||||||||
Current liabilities | ||||||||
Current portion of long-term debt and capital lease obligations | $ | 3,209 | $ | 834 | ||||
Accounts payable—trade | 61,981 | 87,375 | ||||||
Accrued liabilities and other current liabilities | 44,542 | 87,863 | ||||||
Contingent consideration liability | — | 35,700 | ||||||
Deferred revenue | 7,130 | 10,758 | ||||||
Billings in excess of costs and profits recognized | 7,889 | 12,508 | ||||||
Derivative instruments | 2,194 | 313 | ||||||
|
| |||||||
Total current liabilities | 126,945 | 235,351 | ||||||
Long-term debt, net of current portion | 204,715 | 684,295 | ||||||
Deferred income taxes, net | 20,368 | 21,528 | ||||||
Derivative instruments | 2,162 | 2,116 | ||||||
Other long-term liabilities | 1,065 | 511 | ||||||
|
| |||||||
Total liabilities | 355,255 | 943,801 | ||||||
|
| |||||||
Commitments and contingencies | ||||||||
Equity | ||||||||
Common stock, $0.01 par value, 8,000,000 shares authorized, 1,555,514 and 1,784,536 shares issued and outstanding, respectively | 16 | 19 | ||||||
Additional paid-in capital | 342,217 | 422,539 | ||||||
Warrants | 7,825 | 27,097 | ||||||
Retained earnings | 150,803 | 212,416 | ||||||
Treasury stock | (25,823 | ) | (25,877 | ) | ||||
Accumulated other comprehensive loss | (12,515 | ) | (16,544 | ) | ||||
|
| |||||||
Total stockholders’ equity | 462,523 | 619,650 | ||||||
Noncontrolling interest in subsidiary | 554 | 655 | ||||||
|
| |||||||
Total equity | 463,077 | 620,305 | ||||||
|
| |||||||
Total liabilities and equity | $ | 818,332 | $ | 1,564,106 | ||||
| ||||||||
The accompanying notes are an integral part of these consolidated financial statements.period presented.
Forum Energy Technologies, Inc. and subsidiaries
Consolidated statements of income
for the nine months ended September 30, 2010 and 2011
(Unaudited)
| Nine months ended September 30, | ||||||||
| (in thousands of dollars, except share information) | 2010 | 2011 | ||||||
| ||||||||
Net sales | $ | 545,751 | | $ | 791,412 | | ||
Cost of sales | 390,851 | 542,832 | ||||||
|
| |||||||
Gross profit | 154,900 | 248,580 | ||||||
|
| |||||||
Operating expenses | ||||||||
Selling, general and administrative expenses | 100,263 | 129,626 | ||||||
Contingent consideration | — | 6,000 | ||||||
Transaction expenses | — | 3,434 | ||||||
(Gain) loss on sale of assets | (471 | ) | (520 | ) | ||||
|
| |||||||
Total operating expenses | 99,792 | 138,540 | ||||||
|
| |||||||
Income from operations | 55,108 | 110,040 | ||||||
|
| |||||||
Other expense (income) | ||||||||
Expenses related to the Combination | 6,919 | — | ||||||
Deferred loan costs written off | 6,082 | — | ||||||
Interest expense | 15,417 | 13,723 | ||||||
Other, net | (2,189 | ) | 1,261 | |||||
|
| |||||||
Total other expense (income) | 26,229 | 14,984 | ||||||
|
| |||||||
Income before income taxes | 28,879 | 95,056 | ||||||
Income tax expense | 15,685 | 33,176 | ||||||
|
| |||||||
Net income | 13,194 | 61,880 | ||||||
Less: Income attributable to noncontrolling interest | (123 | ) | (267 | ) | ||||
|
| |||||||
Net income attributable to common stockholders | $ | 13,071 | 61,613 | |||||
|
| |||||||
Weighted average shares outstanding | ||||||||
Basic | 1,422 | 1,671 | ||||||
Diluted | 1,424 | 1,769 | ||||||
Earnings per share | ||||||||
Basic | $ | 9.19 | $ | 36.87 | ||||
Diluted | 9.18 | 34.83 | ||||||
| ||||||||
The accompanying notes are an integral part of these consolidated financial statements.
Forum Energy Technologies, Inc. and subsidiaries
Consolidated statement of changes in stockholders’
equity For the nine months ended September 30, 2011
(Unaudited)
(in thousands of dollars, except share information) | Common Stock | Additional paid in | Treasury | Warrants | Retained | Accumulated | Total | Non controlling | Total | |||||||||||||||||||||||||||||||
| Shares | Amount | |||||||||||||||||||||||||||||||||||||||
| ||||||||||||||||||||||||||||||||||||||||
Balance at December 31, 2010 | 1,555,154 | $ | 16 | $ | 342,217 | $ | (25,823 | ) | $ | 7,825 | $ | 150,803 | $ | (12,515 | ) | $ | 462,523 | $ | 554 | $ | 463,077 | |||||||||||||||||||
Stock issuance related to acquisitions | 92,396 | 1 | 38,954 | — | — | — | — | 38,955 | — | 38,955 | ||||||||||||||||||||||||||||||
Stock issuance | 175,853 | 2 | 54,009 | — | — | — | — | 54,011 | — | 54,011 | ||||||||||||||||||||||||||||||
Restricted stock issuance | 1,104 | — | — | — | — | — | — | — | — | — | ||||||||||||||||||||||||||||||
Restricted stock purchase | 4,075 | — | 1,610 | — | — | — | — | 1,610 | — | 1,610 | ||||||||||||||||||||||||||||||
Restricted stock withheld | (105 | ) | — | — | (54 | ) | — | — | — | (54 | ) | — | (54 | ) | ||||||||||||||||||||||||||
Stock based compensation expense | — | — | 3,997 | — | — | — | — | 3,997 | — | 3,997 | ||||||||||||||||||||||||||||||
Exercised stock options | 3,571 | — | 580 | — | — | — | — | 580 | — | 580 | ||||||||||||||||||||||||||||||
Warrant issuance | — | — | (19,278 | ) | — | 19,278 | — | — | — | — | — | |||||||||||||||||||||||||||||
Exercise of warrants | 85 | — | 31 | — | (6 | ) | — | — | 25 | — | 25 | |||||||||||||||||||||||||||||
Excess tax benefits | — | — | 419 | — | — | — | — | 419 | — | 419 | ||||||||||||||||||||||||||||||
Comprehensive income: | ||||||||||||||||||||||||||||||||||||||||
Net income | — | — | — | — | — | 61,613 | — | 61,613 | 267 | 61,880 | ||||||||||||||||||||||||||||||
Change in currency translation adj | — | — | — | — | — | — | (5,253 | ) | (5,253 | ) | (166 | ) | (5,419 | ) | ||||||||||||||||||||||||||
Change related to derivative liabilities, net of tax | — | — | — | — | — | — | 1,224 | 1,224 | — | 1,224 | ||||||||||||||||||||||||||||||
|
|
|
| |||||||||||||||||||||||||||||||||||||
Comprehensive income | — | — | — | — | — | — | — | 57,584 | — | 57,685 | ||||||||||||||||||||||||||||||
|
| |||||||||||||||||||||||||||||||||||||||
Balance at September 30, 2011 | 1,832,133 | $ | 19 | $ | 422,539 | $ | (25,877 | ) | $ | 27,097 | $ | 212,416 | $ | (16,544 | ) | $ | 619,650 | $ | 655 | $ | 620,305 | |||||||||||||||||||
| ||||||||||||||||||||||||||||||||||||||||
The accompanying notes are an integral part of these consolidated financial statements.
Forum Energy Technologies, Inc. and subsidiaries
Consolidated statements of cash flows
For the nine months ended September 30, 2010 and 2011
(Unaudited)
| Nine months ended September 30, | ||||||||
| (in thousands of dollars, except share information) | 2010 | 2011 | ||||||
| ||||||||
Cash flows from operating activities | ||||||||
Net income | $ | 13,071 | 61,613 | |||||
Adjustments to reconcile net income to net cash provided by operating activities | ||||||||
Change in contingent consideration | — | 6,000 | ||||||
Deferred loan costs written off | 6,082 | — | ||||||
Unrealized gain on interest rate swap | 1,424 | (46 | ) | |||||
Share-based compensation expense | 3,781 | 3,997 | ||||||
Depreciation expense | 16,034 | 18,752 | ||||||
Amortization of deferred loan costs | 1,332 | 1,575 | ||||||
Amortization of intangible assets | 8,723 | 9,194 | ||||||
Loss (gain) on disposal of fixed assets | (220 | ) | (262 | ) | ||||
Deferred income taxes | 1,240 | 2,383 | ||||||
Changes in operating assets and liabilities | ||||||||
Accounts receivable—trade | (13,491 | ) | (48,844 | ) | ||||
Inventories | (8,184 | ) | (51,924 | ) | ||||
Prepaid expenses and other current assets | (2,151 | ) | (4,236 | ) | ||||
Cost and estimated profit in excess of billings | (5,977 | ) | (18,919 | ) | ||||
Accounts payable, deferred revenue and other accrued liabilities | 15,502 | 33,427 | ||||||
Billings in excess of costs and estimated profits earned | (9,274 | ) | 4,797 | |||||
|
| |||||||
Net cash provided by operating activities | 27,892 | 18,624 | ||||||
|
| |||||||
Cash flows from investing activities | ||||||||
Capital expenditures for property and equipment | (8,843 | ) | (29,574 | ) | ||||
Proceeds from sale of property and equipment | 609 | 1,006 | ||||||
Capitalized costs related to patents | (707 | ) | (707 | ) | ||||
Acquisition of businesses, net of cash acquired | — | (505,406 | ) | |||||
|
| |||||||
Net cash used in investing activities | (8,941 | ) | (534,681 | ) | ||||
|
| |||||||
Cash flows from financing activities | ||||||||
Deferred financing costs | (6,591 | ) | (2,280 | ) | ||||
Borrowings due to Acquisitions | — | 505,406 | ||||||
Borrowings on long-term debt | 142,009 | — | ||||||
Repayment of long-term debt | (195,646 | ) | (27,768 | ) | ||||
Purchased stock due to the combination | (3,325 | ) | — | |||||
Purchases of stock | (25,068 | ) | (54 | ) | ||||
Excess tax (benefits) expense from stock based compensation | 22 | 418 | ||||||
Proceeds from stock issuance | 62,134 | 56,225 | ||||||
|
| |||||||
Net cash provided by (used in) financing activities | (26,465 | ) | 531,947 | |||||
|
| |||||||
Effect of exchange rate changes on cash | 518 | 690 | ||||||
|
| |||||||
Net increase (decrease) in cash and cash equivalents | (6,996 | ) | 16,580 | |||||
Cash and cash equivalents | ||||||||
Beginning of period | 26,894 | 20,348 | ||||||
|
| |||||||
End of period | $ | 19,898 | 36,928 | |||||
|
| |||||||
Supplemental cash flow disclosures | ||||||||
Interest paid | 17,860 | 11,216 | ||||||
Income taxes paid | 21,015 | 21,115 | ||||||
Noncash investing and financing activities | ||||||||
Acquisition via contingent consideration and stock | $ | — | 68,654 | |||||
| ||||||||
The accompanying notes are an integral part of these consolidated financial statements.
Forum Energy Technologies, Inc. and subsidiaries
Notes to consolidated interim financial statements
(Unaudited)
1. Organization and basis of presentation
The accompanying consolidated financial statements of the Company include the accounts of Forum Energy Technologies, Inc. and its subsidiaries.
All significant intercompany transactions have been eliminated in consolidation. In the opinion of management, all adjustments, consisting of normal recurring adjustments, necessary for the fair presentation have been included.
These interim financial statements are unaudited and have been prepared pursuant to the rules and regulations of the Securities and Exchange Commission (“SEC”) regarding interim financial reporting. Accordingly, they do not include all of the information and notes required by accounting principles generally accepted in the United States of America (“GAAP”) for complete consolidated financial statements and should be read in conjunction with the audited consolidated financial statements for the years ended December 31, 2010 included elsewhere in this prospectus.
2. Recent accounting pronouncements
From time to time, new accounting pronouncements are issued by the Financial Accounting Standards Board which are adopted by the Company as of the specified effective date. Unless otherwise discussed, management believes that the impact of recently issued standards, which are not yet effective, will not have a material impact on the Company’s consolidated financial statements upon adoption.
In June 2011, the Financial Accounting Standards Board (“FASB”) issued an update to ASC 220,Presentation of Comprehensive Income. This Accounting Standards Update (“ASU”) provides that an entity that reports items of other comprehensive income has the option to present comprehensive income in either 1) a single statement that presents the components of net income and total net income, the components of other comprehensive income and total other comprehensive income, and a total for comprehensive income; or 2) a two-statement approach which presents the components of net income and total net income in a first statement, immediately followed by a financial statement that presents the components of other comprehensive income, a total for other comprehensive income, and a total for comprehensive income. The option in current GAAP that permits the presentation of other comprehensive income in the statement of changes in equity was eliminated. The guidance will be applied retrospectively and is effective for the Company for annual periods beginning on January 1, 2012. Early adoption is permitted. The adoption of this guidance will not have a material impact on the Company’s financial statements.
In December 2010, the FASB issued FASB ASU 2010-28, which affects entities evaluating goodwill for impairment under FASB ASC 350-20. ASU 2010-28, among other things, requires entities with a zero or negative carrying value to assess, considering qualitative factors, whether it is more likely than not that goodwill impairment exists. If an entity concludes that it is more likely than not that goodwill impairment exists, the entity must perform step 2 of the goodwill impairment test. ASU 2010-28 is effective for impairment tests performed during an entity’s fiscal year
Forum Energy Technologies, Inc. and subsidiaries
Notes to consolidated interim financial statements (continued)
(Unaudited)
beginning after December 15, 2010, with early adoption not permitted. We do not believe the adoption of this ASU will have a material impact on the Company’s financial position or results of operations.
3. Acquisition
Wood Flowline Products, LLC
In February 2011, the Company purchased Wood Flowline Products, LLC (“WFP”). WFP manufactures pressure control and flow equipment products that are principally used in the fracturing and well stimulation process. WFP also provides on-site recertification and refurbishment services of the associated flow equipment products. This acquisition provides the Company new exposure to the growing well completions sector, specifically focused on the development of North American unconventional shale and tight sands resources. The results of WFP’s operations have been included in the Company’s consolidated financial statements beginning February 1, 2011 and will be included in the Company’s Production and Infrastructure segment. The Company incurred acquisition related fees and expenses of $0.4 million. WFP recorded revenue and earnings of $37.0 million and $7.3 million, respectively, from the time of acquisition through September 30, 2011. The purchase price included: (1) cash of $32.7 million, (2) 35,000 shares of common stock of the Company valued at $340 per share based on an internal valuation and (3) two separate contingent consideration payments which may be payable in cash and/or shares of Company stock based upon WFP’s 2011 and 2012 calendar year earnings as defined in the purchase and sale agreement. The fair value of the contingent consideration was estimated to be $13.4 million based on an internal valuation of the earnings level that the acquired company is expected to achieve. The total consideration has been allocated on a preliminary basis to the assets acquired and liabilities assumed, including identifiable intangible assets, based on their respective fair values as of the acquisition date. The fair value of the contingent consideration payment was remeasured as of September 30, 2011 at $16.2 million and is included in “Contingent consideration liability” in the consolidated balance sheet. The change in fair value of $2.8 million is included in “Contingent consideration” in the consolidated statements of operations.
The following table summarizes the preliminary fair values of the assets acquired and the liabilities assumed as of the acquisition date (in thousands):
Current assets, net of cash acquired | $ | 12,733 | ||
Property and equipment | 3,239 | |||
Intangible assets (primarily customer relationships) | 16,800 | |||
Tax deductible goodwill | 29,893 | |||
Current liabilities | (4,654 | ) | ||
|
| |||
Net assets acquired | $ | 58,011 | ||
| ||||
Phoinix Global LLC
In April 2011, the Company purchased Phoinix Global LLC (“Phoinix”), a provider of high pressure flow control equipment and products utilized in the well stimulation and flow back processes of
Forum Energy Technologies, Inc. and subsidiaries
Notes to consolidated interim financial statements (continued)
(Unaudited)
oil and gas well completion based in Alice, Texas. This acquisition adds to the Company’s completion products capabilities through a product offering that includes fluid-ends for frac pressure pumps, plug valves, relief valves, chokes, manifolds, manifold trailers and flow equipment transport trucks. The results of the Phoinix operations have been included in the Company’s consolidated financial statements beginning May 1, 2011 and will be included in the Company’s Production and Infrastructure segment. The Company incurred acquisition related fees and expenses of $0.3 million. Phoinix recorded revenue and earnings of $33.3 million and $5.7 million, respectively, from the time of acquisition through September 30, 2011. The purchase price included: (1) cash of $23.6 million (subject to working capital adjustments), (2) 20,252 shares of common stock of the Company valued at $395 per share based on an internal valuation and (3) two separate contingent consideration payments which may be payable in cash based upon Phoinix’s 2011 and 2012 calendar year earnings as defined in the purchase and sale agreement. The fair value of the contingent consideration was estimated to be $16.3 million based on an internal valuation of the earnings level that the acquired company is expected to achieve. The total consideration has been allocated on a preliminary basis to the assets acquired and liabilities assumed, including identifiable intangible assets, based on their respective fair values as of the acquisition date. The Company is still assessing the economic characteristics of certain customer relationships. The Company expects to substantially complete this assessment during the third quarter of 2011 and may adjust amounts recorded to reflect any revised evaluations. The fair value of the contingent consideration payment was remeasured as of September 30, 2011 at $19.5 million and is included in “Contingent consideration liability” in the consolidated balance sheet. The change in fair value of $3.2 million is included in “Contingent consideration” in the consolidated statements of operations.
The following table summarizes the preliminary fair values of the assets acquired and the liabilities assumed as of the acquisition date (in thousands):
Current assets, net of cash acquired | $ | 11,686 | ||
Property and equipment | 1,350 | |||
Intangible assets (primarily customer relationships) | 17,200 | |||
Tax-deductible goodwill | 25,002 | |||
Current liabilities | (7,322 | ) | ||
|
| |||
Net assets acquired | $ | 47,916 | ||
| ||||
Cannon Services
In July 2011, the Company acquired Cannon Services (“Cannon”), based in Stafford, Texas. Cannon is a provider of standard and customized clamp and stamped metal protection systems used to shield the downhole control lines and gauges during their installation and provide protection during production enhancement operations. This acquisition, along with the acquisition of Davis-Lynch, formed the new product platform targeting niche downhole products that are consumed during the well construction, completion, intervention and production enhancement processes, as well as those associated with the growth in intelligent well construction. The results of Cannon’s operations have been included in the Company’s
Forum Energy Technologies, Inc. and subsidiaries
Notes to consolidated interim financial statements (continued)
(Unaudited)
consolidated financial statements beginning August 1, 2011 and will be included in the Company’s Drilling and Subsea segment. The Company incurred acquisition related fees and expenses of $0.4 million. Cannon recorded revenues and earnings of $6.9 million and $1.4 million, respectively from the time of acquisition through September 30, 2011. The purchase price included: (1) $48.2 million of cash and (2) 20,944 shares of common stock valued at $513 per share based on an internal valuation.
The following table summarizes the preliminary fair values of the assets acquired and the liabilities assumed as of the acquisition date (in thousands):
Current assets, net of cash acquired | $ | 10,500 | ||
Property and equipment | 4,326 | |||
Intangible assets (primarily customer relationships) | 18,800 | |||
Tax-deductible goodwill | 27,402 | |||
Current liabilities | (2,104 | ) | ||
|
| |||
Net assets acquired | $ | 58,923 | ||
| ||||
AMC Global Group, Ltd.
In July 2011, the Company acquired AMC Global Group, Ltd. (“AMC”), based in Aberdeen, Scotland. AMC designs and manufactures specialized torque equipment for tubular connections, including high torque stroking units, fully rotational torque units and portable torque units for field deployment and related control systems, and provides aftermarket service. This acquisition enhanced the product offerings in our drilling products line. The results of AMC’s operations have been included in the Company’s consolidated financial statements beginning August 1, 2011 and will be included in the Company’s Drilling and Subsea segment. The Company incurred acquisition related fees and expenses of $0.5 million. AMC recorded revenues and earnings of $6.7 million and $1.5 million, respectively from the time of acquisition through September 30, 2011. The purchase price included: (1) $46.5 million of cash and (2) 16,200 shares of common stock valued at $513 per share based on an internal valuation.
The following table summarizes the preliminary fair values of the assets acquired and the liabilities assumed as of the acquisition date (in thousands):
Current assets, net of cash acquired | 15,674 | |||
Property and equipment | 363 | |||
Intangible assets (primarily customer relationships) | 9,871 | |||
Non-tax-deductible goodwill | 35,762 | |||
Current liabilities | (4,323 | ) | ||
Deferred tax liabilities | (2,567 | ) | ||
|
| |||
Net assets acquired | $ | 54,780 | ||
| ||||
Forum Energy Technologies, Inc. and subsidiaries
Notes to consolidated interim financial statements (continued)
(Unaudited)
P-Quip, Ltd.
In July 2011, the Company acquired P-Quip, Ltd. (“P-Quip”), based in Kilbirnie, Scotland. P-Quip manufactures proprietary mud pump fluid end assemblies, mud pump rod systems, liner retention systems, valve cover retention systems and other drilling flow control products. This acquisition enhanced the product offerings in our drilling products line. The results of P-Quip’s operations have been included in the Company’s consolidated financial statements beginning August 1, 2011 and will be included in the Company’s Drilling and Subsea segment. The Company incurred acquisition related fees and expenses of $0.4 million. P-Quip recorded revenues and earnings of $6.3 million and $2.4 million, respectively from the time of acquisition through September 30, 2011. The purchase price included $32.4 million of cash (subject to working capital adjustments).
The following table summarizes the preliminary fair values of the assets acquired and the liabilities assumed as of the acquisition date (in thousands):
Current assets, net of cash acquired | 11,932 | |||
Property and equipment | 114 | |||
Intangible assets (primarily customer relationships) | 7,051 | |||
Non-tax-deductible goodwill | 18,779 | |||
Current liabilities | (3,618 | ) | ||
Deferred tax liabilities | (1,833 | ) | ||
|
| |||
Net assets acquired | $ | 32,425 | ||
| ||||
Davis-Lynch LLC
In July 2011, the Company acquired Davis-Lynch LLC (“Davis-Lynch”), based in Pearland, Texas. Davis-Lynch is a provider of proprietary, downhole cementing and casing products. This acquisition along with the acquisition of Cannon Services, formed the new product platform targeting niche downhole products that are consumed during the well construction, completion, intervention and production enhancement processes, as well as those associated with the growth in intelligent well construction. The results of Davis-Lynch’s operations have been included in the Company’s consolidated financial statements beginning August 1, 2011 and will be included in the Company’s Drilling and Subsea segment. The Company incurred acquisition related fees and expenses of $0.9 million. Davis-Lynch recorded revenues and earnings of $20.9 million and $5.3 million, respectively from the time of acquisition through September 30, 2011. The purchase price included $316.0 million of cash (subject to working capital adjustments).
The following table summarizes the preliminary fair values of the assets acquired and the liabilities assumed as of the acquisition date (in thousands):
Current assets, net of cash acquired | 52,917 | |||
Property and equipment | 9,480 | |||
Intangible assets (primarily customer relationships) | 96,000 | |||
Tax-deductible goodwill | 164,957 | |||
Current liabilities | (7,334 | ) | ||
|
| |||
Net assets acquired | $ | 316,020 | ||
| ||||
Forum Energy Technologies, Inc. and subsidiaries
Notes to consolidated interim financial statements (continued)
(Unaudited)
The following table provides pro forma information related to all acquisitions in the aggregate (in thousands, except per share data):
| Nine months ended September 30, 2010 | Nine months ended September 30, 2011 | |||||||
| ||||||||
Revenue | $ | 691,351 | $ | 909,026 | ||||
Net income | 42,003 | 81,775 | ||||||
Basic earnings per share | 27.74 | 48.78 | ||||||
Diluted earnings per share | 27.71 | 46.21 | ||||||
| ||||||||
The pro forma information for the nine months ended September 30, 2010 and September 30, 2011 assumes the acquisitions listed above occurred as of January 1, 2010.
The combined results of operations of the acquired businesses have been adjusted to reflect additional depreciation of fixed assets and amortization of intangible assets subject to amortization. Pro forma interest expense was calculated on notes payable and draws on the Company’s available line of credit at a rate of 4.7%, as if the businesses were acquired at the beginning of the period.
Although the Company believes the accounting policies and procedures used to prepare the pro forma schedules are reasonable, these pro forma results do not purport to be indicative of the actual results which would have been achieved had the acquisition been consummated on January 1, 2010. The amounts shown are not intended to be a projection of future results.
4. Inventories
The significant components of inventory are as follows:
| December 31, 2010 | September 30 2011 | |||||||
| (in thousands) | ||||||||
| ||||||||
Raw materials and parts | $ | 63,234 | $ | 104,375 | ||||
Work in process | 19,534 | 29,942 | ||||||
Finished goods | 101,115 | 163,779 | ||||||
|
| |||||||
| 183,883 | 298,096 | |||||||
Inventory reserve | (10,106 | ) | (12,332 | ) | ||||
|
| |||||||
Inventories, net | $ | 173,777 | $ | 285,764 | ||||
| ||||||||
Forum Energy Technologies, Inc. and subsidiaries
Notes to consolidated interim financial statements (continued)
(Unaudited)
5. Goodwill and intangible assets
Goodwill
The changes in the amount of goodwill from January 1, 2011 to September 30, 2011, are as follows (in thousands):
Goodwill Balance at January 1, net | $ | 294,381 | ||
Acquisition | 311,550 | |||
Impact of non-United States local currency translation | (2,059 | ) | ||
|
| |||
Goodwill Balance at September 30, net | $ | 603,872 | ||
| ||||
Intangible assets
At December 31, 2010 and September 30, 2011, intangible assets consist of the following, respectively:
| December 31, 2010 | ||||||||||||||||
| Gross carrying amount | Accumulated amortization | Net amortizable intangibles | Amortization period (in years) | |||||||||||||
| (in thousands) | ||||||||||||||||
| ||||||||||||||||
Customer relationships | $ | 70,837 | $ | (26,907 | ) | $ | 43,930 | 4-15 | ||||||||
Patents and technology | 5,764 | (1,626 | ) | 4,138 | 5-17 | |||||||||||
Non-compete agreements | 4,047 | (3,598 | ) | 449 | 3-6 | |||||||||||
Trade names | 15,312 | (3,865 | ) | 11,447 | 10-15 | |||||||||||
Contracts | 260 | (260 | ) | — | <1 | |||||||||||
Distributor relationships | 22,160 | (7,486 | ) | 14,674 | 8-15 | |||||||||||
Trademark | 5,521 | — | 5,521 | Indefinite | ||||||||||||
|
| |||||||||||||||
Intangible Assets Total | $ | 123,901 | $ | (43,742 | ) | $ | 80,159 | |||||||||
| ||||||||||||||||
| September 30, 2011 | ||||||||||||||||
| Gross carrying amount | Accumulated amortization | Net amortizable intangibles | Amortization period (in years) | |||||||||||||
| (in thousands) | ||||||||||||||||
| ||||||||||||||||
Customer relationships | $ | 204,312 | $ | (33,072 | ) | $ | 171,240 | 4-15 | ||||||||
Patents and technology | 8,777 | (2,124 | ) | 6,653 | 5-17 | |||||||||||
Non-compete agreements | 5,222 | (3,942 | ) | 1,280 | 3-6 | |||||||||||
Trade names | 45,985 | (4,870 | ) | 41,115 | 10-15 | |||||||||||
Contracts | 260 | (260 | ) | — | <1 | |||||||||||
Distributor relationships | 22,160 | (8,434 | ) | 13,726 | 8-15 | |||||||||||
Trademark | 5,521 | — | 5,521 | Indefinite | ||||||||||||
|
| |||||||||||||||
Intangible Assets Total | $ | 292,237 | $ | (52,702 | ) | $ | 239,535 | |||||||||
| ||||||||||||||||
Forum Energy Technologies, Inc. and subsidiaries
Notes to consolidated interim financial statements (continued)
(Unaudited)
6. Debt
Notes payable and lines of credit consist of the following:
| December 31, 2010 | September 30, 2011 | |||||||
| (in thousands) | ||||||||
| ||||||||
Senior secured revolving credit facility | $ | 204,000 | $ | 684,000 | ||||
Other debt | 3,924 | 1,129 | ||||||
|
| |||||||
Total debt | 207,924 | 685,129 | ||||||
Less: current maturities | (3,209 | ) | (834 | ) | ||||
|
| |||||||
Long-term debt | $ | 204,715 | $ | 684,295 | ||||
| ||||||||
In conjunction with the Combination, FET entered into a senior secured credit facility with several financial institutions. The credit facility provided for a $450.0 million revolving credit facility, including up to $75.0 million of letters of credit and up to $25.0 million in swingline loans, and matures in August 2014. Effective June 29, 2011, we amended our senior secured credit facility to, among other things, increase the commitment to $750 million. Effective October 4, 2011, the Company amended our senior secured credit facility to, among other things, increase the commitment to $900 million.
Interest is payable every 30, 60 or 90 days based on interest rate elections. Amounts outstanding are collateralized by substantially all of FET’s assets. Weighted average interest rates (without the effect of hedging) at September 30, 2011 and December 31, 2010 were 2.74% and 3.0%, respectively. The credit facility allows management to elect how interest will be computed which may be determined by reference to the London interbank offered rate, or LIBOR, plus an applicable margin between 2.0% and 3.75% per annum or a base rate plus an applicable margin between 0.5% and 2.25% per annum (with the applicable margin depending upon FET’s ratio of total funded debt to EBITDA).
This credit facility contains covenants which require FET to maintain certain financial ratios. These covenants are as follows:
Total funded debt to EBITDA (as defined in the credit facility) of not more than 3.75 to 1.0 for periods ending through December 31, 2011; 3.50 to 1.0 for periods ending from January 1, 2012 through December 31, 2012; 3.25 to 1.0 for periods ending from January 1, 2013 through December 31, 2013 and 3.00 to 1.0 for periods ending thereafter;
EBITDA to interest expense ratio (as defined in the credit facility) of not less than 3.0 to 1.0; and
Total balance sheet debt to total capitalization (as defined in the credit facility) of not more than 0.65 to 1.0.
Availability under the credit facility, considering the covenants discussed above, was approximately $210 million and $60 million at December 31, 2010 and September 30, 2011, respectively. The Company was in compliance with the aforementioned financial covenants at
Forum Energy Technologies, Inc. and subsidiaries
Notes to consolidated interim financial statements (continued)
(Unaudited)
December 31, 2010 and September 30, 2011. Giving effect to the amendment of the senior secured credit facility on October 4, 2011 the Company had $231 million of availability as of September 30, 2011.
Other debt
Other debt consists primarily of upfront annual insurance premiums that have been financed and capital lease obligations.
Debt issue costs
In conjunction with entering into the senior secured facility, the Company incurred approximately $8.9 million in loan costs that have been capitalized and are amortized to interest expense over the term of the facility.
Subsequent to September 30, 2011, the Company incurred $ 3.3 million in loan costs which will be capitalized in connection with the amendment to its senior secured credit facility on October 4, 2011
7. Income taxes
The Company’s effective tax rate for the nine months ended September 30, 2010 and 2011 was 54.3% and 34.9%, respectively. The tax provision for the nine months of 2011 is lower than the comparable period in 2010 primarily due to certain expenses incurred as part of the Combination included in profit before taxes not deductible for tax purposes and due to adjustments for prior year taxes resulting from recently filed tax returns.
8. Derivatives
The Company has an interest rate swap agreement to convert variable interest payments related to $34 million of floating rate debt to fixed interest payments. This swap expires in November 2011 and has a weighted average fixed rate of 4.9% plus the applicable margin. The Company also has an interest rate collar arrangement to reduce the variability in interest payments related to $20 million in floating rate debt. This interest rate collar instrument expires in November 2011 and has a floor interest rate of 4.36%, plus the applicable margin, and a cap interest rate of 5.36%, plus the applicable margin. The Company’s balance sheet at December 31, 2010 and September 30, 2011 included a current derivative liability of $2.2 million and $0.3 million, respectively.
These instruments, which the Company has designated as cash flow hedging instruments, meet the specific hedge criteria provided by the derivatives and hedging accounting guidance and any changes in their fair values are recognized in accumulated other comprehensive income or loss. Since the terms of the hedged item and the instruments substantially coincide, the hedge is expected to offset changes in expected cash flows due to fluctuations in the variable rate and, therefore, the Company currently does not expect any ineffectiveness.
Forum Energy Technologies, Inc. and subsidiaries
Notes to consolidated interim financial statements (continued)
(Unaudited)
The counterparties to the Company’s interest rate swap agreements are major international financial institutions with good credit ratings so nonperformance is not expected from them.
Certain derivative instruments were not designated for hedge accounting at inception. These derivatives are also recorded at fair value, which is measured using the market approach valuation technique. These interest rate swap agreements were entered into to hedge the interest rate risk exposure. At December 31, 2010 and September 30, 2011, the fair value of the swap agreements was recorded as a long-term liability of $2.2 million and $2.1 million, respectively.
Our financial assets and liabilities are measured at fair value on a recurring basis. There were no outstanding financial assets as of December 31, 2010 and September 30, 2011. The following fair value hierarchy table presents information about the Company’s financial liabilities measured at fair value on a recurring basis as of December 31, 2010 and September 30, 2011:
| Quoted prices in active markets for identical assets (Level 1) | Significant other observable inputs (Level 2) | Significant unobservable inputs (Level 3) | Balance as of December 31, 2010 | |||||||||||||
| (in thousands) | ||||||||||||||||
| ||||||||||||||||
Liabilities | ||||||||||||||||
Interest rate derivatives | $ | — | $ | — | $ | 4,356 | $ | 4,356 | ||||||||
|
| |||||||||||||||
Total Liabilities | $ | — | $ | — | $ | 4,356 | $ | 4,356 | ||||||||
| ||||||||||||||||
| ||||||||||||||||
| Quoted prices in active markets for identical assets (Level 1) | Significant other observable inputs (Level 2) | Significant unobservable inputs (Level 3) | Balance as of September 30, 2011 | |||||||||||||
| (in thousands) | ||||||||||||||||
| ||||||||||||||||
Liabilities | ||||||||||||||||
Interest rate derivatives | $ | — | $ | — | $ | 2,429 | $ | 2,429 | ||||||||
|
| |||||||||||||||
Total Liabilities | $ | — | $ | — | $ | 2,429 | $ | 2,429 | ||||||||
| ||||||||||||||||
The following table sets forth a reconciliation of changes for the nine-month period ended September 30, 2011 in the fair value of financial liabilities classified as Level 3 in the fair value hierarchy.
| (in thousands) | ||||
| ||||
Balance at beginning of period | $ | (4,356 | ) | |
Total Gains or (Losses) (Realized or Unrealized): | ||||
Included in Earnings | 45 | |||
Included in Other Comprehensive Income | 1,882 | |||
Purchases, Issuances and Settlements | — | |||
Transfers In and/or Out of Level 3 | — | |||
|
| |||
Balance at end of period | $ | (2,429 | ) | |
| ||||
Forum Energy Technologies, Inc. and subsidiaries
Notes to consolidated interim financial statements (continued)
(Unaudited)
9. Business segments
The Company’s operations are divided into three business segments, Drilling and Subsea (“D&S”), Production and Infrastructure (“P&I”) and Corporate. Summary financial data by segment follows (in thousands):
| Nine months ended September 30, 2010 | ||||||||||||||||||||||||
| D&S | P&I | Corp | Total segments | Gain/(loss) on sale of assets not part of segment income | Total | |||||||||||||||||||
| ||||||||||||||||||||||||
Revenue | $ | 346,382 | $ | 199,369 | $ | — | $ | 545,751 | $ | 545,751 | ||||||||||||||
Operating income | 39,748 | 15,939 | (1,050 | ) | 54,637 | 471 | 55,108 | |||||||||||||||||
Total assets | 657,775 | 166,996 | — | 824,771 | 824,771 | |||||||||||||||||||
| ||||||||||||||||||||||||
| Nine months ended September 30, 2011 | ||||||||||||||||||||||||||||||||
| D&S | P&I | Corp | Total segments | Gain/(loss) on sale of assets not part of segment income | Contingent Consideration not part of segment income | Transaction expenses not part of segment income | Total | |||||||||||||||||||||||||
| ||||||||||||||||||||||||||||||||
Revenue | $ | 465,898 | $ | 325,514 | $ | — | $ | 791,412 | $ | — | $ | — | $ | — | $ | 791,412 | ||||||||||||||||
Operating income | 83,478 | 50,729 | (15,253 | ) | 118,954 | 520 | (6,000 | ) | (3,434 | ) | 110,040 | |||||||||||||||||||||
Total assets | 1,198,501 | 360,652 | 4,953 | 1,564,106 | — | — | — | 1,564,106 | ||||||||||||||||||||||||
| ||||||||||||||||||||||||||||||||
10. Earnings per share
The calculation of basic and diluted earnings per share for each presented was as follows (dollars and shares in thousands, except per share amounts):
| Nine months ended September 30, | ||||||||
| 2010 | 2011 | |||||||
| ||||||||
Net Income attributable to common stockholders | $ | 13,071 | $ | 61,613 | ||||
|
| |||||||
Average shares outstanding (basic) | 1,422 | 1,671 | ||||||
Common stock equivalents | 2 | 98 | ||||||
|
| |||||||
Diluted shares | 1,424 | 1,769 | ||||||
|
| |||||||
Basic earnings per share | $ | 9.19 | $ | 36.87 | ||||
|
| |||||||
Diluted earnings per share | $ | 9.18 | 34.83 | |||||
| ||||||||
Forum Energy Technologies, Inc. and subsidiaries
Notes to consolidated interim financial statements (continued)
(Unaudited)
11. Commitments and contingencies
In the ordinary course of business, the Company is, and in the future, could be involved in various pending or threatened legal actions, some of which may or may not be covered by insurance. Management has reviewed pending judicial and legal proceedings, reasonably anticipated costs and expenses in connection with such proceedings, and availability and limits of insurance coverage, and has established reserves that are believed to be appropriate in light of those outcomes that are believed to be probable and can be estimated. The reserve accrued at December 31, 2010 and September 30, 2011 is insignificant. In the opinion of management, the amount of ultimate liability, if any, with respect to these actions will not have a material adverse effect on the Company’s financial statements.
Portland Harbor Superfund litigation
In May 2009, one of our subsidiaries (which is presently a dormant company with nominal assets except for rights under insurance policies) was named along with many defendants in a suit filed by the Port of Portland, Oregon seeking reimbursement of costs related to a five-year study of contaminated sediments at the port. In March 2010, the subsidiary also received a notice letter from the EPA indicating that it had been identified as a potentially responsible party with respect to environmental contamination in the “study area” for the Portland Harbor Superfund Site. Under a 1997 indemnity agreement, our subsidiary is indemnified by a third party with respect to losses relating to environmental contamination. As required under the indemnity agreement, our subsidiary provided notice of these claims, and the indemnitor has assumed responsibility and is providing a defense of the claims. Although we believe that it is unlikely that our subsidiary contributed to the contamination at the Portland Harbor Superfund Site, the potential liability of our subsidiary and the ability of the indemnitor to fulfill its indemnity obligations cannot be quantified at this time.
12. Related party transactions
Forum Oilfield Technologies, Inc., a subsidiary of the Company, has related party transactions, including sales and leasing activity with certain former owners of acquired companies or certain stockholders. The dollar amounts related to these related party activities are not significant to the Company’s consolidated financial statements. For the Company’s subsidiary, Global Flow Technologies, Inc. (“GFT”), in conjunction with the acquisition of one of its subsidiaries, the Company entered into various operating lease agreements with the former principals for office and warehouse space. For the nine-month periods ended September 30, 2010 and 2011, the Company paid $0.2 million each period in lease payments to these affiliates. GFT also utilizes a certain agent, which is owned by a former owner. The amount paid to this agent for each of the nine-month periods ended September 30, 2010 and 2011 was $0.2 million.
The Company’s subsidiary, Allied Production Services, Inc. (“Allied”) leases two facilities from a stockholder of FET. Allied paid $0.7 million and $0.6 million in lease payments for the nine-month periods ended September 30, 2010 and 2011, respectively. Allied purchased inventory
Forum Energy Technologies, Inc. and subsidiaries
Notes to consolidated interim financial statements (continued)
(Unaudited)
and services from a shareholder totaling $2.9 million and $3.6 million during the nine-month periods ended September 30, 2010 and 2011, respectively. The Company sold less than $10,000 and $1.9 million of equipment and services to a stockholder during the nine-month periods ended September 30, 2010 and 2011, respectively.
13. Subsequent events
Effective October 4, 2011, the Company amended our senior secured credit facility to, among other things, increase the commitment to $900 million. The Company incurred $3.3 million in loan costs in connection with this amendment which will be capitalized.
Financial statements for the year ended December 31, 2010
Index
| Page | ||||
Report of independent registered public accounting firm
To the Owner of
Davis-Lynch, Inc.:
We have audited the accompanying balance sheetssheet of Davis-Lynch, Inc. (the “Company”) as of December 31, 2010 and 2009, and the related statements of operations, of changes in stockholder’s equity and of cash flows for each of the threetwo years in the period ended December 31, 2010. These financial statements are the responsibility of the Company’s management. Our responsibility is to express an opinion on these financial statements based on our audits.
We conducted our audits in accordance with the standards of the Public Company Accounting Oversight Board (United States). Those standards require that we plan and perform the audits to obtain reasonable assurance about whether the financial statements are free of material misstatement. An audit includes examining, on a test basis, evidence supporting the amounts and disclosures in the financial statements. An audit also includes assessing the accounting principles used and the significant estimates made by management, as well as evaluating the overall financial statement presentation. We believe that our audits provide a reasonable basis for our opinion.
In our opinion, the financial statements referred to above present fairly, in all material respects, the financial position of Davis-Lynch, Inc. as of December 31, 2010 and 2009, and the results of its operations and its cash flows for each of the threetwo years in the period ended December 31, 2010, in conformity with accounting principles generally accepted in the United States of America.
/s/ UHY LLP
Houston, Texas
August 26, 2011
Balance sheets
| December 31, | December 31, 2010 | |||||||||||
| 2010 | 2009 |
| ||||||||||
|
| |||||||||||
ASSETS | ||||||||||||
CURRENT ASSETS | ||||||||||||
Cash and cash equivalents | $ | 81,642,230 | $ | 53,518,507 | $ | 81,642,230 | ||||||
Accounts receivable—trade, net | 19,865,005 | 11,029,726 | 19,865,005 | |||||||||
Inventory, net | 25,044,231 | 28,090,506 | 25,044,231 | |||||||||
Prepaid expenses and other assets | 288,959 | 293,853 | 288,959 | |||||||||
|
|
| ||||||||||
TOTAL CURRENT ASSETS | 126,840,425 | 92,932,592 | 126,840,425 | |||||||||
PROPERTY AND EQUIPMENT, net | 1,041,298 | 1,405,369 | 1,041,298 | |||||||||
|
|
| ||||||||||
TOTAL ASSETS | $ | 127,881,723 | $ | 94,337,961 | $ | 127,881,723 | ||||||
|
|
| ||||||||||
LIABILITIES AND STOCKHOLDER’S EQUITY | ||||||||||||
CURRENT LIABILITIES | ||||||||||||
Accounts payable, trade | $ | 4,163,096 | $ | 4,507,103 | $ | 4,163,096 | ||||||
Accrued expenses and other liabilities | 3,236,188 | 1,084,121 | 3,236,188 | |||||||||
|
|
| ||||||||||
TOTAL CURRENT LIABILITIES | 7,399,284 | 5,591,224 | 7,399,284 | |||||||||
|
|
| ||||||||||
TOTAL LIABILITIES | 7,399,284 | 5,591,224 | 7,399,284 | |||||||||
COMMITMENTS AND CONTINGENCIES (NOTE E AND H) | ||||||||||||
STOCKHOLDER’S EQUITY | ||||||||||||
Common stock; $1 par value; 240,000 shares authorized, issued and outstanding | 240,000 | 240,000 | 240,000 | |||||||||
Retained earnings | 120,242,439 | 88,506,737 | 120,242,439 | |||||||||
|
|
| ||||||||||
TOTAL STOCKHOLDER’S EQUITY | 120,482,439 | 88,746,737 | 120,482,439 | |||||||||
|
|
| ||||||||||
TOTAL LIABILITIES AND STOCKHOLDER’S EQUITY | $ | 127,881,723 | $ | 94,337,961 | $ | 127,881,723 | ||||||
|
|
| ||||||||||
See accompanying notes to financial statements.
Statements of operations
| Year ended December 31, | Year ended December 31, | |||||||||||||||||||
| 2010 | 2009 | 2008 | 2010 | 2009 | ||||||||||||||||
|
|
| ||||||||||||||||||
NET SALES | $ | 89,151,747 | $ | 60,043,232 | $ | 110,085,510 | $ | 89,151,747 | $ | 60,043,232 | ||||||||||
COST OF SALES | 37,381,245 | 18,024,713 | 40,040,640 | 37,381,245 | 18,024,713 | |||||||||||||||
|
|
|
| |||||||||||||||||
GROSS PROFIT | 51,770,502 | 42,018,519 | 70,044,870 | 51,770,502 | 42,018,519 | |||||||||||||||
SELLING, GENERAL AND ADMINISTRATIVE EXPENSES | 13,943,185 | 12,637,033 | 17,103,185 | 13,943,185 | 12,637,033 | |||||||||||||||
|
|
|
| |||||||||||||||||
OPERATING INCOME | 37,827,317 | 29,381,486 | 52,941,685 | 37,827,317 | 29,381,486 | |||||||||||||||
OTHER INCOME (EXPENSE) | ||||||||||||||||||||
Interest income | 329,852 | 278,337 | 1,034,670 | 329,852 | 278,337 | |||||||||||||||
Interest expense | — | (1,000,000 | ) | (1,000,000 | ) | — | (1,000,000 | ) | ||||||||||||
Loss from unauthorized employee activities | — | (2,284,580 | ) | (4,114,016 | ) | — | (2,284,580 | ) | ||||||||||||
Other, net | 148,370 | (6,212 | ) | 87,039 | 148,370 | (6,212 | ) | |||||||||||||
|
|
|
| |||||||||||||||||
TOTAL OTHER INCOME (EXPENSE) | 478,222 | (3,012,455 | ) | (3,992,307 | ) | 478,222 | (3,012,455 | ) | ||||||||||||
|
|
|
| |||||||||||||||||
NET INCOME BEFORE INCOME TAX EXPENSE | 38,305,539 | 26,369,031 | 48,949,378 | 38,305,539 | 26,369,031 | |||||||||||||||
STATE INCOME TAX EXPENSE | 1,569,837 | 157,412 | 410,051 | 1,569,837 | 157,412 | |||||||||||||||
|
|
|
| |||||||||||||||||
NET INCOME | $ | 36,735,702 | $ | 26,211,619 | $ | 48,539,327 | $ | 36,735,702 | $ | 26,211,619 | ||||||||||
|
|
| ||||||||||||||||||
See accompanying notes to financial statements.
Statements of changes in stockholder’s equity
For the years ended December 31, 2010 2009 and 20082009
| Common stock | Retained earnings | Total stockholder’s equity | Common stock | Retained earnings | Total stockholder’s equity | |||||||||||||||||||
|
|
| ||||||||||||||||||||||
Balance, January 1, 2008 | $ | 240,000 | $ | 55,087,867 | $ | 55,327,867 | ||||||||||||||||||
Dividends | — | (31,332,076 | ) | (31,332,076 | ) | |||||||||||||||||||
Net income | — | 48,539,327 | 48,539,327 | |||||||||||||||||||||
|
| |||||||||||||||||||||||
Balance, December 31, 2008 | 240,000 | 72,295,118 | 72,535,118 | |||||||||||||||||||||
Balance, January 1, 2009 | 240,000 | 72,295,118 | 72,535,118 | |||||||||||||||||||||
Dividends | — | (10,000,000 | ) | (10,000,000 | ) | — | (10,000,000 | ) | (10,000,000 | ) | ||||||||||||||
Net income | — | 26,211,619 | 26,211,619 | — | 26,211,619 | 26,211,619 | ||||||||||||||||||
|
|
|
| |||||||||||||||||||||
Balance, December 31, 2009 | 240,000 | 88,506,737 | 88,746,737 | 240,000 | 88,506,737 | 88,746,737 | ||||||||||||||||||
Dividends | — | (5,000,000 | ) | (5,000,000 | ) | — | (5,000,000 | ) | (5,000,000 | ) | ||||||||||||||
Net income | — | 36,735,702 | 36,735,702 | — | 36,735,702 | 36,735,702 | ||||||||||||||||||
|
|
|
| |||||||||||||||||||||
Balance, December 31, 2010 | $ | 240,000 | $ | 120,242,439 | $ | 120,482,439 | $ | 240,000 | $ | 120,242,439 | $ | 120,482,439 | ||||||||||||
|
|
| ||||||||||||||||||||||
See accompanying notes to financial statements.
Statements of cash flows
| Year ended December 31, | ||||||||||||||||||||
| Year ended December 31, | 2010 | 2009 | ||||||||||||||||||
| 2010 | 2009 | 2008 |
| |||||||||||||||||
|
| |||||||||||||||||||
CASH FLOWS FROM OPERATING ACTIVITIES | ||||||||||||||||||||
Net income | $ | 36,735,702 | $ | 26,211,619 | $ | 48,539,327 | $ | 36,735,702 | $ | 26,211,619 | ||||||||||
Adjustment to reconcile net income to net cash provided by operating activities: | ||||||||||||||||||||
Depreciation and amortization | 495,627 | 600,023 | 1,322,169 | 495,627 | 600,023 | |||||||||||||||
Provision for bad debts | — | 88,515 | 408,610 | — | 88,515 | |||||||||||||||
Provision for inventory obsolescence | 1,230,458 | 4,400,000 | — | 1,230,458 | 4,400,000 | |||||||||||||||
Gain on sale of property and equipment | (26,182 | ) | (9,609 | ) | (50,289 | ) | (26,182 | ) | (9,609 | ) | ||||||||||
Changes in operating assets and liabilities: | ||||||||||||||||||||
Accounts receivable, trade | (8,835,279 | ) | 11,654,639 | (4,514,615 | ) | (8,835,279 | ) | 11,654,639 | ||||||||||||
Inventories | 1,815,817 | (9,378,607 | ) | (11,437,721 | ) | 1,815,817 | (9,378,607 | ) | ||||||||||||
Prepaid expenses and other assets | 4,894 | 91,217 | (4,892 | ) | 4,894 | 91,217 | ||||||||||||||
Accounts payable, trade | (344,007 | ) | (5,705,293 | ) | (3,070,992 | ) | (344,007 | ) | (5,705,293 | ) | ||||||||||
Accrued expenses and other liabilities | 2,152,067 | (702,751 | ) | 263,488 | 2,152,067 | (702,751 | ) | |||||||||||||
Accrued interest | — | (1,000,000 | ) | 1,000,000 | — | (1,000,000 | ) | |||||||||||||
|
|
|
| |||||||||||||||||
NET CASH PROVIDED BY OPERATING ACTIVITIES | 33,229,097 | 26,249,753 | 32,455,085 | 33,229,097 | 26,249,753 | |||||||||||||||
CASH FLOWS FROM INVESTING ACTIVITIES | ||||||||||||||||||||
Proceeds from sale of property and equipment | 49,000 | 16,145 | 66,967 | 49,000 | 16,145 | |||||||||||||||
Purchases of property and equipment | (154,374 | ) | (104,822 | ) | (811,728 | ) | (154,374 | ) | (104,822 | ) | ||||||||||
|
|
|
| |||||||||||||||||
NET CASH USED IN INVESTING ACTIVITIES | (105,374 | ) | (88,677 | ) | (744,761 | ) | (105,374 | ) | (88,677 | ) | ||||||||||
CASH FLOWS FROM FINANCING ACTIVITIES | ||||||||||||||||||||
Proceeds from notes payable, stockholder | — | 10,000,000 | 10,000,000 | — | 10,000,000 | |||||||||||||||
Payment of notes payable, stockholder | — | (20,000,000 | ) | — | — | (20,000,000 | ) | |||||||||||||
Payment of dividends | (5,000,000 | ) | (10,000,000 | ) | (31,332,076 | ) | (5,000,000 | ) | (10,000,000 | ) | ||||||||||
|
|
|
| |||||||||||||||||
NET CASH USED IN FINANCING ACTIVITIES | (5,000,000 | ) | (20,000,000 | ) | (21,332,076 | ) | (5,000,000 | ) | (20,000,000 | ) | ||||||||||
|
|
|
| |||||||||||||||||
NET INCREASE IN CASH AND CASH EQUIVALENTS | 28,123,723 | 6,161,076 | 10,378,248 | 28,123,723 | 6,161,076 | |||||||||||||||
CASH AND CASH EQUIVALENTS, beginning of year | 53,518,507 | 47,357,431 | 36,979,183 | 53,518,507 | 47,357,431 | |||||||||||||||
|
|
|
| |||||||||||||||||
CASH AND CASH EQUIVALENTS, end of year | $ | 81,642,230 | $ | 53,518,507 | $ | 47,357,431 | $ | 81,642,230 | $ | 53,518,507 | ||||||||||
|
|
|
| |||||||||||||||||
SUPPLEMENTAL DISCLOSURES: | ||||||||||||||||||||
Interest paid | $ | — | $ | 2,000,000 | $ | — | $ | — | $ | 2,000,000 | ||||||||||
|
|
|
| |||||||||||||||||
State taxes paid | $ | 267,499 | $ | 165,000 | $ | 245,051 | $ | 267,499 | $ | 165,000 | ||||||||||
|
|
|
| |||||||||||||||||
NON-CASH ACTIVITIES: | ||||||||||||||||||||
Write off of fully depreciated property and equipment | $ | — | $ | 660,588 | $ | 1,095,047 | $ | — | $ | 660,588 | ||||||||||
|
|
| ||||||||||||||||||
See accompanying notes to financial statements.
Notes to financial statements
Note A—Organization and nature of business
Davis-Lynch, Inc. (the “Company”) is a Subchapter S Corporation formed in 1947 that is privately and wholly owned by Carl A. Davis, President. The Company’s line of business includes designing, manufacturing, and marketing cementing equipment with operations solely in the United States. The Company operates in one segment. It sells its products primarily in the United States and through distributors in certain foreign geographic areas such as the Middle East, Africa, and South America. Originally a manufacturer of float equipment, the Company has expanded its product line to include a full line of centralizers and primary cementing aids, multi-purpose float collars, stage cementing tools, inner-string cementing tools, inflatable packers, flotation collars, cementing plugs, fill and circulate tools for running casing, casing hangers and drive pipe landing rings, as well as surge reduction equipment. The Company’s headquarters are located in Pearland, Texas. The financial statements of the Company have been prepared on the accrual basis of accounting in accordance with generally accepted accounting principles in the United States of America.
Note B—Summary of significant accounting policies
Cash and cash equivalents: For purposes of the statements of cash flows, cash and cash equivalents consists of cash in banks, money market funds, and certificates of deposit with original maturities of three months or less.
The Company reclassified overdrafts of approximately $1.1 million and $3.3 million from cash and cash equivalents to accounts payable at December 31, 2009 and 2008, respectively.2009. There were no cash overdrafts at December 31, 2010.
Allowance for doubtful accounts: Earnings are charged with a provision for doubtful accounts based upon a current review of the collectability of accounts from customers. Accounts deemed uncollectible are applied against the allowance for doubtful accounts. Accounts receivable, trade was net of an allowance for doubtful accounts of $1,055,817 at December 31, 2010 and 2009, respectively. Bad debt expense totaled $0 $88,515 and $408,610$88,515 for the years ended December 31, 2010 2009 and 2008,2009, respectively.
Davis-Lynch, Inc.
Notes to financial statements (continued)
Inventory: Inventories are stated at the lower of cost or market value using an average standard cost. Cost is determined using standard cost, which approximates average cost, and includes the application of related direct labor and overhead. The Company periodically evaluates the components comprising its inventories and reviews for items that have not been utilized over a certain period of time based on current products in production, physical condition, and future applicability to be utilized in production to determine its obsolescence reserve. Inventory obsolescence expense totaled $1,230,458 $4,400,000 and $0$4,400,000 for the years ended December 31, 2010 2009 and 2008,2009, respectively. Inventories consist of the following:
| December 31, | ||||||||
| 2010 | 2009 | |||||||
| ||||||||
Raw material | $ | 8,502,006 | $ | 14,915,896 | ||||
Work-in-process | 9,317,852 | 2,951,182 | ||||||
Finished goods | 12,854,831 | 14,623,428 | ||||||
|
|
|
| |||||
| 30,674,689 | 32,490,506 | |||||||
Less: obsolescence reserve | (5,630,458 | ) | (4,400,000 | ) | ||||
|
|
|
| |||||
Inventory, net | $ | 25,044,231 | $ | 28,090,506 | ||||
| ||||||||
Property and equipment: Property and equipment are stated at cost. Depreciation is computed over the estimated useful lives of the related assets using the straight-line method. Maintenance and repairs are charged to expense as incurred and significant renewals and betterments are capitalized. The cost and related accumulated depreciation of assets retired or otherwise disposed of are eliminated from the accounts, and any resulting gains or losses are recognized in operations in the year of disposal.
Property and equipment, net and related accumulated depreciation consist of the following:
| Estimated useful life | December 31, | |||||||||||
| 2010 | 2009 | |||||||||||
| ||||||||||||
Autos | 3-20 years | $ | 440,544 | $ | 452,121 | |||||||
Forklifts | 3-10 years | 321,033 | 321,033 | |||||||||
Machinery and equipment | 7-30 years | 7,703,908 | 7,908,692 | |||||||||
Leasehold improvements | 2,314,447 | 2,314,447 | ||||||||||
|
| |||||||||||
| 10,779,932 | 10,996,293 | |||||||||||
Less: accumulated depreciation and amortization | (9,738,634 | ) | (9,590,924 | ) | ||||||||
|
| |||||||||||
Property and equipment, net | $ | 1,041,298 | $ | 1,405,369 | ||||||||
| ||||||||||||
For the years ended December 31, 2010 2009 and 2008,2009, depreciation expense related to property and equipment totaled $495,627 $600,023 and $1,322,169,$600,023, respectively. For the years ended December 31, 2010 and 2009, $452,902 and 2008, $452,902, $536,560, and $1,199,252, respectively, of depreciation expense is included in “cost of sales” and $42,725 $63,463 and $122,917,$63,463, respectively, is included in “selling, general and administrative expenses” in the accompanying statements of operations. Repairs and maintenance expense totaled $521,435 $209,339 and $885,571$209,339 for the years ended December 31, 2010 and 2009, and 2008, respectively.
Davis-Lynch, Inc.
Notes to financial statements (continued)
Impairment of long-lived assets: The Company reviews the recoverability of its long-lived assets, such as plant, property and equipment, when events or changes in circumstances occur that indicate the carrying value of the asset or asset group may not be recoverable and the expected future pre-tax cash flows (undiscounted) to be generated by those assets are less than the
carrying value of the assets. In such case, the impairment loss would be equal to the amount by which the carrying value exceeds estimated fair market value of the related assets. Long-lived assets are reviewed for impairment at the individual asset or the asset group level for which the lowest level of independent cash flows can be identified. The Company determined that no impairment had occurred during the year ended December 31, 2010 2009 or 2008.and 2009.
Income taxes: As the Company is a Subchapter S Corporation, there is no provision for federal income taxes reflected in the financial statements as the Company is not subject to federal income taxes. Earnings are included in the owner’s personal income tax return.
Effective January 1, 2009, the Company adopted guidance in Accounting Standards Codification (“ASC”) Topic 740 (ASC 740),Income Taxes, for the accounting for the uncertainty in income taxes. The guidance clarifies the accounting for income taxes by prescribing the minimum recognition threshold an income tax position is required to meet before being recognized in the financial statements and applies to all income tax positions. Each income tax position is assessed using a two step process. A determination is made as to whether it is more likely than not that the income tax position will be sustained, based upon technical merits, upon examination by the taxing authorities. If the income tax position is expected to meet the more likely than not criteria, the benefit recorded in the financial statements equals the largest amount that is greater than 50% likely to be realized upon its ultimate settlement.
The adoption of this guidance did not impact the Company’s financial position, results of operations, or cash flows as the income tax positions taken by the Company for any years open under the various statute of limitations is that the Company continues to be exempt from federal income taxes by virtue of its pass through status and that federal income tax is attributable to its owner. Management believes that this tax position meets the more likely than not threshold and accordingly, the tax benefit of this income tax position (no federal income tax expense or liability) has been recognized for the years ended on or before December 31, 2010.
The Company records income tax related interest and penalties as a component of the provision for income taxes. For the year ended December 31, 2010, the Company recorded approximately $177,000 of interest and $53,000 in penalties related to state income taxes. For the yearsyear ended December 31, 2009, and 2008, the Company did not record any income tax related interest or penalties. The Company believes there is no tax positions taken or expected to be taken that would significantly increase or decrease unrecognized tax benefits within twelve months of the reporting date.
During 2010, the Company underwent a tax audit by the State of Louisiana (the “State”). As a result of this audit, it was determined the Company owed additional taxes totaling $1,249,246, inclusive of interest and penalties, to the State. This amount was reflected in the December 31, 2010 financial statements and was subsequently paid in January 2011. No other state tax returns are currently under examination by state authorities. However, fiscal years 2007 and later remain subject to examination by the respective states in which the Company does business.
Davis-Lynch, Inc.
Notes to financial statements (continued)
In May 2006, the State of Texas enacted a bill that replaced the existing state franchise tax with a margin tax. Effective January 1, 2007, the margin tax applies to legal entities conducting business in Texas, including previously non-taxable entities such as limited partnerships and limited liability partnerships. The margin tax is based on Texas sourced taxable margin. The tax is calculated by applying a tax rate to a base rate that considers both revenues and expenses and therefore has the characteristics of an income tax. As a result, the Company recorded $146,825 $134,389 and $154,705$134,389 in estimated state income taxes for the years ended December 31, 2010 2009 and 2008, 2009,
respectively, that is solely attributable to the Texas margin tax and is included in “state income tax expense” in the accompanying statements of operations. The Company also recorded $1,423,012 $23,023 and $255,346$23,023 in state income taxes for the years ended December 31, 2010 2009 and 2008,2009, respectively, attributable to various other states in which the Company conducts business.
Concentrations of credit risk: Financial instruments that potentially subject the Company to credit risk are cash and cash equivalents and trade accounts receivable. The Company maintains cash balances in high credit quality financial institutions which at times may exceed federally insured limits. The Company monitors the financial condition of these institutions and has experienced no losses associated with these accounts. The Company extends credit to customers throughout the United States of America and certain foreign countries. The Company’s allowance for doubtful accounts is based upon a current review of collectability for each customer taking into consideration current market conditions and other factors.
The Company’s primary customers are in the energy industry. As such, the Company could be affected by events that affect this industry such as natural disasters, political unrest, terrorism, oil prices and domestic policies regarding energy related industries.
In October 2008, the Federal Deposit Insurance Corporation increased its insurance to $250,000 per depositor, and to an unlimited amount for non-interest bearing accounts. The coverage increase, which is temporary, extends through December 31, 2013.
Revenue recognition: Revenue is recognized when products are shipped or services are performed.
Shipping and handling fees and costs: Shipping and handling fees, if billed to customers, are included in net sales. Shipping and handling costs are classified as cost of sales.
Reclassifications: Certain reclassifications of 2009 amounts were made to conform to the current period presentation. Such reclassifications had no impact on 2009 reported net income or stockholder’s equity.
Use of estimates: The preparation of financial statements in conformity with accounting principles generally accepted in the United States of America requires management to make estimates and assumptions that affect the reported amounts of assets and liabilities and disclosure of contingent assets and liabilities at the date of the financial statements and the reported amounts of revenues and expenses during the reporting period. On an ongoing basis, the Company evaluates its estimates and assumptions, including those related to its allowance for doubtful accounts, inventory obsolescence, impairment for property and equipment and contingencies. Actual results could differ from these estimates.
Davis-Lynch, Inc.
Notes to financial statements (continued)
Environmental remediation: The Company accounts for environmental remediation in accordance with ASC Topic 410,Asset Retirement and Environmental Obligations. In accordance with this guidance, liabilities are recorded when environmental assessments indicate that remediation efforts are probable and the costs can be reasonably estimated. Estimates of the liability are based upon currently available facts, existing technology and presently enacted laws and regulations, taking into consideration the likely effects of inflation and other societal and economic factors, and include estimates of associated legal costs.
Fair value of financial instruments: Financial instruments of the Company consist primarily of cash and cash equivalents, accounts receivable and accounts payable. The Company’s management considers the carrying values of cash and cash equivalents, accounts receivable and accounts payable to be representative of their respective fair values because of their short-term nature.
Recent accounting standards: In June 2011, the Financial Accounting Standards Board (“FASB”) issued an update to ASC 220,Presentation of Comprehensive Income. This Accounting Standards Update (“ASU”) provides that an entity that reports items of other comprehensive income has the option to present comprehensive income in either 1) a single statement that presents the components of net income and total net income, the components of other comprehensive income and total other comprehensive income, and a total for comprehensive income; or 2) a two-statement approach which presents the components of net income and total net income in a first statement, immediately followed by a financial statement that presents the components of other comprehensive income, a total for other comprehensive income, and a total for comprehensive income. The option in current GAAP that permits the presentation of other comprehensive income in the statement of changes in equity was eliminated. The guidance will be applied retrospectively and is effective for the Company for annual periods beginning on January 1, 2012. Early adoption is permitted. The adoption of this guidance will not have a material impact on the Company’s financial statements.
In May 2011, the FASB issued an update to ASC 820,Fair Value Measurements. This ASU clarifies the application of certain fair value measurement requirements and requires, among other things, expanded disclosures for Level 3 fair value measurements and the categorization by level for items for which fair value is required to be disclosed in accordance with ASC 825,Financial Instruments. The guidance will be applied prospectively and is effective for the Company for annual periods beginning on January 1, 2012. Early adoption is not permitted. The adoption of this standard will not have an impact on the Company’s financial statements.
In October 2009, the FASB issued an update to ASC 605,Revenue Recognition. This ASU allows companies to allocate consideration for qualified separate deliverables using the estimated selling price for both delivered and undelivered items when vendor-specific objective evidence or third-party evidence is unavailable. It also requires additional disclosures on the nature of multiple element arrangements, the types of deliverables under the arrangements, the general timing of their delivery, and significant factors and estimates used to determine estimated selling prices. The Company adopted this new guidance on January 1, 2011. Accordingly, the Company applies this guidance to transactions initiated or materially modified on or after January 1, 2011. The Company’s adoption of this new guidance did not have an impact on its financial position, results of operations, cash flows or existing revenue recognition policies.
Davis-Lynch, Inc.
Notes to financial statements (continued)
In December 2010, the FASB issued an update to ASC 805,Business Combinations. This ASU addressed the disclosure of comparative financial statements and expanded on the supplementary pro forma information for business combinations. The Company adopted this ASU prospectively for business combinations occurring on or after December 15, 2010.
Note C—Accrued expenses and other liabilities
Accrued expenses consisted of the following:
| December 31, | ||||||||
| 2010 | 2009 | |||||||
| ||||||||
Sales tax payable | $ | 131,164 | $ | 119,881 | ||||
Customer credits | 74,270 | 195,729 | ||||||
Accrued commissions | 2,098,912 | 297,297 | ||||||
Accrued royalties | 527,842 | 306,259 | ||||||
Accrued state taxes | 404,000 | 157,412 | ||||||
Payroll taxes payable | — | 7,543 | ||||||
|
| |||||||
| $ | 3,236,188 | $ | 1,084,121 | |||||
| ||||||||
Note D—Income taxes
The provision for income taxes consists of the following:
| December 31, | December 31, | |||||||||||||||||||
| 2010 | 2009 | 2008 | 2010 | 2009 | ||||||||||||||||
|
|
| ||||||||||||||||||
Texas margin tax | $ | 146,825 | $ | 134,389 | $ | 154,705 | $ | 146,825 | $ | 134,389 | ||||||||||
Louisiana income tax inclusive of interest and penalties | 1,373,012 | — | — | 1,373,012 | — | |||||||||||||||
Other state income taxes | 50,000 | 23,023 | 255,346 | 50,000 | 23,023 | |||||||||||||||
|
|
|
|
| ||||||||||||||||
Total | $ | 1,569,837 | $ | 157,412 | $ | 410,051 | $ | 1,569,837 | $ | 157,412 | ||||||||||
|
|
| ||||||||||||||||||
Note E—Commitments and contingencies
In 2009, an embezzlement scheme totaling approximately $15 million was discovered by the Company, whereby former employees had submitted fraudulent invoices for payments for over a decade. The fraud came to light during a two-month examination of the Company’s accounting records. The Company hired a third-party independent consultant to investigate this matter and to conduct the examination. The consultant reported their findings to management of the Company, which has begun legal action against the defendants in Federal District Court. Approximately $2.3 million and $4.1 million of unauthorized invoices were recorded and paid in 2009 and 2008, respectively, related to this matter which is included as loss from unauthorized employee activities in the statement of operations. All other amounts pertaining to this matter related to years prior to 2008.2009. In 2010, the Company was awarded summary judgment, no amounts have been received, and no receivable has been recorded by the Company at December 31, 2010 2009 or 2008.2009. The Company intends to vigorously pursue this matter.
Davis-Lynch, Inc.
Notes to financial statements (continued)
In January 2010, a favorable settlement was reached in a patent infringement lawsuit whereby the Company was the plaintiff. Terms of the settlement were not disclosed, but the defendant will pay a 10% royalty on future sales of the products included in the lawsuit. The Company recognized royalty income of $608,062 related to this settlement for the year ended December 31, 2010.
The Company is involved in various disputes arising in the ordinary course of business. Management does not believe the outcome of these disputes will have a material adverse effect on the Company’s financial position, results of operations or cash flows.
The Company leases certain equipment and office and manufacturing space under non-cancelable operating leases which expired at various dates through 2010 and now are month to month in nature. Total rental expense for the years ended December 31, 2010 2009 and 20082009 was approximately $235,000 $189,000 and $254,000,$189,000, respectively.
The Company has various standby letters of credit with a financial institution up to a total commitment limit of $3,000,000 of which approximately $2,503,000 was utilized at December 31, 2010. The letters of credit expire through November 2011, and support certain international operations.
Note F—Related party transactions
On January 1, 2008, the Company entered into a note payable with the owner of the Company for $10,000,000, bearing interest at 10% per annum. The Company repaid the outstanding note payable plus all accrued and unpaid interest on January 2, 2009. Concurrent with the repayment on January 2, 2009, the Company entered into a new note payable agreement with the owner of the Company for $10,000,000, bearing interest at 10% per annum. The Company repaid the outstanding note payable plus all accrued and unpaid interest on December 31, 2009. Interest expense incurred on the note payable was $1,000,000 for the year ended December 31, 2009. No interest expense was incurred for the year ended December 31, 2010 as no note payable with the owner was outstanding subsequent to December 31, 2009.
The Company leases land from a related party. Total rent expense for the years ended December 31, 2010 2009 and 20082009 was approximately $120,000 in each year, respectively. During 2010 2009 and 2008,2009, the Company purchased supplies and materials from a related party which totaled approximately $351,000 $150,000 and $258,000,$150,000, respectively.
The Company utilizes a staffing company that is a related party. Total expense for the year ended December 31, 2010 to this company was approximately $2,748,000. There was no expense to this party for the yearsyear ended December 31, 2009 and 2008.2009.
Note G—Significant customers
During the yearsyear ended December 31, 2010, and 2008, no customer had net sales of more than 10% of total net sales. During the year ended December 31, 2009, the Company had net sales from one customer totaling approximately 10% of total net sales, or $6,162,900. At December 31, 2009, accounts receivable from the customer was $594,724.
Davis-Lynch, Inc.
Notes to financial statements (continued)
Note H—Environmental remediation
In 2008, a toxic liquid substance was discovered in the water system at the Company’s manufacturing facility in Pearland, Texas. In 2008, a third party was contracted to perform an assessment and to perform remediation work. The total estimated cost for the remediation, which was completed and paid in 2009, totaling approximately $750,000 was recorded as an expense in 2008 in accordance with ASC Topic 410,Asset Retirement and Environmental Obligations. Quarterly water samples are now being taken in order to satisfy State regulatory authorities that the matter has been resolved.
Note I—Risk and uncertainties
The current downturn in the United States economy, the moratorium on drilling in the Gulf of Mexico, and any economic slowdown in future periods, could adversely affect the Company in ways that cannot be predicted. During times of economic slowdown, the Company’s customers may reduce their capital expenditures and defer or cancel pending orders. Such developments occur even among customers that are not experiencing financial difficulties. These deferrals or cancelling of capital expenditures could directly impact the demand for the Company’s products and services. Additionally, bankruptcies or financial difficulties among the Company’s customers could reduce its cash flows and adversely impact liquidity and profitability.
Note J—I—Subsequent events
The Company has evaluated all events subsequent from the balance sheet date of December 31, 2010 through August 26, 2011, and noted no subsequent events that would require recognition or disclosure in the financial statements, other than those items disclosed herein and below.
On June 23, 2011, the Company converted from a Subchapter S Corporation to a Limited Liability Company.
On June 25, 2011, Forum Energy Technologies, Inc. entered into an agreement to purchase the Company for cash, as outlined under the terms in the purchase and sale agreement, subject to certain working capital adjustments. The transaction closed on July 29, 2011.
Financial statements for the six months ended June 30, 2011
Index
| Page | ||||
Balance sheets
| June 30, 2011 | December 31, 2010 | |||||||
| (Unaudited) | ||||||||
| ||||||||
ASSETS | ||||||||
CURRENT ASSETS | ||||||||
Cash and cash equivalents | $ | 71,903,646 | $ | 81,642,230 | ||||
Accounts receivable—trade, net | 21,552,415 | 19,865,005 | ||||||
Inventory, net | 31,594,469 | 25,044,231 | ||||||
Prepaid expenses and other assets | 41,280 | 288,959 | ||||||
|
| |||||||
TOTAL CURRENT ASSETS | 125,091,810 | 126,840,425 | ||||||
PROPERTY AND EQUIPMENT, net | 887,979 | 1,041,298 | ||||||
|
| |||||||
TOTAL ASSETS | $ | 125,979,789 | $ | 127,881,723 | ||||
|
| |||||||
LIABILITIES AND STOCKHOLDER’S EQUITY | ||||||||
CURRENT LIABILITIES | ||||||||
Accounts payable, trade | $ | 2,067,177 | $ | 4,163,096 | ||||
Accrued expenses and other liabilities | 4,472,862 | 3,236,188 | ||||||
|
| |||||||
TOTAL CURRENT LIABILITIES | 6,540,039 | 7,399,284 | ||||||
|
| |||||||
TOTAL LIABILITIES | 6,540,039 | 7,399,284 | ||||||
COMMITMENTS AND CONTINGENCIES (Note E) | ||||||||
STOCKHOLDER’S EQUITY | ||||||||
Common stock; $1 par value; 240,000 shares authorized, issued and outstanding | 240,000 | 240,000 | ||||||
Retained earnings | 119,199,750 | 120,242,439 | ||||||
|
| |||||||
TOTAL STOCKHOLDER’S EQUITY | 119,439,750 | 120,482,439 | ||||||
|
|
|
| |||||
TOTAL LIABILITIES AND STOCKHOLDER’S EQUITY | $ | 125,979,789 | $ | 127,881,723 | ||||
| ||||||||
June 30, 2011 | December 31, 2010 | |||||||
| ||||||||
| (Unaudited) | ||||||||
ASSETS | ||||||||
CURRENT ASSETS | ||||||||
Cash and cash equivalents | $ | 71,903,646 | $ | 81,642,230 | ||||
Accounts receivable—trade, net | 21,552,415 | 19,865,005 | ||||||
Inventory, net | 31,594,469 | 25,044,231 | ||||||
Prepaid expenses and other assets | 41,280 | 288,959 | ||||||
|
| |||||||
TOTAL CURRENT ASSETS | 125,091,810 | 126,840,425 | ||||||
PROPERTY AND EQUIPMENT, net | 887,979 | 1,041,298 | ||||||
|
| |||||||
TOTAL ASSETS | $ | 125,979,789 | $ | 127,881,723 | ||||
|
| |||||||
LIABILITIES AND STOCKHOLDER’S EQUITY | ||||||||
CURRENT LIABILITIES | ||||||||
Accounts payable, trade | $ | 2,067,177 | $ | 4,163,096 | ||||
Accrued expenses and other liabilities | 4,472,862 | 3,236,188 | ||||||
|
| |||||||
TOTAL CURRENT LIABILITIES | 6,540,039 | 7,399,284 | ||||||
|
| |||||||
TOTAL LIABILITIES | 6,540,039 | 7,399,284 | ||||||
COMMITMENTS AND CONTINGENCIES (Note E) | ||||||||
STOCKHOLDER’S EQUITY | ||||||||
Common stock; $1 par value; 240,000 shares authorized, issued and outstanding | 240,000 | 240,000 | ||||||
Retained earnings | 119,199,750 | 120,242,439 | ||||||
|
| |||||||
TOTAL STOCKHOLDER’S EQUITY | 119,439,750 | 120,482,439 | ||||||
|
| |||||||
TOTAL LIABILITIES AND STOCKHOLDER’S EQUITY | $ | 125,979,789 | $ | 127,881,723 | ||||
| ||||||||
See accompanying notes to unaudited financial statements.
Statements of operations
(Unaudited)
| Three months ended June 30, | Six months ended June 30, | |||||||||||||||
| 2011 | 2010 | 2011 | 2010 | |||||||||||||
| ||||||||||||||||
NET SALES | $ | 26,447,304 | $ | 22,750,235 | $ | 50,353,477 | $ | 39,699,511 | ||||||||
COST OF SALES | 10,545,532 | 8,609,062 | 19,393,377 | 14,664,447 | ||||||||||||
|
| |||||||||||||||
GROSS PROFIT | 15,901,772 | 14,141,173 | 30,960,100 | 25,035,064 | ||||||||||||
SELLING, GENERAL AND ADMINISTRATIVE EXPENSES | 3,437,077 | 4,751,250 | 6,186,204 | 6,445,339 | ||||||||||||
|
| |||||||||||||||
OPERATING INCOME | 12,464,695 | 9,389,923 | 24,773,896 | 18,589,725 | ||||||||||||
OTHER INCOME | ||||||||||||||||
Interest income | 96,217 | 74,659 | 189,102 | 135,856 | ||||||||||||
Other income | — | — | — | 2,000,000 | ||||||||||||
Other, net | 56,556 | 34,218 | 112,359 | 56,991 | ||||||||||||
|
| |||||||||||||||
TOTAL OTHER INCOME | 152,773 | 108,877 | 301,461 | 2,192,847 | ||||||||||||
|
| |||||||||||||||
NET INCOME BEFORE INCOME TAX EXPENSE | 12,617,468 | 9,498,800 | 25,075,357 | 20,782,572 | ||||||||||||
INCOME TAX EXPENSE | (120,000 | ) | (45,568 | ) | (238,367 | ) | (65,568 | ) | ||||||||
|
| |||||||||||||||
NET INCOME | $ | 12,497,468 | $ | 9,453,232 | $ | 24,836,990 | $ | 20,717,004 | ||||||||
| ||||||||||||||||
See accompanying notes to unaudited financial statements.
Statements of changes in stockholder’s equity
Six months ended June 30, 2011
| Common stock | Retained earnings | Total stockholder’s equity | ||||||||||
| ||||||||||||
Balance, January 1, 2011 | $ | 240,000 | $ | 120,242,439 | $ | 120,482,439 | ||||||
Dividend(unaudited) | — | (25,879,679 | ) | (25,879,679 | ) | |||||||
Net income(unaudited) | — | 24,836,990 | 24,836,990 | |||||||||
|
| |||||||||||
Balance, June 30, 2011(unaudited) | $ | 240,000 | $ | 119,199,750 | $ | 119,439,750 | ||||||
| ||||||||||||
See accompanying notes to unaudited financial statements.
Statements of cash flows
(Unaudited)
| Six months ended June 30, | ||||||||
| 2011 | 2010 | |||||||
| ||||||||
CASH FLOWS FROM OPERATING ACTIVITIES | ||||||||
Net income | $ | 24,836,990 | $ | 20,717,004 | ||||
Adjustment to reconcile net income to net cash provided by operating activities: | ||||||||
Depreciation | 169,656 | 210,267 | ||||||
Provision for inventory obsolescence | (158,909 | ) | 2,659,790 | |||||
Gain on sale of property and equipment | (18,322 | ) | — | |||||
Changes in operating assets and liabilities: | ||||||||
Accounts receivable, trade | (1,687,410 | ) | (6,079,655 | ) | ||||
Inventories | (6,391,329 | ) | (892,025 | ) | ||||
Prepaid expenses and other assets | 247,679 | 255,460 | ||||||
Accounts payable, trade | (2,095,919 | ) | (1,806,651 | ) | ||||
Accrued expenses and other liabilities | 1,236,674 | 875,786 | ||||||
|
| |||||||
NET CASH PROVIDED BY OPERATING ACTIVITIES | 16,139,110 | 15,939,976 | ||||||
CASH FLOWS FROM INVESTING ACTIVITIES | ||||||||
Proceeds from sale of property and equipment | 20,675 | — | ||||||
Purchases of property and equipment | (18,690 | ) | (50,144 | ) | ||||
|
| |||||||
NET CASH PROVIDED BY (USED IN) INVESTING ACTIVITIES | 1,985 | (50,144 | ) | |||||
CASH FLOW FROM FINANCING ACTIVITIES | ||||||||
Payment of dividends | (25,879,679 | ) | — | |||||
|
| |||||||
NET CASH USED IN FINANCING ACTIVITIES | (25,879,679 | ) | — | |||||
|
| |||||||
NET (DECREASE) INCREASE IN CASH AND CASH EQUIVALENTS | (9,738,584 | ) | 15,889,832 | |||||
CASH AND CASH EQUIVALENTS, beginning of period | 81,642,230 | 53,518,507 | ||||||
|
| |||||||
CASH AND CASH EQUIVALENTS, end of period | $ | 71,903,646 | $ | 69,408,339 | ||||
|
| |||||||
SUPPLEMENTAL DISCLOSURES: | ||||||||
State taxes paid | $ | 1,679,445 | $ | 157,412 | ||||
| ||||||||
See accompanying notes to unaudited financial statements.
Notes to financial statements
Note A—Organization and nature of business
Davis-Lynch, LLC (the “Company”) is a Subchapter S Corporation that converted to a limited liability company on June 23, 2011. The Company was formed in 1947 and is privately and wholly owned by Carl A. Davis, President. The Company’s line of business includes designing, manufacturing, and marketing cementing equipment with operations solely in the United States. The Company operates in one segment. It sells its products primarily in the United States and through distributors in certain foreign geographic areas such as the Middle East, Africa, and South America. Originally a manufacturer of float equipment, the Company has expanded its product line to include a full line of centralizers and primary cementing aids, multi-purpose float collars, stage cementing tools, inner-string cementing tools, inflatable packers, flotation collars, cementing plugs, fill and circulate tools for running casing, casing hangers and drive pipe landing rings, as well as surge reduction equipment. The Company’s headquarters are located in Pearland, Texas. The financial statements have been prepared in the accrual basis of accounting principles in the United States of America.
The unaudited financial statements contained herein include all adjustments which are, in the opinion of management, necessary to provide a fair presentation of the financial condition and results of operations for the periods presented. All such adjustments are of a normal recurring nature. Certain information and footnote disclosures normally included in financial statements prepared in accordance with accounting principles generally accepted in the United States have been condensed or omitted in these financial statements. These financial statements should be read in conjunction with the financial statements and notes included in the Company’s latest audited financial statements as of December 31, 2010 and each of the three years ended December 31, 2010. The results of operations as of June 30, 2011 and for the six-month periods ended June 30, 2011 and 2010 are not necessarily indicative of the results to be expected for the full years ending December 31, 2011 and 2010.
Note B—Summary of significant accounting policies
Cash and cash equivalents: For purposes of the statements of cash flows, cash and cash equivalents consists of cash in banks, money market funds, and certificates of deposit with original maturities of three months or less.
Allowance for doubtful accounts: Earnings are charged with a provision for doubtful accounts based upon a current review of the collectability of accounts from customers. Accounts deemed uncollectible are applied against the allowance for doubtful accounts. Accounts receivable, trade was net of an allowance for doubtful accounts of $1,055,817 at June 30, 2011 and December 31, 2010. Bad debt expense totaled $0 for the three months ended June 30, 2011 and 2010, and $0 for the six months ended June 30, 2011, and 2010.
Inventory: Inventories are stated at the lower of cost or market value using an average standard cost. Cost is determined using standard cost, which approximates average cost, and includes the application of related direct labor and overhead. The Company periodically evaluates the components comprising its inventories and reviews for items that have not been utilized over a certain period of time based on current products in production, physical condition, and future applicability to be utilized in production to determine its obsolescence reserve.
Davis-Lynch, Inc.
Notes to financial statements (continued)
Inventories consist of the following:
| June 30, 2011 | December 31, 2010 | |||||||
| ||||||||
| (Unaudited) | ||||||||
Raw material | $ | 11,015,383 | $ | 8,502,006 | ||||
Work-in-process | 11,574,594 | 9,317,852 | ||||||
Finished goods | 14,476,041 | 12,854,831 | ||||||
|
| |||||||
| 37,066,018 | 30,674,689 | |||||||
Less: obsolescence reserve | (5,471,549 | ) | (5,630,458 | ) | ||||
|
| |||||||
Inventory, net | $ | 31,594,469 | $ | 25,044,231 | ||||
| ||||||||
Property and equipment: Property and equipment are stated at cost. Depreciation is computed over the estimated useful lives of the related assets using the straight-line method. Maintenance and repairs are charged to expense as incurred and significant renewals and betterments are capitalized. The cost and related accumulated depreciation of assets retired or otherwise disposed of are eliminated from the accounts, and any resulting gains or losses are recognized in operations in the year of disposal.
Property and equipment, net and related accumulated depreciation consist of the following:
| Estimated useful life | June 30, 2011 | December 31, 2010 | ||||||||||
| ||||||||||||
| (Unaudited) | ||||||||||||
Autos | 3-20 years | $ | 429,464 | $ | 440,544 | |||||||
Forklifts | 3-10 years | 321,033 | 321,033 | |||||||||
Machinery and equipment | 7-30 years | 7,642,423 | 7,703,908 | |||||||||
Leasehold improvements | 2,314,447 | 2,314,447 | ||||||||||
|
| |||||||||||
| 10,707,367 | 10,779,932 | |||||||||||
Less: accumulated depreciation and amortization | (9,819,388 | ) | (9,738,634 | ) | ||||||||
|
| |||||||||||
Property and equipment, net | $ | 887,979 | $ | 1,041,298 | ||||||||
| ||||||||||||
Depreciation expense related to property and equipment were $64,522 and $60,441 for the three months ended June 30, 2011 and 2010, respectively, and $169,656 and $210,268 for the six months ended June 30, 2011 and 2010, respectively. For the three months ended June 30, 2011, and 2010, $59,964 and $54,944, respectively, of depreciation expense is included in “cost of sales” and $4,558 and $5,497, respectively, is included in “selling, general, and administrative expenses” in the accompanying statements of operations. For the six months ended June 30, 2011, and 2010, $154,416 and $188,905, respectively, of depreciation expense is included in “cost of sales” and $15,240 and $21,363, respectively, is included in “selling, general and administrative expenses” in the accompanying statement of operations. Repairs and maintenance expense was $118,482 and $96,139 for the three months ended June 30, 2011 and 2010, respectively, and $253,486 and $135,725 for the six months ended June 30, 2011 and 2010, respectively.
Davis-Lynch, Inc.
Notes to financial statements (continued)
Impairment of long-lived assets: The Company reviews the recoverability of its long-lived assets, such as plant, property and equipment, when events or changes in circumstances occur that indicate the carrying value of the asset or asset group may not be recoverable and the expected future pre-tax cash flows (undiscounted) to be generated by those assets are less than the carrying value of the assets. In such case, the impairment loss would be equal to the amount by
which the carrying value exceeds estimated fair market value of the related assets. Long-lived assets are reviewed for impairment at the individual asset or the asset group level for which the lowest level of independent cash flows can be identified.
Income taxes: On June 23, 2011, the Company converted from a Subchapter S Corporation to a Limited Liability Company. As a Limited Liability Company, there is no provision for federal income taxes reflected in the financial statements as the Company is not subject to federal income taxes. Earnings flow through to the owner’s personal income tax return.
Effective January 1, 2009, the Company adopted guidance in Accounting Standards Codification (“ASC”) Topic 740 (ASC 740),Income Taxes, for the accounting for the uncertainty in income taxes. The guidance clarifies the accounting for income taxes by prescribing the minimum recognition threshold an income tax position is required to meet before being recognized in the financial statements and applies to all income tax positions. Each income tax position is assessed using a two step process. A determination is made as to whether it is more likely than not that the income tax position will be sustained, based upon technical merits, upon examination by the taxing authorities. If the income tax position is expected to meet the more likely than not criteria, the benefit recorded in the financial statements equals the largest amount that is greater than 50% likely to be realized upon its ultimate settlement.
The adoption of this guidance did not impact the Company’s financial position, results of operations, or cash flows as the income tax positions taken by the Company for any years open under the various statute of limitations is that the Company continues to be exempt from federal income taxes by virtue of its pass through status and that federal income tax is attributable to its owner. Management believes that this tax position meets the more likely than not threshold and accordingly, the tax benefit of this income tax position (no federal income tax expense or liability) has been recognized for any period presented.
The Company records income tax related interest and penalties as a component of the provision for income taxes. For the three months and six months ended June 30, 2011 and 2010, the Company recorded approximately $0 of interest and $0 in penalties related to state income taxes, respectively. The Company believes there is no tax positions taken or expected to be taken that would significantly increase or decrease unrecognized tax benefits within twelve months of the reporting date.
During 2010, the Company underwent a tax audit by the State of Louisiana (the “State”). As a result of this audit, it was determined the Company owed additional taxes totaling $1,249,246, inclusive of interest and penalties, to the State. This amount was reflected in the December 31, 2010 financial statements and was subsequently paid in January 2011. No other state tax returns are currently under examination by state authorities. However, fiscal years 2007 and later remain subject to examination by the respective states in which the Company does business.
Davis-Lynch, Inc.
Notes to financial statements (continued)
In May 2006, the State of Texas enacted a bill that replaced the existing state franchise tax with a margin tax. Effective January 1, 2007, the margin tax applies to legal entities conducting business in Texas, including previously non-taxable entities such as limited partnerships and limited liability partnerships. The margin tax is based on Texas sourced taxable margin. The tax is calculated by applying a tax rate to a base rate that considers both revenues and expenses and therefore has the characteristics of an income tax. As a result, the Company recorded $61,200 and $24,825 in estimated state income taxes for the three months ended June 30, 2011 and 2010, respectively, and $122,400 and $44,825 for the six months ended June 30, 2011 and 2010,
respectively, that is solely attributable to the Texas margin tax and is included in “income tax expense” in the accompanying statements of operations. The Company also recorded $58,800 and $20,743 in state income taxes for the three months ended June 30, 2011 and 2010, respectively, and $115,967 and $20,743 for the six months ended June 30, 2011 and 2010, respectively, attributable to various other states in which the Company conducts business.
Concentrations of credit risk: Financial instruments that potentially subject the Company to credit risk are cash and cash equivalents and trade accounts receivable. The Company maintains cash balances in high credit quality financial institutions which at times may exceed federally insured limits. The Company monitors the financial condition of these institutions and has experienced no losses associated with these accounts. The Company extends credit to customers throughout the United States of America and certain foreign countries. The Company’s allowance for doubtful accounts is based upon a current review of collectability for each customer taking into consideration current market conditions and other factors.
The Company’s primary customers are in the energy industry. As such, the Company could be affected by events that affect this industry such as natural disasters, political unrest, terrorism, oil prices and domestic policies regarding energy related industries.
In October 2008, the Federal Deposit Insurance Corporation increased its insurance to $250,000 per depositor, and to an unlimited amount for non-interest bearing accounts. The coverage increase, which is temporary, extends through December 31, 2013.
Revenue recognition: Revenue is recognized when products are shipped or services are performed.
Shipping and handling fees and costs: Shipping and handling fees, if billed to customers, are included in net sales. Shipping and handling costs are classified as cost of sales.
Use of estimates: The preparation of financial statements in conformity with accounting principles generally accepted in the United States of America requires management to make estimates and assumptions that affect the reported amounts of assets and liabilities and disclosure of contingent assets and liabilities at the date of the financial statements and the reported amounts of revenues and expenses during the reporting period. On an ongoing basis, the Company evaluates its estimates and assumptions, including those related to its allowance for doubtful accounts, inventory obsolescence, impairment for property and equipment and contingencies. Actual results could differ from these estimates.
Davis-Lynch, Inc.
Notes to financial statements (continued)
Environmental remediation: The Company accounts for environmental remediation in accordance with ASC Topic 410,Asset Retirement and Environmental Obligations. In accordance with this guidance, liabilities are recorded when environmental assessments indicate that remediation efforts are probable and the costs can be reasonably estimated. Estimates of the liability are based upon currently available facts, existing technology and presently enacted laws and regulations, taking into consideration the likely effects of inflation and other societal and economic factors, and include estimates of associated legal costs.
Fair value of financial instruments: Financial instruments of the Company consist primarily of cash and cash equivalents, accounts receivable and accounts payable. The Company’s management considers the carrying values of cash and cash equivalents, accounts receivable and accounts payable to be representative of their respective fair values because of their short-term nature.
Recent accounting standards: In June 2011, the Financial Accounting Standards Board (“FASB”) issued an update to ASC 220,Presentation of Comprehensive Income. This Accounting Standards Update (“ASU”) provides that an entity that reports items of other comprehensive income has the option to present comprehensive income in either 1) a single statement that presents the components of net income and total net income, the components of other comprehensive income and total other comprehensive income, and a total for comprehensive income; or 2) a two-statement approach which presents the components of net income and total net income in a first statement, immediately followed by a financial statement that presents the components of other comprehensive income, a total for other comprehensive income, and a total for comprehensive income. The option in current GAAP that permits the presentation of other comprehensive income in the statement of changes in equity was eliminated. The guidance will be applied retrospectively and is effective for the Company for annual periods beginning on January 1, 2012. Early adoption is permitted. The adoption of this guidance will not have a material impact on the Company’s financial statements.
In May 2011, the FASB issued an update to ASC 820,Fair Value Measurements. This ASU clarifies the application of certain fair value measurement requirements and requires, among other things, expanded disclosures for Level 3 fair value measurements and the categorization by level for items for which fair value is required to be disclosed in accordance with ASC 825,Financial Instruments. The guidance will be applied prospectively and is effective for the Company for annual periods beginning on January 1, 2012. Early adoption is not permitted. The adoption of this standard will not have an impact on the Company’s financial statements.
In October 2009, the FASB issued an update to ASC 605,Revenue Recognition. This ASU allows companies to allocate consideration for qualified separate deliverables using the estimated selling price for both delivered and undelivered items when vendor-specific objective evidence or third-party evidence is unavailable. It also requires additional disclosures on the nature of multiple element arrangements, the types of deliverables under the arrangements, the general timing of their delivery, and significant factors and estimates used to determine estimated selling prices. The Company adopted this new guidance on January 1, 2011. Accordingly, the Company applies this guidance to transactions initiated or materially modified on or after January 1, 2011. The Company’s adoption of this new guidance did not have an impact on its financial position, results of operations, cash flows or existing revenue recognition policies.
Davis-Lynch, Inc.
Notes to financial statements (continued)
In December 2010, the FASB issued an update to ASC 805,Business Combinations. This ASU addressed the disclosure of comparative financial statements and expanded on the supplementary pro forma information for business combinations. The Company adopted this ASU prospectively for business combinations occurring on or after December 15, 2010.
Note C—Accrued expenses and other liabilities
Accrued expenses consisted of the following:
| June 30, 2011 | December 31, 2010 | |||||||
| ||||||||
| (Unaudited) | ||||||||
Sales tax payable | $ | 165,774 | $ | 131,164 | ||||
Customer credits | 74,270 | 74,270 | ||||||
Accrued commissions | 2,063,768 | 2,098,912 | ||||||
Accrued bonuses | 642,000 | — | ||||||
Accrued royalties | 1,242,538 | 527,842 | ||||||
Accrued state taxes | 159,512 | 404,000 | ||||||
Accrued professional services | 125,000 | — | ||||||
|
| |||||||
| $ | 4,472,862 | $ | 3,236,188 | |||||
| ||||||||
Note D—Income taxes
The provision for income taxes as of June 30, 2011 and 2010 consists of the following(unaudited):
| Three months ended June 30, | Six months ended June 30, | |||||||||||||||
| 2011 | 2010 | 2011 | 2010 | |||||||||||||
| ||||||||||||||||
Texas margin tax | $ | 61,200 | $ | 24,825 | 122,400 | $ | 44,825 | |||||||||
Other state income taxes | 58,800 | 20,743 | 115,967 | 20,743 | ||||||||||||
|
| |||||||||||||||
Total | $ | 120,000 | $ | 45,568 | $ | 238,367 | $ | 65,568 | ||||||||
| ||||||||||||||||
Note E—Commitments and contingencies
In 2009, an embezzlement scheme totaling approximately $15 million was discovered by the Company, whereby former employees had submitted fraudulent invoices for payments for over a decade. The fraud came to light during a two month examination of the Company’s accounting records. The Company hired a third party independent consultant to investigate this matter and to conduct the examination. The consultant has reported their findings to management of the Company, which has begun legal action against the defendants in Federal District Court. All amounts pertaining to this matter related to years prior to 2010. In 2010, the Company was awarded summary judgment, no amounts have been received, and no receivable has been recorded by the Company at June 30, 2011. The Company intends to vigorously pursue this matter.
Davis-Lynch, Inc.
Notes to financial statements (continued)
In January 2010, a favorable settlement was reached in a patent infringement lawsuit whereby the Company was the plaintiff. Terms of the settlement were not disclosed, but the defendant will pay a 10% royalty on future sales of the products included in the lawsuit. The Company recognized royalty income of $88,936 and $396,793 related to this settlement in the six months ended June 30, 2011 and 2010, respectively.
The Company is involved in various disputes arising in the ordinary course of business. Management does not believe the outcome of these disputes will have a material adverse effect on the Company’s financial position, results of operations or cash flows.
The Company leases certain equipment and office and manufacturing space under non-cancelable operating leases which expire at various dates through 2010 and now are month to month in nature. Total rental expense for the three months ended June 30, 2011, and 2010, were both approximately $59,000, and approximately $118,000 for both the six months ended June 30, 2011 and 2010, respectively.
The Company has various standby letters of credit with a financial institution up to a total commitment limit of $3,000,000 of which approximately $2,645,675 was utilized at June 30, 2011. The letters of credit expire through November 2011, and support certain international operations.
Note F—Related party transactions
The Company leases land from a related party. Total rent expense was approximately $30,000 for both the three months ended June 30, 2011, and 2010, and approximately $60,000 for both the six months ended June 30, 2011 and 2010.
For the three months ended June 30, 2011 and 2010, the Company purchased supplies and materials from a related party which totaled approximately $79,000 and $63,000, respectively, and approximately $158,000 and $125,000 for the six months ended June 30, 2011 and 2010, respectively.
The Company utilizes a staffing company that is a related party. Total expense for the three months ended June 30, 2011 and 2010 was approximately $3,600,000 and $0, respectively, and approximately $6,896,000 and $0 for the six months ended June 30, 2011 and 2010, respectively.
Note G—Risk and uncertainties
The current downturn in the United States economy, and any economic slowdown in future periods, could adversely affect the Company in ways that cannot be predicted. During times of economic slowdown, the Company’s customers may reduce their capital expenditures and defer or cancel pending orders. Such developments occur even among customers that are not experiencing financial difficulties. These deferrals or cancelling of capital expenditures could directly impact the demand for the Company’s products and services. Additionally, bankruptcies or financial difficulties among the Company’s customers could reduce its cash flows and adversely impact liquidity and profitability.
Davis-Lynch, Inc.
Notes to financial statements (continued)
Note H—Subsequent events
The Company has evaluated all events subsequent from the balance sheet date of June 30, 2011 through August 29, 2011, and noted no subsequent events that would require recognition or disclosure in the financial statements, other than those items disclosed herein and below.
On June 25, 2011, Forum Energy Technologies, Inc. entered into an agreement to purchase the Company for cash, as outlined under the terms in the purchase and sale agreement, subject to certain working capital adjustments. The transaction closed on July 29, 2011.
Wood Flowline Products, LLC financial statements
Index
Report of independent registered public accounting firm
To the Members of
Wood Flowline Products, LLC
In our opinion, the accompanying balance sheet and the related statements of operations, of members’ equity and of cash flows, present fairly, in all material respects, the financial position of Wood Flowline Products, LLC at December 31, 2010 and the results of its operations and its cash flows for the year then ended in conformity with accounting principles generally accepted in the United States of America. These financial statements are the responsibility of the Company’s management. Our responsibility is to express an opinion on these financial statements based on our audit. We conducted our audit of these statements in accordance with the standards of the Public Company Accounting Oversight Board (United States). Those standards require that we plan and perform the audit to obtain reasonable assurance about whether the financial statements are free of material misstatement. An audit includes examining, on a test basis, evidence supporting the amounts and disclosures in the financial statements, assessing the accounting principles used and significant estimates made by management, and evaluating the overall financial statement presentation. We believe that our audit provides a reasonable basis for our opinion.
/s/ PricewaterhouseCoopers LLP
Houston, Texas
June 24, 2011
Balance sheet
December 31, 2010
| (thousands) | ||||
| ||||
Assets | ||||
Current assets | ||||
Cash and cash equivalents | $ | 710 | ||
Accounts receivable, net | 5,444 | |||
Inventories | 4,792 | |||
Prepaid expenses and other current assets | 373 | |||
|
| |||
Total current assets | 11,319 | |||
Property, plant and equipment, net | 2,265 | |||
|
| |||
Total assets | $ | 13,584 | ||
|
| |||
Liabilities and Members’ Equity | ||||
Current liabilities | ||||
Current portion of long-term debt—related party | $ | 629 | ||
Current portion of long-term debt | 65 | |||
Accounts payable | 2,359 | |||
Accrued expenses and other payables | 496 | |||
|
| |||
Total current liabilities | 3,549 | |||
Long-term debt, less current portion—related party | 203 | |||
Long-term debt, less current portion | 100 | |||
Commitments and contingencies (Note 7) | ||||
Members’ Equity | 9,732 | |||
|
| |||
Total liabilities and members’ equity | $ | 13,584 | ||
| ||||
The accompanying notes are an integral part of this financial statements.
Statement of operations
Year ended December 31, 2010
| (thousands) | ||||
| ||||
Revenue | ||||
Products | $ | 23,964 | ||
Services | 4,560 | |||
|
| |||
Total revenue | 28,524 | |||
|
| |||
Operating costs and expenses | ||||
Cost of revenue | ||||
Products | 17,781 | |||
Services | 958 | |||
Selling, general and administrative expenses | 1,576 | |||
|
| |||
| 20,315 | ||||
|
| |||
Income from operations | 8,209 | |||
|
| |||
Other income (expense) | ||||
Interest expense | (81 | ) | ||
Other expense, net | (4 | ) | ||
|
| |||
Total other expenses | (85 | ) | ||
|
| |||
Net income | $ | 8,124 | ||
| ||||
The accompanying notes are an integral part of this financial statements.
Consolidated statements of members’ equity
December 31, 2010
| (thousands) | ||||
| Total members’ equity | ||||
| ||||
Balance, December 31, 2009 | $ | 1,925 | ||
Distributions to members | (317 | ) | ||
Net income | 8,124 | |||
|
| |||
Balance, December 31, 2010 | $ | 9,732 | ||
| ||||
The accompanying notes are an integral part of this financial statements.
Statement of cash flows
December 31, 2010
| (thousands) | ||||
| ||||
Cash flow from operating activities | ||||
Net income | $ | 8,124 | ||
Adjustments to reconcile net income to net cash provided by operating activities | ||||
Depreciation expense | 427 | |||
Bad debt expense | 40 | |||
Loss on sale of equipment | 4 | |||
Changes in operating assets and liabilities | ||||
Accounts receivable (increase) | (4,672 | ) | ||
Inventories (increase) | (3,105 | ) | ||
Prepaid expenses and other current assets (increase) | (262 | ) | ||
Accounts payable and accrued expenses increase | 1,687 | |||
|
| |||
Net cash provided by operating activities | 2,243 | |||
|
| |||
Cash flow from investing activities | ||||
Net cash received from sale of assets | 23 | |||
Purchase of property, plant and equipment | (1,055 | ) | ||
|
| |||
Net cash used by investing activities | (1,032 | ) | ||
|
| |||
Cash flow from financing activities | ||||
Proceeds from related party notes | 390 | |||
Payments of related party notes | (544 | ) | ||
Payments of equipment notes | (38 | ) | ||
Distributions to members | (317 | ) | ||
|
| |||
Net cash used by financing activities | (509 | ) | ||
|
| |||
Net increase in cash | 702 | |||
Cash and cash equivalents | ||||
Beginning of period | 8 | |||
|
| |||
End of period | $ | 710 | ||
|
| |||
Supplemental cash flow information | ||||
Cash paid for interest | $ | 69 | ||
Noncash investing and financing activities | ||||
Property, plant and equipment acquired through note payable | $ | 203 | ||
| ||||
The accompanying notes are an integral part of this financial statements.
Notes to financial statements
December 31, 2010
1. Description of business and organization
Wood Flowline Products LLC (the “Company”), formed as a limited liability company in the State of Texas in September 2008, is a company focused on the manufacturing, distribution and maintenance of well-completion products. This includes the manufacturing, testing, rebuilding and recertification of swivel joints, pup joints, check valves, release valves, manifold trailers and other completion products. The Company has facilities in Oklahoma and Arkansas. The Company provides complete and detailed rebuild and recertification services for frac iron at its facilities. The Company also has a mobile rebuild and recertification team that provides flow line and valve maintenance, repair, ultrasonic testing and hydrostatic testing in the field.
2. Significant accounting policies
Cash and cash equivalents
Cash and cash equivalents include cash on hand and all highly liquid investments with original maturities of three months or less.
Revenue recognition
For product sales, the Company recognizes revenue when persuasive evidence of an arrangement exists, performance has occurred, collection is reasonably assured, the sale price is fixed and determinable, and risk of loss for products shipped has occurred.
For rebuild and recertification services, the Company recognizes revenue when the service is complete.
Shipping and handling fees
The Company includes shipping and handling fees billed to customers in product sales revenue. Shipping and handling costs associated with these sales were $258 thousand for the year ended December 31, 2010.
Accounts receivable
The Company extends credit to customers in the normal course of business. The Company estimates its bad debt exposure based upon aging its accounts receivable balances each period and records a bad debt provision for accounts receivable it believes it may not collect in full. The Company has recorded a reserve for uncollectible accounts receivable of $40 thousand at December 31, 2010.
Concentration of credit risk
The majority of the Company’s customers operate in the oil and gas industry. While current energy prices are important contributors to positive cash flow for the customers, expectations about future prices and price volatility are generally more important for determining future
Wood Flowline Products, LLC
Notes to financial statements
December 31, 2010 (continued)
spending levels. Any prolonged increase or decrease in oil and natural gas prices affects the levels of exploration, development and production activity as well as the entire health of the oil and natural gas industry, and can therefore negatively impact spending by Company’s customers.
Revenue for the year ended December 31, 2010 includes sales to 5 customers that each individually represented more than 10% of total revenue. These customers accounted for 85% of revenue for the year ended December 31, 2010. Accounts receivable from these customers totaled 86% of accounts receivable at December 31, 2010.
The Company maintains its cash balances at one financial institution. The Federal Deposit Insurance Corporation insures account balances up to $250 thousand, and they have offered unlimited coverage for noninterest bearing accounts at participating FDIC insured institutions through June 30, 2012. The Company’s major bank participates in this program. The Company does not believe that it is exposed to any significant credit risk on any uninsured amounts.
Inventories
Inventories are stated at the lower of cost or market, cost being determined on an average cost basis. The Company reviews its inventory balances and writes down its inventory for estimated obsolescence or excess inventory equal to the difference between the cost of inventory and the estimated market value based upon assumptions about future demand and market conditions. There was no reserve recorded for inventory on hand at December 31, 2010.
Concentration of supplier risk
Purchases during the year ended December 31, 2010 include purchases from 3 suppliers that each individually represented more than 10% of total inventory purchases. These suppliers accounted for 59% of total inventory purchases for the year ended December 31, 2010. The Company’s accounts payable to these vendors totaled 60% of total accounts payable at December 31, 2010.
Property, plant and equipment
Property and equipment are recorded at cost. The costs of major renewals and betterments are capitalized; repair and maintenance costs are expensed as incurred. When assets are sold or retired, the cost and related accumulated depreciation are removed from the appropriate accounts, and the resulting gain or loss is included in current operations. Leasehold improvements are capitalized and amortized over the lesser of their estimated useful lives or 5 years.
Wood Flowline Products, LLC
Notes to financial statements
December 31, 2010 (continued)
Depreciation of property and equipment is computed principally using the straight-line basis over the estimated useful lives of the assets as set forth below:
| ||||
| ||||
| ||||
| ||||
| ||||
Members’ equity
The Company has one class of equity. Members’ interests were determined based upon each member’s initial capital contribution in accordance with the Company Agreement. Initial capital contributions totaled $1 million.
Impairment of long-lived assets
Long-lived assets held and used by the Company are reviewed for impairment whenever events or changes in circumstances indicate that the carrying amount of an asset may not be recoverable. For purposes of evaluating the recoverability of long-lived assets, the recoverability test is performed using undiscounted future net cash flows of assets grouped at the lowest level for which there are identifiable cash flows that are independent of the cash flows of other groups of assets. If the undiscounted future net cash flows are less than the carrying amount of the asset, the asset is deemed impaired. The amount of the impairment is measured as the difference between carrying value and the fair value of the asset.
Income taxes
As a limited liability company, provision for income taxes is not made in the Company’s accounts since such taxes are the responsibility of the individual members. Further, the members capital account reflected in the accompanying balance sheet differs from amounts reported in the members’ income tax returns because of differences in the timing of certain expense and revenue items for financial and tax reporting purposes.
Use of estimates
The preparation of the financial statements in conformity with accounting principles generally accepted in the United States of America requires management to make estimates and assumptions that affect the reported amounts of assets and liabilities and disclosure of contingent assets and liabilities at the date of the consolidated financial statements and the reported amounts of revenues and expenses during the reporting period. Accordingly, actual results could differ from these estimates.
Wood Flowline Products, LLC
Notes to financial statements
December 31, 2010 (continued)
3. Inventories
Inventories consist of the followings at December 31, 2010:
| (thousands) | ||||
| ||||
Raw materials | $ | 4,026 | ||
Work-in-progress | 335 | |||
Finished goods | 431 | |||
|
| |||
| $ | 4,792 | |||
| ||||
4. Property, plant and equipment
The following is a summary of property, plant and equipment at December 31, 2010:
| (thousands) | ||||
| ||||
Machinery and equipment | $ | 1,534 | ||
Furniture, fixtures and computers and software | 85 | |||
Automobile and other vehicles | 382 | |||
Leasehold improvements | 796 | |||
Less: Accumulated depreciation | (634 | ) | ||
Construction in process | 102 | |||
|
| |||
| $ | 2,265 | |||
| ||||
Depreciation expense was $427 thousand for the year ended December 31, 2010, of which $279 thousand, $88 thousand and $60 thousand is recorded within products cost of revenue, services cost of revenue and selling, general and administrative expenses, respectively, in the accompanying statement of operations.
5. Accrued expenses
The following is a summary of accrued expenses at December 31, 2010:
| (thousands) | ||||
| ||||
Accrued vacation | $ | 31 | ||
Accrued interest | 13 | |||
Insurance payable | 222 | |||
Sales, franchise taxes | 110 | |||
Payroll accrual | 114 | |||
Payroll liabilities | 6 | |||
|
| |||
| $ | 496 | |||
| ||||
Wood Flowline Products, LLC
Notes to financial statements
December 31, 2010 (continued)
6. Long-term debt
The Company entered into loan agreements with a related party for a total of $1.1 million. These loans were made from January 2009 to July 2009. The loans are unsecured and bear interest at 7% per year payable in equal installments of $35 thousand each month.
Additional loan agreements totaling $273 thousand were entered into with the related party from December 2009 to September 2010. These loans are also unsecured, bear interest at 7% per year and were due in full in February 2011.
Three equipment notes were entered into between June 2010 and August 2010. The notes are collateralized by assets and bear interest at rates between 6.5% and 7% per year, payable in installments totaling $6 thousand per month.
The long-term debt’s fair value approximates its carrying value.
Following are maturities of notes payable for each of the next five years:
2011 | $ | 694 | ||
2012 | 254 | |||
2013 | 37 | |||
2014 | 8 | |||
2015 | 4 | |||
|
| |||
| $ | 997 | |||
| ||||
7. Commitments and contingencies
At December 31, 2010 the Company had a commitment for $376 thousand to purchase machinery and equipment.
8. Related party transactions
The Company conducts business with another entity related through common ownership. Sales to that entity for the year ending December 31, 2010 were $519 thousand. Accounts receivable from that entity at December 31, 2010 was $257 thousand.
During the year ending December 31, 2010 the Company purchased fixed assets from an owner of the Company. The fixed assets purchased were two trucks and two trailers used in the mobile recertification/rebuild operations of the Company. One truck and trailer was purchased for $50 thousand, and the other was purchased for $127 thousand.
The Company entered into loan agreements with an investment company affiliated with two of the Company’s four ownership interests. See Note 6.
9. Subsequent events
On February 3, 2011 Forum Energy Technologies Inc., through one of its subsidiaries, purchased 100% of the stock of Wood Flowline Products LLC. Forum Energy Technologies is a global oilfield
Wood Flowline Products, LLC
Notes to financial statements
December 31, 2010 (continued)
products Company, serving the drilling, subsea, completion, production and process sectors of the oil and natural gas industry. All of the long-term debt outstanding at December 31, 2010 was repaid in connection with this transaction.
Events occurring after December 31, 2010 were evaluated as of June 24, 2011, the date this report was made available to be issued, to ensure any subsequent events that meet the criteria for recognition and/or disclosure in this report have been identified.
Financial statements
for the year ended 30 April 2011
Report of independent registered public accounting firm
to the member of AMC Global Group Limited
In our opinion, the accompanying consolidated and company balance sheets and the related consolidated profit and loss account and cash flow statement present fairly, in all material respects, the financial position of AMC Global Group Limited and its subsidiaries at 30 April 2011, and the results of their operations and their cash flows for the year ended 30 April 2011 in conformity with accounting principles generally accepted in the United Kingdom. These financial statements are the responsibility of the Company’s management. Our responsibility is to express an opinion on these financial statements based on our audit. We conducted our audits of these statements in accordance with the standards of the Public Company Accounting Oversight Board (United States). Those standards require that we plan and perform the audit to obtain reasonable assurance about whether the financial statements are free of material misstatement. An audit includes examining, on a test basis, evidence supporting the amounts and disclosures in the financial statements, assessing the accounting principles used and significant estimates made by management, and evaluating the overall financial statement presentation. We believe that our audits provide a reasonable basis for our opinion.
Accounting principles generally accepted in the United Kingdom vary in certain significant respects from accounting principles generally accepted in the United States of America. Information relating to the nature of such differences is presented in notes 2 to the combined financial statements.
/s/ PricewaterhouseCoopers LLP
Aberdeen, United Kingdom
August 31, 2011
Consolidated profit and loss account for the year ended
30 April 2011
| Note | 2011 £ | |||||||
| ||||||||
Turnover | 3 | 12,832,852 | ||||||
Cost of sales | (5,755,776 | ) | ||||||
|
| |||||||
Gross profit | 7,077,076 | |||||||
Administrative expenses | (1,930,342 | ) | ||||||
Other operating income | 10,496 | |||||||
|
| |||||||
Operating profit | 4 | 5,157,230 | ||||||
Interest receivable and similar income | 7 | 16,209 | ||||||
Interest payable and similar charges | 8 | (15,011 | ) | |||||
|
| |||||||
Profit on ordinary activities before taxation | 5,158,428 | |||||||
Tax on profit on ordinary activities | 9 | (1,522,053 | ) | |||||
|
| |||||||
Profit for the financial year | 23 | 3,636,375 | ||||||
| ||||||||
All amounts relate to continuing operations.
The Group has no recognised gains or losses other than those included in the profit and loss account above.
There is no difference between the profit on ordinary activities before taxation and the profit for the year above and their historical cost equivalents.
The accompanying notes are an integral part of these financial statements.
Consolidated and company balance sheets as at
30 April 2011
| Note | Group 2011 £ | Company 2011 £ | ||||||||||
| ||||||||||||
Fixed assets | ||||||||||||
Intangible assets | 12 | 2,975,987 | — | |||||||||
Tangible assets | 13 | 1,504,047 | — | |||||||||
Investments | 14 | — | 5,057,887 | |||||||||
|
| |||||||||||
| 4,480,034 | 5,057,887 | |||||||||||
Current assets | ||||||||||||
Stock | 15 | 1,437,739 | — | |||||||||
Debtors | 16 | 2,958,619 | — | |||||||||
Investments | 17 | 550,000 | — | |||||||||
Cash at bank and in hand | 3,569,422 | 25,329 | ||||||||||
|
| |||||||||||
| 8,515,780 | 25,329 | |||||||||||
Creditors: amounts falling due within one year | 18 | (2,586,354 | ) | (1,845,419 | ) | |||||||
|
| |||||||||||
Net current assets/(liabilities) | 5,929,426 | (1,820,090 | ) | |||||||||
|
| |||||||||||
Total assets less current liabilities | 10,409,460 | 3,237,797 | ||||||||||
Creditors: amounts falling due after more than one year | 19 | — | — | |||||||||
Provisions for liabilities | 20 | (8,706 | ) | — | ||||||||
|
| |||||||||||
Net assets | 10,400,754 | 3,237,797 | ||||||||||
|
| |||||||||||
Capital and reserves | ||||||||||||
Called up share capital | 21 | 2,550,000 | 2,550,000 | |||||||||
Profit and loss account | 22 | 7,850,754 | 687,797 | |||||||||
|
| |||||||||||
Total shareholders’ funds | 23 | 10,400,754 | 3,237,797 | |||||||||
| ||||||||||||
The financial statements on pages F-118 to F-132 were approved by the board of directors on August 31, 2011 and were signed on its behalf by:
|
Director
Registered no. SC SC333600 (Scotland)
Consolidated cash flow statement for the year ended
30 April 2011
| Note | £ | £ | ||||||||||
| ||||||||||||
Net cash inflow from operating activities | 24 | 4,263,878 | ||||||||||
|
| |||||||||||
Returns on investments and servicing of finance | ||||||||||||
Interest received | 7 | 16,209 | ||||||||||
Interest paid | 8 | (15,011 | ) | |||||||||
|
| |||||||||||
Net cash inflow from returns on investments and servicing of finance | 1,198 | |||||||||||
Taxation | (762,940 | ) | ||||||||||
Capital expenditure and financial investment | ||||||||||||
Purchase of tangible fixed assets | 13 | (453,155 | ) | |||||||||
Sale of tangible fixed assets | 5,501 | |||||||||||
|
| |||||||||||
Net cash inflow for capital and financial investment | (447,654 | ) | ||||||||||
Equity dividends paid to shareholders | 11 | (62,500 | ) | |||||||||
|
| |||||||||||
Net cash inflow before use of liquid resources and financing | 2,991,982 | |||||||||||
|
| |||||||||||
Net cash outflow from management of liquid resources | (300,000 | ) | ||||||||||
|
| |||||||||||
Financing | ||||||||||||
Redemption of loan notes | (752,845 | ) | ||||||||||
|
| |||||||||||
Net cash inflow from financing | (752,845 | ) | ||||||||||
|
| |||||||||||
Increase in net cash | 1,939,137 | |||||||||||
|
| |||||||||||
Reconciliation to net cash | ||||||||||||
Net cash at 1 May | 1,127,439 | |||||||||||
Decrease in net cash | 1,939,138 | |||||||||||
Cash inflow from increase in liquid resources | 300,000 | |||||||||||
Movement in borrowings | 752,845 | |||||||||||
|
| |||||||||||
Net cash at 30 April 2011 | 4,119,422 | |||||||||||
| ||||||||||||
Notes to the consolidated financial statements for the year ended 30 April 2011
1. Business activities
The principal activity of the Group is the manufacture, sale and maintenance of torquing equipment (bucking machines) to the global oil and gas industry.
2. Accounting policies
(a) UK GAAP accounting policies
Accounting convention
These financial statements are prepared on a going concern basis, under the historical cost convention and in accordance with the Companies Act 2006 and applicable accounting standards in the United Kingdom. The principal accounting policies are set out below.
Basis of consolidation
The Group financial statements comprise the financial statements of the Company and all its subsidiary undertakings. The accounting reference date of the Company and its subsidiary undertakings is 30 April. Uniform accounting policies are applied throughout the Group. Profits or losses on intra-Group transactions are eliminated on consolidation.
Turnover
Turnover represents amounts receivable for goods and services net of VAT and trade discounts. It includes the relevant proportion of contract value for performance up to the year end.
Goodwill
When the fair value of the consideration for an acquired undertaking exceeds the fair value of its separable net assets the difference is treated as purchased goodwill and is capitalised and amortised through the profit and loss account on a straight line basis over its estimated economic life of 20 years. Impairment reviews are carried out to ensure that goodwill is not carried at above its recoverable amount.
AMC Global Group Limited
Notes to the consolidated financial statements for the year ended 30 April 2011 (continued)
Tangible fixed assets and depreciation
Tangible fixed assets are stated at cost less depreciation. Cost includes the original purchase price of the asset and the costs attributable to bringing the asset to its working condition for its intended use. Depreciation is provided at the following annual rates in order to write off each asset over its estimated useful life.
| ||
| ||
| ||
| ||
Investments
Investments in subsidiary undertakings are recorded at cost plus incidental expenses less any provision for impairment. Impairment reviews are performed by the directors when there has been an indication of potential impairment.
Current asset investments are stated at the lower of cost and net realisable value.
Stocks
Stock is valued at the lower of cost and net realisable value after making due allowance for any obsolete or slow-moving items.
Long-term contracts
Turnover and profit is recognised on long-term contracts as contract activity progresses and is calculated by reference to the value of work performed to date as a proportion of the total contract cost where the outcome can be assessed with reasonable certainty. Provisions for foreseeable losses are recognised in full when identified Turnover derived from variations on long-term contracts is recognised only when they have been accepted by the customer.
Where the invoiced value of work performed on a long-term contract is less than the actual value of the work performed by reference to the proportion of overall estimated contract costs incurred, the difference is recorded as amounts recoverable on long-term contracts and included within debtors due within one year.
Where payments are received from customers which exceed the value of work performed on a long-term contract the excess amounts are recorded as amounts payable under long-term contracts and included within creditors falling due within one year.
AMC Global Group Limited
Notes to the consolidated financial statements for the year ended 30 April 2011 (continued)
Pension costs
The Company operates a defined contribution scheme. The assets of the scheme are held separately from those of the Company in an independently administered fund. Contributions payable for the period are charged in the profit and loss account in the period to which they relate.
Current and deferred taxation
Corporation tax is provided on the assessable profits of the Company at the appropriate rates in force.
Deferred tax is recognised in respect of all timing differences that have originated but not reversed at the balance sheet date where transactions or events that result in an obligation to pay more tax or a right to pay less tax in the future have occurred at the balance sheet date. Timing differences are differences between the Company’s taxable profits and its results as stated in the financial statements. Deferred tax is measured at average tax rates that are expected to apply in the years in which the timing differences are expected to reverse, based on tax rates and laws that have been enacted or substantially enacted by the balance sheet date. Deferred tax assets and tax debtors arising from withholding tax credits are recognised to the extent that they are more likely than not to be recoverable. Deferred tax is measured on a non-discounted basis.
Foreign currency translation
The functional and presentational currency of the Company is Pounds Sterling.
Transactions in foreign currencies are recorded at the date ruling at the date of the transaction. Monetary assets and liabilities denominated in foreign currencies are retranslated at the rate of exchange ruling at the balance sheet date. All differences are taken to the profit and loss account.
Research and development
Research expenditure is written off to to cost of sales in the profit and loss account in the year in which it is incurred.
(b) Principal differences to US GAAP
The financial statements have been prepared in accordance with accounting principles generally accepted in the United Kingdom (‘UK GAAP”). Such principles differ in certain significant respects from generally accepted accounting principles in the United States (‘US GAAP’). A summary of principal differences applicable to AMC Global Group Limited are set out below.
AMC Global Group Limited
Notes to the consolidated financial statements for the year ended 30 April 2011 (continued)
Goodwill and intangible asset amortization
Under UK GAAP, goodwill arising and separately identifiable and separable intangible assets acquired on acquisitions made on or after 1 April 1998 are capitalized and amortized over their useful life, with a rebuttable presumption that the useful life will not exceed a period of 20 years. Prior to 1 April 1998, all goodwill and separately identifiable and separate intangible assets were written off to reserves on acquisition.
Under US GAAP, SFAS 142, “Goodwill and Other Intangible Assets” became effective for fiscal years beginning after 15 December 2001. Under SFAS 142, goodwill is not amortized but is tested for impairment on an annual basis or where there is an indicator of impairment. Prior to SFAS 142, goodwill was capitalized and amortized over its estimated useful life. Under SFAS 142, recognized intangible assets are amortized over their estimated useful lives.
Deferred income taxes
Under UK GAAP, deferred taxation is provided in full on all material timing differences. Deferred tax assets are recognized where their recovery is considered more likely than not. US GAAP requires deferred taxation to be provided in full, using the liability method. In addition, US GAAP requires the recognition of the deferred tax consequences of differences between the assigned values and the tax bases of the identifiable intangible assets, with the exception of non tax-deductible goodwill, in a purchase business combination. Consequently, a deferred tax liability attributable to identifiable intangible assets will be recognized and amortized over the useful economic lives of the underlying intangible assets.
Statement of cash flows
The statement of cash flows under UK GAAP is prepared in accordance with FRS 1 (revised) and presents substantially the same information as that required under US GAAP. Under US GAAP, however, there are certain differences from UK GAAP with regard to the classification of items within the cash flow statement and with regard to the definition of cash and cash equivalents.
Revenue Recognition—Long-term contract
Under UK GAAP, SSAP 9 defines a long-term contract as a contract entered into for the design, manufacture or construction of a single substantial asset where the time taken substantially to complete the contract is such that the contract activity falls into different accounts periods. This definition requires contracts with duration of less than one year to be accounted for as long-term contracts if they are sufficiently material to the activities of the period that failure to record turnover and profit on them would result in the accounts not giving a true and fair view. The Company recognizes revenue and cost of goods sold each period based upon the advancement of the work-in-progress unless the stage of completion is insufficient to enable a reasonably certain forecast of profit to be established. Under US GAAP, revenue would be accounted for on these contracts only when delivery has occurred.
AMC Global Group Limited
Notes to the consolidated financial statements for the year ended 30 April 2011 (continued)
Financial statement presentation
The format and presentation of the balance sheet, income statement and statement of cash flows under UK GAAP differs from that under US GAAP.
3. Turnover
In the opinion of the directors it would be seriously prejudicial to disclose segmental information by class of business or by geographical markets.
4. Operating profit
| ||||
| ||||
| ||||
| ||||
| ||||
| ||||
| ||||
| ||||
| ||||
| ||||
5. Directors’ remuneration
| ||||
| ||||
The number of directors for whom retirement benefits are accruing under defined contribution schemes amounted to 3.
The remuneration disclosed above includes the following amounts paid to the highest paid director:
| ||||
| ||||
AMC Global Group Limited
Notes to the consolidated financial statements for the year ended 30 April 2011 (continued)
6. Employees
The average monthly number of persons (including executive directors) employed by the Group during the year was:
| ||||
| ||||
| ||||
The staff costs for the Group including directors’ remuneration were as follows:
| ||||
| ||||
| ||||
7. Interest receivable and similar income
| ||||
8. Interest payable and similar charges
| ||||
9. Taxation
(a) Analysis of tax charge in the year:
| ||||
| ||||
| ||||
| ||||
| ||||
| ||||
| ||||
AMC Global Group Limited
Notes to the consolidated financial statements for the year ended 30 April 2011 (continued)
(b) Factors affecting tax charge for the year:
The tax assessed for the year is higher than the standard rate of corporation tax in the UK of 27.83%. The differences are explained below:
| ||||
| ||||
| ||||
| ||||
| ||||
| ||||
| ||||
| ||||
(c) Factors that may affect future tax charges:
The UK substantively enacted on 20 July 2010 an amendment to the corporation tax rate from 28% to 27% effective from 1 April 2011. Further reductions to the UK corporation tax rate were announced in the March 2011 Government Budget. The changes propose to reduce the corporation tax rate to 26% on 1 April 2011 and reduce the rate by 1% per annum thereafter to 23% by 1 April 2014. The reduction of the main corporation tax rate to 26% was substantively enacted on 29 March 2011. The reduction to 25% from April 2012 was substantively enacted on 5 July 2011. The changes to the tax rates do not have a material impact on these financial statements.
10. Profit and loss account of the Company
The Company made a loss of £10,301. The directors have taken advantage of the exemption available under section 408 of the Companies Act 2006 and not presented a profit and loss account for the Company alone.
11. Dividends
| ||||
| ||||
AMC Global Group Limited
Notes to the consolidated financial statements for the year ended 30 April 2011 (continued)
12. Intangible fixed assets
| ||||
| ||||
| ||||
| ||||
| ||||
| ||||
| ||||
| ||||
13. Tangible fixed assets
| Group | Land and buildings | Plant and machinery | Fixtures, fittings and | Motor vehicles | Total | |||||||||||||||
| £ | £ | £ | £ | £ | ||||||||||||||||
| ||||||||||||||||||||
Cost | ||||||||||||||||||||
At 1 May 2010 | 1,299,887 | 354,137 | 55,592 | 147,879 | 1,857,495 | |||||||||||||||
Additions | 348,202 | 71,933 | 3,045 | 29,975 | 453,155 | |||||||||||||||
Disposals | — | (134,874 | ) | (40,598 | ) | (6,200 | ) | (181,672 | ) | |||||||||||
|
| |||||||||||||||||||
At 30 April 2011 | 1,648,089 | 291,196 | 18,039 | 171,654 | 2,128,978 | |||||||||||||||
|
| |||||||||||||||||||
Accumulated depreciation | ||||||||||||||||||||
At 1 May 2010 | 255,173 | 189,886 | 40,885 | 68,259 | 554,203 | |||||||||||||||
Charge for the year | 140,539 | 57,155 | 6,632 | 36,438 | 240,764 | |||||||||||||||
Disposals | — | (127,020 | ) | (40,187 | ) | (2,829 | ) | (170,036 | ) | |||||||||||
|
| |||||||||||||||||||
At 30 April 2011 | 395,712 | 120,021 | 7,330 | 101,868 | 624,931 | |||||||||||||||
|
| |||||||||||||||||||
Net book value | ||||||||||||||||||||
At 30 April 2011 | 1,252,377 | 171,175 | 10,709 | 69,786 | 1,504,047 | |||||||||||||||
| ||||||||||||||||||||
There are no assets held under finance leases or hire purchase contracts.
14. Fixed asset investments
| ||||
AMC Global Group Limited
Notes to the consolidated financial statements for the year ended 30 April 2011 (continued)
In the opinion of the directors, the aggregate value of the Company’s investment in subsidiary undertakings is not less than the amount included in the balance sheet.
AMC Global Group Limited is a private Company, registered and domiciled in Scotland. Details of investments in which the Company hold more than 20% of the nominal value of any class of share capital are as follows:
| ||||||||||
AMC Global Engineering Limited holds 100% of the ordinary share capital of AMC Engineering Limited, a Company incorporated in Scotland and 100% of the ordinary share capital of AMC Torque Solutions Inc., a Company incorporated in the United States of America
The principal activities of subsidiary undertakings are as follows:
| ||
| ||
| ||
15. Stock
| ||||
16. Debtors
| ||||
| ||||
| ||||
| ||||
| ||||
AMC Global Group Limited
Notes to the consolidated financial statements for the year ended 30 April 2011 (continued)
17. Current asset investments
| ||||
Current asset investments comprise of deposit investments with a market value at 30 April 2011 of £603,170.
18. Creditors: amounts falling due within one year
Group 2011 | Company 2011 | |||||||
| £ | £ | |||||||
| ||||||||
Trade creditors | 1,304,986 | — | ||||||
Payments on account on contracts | 192,860 | — | ||||||
Amounts owed to Group undertakings | — | 1,845,419 | ||||||
Corporation tax | 966,709 | — | ||||||
Other taxation and social security | 88,992 | — | ||||||
Other creditors | 9,082 | — | ||||||
Accruals and deferred income | 23,725 | — | ||||||
|
|
|
| |||||
| 2,586,354 | 1,845,419 | |||||||
| ||||||||
Amounts owed by Group undertakings are unsecured, have no fixed date of repayment and are repayable on demand.
19. Provisions for liabilities
The liability for deferred taxation is analysed below:
| ||||
The movement on the deferred tax liability is as follows:
| ||||
| ||||
| ||||
AMC Global Group Limited
Notes to the consolidated financial statements for the year ended 30 April 2011 (continued)
20. Pension and other post-retirement benefit commitments
The Group made the following contributions to defined contribution pension schemes:
| ||||
21. Share capital
| ||||
| ||||
| ||||
The Preference shares do not entitle the holders to any dividends and have no set redemption date.
Preference shareholders are not entitled to attend or vote at any general meetings of the Company.
On a distribution of the Company assets, Preference shareholders are to be repaid £1 for each Preference share held. Any surplus remaining is to be distributed among the Ordinary shareholders.
22. Profit and loss account
Group 2011 | Company 2011 | |||||||
| £ | £ | |||||||
| ||||||||
At 1 May | 4,276,879 | 760,598 | ||||||
Retained profit/(loss) for the year (note 23) | 3,573,875 | (72,801 | ) | |||||
|
| |||||||
At 30 April | 7,850,754 | 687,797 | ||||||
| ||||||||
23. Reconciliation of movements in shareholders’ funds
Group 2011 | Company 2011 | |||||||
| £ | £ | |||||||
| ||||||||
Profit/(loss) for the financial year | 3,636,375 | (10,301 | ) | |||||
Dividends | (62,500 | ) | (62,500 | ) | ||||
|
| |||||||
Retained profit/(loss) for the financial year | 3,573,875 | (72,801 | ) | |||||
|
| |||||||
Net addition/(reduction) to shareholder’s funds | 3,573,875 | (72,801 | ) | |||||
|
| |||||||
Closing shareholders funds | 10,400,754 | 3,237,797 | ||||||
| ||||||||
AMC Global Group Limited
Notes to the consolidated financial statements for the year ended 30 April 2011 (continued)
24. Net cash inflow from operating activities
| ||||
| ||||
| ||||
| ||||
| ||||
| ||||
| ||||
25. Related party transactions
During the year the Group repaid £752,845 of loan notes to Kerry Polson, the wife of director, Andrew Polson. At 30 April 2011 the amount of loan notes outstanding was £nil. During the year interest of £15,011 was charged on the loan notes at 4% over base rate
The Company has taken advantage of the exemptions in FRS 8 not to disclose related party transactions with entities that are part of the Group headed by AMC Global Group Limited.
26. Operating lease commitments
At 30 April 2011 the Group was committed to making the following payments under non-cancellable operating leases:
| ||||
| ||||
27. Ultimate controlling party
During the financial year the Group was controlled by its director, Andrew Polson, by virtue of the fact that he owns the majority of the issued Ordinary share capital of the Company.
On 1 July 2011 the Company was acquired by Forum Energy Technologies Inc.
From 1 July 2011 the ultimate parent undertaking and controlling party is Forum Energy Technologies Inc. (formerly Forum Oilfield Technologies Inc.), a Company incorporated in United States of America.
Financial statements
For the year ended 31 May 2011
Contents
| ||||
| ||||
Report of independent registered public accounting firm to the member of P-Quip Limited
In our opinion, the accompanying balance sheet and the related profit and loss account and cash flow statement present fairly, in all material respects, the financial position of P-Quip Limited at 31 May 2011, and the results of its operations and its cash flows for the year ended 31 May 2011 in conformity with accounting principles generally accepted in the United Kingdom. These financial statements are the responsibility of the Company’s management. Our responsibility is to express an opinion on these financial statements based on our audit. We conducted our audit of these statements in accordance with the standards of the Public Company Accounting Oversight Board (United States). Those standards require that we plan and perform the audit to obtain reasonable assurance about whether the financial statements are free of material misstatement. An audit includes examining, on a test basis, evidence supporting the amounts and disclosures in the financial statements, assessing the accounting principles used and significant estimates made by management, and evaluating the overall financial statement presentation. We believe that our audit provides a reasonable basis for our opinion.
Accounting principles generally accepted in the United Kingdom vary in certain significant respects from accounting principles generally accepted in the United States of America. Information relating to the nature of such differences is presented in note 2 to the financial statements.
/s/ PricewaterhouseCoopers LLP
Aberdeen, United Kingdom
August 31, 2011
Profit and loss account for the year ended 31 May 2011
| 2011 | ||||||||
| Note | £ | |||||||
| ||||||||
Turnover | 3 | 9,097,357 | ||||||
Cost of sales | (4,659,977 | ) | ||||||
|
| |||||||
Gross profit | 4,437,380 | |||||||
Administrative expenses | (1,121,508 | ) | ||||||
|
| |||||||
Operating profit | 4 | 3,315,872 | ||||||
Interest receivable and similar income | 7 | 7,649 | ||||||
Interest payable and similar charges | 8 | (2,442 | ) | |||||
|
| |||||||
Profit on ordinary activities before taxation | 3,321,079 | |||||||
Tax on profit on ordinary activities | 9 | (578,534 | ) | |||||
|
| |||||||
Profit for the financial year | 20 | 2,742,545 | ||||||
| ||||||||
All amounts relate to continuing operations.
There were no recognised gains and losses other than those included in the profit and loss account above.
There is no difference between the profit on ordinary activities before taxation and the profit for the year above and their historical cost equivalents.
The accompanying notes are an integral part of these financial statements.
Balance sheet as at 31 May 2011
| 2011 | ||||||||
| Note | £ | |||||||
| ||||||||
Fixed assets | ||||||||
Tangible assets | 11 | 73,033 | ||||||
|
| |||||||
Current assets | ||||||||
Stock | 12 | 2,947,496 | ||||||
Debtors | 13 | 5,518,157 | ||||||
Cash at bank and in hand | 965,549 | |||||||
|
| |||||||
| 9,431,202 | ||||||||
Creditors: amounts falling due within one year | 14 | (2,946,836 | ) | |||||
|
| |||||||
Net current assets | 6,484,366 | |||||||
|
| |||||||
Total assets less current liabilities | 6,557,399 | |||||||
|
| |||||||
Creditors: amounts falling due after more than one year | 15 | (19,937 | ) | |||||
|
| |||||||
Net assets | 6,537,462 | |||||||
|
| |||||||
Capital and reserves | ||||||||
Called up share capital | 18 | 33,215 | ||||||
Profit and loss account | 19 | 6,504,247 | ||||||
|
| |||||||
Total shareholder’s funds | 20 | 6,537,462 | ||||||
| ||||||||
The financial statements on pages F-135 to F-148 were approved by the board of directors on August 31, 2011 and were signed on its behalf by:
| ||||
P-Quip Limited
Registered no. SC046702
Cash flow statement for the year ended 31 May 2011
| 2011 | ||||||||||||
| Note | £ | £ | ||||||||||
| ||||||||||||
Net cash inflow from operating activities | 21 | 3,501,799 | ||||||||||
|
| |||||||||||
Returns on investments and servicing of finance | ||||||||||||
Interest received | 7 | 7,649 | ||||||||||
Interest paid | 8 | (2,442 | ) | |||||||||
|
| |||||||||||
Net cash inflow from returns on investments and servicing of finance | 5,207 | |||||||||||
Taxation | (543,712 | ) | ||||||||||
Capital expenditure and financial investment | ||||||||||||
Purchase of tangible fixed assets | 11 | (5,132 | ) | |||||||||
|
| |||||||||||
Net cash (outflow) for capital and financial investment | (5,132 | ) | ||||||||||
Equity dividends paid to shareholders | 10 | (3,500,000 | ) | |||||||||
|
| |||||||||||
Net cash outflow before use of liquid resources and financing | (541,838 | ) | ||||||||||
Financing | ||||||||||||
Capital element of hire purchase contracts | (16,958 | ) | ||||||||||
|
| |||||||||||
Net cash outflow from financing | (16,958 | ) | ||||||||||
|
| |||||||||||
Decrease in net cash | (558,796 | ) | ||||||||||
|
| |||||||||||
Reconciliation to net (debt)/cash | ||||||||||||
Net cash at 1 June | 1,498,594 | |||||||||||
Decrease in net cash | (558,796 | ) | ||||||||||
Movement in borrowings | 16,958 | |||||||||||
Other non-cash changes | (25,300 | ) | ||||||||||
|
| |||||||||||
Net cash at 31 May | 931,456 | |||||||||||
| ||||||||||||
Notes to the financial statements for the year ended 31 May 2011
1. Business activities
The principal activity of the company is the design, supply, manufacture, installation and commissioning of proprietary mud pump fluid end assemblies for the oil industry. P-Quip’s products include mud pump rod systems, a liner retention system, valve cover retention systems, discharge strainer systems, valve seat pulling jack, special mud pump pistons, an automatic self- supporting mud bucket and a washpipe system. These products are sold to drilling contractors and mud pump manufacturers.
2. Accounting policies
(a) UK GAAP accounting policies
Accounting convention
These financial statements are prepared on a going concern basis, under the historical cost convention and in accordance with the Companies Act 2006 and applicable accounting standards in the United Kingdom. The principal accounting policies are set out below:
Turnover
Turnover arising from the sale of goods is recognised once substantially all the risks and rewards of ownership of the goods are transferred to the customer. Typically this will be upon shipment of goods, but will depend on factors such as insurance arrangements for goods in transit, where if all risks of ownership are not deemed to have passed then revenues are deferred until risk is deemed transferred to the customer.
Tangible fixed assets and depreciation
Tangible fixed assets are stated at cost less depreciation. Cost includes the original purchase price of the asset and the costs attributable to bringing the asset to its working condition for its intended use. Depreciation is provided at the following annual rates in order to write off each asset over its estimated useful life or, if held under a finance lease, over the lease term, whichever is shorter:
| ||||
| ||||
| ||||
| ||||
| ||||
Hire purchase and leasing commitments
Assets obtained under hire purchase contracts are capitalised in the balance sheet. Those held under hire purchase contracts are depreciated over their estimated useful lives.
P-Quip Limited
Notes to the financial statements for the year ended 31 May 2011 (continued)
The interest element of these obligations is charged to the profit and loss account over the relevant period. The capital element of the future payments is treated as a liability.
Rentals paid under operating leases are charged to the profit and loss account on a straight line basis over the period of the lease.
Benefits received and receivable as an incentive to sign an operating lease are recognised on a straight line basis over the period until the date the rent is expected to be adjusted to the prevailing market rate.
Stocks
Stocks are valued at the lower of cost and net realisable value after making due allowance for obsolete and slow-moving stocks. Cost includes all direct costs and an appropriate proportion of fixed and variable overheads.
Taxation
Corporation tax is provided on the assessable profits of the company at the appropriate rates in force.
Deferred tax is recognised in respect of all timing differences that have originated but not reversed at the balance sheet date where transactions or events that result in an obligation to pay more tax or a right to pay less tax in the future have occurred at the balance sheet date. Timing differences are differences between the company’s taxable profits and its results as stated in the financial statements. Deferred tax is measured at average tax rates that are expected to apply in the years in which the timing differences are expected to reverse, based on tax rates and laws that have been enacted or substantially enacted by the balance sheet date. Deferred tax assets and tax debtors arising from withholding tax credits are recognised to the extent that they are more likely than not to be recoverable. Deferred tax is measured on a non-discounted basis. Deferred tax assets are recognised to the extent that it is regarded as more likely than not that they will be recovered. Deferred tax assets and liabilities are not discounted.
Foreign currencies
The functional and presentational currency of the company is Pounds Sterling.
Transactions in foreign currencies are recorded at the date ruling at the date of the transaction. Monetary assets and liabilities denominated in foreign currencies are retranslated at the rate of exchange ruling at the balance sheet date. All differences are taken to the profit and loss account.
P-Quip Limited
Notes to the financial statements for the year ended 31 May 2011 (continued)
Pensions
The company operates a defined contribution scheme. The assets of the scheme are held separately from those of the company in an independently administered fund. Contributions payable for the period are charged in the profit and loss account in the period to which they relate.
(b) Principal differences to US GAAP
The financial statements have been prepared in accordance with accounting principles generally accepted in the United Kingdom (‘UK GAAP”). Such principles differ in certain significant respects from generally accepted accounting principles in the United States (‘US GAAP’). A summary of principal differences applicable to the company are set out below.
Deferred income taxes
Under UK GAAP, deferred taxation is provided in full on all material timing differences. Deferred tax assets are recognized where their recovery is considered more likely than not. US GAAP requires deferred taxation to be provided in full, using the liability method. In addition, US GAAP requires the recognition of the deferred tax consequences of differences between the assigned values and the tax bases of the identifiable intangible assets, with the exception of non tax-deductible goodwill, in a purchase business combination. Consequently, a deferred tax liability attributable to identifiable intangible assets will be recognized and amortized over the useful economic lives of the underlying intangible assets.
Statement of cash flows
The statement of cash flows under UK GAAP is prepared in accordance with FRS 1 (revised) and presents substantially the same information as that required under US GAAP. Under US GAAP, however, there are certain differences from UK GAAP with regard to the classification of items within the cash flow statement and with regard to the definition of cash and cash equivalents.
Financial statement presentation
The format and presentation of the balance sheet, income statement and statement of cash flows under UK GAAP differs from that under US GAAP.
3. Turnover
In the opinion of the directors it would be seriously prejudicial to disclose segmental information by class of business or by geographical markets.
P-Quip Limited
Notes to the financial statements for the year ended 31 May 2011 (continued)
4. Operating profit
| ||||
| ||||
| ||||
| ||||
| ||||
| ||||
| ||||
| ||||
| ||||
| ||||
5. Staff costs
Staff costs, including directors’ remuneration, were as follows:
| ||||
| ||||
| ||||
| ||||
The average monthly number of employees, including directors, during the year was as follows:
| ||||
| ||||
| ||||
6. Directors’ remuneration
| ||||
| ||||
| ||||
During the year retirement benefits were accruing to 1 director in respect of defined contribution pension schemes.
The amounts above relate to the emoluments of the highest paid director.
P-Quip Limited
Notes to the financial statements for the year ended 31 May 2011 (continued)
7. Interest receivable and similar income
| ||||
| ||||
8. Interest payable and similar charges
| ||||
| ||||
| ||||
9. Taxation
(a) Analysis of tax charge in the year
| ||||
| ||||
| ||||
| ||||
| ||||
| ||||
| ||||
| ||||
| ||||
| ||||
P-Quip Limited
Notes to the financial statements for the year ended 31 May 2011 (continued)
(b) Factors affecting tax charge for the year
The tax assessed for the year is lower than the standard rate of corporation tax in the UK of 27.67% (2010: 28%). The differences are explained below:
| ||||
| ||||
| ||||
| ||||
| ||||
| ||||
| ||||
| ||||
| ||||
| ||||
(c) Factors that may affect future tax charges
The UK substantively enacted on 20 July 2010 an amendment to the corporation tax rate from 28% to 27% effective from 1 April 2011. Further reductions to the UK corporation tax rate were announced in the March 2011 Government Budget. The changes propose to reduce the corporation tax rate to 26% on 1 April 2011 and reduce the rate by 1% per annum thereafter to 23% by 1 April 2014. The reduction of the main corporation tax rate to 26% was substantively enacted on 29 March 2011. The reduction to 25% from April 2012 was substantively enacted on 5 July 2011. The changes to the tax rates do not have a material impact on these financial statements.
P-Quip Limited
Notes to the financial statements for the year ended 31 May 2011 (continued)
10. Dividends
| ||||
| ||||
11. Tangible fixed assets
Freehold £ | Plant and £ | Motor £ | Fixtures & £ | Computer £ | Total £ | |||||||||||||||||||
| ||||||||||||||||||||||||
Cost | ||||||||||||||||||||||||
At 1 June 2010 | 8,381 | 13,322 | 84,712 | 22,606 | 5,712 | 134,733 | ||||||||||||||||||
Additions | — | — | 25,300 | 4,540 | 592 | 30,432 | ||||||||||||||||||
|
| |||||||||||||||||||||||
At 31 May 2011 | 8,381 | 13,322 | 110,012 | 27,146 | 6,304 | 165,165 | ||||||||||||||||||
|
| |||||||||||||||||||||||
Depreciation | ||||||||||||||||||||||||
At 1 June 2010 | 3,562 | 9,675 | 33,862 | 14,120 | 3,717 | 64,936 | ||||||||||||||||||
Charge for year | 838 | 2,043 | 20,715 | 2,753 | 847 | 27,196 | ||||||||||||||||||
|
| |||||||||||||||||||||||
At 31 May 2011 | 4,400 | 11,718 | 54,577 | 16,873 | 4,564 | 92,132 | ||||||||||||||||||
|
| |||||||||||||||||||||||
Net book value | ||||||||||||||||||||||||
At 31 May 2011 | 3,981 | 1,604 | 55,435 | 10,273 | 1,740 | 73,033 | ||||||||||||||||||
| ||||||||||||||||||||||||
The net book value of assets held under finance leases or hire purchase contracts, included above, are as follows:
| ||||
| ||||
| ||||
| ||||
12. Stock
| ||||
| ||||
P-Quip Limited
Notes to the financial statements for the year ended 31 May 2011 (continued)
13. Debtors
| ||||
| ||||
| ||||
| ||||
| ||||
| ||||
Amounts owed by group undertakings are unsecured, interest free, have no fixed date of repayment and are repayable on demand.
14. Creditors: amounts falling due within one year
| ||||
| ||||
| ||||
| ||||
| ||||
| ||||
Amounts owed to group undertakings are unsecured, interest free, have no fixed date of repayment and are repayable on demand.
15. Creditors: amounts falling due after more than one year
| ||||
| ||||
16. Security
The bank holds a bond and floating charge over all the assets of the company.
The bank held a cross corporate guarantee between KLS Holdings Ltd, Lothian Steel Services Ltd, Ecosteel Ltd, P-Quip Ltd & Bridgeforth Engineering Ltd and third party.
The bank held standard security over 19/23 Bellknowes Industrial Estate, which was granted by KLS Holdings Limited.
P-Quip Limited
Notes to the financial statements for the year ended 31 May 2011 (continued)
Both the cross corporate guarantee and the standard security was removed following the acquisition of P-Quip Ltd by Forum Energy Technologies (UK) Ltd, on 5th July 2011.
17. Deferred tax asset
| ||||
| ||||
| ||||
| ||||
The deferred tax asset is made up as follows:
| ||||
| ||||
| ||||
18. Share Capital
| ||||
| ||||
| ||||
| ||||
| ||||
19. Profit and loss account
| ||||
| ||||
| ||||
| ||||
P-Quip Limited
Notes to the financial statements for the year ended 31 May 2011 (continued)
20. Reconciliation of movement in shareholder’s funds
| ||||
| ||||
| ||||
| ||||
| ||||
| ||||
21. Cash flow from operating activities
| ||||
| ||||
| ||||
| ||||
| ||||
| ||||
| ||||
| ||||
22. Pension commitments
Contributions made by the company to defined contribution pension schemes amounted to £20,298. There were no pension contributions outstanding at the year end.
23. Operating lease commitments
|
| |||||||
| ||||||||
| ||||||||
| ||||||||
24. Ultimate parent undertaking and controlling party
During the financial year the ultimate parent company was KLS (Holdings) Limited, a company incorporated in Scotland. This is the parent undertaking of the smallest and largest group to consolidate these financial statements.
P-Quip Limited
Notes to the financial statements for the year ended 31 May 2011 (continued)
The company has taken advantage of the exemptions in FRS 8 not to disclose related party transactions with entities that are part of the group headed by KLS (Holdings) Limited.
On 5 July 2011 the company was acquired by Forum Energy Technologies (UK) Limited.
From 5 July 2011, the ultimate parent undertaking and controlling party is Forum Energy Technologies Inc. (formerly Forum Oilfield Technologies Inc.), a company incorporated in United States of America.
Cannon Services, Ltd. financial statements
for the year ended December 31, 2010
Index
| ||||
Report of independent registered public accounting firm
To the Partners of
Cannon Services, Ltd.
In our opinion, the accompanying balance sheet and the related statements of income, of changes in partners’ capital and of cash flows, present fairly, in all material respects, the financial position of Cannon Services, Ltd. at December 31, 2010 and the results of its operations and its cash flows for the year then ended in conformity with accounting principles generally accepted in the United States of America. These financial statements are the responsibility of the Company’s management. Our responsibility is to express an opinion on these financial statements based on our audit. We conducted our audit of these statements in accordance with the standards of the Public Company Accounting Oversight Board (United States). Those standards require that we plan and perform the audit to obtain reasonable assurance about whether the financial statements are free of material misstatement. An audit includes examining, on a test basis, evidence supporting the amounts and disclosures in the financial statements, assessing the accounting principles used and significant estimates made by management, and evaluating the overall financial statement presentation. We believe that our audit provides a reasonable basis for our opinion.
/s/ PricewaterhouseCoopers LLP
Houston, Texas
August 19, 2011
Balance sheet
December 31, 2010
(in thousands)
Assets | ||||
Current assets | ||||
Cash and cash equivalents | $ | 1,346 | ||
Accounts receivable, net | 5,221 | |||
Inventories | 4,920 | |||
Prepaid expenses and other current assets | 127 | |||
|
| |||
Total current assets | 11,614 | |||
Property and equipment, net | 457 | |||
|
| |||
Total assets | $ | 12,071 | ||
|
| |||
Liabilities and Partners’ Capital | ||||
Current liabilities | ||||
Accounts payable | $ | 397 | ||
Accrued expenses and other payables | 420 | |||
|
| |||
Total current liabilities | 817 | |||
Commitments and contingencies (Note 6) | ||||
Partners’ Capital | 11,254 | |||
|
| |||
Total liabilities and partners’ capital | $ | 12,071 | ||
| ||||
The accompanying notes are an integral part of this financial statements.
Statement of income
Year ended December 31, 2010
(in thousands)
Product sales | $ | 29,684 | ||
Cost of sales | 16,039 | |||
|
| |||
Gross profit | 13,645 | |||
Selling, general and administrative expenses | 5,869 | |||
|
| |||
Income from operations | 7,776 | |||
Other income | 38 | |||
|
| |||
Net income | $ | 7,814 | ||
| ||||
The accompanying notes are an integral part of this financial statements.
Statement of changes in partners’ capital
December 31, 2010
(in thousands)
| Total partners’ capital | ||||
| ||||
Balance at December 31, 2009 | $ | 8,585 | ||
Distributions to partners | (5,145 | ) | ||
Net income | 7,814 | |||
|
| |||
Balance at December 31, 2010 | $ | 11,254 | ||
| ||||
The accompanying notes are an integral part of this financial statements.
Statement of cash flows
December 31, 2010
(in thousands)
Cash flow from operating activities | ||||
Net income | $ | 7,814 | ||
Adjustments to reconcile net income to net cash provided by operating activities | ||||
Bad debt expense | 19 | |||
Depreciation of property and equipment | 165 | |||
Changes in operating assets and liabilities | ||||
Accounts receivable (increase) | (2,264 | ) | ||
Inventories (increase) | (1,626 | ) | ||
Prepaid expenses and other current assets (increase) | (24 | ) | ||
Accounts payable and accrued expenses (decrease) | (131 | ) | ||
|
| |||
Net cash provided in operating activities | 3,953 | |||
|
| |||
Cash flow from investing activities | ||||
Purchase of property, plant and equipment | (232 | ) | ||
|
| |||
Net cash used in investing activities | (232 | ) | ||
|
| |||
Cash flow from financing activities | ||||
Distributions to partners | (5,145 | ) | ||
|
| |||
Net cash used in financing activities | (5,145 | ) | ||
|
| |||
Net decrease in cash | (1,424 | ) | ||
Cash and cash equivalents | ||||
Beginning of period | 2,770 | |||
|
| |||
End of period | $ | 1,346 | ||
| ||||
The accompanying notes are an integral part of this financial statements.
Notes to financial statements
December 31, 2010
(in thousands)
1. Description of business and organization
Cannon Services, Ltd. (the “Company”), was formed in 1986 and converted to a limited partnership in the State of Texas in January 2001. The Company manufactures and supplies protection systems for downhole completion control lines and cables. Products include protectors for ESP cable, TEC lines, gauges, control lines, intelligent well flat packs, sub-sea umbilicals and fiber optics. The Company has facilities in Stafford Texas. The accompanying financial statements and related footnotes are presented in accordance with accounting principles generally accepted in the United States of America (“GAAP”).
2. Significant accounting policies
Cash and cash equivalents
Cash and cash equivalents include cash on hand and all highly liquid investments with original maturities of three months or less.
Revenue recognition
The Company recognizes revenue from its product sales when persuasive evidence of an arrangement exists, performance has occurred, collection is reasonably assured, the sale price is fixed and determinable, and the transfer of risk of loss for products shipped has occurred.
Accounts receivable
The Company extends credit to customers in the normal course of business. The Company estimates its bad debt exposure based upon the age of its accounts receivable balances each period and records a bad debt provision for accounts receivable that the Company believes it may not collect in full.
Concentration of credit risk
The majority of the Company’s customers operate in the oil and gas industry. While current energy prices are important contributors to positive cash flow for the customers, expectations about future prices and price volatility are generally more important for determining future spending levels. Any prolonged increase or decrease in oil and natural gas prices affects the levels of exploration, development and production activity as well as the entire health of the oil and natural gas industry, and can therefore negatively impact spending by Company’s customers.
Revenue for the year ended December 31, 2010 includes sales to 3 customers that each individually represented more than 10% of total revenue. These customers accounted for 40% of revenue for the year ended December 31, 2010. Accounts receivable from these customers totaled 58% of accounts receivable at December 31, 2010.
Cannon Services, Ltd.
Notes to financial statements
December 31, 2010 (continued)
(in thousands)
The Company maintains its cash balances at one financial institution. The Federal Deposit Insurance Corporation insures account balances up to $250 thousand, and they have offered unlimited coverage for noninterest bearing accounts at participating FDIC insured institutions through June 30, 2012. The Company’s financial institution participates in this program. The Company does not believe that it is exposed to any significant credit risk on any uninsured amounts.
Inventories
Inventories are stated at the lower of cost or market, cost being determined on an average cost basis. The Company reviews its inventory balances and writes down its inventory for estimated obsolescence or excess inventory equal to the difference between the cost of inventory and the estimated market value based upon assumptions about future demand and market conditions. There was no reserve recorded for inventory on hand at December 31, 2010.
Concentration of supplier risk
Purchases during the year ended December 31, 2010 include purchases from one supplier that represented 91% of total inventory purchases. The Company’s accounts payable to this vendor totaled 62% of total accounts payable at December 31, 2010.
Property and equipment
Property and equipment are recorded at cost. The costs of major renewals and betterments are capitalized; repair and maintenance costs are expensed as incurred. When assets are sold or retired, the cost and related accumulated depreciation are removed from the appropriate accounts, and the resulting gain or loss is included in current income.
Depreciation of property and equipment is computed principally using the straight-line basis over the estimated useful lives of the assets as set forth below:
| ||||
| ||||
| ||||
| ||||
Impairment of Long-lived assets
Long-lived assets held and used by the Company are reviewed for impairment whenever events or changes in circumstances indicate that the carrying amount of an asset may not be recoverable. For purposes of evaluating the recoverability of long-lived assets, the recoverability test is performed using undiscounted future net cash flows of assets grouped at the lowest level
Cannon Services, Ltd.
Notes to financial statements
December 31, 2010 (continued)
(in thousands)
for which there are identifiable cash flows that are independent of the cash flows of other groups of assets. If the undiscounted future net cash flows are less than the carrying amount of the asset, the asset is deemed impaired. The amount of the impairment is measured as the difference between carrying value and the fair value of the asset.
Income taxes
As a limited partnership, provision for income taxes is not made in the Company’s accounts since such taxes are the responsibility of the individual members. Further, the partners’ capital account reflected in the accompanying balance sheet differs from amounts reported in the partners’ income tax returns because of differences in the timing of certain expense and revenue items for financial and tax reporting purposes.
Use of estimates
The preparation of the financial statements in conformity with accounting principles generally accepted in the United States of America requires management to make estimates and assumptions that affect the reported amounts of assets and liabilities and disclosure of contingent assets and liabilities at the date of the consolidated financial statements and the reported amounts of revenues and expenses during the reporting period. Accordingly, actual results could differ from these estimates.
3. Property and equipment
The following is a summary of property and equipment at December 31, 2010:
Machinery and equipment | $ | 451 | ||
Furniture, fixtures and computers and software | 144 | |||
Tooling | 929 | |||
Less: Accumulated depreciation | (1,067 | ) | ||
|
| |||
| $ | 457 | |||
| ||||
Depreciation expense was $165 thousand for the year ended December 31, 2010.
4. Accrued expenses
The following is a summary of accrued expenses at December 31, 2010:
Payroll | $ | 146 | ||
Commissions payable | 237 | |||
Other | 37 | |||
|
| |||
| $ | 420 | |||
| ||||
Cannon Services, Ltd.
Notes to financial statements
December 31, 2010 (continued)
(in thousands)
5. Commitments and contingencies
The Company rents its facilities from a company affiliated through common ownership (See note 6). Future minimum payments due under this agreement at December 31, 2010 are as follows:
2011 | $ | 395 | ||
2012 | 415 | |||
2013 | 176 | |||
2014 | — | |||
2015 | — | |||
|
| |||
| $ | 986 | |||
| ||||
6. Related party transactions
The Company rents its facilities from a company affiliated through common ownership. Rent expense for the year ended December 31, 2010 was $384 thousand. The Company pays a 5 percent royalty to a partner based upon annual product sales. The total royalty expense for the year ended December 31, 2010 was $1.455 million.
7. Subsequent events
On July 1, 2011 Forum Energy Technologies Inc., through one of its subsidiaries, purchased 100% of the partnership interests of Cannon Services, Ltd. Forum Energy Technologies is a global oilfield products Company, serving the drilling, subsea, completion, production and process sectors of the oil and natural gas industry.
Events occurring after December 31, 2010 were evaluated as of the date that this report was made available to be issued, to ensure any subsequent events that meet the criteria for recognition and/or disclosure in this report have been identified.
Cannon Services, Ltd. Financial statements
for the six months ended June 30, 2010 and June 30, 2011
Index
| ||||
Condensed balance sheets (unaudited)
(in thousands)
| December 31, 2010 | June 30, 2011 | |||||||
| ||||||||
Assets | ||||||||
Current assets | ||||||||
Cash and cash equivalents | $ | 1,346 | $ | 1,640 | ||||
Accounts receivable, net | 5,221 | 3,452 | ||||||
Inventories | 4,920 | 5,537 | ||||||
Prepaid expenses and other current assets | 127 | 1,125 | ||||||
|
| |||||||
Total current assets | 11,614 | 11,754 | ||||||
Property, plant and equipment, net | 457 | 497 | ||||||
|
| |||||||
Total assets | $ | 12,071 | $ | 12,251 | ||||
|
| |||||||
Liabilities and Partners’ Capital | ||||||||
Current liabilities | ||||||||
Accounts payable | $ | 397 | $ | 1,178 | ||||
Accrued expenses and other payables | 420 | 560 | ||||||
|
| |||||||
Total current liabilities | 817 | 1,738 | ||||||
Commitments and contingencies (Note 5) | ||||||||
Partners’ Capital | 11,254 | 10,513 | ||||||
|
| |||||||
Total liabilities and partners’ capital | $ | 12,071 | $ | 12,251 | ||||
| ||||||||
The accompanying notes are an integral part of these condensed financial statements.
Condensed statements of income (unaudited)
(in thousands)
| Six months ended June 30, | ||||||||
| 2010 | 2011 | |||||||
| ||||||||
Product sales | $ | 14,127 | $ | 13,544 | ||||
Cost of sales | 7,661 | 5,633 | ||||||
|
| |||||||
Gross profit | 6,466 | 7,911 | ||||||
Selling, general and administrative expenses | 2,117 | 3,472 | ||||||
|
| |||||||
Income from operations | 4,349 | 4,439 | ||||||
Other income | 2 | — | ||||||
|
| |||||||
Net income | $ | 4,351 | $ | 4,439 | ||||
| ||||||||
The accompanying notes are an integral part of these condensed financial statements.
Condensed statements of cash flows (unaudited)
(in thousands)
| Six months ended June 30, | ||||||||
| 2010 | 2011 | |||||||
| ||||||||
Cash flow from operating activities | ||||||||
Net income | $ | 4,351 | $ | 4,439 | ||||
Adjustments to reconcile net income to net cash provided by operating activities | ||||||||
Depreciation of property and equipment | 84 | 80 | ||||||
Changes in operating assets and liabilities | ||||||||
Accounts receivable (increase) decrease | (2,444 | ) | 1,769 | |||||
Inventories (increase) | (1,006 | ) | (617 | ) | ||||
Prepaid expenses and other current assets (increase) decrease | 78 | (998 | ) | |||||
Accounts payable and accrued expenses increase | 1,114 | 921 | ||||||
|
| |||||||
Net cash provided by operating activities | 2,177 | 5,594 | ||||||
|
| |||||||
Cash flow from investing activities | ||||||||
Purchase of property and equipment | (64 | ) | (120 | ) | ||||
|
| |||||||
Net cash used in investing activities | (64 | ) | (120 | ) | ||||
|
| |||||||
Cash flow from financing activities | ||||||||
Distributions to partners | (1,795 | ) | (5,180 | ) | ||||
|
| |||||||
Net cash used in financing activities | (1,795 | ) | (5,180 | ) | ||||
|
| |||||||
Net increase in cash | 318 | 294 | ||||||
Cash and cash equivalents | ||||||||
Beginning of period | 2,771 | 1,346 | ||||||
|
| |||||||
End of period | $ | 3,089 | $ | 1,640 | ||||
| ||||||||
The accompanying notes are an integral part of these condensed financial statements.
Notes to condensed financial statements (unaudited)
(in thousands)
1. Description of business and organization
Cannon Services, Ltd (the “Company”), was formed in 1986 and was converted to a limited partnership in the State of Texas in January 2001. The Company manufactures and supplies protection systems for downhole completion control lines and cables. Products include protectors for ESP cable, TEC lines, gauges, control lines, intelligent well flat packs, sub-sea umbilicals and fiber optics. The Company has facilities in Stafford Texas. The accompanying financial statements and related footnotes are presented in accordance with accounting principles generally accepted in the United States of America (“GAAP”).
Basis of presentation
The condensed balance sheet of the Company at December 31, 2010 was derived from the Company’s audited financial statements as of that date, but does not include all disclosures required by accounting principles generally accepted in the United States of America. The condensed balance sheet at June 30, 2011, the condensed statements of income for the six month periods ended June 30, 2011 and June 30, 2010, respectively, and the condensed statements of cash flows for the six month periods ended June 30, 2011 and June 30, 2010, respectively, were prepared by the Company.
In the opinion of Company management, all adjustments, consisting of normal recurring adjustments, necessary to state fairly the financial position, results of operations and cash flows were recorded. The results of operations for the six month period ended June 30, 2011 are not necessarily indicative of the operating results for a full year or of future operations.
Certain information and footnote disclosures normally included in financial statements presented in accordance with accounting principles generally accepted in the United States of America have been condensed or omitted. The accompanying condensed financial statements should be read in conjunction with the financial statements and notes thereto contained in the Company’s financial statements for the year ended December 31, 2010.
2. Commitments and contingencies
The Company rents its facilities from a company affiliated through common ownership. Future minimum payments due under this agreement at June 30, 2011 are as follows:
2011 | $ | 201 | ||
2012 | 415 | |||
2013 | 176 | |||
2014 | — | |||
2015 | — | |||
|
| |||
| $ | 792 | |||
| ||||
Cannon Services, Ltd.
Notes to condensed financial statements (unaudited) (continued)
(in thousands)
3. Related party transactions
The Company rents its facilities from a company affiliated through common ownership (Note 2).
The Company owes a 5 percent royalty to a partner based on sales. Total royalty expense for the six month periods ended June 30, 2010 and 2011 were $350 thousand and $661 thousand, respectively. On July 1, 2011 the Company purchased the patents underlying the above described royalty agreement and cancelled the royalty agreement in exchange for $1.0 million. This payment was made in June 2011 and is included in prepaid expenses and other current assets on the accompanying balance sheet at June 30, 2011.
4. Subsequent events
On July 1, 2011 Forum Energy Technologies Inc., through one of its subsidiaries, purchased 100% of the stock of Cannon Services, Ltd. Forum Energy Technologies is a global oilfield products Company, serving the drilling, subsea, completion, production and process sectors of the oil and natural gas industry.
Events occurring after June 30, 2011 were evaluated as the date these financial statements were made available to be issued, to ensure any subsequent events that meet the criteria for recognition and/or disclosure in this report have been identified.
Selected industry terms
The following industry terms defined in this section are used throughout this prospectus:
Bbl. One stock tank barrel of 42 U.S. gallons liquid volume, used herein in reference to crude oil, condensate or natural gas liquids.
Blowout preventer (BOP). A large valve at the top of a well that may be closed to regain control of a reservoir if the drilling crew or other wellsite personnel lose control of formation fluids.
Bottomhole assembly. The lower end of a drill string composed of specialized components including the drill bit.
Casing. Large-diameter pipe lowered into an openhole wellbore and cemented in place.
Catwalk. The ramp at the side of the drilling rig where tubulars are laid to be lifted to the drill floor.
Choke. A device incorporating an orifice that is used to control fluid flow rate or downstream system pressure.
Coiled tubing. A long, continuous length of pipe wound on a spool. The pipe is straightened prior to pushing into a wellbore and recoiled to spool the pipe back onto the transport and storage spool.
Drilling rig. The machine used to drill a wellbore.
Drill bit. Tool attached to the bottom of a drill string that serves as the cutting or boring element used to drill the wellbore.
Drill floor. The elevated platform where the majority of activity by a drilling rig crew occurs during drilling operations, including make-up and breakout of tubulars and supervision and monitoring of the drilling process.
Drill pipe. Heavy tubular steel conduit fitted with special threaded ends called tool joints. The drill pipe connects the surface equipment with the bottomhole assembly, both to pump drilling fluid to the drill bit and to raise, lower and rotate the bottomhole assembly.
Drill string. The combination of the drillpipe and the bottomhole assembly.
Elevator. A set of clamps that grip tubulars so that the tubulars can be raised or lowered into the wellbore.
Flatpacks. A method of encapsulating downhole control lines and electrical conduit material so as to protect against damage caused by pressure or temperature.
Flow Equipment. The high pressure tubulars, piping, joints, valves, manifolds, fittings, assemblies, and other pressure control products used in the well stimulation process. Flow equipment also commonly refers to all of the pressure control products that connect the hydraulic fracturing pressure pump to the top of the well, and serves as the conduit though which the fracturing fluids travel.
Hydrocarbon. A naturally occurring organic compound comprising hydrogen and carbon. Hydrocarbons can be as simple as methane, but many are highly complex molecules, and can occur as gases, liquids or solids. Petroleum is a complex mixture of hydrocarbons. The most common hydrocarbons are natural gas, oil and coal.
Iron roughneck. Machine on drill floor used to make-up or breakout tubulars.
Landing String. A long string of drill pipe used to lower blowout preventer stacks and casing strings to the ocean floor from an offshore drilling rig.
Lease Automatic Custody Transfer (LACT) Unit. Measurement systems used in the ownership transfer of crude oil and petroleum products from the well site to trucks, pipelines or storage tanks.
Make-up and breakout. Process of spinning and torquing when connecting and disconnecting tubulars.
Manifold. An arrangement of piping, valves and chokes designed to control, distribute and often monitor fluid flow. Manifolds are often configured for specific functions, such as a choke and kill manifold used in well-control operations and a squeeze manifold used in squeeze-cementing work.
Mcf. One thousand cubic feet of natural gas.
Mud Pump. A large reciprocating pump used to circulate the drilling fluid on a drilling rig.
Mousehole. Shallow bores under the drill floor, usually lined with pipe, in which joints of drill pipe are temporarily suspended for later connection to the drill string.
Pick-up and lay-down. Pipe handling systems that consist of truck mounted units that raise and lower tubulars to and from the drill floor. Pick-up and lay-down operations are typically conducted by specialized service company crews.
Pipe handling. Equipment used to move and connect tubulars.
Rotary table. Machine embedded into drill floor used to rotate the drill string.
Slips. Wedge-shaped pieces of metal with gripping elements that are used to hold tubulars in place or to prevent tubulars from slipping down into the wellbore.
Tongs. Large wrenches used for torquing when making-up or breaking-out tubulars.
Top Drive. Machine used to rotate the drill string by attaching to the top of the drillpipe without the use of the rotary table.
Tubing. String of pipe set inside the well casing, through which a reservoir’s oil or natural gas is produced.
Tubulars. Drill pipe, casing, tubing, or other piping placed in the wellbore.
Wellbore. The physical conduit from surface into the hydrocarbon reservoir.
Wireline. A general term used to describe well-intervention operations conducted using single-strand or multistrand wire or cable for intervention in oil or gas wells.
Definitions of categories used in revenue split analysis
Phase of well life driver. This revenue split is intended to answer the question, “What phase in the development process of oil or natural gas reserves drives the need for our product or related service?”
| • | Subsea—includes products and related services used in or directly supporting subsea operations |
| • | Drilling Capital Equipment—includes items on the rig, drill string, and items supporting drilling activities that are defined as capital equipment (see below) |
| • | Drilling Consumable Products—includes items on the rig, drill string, and items supporting drilling activities that are defined as consumable, aftermarket or rental items (see below) |
| • | Well Construction & Completion—includes items or activities downhole used to construct |
| • | Well Stimulation & Intervention—includes products or related services located on the surface that are used in the stimulation, workover or intervention processes |
| • | Production—includes |
| • | Infrastructure—includes surface infrastructure items related to or used in pre-drilling field development, pipeline operation or construction, midstream processing, refining, petrochemical processing, or in other general processing industries |
All others
Geographic exposure. This revenue split is intended to answer the question, “Where is the activity that is driving our business, when estimated by product shipment destination?”
| • | United States—includes items delivered or related services provided in the United States of America or surrounding waters |
|
Canada—includes items delivered or related services provided in Canada
| • | Europe—includes items delivered or related services provided in Europe or surrounding waters |
| • | Far East—includes items delivered or related services provided in Australasia or surrounding waters |
| • | Other—includes items delivered or related services provided everywhere else in the world |
Land versus offshore. This revenue split is intended to answer the question, “Is the activity that is driving our revenue related to land or offshore activity?”
| • | Land—includes items delivered or related services provided on land |
| • | Offshore—includes items delivered or related services provided on water |
Product Spend cycle. This revenue split is intended to answer the question, “From our customers’ perspective, what type of spending is driving our revenue?”
| • | Capital products—includes items and related services that are additive to the industry’s capacity; and/or used in major capital refurbishment or expansion projects of major processing facilities; and/or are expected to last at least 5 years. Our customers often, although not exclusively, procure these items and related services from their capital expenditure budgets. |
| • | Consumables, spare parts and aftermarket—includes items and related services that are consumed during the operation of other, often larger pieces of equipment or products; spare parts used to maintain other equipment; aftermarket service and parts used to maintain, refurbish, or recertify other equipment. Our customers often, although not always, procure these items and related services from their operating budgets. These products or related services are also often not discretionary in nature. |
| • | Rental—includes all revenue generated by products that are rented to our customers |
| • | Other—includes all items or related services that generates revenue from other types of spending |
Commodity exposure. This revenue split is intended to answer the question, “What commodity is the target of the activity that is driving demand for our products or related services?”
|
|
|
shares
Common stock
Prospectus
J.P. Morgan
BofA Merrill Lynch
Credit Suisse
Citigroup
Deutsche Bank Securities
Simmons & Company International
Tudor, Pickering, Holt & Co.
Capital One Southcoast
Dahlman Rose & Company
FBR
Howard Weil Incorporated
Johnson Rice & Company L.L.C.
, 2012
You should rely only on the information contained in this prospectus and any free writing prospectus prepared by or on behalf of us or to which we have referred you. Neither we nor the selling stockholders have authorized anyone to provide you with information different from that contained in this prospectus and any free writing prospectus. We and the selling stockholders are offering to sell shares of common stock and seeking offers to buy shares of common stock only in jurisdictions where offers and sales are permitted. The information in this prospectus is accurate only as of the date of this prospectus, regardless of the time of delivery of this prospectus or any sale of the common stock.
No action is being taken in any jurisdiction outside the United States to permit a public offering of the common stock or possession or distribution of this prospectus in that jurisdiction. Persons who come into possession of this prospectus in jurisdictions outside the United States are required to inform themselves about and to observe any restrictions as to this offering and the distribution of this prospectus applicable to that jurisdiction.
Until , 2012, all dealers that buy, sell or trade our common stock, whether or not participating in this offering, may be required to deliver a prospectus. This requirement is in addition to the dealers’ obligation to deliver a prospectus when acting as underwriters and with respect to their unsold allotments or subscriptions.
Part II
Information not required in prospectus
| Item 13. | Other expenses of issuance and distribution |
The following table sets forth an itemized statement of the amounts of all expenses (excluding underwriting discounts and commissions) payable by us in connection with the registration of the common stock offered hereby. With the exception of the Registration Fee, FINRA Filing Fee and New York Stock Exchange listing fee), the amounts set forth below are estimates. The selling stockholders will not bear any portion of such expenses.
| ||||
SEC Registration Fee | $ | 39,987 | ||
FINRA Filing Fee | $ | 35,000 | ||
New York Stock Exchange listing fee | ||||
Accountants’ fees and expenses | ||||
Legal fees and expenses | ||||
Printing and engraving expenses | ||||
Transfer agent and registrar fees | ||||
Miscellaneous | ||||
|
| |||
Total | $ | |||
| ||||
| Item 14. | Indemnification of directors and officers |
Our amended and restated certificate of incorporation will provide that a director will not be liable to the corporation or its stockholders for monetary damages to the fullest extent permitted by the DGCL. In addition, if the DGCL is amended to authorize the further elimination or limitation of the liability of directors, then the liability of a director of the corporation, in addition to the limitation on personal liability provided for in our certificate of incorporation, will be limited to the fullest extent permitted by the amended DGCL. Our amended and restated bylaws will provide that the corporation will indemnify, and advance expenses to, any officer or director to the fullest extent authorized by the DGCL.
Section 145 of the DGCL provides that a corporation may indemnify directors and officers as well as other employees and individuals against expenses, including attorneys’ fees, judgments, fines and amounts paid in settlement in connection with specified actions, suits and proceedings whether civil, criminal, administrative, or investigative, other than a derivative action by or in the right of the corporation, if they acted in good faith and in a manner they reasonably believed to be in or not opposed to the best interests of the corporation and, with respect to any criminal action or proceeding, had no reasonable cause to believe their conduct was unlawful. A similar standard is applicable in the case of derivative actions, except that indemnification extends only to expenses, including attorneys’ fees, incurred in connection with the defense or settlement of such action and the statute requires court approval before there can be any indemnification where the person seeking indemnification has been found liable to the corporation. The statute provides that it is not exclusive of other indemnification that may be granted by a corporation’s certificate of incorporation, bylaws, disinterested director vote, stockholder vote, agreement or otherwise.
II-1
Our amended and restated certificate of incorporation will also contain indemnification rights for our directors and our officers. Specifically, our amended and restated certificate of
II-1
incorporation will provide that we shall indemnify our officers and directors to the fullest extent authorized by the DGCL. Further, we may maintain insurance on behalf of our officers and directors against expense, liability or loss asserted incurred by them in their capacities as officers and directors.
We have obtained directors’ and officers’ insurance to cover our directors, officers and some of our employees for certain liabilities.
Each of our current and former directors and officers and that of Allied, Global Flow, Triton and Subsea and their respective subsidiaries, as applicable, are indemnified pursuant to an indemnification agreement and to the fullest extent possible under law against all losses pertaining to certain actions taken by them, or failures to act, while serving in those capacities before the Combination. For six years after the Combination, we will honor all rights to indemnification under our charter and that of the Allied Charter, the Global Flow Charter, the Triton LLC Agreement and the Subsea Charter, and any our indemnification agreements or that of Allied, Global Flow, Triton and Subsea existing in favor of any of our current or former directors or officers or that of Allied, Global Flow, Triton and Subsea arising from any act or omission occurring prior to the closing of the Combination. Pursuant to these proposed agreements, if an officer or director makes a claim of indemnification to us, either a majority of the independent directors or independent legal counsel selected by the independent directors must review the relevant facts and make a determination whether the officer or director has met the standards of conduct under Delaware law that would permit (under Delaware law) and require (under the indemnification agreement) us to indemnify the officer or director.
| Item 15. | Recent sales of unregistered securities. |
During the past three years, we have issued unregistered securities to a limited number of persons, as described below. None of these transactions involved any underwriters, underwriting discounts or commissions or any public offering, and we believe that each of these transactions was exempt from the registration requirements pursuant to Section 4(2) of the Securities Act, Regulation D or Regulation S promulgated thereunder or Rule 701 of the Securities Act. The recipients of these securities represented their intention to acquire the securities for investment only and not with a view to or for sale in connection with any distribution thereof, and appropriate legends were affixed to the share certificates and instruments issued in these transactions. All share and price information included in this section does not reflect the impact of the expected pre-offering split of our common stock previously described in the section titled “Stock split.”
On August 2, 2010, we completed the Combination, through which FOT, Global Flow, Triton, Allied and Subsea were combined. In the Combination, FOT became the parent company and was renamed Forum Energy Technologies, Inc., all of the outstanding shares held by each of the former Allied shareholders in Allied were acquired in exchange for 77,109 of our shares, all of the outstanding shares held by each of the former Global Flow shareholders in Global Flow were acquired in exchange for 183,321 of our shares, all of the outstanding shares held by each of the former Triton unitholders in Triton were acquired in exchange for 283,239 of our shares and all of the outstanding shares held by each of the former Subsea shareholders in Subsea were acquired in exchange for 90,761 of our shares.
II-2
The following table sets forth information on the restricted stock awards issued by us and common stock issued pursuant to the exercise of stock options in the three years preceding the filing of this registration statement.
| Person or class of person | Date of issuance/option | Total shares of restricted stock | Common stock issued pursuant to options exercises | Total consideration | Date of issuance/option | Total shares of restricted stock | Common stock issued pursuant to options/ warrants exercises | Total consideration | ||||||||||||||||||||
|
|
| ||||||||||||||||||||||||||
FOT Employee | September 30, 2008 | 300 | * | |||||||||||||||||||||||||
FOT Directors | September 15, 2009 | 1,248 | * | September 15, 2009 | 1,248 | * | ||||||||||||||||||||||
FOT Employee | December 22, 2009 | 607 | $ | 75,875 | December 22, 2009 | 607 | $ | 75,875 | ||||||||||||||||||||
FOT Employee | March 31, 2010 | 300 | * | March 31, 2010 | 300 | * | ||||||||||||||||||||||
Former Holders of Triton Management Units** | August 2, 2010 | 1,447 | * | August 2, 2010 | 1,447 | * | ||||||||||||||||||||||
FET Executive Officer | October 25, 2010 | 1,760 | * | October 25, 2010 | 1,760 | * | ||||||||||||||||||||||
FET Executive Officer | November 1, 2010 | 2,638 | * | November 1, 2010 | 2,638 | * | ||||||||||||||||||||||
FOT Director | November 17, 2010 | 500 | $ | 100,000 | November 17, 2010 | 500 | $ | 100,000 | ||||||||||||||||||||
FET Executive Officer | November 29, 2010 | 431 | * | November 29, 2010 | 431 | * | ||||||||||||||||||||||
FET Employees | March 28, 2011 | 817 | * | March 28, 2011 | 817 | * | ||||||||||||||||||||||
FET Director | March 31, 2011 | 85 | $ | 25,114 | ||||||||||||||||||||||||
FET Employee | May 18, 2011 | 500 | $ | 50,580 | May 18, 2011 | 500 | $ | 50,580 | ||||||||||||||||||||
FET Employees | May 19, 2011 | 84 | $ | 12,180 | May 19, 2011 | 84 | $ | 12,180 | ||||||||||||||||||||
FET Executive Officer | May 19, 2011 | 500 | $ | 100,000 | May 19, 2011 | 500 | $ | 100,000 | ||||||||||||||||||||
FET Employees | July 1, 2011 | 287 | * | July 1, 2011 | 287 | * | ||||||||||||||||||||||
FOT Employee | July 19, 2011 | 145 | $ | 42,525 | July 19, 2011 | 145 | $ | 42,525 | ||||||||||||||||||||
FOT Employee | August 12, 2011 | 1,897 | $ | 275,065 | August 12, 2011 | 1,897 | $ | 275,065 | ||||||||||||||||||||
FOT Employee | August 16, 2011 | 125 | $ | 28,125 | August 16, 2011 | 125 | $ | 28,125 | ||||||||||||||||||||
FOT Employee | August 17, 2011 | 50 | $ | 12,732.25 | August 17, 2011 | 50 | $ | 12,732.25 | ||||||||||||||||||||
FET Employees | September 8, 2011 | 225 | $ | 52,500 | September 8, 2011 | 225 | $ | 52,500 | ||||||||||||||||||||
Former FOT Director | October 21, 2011 | 425 | $ | 85,000 | October 21, 2011 | 425 | $ | 85,000 | ||||||||||||||||||||
FET Director | October 24, 2011 | 88 | $ | 25,018 | October 24, 2011 | 88 | $ | 25,018 | ||||||||||||||||||||
FET Employee | November 10, 2011 | 333 | $ | 66,600 | November 10, 2011 | 333 | $ | 66,600 | ||||||||||||||||||||
FET Employee | November 15, 2011 | 100 | $ | 20,000 | November 15, 2011 | 100 | $ | 20,000 | ||||||||||||||||||||
FET Employee | November 16, 2011 | 400 | $ | 90,000 | November 16, 2011 | 400 | $ | 90,000 | ||||||||||||||||||||
FET Employee | November 17, 2011 | 150 | $ | 30,000 | November 17, 2011 | 150 | $ | 30,000 | ||||||||||||||||||||
FET Employees | November 18, 2011 | 583 | $ | 116,600 | November 18, 2011 | 583 | $ | 116,600 | ||||||||||||||||||||
FET Employee | November 30, 2011 | 300 | $ | 60,000 | November 30, 2011 | 300 | $ | 60,000 | ||||||||||||||||||||
Former FOT Director | November 30, 2011 | 600 | $ | 120,000 | November 30, 2011 | 600 | $ | 120,000 | ||||||||||||||||||||
FET Employee | December 1, 2011 | 200 | $ | 40,000 | December 1, 2011 | 200 | $ | 40,000 | ||||||||||||||||||||
FET Executive Officer | December 6, 2011 | 193 | * | December 6, 2011 | 193 | * | ||||||||||||||||||||||
FET Employees | December 6, 2011 | 493 | * | December 7, 2011 | 493 | * | ||||||||||||||||||||||
FET Employee | December 21, 2011 | 334 | $ | 66,800 | ||||||||||||||||||||||||
FET Employee | December 31, 2011 | 37 | $ | 11,840 | ||||||||||||||||||||||||
Former FET Employee | January 6, 2012 | 138 | $ | 39,232 | ||||||||||||||||||||||||
FET Shareholder | January 12, 2012 | 78 | $ | 24,137 | ||||||||||||||||||||||||
FET Director | January 31, 2012 | 833 | $ | 499,800 | ||||||||||||||||||||||||
FET Employee | January 31, 2012 | 160 | $ | 32,000 | ||||||||||||||||||||||||
FET Employee | February 15, 2012 | 500 | $ | 100,000 | ||||||||||||||||||||||||
|
|
| ||||||||||||||||||||||||||
| * | No cash consideration was paid to us by any recipient of any restricted stock award. |
| ** | In connection with the Combination, we issued 1,447 shares of our restricted stock to former holders of Triton management units. |
II-3
The following table sets forth information on the stock options issued by us in the three years preceding the filing of this registration statement.
| Date of issuance | Number of options granted | Grant date exercise price ($/sh) | Number of options granted | Grant date exercise price ($/sh) | ||||||||||||
|
|
| ||||||||||||||
September 9, 2010 | 1,056 | 284.29 | 1,056 | 284.29 | ||||||||||||
October 4, 2010 | 700 | 284.29 | 700 | 284.29 | ||||||||||||
October 18, 2010 | 350 | 284.29 | 350 | 284.29 | ||||||||||||
October 25, 2010 | 6,000 | 284.29 | 6,000 | 284.29 | ||||||||||||
November 29, 2010 | 569 | 284.29 | 569 | 284.29 | ||||||||||||
February 4, 2011 | 1,000 | 340.00 | 1,000 | 340.00 | ||||||||||||
February 22, 2011 | 500 | 340.00 | 500 | 340.00 | ||||||||||||
February 24, 2011 | 253 | 395.00 | 253 | 395.00 | ||||||||||||
March 28, 2011 | 1,045 | 395.00 | 1,045 | 395.00 | ||||||||||||
May 2, 2011 | 600 | 395.00 | 600 | 395.00 | ||||||||||||
May 16, 2011 | 100 | 395.00 | 100 | 395.00 | ||||||||||||
May 17, 2011 | 250 | 395.00 | 250 | 395.00 | ||||||||||||
June 6, 2011 | 600 | 513.00 | 600 | 513.00 | ||||||||||||
July 1, 2011 | 322 | 513.00 | 322 | 513.00 | ||||||||||||
July 8, 2011 | 1,600 | 513.00 | 1,600 | 513.00 | ||||||||||||
July 18, 2011 | 900 | 565.00 | 900 | 565.00 | ||||||||||||
August 17, 2011 | 616 | 568.00 | 616 | 568.00 | ||||||||||||
August 22, 2011 | 400 | 568.00 | 400 | 568.00 | ||||||||||||
November 14, 2011 | 200 | 568.00 | 200 | 568.00 | ||||||||||||
December 2, 2011 | 900 | 568.00 | 900 | 568.00 | ||||||||||||
December 6, 2011 | 914 | 568.00 | ||||||||||||||
December 7, 2011 | 914 | 568.00 | ||||||||||||||
January 23, 2012 | 400 | 600.00 | ||||||||||||||
January 31, 2012 | 167 | 600.00 | ||||||||||||||
|
|
| ||||||||||||||
No cash consideration was paid to us by any recipient of any of the foregoing options for the grant of such options. All of the stock options described above issued prior to the Combination, August 2, 2010, were granted under the Forum Oilfield Technologies, Inc. 2005 Stock Incentive Plan, or Prior Plan, to the officers, employees and consultants of FOT. In connection with the Combination, we amended and restated the Prior Plan to change, among other things, the name of the plan to the Forum Energy Technologies, Inc. 2010 Stock Incentive Plan, or 2010 Plan. At the time of the Combination, both vested and unvested stock options of Allied, Global Flow and Subsea outstanding under a Pre-Combination Equity Plan were converted into an option under the 2010 Plan to acquire the number of shares of our common stock that resulted from multiplying the applicable exchange ratio by the number of shares still subject to the original award. Because Triton’s management units were not convertible into our options, at the time of the Combination, holders of those management units were granted options under the 2010 Plan to purchase 11,314 shares of common stock. All of the stock options described above issued on or after the Combination were granted under the 2010 Plan to our officers, employees and consultants.
In connection with the Combination and pursuant to a subscription agreement dated August 20, 2010, we offered each of our stockholders who were accredited investors or non-U.S. persons (as such term is defined for purposes of the Securities Act of 1933)Act) the opportunity to purchase shares of our common stock worth $115 million in the aggregate, up to their pro-rata ownership of us. In connection with this subscription offer, 34 stockholders, including some of our executive officers and directors, subscribed to purchase 11,707 shares of our common stock in exchange for aggregate cash payments of $3,328,183. In connection with the purchase of these shares of our common stock pursuant to the subscription agreement, we issued to those stockholders who
II-4
purchased shares of our common stock a warrant to purchase additional shares of our common stock on the basis of one warrant share for every two shares purchased in the subscription offer, resulting in warrants issued to purchase an aggregate of 5,853 shares of our common stock. The warrants were exercisable upon their issuance and will remain exercisable until the date that is the 30 month anniversary following the consummation of this offering. The initial exercise price of the warrants was $284.29 per share, and the exercise price increases by 0.5% of the then-current exercise price on the last day of each month following their original issuance. One of our directors exercised warrants to purchase 85 shares of our common stock on March 31, 2011, and one of our shareholders exercised warrants to purchase 78 shares of our common stock on January 12, 2012. For more information about these warrants, please see “Description of capital stock—Warrants” (in the prospectus included in this registration statement).
In connection with the Combination and pursuant to a subscription agreement dated August 2, 2010, each of SCF-VII, L.P., Sunray Capital and Messrs. Gaut and Connelly subscribed to purchase 175,876, 17,587, 12,311 and 1,055 shares of our common stock in exchange for a cash payment of $49,999,788.04, $4,999,808.23, $3,499,894.19 and $299,925.95, respectively. In connection with the purchase of these shares of our common stock pursuant to the Subscription Agreement, each of SCF-VII, L.P., Sunray Capital and Messrs. Gaut and Connelly received a warrant to purchase 87,938, 8,794, 6,156 and 528 shares of our common stock, respectively. Each of these warrants entitle the holder to purchase shares of our common stock at a purchase price per share of $284.29, subject to a monthly increase of the then-current exercise price by 0.5%, and expire on the 30 month anniversary of the completion of this offering. For more information about these warrants, please see “Description of capital stock—Warrants” (in the prospectus included in this registration statement).
Pursuant to a subscription agreement dated October 25, 2010, Mr. McCulloch subscribed to purchase 7,035 shares of our common stock in exchange for a cash payment of $1,999,980.
Pursuant to that certain Subscription Agreement dated November 18, 2010, Mr. Jones subscribed to purchase 2,638 shares of our common stock in exchange for a cash payment of $749,957.
On January 31, 2011, we issued 35,000 shares of common stock to the former members of Wood Flowline Products, LLC as consideration for the WFP Acquisition.
On April 29, 2011, we issued 20,252 shares of common stock to the former members of Phoinix Global LLC as consideration for the Phoinix Acquisition.
On May 17, 2011, we issued 4,075 shares of restricted stock to former shareholders of Specialist ROV Tooling Services, Ltd. as consideration for the Specialist Acquisition.
On July 1, 2011, we issued 20,944 shares of common stock to the former unitholders of Cannon Services LP as consideration for the Cannon Acquisition.
On July 1, 2011, we issued 16,200 shares of common stock to the former shareholders of AMC Global Group Ltd. as consideration for the AMC Acquisition.
On July 1, 2011, we issued 5,847 restricted shares of common stock to a former shareholder and its affiliate of SVP Products Inc. as consideration for the SVP Acquisition.
Pursuant to a Subscription Agreement dated August 2, 2011 between Forum Energy Technologies, Inc. and Mr. John A. Carrig, Mr. Carrig subscribed to purchase 884 shares of our common stock in exchange for a cash payment of $499,460.
II-5
Pursuant to a Subscription Agreement dated August 3, 2011 between Forum Energy Technologies, Inc. and Ms. Evelyn M. Angelle, Ms. Angelle subscribed to purchase 176 shares of our common stock in exchange for a cash payment of $99,440.
Pursuant to a Subscription Agreement dated December 2, 2011 between Forum Energy Technologies, Inc. and Mr. Pablo G. Mercado, Mr. Mercado subscribed to purchase 176 shares of our common stock in exchange for a cash payment of $99,968.
The terms of the Subscription Agreement among Forum Energy Technologies, Inc., SCF-VII, L.P., Sunray Capital and Messrs. Gaut and Connelly also include an additional equity commitment by SCF, VII, L.P. to purchase an additional $50.0 million of our shares of common stock on or before August 3, 2011. In June 2011, SCF-VII, L.P. purchased an additional 168,236 shares of our common stock pursuant to this equity commitment in exchange for a cash payment of $50.0 million. In connection with the purchase of these shares, SCF-VII, L.P. also received a warrant to purchase 84,118 shares of our common stock pursuant to the Subscription Agreement.
Pursuant to the terms of those Subscription Agreements dated July 29, 2011 between Forum Energy Technologies, Inc. and certain shareholders of Davis-Lynch, such shareholders subscribed to purchase a total of 710 shares of our common stock in exchange for a cash payment of $401,150.
Pursuant to a Subscription Agreement dated January 31, 2012 between Forum Energy Technologies, Inc. and Mr. Louis A. Raspino, Mr. Raspino subscribed to purchase 833 shares of our common stock in exchange for a cash payment of $499,800.
Certain transactions, including (i) the issuance of shares to SCF, former Allied shareholders, former Global Flow shareholders, former Triton and former Subsea shareholders in connection with the Combination, (ii) certain of the above-described issuances of restricted stock and option grants to accredited investors, (iii) issuances of our common stock and warrants made pursuant to the Subscription Agreements described above and (iv) issuances of our common stock as consideration for acquisitions as described above were made in reliance upon the exemption from registration requirements of the Securities Act available under Section 4(2) of the Securities Act, Rule 506 of Regulation D and Regulation S. The recipients of the securities in these transactions represented that they were sophisticated persons and that they intended to acquire the securities for investment only and not with a view to, or for sale in connection with, any distribution thereof, and appropriate legends were affixed to the share certificates and instruments issued in such sales. We believe that the purchasers either received adequate information about us or had adequate access, through their relationships with us, to such information.
All other issuances of common stock described above either represent grants of restricted stock under, or were made pursuant to the exercise of stock options granted under, our Prior Plan or 2010 Plan to our officers, directors, employees and consultants in reliance upon an available exemption from the registration requirements of the Securities Act, including those contained in Rule 701 promulgated under Section 3(b) of the Securities Act. Among other things, we relied on the fact that, under Rule 701, companies that are not subject to the reporting requirements of Section 13 or Section 15(d) of the Exchange Act are exempt from registration under the Securities Act with respect to certain offers and sales of securities pursuant to “compensatory benefit plans” as defined under that rule. We believe that our Prior Plan and our 2010 Plan qualify as compensatory benefit plans.
II-6
| Item 16. | Exhibits and financial statement schedules |
| (a) | Exhibits |
| Exhibit number | Description | |||
|
| |||
| Form of Underwriting Agreement | ||||
| **††2.1 | Combination Agreement dated July 16, 2010 by and among Forum Oilfield Technologies, Inc., Allied Production Services, Inc., Allied Merger Sub, LLC, Global Flow Technologies, Inc., Global Flow Merger Sub, LLC, Subsea Services International, Inc., Subsea Merger Sub, LLC, Triton Group Holdings LLC, Triton Merger Sub, LLC and SCF-VII, L.P. | |||
| **††2.2 | Purchase and Sale Agreement among Davis-Lynch Holding Co., Inc., Carl A. Davis and Forum Energy Technologies, Inc., dated June 25, 2011 | |||
| **3.1 | Second Amended and Restated Certificate of Incorporation of Forum Energy Technologies, Inc. | |||
| **3.2 | Amended and Restated Bylaws of Forum Energy Technologies, Inc. | |||
| **3.3 | Form of Third Amended and Restated Certificate of Incorporation of Forum Energy Technologies, Inc. | |||
| **3.4 | Form of Second Amended and Restated Bylaws of Forum Energy Technologies, Inc. | |||
| **4.1 | Form of Common Stock Certificate | |||
| **4.2 | Amended and Restated Stockholders Agreement dated as of August 2, 2010 by and among the Company and certain of its stockholders, as amended | |||
| **4.3 | Registration Rights Agreement dated as of August 2, 2010 by and among Forum Energy Technologies and the other parties thereto (included as Exhibit B to Exhibit 4.2) | |||
| **5.1 | Form of opinion of Vinson & Elkins L.L.P. as to the legality of the securities being registered | |||
| **10.1 | Credit Agreement, dated as of August 2, 2010, among Forum Energy Technologies, Inc., as Borrower, Wells Fargo Bank, National Association, as Administrative Agent and Swing Line Lender, Wells Fargo Bank, National Association, JPMorgan Chase Bank, N.A. and Bank of America, N.A. and such other lenders designated from time to time as issuing lenders. | |||
| **†10.2 | Employment Agreement dated as of August 2, 2010 between Forum Energy Technologies, Inc. and C. Christopher Gaut | |||
| **†10.3 | Employment Agreement dated as of August 2, 2010 between Forum Energy Technologies, Inc. and Charles E. Jones | |||
| **†10.4 | Employment Agreement dated as of August 2, 2010 between Forum Energy Technologies, Inc. and | |||
| **† | Employment Agreement dated as of August 2, 2010 between Forum Energy Technologies, Inc. and James W. Harris | |||
| **† | Employment Agreement dated as of | |||
II-7
| Exhibit number | Description | |||
|
| |||
| **† | Secondment Agreement dated as of August 2, 2010 by and among Forum Energy Technologies, L.E. Simmons & Associates, Inc. and W. Patrick Connelly | |||
| **† | Indemnification Agreement dated as of August 2, 2010 between Forum Energy Technologies and C. Christopher Gaut | |||
| **† | Form of Indemnification Agreement between Forum Energy Technologies, Inc. and the executive officers identified on Annex A thereto | |||
| Form of Indemnification Agreement between Forum Energy Technologies and each of the non-SCF directors identified on Annex A thereto | ||||
| **† | Form of Indemnification Agreement between Forum Energy Technologies and each of the SCF directors identified on Annex A thereto | |||
| **† | 2011 Management Incentive Plan | |||
| **† | Forum Energy Technologies, Inc. 2010 Stock Incentive Plan | |||
| **† | Forum Energy Technologies, Inc. Severance Plan | |||
| **† | Form of Restricted Stock Agreement | |||
| **†10.16 | Form of Nonstatutory Stock Option Agreement (Employees) | |||
| **†10.17 | Form of Nonstatutory Stock Option Agreement | |||
| ** | Subscription Agreement dated July 16, 2010 by and among Forum Oilfield Technologies, Inc., SCF-VII, L.P., Sunray Capital, LP, C. Christopher Gaut and W. Patrick Connelly, as amended | |||
| ** | Subscription Agreement dated August 20, 2010 by and among Forum Energy Technologies, Inc. and the parties thereto (with attached schedule of parties thereto), as amended | |||
| ** | Form of Warrant Agreement (with attached schedule of parties thereto) | |||
| ** | Subscription Agreement dated October 25, 2010 between Forum Energy Technologies, Inc. and James L. McCulloch | |||
| ** | Subscription Agreement dated November 8, 2010 between Forum Energy Technologies, Inc. and Charles E. Jones | |||
| ** | Subscription Agreement dated August 2, 2011 between Forum Energy Technologies, Inc. and John A. Carrig | |||
| ** | Subscription Agreement dated August 3, 2011 between Forum Energy Technologies, Inc. and Evelyn Angelle | |||
| **† | Subscription Agreement dated December 2, 2011 between Forum Energy Technologies, Inc. and Pablo Mercado | |||
| †10.26 | Subscription Agreement dated January 31, 2012 between Forum Energy Technologies, Inc. and Louis Raspino, Jr. | |||
| **10.27 | Agreement and Amendment No. 1 to Credit Agreement, dated as of June 29, 2011, among Forum Energy Technologies, Inc., as Borrower, Wells Fargo Bank, National Association, as Administrative Agent and Swing Line Lender, Wells Fargo Bank, National Association, JPMorgan Chase Bank, N.A. and Bank of America, N.A. and such other lenders designated from time to time as issuing lenders | |||
II-8
| Exhibit number | Description | |||
|
|
| ||
| **10.28 | Amended and Restated Credit Agreement, dated as of October 4, 2011, among Forum Energy Technologies, Inc., as Borrower, Wells Fargo Bank, National Association, as Administrative Agent and Swing Line Lender, Wells Fargo Bank, National Association, JPMorgan Chase Bank, N.A. and Bank of America, N.A. and such other lenders designated from time to time as issuing lenders. | |||
| **21.1 | List of Subsidiaries of Forum Energy Technologies, Inc. | |||
| 23.1 | Consent of PricewaterhouseCoopers LLP (Forum Energy Technologies, Inc.) | |||
| 23.2 | Consent of Ernst & Young LLP (Allied Production Services, Inc.) | |||
| 23.3 | Consent of | |||
| Consent of Deloitte LLP (Triton Group Holdings LLC) | ||||
| Consent of UHY LLP (Davis-Lynch, Inc. | ||||
| **23.11 | Consent of Vinson & Elkins L.L.P. (included as part of Exhibit 5.1 hereto) | |||
| 24.1 | Power of Attorney (included on the signature page of the initial filing of the registration statement) | |||
|
| |||
| * | To be filed by amendment. |
| ** | Previously filed as part of the registration statement on Form S-1 (Registration No. 333-176603). |
| † | Management contract or compensatory plan or arrangement. |
| †† | Certain schedules and exhibits are not filed herewith in accordance with Item 601(b)(2) of Regulation S-K. Forum agrees to furnish supplementally a copy of any omitted schedule or exhibit to the Securities and Exchange Commission upon request. |
| Item 17. | Undertakings |
The undersigned registrant hereby undertakes to provide to the underwriters at the closing specified in the underwriting agreement certificates in such denominations and registered in such names as required by the underwriters to permit prompt delivery to each purchaser.
Insofar as indemnification for liabilities arising under the Securities Act may be permitted to directors, officers and controlling persons of the registrant pursuant to the foregoing provisions, or otherwise, the registrant has been advised that in the opinion of the Securities and Exchange Commission such indemnification is against public policy as expressed in the Securities Act and is, therefore, unenforceable. In the event that a claim for indemnification against such liabilities (other than the payment by the registrant of expenses incurred or paid by a director, officer or controlling person of the registrant in the successful defense of any action, suit or proceeding) is asserted by such director, officer or controlling person in connection with the securities being registered, the registrant will, unless in the opinion of its counsel the matter has been settled by controlling precedent, submit to a court of appropriate jurisdiction the question whether such indemnification by it is against public policy as expressed in the Securities Act and will be governed by the final adjudication of such issue.
II-9
The undersigned registrant hereby undertakes that:
(1) For purposes of determining any liability under the Securities Act, the information omitted from the form of prospectus filed as part of this registration statement in reliance upon Rule 430A and contained in a form of prospectus filed by the registrant pursuant to Rule 424(b)(1) or (4) or 497(h) under the Securities Act shall be deemed to be part of this registration statement as of the time it was declared effective.
II-9
(2) For the purpose of determining any liability under the Securities Act, each post-effective amendment that contains a form of prospectus shall be deemed to be a new registration statement relating to the securities offered therein, and the offering of such securities at that time shall be deemed to be the initial bona fide offering thereof.
II-10
Signatures
Pursuant to the requirements of the Securities Act of 1933, the registrant has duly caused this Registration Statement to be signed on its behalf by the undersigned, thereunto duly authorized, in the City of Houston, State of Texas, on December 29, 2011.March 14, 2012.
| FORUM ENERGY TECHNOLOGIES, INC. | ||||
By: | /s/ C. Christopher Gaut | |||
| C. Christopher Gaut | ||||
| President, Chief Executive Officer and Chairman of the Board | ||||
Each person whose signature appears below appoints C. Christopher Gaut, James W. Harris and James L. McCulloch, and each of them, any of whom may act without the joinder of the other, as his or her true and lawful attorneys-in-fact and agents, with full power of substitution and resubstitution, for him or her and in his name, place and stead, in any and all capacities, to sign any and all amendments (including post-effective amendments) to this Registration Statement and any Registration Statement (including any amendment thereto) for this offering that is to be effective upon filing pursuant to Rule 462(b) under the Securities Act of 1933, as amended, and to file the same, with all exhibits thereto, and all other documents in connection therewith, with the Securities and Exchange Commission, granting unto said attorneys-in-fact and agents full power and authority to do and perform each and every act and thing requisite and necessary to be done, as fully to all intents and purposes as he or she might or would do in person, hereby ratifying and confirming all that said attorneys-in-fact and agents or any of them or their or his substitute or substitutes, may lawfully do or cause to be done by virtue hereof.
Pursuant to the requirements of the Securities Act of 1933, as amended, this Registration Statement has been signed below by the following persons in the capacities and the dates indicated.
| Signature | Title | Date | ||
| ||||
/s/ C. Christopher Gaut C. Christopher Gaut | President, Chief Executive Officer and Chairman of the Board (Principal Executive Officer) | |||
/s/ James W. Harris James W. Harris | Senior Vice President and Chief Financial Officer (Principal Financial Officer and Principal Accounting Officer) | |||
* Evelyn M. Angelle | Director | |||
* David C. Baldwin | Director | |||
* John A. Carrig | Director | |||
* Michael McShane | Director | |||
II-11
| Signature | Title | Date | ||
/s/ Louis Raspino, Jr. Louis Raspino, Jr. | Director | March 14, 2012 | ||
* Franklin Myers | Director | |||
* John Schmitz | Director | |||
* Andrew L. Waite | Director | |||
* By: | /s/ C. Christopher Gaut C. Christopher Gaut, Attorney-in-fact | |
II-11II-12
Index to exhibits
| Exhibit number | Description | |||
|
| |||
| Form of Underwriting Agreement | ||||
| **††2.1 | Combination Agreement dated July 16, 2010 by and among Forum Oilfield Technologies, Inc., Allied Production Services, Inc., Allied Merger Sub, LLC, Global Flow Technologies, Inc., Global Flow Merger Sub, LLC, Subsea Services International, Inc., Subsea Merger Sub, LLC, Triton Group Holdings LLC, Triton Merger Sub, LLC and SCF-VII, L.P. | |||
| **††2.2 | Purchase and Sale Agreement among Davis-Lynch Holding Co., Inc., Carl A. Davis and Forum Energy Technologies, Inc., dated June 25, 2011 | |||
| **3.1 | Second Amended and Restated Certificate of Incorporation of Forum Energy Technologies, Inc. | |||
| **3.2 | Amended and Restated Bylaws of Forum Energy Technologies, Inc. | |||
| **3.3 | Form of Third Amended and Restated Certificate of Incorporation of Forum Energy Technologies, Inc. | |||
| **3.4 | Form of Second Amended and Restated Bylaws of Forum Energy Technologies, Inc. | |||
| **4.1 | Form of Common Stock Certificate | |||
| **4.2 | Amended and Restated Stockholders Agreement dated as of August 2, 2010 by and among the Company and certain of its stockholders, as amended | |||
| **4.3 | Registration Rights Agreement dated as of August 2, 2010 by and among Forum Energy Technologies and the other parties thereto (included as Exhibit B to Exhibit 4.2) | |||
| **5.1 | Form of Opinion of Vinson & Elkins L.L.P. as to the legality of the securities being registered | |||
| **10.1 | Credit Agreement, dated as of August 2, 2010, among Forum Energy Technologies, Inc., as Borrower, Wells Fargo Bank, National Association, as Administrative Agent and Swing Line Lender, Wells Fargo Bank, National Association, JPMorgan Chase Bank, N.A. and Bank of America, N.A. and such other lenders designated from time to time as issuing lenders. | |||
| **†10.2 | Employment Agreement dated as of August 2, 2010 between Forum Energy Technologies, Inc. and C. Christopher Gaut | |||
| **†10.3 | Employment Agreement dated as of August 2, 2010 between Forum Energy Technologies, Inc. and Charles E. Jones | |||
| **†10.4 | Employment Agreement dated as of August 2, 2010 between Forum Energy Technologies, Inc. and | |||
| **† | Employment Agreement dated as of August 2, 2010 between Forum Energy Technologies, Inc. and James W. Harris | |||
| **† | Employment Agreement dated as of | |||
| **†10.7 | Secondment Agreement dated as of August 2, 2010 by and among Forum Energy Technologies, L.E. Simmons & Associates, Inc. and W. Patrick Connelly | |||
II-12II-13
| Exhibit number | Description | |||
|
| |||
| **†10.8 | ||||
| Indemnification Agreement dated as of August 2, 2010 between Forum Energy Technologies and C. Christopher Gaut | ||||
| **† | Form of Indemnification Agreement between Forum Energy Technologies, Inc. and the executive officers identified on Annex A thereto | |||
| Form of Indemnification Agreement between Forum Energy Technologies and each of the non-SCF directors identified on Annex A thereto | ||||
| **† | Form of Indemnification Agreement between Forum Energy Technologies and each of the SCF directors identified on Annex A thereto | |||
| **† | 2011 Management Incentive Plan | |||
| **† | Forum Energy Technologies, Inc. 2010 Stock Incentive Plan | |||
| **† | Forum Energy Technologies, Inc. Severance Plan | |||
| **† | Form of Restricted Stock Agreement | |||
| **†10.16 | Form of Nonstatutory Stock Option Agreement (Employees) | |||
| **†10.17 | Form of Nonstatutory Stock Option Agreement | |||
| ** | Subscription Agreement dated July 16, 2010 by and among Forum Oilfield Technologies, Inc., SCF-VII, L.P., Sunray Capital, LP, C. Christopher Gaut and W. Patrick Connelly, as amended | |||
| ** | Subscription Agreement dated August 20, 2010 by and among Forum Energy Technologies, Inc. and the parties thereto (with attached schedule of parties thereto), as amended | |||
| ** | Form of Warrant Agreement (with attached schedule of parties thereto) | |||
| ** | Subscription Agreement dated October 25, 2010 between Forum Energy Technologies, Inc. and James L. McCulloch | |||
| ** | Subscription Agreement dated November 8, 2010 between Forum Energy Technologies, Inc. and Charles E. Jones | |||
| ** | Subscription Agreement dated August 2, 2011 between Forum Energy Technologies, Inc. and John A. Carrig | |||
| ** | Subscription Agreement dated August 3, 2011 between Forum Energy Technologies, Inc. and Evelyn Angelle | |||
| **† | Subscription Agreement dated December 2, 2011 between Forum Energy Technologies, Inc. and Pablo Mercado | |||
| †10.26 | Subscription Agreement dated January 31, 2012 between Forum Energy Technologies, Inc. and Louis Raspino, Jr. | |||
| **10.27 | Agreement and Amendment No. 1 to Credit Agreement, dated as of June 29, 2011, among Forum Energy Technologies, Inc., as Borrower, Wells Fargo Bank, National Association, as Administrative Agent and Swing Line Lender, Wells Fargo Bank, National Association, JPMorgan Chase Bank, N.A. and Bank of America, N.A. and such other lenders designated from time to time as issuing lenders | |||
II-13II-14
| Exhibit number | Description | |||
|
| |||
| **10.28 | Amended and Restated Credit Agreement, dated as of October 4, 2011, among Forum Energy Technologies, Inc., as Borrower, Wells Fargo Bank, National Association, as Administrative Agent and Swing Line Lender, Wells Fargo Bank, National Association, JPMorgan Chase Bank, N.A. and Bank of America, N.A. and such other lenders designated from time to time as issuing lenders. | |||
| **21.1 | List of Subsidiaries of Forum Energy Technologies, Inc. | |||
| 23.1 | Consent of PricewaterhouseCoopers LLP (Forum Energy Technologies, Inc.) | |||
| 23.2 | Consent of Ernst & Young LLP (Allied Production Services, Inc.) | |||
| 23.3 | Consent of | |||
| Consent of Deloitte LLP (Triton Group Holdings LLC) | ||||
| Consent of UHY LLP (Davis-Lynch, Inc. | ||||
| **23.11 | Consent of Vinson & Elkins L.L.P. (included as part of Exhibit 5.1 hereto) | |||
| 24.1 | Power of Attorney (included on the signature page of the initial filing of the registration statement) | |||
|
| |||
| * | To be filed by amendment. |
| ** | Previously filed as part of the registration statement on Form S-1 (Registration No. 333-176603). |
| † | Management contract or compensatory plan or arrangement. |
| †† | Certain schedules and exhibits are not filed herewith in accordance with Item 601(b)(2) of Regulation S-K. Forum agrees to furnish supplementally a copy of any omitted schedule or exhibit to the Securities and Exchange Commission upon request. |
II-14II-15