| (a) | For purposes of calculating the pro forma net income per Class A share, the number of Class A shares of Silvercrest outstanding are calculated as follows: | | | Incremental shares of Class A common stock (1) | | | Shares of Class A common stock outstanding immediately after this offering | | | | | | Total pro forma Class A shares of Silvercrest for purposes of calculating pro forma net income per Class A share the number of Class A shares of Silvercrest outstanding are calculated as follows: |
| | | Pro forma Class A shares of Silvercrest
| | | | | |
| (1) | Represents incremental Class A shares whose proceeds are assumed to fund the cash distribution to our existing principals as such distribution exceeds current year pro forma earnings. |
| | | | | Distribution prior to offering | | | $ | | Pro forma net income attributable to Silvercrest | | $ | | | | | | | | Distribution in excess of pro forma net income attributable to Silvercrest | | $ | | | Initial public offering price per share | | $ | | | | | | | | Incremental shares of Class A common stock | | | | | Shares of Class A common stock outstanding immediately after this offering | | | | | | | | | | Total pro forma Class A shares of Silvercrest for purposes of calculating pro forma net income per Class A share | | | | | | | | | |
The pro forma basic and diluted net income per Class A share is calculated as follows (Dollars in thousands, except per share data): | | | | | | | | | | | | Basic | | | Diluted | | Pro forma net income attributable to Silvercrest(1)Silvercrest (2) | | $ | | | | $ | | | Weighted average common shares outstanding | | | | | | | | | | | | | | | | | | Pro forma net income per Class A share | | $ | | | | $ | | | | | | | | | | | |
(1)(2) | Our shares of Class B common stock do not share in our earnings and are therefore not included in the weighted average shares outstanding or net income per share. Furthermore, no pro forma effect was given to the future potential exchanges of the Class B units of Silvercrest L.P. held by our principals that will be outstanding immediately after the consummation of the reorganization and the offering for a corresponding number of shares of our Class A common stock because the issuance of shares of Class A common stock upon these exchanges would not be dilutive. |
Employee bonuses and related payroll taxes of $ are expected to be paid in conjunction with the completion of this offering but have not been reflected in the unaudited pro forma statement of operations given the non-recurring nature of these payments. MANAGEMENT’S DISCUSSION AND ANALYSIS OF OF FINANCIAL CONDITION AND RESULTS OF OPERATIONS
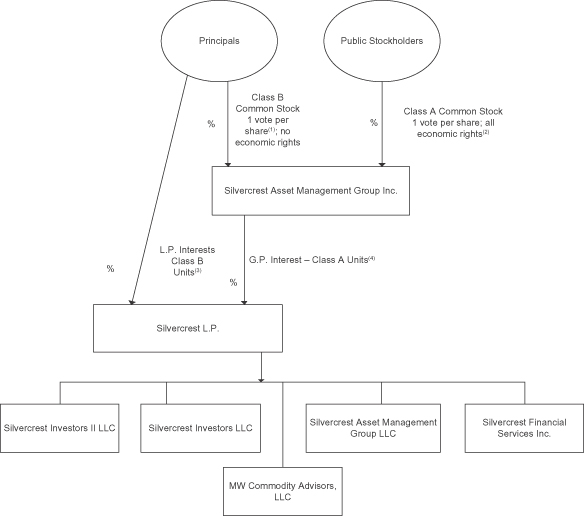
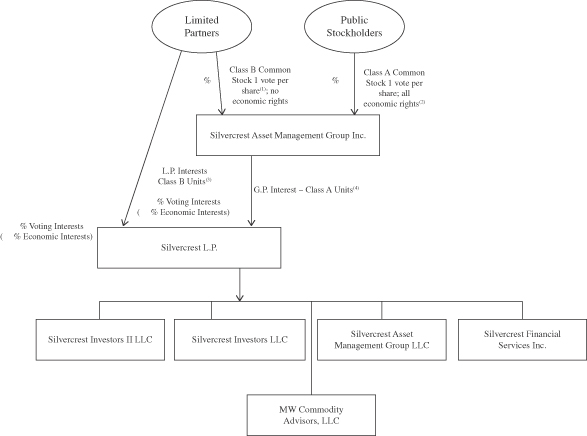
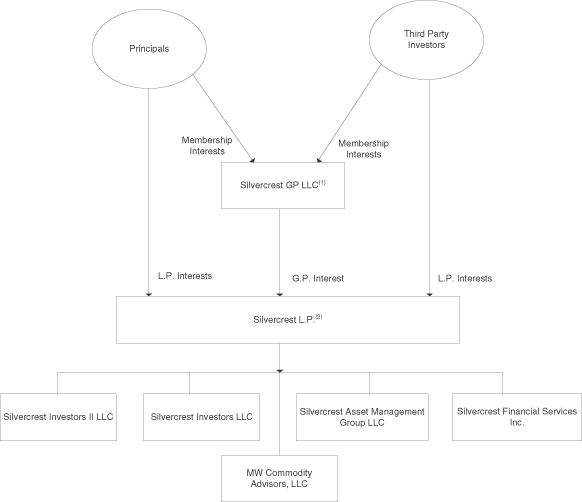
You should read this discussion and analysis of our financial condition and results of operation in conjunction with our “Selected Historical Consolidated Financial Data” and our historical financial statements and related notes included elsewhere in this prospectus. The information in this section contains forward-looking statements (see “Special Note Regarding Forward-Looking Statements”). Our actual results may differ significantly from the results suggested by these forward-looking statements and from our historical results. Some factors that may cause our results to differ are described in the “Risk Factors” section of this prospectus. The historical financial data discussed below reflect the historical results of operations and financial condition of Silvercrest L.P. and its subsidiaries and do not give effect to our reorganization. See “Reorganization“The Reorganization and Our Holding Company Structure” and “Unaudited Pro Forma Consolidated Financial Information,” included elsewhere in this prospectus, for a description of our reorganization and its effect on our historical results of operations. Overview We are a premier, full-service wealth management firm focused on providing financial advisory and related family office services to ultra-high net worth individuals and endowments, foundations and other institutional investors. In addition to a wide range of investment capabilities, we offer a full suite of complementary and customized family office services for families seeking a comprehensive oversight of their financial affairs. During the sixthree months ended June 30,March 31, 2013, our assets under management grew 21.4% from $11.2 billion to $13.6 billion. During the year ended December 31, 2012, our assets under management grew 5.9%10.9%, from $10.1 billion to $10.7 billion. During the twelve months ended December 31, 2011, our assets under management grew 9.8%, from $9.2 billion to $10.1$11.2 billion. As part of the reorganization of our company occurring in connection with this offering, Silvercrest will become the general partner of Silvercrest, L.P, our operating company. In addition, the partnership units of all continuing partners of Silvercrest L.P. will be reclassified as Class B units that have equal economic rights to our shares of Class A common stock. After giving effect to the reorganization described above, we will hold approximately % of the partnership interests in Silvercrest L.P. (or approximately % if the underwriters exercise in full their option to purchase additional shares). The partners in Silvercrest L.P. following this offering, consisting of 37 of our current employees and two non-employee partners, will collectively hold the remaining approximately % of the partnership interests in Silvercrest L.P. (or approximately % if the underwriters in full exercise their over-allotment option)option to purchase additional shares). In addition, Silvercrest L.P. has issued deferred equity units exercisable for Class B units which entitle the holderholders thereof to receive distributions from Silvercrest L.P. to the same extent as if the underlying Class B units were outstanding. Net profits and net losses of Silvercrest L.P. will be allocated, and distributions from Silvercrest L.P. will be made, to its current partners pro rata in accordance with their respective partnership units (and assuming the Class B units underlying all deferred equity units are outstanding). For more information on our reorganization, see “The Reorganization and Our Holding Company Structure.” The historical results of operations discussed in this Management’s Discussion and Analysis of Financial Condition and Results of Operations are those of Silvercrest L.P. and its subsidiaries. After the completion of the reorganization, as the general partner of Silvercrest L.P., we will control its business and affairs and, therefore, consolidate its financial results with ours. In light of our employees’ collective % partnership interest in Silvercrest L.P. immediately after the reorganization and this offering (or approximately % if the underwriters exercise in full their option to purchase additional shares), we will reflect the interests of these employees as a non-controlling interest in our consolidated financial statements. As a result, our net income, after amounts attributable to non-controlling interests, will represent % of Silvercrest L.P.’s net income (or approximately % if the underwriters exercise in full their option to purchase additional shares), and similarly, outstanding shares of our Class A common stock will represent % of the outstanding partnership units of Silvercrest L.P. (or approximately % if the underwriters exercise in full their over-allotment option)option to purchase additional shares). For more information on the pro forma impact of our reorganization, see “Unaudited Pro Forma Consolidated Financial Information.” Key Performance Indicators When we review our performance, we focus on the indicators described below: | | | | For the year ended December 31, | | | For the six months ended
June 30, | | | For the Years Ended December 31, | | For the Three Months Ended
March 31, | | (in thousands except as indicated) | | 2011 | | | 2010 | | | 2009 | | | 2012 | | | 2011 | | | 2012 | | 2011 | | 2010 | | 2013 | | 2012 | | Revenue | | $ | 42,787 | | | $ | 36,831 | | | $ | 32,534 | | | $ | 24,787 | | | $ | 20,779 | | | $ | 51,690 | | | $ | 42,787 | | | $ | 36,831 | | | $ | 13,685 | | | $ | 11,880 | | Income before other income (expense) | | $ | 14,446 | | | $ | 10,844 | | | $ | 2,207 | | | $ | 9,979 | | | $ | 7,881 | | | Income before other income (expense), net | | | $ | 18,902 | | | $ | 14,446 | | | $ | 10,844 | | | $ | 5,774 | | | $ | 4,546 | | Net income | | $ | 14,609 | | | $ | 10,942 | | | $ | 8,086 | | | $ | 9,404 | | | $ | 7,544 | | | $ | 19,720 | | | $ | 14,609 | | | $ | 10,942 | | | $ | 5,464 | | | $ | 4,289 | | Adjusted EBITDA (1) | | $ | 10,839 | | | $ | 9,068 | | | $ | 6,449 | | | $ | 6,776 | | | $ | 5,580 | | | $ | 14,702 | | | $ | 10,839 | | | $ | 9,068 | | | $ | 4,137 | | | $ | 3,447 | | Adjusted EBITDA margin (2) | | | 25.3% | | | | 24.6% | | | | 19.8% | | | | 27.3% | | | | 26.9% | | | | 28.4 | % | | | 25.3 | % | | | 24.6 | % | | | 30.2 | % | | | 29.0 | % | Assets under management at period end (in billions) | | $ | 10.1 | | | $ | 9.2 | | | $ | 8.8 | | | $ | 10.7 | | | $ | 10.6 | | | Average assets under management (in billions) (3) | | $ | 9.7 | | | $ | 9.0 | | | $ | 8.3 | | | $ | 10.4 | | | $ | 9.9 | | | Assets under management at period end (billions) | | | $ | 11.2 | | | $ | 10.1 | | | $ | 9.2 | | | $ | 13.6 | | | $ | 11.1 | | Average assets under management (billions) (3) | | | $ | 10.7 | | | $ | 9.7 | | | $ | 9.0 | | | $ | 12.4 | | | $ | 10.6 | |
| (1) | EBITDA represents net income before income tax expense, interest income, interest expense, depreciation and amortization. We define Adjusted EBITDA as EBITDA without giving effect to professional fees associated with acquisitions or financing transactions, losses on forgiveness of notes receivable from our principals, gains on extinguishment of debt or other obligations related to acquisitions, impairment charges and losses on disposals or abandonment of assets and leaseholds, client reimbursements and fund redemption costs, severance and other similar expenses, but including partner incentive allocations as an expense. See “Selected Historical Consolidated Financial Data” for a further explanation of Adjusted EBITDA and its reconciliation to net income on a basis consistent with GAAP. |
| (2) | Adjusted EBITDA margin is calculated by dividing Adjusted EBITDA by total revenue. |
| (3) | We have computed average assets under management by averaging assets under management at the beginning of the applicable period and assets under management at the end of the applicable period. |
Revenue We generate revenue from management and advisory fees, performance fees, and family office services fees. Our management and advisory fees are generated by managing assets on behalf of separate accounts and acting as investment adviser for various investment funds. Our performance fees relate to assets managed in external investment strategies in which we have a revenue sharing arrangement and in funds in which we have no partnership interest. Our management and advisory fees and family office services fees income is recognized through the course of the period in which these services are provided. Income from performance fees is recorded at the conclusion of the contractual performance period when all contingencies are resolved. In certain arrangements, we are only entitled to receive performance fees and allocations when the return on assets under management exceeds certain benchmark returns or other performance targets. The discretionary investment management agreements for our separately managed accounts do not have a specified term. Rather, each agreement may be terminated by either party at any time upon written notice of termination to the other party. The investment management agreements for our private funds are generally in effect from year to year, and may be terminated at the end of any year (or, in certain cases, on the anniversary of execution of the agreement) (i) by us upon 30 or 90 days’ prior written notice and (ii) after receiving the affirmative vote of a specified percentage of the investors in the private fund that are not affiliated with us, by the private fund on 60 or 90 days’ prior written notice. The investment management agreements for our private funds may also generally be terminated effective immediately by either party where the non-terminating party (i) commits a material breach of the terms subject, in certain cases, to a cure period, (ii) is found to have committed fraud, gross negligence or willful misconduct or (iii) terminates, become bankrupt, becomes insolvent or dissolves. Each of our investment management agreements contains customary indemnification obligations from us to our clients. The tables below set forth the amount of assets under management, the percentage of management and advisory fees revenues, the amount of revenue recognized, and the average assets under management for discretionary managed accounts and for private funds for each period presented. Discretionary Managed Accounts | | | | | | | | | | | | | | | | | | | | | | | | As of and for the
Year Ended
December 31, | | | As of and for the
Six Months
Ended
June 30, | | | (In billions) | | 2011 | | | 2010 | | | 2009 | | | 2012 | | | 2011 | | AUM concentrated in Discretionary Managed Accounts ($) | | $ | 6.2 | | | $ | 5.7 | | | $ | 5.3 | | | $ | 6.7 | | | $ | 6.4 | | Average AUM For Discretionary Managed Accounts | | $ | 6.0 | | | $ | 5.5 | | | $ | 5.0 | | | $ | 6.5 | | | $ | 6.1 | | Discretionary Managed Accounts Revenue ($) (in millions) | | $ | 32.5 | | | $ | 27.5 | | | $ | 24.0 | | | $ | 18.1 | | | $ | 16.1 | | Percentage of management and advisory fees revenue (%) | | | 86 | % | | | 85 | % | | | 82 | % | | | 81 | % | | | 87 | % | Private Funds | | | | | | | | | | | | | | | | | | | | | | | | As of and for the
Year Ended
December 31, | | | As of and for the
Six Months
Ended
June 30, | | | (In billions) | | 2011 | | | 2010 | | | 2009 | | | 2012 | | | 2011 | | AUM concentrated in Private Funds ($) | | $ | 0.8 | | | $ | 0.7 | | | $ | 0.8 | | | $ | 0.9 | | | $ | 0.7 | | Average AUM for Private Funds | | $ | 0.8 | | | $ | 0.8 | | | $ | 1.1 | | | $ | 0.9 | | | $ | 0.7 | | Private Funds Revenue ($) (in millions) | | $ | 5.4 | | | $ | 4.9 | | | $ | 5.3 | | | $ | 4.2 | | | $ | 2.4 | | Percentage of management and advisory fees revenue (%) | | | 14 | % | | | 15 | % | | | 18 | % | | | 19 | % | | | 13 | % |
| | | | | | | | | | | | | | | | | | | | | | | | As of and for the Years Ended December 31, | | | As of and for the Three
Months Ended March 31, | | (in billions) | | 2012 | | | 2011 | | | 2010 | | | 2013 | | | 2012 | | AUM concentrated in Discretionary Managed Accounts ($) | | $ | 7.1 | | | $ | 6.2 | | | $ | 5.7 | | | $ | 7.8 | | | $ | 6.9 | | Average AUM For Discretionary Managed Accounts | | $ | 6.7 | | | $ | 6.0 | | | $ | 5.5 | | | $ | 7.5 | | | $ | 6.6 | | Discretionary Managed Accounts Revenue ($) (in millions) | | $ | 37.6 | | | $ | 32.5 | | | $ | 27.5 | | | $ | 10.3 | | | $ | 8.7 | | Percentage of management and advisory fees revenue (%) | | | 82% | | | | 86% | | | | 85% | | | | 83% | | | | 81% | |
Private Funds | | | | | | | | | | | | | | | | | | | | | | | | As of and for the Years Ended December 31, | | | As of and for the Three
Months Ended March 31, | | (in billions) | | 2012 | | | 2011 | | | 2010 | | | 2013 | | | 2012 | | AUM concentrated in Private Funds ($) | | $ | 0.9 | | | $ | 0.8 | | | $ | 0.7 | | | $ | 0.9 | | | $ | 0.9 | | Average AUM For Private Funds | | $ | 0.9 | | | $ | 0.8 | | | $ | 0.8 | | | $ | 0.9 | | | $ | 0.9 | | Private Funds Revenue ($) (in millions) | | $ | 8.5 | | | $ | 5.4 | | | $ | 4.9 | | | $ | 2.2 | | | $ | 2.0 | | Percentage of management and advisory fees revenue (%) | | | 18% | | | | 14% | | | | 15% | | | | 17% | | | | 19% | |
Our advisory fees are primarily driven by the level of our assets under management. Our assets under management increase or decrease based on the net inflows or outflows of funds into our various investment strategies and the investment performance of our clients’ accounts. In order to increase our assets under management and expand our business, we must develop and market investment strategies that suit the investment needs of our target clients and provide attractive returns over the long term. Our ability to continue to attract clients will depend on a variety of factors including, among others: our ability to educate our target clients about our classic value investment strategies and provide them with exceptional client service; the relative investment performance of our investment strategies, as compared to competing products and market indices; competitive conditions in the investment management and broader financial services sectors; investor sentiment and confidence; and our decision to close strategies when we deem it to be in the best interests of our clients. The majority of advisory fees that we earn on separately-managed accounts are based on the value of assets under management on the last day of each calendar quarter. Most of our advisory fees are billed quarterly in advance on the first day of each calendar quarter. Our basic annual fee schedule for management of clients’ assets in separately managed accounts is: (i) for managed equity or balanced portfolios, 1% of the first $10 $10 million and 0.60% on the balance, (ii) for managed fixed income only portfolios, 0.40% on the first $10 million and 0.30% on the balance and (iii) for the municipal value strategy, 0.65%. Our fee for monitoring non-discretionary assets can range from 0.05% to 0.01%, but can also be incorporated into an agreed-upon fixed family office service fee. The majority of our client relationships pay a blended fee rate since they are invested in multiple strategies. Management fees earned on investment funds that we advise are calculated primarily based on the net assets of the funds. Some funds calculate investment fees based on the net assets of the funds as of the last business day of each calendar quarter, whereas other funds calculate investment fees based on the value of net assets on the first business day of the month. Depending on the investment fund, fees are paid either quarterly in advance or quarterly in arrears. For our private funds, the fees range from 0.25% to 1.5% annually. Certain management fees earned on investment funds for which we perform risk management and due diligence services are based on flat fee agreements customized for each engagement. Average management fee is calculated by dividing our actual revenue earned over a period by our average assets under management during the same period (which is calculated by averaging quarter-end assets under management for the applicable period). Our average management fee was 0.43%0.44% and 0.37%0.40% for the sixthree months ended June 30,March 31, 2013 and 2012, and 2011, respectively, and 0.39%was 0.43%, 0.36%0.39% and 0.35%0.36% for the years ended December 31, 2012, 2011 2010 and 2009,2010, respectively. Increases in our total average management fee rates are primarily the result of a change in the mix and increased concentration of our assets under management and increased concentration in our equities strategies whose fee rates are higher than those of other investment strategies. Advisory fees are also adjusted for any cash flows into or out of a portfolio, where the cash flow represents greater than 10% of the value of the portfolio. Silvercrest L.P. has authority to take fees directly from external custodian accounts of its separately managed accounts. Our advisory fees may fluctuate based on a number of factors, including the following: changes in assets under management due to appreciation or depreciation of our investment portfolios, and the levels of the contribution and withdrawal of assets by new and existing clients; allocation of assets under management among our investment strategies, which have different fee schedules; allocation of assets under management between separately managed accounts and advised funds, for which we generally earn lower overall advisory fees; and the level of our performance with respect to accounts and funds on which we are paid incentive fees. Our family office services capabilities enable us to provide comprehensive and integrated services to our clients. Our dedicated group of tax and financial planning professionals provide financial planning, tax planning and preparation, partnership accounting and fund administration and consolidated wealth reporting among other services. Family office services income fluctuates based on both the number of clients for whom we perform these services and the level of agreed-upon fees, most of which are flat fees. Therefore, non-discretionary assets under management, which are associated with family office services, do not typically serve as the basis for the amount of family office services revenue that is recognized. We have experienced a steady increase in family office services fees over the past few years as more of our separately managed accounts relationships have taken advantage of these services. We have also been successful in attracting new clients who have engaged us primarily for our family office services. Expenses Our expenses consist primarily of compensation and benefits expenses, as well as general and administrative expense including rent, professional services fees, data-related costs and sub-advisory fees. These expenses may fluctuate due to a number of factors, including the following: variations in the level of total compensation expense due to, among other things, bonuses, awards of equity to our employees and partners of Silvercrest L.P., changes in our employee count and mix, and competitive factors; and the level of management fees from funds that utilize sub-advisors will affect the amount of sub-advisory fees. We expect our professional services fees to increase after this offering as a result of being a public company. Compensation and Benefits Expense Our largest expense is compensation and benefits, which includes the salaries, bonuses, equity-based compensation and related benefits and payroll costs attributable to our principals and employees. Our compensation methodology is intended to meet the following objectives: (i) support our overall business strategy; (ii) attract, retain and motivate top-tier professionals within the investment management industry; and (iii) align our partner’employees’ interests with those of our equity owners. We have experienced, and expect to continue to experience, a general rise in compensation and benefits expense commensurate with growth in headcount and with the need to maintain competitive compensation levels. Upon the completion of the reorganization and this offering, we will account for partner incentive payments as an expense in our statement of operations and have reflected the related adjustments in our pro forma financial statements. Accordingly, this will have the effect of increasing compensation expense relative to the amounts that have been recorded historically in our financial statements. See “Unaudited Pro Forma Consolidated Financial Information.” The components of our compensation expenses for the three months ended March 31, 2013 and 2012 and three years ended December 31, 2011 and the six months ended June 30, 2012 and 2011 are as follows: | | | | For the Year Ended December 31, | | | For the Six Months Ended
June 30, | | | For the Year Ended December 31, | | | For the Three Months Ended
March 31, | | (in thousands) | | 2011 | | | 2010 | | | 2009 | | | 2012 | | | 2011 | | | 2012 | | | 2011 | | | 2010 | | | 2013 | | | 2012 | | Cash compensation and benefits | | $ | 16,495 | | | $ | 15,936 | | | $ | 15,630 | | | $ | 8,777 | | | $ | 7,973 | | | $ | 17,726 | | | $ | 16,495 | | | $ | 15,936 | | | $ | 4,574 | | | $ | 4,331 | | Distributions on liability awards (1) | | | 20 | | | | 9 | | | | — | | | | 17 | | | | 5 | | | | 28 | | | | 20 | | | | 9 | | | | 7 | | | | 6 | | Non-cash equity-based compensation expense | | | 977 | | | | 583 | | | | — | | | | 806 | | | | 496 | | | | 1,354 | | | | 977 | | | | 583 | | | | 620 | | | | 431 | | | | | | | | | | | | | | | | | | | | | | | | | | | | | | | | | Total compensation expense | | $ | 17,492 | | | $ | 16,528 | | | $ | 15,630 | | | $ | 9,600 | | | $ | 8,474 | | | $ | 19,108 | | | $ | 17,492 | | | $ | 16,528 | | | $ | 5,201 | | | $ | 4,768 | | | | | | | | | | | | | | | | | | | | | | | | | | | | | | | | |
| (1) | Cash distributions on the portion of unvested deferred equity units that are subject to forfeiture are expensed when paid. Unvested deferred equity units are classified as liability awards. |
On February 29, 2012, February 28, 2011 and February 24, 2010, Silvercrest L.P. and Silvercrest GP LLC, our predecessor, granted equity-based compensation awards to certain of their principals based on the fair value of the equity interests of Silvercrest L.P. and Silvercrest GP LLC. Each grant includes a deferred equity unit and performance unit, subject to forfeiture and acceleration of vesting. Each 100 deferred equity units represent the unsecured right to receive one unit of Silvercrest GP LLC and 99 units of Silvercrest L.P., subject to vesting over a four-year period beginning on the first-yearfirst anniversary of the date of grant. Each deferred equity unit, whether vested or unvested, entitles the holder to receive distributions from Silvercrest L.P. and Silvercrest GP LLC as if such holder held such unit. Upon each vesting date, a holder may receive the number of units vested or the equivalent cash value and units, but in no event may the holder receive more than 50% of the aggregate value in cash. To the extent that holders elect to receive up to 50% of the aggregate value in cash, we could have less cash to utilize. We have accounted for the distributions on the portion of the deferred equity units that are subject to forfeiture as compensation expense. Equity-based compensation expense will be recognized on the February 29, 2012, February 28, 2011 and February 24, 2010 deferred equity unit and performance unit awards through February 29, 2016, February 28, 2015 and February 24, 2014, respectively. Each performance unit represents the right to receive one unit of Silvercrest L.P. and one unit of Silvercrest GP LLC for each two units of Silvercrest L.P. and Silvercrest GP LLC, respectively, issued upon vesting of the deferred equity units awarded to the employee, in each case subject to the achievement of defined performance goals. Although performance units will only vest upon the achievement of the performance goals, they are expensed over the same vesting period as the deferred equity units thatwith which they are associated with because there is an explicit service period. For more information on the terms of the deferred equity units and performance units, see “Compensation Discussion and Analysis—Deferred Equity Units and Performance Units.” General and Administrative Expenses General and administrative expenses include occupancy-related costs, professional and outside services fees, office expenses, depreciation and amortization, sub-advisory fees and the costs associated with operating and maintaining our research, trading and portfolio accounting systems. Our costs associated with operating and maintaining our research, trading and portfolio accounting systems and professional services expenses generally increase or decrease in relative proportion to the number of employees retained by us and the overall size and scale of our business operations. Sub-advisory fees will fluctuate based on the level of management fees from funds that utilize sub-advisors. Following this offering, we expect that we will incur additional expenses as a result of becoming a public company for, among other things, directors and officers insurance, director fees, SEC reporting and compliance, including Sarbanes-Oxley compliance, transfer agent fees, professional fees and other similar expenses. These additional expenses will reduce our net income. Other Income Other income is derived primarily from investment income arising from our investments in various private investment funds that were established as part of our investment strategies. We expect the investment components of other income, in the aggregate, to fluctuate based on market conditions and the success of our investment strategies. Performance fees earned from those investment funds in which we have a partnership interest have been earned over the past few years as a result of the achievement of various high water marks depending on the investment fund. These performance fees are recorded based on the equity method of accounting. The majority of our performance fees over the past few years have been earned from our fixed income-related funds. Minority and Non-Controlling Interests After our reorganization, we will be the general partner of Silvercrest L.P. and will control its business and affairs and, therefore, consolidate its financial results with ours. In light of our employees’ expected % interest in Silvercrest L.P. (or % if the underwriters exercise in full their option to purchase additional shares) immediately after the consummation of the reorganization and this offering, we will reflect their partnership interests as a non-controlling interestinterests in our consolidated financial statements. As a result, immediately after the consummation of this offering, our net income, after income attributable to non-controlling interests, will represent % of Silvercrest L.P.’s net income (or % if the underwriters exercise in full their option to purchase additional shares), and similarly, outstanding shares of our Class A common stock will represent % of the outstanding partnership units of Silvercrest L.P. (or % if the underwriters exercise in full their option to purchase additional shares). Provision for Income Tax While Silvercrest L.P. has historically not been subject to U.S. federal and certain state income taxes, it has been subject to the New York City Unincorporated Business Tax. As a result of our reorganization, we will become subject to taxes applicable to C-corporations. We expect our effective tax rate, and the absolute dollar amount of our tax expense, to increase as a result of this reorganization offset by the benefits of the tax receivable agreement. For more information on the pro forma income taxes applicable to us under C-corporation status, see “The Reorganization and Our Holding Company Structure” and “Unaudited Pro Forma Consolidated Financial Information.” Significant TransactionsAcquisition
Milbank
On November 1, 2011,March 28, 2013, we acquired substantially all of thecertain assets of Milbank Winthrop & Co., Inc., or Milbank,Ten-Sixty. Ten-Sixty is a registered investment adviser that managedadvises on approximately $500 million$1.9 billion of assets primarily on behalf of ultra-high net worth families. Theinstitutional clients. This strategic acquisition expands our hedge fund due diligence capabilities and continues the growth of Milbank, a long-standing and highly regarded investment boutique, strengthens Silvercrest L.P.’s presence in the New York market and adds investment managers that have significant experience and knowledge of the industry. Under the terms of the asset purchase agreement, the purchase price for the assets of Milbank consisted of a cash consideration of $3.4 million (net of cash acquired of $0.8 million), interests in Silvercrest L.P. and Silvercrest GP LLC with a fair value of $3.1 million, and a promissory note issued by Silvercrest Asset Management Group LLC to Milbank for $3.2 million. As part of the asset purchase agreement, we are obligated to make future earnout payments to Milbank should specific financial and performance targets be achieved by the Milbankour institutional business. We determined that the acquisition-date fair value of the contingent consideration was $1.7 million based on the likelihood that the financial and performance targets included in the asset purchase agreement will be achieved. Under the terms of the asset purchase agreement, Milbank is entitledwe paid cash consideration at closing of $2.5 million and issued a promissory note to receive six earnout paymentsTen-Sixty for the following periods: November 1, 2011 through December 31, 2011, full calendar years 2012, 2013, 2014 and 2015, and January 1, 2016 through October 31, 2016. Each earnout payment is equal$1.5 million subject to 20% of EBITDA generated by the Milbank business (as defined in the asset purchase agreement) during the relevant earnout period.adjustment. The aggregate principal amount of the earnout payment will vary dependingpromissory note is payable in two initial installments of $0.2 million each on the level of EBITDA that is generated in each respective earnout period. Milbank revenueApril 30, 2013 and operating expenses for the two months ended December 31, 2011 were $0.92013 and then quarterly installments from June 30, 2014 through March 31, 2017 of $0.1 million and $0.4 million, respectively.
LongChamp
In 2009, we entered into a settlement agreement witheach. The principal amount outstanding under this note bears interest at the former ownersrate of The LongChamp Group, Inc., or LGI, to close the business of LGI, a hedge fund advisory business, which was acquired by Silvercrest L.P. in 2007, and terminate all agreements between them and our company. The termination of these agreements coupled with declining economic conditions resulted in various client redemptions. LGI was ultimately wound down in 2009. For further explanation of the closing of the LGI business, see Note 10 to the audited consolidated financial statements of Silvercrest L.P. included elsewhere in this prospectus.five percent per annum.
Operating Results Revenue Our revenues for the sixthree months ended June 30,March 31, 2013 and 2012 and 2011 and the years ended December 31, 2012, 2011 2010 and 20092010 are set forth below: | | | | | | | | | | | For the Three Months Ended March 31, | | | (in thousands) | | For the Six Months Ended June 30, | | | 2013 | | | 2012 | | | 2013 vs. 2012 ($) | | | 2013 vs. 2012 (%) | | | | | 2012 | | | 2011 | | | 2012 vs. 2011 ($) | | 2012 vs. 2011 (%) | | | Management and advisory fees | | $ | 22,327 | | | $ | 18,539 | | | $ | 3,788 | | | | 20.4 | % | | $ | 12,457 | | | $ | 10,682 | | | $ | 1,775 | | | | 16.6 | % | Performance fees and allocations | | | 16 | | | | 31 | | | | (15 | ) | | | -48.4 | % | | | 3 | | | | — | | | | 3 | | | | Family office services | | | 2,444 | | | | 2,209 | | | | 235 | | | | 10.6 | % | | | 1,225 | | | | 1,198 | | | | 27 | | | | 2.3 | % | | | | | | | | | | | | | | | | | | | | | | | | Total revenue | | $ | 24,787 | | | $ | 20,779 | | | $ | 4,008 | | | | 19.3 | % | | $ | 13,685 | | | $ | 11,880 | | | $ | 1,805 | | | | 15.2 | % | | | | | | | | | | | | | | | | | | | | | | | |
| | | | For the Year Ended December 31, | | | For the Years Ended December 31, | | | | | 2011 | | | 2010 | | | 2011 vs. 2010 ($) | | 2011 vs. 2010 (%) | | | (in thousands) | | | 2012 | | | 2011 | | | 2012 vs. 2011 ($) | | | 2012 vs. 2011 (%) | | Management and advisory fees | | $ | 37,869 | | | $ | 32,442 | | | $ | 5,427 | | | | 16.7 | % | | $ | 46,069 | | | $ | 37,869 | | | $ | 8,200 | | | | 21.7 | % | Performance fees and allocations | | | 85 | | | | 548 | | | | (463 | ) | | | -84.5 | % | | | 714 | | | | 85 | | | | 629 | | | | 740.0 | % | Family office services | | | 4,833 | | | | 3,841 | | | | 992 | | | | 25.8 | % | | | 4,907 | | | | 4,833 | | | | 74 | | | | 1.5 | % | | | | | | | | | | | | | | | | | | | | | | | | Total revenue | | $ | 42,787 | | | $ | 36,831 | | | $ | 5,956 | | | | 16.2 | % | | $ | 51,690 | | | $ | 42,787 | | | $ | 8,903 | | | | 20.8 | % | | | | | | | | | | | | | | | | | | | | | | | | | | | | For the Year Ended December 31, | | | | | | 2010 | | | 2009 | | | 2010 vs. 2009 ($) | | 2010 vs. 2009 (%) | | | Management and advisory fees | | $ | 32,442 | | | $ | 29,341 | | | $ | 3,101 | | | | 10.6 | % | | Performance fees and allocations | | | 548 | | | | 96 | | | | 452 | | | | 470.8 | % | | Family office services | | | 3,841 | | | | 3,097 | | | | 744 | | | | 24.0 | % | | | | | | | | | | | | | | | Total revenue | | $ | 36,831 | | | $ | 32,534 | | | $ | 4,297 | | | | 13.2 | % | | | | | | | | | | | | | | |
| | | | | | | | | | | | | | | | | | | | For the Years Ended December 31, | | (in thousands) | | 2011 | | | 2010 | | | 2011 vs. 2010 ($) | | | 2011 vs. 2010 (%) | | Management and advisory fees | | $ | 37,869 | | | $ | 32,442 | | | $ | 5,427 | | | | 16.7 | % | Performance fees and allocations | | | 85 | | | | 548 | | | | (463 | ) | | | -84.5 | % | Family office services | | | 4,833 | | | | 3,841 | | | | 992 | | | | 25.8 | % | | | | | | | | | | | | | | | | | | Total revenue | | $ | 42,787 | | | $ | 36,831 | | | $ | 5,956 | | | | 16.2 | % | | | | | | | | | | | | | | | | | |
The growth in our assets under management during the sixthree months ended June 30, 2011March 31, 2013 and 2012 and from December 31, 2009January 1, 2010 to December 31, 2011 and2012 is described below: | | | | | | | | | Assets Under Management | | | (in billions) | | Assets Under Management | | | Discretionary | | Non-
Discretionary | | Total | | As of December 31, 2011 | | | $ | 7.0 | | | $ | 3.1 | | | $ | 10.1 | | Gross client additions | | | | 1.6 | | | | 0.1 | | | | 1.7 | | Gross client withdrawals | | | | (1.3 | ) | | | (0.1 | ) | | | (1.4 | ) | Market appreciation | | | | 0.4 | | | | 0.3 | | | | 0.6 | | | | | Discretionary | | Non-Discretionary | | Total | | | | | | | | | | | As of December 31, 2010 | | $ | 6.3 | | | $ | 2.9 | | | $ | 9.2 | | | As of March 31, 2012 | | | $ | 7.7 | | | $ | 3.4 | | | $ | 11.1 | (2) | | | | | | | | | | | | As of December 31, 2012 | | | $ | 8.0 | | | $ | 3.1 | | | $ | 11.2 | | Gross client additions | | | | 1.6 | | | | 2.0 | | | | 3.6 | | Gross client withdrawals | | | | (1.5 | ) | | | (0.2 | ) | | | (1.7 | ) | Market appreciation | | | | 0.5 | | | | 0.1 | | | | 0.6 | | | | | | | | | | | | | As of March 31, 2013 | | | $ | 8.6 | | | $ | 5.0 | | | $ | 13.6 | (2) | | | | | | | | | | | | As of January 1, 2010 | | | $ | 6.1 | | | $ | 2.7 | | | $ | 8.8 | | Gross client inflows | | | 1.5 | | | | 1.0 | | | | 2.5 | | | | 1.5 | | | | 1.0 | | | | 2.5 | | Gross clientoutflows | | | (1.1 | ) | | | (0.7 | ) | | | (1.8 | ) | | | (1.7 | ) | | | (0.8 | ) | | | (2.5 | ) | Market appreciation (1) | | | 0.4 | | | | 0.3 | | | | 0.7 | | | | | | | | | | | | | | As of June 30, 2011 | | $ | 7.1 | | | $ | 3.5 | | | $ | 10.6 | | | | | | | | | | | | | | As of December 31, 2011 | | $ | 7.0 | | | $ | 3.1 | | | $ | 10.1 | | | Gross client inflows | | | 3.0 | | | | 0.3 | | | | 3.3 | | | Gross clientoutflows | | | (2.7 | ) | | | (0.3 | ) | | | (3.0 | ) | | Market appreciation (1) | | | 0.3 | | | | — | | | | 0.3 | | | | | | | | | | | | | | As of June 30, 2012 | | $ | 7.6 | | | $ | 3.1 | | | $ | 10.7 | | | | | | | | | | | | | | As of January 1, 2009 | | $ | 6.0 | | | $ | 1.8 | | | $ | 7.8 | | | Gross client inflows | | | 1.4 | | | | 0.5 | | | | 1.9 | | | Gross client outflows | | | (2.5 | ) | | | (0.7 | ) | | | (3.2 | ) | | Market appreciation (1) | | | 1.2 | | | | 1.1 | | | | 2.3 | | | | | | | | | | | | | | As of December 31, 2009 | | $ | 6.1 | | | $ | 2.7 | | | $ | 8.8 | | | Gross client inflows | | | 1.5 | | | | 1.0 | | | | 2.5 | | | Gross clientoutflows | | | (1.7 | ) | | | (0.8 | ) | | | (2.5 | ) | | Market appreciation (depreciation) (1) | | | 0.5 | | | | (0.1 | ) | | | 0.4 | | | Market appreciation (depreciation) (1) | | | | 0.5 | | | | (0.1 | ) | | | 0.4 | | | | | | | | | | | | | | | | | | | | | As of December 31, 2010 | | $ | 6.4 | | | $ | 2.8 | | | $ | 9.2 | | | | 6.3 | | | | 2.9 | | | | 9.2 | | Gross client inflows | | | 3.6 | | | | 1.5 | | | | 5.1 | | | | 3.8 | | | | 1.5 | | | | 5.3 | | Gross clientoutflows | | | (3.1 | ) | | | (1.1 | ) | | | (4.2 | ) | | | (3.1 | ) | | | (1.2 | ) | | | (4.3 | ) | Market appreciation (depreciation) (1) | | | 0.1 | | | | (0.1 | ) | | | — | | | | 0.1 | | | | (0.1 | ) | | | — | | | | | | | | | | | | | | | | | | | | | As of December 31, 2011 | | $ | 7.0 | | | $ | 3.1 | | | $ | 10.1 | (2) | | | 7.0 | | | | 3.1 | | | | 10.1 | | Gross client inflows | | | | 6.7 | | | | 0.6 | | | | 7.3 | | Gross client outflows | | | | (6.3 | ) | | | (0.6 | ) | | | (6.9 | ) | Market appreciation (1) | | | | 0.5 | | | | 0.1 | | | | 0.6 | | | | | | | | | | | | | | | | | | | | | As of December 31, 2012 | | | $ | 8.0 | | | $ | 3.1 | | | $ | 11.2 | (2) | | | | | | | | | | | |
| (1) | For additional investment strategy performance information disclosed elsewhere in this prospectus, please see the “Business” section. |
| (2) | Less than 5% of assets under management generate performance fees. |
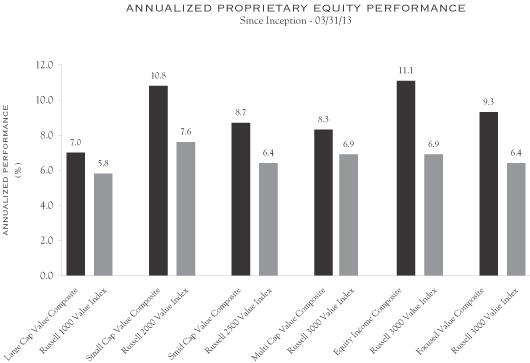
SixThree Months Ended June 30,March 31, 2013 versus Three Months Ended March 31, 2012
Our total revenue increased by $1.8 million, or 15.2%, to $13.7 million for the three months ended March 31, 2013, from $11.9 million for the three months ended March 31, 2012. This increase was driven primarily by growth in our management and advisory fees as a result of increased assets under management. Assets under management increased by $2.4 billion, or 21.4%, to $13.6 billion at March 31, 2013 from $11.2 billion at December 31, 2012. Contributing to the growth in assets under management was $1.9 billion of assets under management related to the Ten-Sixty acquisition, $1.6 billion of client inflows and $0.6 billion in market appreciation, partially offset by client outflows of $1.7 billion. Our market appreciation during the three months ended March 31, 2013 constituted a 5.4% rate of increase in our total assets under management compared to the year ended December 31, 2012. Our growth in assets under management for the three months ended March 31, 2013 was attributable to an increase of $0.6 billion and $1.9 billion in discretionary and non-discretionary assets under management, respectively, primarily related to the Ten-Sixty acquisition, The growth in our discretionary assets under management was primarily driven by an increase in separately managed accounts. An increase in the concentration of equity securities, which are included in discretionary assets under management and whose fee rates are higher than those of other investments, was the primary driver of increased management and advisory fees revenue for the three months ended March 31, 2013 compared to the prior year. Sub-advised fund management revenue remained flat for the three months ended March 31, 2013 compared to the same period in the prior year. Proprietary fund management revenue increased by $0.2 million to $1.9 million for the three months ended March 31, 2013 from $1.7 million for the same period in the prior year. This increase in proprietary fund management revenue was primarily attributable to market appreciation. With respect to our discretionary assets under management, equity assets experienced growth of 11.7% during the three months ended March 31, 2013 while fixed income assets experienced growth of 1.9% during the same period. Most of our growth came from our small cap value, equity income and large cap value strategies with composite returns of 12.7%, 11.8% and 12.2%, respectively. As of March 31, 2013, the composition of our assets under management was 63% in discretionary assets, which includes both separately managed accounts and proprietary and sub-advised funds, and 37% in non-discretionary assets which represent assets on which we provide portfolio reporting but do not have investment discretion. Year Ended December 31, 2012 versus Six MonthsYear Ended June 30,December 31, 2011 Our total revenue increased by $4.0$8.9 million, or 19.3%20.8%, to $24.8$51.7 million for the six monthsyear ended June 30,December 31, 2012, from $20.8$42.8 million for the six monthsyear ended June 30,December 31, 2011. This increase was driven primarily by growth in our management and advisory fees as a result of increased assets under management. Assets under management increased by $0.6$1.1 billion, or 5.9%10.9%, to $10.7$11.2 billion at June 30,December 31, 2012 from $10.1 billion at December 31, 2011. Contributing to the growth in assets under management was $3.3$7.3 billion of client inflows and $0.3$0.7 billion in market appreciation, partially offset by client outflows of $3.0$6.9 billion. Our market appreciation during the six monthsyear ended June 30,December 31, 2012 constituted a 3.0%6.9% rate of increase in our total assets under management compared to the year ended December 31, 2011. Our growth in assets under management for the six monthsyear ended June 30,December 31, 2012 was primarily attributable to an increase of $0.6$0.9 billion in separately managed accounts, which are included in discretionary assets under management. An increase in the concentration of equity securities, which are included in discretionary assets under management and whose fee rates are higher than those of other investments, was the primary driver of increased management and advisory fees revenue for the six monthsyear ended June 30,December 31, 2012 compared to the same period in the prior year. Sub-advised fund management revenue decreased by $0.3$0.4 million to $0.6$1.2 million for the six monthsyear ended June 30,December 31, 2012 from $0.9$1.6 million for the same period in the prior year. While sub-advised fund assets under management remained flat as of June 30,December 31, 2012 as compared to December 31, 2011, client redemptions primarily contributed to the decrease in sub-advised fund management revenue. Proprietary fund management revenue increased by $2.1$3.5 million to $3.7$7.3 million for the six monthsyear ended June 30,December 31, 2012 from $1.6$3.8 million for the same period in the prior year. This increase in proprietary fund management revenue was attributable to a $0.4 billion increase in proprietary fund assets under management from $0.4 billion asthe acquisition of June 30, 2011 to $0.8 billion as of June 30, 2012 primarily as a result of the addition of $0.3 billion of Milbank fund assets under management in November 2011. With respect to our discretionary assets under management, equity and fixed income assets experienced growth of 23.7% and 3.6%, respectively, for30.5% during the six monthsyear ended June 30, 2012.December 31, 2012 while fixed income assets were flat during the same period. Most of our growth came from our equity incomeSMID cap, multi cap and small cap value strategies with composite returns of 8.0%16.7%, 16.5% and 7.7%16.0%, respectively. As of June 30,December 31, 2012, the composition of our assets under management was 71%72% in discretionary assets, which includes both separately managed accounts and proprietary and sub-advised funds, and 29%28% in non-discretionary assets which represent assets on which we provide portfolio reporting but do not have investment discretion. Assets under managementPerformance fee revenue increased by $1.4 billion, or 15.2%,$629 thousand to $10.6 billion at June 30, 2011 from $9.2 billion at December 31, 2010. Contributing to the growth in assets under management was $2.5 billion of client inflows and $0.7 billion in market appreciation partially offset by client outflows at $1.8 billion. Our market appreciation during the six months ended June 30, 2011 constituted a 7.6% rate of increase in our total assets under management compared to$714 thousand for the year ended December 31, 2010. Our growth in assets under management2012 from $85 thousand for the six monthsyear ended June 30, 2011 wasDecember 31, 2011. These performance fees are primarily related to external investment strategies in which we have a revenue sharing arrangement. The increase in performance fee revenue is directly attributable to an increasehigher returns achieved at our external investment strategies. The balance of $0.8 billion in separately managed accounts, whichour performance fees are earned from proprietary funds and are included in discretionary assets under management, and $0.6 billionequity income from investments, which is discussed below in non-discretionary assets. An increase in“—Other Income (Expense).”
Family office services income increased by $0.1 million or 1.5%, from $4.8 million for the concentration of equity securities, which are included in discretionary assets under management and whose fee rates are higher than those of other investments, wasyear ended December 31, 2011 to $4.9 million for the primary driveryear ended December 31, 2012, primarily as a result of increased discretionary assets under managementfees from December 31, 2010 to June 30, 2011. Proprietary fund assets under management asexisting clients because of June 30, 2011 remained flat as compared to December 31, 2010. With respect to our discretionary assets under management, equities experienced growthincreased rates in certain cases and a greater amount of 17.6% while fixed income assets remained flat for the six months ended June 30, 2011. Most of our growth came from our equity income, large cap value, multi cap value, and small cap value portfolios with composite returns of 8.0%, 7.3%, 9.1%, and 8.2%, respectively. The increaseservices provided in non-discretionary assets was primarily driven by a new family office relationship entered into during the six months ended June 30, 2011. As of June 30, 2011, the composition of our assets under management was 67% in discretionary assets, which includes both separately managed accounts and proprietary and sub-advised funds, and 33% in non-discretionary assets which represent assets on which we provide portfolio reporting but do not have investment discretion.other cases. Year Ended December 31, 2011 versus Year Ended December 31, 2010 Our total revenue increased by $6.0 million, or 16.2%, to $42.8 million for the year ended December 31, 2011, from $36.8 million for the year ended December 31, 2010. This increase was driven primarily by growth in our management and advisory fees as a result of increased assets under management. Assets under management increased by $0.9 billion, or 9.8%, to $10.1 billion at December 31, 2011 from $9.2 billion at December 31, 2010. Contributing to the growth in assets under management was $5.1 billion of net client inflows partially offset by $4.2 billion of client outflows. Our growth in assets under management in 2011 was primarily attributable to an increase of $0.5 billion in separately managed accounts and $0.2 billion in proprietary and sub-advised funds, which are included in discretionary assets under management. An increase in the concentration of equity securities, which are included in discretionary assets under management and whose fee rates are higher than those of other investments, was the primary driver of increased management and advisory fees revenue for the year ended December 31, 2011 compared to the year ended December 31, 2010. Sub-advised fund management revenue increased by $0.2 million to $1.6 million for the year ended December 31, 2011 from $1.4 million for the year ended December 31, 2010 while sub-advised fund assets under management remained flat. Proprietary fund management revenue increased by $0.3 million to $3.8 million for the year ended December 31, 2011 from $3.5 million for the year ended December 31, 2010. This increase in proprietary fund management revenue was attributable to a $0.2 billion increase in proprietary fund assets under management from $0.5 billion as of December 31, 2010 to $0.7 billion as of December 31, 2011. This increase was primarily the result of the addition of $0.3 billion of Milbank fund assets under management in November 2011, partially offset by $0.1 billion of client fund redemptions. With respect to our discretionary assets under management, equities experienced growth of 9.4% while fixed income assets declined 3.0% for the year ended December 31, 2011. Most of our growth came from our equity income, multi cap value and small cap value strategies with composite returns of 4.4%, 0.5%, and 1.5%, respectively. As of December 31, 2011, the composition of our assets under management was 70% in discretionary assets, which includes both separately managed accounts and proprietary and sub-advised funds, and 30% in non-discretionary assets, which represent assets on which we provide portfolio reporting but do not have investment discretion. Performance fee revenue decreased by $463 thousand to $85 thousand for the year ended December 31, 2011 from $548 thousand for the year ended December 31, 2010. These performance fees are primarily related to external investment strategies in which we have a revenue sharing arrangement. The decrease in performance fee revenue is directly attributable to lower returns achieved at our external investment strategies. The balance of our performance fees are earned from proprietary funds and are included in equity income from investments, which is discussed below in “—Other Income (Expense)., Net.” Family office services income increased by $1.0 million or 25.8%, from $3.8 million for the year ended December 31, 2010 to $4.8 million for the year ended December 31, 2011, primarily as a result of the addition of significant family relationships in 2011 and increased fees from existing clients because of increased rates in certain cases and a greater amount of services provided in other cases. Year Ended December 31, 2010 versus Year Ended December 31, 2009
Our total revenue increased by $4.3 million, or 13.2%, to $36.8 million for the year ended December 31, 2010, from $32.5 million for the year ended December 31, 2009. This increase was driven primarily by growth in our management and advisory fees as a result of increased assets under management.
Assets under management increased by $0.4 billion, or 4.5%, to $9.2 billion at December 31, 2010 from $8.8 billion at December 31, 2009. Contributing to the growth in assets under management was $0.4 billion in market appreciation. Our market appreciation during the year ended December 31, 2010 constituted a 4.5% rate of increase in our total assets under management compared to the year ended December 31, 2009. Our growth in assets under management in 2010 was attributable to an increase of $0.3 billion in discretionary separately managed accounts, and $0.2 billion in non-discretionary assets. An increase in the concentration of equity securities, which are included in discretionary assets under management and whose fee rates are higher than those of other investments, was the primary driver of increased management and advisory fees revenue for the year ended December 31, 2010 compared to the year ended December 31, 2009. Sub-advised fund management revenue decreased by $1.0 million to $1.4 million for the year ended December 31, 2010 from $2.4 million for the year ended December 31, 2009. With respect to our discretionary assets under management, equities experienced growth of 13.0% while fixed income assets declined 6.3% for the year ended December 31, 2010. Most of our growth came from our equity income, large cap value, multi cap value and small cap value strategies with composite returns of 17.5%, 15.4%, 19.4%, and 25.7%, respectively. The closing of our LongChamp business contributed to this decrease in sub-advised fund management revenue. Proprietary fund management revenue increased by $0.5 million to $3.5 million for the year ended December 31, 2010 from $3.0 million for the year ended December 31, 2009. As of December 31, 2010, the composition of our assets under management was 69% in discretionary assets, which includes both separately managed accounts and proprietary and sub-advised funds, and 31% in non-discretionary assets, which represent assets on which we provide portfolio reporting but do not have investment discretion.
Assets under management increased by $1.0 billion, or 12.8%, to $8.8 billion at December 31, 2009 from $7.8 billion at December 31, 2008. Contributing to the growth in assets under management was $1.9 billion of
client inflows and $2.3 billion in market appreciation, partially offset by $3.2 billion of client outflows. Our market appreciation during the year ended December 31, 2009 constituted a 29.5% rate of increase in our total assets under management compared to the year ended December 31, 2008. Our growth in assets under management in 2009 was attributable to an increase of $0.2 billion in separately managed accounts, which are included in discretionary assets under management, and $0.9 billion in non-discretionary assets. An increase in the concentration of equity securities, which are included in discretionary assets under management, was the primary driver of increased management and advisory fees revenue for the year ended December 31, 2009 compared to the year ended December 31, 2008. Sub-advised fund management revenue decreased by $5.7 million to $2.4 million for the year ended December 31, 2009 from $8.1 million for the year ended December 31, 2008. This decrease in sub-advised fund management revenue was the result of a decrease in sub-advised fund assets under management from $0.5 billion as of December 31, 2008 to $0.3 billion as of December 31, 2009 because of the closing of our LongChamp business and other client fund redemptions. Proprietary fund management revenue decreased by $1.1 million to $3.0 million for the year ended December 31, 2009 from $4.1 million for the year ended December 31, 2008 primarily as a result of lower revenue from our fixed income funds. With respect to our discretionary assets under management, equity and fixed income assets experienced growth of 34.9% and 43.3%, respectively, for the year ended December 31, 2009. Most of our growth came from our large cap value, multi cap value, and small cap value strategies with composite returns of 29.6%, 30.5%, and 24.7%, respectively. Most of our fixed income asset growth came from our separately managed accounts with composite returns for our taxable high yield and core fixed income strategies of 36.5% and 3.0%, respectively. As of December 31, 2009, the composition of our assets under management was 69% in discretionary assets, which includes both separately managed accounts and proprietary and sub-advised funds, and 31% in non-discretionary assets, which represent assets on which we provide portfolio reporting but do not have investment discretion.
Performance fee revenue increased by $452 thousand to $548 thousand for the year ended December 31, 2010 from $96 thousand for the year ended December 31, 2009. These performance fees are primarily related to external investment strategies in which we have a revenue sharing arrangement. The increase in performance fee revenue is directly attributable to higher returns achieved at our external investment strategies. The balance of our performance fees are included in equity income from investments which is discussed below in “—Other Income (Expense).”
Family office services income increased by $0.7 million, or 24.0%, from $3.1 million for the year ended December 31, 2009 to $3.8 million for the year ended December 31, 2010, primarily as a result of increases to fee rates for existing clients.
Expenses Our expenses for the sixthree months ended June 30,March 31, 2013 and 2012 and 2011 and the years ended December 31, 2012, 2011 2010 and 20092010 are set forth below: | | | | | | | | | | | For the Three Months Ended March 31, | | | (in thousands) | | For the Six Months Ended June 30, | | | 2013 | | | 2012 | | | 2013 vs. 2012 ($) | | | 2013 vs. 2012 (%) | | | | | 2012 | | | 2011 | | | 2012 vs. 2011 ($) | | | 2012 vs. 2011 (%) | | | Compensation and benefits | | $ | 9,600 | | | $ | 8,474 | | | $ | 1,126 | | | | 13.3 | % | | $ | 5,201 | | | $ | 4,768 | | | $ | 433 | | | | 9.1 | % | General and administrative | | | 5,208 | | | | 4,424 | | | | 784 | | | | 17.7 | % | | General, administrative and other | | | | 2,710 | | | | 2,566 | | | | 144 | | | | 5.6 | % | | | | | | | | | | | | | | | | | | | | | | | | Total expenses | | $ | 14,808 | | | $ | 12,898 | | | $ | 1,910 | | | | 14.8 | % | | $ | 7,911 | | | $ | 7,334 | | | $ | 577 | | | | 7.9 | % | | | | | | | | | | | | | | | | | | | | | | | | | | | | For the Year Ended December 31, | | | | | | 2011 | | | 2010 | | | 2011 vs. 2010 ($) | | | 2011 vs. 2010 (%) | | | Compensation and benefits | | $ | 17,492 | | | $ | 16,528 | | | $ | 964 | | | | 5.8 | % | | General and administrative | | | 10,849 | | | | 9,459 | | | | 1,390 | | | | 14.7 | % | | | | | | | | | | | | | | | Total expenses | | $ | 28,341 | | | $ | 25,987 | | | $ | 2,354 | | | | 9.1 | % | | | | | | | | | | | | | | |
| | | | | | | | | | | | | | | | | | | | For the Years Ended December 31, | | (in thousands) | | 2012 | | | 2011 | | | 2012 vs. 2011 ($) | | | 2012 vs. 2011 (%) | | Compensation and benefits | | $ | 19,108 | | | $ | 17,492 | | | $ | 1,616 | | | | 9.2 | % | General, administrative and other | | | 13,680 | | | | 10,849 | | | | 2,831 | | | | 26.1 | % | | | | | | | | | | | | | | | | | | Total expenses | | $ | 32,788 | | | $ | 28,341 | | | $ | 4,447 | | | | 15.7 | % | | | | | | | | | | | | | | | | | |
| | | | For the Year Ended December 31, | | | For the Years Ended December 31, | | | | | 2010 | | | 2009 | | | 2010 vs. 2009 ($) | | 2010 vs. 2009 (%) | | | (in thousands) | | | 2011 | | | 2010 | | | 2011 vs. 2010 ($) | | | 2011 vs. 2010 (%) | | Compensation and benefits | | $ | 16,528 | | | $ | 15,630 | | | $ | 898 | | | | 5.7 | % | | $ | 17,492 | | | $ | 16,528 | | | $ | 964 | | | | 5.8 | % | General and administrative | | | 9,459 | | | | 13,006 | | | | (3,547 | ) | | | -27.3 | % | | | 10,849 | | | | 9,459 | | | | 1,390 | | | | 14.7 | % | Impairment charges | | | — | | | | 1,691 | | | | (1,691 | ) | | | -100 | % | | | | | | | | | | | | | | | | | | | | | | | | | Total expenses | | $ | 25,987 | | | $ | 30,327 | | | $ | (4,340 | ) | | | -14.3 | % | | $ | 28,341 | | | $ | 25,987 | | | $ | 2,354 | | | | 9.1 | % | | | | | | | | | | | | | | | | | | | | | | | |
Our expenses are driven primarily by our compensation costs. The table included in “—Expenses—Compensation and Benefits Expense” describes the components of our compensation expense for the sixthree months ended June 30,March 31, 2013 and 2012 and 2011 andfor the three years ended December 31, 2011.2012. Other expenses, such as rent, professional service fees, data-related costs, and sub-advisory fees incurred are included in our general and administrative expenses. SixThree Months Ended June 30,March 31, 2013 versus Three Months Ended March 31, 2012
Total expenses increased by $0.6 million, or 7.9%, to $7.9 million for the three months ended March 31, 2013 from $7.3 million for the three months ended March 31, 2012. This increase was primarily attributable to increases in compensation and benefits expense and general and administrative expenses of $0.4 million and $0.2 million, respectively. Compensation and benefits expense increased by $0.4 million, or 9.1%, to $5.2 million for the three months ended March 31, 2013 from $4.8 million for the three months ended March 31, 2012. The increase was primarily attributable to an increase in salaries of $0.2 million as a result of both merit increases and increased headcount, and increased equity-based compensation expense of $0.2 million primarily due to an increase in the fair value of the deferred equity units. General and administrative expenses increased by $0.1 million, or 5.6%, to $2.7 million for the three months ended March 31, 2013 from $2.6 million for the three months ended March 31, 2012. This increase was primarily due to an increase in professional fees of $64 thousand for legal fees related to the Ten-Sixty acquisition, higher operating escalation charges of $20 thousand at our corporate headquarters, and increased sub-advisory fees of $34 thousand related to increased services received in addition to increased fund management revenue. Year Ended December 31, 2012 versus Six MonthsYear Ended June 30,December 31, 2011 Total expenses increased by $1.9$4.5 million, or 14.8%15.7%, to $14.8$32.8 million for the six monthsyear ended June 30,December 31, 2012 from $12.9$28.3 million for the six monthsyear ended June 30,December 31, 2011. This increase was primarily attributable to increases in compensation and benefits expense and general and administrative expenses of $1.1$1.6 million and $0.8$2.8 million, respectively. Compensation and benefits expense increased by $1.1$1.6 million, or 13.3%9.2%, to $9.6$19.1 million for the six monthsyear ended June 30,December 31, 2012 from $8.5$17.5 million for the six monthsyear ended June 30,December 31, 2011. The increase was primarily attributable to an increase in salaries of $0.6$0.9 million as a result of both merit increases and increased headcount primarily as a result of the Milbank acquisition, increased incentive compensation expense of $0.1$0.3 million, and increased equity-based compensation expense of $0.3 million due to the grant of additional deferred equity units to employees and an increase in the fair value of the deferred equity units. General and administrative expenses increased by $0.8$2.8 million, or 17.7%26.1%, to $5.2$13.7 million for the six monthsyear ended June 30,December 31, 2012 from $4.4$10.9 million for the six monthsyear ended June 30,December 31, 2011. This increase was primarily due to an increase in professional fees of $2.3 million for services rendered in connection with a planned initial public offering that was withdrawn in November 2012 and acquisition transactions and depreciation and amortization expense of $0.3$0.4 million dueprimarily related to amortization of intangible assets related to Milbank, a $0.2 million increase in costs related to the development of our portfolio management system and investment research and pricing subscriptions, a $0.1 million increase in rent as a resultpart of the Milbank acquisition and the non-renewal of one of our sub-leases, and a $0.6 million increase in professional fees including acquisition transactions. transaction. On May 1, 2012, we reoccupied space at our headquarters that we had previously abandoned in 2009. As a result, we recorded a reversal of a lease abandonmentthis released the remaining abandonment-related liability of $0.7 million. This reversal was partially offset by increased operating cost escalations of $0.2 million which reduced occupancy expense for the six months ended June 30, 2012.and lower sub-tenant rent of $0.2 million. Year Ended December 31, 2011 versus Year Ended December 31, 2010 Total expenses increased by $2.4 million, or 9.1%, to $28.3 million for the year ended December 31, 2011 from $26.0 million for the year ended December 31, 2010. This increase was primarily attributable to increases in compensation and benefits expense and general and administrative expenses of $1.0 million and $1.4 million, respectively. Compensation and benefits expense increased by $1.0 million, or 5.8%, to $17.5 million for the year ended December 31, 2011 from $16.5 million for the year ended December 31, 2010. The increase was primarily attributable to an increase in equity-based compensation expense of $0.5 million due to the grant of deferred equity units to employees, increased salaries of $0.8 million as a result of both merit increases and increased headcount, and increased benefits and payroll taxes expense of $0.1 million, partially offset by lower employee bonus expense of $0.4 million. General and administrative expenses increased by $1.4 million, or 14.7%, to $10.8 million for the year ended December 31, 2011 from $9.4 million for the year ended December 31, 2010. This increase was primarily due to an increase in professional fees of $0.8 million for services rendered in connection with this offering and acquisition transactions, $0.7 million in reimbursements to clients and a $0.2 million increase in costs related to the development of our portfolio management system and investment research and pricing subscriptions, offset by decreased occupancy costs of $0.3 million due to increased sub-tenant rent. Other Income (Expense), Net | | | | | | | | | | | | | | | | | | | | For the Three Months Ended March 31, | | (in thousands) | | 2013 | | | 2012 | | | 2013 vs. 2012 ($) | | | 2013 vs. 2012 (%) | | Other income (expense), net | | $ | 29 | | | $ | 32 | | | $ | (3 | ) | | | -9.4 | % | Interest income | | | 27 | | | | 45 | | | | (18 | ) | | | -40.0 | % | Interest expense | | | (37 | ) | | | (64 | ) | | | 27 | | | | -42.2 | % | | | | | | | | | | | | | | | | | | Total other income (expense), net | | $ | 19 | | | $ | 13 | | | $ | 6 | | | | 46.2 | % | | | | | | | | | | | | | | | | | |
| | | | | | | | | | | | | | | | | | | | For the Years Ended December 31, | | (in thousands) | | 2012 | | | 2011 | | | 2012 vs. 2011 ($) | | | 2012 vs. 2011 (%) | | Loss on forgiveness of notes receivable | | $ | — | | | $ | (34 | ) | | $ | 34 | | | | -100.0 | % | Other | | | 123 | | | | (210 | ) | | | 333 | | | | -41.4 | % | Interest income | | | 145 | | | | 187 | | | | (42 | ) | | | -22.5 | % | Interest expense | | | (304 | ) | | | (164 | ) | | | (140 | ) | | | 85.4 | % | Equity income from investments | | | 1,911 | | | | 950 | | | | 961 | | | | -158.6 | % | | | | | | | | | | | | | | | | | | Total other income (expense), net | | $ | 1,875 | | | $ | 729 | | | $ | 1,146 | | | | 157.2 | % | | | | | | | | | | | | | | | | | |
| | | | | | | | | | | | | | | | | | | | For the Years Ended December 31, | | (in thousands) | | 2011 | | | 2010 | | | 2011 vs. 2010 ($) | | | 2011 vs. 2010 (%) | | Loss on forgiveness of notes receivable | | $ | (34 | ) | | $ | (508 | ) | | $ | 474 | | | | -93.3 | % | Other | | | (210 | ) | | | 32 | | | | (242 | ) | | | -756.3 | % | Interest income | | | 187 | | | | 231 | | | | (44 | ) | | | -19.0 | % | Interest expense | | | (164 | ) | | | (241 | ) | | | 77 | | | | -32.0 | % | Equity income from investments | | | 950 | | | | 1,241 | | | | (291 | ) | | | -23.4 | % | | | | | | | | | | | | | | | | | | Total other income (expense), net | | $ | 729 | | | $ | 755 | | | $ | (26 | ) | | | -3.4 | % | | | | | | | | | | | | | | | | | |
Three Months Ended March 31, 2013 versus Three Months Ended March 31, 2012 Other income (expense), net increased by $6 thousand to $19 thousand of other income for the three months ended March 31, 2013 from $13 thousand of other income for the three months ended March 31, 2012. Year Ended December 31, 20102012 versus Year Ended December 31, 20092011 Total expenses decreasedOther income (expense), net increased by $4.3$1.1 million or 14.3%, to $26.0$1.9 million for the year ended December 31, 20102012 from $30.3$0.7 million for the year ended December 31, 2009. This was primarily2011. The increase in other income (expense), net is attributable to decreasesa $1.0 million increase in general and administrative expenses and impairment charges of $3.5 million and $1.7 million, respectively,equity income from investments resulting from performance fee allocations partially offset by a $0.9 million increase in compensation and benefits expense.
Compensation and benefits expense increased by $0.9 million, or 5.7%, to $16.5 million for the year ended December 31, 2010 from $15.6 million for the year ended December 31, 2009. The increase was primarily attributable to a $0.6 million increase in equity-based compensation expense, increased employee bonusnet interest expense of $0.1$0.2 million a $0.1 million increase in salaries, and $0.1 million of severance charges related to the termination of two employees.
General and administrative expenses decreased by $3.5 million, or 27.3%, to $9.5 million for the year ended December 31, 2010 from $13.0 million for the year ended December 31, 2009. This $3.5 million decrease was primarily attributable to a one-time $1.2 million lease abandonment charge in 2009 for space at our corporate headquarters, and a $2.3 million decrease in LGI operating expenses as a result of the wind-down of our LGI business in 2009.
Impairment charges decreased by $1.7 million from the year ended December 31, 2009 to the year ended December 31, 2010 as a result of a $1.2 million leasehold improvements impairment charge in 2009 related to the abandonment of a portion of the leased space at our corporate headquarters. Also, a $0.5 million charge was taken in 2009 to write-off goodwill and assets related to the LGI business closure.
Other Income (Expense)
| | | | | | | | | | | | | | | | | | (in thousands) | | For the Six Months Ended June 30, | | | | | 2012 | | | 2011 | | | 2012 vs. 2011 ($) | | | 2012 vs. 2011 (%) | | Other income (expense) | | $ | 61 | | | $ | (176 | ) | | $ | 237 | | | | -134.7 | % | Interest income | | | 86 | | | | 92 | | | | (6 | ) | | | -6.5 | % | Interest expense | | | (206 | ) | | | (75 | ) | | | (131 | ) | | | 174.7 | % | | | | | | | | | | | | | | | | | | Total other income (expense) | | $ | (59 | ) | | $ | (159 | ) | | $ | 100 | | | | -62.9 | % | | | | | | | | | | | | | | | | | | | | | | | For the Year Ended December 31, | | | | | 2011 | | | 2010 | | | 2011 vs. 2010 ($) | | | 2011 vs. 2010 (%) | | Loss on forgiveness of notes receivable | | $ | (34 | ) | | $ | (508 | ) | | $ | 474 | | | | -93.3 | % | Interest income | | | 187 | | | | 231 | | | | (44 | ) | | | -19.0 | % | Interest expense | | | (164 | ) | | | (241 | ) | | | 77 | | | | -32.0 | % | Equity income from investments | | | 950 | | | | 1,241 | | | | (291 | ) | | | -23.4 | % | Other | | | (210 | ) | | | 32 | | | | (242 | ) | | | -756.3 | % | | | | | | | | | | | | | | | | | | Total other income (expense) | | $ | 729 | | | $ | 755 | | | $ | (26 | ) | | | -3.4 | % | | | | | | | | | | | | | | | | | |
| | | | | | | | | | | | | | | | | | (in thousands) | | For the Year Ended December 31, | | | | | 2010 | | | 2009 | | | 2010 vs. 2009 ($) | | | 2010 vs. 2009 (%) | | Gain on extinguishment of debt | | $ | — | | | $ | 3,934 | | | $ | (3,934 | ) | | | -100.0 | % | Gain on settlement with former LGI shareholders | | | — | | | | 1,470 | | | | (1,470 | ) | | | -100.0 | % | Loss on forgiveness of notes receivable | | | (508 | ) | | | — | | | | (508 | ) | | | — | | Interest income | | | 231 | | | | 213 | | | | 18 | | | | 8.5 | % | Interest expense | | | (241 | ) | | | (467 | ) | | | 226 | | | | -48.4 | % | Equity income from investments | | | 1,241 | | | | 274 | | | | 967 | | | | 352.9 | % | Other | | | 32 | | | | 134 | | | | (102 | ) | | | -76.1 | % | | | | | | | | | | | | | | | | | | Total other income (expense) | | $ | 755 | | | $ | 5,558 | | | $ | (4,803 | ) | | | -86.4 | % | | | | | | | | | | | | | | | | | |
Six Months Ended June 30, 2012 versus Six Months Ended June 30, 2011
Other income (expense) decreased by $100 thousand to ($59) thousand for the six months ended June 30, 2012 from ($159) thousand for the six months ended June 30, 2011. The decrease in other income (expense) is attributable to $0.2 million loss on a sub-lease charge related to a new sub-tenant on our leased space in January 2011. Interest expense increased by $131 thousand to $206 thousand for the six months ended June 30, 2012 from $75 thousand for the six months ended June 30, 2011, primarily due to a write off prepaid interest expense of $86 thousand related to the reversal of thea lease abandonment liability in addition to an increase in notes payable issued in connection with the acquisition of Milbank.
Year Ended December 31, 2011 versus Year Ended December 31, 2010 Other income (expense), net decreased by $26 thousand, or 3.4%, to $0.7 million for the year ended December 31, 2011 from $0.8 million for the year ended December 31, 2010. In 2011 and 2010, we recorded losses on the forgiveness of notes receivable of $34 thousand and $508 thousand, respectively, in connection with the termination of principalsemployee-partners and the related termination of existing notes in exchange for the repurchase of units of Silvercrest L.P. and Silvercrest GP LLC. Interest income decreased by $44 thousand or 19.0% to $187 thousand for the year ended December 31, 2011 from $231 thousand for the year ended December 31, 2010. Interest expense decreased by $77 thousand or 32.0% to $164 thousand for the year ended December 31, 2011 from $241 thousand for the year ended December 31, 2010. Equity income from investments decreased by $0.3 million primarily as a result of decreased performance fee allocations from some of our funds. Other income (expense) decreased by $0.2 million as a result of a $0.1 million loss on sub-lease charge related to a new sub-tenant on our leased space in January 2011 and $0.1 million of unrealized and realized losses related to an investment in marketable securities. Provision for Income Taxes Three Months Ended March 31, 2013 versus Three Months Ended March 31, 2012 The provision for income taxes was $0.3 million for the three months ended March 31, 2013 and 2012. Our provision for income taxes as a percentage of income before provision for income taxes for the three months ended March 31, 2013 and 2012 was 5.7% and 5.9%, respectively. Year Ended December 31, 20102012 versus Year Ended December 31, 2009 Other income (expense) decreased by $4.8 million, or 86.4%, to $0.8 million for the year ended December 31, 2010 from $5.6 million for the year ended December 31, 2009. This decrease was primarily attributable to a $3.9 million gain on extinguishment of debt related to the closing of the LGI business and a $1.5 million gain on settlement with the former owners of the LGI business in 2009. In 2010, we forgave $0.5 million of notes receivable in connection with the termination of a partner. This note was originally issued for the purchase of units in Silvercrest L.P. and Silvercrest GP LLC by a terminated partner at the time he joined our company. Upon termination of the partner, the note was cancelled and we redeemed and cancelled the underlying equity. Interest income increased by $18 thousand or 8.5% to $231 thousand for the year ended December 31, 2010 from $213 thousand for the year ended December 31, 2009. Interest expense decreased by $0.3 million, or 48.4%, to $0.2 million for the year ended December 31, 2010 from $0.5 million for the year ended December 31, 2009 due to a decrease in interest expense from notes issued to principals and as consideration in connection with prior acquisitions. Interest expense decreased as a result of the repayment and scheduled principal payments on notes issued to partners, scheduled principal payments on a note, and the forgiveness of a note in conjunction with the closing of the LGI business. Equity income from investments increased by $1.0 million primarily as a result of increased performance fee allocations from some of our funds.
Provision for Income Taxes
Six Months Ended June 30, 2012 versus Six Months Ended June 30, 2011
The provision for income taxes was $0.5$1.1 million and $0.2$0.6 million for the six monthsyears ended June 30,December 31, 2012 and June 30,December 31, 2011, respectively. The change was a result of an increase in taxable income. Our provision for income taxes as a percentage of income before provision for income taxes for the six monthsyear ended June 30,December 31, 2012 was 5.2%5.1% compared to 2.3%3.7% for the six monthsyear ended June 30,December 31, 2011. Year Ended December 31, 2011 versus Year Ended December 31, 2010 The provision for income taxes was $0.6 million and $0.7 million for the years ended December 31, 2011 and December 31, 2010, respectively, representing a decrease of $0.1 million, or 14.3%. The change was a result of a decrease in taxable income due to increased deferred rent, contingent consideration in the Milbank acquisition, and increased amortization of intangible assets. Our provision for income taxes as a percentage of income before provision for income taxes in 2011 was 3.7% compared to 5.7% in 2010. Year Ended December 31, 2010 versus Year Ended December 31, 2009
The provision for income taxes was $0.7 million for the year ended December 31, 2010 and the benefit from income taxes was $0.3 million for the year ended December 31, 2009. The change was primarily due to an increase in taxable income due to losses recognized in 2009 related to the closing of the LGI business. Our provision for income taxes as a percentage of income before provision for income taxes in 2010 was 5.7%.
Initial Public Offering Costs
As of June 30, 2012, we have incurred and deferred $545 thousand of professional fees associated with this offering. These fees are included in prepaid expenses and other assets in our condensed consolidated statement of financial condition at June 30, 2012 included elsewhere in this prospectus. In the event the offering is not consummated, the deferred offering costs will be expensed.
Liquidity and Capital Resources Historically, the working capital needs of our business have primarily been met through cash generated by our operations. We expect that our cash and liquidity requirements in the twelve months following the consummation of this offering will be met primarily through cash generated by our operations. Our ongoing sources of cash primarily consist of management fees and family office services fees, which are principally collected quarterly. We primarily use cash flow from operations to pay compensation and related expenses, general and administrative expenses, income taxes, debt service, capital expenditures and distributions. Seasonality typically affects cash flow since the first quarter of each year includes as a source of cash, the prior year’s annual performance fee payments, if any, from our various funds and external investment strategies and, as a use of cash, the prior fiscal year’s incentive compensation. We believe that we have sufficient cash from our operations to fund our operations and commitments for the next twelve months. The following table set forth certain key financial data relating to our liquidity and capital resources as of March 31, 2013 and 2012 and December 31, 2012, 2011 2010 and 2009 and June 30, 2012 and 2011.2010. | | | | | | | | | | | | | Years Ended December 31, | | | Three Months Ended March 31, | | | (in thousands) | | Years Ended December 31, | | | Six Months Ended June 30, | | | 2012 | | | 2011 | | | 2010 | | | 2012 | | | 2012 | | | | | 2011 | | | 2010 | | | 2009 | | | 2012 | | | 2011 | | | Cash and cash equivalents | | $ | 7,354 | | | $ | 7,025 | | | $ | 5,327 | | | $ | 2,568 | | | $ | 5,404 | | | $ | 13,443 | | | $ | 7,354 | | | $ | 7,025 | | | $ | 4,355 | | | $ | 4,095 | | Accounts receivable | | $ | 2,238 | | | $ | 2,247 | | | $ | 1,213 | | | $ | 3,554 | | | $ | 2,424 | | | $ | 3,675 | | | $ | 2,238 | | | $ | 2,247 | | | $ | 3,307 | | | $ | 2,148 | | Due from Silvercrest Funds | | $ | 2,043 | | | $ | 1,255 | | | $ | 953 | | | $ | 2,033 | | | $ | 1,173 | | | $ | 1,622 | | | $ | 2,043 | | | $ | 1,255 | | | $ | 1,220 | | | $ | 1,918 | |
In connection withPrior to the reorganization,consummation of this offering, Silvercrest L.P. intends to make a distribution to its principalsexisting limited partners of previously undistributed current year earnings in the aggregate amount of approximately $ .million. Such distribution will be funded from the existing cash balances of Silvercrest L.P. at the time of the reorganization but before the consummation of this offering and will not be funded by any of the proceeds of this offering. Purchasers in this offering will not be entitled to receive any portion of this distribution and such distribution may not be indicative of the amount of any future distributions.
We anticipate that distributions to the principalslimited partners of Silvercrest L.P., which, immediately following this offering, will consist of 37 of our current employees, two non-employee partners and us will continue to be a material use of our cash resources and will vary in amount and timing based on our operating results and dividend policy. As discussed under “Dividend Policy,” we currently intend to declare quarterly cash dividends to our Class A common stockholders. We are a holding company and have no material assets other than our ownership of interests in Silvercrest L.P. As a result, we will depend upon distributions from Silvercrest L.P. to pay any dividends to our Class A stockholders. We expect to cause Silvercrest L.P. to make distributions to us in an amount sufficient to cover dividends, if any, declared by us. Our dividend policy has certain risks and limitations, particularly with respect to liquidity. Although we expect to pay dividends according to our dividend policy, we may not pay dividends according to our policy, or at all, if, among other things, we do not have the cash necessary to pay our intended dividends. To the extent we do not have cash on hand sufficient to pay dividends, we may decide not to pay dividends. By paying cash dividends rather than investing that cash in our future growth, we risk slowing thatthe pace of our growth, or not having a sufficient amount of cash to fund our operations or unanticipated capital expenditures, should the need arise. Our purchase of Class B units in Silvercrest L.P. concurrently with this offering, and the future exchanges of Class B units of Silvercrest L.P., are expected to result in increases in our share of the tax basis of the tangible and intangible assets of Silvercrest L.P. at the time of our acquisition and these future exchanges, which will increase the tax depreciation and amortization deductions that otherwise would not have been available to us. These increases in tax basis and tax depreciation and amortization deductions are expected to reduce the amount of tax that we would otherwise be required to pay in the future. We will enter into a tax receivable agreement with the current membersprincipals of Silvercrest L.P. and any future employee holders of Class B units pursuant to which we will agree to pay them 85% of the amount of cash savings, if any, in U.S. federal, state and local income tax that we actually realize as a result of these increases in tax basis and certain other tax benefits related to entering into the tax receivable agreement, including tax benefits attributable to payments thereunder. The timing of these payments is currently unknown. The payments to be made pursuant to the tax receivable agreement will be a liability of Silvercrest and not Silvercrest L.P. This liability will be recorded as an “other liability” on our statement of financial condition. For purposes of the tax receivable agreement, cash savings in income tax will be computed by comparing our actual income tax liability to the amount of such taxes that we would have been required to pay had there been no increase in our share of the tax basis of the tangible and intangible assets of Silvercrest L.P. While the actual increase in tax basis, as well as the amount and timing of any payments under this agreement, will vary depending upon a number of factors, including the timing of exchanges, the price of shares of our Class A common stock at the time of the exchange, the extent to which such exchanges are taxable, the amount and timing of our income and the tax rates then applicable, we expect that as a result of the size of the increases in the tax basis of our tangible and intangible assets, the payments that we may make under the tax receivable agreement likely will be substantial. Assuming no material changes in the relevant tax law and that we earn sufficient taxable income to realize the full tax benefit of the increased depreciation and amortization of our assets, we expect that future payments to the selling principals of Silvercrest L.P. in respect of our purchase of Class B units from them will aggregate approximately $ million. Future payments to current principals of Silvercrest L.P. and future holders of Class B units in respect of subsequent exchanges would be in addition to these amounts and are expected to be substantial. We intend to fund required payments pursuant to the tax receivable agreement from the distributions received from Silvercrest L.P. Cash Flows The following table sets forth our cash flows for the three months ended March 31, 2013 and 2012 and the years ended December 31, 2012, 2011 2010 and 2009 and the six months ended June 30, 2012 and 2011.2010. Operating activities consist of net income subject to adjustments for changes in operating assets and liabilities, depreciation, and equity-based compensation expense. Investing activities consist primarily of acquiring and selling property and equipment, distributions received from investments in investment funds, and cash paid as part of business acquisitions. Financing activities consist primarily of contributions from partners, distributions to partners, the issuance and payments on partner notes and earnout payments related to business acquisitions. | | | | | | | | | | | | | Years Ended December 31, | | Three Months Ended March 31, | | | (in thousands) | | Years Ended December 31, | | For the Six Months Ended June 30, | | | 2012 | | 2011 | | 2010 | | 2013 | | 2012 | | | | | 2011 | | 2010 | | 2009 | | 2012 | | 2011 | | | Net cash provided by operating activities | | $ | 15,401 | | | $ | 11,419 | | | $ | 8,311 | | | $ | 8,348 | | | $ | 7,137 | | | $ | 20,756 | | | $ | 15,401 | | | $ | 11,419 | | | $ | 7,384 | | | $ | 4,502 | | Net cash (used in) provided by investing activities | | | (4,476 | ) | | | 365 | | | | (512 | ) | | | (241 | ) | | | (391 | ) | | | (770 | ) | | | (4,476 | ) | | | 365 | | | $ | (2,782 | ) | | $ | (214 | ) | Net cash used in financing activities | | | (10,596 | ) | | | (10,086 | ) | | | (8,847 | ) | | | (12,893 | ) | | | (8,367 | ) | | | (13,897 | ) | | | (10,596 | ) | | | (10,086 | ) | | $ | (13,690 | ) | | $ | (7,547 | ) | | | | | | | | | | | | | | | | | | | | | | | | | | | | | | | | Net change in cash | | $ | 329 | | | $ | 1,698 | | | $ | (1,048 | ) | | $ | (4,786 | ) | | $ | (1,621 | ) | | $ | 6,089 | | | $ | 329 | | | $ | 1,698 | | | $ | (9,088 | ) | | $ | (3,259 | ) | | | | | | | | | | | | | | | | | | | | | | | | | | | | | | | |
Operating Activities SixThree Months Ended June 30,March 31, 2013 versus Three Months Ended March 31, 2012
Operating activities provided $7.4 million and $4.5 million for the three months ended March 31, 2013 and 2012, respectively. This difference primarily is the result of an increase in net income of $1.2 million for the three months ended March 31, 2013, and increased working capital resulting from an increase in the changes to receivables and due from Silvercrest Funds of $0.6 million resulting from increased collections due to greater revenue, accounts payable and accrued expenses of $0.5 million primarily due to the timing and level of payments in the ordinary course of our business, and accrued compensation of $0.2 million due to increased incentive compensation expense in 2013. Year Ended December 31, 2012 versus Six MonthsYear Ended June 30,December 31, 2011 Operating activities provided $8.3$20.8 million and $7.1$15.4 million for the six monthsyears ended June 30,December 31, 2012 and 2011, respectively. This difference primarily is the result of an increase in net income of $1.8$5.1 million for the six monthsyear ended June 30, 2012.December 31, 2012, and increased working capital resulting from an increase in the change to accrued compensation of $0.8 million due to increased incentive compensation expense in 2012 which was paid in 2013. Year Ended December 31, 2011 versus Year Ended December 31, 2010 Operating activities provided $15.4 million and $11.4 million for the years ended December 31, 2011 and 2010, respectively. This difference primarily is the result of an increase in net income of $3.7 million for the year ended December 31, 2011 and increased working capital resulting from an increase of $0.7 million in the collection of accounts receivable during the year ended December 31, 2011. The increase in Due from Silvercrest Funds is the result of a change in payment terms from monthly to quarterly in addition to increased fund management fee revenue. Year Ended December 31, 2010 versus Year Ended December 31, 2009
Operating activities provided $11.4 million and $8.3 million for the years ended December 31, 2010 and December 31, 2009, respectively. This difference is partially attributable to higher net income for the year ended December 31, 2010, a $0.7 million increase in the change to accounts payable and accrued expenses, and a decrease of $2.8 million in employee bonuses paid in 2010. These increases in cash provided by operating activities were partially offset by a $4.6 million increase related to the change in accounts receivable for the year ended December 31, 2010. The increase in Due from Silvercrest Funds is the result of a change in payment terms from monthly to quarterly in addition to increased fund management fee revenue.
Investing Activities SixThree Months Ended June 30,March 31, 2013 versus Three Months Ended March 31, 2012
For the three months ended March 31, 2013 and 2012, investing activities used $2.8 million and $0.2 million, respectively. The increase in the use of cash was primarily the result of $2.5 million of cash paid at the closing of the Ten-Sixty acquisition. Year Ended December 31, 2012 versus Six MonthsYear Ended June 30,December 31, 2011 For the six monthsyear ended June 30,December 31, 2012, investing activities used $0.2$0.8 million primarily as a result of a $0.4$0.7 million earnout payment related to the Marathon acquisition partially offset by the $0.2 million sale of securities and partial release of our security deposit on our lease in New York.acquisition. Year Ended December 31, 2011 versus Year Ended December 31, 2010 Investing activities consist primarily of investments in investment funds as well as capital expenditures. For the year ended December 31, 2011, investing activities used $4.5 million whereas for the year ended December 31, 2010, investing activities provided $0.4 million. The increase in cash used in investing activities from 2010 to 2011 was primarily the result of the cash payment of $3.3 million related to the Milbank acquisition in addition to a $0.4 million increase in earnout payments related to the Marathon acquisition. Year Ended December 31, 2010 versus Year Ended December 31, 2009
For the year ended December 31, 2010, investing activities provided $0.4 million primarily as a result of the funding of a sub-tenant escrow account.
Financing Activities SixThree Months Ended June 30,March 31, 2013 versus Three Months Ended March 31, 2012
For the three months ended March 31, 2013 and 2012, financing activities used $13.7 million and $7.5 million, respectively. The increase in net cash used in financing activities from 2012 to 2013 was primarily the result of higher partner incentive allocations paid in 2013 in addition to higher tax distributions paid during the three months ended March 31, 2013 as compared to the same period in 2012. Incentive allocations and tax distributions increased directly as a result of increased profitability and operating cash flow. Year Ended December 31, 2012 versus Six MonthsYear Ended June 30,December 31, 2011 For the six monthsyears ended June 30,December 31, 2012 and 2011, financing activities used $12.9$13.9 million and $8.4$10.6 million, respectively. The increase in net cash used in financing activities from 2011 to 2012 was primarily the result of higher partner incentive allocations paid in 2012 in addition to higher tax distributions paid during the six monthsyear ended June 30,December 31, 2012 as compared to the same period in 2011.2011 partially offset by increased payments from partners on notes receivable. Incentive allocations and tax distributions increased directly as a result of increased profitability and operating cash flow. Year Ended December 31, 2011 versus Year Ended December 31, 2010 Financing activities consist primarily of contributions from partners, distributions to partners, the issuance and payments on partner notes, and earnout payments related to business acquisitions completed on or subsequent to January 1, 2009. For the years ended December 31, 2011 and 2010, financing activities used $10.6 million, and $10.1 million, respectively. The increase in net cash used in financing activities from 2010 to 2011 was the result of increased distributions of $4.1 million made to principals as a result of higher partner incentive allocations paid in 2011 in addition to higher tax distributions paid in the first quarter of 2011 as compared to the same period in 2010. Incentive allocations and tax distributions increased directly as a result of increased profitability and operating cash flow. These increases were partially offset by lower payments of $2.9 million on notes payable due to the payment in full in 2011 of the note issued in connection with the Marathon acquisition, and the payment in full during 2010 of notes issued to former partners by us for the redemption of units under which we exercised our call right upon their termination of employment. In addition, cash received from principals on notes receivable was $1.1 million for the year ended December 31, 2011 compared to $0.2 million for the year ended December 31, 2010. Year Ended December 31, 2010 versus Year Ended December 31, 2009
For the years ended December 31, 2010 and 2009, financing activities used $10.1 million, and $8.8 million, respectively. This increase was due to $1.2 million of reduced cash proceeds received from the issuance of interests in Silvercrest L.P. in 2010. Cash payments received from principals on notes receivable was $0.8 million lower in 2010 than in 2009 because payments on certain partner notes that were due in 2010 were extended until 2011. Repayments on notes issued to former principals for the redemption of units held by them under which we exercised our call right upon their termination increased $0.5 million for the year ended December 31, 2010 compared to the year ended December 31, 2009. These increases were partially offset by lower distributions to principals of $1.4 million as a result of lower partner incentive allocations paid in 2010.
We anticipate that distributions to principals of Silvercrest L.P. will continue to be a material use of our cash resources, and will vary in amount and timing based on our operating results and dividend policy. We have an outstanding fixed rate notenotes payable to Ten-Sixty and Milbank related to the Ten-Sixty and Milbank acquisition,acquisitions, and variable rate notes issued to former principals to redeem units held by them under which we exercised our call right upon their termination. As of March 31, 2013, the aggregate principal amount of the Ten-Sixty promissory note is $1.5 million which is payable in two initial installments of $0.2 million each on April 30, 2013 and December 31, 2013 and then quarterly installments from June 30, 2014 through March 31, 2017 of $0.1 million each. The principal amount outstanding under this note bears interest at the rate of five percent per annum. The aggregate principal amount of the notes related to the Milbank acquisition matures after four annual principal installments payable on each of November 1, 2012, 2013, 2014, and 2015 in the amounts of $0.8 million, $0.9 million, $1.0 million, and $0.6 million, respectively, together with all accrued and unpaid interest. If specified conditions are not met by Milbank prior to November 1, 2014, then the principal payment due on November 1, 2015 will be reduced to $0.1 million. The principal amount outstanding under this note bears interest at the rate of five percent per annum. As of June 30, 2012, $3.2March 31, 2013, $2.4 million remains outstanding on the notes payable related to the Milbank acquisition. Accrued but unpaid interest on the notes payable related to the Milbank acquisition was approximately $0.1 million$50 thousand as of June 30, 2012.March 31, 2013. As of December 31, 2011, $3.22012, $2.4 million remains outstanding on the notes payable related to the Milbank acquisition. Accrued but unpaid interest on the notes payable related to the Milbank acquisition was approximately $0.1 million$20 thousand as of December 31, 2011.2012. As of June 30, 2012, $1.1March 31, 2013, $0.4 million remains outstanding on the notes issued to former principals. Accrued but unpaid interest on these notes issued to former principals was approximately $23$4 thousand as of June 30, 2012.March 31, 2013. The principal amounts outstanding under these notes bear interest at the U.S. Prime Rate plus one percent in effect at the time payments are due. As of December 31, 2011, $1.62012, $0.9 million remains outstanding on the notes issued to former principals. Accrued but unpaid interest on these notes issued to former principals was approximately $44$26 thousand as of December 31, 2011.2012. The principal amounts outstanding under these notes bear interest at the U.S. Prime Rate plus one percent in effect at the time payments are due. Contractual Obligations The following table sets forth information regarding our consolidated contractual obligations as of December 31, 2011.2012. | | | | Payments Due by Period | | | Payments Due by Period | | | | | Less Than | | | More Than | | | Less Than | | | More Than | | | | | Total | | | 1 Year | | | 1-3 Years | | | 3-5 Years | | | 5 Years | | | Total | | | 1 Year | | | 1-3 Years | | | 3-5 Years | | | 5 Years | | | | | (in thousands) | | | (in thousands) | | Operating leases | | $ | 19,096 | | | $ | 3,448 | | | $ | 6,687 | | | $ | 6,532 | | | $ | 2,429 | | | $ | 17,352 | | | $ | 3,675 | | | $ | 7,307 | | | $ | 6,370 | | | $ | — | | Capital leases | | | 55 | | | | 21 | | | | 34 | | | | — | | | | — | | | | 33 | | | | 20 | | | | 13 | | | | — | | | | — | | Notes payable | | | 4,739 | | | | 1,469 | | | | 2,706 | | | | 564 | | | | — | | | | 3,270 | | | | 1,556 | | | | 1,714 | | | | — | | | | — | | | | | | | | | | | | | | | | | | | | | | | | | | | | | | | | | Total | | $ | 23,890 | | | $ | 4,938 | | | $ | 9,427 | | | $ | 7,096 | | | $ | 2,429 | | | $ | 20,655 | | | $ | 5,251 | | | $ | 9,034 | | | $ | 6,370 | | | $ | — | | | | | | | | | | | | | | | | | | | | | | | | | | | | | | | | |
| (1) | Excludes $1.5 million promissory note related to the Ten-Sixty acquisition on March 28, 2013. |
Off-Balance Sheet Arrangements We entered into a guaranty arrangement in October 2011. We act as investment advisor to Silvercrest Strategic Opportunities Fund. In October 2011, Silvercrest Strategic Opportunities Fund entered into a $5,000,000 revolving credit agreement with Pershing LLC for client redemptions. Simultaneously with the execution of the credit agreement, we entered into an indemnification agreement with Pershing whereby we agreed to indemnify Pershing from claims arising out of the non-performance of Silvercrest Strategic Opportunities Fund’s obligations under the related credit agreement. The credit agreement matured on January 15, 2012. See Note 1110 to the consolidated financial statements of Silvercrest L.P. for the years ended December 31, 2012, 2011 2010 and 20092010 included elsewhere in this prospectus for further disclosure regarding this off-balance sheet arrangement. We did not have any off-balance sheet arrangements as of June 30, 2012,March 31, 2013, December 31, 20102012 or December 31, 2009.2010. Critical Accounting Policies and Estimates The preparation of the consolidated financial statements requires management to make estimates and assumptions that affect the reported amounts of assets and liabilities, the disclosure of contingent assets and liabilities at the date of the consolidated financial statements and the reported amounts of revenues, expenses and other income reported in the consolidated financial statements and the accompanying notes. We base our estimates on historical experience and on various other assumptions that are believed to be reasonable under current circumstances, our results of which form the basis for making judgments about the carrying value of assets and liabilities that are not readily available from other sources. Actual results could differ from those estimates. Significant estimates and assumptions made by management include the fair value of acquired assets and liabilities, impairment of goodwill and intangible assets, revenue recognition, equity based compensation, accounting for income taxes, and other matters that affect the consolidated financial statements and related disclosures. Accounting policies are an integral part of our financial statements. An understanding of these accounting policies is essential when reviewing our reported results of operations and our financial condition. Management believes that the critical accounting policies and estimates discussed below involve additional management judgment due to the sensitivity of the methods and assumptions used. Business Combinations We account for business combinations using the acquisition method of accounting. The acquisition method of accounting requires that purchase price, including the fair value of contingent consideration, of the acquisition be allocated to the assets acquired and liabilities assumed using the estimated fair values determined by management as of the acquisition date. For acquisitions completed subsequent to January 1, 2009, we measure the fair value of contingent consideration at each reporting period using a probability-adjusted discounted cash flow method based on significant inputs not observable in the market and any change in the fair value from either the passage of time or events occurring after the acquisition date, is recorded in earnings. In relation to our acquisition of Milbank, Winthrop, the fair value of the contingent consideration was based on discounted cash flow models using projected EBITDA for each earnout period. The discount rate applied to the projected EBITDA was determined based on the weighted average cost of capital for the Company and considered that the overall risk associated with the payments was similar to the overall risks of our business as there is no target, floor or cap associated with the contingent payments. Goodwill and Intangible Assets Goodwill consists of the excess of the purchase price over the fair value of identifiable net assets of businesses acquired. Goodwill is not amortized and is evaluated for impairment using a two-step process that is performed at least annually, or whenever events or circumstances indicate that impairment may have occurred. During In September 2011, we changedthe FASB issued ASU 2011-08, “Testing Goodwill for Impairment”, which provided new accounting guidance on testing goodwill for impairment. The enhanced guidance provides an entity the option to first perform a qualitative assessment of whether a reporting unit’s fair value is more likely than not less than its carrying value, including goodwill. In performing its qualitative assessment, an entity considers the extent to which adverse events or circumstances identified, such as changes in economic conditions, industry and market conditions or entity specific events, could affect the comparison of the reporting unit’s fair value with its carrying amount. If an entity concludes that the fair value of a reporting unit is more likely than not less than its carrying amount, the entity is required to perform the currently prescribed two-step goodwill impairment test to identify potential goodwill impairment and, accordingly, measure the amount, if any, of goodwill impairment loss to be recognized for that reporting unit. The guidance was effective for us as of January 1, 2012. We did not utilize this option and assessed goodwill using the two-step process when performing our annual impairment test date from December 31 to October 1, effective October 1, 2011. The change was madeassessment in anticipation of our company having a requirement to issue its annual financial statements on an accelerated basis as compared to prior years. The change had no impact on our results of operations or any other financial statement line item. 2012. The first step is a comparison of the fair value of a reporting unit with its carrying amount, including goodwill. If the fair value of the reporting unit exceeds its carrying value, goodwill of the reporting unit is not considered impaired and the second step is unnecessary. If the carrying value of the reporting unit exceeds its fair value, a second step is performed to measure the amount of impairment by comparing the carrying amount of the goodwill to a determination of the implied fair value of the goodwill. If the carrying amount of the goodwill is greater than the implied value, an impairment loss is recognized for the difference. The implied value of the goodwill is determined as of the test date by performing a purchase price allocation, as if the reporting unit had just been acquired, using currently estimated fair values of the individual assets and liabilities of the reporting unit, together with an estimate of the fair value of the reporting unit taken as a whole. The estimate of the fair value of the reporting unit is based upon information available regarding prices of similar groups of assets, or other valuation techniques including present value techniques based upon estimates of future cash flows.flows.In order to determine the fair value of our reporting unit, we first determined the market value of our invested capital, or MVIC. Our MVIC was estimated using a combination of generally accepted valuation methods: the income approach using the discounted cash flow method, or DCF, and a market-based approach using the comparable company method. The DCF method estimates enterprise value based on the estimated present value of the future net cash flows the business is expected to generate over a forecasted period and an estimate of the present value of cash flows beyond that period, which is referred to as terminal value. The estimated present value is calculated using our weighted average cost of capital, which accounts for the time value of money and the appropriate degree of risks inherent in our business. The market-based approach considers multiples of financial metrics based trading multiples of a selected peer group of companies. These multiples are then applied to our financial metrics to derive a range of indicated values. Once calculated, the discounted cash flow and comparable company methods are then weighted. Our reporting unit is not at risk of failing step one as its estimated fair value determined during the company’sour annual goodwill impairment test for 20112012 exceeded its carrying amount by over 400%380%. During 2011, we changed our annual impairment test date from December 31 to October 1, effective October 1, 2011. The change was made in anticipation of our company having a requirement to issue its annual financial statements on an accelerated basis as compared to prior years. The change had no impact on our results of operations or any other financial statement line item. Identifiable finite-lived intangible assets are amortized over their estimated useful lives ranging from three to 20 years. The method of amortization is based on the pattern over which the economic benefits, generally expected undiscounted cash flows, of the intangible asset are consumed. Intangible assets for which no pattern can be reliably determined are amortized using the straight-line method. Intangible assets consist primarily of the contractual right to future management, advisory and performance fees from customer contracts or relationships. Indefinite-lived intangible assets are reviewed for impairment whenever events or changes in circumstances indicate that the net carrying amount of the asset may not be recoverable. In connection with such review, we also re-evaluate the periods of amortization for these assets. Recoverability of these assets is measured by a comparison of the carrying amount of these assets to undiscounted future net cash flows expected to be generated by these assets. If such assets are considered to be impaired, the impairment to be recognized is measured by the amount by which the carrying amount of the assets exceeds their fair value. Revenue Recognition Investment advisory fees are typically billed quarterly in advance afterat the beginning of the quarter or in arrears after the end of the quarter, based on a contractual percentage of the assets managed. Family office services fees are also typically billed quarterly in advance afterat the beginning of the quarter or in arrears after the end of the quarter based on a contractual percentage of the assets managed or upon a contractually agreed-upon flat fee arrangement. Revenue is recognized on a ratable basis over the period in which services are performed. We account for performance based revenue in accordance with ASC 605-20-S99, Accounting for Management Fees Based on a Formula, by recognizing performance fees and allocations as revenue only when it is certain that the fee income is earned and payable pursuant to the relevant agreements. In certain arrangements, we are only entitled to receive performance fees and allocations when the return on assets under management exceeds certain benchmark returns or other performance targets. We record performance fees and allocations as a component of revenue. Because the majority of our revenues are earned based on assets under management that have been determined using fair value methods and since market appreciation/depreciation has a significant impact on our revenue, we have presented our assets under management using the U.S. GAAP framework for measuring fair value. That framework provides a three-level fair value hierarchy that prioritizes the inputs to valuation techniques used to measure fair value. The hierarchy gives the highest priority to unadjusted quoted prices in active markets for identical assets or liabilities (Level 1) and the lowest priority to unobservable inputs based on company assumptions (Level 3). A financial instrument’s categorization within the fair value hierarchy is based upon the lowest level of input that is significant to the instrument’s fair value measurement. The three levels within the fair value hierarchy are described as follows: Level 1—includes quoted prices (unadjusted) in active markets for identical instruments at the measurement date. The typetypes of financial instruments included in Level 1 include unrestricted securities, including equities listed in active markets. Level 2—includes inputs other than quoted prices that are observable for the instruments, including quoted prices for similar instruments in active markets, quoted prices for identical or similar instruments in markets that are not active, or inputs other than quoted prices that are observable for the instruments. The type of financial instruments in this category include less liquid and restricted securities listed in active markets, securities traded in other than active markets, government and agency securities, and managed funds whose net asset value is based on observable inputs. Level 3—includes one or more significant unobservable inputs. Financial instruments that are included in this category include assets under management primarily comprised of investments in privately-held entities, limited partnerships, and other instruments where the fair value is based on unobservable inputs. The table below summarizes the approximate amount of assets under management for the periods indicated for which fair value is measured based on Level 1, Level 2 and Level 3 inputs. | | | | | | | | | | | | | | | | | | | | Level 1 | | | Level 2 | | | Level 3 | | | Total | | | | | (in billions) | | December 31, 2011 AUM | | $ | 7.5 | | | $ | 1.1 | | | $ | 1.5 | | | $ | 10.1 | | June 30, 2012 AUM | | $ | 8.1 | | | $ | 1.1 | | | $ | 1.5 | | | $ | 10.7 | |
| | | | | | | | | | | | | | | | | | | | Level 1 | | | Level 2 | | | Level 3 | | | Total | | | | | (in billions) | | December 31, 2012 AUM | | $ | 8.4 | | | $ | 1.4 | | | $ | 1.4 | | | $ | 11.2 | | March 31, 2013 AUM | | $ | 9.4 | | | $ | 1.8 | | | $ | 2.4 | | | $ | 13.6 | |
As substantially all our assets under management are valued by independent pricing services based upon observable market prices or inputs, we believe market risk is the most significant risk underlying valuation of our assets under management, as discussed under the heading “Risk Factors” and “—Quantitative and Qualitative Disclosure About Market Risk.” The average value of our assets under management for the sixthree months ended June 30,March 31, 2013 was approximately $12.4 billion. Assuming a 10% increase or decrease in our average assets under management and the change being proportionately distributed over all our products, the value would increase or decrease by approximately $1.2 billion, which would cause an annualized increase or decrease in revenues of approximately $5.5 million, at a weighted average fee rate as of March 31, 2013 of 0.44%. The average value of our assets under management for the year ended December 31, 2012 was approximately $10.4$10.7 billion. Assuming a 10% increase or decrease in our average assets under management and the change being proportionately distributed over all our products, the value would increase or decrease by approximately $1.0$1.1 billion, which would cause an annualized increase or decrease in revenues of approximately $4.5$4.6 million, at our currentthe 2012 weighted average fee rate of 0.43%. The average value of our assets under management for the year ended December 31, 2011 was approximately $9.7 billion. Assuming a 10% increase or decrease in our average assets under management and the change being proportionately distributed over all our products, the value would increase or decrease by approximately $1.0 billion, which would cause an annualized increase or decrease in revenues of approximately $3.8 million at the 2011 weighted average fee rate of 0.39%.
Equity-Based Compensation Equity-based compensation cost relating to the issuance of share-based awards to principals is based on the fair value of the award at the date of grant, which is expensed ratably over the requisite service period, net of estimated forfeitures. The fair value of the award is based upon the calculation of a per unit limited partnership interest of our company utilizing both discounted cash flow and guideline company valuation methodologies. The forfeiture assumption is ultimately adjusted to the actual forfeiture rate. Therefore, changes in the forfeiture assumptions may affect the timing of the total amount of expense recognized over the vesting period. The service period is the period over which the employee performs the related services, which is normally the same as the vesting period. Equity-based awards that do not require future service are expensed immediately. Equity-based awards that have the potential to be settled in cash at the election of the employee or that pertain to redeemable partnership units are classified as liabilities, or Liability Awards, and are adjusted to fair value at the end of each reporting period. Distributions associated with Liability Awards not expected to vest are accounted for as part of compensation expense in our Consolidated Statements of Operations. In order to determine the fair value of our limited partnership interests underlying equity-based compensation awards issued prior to the offering described in this prospectus, we first determined the market value of our invested capital, or MVIC. Our MVIC was estimated using a combination of two generally accepted approaches: the income approach using the discounted cash flow method, or DCF, and the market-based approach using the comparable company method. The DCF method estimates enterprise value based on the estimated present value of future net cash flows the business is expected to generate over a forecasted period and an estimate of the present value of cash flows beyond that period, which is referred to as terminal value. The estimated present value is calculated using our weighted average cost of capital, which accounts for the time value of money and the appropriate degree of risks inherent in the business. The market-based approach considers multiples of financial metrics based trading multiples of a selected peer group of companies. These multiples are then applied to our financial metrics to derive a range of indicated values. Once calculated, the discounted cash flow and comparable company methods are then weighted. Estimates of the volatility of our limited partnership interests were based on available information regarding the volatility of common stock of comparable, publicly traded companies. Prior to this offering, the fair value of the limited partnership interests underlying equity-based compensation awards were determined in accordance with the guidelines outlined in the American Institute of Certified Public Accountants Practice Aid, “Valuation of Privately-Held-Company Equity Securities Issued as Compensation.” The assumptions we used in the valuation model were based on future expectations combined with management judgment. Because there had been no public market for our limited partnership units, management exercised significant judgment and considered numerous objective and subjective factors to determine the fair value of our limited partnership interests as of the date of each equity-based compensation award grant, including the following factors: the provisions of our limited partnership agreement; our operating and financial performance; current business conditions and projections; lack of control discount; lack of marketability discount; the likelihood of achieving a liquidity event for the limited partnership interests underlying these equity-based compensation awards, such as an initial public offering or sale of our company, given prevailing market conditions; historical trading activity of comparable publicly traded companies; the market performance of comparable publicly traded companies; and the U.S. and global capital market conditions. In February 2010, we granted 15,808 units with fair value at grant date of $68.36 per unit. By February 2011, U.S. markets improved which resulted in an increase in our valuation and the market value of comparable companies. As a result of these factors in addition to organic growth, we projected increases in our budget for 2011 as compared to our actual performance in 2010. In February 2011, we granted 10,802 units with fair value at grant date of $148.35 per unit. Our valuation determined a MVIC by weighting the DCF approach at 50% and the market-based approach at 50%. Our MVIC reflected a discount for lack of control of 13% based on the existence of a non-managing partnership interest and a discount for lack of marketability of 20% based on a liquidity event expected to occur within approximately twelve months. In February 2012, we granted 1,000 units with fair value at grant date of $207.71 per unit. U.S. markets continued to improve into the first quarter of 2012 as compared to the end of 2011. As a result, we projected increases in our 2012 budget as compared to actual performance in 2011. Our valuation for the February 2012 grants was determined using a market-based approach and reflected an assumed initial public offering discount of 15%.approach. Income Taxes Our operating company is not subject to federal and state income taxes, since all income, gains and losses are passed through to itsour partners. Our operating company is subject to New York City Unincorporated Business Tax. We, including our affiliated incorporated entities, are subject to federal and state corporate income tax, which requires an asset and liability approach to the financial accounting and reporting of income taxes. With respect to our incorporated entity, the annual tax rate is based on the income, statutory tax rates and tax planning opportunities available in the various jurisdictions in which we operate. Tax laws are complex and subject to different interpretations by the taxpayer and respective governmental taxing authorities. Judgment is required in determining the tax expense and in evaluating tax positions. The tax effects of an uncertain tax position, or UTP, taken or expected to be taken in income tax returns are recognized only if it is “more likely-than-not” to be sustained on examination by the taxing authorities, based on its technical merits as of the reporting date. The tax benefits recognized in the financial statements from such a position are measured based on the largest benefit that has a greater than 50% likelihood of being realized upon ultimate settlement. We recognize estimated interest and penalties related to UTPs in income tax expense. We recognize the benefit of a UTP in the period when it is effectively settled. Previously recognized tax positions are derecognized in the first period in which it is no longer more likely than not that the tax position would be sustained upon examination. Recently Issued Accounting Pronouncements In January 2010, the FASB issued Accounting Standards Update, or ASU, 2010-06, “Improving Disclosures About Fair Value Measurements,” or ASU 2010-06. ASU 2010-06 requires disclosing separately the amount of significant transfers in and out of the Level 1 and Level 2 categories and the reasons for the transfers and it requires that Level 3 purchases, sales, issuances and settlements activity be reported on a gross rather than a net basis. ASU 2010-06 also requires fair value measurement disclosures for each class of assets and liabilities and disclosures about valuation techniques and inputs used to measure fair value for both recurring and nonrecurring fair value measurements for Level 2 and Level 3 measurements. These disclosures were effective as of January 1, 2010, except for the Level III gross reporting which was effective for our company January 1, 2011. The adoption of ASU 2010-06 did not have a material impact on our financial statements. In July 2010, the FASB issued ASU 2010-20, “Disclosures about the Credit Quality of Financing Receivables and the Allowance for Credit Losses,” or ASU 2010-20. ASU 2010-20 requires additional disclosures about the credit quality of financing receivables and the allowance for credit losses. The purpose of the additional disclosures is to enable users of financial statements to better understand the nature of credit risk inherent in an entity’s portfolio of financing receivables and how that risk is analyzed. The new disclosures were effective for our interim and annual reporting periods beginning January 1, 2011. The adoption of this guidance did not have a material impact on our consolidated financial statements.
In December 2010, the FASB issued ASU 2010-28, “Intangibles—Goodwill and Other (Topic 350) When to Perform Step Two of the Goodwill Impairment Test for Reporting Units with Zero or Negative Carrying Amounts,” which enhanced guidance on when to perform step two of the goodwill impairment test for reporting units with zero or negative carrying amounts and requires step two to be performed if it is more likely than not that a goodwill impairment exists. This guidance was effective for our interim and annual reporting periods beginning January 1, 2011. As our reporting unit does not currently have a zero or negative carrying value, the adoption of this guidance did not have any impact on our financial statements.
In May 2011, the FASB issued ASU 2011-04, “Fair Value Measurement (Topic 820): Amendments to Achieve Common Fair Value Measurement and Disclosure Requirements in GAAP and International Financial Reporting Standards,” or IFRS, which amended guidance on fair value measurements to achieve common fair value measurement and disclosure requirements in GAAP and IFRS. The amended guidance specifies that the concepts of highest and best use and valuation premise in a fair value measurement are relevant only when
measuring the fair value of nonfinancial assets and are not relevant when measuring the fair value of financial assets or of liabilities. The amendments include requirements specific to measuring the fair value of those instruments, such as equity interests used as consideration in a business combination. An entity should measure the fair value of its own equity instrument from the perspective of a market participant that holds the instrument as an asset. With respect to financial instruments that are managed as part of a portfolio, an exception to fair value requirements is provided. That exception permits a reporting entity to measure the fair value of such financial assets and financial liabilities at the price that would be received to sell a net asset position for a particular risk or to transfer a net liability position for a particular risk in an orderly transaction between market participants at the measurement date. The amendments also clarify that premiums and discounts should only be applied if market participants would do so when pricing the asset or liability. Premiums and discounts related to the size of an entity’s holding (e.g., a blockage factor) rather than as a characteristic of the asset or liability (e.g., a control premium) are not permitted in a fair value measurement. The guidance also requires enhanced disclosures about fair value measurements, including, among other things, (a) for fair value measurements categorized within Level III of the fair value hierarchy, (1) a quantitative disclosure of the unobservable inputs and assumptions used in the measurement, (2) the valuation process used by the reporting entity and (3) a narrative description of the sensitivity of the fair value measurement to changes in unobservable inputs and the interrelationships between those unobservable inputs, if any, and (b) the categorization by level of the fair value hierarchy for items that are not measured at fair value in the statement of financial position but for which the fair value is required to be disclosed (for example, a financial instrument that is measured at amortized cost in the statement of financial position but for which fair value is disclosed). The guidance also amends disclosure requirements for significant transfers between Level I and Level II and now requires disclosure of all transfers between Levels I and II in the fair value hierarchy. The amended guidance iswas effective for interimus on January 1, 2012 and annual periods beginning after December 15, 2011. As the impact of the guidance is primarily limited to enhanced disclosures, the adoption did not have a material impact on our consolidated financial statements. In September 2011, the FASB issued ASU 2011-08, “Testing Goodwill for Impairment,” which provided new accounting guidance on testing goodwill for impairment. The enhanced guidance provides an entity the option to first perform a qualitative assessment of whether a reporting unit’s fair value is more likely than not less than its carrying value, including goodwill. In performing its qualitative assessment, an entity considers the extent to which adverse events or circumstances identified, such as changes in economic conditions, industry and market conditions or entity specific events, could affect the comparison of the reporting unit’s fair value with its carrying amount. If an entity concludes that the fair value of a reporting unit is more likely than not less than its carrying amount, the entity is required to perform the currently prescribed two-step goodwill impairment test to identify potential goodwill impairment and, accordingly, measure the amount, if any, of goodwill impairment loss to be recognized for that reporting unit. The guidance is effective for our interim and annual periods commencing January 1, 2012. Early adoption is permitted. We will consider the guidance when performing our annual impairment assessment in 2012.
Subsequent Event
On September 18, 2012, three of Silvercrest L.P.’s executives repaid outstanding notes payable and accrued interest of $1,897 thousand that were initially issued in connection with the acquisition of their partnership interests.
Qualitative and Quantitative Disclosures Regarding Market Risk Our exposure to market risk is directly related to our role as investment adviser for the separate accounts we manage and the funds for which we act as sub-investment adviser. Most of our revenue for the year ended December 31, 20112012 and the sixthree months ended June 30, 2012 wereMarch 31, 2013 was derived from advisory fees, which are typically based on the market value of assets under management. Accordingly, a decline in the prices of securities would cause our revenue and income to decline due to a decrease in the value of the assets we manage. In addition, such a decline could cause our clients to withdraw their funds in favor of investments offering higher returns or lower risk, which would cause our revenue and income to decline further. Please see our discussion of market risks in “—Critical Accounting Policies and Estimates—Revenue Recognition.” BUSINESS Our Guiding Principles We will create, build and maintain an environment that encourages innovation and original thought and apply this fresh thinking to the needs of our clients and firm. We will attract, motivate and retain unusually talented and ambitious professionals who share a passion for the investment business and an antipathy for corporate bureaucracy and office politics. We will conduct ourselves in all our dealings as highly ethical, responsible and competent professionals who always place our clients’ financial interests ahead of our own. We will encourage and nurture an entrepreneurial, collegial and action-oriented business culture in which “fun” is inevitable and decisions are generally consensual. Our Company We are a premier, full-service wealth management firm focused on providing financial advisory and related family office services to ultra-high net worth individuals and institutional investors. In addition to a wide range of investment capabilities, we offer a full suite of complementary and customized family office services for families seeking comprehensive oversight of their financial affairs. As of June 30, 2012,March 31, 2013, our assets under management were $10.7 billion, which we believe makes us the largest investment adviser in the United States that is focused on high net worth clients and is principally owned by its employees. Our clients are among the wealthiest and most sophisticated in the world.$13.6 billion. We were founded ten11 years ago on the premise that if we staffed and organized our business to deliver a combination of excellent investment performance together with high-touch client service, we would quickly differentiate our business from a crowded field of firms nominally in the wealth management business. We seek to attract and serve a base of individuals and families with $10 million or more of investable assets, and we believe we are particularly well-positioned to offer comprehensive investment and family office service solutions to families with over $25 million of investable assets. As of June 30, 2012,March 31, 2013, our top 375419 client relationships had an average size of $28$32 million and represented approximately 98% of our assets under management. Our top 50 relationships averaged $151$196 million in size as of June 30, 2012.March 31, 2013. As a boutique, we are large enough to provide an array of comprehensive capabilities, yet agile enough to coordinate and deliver highly personalized client service. We consider these to be our competitive strengths: We are a company offering independent, unconflicted advice, which is principally employee-owned. We have a strong record of organic and acquired growth and we have a scalable platform. We have a long-term track record of superior investment performance. We have a diverse and highly loyal clientele. We have proven senior management which has successfully executed our growth strategy. We have grown during a time of extraordinary financial turmoil during which the value of a full-service, independent, client-focused firm has become ever-more apparent. Our growth and success at attracting ultra-high net worth clients, primarily by taking market share from our competitors, validates our original premise. Our annual client retention rate has averaged 98% since 2006 and, as shown below, the compound annual growth rate, or CAGR, in assets under management since inception is 49%48%. We believe our record of growth is a direct result of our demonstrated record of delivering excellent performance together with highly personalized service to our clients. 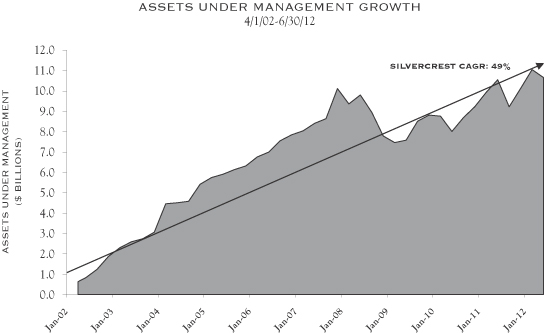 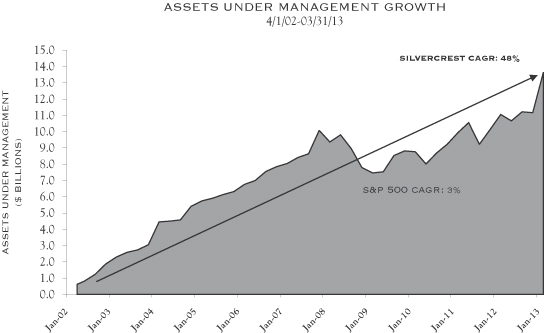
Our organic growth has been complemented by selective hiring and by fourfive successfully completed strategic acquisitions which have expanded not only assets under management, but also our professional ranks, geographic footprint and service capabilities. We believe additional acquisitions will allow us to extend our geographic presence nationally. As we grow, we will maintain our value proposition to continue to deliver to our clients excellent investment performance together with excellent client service, the essence of what differentiates us from our competitors. Our clients engage us to advise them on traditional investment strategies focused on equities, fixed income and cash as well as non-traditional investment strategies including hedge funds, private equity funds, real estate and commodities. Our clients receive a full menu of proprietary investment capabilities together with a focused array of complementary non-proprietary capabilities offered by unaffiliated firms selected by us. In addition to our investment capabilities, we also provide our clients with family office services and related administrative services, which include financial planning, tax planning and preparation, partnership accounting and fund administration, and consolidated wealth reporting. Our fees for our investment advisory services, non-proprietary services, and family office and related administrative services are structured to align our financial incentives with those of our clients to ensure they receive unconflicted advice. The vast majority of our fees are for discretionary asset management, and are based on the value of the assets we manage for our clients. These fee revenues increase if our clients’ assets grow in value; these revenues decrease if our clients’ assets decline in value. We charge a management fee based on assets under management for our investment advisory services. Unlike our management fees, our fees for family office services and related administrative services are generally not based on or correlated to market values. For these services, we generally charge our clients a negotiated fee based on the scope of work. These services create strong client relationships and contribute meaningfully to our record of client retention. As of June 30, 2012,March 31, 2013, approximately 94%89% of our discretionary assets under management were held for individual clients and 6%11% for institutional clients. Based on the strong results we have achieved in a number of our equity strategies, we have begun to attractare attracting a significant amount of institutional investor interest. After almost fourfive years of dedicated effort, our equity capabilities are now on the approved lists of several prominent institutional consultants and, as a result, we believe significant institutional growth is likely in future years. History, Organization and Philosophy When forming our company, our founders had the objective of creating a large full-service boutique operation focused on managing portfolios and delivering financial advice to wealthy individuals and select institutions. We commenced operations in April of 2002. Our first partners and employees came almost entirely from Donaldson, Lufkin& Jenrette (DLJ) Asset Management Group which had been acquired by Credit Suisse Asset Management in late 2000. In 2002, we carefully recruited and hired the same equity, fixed income and client service teams with whom our clients had worked at DLJ Asset Management Group. As of June 30, 2012, more thanMay 15, 2013, approximately a quarter of our 8795 employees are veterans of DLJ. Many of our principals, therefore, have worked together for 20 years and, in some cases, even longer. Our headquarters are located in New York City with additional offices in Boston, Massachusetts and Charlottesville, Virginia. SinceFrom 2004 to 2012, we havesuccessfully acquired four separate registered investment advisers and we have integrated and rebranded their operations into our company. In April 2013, we began integrating and rebranding the acquired operations of Ten-Sixty Asset Management, LLC. The following is a summary of these acquisitions: James C. Edwards Asset Management Inc., acquired in March 2004 with $889 million in assets under management, helped build out our New York presence; Heritage Financial Management LLC, acquired in March 2005 with $330 million in assets under management, created an office in Charlottesville, VA and enhanced our family office and tax planning and preparation capabilities; Marathon Capital Group LLC, acquired in October 2008 with $552 million in assets under management, established a Boston office for our company; and Milbank Winthrop & Co., acquired in November 2011 with approximately $478 million in assets under management, strengthened our presence in the New York market and allowed us to add commodity and new funds of funds investment capabilities. Ten-Sixty Asset Management, LLC, acquired in March 2013 with approximately $1.9 billion in assets under management, expanded our hedge fund due diligence capabilities and continued to grow our institutional business. In structuring our business we anticipated that we would quickly become a large boutique operation. Accordingly, from inception we have embraced an organizational structure in which the primary functions of client service, investments, technology and operations and business administration were organized and staffed with professionals who specialize in each of those functions. This structure permits each professional to focus on his or her area of expertise without the distraction of other business responsibilities. At many other firms the senior professionals are expected to serve multiple roles simultaneously, which we believe dilutes the value to clients and makes scaling the business effectively unachievable. We firmly believe that our business structure represents a better approach and will permit us to greatly expand our business on our existing platform. In meeting our primary objective to deliver strong investment results, we seek to add value through our asset allocation advice, as well as through our proprietary equity and fixed income strategies and outsourced investment capabilities. We recruited and hired a team of seasoned securities analysts who have an institutional caliber approach to security selection and a long record of success in implementing their strategies. We encourage them to focus 100% of their professional time on the task of securities selection. Our in-house equity analysts are focused on U.S. large cap, small cap, smid cap, multi cap, equity income and focused value equity strategies. On the fixed income side, our analysts are focused on high-grade municipals, high-yield municipals and high-grade taxables. In order to deliver excellent client service, our portfolio managers are charged with the responsibility of working individually with each client to help define investment objectives, risk tolerance, cash flow requirements and other financial needs. The portfolio manager is responsible for developing a portfolio strategy designed to meet these predetermined client goals. Thereafter, the portfolio manager becomes the client’s primary point of contact with our company in all matters, including assessing the client’s need for family office services, and then introducing and overseeing the family office services professionals engaged for that work. Client-facing portfolio managers, their support staffs and the family office services group account for 50%45% of our total employees, a reflection of our high commitment to excellent client service. The ratio of our total client relationships to client-facing professionals is, therefore, approximately nine to one. We are staffed to assure that each client receives senior level personal attention. We have a staff of ten10 professionals who work with our portfolio managers to deliver family office services to interested clients. The fees for family office services are negotiated with the client and generally are not asset-based. For this reason, the revenues generated by our family office services are non-correlated to market movements and provide us with a diversified source of earnings. We believe these family office services have been an attractive component of our overall value proposition and engender a stronger relationship with the client, leading to greater client retention and the institutionalization of client relationships. Our compound annual growth rate for assets under management growth from inception through March 31, 2013 is 48%. Prior to the financial crisis of 2008, we enjoyed a triple digit annualizedcompound annual growth rate ofin assets under management of approximately 85% from inception through August 2008. Subsequent to the onset of the financial crisis in 2008, we have recovered more rapidly than many of our large, independent competitors, according to RIA Data Center, and our assets under management now exceed our pre-financial crisis high. Importantly, we remained profitable throughout the downturn. As a result, our compound annual growth rate from August 2008 through March 31, 2013 is 8%. We expect to continue our pattern of complementing our organic growth in assets through selective hiring and acquisitions. We expect our growth to further accelerate as a direct result of growing client referrals and increasing our presence in the institutional marketplace. Our Market Opportunity Overview Our client relationships with ultra-high net worth individuals currently represent less than 1% of U.S. families with investable assets over $25 million. Our assets represent less than 5% of the $356$498 billion multi-family office (MFO)/registered investment adviser (RIA) channel, which, according to data from Cerulli Associates, itself represents 8%10% of the estimated $4.6$4.8 trillion high net worth market. Even modest improvements in our penetration of this market will lead to significant further growth. Domestic High Net Worth Market The Spectrem Group estimates there were 1.1 million households in the United States with a net worth of over $5 million in 20112012 and 107,000117,000 with a net worth in excess of $25 million. Over the last 1415 years, the number of households with over $5 million in net worth has grown at an annual rate of 12%11% per year. Cerulli Associates estimates that 92%90% of the $4.6$4.8 trillion high net worth market is at firms outside the MFO/RIA channel. With our focus on taking market share from these firms, we believe that there is a significant growth opportunity for us.  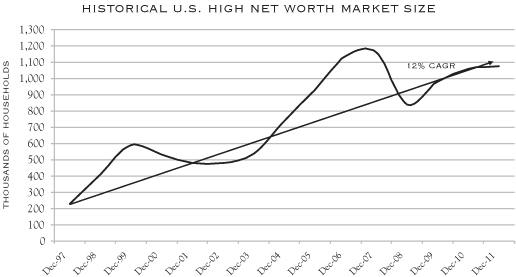
Source: The Spectrem Group The Spectrem Group found that high net worth clients and families, in selecting an adviser, valued qualities such as honesty, trustworthiness, transparency and responsive service ahead of an adviser’s investment performance track record. When these highly valued characteristics are coupled with superior performance, the result can be an unusually loyal client base. During one of the most turbulent periods of U.S. financial history our clients proved to be highly loyal: our annual client retention rate for the years 2006 through 20112012 was 98%. The Wealth Management Industry The wealth management industry is highly competitive and comprised of many players. We compete directly with some of the largest financial service companies, as well as some of the smallest. Substantially all of our new business to date has resulted from our success in taking market share from these firms. In general, these competitors fall into one of the following categories: | | • | | Diversified Financial Institutions have divisions aimed at providing wealth management solutions to the high net worth segment that are usually staffed by brokers with many sources of compensation. |
| | • | | Asset Management Firms offer proprietary institutional and retail asset management services catering to the high net worth segment largely with off-the-shelf products. |
| | • | | Trust Companies combine fiduciary and investment services as well as ancillary financial services with little emphasis on performance. |
| | • | | MFO/RIAs focus exclusively on the high net worth segment and, in the case of MFOs, are frequently dominated by one or two families. |
Cerulli Associates estimates that MFO/RIAs are the fastest growing firms in the wealth management industry. Assets have doubled over the last five years as they have taken greater market share, primarily from large financial institutions. Assets managed by MFO/RIAs grew from 2005-20102006-2011 at a CAGR of 14.9%13.6% as compared with a 4.3%0.9% CAGR for all high net worth providers. Cerulli Associates further estimates that high net worth managed assets will grow at a 9.4%15.7% CAGR from 20102011 through 2014.2015. We are an RIA which is also regarded as an MFO, and thus we are well positioned to benefit from the growth Cerulli Associates foresees. The 2008 financial crisis created an ongoing opportunity for independent smaller firms to attract assets from their larger competitors. The press has documented the erosion of client trust that has occurred at large financial institutions due to inherent conflicts of interest and lack of transparency. In delivering conflict-free advice within a completely transparent fee relationship, we are well-positioned to achieve further market share gains. Institutional Market The asset management industry has experienced significant growth in worldwide assets under management during the past 15 years, fueled in significant respects by aging populations in both developed and emerging markets around the world, which have increased the pools of savings and particularly pension assets. For example, total pension assets in the United States grew from $6.8 trillion at the end of 1996 to $16.1 trillion at the end of 2011, according to Towers Watson. Furthermore, Towers Watson estimates that U.S. pension funds allocate 44% of year-end total assets to equities or $7.1 trillion.trillion at the end of 2011. As of June 30, 2012,March 31, 2013, institutional assets only represented approximately 6%11% of our totaldiscretionary assets under management or $661$950 million but, afterand 7% of total assets under management. After a focused multi-year investment effort to make our capabilities known to institutional investment consultants, we continue to believe we are now well positioned to attract meaningful institutional assets. As a result, we expect this percentage to increase significantly. Competitive Strengths Our key competitive strengths are as follows: Independent, Unconflicted Advice We are an independent registered investment adviser and are not affiliated with a broker/dealer or a commercial bank. As a result, our financial incentives are directly aligned with those of our clients. The vast majority of our fees are for discretionary asset management, and are based on the value of the assets we manage for our clients. These fee revenues increase if our clients’ assets grow in value; these revenues decrease if our clients’ assets decline in value. We do not receive commissions, rebates, spreads or any other indirect or undisclosed forms of compensation. We are not controlled by any client or family and all of our investment decisions are made in the best interests of our clients. All of our fees are fully disclosed and transparent to our clients who have an unrestricted right to accept or reject them. We employ a partnership culture and mindset fostered through widespread employee equity ownership. As of June 30, 2012,May 15, 2013, 37 of our employees owned equity in our company. Each of our principals purchased this equity by making a substantial personal investment in our company. We believe that employee equity aligns our employees’ interests both with our company’s and our clients’ interests. It further motivates and dedicates employees to the task of satisfying our clients’ objectives. We believe that this partnership approach maximizes teamwork and collegiality and when issues and opportunities arise, all of our principals take an active interest in them. Demonstrated Track Record of Growing Assets Under Management We have expanded our business through a combination of organic growth and acquired growth, which combined with strong investment returns, have produced a CAGR in total client assets of 49%48% since our inception. Our organic growth in our individual client business has been fueled by client referrals and through the hiring of portfolio managers with substantial client relationships. Our institutional client business has resulted from a multi-year effort to make our equity capabilities known to institutional investment consultants. Our acquired growth is the result of fourfive successfully completed strategic acquisitions we have consummated in New York, Boston and Charlottesville. Following this offering, we expect the number and frequency of acquisitions to increase. We have adopted a scalable structure in which the primary functions of client service, investments, technology and operations and business administration are organized and staffed with professionals who specialize in each of those functions. Our organization not only permits the efficient and scalable growth of our business but fosters the integration of acquired firms. Our ultra-high net worth business is scalable and our institutional business is even more so. We can add significant institutional assets without any further significant investment in infrastructure. Long-Term Track Record of Superior Investment Performance We have a proven ability to deliver excellent investment performance through both our asset allocation work on behalf of clients as well as through security selection. We believe that the superior investment returns we have generated for investors over many years and through all types of economic conditions are a key reason for our success in growing assets. The following chart summarizes the performance of each of our principal equity strategies relative to their appropriate benchmarks. | PROPRIETARY EQUITY PERFORMANCE AS OF 6/30/12 | | | | ANNUALIZED PERFORMANCE | | | | | | | INCEPTION | | 1-YEAR | | 3-YEAR | | 5-YEAR | | 7-YEAR | | INCEPTION | | | | PROPRIETARY EQUITY PERFORMANCE | | | ANNUALIZED PERFORMANCE | | AS OF 03/31/13 | | | INCEPTION | | 1-YEAR | | | 3-YEAR | | | 5-YEAR | | | 7-YEAR | | | INCEPTION | | Large Cap Value Composite | | | 4/1/02 | | | | -2.2 | | | | 14.3 | | | | 0.6 | | | | 4.8 | | | | 5.6 | | | 4/1/02 | | | 16.0 | | | | 11.9 | | | | 6.2 | | | | 5.9 | | | | 7.0 | | Russell 1000 Value Index | | | | | 3.0 | | | | 15.8 | | | | -2.2 | | | | 2.9 | | | | 4.2 | | | | | | 18.8 | | | | 12.7 | | | | 4.9 | | | | 4.2 | | | | 5.8 | | | Small Cap Value Composite | | | 4/1/02 | | | | 1.9 | | | | 19.9 | | | | 7.9 | | | | 9.7 | | | | 9.6 | | | 4/1/02 | | | 17.6 | | | | 16.7 | | | | 13.1 | | | | 10.6 | | | | 10.8 | | Russell 2000 Value Index | | | | | -1.4 | | | | 17.5 | | | | -1.1 | | | | 3.4 | | | | 6.1 | | | | | | 18.1 | | | | 12.1 | | | | 7.3 | | | | 3.9 | | | | 7.6 | | | Smid Cap Value Composite | | | 10/1/05 | | | | -0.4 | | | | 17.4 | | | | 3.6 | | | | — | | | | 6.5 | | | 10/1/05 | | | 16.8 | | | | 15.2 | | | | 8.6 | | | | 8.2 | | | | 8.7 | | Russell 2500 Value Index | | | | | -1.5 | | | | 18.8 | | | | -0.2 | | | | — | | | | 3.7 | | | | | | 21.2 | | | | 14.2 | | | | 8.8 | | | | 5.2 | | | | 6.4 | | | Multi Cap Value Composite | | | 7/1/02 | | | | -1.3 | | | | 16.5 | | | | 3.0 | | | | 6.4 | | | | 7.0 | | | 7/1/02 | | | 15.9 | | | | 13.4 | | | | 8.4 | | | | 7.7 | | | | 8.3 | | Russell 3000 Value Index | | | | | 2.6 | | | | 16.0 | | | | -2.1 | | | | 3.0 | | | | 5.4 | | | | | | 18.7 | | | | 12.7 | | | | 5.1 | | | | 4.2 | | | | 6.9 | | | Equity Income Composite | | | 12/1/03 | | | | 4.5 | | | | 17.3 | | | | 4.9 | | | | 8.0 | | | | 9.9 | | | 12/1/03 | | | 18.6 | | | | 14.9 | | | | 10.1 | | | | 9.1 | | | | 11.1 | | Russell 3000 Value Index | | | | | 2.6 | | | | 16.0 | | | | -2.1 | | | | 3.0 | | | | 5.2 | | | | | | 18.7 | | | | 12.7 | | | | 5.1 | | | | 4.2 | | | | 6.9 | | | Focused Value Composite | | | 9/1/04 | | | | -5.2 | | | | 15.9 | | | | 2.4 | | | | 6.5 | | | | 8.2 | | | 9/1/04 | | | 11.4 | | | | 10.5 | | | | 8.4 | | | | 6.9 | | | | 9.3 | | Russell 3000 Value Index | | | | | 2.6 | | | | 16.0 | | | | -2.1 | | | | 3.0 | | | | 4.4 | | | | | | 18.7 | | | | 12.7 | | | | 5.1 | | | | 4.2 | | | | 6.4 | |
Loyal, Diverse Base of Clients As a result of our focus on delivering outstanding investment performance combined with highly personalized client service, we have developed significant long-term relationships with a large majority of our clients. Many of our client relationships pre-date the formation of our company. Since 2006, our annual client retention rate has averaged 98%. and was 99% and 100% in 2011 and 2012, respectively. Our suite of family office services has been an important component to building a strong relationship with our clients, leading to greater client retention. Nine out of our ten largest relationships use one or more components of our family office services. In addition to assisting in client retention, these capabilities have been instrumental in attracting new clients from families which seek a comprehensive and efficient approach to overseeing their wealth beyond investment management. Our assets under management are highly diversified among clients. As of June 30, 2012,March 31, 2013, approximately 98% of our business was comprised of clients whose average relationship size is $28$32 million and our top 50 relationships averaged $151$196 million. As of June 30, 2012,March 31, 2013, our clients were represented in 43 states, and the District of Columbia, Europe and Latin America and no single client represented more than 5% of our revenue.revenue or 6% of discretionary assets under management. Dedicated, Proven Senior Management Our entire business is overseen by an Executive Committee comprising our Chief Executive Officer, President and Chief Operating Officer, Chief Financial Officer, General Counsel and General Counsel.a Managing Director from our Portfolio Management Group. This group meets weekly to discuss our overall business. In particular, the Executive Committee focuses on developing and implementing our strategy as well as solving problems and seizing opportunities effectively and efficiently. At present, except for Mr. Albert S. Messina, no one on the Executive Committee has direct client or investment responsibility and, as a result, each memberthe members of the Executive Committee commits his fullcommit significant resources to managing the business and executing our growth strategy. Our Growth Strategy We built our company to take market share from financial services firms whose wealth management models we believe are flawed. To date, we attracted substantially all of our new client relationships from our competitors due to client dissatisfaction with service and/or investment performance. Our growth strategy has been and will continue to be to grow our business organically, to complement our organic growth with strategic hires and acquisitions and to expand our presence in the institutional market. In support of each of these initiatives we plan to continue to invest in establishing our brand through continued selective advertising and public relations. Organic Growth We have a proven ability to identify, attract and retain ultra-high net worth clients who seek a firm designed to deliver excellent investment performance and excellent client service. Our organizational model of separate and distinct business functions has proven scalable and our company’s assets under management have grown on average in excessto $13.6 billion as of $1 billion per yearMarch 31, 2013 without a commensurate increase in headcount. Importantly, we have achieved our growth while maintaining our profitability during one of the most challenging periods in the history of the U.S. financial markets. Going forward, we will continue to execute our proven business plan for attracting ultra-high net worth clients. The business of attracting ultra-high net worth clients is the business of obtaining referrals and gaining trust. At our company these responsibilities reside principally with our portfolio managers. Our senior portfolio managers have on average nearly 30 years of experience and they have a wealth of contacts and professional referral sources as a result of that experience. In spearheading the effort to deliver excellent performance and service to their clients, these portfolio managers develop very close relationships with their clients and in many cases these relationships are much older than our company itself. Much of our new business results from referrals from existing clients. In this regard, it is critical that our portfolio managers work closely with each of their clients to establish the trust that is at the heart of the relationship. Where appropriate, our portfolio managers are also encouraged to introduce our clients to our family office services capabilities and we expect to see growth in client utilization of these services in the future. Nine of our ten largest clients use our family office services and some of these have closed their own family offices to consolidate those activities with us. This is a profitable business for us and it serves to tighten our ties to those clients who avail themselves of the services we offer. It is also extremely useful to us in new business competitions where we use these services as a differentiator from our competitors. We expect much greater penetration with our current clients in future years and we expect that many of our new clients will use these services extensively. Complementing the efforts of our senior portfolio managers to cultivate client referrals, our recently created business development team is charged with identifying newly formed wealth (resulting from merger, acquisition or corporate finance) and then creating customized solicitations. Our objective is two-fold: we will expand awareness of our company and its capabilities by distributing our marketing materials to this new audience and we will attract a certain amount of new business. The basis of this effort is careful research designed to ascertain if the prospect has any relationship with us—orus-or any of our clients or friends—andfriends-and then our solicitation is tailored to those circumstances. This effort is relatively new but we are very encouraged by its early results. In all of our business development efforts we devote a great deal of time and effort to developing highly customized and detailed proposals for our prospects. In order to do so, we spend as much time as is required to thoroughly understand the prospect’s circumstances and goals as well as the sources of its dissatisfaction with its existing adviser. Where appropriate our proposals include the integration of our entire suite of family office services. We believe very few of our competitors invest the time and labor to create comparable proposals and we believe these customized proposals have underpinned much of our new business success. We believe our customized new business presentations distinguish us from both our much larger competitors, which have substantial resources, but whose size, we believe, may impede them from easily tailoring solutions to suit clients’ needs, as well as from our smaller competitors whom, we believe, do not have our depth of resources or capabilities. Simultaneously, our customized new business presentations distinguish us from both our much larger competitors who have major resources but cannot easily tailor solutions to suit clients’ needs as well as from our smaller competitors who do not have our depth of resources or capabilities. Acquired Growth From our inception, our organic growth has been complemented by selective hiring and strategic acquisitions which have served to enlarge our client base, expand our professional ranks, increase our geographic presence and broaden our service capabilities. We therefore expect to continue to recruit and hire senior portfolio managers with significant client relationships as well as successful investment professionals with capabilities currently not available internally to us. We have used acquisitions to extend our presence into new geographies (Boston, Charlottesville) and to gain new investment expertise. The fourfive strategic acquisitions we have successfully completed have allowed us to benefit from economies of scale and scope. In making acquisitions, we look for compatible professionals of the highest integrity who believe in our high service-high performance model for the business. It is important that their clientele be principally clients of high net worth and it is helpful if they have a similar value-based investment methodology. These firms are attracted to our company by the strength of our brand, the breadth of our services and the integrity of our people. Often these firms are extremely limited in the investment products and client services they can offer their clients and it is not uncommon that they have succession or other management issues to resolve. In addition, the high and growing cost of compliance with federal and state laws governing their business is often an added inducement. Following this offering, we believe we will become the partner of choice for many such firms. Continuing our short-term growth strategy, we intend to establish offices in major wealth centers on the West Coast, in the Southwest and in the Midwest in order to be closer to both our clients and to prospective clients. The following chart identifies those U.S. cities which contain the greatest number of families with net worth of $30 million or more: | RANK | | CITY | | RESIDENTS WITH
A NET WORTH >
$30 MILLION | | | CITY | | RESIDENTS WITH
A NET WORTH >
$30 MILLION | | | 1 | | New York, NY | | | 7,270 | | | New York, NY | | | 7,535 | | | 2 | | Los Angeles, CA | | | 4,350 | | | San Francisco, CA | | | 4,580 | | | 3 | | San Francisco, CA | | | 4,230 | | | Los Angeles, CA | | | 4,525 | | | 4 | | Chicago, IL | | | 2,550 | | | Chicago, IL | | | 2,610 | | | 5 | | Washington, DC | | | 2,300 | | | Washington, DC | | | 2,395 | | | 6 | | Houston, TX | | | 2,250 | | | Houston, TX | | | 2,285 | | | 7 | | Dallas, TX | | | 1,855 | | | Dallas, TX | | | 2,015 | | | 8 | | Atlanta, GA | | | 960 | | | Atlanta, GA | | | 970 | | | 9 | | Boston, MA | | | 890 | | | Seattle, WA | | | 950 | | | 10 | | Seattle, WA | | | 885 | | | 10-Tie | | | Boston, MA | | | 915 | | 10-Tie | | | Philadelphia, PA | | | 915 | |
Source: Cerulli Associates/Wealth-X While we have been able to consummate acquisitions largely on the strength of our brand and culture without the benefit of publicly traded stock, we believe additional cash and a publicly traded stock will greatly enhance our acquisition prospects. Our past acquisitions have sharpened our ability to integrate acquired businesses, and we believe that once we identify an acquisition target we will be able to complete the acquisition and the integration of the acquired business expeditiously. We have a strong brand and trusted reputation. Unlike pure “roll up” firms, we believe we appeal to like-minded professionals who wish to remain independent, autonomous and focused on their clients. In-line with our previous acquisitions, we envision future targets will be rebranded as Silvercrest. Institutional Growth After fourfive years of effort focused on cultivating relationships with institutional investment consultants, we are nowcontinue to regularly makingmake new business presentations to institutional investors, including public and corporate pension funds, endowments, foundations, and their consultants. We are now on the “approved” lists of certain prominent institutional investment consultants, which means that these consultants would be prepared to recomment our firm to clients in search of a particular investment strategy for its clients. This has significantly enhanced our ability to win mandates these consultants seek for their institutional clients and as a result we have begun to win institutional mandates in our equity strategies. This trend was recently highlighted by our selection by a very large state retirement fund to manage an equity mandate of up to $400 million. In addition, in December 2011, we have beenwere hired to manage, and have begun providing services to, a new equity mutual fund which is presently inbeing actively marketed throughout the early stages of its national marketing campaign.nation. We expect this trend to continue once it is publicly known that these and other institutions have engaged us to manage significant portfolios for them. The importance of institutional growth to our company is noteworthy: institutional assets will likely expand not only our assets under management but also our profit margins; and the painstaking due diligence conducted by these institutions before selecting us will ratify and confirm the decisions to hire us made by our individual clients. Brand Management We have invested heavily to build, maintain and extend our brand. We have done so in the belief that creating awareness of our company and its differentiated characteristics would support all aspects of our business but most notably our growth. With limited resources, we have created a focused national advertising campaign, which has drawn praise from clients, prospects and competitors alike. We have carefully chosen media outlets that reach our target audience efficiently and we estimate that the new business, which we get directly as a result of our advertising, now finances its cost. Complementing our advertising strategy and again with limited resources, we have also invested in an effort to get media coverage of our company in some of the nation’s most prestigious national publications as well as in industry journals and newsletters. This effort has resulted in press coverage by theWall Street Journal,Barron’s,Bloomberg, theFinancial Times andThe New York Times as well as various trade publications distributed within our industry. This public relations effort has very proven helpful in establishing our company as a leader in our industry. Following this offering we expect to increase our spending in both advertising and public relations as part of our effort to further build our brand and to increase the market’s awareness of our company, particularly in the geographic markets which we expect to enter. Our Business Model We were founded in 2002 to provide independent investment advisory and related family office services to ultra-high net worth individuals and endowments, foundations and other institutional investors. To this end, we are structured to provide our clients with institutional-quality investment management with athe superior level of service thatexpected by wealthy individuals have difficulty obtaining elsewhere.individuals. To provide athis high level of service, we rely on portfolio management teams and our family office services team to provide objective, conflict-free investment management selection and a fully integrated, customized family-centric approach to wealth management. We believe the combination of comprehensive family office service, excellent investment capabilities and a high level of personal service allows us to take advantage of economies of scale to service the needs of our ultra-high net worth clients. We have dedicated investment management teams tasked with successfully implementing their respective investment strategies. To increase the probability of success in meeting this objective, our analysts are not responsible for client interaction, management of our business, marketing or compliance oversight. This enables us to effectively serve ultra-high net worth clients as well as institutions which typically perform in-depth due diligence before selecting a manager. Delivering Investment Performance The Investment Policy & Strategy Committee, or IPSC, which is comprised of our chief strategist and several of our senior portfolio managers, is charged with the responsibility of adding value through asset allocation and manager selection. This is done through the use of our proprietary investment management by internal analysts, and by whom we believe are best-of-breed external managers. The IPSC develops model asset allocations assuming differing levels of risk, liquidity and income tolerance as well as conducting outside manager due diligence. Our proprietary model portfolio structures are not merely a backward-looking, mechanical exercise based on the past performance of different asset classes.Instead,classes. Instead, our IPSC overlays our judgment on the likely future performance of different asset classes in arriving at optimal portfolio structures. None of our dedicated investment analysts serves on this committee, which safeguards the independence of the IPSC’s recommendations. Our portfolio managers are responsible for creating a customized investment program for each client based upon the IPSC’s work. An interactive dialogue ensures that each portfolio plan is based upon each client’s defined written objectives. Each client’s portfolio strategy takes into account that client’s risk tolerance, income and liquidity requirements as well as the effect of diversifying out of low-basis and/or sentimental holdings. Historically, the IPSC has added value to our clients’ portfolios through asset allocation weightings and manager selection. The chart below shows the performance results of our company’s basic asset allocation model portfolios developed by the IPSC using our proprietary and outsourced investment capabilities. | | | | | | | ANNUALIZED PERFORMANCE | | | | | | MODEL PORTFOLIO PERFORMANCE AS OF 6/30/12 | | INCEPTION | | | 1-YEAR | | | 3-YEAR | | | 5-YEAR | | | 7-YEAR | | | INCEPTION | | | | MODEL PORTFOLIO PERFORMANCE | | | ANNUALIZED PERFORMANCE | | AS OF 3/31/2013 | | | INCEPTION | | | 1-YEAR | | | 3-YEAR | | | 5-YEAR | | | 7-YEAR | | | INCEPTION | | Income Portfolio | | | 5/1/03 | | | | 2.3 | | | | 10.9 | | | | 4.8 | | | | 5.7 | | | | 6.5 | | | | 5/1/03 | | | | 7.6 | | | | 6.5 | | | | 5.1 | | | | 5.5 | | | | 6.4 | | U.S. Stock/Bond Mix (50/50)1 | | | | | 6.5 | | | | 11.7 | | | | 3.5 | | | | 4.8 | | | | 5.9 | | | | | | 8.9 | | | | 9.1 | | | | 5.6 | | | | 5.5 | | | | 6.4 | | | Balanced Portfolio | | | 5/1/03 | | | | 0.6 | | | | 12.9 | | | | 4.3 | | | | 6.0 | | | | 7.4 | | | | 5/1/03 | | | | 8.7 | | | | 7.6 | | | | 5.5 | | | | 5.5 | | | | 7.4 | | U.S. Stock/Bond Mix (60/40)1 | | | | | 6.3 | | | | 12.6 | | | | 2.9 | | | | 4.7 | | | | 6.0 | | | | | | 9.9 | | | | 9.8 | | | | 5.7 | | | | 5.4 | | | | 6.6 | | | Growth Portfolio | | | 5/1/03 | | | | -1.7 | | | | 14.9 | | | | 3.1 | | | | 6.1 | | | | 8.2 | | | | 5/1/03 | | | | 10.7 | | | | 9.8 | | | | 6.0 | | | | 5.2 | | | | 8.4 | | U.S. Stock/Bond Mix (90/10)1 | | | | | 5.7 | | | | 15.5 | | | | 0.9 | | | | 4.2 | | | | 6.4 | | | | | | 12.9 | | | | 12.0 | | | | 5.8 | | | | 5.1 | | | | 7.5 | |
| 1 | The equity benchmark is the S&P 500 Index and the fixed income benchmark is the Barclays Aggregate Bond Index. |
From inception, we have employed a system of peer group reviews to ensure that client portfolios have been constructed in a manner consistent with our best collective thinking. In annual peer group reviews, the asset allocation within client portfolios is compared with the portfolios’ defined objectives and portfolios which are not fully aligned with the investment objective, which are then singled out for further review and discussion. Our objective is for all clients to receive our best thinking and that portfolio managers are managing portfolios consistently with our policy. As a combination of these various factors, the client relationship is with us and not merely with an individual at our company. We believe that it is impossible for a single manager to perform all forms of investing equally well. Thus, our core proprietary investment capabilities are focused on a narrow range of highly disciplined U.S. equity and fixed income management strategies. Our investment teams have exhibited strong performance records. With respect to these strategies, roughly 57%50% of our separately managed accounttotal assets under management are managed in our proprietary investment strategies. Our outsourced investment capabilities include alternative investments as well as traditional investment approaches in the categories of domestic large, mid and small cap growth equity, international equities and high yield bonds. Proprietary Equity Strategies Our equity strategies rely on a team-based investment approach and a rigorous investment process. This approach has resulted in returns that exceed relevant market benchmarks. We believe this team approach has provided and will continue to provide consistency to our investment process and results over the long-term. Our investment analysts are generalists who employ a “bottom-up” value oriented equity selecting methodology. Our analysts collectively monitor a universe of approximately 100 stocks which are deemed to be attractively valued relative to their business outlook and management’s history of adding value. Each proprietary equity strategy is built from the same body of research. Below is an illustration of the equity team’s investment process: 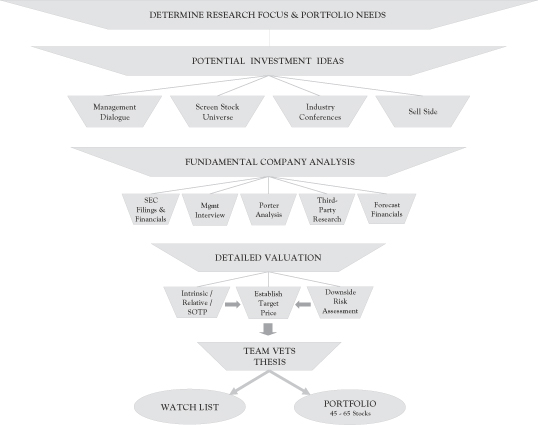 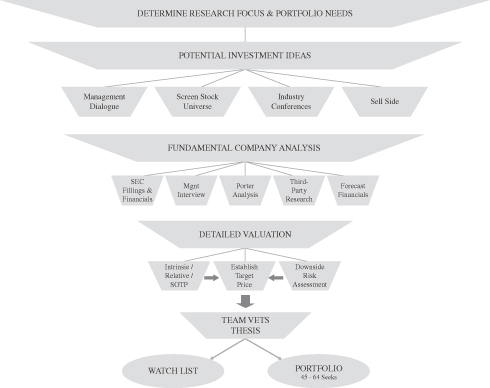
Once stocks have been approved for investment from this body of research, they become part of one or more model equity portfolios. These are generally large cap, small cap, smid cap, multi-cap, equity income and focused value. Each stock position is continually monitored against its investment thesis to ensure investment discipline, and we employ a strict discipline to trim or sell securities in the following circumstances: When a stock is excessively valued in our models or the best case scenario is reflected in the stock price; Due to a stock’s outperformance, which can adversely affect a portfolio’s diversification; Due to underperformance, when a stock trails relevant benchmarks by more than 10%; When the investment thesis changes, due to a loss of confidence in management, a change in business prospects, or the deterioration in earnings quality. Below is a breakdown of assets among the various proprietary equity strategies as of June 30, 2012:March 31, 2013: 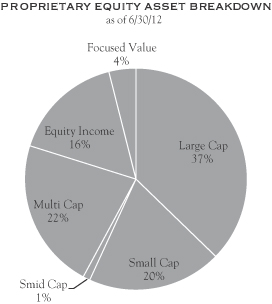 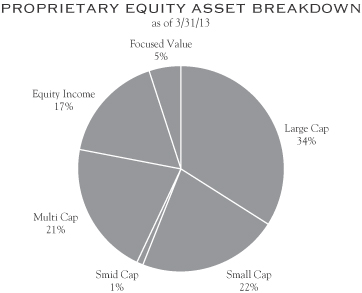
Each of our equity strategies has outperformed its benchmark as illustrated by the following chart: | | | | | | | | | | | | | | | | | | | | | | | PROPRIETARY EQUITY PERFORMANCE
AS OF 6/30/12 | | | | ANNUALIZED PERFORMANCE | | | | | | | INCEPTION | | 1-YEAR | | | 3-YEAR | | | 5-YEAR | | | 7-YEAR | | | INCEPTION | | Large Cap Value Composite | | 4/1/02 | | | -2.2 | | | | 14.3 | | | | 0.6 | | | | 4.8 | | | | 5.6 | | Russell 1000 Value Index | | | | | 3.0 | | | | 15.8 | | | | -2.2 | | | | 2.9 | | | | 4.2 | | | | | | | | | Small Cap Value Composite | | 4/1/02 | | | 1.9 | | | | 19.9 | | | | 7.9 | | | | 9.7 | | | | 9.6 | | Russell 2000 Value Index | | | | | -1.4 | | | | 17.5 | | | | -1.1 | | | | 3.4 | | | | 6.1 | | | | | | | | | Smid Cap Value Composite | | 10/1/05 | | | -0.4 | | | | 17.4 | | | | 3.6 | | | | — | | | | 6.5 | | Russell 2500 Value Index | | | | | -1.5 | | | | 18.8 | | | | -0.2 | | | | — | | | | 3.7 | | | | | | | | | Multi Cap Value Composite | | 7/1/02 | | | -1.3 | | | | 16.5 | | | | 3.0 | | | | 6.4 | | | | 7.0 | | Russell 3000 Value Index | | | | | 2.6 | | | | 16.0 | | | | -2.1 | | | | 3.0 | | | | 5.4 | | | | | | | | | Equity Income Composite | | 12/1/03 | | | 4.5 | | | | 17.3 | | | | 4.9 | | | | 8.0 | | | | 9.9 | | Russell 3000 Value Index | | | | | 2.6 | | | | 16.0 | | | | -2.1 | | | | 3.0 | | | | 5.2 | | | | | | | | | Focused Value Composite | | 9/1/04 | | | -5.2 | | | | 15.9 | | | | 2.4 | | | | 6.5 | | | | 8.2 | | Russell 3000 Value Index | | | | | 2.6 | | | | 16.0 | | | | -2.1 | | | | 3.0 | | | | 4.4 | |
| | | | | | | | | | | | | | | | | | | | | | | | | | PROPRIETARY EQUITY PERFORMANCE | | ANNUALIZED PERFORMANCE | | | AS OF 03/31/13 | | INCEPTION | | | 1-YEAR | | | 3-YEAR | | | 5-YEAR | | | 7-YEAR | | | INCEPTION | | Large Cap Value Composite | | | 4/1/02 | | | | 16.0 | | | | 11.9 | | | | 6.2 | | | | 5.9 | | | | 7.0 | | Russell 1000 Value Index | | | | | | | 18.8 | | | | 12.7 | | | | 4.9 | | | | 4.2 | | | | 5.8 | | | | | | | | | Small Cap Value Composite | | | 4/1/02 | | | | 17.6 | | | | 16.7 | | | | 13.1 | | | | 10.6 | | | | 10.8 | | Russell 2000 Value Index | | | | | | | 18.1 | | | | 12.1 | | | | 7.3 | | | | 3.9 | | | | 7.6 | | | | | | | | | Smid Cap Value Composite | | | 10/1/05 | | | | 16.8 | | | | 15.2 | | | | 8.6 | | | | 8.2 | | | | 8.7 | | Russell 2500 Value Index | | | | | | | 21.2 | | | | 14.2 | | | | 8.8 | | | | 5.2 | | | | 6.4 | | | | | | | | | Multi Cap Value Composite | | | 7/1/02 | | | | 15.9 | | | | 13.4 | | | | 8.4 | | | | 7.7 | | | | 8.3 | | Russell 3000 Value Index | | | | | | | 18.7 | | | | 12.7 | | | | 5.1 | | | | 4.2 | | | | 6.9 | | | | | | | | | Equity Income Composite | | | 12/1/03 | | | | 18.6 | | | | 14.9 | | | | 10.1 | | | | 9.1 | | | | 11.1 | | Russell 3000 Value Index | | | | | | | 18.7 | | | | 12.7 | | | | 5.1 | | | | 4.2 | | | | 6.9 | | | | | | | | | Focused Value Composite | | | 9/1/04 | | | | 11.4 | | | | 10.5 | | | | 8.4 | | | | 6.9 | | | | 9.3 | | Russell 3000 Value Index | | | | | | | 18.7 | | | | 12.7 | | | | 5.1 | | | | 4.2 | | | | 6.4 | |
Proprietary Fixed Income Strategies In the management of fixed income investments, clients typically give us the mandate to produce stable returns to dampen the volatility of their portfolios as a counter-weight to equities as part of their complete asset allocation. For those investors who can take advantage of the tax exemption of municipal bonds, we have developed two high-yield municipal bond products designed to add value to the returns possible from high-grade bonds in a low interest rate environment. Below is the breakdown of assets under management by strategy as of June 30, 2012:March 31, 2013: 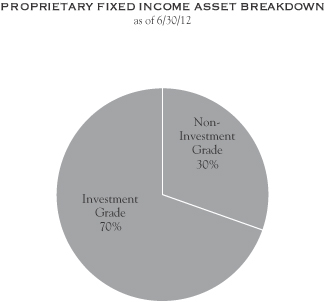 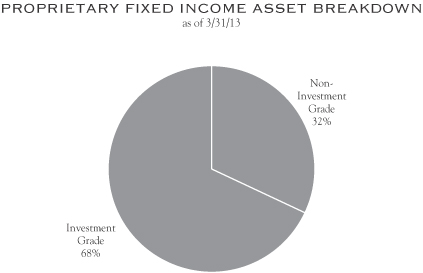
Our fixed income strategy employs a bottom-up fundamental value approach designed to minimize the risk of loss. Almost all of our bond portfolios are highly customized and focused on income and liquidity generation as opposed to capital appreciation. Outsourced Manager Selection Recognizing the value of diversification to our clients, we offer a variety of outsourced investment capabilities designed to complement our proprietary capabilities. These outsourced capabilities include managers who have long records of success in managing growth equities, international equities, taxable high yield bonds, hedge funds and other strategies not offered on a proprietary basis by us. In selecting these managers, we utilize an investment manager database for initial screening and then a dedicated staff conducts on-site due diligence. Potential managers are reviewed and selected by our IPSC. Our selection criteria include the following: | | • | | Highly Consistent Returns. We emphasize consistency of performance over strong performance marked by high volatility. |
| | • | | Tax Sensitivity. We seek managers with a low turnover style of management designed to achieve attractive after-tax rates of return. |
| | • | | Solid Operations, Technology. We require each manager to produce evidence that it has strong technology and operations capabilities as well as vigorous compliance adherence. |
| | • | | Alignment of Interest. We require evidence that the strategy’s key people have significant equity in their company and are motivated to stay in place. |
| | • | | Will Negotiate Fees. We require our traditional managers to accept a significant discount in their management fees because we expect to manage all aspects of the client relationship. Their only responsibility is to manage the capital entrusted to them. No manager has refused to offer the discounts we seek. |
In the case of hedge fund selection, for several years we have engaged the services of an outside hedge fund consultant whose team of analysts assists us in making formal hedge fund decisions. For large clients with significant hedge fund exposure, we offer a hedge fund advisory service to create customized hedge fund portfolios. Each of our funds of funds capabilities appears below:
| | • | | Silvercrest Hedged Equity Fund is designed to complement and diversify long-only equity portfolios through investments with managers who employ long and short strategies; |
| | • | | Silvercrest Emerging Markets Fund provides international and non-dollar exposure and diversification focused on long, short, credit and other managers who invest in emerging markets; |
| | • | | Silvercrest Commodity Strategies Fund seeks to give investors comprehensive commodity exposure; and |
| | • | | Silvercrest Special Situations Fund is designed to outperform traditional benchmarks with less volatility. |
We have two types of fee arrangements with outsourced managers. With respect to separately managed accounts, clients pay a discounted fee, negotiated by us, directly to the manager. With respect to outsourced fund consultants, clients pay a discounted fee negotiated by us, directly to the manager and the manager distributes a portion of the fee to us. Clients are informed of this arrangement and have signed a written acknowledgement. Delivering Client Service We take a holistic approach to client service, whereby a senior portfolio manager spearheads the coordination of the IPSC recommendations, family office services work and the investment management team in order to deliver the full range of our capabilities to the client. The portfolio manager helps the client define his or her portfolio needs, develop a portfolio plan designed to achieve them and execute an agreed upon plan to accomplish our client’s financial objectives. The portfolio manager has regular contact with our clients to make sure our clients thoroughly understand the decisions that are made. Portfolio managers are supported by junior portfolio managers and portfolio assistants who are thoroughly knowledgeable about a client’s portfolio, investment strategy and relationship with us. Junior portfolio managers are young professionals whom we seek to train and develop as portfolio managers. This approach frees senior managers to handle more client business, without compromising service, while developing the next generation of portfolio managers to develop and handle new client accounts. The majority of our organic growth is due to client referrals and we believe the structure of our portfolio management teams, investments in technology and integrated portfolio trading programs enable us to scale future growth. Nine out of our ten largest high net worth clients use one or more componentcomponents of our family office services. We believe that this is an attractive growth area for our company and we have initiated plans to increase the provision of these services to both broaden relationships with existing clients and to attract potential clients. Our family office services are profitable and are not used as a loss-leader for attracting clients. Our family office capabilities include the following: Tax Planning and Preparation; Partnership Accounting and Fund Administration; Consolidated Wealth Reporting; Estate or Trust Agency; and Art Consultancy, Management. For institutional client relationships, all day-to-day interfacingcontact with our clients is handled by a dedicated institutional client service team headed by a Managing Director who also maintains our relationships with institutional investment consultants. This structure permits our investment professionals to maintain their focus on achieving superior investment results without the distraction of client demands. For the regularly scheduled portfolio review sessions with a client, generally a senior investment professional attends the face-to-face meetings with the head of institutional client services. The result is an efficient client-oriented service approach that is significantly scalable in size. Competition The wealth management industry is highly competitive and is comprised of many players. We compete directly with some of the largest financial service companies, as well as some of the smallest. VirtuallySubstantially all of our new business is gained from our success in taking market share from these firms. We primarily compete on the basis of several factors, including our level of service, the quality of our advice, independence, stability, performance results, breadth of our capabilities and fees. In general, these competitors fall into one of the following categories: | | • | | Diversified Financial Institutions have divisions aimed at providing wealth management solutions to the high net worth segment that are usually staffed by brokers. |
| | • | | Asset Management Firms offer proprietary institutional and retail asset management services catering to the high net worth segment largely with off-the-shelf products. |
| | • | | Trust Companies combine fiduciary and investment services as well as ancillary financial services. |
| | • | | MFO/RIAs focus exclusively on the high net worth segment and are frequently dominated by one or two families. |
As a registered investment adviser that is not affiliated with other financial firms, we are free from the conflicts associated with brokerage or investment banking firms. In advising our clients on portfolio strategies, we are motivated to meet our clients’ investment objectives—not to generate commissions or placement fees—and to focus solely on providing excellent service and investment performance. We have the size and resources to compete with larger organizations, and unlike many smaller firms, to provide our clients with fully customized, full-service wealth management and integrated family office solutions. While many competitors outsource investment management, we have chosen to compete with excellent proprietary investment capabilities coupled with a focused array of complementary non-proprietary capabilities offered by unaffiliated firms. This combination enables us to compete for and win the business of wealthy investors. We believe this is a key to our past and future success. Employees As of June 30, 2012,March 31, 2013, we had 8593 full-time employees and twothree part-time employees. Facilities Our corporate headquarters are principally located at 1330 Avenue of the Americas, 38th Floor, New York, New York 10019, where we occupy approximately 41,000 square feet of space under a lease, the terms of which expire on September 30, 2017. We believe our current facilities are adequate for our current needs and that suitable additional space will be available as and when needed. Legal Proceedings In the normal course of business, we may be subject to various legal and administrative proceedings. Currently, there are no legal proceedings pending or threatened against us. REGULATORY ENVIRONMENT Our business is subject to extensive regulation in the United States at the federal level and, to a lesser extent, the state level. Under these laws and regulations, agencies that regulate investment advisers have broad administrative powers, including the power to limit, restrict or prohibit an investment adviser from carrying on its business in the event that it fails to comply with such laws and regulations. Possible sanctions that may be imposed include the suspension of individual employees, limitations on engaging in certain lines of business for specified periods of time, revocation of investment adviser and other registrations, censures and fines. The legislative and regulatory environment in which we operate has undergone significant changes in the recent past. New laws or regulations, or changes in the enforcement of existing laws or regulations, applicable to us and our clients may adversely affect our business. Our ability to function in this environment will depend on our ability to monitor and promptly react to legislative and regulatory changes. There have been a number of highly publicized regulatory inquiries that have focused on the investment management industry. These inquiries have resulted in increased scrutiny of the industry and new rules and regulations for investment advisers. This regulatory scrutiny may limit our ability to engage in certain activities that might be beneficial to our stockholders. In addition, as a result of recent market events, acts of serious fraud in the investment management industry and perceived lapses in regulatory oversight, U.S. and non-U.S. governmental and regulatory authorities may increase regulatory oversight of our businesses. We may be adversely affected as a result of new or revised legislation or regulations imposed by the SEC, the CFTC, other U.S. or non-U.S. regulatory authorities or self-regulatory organizations that supervise the financial markets. We also may be adversely affected by changes in the interpretation or enforcement of existing laws and rules by these governmental authorities and self-regulatory organizations, as well as by U.S. and non-U.S. courts. It is impossible to determine the extent of the impact of any new laws, regulations or initiatives that may be proposed on us or the markets in which we trade, or whether any of the proposals will become law. Compliance with any new laws or regulations could add to our compliance burden and costs and affect the manner in which we conduct our business. SEC Regulation Silvercrest Asset Management GroupSAMG LLC is registered with the SEC as an investment adviser under the Advisers Act. The Advisers Act, together with the SEC’s regulations and interpretations thereunder, imposes substantive and material restrictions and requirements on the operations of investment advisers. The SEC is authorized to institute proceedings and impose sanctions for violations of the Advisers Act, ranging from fines and censures to termination of an adviser’s registration.
The Advisers Act imposes substantive regulation on virtually all aspects of our business and relationships with our clients. As a registered investment adviser, we are subject to many requirements that cover, among other things, disclosure of information about our business to clients; maintenance of written policies and procedures; maintenance of extensive books and records; restrictions on the types of fees we may charge, including performance fees; solicitation arrangements; engaging in transactions with clients; maintaining an effective compliance program; custody of client assets; client privacy; advertising; and proxy voting. The SEC has authority to inspect any registered investment adviser and typically inspects a registered investment adviser periodically to determine whether the adviser is conducting its activities (i) in accordance with applicable laws, (ii) consistent with disclosures made to clients and (iii) with adequate systems and procedures to ensure compliance. As an investment adviser, we have a fiduciary duty to our clients. The SEC has interpreted this duty to impose standards, requirements and limitations on, among other things: trading for proprietary, personal and client accounts; allocations of investment opportunities among clients; use of soft dollars; execution of transactions; and recommendations to clients. We manage 72%63% of our accounts on a discretionary basis, with authority to buy and sell securities for each portfolio, select broker-dealers to execute trades and negotiate brokerage commission rates. In connection with these transactions, we receive soft dollar credits from broker-dealers that have the effect of reducing certain of our expenses. Section 28(e) of the Exchange Act provides a “safe harbor” to an investment adviser against claims that it breached its fiduciary duty under state or federal law (including ERISA) solely because the adviser caused its clients’ accounts to pay more than the lowest available commission for executing a securities trade in return for brokerage and research services. To rely on the safe harbor offered by Section 28(e), (i) we must make a good-faith determination that the amount of commissions is reasonable in relation to the value of the brokerage and research services being received and (ii) the brokerage and research services must provide lawful and appropriate assistance to us in carrying out our investment decision-making responsibilities. In permissible circumstances, we may receive technology-based research, market quotation and/or market survey services which are paid for in whole or in part by soft dollar brokerage arrangements. If our ability to use soft dollars were reduced or eliminated as a result of the implementation of statutory amendments or new regulations, our operating expenses would increase. Under the Advisers Act, our investment management agreements may not be assigned without the client’s consent. The term “assignment” is broadly defined and includes direct assignments as well as assignments that may be deemed to occur upon the transfer, directly or indirectly, of a controlling interest in an investment adviser. The failure of Silvercrest Asset Management GroupSAMG LLC to comply with the requirements of the Advisers Act, and the regulations and interpretations thereunder, could have a material adverse effect on us. CFTC Regulation Due to recent rule amendments by the CFTC, Silvercrest Asset Management GroupSAMG LLC and certain of its affiliates may be required to registeris registered with the CFTC and the National Futures Association, or the NFA, as a commodity pool operator and/or commodity trading advisor. Registration will subjectsubjects us and our affiliates to substantive and material restrictions and requirements, including, among other things, reporting, recordkeeping, disclosure, self-examination and training requirements. Registration may also subjectsubjects us to periodic on-site audits, and the CFTC is authorized to institute proceedings and impose sanctions for violations of the Commodity Exchange Act and/or CFTC rules. Dodd-Frank While the Dodd-Frank Act has not yet caused us to reconsider our business model, certain provisions will, and other provisions may, increase regulatory burdens and reporting and related compliance costs. In addition, the scope of many provisions of the Dodd-Frank Act are being determined by implementing regulations, some of which will require lengthy proposal and promulgation periods. Moreover, the Dodd-Frank Act mandates many regulatory studies, some of which pertain directly to the investment management industry, which could lead to additional legislation or regulation. The SEC and the CFTC, jointlyas a result of authority provided to these agencies in Section 404 of the Dodd-Frank Act, issued final rules that require investment advisers registered with the SEC that advise one or more private funds, as well as commodity pool operators and commodity trading advisors registered with the CFTC, to provide certain information on Form PF about their funds and assets under management, including the amount of borrowings, concentration of ownership and other performance information, which will be used by the Financial Stability Oversight Council for purposes of assessing the systemic risk posed by private funds and by the SEC and CFTC for other purposes. We are subject to these rules and will have to providefile a Form PFPF. Likewise, as a result of the issuance by the CFTC of certain other rules, pursuant to authority granted under Sections 404 and 406 of the SEC.Dodd-Frank Act, we will be required to file a Form CPO-PQR and Form CTA-PR. The Dodd-Frank Act will affect a broad range of market participants with whom we interact or may interact, including banks, non-bank financial institutions, rating agencies, mortgage brokers, credit unions, insurance companies and broker-dealers. Regulatory changes that will affect other market participants are likely to change the way in which we conduct business with our counterparties. The uncertainty regarding further implementation of the Dodd-Frank Act and its impact on the investment management industry and us cannot be predicted at this time but will continue to be a risk for our business. ERISA-Related Regulation To the extent that Silvercrest Asset Management GroupSAMG LLC or any other of our affiliates is a “fiduciary” under ERISA with respect to benefit plan clients, it is subject to ERISA and to regulations promulgated thereunder. Among other things, ERISA and applicable provisions of the Internal Revenue Code impose certain duties on persons who are fiduciaries under ERISA, prohibit certain transactions involving benefit plan clients and provide monetary penalties for violations of these prohibitions. Our failure to comply with these requirements could have a material adverse effect on our business. Compliance Our legal and compliance functions are integrated into a team of professionals. This group is responsible for all legal and regulatory compliance matters, as well as monitoring adherence to client investment guidelines. Senior management is involved at various levels in all of these functions. For information about our regulatory environment, see “Risk Factors—Risks Related to the Regulatory Environment in which We Operate—The regulatory environment in which we operate is subject to continual change and regulatory developments designed to increase oversight may adversely affect our business.” MANAGEMENT Executive Officers and Directors The following table provides information regarding our directors, nominees to our board of directors and executive officers. | | | | | | | Name | | Age | | | Position | G. Moffett Cochran | | | 6162 | | | Chairman, Chief Executive Officer and Director | Richard R. Hough III | | | 4243 | | | President, Chief Operating Officer and Director | Scott A. Gerard | | | 4445 | | | Chief Financial Officer | David J. Campbell | | | 4344 | | | General Counsel and Secretary | Albert S. Messina | | | 65 | | | Managing Director and Portfolio Manager | Winthrop B. Conrad, Jr. | | | 67 | | | Director | Wilmot H. Kidd III | | | 7071 | | | Director | Richard S. Pechter | | | 6768 | | | Director |
G. Moffett Cochran is our Chief Executive Officer and Chairman of our board of directors. As our Chief Executive Officer, Mr. Cochran is responsible for the oversight and management of our company. Mr. Cochran has been the Chairman and Chief Executive Officer of Silvercrest Asset Management GroupSAMG LLC, since he co-founded it in 2001. Prior to forming Silvercrest Asset Management GroupSAMG LLC, Mr. Cochran served as Chairman of Donaldson, Lufkin & Jenrette (DLJ) Asset Management Group and then as President of Credit Suisse Asset Management LLC following the acquisition of DLJ by Credit Suisse in 2000. He also currently serves as Chairman of the Board of Directors of the Jefferson Scholars Foundation and as a member of the Board of Trustees of the Virginia Museum of Fine Arts. Mr. Cochran holds a B.A. from the University of Virginia and a J.D. from the University of Virginia School of Law. As co-founder of Silvercrest Asset Management GroupSAMG LLC, Mr. Cochran has been involved in guiding our business since its inception. Mr. Cochran has over 25 years of experience in senior management positions in the investment management industry and has dealt with a wide range of issues that face the industry and us in particular. These two facets provide him with strong insights into all aspects of our business and the types of management issues that face companies in our sector. Based on his experience and qualifications, Mr. Cochran was elected as a member of our board. Richard R. Hough III is our President and Chief Operating Officer and a member of our board of directors. Mr. Hough has served as President of Silvercrest Asset Management GroupSAMG LLC since January 2012 and as its Chief Operating Officer since July 2010. He has been a member of the Executive Committee of Silvercrest L.P. since 2007. Mr. Hough, who joined us in 2003, has responsibility for all aspects of our operations, including corporate strategy and development. Previously, Mr. Hough served as the founding national program director of Children’s Scholarship Fund. Mr. Hough also worked in Washington, DC, as a managing editor and policy analyst. Mr. Hough is a member of the Board of Governors of the Investment Adviser Association, a not-for-profit organization that represents the interests of SEC-registered investment adviser firms. He serves on the advisory board of theNew Criterion, a monthly review of the arts and intellectual life and on the executive board of Monmouth Council, Boy Scouts of America. Mr. Hough graduated with a degree in politics from Princeton University. Mr. Hough has been involved in the strategy of our company for almost ten years. His various leadership roles enable him to provide valuable insight on the strategic direction of the Company. Based on his experience and qualifications, Mr. Hough was elected as a member of our board. Scott A. Gerard is our Chief Financial Officer. Mr. Gerard has served as Chief Financial Officer of Silvercrest Asset Management GroupSAMG LLC since 2010. Prior to joining Silvercrest, Mr. Gerard was Chief Financial Officer of Brand Connections, LLC, a private equity-backed marketing and media company from December 2008 through November 2009. Previously, he was Chief Financial Officer of Guideline, Inc., a publicly-held business research firm. Prior to Guideline, Mr. Gerard was a Division Controller with Citigroup Inc. and began his career with KPMG LLP. Mr. Gerard is a Certified Public Accountant and received a B.S. in accounting from the University of Buffalo. David J. Campbell is our General Counsel and Secretary. Mr. Campbell has served as the General Counsel of Silvercrest Asset Management GroupSAMG LLC since 2009. Prior to joining Silvercrest, Mr. Campbell served as a Managing Director and Associate General Counsel at Jefferies & Company, Inc. from 2006 to 2009. Mr. Campbell began his career at Donaldson, Lufkin & Jenrette Securities Corporation, where as a Senior Vice President he provided advice and counsel to DLJ’s Pershing Division, Investment Services Group and DLJdirect. In 2001, he joined the law firm of Bressler, Amery & Ross, P.C., where he was a partner. He graduated with a B.A. from The George Washington University and a J.D. from Villanova University School of Law. Albert S. Messina joined Silvercrest Asset Management in April 2002 as a Managing Director and Portfolio Manager of equity and fixed income portfolios. Prior to that, Mr. Messina was a Managing Director at Credit Suisse Asset Management (CSAM), where he served in a similar capacity. He arrived at CSAM as a result of that firm’s merger with DLJ, where he had worked since 1983. Previously, he spent 14 years with Bankers Trust Company, where he advised private clients and oversaw the fiduciary department’s Tax Services Division. Mr. Messina holds a B.A. in Economics from Brooklyn College. Winthrop B. Conrad, Jr.is a member of our board of directors. Winthrop B. Conrad, Jr. is Senior Counsel, retired, of Davis Polk & Wardwell, LLP, a New York based global law firm. Prior to July 2007, Mr. Conrad was a senior partner at Davis Polk, specializing in capital markets transactions, mergers and acquisitions and general corporate matters. Mr. Conrad is a graduate of Yale College and received his J.D. from Harvard Law School. Davis Polk has not performed and does not perform legal services for us. Mr. Conrad has extensive experience with corporate transactions, as well as finance, which provides us with important perspectives in those areas. With his broad experience in corporate legal matters, Mr. Conrad is uniquely equipped to provide the board with insight into capitalization strategies, fiduciary matters, capital markets mechanics and strategic expansion opportunities. Based on his experience and qualifications, Mr. Conrad was elected as a member of our board. Wilmot H. Kidd III is a member of our board of directors. Mr. Kidd is Chairman of the Board and President of Central Securities Corporation, a non-diversified, publicly traded, investment company. Mr. Kidd has served as its President since 1973 and became Chairman of its Board of Directors in 2010. Mr. Kidd graduated from Washington & Lee University with a B.S. and from Northwestern University with an M.B.A. Mr. Kidd has been involved in the financial services industry generally and the financial aspects of the investment company environment specifically for many years. He has extensive financial expertise through his various roles in publicly traded investment companies. In addition, Mr. Kidd’s service as chairman of the board of another public company provides our company with valuable insights on corporate governance issues that face the board and our company. Based on his experience and qualifications, Mr. Kidd was elected as a member of our board. Richard S. Pechter is a member of our board of directors. Mr. Pechter joined Donaldson, Lufkin & Jenrette, or DLJ, in 1969 and spent his career there, retiring in 2000 as a Director of the parent and Chairman of DLJ’s Financial Services Group and DLJdirect. He is currently a Director of the Financial Industry Regulatory Authority, Inc., or FINRA and was previously a Director of the New York Stock Exchange Regulatory Authority. Mr. Pechter graduated from Yale and received his M.B.A. from the Harvard Business School, where he was a Baker Scholar. Mr. Pechter has 42 years of experience in the investment management sector in various business, finance and strategic leadership roles. He has broad expertise and knowledge of the investment management business. Through his experience, Mr. Pechter has gained and developed extensive business, finance, distribution, marketing and leadership skills. Further, Mr. Pechter possesses an understanding of the regulatory aspects affecting our business through his relationships with FINRA and the New York Stock Exchange Regulatory Authority. These unique characteristics make him an important asset to our board, providing insight into the regulatory developments within our sector. Based on his experience and qualifications, Mr. Pechter was elected as a member of our board. Board Composition Our board of directors currently consists of five directors. Messrs. Conrad, Kidd and Pechter qualify as independent directors under the corporate governance standards of Nasdaq. Our board of directors consists of a majority of independent directors within the meaning of the applicable rules of the SEC and Nasdaq and at least one member, Mr. Kidd, who is an Audit Committee financial expert within the meaning of the applicable rules of the SEC and Nasdaq. As described under “The Reorganization and Our Holding Company Structure—Stockholders’ Agreement Among Class B Stockholders,” the holders of our Class B common stockprincipals and our employees who are granted restricted shares of our Class A common stock will enter into a stockholders’ agreement pursuant to which they will agree to vote their shares of Class A common stock and Class B common stock they hold at such time, or may acquire in the future, in accordance with the decision of the Executive Committee of Silvercrest L.P.Committee. The votes of the members of the Executive Committee will be weighted based upon their relative holdings of Class B units. As a result of his equity ownership and position on the Executive Committee, following this offering, G. Moffett Cochran will initially control the vote of the Executive Committee, of Silvercrest L.P., and therefore, the vote of all of the shares of Class A common stock and Class B common stock held by our employees.principals. The parties ofto the stockholders’ agreement collectively will hold % of the combined voting power of our capital stock immediately after this offering (or approximately % if the underwriters exercise in full their option to purchase additional shares). Staggered Board Effective upon the consummation of this offering, our board of directors will be divided into three staggered classes of directors of the same or nearly the same number and each director will be assigned to one of the three classes. At each annual meeting of the stockholders, a class of directors will be elected for a three-year term to succeed the directors of the same class whose terms are then expiring. The terms of the directors will expire upon the election and qualification of successor directors at the annual meeting of stockholders to be held during the years 20132014 for Class I directors, 20142015 for Class II directors and 20152016 for Class III directors. Our Class I directors will be Mr. Kidd and Mr. Pechter; Our Class II directors will be Mr. Conrad and Mr. Hough; and Our Class III director will be Mr. Cochran. Our board of directors is set at five directors. Our second amended and restated certificate of incorporation and amended and restated bylaws provide that the number of our board of directors shall be fixed from time to time by a resolution of a majority of our board of directors. Any additional directorships resulting from an increase in the number of directors will be distributed among the three classes so that, as nearly as possible, each class shall consist of one-third of the board of directors. The division of our board of directors into three classes with staggered three-year terms may delay or prevent stockholder efforts to effect a change of our management or a change in control. See “Description of Capital Stock—Anti-Takeover Effects of Delaware Law and Our Second Amended and Restated Certificate of Incorporation—Classified Board of Directors” and “Risk Factors—Risks Related to this Offering—Anti-takeover provisions in our second amended and restated certificate of incorporation and amended and restated bylaws could discourage a change of control that our stockholders may favor, which also could adversely affect the market price of our Class A common stock.” Our board of directors currently consists of five directors. Messrs. Conrad, Kidd and Pechter qualify as independent directors under the corporate governance standards of Nasdaq. Silvercrest was incorporated on July 11, 2011. As such, we have had only one annual meeting during the most recent fiscal year in which all directors attended. Upon being registered as a public company, we intend towill have required annual meetings. Board Leadership Structure Our board of directors includes our Chief Executive Officer who also serves as Chairman of the board. Our board understands that there is no single, generally accepted approach to providing board leadership and that given the dynamic and competitive environment in which we operate, the right board leadership structure may vary as circumstances warrant. To this end, our board of directors has no policy mandating the combination or separation of the roles of Chairman of the board and Chief Executive Officer and believes the matter should be discussed and considered from time to time as circumstances change. Mr. Cochran will serve as both our Chief Executive Officer and Chairman, which we believe provides strong leadership for us and promotes a close relationship between management and our board of directors and assists in the development and implementation of corporate strategy. Board Oversight of Risk Management Our board of directors is responsible for overseeing management in the execution of its responsibilities and for assessing our general approach to risk management. In addition, an overall review of risk is inherent in our board’s consideration of our long-term strategies and other matters presented to our board. Our board exercises its responsibilities periodically as part of its meetings and also through our board’s three committees, which will be established prior to the consummation of this offering, each of which will examine various components of enterprise risk as part of their responsibilities. For example, the Audit Committee has primary responsibility for addressing risks relating to financial matters, particularly financial reporting, accounting practices and policies, disclosure controls and procedures and internal control over financial reporting. The Audit Committee has primary responsibility for reviewing and discussing our practices regarding risk assessment and management, including any guidelines or policies that govern the process by which we identify, monitor and handle major risks. The Nominating and Corporate Governance Committee oversees risks associated with the independence of our board and potential conflicts of interest. The Compensation Committee has primary responsibility for risks and exposures associated with our compensation policies, plans and practices, regarding both executive compensation and the compensation structure generally, including whether it provides appropriate incentives that do not encourage excessive risk-taking. Senior management is responsible for assessing and managing our various exposures to risk on a day-to-day basis, including the creation of appropriate risk management programs and policies. Our board’s role in risk oversight of our company is consistent with our leadership structure, with the Chief Executive Officer and other members of senior management having responsibility for assessing and managing our risk exposure, with our board and its committees providing oversight in connection with those efforts. We believe this division of risk management responsibilities presents a consistent, systematic and effective approach for identifying, managing and mitigating risks throughout our company. Board Committees Prior to the consummation of this offering, we will establish an Audit Committee, a Nominating and Corporate Governance Committee and a Compensation Committee, each consisting only of independent directors. Audit Committee Our Audit Committee will assist our board of directors in its oversight of our internal audit function, the integrity of our financial statements, our independent registered public accounting firm’s qualifications and independence and the performance of our independent registered public accounting firm. Our Audit Committee’s responsibilities will include, among others: reviewing the audit plans and findings of our independent registered public accounting firm and our internal audit and risk review staff, as well as the results of regulatory examinations, and tracking management’s corrective action plans where necessary; reviewing our financial statements, including any significant financial items and/or changes in accounting policies, with our senior management and independent registered public accounting firm; reviewing our financial risk and control procedures, compliance programs regarding risk assessment and management and significant tax, legal and regulatory matters; and appointing annually our independent registered public accounting firm, evaluating its independence and performance, determining its compensation and setting clear hiring policies for employees or former employees of the independent registered public accounting firm. We anticipate that Messrs. Conrad, Kidd and Pechter will serve on the Audit Committee and that Mr. Kidd will serve as its chairman. Each of Messrs. Conrad, Kidd and Pechter is independent under Rule 10A-3 of the Exchange Act. Mr. Kidd serves as our Audit Committee “financial expert”, as that term is defined under the SEC rules implementing Section 407 of Sarbanes-Oxley, and has experience that results in his financial sophistication as defined under Nasdaq rules. Nominating and Corporate Governance Committee Our Nominating and Corporate Governance Committee’s responsibilities will include, among others: making recommendations to the board regarding the selection of candidates, qualification and competency requirements for service on the board and the suitability of proposed nominees as directors; advising the board with respect to the corporate governance principles applicable to us; overseeing the evaluation of the board and management; reviewing and approving in advance any related party transaction, other than those that are pre-approved pursuant to pre-approval guidelines or rules established by the committee; reviewing periodically the form and amounts of director compensation and making recommendations to the board with respect thereto; and establishing guidelines or rules to cover specific categories of transactions. We anticipate that Messrs. Conrad, Kidd and Pechter will serve on the Nominating and Corporate Governance Committee, each of whom qualifies as an “independent” director as defined under the applicable rules and regulations of the SEC, Nasdaq and the Internal Revenue Service.IRS. Mr. Conrad will serve as the chairman of the Nominating and Corporate Governance Committee. Compensation Committee Our Compensation Committee will assist our board of directors in the discharge of its responsibilities relating to the compensation of our executive officers. Our Compensation Committee’s responsibilities will include, among others: reviewing and approving, or making recommendations to our board of directors with respect to, the compensation of our executive officers; overseeing and administering, and making recommendations to our board of directors with respect to, our cash and equity incentive plans; and reviewing and making recommendations to the board of directors with respect to director compensation. We anticipate that Messrs. Conrad, Kidd and Pechter will serve on the Compensation Committee, each of whom qualifies as an “independent” director as defined under the applicable rules and regulations of the SEC, Nasdaq and the Internal Revenue Service.IRS. Mr. Pechter will serve as the chairman of the Compensation Committee. Compensation Committee Interlocks and Insider Participation Upon the effectiveness of the registration statement of which this prospectus forms a part, our board of directors will form a Compensation Committee as described above. Prior to this offering, the compensation of our executive officers was determined by our Chief Executive Officer and the Executive Committee of Silvercrest L.P.Committee. Following this offering, the Compensation Committee of our board of directors will have responsibility for establishing and administering compensation programs and practices with respect to our executive officers, including the named executive officers. None of our executive officers serves as a member of the board of directors or Compensation Committee, or other committee serving an equivalent function, of any entity that has one or more of its executive officers serving as a member of our board of directors or our Compensation Committee. COMPENSATION DISCUSSION AND ANALYSIS The following discussion and analysis of compensation arrangements of our named executive officers for 20112012 should be read together with the compensation tables and related disclosures set forth below. This discussion contains certain forward-looking statements that are based on our current plans, considerations, expectations and determinations regarding future compensation programs. Actual compensation programs that we adopt in the future may differ materially from currently planned programs as summarized in this discussion. This section summarizes the material elements and principles underlying our compensation policies, including those relating to our named executive officers. It generally describes the manner and context in which compensation is earned by, and awarded and paid to, our management and senior executives, who we refer to as our principals, and provides perspective on the tables and narratives that follow. The named executive officers of Silvercrest are G. Moffett Cochran, Chairman and Chief Executive Officer, Richard R. Hough III, President and Chief Operating Officer, Scott A. Gerard, Chief Financial Officer, and David J. Campbell, General Counsel and Secretary.Secretary and Albert S. Messina, Managing Director and Portfolio Manager. During 20112012 and through the consummation of this offering, we were a private company. We expect that some of our policies and practices with respect to compensation will change when we are a public company. This section also highlights some of those expected changes. References to “we”, “our” or “company” in this Compensation Discussion and Analysis section that describe our historical compensation practices refer to Silvercrest L.P. and our predecessor Silvercrest GP LLC, and references to “we”, “our” or “company” in this Compensation Discussion and Analysis section that describe our compensation practices following the consummation of this offering refer to Silvercrest and its subsidiaries. Philosophy and Objectives of Compensation Program Our compensation program is designed to reward past performance on an individual, team, and company level, and encourages future contributions to achieving our strategic goals and enhancing stockholder value. Our method of compensating our principals is intended to meet the following objectives: (i) support our overall business strategy; (ii) attract, retain and motivate top-tier professionals within the investment management industry; and (iii) align the interests of our principals with those of our stockholders. We believe that to create long-term value for our stockholders, we need a skilled and experienced management team focused on achieving profitable and sustainable financial results, expanding our investment capabilities through disciplined growth, continuing to diversify sources of revenue and delivering superior client service. We depend on our management team to execute the strategic direction of our company and maintain our standards for ethical, responsible and professional conduct. We also rely on our management team to manage our professionals and distribution channels and provide the operational infrastructure that allows our investment professionals to focus on achieving attractive investment returns and superior client service. In addition, we depend on our management team to encourage an entrepreneurial and collegial business culture. The elements of our compensation and equity participation programs have contributed to our ability to attract and retain a highly qualified team of professionals. For our principals, we use, and expect to continue to use, cash and equity compensation programs and equity participation in a combination that has been successful for us in the past and that we believe will continue to be successful for us as a public company. In addition to cash compensation for our principals, we have recognized performance and value, which enhance our overall compensation objectives, by (i) offering interests in Silvercrest L.P. and its general partner and our predecessor, Silvercrest GP LLC, for purchase by employees at fair market value and (ii) awarding deferred equity units in Silvercrest L.P. and Silvercrest GP LLC which vest over time. In some cases, these deferred equity units are complemented by performance units of additional equity interests in Silvercrest L.P. and Silvercrest GP LLC that vest upon the achievement of defined, long-term company performance hurdles. By doing so, we have enabled our principals to share in the future profits, growth and success of our business. Our cash compensation and equity participation programs align the interests of our principals with those of our stockholders and create long-term stockholder value. After becoming a public company, we intend to maintain overall compensation at highly competitive levels. In addition, we expect to award equity-based compensation as part of our compensation programs for our principals. As a public company, we intend to focus compensation programs on rewarding performance that increases long-term stockholder value, including growing revenues, retaining clients, developing new client relationships, developing new products, improving operational efficiency and managing risks. We intend to periodically evaluate the success of our compensation and equity participation programs in achieving these objectives and adapt these programs as our company grows in order to enable us to better achieve these, and future, objectives. Determination of Compensation and Role of Directors and Principals in Compensation Decisions Our executive compensation and equity participation programs were developed and implemented while we were a private company. We have not identified a specific peer group of companies for comparative purposes and have not engaged in formal competitive benchmarking of compensation against specific peer companies. In addition, we have not engaged a compensation consultant to assist in the annual review of our compensation practices or the development of compensation or equity participation programs for our principals. Compensation of our employees is not determined using rigid metrics or formulae and all compensation decisions are subject to the discretion of the Executive Committee of Silvercrest L.P. and, ultimately, our Chairman and Chief Executive Officer. Historically, base salaries, annual bonuses and incentive compensation of our employees are reviewed by the Executive Committee of Silvercrest L.P. and adjusted as deemed necessary after taking into account both individual and company performance. In addition, pursuant to the terms of our governing documents, aggregate compensation levels historically have been subject to the approval of our independent board member and independent investor when they exceeded a specified percentage of annual revenue. In connection with this offering, our board of directors will form a Compensation Committee comprised solely of independent directors to assist our board of directors in the discharge of its responsibilities relating to the compensation of our named executive officers. For a discussion of the Compensation Committee’s role and responsibilities, see “Management—Board Committees—Compensation Committee” included in this prospectus. In making its decisions, the Compensation Committee will be guided by the recommendations of the Chief Executive Officer and Executive Committee of Silvercrest L.P.Committee. We have not adopted policies with respect to cash versus non-cash compensation (or among different forms of non-cash compensation), although we have determined that it is important to encourage or provide a meaningful opportunity to acquire an amount of equity ownership by our principals to help align their interests with those of our company. The allocation between cash and non-cash compensation has historically been based on a number of factors, including individual performance, company performance and company liquidity. These determinations vary from year to year. We may decide in future years to pay some or all of short-term and long-term incentives in equity depending upon the facts and circumstances existing at that time. We have also not adopted policies with respect to current versus long-term compensation, but believe that both elements are necessary for achieving our compensation objectives for all employees. As a public company, we expect that base salaries and performance bonuses will remain competitive for all employees. Equity awards for principals will reward achievement of strategic long-term objectives and we believe will contribute toward overall stockholder value. In the future, we also expect that our Chief Executive Officer will continue to have discretion to determine the compensation of the named executive officers (other than himself), which he will do in consultation with our Compensation Committee. Our Compensation Committee is also expected to assume overall oversight responsibility for our compensation policies, plans and programs, by reviewing our company’s achievements and the achievements of our employees, and providing input and guidance to our Chairman and Chief Executive Officer in the determination of the specific type and level of compensation of our other named executive officers. Our Compensation Committee will also set the compensation of our Chairman and Chief Executive Officer. Principal Components of Compensation We have established compensation practices that directly link compensation with individual and company performance, as described below. These practices apply to all of our principals, including our named executive officers. Ultimately, ownership in our company has been the primary tool we have used to attract and retain senior professionals. As of, June 30, 2012, on a pro forma basis to take into account the reorganization and the consummation of this offering, our principals indirectly held approximately % of the interests in Silvercrest L.P. The substantial majority of employee-owned interests are held by Mr. Cochran. In connection with the reorganization, all units in Silvercrest GP LLC, our predecessor, held by our principals will be converted into interests in Silvercrest L.P. The interests in Silvercrest L.P. currently held by our principals will continue to be held by them and will entitle them to continue to receive distributions from Silvercrest L.P. after the consummation of this offering. In 2011,2012, we provided the following elements of compensation to our principals, the relative value of each of these components for individual principals varying based on job role and performance: (i) base salary; (ii) annual cash bonus; (iii) deferred equity-based compensation; and (iv) other benefits and perquisites, each of which is described below. | | • | | Base Salary. Base salaries are intended to provide the named executive officers with a degree of financial certainty and stability that does not depend entirely upon company or individual performance. The intent behind all salaries is to provide a source of stable and predictable cash flow for each of our principals. The base salaries of our named executive officers for 20112012 are set forth below in our “Summary Compensation Table.” |
| | • | | Annual Cash Bonus. Annual cash bonus is determined at or after the end of each fiscal year and is based on a number of variables that are linked to individual and company-wide performance for that year and over the longer term. Our principals’ annual bonus awards have been granted in the sole and absolute discretion of our Chairman and Chief Executive Officer. Historically, our Chairman and Chief Executive Officer has determined his own bonus, if any, based upon the performance of our company. As a public company, we anticipate that our Compensation Committee will assume oversight for all of our compensation programs, including the approval of compensation of our Chief Executive Officer. The annual cash incentive compensation awarded to our named executive officers for fiscal 20112012 is set forth below in our “Summary Compensation Table.” |
| | • | | Deferred Equity-Based Compensation. All of our named executive officers and all of our principals own equity interests in our company. As part of our annual incentive compensation for some of our named executive officers and other principals, we awarded deferred equity units which vest over a four-year period and performance units in each of 2011 and 2012 for performance in the prior year. Units granted represented 25% of annual incentive compensation in 2011 for all of our named executive officers except Mr. Cochran, whose bonus was comprised entirely of units. In 2012, the percentage varied by officer. Each performance unit represents the unsecured right to receive additional interests in Silvercrest L.P. and Silvercrest GP LLC, but only if: (i) the recipient continues to hold the underlying deferred equity units at the time the performance units vest, which is four years from the date of issuance; and (ii) interests in Silvercrest L.P. and Silvercrest GP LLC have increased in value from date of issuance by at least 15% in year four. The value of the deferred equity and performance units when awarded is set forth below in our “Summary Compensation Table.” |
| | • | | Other Benefits and Perquisites. Each of our employees participates in the employee health benefit programs we maintain, including medical, group life and long-term disability insurance, on the same |
| basis as all other employees, subject to satisfying any eligibility requirements and applicable law. We also provide other perquisites such as an automobile program, by which our present and former Management Committee members are provided $500 per month toward auto lease or financing |
| payments. In addition, we offer each of our employees our investment management services, if they place their funds in a separately-managed account with us, at a discounted advisory fee typically associated with these services. Currently we do not have plans to change the levels of perquisites received, but continue to monitor them and may make adjustments from time to time. The perquisites provided to our named executive officers in the fiscal year ending December 31, 20112012 are described below in our “Summary Compensation Table.” |
Stock Ownership Guidelines While the compensation of our principals has primarily included a set salary and a discretionary bonus, virtually all of our principals own equity interests in Silvercrest L.P. and Silvercrest GP LLC. As stated, we believe that equity ownership in our company causes principals to have a long-term view of our success, and a healthy concern for the entire company, rather than merely improving their own compensation. Principals are incentivized to grow and increase the value of their equity interests by adding to our overall revenue and guarding our expenses in a way that a non-equity owner would not. All of our principals have been offered multiple opportunities to acquire ownership interests in our company value based on a multiple of earnings that serves as a proxy for fair market value, and in many cases, have received annual incentive compensation awards which include such interests. To date, only those employees who attained the title of Senior Vice President, Managing Director or higher were invited to purchase equity interests in Silvercrest L.P. and Silvercrest GP LLC or receive them as annual incentive compensation awards. These transactions have taken a variety of forms. Some equity owners received equity interests in Silvercrest L.P. and Silvercrest GP LLC upon the acquisition by our company of their prior firm. We have made foursuccessfully completed five of these acquisitions. Some equity owners were invited to purchase equity interests in Silvercrest L.P. and Silvercrest GP LLC upon commencement of employment at our company or upon achieving a specified seniority level at our company. On other occasions, we offered the opportunity to existing principals to purchase equity interests in Silvercrest L.P. and Silvercrest GP LLC that were redeemed by departing principals or issued new equity interests. In these cases, the principals purchased the equity interests by issuing promissory notes to us in the amount of the value of the equity interests purchased, some of which notes provided for annual amortization and others of which provided for a balloon payment. In addition, in 2011 and 2012, some principals received additional equity interests as annual incentive compensation awards. Our principals have not historically been subject to mandated equity ownership or retention guidelines. It is our belief that the equity component of our compensation program ensures that our principals are also owners whose incentives are directly aligned with those of our company and our clients. As a public company, we intend to continue to promote broad and substantial equity ownership by our principals by using both equity-based compensation awards which may be granted on an annual basis, and performance awards that will be granted in appropriate circumstances. We may expand our equity ownership by creating opportunities for all employees, and not only our principals, to acquire equity interests in our company. In addition, following this offering, while an employee of Silvercrest L.P., our principals will be required to retain at least 25% of the Class B units in Silvercrest L.P. owned by the principal on the date of consummation of this offering. Each holder’s profits percentage is fixed at the date of acquisition of the equity interests in Silvercrest L.P. and Silvercrest GP LLC, subject to dilution when additional equity interests in these entities are issued or accretion if existing equity interests in their entities are redeemed and not resold. Under the terms of its limited partnership agreement, Silvercrest L.P. may retain profits for future needs of the partnership. An equity interest in Silvercrest L.P. and Silvercrest GP LLC also allows the holder to participate in the appreciation or depreciation in the value of Silvercrest L.P. and Silvercrest GP LLC, respectively, from and after the date of the grant of the equity interest, by participating in defined capital or liquidity events (as defined in the second amended and restated limited partnership agreement and amended and restated limited liability company agreement) or by redemption following termination of employment. The redemption of these equity interests is described in detail below under “Potential Payments Upon Termination or Change in Control.” In connection with the reorganization, the terms of the equity interests held by our named executive officers will change in several significant respects, described in greater detail under “The Reorganization and Our Holding Company Structure” in this prospectus. As part of our reorganization, interests in Silvercrest L.P. will be exchanged for Class B units of Silvercrest L.P. and shares of our Class B common stock. Class A units in Silvercrest L.P. will be held by Silvercrest, the new general partner of Silvercrest L.P. Each Class A unit and Class B unit gives its holder the right to a percentage of the current profits of Silvercrest L.P. (as defined in the second amended and restated limited partnership agreement). Following this offering, a substantial portion of the economic return of our principals will continue to be obtained through their equity ownership in Silvercrest L.P. We believe that the continued link between the economic return they realize and our performance will encourage their continued exceptional performance. In addition, we believe that the restrictions on transfer and the ownership requirements to which they will be subject will align their interests with those of our stockholders. See “The Reorganization and Our Holding Company Structure” for a more detailed described of the ownership structure and the rights of the limited partners in Silvercrest L.P. after this offering. Following this offering, as an element of compensation we intend to grant equity-based awards to those individuals considered to be critical to our company’s future success.success, primarily, (i) those professionals responsible for the investment performance of our strategies; (ii) those professionals principally responsible for servicing our existing clients and increasing our client base; and (iii) our executive officers. As of December 31, 2012, our named executive officers held deferred equity units with profits percentages and equity balances in Silvercrest L.P. and Silvercrest GP LLC, as follows: | | | | | | | | | | | | | | | | Profits
Percentage (1) | | | 2012 Earned
Profits (2) | | | Equity
Balance as of
December 31, 2012 (3) | | G. Moffett Cochran | | | 0.31 | % | | $ | 15,308 | | | $ | 447,661 | | Richard R. Hough | | | 0.32 | % | | $ | 16,419 | | | $ | 456,705 | | Scott A. Gerard | | | 0.09 | % | | $ | 4,717 | | | $ | 133,527 | | David J. Campbell | | | 0.13 | % | | $ | 7,431 | | | $ | 192,311 | | Albert S. Messina | | | 0.34 | % | | $ | 19,556 | | | $ | 483,836 | |
| (1) | The amounts in this column represent the respective combined vested and unvested deferred equity unit percentages of our named executive officers. |
| (2) | The amounts in this column represent allocations of 2012 profits to our named executive officers pursuant to their respective equity interests related to both vested and unvested deferred equity units. Profits allocations related to the vested and unvested deferred equity units were determined based on the net income of Silvercrest L.P and Silvercrest GP LLC. |
| (3) | The amounts in this column represent the respective combined vested and unvested deferred equity unit account balances of our named executive officers that would be paid to the holder of following termination of employment under certain circumstances. The amounts in this table assume that the holder’s employment was terminated by death or disability. |
Tax Considerations Our Compensation Committee is expected to consider the anticipated tax and accounting treatment of various payments and benefits to us and, when relevant, to our principals, although these considerations are not dispositive. Section 162(m) of the Internal Revenue Code generally disallows a tax deduction to a publicly-traded corporation that pays compensation in excess of $1 million to any of its named executive officers (other than the chief financial officer) in any taxable year, unless the compensation plan and awards meet certain requirements. As a private company, Section 162(m) does not currently apply to our compensation program. To the extent Section 162(m) becomes applicable to us, we will endeavor to structure compensation to qualify as performance-basedperformance- based under Section 162(m), where it is reasonable to do so while meeting our compensation objectives. Notwithstanding the foregoing, we reserve the right to pay amounts that are not deductible under Section 162(m) during any period when Section 162(m) is applicable to us. Risk Considerations in our Compensation Program In evaluating our compensation program, we have identified two primary risks relating to compensation: (i) the risk that compensation will not be sufficient to retain talent and (ii) the risk that compensation may provide unintended incentives. To combat the risk that our compensation might not be sufficient, we strive to use a compensation structure and set compensation levels for all employees in a way that we believe contributes to low rates of employee attrition. We do not use compensation consultants, but we receive regular and ongoing input from industry representatives and other market sources through our (1) participation on the Pershing Advisor Solutions, a service which provides a customized approach to understanding the RIA business and a range of solutions to help meet demand, with MFO/RIA peers; (2) participation in other custodian advisor forums and industry events; (3) review of compensation surveys by companies such as The Bower Group, which provides international consulting services to a range of clients; (4) review of industry publications featuring stories on compensation practices and metrics; and (5) reviewing the Moss Adams Adviser Compensation and Staffing Study, which is prepared by Pershing Advisor Solutions, Moss Adams LLP and IN Advisor Solutions and includes data on hundreds of advisory firms. We also make equity awards subject to multi-year vesting schedules to provide a long-term component to our compensation program and impose ongoing restrictions on the ability of our principals to dispose of their equity holdings acquired through equity awards. We believe that both the structure and levels of compensation have aided us in retaining key personnel as evidenced by the long-term tenure of our principals. To address the risk that our compensation programs might provide unintended incentives, we keep our compensation programs simple and we tie the long-term component of equity-based compensation to our company-wide results. We have not seen any employee behaviors motivated by our compensation policies and practices that create increased risks for our stockholders or our clients. Based on the foregoing, we do not believe that our compensation policies and practices motivate imprudent risk taking. Consequently, we are satisfied that any potential risks arising from our employee compensation policies and practices are not reasonably likely to have a material adverse effect on us. As mentioned, our Compensation Committee, which will be comprised entirely of independent directors upon the consummation of this offering, will review our compensation plans and policies periodically to ensure proper alignment with overall company goals and objectives. Our Compensation Committee is also expected to review the risks arising from our compensation policies and practices and assesses whether any such risks are reasonably likely to have a material adverse effect on us. Summary Compensation Table The following table shows the annual compensation of our principal executive officer, principal financial officer and the two most highly compensated executive officers other than our principal executive officer and principal financial officer, who were serving as executive officers on December 31, 2011.2012. These officers are referred to in this prospectus as the “named executive officers.” The following table shows four executive officers rather than five because no other executive officer of our company has total compensation in excess of $100,000. | Name and Principal Position | | Year | | | Salary
($) (2) | | | Bonus
($) (3) | | | Stock
Awards
($) (4) | | | All Other
Compensation
Earnings ($) (5) | | | Total ($) | | | Year | | | Salary
($) (3) | | | Bonus
($) (4) | | | Stock
Awards
($) (5) | | | Cash
Distributions
(6) | | | All Other
Compensation
Earnings ($)
(7) | | | Total ($) | | G. Moffett Cochran, Chief Executive Officer | | | 2011 | | | $ | 500,000 | | | | — | | | $ | 409,031 | | | $ | 230,523 | | | $ | 1,139,554 | | | G. Moffett Cochran, Chairman and Chief Executive Officer | | | | 2012 | | | $ | 708,333 | | | $ | — | | | $ | — | | | $ | 16,680 | | | $ | 248,352 | | | $ | 973,365 | | | | | | 2011 | | | $ | 500,000 | | | $ | — | | | $ | 396,750 | | | $ | 11,191 | | | $ | 230,523 | | | $ | 1,138,464 | | Richard R. Hough, President and Chief Operating Officer (1) | | | 2011 | | | $ | 400,000 | | | $ | 225,000 | | | $ | 76,645 | | | | — | | | $ | 701,645 | | | | 2012 | | | $ | 455,691 | | | $ | 425,000 | | | $ | 207,814 | | | $ | 16,453 | | | $ | — | | | $ | 1,104,958 | | | | | | 2011 | | | $ | 400,000 | | | $ | 225,000 | | | $ | 74,494 | | | $ | 8,607 | | | | — | | | $ | 708,101 | | Scott A. Gerard, Chief Financial Officer | | | 2011 | | | $ | 325,000 | | | $ | 200,000 | | | $ | 67,982 | | | | — | | | $ | 592,982 | | | | 2012 | | | $ | 339,095 | | | $ | 350,000 | | | $ | 69,167 | | | $ | 4,759 | | | $ | — | | | $ | 763,021 | | | | | | 2011 | | | $ | 325,000 | | | $ | 200,000 | | | $ | 66,007 | | | $ | 1,974 | | | | — | | | $ | 592,981 | | David J. Campbell, General Counsel and Secretary | | | 2011 | | | $ | 325,000 | | | $ | 175,000 | | | $ | 59,530 | | | | — | | | $ | 559,530 | �� | | | 2012 | | | $ | 339,095 | | | $ | 275,000 | | | $ | 34,584 | | | $ | 7,457 | | | $ | — | | | $ | 656,136 | | | | | | 2011 | | | $ | 325,000 | | | $ | 175,000 | | | $ | 57,756 | | | $ | 5,152 | | | | — | | | $ | 562,908 | | Albert S. Messina, Managing Director and Portfolio Manager (2) | | | | 2012 | | | $ | 300,000 | | | $ | 381,489 | | | $ | — | | | $ | 19,562 | | | $ | — | | | $ | 701,051 | | | | | | 2011 | | | $ | 300,000 | | | $ | 391,000 | | | $ | 125,649 | | | $ | 15,791 | | | | — | | | $ | 832,440 | |
| (1) | Mr. Hough was named our Chief Operating Officer in July 2010 and was named President in February 2012. |
| (2) | Mr. Messina was appointed to the Executive Committee and became a named executive officer in April 2013. |
| (3) | Amounts represent guaranteed payments made to our named executive officers. |
(3)(4) | Amounts represent cash bonuses earned at December 31, 20112012 and paid in February 2012.2013. |
(4)(5) | Reflects the grant date fair value computed in accordance with FASB ASC Topic 718, or ASC 718, associated with deferred equity units in Silvercrest L.P., including distributions in respect of such units, calculated pursuant to ASC 718. Pursuant to ASC 718, Silvercrest L.P. recognizes compensation expense associated with the granting of equity-based compensation based on the grant-date fair value of the award if it is classified as an equity instrument, and on the changes in settlement amount for awards that are classified as liabilities. Silvercrest L.P.’s deferred equity unit-based awards have redemption features that necessitate their classification as liabilities and, accordingly, changes to their redemption values subsequent to the grant date have been included as a component of compensation expense. For the year ended December 31, 2011, distributions attributable to the deferred equity units held by the named executive |
| officers were made as follows: Mr. Cochran—$12,281; Mr. Hough—$2,151; Mr. Gerard—$1,974; and Mr. Campbell—$1,774. See Note 1716 to the audited consolidated financial statements of Silvercrest L.P. included elsewhere in this prospectus.
|
(5)(6) | Amounts showing in this column represent the amount of cash distributed to each of the named executive officers on account of his vested and unvested deferred equity units for the respective year. |
| (7) | Amounts in this column represent the aggregate dollar amount of all other compensation received by Mr. Cochran, consisting of employer-paid car allowances equal to $6,000, insurance premiums for life and disability insurance benefiting Mr. Cochran equal to $6,200$6,370 and the savings of $218,323$235,652, to Mr. Cochran for the discounted advisory fee for investment management services on his funds placed in a separately managed account with our company. None of the perquisites received by our other named executive officers exceeded $10,000 in 2011.2012. |
Employment Agreements During fiscal 2011 Silvercrest Asset Management GroupSAMG LLC was a party to employment agreements with each of Messrs. Gerard and Campbell that provided for at-will employment. These agreements did not provide compensation terms orfor duration of employment. They did include restrictive covenants concerning the protection of our confidential information and solicitation of our employees and clients. WeBoth employment agreements were terminated in 2012 and we do not have employment agreements with Mr. Hough or Mr. Cochran. As limited partners of Silvercrest L.P., each of our named executive officers (other than Mr. Cochran) may not, while employed and during the one-year period following termination of employment by the employee, without good reason, (i) contact any of our clients or vendors or otherwise solicit any of our clients or vendors to terminate their relationship with us; (ii) accept any business from any of our clients with whom the employee dealt while at our company; or (iii) hire any of our employees. As a founding partner of our company, Mr. Cochran is bound by more restrictive covenants that prevent him during his employment and for two years following termination of employment from (i) contacting any of our clients or vendors or otherwise soliciting any of our clients or vendors to terminate their relationship with us; (ii) accepting any business from any of our clients with whom he dealt with while at our company; (iii) competing with us; or (iv) hiring any of our employees. Outstanding Equity Awards at Fiscal Year End 20112012 The following table sets forth information relating to equity interests in Silvercrest L.P. and Silvercrest GP LLC issued to our named executive officers subject to vesting provisions. | | | | Stock Awards | | | Stock Awards | | Name | | Number of
Shares or Units of
Stock That Have
Not Vested (#) | | | Market Value of
Shares or Units of
Stock That Have
Not Vested (as of
12/31/2011) ($) (1) | | | Equity Incentive
Plan Awards:
Number of
Unearned Shares,
Units or Other
Rights That Have
Not Vested (#) | | | Equity Incentive
Plan Awards:
Market or Payout
Value of
Unearned Shares,
Units or Other
Rights That Have
Not Vested ($) | | | Number of
Shares or Units
of
Stock That Have
Not Vested (#) | | | Market Value of
Shares or Units of
Stock That Have
Not Vested (as of
12/31/2012) ($) (1) | | | Equity Incentive
Plan Awards:
Number of
Unearned Shares,
Units or Other
Rights That Have
Not Vested (#) | | | Equity Incentive
Plan Awards:
Market or
Payout
Value of
Unearned
Shares,
Units or Other
Rights That
Have
Not Vested ($) | | G. Moffett Cochran (2) | | | 2,525 | | | $ | 611,156 | | | | — | | | $ | — | | | | 2,104 | | | $ | 559,576 | | | | — | | | $ | — | | Richard R. Hough (3) | | | 1,391 | | | $ | 336,747 | | | | — | | | $ | — | | | | 2,130 | | | $ | 566,426 | | | | — | | | $ | — | | Scott A. Gerard (4) | | | 420 | | | $ | 101,678 | | | | — | | | $ | — | | | | 683 | | | $ | 181,671 | | | | — | | | $ | — | | David J. Campbell (5) | | | 826 | | | $ | 199,966 | | | | — | | | $ | — | | | | 840 | | | $ | 223,299 | | | | — | | | $ | — | | Albert S. Messina (6) | | | | 1,872 | | | $ | 497,933 | | | | — | | | $ | — | |
| (1) | Represents (i) $242.09$265.99 per unit, which is the effective per unit value as of December 31, 2011,2012, multiplied by (ii) the number of unvested units. |
| (2) | 420.75 shares vest on each of February 28, 2012, 2013, 2014 and 2015. 842 shares, which represent performance units, may vest on February 28, 2015 if performance targets are met. |
| (3) | 183.50 shares vest on each of February 24, 2011, 2012, 2013 and 2014. 367 shares, which represent performance units, may vest on February 24, 2014 if performance targets are met. 79 shares vest on each of February 28, 2012, 2013, 2014 and 2015. 158 shares, which represent performance units, may vest on February 28, 2015 if performance targets are met. 166.75 shares vest on each of February 28, 2013, 2014, 2015 and 2016. 334 shares, which represent performance units, may vest on February 28, 2016 if performance targets are met. |
| (4) | 70 shares vest on each of February 28, 2012, 2013, 2014 and 2015. 140 shares, which represent performance units, may vest on February 28, 2015 if performance targets are met. 55.50 shares vest on each of February 28, 2013, 2014, 2015 and 2016. 111 shares, which represent performance units, may vest on February 28, 2016 if performance targets are met. |
| (5) | 91.75 shares vest on each of February 24, 2011, 2012, 2013 and 2014. 184183.50 shares, which represent performance units, may vest on February 24, 2014 if performance targets are met. 61.25 shares vest on each of February 28, 2012, 2013, 2014 and 2015. 123122.50 shares, which represent performance units, may vest on February 28, 2015 if performance |
| targets are met. 27.75 shares vest on each of February 28, 2013, 2014, 2015 and 2016. 55.50 shares, which represent performance units, may vest on February 28, 2016 if performance targets are met. |
| (6) | 321.50 shares vest on each of February 24, 2013 and 2014. 562.75 shares, which represent performance units, may vest on February 24, 2014 if performance targets are met. 133.25 shares vest on each of February 28, 2013, 2014 and 2015. 266.50 shares, which represent performance units, may vest on February 28, 2015 if performance targets are met. |
Option Exercises and Stock Vested TableDuring the Year Ended December 31, 2012 The following table sets forth information concerning interests in Silvercrest L.P. acquired upon the vesting of deferred equity units by the named executive officers.officers during the year ended December 31, 2012. | | | | Equity Awards | | | Equity Awards | | Name | | Number of L.P. Interests
Acquired on Vesting (#) | | | Value Realized on Vesting ($) (1) | | | Number of L.P. Interests
Acquired on Vesting (#) | | | Value Realized on
Vesting ($) (1) | | G. Moffett Cochran | | | — | | | $ | — | | | | 421 | | | $ | 87,394 | | Richard R. Hough | | | 184 | | | $ | 27,296 | | | | 262 | | | $ | 54,420 | | Scott A. Gerard | | | — | | | $ | — | | | | 70 | | | $ | 14,540 | | David J. Campbell | | | 92 | | | $ | 13,648 | | | | 153 | | | $ | 31,780 | | Albert S. Messina | | | | 455 | | | $ | 94,456 | |
| (1) | Reflects the vesting date fair value computed in accordance with ASC 718 associated with deferred equity units in Silvercrest L.P. |
Pension Benefits We do not sponsor or maintain any benefit pension or retirement benefits for the benefit of our employees. Nonqualified Defined Contribution and Other Nonqualified Deferred Compensation Plans We do not sponsor or maintain any nonqualified defined contribution or other nonqualified deferred compensation plans for the benefit of our employees. Potential Payments Upon Termination or Change in Control The following summarizes the potential payments and benefits that we would provide to our named executive officers in connection with a termination of employment and/or a change in control. In determining amounts payable, we have assumed in all cases that the termination of employment occurred on December 31, 20112012 and prior to this offering. Severance Benefits We do not offer or have in place any formal retirement, severance, or similar compensation programs providing for additional benefits or payments in connection with a termination of employment, change in job responsibility or change in control. Our named executive officers, therefore, do not have employment, severance, change in control or other agreements with us that would require any payments to them in the event of a termination of employment and/or a change in control. Our named executive officers are all employed on an “at will” basis, which enables us to terminate their employment at any time. Under certain circumstances, a named executive officer may be offered severance benefits to be negotiated at the time of termination. Deferred Equity Units and Performance Units As part of bonus compensation for performance during 2009, Silvercrest Asset Management GroupSAMG LLC awarded to its principals 50% of the annual bonus earned by them in deferred equity units and performance units. For performance during 2010, the percentage was 25%, except in the case of Mr. Cochran, for whom the percentage in 2010 was 100%. For performance during 2011, discretionary awards were made in 2012 to all members of the Executive Committee except for Mr. Cochran and Mr. Messina. As of December 31, 2011,2012, there were 22,35316,788 deferred equity units and 12,79513,124 performance units outstanding. The deferred equity units and performance units were not issued pursuant to a plan. Deferred Equity Units Each deferred equity unit represents the right to receive one unit of Silvercrest GP LLC and 99 units of Silvercrest L.P. All deferred equity units receive distributions to the same extent as if underlying units exerciseable therefortherefore were deemed outstanding. As part of the reorganization, all deferred equity units outstanding immediately prior to the consummation of this offering will represent the right to receive an equal number of Class B units of Silvercrest L.P. Each deferred equity unit vests in four annual increments of 25% beginning on the first anniversary of the date of grant. On each vesting date, each deferred equity unit will entitle the holder thereof to receive 100 Class B units of Silvercrest L.P. On each vesting date, the holder of a deferred equity unit will have the right to require Silvercrest Asset Management GroupSAMG LLC to pay the holder cash for a specified percentage of the deferred equity units in lieu of issuing Class B units to the holder for that percentage. The Executive Committee of Silvercrest L.P. sets the specified percentage that may be paid in cash at the option of the holder of the deferred equity units each year. Performance Units Silvercrest Asset Management GroupSAMG LLC also granted to each employee who received an award of deferred equity units, a number of performance units which represent the right to receive (i) one unit of Silvercrest GP LLC for every two units of Silvercrest GP LLC issued upon vesting of the deferred equity units awarded to the employee and (ii) one unit of Silvercrest L.P. for every two units of Silvercrest L.P. issued upon vesting of the deferred equity units awarded to the employee. Immediately priorPrior to the consummation of this offering, as part of the reorganization, each performance unit will become exercisable for one Class B unit for every two Class B units issued upon vesting of the deferred equity units awarded to the employee. Each performance unit is subject to forfeiture if (i) the Class B units granted to the employee pursuant to the corresponding deferred equity unit are not held by such employee on the earlier of (A) February 29, 2016 for the fiscal 2011 performance units, February 28, 2015 for the fiscal 2010 performance units , and February 24, 2014 for the fiscal 2009 performance units and (B) the consummation of a change of control transaction or (ii) the value per Class B unit did not increase at least 15% per annum based on the Adjusted EBITDA (as defined in the unit award agreement) of Silvercrest L.P. calculated as of December 31, 2014. Performance units are not entitled to any distributions from Silvercrest L.P. until the underlying Class B units are issued.
Dividend Equivalents Each deferred equity unit also entitles the holder to receive distributions from Silvercrest L.P. in the same amounts and at the same times as the holder would have received the distributions had the Class B units underlying the deferred equity units been awarded on the date of grant. Treatment upon Termination of Employment Voluntary Resignation and Termination with Cause All deferred equity units and performance units are automatically forfeited upon a voluntary resignation or termination with cause. The right to receive dividend equivalents on the deferred equity units also terminates upon a termination of employment for the reasons stated above. Involuntary Termination without Cause, Death, Disability and Retirement Upon an employee’s involuntary termination by us, the disability of the employee, the retirement by the employee or an employee’s death, all deferred equity units become fully and immediately vested. The Executive Committee of Silvercrest L.P. may determine as of the date of termination of employment the percentage of the deferred equity units held by the terminated employee that may be settled in cash. If an employee is terminated for any of the reasons set forth above, the terminated employee will receive a prorated number of Class B units based on the period of time employed between the date of grant and the settlement of the performance units when the performance target is achieved. The performance units will not be settled until the achievement of the performance target, if at all. In addition, the right to receive dividend equivalents on the deferred equity units will continue until the deferred equity units are settled. Change in Control All of the deferred equity units automatically vest in full upon the consummation of a change in control transaction. The Executive Committee of Silvercrest L.P. will determine whether the performance target for the performance units was achieved as of the closing date of the change in control transaction. If the performance target is achieved, the holder will receive settlement in full of the performance units upon the closing of the change in control transaction. Vesting and Redemption of Silvercrest L.P. Interests Under the terms of the second amended and restated limited partnership agreement, which governs the rights and liabilities of our named executive officers with respect to the ownership of their interests in Silvercrest L.P., those interests are subject to redemption at the option of the employee or Silvercrest L.P. upon the termination of their employment. The terms of the second amended and restated limited partnership agreement governing the redemption of interests held by Mr. Cochran are different from those governing Messrs. Hough, Gerard, Campbell, and Campbell,Messina as set forth below. Upon the termination of employment of any of Messrs. Hough, Gerard, Campbell, or Campbell,Messina, the terminated employee and Silvercrest L.P. each have a right to require the redemption of the terminated employee’s interests in Silvercrest L.P. Redemption is typically effected on a date that is at least sixty, but not more than ninety, days after of the date of termination of employment. Payment for the interests is made by issuance of a promissory note by Silvercrest L.P. to the terminated employee and payments under that note are scheduled over a four or five-year period beginning with a payment immediately after the termination date or on the one-year anniversary of the termination date, depending on the circumstances of the termination. The payment amount also differs based on the circumstances of the termination. Payments on the note may be reduced in the event of a violation of non-solicitation or confidentiality covenants applicable to the terminated employee in the second amended and restated limited partnership agreement. Redemption is also triggered upon termination of employment due to death or disability. Pursuant to the second amended and restated limited partnership agreement, in the event of a termination of employment of Mr. Cochran prior to April 30, 2013, other than due to his death or disability, neither Silvercrest L.P. nor Mr. Cochran has the right to redeem his interests in Silvercrest L.P. In the event of a termination of his employment after April 30, 2013, both Mr. Cochran and Silvercrest L.P. will have the right to redeem Mr. Cochran’s interests. In such event, redemption of Mr. Cochran’s interests will be made by issuance of a note by Silvercrest L.P. to Mr. Cochran which will be payable in either two or three annual installments, depending on the circumstances of his termination. In the event of termination of employment of a named executive officer due to death or disability on December 31, 2011,2012, the payment upon redemption of his interest in Silvercrest L.P. would be approximately as follows: $27,393,694$30,098,098 for Mr. Cochran; $1,962,382$2,333,530 for Mr. Hough; $733,533$864,999 for Mr. Gerard; and $1,128,624$1,269,570 for Mr. Campbell.Campbell; and $2,875,884 for Mr. Messina. Those redemption payments may be made over a period of two through five years and, in the case of Mr. Cochran, the first payment may be withheld through April 30, 2013. Those payments would vary in the event of termination of employment of any of the named executive officers for any reason other than death or disability. Director Compensation We did not paypaid $12,500 to each of our non-employee directors any compensation for their service as directors during the year ended December 31, 2011.2012. Upon completion of this offering, we do not expect to pay our directors who are also our employees any compensation for their services as directors. We anticipate that our independent, non-employee directors will initially be compensated with an annual retainer of $50,000 and an additional $5,000 annually per committee on which the director serves. In addition, all directors will be reimbursed for reasonable out-of-pocket expenses incurred by them in connection with attending board of directors, committee and stockholder meetings, including those for travel, meals and lodging. We reserve the right to change the manner and amount of compensation to our directors at any time. 2012 Equity Incentive Plan Our board of directors will adopt,adopted, and our stockholders will approve, the Silvercrest Asset Management Group Inc. 2012 Equity Incentive Plan, or the 2012 Equity Incentive Plan prior to the consummation of this offering. The purposes of the 2012 Equity Incentive Plan are to (i) align the long-term financial interests of our employees, directors, consultants and advisers with those of our stockholders; (ii) to attract and retain those individuals by providing compensation opportunities that are consistent with our compensation philosophy; and (iii) to provide incentives to those individuals who contribute significantly to our long-term performance and growth. To accomplish these purposes, the 2012 Equity Incentive Plan will provide for the grant of units of Silvercrest L.P. (All references to units or interests of Silvercrest L.P. refer to Class B units of Silvercrest L.P. and accompanying shares of Class B common stock of our company). The 2012 Equity Incentive Plan will also provide for the grant of stock options (both stock options intended to be incentive stock options under Section 422 of the Internal Revenue Code and non-qualified stock options), stock appreciation rights, or SARs, restricted stock awards, restricted stock units, performance-based stock awards and other stock-based awards (collectively, stock awards) based on our Class A common stock. Incentive stock options may be granted only to employees; all other awards may be granted to employees, including officers, members, limited partners or partners who are engaged in the business of one or more of our subsidiaries, as well as non-employee directors and consultants. It is initially anticipated that awards under the 2012 Equity Incentive Plan granted to our employees will be in the form of units of Silvercrest L.P. that will not vest until a specified period of time has elapsed, or other vesting conditions have been satisfied as determined by the Compensation Committee, and which may be forfeited if the vesting conditions are not met. During the period that any vesting restrictions apply, unless otherwise determined by the Compensation Committee, the recipient of the award will be eligible to participate in distributions of income from Silvercrest L.P. In addition, before the vesting conditions have been satisfied, the transferability of such units is generally prohibited and such units will not be eligible to be exchanged for cash or shares of our Class A common stock pursuant to the exchange agreement. Awards under the 2012 Equity Incentive Plan will be structured to comply with Section 409A of the Internal Revenue Code. Shares Subject to the 2012 Equity Incentive Plan A total of shares of our Class A common stock, representing 15% of the shares of our Class A common stock and our Class B common stock outstanding as of the closing of this offering, will be reserved and available for issuance under the 2012 Equity Incentive Plan. The equity interests may be issued in the form of shares of our Class A common stock or Class B units of Silvercrest L.P. If an equity award granted under the 2012 Equity Incentive Plan expires or otherwise terminates without being exercised in full, or is settled in cash, the equity interests not acquired pursuant to the award will again become available for subsequent issuance under the 2012 Equity Incentive Plan. In addition, equity awards that are forfeited, cancelled, exchanged or surrendered prior to becoming fully vested, may become available for the grant of new equity awards under the 2012 Equity Incentive Plan. The aggregate number of equity interests that may be granted to any single individual during a calendar year in the form of stock awards may not exceed shares of Class A common stock and/or Class B units. Administration of the 2012 Equity Incentive Plan The 2012 Equity Incentive Plan will be administered by our Compensation Committee. Subject to the terms of the 2012 Equity Incentive Plan, the Compensation Committee will determine which employees, directors, consultants and advisers will receive grants under the 2012 Equity Incentive Plan, the dates of grant, the numbers and types of stock awards to be granted, the exercise or purchase price of each award, and the terms and conditions of the stock awards, including the period of their exercisability and vesting and, in certain instances, the fair market value applicable to a stock award. In addition, the Compensation Committee will interpret the 2012 Equity Incentive Plan and may adopt any administrative rules, regulations, procedures and guidelines governing the 2012 Equity Incentive Plan or any awards granted under the 2012 Equity Incentive Plan as it deems appropriate. The Compensation Committee may cancel, with the consent of the affected participants, any or all of the outstanding stock options or SARs in exchange for (i) new stock options or SARs covering the same or a different number of shares of our Class A common stock, but with an exercise price or base amount per share not less than the fair market value per share of our Class A common stock on the new grant date; or (ii) cash or shares of our Class A common stock, whether vested or unvested, equal in value to the value of the cancelled stock options or SARs. Types of Equity-Based Awards The types of awards that may be made under the 2012 Equity Incentive Plan are described below. These awards may be made singly or in combination, as part of compensation awards or ownership awards, or both. All of the awards described below are subject to the conditions, limitations, restrictions, vesting and forfeiture provisions determined by the Compensation Committee, in its sole discretion, subject to certain limitations provided in the 2012 Equity Incentive Plan. Awards under the 2012 Equity Incentive Plan may be granted without any vesting or forfeiture conditions, as determined by the Compensation Committee. Each award granted under the 2012 Equity Incentive Plan will be evidenced by an award agreement, which will govern that award’s terms and conditions. Non-qualified Stock Options A non-qualified stock option is an option that does not meet the qualifications of an incentive stock option as described below. An award of a non-qualified stock option grants a participant the right to purchase a certain number of shares of our Class A common stock during a specified term in the future, after a vesting period, at an exercise price equal to at least 100% of the fair market value of our Class A common stock on the grant date. The term of a non-qualified stock option may not exceed ten years from the date of grant. Except as provided in the award agreement or as otherwise determined by the Compensation Committee, an option may only be exercised while the participant is employed by, or providing services to, us or our subsidiaries, or during an applicable period after termination of employment or service. Incentive Stock Options An incentive stock option is a stock option that meets the requirements of Section 422 of the Internal Revenue Code. Incentive stock options may be granted only to our employees and must have an exercise price of no less than 100% of fair market value on the grant date, a term of no more than ten years, and be granted from a plan that has been approved by our stockholders. No incentive stock option may be granted to any person who, at the time of the grant, owns or is deemed to own stock possessing more than 10% of our total combined voting power or that of any of our affiliates, or more than 10% of the value of all classes of our stock, unless (i) the option exercise price is at least 110% of the fair market value of the stock subject to the option on the date of grant and (ii) the term of the incentive stock option does not exceed five years from the date of grant. SARs A SAR entitles the participant to receive an amount equal to the difference between the fair market value of our Class A common stock on the exercise date and the exercise price of the SAR (which may not be less than 100% of the fair market value of a share of our Class A common stock on the grant date), multiplied by the number of shares subject to the SAR. The term of a SAR may not exceed ten years from the date of grant. Payment to a participant upon the exercise of a SAR may be either in cash, shares of our Class A common stock or a combination of the two as determined by the Compensation Committee. Except as provided in the award agreement or as otherwise determined by the Compensation Committee, a SAR may only be exercised while the participant is employed by, or providing services to, us or our subsidiaries, or during an applicable period after termination of employment or service. Restricted Stock A restricted stock award is an award of outstanding shares of our Class A common stock that does not vest until a specified period of time has elapsed, or other vesting conditions have been satisfied as determined by the Compensation Committee, and which may be forfeited if the conditions to vesting are not met. During the period that any restrictions apply, the transferability of stock awards is generally prohibited. Participants generally have all of the rights of a stockholder as to those shares, including the right to receive dividend payments on the shares subject to their award during the vesting period (unless the awards are subject to performance-vesting criteria) and the right to vote those shares. Dividends will be subject to the same restrictions as the underlying restricted stock unless otherwise provided by the Compensation Committee. All unvested restricted stock awards are forfeited if the participant’s employment or service is terminated for any reason, unless the Compensation Committee determines otherwise. Restricted Stock Units A restricted stock unit is a phantom unit that represents shares of our Class A common stock. Restricted stock units become payable on terms and conditions determined by the Compensation Committee and will be settled either in cash, shares of our Class A common stock or Class B units of Silvercrest L.P. or a combination of any of the three as determined by the Compensation Committee. All unvested restricted stock units are forfeited if the participant’s employment or service is terminated for any reason, unless the Compensation Committee determines otherwise. Performance Awards The 2012 Equity Incentive Plan permits the grant of performance-based stock that may qualify as performance-based compensation, not subject to the $1 million limitation on the income tax deductibility of compensation paid per covered principal imposed by Section 162(m) of the Internal Revenue Code, to the extent Section 162(m) is applicable to us. To assure that the compensation attributable to performance-based stock will so qualify, our Compensation Committee can, but will not be required to, structure these awards so that stock will be issued or paid pursuant to the award only upon the achievement of certain pre-established performance goals during a designated performance period. The performance goals, to the extent designed to meet the requirements of Section 162(m) of the Internal Revenue Code, will be based on one or more of the following criteria: (i) earnings including operating income, economic income, economic net income, earnings before or after taxes, earnings before or after interest, depreciation, amortization, or extraordinary or special items or book value per share (which may exclude nonrecurring items); (ii) pre-tax income or after-tax income; (iii) earnings per common share (basic or diluted); (iv) operating profit; (v) revenue, revenue growth or rate of revenue growth; (vi) return on assets (gross or net), return on investment, return on capital, or return on equity; (vii) return on sales or revenues; (viii) operating expenses; (ix) stock price appreciation; (x) cash flow, free cash flow, cash flow return on investment (discounted or otherwise), net cash provided by operations, or cash flow in excess of cost of capital; (xi) implementation or completion of critical projects or processes; (xii) economic value created; (xiii) cumulative earnings per share growth; (xiv) operating margin or profit margin; (xv) common stock price or total stockholder return; (xvi) cost targets, reductions and savings, productivity and efficiencies; (xvii) strategic business criteria, consisting of one or more objectives based on meeting specified market penetration, geographic business expansion, customer satisfaction, employee satisfaction, human resources management, supervision of litigation, information technology and goals relating to acquisitions, divestitures, joint ventures and similar transactions and budget comparisons; (xviii) personal professional objectives, including any of the foregoing performance goals, implementation of policies and plans, negotiation of transactions, development of long-term business goals, formation of joint ventures, research or development collaborations, and completion of other corporate transactions; and (xix) any combination of any of the foregoing. Dividend Equivalents Dividend equivalents entitle the participant to receive amounts equal to ordinary dividends that are paid on the shares underlying a grant while the grant is outstanding and may be awarded in connection with grants other than stock options or SARs. The Compensation Committee will determine whether dividend equivalents will be paid currently or credited to a bookkeeping account as a dollar amount or in the form of restricted stock units. Dividend equivalents may be paid in cash, in shares of our Class A common stock or in a combination of the two. The Compensation Committee will determine whether dividend equivalents will be conditioned upon the exercise, vesting or payment of the grant to which they relate and the other terms and conditions of the grant. Class B Units Under the 2012 Equity Incentive Plan, the Compensation Committee may also grant equity-based incentives related to Class B units of Silvercrest L.P. to encourage ownership in our operating partnership. The Compensation Committee may grant the same types of awards available under the 2012 Equity Incentive Plan related to our Class A common stock as awards related to the Class B units of Silvercrest L.P., including options to purchase Class B units. Any award granted covering units will reduce the overall limit with respect to the number of shares of Class A common stock that may be granted under the 2012 Equity Incentive Plan on a one-for-one basis. LTIP Awards The 2012 Equity Incentive Plan allows for the grant of LTIP units that may, upon the occurrence of certain events or the participant’s achievement of certain performance goals, convert into Class B units of Silvercrest L.P. To the extent provided in an award agreement, LTIP units, whether or not vested, would entitle the participant to receive, currently or on a deferred or contingent basis, distributions or distribution equivalent payments with respect to the number of Class B units of Silvercrest L.P. corresponding to the LTIP units. The Compensation Committee may award LTIP units as free-standing awards or in tandem with other awards under the 2012 Equity Incentive Plan. Any award granted covering LTIP units will reduce the overall limit with respect to the number of shares of Class A common stock that may be granted under the 2012 Equity Incentive Plan on a one-for-one basis. Other Equity-Based Awards Under the 2012 Equity Incentive Plan, the Compensation Committee may grant other types of awards that are based on, or measured by reference to, shares of our Class A common stock or Class B units of Silvercrest L.P. The Compensation Committee will determine the terms and conditions of such awards. Other stock-based awards may be settled in either cash or equity, as determined by the Compensation Committee. Adjustments In connection with stock splits, stock dividends, recapitalizations and certain other events affecting our Class A common stock, the Compensation Committee will make adjustments as it deems appropriate in (i) the number and kind of shares covered by outstanding grants and (ii) the exercise price of all outstanding stock awards, if applicable. Change of Control If we experience a change of control, unless otherwise determined by our Compensation Committee or evidenced in the applicable award or other agreement, our Compensation Committee will have discretion to provide, among other things, (i) for the continuation of outstanding awards after the change in control without change; (ii) the cash-out of outstanding options as of the time of the change in control transaction as part of the transaction; (iii) a requirement that the buyer assume or substitute outstanding awards; and (iv) the acceleration of outstanding options and awards. In the event of a change in control in which the consideration paid to the holders of shares of Class A common stock and Class B units of Silvercrest L.P. is solely cash, our Compensation Committee may, in its discretion, provide that each award shall, upon the occurrence of a change in control, be cancelled in exchange for a payment, in cash or Class A common stock, in an amount equal to (x) the excess of the consideration paid per share of Class A common stock and Class B units of Silvercrest L.P. in the change of control over the exercise or purchase price (if any) per share of Class A common stock or Class B units of Silvercrest L.P. subject to the award, multiplied by (y) the number of shares of Class A common stock or Class B units of Silvercrest L.P. granted under the award. In general terms, a change of control under the 2012 Equity Incentive Plan occurs: if a person, entity or affiliated group (with certain exceptions) acquires more than 50% of our then outstanding voting securities; if we merge into another entity, unless the holders of our voting shares immediately prior to the merger have at least 50% of the combined voting power of the securities in the merged entity or its parent; if we sell or dispose of all or substantially all of our assets; if we are liquidated or dissolved; if a majority of the members of our board of directors is replaced during any 12-month or shorter period by directors whose appointment or election is not endorsed by a majority of the incumbent directors; or We cease to be the general partner of Silvercrest L.P. Section 162(m) Stockholder Approval Requirements In compliance with the transition rules under Section 162(m) of the Internal Revenue Code, and after this offering, to the extent Section 162(m) is applicable to us, our stockholders will approve the 2012 Equity Incentive Plan no later than the first occurrence of: (i) the expiration of the 2012 Equity Incentive Plan; (ii) a material modification of the 2012 Equity Incentive Plan (in accordance with Section 162(m) of the Internal Revenue Code); (iii) the issuance of all our Class A common stock authorized for issuance under the 2012 Equity Incentive Plan; or (iv) our first stockholders’ meeting (during which our directors are elected) that occurs after the end of the third calendar year following the year in which this offering occurs. Amendment; Termination Our board of directors may amend or terminate the 2012 Equity Incentive Plan at any time. Our stockholders must approve any amendment if their approval is required in order to comply with the Internal Revenue Code, applicable laws, or applicable stock exchange requirements. Unless terminated sooner by our board of directors or extended with stockholder approval, awards may be granted under the 2012 Equity Incentive Plan at any time in the period commencing on the date of approval of the 2012 Equity Incentive Plan by the board of directors and ending on the issuance of all of the shares of Class A common stock subject to the 2012 Equity Incentive Plan. Awards granted pursuant to the 2012 Equity Incentive Plan within that period shall not expire solely by reason of the termination of the 2012 Equity Incentive Plan. CERTAIN RELATIONSHIPS AND RELATED PARTY TRANSACTIONS Reorganization Prior to the effectiveness of the registration statement of which this prospectus forms a part, we entered into a series of transactions to reorganize our capital structure. We also entered into agreements with certain related persons in connection with the reorganization. See “The Reorganization and Our Holding Company Structure.” In addition, we expect to enterentered into an indemnification agreement with each of our executive officers and directors that provides, in general, that we will indemnify them to the fullest extent permitted by law in connection with their service to us or on our behalf. Due to the nature of the indemnification agreements, they are not the type of agreements that are typically entered into with or available to unaffiliated third parties. Purchase of Class B Units Immediately following the consummation of this offering, we willintend to purchase an aggregate of Class B units of Silvercrest L.P. from existing limited partners of Silvercrest L.P., including Vulcan Wealth Management LLC G. Moffett Cochran and Martin Jaffe, for approximately $ .million. The purchase price for the Class B units will be determined by the public offering price of our Class A common stock in this offering less the per share amount of underwriting discounts and commissions and offering expenses incurred by us. Promissory Notes On September 18, 2012, Mr. Hough repaid in full the principal amount and all accrued interest on five promissory notes issued by Mr. Hough in favor of Silvercrest L.P. The principal amounts at the time of repayment were $542,220.00, $122,812.50, $44,544.00, $77,520.00, and $222,837.51 with interest accruing at 3.53%, 2.77%, 4.40%, 2.64% and 2.42%, per annum, respectively. On September 18, 2012, Mr. Gerard repaid in full the principal amount and all accrued interest on two promissory notes issued by Mr. Gerard in favor of Silvercrest L.P. The principal amounts at the time of repayment were $261,513.54 and $133,640.17 with interest accruing at 1.62% and 2.66%, per annum, respectively. On September 18, 2012, Mr. Campbell repaid in full the principal amount and all accrued interest on two promissory notes issued by Mr. Campbell in favor of Silvercrest L.P. The principal amounts at the time of repayment were $77,520.00 and $270,187.51 with interest accruing at 2.64% and 2.84%, per annum, respectively. On April 17, 2013, Mr. Messina repaid in full the principal amount and all accrued interest on two promissory notes issued by Mr. Messina in favor of Silvercrest L.P. The principal amounts at the time of repayment were $98,250.00 and $58,140.00 with interest accruing at 2.77% and 2.64%, per annum, respectively. Shares Subject to Redemption Prior to this offering, underUnder the terms of the second amended and restated limited partnership agreement, which governsgoverning the rights and liabilities of our named executive officers with respect to the ownership of their interests in Silvercrest L.P., those interests are subject to redemption at the option of the employee or Silvercrest L.P. upon the termination of their employment. See “Compensation Discussion and Analysis—Potential Payments Upon Termination or Change in Control—Vesting and Redemption of Silvercrest L.P. Interests” for further discussion of these redemption obligations.
Management Fees Silvercrest Asset Management GroupSAMG LLC manages the personal funds of many of its employees and members of the families of those employees, including Messrs. Cochran, Hough, Gerard, Campbell and CampbellMessina pursuant to investment management agreements in which it has agreed to reduce the advisory fees it charges its employees and members of their families. The value of the discount to the investment advisory services provided to Mr. Cochran by our company in 20112012 was approximately $218,000.$236,000. The value of services provided to other executives by our company was not significant.
Policies and Procedures Regarding Transactions with Related Persons Upon the consummation of this offering, our board of directors will adopt written policies and procedures for transactions with related persons. As a general matter, the policy will require our Audit Committee to review and approve or disapprove the entry by us into certain transactions with related persons. The policy will contain transactions which are pre-approved transactions. The policy will only apply to transactions, arrangements and relationships where the aggregate amount involved could reasonably be expected to exceed $120,000 in any calendar year and in which a related person has a direct or indirect interest. A related person is (i) any of our directors, nominees for director or executive officers, (ii) any immediate family member of any of our directors, nominees for director or executive officers and (iii) any person, and his or her immediate family members, or entity, including affiliates, that was a beneficial owner of 5% or more of any of our outstanding equity securities at the time the transaction occurred or existed. The policy will provide that if advance approval of a transaction subject to the policy is not obtained, it must be promptly submitted to the Audit Committee for possible ratification, approval, amendment, termination or rescission. In reviewing any transaction, the Audit Committee will take into account, among other factors the Audit Committee deems appropriate, recommendations from senior management, whether the transaction is on terms no less favorable than the terms generally available to a third party in similar circumstances and the extent of the related person’s interest in the transaction. Any related person transaction must be conducted at arm’s length. Any member of the Audit Committee who is a related person with respect to a transaction under review may not participate in the deliberations or vote on the approval or ratification of the transaction. However, such a director may be counted in determining the presence of a quorum at a meeting of the Audit Committee that considers a transaction. SECURITY OWNERSHIP OF CERTAIN BENEFICIAL OWNERS AND MANAGEMENT A beneficial owner of a security includes any person who directly or indirectly has or shares voting power and/or investment power with respect to that security or has the right to obtain voting power and/or investment power within 60 days. Except as otherwise noted, each beneficial owner in the table below has sole voting power with respect to the shares of Class A common stock and Class B common stock listed. The following table sets forth beneficial ownership of our common stock by: each person who beneficially owns more than 5% of the shares; each of our named executive officers listed in the summary compensation table;table each member of our board of directors; and all executive officers and directors as a group. Unless otherwise indicated in the footnotes below, the persons and entities named in the table have sole voting and investment power with respect to all shares of Class A common stock and Class B common stock beneficially owned, subject to community property laws where applicable. Unless otherwise indicated in the footnotes below, the address of each stockholder is c/o Silvercrest Asset Management Group Inc., 1330 Avenue of the Americas, 38th Floor, New York, New York 10019. This beneficial ownership information is presented on the following basis: after giving effect to the issuance of an aggregate of shares of Class B common stock to the continuing members of Silvercrest L.P.; in connection with the reorganization; and after giving effect to the issuance of shares of Class A common stock in this offering; andoffering. after giving effect to each of the issuances described in the preceding bullet point, plus the exercise by the underwriters of their option to purchase an additional shares of Class A common stock in this offering to cover over-allotments.
Beneficial ownership is determined in accordance with the rules of the SEC. In computing the number of shares beneficially owned by a person and the percentage of ownership held by that person, shares of common stock subject to equity awards held by that person that are currently exercisable or will become exercisable within 60 days after SeptemberApril 1, 20122013 are deemed outstanding, while these shares are not deemed outstanding for computing percentage ownership of any other person. | | | | Class A | | Class B | | | Class A | | Class B | Beneficial Owner | | No. of
Shares
Before
Offering | | Percentage | | No. of
Shares
after
Offering | | Percentage | | No. of
Shares
Before
Offering | | Percentage | | No. of
Shares
after
Offering | | Percentage | | | No. of
Shares
Before
Offering | | Percentage | | No. of
Shares
After
Offering (3) | | Percentage (3) | | No. of
Shares
Before
Offering | | Percentage | | No. of
Shares
After
Offering | | Percentage (4) | Officers and Directors | | | | | | | | | | | | | | | | | | | | | | | | | | | | | | | | | G. Moffett Cochran (1) | | | 10 | | | | — | | | | 10 | | | | — | | | | 2,152,206 | | | | 21.06 | % | | | | | | % | | | 10 | | | | — | | | | 10 | | | | — | | | | 2,135,969 | | | | 21.12 | % | | | | | Richard R. Hough III | | | — | | | | — | | | | — | | | | — | | | | 144,298 | | | | 1.63 | % | | | | | | % | | | — | | | | — | | | | — | | | | — | | | | 150,836 | | | | 1.64 | % | | | | | Scott A. Gerard | | | — | | | | — | | | | — | | | | — | | | | 54,241 | | | | * | | | | | | | | — | | | | — | | | | — | | | | — | | | | 56,017 | | | | * | | | | | | David J. Campbell | | | — | | | | — | | | | — | | | | — | | | | 82,608 | | | | * | | | | | | | | — | | | | — | | | | — | | | | — | | | | 85,115 | | | | * | | | | | | Albert S. Messina | | | | — | | | | — | | | | — | | | | — | | | | 190,115 | | | | 1.90 | % | | | | | Winthrop B. Conrad, Jr. | | | — | | | | — | | | | — | | | | — | | | | — | | | | — | | | | | | | | — | | | | — | | | | — | | | | — | | | | — | | | | — | | | | | | Wilmot H. Kidd III | | | — | | | | — | | | | — | | | | — | | | | — | | | | — | | | | | | | | — | | | | — | | | | — | | | | — | | | | — | | | | — | | | | | | Richard S. Pechter | | | — | | | | — | | | | — | | | | — | | | | — | | | | — | | | | | | | | — | | | | — | | | | — | | | | — | | | | — | | | | — | | | | | | All named executive officers and directors as a group (7 people). | | | 10 | | | | — | | | | 10 | | | | — | | | | 2,433,353 | | | | 24.19 | % | | | | | | % | | All directors and executive officers as a group (8 people). | | | | 10 | | | | — | | | | 10 | | | | — | | | | 2,618,052 | | | | 26.15 | % | | | | | 5% Security Holders | | | | | | | | | | | | | | | | | | | | | | | | | | | | | | | | | Martin Jaffe | | | — | | | | — | | | | — | | | | — | | | | 844,704 | | | | 13.17 | % | | | | | | % | | | — | | | | — | | | | — | | | | — | | | | 1,341,107 | | | | 13.21 | % | | | | | Vulcan Wealth Management LLC (2) | | | — | | | | — | | | | — | | | | — | | | | 2,622,900 | | | | 25.38 | % | | | | | | | — | | | | — | | | | — | | | | — | | | | 2,593,359 | | | | 25.45 | % | | | | |
| (1) | Includes amount of Class B units owned by The Moffett Cochran GRAT 2010 of which Mr. Cochran is the trustee. |
| (2) | Vulcan Wealth Management LLC is wholly-owned by Vulcan Capital Private Equity I LLC. Vulcan Capital Private Equity Inc. is the managing member of Vulcan Capital Private Equity Management I LLC, which is the manager of Vulcan Capital Private Equity I LLC. Paul Allen is the sole stockholder of Vulcan Capital Private Equity Inc., and, as such, possesses sole voting and investment power over the shares held by Vulcan Wealth Management LLC.Vulcan. Mr. Allen disclaims beneficial ownership of the shares held by Vulcan Wealth Management LLC except to the extent of his pecuniary interest therein. The address for Vulcan Wealth Management LLC is 505 5th Avenue S, Suite 900, Seattle, Washington 98104. |
| (3) | The number of Class A shares and the corresponding percentages will not be altered in the event the underwriters exercise their right to purchase additional shares. |
| (4) | If the underwriters exercise in full their option to purchase additional shares of Class A common stock, the number of Class A Shares will not be altered; however the corresponding percentages will change as follows: Mr. Cochran— %; Mr. Hough— %; Mr. Messina— %; Mr. Jaffe— %; and all named executive officers and directors as a group— %. |
DESCRIPTION OF CAPITAL STOCK The following is a description of the material terms of our capital stock and provisions of our second amended and restated certificate of incorporation and amended and restated bylaws, each of which will be in effect immediately prior to this offering. Copies of the second amended and restated certificate of incorporation and the amended and restated bylaws have been filed with the SEC as exhibits to our registration statement of which this prospectus forms a part. Immediately prior to this offering, our authorized capital stock will consist of 50 million shares of Class A common stock, par value $0.01 per share, 25 million shares of Class B common stock, par value $0.01 per share and 10 million shares of preferred stock, par value $0.01 per share. Upon the consummation of this offering, shares of Class A common stock, shares of Class B common stock and no shares of preferred stock will be outstanding. Common Stock Class A Common Stock Voting Rights Our Class A stockholders will be entitled to one vote for each share held of record on all matters submitted to a vote of our stockholders. Our Class A stockholders will not be entitled to cumulate their votes in the election of directors. Generally, all matters to be voted on by stockholders must be approved by a majority (or, in the case of election of directors, by a plurality) of the votes entitled to be cast by all holders of Class A common stock and Class B common stock present in person or represented by proxy, voting together as a single class. Except as otherwise provided by law or as described in “—Anti-Takeover Effects of Delaware Law and Our Second Amended and Restated Certificate of Incorporation—Amendment of Certificate of Incorporation and Bylaws,” amendments to our second amended and restated certificate of incorporation must be approved by a majority of the combined voting power of all shares of Class A common stock and Class B common stock, voting together as a single class. However, amendments to our second amended and restated certificate of incorporation that would alter or change the powers, preferences or special rights of the Class A common stock, so as to affect them adversely, also must be approved by a majority of the votes entitled to be cast by the holders of the shares affected by the amendment, voting as a separate class. Notwithstanding the foregoing, any amendment to our second amended and restated certificate of incorporation to increase or decrease the authorized shares of Class A common stock must be approved by the vote of the holders of a majority of our shares of Class A common stock. Dividend Rights Class A stockholders are entitled to receive dividends, when and if declared by our board of directors, out of funds legally available therefor, subject to any statutory or contractual restrictions on the payment of dividends and to any restrictions on the payment of dividends imposed by the terms of any outstanding preferred stock. Dividends consisting of shares of Class A common stock may be paid only as follows: (i) shares of Class A common stock may be paid only to holders of shares of Class A common stock and (ii) shares will be paid proportionately with respect to each outstanding share of our Class A common stock. See “Dividend Policy.” Liquidation Rights Upon our liquidation, dissolution or winding-up, or the sale of all, or substantially all, of our assets, after payment in full of all amounts required to be paid to creditors and to holders of preferred stock having a liquidation preference, if any, the Class A stockholders will be entitled to share ratably in our remaining assets available for distribution to Class A stockholders. Other Matters In the event of our merger or consolidation with or into another company in connection with which shares of common stock are converted into, or exchangeable for, shares of stock, other securities or property (including cash), common stockholders, regardless of class, will be entitled to receive the same kind and amount of shares of stock and other securities and property (including cash); provided that, if shares of Class A common stock are exchanged for or converted into shares of capital stock, suchthe shares for which they are exchanged, for, or changedconverted into, may differ between classes to the extent that the shares of Class A common stock and the Class B common stock differ. No shares of Class A common stock will be subject to redemption or have preemptive rights to purchase additional shares of Class A common stock. Upon consummation of this offering, all the outstanding shares of Class A common stock will be legally issued, fully paid and non-assessable. Exchanges of Class B units for Class A Common Stock and Registration Rights Class B units of Silvercrest L.P. held by our principals will be exchangeable for shares of our Class A common stock, on a one-for-one basis, subject to customary adjustments for share splits, dividends and reclassifications. See “The Reorganization and Our Holding Company Structure—Second Amended and Restated Limited Partnership Agreement of Silvercrest L.P.—Exchange Rights” for a description of the timing and circumstances under which Class B units may be exchanged for shares of our Class A common stock. Also, see “The Reorganization and Our Holding Company Structure—Resale and Registration Rights Agreement” for a description of circumstances in which these shares may be resold. Class B Common Stock Issuance of Class B Common Stock with Class B units Shares of our Class B common stock are issuable only in connection with the issuance of Class B units of Silvercrest L.P. When a vested or unvested Class B unit is issued by Silvercrest L.P., we will issue the holder one share of our Class B common stock in exchange for the payment of its par value, subject to the holder’s agreement to be bound by the terms of the stockholders’ agreement described in the “The Reorganization and Our Holding Company Structure—Stockholders’ Agreement Among Class B Stockholders.” Each share of our Class B common stock will be redeemed for its par value and cancelled by us if the holder of the corresponding Class B unit exchanges or forfeits its Class B unit pursuant to the terms of the second amended and restated limited partnership agreement of Silvercrest L.P., the terms of the 2012 Equity Incentive Plan, or otherwise. Voting Rights Our Class B stockholders will be entitled to one vote for each share held of record on all matters submitted to a vote of our stockholders. Class B stockholders will not be entitled to cumulate their votes in the election of directors. Generally, all matters to be voted on by stockholders must be approved by a majority (or, in the case of election of directors, by a plurality) of the votes entitled to be cast by all Class B stockholders and Class A stockholders present in person or represented by proxy, voting together as a single class. Except as otherwise provided by law or as described in “—Anti-Takeover Effects of Delaware Law and Our Second Amended and Restated Certificate of Incorporation—Amendment of Certificate of Incorporation and Bylaws,” amendments to our second amended and restated certificate of incorporation must be approved by a majority of the combined voting power of all shares of Class B common stock and Class A common stock, voting together as a single class. However, amendments to our second amended and restated certificate of incorporation that would alter or change the powers, preferences or special rights of the shares of Class B common stock so as to affect them adversely also must be approved by a majority of the votes entitled to be cast by the holders of the shares affected by the amendment, voting as a separate class. Notwithstanding the foregoing, any amendment to our second amended and restated certificate of incorporation to increase or decrease the authorized shares of Class B common stock must be approved by the vote of the holders of a majority of the shares of Class B common stock. See “The Reorganization and Our Holding Company Structure—Stockholders’ Agreement Among Class B Stockholders” for a description of the terms of the stockholders’ agreement that the holders of allprincipals who hold shares of Class B common stock outstanding immediately after this offering will enter into simultaneously with this offering. Any personemployee who becomes ais issued shares of Class B stockholdercommon stock after this offering will be required to become a party to the stockholders’ agreement. Dividend Rights Our Class B stockholders will not participate in any dividends declared by our board of directors. Liquidation Rights Upon our liquidation, dissolution or winding-up, or the sale of all, or substantially all, of our assets, Class B stockholders only will be entitled to receive the par value of our Class B common stock. Other Matters In the event of our merger or consolidation with or into another company in connection with which shares of Class B common stock are converted into, or exchangeable for, shares of stock, other securities or property (including cash), all common stockholders will be entitled to receive the same kind and amount of shares of stock and other securities and property (including cash); provided that, if shares of Class B common stock are exchanged for, or converted into, shares of capital stock, suchthe shares for which they are exchanged, for, or changedconverted into, may differ to the extent that the shares of our Class A common stock and Class B common stock differ. No shares of Class B common stock will have preemptive rights to purchase additional shares of Class B common stock. Upon consummation of this offering, all outstanding shares of Class B common stock will be legally issued, fully paid and non-assessable. Preferred Stock Our board of directors has the authority to issue preferred stock in one or more classes or series and to fix the rights, preferences, privileges and related restrictions, including dividend rights, dividend rates, conversion rights, voting rights, terms of redemption, redemption prices, liquidation preferences and the number of shares constituting any class or series, or the designation of the class or series, without the approval of our stockholders. The authority of our board of directors to issue preferred stock without approval of our stockholders may have the effect of delaying, deferring or preventing a change in control of our company and may adversely affect the voting and other rights of the holders of our common stock. The issuance of preferred stock with voting and conversion rights may adversely affect the voting power of the holders of our common stock, including the loss of voting control to others. Anti-Takeover Effects of Delaware Law and Our Second Amended and Restated Certificate of Incorporation Our second amended and restated certificate of incorporation and our amended and restated bylaws, contain provisions which may have the effect of delaying, deterring or preventing a future takeover or change in control of our company. These provisions include the following: Issuance of Preferred Stock Our board of directors is authorized to issue million shares of preferred stock and determine the powers, preferences and special rights of any unissued series of preferred stock, including voting rights, dividend rights, and terms of redemption, conversion rights and the designation of any such series, without the approval of our stockholders. As a result, our board of directors could issue preferred stock quickly and easily, which could adversely affect the rights of holders of our common stock. Our board of directors could issue the preferred stock with terms calculated to delay or prevent a change in control or make removal of management more difficult. Elimination of Stockholder Action by Written Consent Our second amended and restated certificate of incorporation provides that stockholder action can be taken only at an annual or special meeting of stockholders and cannot be taken by written consent in lieu of a meeting. Elimination of the Ability to Call Special Meetings Our second amended and restated certificate of incorporation provides that, except as otherwise required by law, special meetings of our stockholders can only be called pursuant to a resolution adopted by a majority of our board of directors, a committee of the board of directors that has been duly designated by the board of directors and whose powers and authority include the power to call such meetings, or by the Chairman of our board of directors. Stockholders are not permitted to call a special meeting or to require our board to call a special meeting. Advance Notice Procedures for Stockholder Proposals Our amended and restated bylaws establish an advance notice procedure for stockholder proposals to be brought before an annual meeting of our stockholders, including proposed nominations of persons for election to our board. Stockholders at our annual meeting may only consider proposals or nominations specified in the notice of meeting, or brought before the meeting by, or at the direction of, our board of directors, or by a stockholder who was a stockholder of record on the record date for the meeting, who is entitled to vote at the meeting and who has given to our secretary timely written notice, in proper form, of the stockholder’s intention to bring that business before the meeting. Classified Board of Directors Our board of directors is divided into three classes, Class I, Class II and Class III, with members of each class serving staggered three-year terms. Our second amended and restated certificate of incorporation provides that the authorized number of directors may be changed only by resolution of the board. Any additional directorships resulting from an increase in the number of directors will be distributed among the three classes so that, as nearly as possible, each class will consist of one-third of the directors. Removal of Directors; Board of Directors Vacancies Our second amended and restated certificate of incorporation and amended and restated bylaws provide that members of our board of directors may not be removed without cause. Our amended and restated bylaws further provide that only our board of directors may fill vacant directorships, except in limited circumstances. These provisions would prevent a stockholder from gaining control of our board of directors by removing incumbent directors and filling the resulting vacancies with such stockholder’s own nominees. Amendment of Certificate of Incorporation and Bylaws The General Corporation Law of the State of Delaware, or DGCL, provides generally that the affirmative vote of a majority of the outstanding shares of common stock entitled to vote is required to amend or repeal a corporation’s certificate of incorporation or bylaws, unless the certificate of incorporation requires a greater percentage. Our second amended and restated certificate of incorporation generally requires the approval of the holders of at least two-thirds of the voting power of the issued and outstanding shares of our capital stock entitled to vote in connection with the election of directors, to amend any provisions of our second amended and restated certificate of incorporation described in “—Anti-Takeover Effects of Delaware Law and Our Second Amended and Restated Certificate of Incorporation.” Our second amended and restated certificate of incorporation and amended and restated bylaws provide that the holders of at least two-thirds of the voting power of the issued and outstanding shares of our capital stock entitled to vote in connection with the election of directors have the power to amend or repeal our amended and restated bylaws. In addition, our second amended and restated certificate of incorporation grants our board of directors the authority to amend and repeal our amended and restated bylaws without a stockholder vote in any manner not inconsistent with the laws of the State of Delaware or our second amended and restated certificate of incorporation. The foregoing provisions of our second amended and restated certificate of incorporation and amended and restated bylaws could discourage potential acquisition proposals and could delay or prevent a change in control. These provisions are intended to enhance the likelihood of continuity and stability in the policies formulated by our board of directors and to discourage certain types of transactions that may involve an actual or threatened change of control. These provisions are designed to reduce our vulnerability to an unsolicited acquisition proposal. The provisions also are intended to discourage certain tactics that may be used in proxy fights. However, such provisions could have the effect of discouraging others from making tender offers for our equity securities and, as a consequence, they also may inhibit fluctuations in the market price of our Class A common stock that could result from actual or rumored takeover attempts. Such provisions also may have the effect of preventing changes in our management, or delaying or preventing a transaction that might benefit you or other minority stockholders. Section 203 of the DGCL We are subject to Section 203 of the DGCL, an anti-takeover law. In general, Section 203 prohibits a publicly-held Delaware corporation from engaging in a “business combination” with an “interested stockholder” for a period of three years following the date the person became an interested stockholder, unless (with certain exceptions) the “business combination” or the transaction in which the person became an interested stockholder is approved in a prescribed manner. Generally, a “business combination” includes a merger, asset or stock sale, or other transaction resulting in a financial benefit to the interested stockholder. Generally, an “interested stockholder” is a person who, together with affiliates and associates, owns (or within three years prior to the determination of interested stockholder status, did own) 15% or more of a corporation’s voting stock. The existence of this provision could have anti-takeover effects with respect to transactions not approved in advance by our board of directors, such as discouraging takeover attempts that might result in a premium over the market price of our common stock. Limitations on Liability and Indemnification of Officers and Directors Our second amended and restated certificate of incorporation and amended and restated bylaws provide indemnification for our directors and officers to the fullest extent permitted by the DGCL. Prior to the completion of this offering, we intend to enter into indemnification agreements with each of our directors that may, in some cases, be broader than the specific indemnification provisions contained under Delaware law. In addition, as permitted by the DGCL, our second amended and restated certificate of incorporation includes provisions that eliminate the personal liability of our directors for monetary damages resulting from breaches of certain fiduciary duties as a director. The effect of this provision is to restrict our rights and the rights of our stockholders in derivative suits to recover monetary damages against a director for breach of fiduciary duties as a director, except that a director will be personally liable for: any breach of his duty of loyalty to us or our stockholders; acts or omissions not in good faith, or which involve intentional misconduct or a knowing violation of law; any transaction from which the director derived an improper personal benefit; or improper distributions to stockholders. If the DGCL is amended to authorize corporate action further eliminating or limiting the personal liability of directors or officers, then the liability of our directors or officers shall be eliminated or limited to the fullest extent permitted by the DGCL, as so amended. This provision regarding indemnification of our directors and officers in our second amended and restated certificate of incorporation generally does not limit liability under state or federal securities laws. Delaware law and our second amended and restated certificate of incorporation and amended and restated bylaws provide that we will, in certain situations, indemnify any person made or threatened to be made a party to a proceeding by reason of that person’s former or present official capacity with our company against judgments, penalties, fines, settlements and reasonable expenses, including reasonable attorneys’ fees. A person is also entitled, subject to certain limitations, to payment or reimbursement of reasonable expenses in advance of final disposition of the proceeding. Your investment may be adversely affected to the extent that, in a class action or direct suit, we pay the costs of settlement and damage awards against directors and officers pursuant to these indemnification provisions. Transfer Agent and Registrar The transfer agent and registrar for our Class A common stock will be American Stock Transfer. Listing We intend to apply to list our Class A common stock on Nasdaq under the symbol “SAMG.” SHARES ELIGIBLE FOR FUTURE SALE We cannot predict the effect, if any, that market sales of shares of our Class A common stock or the availability of shares of our Class A common stock for sale will have on the market price of our Class A common stock prevailing from time to time. Nevertheless, sales of substantial amounts of our Class A common stock in the public market, including shares issued and sold upon exchange of Class B units, could adversely affect the market price of our Class A common stock and could impair our future ability to raise capital through the sale of our equity securities. Class A Common Stock Outstanding Upon Closing shares of Class A common stock will be outstanding immediately after this offering (or shares of Class A common stock if the underwriters exercise in full their option to purchase additional shares of Class A common stock). Subject to certain restrictions, following the six-month anniversary of the consummation of this offering, each holder (other than us)principal and certain permitted transferees will have the right to exchange their Class B units of Silvercrest L.P. for shares of our Class A common stock on a one-for-one basis pursuant to the terms of our second amended and restated limited partnership agreement. See “The Reorganization and Our Holding Company Structure—Second Amended and Restated Limited Partnership Agreement of Silvercrest L.P.—Exchange Rights.” These shares of our Class A common stock issuable upon exchange of Class B units would be “restricted securities,” as defined in Rule 144. However, we will enter into a resale and registration rights agreement with the holders of the Class B units of Silvercrest L.P. that will require us to register under the Securities Act these shares of Class A common stock. See “The Reorganization and Our Holding Company Structure—Resale and Registration Rights Agreement.” Of the shares of Class A common stock outstanding following this offering, shares of Class A common stock (or shares of Class A common stock if the underwriters exercise in full their option to purchase additional shares of Class A common stock) sold in this offering will be freely tradable without restriction or further registration under the Securities Act, except for any shares of Class A common stock held by our “affiliates”, as defined in Rule 144 under the Securities Act, which would be subject to the limitations and restrictions described below under “—Rule 144.” The shares of our Class A common stock issuable upon exchange of Class B units of Silvercrest L.P. may be sold only as part of an annual underwritten offering pursuant to the resale and registration rights agreement until the fifth anniversary of the consummation of this offering, subject to the following exceptions: holders at any time may sell a number of shares sufficient to cover taxes due upon exchange of Class B units in any manner of sale permitted under the securities laws; and the estate of any deceased holder or the beneficiaries thereof, at any time, may sell a number of shares sufficient to cover applicable estate and inheritance taxes. Shares of Class A common stock issuable upon exchange of Class B units held by a principal of Silvercrest L.P. are subject to additional restrictions on transfer as described under “The Reorganization and Our Holding Company Structure—Resale and Registration Rights Agreement.” In addition, our board of directors may at any time waive any restrictions on sale of our Class A common stock. Lock-Up Agreements We will agree with the underwriters not to issue, sell, or otherwise dispose of or hedge any shares of our Class A common stock, subject to certain exceptions, for the 180-day period following the date of this prospectus, without the prior consent of Sandler O’Neill & Partners, L.P. and Raymond James & Associates, Inc. OurPrior to the consummation of this offering, our executive officers and directors and our employees who participate in the directed share program will enter into similar lock-up agreements with the underwriters. Sandler O’Neill & Partners, L.P. and Raymond James & Associates, Inc. may, at any time, release us and/or any of our officers and directors from this lock-up agreement and allow us to sell shares of our Class A common stock within this 180-day period. See “Underwriting.” Pursuant to our lock-up agreement with the underwriters, we will not be permitted to waive these restrictions pursuant to the exchange agreement without the prior consent of Sandler O’Neill & Partners, L.P. and Raymond James & Associates, Inc.
Rule 144 In general, under Rule 144 as currently in effect, our affiliates who own shares for at least six months or own shares purchased in the open market are entitled to sell these shares as follows. Within any three-month period, each person may sell a number of shares that does not exceed the greater of 1% of our then-outstanding shares of Class A common stock, which will equal approximately shares immediately after this offering (based on the number of shares of our Class A common stock outstanding upon completion of this offering), or the average weekly trading volume of our Class A common stock on Nasdaq during the four calendar weeks preceding the filing of a notice of the sale on Form 144. Sales under Rule 144 by affiliates also will be subject to manner of sale provisions, notice requirements and the availability of current public information about us. A person who is not deemed to have been one of our affiliates at any time during the three months preceding a sale, and who owns shares of Class A common stock within the definition of “restricted securities” under Rule 144 that were acquired from us or any affiliate at least six months previously, would also be entitled to sell shares under Rule 144. Such sales would be permitted without regard to the volume limitations, manner of sale provisions or notice requirements described above and, after one year, without any limits, including the public information requirement. Rule 701 In general, and subject to lock-up agreements, any of our employees, consultants or advisers, other than affiliates, who purchased shares of Class A common stock from us under our 2012 Equity Incentive Plan, or other written agreements in accordance with Rule 701 of the Securities Act, are eligible to resell their shares under Rule 144. Registration of Shares Under 2012 Equity Incentive Plan We intend to file a registration statement on Form S-8 covering all of the shares of Class A common stock issuable or reserved for issuance under our 2012 Equity Incentive Plan. When issued, these shares of Class A common stock will be freely tradable in the public market, subject to Rule 144 volume limitations applicable to affiliates and, in some cases, the expiration of the lock-up agreements described in “Underwriting.” Resale and Registration Rights Agreement In connection with this offering, we will enter into a resale and registration rights agreement with the holders of theour principals who hold Class B units of Silvercrest L.P. pursuant to which the shares of our Class A common stock issued upon exchange or conversion of their Class B units will be eligible for resale, subject to the resale timing and manner limitations described under “The Reorganization and Our Holding Company Structure—Resale and Registration Rights Agreement.” MATERIAL U.S. FEDERAL TAX CONSIDERATIONS FOR NON-U.S. HOLDERS OF CLASS A COMMON STOCK The following is a summary of the material U.S. federal income tax and estate tax consequences applicable to non-U.S. holders (as defined below) with respect to the acquisition, ownership and disposition of shares of our Class A common stock. This summary is based on current provisions of the Internal Revenue Code, the Treasury regulations promulgated thereunder, administrative rulings and judicial opinions, all of which are subject to change, possibly with retroactive effect. We have not sought any ruling from the U.S. Internal Revenue Service, or the IRS, with respect to the statements made and the conclusions reached in the following summary, and there can be no assurance that the IRS will agree with such statements and conclusions. This summary is limited to non-U.S. holders (as defined below) who purchase shares of our Class A common stock pursuant to this offering and who hold those shares as capital assets within the meaning of Section 1221 of the Internal Revenue Code. This discussion does not address all aspects of U.S. federal income or estate taxation that may be relevant to a particular non-U.S. holder in light of that non-U.S. holder’s individual circumstances, any consequences under the unearned income Medicare contribution tax pursuant to the Health Care and Education Reconciliation Act of 2010, or any consequences under other U.S. federal tax laws, nor does it address any aspects of tax considerations arising under the laws of any non-U.S., state or local jurisdiction. This discussion also does not address tax considerations applicable to a non-U.S. holder subject to special treatment under the U.S. federal income tax or estate tax laws, including without limitation: banks, insurance companies or other financial institutions; partnerships or other pass-through entities; tax-exempt organizations; tax-qualified retirement plans; traders, brokers, or dealers in securities, commodities or currencies; U.S. expatriates and certain former citizens or long-term residents of the U.S.; controlled foreign corporations; passive foreign investment companies; corporations that accumulate earnings to avoid U.S. federal income tax; persons that own, or have owned, actually or constructively, more than 5% of our Class A common stock; and persons that will hold common stock as a position treated as a hedging transaction, “straddle” or “conversion transaction” or other risk-reduction transaction for tax purposes.purposes; and persons deemed to sell our Class A common stock under the constructive sale provisions of the Code. Accordingly, we urge prospective investors to consult with their own tax advisers regarding the state, local and other tax considerations of acquiring, holding and disposing of shares of our Class A common stock. In addition, this discussion does not address the tax treatment of partnerships (or entities or arrangements that are treated as partnerships for U.S. federal income tax purposes) or persons who hold their Class A common stock through partnerships or other pass-through entities for U.S. federal income tax purposes. If a partnership (or other entity treated as a pass-through entity for U.S. federal income tax purposes) is a beneficial owner of Class A common stock, the tax treatment of a partner in the partnership (or member in such other entity) will generally depend upon the status of the partner and the activities of the partnership. Any partner in a partnership holding shares of Class A common stock should consult its own tax advisers. PROSPECTIVE INVESTORS ARE URGED TO CONSULT THEIR TAX ADVISERS WITH RESPECT TO THE APPLICATION OF THE U.S. FEDERAL INCOME TAX LAWS TO THEIR PARTICULAR SITUATIONS, AS WELL AS ANY INCOME OR OTHER TAX CONSEQUENCES OF THE PURCHASE, OWNERSHIP OR DISPOSITION OF OUR CLASS A COMMON STOCK ARISING UNDER THE LAWS OF THE U.S., ANY STATE, LOCAL, NON-U.S. OR OTHER TAXING JURISDICTION OR UNDER ANY APPLICABLE TAX TREATY. Definition of Non-U.S. Holder In general, a “non-U.S. holder” is any beneficial owner of our Class A common stock (other than an entity treated as a partnership or disregarded as separate from its owner for U.S. federal income tax purposes) that is not a U.S. person. A “U.S. person” is any of the following: an individual citizen or resident of the U.S. as determined for U.S. federal income tax purposes; a corporation (or any entity treated as a corporation for U.S. federal income tax purposes) created or organized in or under the laws of the U.S., any state thereof or the District of Columbia; an estate, the income of which is includible in gross income for U.S. federal income tax purposes regardless of its source; or a trust if (a) a court within the U.S. is able to exercise primary supervision over the administration of the trust and one or more U.S. persons (as defined in the Internal Revenue Code) have the authority to control all substantial decisions of the trust or (b) it has a valid election in effect under applicable Treasury regulations to be treated as a U.S. person. Distributions on Class A Common Stock If we make cash or other property distributions on our Class A common stock, or effect a redemption that is treated as a distribution with respect to our Class A common stock, then any such distributionsdistribution or redemptionsredemption will constitute dividendsa dividend for U.S. federal income tax purposes to the extent paid from our current and accumulated earnings and profits, as determined under U.S. federal income tax principles. Amounts not treated as dividendsa dividend for U.S. federal income tax purposes will constitute a tax-free return of capital to the extent of the non-U.S. holder’s adjusted tax basis in our Class A common stock and will be applied against and reduce that basis.basis, but not below zero. Any excess will be treated as gain realized on the sale or other disposition of the Class A common stock and will be treated as described under the section titled “—Gain on Sale or Other Disposition of Class A Common Stock” below. Except as described in the next paragraph, dividends paid to a non-U.S. holder of our Class A common stock generally will be subject to U.S. federal withholding tax at a rate of 30% of the gross amount of the dividends, or a lower rate specified by an applicable income tax treaty. To receive the benefit of a reduced treaty rate, a non-U.S. holder must furnish to us or our paying agent or withholding agent a properly completed and valid IRS Form W-8BEN (or applicable successor form) certifying, under penalties of perjury, such holder’s qualification for the reduced rate. This certification must be provided to us or our paying agent or other withholding agent prior to the payment of dividends and may be required to be updated periodically. Special certification and other requirements apply if our Class A common stock is held through a non-U.S. intermediary including non-U.S. pass-through entities. Non-U.S. holders that do not timely provide us or our paying agent or other withholding agent with the required certification, but that qualify for a reduced treaty rate, may obtain a refund of any excess amounts withheld by timely filing an appropriate claim for refund with the IRS. If we are not able to determine whether or not a distribution will exceed current and accumulated earnings and profits at the time the distribution is made, we may withhold tax on the entire amount of any distribution at the same rate as we would withhold on a dividend. However, a non-U.S. holder may obtain a refund of amounts that we withhold to the extent the distribution in fact exceeded our current and accumulated earnings and profits. If a non-U.S. holder holds our Class A common stock in connection with the conduct of a trade or business in the U.S., and dividends paid on the Class A common stock are effectively connected with such holder’s U.S. trade or business (and, if required by an applicable income tax treaty, are attributable to a permanent establishment or fixed base maintained by the non-U.S. holder in the U.S.), the non-U.S. holder will be exempt from U.S. federal withholding tax, but will be subject to tax as provided below. To claim the exemption, the non-U.S. holder must furnish to us or our paying agent or other withholding agent the required forms, including a properly executed IRS Form W-8ECI (or applicable successor form). Any dividends paid on our Class A common stock that are effectively connected with a non-U.S. holder’s U.S. trade or business (and, if required by an applicable income tax treaty, are attributable to a permanent establishment or fixed base maintained by the non-U.S. holder in the U.S.) generally will be subject to U.S. federal income tax on a net income basis at the regular graduated U.S. federal income tax rates in the same manner as if such holder were a U.S. holder. A non-U.S. holder that is a non-U.S. corporation (or non-U.S. entity treated as a corporation for U.S. federal income tax purposes) also may be subject to an additional branch profits tax equal to 30% (or such lower rate specified by an applicable income tax treaty) of a portion of its effectively connected earnings and profits for the taxable year. Non-U.S. holders should consult any applicable income tax treaties that may provide for different rules. A non-U.S. holder who provides us with an IRS Form W-8BEN or Form W-8ECI must update the form or submit a new form, as applicable, if there is a change in circumstances that makes any information on such form incorrect. A non-U.S. holder that claims the benefit of an applicable income tax treaty generally will be required to satisfy applicable certification and other requirements prior to the distribution date. Non-U.S. holders should consult their tax advisers regarding their entitlement to benefits under a relevant income tax treaty. Gain on Sale or Other Taxable Disposition of Class A Common Stock Subject to the discussion below regarding backup withholding, a non-U.S. holder generally will not be subject to U.S. federal income tax on any gain realized on a sale or other taxable disposition of our Class A common stock unless: the gain is “effectively connected” with the non-U.S. holder’s conduct of a trade or business in the U.S., and, if required by an applicable income tax treaty, the gain is attributable to a permanent establishment or fixed base that the non-U.S. holder maintains in the U.S., the non-U.S. holder is an individual, holds the Class A common stock as a capital asset, is present in the U.S. for 183 or more days in the taxable year of the sale and certain other conditions exist, or we are or have been a U.S. real property holding corporation, or a USRPHC, for U.S. federal income tax purposes at any time within the shorter of the five-year period preceding the disposition and the non-U.S. holder’s holding period for our Class A common stock, and such non-U.S. holder has actually or constructively held (at any time during the shorter of the five-year period preceding the date of the disposition or the holder’s holding period) 5% or more of our Class A common stock. We believe we currently are not, and we do not anticipate becoming, a USRPHC for U.S. federal income tax purposes. However, no assurance can be offered in this regard. Gain described in the first or third bullet point above will be subject to U.S. federal income tax on a net income basis at regular graduated U.S. federal income tax rates generally in the same manner as if such holder were a U.S. holder. A non-U.S. holder that is a non-U.S. corporation (or non-U.S. entity treated as a corporation for U.S. federal income tax purposes) also may be subject to an additional branch profits tax equal to 30% (or such lower rate specified by an applicable income tax treaty) of a portion of its effectively connected earnings and profits for the taxable year. The gross proceeds from transactions to which the third bullet point above applies will generally be subject to a 10% withholding tax, which may be claimed as a credit against the non-U.S. holder’s federal income tax liability. Non-U.S. holders should consult any applicable income tax treaties that may provide for different rules. Gain described in the second bullet point above will be subject to U.S. federal income tax at a flat 30% rate (or such lower rate specified by an applicable income tax treaty), but may be offset by U.S. source capital losses (even though the individual is not considered a resident of the U.S.), provided that the non-U.S. holder has timely filed U.S. federal income tax returns with respect to such losses. Federal Estate Taxes An individual non-U.S. holder who is treated as the owner of, or has made certain lifetime transfers of, an interest in our Class A common stock will be required to include the value thereof in his or her gross estate for U.S. federal estate tax purposes, and may be subject to U.S. federal estate tax unless an applicable estate tax treaty provides otherwise, even though such individual was not a citizen or resident of the U.S. at the time of his or her death. Backup Withholding and Information Reporting In general (except as described below), backup withholding and information reporting will not apply to a distribution of dividends on our Class A common stock paid to you or to proceeds from the disposition of the Class A common stock by you, in each case, if you certify under penalties of perjury that you are a non-U.S. person, and neither we nor our paying agent (or other payor) have actual knowledge or reason to know to the contrary. In general, if the Class A common stock is not held through a qualified intermediary, the amount of dividends, the name and address of the beneficial owner and the amount, if any, of tax withheld may be reported to the IRS. Information reporting and backup withholding generally are not required with respect to the amount of any proceeds from the sale or other disposition of our Class A common stock by a non-U.S. holder outside the U.S. through a foreign office of a foreign broker that does not have certain specified connections to the U.S. However, if a non-U.S. holder sells or otherwise disposes of its shares of our Class A common stock through a U.S. broker or the U.S. offices of a foreign broker, the broker will generally be required to report the amount of proceeds paid to the non-U.S. holder to the IRS and also backup withhold on that amount unless such non-U.S. holder provides appropriate certification to the broker of its status as a non-U.S. person (and the payor does not have actual knowledge or reason to know that such holder is a U.S. person as defined under the Internal Revenue Code) or otherwise establishes an exemption. Information reporting will also apply if a non-U.S. holder sells its shares of our Class A common stock through a foreign broker deriving more than a specified percentage of its income from U.S. sources or having certain other connections to the U.S., unless such broker has documentary evidence in its records that such non-U.S. holder is a non-U.S. person (and the payor does not have actual knowledge or reason to know that such holder is a U.S. person as defined under the Internal Revenue Code) and certain other conditions are met, or such non-U.S. holder otherwise establishes an exemption. Copies of information returns may be made available to the tax authorities of the country in which the non-U.S. holder resides or is incorporated under the provisions of a specific treaty or agreement. Backup withholding is not an additional tax. Any amounts withheld from a payment to a non-U.S. holder under the backup withholding rules generally can be credited against any U.S. federal income tax liability of the non-U.S. holder, provided that you timely furnish the required information to the IRS. Foreign Accounts Recently enacted legislation generally will impose a U.S. federal withholding tax of 30% on dividends paid after December 31, 2013, and the gross proceeds of a disposition of our Class A common stock paid after December 31, 2014 to a “foreign financial institution,” as specially defined under these rules, unless such institution enters into an agreement with the U.S. government to withhold on certain payments and to collect and providePursuant to the U.S. tax authorities substantialForeign Account Tax Compliance Act, or “FATCA,” foreign financial institutions (which term includes most foreign hedge funds, private equity funds, mutual funds, securitization vehicles and other investment vehicles) and certain other foreign entities must comply with certain new information regardingreporting rules with respect to their U.S. account holders of suchand investors or confront a new withholding tax on U.S.-source payments made to them (whether received as a beneficial owner or as an intermediary for another party). More
specifically, a foreign financial institution which includes certain equity and debt holders of such institution, as well as certain account holdersor other foreign entity that are foreign entitiesdoes not comply with U.S. owners. The legislation alsothe FATCA reporting requirements will generally imposebe subject to a new 30% withholding tax with respect to any “withholdable payments.” For this purpose, withholdable payments include generally U.S.-source payments otherwise subject to nonresident withholding tax (e.g., U.S.-source dividends) and also include the entire gross proceeds from the sale of any equity or debt instruments of U.S. issuers, even if the payment would otherwise not be subject to U.S. nonresident withholding tax (e.g., because it is capital gain). Final Treasury regulations defer this withholding obligation until January 1, 2014 for payments of U.S.-source dividends and until January 1, 2017 for gross proceeds from dispositions of stock in a U.S. federal withholding tax of 30% on dividends paid after December 31, 2013, and the gross proceeds of a disposition of our Class A common stock paid after December 31, 2014 to a non-financial foreign entity unless such entity provides the withholding agent with a certification identifying the direct and indirect U.S. owners of the entity. corporation. We will not pay any additional amounts to non-U.S. holders in respect of any amounts withheld.withheld pursuant to FATCA. Under certain circumstances, a non-U.S. holder might be eligible for refunds or credits of such taxes. Prospective investorsNon-U.S. holders are encouragedurged to consult with their own tax advisersadvisors regarding the possible implicationseffect, if any, of this legislationthe FATCA provisions to them based on their investment in our Class A common stock.particular circumstances. The preceding discussion is not tax advice. Each prospective investor should consult the prospective investor’s own tax adviser regarding the particular U.S. federal, state and local and non-U.S. tax consequences of purchasing, holding and disposing of our Class A common stock, including the consequences of any proposed change in applicable laws. UNDERWRITING We are offering the shares of our Class A common stock described in this prospectus in an underwritten offering in which we and Sandler O’Neill & Partners, L.P., as representative of the underwriters for the offering, will enter into an underwriting agreement with respect to the common stock being offered. Subject to the terms and conditions contained in the underwriting agreement, each underwriter named below has severally agreed to purchase the respective number of shares of our common stock set forth opposite its name below: | | | Name | | Number of
Shares of Class A
common stock | Sandler O’Neill & Partners, L.P. | | | Raymond James & Associates, Inc. | | | | | | Total | | |
The underwriting agreement provides that the underwriters’ obligation to purchase shares of our Class A common stock depends on the satisfaction of the conditions contained in the underwriting agreement, including: the representations and warranties made by us are true and agreements have been performed; there is no material adverse change in their determination in the financial markets or in our business; and we deliver customary closing documents. Subject to these conditions, the underwriters are committed to purchase and pay for all of the shares of our Class A common stock offered by this prospectus, if any such shares are purchased. However, the underwriters are not obligated to take or pay for the shares of our Class A common stock covered by the underwriters’ over-allotment option described below, unless and until that option is exercised. Over-Allotment Option We have granted the underwriters an option, exercisable no later than 30 days after the date of the underwriting agreement, to purchase up to an aggregate of additional shares of Class A common stock at the public offering price, less the underwriting discounts and commissions set forth on the cover page of this prospectus. Commissions and Expenses The underwriters propose to offer our Class A common stock directly to the public at the offering price set forth on the cover page of this prospectus and to dealers at the public offering price less a concession not in excess of $ per share. The underwriters may allow, and the dealers may re-allow, a concession not in excess of $ per share on sales to other brokers and dealers. After the public offering of our Class A common stock, the underwriters may change the offering price, concessions and other selling terms. The following table shows the per share and total underwriting discounts and commissions that we will pay to the underwriters and the proceeds we will receive before expenses. These amounts are shown assuming both no exercise and full exercise of the underwriters’ over-allotment option. | | | | | | | | | | | | | | | | Per Share | | | Total without
over-allotment
exercise | | | Total with
over-allotment over-
allotment
exercise | | Public offering price | | $ | | | | $ | | | | $ | | | Underwriting discount | | $ | | | | $ | | | | $ | | | Proceeds to us (before expenses) | | $ | | | | $ | | | | $ | | |
In addition to the underwriting discount, we will reimburse the underwriters for their reasonable out-of-pocket non-legal expenses up to $ , incurred in connection with their engagement as underwriters, regardless of whetherin the event this offering is consummated, including, without limitation, marketing, syndication and travel expenses. Further, we will reimburse the underwriters for their legal fees of up to $ incurred in connection with their engagement as underwriters, regardless of whetherin the event that this offering is not consummated. We will also pay for filing fees incident to, and the fees and disbursements (up to an aggregate of $ ) of blue sky counsel for the underwriters in connection with, securing any required review of the terms of this offering. We estimate that the total expenses of this offering, exclusive of the underwriting discounts and commissions, will be approximately $ ,million, and are payable by us. We have agreed to grant Sandler O’Neill & Partners, L.P. the right of first refusal to act as a financial advisor to us, in any transaction involving (i) a public offering of our or any of our subsidiaries’ securities and (ii) the sale in one or more transaction of series of related transactions by the existing holders of our or our subsidiaries’ outstanding securities representing at least 30% of our or any of our subsidiaries’ outstanding securities (other than any internal reorganization), in each case for a period of six months following the commencement of the sale of shares of our Class A common stock. Offering Price Determination Prior to this offering, there has been no public market for our Class A common stock. The initial public offering price will be negotiated between the representative and us. In determining the initial public offering price of our Class A common stock, the representative will consider: the history and prospects for the industry in which we compete; our financial information; the prevailing securities markets at the time of this offering; and the recent market prices of and the demand for publicly traded stock of comparable companies. Indemnification We have agreed to indemnify the underwriters, and persons who control the underwriters, against certain liabilities, including liabilities under the Securities Act, and to contribute to payments that the underwriters may be required to make in respect of these liabilities. Lock-Up Agreement We,Prior to the consummation of this offering, our directors and executive officers and certain of our shareholders have enteredemployees who participate in the directed share program will enter into lock-up agreements with the underwriters. Under these agreements, for a period of 180 days after the date of the underwriting agreement, we and each of these persons may not, without the prior written approval of the underwriters, subject to limited exceptions:
offer, pledge, sell, contract to sell, sell any option or contract to purchase, purchase any option or contract to sell, grant any option, right or warrant for the sale of, or otherwise dispose of or transfer any of our Class A common stock or any securities convertible into or exchangeable or exercisable for our Class A common stock, whether now owned or hereafter acquired or with respect to which such person has or hereafter acquires the power of disposition, or file any registration statement under the Securities Act, with respect to any of the foregoing, or enter into any swap or any other agreement or any transaction that transfers, in whole or in part, directly or indirectly, the economic consequence of ownership of our common stock, whether any such swap or transaction is to be settled by delivery of our Class A common stock or other securities, in cash or otherwise. The 180-day restricted period described in the preceding paragraph will be extended if: during the period that begins on the date that is 15 calendar days plus 3 business days before the last day of the 180-day restricted period and ends on the last day of the 180-day restricted period, we issue an earnings release or material news or a material event relating to us occurs, or prior to the expiration of the 180-day restricted period, we announce that we will release earnings results during the 17-day period beginning on the last day of the 180-day restricted period, in which case the restrictions described in the preceding paragraph will continue to apply until the expiration of the date that is 15 calendar days plus three business days after the date on which the earnings release is issued or the material news or material event relating to us occurs. Listing on theThe Nasdaq Global Market We have appliedintend to apply to list our Class A common stock on The Nasdaq Global Market under the symbol “SAMG.” Stabilization In connection with this offering, the underwriters may, but are not obligated to, engage in stabilizing transactions, over-allotment transactions, syndicate covering transactions and penalty bids. Stabilizing transactions permit bids to purchase shares of Class A common stock so long as the stabilizing bids do not exceed a specified maximum, and are engaged in for the purpose of preventing or mitigating a decline in the market price of the Class A common stock while the offering is in progress. Over-allotment transactions involve sales by the underwriters of shares of Class A common stock in excess of the number of shares the underwriters are obligated to purchase. This creates a syndicate short position that may be either a covered short position or a naked short position. In a covered short position, the number of shares of Class A common stock over-allotted by the underwriters is not greater than the number of shares that they may purchase in the over-allotment option. In a naked short position, the number of shares involved is greater than the number of shares in the over-allotment option. The underwriters may close out any short position by exercising their over-allotment option and/or purchasing shares in the open market. Syndicate covering transactions involve purchases of Class A common stock in the open market after the distribution has been completed in order to cover syndicate short positions. In determining the source of shares to close out the short position, the underwriters will consider, among other things, the price of shares available for purchase in the open market as compared with the price at which they may purchase shares through exercise of the over-allotment option. If the underwriters sell more shares than could be covered by exercise of the over-allotment option and, therefore, have a naked short position, the position can be closed out only by buying shares in the open market. A naked short position is more likely to be created if the underwriters are concerned that after pricing there could be downward pressure on the price of the shares in the open market that could adversely affect investors who purchase in the offering. Penalty bids permit the underwriters to reclaim a selling concession from a syndicate member when the common stock originally sold by that syndicate member is purchased in stabilizing or syndicate covering transactions to cover syndicate short positions. These stabilizing transactions, syndicate covering transactions and penalty bids may have the effect of raising or maintaining the market price of our Class A common stock or preventing or mitigating a decline in the market price of our Class A common stock. As a result, the price of our Class A common stock in the open market may be higher than it would otherwise be in the absence of these transactions. Neither we nor the underwriters make any representation or prediction as to the effect that the transactions described above may have on the price of our Class A common stock. These transactions may be effected on The Nasdaq Global Market, in the over-the-counter market or otherwise and, if commenced, may be discontinued at any time. Directed Share Program We have directed the underwriters to reserve up to % of the shares of Class A common stock to be issued in this offering for sale to our directors, officers and certain other persons at the initial public offering price through a directed share program. The number of shares Class A common stock available for sale to the public in the offering will be reduced to the extent these persons purchase any reserved shares. Any shares of Class A common stock not so purchased will be offered by the underwriters to the public on the same basis as other shares offered hereby. Our Relationship with the Underwriters Certain of the underwriters and/or their affiliates have engaged, and may in the future engage, in commercial and investment banking transactions with us in the ordinary course of their business. They have received, and expect to receive, customary compensation and expense reimbursement for these commercial and investment banking transactions. Notice to Prospective Investors in Switzerland This document does not constitute a prospectus within the meaning of Article 652a of the Swiss Code of Obligations. The shares of our Class A common stock may not be sold directly or indirectly in or into Switzerland except in a manner which will not result in a public offering within the meaning of the Swiss Code of Obligations. Neither this document nor any other offering materials relating to the Class A common stock may be distributed, published or otherwise made available in Switzerland except in a manner which will not constitute a public offer of our Class A common stock in Switzerland. Notice to Prospective Investors in the United Kingdom This document does not constitute a prospectus for the purposes of the prospectus rules issued by the UK Financial Services Authorities, or the FSA, pursuant to section 84 of the Financial Services and Markets Act 2000, as amended, or the FSMA, and has not been filed with the FSA. The shares of Class A common stock to be issued in this offering may not be offered or sold and will not be offered or sold to the public in the United Kingdom (within the meaning of section 102B of the FSMA) save in the circumstances where it is lawful to do so without an approved prospectus (with the meaning of the section 85 of the FSMA) being made available to the public before the offer is made. In addition, no person may communicate or cause to be communicated any invitation or inducement to engage in investment activity (within the meaning of section 21 of the FSMA) received by it in connection with the issue or sale or any shares of Class A common stock except in circumstances in which section 21(1) of the FSMA does not apply to Silvercrest. This prospectus is directed only at (i) persons who are outside the United Kingdom and (ii) persons having professional experience in matters relating to investments who fall within the definition of “investment professionals” in Article 19 of the Financial Services and Markets Act 2000 (Financial Promotion) Order 2005, as amended, the FPO, or (iii) high net worth bodies corporate, unincorporated associations and partnerships and trustees of high value trusts as described in Article 49 of the FPO. Any investment or investment activity to which this prospectus relates is only available to and will only be engaged in with such persons and persons who do not fall within (ii) or (iii) above should not rely on or act upon this communication. LEGAL MATTERS Certain legal matters with respect to the common stock offered hereby will be passed upon for us by Bingham McCutchen LLP. Certain legal matters with respect to this offering will be passed upon for the underwriters by Paul, Weiss, Rifkind, Wharton & Garrison LLP. EXPERTS The balance sheet of Silvercrest Asset Management Group Inc. as of May 11,December 31, 2012, included in this prospectus, has been audited by Deloitte & Touche LLP, an independent registered public accounting firm, as stated in their report appearing herein. Such Balance Sheetbalance sheet has been so included in reliance upon the report of such firm given upon their authority as experts in accounting and auditing. The consolidated financial statements of Silvercrest L.P. and its subsidiaries as of December 31, 20112012 and December 2010,2011, and for each of the years in the three-year period ended December 31, 2011,2012, included in this prospectus, have been audited by Deloitte & Touche LLP, an independent registered public accounting firm, as stated in their report appearing herein, which report expresses an unqualified opinion on the consolidated financial statements and includes an explanatory paragraph referring to a change in Silvercrest L.P.’s annual goodwill impairment testing date. Such financial statements have been so included in reliance upon the report of such firm given upon their authority as experts in accounting and auditing. The consolidated financial statements of Milbank Winthrop & Co., Inc. as of December 31, 2010 and 2009, and for each of the years in the two yeartwo-year period ended December 31, 2010, and the consolidated financial statements of MW Commodity Advisors, LLC as of December 31, 2011 and 2010, and for each of the years in the two-year period ended December 31, 2011, have been included herein in reliance upon the reportreports of Fulvio & Associates, L.L.P., an independent registered public accounting firm, appearing elsewhere herein, and upon the authority of said firm as experts in accounting and auditing. WHERE YOU CAN FIND MORE INFORMATION We have filed with the SEC a registration statement on Form S-1 under the Securities Act with respect to our Class A common stock. This prospectus does not contain all of the information set forth in the registration statement and the exhibits and schedules to the registration statement. For further information with respect to us and our Class A common stock, we refer you to the registration statement and the exhibits and schedules filed as a part of the registration statement. Each statement in this prospectus relating to a contract or document filed as an exhibit is qualified in all respects by the filed exhibit. You may read and copy any document we have filed or may file in the future at the SEC’s public reference facility in Room 1580, 100 F Street, N.E., Washington, D.C. 20549. Please call the SEC at 1-800-SEC-0330 for further information on the public reference room. The SEC maintains a website that contains reports, proxy and information statements and other information regarding registrants that file electronically with the SEC at http://www.sec.gov. Upon completion of this offering, we will be subject to the information and periodic reporting requirements of the Exchange Act and, accordingly, file periodic reports and other information, including proxy statements, with the SEC. INDEX TO FINANCIAL STATEMENTS SILVERCREST ASSET MANAGEMENT GROUP INC. | | | | | | | | Page | | Silvercrest Asset Management Group Inc. | | | | | | | Report of Independent Registered Public Accounting Firm | | | F-3 | | | | Balance Sheet as of May 11,December 31, 2012 | | | F-4 | | | | Notes to Balance Sheet | | | F-5 | | | | Balance Sheet as of June 30, 2012March 31, 2013 (Unaudited) (Unaudited) | | | F-6F-7 | | | | Notes to Balance Sheet | | | F-7F-8 | | | | Silvercrest L.P. and Subsidiaries | | | | | Report of Independent Registered Public Accounting Firm
| | | F-8 | | Consolidated Financial Statements of Silvercrest L.P. and its Subsidiaries for the three years ended December 31, 2011,2012, December 31, 2010,2011, and December 31, 2009:2010: | | | | | | | Report of Independent Registered Public Accounting Firm | | | F-10 | | | | Consolidated Statements of Financial Condition | | | F-9F-11 | | | | Consolidated Statements of Operations | | | F-10F-12 | | | | Consolidated Statements of Partners’ Deficit | | | F-11F-13 | | | | Consolidated Statements of Cash Flows | | | F-12F-14 | | | | Notes to Consolidated Financial Statements | | | F-14F-16 | | | | Condensed Consolidated Financial Statements of Silvercrest L.P. and its Subsidiaries for the sixthree months ended June 30,March 31, 2013 and 2012 and 2011 (Unaudited): | | | | | | | Condensed Consolidated Statements of Financial Condition | | | F-36F-38 | | | | Condensed Consolidated Statements of Operations | | | F-37F-39 | | | | Condensed Consolidated Statements of Partners’ Deficit | | | F-38F-40 | | | | Condensed Consolidated Statements of Cash Flows | | | F-39F-41 | | | | Notes to Condensed Consolidated Financial Statements | | | F-40F-43 | | | | Milbank Winthrop & Co., Inc. | | | | | | | Consolidated Financial Statements of Milbank Winthrop & Co., Inc. for the nine month period ended September 30, 2011 (Unaudited): | | | | | | | Consolidated Statements of Financial Condition | | | F-60F-62 | | | | Consolidated Statements of Operations | | | F-62F-64 | | | | Consolidated Statements of Changes in Stockholders’ Equity | | | F-63F-65 | | | | Consolidated Statements of Cash Flows | | | F-64F-66 | | | | Notes to Consolidated Financial Statements | | | F-66F-68 | |
REPORT OF INDEPENDENT REGISTERED PUBLIC ACCOUNTING FIRM To the Stockholder of Silvercrest Asset Management Group, Inc.: New York, New York
We have audited the accompanying balance sheet of Silvercrest Asset Management Group Inc. (the “Company”) as of May 11,December 31, 2012. This balance sheet is the responsibility of the Company’s management. Our responsibility is to express an opinion on this balance sheet based on our audit. We conducted our audit in accordance with the standards of the Public Company Accounting Oversight Board (United States). Those standards require that we plan and perform the audit to obtain reasonable assurance about whether the balance sheet is free of material misstatement. The Company is not required to have, nor were we engaged to perform, an audit of its internal control over financial reporting. Our audit included consideration of internal control over financial reporting as a basis for designing audit procedures that are appropriate in the circumstances, but not for the purpose of expressing an opinion on the effectiveness of the Company’s internal control over financial reporting. Accordingly, we express no such opinion. An audit also includes examining, on a test basis, evidence supporting the amounts and disclosures in the balance sheet, assessing the accounting principles used and significant estimates made by management, as well as evaluating the overall balance sheet presentation. We believe that our audit provides a reasonable basis for our opinion. In our opinion, the balance sheet presents fairly, in all material respects, the financial condition of Silvercrest Asset Management Group Inc. as of May 11,December 3, 2012, in conformity with accounting principles generally accepted in the United States of America. /s/ DELOITTE & TOUCHE LLP New York, New York May 11, 2012
Silvercrest Asset Management Group Inc.
Balance Sheet
May 11, 2012
| | | | | Assets | | | | | Cash | | $ | 100 | | | | | | | Stockholder’s Equity | | | | | Class A common stock, $0.01 par value - 1,000 shares authorized, 10 shares issued and outstanding | | $ | — | | Class B common stock, $0.01 par value - 1,000 shares authorized, 0 shares issued and outstanding | | | — | | Additional paid-in capital | | | 100 | | | | | | | Total stockholder’s equity | | $ | 100 | | | | | | |
See accompanying notes to balance sheet.
Silvercrest Asset Management Group Inc.
Notes to Balance Sheet
As of May 11, 2012
Silvercrest Asset Management Group Inc. (the “Company”) was formed as a Delaware corporation on July 11, 2011. The Company’s fiscal year end is December 31. The Company was formed for the purpose of completing a public offering and related transactions in order to carry on the business of Silvercrest L.P. The Company will be the sole general partner in Silvercrest L.P. and will operate and control all of the businesses and affairs of Silvercrest L.P. and, through Silvercrest L.P. and its subsidiaries, continue to conduct the business now conducted by these subsidiaries.
2. | SUMMARY OF SIGNIFICANT ACCOUNTING POLICIES |
Basis of Accounting — The Balance Sheet has been prepared in accordance with accounting principles generally accepted in the United States of America. Separate Statements of Operations, Stockholder’s Equity and of Cash Flows have not been presented as there have been no activities by this entity. There were no assets, liabilities, or equity as of December 31, 2011. The Company’s initial issuance of Class A common stock was on May 10, 2012.
G. Moffett Cochran, the Chairman, Chief Executive Officer and a Director of the Company is the sole stockholder of the Company, and contributed $100 to the Company on May 10, 2012 to purchase 10 shares of Class A common stock.
Holders of Class A common stock shall be entitled to one vote for each share of Class A common stock held on all matters submitted to stockholders for vote, consent or approval. Holders of Class B common stock shall be entitled to five votes for each share of Class B common stock held. Dividends are payable only to holders of Class A common stock.April 18, 2013
Silvercrest Asset Management Group Inc. Balance Sheet (Unaudited)
June 30,December 31, 2012
| Assets | | | | | Cash | | $ | 100 | | | $ | 100 | | | | | | | | | | Stockholder’s Equity | | | | | Class A common stock, $0.01 par value — 1,000 shares authorized, 10 shares issued and outstanding | | $ | — | | | Class B common stock, $0.01 par value — 1,000 shares authorized, 0 shares issued and outstanding | | | — | | | Preferred stock, $0.01 par value-10,000,000 shares authorized, none issued and outstanding | | | $ | — | | Class A common stock, $0.01 par value-50,000,000 shares authorized, 10 shares issued and outstanding | | | | — | | Class B common stock, $0.01 par value-25,000,000 shares authorized, none issued and outstanding | | | | — | | Additional paid-in capital | | | 100 | | | | 100 | | | | | | | | | Total stockholder’s equity | | $ | 100 | | | $ | 100 | | | | | | | | |
See accompanying notes to balance sheet. Silvercrest Asset Management Group Inc. Notes to Balance Sheet (Unaudited)
As of June 30,December 31, 2012 Silvercrest Asset Management Group Inc. (the “Company”) was formed as a Delaware corporation on July 11, 2011. The Company’s fiscal year end is December 31. The Company was formed for the purpose of completing a public offering and related transactions in order to carry on the business of Silvercrest L.P. The Company will be the sole general partner in Silvercrest L.P. and will operate and control all of the businesses and affairs of Silvercrest L.P. and, through Silvercrest L.P. and its subsidiaries, continue to conduct the business now conducted by these subsidiaries. | 2. | SUMMARY OF SIGNIFICANT ACCOUNTING POLICIES |
Basis of Accounting — Accounting—The Balance Sheet has been prepared in accordance with accounting principles generally accepted in the United States of America. Separate Statements of Operations, Stockholder’s Equity and of Cash Flows have not been presented as there have been no activities by this entity. There were no assets, liabilities, or equity as of December 31, 2011. The Company’s initial issuance of Class A common stock was on May 10, 2012. G. Moffett Cochran, the Chairman, Chief Executive Officer and a Director of the Company is the sole stockholder of the Company, and contributed $100 to the Company on May 10, 2012 to purchase 10 shares of Class A common stock. On November 13, 2012, the Company amended its certificate of incorporation to increase the total number of shares the Company shall have the authority to issue to 85,000,000 shares, consisting of 50,000,000 shares of Class A voting common stock and 25,000,000 shares of Class B voting common stock and 10,000,000 shares of preferred stock. All authorized shares have a par value of $0.01 per share. Holders of Class A common stock shall be entitled to one vote for each share of Class A common stock held on all matters submitted to stockholders for vote, consent or approval. Holders of Class B common stock shall be entitled to five votesone vote for each share of Class B common stock held. Dividends are payable only to holders of Class A common stock. On November 2, 2012, our board of directors adopted the Silvercrest Asset Management Group Inc. 2012 Equity Incentive Plan, or the 2012 Equity Incentive Plan. A total of 15% of the shares of the Company’s Class A common stock and its Class B common stock outstanding as of the closing of the Company’s initial public offering, if consummated, will be reserved and available for issuance under the 2012 Equity Incentive Plan. The equity interests may be issued in the form of shares of the Company’s Class A common stock and Class B units of Silvercrest L.P. The purposes of the 2012 Equity Incentive Plan are to (i) align the long-term financial interests of our employees, directors, consultants and advisers with those of our stockholders; (ii) attract and retain those individuals by providing compensation opportunities that are consistent with our compensation philosophy; and (iii) provide incentives to those individuals who contribute significantly to our long-term performance and growth. To accomplish these purposes, the 2012 Equity Incentive Plan will provide for the grant of units of Silvercrest L.P. (All references to units or interests of Silvercrest L.P. refer to Class B units of Silvercrest L.P. and accompanying shares of Class B common stock of our Company). The 2012 Equity Incentive Plan will also provide for the grant of stock options, stock appreciation rights, or SARs, restricted stock awards, restricted stock units, performance-based stock awards and other stock-based awards (collectively, stock awards) based on our Class A common stock. Awards may be granted to employees, including officers, members, limited partners or partners who are engaged in the business of one or more of our subsidiaries, as well as non-employee directors and consultants. It is initially anticipated that awards under the 2012 Equity Incentive Plan granted to our employees will be in the form of units of Silvercrest L.P. that will not vest until a specified period of time has elapsed, or other vesting conditions have been satisfied as determined by the Compensation Committee of the Company’s Board of Directors, and which may be forfeited if the vesting conditions are not met. During the period that any vesting restrictions apply, unless otherwise determined by the Compensation Committee, the recipient of the award will be eligible to participate in distributions of income from Silvercrest L.P. In addition, before the vesting conditions have been satisfied, the transferability of such units is generally prohibited and such units will not be eligible to be exchanged for cash or shares of our Class A common stock. On February 28, 2013, the Company amended its Amended and Restated Certification of Incorporation to reduce the total number of shares of all classes of stock which the Company shall have authority to issue to 4,000 shares. The total number of shares of all classes of common stock which the Company shall have authority was reduced to 3,000 shares, consisting of 2,000 shares of Class A common stock, par value $0.01 per share; and 1,000 shares of Class B common stock, par value $0.01 per share and, together with the Class A common stock. The total number of shares of all classes of preferred stock, par value $0.01 per share, which the Company shall have authority to issue is 1,000 shares. The Company has evaluated subsequent events through April 18, 2013, which is the date the balance sheet was available to be issued. Silvercrest Asset Management Group Inc. Balance Sheet (Unaudited) March 31, 2013 | | | | | Assets | | | | | Cash | | $ | 100 | | | | | | | Stockholder’s Equity | | | | | Preferred stock, $0.01 par value-1,000 shares authorized, none issued and outstanding | | $ | — | | Class A common stock, $0.01 par value-2,000 shares authorized, 10 shares issued and outstanding | | | — | | Class B common stock, $0.01 par value-1,000 shares authorized, none issued and outstanding | | | — | | Additional paid-in capital | | | 100 | | | | | | | Total stockholder’s equity | | $ | 100 | | | | | | |
See accompanying notes to balance sheet. Silvercrest Asset Management Group Inc. Notes to Balance Sheet (Unaudited) As of March 31, 2013 Silvercrest Asset Management Group Inc. (the “Company”) was formed as a Delaware corporation on July 11, 2011. The Company’s fiscal year end is December 31. The Company was formed for the purpose of completing a public offering and related transactions in order to carry on the business of Silvercrest L.P. The Company will be the sole general partner in Silvercrest L.P. and will operate and control all of the businesses and affairs of Silvercrest L.P. and, through Silvercrest L.P. and its subsidiaries, continue to conduct the business now conducted by these subsidiaries. | 2. | SUMMARY OF SIGNIFICANT ACCOUNTING POLICIES |
Basis of Accounting—The Balance Sheet has been prepared in accordance with accounting principles generally accepted in the United States of America. Separate Statements of Operations, Stockholder’s Equity and of Cash Flows have not been presented as there have been no activities by this entity. The Company’s initial issuance of Class A common stock was on May 10, 2012. G. Moffett Cochran, the Chairman, Chief Executive Officer and a Director of the Company is the sole stockholder of the Company, and contributed $100 to the Company on May 10, 2012 to purchase 10 shares of Class A common stock. On November 13, 2012, the Company amended its certificate of incorporation to increase the total number of shares the Company shall have the authority to issue to 85,000,000 shares, consisting of 50,000,000 shares of Class A voting common stock and 25,000,000 shares of Class B voting common stock and 10,000,000 shares of preferred stock. All authorized shares have a par value of $0.01 per share. Holders of Class A common stock shall be entitled to one vote for each share of Class A common stock held on all matters submitted to stockholders for vote, consent or approval. Holders of Class B common stock shall be entitled to one vote for each share of Class B common stock held. Dividends are payable only to holders of Class A common stock. On February 28, 2013, the Company amended its Amended and Restated Certification of Incorporation to reduce the total number of shares of all classes of stock which the Company shall have authority to issue to 4,000 shares. The total number of shares of all classes of common stock which the Company shall have authority was reduced to 3,000 shares, consisting of 2,000 shares of Class A common stock, par value $0.01 per share; and 1,000 shares of Class B common stock, par value $0.01 per share and, together with the Class A common stock. The total number of shares of all classes of preferred stock, par value $0.01 per share, which the Company shall have authority to issue is 1,000 shares. On November 2, 2012, our board of directors adopted the Silvercrest Asset Management Group Inc. 2012 Equity Incentive Plan, or the 2012 Equity Incentive Plan. A total of 15% of the shares of the Company’s Class A common stock and its Class B common stock outstanding as of the closing of the Company’s initial public offering, if consummated, will be reserved and available for issuance under the 2012 Equity Incentive Plan. The equity interests may be issued in the form of shares of the Company’s Class A common stock and Class B units of Silvercrest L.P. The purposes of the 2012 Equity Incentive Plan are to (i) align the long-term financial interests of our employees, directors, consultants and advisers with those of our stockholders; (ii) attract and retain those individuals by providing compensation opportunities that are consistent with our compensation philosophy; and (iii) provide incentives to those individuals who contribute significantly to our long-term performance and growth. To accomplish these purposes, the 2012 Equity Incentive Plan will provide for the grant of units of Silvercrest L.P. (All references to units or interests of Silvercrest L.P. refer to Class B units of Silvercrest L.P. and accompanying shares of Class B common stock of our Company). The 2012 Equity Incentive Plan will also provide for the grant of stock options, stock appreciation rights, or SARs, restricted stock awards, restricted stock units, performance-based stock awards and other stock-based awards (collectively, stock awards) based on our Class A common stock. Awards may be granted to employees, including officers, members, limited partners or partners who are engaged in the business of one or more of our subsidiaries, as well as non-employee directors and consultants. It is initially anticipated that awards under the 2012 Equity Incentive Plan granted to our employees will be in the form of units of Silvercrest L.P. that will not vest until a specified period of time has elapsed, or other vesting conditions have been satisfied as determined by the Compensation Committee of the Company’s Board of Directors, and which may be forfeited if the vesting conditions are not met. During the period that any vesting restrictions apply, unless otherwise determined by the Compensation Committee, the recipient of the award will be eligible to participate in distributions of income from Silvercrest L.P. In addition, before the vesting conditions have been satisfied, the transferability of such units is generally prohibited and such units will not be eligible to be exchanged for cash or shares of our Class A common stock. The Company has evaluated subsequent events through May , 2013, which is the date the balance sheet was available to be issued. REPORT OF INDEPENDENT REGISTERED PUBLIC ACCOUNTING FIRM To the Partners of Silvercrest L.P.: New York, New York and Subsidiaries:
We have audited the accompanying consolidated statements of financial condition of Silvercrest, L.P. and subsidiariesSubsidiaries (the “Company”) as of December 20112012 and 2010,2011, and the related consolidated statements of operations, partners’ deficit, and cash flows for each of the three years in the period ended December 31, 2011.2012. These consolidated financial statements are the responsibility of the Company’s management. Our responsibility is to express an opinion on these consolidated financial statements based on our audits. We conducted our audits in accordance with the standards of the Public Company Accounting Oversight Board (United States). Those standards require that we plan and perform the audit to obtain reasonable assurance about whether the consolidated financial statements are free of material misstatement. The Company is not required to have, nor were we engaged to perform, an audit of its internal control over financial reporting. Our audits included consideration of internal control over financial reporting as a basis for designing audit procedures that are appropriate in the circumstances, but not for the purpose of expressing an opinion on the effectiveness of the Company’s internal control over financial reporting. Accordingly, we express no such opinion. An audit also includes examining, on a test basis, evidence supporting the amounts and disclosures in the consolidated financial statements, assessing the accounting principles used and significant estimates made by management, as well as evaluating the overall consolidated financial statement presentation. We believe that our audits provide a reasonable basis for our opinion. In our opinion, such consolidated financial statements present fairly, in all material respects, the consolidated financial position of Silvercrest, L.P. and subsidiariesSubsidiaries as of December 31, 20112012 and 20102011 and the results of their operations and their cash flows for each of the three years in the period ended December 31, 2011,2012, in conformity with accounting principles generally accepted in the United States of America. As discussed in Note 2 to the consolidated financial statements, the Company changed its annual goodwill impairment testing date from December 31 to October 1, effective October 1, 2011. /s/ DELOITTE & TOUCHE LLP New York, New York May 11, 2012 (August 13, 2012 as to the effects of the restatement discussed in Note 2)April 18, 2013
Silvercrest L.P. And Subsidiaries Consolidated Statements of Financial Condition (In thousands) | | | | | | | | | | | | December 31, | | | | | 2011 | | | 2010 | | Assets | | | | | | | | | Cash and cash equivalents | | $ | 7,354 | | | $ | 7,025 | | Restricted certificates of deposit and escrow | | | 1,130 | | | | 1,465 | | Investments | | | 1,128 | | | | 1,316 | | Receivables, net | | | 2,238 | | | | 2,247 | | Due from Silvercrest Funds | | | 2,043 | | | | 1,255 | | Furniture, equipment and leasehold improvements, net | | | 2,275 | | | | 2,107 | | Goodwill | | | 14,683 | | | | 10,993 | | Intangible assets, net | | | 13,810 | | | | 5,771 | | Prepaid expenses and other assets | | | 601 | | | | 900 | | | | | | | | | | | Total assets | | $ | 45,262 | | | $ | 33,079 | | | | | | | | | | | Liabilities, Redeemable Partners’ Capital and Partners’ Deficit | | | | | | | | | Accounts payable and accrued expenses | | | 4,365 | | | | 2,236 | | Accrued compensation | | | 2,915 | | | | 2,790 | | Notes payable | | | 4,809 | | | | 2,957 | | Deferred rent | | | 3,287 | | | | 3,552 | | Deferred tax and other liabilities | | | 375 | | | | 955 | | | | | | | | | | | Total liabilities | | | 15,751 | | | | 12,490 | | | | | | | | | | | Redeemable partners’ capital | | | 91,201 | | | | 51,744 | | Notes receivable from partners | | | (6,024 | ) | | | (6,125 | ) | | | | | | | | | | Total redeemable partners’ capital | | | 85,177 | | | | 45,619 | | | | | | | | | | | Commitments and Contingencies (Note 11) | | | | | | | | | Partners’ Deficit | | | | | | | | | Partners’ capital | | | 44,359 | | | | 41,909 | | Excess of liabilities, redeemable partners’ capital and partners’ capital over assets | | | (100,025 | ) | | | (66,939 | ) | | | | | | | | | | Total partners’ deficit | | | (55,666 | ) | | | (25,030 | ) | | | | | | | | | | Total liabilities, redeemable partners’ capital and partners’ deficit | | $ | 45,262 | | | $ | 33,079 | | | | | | | | | | |
See accompanying notes to consolidated financial statements.
Silvercrest L.P.
And Subsidiaries
Consolidated Statements of Operations
(In thousands)
| | | | | | | | | | | | December 31, | | | | | 2012 | | | 2011 | | Assets | | | | | | | | | Cash and cash equivalents | | $ | 13,443 | | | $ | 7,354 | | Restricted certificates of deposit and escrow | | | 1,020 | | | | 1,130 | | Investments | | | 1,980 | | | | 1,128 | | Receivables, net | | | 3,675 | | | | 2,238 | | Due from Silvercrest Funds | | | 1,622 | | | | 2,043 | | Furniture, equipment and leasehold improvements, net | | | 2,061 | | | | 2,275 | | Goodwill | | | 15,891 | | | | 14,683 | | Intangible assets, net | | | 12,363 | | | | 13,810 | | Prepaid expenses and other assets | | | 399 | | | | 601 | | | | | | | | | | | Total assets | | $ | 52,454 | | | $ | 45,262 | | | | | | | | | | | Liabilities, Redeemable Partners’ Capital and Partners’ Deficit | | | | | | | | | Accounts payable and accrued expenses | | $ | 4,513 | | | $ | 4,365 | | Accrued compensation | | | 3,656 | | | | 2,915 | | Notes payable | | | 3,315 | | | | 4,809 | | Deferred rent | | | 2,268 | | | | 3,287 | | Deferred tax and other liabilities | | | 565 | | | | 375 | | | | | | | | | | | Total liabilities | | | 14,317 | | | | 15,751 | | | | | | | | | | | Redeemable partners’ capital | | | 102,017 | | | | 91,201 | | Notes receivable from partners | | | (3,410 | ) | | | (6,024 | ) | | | | | | | | | | Total redeemable partners’ capital | | | 98,607 | | | | 85,177 | | | | | | | | | | | Commitments and Contingencies (Note 10) | | | | | | | | | Partners’ Deficit | | | | | | | | | Partners’ capital | | | 47,904 | | | | 44,359 | | Excess of liabilities, redeemable partners’ capital and partners’ capital over assets | | | (108,374 | ) | | | (100,025 | ) | | | | | | | | | | Total partners’ deficit | | | (60,470 | ) | | | (55,666 | ) | | | | | | | | | | Total liabilities, redeemable partners’ capital and partners’ deficit | | $ | 52,454 | | | $ | 45,262 | | | | | | | | | | |
| | | | | | | | | | | | | | | | For the year ended December 31, | | | | | 2011 | | | 2010 | | | 2009 | | Revenue | | | | | | | | | | | | | Management and advisory fees | | $ | 37,869 | | | $ | 32,442 | | | $ | 29,341 | | Performance fees and allocations | | | 85 | | | | 548 | | | | 96 | | Family office services | | | 4,833 | | | | 3,841 | | | | 3,097 | | | | | | | | | | | | | | | Total revenue | | | 42,787 | | | | 36,831 | | | | 32,534 | | | | | | | | | | | | | | | Expenses | | | | | | | | | | | | | Compensation and benefits | | | 17,492 | | | | 16,528 | | | | 15,630 | | General and administrative | | | 10,849 | | | | 9,459 | | | | 13,006 | | Impairment charges | | | — | | | | — | | | | 1,691 | | | | | | | | | | | | | | | Total expenses | | | 28,341 | | | | 25,987 | | | | 30,327 | | | | | | | | | | | | | | | Income before other income (expense) | | | 14,446 | | | | 10,844 | | | | 2,207 | | Other income (expense) | | | | | | | | | | | | | Gain on extinguishment of debt | | | — | | | | — | | | | 3,934 | | Gain on settlement with former LongChamp shareholders | | | — | | | | — | | | | 1,470 | | Loss on forgiveness of notes receivable | | | (34 | ) | | | (508 | ) | | | — | | Change in value of options granted to equity holders | | | — | | | | 2 | | | | 134 | | Other (expense) income | | | (210 | ) | | | 30 | | | | — | | Interest income | | | 187 | | | | 231 | | | | 213 | | Interest expense | | | (164 | ) | | | (241 | ) | | | (467 | ) | Equity income from investments | | | 950 | | | | 1,241 | | | | 274 | | | | | | | | | | | | | | | Total other income | | | 729 | | | | 755 | | | | 5,558 | | | | | | | | | | | | | | | Income before (provision) benefit for income taxes | | | 15,175 | | | | 11,599 | | | | 7,765 | | (Provision) benefit for income taxes | | | (566 | ) | | | (657 | ) | | | 321 | | | | | | | | | | | | | | | Net income | | $ | 14,609 | | | $ | 10,942 | | | $ | 8,086 | | | | | | | | | | | | | | |
See accompanying notes to consolidated financial statements. Silvercrest L.P. And Subsidiaries Consolidated Statements of Partners’ DeficitOperations (In thousands) | | | | | | | | | | | | | | | | Partners’
Capital | | | Excess of
Liabilities,
Redeemable
Partners’
Capital and
Partners’
Capital
over Assets | | | Total
Partners’
Deficit | | January 1, 2009 | | $ | 37,521 | | | $ | (106,461 | ) | | $ | (68,940 | ) | Contributions from partners | | | — | | | | 4,842 | | | | 4,842 | | Distributions to partners | | | — | | | | (7,377 | ) | | | (7,377 | ) | Accretion to redemption value of redeemable partnership units | | | — | | | | 44,241 | | | | 44,241 | | Net income | | | 2,239 | | | | 5,847 | | | | 8,086 | | | | | | | | | | | | | | | December 31, 2009 | | | 39,760 | | | | (58,908 | ) | | | (19,148 | ) | Contributions from partners | | | — | | | | 1,090 | | | | 1,090 | | Distributions to partners | | | (823 | ) | | | (5,050 | ) | | | (5,873 | ) | Equity-based compensation | | | — | | | | 9 | | | | 9 | | Accretion to redemption value of redeemable partnership units | | | — | | | | (12,050 | ) | | | (12,050 | ) | Net income | | | 2,972 | | | | 7,970 | | | | 10,942 | | | | | | | | | | | | | | | December 31, 2010 | | | 41,909 | | | | (66,939 | ) | | | (25,030 | ) | Contributions from partners | | | — | | | | 849 | | | | 849 | | Distributions to partners | | | (1,271 | ) | | | (8,723 | ) | | | (9,994 | ) | Equity-based compensation | | | — | | | | 489 | | | | 489 | | Accretion to redemption value of redeemable partnership units | | | — | | | | (36,589 | ) | | | (36,589 | ) | Net income | | | 3,721 | | | | 10,888 | | | | 14,609 | | | | | | | | | | | | | | | December 31, 2011 | | $ | 44,359 | | | $ | (100,025 | ) | | $ | (55,666 | ) | | | | | | | | | | | | | |
| | | | | | | | | | | | | | | | For the year ended December 31, | | | | | 2012 | | | 2011 | | | 2010 | | Revenue | | | | | | | | | | | | | Management and advisory fees | | $ | 46,069 | | | $ | 37,869 | | | $ | 32,442 | | Performance fees and allocations | | | 714 | | | | 85 | | | | 548 | | Family office services | | | 4,907 | | | | 4,833 | | | | 3,841 | | | | | | | | | | | | | | | Total revenue | | | 51,690 | | | | 42,787 | | | | 36,831 | | | | | | | | | | | | | | | Expenses | | | | | | | | | | | | | Compensation and benefits | | | 19,108 | | | | 17,492 | | | | 16,528 | | General and administrative | | | 13,680 | | | | 10,849 | | | | 9,459 | | | | | | | | | | | | | | | Total expenses | | | 32,788 | | | | 28,341 | | | | 25,987 | | | | | | | | | | | | | | | Income before other income (expense), net | | | 18,902 | | | | 14,446 | | | | 10,844 | | Other income (expense), net | | | | | | | | | | | | | Loss on forgiveness of notes receivable | | | — | | | | (34 | ) | | | (508 | ) | Other income (expense), net | | | 123 | | | | (210 | ) | | | 32 | | Interest income | | | 145 | | | | 187 | | | | 231 | | Interest expense | | | (304 | ) | | | (164 | ) | | | (241 | ) | Equity income from investments | | | 1,911 | | | | 950 | | | | 1,241 | | | | | | | | | | | | | | | Total other income (expense), net | | | 1,875 | | | | 729 | | | | 755 | | | | | | | | | | | | | | | Income before provision for income taxes | | | 20,777 | | | | 15,175 | | | | 11,599 | | Provision for income taxes | | | (1,057 | ) | | | (566 | ) | | | (657 | ) | | | | | | | | | | | | | | Net income | | $ | 19,720 | | | $ | 14,609 | | | $ | 10,942 | | | | | | | | | | | | | | |
See accompanying notes to consolidated financial statements. Silvercrest L.P. And Subsidiaries Consolidated Statements of Cash FlowsPartners’ Deficit (In thousands) | | | | | | | | | | | | | | | | For the year ended December 31, | | | | | 2011 | | | 2010 | | | 2009 | | Cash Flows From Operating Activities | | | | | | | | | | | | | Net income | | $ | 14,609 | | | $ | 10,942 | | | $ | 8,086 | | Adjustments to reconcile net income to net cash provided by operating activities: | | | | | | | | | | | | | Equity-based compensation | | | 977 | | | | 583 | | | | — | | Depreciation and amortization | | | 1,469 | | | | 1,379 | | | | 1,531 | | Amortization of acquired deferred revenue | | | (870 | ) | | | — | | | | — | | Deferred rent | | | (265 | ) | | | (418 | ) | | | 647 | | Deferred income taxes | | | (275 | ) | | | (174 | ) | | | 293 | | Goodwill, intangible and fixed asset impairment charge | | | — | | | | — | | | | 1,691 | | Change in fair value of options granted | | | — | | | | (2 | ) | | | (134 | ) | Gain on extinguishment of debt | | | — | | | | — | | | | (3,934 | ) | Gain on settlement with former LongChamp shareholders | | | — | | | | — | | | | (219 | ) | Loss on forgiveness of notes receivable | | | 34 | | | | 508 | | | | — | | Non-cash interest income | | | (180 | ) | | | (207 | ) | | | (165 | ) | Non-cash interest expense | | | — | | | | — | | | | 35 | | Distributions received from investment funds | | | 1,231 | | | | 274 | | | | 1,014 | | Equity income from investments | | | (950 | ) | | | (1,241 | ) | | | (274 | ) | Provision for doubtful receivables | | | — | | | | 104 | | | | — | | Other | | | 92 | | | | — | | | | — | | Cash flows due to changes in operating assets and liabilities: | | | | | | | | | | | | | Receivables and due from Silvercrest funds | | | (780 | ) | | | (1,438 | ) | | | 3,211 | | Prepaid expenses and other assets | | | 192 | | | | 422 | | | | (49 | ) | Payables and accrued expenses | | | 644 | | | | (261 | ) | | | (980 | ) | Accrued compensation | | | (360 | ) | | | 113 | | | | (2,702 | ) | Other liabilities | | | (282 | ) | | | 646 | | | | (2 | ) | Interest payable on notes payable | | | 115 | | | | 189 | | | | 262 | | | | | | | | | | | | | | | Net cash provided by operating activities | | | 15,401 | | | | 11,419 | | | | 8,311 | | | | | | | | | | | | | | | Cash Flows From Investing Activities | | | | | | | | | | | | | Restricted certificates of deposit and escrow | | $ | 335 | | | $ | 689 | | | $ | (14 | ) | Acquisition of furniture, equipment and leasehold improvements Earn-outs paid related to acquisitions completed before January 1, 2009 | |
| (606
(663 | )
) | |
| (79
(245 | )
) | |
| (10
(488 | )
) | Acquisition of Milbank, net of cash acquired | | | (3,357 | ) | | | — | | | | — | | Purchase of investments | | | (419 | ) | | | — | | | | — | | Proceeds from sale of investments | | | 234 | | | | — | | | | — | | | | | | | | | | | | | | | Net cash (used in) provided by investing activities | | | (4,476 | ) | | | 365 | | | | (512 | ) | | | | | | | | | | | | | |
| | | | | | | | | | | | | | | | Partners’
Capital | | | Excess of
Liabilities,
Redeemable
Partners’
Capital and
Partners’
Capital
over Assets | | | Total
Partners’
Deficit | | January 1, 2010 | | $ | 39,760 | | | $ | (58,908 | ) | | $ | (19,148 | ) | Contributions from partners | | | — | | | | 1,090 | | | | 1,090 | | Distributions to partners | | | (823 | ) | | | (5,050 | ) | | | (5,873 | ) | Equity-based compensation | | | — | | | | 9 | | | | 9 | | Accretion to redemption value of redeemable partnership units | | | — | | | | (12,050 | ) | | | (12,050 | ) | Net income | | | 2,972 | | | | 7,970 | | | | 10,942 | | | | | | | | | | | | | | | December 31, 2010 | | | 41,909 | | | | (66,939 | ) | | | (25,030 | ) | Contributions from partners | | | — | | | | 849 | | | | 849 | | Distributions to partners | | | (1,271 | ) | | | (8,723 | ) | | | (9,994 | ) | Equity-based compensation | | | — | | | | 489 | | | | 489 | | Accretion to redemption value of redeemable partnership units | | | — | | | | (36,589 | ) | | | (36,589 | ) | Net income | | | 3,721 | | | | 10,888 | | | | 14,609 | | | | | | | | | | | | | | | December 31, 2011 | | | 44,359 | | | | (100,025 | ) | | | (55,666 | ) | Contributions from partners | | | — | | | | 112 | | | | 112 | | Distributions to partners | | | (1,466 | ) | | | (13,283 | ) | | | (14,749 | ) | Equity-based compensation | | | — | | | | 1,019 | | | | 1,019 | | Accretion to redemption value of redeemable partnership units | | | — | | | | (10,906 | ) | | | (10,906 | ) | Net income | | | 5,011 | | | | 14,709 | | | | 19,720 | | | | | | | | | | | | | | | December 31, 2012 | | $ | 47,904 | | | $ | (108,374 | ) | | $ | (60,470 | ) | | | | | | | | | | | | | |
See accompanying notes to consolidated financial statements.
| | | | | | | | | | | | | | | | For the year ended December 31, | | | | | 2011 | | | 2010 | | | 2009 | | Cash Flows From Financing Activities | | | | | | | | | | | | | Proceeds from issuance of partner interests | | $ | 13 | | | $ | 180 | | | $ | 1,343 | | Redemptions of partner interests | | | (237 | ) | | | (225 | ) | | | — | | Repayments of notes payable | | | (1,445 | ) | | | (4,373 | ) | | | (3,895 | ) | Payments on capital leases | | | (16 | ) | | | (2 | ) | | | — | | Distributions to partners | | | (9,994 | ) | | | (5,873 | ) | | | (7,307 | ) | Payments from partners on notes receivable | | | 1,083 | | | | 207 | | | | 1,012 | | | | | | | | | | | | | | | Net cash used in financing activities | | | (10,596 | ) | | | (10,086 | ) | | | (8,847 | ) | | | | | | | | | | | | | | | | | | Net increase (decrease) in cash and cash equivalents | | | 329 | | | | 1,698 | | | | (1,048 | ) | Cash and cash equivalents, beginning of year | | | 7,025 | | | | 5,327 | | | | 6,375 | | | | | | | | | | | | | | | Cash and cash equivalents, end of year | | $ | 7,354 | | | $ | 7,025 | | | $ | 5,327 | | | | | | | | | | | | | | | | | | | Supplemental Disclosures of Cash Flow Information | | | | | | | | | | | | | Net cash paid (refunded) during the year for: | | | | | | | | | | | | | Income taxes | | $ | 855 | | | $ | (539 | ) | | $ | 934 | | Interest | | | 114 | | | | 252 | | | | 285 | | | | | | Supplemental Disclosures of Non-cash Investing and Financing Activities | | | | | | | | | | | | | Earnout accrual for acquisition of Marathon Capital Group, LLC | | $ | 419 | | | $ | 685 | | | $ | 321 | | Earn-out accrual for acquisition of Heritage Financial Management, LLC | | $ | — | | | $ | — | | | $ | 291 | | Notes receivable: | | | | | | | | | | | | | From partners for capital contributions | | $ | 836 | | | $ | 187 | | | $ | 3,500 | | Satisfied as part of share redemptions | | | — | | | | 734 | | | | 901 | | Loss on forgiveness of notes receivable | | | 34 | | | | 508 | | | | — | | Earnout accrual for acquisition of Milbank | | | 1,726 | | | | — | | | | — | | Issuance of notes payable for redemption of partner interests | | | — | | | | 745 | | | | 1,897 | | Issuance of notes payable for acquisition of Milbank | | | 3,181 | | | | — | | | | — | | Issuance of partner interests as satisfaction of notes payable to partners | | | — | | | | 724 | | | | — | | Issuance of shares for acquisition of Milbank | | | 3,105 | | | | — | | | | — | |
See accompanying notes to consolidated financial statements. Silvercrest L.P. And Subsidiaries Consolidated Statements of Cash Flows (In thousands) | | | | | | | | | | | | | | | | For the year ended December 31, | | | | | 2012 | | | 2011 | | | 2010 | | Cash Flows From Operating Activities | | | | | | | | | | | | | Net income | | $ | 19,720 | | | $ | 14,609 | | | $ | 10,942 | | Adjustments to reconcile net income to net cash provided by operating activities: | | | | | | | | | | | | | Equity-based compensation | | | 1,354 | | | | 977 | | | | 583 | | Depreciation and amortization | | | 1,918 | | | | 1,469 | | | | 1,379 | | Amortization of acquired deferred revenue | | | — | | | | (870 | ) | | | — | | Deferred rent | | | (336 | ) | | | (265 | ) | | | (418 | ) | Reversal of lease abandonment charge | | | (576 | ) | | | — | | | | — | | Deferred income taxes | | | 22 | | | | (275 | ) | | | (174 | ) | Change in fair value of options granted | | | — | | | | — | | | | (2 | ) | Loss on forgiveness of notes receivable | | | — | | | | 34 | | | | 508 | | Non-cash interest on notes receivable from partners | | | (138 | ) | | | (180 | ) | | | (207 | ) | Distributions received from investment funds | | | 965 | | | | 1,231 | | | | 274 | | Equity income from investments | | | (1,911 | ) | | | (950 | ) | | | (1,241 | ) | Provision for doubtful receivables | | | — | | | | — | | | | 104 | | Other | | | (6 | ) | | | 92 | | | | — | | Cash flows due to changes in operating assets and liabilities: | | | | | | | | | | | | | Receivables and due from Silvercrest funds | | | (1,016 | ) | | | (780 | ) | | | (1,438 | ) | Prepaid expenses and other assets | | | 117 | | | | 192 | | | | 422 | | Accounts payable and accrued expenses | | | (76 | ) | | | 644 | | | | (261 | ) | Accrued compensation | | | 406 | | | | (360 | ) | | | 113 | | Other liabilities | | | 154 | | | | (282 | ) | | | 646 | | Interest payable on notes payable | | | 201 | | | | 115 | | | | 189 | | | | | | | | | | | | | | | Net cash provided by operating activities | | | 20,756 | | | | 15,401 | | | | 11,419 | | | | | | | | | | | | | | | Cash Flows From Investing Activities | | | | | | | | | | | | | Restricted certificates of deposit and escrow | | $ | 110 | | | $ | 335 | | | $ | 689 | | Acquisition of furniture, equipment and leasehold improvements | | | (257 | ) | | | (606 | ) | | | (79 | ) | Earn-outs paid related to acquisitions completed before January 1, 2009 | | | (720 | ) | | | (663 | ) | | | (245 | ) | Acquisition of Milbank, net of cash acquired | | | — | | | | (3,357 | ) | | | — | | Purchase of investments | | | (42 | ) | | | (419 | ) | | | — | | Proceeds from sale of investments | | | 139 | | | | 234 | | | | — | | | | | | | | | | | | | | | Net cash (used in) provided by investing activities | | | (770 | ) | | | (4,476 | ) | | | 365 | | | | | | | | | | | | | | | Cash Flows From Financing Activities | | | | | | | | | | | | | Proceeds from issuance of partner interests | | $ | — | | | $ | 13 | | | $ | 180 | | Earn-outs paid related to acquisitions completed on or after January 1, 2009 | | | (75 | ) | | | — | | | | — | | Redemptions of partners’ interests | | | (222 | ) | | | (237 | ) | | | (225 | ) | Repayments of notes payable | | | (1,695 | ) | | | (1,445 | ) | | | (4,373 | ) | Payments on capital leases | | | (20 | ) | | | (16 | ) | | | (2 | ) | Distributions to partners | | | (14,749 | ) | | | (9,994 | ) | | | (5,873 | ) | Payments from partners on notes receivable | | | 2,864 | | | | 1,083 | | | | 207 | | | | | | | | | | | | | | | Net cash used in financing activities | | | (13,897 | ) | | | (10,596 | ) | | | (10,086 | ) | | | | | | | | | | | | | | Net increase in cash and cash equivalents | | | 6,089 | | | | 329 | | | | 1,698 | | Cash and cash equivalents, beginning of year | | | 7,354 | | | | 7,025 | | | | 5,327 | | | | | | | | | | | | | | | Cash and cash equivalents, end of year | | $ | 13,443 | | | $ | 7,354 | | | $ | 7,025 | | | | | | | | | | | | | | |
See accompanying notes to consolidated financial statements. | | | | | | | | | | | | | | | | For the year ended December 31, | | | | | 2012 | | | 2011 | | | 2010 | | Supplemental Disclosures of Cash Flow Information | | | | | | | | | | | | | Net cash paid (refunded) during the year for: | | | | | | | | | | | | | Income taxes | | $ | 995 | | | $ | 855 | | | $ | (539 | ) | Interest | | | 225 | | | | 114 | | | | 252 | | | | | | Supplemental Disclosures of Non-cash Investing and Financing Activities | | | | | | | | | | | | | Notes receivable: | | | | | | | | | | | | | From partners for capital contributions | | $ | 112 | | | $ | 836 | | | $ | 187 | | Satisfied as part of share redemptions | | | — | | | | — | | | | 734 | | Loss on forgiveness of notes receivable | | | — | | | | 34 | | | | 508 | | Earnout accrual for acquisition of Marathon Capital Group, LLC | | | 1,061 | | | | 419 | | | | 685 | | Earnout accrual for acquisition of Milbank | | | — | | | | 1,726 | | | | — | | Issuance of notes payable for redemption of partner interests | | | — | | | | — | | | | 745 | | Issuance of notes payable for acquisition of Milbank | | | — | | | | 3,181 | | | | — | | Issuance of partner interests as satisfaction of notes payable to partners | | | — | | | | — | | | | 724 | | Issuance of shares for acquisition of Milbank | | | — | | | | 3,105 | | | | — | | Issuance of shares and call rights option for acquisition of MW Commodity Advisors, LLC | | | 147 | | | | — | | | | — | |
See accompanying notes to consolidated financial statements. Silvercrest L.P. and Subsidiaries Notes to Consolidated Financial Statements As of and For the Years Ended December 2011, 2010 and 2009
(Dollars in thousands) 1. ORGANIZATION AND BUSINESS
| 1. | ORGANIZATION AND BUSINESS |
Silvercrest L.P. (“Silvercrest”), together with its consolidated subsidiaries (collectively the “Company”), provides investment management and family office services to individuals and families and their trusts, and to endowments, foundations and other institutional investors primarily located in the United States of America. The business includes the management of funds of funds, and other investment funds, collectively referred to as the “Silvercrest Funds.” Silvercrest was formed on December 10, 2008 and commenced operations on January 1, 2009 along with its general partner, Silvercrest GP LLC (“GP LLC”) as part of a restructuring that was completed to organize the Company more in line with industry standards and to increase tax efficiency. Pursuant to the reorganization each of the members of Silvercrest Asset Management Group LLC (“SAMG LLC”) contributed their limited liability company interests in SAMG LLC to Silvercrest L.P. in return for limited partnership interests in Silvercrest L.P. and member interests in Silvercrest GP LLC, such that immediately after giving effect to such issuances each member’s percentage ownership of, and voting interest in, the aggregate limited partnership interests was equal to its ownership and voting interests immediately prior to such issuance, but reduced pro rata to take into account the 1% interest in Silvercrest L.P. owned by Silvercrest GP LLC, the general partner of Silvercrest L.P. As a result of the restructuring, SAMG LLC became a wholly owned subsidiary as of January 1, 2009. The reorganization was accounted for as a transaction between entities under common control and all balances of SAMG LLC were carried over to Silvercrest at their carrying values onas of December 31, 2008. On March 11, 2004, the Company acquired 100% of the outstanding shares of James C. Edwards Asset Management, Inc. (“JCE”) and subsequently changed JCE’s name to Silvercrest Financial Services, Inc. (“SFS”). On December 31, 2004, the Company acquired 100% of the outstanding shares of The LongChamp Group, Inc. now SAM Alternative Solutions, Inc. (“LGI”). Effective March 31, 2005, the Company entered into an Asset Contribution Agreement to acquire all of the assets, properties, rights and certain liabilities of Heritage Financial Management, LLC (“HFM”). Effective October 3, 2008, the Company acquired 100% of the outstanding limited liability company interests of Marathon Capital Group, LLC (“MCG”) through a limited liability company interest purchase agreement dated September 22, 2008. On November 1, 2011, the Company acquired certain assets of Milbank Winthrop & Co. (“Milbank”). On April 1, 2012, the Company acquired the LLC interests of MW Commodity Advisors, LLC (“Commodity Advisors”). See Notes 3, 7 and 8 for additional information related to goodwill and intangible assets related to these acquisitions. 2. SUMMARY OF SIGNIFICANT ACCOUNTING POLICIES
| 2. | SUMMARY OF SIGNIFICANT ACCOUNTING POLICIES |
Basis of Presentation and Principles of Consolidation The accompanying consolidated financial statements include the accounts of Silvercrest and its wholly-owned subsidiaries, SAMG LLC, SFS, LGI, MCG, Silvercrest Investors LLC and Silvercrest Investors II LLC as of and for the year ended December 31, 2011.2012. All intercompany transactions and balances have been eliminated. In addition, Silvercrestthe Company evaluates for consolidation those entities it controls through a majority voting interest or otherwise, including those Silvercrest Funds in which the general partner or equivalent is presumed to have control over the fund. The initial step in our determination of whether a fund for which the CompanySilvercrest is the general partner is required to be consolidated is assessing whether the fund meets the definition of a variable interest entity (VIE). None of funds for which the CompanySilvercrest is the general partner met the definition of a VIE during the three years ended December 31, 2011,2012, as the total equity at risk of each fund is sufficient for the fund to finance its activities without additional subordinated financial support provided by any parties, including the equity holders. The CompanySilvercrest then considers whether the fund is a voting interest entities (VoIE) in which the unaffiliated limited partners have substantive “kick-out” rights that provide the ability to dissolve (liquidate) the limited partnership or otherwise remove the general partner without cause.The CompanySilvercrest considers the “kick-out” rights to be substantive if the general partner for the fund can be removed by the vote of a simple majority of the unaffiliated limited partners and there are no significant barriers to the unaffiliated limited partners’ ability to exercise these rights in that among other things (1) there are no conditions or timing limits on when the rights can be exercised, (2) there are no financial or operational barriers associated with replacing the general partner, (3) there are a number of qualified replacement investment advisors that would accept appointment at the same fee level, (4) each fund’s documents provide for the ability to call and conduct a vote, and (5) the information necessary to exercise the kick-out rights and related vote are available from the fund and its administrator.
As of and for the years ended December 2012, 2011 2010 and 2009,2010, all of the funds for which the CompanySilvercrest was the general partner have substantive “kick-out” rights and therefore Silvercrest did not consolidate any of the Silvercrest Funds. Segment Reporting The Company views its operations as comprising one operating segment. Each of the Company’s acquired businesses have similar economic characteristics and have been fully integrated upon acquisition. Furthermore, our Chief Operating Decision Maker, which is the Company’s Chief Executive Officer, monitors and reviews financial information at a consolidated level for assessing operating results and the allocation of resources. Use of Estimates The preparation of the consolidated financial statements requires management to make estimates and assumptions that affect the reported amounts of assets and liabilities, the disclosure of contingent assets and liabilities at the date of the consolidated financial statements and the reported amounts of revenues, expenses and other income reported in the consolidated financial statements and the accompanying notes. Actual results could differ from those estimates. Significant estimates and assumptions made by management include the fair value of acquired assets and liabilities, equity based compensation, impairmentthe fair value of our reporting unit utilized in assessing goodwill for impairment, accounting for income taxes, the useful lives of long lived assets and other matters that affect the consolidated financial statements and related disclosures. Cash and Cash Equivalents The Company considers all highly liquid securities with original maturities of 90 days or less when purchased to be cash equivalents. Restricted Certificates of Deposit Certain certificates of deposit held at a major financial institution are restricted and serve as collateral for letters of credit for the Company’s lease obligations as described in Note 11.10. Equity Method Investments Entities and investments over which the Company exercises significant influence over the activities of the entity but which do not meet the requirements for consolidation are accounted for using the equity method of accounting, pursuant to ASC 323, Investments-Equity Method and Joint Ventures, (“ASC 323”), whereby the Company records its share of the underlying income or losses of these entities. Intercompany profit arising from transactions with affiliates is eliminated to the extent of its beneficial interest. Equity in losses of equity method investments is not recognized after the carrying value of an investment, including advances and loans, has been reduced to zero, unless guarantees or other funding obligations exist. The Company evaluates its equity method investments for impairment, whenever events or changes in circumstances indicate that the carrying amounts of such investments may not be recoverable. The difference between the carrying value of the equity method investment and its estimated fair value is recognized as impairment when the loss in value is deemed other than temporary. The Company’s equity method investments approximate their fair value at December 31, 2012, 2011 2010 and 2009.2010. The fair value of the equity method investments is estimated based on the Company’s share of the fair value of net assets of the equity method investee which consist of Level I and Level II securities. No impairment charges related to equity method investments were recorded during the years ended December 31, 2012, 2011 2010 and 2009.2010. Receivables and Due from Silvercrest Funds Receivables consist primarily of amounts due for advisory fees due from clients and management fees, and are stated at net realizable value. The Company maintains an allowance for doubtful receivables based on estimates of expected losses and specific identification of uncollectible accounts. The Company charges actual losses to the allowance when incurred. Furniture, Equipment and Leasehold Improvements Furniture, equipment and leasehold improvements consist primarily of furniture, fixtures and equipment, computer hardware and software and leasehold improvements and are recorded at cost less accumulated depreciation. Depreciation is calculated using the straight-line method over the assets’ estimated useful lives, which for leasehold improvements is the lesser of the lease term or the life of the asset, generally 10 years, and 3 to 7 years for other fixed assets. Business Combinations The Company accounts for business combinations using the acquisition method of accounting. The acquisition method of accounting requires that purchase price, including the fair value of contingent consideration, of the acquisition be allocated to the assets acquired and liabilities assumed using the fair values determined by management as of the acquisition date. Contingent consideration is recorded as part of the purchase price when such contingent consideration is not based on continuing employment of the selling shareholders. Contingent consideration that is related to continuing employment is recorded as compensation expense. Payments made for contingent consideration recorded as part of an acquisition’s purchase price are reflected as financing activities in the Company’s statements of cash flows. For acquisitions completed subsequent to January 1, 2009, the Company remeasures the fair value of contingent consideration at each reporting period using a probability-adjusted discounted cash flow method based on significant inputs not observable in the market and any change in the fair value from either the passage of time or events occurring after the acquisition date, is recorded in earnings. Contingent consideration payments that exceed the acquisition date fair value of the contingent consideration are reflected as an operating activity in the consolidated statements of cash flows. Correction of Immaterial Error
Subsequent to the issuance of the Company’s consolidated financial statements as of and for the three years ended December 31, 2011, the Company determined that it had incorrectly classified contingent consideration payments made for acquisitions completed prior to January 1, 2009 as cash flows from financing activities, instead of cash flows from investing activities. As a result, the accompanying financial statements have been
restated to correct this error. Cash payments for contingent consideration of $663, $245, and $488 for December 31, 2011, 2010, and 2009, respectively, have been reclassified in the consolidated statement of cash flows from financing activities to investing activities.
Goodwill and Intangible Assets Goodwill consists of the excess of the purchase price over the fair value of identifiable net assets of businesses acquired. Goodwill is not amortized and is evaluated for impairment using a two-step process that is performed at least annually, or whenever events or circumstances indicate that impairment may have occurred. During 2011, the Company changed its annual impairment test date from December 31 to October 1, effective October 1, 2011. The change in the impairment testing date was not made with the intent of accelerating or delaying an impairment charge. The change was made in anticipation of the Company having a requirement to issue its annual financial statements on an accelerated basis as compared to prior years. The change had no impact on the Company’s results of operations or any other financial statement line item. In September 2011, the FASB issued ASU 2011-08, “Testing Goodwill for Impairment”, which provided new accounting guidance on testing goodwill for impairment. The enhanced guidance provides an entity the option to first perform a qualitative assessment of whether a reporting unit’s fair value is more likely than not less than its carrying value, including goodwill. In performing its qualitative assessment, an entity considers the extent to which adverse events or circumstances identified, such as changes in economic conditions, industry and market conditions or entity specific events, could affect the comparison of the reporting unit’s fair value with its carrying amount. If an entity concludes that the fair value of a reporting unit is more likely than not less than its carrying amount, the entity is required to perform the currently prescribed two-step goodwill impairment test to identify potential goodwill impairment and, accordingly, measure the amount, if any, of goodwill impairment loss to be recognized for that reporting unit. The guidance was effective for the Company as of January 1, 2012. The Company did not utilize this option and assessed goodwill using the two-step process when performing its annual impairment assessment in 2012. The first step is a comparison of the fair value of a reporting unit with its carrying amount, including goodwill. If the fair value of the reporting unit exceeds its carrying value, goodwill of the reporting unit is not considered impaired and the second step is unnecessary. If the carrying value of the reporting unit exceeds its fair value, a second step is performed to measure the amount of impairment by comparing the carrying amount of the goodwill to a determination of the implied fair value of the goodwill. If the carrying amount of the goodwill is greater than the implied value, an impairment loss is recognized for the difference. The implied value of the goodwill is determined as of the test date by performing a purchase price allocation, as if the reporting unit had just been acquired, using currently estimated fair values of the individual assets and liabilities of the reporting unit, together with an estimate of the fair value of the reporting unit taken as a whole. The estimate of the fair value of the reporting unit is based upon information available regarding prices of similar groups of assets, or other valuation techniques including present value techniques based upon estimates of future cash flows. The Company has one reporting unit at December 31, 2012, 2011 2010 and 2009.2010. No goodwill impairment charges were recorded during the years ended December 31, 2012, 2011 and 2010. As discussed in Notes 7 and 8, goodwill and intangible assets related to During 2011, the acquisition of LGI were determined to be impaired as ofCompany changed its annual impairment test date from December 31 2009.to October 1, effective October 1, 2011. The change was made in anticipation of the Company having a requirement to issue its annual financial statements on an accelerated basis as compared to prior years. The change had no impact on the Company’s results of operations or any other financial statement line item. Identifiable finite-lived intangible assets are amortized over their estimated useful lives ranging from 3 to 20 years. The method of amortization is based on the pattern over which the economic benefits, generally expected undiscounted cash flows, of the intangible asset are consumed. Intangible assets for which no pattern can be reliably determined are amortized using the straight-line method. Intangible assets consist primarily of the contractual right to future management, advisory and performance fees from customer contracts or relationships. Long-lived Assets Long-lived assets of the Company are reviewed for impairment whenever events or changes in circumstances indicate that the net carrying amount of the asset may not be recoverable. In connection with such review, the Company also re-evaluates the periods of depreciation and amortization for these assets. Recoverability of assets to be held and used is measured by a comparison of the carrying amount of an asset to undiscounted future net cash flows expected to be generated by the asset. If such assets are considered to be impaired, the impairment to be recognized is measured by the amount by which the carrying amount of the assets exceeds their fair value. Initial Public Offering Costs During 2012, the Company incurred $2,816 of professional fees and other costs associated with its planned initial public offering. These costs are included in general, administrative and other in the Consolidated Statement of Operations. These costs were expensed upon the withdrawal of the Company’s registration statement in November 2012. Derivative Instruments Derivative instruments are recorded at fair value as either assets or liabilities in the Company’s consolidated balance sheet. The Company’s derivatives are not designated as hedging instruments and are used as “economic hedges” to manage certain risks in the Company’s business. As a result of the use of derivative instruments, the Company is exposed to the risk that counterparties to derivative contracts will fail to meet their contractual obligations. The Company does not hold collateral or other security from its counterparties supporting its derivative instruments. In addition, there are no netting arrangements in place with the counterparties. To mitigate the counterparty credit risk, the Company has a policy of entering into contracts only with carefully selected major financial institutions based upon their credit ratings and other factors. The Company records the changes in fair value of derivative instruments in “Other income (expenses)”, net” in the consolidated statement of operations. The Company does not purchase, hold or sell derivative financial instruments for trading and speculative purposes. Partner Distributions Partner incentive allocations, which are determined by the general partner and approved by a vote of the partners, can be formula based or discretionary. Incentive allocations are considered distributions of net income as stipulated by Silvercrest’s Amended and Restated Limited Partnership Agreement and are recognized in the period in which they are paid. In the event there is insufficient distributable cash flow to make incentive distributions, the general partner in its sole and absolute discretion may determine not to make any distributions called for under the partnership agreement. The remaining net income or loss after partner incentive allocations is generally allocated to the partners based on their pro rata ownership. Redeemable Partnership Units Redeemable partnership units in our Company consist of units issued to our founders and those purchased by certain of our employees. These capital units entitle the holder to a share of the distributions of our Company. Units are subject to certain redemption features. Upon the termination of employment of the Terminated Employee, as defined, the Company has a right to call the Units.units. In addition, the terminated employee has a right to put the Unitsunits to the Company upon termination or death, provided the terminated employee has complied with certain restrictions as described in the partnership agreement. In accordance with the provisions of our partnership and operating agreements, the put described above expires with the consummation of an IPO or Sale Transaction, as defined in our partnership and operating agreements. As the units are redeemable at the option of the holder and are not mandatorily redeemable, the redeemable partnership units have be classified outside of permanent partner’s capital. The units are adjusted to their current redemption value at the end of each reporting period with the increase or decrease in redemption value being charged to excess of liabilities, redeemable partners’ capital and partner’s capital over assets. The Company also makes distributions to its partners of various nature including incentive payments, profit distributions and tax distributions. Revenue Recognition Revenue is recognized ratably over the period in which services are performed. Revenue consists primarily of investment advisory fees, family office services fees and fund management fees. Investment advisory fees are typically billed quarterly in advance afterat the beginning of the quarter or in arrears after the end of the quarter, based on a contractually specified percentage of the assets managed. For investment advisory fees billed in advance, the value of assets managed is determined based on the value of the customer’s account as of the last trading day of the preceding quarter. For investment advisory fees billed in arrears the value of assets managed is determined based on the value of the customer’s account on the last day of the quarter being billed. Family office services fees are typically billed quarterly in advance afterat the beginning of the quarter or in arrears after the end of the quarter based on a contractual percentage of the assets managed or based on a fixed fee arrangement. Management fees from proprietary and non-proprietary funds isare calculated as a percentage of net asset values measured at the beginning of a month or quarter or at the end of a quarter, depending on the fund. The Company accounts for performance based revenue in accordance with ASC 605-20-S99, “Accounting for Management Fees Based on a Formula”, by recognizing performance fees and allocations as revenue only when it is certain that the fee income is earned and payable pursuant to the relevant agreements, and no contingencies remain. Performance fee contingencies are typically resolved at the end of each annual period. In certain arrangements, the Company is only entitled to receive performance fees and allocations when the return on assets under management exceeds certain benchmark returns or other performance targets. The Company records performance fees and allocations as a component of revenue. Equity-Based Compensation Equity-based compensation cost relating to the issuance of share-based awards to partners is based on the fair value of the award at the date of grant, which is expensed ratably over the requisite service period, net of estimated forfeitures. The forfeiture assumption is ultimately adjusted to the actual forfeiture rate. Therefore, changes in the forfeiture assumptions may affect the timing of the total amount of expense recognized over the vesting period. The service period is the period over which the employee performs the related services, which is normally the same as the vesting period. Equity-based awards that do not require future service are expensed immediately. Equity-based awards that have the potential to be settled in cash at the election of the employee or which relate to redeemable partnership units are classified as liabilities (“Liability Awards”) and are adjusted to fair value at the end of each reporting period. Distributions associated with Liability Awards not expected to vest are accounted for as part of compensation expense in the Consolidated Statement of Operations. Leases The Company expenses the net lease payments associated with operating leases on a straight-line basis over the respective leases’ term including any rent-free periods. Leasehold improvements are recorded at cost and are depreciated using the straight-line method over the lesser of the estimated useful lives of the improvements (generally 10 years) or the remaining lease term. Income Taxes Silvercrest is not subject to federal and state income taxes, since all income, gains and losses are passed through to its partners. Silvercrest is subject to New York City unincorporated business tax. SFS is subject to federal and state corporate income tax, which requires an asset and liability approach to the financial accounting and reporting of income taxes. With respect to the Company’s incorporated entity, the annual tax rate is based on the income, statutory tax rates and tax planning opportunities available in the various jurisdictions in which the Company operates. Tax laws are complex and subject to different interpretations by the taxpayer and respective governmental taxing authorities. Judgment is required in determining the tax expense and in evaluating tax positions. The tax effects of an uncertain tax position (“UTP”) taken or expected to be taken in income tax returns are recognized only if it is “more likely-than-not” to be sustained on examination by the taxing authorities, based on its technical merits as of the reporting date. The tax benefits recognized in the financial statements from such a position are measured based on the largest benefit that has a greater than fifty percent likelihood of being realized upon ultimate settlement. The Company recognizes estimated accrued interest and penalties related to UTPs in income tax expense. The Company recognizes the benefit of a UTP in the period when it is effectively settled. Previously recognized tax positions are derecognized in the first period in which it is no longer more likely than not that the tax position would be sustained upon examination. Recent Accounting Developments In January 2010, the FASB issued Accounting Standards Update (“ASU”) 2010-06, “Improving Disclosures About Fair Value Measurements” (“ASU 2010-06”). ASU 2010-06 requires disclosing separately the amount of significant transfers in and out of the Level I and Level II categories and the reasons for the transfers and it requires that Level III purchases, sales, issuances and settlements activity be reported on a gross rather than a net basis. ASU 2010-06 also requires fair value measurement disclosures for each class of assets and liabilities and disclosures about valuation techniques and inputs used to measure fair value for both recurring and nonrecurring fair value measurements for Level II and Level III measurements. These disclosures were effective for the Company as of January 1, 2010, except for the Level III gross reporting which was effective for the Company January 1, 2011. The adoption of ASU 2010-06 did not have a material impact on the Company’s consolidated financial statements.
In July 2010, the FASB issued ASU 2010-20, “Disclosures about the Credit Quality of Financing Receivables and the Allowance for Credit Losses” (“ASU 2010-20”). ASU 2010-20 requires additional disclosures about the credit quality of financing receivables and the allowance for credit losses. The purpose of the additional disclosures is to enable users of financial statements to better understand the nature of credit risk inherent in an entity’s portfolio of financing receivables and how that risk is analyzed. The new disclosures were effective for the Company January 1, 2011. The adoption of this guidance did not have a material impact on the Company’s consolidated financial statements.
In December 2010, the FASB issued ASU 2010-28, “Intangibles – Goodwill and Other (Topic 350) When to Perform Step Two of the Goodwill Impairment Test for Reporting Units with Zero or Negative Carrying Amounts”, which enhanced guidance on when to perform step two of the goodwill impairment test for reporting units with zero or negative carrying amounts. The updated guidance modifies existing requirements under step one of the goodwill impairment test for reporting units with zero or negative carrying amounts and requires step two to be performed if it is more likely than not that a goodwill impairment exists. This guidance was effective for the Company January 1, 2011. As the Company’s reporting unit does not currently have a zero or negative carrying value, the adoption of this guidance did not have any impact on the Company’s financial statements.
In May 2011, the FASB issued ASU 2011-04, “Fair Value Measurement (Topic 820): Amendments to Achieve Common Fair Value Measurement and Disclosure Requirements in GAAP and International Financial Reporting Standards (“IFRS”)”, which amended guidance on fair value measurements to achieve common fair value measurement and disclosure requirements in GAAP and IFRS. The amended guidance specifies that the concepts of highest and best use and valuation premise in a fair value measurement are relevant only when measuring the fair value of nonfinancial assets and are not relevant when measuring the fair value of financial assets or of liabilities. The amendments include requirements specific to measuring the fair value of those instruments, such as equity interests used as consideration in a business combination. An entity should measure the fair value of its own equity instrument from the perspective of a market participant that holds the instrument as an asset. With respect to financial instruments that are managed as part of a portfolio, an exception to fair value requirements is provided. That exception permits a reporting entity to measure the fair value of such financial assets and financial liabilities at the price that would be received to sell a net asset position for a particular risk or to transfer a net liability position for a particular risk in an orderly transaction between market participants at the measurement date. The amendments also clarify that premiums and discounts should only be applied if market participants would do so when pricing the asset or liability. Premiums and discounts related to the size of an entity’s holding (e.g., a blockage factor) rather than as a characteristic of the asset or liability (e.g., a control premium) is not permitted in a fair value measurement. The guidance also requires enhanced disclosures about fair value measurements, including, among other things, (a) for fair value measurements categorized within Level III of the fair value hierarchy, (1) a quantitative disclosure of the unobservable inputs and assumptions used in the measurement, (2) the valuation process used by the reporting entity, and (3) a narrative description of the sensitivity of the fair value measurement to changes in unobservable inputs and the interrelationships between those unobservable inputs, if any, and (b) the categorization by level of the fair value hierarchy for items that are not measured at fair value in the statement of financial position but for which the fair value is required to be disclosed (for example, a financial instrument that is measured at amortized cost in the statement of financial position but for which fair value is disclosed). The guidance also amends disclosure requirements for significant transfers between Level I and Level II and now requires disclosure of all transfers between Levels I and II in the fair value hierarchy. The amended guidance iswas effective for interimthe Company on January 1, 2012 and annual periods beginning after December 15, 2011. As the impact of the guidance is primarily limited to enhanced disclosures, adoption isdid not expected to have a material impact on the Company’s consolidated financial statements. In September 2011, the FASB issued ASU 2011-08, “Testing Goodwill for Impairment”, which provided new accounting guidance on testing goodwill for impairment. The enhanced guidance provides an entity the option to first perform a qualitative assessment of whether a reporting unit's fair value is more likely than not less than its carrying value, including goodwill. In performing its qualitative assessment, an entity considers the extent to which adverse events or circumstances identified, such as changes in economic conditions, industry and market conditions or entity specific events, could affect the comparison of the reporting unit's fair value with its carrying amount. If an entity concludes that the fair value of a reporting unit is more likely than not less than its carrying amount, the entity is required to perform the currently prescribed two-step goodwill impairment test to identify potential goodwill impairment and, accordingly, measure the amount, if any, of goodwill impairment loss to be recognized for that reporting unit. The guidance is effective for the Company for interim and annual periods commencing January 1, 2012. Early adoption is permitted. The Company will consider this guidance when performing its annual impairment assessment in 2012.
3. ACQUISITIONMilbank:
On November 1, 2011, the Company acquired certain assets of Milbank, a registered investment advisor that oversees approximately $500 million of assets primarily on behalf of high-net-worth families. The strategic acquisition of Milbank, a long-standing and highly regarded investment boutique, strengthens the Company’s presence in the New York market and the Company obtains investment managers that have significant experience and knowledge of the industry. Milbank’s clients will gain access to the Company’s complete investment management, wealth planning and reporting capabilities, including proprietary value equity and fixed income disciplines and alternative investment advisory services. Under the terms of the Asset Purchase Agreement, the Company paid cash consideration of $3,357 (net of cash acquired of $813), issued units of the Company with a fair value of $3,105, and issued a promissory note to Milbank for $3,181. The promissory note bears interest at a rate of 5% per annum and is payable in four annual installments (see Note 9). The purchase price allocation includes an estimate of the fair value of the 19,757 units issued to the former owners of Milbank which was determined by calculating a per unit limited partnership interest fair value in the Company utilizing both discounted cash flow and guideline company valuation methodologies. Furthermore, as part of the Asset Purchase Agreement, the Company is obligated to make future earnout payments to Milbank. The Company determined that the acquisition-date fair value of the contingent consideration was $1,726 based on the likelihood that the financial and performance targets will be achieved. Under the terms of the Asset Purchase Agreement, Milbank is entitled to receive six earnout payments. The earnout periods are as follows: November 1, 2011 through December 31, 2011, full calendar years 2012, 2013, 2014 and 2015, and January 1, 2016 through October 31, 2016. Each earnout payment is equal to 20% of annual EBITDA, as defined in the Asset Purchase Agreement. There is no required EBITDA milestone that needs to be achieved in order for an earnout payment to be made. The amount of the earnout payments will vary depending on the level of EBITDA that is generated in each respective earnout period. As the acquisition was completed after January 1, 2009, the estimated fair value of contingent consideration is recognized at the date of acquisition, and adjusted for changes in facts and circumstances until the ultimate resolution of the contingency. Changes in the fair value of contingent consideration are reflected in the Consolidated Statement of Operations. The fair value of the contingent consideration was based on discounted cash flow models using projected EBITDA for each earnout period. The discount rate applied to the to the projected EBITDA was determined based on the weighted average cost of capital for the Company and took into account that the overall risk associated with the payments was similar to the overall risks of the Company as there is no target, floor or cap associated the contingent payments. A fair value adjustment of $42 was recorded at December 31, 2012, and is included in general, administrative and other expenses in the Consolidated Statement of Operations for the year ended December 31, 2012. The Company has a liability of $1,609 related to Milbank included in accounts payable and accrued expenses in the Consolidated Statement of Financial Condition as of December 31, 2012 for contingent consideration. During 2011, the Company incurred $222 in costs related to the acquisition of Milbank, and has included these in general, administrative and other in the Consolidated Statement of Operations. | Shares issued | | $ | 3,105 | | | Units issued | | | $ | 3,105 | | Note payable due to Milbank | | | 3,181 | | | | 3,181 | | Cash paid on date of acquisition | | | 4,170 | | | | 4,170 | | Contingent consideration | | | 1,726 | | | | 1,726 | | | | | | | | | Total purchase consideration | | $ | 12,182 | | | $ | 12,182 | | | | | | | | |
The following table summarizes the final amounts allocated to the acquired assets and assumed liabilities. The excess of the purchase price over the fair values of assets acquired and liabilities assumed was allocated to goodwill and intangible assets. | | | | | Cash | | $ | 813 | | Prepaid expenses | | | 57 | | Furniture and equipment | | | 20 | | Deferred revenue | | | (871 | ) | Net deferred tax liability | | | (107 | ) | Capital lease | | | (17 | ) | | | | | | Total fair value of net tangible assets acquired | | | (105 | ) | Goodwill | | | 3,271 | | Customer relationships (20 years) | | | 8,200 | | Non-compete agreements (3-5 years) | | | 816 | | | | | | | Total purchase consideration | | $ | 12,182 | | | | | | |
The Company believes the recorded goodwill is supported by the anticipated revenues and expected synergies of integrating the operations of Milbank into the Company. Furthermore, there are expected synergies with respect to compensation and benefits and general and administrative costs. The goodwill that is expected to be deductible for tax purposes is goodwill that originates from contingent consideration. Commodity Advisors: On April 1, 2012, the Company acquired Commodity Advisors. Commodity Advisors is the general partner of MW Commodity Strategies, L.P. (the “MW Commodity Fund LLC”), a fund whose investment objective is to seek superior risk adjusted returns through strategic, sector-based investments with commodity and macro trading investment managers. The acquisition of Commodity Advisors adds another strategy to the Company’s investment management, wealth planning and reporting capabilities, including proprietary value equity and fixed income disciplines and alternative investment advisory services. On April 1, 2012, the Company, in exchange for the member interests of Commodity Advisors, issued 631 and 6 units of Silvercrest L.P. and Silvercrest GP LLC, respectively, at closing, with a fair value of $132. Furthermore, the Company is obligated to make quarterly contingent payments if incremental income, as defined in the purchase agreement, exceeds various thresholds. As these contingent payments are tied to the continued employment by the Company of the former member of Commodity Advisors, they will be considered compensation expense in the period in which such contingent payments are earned. The Company is obligated to make a future one-time earnout payment in units equal to the difference between $800 and the redemption value of the units issued at closing, if incremental revenue, as defined, reaches an amount equal to $400 prior to March 31, 2014. | | | | | Units issued | | $ | 132 | | Call rights option issued | | | 15 | | | | | | | Total purchase consideration | | $ | 147 | | | | | | |
The following table summarizes the final amounts allocated to the acquired assets and assumed liabilities. The excess of the purchase price over the fair values of assets acquired and liabilities assumed was allocated to goodwill and intangible assets. | | | | | Receivables | | $ | 7 | | Liabilities | | | (7 | ) | | | | | | Total fair value of net tangible assets acquired | | | — | | Goodwill | | | 147 | | | | | | | Total purchase consideration | | $ | 147 | | | | | | |
The pro forma information below represents consolidated results of operations as if the acquisitionacquisitions of Milbank occurred on January 1, 2010.2010 and January 1, 2011 and the acquisition of Commodity Advisors occurred on January 1, 2011 and on January 1, 2012. The pro forma information has been included for comparative purposes and is not indicative of results of operations of the consolidated Company had the acquisitionacquisitions occurred as of January 1, 2012, 2011 and 2010, nor is it necessarily indicative of future results. | | | | Pro Forma
Twelve Months
Ended
December 31,
2011 | | | Pro Forma
Twelve Months
Ended
December 31,
2010 | | | Pro Forma
Twelve Months
Ended
December 31,
2012 | | | Pro Forma
Twelve Months
Ended
December 31,
2011 | | | Pro Forma
Twelve Months
Ended
December 31,
2010 | | Total Revenue | | $ | 47,522 | | | $ | 41,617 | | | $ | 51,728 | | | $ | 47,680 | | | $ | 41,617 | | Net Income | | $ | 15,896 | | | $ | 12,122 | | | $ | 19,748 | | | $ | 16,013 | | | $ | 12,122 | |
Milbank revenue and income before provision for income taxes for the two months ended December 31, 2011 that are included in the Consolidated Statement of Operations are $871 and $367, respectively. 4. INVESTMENTS AND FAIR VALUE MEASUREMENTSCommodity Advisors revenue and income before provision for income taxes for the nine months ended December 31, 2012 that are included in the Consolidated Statement of Operations are $74 and $43, respectively.
| 4. | INVESTMENTS AND FAIR VALUE MEASUREMENTS |
Investments include $1,968, $1,034, $1,316 and $349$1,316 as of December 31, 2012, 2011 2010 and 2009,2010, respectively, representing the Company’s equity method investments in affiliated investment funds which have been established and managed by the Company and its affiliates. The Company’s financial interest in these funds can range up to 2%. Despite the Company’s insignificant financial interest, the Company exerts significant influence over these funds as the Company typically serves as the general partner, managing member or equivalent for these funds. During 2007, the Silvercrest Funds granted rights to the unaffiliated investors in each respective fund to provide that a simple majority of the fund’s unaffiliated investors will have the right, without cause, to remove the general partner or equivalent of that fund or to accelerate the liquidation date of that fund in accordance with certain procedures. At December 31, 2012, 2011 2010 and 2009,2010, the Company determined none of the Silvercrest Funds were required to be consolidated. The Company’s involvement with these entities began on the dates that they were formed, which rangesrange from July 2003 to July 2008. Summarized financial information for investments accounted for under the equity method as of and for the years ended December 31, 2012, 2011 2010 and 20092010 are as follows: | | | | As of and for the Years Ended | | | | | | | | | | | | | | December 31, | | | | | | As of and for the Years Ended
December 31, | | | | | 2011 | | | 2010 | | | 2009 | | | 2012 | | | 2011 | | | 2010 | | Total assets | | $ | 257,349 | | | $ | 266,979 | | | $ | 268,770 | | | $ | 273,797 | | | $ | 257,349 | | | $ | 266,979 | | | | | | | | | | | | | | | | | | | | | Total liabilities | | $ | 20,412 | | | $ | 1,712 | | | $ | 7,385 | | | $ | 2,962 | | | $ | 20,412 | | | $ | 1,712 | | | | | | | | | | | | | | | | | | | | | Income | | $ | 17,398 | | | $ | 18,771 | | | $ | 19,433 | | | $ | 16,627 | | | $ | 17,398 | | | $ | 18,771 | | Operating expenses | | | 2,161 | | | | 2,236 | | | | 2,045 | | | | 2,342 | | | | 2,161 | | | | 2,236 | | Realized and unrealized gain (loss) on investments | | | 5,675 | | | | 6,533 | | | | 49,415 | | | Realized and unrealized net gain on investments | | | | 17,461 | | | | 5,675 | | | | 6,533 | | | | | | | | | | | | | | | | | | | | | Net increase in members capital resulting from operations | | $ | 20,913 | | | $ | 23,068 | | | $ | 66,802 | | | $ | 31,747 | | | $ | 20,913 | | | $ | 23,068 | | | | | | | | | | | | | | | | | | | | |
In 2011, the Company entered into derivative contracts that were not designated as accounting hedges. The fair value of these derivative assets is recorded within Investments in the 2011 Consolidated Statement of Financial Condition. The Company entered into these derivative instruments in order to mitigate the risk of any exposure during the fourth quarter between the values of certain investor redemptions and the actual proceeds received by one of our funds when the underlying securities to these redemptions were sold. As of December 31, 2011, Investments include put options with notional and fair values of $795 and $94, respectively. For the year ended December 31, 2011, realized gains and (losses) for options and other derivative contracts were $2 and ($81), respectively. The net change in unrealized gains and (losses) on the put options was ($13) for the year ended December 31, 2011. As of December 31, 2012, all derivative contracts had been settled. For the twelve months ended December 31, 2012, realized gains for put options and other derivative contracts were $8 and realized (losses) were ($17). Fair Value Measurements U.S. generally accepted accounting principles (“GAAP”) establishes a hierarchal disclosure framework which prioritizes and ranks the level of market price observability used in measuring investments at fair value. Market price observability is affected by a number of factors, including the type of investment, the characteristics specific to the investment and the state of the marketplace including the existence and transparency of transactions between market participants. Investments with readily available active quoted prices or for which fair value can be measured from actively quoted prices in an orderly market generally will have a higher degree of market price observability and a lesser degree of judgment used in measuring fair value. Investments measured and reported at fair value are classified and disclosed in one of the following categories. Level I: Quoted prices are available in active markets for identical investments as of the reporting date. The type of investments in Level I include listed equities and listed derivatives. Level II: Pricing inputs are other than quoted prices in active markets, which are either directly or indirectly observable as of the reporting date, and fair value is determined through the use of models or other valuation methodologies. Investments which are generally included in Level II include corporate bonds and loans, less liquid and restricted equity securities, certain over-the counter derivatives, and certain fund of hedge funds investments in which the Company has the ability to redeem its investment at net asset value at, or within three months of, the reporting date. | certain fund of hedge funds investments in which the Company has the ability to redeem its investment at net asset value at, or within three months of, the reporting date.
|
Level III: Pricing inputs are unobservable for the investment and includes situations where there is little, if any, market activity for the investment. The inputs into the determination of fair value require significant management judgment or estimation. Investments that are included in Level III generally include general and limited partnership interests in private equity and real estate funds, credit-oriented funds, certain over-the counter derivatives, funds of hedge funds which use net asset value per share to determine fair value in which the Company may not have the ability to redeem its investment at net asset value at, or within three months of, the reporting date, distressed debt and non-investment grade residual interests in securitizations and collateralized debt obligations. In certain cases, the inputs used to measure fair value may fall into different levels of the fair value hierarchy. In such cases, the determination of which category within the fair value hierarchy is appropriate for any given investment is based on the lowest level of input that is significant to the fair value measurement. The Company’s assessment of the significance of a particular input to the fair value measurement in its entirety requires judgment and considers factors specific to the investment. The following table summarizes the valuation of the Company’s financial assets by the fair value hierarchy as of December 31, 2011:2012: | | | | Level I | | | Level II | | | Level III | | | Total | | | Level I | | | Level II | | | Level III | | | Total | | Assets | | | | | | | | | | | | | | | | | Cash equivalents - Money Market Funds | | $ | 1,037 | | | $ | — | | | $ | — | | | $ | 1,037 | | | $ | 1,020 | | | $ | — | | | $ | — | | | $ | 1,020 | | Free Standing Derivatives - Put Options | | | 94 | | | | — | | | | — | | | | 94 | | | | | | | | | | | | | | | | | | | | | | | | | | | | | | $ | 1,131 | | | $ | — | | | $ | — | | | $ | 1,131 | | | | | | | | | | | | | | | | |
The following table summarizes the valuation of the Company’s financial assets by the fair value hierarchy as of December 31, 2010:2011: | | | | Level I | | | Level II | | | Level III | | | Total | | | Level I | | | Level II | | | Level III | | | Total | | Assets | | | | | | | | | | | | | | | | | Cash equivalents - Money Market Funds | | $ | 1,034 | | | $ | — | | | $ | — | | | $ | 1,034 | | | $ | 1,037 | | | $ | — | | | $ | — | | | $ | 1,037 | | Free Standing Derivatives - Put Options | | | | 94 | | | | — | | | | — | | | | 94 | | | | | | | | | | | | | | | | | | | | | | | | | | | | | | $ | 1,131 | | | $ | — | | | $ | — | | | $ | 1,131 | | | | | | | | | | | | | | | |
5. RECEIVABLES, NET
At December 31, 2012 and 2011, financial instruments that are not held at fair value are categorized in the table below: | | | | | | | | | | | | | | | | | | | | | | 2012 | | | 2011 | | | Fair Value
Hierarchy | | | | Carrying
Amount | | | Fair
Value | | | Carrying
Amount | | | Fair
Value | | | Financial Assets: | | | | | | | | | | | | | | | | | | | Cash | | $ | 12,392 | | | $ | 12,392 | | | $ | 6,317 | | | $ | 6,317 | | | | Restricted Certificates of Deposit and Escrow | | $ | 1,020 | | | $ | 1,020 | | | $ | 1,130 | | | $ | 1,130 | | | Level 1(1) | | | | | | | Financial liabilities: | | | | | | | | | | | | | | | | | | | Notes Payable | | $ | 3,315 | | | $ | 3,315 | | | $ | 4,809 | | | $ | 4,809 | | | Level 2(2) |
| (1) | Restricted certificates of deposit and escrow consists of money market funds that are carried at either cost or amortized cost that approximates fair value due to their short-term maturities. The money market funds are valued through the use of quoted market prices, or $1.00, which is generally the NAV of the funds. |
| (2) | The carrying value of notes payable approximates fair value, which is determined based on interest rates currently available to the Company for similar debt. |
The following is a summary of receivables as of December 31, 20112012 and 2010:2011: | | | | 2011 | | 2010 | | | 2012 | | 2011 | | Management and advisory fees receivable | | $ | 1,433 | | | $ | 1,442 | | | $ | 1,815 | | | $ | 1,433 | | Unbilled receivables | | | 1,134 | | | | 1,196 | | | | 1,787 | | | | 1,134 | | Other receivables | | | 57 | | | | 2 | | | | 435 | | | | 57 | | | | | | | | | | | | | | | Receivables | | | 2,624 | | | | 2,640 | | | | 4,037 | | | | 2,624 | | Allowance for doubtful receivables | | | (386 | ) | | | (393 | ) | | | (362 | ) | | | (386 | ) | | | | | | | | | | | | | | Receivables, net | | $ | 2,238 | | | $ | 2,247 | | | $ | 3,675 | | | $ | 2,238 | | | | | | | | | | | | | | |
6. FURNITURE, EQUIPMENT AND LEASEHOLD IMPROVEMENTS, NET
| 6. | FURNITURE, EQUIPMENT AND LEASEHOLD IMPROVEMENTS, NET |
The following is a summary of furniture, equipment and leasehold improvements, net as of December 31, 20112012 and 2010:2011: | | | | 2011 | | 2010 | | | 2012 | | 2011 | | Leasehold improvements | | $ | 3,466 | | | $ | 2,982 | | | $ | 3,557 | | | $ | 3,466 | | Furniture and equipment | | | 3,360 | | | | 3,190 | | | | 3,526 | | | | 3,360 | | Artwork | | | 338 | | | | 332 | | | | 338 | | | | 338 | | | | | | | | | | | | | | | Total cost | | | 7,164 | | | | 6,504 | | | | 7,421 | | | | 7,164 | | Accumulated depreciation and amortization | | | (4,889 | ) | | | (4,397 | ) | | | (5,360 | ) | | | (4,889 | ) | | | | | | | | | | | | | | Furniture, equipment and leasehold improvements, net | | $ | 2,275 | | | $ | 2,107 | | | $ | 2,061 | | | $ | 2,275 | | | | | | | | | | | | | | |
Depreciation expense for the years ended December 31, 2012, 2011 and 2010 was $471, $492, and 2009 was $492, $463, and $522, respectively. In 2009, the Company abandoned a portion of its unutilized space at 1330 Avenue of Americas and recorded a leasehold improvements impairment charge of $1,202, which was the net book value as of the date of abandonment.
In 2009, the Company dissolved LGI and wrote off all related fixed assets, totaling $43.
7. GOODWILL
The following is a summary of the changes to the carrying amount of goodwill as of December 31, 20112012 and 2010:2011: | | | | 2011 | | 2010 | | | 2012 | | 2011 | | January 1, | | | | | | | | | Gross balance | | $ | 28,408 | | | $ | 26,731 | | | $ | 32,098 | | | $ | 28,408 | | Accumulated impairment losses | | | (17,415 | ) | | | (17,415 | ) | | | (17,415 | ) | | | (17,415 | ) | | | | | | | | | | | | | | Net balance | | | 10,993 | | | | 9,316 | | | | 14,683 | | | | 10,993 | | Purchase price adjustments from earnouts | | | 419 | | | | 929 | | | | 1,061 | | | | 419 | | Acquisition of Milbank | | | 3,271 | | | | — | | | | — | | | | 3,271 | | Deferred tax liability adjustment | | | — | | | | 748 | | | Acquisition of Commodity Advisors | | | | 147 | | | | — | | December 31, | | | | | | | | | Gross balance | | | 32,098 | | | | 28,408 | | | | 33,436 | | | | 32,098 | | Accumulated impairment losses | | | (17,415 | ) | | | (17,415 | ) | | | (17,415 | ) | | | (17,415 | ) | | | | | | | | | | | | | | Net balance | | $ | 14,683 | | | $ | 10,993 | | | $ | 15,891 | | | $ | 14,683 | | | | | | | | | | | | | | |
8. INTANGIBLE ASSETS
The following is a summary of intangible assets as of December 31, 20112012 and 2010:2011: | | | | | Customer
Relationships | | Other
Intangible Assets | | Total | | Cost | | | | | | | | Balance, January 1, 2012 | | | $ | 15,910 | | | $ | 1,566 | | | $ | 17,476 | | | | | | | | | | | | | Balance, December 31, 2012 | | | | 15,910 | | | | 1,566 | | | | 17,476 | | Useful lives | | | | 15-20 years | | | | 3-5 years | | | | Accumulated amortization | | | | | | | | Balance, January 1, 2012 | | | | (3,144 | ) | | | (522 | ) | | | (3,666 | ) | Amortization expense | | | | (1,094 | ) | | | (353 | ) | | | (1,447 | ) | | | | | | | | | | | | Balance, December 31, 2012 | | | | (4,238 | ) | | | (875 | ) | | | (5,113 | ) | | | | | | | | | | | | Net book value | | | $ | 11,672 | | | $ | 691 | | | $ | 12,363 | | | | | Customer
Relationships | | Other
Intangible Assets | | Total | | | | | | | | | | | Cost | | | | | | | | | | | | | Balance, January 1, 2011 | | $ | 7,710 | | | $ | 750 | | | $ | 8,460 | | | $ | 7,710 | | | $ | 750 | | | $ | 8,460 | | Acquisition of certain assets of Milbank | | | 8,200 | | | | 816 | | | | 9,016 | | | | 8,200 | | | | 816 | | | | 9,016 | | | | | | | | | | | | | | | | | | | | | Balance, December 31, 2011 | | | 15,910 | | | | 1,566 | | | | 17,476 | | | | 15,910 | | | | 1,566 | | | | 17,476 | | Useful lives | | | 15-20 years | | | | 3-5 years | | | | | | 15-20 years | | | | 3-5 years | | | | Accumulated amortization | | | | | | | | | | | | | Balance, January 1, 2011 | | | (2,351 | ) | | | (338 | ) | | | (2,689 | ) | | | (2,351 | ) | | | (338 | ) | | | (2,689 | ) | Amortization expense | | | (793 | ) | | | (184 | ) | | | (977 | ) | | | (793 | ) | | | (184 | ) | | | (977 | ) | | | | | | | | | | | | | | | | | | | | Balance, December 31, 2011 | | | (3,144 | ) | | | (522 | ) | | | (3,666 | ) | | | (3,144 | ) | | | (522 | ) | | | (3,666 | ) | | | | | | | | | | | | | | | | | | | | Net book value | | $ | 12,766 | | | $ | 1,044 | | | $ | 13,810 | | | $ | 12,766 | | | $ | 1,044 | | | $ | 13,810 | | | | | | | | | | | | | | | | | | | | | Cost | | | | | | | | Balance, January 1, 2010 | | $ | 7,710 | | | $ | 750 | | | $ | 8,460 | | | | | | | | | | | | | | Balance, December 31, 2010 | | | 7,710 | | | | 750 | | | | 8,460 | | | Useful lives | | | 15-20 years | | | | 5 years | | | | | Accumulated amortization | | | | | | | | Balance, January 1, 2010 | | | (1,585 | ) | | | (188 | ) | | | (1,773 | ) | | Amortization expense | | | (766 | ) | | | (150 | ) | | | (916 | ) | | | | | | | | | | | | | Balance, December 31, 2010 | | | (2,351 | ) | | | (338 | ) | | | (2,689 | ) | | | | | | | | | | | | | Net book value | | $ | 5,359 | | | $ | 412 | | | $ | 5,771 | | | | | | | | | | | | | |
Amortization expense related to the intangible assets was $1,009$916 for the year ended December 31, 2009.2010. Amortization related to the Company’s finite life intangible assets is scheduled to be expensed over the next five years and thereafter as follows: | 2012 | | $ | 1,447 | | | 2013 | | | 1,370 | | | $ | 1,370 | | 2014 | | | 1,229 | | | | 1,229 | | 2015 | | | 1,100 | | | | 1,100 | | 2016 | | | 1,044 | | | | 1,044 | | 2017 | | | | 947 | | Thereafter | | | 7,620 | | | | 6,673 | | | | | | | | | Total | | $ | 13,810 | | | $ | 12,363 | | | | | | | | |
9. NOTES PAYABLE
The following is a summary of notes payable: | | | | December 31, 2011 | | | December 31, 2012 | | | | | Interest Rate | | Amount | | | Interest Rate | | Amount | | Principal on fixed rate notes | | | 5.0 | % | | $ | 3,181 | | | | 5.0 | % | | $ | 2,397 | | Variable rate notes issued for redemption of partners’ interest (see Note 16) | | | Prime plus 1 | % | | | 1,558 | | | Variable rate notes issued for redemption of partners’ interests (see Note 16) | | | | Prime plus 1 | % | | | 872 | | Interest payable | | | | | 70 | | | | | | 46 | | | | | | | | | | | | | Total, December 31, 2011 | | | | $ | 4,809 | | | Total, December 31, 2012 | | | | | $ | 3,315 | | | | | | | | | | | | |
| | | | December 31, 2010 | | | December 31, 2011 | | | | | Interest Rate | | Amount | | | Interest Rate | | Amount | | Principal on fixed rate notes | | | 2.38 | % | | $ | 450 | | | | 5.0 | % | | $ | 3,181 | | Variable rate notes issued for redemption of partners’ interest (see Note 16) | | | Prime plus 1 | % | | | 2,438 | | | | Prime plus 1 | % | | | 1,558 | | Interest payable | | | | | 69 | | | | | | 70 | | | | | | | | | | | | | Total, December 31, 2010 | | | | $ | 2,957 | | | Total, December 31, 2011 | | | | | $ | 4,809 | | | | | | | | | | | | |
The carrying value of notes payable approximates fair value. The fixed rate note, which is related to the Milbank acquisition, approximates fair value becausebased on interest rates currently available to the note, which was part of an arm’s length transaction, was executed on November 1, 2011.Company for similar debt. The variable rate notes are based on a multiple of the U.S. Prime Rate. Future principal amounts payable under the notes payable are as follows: | 2012 | | $ | 1,469 | | | 2013 | | | 1,556 | | | $ | 1,555 | | 2014 | | | 1,150 | | | | 1,150 | | 2015 | | | 564 | | | | 564 | | | | | | | | | Total | | $ | 4,739 | | | $ | 3,269 | | | | | | | | |
10. SETTLEMENT WITH FORMER SHAREHOLDERS OF THE LONGCHAMP GROUP, INC.
In settlement of a dispute between the Company and the sellers of LGI, on August 14, 2009, the parties agreed to release each other from all claims and obligations under the agreements between the parties, except for claims and obligations related to the termination of one of the sellers’ employment with LGI (the “2009 Settlement”). Furthermore, all agreements between the parties were terminated including the agreement under which LGI acted as the sub-advisor for the funds managed by LongChamp Advisors Limited and LongChamp Management International Limited. In addition, the Company agreed to sell to Virgil Limited various marks, including The LongChamp Group, Inc. name, designs and logos, goodwill of the business associated therewith, physical signage and domain names. Under the 2009 Settlement, the Company continues to own 100% of the LGI legal entity, which was renamed to SAM Alternative Solutions, Inc. in August 2009. As a result of the 2009 Settlement the Company recognized a gain on the extinguishment of debt in the amount of $3,934 and a gain on the sale of the LongChamp Group name, designs, logo and other intangibles (with no carrying value) of $1,470.
Primarily as a result of declining economic conditions and the redemption of various client accounts in 2009, all of the remaining goodwill and intangible assets from the acquisition of LGI, in the amount of $193 and $252, respectively, were impaired and written off in 2009. The SAM Alternative Solutions, Inc. legal entity was also dissolved in December 2009.
11. COMMITMENTS AND CONTINGENCIES
| 10. | COMMITMENTS AND CONTINGENCIES |
Lease Commitments The Company leases office space pursuant to operating leases that are subject to specific escalation clauses. Rent expense charged to operations for the years ended December 31, 2012, 2011 2010 and 20092010 amounted to $3,588, $3,304, $3,273 and $4,428,$3,273, respectively The Company received sub-lease income from subtenants forduring the years ended December 31, 2012, 2011 and 2010 of $764, $1,006, and 2009 of $1,006, $682, and $441, respectively. Therefore, for the years ended December 31, 2012, 2011 2010 and 2009,2010, net rent expense amounted to $2,824, $2,298, $2,591 and $3,987,$2,591, respectively, and is included in general, administrative and other expenses in the Consolidated Statement of Operations. During 2006, the Company entered into a lease agreement for office space for its headquarters. The lease commenced on January 1, 2007 and expires September 30, 2017. The lease is subject to escalation clauses and provides for rent free periods of 6 to 9 months and a leasehold improvement allowance of $1,538 provided the Company spends at least an additional $513 on improvements. The Company spent $3,284 on leasehold improvements and received $1,499 of the allowance during 2007; the remaining $39 of the allowance was received in 2008. As security for performance under the leases, the Company is required to maintain letters of credit in favor of the landlord totaling $2,023 that were reduced to $1,013 on August 31, 2010 and can be further reduced to $506 on August 31, 2014. The letter of credit is collateralized by a certificate of deposit in an equal amount. Future minimum lease payments and rentals under lease agreements which expire through 2017 are as follows: | | | | Minimum
Lease
Commitments | | | Non-cancellable
Subleases | | Minimum Net
Rentals | | | Minimum
Lease
Commitments | | | Non-cancellable
Subleases | | Minimum Net
Rentals | | 2012 | | $ | 3,448 | | | $ | (757 | ) | | $ | 2,691 | | | 2013 | | | 3,342 | | | | (724 | ) | | | 2,618 | | | $ | 3,675 | | | $ | (727 | ) | | $ | 2,948 | | 2014 | | | 3,345 | | | | (453 | ) | | | 2,892 | | | | 3,675 | | | | (444 | ) | | | 3,231 | | 2015 | | | 3,293 | | | | (473 | ) | | | 2,820 | | | | 3,632 | | | | (458 | ) | | | 3,174 | | 2016 | | | 3,239 | | | | (473 | ) | | | 2,766 | | | | 3,590 | | | | (458 | ) | | | 3,132 | | Thereafter | | | 2,429 | | | | (354 | ) | | | 2,075 | | | 2017 | | | | 2,780 | | | | (354 | ) | | | 2,426 | | | | | | | | | | | | | | | | | | | | | Total | | $ | 19,096 | | | $ | (3,234 | ) | | $ | 15,862 | | | $ | 17,352 | | | $ | (2,441 | ) | | $ | 14,911 | | | | | | | | | | | | | | | | | | | | |
In 2009, the Company formally abandoned a portion of its unutilized space at its headquarters and subleased the space through September 29, 2017. The Company has the right to cancel the sublease no earlier than September 1, 2011 under certain conditions which the Company does not expect to occur. The Company recorded a lease abandonment charge in 2009 in the amount of $1,154 (on a net present value basis). The balance of the related liability at January 1, 2011 and 2010 was $894, and $1,067, respectively, which was reduced by lease payments during 2011 and 2010 of $174, and $173, respectively, resulting in an ending balance at December 31, 2011 and 2010 of $720 and $894, respectively.$720. The liability is included in Deferred Rent on the Consolidated Statement of Financial Condition.Condition at December 31, 2011. This liability was further reduced by lease payments during the year ended December 31, 2012 of $58. On May 1, 2012, the Company reoccupied space at its headquarters that it had previously abandoned in 2009. As a result, the Company released the remaining abandonment-related liability of $662 and wrote off prepaid interest expense of $86, resulting in a net lease abandonment reversal of $576. This reversal was recorded in general and administrative expense in the consolidated statement of operations. In 2010, an escrow account was funded by a sub-tenant whose sub-lease with the Company commenced on January 1, 2011. Pursuant to the sub-lease, the tenant was required to deposit the first 16 months of rent into the escrow account totaling $452. The initial deposit was depleted as of April 2012, and an additional deposit of $99 was made by the sub-tenant. This account has been recorded as restricted certificates of deposit and escrow on the consolidated balance sheet.Consolidated Statement of Financial Condition. As of December 31, 2012 and 2011, the remaining balance in the escrow account was $114.$1 and $114, respectively. The Company recorded a loss on this sub-lease charge in 2011 of $150 (on a net present value basis). The related unamortized liability that was established in January 2011 was $247 and was reduced by lease payments during the year of $85, resulting in an ending balance at December 31, 2011 of $162. This liability was further reduced by lease payments during the twelve months ended December 31, 2012 of $85, resulting in an ending balance at December 31, 2012 of $77. This liability is included in Deferred Rentdeferred rent on the Consolidated Statement of Financial Condition. The Company has capital leases for certain office equipment. The principal balance of these leases was $55$33 and $9$55 as of December 31, 2012 and 2011, and 2010, respectively. Partners’ Interests and Options Granted
In April 2007, certain former investor members of SAMG LLC sold their membership interests in SAMG LLC to Vulcan Wealth Management Group LLC (“Vulcan”) which acquired an approximately 30% interest in SAMG LLC. In addition, Vulcan invested an additional $10,000 in SAMG LLC in 2007, for an approximately 8% interest, and SAMG LLC incurred $592 of capital issuance costs associated with the transaction that were charged against the proceeds.
In connection with the transaction described above, SAMG LLC granted the former investor members options to purchase 18,170 shares or 4% of members interests in SAMG LLC at a price of $0.275 per share increasing at
20% per annum to a maximum of $0.475 per share. The options vest on and are exercisable for a 30 day period beginning on the earlier of April 30, 2010, fifteen consecutive trading days after an initial public offering, or the date on which a sale of control is consummated. The options can only be settled by the physical delivery of shares to the investor members.
The Company used a Black-Scholes-Merton model to value the options and recorded the fair value of the options of $827 at grant date and the increase in the fair value of $104 from the date of grant until December 31, 2007 as a liability and corresponding expense in its consolidated financial statements. As of December 31, 2008, the fair value of the options had declined to $135 which resulted in a decrease to the liability and recognition of income in the Company’s consolidated financial statements. As of December 31, 2009, the combined fair value of the options had declined to $2 based on the Black-Scholes-Merton model, the option expired unexercised in May 2010.
Contingent Consideration In connection with its acquisition of MCG in October 2008, the Company entered into a contingent consideration agreement whereby the former members of MCG were entitled to contingent consideration equal to 22% of adjusted annual EBITDA for each of the five years subsequent to the date of acquisition. As the acquisition was completed prior to January 1, 2009, contingent consideration is recognized when the contingency is resolved pursuant to the authoritative guidance on business combinations in effect at the date of the closing of the acquisition. The contingent consideration related to the MCG acquisition is recorded on the date when the contingency is resolved. Contingent consideration payments of $720, $663 and $245 were made made during the three years ended December 31, 2012, 2011 and 2010 related to MCG and 2009 wereare reflected in investing activities in the consolidated statement of cash flows. Indemnification Agreement On October 13, 2011, Silvercrest Strategic Opportunities Fund (“SSOF”) entered into a $5,000,000 revolving credit agreement (the “SSOF Credit Agreement”) with Pershing LLC (“Pershing”). Simultaneously with the execution of the SSOF Credit Agreement, SAMG LLC, the investment advisor to SSOF, entered into an indemnification agreement (the “Indemnification Agreement”) with Pershing whereby SAMG LLC agreed to indemnify Pershing from claims arising out of the exercise by Pershing of any rights and remedies under the security agreement related to the obligations of SSOF under the SSOF Credit Agreement. The SSOF Credit Agreement matured and was repaid on January 15, 2012 and as of December 31, 2011, $3,224 inclusive of interest was outstanding on the revolving credit line. 12. PARTNERS’ INCENTIVE ALLOCATIONS AND ALLOCATION OF INCOME AND LOSSES
| 11. | PARTNERS’ INCENTIVE ALLOCATIONS AND ALLOCATION OF INCOME AND LOSSES |
Pursuant to Silvercrest’s Operating Agreement, as amended and restated, partner incentive allocations are treated as distributions of net income. The remaining net income or loss after partner incentive allocations is generally allocated to the partners based on their pro rata ownership. Net income allocation is subject to the recovery of the allocated losses of prior periods. Distributions of partner incentive allocations of net income for the years ended December 31, 2012, 2011 2010 and 20092010 amounted to $8,775, $5,073, $2,691 and $7,171,$2,691, respectively, and are included in excess of liabilities, redeemable partners’ capital and partners’ capital over assets in the Consolidated Statements of Financial Condition. 13. NOTES RECEIVABLE FROM PARTNERS
| 12. | NOTES RECEIVABLE FROM PARTNERS |
Partner contributions are made in cash, in the form of five or six year interest-bearing promissory notes and/or in the form of nine year interest-bearing limited recourse promissory notes. Limited recourse promissory notes were issued in January 2008, August 2009 and September 2009 with interest rates of 3.53%, 2.77% and 2.84%, respectively. The recourse limitation includes a stated percentage of the initial principal amount of the limited recourse note plus a stated percentage of the accreted principal amount as of the date upon which all amounts due are paid in full plus all costs and expenses required to be paid by the borrower and all amounts required to be paid pursuant to a pledge agreement associated with each note issued. Certain notes receivable are payable in annual installments and are collateralized by the Company’s shares that are purchased with the note. Notes receivable from partners are as follows: | | | | 2011 | | 2010 | | | 2012 | | 2011 | | Balance, January 1, | | $ | 6,125 | | | $ | 7,179 | | | $ | 6,024 | | | $ | 6,125 | | Repayment of notes | | | (1,083 | ) | | | (940 | ) | | | (2,864 | ) | | | (1,083 | ) | Forgiveness of notes receivable | | | (34 | ) | | | (508 | ) | | | — | | | | (34 | ) | Interest accrued and capitalized on notes receivable | | | 180 | | | | 207 | | | | 138 | | | | 180 | | New notes receivable issued to partners | | | 836 | | | | 187 | | | | 112 | | | | 836 | | | | | | | | | | | | | | | Balance, December 31, | | $ | 6,024 | | | $ | 6,125 | | | $ | 3,410 | | | $ | 6,024 | | | | | | | | | | | | | | |
Full recourse and limited recourse notes receivable from partners as of December 31, 2012 and 2011 are $1,953 and 2010 are $3,549 and $2,475$1,457 and $3,707, and $2,418, respectively. There is no allowance for credit losses on notes receivable from partners as of December 31, 20112012 and 2010.2011. During 2011 and 2010, the Company forgave $34 and $508, respectively, of notes receivable in connection with the termination of partners whose corresponding capital was forfeited. 14. RELATED PARTY TRANSACTIONS
| 13. | RELATED PARTY TRANSACTIONS |
During 2012, 2011 2010 and 2009,2010, the Company provided services to the domesticated Silvercrest Hedged Equity Fund LP (formed in 2011 and formerly Silvercrest Hedged Equity Fund), Silvercrest Hedged Equity Fund (International), Silvercrest Hedged Equity Fund Ltd (formed in 2011 and includes ERISA investors of Silvercrest Hedged Equity Fund LP), the domesticated Silvercrest Emerging Markets Fund LP (formed in 2011 and formerly Silvercrest Emerging Markets Fund), Silvercrest Emerging Markets Fund (International), Silvercrest Emerging Markets Fund Ltd (formed in 2011 and includes ERISA investors of Silvercrest Emerging Markets Fund LP), Silvercrest Market Neutral Fund (currently in liquidation), Silvercrest Market Neutral Fund (International) (currently in liquidation), Silvercrest Municipal Advantage Portfolio A LLC, Silvercrest Municipal Advantage Portfolio P LLC, the domesticated Silvercrest Strategic Opportunities Fund LP (formed in 2011 and formerly Silvercrest Strategic Opportunities Fund), and Silvercrest Strategic Opportunities Fund (International) (terminated in 2011). These entities operate as feeder funds investing through master-feeder structures except for Silvercrest Hedged Equity Fund LP, Silvercrest Hedged Equity Fund Ltd, Silvercrest Emerging Markets Fund LP, Silvercrest Emerging Markets Fund Ltd, and Silvercrest Strategic Opportunities Fund LP which operate and invest as stand-alone funds. Silvercrest also provides services for the Silvercrest Global Opportunities Fund, L.P. (currently in liquidation), Silvercrest Global Opportunities Fund (International), Ltd. (currently in liquidation), Silvercrest Capital Appreciation Fund LLC (currently in liquidation), Silvercrest International Equity Fund, L.P., Silvercrest Municipal Special Situations Fund LLC, Silvercrest Municipal Special Situations Fund II LLC, Silvercrest Select Growth Equity Fund, L.P., Silvercrest Global Partners, L.P., Silvercrest Small Cap, L.P. and Silvercrest Special Situations, L.P., and Silvercrest Commodity Strategies Fund, LP which operate and invest separately as stand-alone funds. Pursuant to agreements with the above entities, the Company provides investment advisory services and receives an annual management fee of 0% to 1.75% of assets under management and a performance fee or allocation of 0% to 10% of the above entities’ net appreciation over a high-water mark. For the years ended December 31, 2012, 2011 2010 and 2009,2010, the Company earned from the above activities management fee income, which is included in Management and advisory fees in the Consolidated Statement of Operations, of $8,484, $5,403, $4,890 and $5,377,$4,890, respectively, and performance fees and allocations of $2,615, $1,046, $1,379 and $96,$1,379, respectively, of which $1,901, $950, $1,241 and $0,$1,241, respectively, is included in equity income from investments and $714, $85, $138 and $96,$138, respectively, is included in performance fees in the Statement of Operations. As of December 31, 20112012 and 2010,2011, the Company was owed $2,043$1,622 and $1,255,$2,043, respectively, from its various funds. For the years ended December 31, 2012, 2011 2010 and 2009,2010, the Company earned advisory fees of $408, $427, $683 and $662,$683, respectively, from assets managed on behalf of certain of its partners. As of December 31, 20112012 and 2010,2011, the Company is owed approximately $19$17 and $10,$19, respectively, from certain of its partners. 15. INCOME TAXES
For the years ended December 31, 2012, 2011 2010 and 2009,2010, the current tax expense was $1,035, $841, $974 and $96,$974, respectively, and the deferred tax benefitexpense (benefit) for the years ended December 31, 2012, 2011 and 2010 was $22, ($275), and 2009 was $275, $317 and $417,($317), respectively, which resulted in an income tax provision (benefit) for the years ended December 31, 2012, 2011 and 2010 of $1,057, $566, and 2009 of $566, $657, and ($321), respectively, recognized in the Consolidated Statements of Operations. | | | | Year Ended December 31, | | | Year Ended December 31, | | | | | 2011 | | 2010 | | 2009 | | | 2012 | | 2011 | | 2010 | | Current Provision: | | | | | | | | Current (Benefit) Provision: | | | | | | | | Federal | | $ | 6 | | | $ | (9 | ) | | $ | 8 | | | $ | 6 | | | $ | 6 | | | $ | (9 | ) | State and local | | | 835 | | | | 983 | | | | 88 | | | | 1,029 | | | | 835 | | | | 983 | | | | | | | | | | | | | | | | | | | | | Total Current Provision | | | 841 | | | | 974 | | | | 96 | | | | 1,035 | | | | 841 | | | | 974 | | | | | | | | | | | | | | | | | | | | | Deferred (Benefit) Provision: | | | | | | | | | | | | | Federal | | | (281 | ) | | | (224 | ) | | | (152 | ) | | | (14 | ) | | | (281 | ) | | | (224 | ) | State and local | | | 6 | | | | (93 | ) | | | (265 | ) | | | 36 | | | | 6 | | | | (93 | ) | | | | | | | | | | | | | | | | | | | | Total Deferred Benefit | | | (275 | ) | | | (317 | ) | | | (417 | ) | | Total Deferred Provision (Benefit) | | | | 22 | | | | (275 | ) | | | (317 | ) | | | | | | | | | | | | | | | | | | | | Total Provision (Benefit) for Income Taxes | | $ | 566 | | | $ | 657 | | | $ | (321 | ) | | Total Provision for Income Taxes | | | $ | 1,057 | | | $ | 566 | | | $ | 657 | | | | | | | | | | | | | | | | | | | | |
Deferred taxes reflect the net tax effects of temporary differences between the carrying amounts of assets and liabilities for financial reporting purposes and their bases for income tax purposes. As of December 31, 20112012 and 2010,2011, the Company had a net deferred tax liability of $109$130 and $279,$109, respectively. Temporary differences giving rise to the net deferred tax liability include deferred tax assets associated with deferred rent offset by deferred tax liabilities, primarily intangible assets. The change from December 31, 2010 to December 31, 2011 is attributable primarily to the decrease in the projected tax rate applicable to the future operations of SFS offset by the long-term deferred tax liability established through acquisition accounting for the book over tax basis of acquired intangible assets. A summary of thedeferred tax effects of the temporary differences isassets and liabilities as follows: | | | | | | | | | | | | As of December 31, | | | | | 2012 | | | 2011 | | Deferred tax assets | | | | | | | | | Deferred rent | | $ | 112 | | | $ | 120 | | Equity-based compensation of partners | | | 32 | | | | 33 | | Other | | | 2 | | | | — | | | | | | | | | | | Total deferred tax assets | | $ | 146 | | | $ | 153 | | | | | | | | | | | Deferred tax liabilities | | | | | | | | | Intangible assets | | $ | 238 | | | $ | 251 | | Other | | | 38 | | | | 11 | | | | | | | | | | | Total deferred tax liabilities | | $ | 276 | | | $ | 262 | | | | | | | | | | | Net deferred tax liabilities | | $ | (130 | ) | | $ | (109 | ) | | | | | | | | | |
The following table reconciles the provision for income taxes to the U.S. Federal statutory tax rate: | | | | | | | | | | | | | | | | Year Ended December 31, | | | | | 2011 | | | 2010 | | | 2009 | | Statutory U.S. federal income tax rate | | | 35.00 | % | | | 35.00 | % | | | 35.00 | % | Income passed through to Partners | | | (35.00 | )% | | | (35.00 | )% | | | (35.00 | )% | State and local income taxes | | | 5.72 | % | | | 5.68 | % | | | -1.41 | % | Other | | | -1.99 | % | | | -0.02 | % | | | -2.72 | % | | | | | | | | | | | | | | Effective income tax rate | | | 3.73 | % | | | 5.66 | % | | | -4.14 | % |
| | | | | | | | | | | | | | | | Year Ended December 31, | | | | | 2012 | | | 2011 | | | 2010 | | Statutory U.S. federal income tax rate | | | 35.00 | % | | | 35.00 | % | | | 35.00 | % | Income passed through to Partners | | | (35.00 | )% | | | (35.00 | )% | | | (35.00 | )% | State and local income taxes | | | 5.26 | % | | | 5.72 | % | | | 5.68 | % | Other | | | -0.17 | % | | | -1.99 | % | | | -0.02 | % | | | | | | | | | | | | | | Effective income tax rate | | | 5.09 | % | | | 3.73 | % | | | 5.66 | % |
As of December 31, 2012 and 2011, the Company had a tax receivable of $2 resulting from amending the 2007 tax returns of a former corporate subsidiary in order to carry back net operating losses incurred during tax year 2009. As of December 31, 2011, the Company also had taxes payable of $356 and $318, respectively, primarily consisting of NYC UBT liability of $306.$354 and $306, respectively. The Company files U.S. Federal, state and local tax returns. The 2009, 2010, and 2011 tax years of the Company remain subject to examination by U.S. Federal and most state and local tax authorities. The guidance for accounting for uncertainty in income taxes prescribes a recognition threshold and a measurement attribute for the financial statement recognition and measurement of tax positions taken or expected to be taken in a tax return. For those benefits to be recognized, a tax position must be more likely than not to be sustained upon examination by taxing authorities. The amount recognized is measured as the largest amount of benefit that is greater than 50% likely of being realized upon ultimate settlement. As of December 31, 20112012 and 2010,2011, the Company does not have any material uncertain tax positions. 16. REDEEMABLE PARTNERSHIP UNITS
| 15. | REDEEMABLE PARTNERSHIP UNITS |
Upon the termination of employment, of the Terminated Employee, as defined, of the Company, the Company has a right to call the terminated employee’s partnership units. In addition, the terminated employee also has a right to put the partnership units back to the Company upon termination or death, provided the terminated employee has complied with certain restrictions as described in the partnership agreement. With respect to the two founders of the Company, their estate, heirs or other permitted related parties cannot require the Company to redeem their units prior to April 1, 2013. In accordance with the provisions of the Company’s partnership and operating agreements, the put described above expires with the consummation of an IPO or Sale Transaction, as defined in our partnership and operating agreements. The redemption value per share is based on a multiple of historical EBITDA, pursuant to the Company’s partnership agreement. Once units are called or put back to the Company, the redemption results in the issuance of a promissory note by the Company which is typically paid in installments over four years. The Company has recognized redeemable partners’ capital of $91,201$102,017 and $51,744$91,201 as of December 31, 20112012 and December 31, 2010,2011, respectively, which represents the amount of partners’ capital subject to both put and call rights. 17. EQUITY-BASED COMPENSATION
| 16. | EQUITY-BASED COMPENSATION |
Determining the appropriate fair value model and calculating the fair value of equity compensation awards requires the input of complex and subjective assumptions, including the expected life of the equity compensation awards and the stock price volatility. In addition, determining the appropriate amount of associated periodic expense requires management to estimate the amount of employee forfeitures and the likelihood of the achievement of certain performance targets. The assumptions used in calculating the fair value of equity compensation awards and the associated periodic expense represent management’s best estimates, but these estimates involve inherent uncertainties and the application of judgment. As a result, if factors change and the Company deems it necessary in the future to modify the assumptions it made or to use different assumptions, or if the quantity and nature of the Company’s equity-based compensation awards changes, then the amount of expense may need to be adjusted and future equity compensation expense could be materially different from what has been recorded in the current period. The Company has granted equity-based compensation awards to certain partners under the Company’s 2010, 2011 and 20112012 Deferred Equity programs (the “Equity Programs”). The Equity Programs allow for the granting of deferred equity units based in whole on the fair value of the Company’s units. These deferred equity units contain both service and performance requirements. Each grant includes a deferred equity unit (“Deferred Equity Unit”) and performance unit (“Performance Unit”) subject to various terms including terms of forfeiture and acceleration of vesting. Each 100 Deferred Equity Units represent the unsecured right to receive one unit of Silvercrest GP LLC and 99 units of Silvercrest L.P. The Deferred Equity Unit represents the unsecured right to receive one unit of the Company or the equivalent cash value of up to fifty percent (50%) (or such other percentage as may be determined by the Company’s Executive Committee) of the Company’s units issuable upon the vesting of any such Deferred Equity Units and the remaining fifty percent (50%) in units upon the vesting of any such Deferred Equity Units. Such cash amount is to be calculated using the redemption price of such units as of the applicable vesting date. The Performance Unit represents the unsecured right to receive one unit of the Company for every two units of the Company issuable upon the vesting of any such Deferred Equity Units. Twenty-five percent of the Deferred Equity Units shall vest on each of the first, second, third, and fourth anniversaries of the grant date until the Deferred Equity Units are fully vested. The Performance Units shall be subject to forfeiture and subject to the satisfaction of a predetermined performance target at the end of the four year vesting period. If the performance target is achieved, then the Performance Units shall vest at the end of the four year vesting period. The rights of the partners with respect to the Performance Units shall remain subject to forfeiture at all times prior to the date on which such rights become vested and will be forfeited if the performance target is not achieved. Distributions related to Deferred Equity Units that are paid to partners are charged to excess of liabilities, redeemable partners’ capital and partners’ capital over assets. Distributions related to the unvested portion of Deferred Equity Units that are assumed to be forfeited are recognized as additional compensation expense because these distributions are not required to be returned by partners to the Company upon forfeiture. The Company utilized both discounted cash flow and guideline company valuation methods to determine the grant date fair value of the Deferred Equity Units. The grant date fair values of Performance Units were determined by applying a performance probability factor to the Deferred Equity Unit Value. These methodologies included the use of third party data and discounts for lack of control and marketability. All Deferred Equity Units are considered to be liability awards and are adjusted to fair value at the end of each reporting period. For the years ended December 31, 2012, 2011 and 2010, the Company recorded compensation expense related to such units of $1,388, $1,060 and $669, respectively, of which $147, $128 and $123, respectively, relates to the Performance Units given that there is an explicit service period associated with the deferredDeferred Equity Units, and the likelihood that the performance target will be met is considered probable. Distributions include cash distributions paid on Liability Awards. Cash distributions paid on awards expected to be forfeited were $17, $20 and $9 for the years ended December 31, 2012, 2011 and 2010, respectively, and are part of total compensation expense for the years then ended. During the yearyears ended December 31, 2012 and 2011, $63 and $82, respectively, of vested Deferred Equity Units were settled in cash. As of December 31, 2012, 2011 and 2010, there was $1,428, $2,260 and $2,114, respectively, of estimated unrecognized compensation expense related to unvested awards. As of December 31, 2011 and 2010,2012, the unrecognized compensation expense related to unvested awards is expected to be recognized over a period of 2.65 and 3.17 years, respectively.2.16 years. A summary of thisthese equity grantgrants by the Company as of December 31, 2012, 2011 and 2010 during the periods then ended is presented below: | | | | Deferred Equity Units | | Performance Units | | | Deferred Equity Units | | Performance Units | | | | | Units | | Fair Value
per unit | | Units | | Fair Value
per unit | | | Units | | Fair Value
per unit | | Units | | Fair Value
per unit | | Deferred equity unit awards outstanding at January 1, 2010 | | | — | | | | | | — | | | | | | — | | | | | | — | | | | Granted | | | 15,808 | | | | | | 7,904 | | | | | | 15,808 | | | | | | 7,904 | | | | Vested | | | — | | | | | | — | | | | | | — | | | | | | — | | | | Forfeited | | | — | | | | | | — | | | | | | — | | | | | | — | | | | | | | | | | | | | | | | Deferred equity unit awards outstanding at December 31, 2010 | | | 15,808 | | | $ | 148.35 | | | | 7,904 | | | $ | 81.19 | | | | 15,808 | | | $ | 148.35 | | | | 7,904 | | | $ | 81.19 | | Granted | | | 10,802 | | | $ | 157.16 | | | | 5,401 | | | $ | 60.24 | | | | 10,802 | | | $ | 157.16 | | | | 5,401 | | | $ | 60.24 | | Vested | | | (4,257 | ) | | $ | (157.16 | ) | | | — | | | $ | (60.24 | ) | | | (4,257 | ) | | $ | (157.16 | ) | | | — | | | $ | (60.24 | ) | Forfeited | | | — | | | | | | (541 | ) | | | | | — | | | | | | (541 | ) | | | | | | | | | | | | | | | Deferred equity unit awards outstanding at December 31, 2011 | | | 22,353 | | | $ | 157.16 | | | | 12,764 | | | $ | 60.24 | | | | 22,353 | | | $ | 157.16 | | | | 12,764 | | | $ | 60.24 | | Granted | | | | 1,000 | | | $ | 205.70 | | | | 500 | | | $ | 64.24 | | Vested | | | | (6,565 | ) | | $ | (205.70 | ) | | | — | | | $ | (64.24 | ) | Forfeited | | | | — | | | | | | (140 | ) | | | | | | | | | | | | | | | Deferred equity unit awards outstanding at December 31, 2012 | | | | 16,788 | | | $ | 205.70 | | | | 13,124 | | | $ | 64.24 | |
The Company expects 10% of all awards to be forfeited and the related service period is four years. 18. DEFINED CONTRIBUTION AND DEFERRED COMPENSATION PLANS
| 17. | DEFINED CONTRIBUTION AND DEFERRED COMPENSATION PLANS |
SAMG LLC has a defined contribution 401(k) savings plan (the “Plan”) for all eligible employees who meet the minimum age and service requirements as defined in the Plan. The Plan is designed to be a qualified plan under sections 401(a) and 401(k) of the Internal Revenue Code. For employees who qualify under the terms of the Plan, on an annual basis Silvercrest matches dollar for dollar an employee’s contributions up to the first four percent of compensation. For the years ended December 31, 2012, 2011 2010 and 2009,2010, Silvercrest made matching contributions of $63, $71, $46 and $44,$46, respectively, for the benefit of employees. LGI had an annual bonus and deferred compensation plan (the “Deferred Plan”). The amount of a Participant’s Award (as defined) for any Plan Year (as defined) shall equal the product of the Net Revenues (as defined) for such Plan Year multiplied by a percentage, the numerator of which shall be the number of Units (as defined) allocated to such Participant for such Plan Year, and the denominator of which shall be the aggregate number of Units allocated under the Plan (as defined) for such Plan Year; provided, however, that (i) the Award for any Participant in any Plan Year shall, in no event, exceed $10 per Unit and (ii) the aggregate number of Units is subject to increase or decrease, by the Administrator (as defined) in his sole discretion, during such Plan Year to reflect the addition of new employees becoming Participants or to reflect the termination of employment of any Participant. Each Participant may elect to receive their Award in cash, on a deferred basis, or a combination of both subject to various provisions in the Deferred Plan. The Deferred Plan was discontinued as of December 31, 2009. During the year ended December 31, 2010, $154 of payments were made to participants under the plan. The remaining liability at December 31, 2010 was $70, which was paid in full in March 2011. 19. SOFT DOLLAR ARRANGEMENTS
| 18. | SOFT DOLLAR ARRANGEMENTS |
The Company obtains research and other services through “soft dollar” arrangements. The Company receives credits from broker-dealers whereby technology-based research, market quotation and/or market survey services are effectively paid for in whole or in part by “soft dollar” brokerage arrangements. Section 28(e) of the Securities Exchange Act of 1934, as amended, provides a “safe harbor” to an investment adviser against claims that it breached its fiduciary duty under state or federal law (including ERISA) solely because the adviser caused its clients’ accounts to pay more than the lowest available commission for executing a securities trade in return for brokerage and research services. To rely on the safe harbor offered by Section 28(e), (i) the Company must make a good-faith determination that the amount of commissions is reasonable in relation to the value of the brokerage and research services being received and (ii) the brokerage and research services must provide lawful and appropriate assistance to the Company in carrying out its investment decision-making responsibilities. If the use of soft dollars is limited or prohibited in the future by regulation, the Company may have to bear the costs of such research and other services. For the years ended December 31, 2012, 2011 2010 and 2009,2010, the Company utilized “soft dollar” credits of $320, $861, $812 and $724,$812, respectively. 20. SUBSEQUENT EVENT
ACQUISITION On January 5, 2012,March 28, 2013, the Company signed a Limited Liability Companyan Asset Purchase Agreement (the “LLC Agreement”) with MW Commodity Advisors,and closed the related transaction to acquire certain assets of Ten-Sixty Asset Management, LLC (“Commodity Advisors”Ten-Sixty”) to acquire the LLC interests (“LLC Interests”). Ten-Sixty is a registered investment adviser that oversees approximately $1.9 billion of Commodity Advisors. Commodity Advisors is the general partnerassets primarily on behalf of MW Commodity Strategies, L.P. (the “Commodity Fund”), a fund whose investment objective is to seek superior risk adjusted returns through strategic, sector-based investments with commodity and macro trading investment managers. Theinstitutional clients. This strategic acquisition of Commodity Advisors adds another strategy toexpands the Company’s complete investment management, wealth planninghedge fund due diligence capabilities and reporting capabilities, including proprietary value equity and fixed income disciplines and alternative investment advisory services.continues the growth of its institutional business. Under the terms of the LLCAsset Purchase Agreement, the Company in exchangepaid cash consideration at closing of $2,500 and issued a promissory note to Ten-Sixty for the LLC Interests, issued shares$1,479 subject to adjustment. The principal amount of the Company,promissory note is payable in two installments of $218 each on April 30, 2013 and December 31, 2013 and then quarterly installments from June 30, 2014 through March 31, 2017 of $87 each. The principal amount outstanding under this note bears interest at closing, with an estimated fair valuethe rate of $100, which is equal tofive percent per annum. As the difference betweenacquisition was completed shortly before the Closing Revenue, as defined, attributable to all limited partners minus Closing Revenue attributable to those limited partners who give notice that they want to withdraw from the Commodity Fund. Furthermore, as partissuance of the LLC Agreement,these financial statements, the Company could be obligatedis just commencing its process to make a future one-time earnout payment in shares equal toaccount for this business combination, and therefore, the difference between $800disclosure of acquired assets and the annualized revenue at closing only if incremental revenue, as defined, reaches an amount equal to $400 prior to March 31, 2014, as defined in the LLC Agreement.liabilities and pro forma financial results are not presented. The Company has evaluated subsequent events through May 11, 2012,April 18, 2013, which is the date the consolidated financial statements were available to be issued. ***** Silvercrest L.P.And Subsidiaries Condensed Consolidated Statements of Financial Condition (Unaudited) (In thousands) | | | | June 30, | | December 31, | | | March 31, | | December 31, | | | | | 2012 | | 2011 | | | 2013 | | 2012 | | Assets | | | | | | | | | Cash and cash equivalents | | $ | 2,568 | | | $ | 7,354 | | | $ | 4,355 | | | $ | 13,443 | | Restricted certificates of deposit and escrow | | | 1,018 | | | | 1,130 | | | | 1,275 | | | | 1,020 | | Investments | | | 74 | | | | 1,128 | | | | 84 | | | | 1,980 | | Receivables, net | | | 3,554 | | | | 2,238 | | | | 3,307 | | | | 3,675 | | Due from Silvercrest Funds | | | 2,033 | | | | 2,043 | | | | 1,220 | | | | 1,622 | | Furniture, equipment and leasehold improvements, net | | | 2,103 | | | | 2,275 | | | | 1,990 | | | | 2,061 | | Goodwill | | | 14,830 | | | | 14,683 | | | | 18,124 | | | | 15,891 | | Intangible assets, net | | | 13,087 | | | | 13,810 | | | | 13,759 | | | | 12,363 | | Prepaid expenses and other assets | | | 1,152 | | | | 601 | | | | 923 | | | | 399 | | | | | | | | | | | | | | | Total assets | | $ | 40,419 | | | $ | 45,262 | | | $ | 45,037 | | | $ | 52,454 | | | | | | | | | | | | | | | | Liabilities, Redeemable Partners’ Capital and Partners’ Deficit | | | | | | | | | Accounts payable and accrued expenses | | $ | 3,525 | | | $ | 4,365 | | | $ | 4,752 | | | $ | 4,513 | | Accrued compensation | | | 2,067 | | | | 2,915 | | | | 1,438 | | | | 3,656 | | Notes payable | | | 4,414 | | | | 4,809 | | | | 4,350 | | | | 3,315 | | Deferred rent | | | 2,399 | | | | 3,287 | | | | 2,139 | | | | 2,268 | | Deferred tax and other liabilities | | | 336 | | | | 375 | | | | 514 | | | | 565 | | | | | | | | | | | | | | | Total liabilities | | | 12,741 | | | | 15,751 | | | | 13,193 | | | | 14,317 | | | | | | | | | | | | | | | | Redeemable partners’ capital | | | 96,360 | | | | 91,201 | | | | 113,764 | | | | 102,017 | | Notes receivable from partners | | | (5,268 | ) | | | (6,024 | ) | | | (2,716 | ) | | | (3,410 | ) | | | | | | | | | | | | | | Total redeemable partners’ capital | | | 91,092 | | | | 85,177 | | | | 111,048 | | | | 98,607 | | | | | | | | | | | | | | | | Commitments and Contingencies (Note 10) | | | | | | | | | | Partners’ Deficit | | | | | | | | | Partners’ capital | | | 45,660 | | | | 44,359 | | | | 48,915 | | | | 47,904 | | Excess of liabilities, redeemable partners’ capital and partners’ capital over assets | | | (109,074 | ) | | | (100,025 | ) | | | (128,119 | ) | | | (108,374 | ) | | | | | | | | | | | | | | Total partners’ deficit | | | (63,414 | ) | | | (55,666 | ) | | | (79,204 | ) | | | (60,470 | ) | | | | | | | | | | | | | | Total liabilities, redeemable partners’ capital and partners’ deficit | | $ | 40,419 | | | $ | 45,262 | | | $ | 45,037 | | | $ | 52,454 | | | | | | | | | | | | | | |
See accompanying notes to condensed consolidated financial statements. Silvercrest L.P. And Subsidiaries Condensed Consolidated Statements of Operations (Unaudited) (In thousands) | | | | Six months ended
June 30, | | | Three months ended
March 31, | | | | | 2012 | | 2011 | | | 2013 | | 2012 | | Revenue | | | | | | | | | Management and advisory fees | | $ | 22,327 | | | $ | 18,539 | | | $ | 12,457 | | | $ | 10,682 | | Performance fees and allocations | | | 16 | | | | 31 | | | | 3 | | | | — | | Family office services | | | 2,444 | | | | 2,209 | | | | 1,225 | | | | 1,198 | | | | | | | | | | | | | | | Total revenue | | | 24,787 | | | | 20,779 | | | | 13,685 | | | | 11,880 | | | | | | | | | | | | | | | Expenses | | | | | | | | | Compensation and benefits | | | 9,600 | | | | 8,474 | | | | 5,201 | | | | 4,768 | | General and administrative | | | 5,208 | | | | 4,424 | | | | 2,710 | | | | 2,566 | | | | | | | | | | | | | | | Total expenses | | | 14,808 | | | | 12,898 | | | | 7,911 | | | | 7,334 | | | | | | | | | | | | | | | Income before other income (expense) | | | 9,979 | | | | 7,881 | | | Other income (expense) | | | | | | Other income (expense) | | | 61 | | | | (176 | ) | | Income before other income (expense), net | | | | 5,774 | | | | 4,546 | | Other income (expense), net | | | | | | Other income (expense), net | | | | 29 | | | | 32 | | Interest income | | | 86 | | | | 92 | | | | 27 | | | | 45 | | Interest expense | | | (206 | ) | | | (75 | ) | | | (37 | ) | | | (64 | ) | | | | | | | | | | | | | | Total other income (expense) | | | (59 | ) | | | (159 | ) | | Total other income (expense), net | | | | 19 | | | | 13 | | | | | | | | | | | | | | | Income before provision for income taxes | | | 9,920 | | | | 7,722 | | | | 5,793 | | | | 4,559 | | Provision for income taxes | | | (516 | ) | | | (178 | ) | | | 329 | | | | 270 | | | | | | | | | | | | | | | Net income | | $ | 9,404 | | | $ | 7,544 | | | $ | 5,464 | | | $ | 4,289 | | | | | | | | | | | | | | |
See accompanying notes to condensed consolidated financial statementsstatements. Silvercrest L.P. And Subsidiaries Condensed Consolidated Statements of Partners’ Deficit (Unaudited) (In thousands) | | | | Partners’
Capital | | Excess of
Liabilities,
Redeemable
Partners’
Capital and
Partners’
Capital over
Assets | | Total
Partners’
Deficit | | | Partners’
Capital | | Excess of
Liabilities,
Redeemable
Partners’
Capital and
Partners’
Capital
over Assets | | Total
Partners’
Deficit | | January 1, 2011 | | $ | 41,909 | | | $ | (66,939 | ) | | $ | (25,030 | ) | | Contribution from partners | | | — | | | | 535 | | | | 535 | | | January 1, 2012 | | | $ | 44,359 | | | $ | (100,025 | ) | | $ | (55,666 | ) | Contributions from partners | | | | — | | | | 112 | | | | 112 | | Distributions to partners | | | (943 | ) | | | (7,794 | ) | | | (8,737 | ) | | | (323 | ) | | | (7,532 | ) | | | (7,855 | ) | Equity-based compensation | | | — | | | | 490 | | | | 490 | | | | — | | | | 1,014 | | | | 1,014 | | Accretion to redemption value of redeemable partnership units | | | — | | | | (24,080 | ) | | | (24,080 | ) | | | — | | | | 4,994 | | | | 4,994 | | Net income | | | 1,996 | | | | 5,548 | | | | 7,544 | | | | 1,090 | | | | 3,199 | | | | 4,289 | | | | | | | | | | | | | | | | | | | | | June 30, 2011 | | $ | 42,962 | | | $ | (92,240 | ) | | $ | (49,278 | ) | | March 31, 2012 | | | $ | 45,127 | | | $ | (98,237 | ) | | $ | 53,110 | | | | | | | | | | | | | | | | | | | | | January 1, 2012 | | $ | 44,359 | | | $ | (100,025 | ) | | $ | (55,666 | ) | | Contribution from partners | | | — | | | | 245 | | | | 245 | | | January 1, 2013 | | | $ | 47,904 | | | $ | (108,374 | ) | | $ | (60,470 | ) | Contributions from partners | | | | — | | | | — | | | | — | | Distributions to partners | | | (1,085 | ) | | | (12,109 | ) | | | (13,194 | ) | | | (380 | ) | | | (13,289 | ) | | | (13,669 | ) | Equity-based compensation | | | — | | | | 1,019 | | | | 1,019 | | | | — | | | | 1,479 | | | | 1,479 | | Accretion to redemption value of redeemable partnership units | | | — | | | | (5,222 | ) | | | (5,222 | ) | | | — | | | | (12,008 | ) | | | (12,008 | ) | Net income | | | 2,386 | | | | 7,018 | | | | 9,404 | | | | 1,391 | | | | 4,073 | | | | 5,464 | | | | | | | | | | | | | | | | | | | | | June 30, 2012 | | $ | 45,660 | | | $ | (109,074 | ) | | $ | (63,414 | ) | | March 31, 2013 | | | $ | 48,915 | | | $ | (128,119 | ) | | $ | (79,204 | ) | | | | | | | | | | | | | | | | | | | |
See accompanying notes to condensed consolidated financial statements. Silvercrest L.P. And Subsidiaries Condensed Consolidated Statements of Cash Flows (Unaudited) (In thousands) | | | | Six months ended
June 30, | | | Three months ended
March 31, | | | | | 2012 | | 2011 | | | 2013 | | 2012 | | Cash Flows From Operating Activities | | | | | | | | | Net income | | $ | 9,404 | | | $ | 7,544 | | | $ | 5,464 | | | $ | 4,289 | | Adjustments to reconcile net income to net cash provided by operating activities: | | | | | | | | | Equity-based compensation | | | 806 | | | | 496 | | | | 359 | | | | 431 | | Depreciation and amortization | | | 955 | | | | 645 | | | | 449 | | | | 475 | | Deferred rent | | | (876 | ) | | | (9 | ) | | | (108 | ) | | | (121 | ) | Deferred income taxes | | | 22 | | | | (242 | ) | | | 44 | | | | 22 | | Non-cash interest income | | | (81 | ) | | | (88 | ) | | Non-cash interest on notes receivable from partners | | | | (25 | ) | | | (43 | ) | Distributions received from investment funds | | | 961 | | | | 1,227 | | | | 1,900 | | | | 961 | | Other | | | (4 | ) | | | — | | | | (4 | ) | | | (4 | ) | Cash flows due to changes in operating assets and liabilities: | | | | | | | | | Receivables and due from Silvercrest funds | | | (1,306 | ) | | | (96 | ) | | | 770 | | | | 215 | | Prepaid expenses and other assets | | | (260 | ) | | | (157 | ) | | | (545 | ) | | | (273 | ) | Payables and accrued expenses | | | (667 | ) | | | (648 | ) | | Accounts payable and accrued expenses | | | | 237 | | | | (232 | ) | Accrued compensation | | | (635 | ) | | | (1,382 | ) | | | (1,098 | ) | | | (1,152 | ) | Other liabilities | | | (75 | ) | | | (202 | ) | | | (95 | ) | | | (118 | ) | Interest payable on notes payable | | | 104 | | | | 49 | | | | 36 | | | | 52 | | | | | | | | | | | | | | | Net cash provided by operating activities | | | 8,348 | | | | 7,137 | | | | 7,384 | | | | 4,502 | | | | | | | | | | | | | | | Cash Flows From Investing Activities | | | | | | | | | Restricted certificates of deposit and escrow | | $ | 112 | | | $ | 167 | | | $ | (255 | ) | | $ | 84 | | Acquisition of furniture, equipment and leasehold improvements | | | | (27 | ) | | | (5 | ) | Earn-outs paid related to acquisitions completed before January 1, 2009 | | | (390 | ) | | | (362 | ) | | | — | | | | (390 | ) | Acquisition of furniture, equipment and leasehold improvements | | | (60 | ) | | | (196 | ) | | Acquisition of Ten-Sixty | | | | (2,500 | ) | | | — | | Purchase of investments | | | (42 | ) | | | — | | | | — | | | | (42 | ) | Proceeds from sale of investments | | | 139 | | | | — | | | | — | | | | 139 | | | | | | | | | | | | | | | Net cash used in investing activities | | | (241 | ) | | | (391 | ) | | | (2,782 | ) | | | (214 | ) | | | | | | | | | | | | | | Cash Flows From Financing Activities | | | | | | | | | Earn-outs paid related to acquisitions completed on or after January 1, 2009 | | $ | (75 | ) | | $ | — | | | $ | — | | | $ | (75 | ) | Proceeds from issuance of partner interests | | | — | | | | 13 | | | Redemptions of partner interests | | | (63 | ) | | | — | | | Redemptions of partners’ interests | | | | (261 | ) | | | (63 | ) | Repayments of notes payable | | | (499 | ) | | | (722 | ) | | | (480 | ) | | | (499 | ) | Payments on capital leases | | | (12 | ) | | | (4 | ) | | | — | | | | (5 | ) | Distributions to partners | | | (13,194 | ) | | | (8,737 | ) | | | (13,669 | ) | | | (7,855 | ) | Payments from partners on notes receivable | | | 950 | | | | 1,083 | | | | 720 | | | | 950 | | | | | | | | | | | | | | | Net cash used in financing activities | | | (12,893 | ) | | | (8,367 | ) | | | (13,690 | ) | | | (7,547 | ) | | | | | | | | | | | | | | Net increase decrease in cash and cash equivalents | | | (4,786 | ) | | | (1,621 | ) | | Cash and cash equivalents, beginning of period | | | 7,354 | | | | 7,025 | | | Net decrease in cash and cash equivalents | | | | (9,088 | ) | | | (3,259 | ) | Cash and cash equivalents, beginning of year | | | | 13,443 | | | | 7,354 | | | | | | | | | | | | | | | Cash and cash equivalents, end of period | | $ | 2,568 | | | $ | 5,404 | | | Cash and cash equivalents, end of year | | | $ | 4,355 | | | $ | 4,095 | | | | | | | | | | | | | | | Supplemental Disclosures of Cash Flow Information | | | | | | Net cash paid during the period for: | | | | | | Income taxes | | $ | 866 | | | $ | 889 | | | Interest | | | 46 | | | | 74 | | | Supplemental Disclosures of Non-cash Financing Activities | | | | | | Notes receivable: | | | | | | From partners for capital contributions | | $ | 112 | | | $ | 522 | | | Shares issued as part of acquisition of MW Commodity Advisors, LLC | | | 132 | | | | — | | |
See accompanying notes to condensed consolidated financial statements. | | | | | | | | | | | | Three months ended
March 31, | | | | | 2013 | | | 2012 | | Supplemental Disclosures of Cash Flow Information | | | | | | | | | Net cash paid during the year for: | | | | | | | | | Income taxes | | $ | 260 | | | $ | 196 | | Interest | | | 27 | | | | 46 | | | | | Supplemental Disclosures of Non-cash Financing Activities | | | | | | | | | Notes receivable: | | | | | | | | | From partners for capital contributions | | $ | — | | | $ | 112 | | Issuance of notes payable for acquisition of Ten-Sixty | | | 1,479 | | | | — | |
See accompanying notes to condensed consolidated financial statements. Silvercrest L.P. and Subsidiaries Notes to Condensed Consolidated Financial Statements (Unaudited) As of and Forfor the SixThree Months Ended June 30,March 31, 2013 and 2012 and 2011 (Dollars in thousands) 1. ORGANIZATION AND BUSINESS
| 1. | ORGANIZATION AND BUSINESS |
Silvercrest L.P. (“Silvercrest”), together with its consolidated subsidiaries (collectively the “Company”), provides investment management and family office services to individuals and families and their trusts, and to endowments, foundations and other institutional investors primarily located in the United States of America. The business includes the management of funds of funds, and other investment funds, collectively referred to as the “Silvercrest Funds.” Silvercrest was formed on December 10, 2008 and commenced operations on January 1, 2009 along with its general partner, Silvercrest GP LLC (“GP LLC”) as part of a restructuring that was completed to organize the Company more in line with industry standards and to increase tax efficiency. Pursuant to the reorganization each of the members of Silvercrest Asset Management Group LLC (“SAMG LLC”) contributed their limited liability company interests in SAMG LLC to Silvercrest L.P. in return for limited partnership interests in Silvercrest L.P. and member interests in Silvercrest GP LLC, such that immediately after giving effect to such issuanceissuances each member’s percentage ownership of, and voting interest in, the aggregate limited partnership interests was equal to its ownership and voting interests immediately prior to such issuance, but was reduced pro rata to take into account the 1% interest in Silvercrest L.P. owned by Silvercrest GP LLC, the general partner of Silvercrest L.P. As a result of the restructuring, SAMG LLC became a wholly owned subsidiary as of Silvercrest.January 1, 2009. The reorganization was accounted for as a transaction between entities under common control and all balances of SAMG LLC were carried over to Silvercrest at their carrying values onas of December 31, 2008. On March 11, 2004, the Company acquired 100% of the outstanding shares of James C. Edwards Asset Management, Inc. (“JCE”) and subsequently changed JCE’s name to Silvercrest Financial Services, Inc. (“SFS”). On December 31, 2004, the Company acquired 100% of the outstanding shares of The LongChamp Group, Inc. now SAM Alternative Solutions, Inc. (“LGI”). Effective March 31, 2005, the Company entered into an Asset Contribution Agreement to acquire all of the assets, properties, rights and certain liabilities of Heritage Financial Management, LLC (“HFM”). Effective October 3, 2008, the Company acquired 100% of the outstanding limited liability company interests of Marathon Capital Group, LLC (“MCG”) through a limited liability company interest purchase agreement dated September 22, 2008. On November 1, 2011, the Company acquired certain assets of Milbank Winthrop & Co. (“Milbank”). On April 1, 2012, the Company acquired the LLC interests (“LLC Interests”) of MW Commodity Advisors, LLC (“Commodity Advisors”). On March 28, 2013, the Company acquired certain assets of Ten-Sixty Asset Management, LLC (“Ten-Sixty”). See Notes 3, 7 and 8 for additional information related to goodwill and intangible assets related to these acquisitions. 2. SUMMARY OF SIGNIFICANT ACCOUNTING POLICIES
| 2. | SUMMARY OF SIGNIFICANT ACCOUNTING POLICIES |
Basis of Presentation and Principles of Consolidation The accompanying consolidated financial statements include the accounts of Silvercrest and its wholly-owned subsidiaries, SAMG LLC, SFS, LGI, MCG, Silvercrest Investors LLC and Silvercrest Investors II LLC as of and for the six monthsquarter ended June 30, 2012.March 31, 2013. All intercompany transactions and balances have been eliminated. In addition, Silvercrestthe Company evaluates for consolidation those entities it controls through a majority voting interest or otherwise, including those Silvercrest Funds in which the general partner or equivalent is presumed to have control over the fund. The initial step in the Company’sour determination of whether a fund for which Silvercrest is the general partner is required to be consolidated is assessing whether the fund meets the definition of a variable interest entity (VIE). None of funds for which the CompanySilvercrest is the general partner met the definition of a VIE during the six three months ended June 30,March 31, 2013 and 2012 and 2011 andthe two years ended December 31, 2011,2012, as the total equity at risk of each fund is sufficient for the fund to finance its activities without additional subordinated financial support provided by any parties, including the equity holders. The CompanySilvercrest then considers whether the fund is a voting interest entities (VoIE) in which the unaffiliated limited partners have substantive “kick-out” rights that provide the ability to dissolve (liquidate) the limited partnership or otherwise remove the general partner without cause.The CompanySilvercrest considers the “kick-out” rights to be substantive if the general partner for the fund can be removed by the vote of a simple majority of the unaffiliated limited partners and there are no significant barriers to the unaffiliated limited partners’ ability to exercise these rights in that among other things (1) there are no conditions or timing limits on when the rights can be exercised, (2) there are no financial or operational barriers associated with replacing the general partner, (3) there are a number of qualified replacement investment advisors that would accept appointment at the same fee level,
(4) each fund’s documents provide for the ability to call and conduct a vote, and (5) the information necessary to exercise the kick-out rights and related vote are available from the fund and its administrator. As of March 31, 2013 and December 31, 2012 and for the six month periodsthree months ended June 30,March 31, 2013 and 2012, and 2011 and the year ended December 2011, all of the funds for which we areSilvercrest was the general partner have substantive “kick-out” rights and therefore Silvercrest did not consolidate any of the Silvercrest Funds. Segment Reporting The Company views its operations as comprising one operating segment. Each of the Company’s acquired businesses hashave similar economic characteristics and hashave been fully integrated upon acquisition. Furthermore, our Chief Operating Decision Maker, which is the Company’s Chief Executive Officer, monitors and reviews financial information at a consolidated level for assessing operating results and the allocation of resources. Use of Estimates The preparation of the consolidated financial statements requires management to make estimates and assumptions that affect the reported amounts of assets and liabilities, the disclosure of contingent assets and liabilities at the date of the consolidated financial statements and the reported amounts of revenues, expenses and other income reported in the consolidated financial statements and the accompanying notes. Actual results could differ from those estimates. Significant estimates and assumptions made by management include the fair value of acquired assets and liabilities, equity based compensation, impairmentthe fair value of our reporting unit utilized in assessing goodwill for impairment, accounting for income taxes, the useful lives of long lived assets and other matters that affect the consolidated financial statements and related disclosures. Cash and Cash Equivalents The Company considers all highly liquid securities with original maturities of 90 days or less when purchased to be cash equivalents. Restricted Certificates of Deposit Certain certificates of deposit held at a major financial institution are restricted and serve as collateral for letters of credit for the Company’s lease obligations as described in Note 10. Equity Method Investments Entities and investments over which the Company exercises significant influence over the activities of the entity but which do not meet the requirements for consolidation are accounted for using the equity method of accounting, pursuant to ASC 323, “Investments-Equity Method and Joint Ventures”, (“ASC 323”), whereby the Company records its share of the underlying income or losses of these entities. Intercompany profit arising from transactions with affiliates is eliminated to the extent of its beneficial interest. Equity in losses of equity method investments is not recognized after the carrying value of an investment, including advances and loans, has been reduced to zero, unless guarantees or other funding obligations exist. The Company evaluates its equity method investments for impairment, whenever events or changes in circumstances indicate that the carrying amounts of such investments may not be recoverable. The difference between the carrying value of the equity method investment and its estimated fair value is recognized as impairment when the loss in value is deemed other than temporary. The Company’s equity method investments approximate their fair value at June 30, 2012March 31, 2013 and 2011.2012. The fair value of the equity method investments is estimated based on the Company’s share of the fair value of the net assets of the equity method investee which consist of Level I and Level II securities. No impairment charges related to equity method investments were recorded during the sixthree months ended June 30, 2012March 31, 2013 and 2011.2012. Receivables and Due from Silvercrest Funds Receivables consist primarily of amounts due for advisory fees due from clients and management fees, and are stated at net realizable value. The Company maintains an allowance for doubtful receivables based on estimates of expected losses and specific identification of uncollectible accounts. The Company charges actual losses to the allowance when incurred. Furniture, Equipment and Leasehold Improvements Furniture, equipment and leasehold improvements consist primarily of furniture, fixtures and equipment, computer hardware and software and leasehold improvements and are recorded at cost less accumulated depreciation. Depreciation is calculated using the straight-line method over the assets’ estimated useful lives, which for leasehold improvements is the lesser of the lease term or the life of the asset, generally 10 years, and 3 to 7 years for other fixed assets. Business Combinations The Company accounts for business combinations using the acquisition method of accounting. The acquisition method of accounting requires that purchase price, including the fair value of contingent consideration, of the acquisition be allocated to the assets acquired and liabilities assumed using the fair values determined by management as of the acquisition date. Contingent consideration is recorded as part of the purchase price when such contingent consideration is not based on continuing employment of the selling shareholders. Contingent consideration that is related to continuing employment is recorded as compensation expense. Payments made for contingent consideration recorded as part of an acquisition’s purchase price are reflected as financing activities in the Company’s statements of cash flows. For acquisitions completed subsequent to January 1, 2009, the Company remeasures the fair value of contingent consideration at each reporting period using a probability-adjusted discounted cash flow method based on significant inputs not observable in the market and any change in the fair value from either the passage of time or events occurring after the acquisition date, is recorded in earnings. Contingent consideration payments that exceed the acquisition date fair value of the contingent consideration are reflected as an operating activity in the consolidated statements of cash flows. Goodwill and Intangible Assets Goodwill consists of the excess of the purchase price over the fair value of identifiable net assets of businesses acquired. Goodwill is not amortized and is evaluated for impairment using a two-step process that is performed at least annually, or whenever events or circumstances indicate that impairment may have occurred. During In September 2011, the FASB issued ASU 2011-08, “Testing Goodwill for Impairment”, which provided new accounting guidance on testing goodwill for impairment. The enhanced guidance provides an entity the option to first perform a qualitative assessment of whether a reporting unit’s fair value is more likely than not less than its carrying value, including goodwill. In performing its qualitative assessment, an entity considers the extent to which adverse events or circumstances identified, such as changes in economic conditions, industry and market conditions or entity specific events, could affect the comparison of the reporting unit’s fair value with its carrying amount. If an entity concludes that the fair value of a reporting unit is more likely than not less than its carrying amount, the entity is required to perform the currently prescribed two-step goodwill impairment test to identify potential goodwill impairment and, accordingly, measure the amount, if any, of goodwill impairment loss to be recognized for that reporting unit. The guidance was effective for the Company changedas of January 1, 2012. The Company did not utilize this option and assessed goodwill using the two-step process when performing its annual impairment test date from December 31 to October 1, effective October 1, 2011. assessment in 2012.The change in the impairment testing date was not made with the intent of accelerating or delaying an impairment charge. The change was made in anticipation of the Company having a requirement to issue its annual financial statements on an accelerated basis as compared to prior years. The change had no impact on the Company’s results of operations or any other financial statement line item. The first step is a comparison of the fair value of a reporting unit with its carrying amount, including goodwill. If the fair value of the reporting unit exceeds its carrying value, goodwill of the reporting unit is not considered impaired and the second step is unnecessary. If the carrying value of the reporting unit exceeds its fair value, a second step is performed to measure the amount of impairment by comparing the carrying amount of the goodwill to a determination of the implied fair value of the goodwill. If the carrying amount of the goodwill is greater than the implied value, an impairment loss is recognized for the difference. The implied value of the goodwill is determined as of the test date by performing a purchase price allocation, as if the reporting unit had just been acquired, using currently estimated fair values of the individual assets and liabilities of the reporting unit, together with an estimate of the fair value of the reporting unit taken as a whole. The estimate of the fair value of the reporting unit is based upon information available regarding prices of similar groups of assets, or other valuation techniques including present value techniques based upon estimates of future cash flows.
The Company has one reporting unit at June 30, 2012March 31, 2013 and 2011.2012. No goodwill impairment charges were recorded during the sixthree months ended June 30, 2012March 31, 2013 and 2011.2012. Identifiable finite-lived intangible assets are amortized over their estimated useful lives ranging from 3 to 20 years. The method of amortization is based on the pattern over which the economic benefits, generally expected undiscounted cash flows, of the intangible asset are consumed. Intangible assets for which no pattern can be reliably determined are amortized using the straight-line method. Intangible assets consist primarily of the contractual right to future management, advisory and performance fees from customer contracts or relationships. Long-lived Assets Long-lived assets of the Company are reviewed for impairment whenever events or changes in circumstances indicate that the net carrying amount of the asset may not be recoverable. In connection with such review, the Company also re-evaluates the periods of depreciation and amortization for these assets. Recoverability of assets to be held and used is measured by a comparison of the carrying amount of an asset to undiscounted future net cash flows expected to be generated by the asset. If such assets are considered to be impaired, the impairment to be recognized is measured by the amount by which the carrying amount of the assets exceeds their fair value. Initial Public Offering Costs As of June 30, 2012,March 31, 2013, the Company has incurred and deferred $545$30 of professional fees associated with its planned initial public offering. These fees are included in prepaid expenses and other assets in the condensed consolidated statement of financial condition at June 30, 2012.March 31, 2013. In the event the offering is not consummated, the deferred offering costs will be expensed. Derivative Instruments Derivative instruments are recorded at fair value as either assets or liabilities in the Company’s consolidated balance sheet. The Company’s derivatives are not designated as hedging instruments and are used as “economic hedges” to manage certain risks in the Company’s business. As a result of the use of derivative instruments, the Company is exposed to the risk that counterparties to derivative contracts will fail to meet their contractual obligations. The Company does not hold collateral or other security from its counterparties supporting its derivative instruments. In addition, there are no netting arrangements in place with the counterparties. To mitigate the counterparty credit risk, the Company has a policy of entering into contracts only with carefully selected major financial institutions based upon their credit ratings and other factors. The Company records the changes in fair value of derivative instruments in “Other income (expenses)”, net” in the consolidated statement of operations. The Company does not purchase, hold or sell derivative financial instruments for trading and speculative purposes. Partner Distributions Partner incentive allocations, which are determined by the general partner and approved by a vote of the partners, can be formula based or discretionary. Incentive allocations are considered distributions of net income as stipulated by the Company’sSilvercrest’s Amended and Restated Limited Partnership Agreement and are recognized in the period in which they are paid. In the event there is insufficient distributable cash flow to make incentive distributions, the general partner in its sole and absolute discretion canmay determine not to make any distributions called for under the partnership agreement. The remaining net income or loss after partner incentive allocations is generally allocated to the partners based on their pro rata ownership. Redeemable Partnership Units Redeemable partnership units in our Company consist of units issued to our founders and those purchased by certain of our employees. These capital units entitle the holder to a share of the distributions of our Company. Units are subject to certain redemption features. Upon the termination of employment of the Terminated Employee, as defined, the Company has a right to call the Units.units. In addition, the terminated employee has a right to put the Unitsunits to the Company upon termination or death, provided the terminated employee has complied with certain restrictions as described in the partnership agreement. In accordance with the provisions of our partnership and operating agreements, the put described above expires with the consummation of an IPO or Sale Transaction, as defined in our partnership and operating agreements. As the units are redeemable at the option of the holder and are not mandatorily redeemable, the redeemable partnership units have be classified outside of permanent partner’s capital. The units are adjusted to their current redemption value at the end of each reporting period with the increase or decrease in redemption value being charged to excess of liabilities, redeemable partners’ capital and partner’s capital over assets. The Company also makes distributions to its partners of various nature including incentive payments, profit distributions and tax distributions. Revenue Recognition Revenue is recognized ratably over the period in which services are performed. Revenue consists primarily of investment advisory fees, family office services fees and fund management fees. Investment advisory fees are typically billed quarterly in advance afterat the beginning of the quarter or in arrears after the end of the quarter, based on a contractually specified percentage of the assets managed. For investment advisory fees billed in advance, the value of assets managed is determined based on the value of the customer’s account as of the last trading day of the preceding quarter. For investment advisory fees billed in arrears the value of assets managed is determined based on the value of the customer’s account on the last day of the quarter being billed. Family office services fees are typically billed quarterly in advance afterat the beginning of the quarter or in arrears after the end of the quarter based on a contractual percentage of the assets managed or based on a fixed fee arrangement. Management fees from proprietary and non-proprietary funds isare calculated as a percentage of net asset values measured at the beginning of a month or quarter or at the end of a quarter, depending on the fund. The Company accounts for performance based revenue in accordance with ASC 605-20-S99, “Accounting for Management Fees Based on a Formula”,by recognizing performance fees and allocations as revenue only when it is certain that the fee income is earned and payable pursuant to the relevant agreements, and no contingencies remain. Performance fee contingencies are typically resolved at the end of each annual period. In certain arrangements, the Company is only entitled to receive performance fees and allocations when the return on assets under management exceeds certain benchmark returns or other performance targets. The Company records performance fees and allocations as a component of revenue. Equity-Based Compensation Equity-based compensation cost relating to the issuance of share-based awards to partners is based on the fair value of the award at the date of grant, which is expensed ratably over the requisite service period, net of estimated forfeitures. The forfeiture assumption is ultimately adjusted to the actual forfeiture rate. Therefore, changes in the forfeiture assumptions may affect the timing of the total amount of expense recognized over the vesting period. The service period is the period over which the employee performs the related services, which is normally the same as the vesting period. Equity-based awards that do not require future service are expensed immediately. Equity-based awards that have the potential to be settled in cash at the election of the employee or which relate to redeemable partnership units are classified as liabilities (“Liability Awards”) and are adjusted to fair value at the end of each reporting period. Distributions associated with Liability Awards not expected to vest are accounted for as part of compensation expense in the Consolidated Statement of Operations. Leases The Company expenses the net lease payments associated with operating leases on a straight-line basis over the respective leases’ term including any rent-free periods. Leasehold improvements are recorded at cost and are depreciated using the straight-line method over the lesser of the estimated useful lives of the improvements (generally 10 years) or the remaining lease term. Income Taxes Silvercrest is not subject to federal and state income taxes, since all income, gains and losses are passed through to its partners. Silvercrest is subject to New York City unincorporated business tax. SFS is subject to federal and state corporate income tax, which requires an asset and liability approach to the financial accounting and reporting of income taxes. With respect to the Company’s incorporated entity, the annual tax rate is based on the income, statutory tax rates and tax planning opportunities available in the various jurisdictions in which the Company operates. Tax laws are complex and subject to different interpretations by the taxpayer and respective governmental taxing authorities. Judgment is required in determining the tax expense and in evaluating tax positions. The tax effects of an uncertain tax position (“UTP”) taken or expected to be taken in income tax returns are recognized only if it is “more likely-than-not” to be sustained on examination by the taxing authorities, based on its technical merits as of the reporting date. The tax benefits recognized in the financial statements from such a position are measured based on the largest benefit that has a greater than fifty percent likelihood of being realized upon ultimate settlement. The Company recognizes estimated accrued interest and penalties related to UTPs in income tax expense. The Company recognizes the benefit of a UTP in the period when it is effectively settled. Previously recognized tax positions are derecognized in the first period in which it is no longer more likely than not that the tax position would be sustained upon examination. Recent Accounting Developments In May 2011, the FASB issued ASU 2011-04, “Fair Value Measurement (Topic 820): Amendments to Achieve Common Fair Value Measurement and Disclosure Requirements in GAAP and International Financial Reporting Standards (“IFRS”)”, which amended guidance on fair value measurements to achieve common fair value measurement and disclosure requirements in GAAP and IFRS. The amended guidance specifies that the concepts of highest and best use and valuation premise in a fair value measurement are relevant only when measuring the fair value of nonfinancial assets and are not relevant when measuring the fair value of financial assets or of liabilities. The amendments include requirements specific to measuring the fair value of those instruments, such as equity interests used as consideration in a business combination. An entity should measure the fair value of its own equity instrument from the perspective of a market participant that holds the instrument as an asset. With respect to financial instruments that are managed as part of a portfolio, an exception to fair value requirements is provided. That exception permits a reporting entity to measure the fair value of such financial assets and financial liabilities at the price that would be received to sell a net asset position for a particular risk or to transfer a net liability position for a particular risk in an orderly transaction between market participants at the measurement date. The amendments also clarify that premiums and discounts should only be applied if market participants would do so when pricing the asset or liability. Premiums and discounts related to the size of an entity’s holding (e.g., a blockage factor) rather than as a characteristic of the asset or liability (e.g., a control premium) is not permitted in a fair value measurement. The guidance also requires enhanced disclosures about fair value measurements, including, among other things, (a) for fair value measurements categorized within Level III of the fair value hierarchy, (1) a quantitative disclosure of the unobservable inputs and assumptions used in the measurement, (2) the valuation process used by the reporting entity, and (3) a narrative description of the sensitivity of the fair value measurement to changes in unobservable inputs and the interrelationships between those unobservable inputs, if any, and (b) the categorization by level of the fair value hierarchy for items that are not measured at fair value in the statement of financial position but for which the fair value is required to be disclosed (for example, a financial instrument that is measured at amortized cost in the statement of financial position but for which fair value is disclosed). The guidance also amends disclosure requirements for significant transfers between Level I and Level II and now requires disclosure of all transfers between Levels I and II in the fair value hierarchy. The amended guidance was effective for the Company on January 1, 2012 and did not have a material impact on the Company’s consolidated financial statements. In September 2011, the FASB issued ASU 2011-08, “Testing Goodwill for Impairment”, which provided new accounting guidance on testing goodwill for impairment. The enhanced guidance provides an entity the option to first perform a qualitative assessment of whether a reporting unit's fair value is more likely than not less than its carrying value, including goodwill. In performing its qualitative assessment, an entity considers the extent to which adverse events or circumstances identified, such as changes in economic conditions, industry and market conditions or entity specific events, could affect the comparison of the reporting unit's fair value with its carrying amount. If an entity concludes that the fair value of a reporting unit is more likely than not less than its carrying amount, the entity is required to perform the currently prescribed two-step goodwill impairment test to identify potential goodwill impairment and, accordingly, measure the amount, if any, of goodwill impairment loss to be recognized for that reporting unit. The guidance is effective for the Company for interim and annual periods commencing January 1, 2012. Early adoption is permitted. The Company will consider this guidance when performing its annual impairment assessment in 2012.
3. ACQUISITIONSCommodity Advisors:
On NovemberApril 1, 2011,2012, the Company acquired certain assetsCommodity Advisors. Commodity Advisors is the general partner of Milbank,MW Commodity Strategies, L.P. (the “MW Commodity Fund LLC”), a registeredfund whose investment advisor that oversees approximately $500 million of assets primarily on behalf of high-net-worth families.objective is to seek superior risk adjusted returns through strategic, sector-based investments with commodity and macro trading investment managers. The strategic acquisition of Milbank, a long-standing and highly regarded investment boutique, strengthens the Company’s presence in the New York market and the Company obtains investment managers that have significant experience and knowledge of the industry. Milbank’s clients will gain accessCommodity Advisors adds another strategy to the Company’s complete investment management, wealth planning and reporting capabilities, including proprietary value equity and fixed income disciplines and alternative investment advisory services. Under the terms of the Asset Purchase Agreement,On April 1, 2012, the Company, paid cash considerationin exchange for the member interests of $3,357 (net of cash acquired of $813),Commodity Advisors, issued 631 and 6 units of the CompanySilvercrest L.P. and Silvercrest GP LLC, respectively, at closing, with a fair value of $3,105, and issued a promissory note to Milbank for $3,181. The promissory note bears interest at a rate of 5% per annum and is payable in four annual installments (see Note 9). The purchase price allocation includes an estimate of the fair value of the 19,757 units issued to the former owners of Milbank which was determined by calculating a per unit limited partnership interest fair value in the Company utilizing both discounted cash flow and guideline company valuation methodologies.$132. Furthermore, as part of the Asset Purchase Agreement, the Company is obligated to make future earnoutquarterly contingent payments to Milbank. The Company determined that the acquisition-date fair value of the contingent consideration was $1,726 based on the likelihood that the financial and performance targets will be achieved. As of March 31, 2012, the Company determined that no fair value adjustments to contingent consideration were required as the likelihood that the financial and performance targets will be achieved has not changed since the acquisition date. Under the terms of the Asset Purchase Agreement, Milbank is entitled to receive six earnout payments. The earnout periods are as follows: November 1, 2011 through December 31, 2011, full calendar years 2012, 2013, 2014 and 2015, and January 1, 2016 through October 31, 2016. Each earnout payment is equal to 20% of EBITDA,if incremental income, as defined in the Asset Purchase Agreement. Therepurchase agreement, exceeds various thresholds. As these contingent payments are tied to the continued employment by the Company of the former member of Commodity Advisors, they will be considered compensation expense in the period in which such contingent payments are earned (See Note 10). The Company is no required EBITDA milestone that needsobligated to be achieved in order for anmake a future one-time earnout payment in units equal to be made. The amount of the earnout payments will vary depending ondifference between $800 and the level of EBITDA that is generated in each respective earnout period. The fairredemption value of the contingent consideration was based on discounted cash flow models using projected EBITDA for each earnout period. The discount rate appliedunits issued at closing, if incremental revenue, as defined, reaches an amount equal to the$400 prior to the projected EBITDA was determined based on the weighted average cost of capital for the Company and considered that the overall risk associated with the payments was similar to the overall risks of the Company as there is no target, floor or cap associated the contingent payments. During 2011, the Company incurred $222 in costs related to the acquisition of Milbank, and has included these in general, administrative and other in the Consolidated Statement of Operations.March 31, 2014.
| | | | | Shares issued | | $ | 3,105 | | Note payable due to Milbank | | | 3,181 | | Cash paid on date of acquisition | | | 4,170 | | Contingent consideration | | | 1,726 | | | | | | | Total purchase consideration | | $ | 12,182 | | | | | | |
| | | | | Units issued | | $ | 132 | | Call rights option issued | | | 15 | | | | | | | Total purchase consideration | | $ | 147 | | | | | | |
The following table summarizes the final amounts allocated to the acquired assets and assumed liabilities. The excess of the purchase price over the fair values of assets acquired and liabilities assumed was allocated to goodwill and intangible assets. | | | | | Cash | | $ | 813 | | Prepaid expenses | | | 57 | | Furniture and equipment | | | 20 | | Deferred revenue | | | (871 | ) | Net deferred tax liability | | | (107 | ) | Capital lease | | | (17 | ) | | | | | | Total fair value of net tangible assets acquired | | | (105 | ) | Goodwill | | | 3,271 | | Customer relationships (20 years) | | | 8,200 | | Non-compete agreements (3-5 years) | | | 816 | | | | | | | Total purchase consideration | | $ | 12,182 | | | | | | |
| | | | | Receivables | | $ | 7 | | Liabilities | | | (7 | ) | | | | | | Total fair value of net tangible assets acquired | | | — | | Goodwill | | | 147 | | | | | | | Total purchase consideration | | $ | 147 | | | | | | |
Ten-Sixty: On March 28, 2013, the Company executed an Asset Purchase Agreement with and closed the related transaction to acquire certain assets of Ten-Sixty. Ten-Sixty is a registered investment adviser that advises on approximately $1.9 billion of assets primarily on behalf of institutional clients. This strategic acquisition enhances the Company’s hedge fund and investment manager due diligence capabilities, risk management analysis and reporting, and enhances its institutional business. Under the terms of the Asset Purchase Agreement, the Company paid cash consideration at closing of $2,500 and issued a promissory note to Ten-Sixty for $1,479 subject to adjustment. The principal amount of the promissory note is payable in two initial installments of $218 each on April 30, 2013 and December 31, 2013 and then quarterly installments from June 30, 2014 through March 31, 2017 of $87 each. The principal amount outstanding under this note bears interest at the rate of five percent per annum. During the three months ended March 31, 2013, the Company incurred $51 in costs related to the acquisition of Ten-Sixty, and has included these in general, administrative and other in the Condensed Consolidated Statement of Operations. | | | | | Cash paid on date of acquisition | | $ | 2,500 | | Note payable due to Ten-Sixty . . | | | 1,479 | | | | | | | Total purchase consideration . . | | $ | 3,979 | | | | | | |
The Company is in the process of evaluating the allocation of the purchase price of the Ten-Sixty acquisition. Based on the preliminary purchase price allocation, the net tangible assets acquired from the Ten-Sixty transaction were determined to have a fair value of $0. The following table summarizes the preliminary allocation of the excess of the purchase price over the fair values of assets acquired and liabilities assumed was allocated to goodwill and intangible assets. | | | | | Goodwill | | | 2,232 | | Customer relationships (10 years) | | | 1,650 | | Non-compete agreements (5 years) | | | 97 | | | | | | | Total purchase consideration | | $ | 3,979 | | | | | | |
The fair values of the intangibles from the Ten-Sixty acquisition are preliminary and provisional and subject to adjustment if additional information is obtained during the measurement period (a period of up to one year from the closing date) of this transaction that may change the fair value allocation as of the acquisition date. The Company believes the recorded goodwill is supported by the anticipated revenues and expected synergies of integrating the operations of MilbankTen-Sixty into the Company. Furthermore, there are expected synergies with respect to compensation and benefits and general and administrative costs. TheAll goodwill that is expected to be deductible for tax purposes is goodwill that originates from contingent consideration.purposes. On April 1, 2012, the Company acquired the LLC Interests of Commodity Advisors. Commodity Advisors is the general partner of MW Commodity Strategies, L.P. (the “MW Commodity Fund LLC”), a fund whose
investment objective is to seek superior risk adjusted returns through strategic, sector-based investments with commodity and macro trading investment managers. The strategic acquisition of Commodity Advisors adds another strategy to the Company’s investment management, wealth planning and reporting capabilities, including proprietary value equity and fixed income disciplines and alternative investment advisory services. On April 1, 2012, the Company, in exchange for the LLC Interests, issued 631 and 6 units of Silvercrest L.P. and Silvercrest GP LLC, respectively, at closing, with a fair value of $132. Furthermore, as part of the LLC Agreement, the Company could be obligated to make a future one-time earnout payment in shares equal to the difference between $800 and the annualized revenue at closing only if incremental revenue, as defined, reaches an amount equal to $400 prior to March 31, 2014, as defined in the LLC Agreement.
| | | | | Shares issued | | $ | 132 | | Call rights option issued | | | 15 | | | | | | | Total purchase consideration | | $ | 147 | | | | | | |
The following table summarizes the final amounts allocated to the acquired assets and assumed liabilities. The excess of the purchase price over the fair values of assets acquired and liabilities assumed was allocated to goodwill.
| | | | | Receivables | | $ | 7 | | Liabilities | | | (7 | ) | | | | | | Total fair value of net tangible assets acquired | | | — | | Goodwill | | | 147 | | | | | | | Total purchase consideration | | $ | 147 | | | | | | |
The pro forma information below represents consolidated results of operations as if the acquisitionsacquisition of Milbank and Commodity Advisors occurred on January 1, 2011.2012 and the acquisition of Ten-Sixty occurred on January 1, 2013 and January 1, 2012. The pro forma information has been included for comparative purposes and is not indicative of results of operations of the consolidated Company had the acquisitionacquisitions occurred as of January 1, 2011,2013 and 2012, nor is it necessarily indicative of future results. | | | | Pro Forma Six
Months Ended
June 30, 2011 | | | Pro Forma
Three Months
Ended
March 31, 2013 | | | Pro Forma
Three Months
Ended
March 31, 2012 | | Total Revenue | | $ | 23,520 | | | $ | 13,913 | | | $ | 12,095 | | Net Income | | $ | 8,443 | | | $ | 5,516 | | | $ | 4,301 | |
4. INVESTMENTS AND FAIR VALUE MEASUREMENTS
| 4. | INVESTMENTS AND FAIR VALUE MEASUREMENTS |
Investments include $74$84 and $1,034$1,980 as of June 30, 2012March 31, 2013 and December 31, 2011,2012, respectively, representing the Company’s equity method investments in affiliated investment funds which have been established and managed by the Company and its affiliates. The Company’s financial interest in these funds can range up to 2%. Despite the Company’s insignificant financial interest, the Company exertsexercises significant influence over these funds as the Company typically serves as the general partner, managing member or equivalent for these funds. During 2007, the Silvercrest Funds granted rights to the unaffiliated investors in each respective fund to provide that a simple majority of the fund’s unaffiliated investors will have the right, without cause, to remove the general partner or equivalent of that fund or to accelerate the liquidation date of that fund in accordance with certain procedures. At June 30,March 31, 2013 and 2012, and 2011, the Company determined none of the Silvercrest Funds were required to be consolidated. The Company’s involvement with these entities began on the dates that they were formed, which rangesrange from July 2003 to July 2008. The Company evaluates each of its equity method investments to determine if any were significant as defined by guidance from the United States Securities and Exchange Commission. As of and for the six months ended
June 30, 2012, no individual equity method investment held by the Company met the significance criteria. As such, the Company is not required to present summarized financial information for investments accounted for under the equity method.
In 2011, the Company entered into derivative contracts that were not designated as accounting hedges. The fair value of these derivative assets is recorded within Investments in the Consolidated Statement of Financial Condition as of December 31, 2011. The Company entered into these derivative instruments in order to mitigate the risk of any exposure during the fourth quarter between the values of certain investor redemptions and the actual proceeds received by one of our funds when the underlying securities to these redemptions were sold. As of June 30, 2012, all derivative assets had been sold. For the six months ended June 30, 2012, realized gains for options and other derivative contracts were $8 and realized (losses) were ($10).
Fair Value Measurements U.S. generally accepted accounting principles (“GAAP”) establishes a hierarchal disclosure framework which prioritizes and ranks the level of market price observability used in measuring investments at fair value. Market price observability is affected by a number of factors, including the type of investment, the characteristics specific to the investment and the state of the marketplace including the existence and transparency of transactions between market participants. Investments with readily available active quoted prices or for which fair value can be measured from actively quoted prices in an orderly market generally will have a higher degree of market price observability and a lesser degree of judgment used in measuring fair value. Investments measured and reported at fair value are classified and disclosed in one of the following categories. Level I: Quoted prices are available in active markets for identical investments as of the reporting date. The type of investments in Level I include listed equities and listed derivatives. Level II: Pricing inputs are other than quoted prices in active markets, which are either directly or indirectly observable as of the reporting date, and fair value is determined through the use of models or other valuation methodologies. Investments which are generally included in Level II include corporate bonds and loans, less liquid and restricted equity securities, certain over-the counter derivatives, and certain fund of hedge funds investments in which the Company has the ability to redeem its investment at net asset value at, or within three months of, the reporting date. | bonds and loans, less liquid and restricted equity securities, certain over-the counter derivatives, and certain fund of hedge funds investments in which the Company has the ability to redeem its investment at net asset value at, or within three months of, the reporting date. |
Level III: Pricing inputs are unobservable for the investment and includes situations where there is little, if any, market activity for the investment. The inputs into the determination of fair value require significant management judgment or estimation. Investments that are included in Level III generally include general and limited partnership interests in private equity and real estate funds, credit-oriented funds, certain over-the counter derivatives, funds of hedge funds which use net asset value per share to determine fair value in which the Company may not have the ability to redeem its investment at net asset value at, or within three months of, the reporting date, distressed debt and non-investment grade residual interests in securitizations and collateralized debt obligations. In certain cases, the inputs used to measure fair value may fall into different levels of the fair value hierarchy. In such cases, the determination of which category within the fair value hierarchy is appropriate for any given investment is based on the lowest level of input that is significant to the fair value measurement. The Company’s assessment of the significance of a particular input to the fair value measurement in its entirety requires judgment and considers factors specific to the investment. The following table summarizes the valuationclassification of the Company’s financial assets byin the fair value hierarchy as of June 30, 2012:March 31, 2013: | | | | Level I | | | Level II | | | Level III | | | Total | | | Level I | | | Level II | | | Level III | | | Total | | Assets | | | | | | | | | | | | | | | | | Cash equivalents – Money Market Funds | | $ | 1,038 | | | $ | — | | | $ | — | | | $ | 1,038 | | | $ | 1,041 | | | $ | — | | | $ | — | | | $ | 1,041 | | | | | | | | | | | | | | | | | | | | | | | | | | |
The following table summarizes the valuationclassification of the Company’s financial assets byin the fair value hierarchy as of December 31, 2011:2012: | | | | Level I | | | Level II | | | Level III | | | Total | | | Level I | | | Level II | | | Level III | | | Total | | Assets | | | | | | | | | | | | | | | | | Cash equivalents – Money Market Funds | | $ | 1,037 | | | $ | — | | | $ | — | | | $ | 1,037 | | | $ | 1,020 | | | $ | — | | | $ | — | | | $ | 1,020 | | Free Standing Derivatives – Put Options | | | 94 | | | | — | | | | — | | | | 94 | | | | | | | | | | | | | | | | | | | | | | | | | | | | | | $ | 1,131 | | | $ | — | | | $ | — | | | $ | 1,131 | | | | | | | | | | | | | | | | |
5. RECEIVABLES, NET
At March 31, 2013 and December 31, 2012, financial instruments that are not held at fair value are categorized in the table below: | | | | | | | | | | | | | | | | | | | | | | | | March 31, 2013 | | | December 31, 2012 | | | | | | | | Carrying
Amount | | | Fair
Value | | | Carrying
Amount | | | Fair
Value | | | Fair Value
Hierarchy | | Financial Assets: | | | | | | | | | | | | | | | | | | | | | Cash | | $ | 3,314 | | | $ | 3,314 | | | $ | 12,392 | | | $ | 12,392 | | | | | | Restricted Certificates of Deposit and Escrow | | $ | 1,275 | | | $ | 1,275 | | | $ | 1,020 | | | $ | 1,020 | | | | Level 1 | (1) | Financial liabilities: | | | | | | | | | | | | | | | | | | | | | Notes Payable | | $ | 4,350 | | | $ | 4,350 | | | $ | 3,315 | | | $ | 3,315 | | | | Level 2 | (2) |
| (1) | Restricted certificates of deposit and escrow consists of money market funds that are carried at either cost or amortized cost that approximates fair value due to their short-term maturities. The money market funds are valued through the use of quoted market prices, or $1.00, which is generally the NAV of the funds. |
| (2) | The carrying value of notes payable approximates fair value, which is determined based on interest rates currently available to the Company for similar debt. |
The following is a summary of receivables as of June 30, 2012March 31, 2013 and December 31, 2011:2012: | | | | 2012 | | 2011 | | | 2013 | | 2012 | | Management and advisory fees receivable | | $ | 1,996 | | | $ | 1,433 | | | Management and advisory fees receivable . | | | $ | 1,611 | | | $ | 1,815 | | Unbilled receivables | | | 1,942 | | | | 1,134 | | | | 1,917 | | | | 1,787 | | Other receivables | | | 1 | | | | 57 | | | | 92 | | | | 435 | | | | | | | | | | | | | | | Receivables | | | 3,939 | | | | 2,624 | | | | 3,620 | | | | 4,037 | | Allowance for doubtful receivables | | | (385 | ) | | | (386 | ) | | | (313 | ) | | | (362 | ) | | | | | | | | | | | | | | Receivables, net | | $ | 3,554 | | | $ | 2,238 | | | $ | 3,307 | | | $ | 3,675 | | | | | | | | | | | | | | |
6. FURNITURE, EQUIPMENT AND LEASEHOLD IMPROVEMENTS, NET
| 6. | FURNITURE, EQUIPMENT AND LEASEHOLD IMPROVEMENTS, NET |
The following is a summary of furniture, equipment and leasehold improvements, net as of June 30, 2012March 31, 2013 and December 31, 2011:2012: | | | | 2012 | | 2011 | | | 2013 | | 2012 | | Leasehold improvements | | $ | 3,466 | | | $ | 3,466 | | | $ | 3,557 | | | $ | 3,557 | | Furniture and equipment | | | 3,420 | | | | 3,360 | | | Artwork | | | 338 | | | | 338 | | | Furniture and equipment . | | | | 3,553 | | | | 3,526 | | Artwork . . | | | | 338 | | | | 338 | | | | | | | | | | | | | | | Total cost | | | 7,224 | | | | 7,164 | | | | 7,448 | | | | 7,421 | | Accumulated depreciation and amortization | | | (5,121 | ) | | | (4,889 | ) | | | (5,458 | ) | | | (5,360 | ) | | | | | | | | | | | | | | Furniture, equipment and leasehold improvements, net | | $ | 2,103 | | | $ | 2,275 | | | $ | 1,990 | | | $ | 2,061 | | | | | | | | | | | | | | |
Depreciation expense for the sixthree months ended June 30,March 31, 2013 and 2012 was $98 and 2011 was $231 and $208,$113, respectively. 7. GOODWILL
The following is a summary of the changes to the carrying amount of goodwill as of June 30, 2012March 31, 2013 and December 31, 2011:2012: | | | | 2012 | | 2011 | | | 2013 | | 2012 | | Beginning of Period: | | | | | | Beginning | | | | | | Gross balance | | $ | 32,098 | | | $ | 28,408 | | | $ | 33,306 | | | $ | 32,098 | | Accumulated impairment losses | | | (17,415 | ) | | | (17,415 | ) | | Accumulated impairment losses . | | | | (17,415 | ) | | | (17,415 | ) | | | | | | | | | | | | | | Net balance | | | 14,683 | | | | 10,993 | | | Net balance . . | | | | 15,891 | | | | 14,683 | | Purchase price adjustments from earnouts | | | — | | | | 419 | | | | — | | | | 1,061 | | Acquisition of Milbank | | | — | | | | 3,271 | | | Acquisition of MW Commodity Advisors | | | 147 | | | | — | | | End of period | | | | | | Acquisition of Commodity Advisors . | | | | — | | | | 147 | | Acquisition of Ten-Sixty | | | | 2,233 | | | | — | | Ending | | | | | | Gross balance | | | 32,245 | | | | 32,098 | | | | 35,539 | | | | 33,306 | | Accumulated impairment losses | | | (17,415 | ) | | | (17,415 | ) | | | (17,415 | ) | | | (17,415 | ) | | | | | | | | | | | | | | Net balance | | $ | 14,830 | | | $ | 14,683 | | | $ | 18,124 | | | $ | 15,891 | | | | | | | | | | | | | | |
8. INTANGIBLE ASSETS
The following is a summary of intangible assets as of June 30, 2012March 31, 2013 and December 31, 2011:2012: | | | | Customer
Relationships | | Other
Intangible Assets | | Total | | | Customer
Relationships | | Other
Intangible Assets | | Total | | Cost | | | | | | | | | | | | | Balance, June 30, 2012 | | $ | 15,910 | | | $ | 1,566 | | | $ | 17,476 | | | Balance, January 1, 2013 | | | $ | 15,910 | | | $ | 1,566 | | | $ | 17,476 | | Acquisition of certain assets of Ten-Sixty | | | | 1,650 | | | | 97 | | | | 1,747 | | | | | | | | | | | | | Balance, March 31, 2013 | | | | 17,560 | | | | 1,663 | | | | 19,223 | | Useful lives | | | | 10-20 years | | | | 3-5 years | | | | Accumulated amortization | | | | | | | | Balance, January 1, 2013 | | | | (4,238 | ) | | | (875 | ) | | | (5,113 | ) | Amortization expense | | | | (263 | ) | | | (88 | ) | | | (351 | ) | | | | | | | | | | | | Balance, March 31, 2013 | | | | (4,501 | ) | | | (963 | ) | | | (5,464 | ) | | | | | | | | | | | | Net book value | | | $ | 13,057 | | | $ | 705 | | | $ | 13,759 | | | | | | | | | | | | | Cost | | | | | | | | Balance, January 1, 2012 | | | $ | 15,910 | | | $ | 1,566 | | | $ | 17,476 | | | | | | | | | | | | | Balance, December 31, 2012 | | | | 15,910 | | | | 1,566 | | | | 17,476 | | Useful lives | | | 15-20 years | | | | 3-5 years | | | | | | 15-20 years | | | | 3-5 years | | | | Accumulated amortization | | | | | | | | | | | | | Balance, January 1, 2012 | | | (3,144 | ) | | | (522 | ) | | | (3,666 | ) | | | (3,144 | ) | | | (522 | ) | | | (3,666 | ) | Amortization expense | | | (547 | ) | | | (176 | ) | | | (723 | ) | | | (1,094 | ) | | | (353 | ) | | | (1,447 | ) | | | | | | | | | | | | | | | | | | | | Balance, June 30, 2012 | | | (3,691 | ) | | | (698 | ) | | | (4,389 | ) | | Balance, December 31, 2012 | | | | (4,238 | ) | | | (875 | ) | | | (5,113 | ) | | | | | | | | | | | | | | | | | | | | Net book value | | $ | 12,219 | | | $ | 868 | | | $ | 13,087 | | | $ | 11,672 | | | $ | 691 | | | $ | 12,363 | | | | | | | | | | | | | | | | | | | | |
Amortization expense related to the intangible assets was $351 and $362 for the three months ended March 31, 2013 and 2012, respectively. | | | | | | | | | | | | | | | | Customer
Relationships | | | Other
Intangible Assets | | | Total | | Cost | | | | | | | | | | | | | Balance, January 1, 2011 | | $ | 7,710 | | | $ | 750 | | | $ | 8,460 | | Acquisition of certain assets of Milbank | | | 8,200 | | | | 816 | | | | 9,016 | | | | | | | | | | | | | | | Balance, December 31, 2011 | | | 15,910 | | | | 1,566 | | | | 17,476 | | Useful lives | | | 15-20 years | | | | 3-5 years | | | | | | Accumulated amortization | | | | | | | | | | | | | Balance, January 1, 2011 | | | (2,351 | ) | | | (338 | ) | | | (2,689 | ) | Amortization expense | | | (793 | ) | | | (184 | ) | | | (977 | ) | | | | | | | | | | | | | | Balance, December 31, 2011 | | | (3,144 | ) | | | (522 | ) | | | (3,666 | ) | | | | | | | | | | | | | | Net book value | | $ | 12,766 | | | $ | 1,044 | | | $ | 13,810 | | | | | | | | | | | | | | |
Amortization related to the Company’s finite life intangible assets is scheduled to be expensed over the next five years and thereafter as follows: | Remainder of 2012 | | $ | 724 | | | 2013 | | | 1,370 | | | $ | 1,170 | | 2014 | | | 1,229 | | | | 1,422 | | 2015 | | | 1,100 | | | | 1,291 | | 2016 | | | 1,044 | | | | 1,236 | | 2017 | | | | 1,135 | | Thereafter | | | 7,620 | | | | 7,505 | | | | | | | | | Total | | $ | 13,087 | | | $ | 13,759 | | | | | | | | |
9. NOTES PAYABLE
The following is a summary of notes payable: | | | | June 30, 2012 | | | March 31, 2013 | | | | | Interest Rate | | Amount | | | Interest Rate | | Amount | | Principal on fixed rate notes | | 5.0% | | $ | 3,181 | | | | 5.0 | % | | $ | 3,877 | | Variable rate notes issued for redemption of partners’ interest (see Note 16) | | Prime plus 1% | | | 1,104 | | | Variable rate notes issued for redemption of partners’ interests (see Note 16) | | | | Prime plus 1 | % | | | 418 | | Interest payable | | | | | 129 | | | | | | 55 | | | | | | | | | | | | | Total, June 30, 2012 | | | | $ | 4,414 | | | Total, March 31, 2013 | | | | | $ | 4,350 | | | | | | | | | | | | |
| | | | December 31, 2011 | | | December 31, 2012 | | | | | Interest Rate | | Amount | | | Interest Rate | | Amount | | Principal on fixed rate notes | | 5.0% | | $ | 3,181 | | | | 5.0 | % | | $ | 2,397 | | Variable rate notes issued for redemption of partners’ interest (see Note 16) | | Prime plus 1% | | | 1,558 | | | | Prime plus 1 | % | | | 872 | | Interest payable | | | | | 70 | | | | | | 46 | | | | | | | | | | | | | Total, December 31, 2011 | | | | $ | 4,809 | | | Total, December 31, 2012 | | | | | $ | 3,315 | | | | | | | | | | | | |
The carrying value of notes payable approximates fair value. The fixed rate note,notes, which isare related to the Ten-Sixty and Milbank acquisition, approximatesacquisitions, approximate fair value becausebased on interest rates currently available to the note, which was part of an arm’s length transaction, was executed on November 1, 2011.Company for similar debt. The variable rate notes are based on a multiple of the U.S. Prime Rate. Future principal amounts payable under the notes payable are as follows: | | | | | Remainder of 2012 | | $ | 1,202 | | 2013 | | | 1,556 | | 2014 | | | 963 | | 2015 | | | 564 | | | | | | | Total | | $ | 4,285 | | | | | | |
| | | | | 2013 . | | $ | 1,536 | | 2014 . | | | 1,412 | | 2015 . | | | 912 | | 2016 . | | | 348 | | 2017 . | | | 87 | | | | | | | Total . | | $ | 4,295 | | | | | | |
10. COMMITMENTS AND CONTINGENCIES
| 10. | COMMITMENTS AND CONTINGENCIES |
Lease Commitments The Company leases office space pursuant to operating leases that are subject to specific escalation clauses. Rent expense charged to operations for the sixthree months ended June 30,March 31, 2013 and 2012 and 2011 amounted to $1,737$901 and $1,675, respectively .$864, respectively. The Company received sub-lease income from subtenants forduring the sixthree months ended June 30,March 31, 2013 and 2012 of $284 and 2011 of $466 and $511,$255, respectively. Therefore, for the sixthree months ended June 30,March 31, 2013 and 2012, and 2011, net rent expense amounted to $1,270$617 and $1,164,$609, respectively, and is included in general, administrative and other expenses in the Condensed Consolidated Statement of Operations. During 2006, the Company entered into a lease agreement for office space for its headquarters. The lease commenced on January 1, 2007 and expires September 30, 2017. The lease is subject to escalation clauses and provides for rent free periods of 6 to 9 months and a leasehold improvement allowance of $1,538 provided the Company spends at least an additional $513 on improvements. The Company spent $3,284 on leasehold improvements and received $1,499 of the allowance during 2007; the remaining $39 of the allowance was received in 2008. As security for performance under the leases, the Company is required to maintain letters of credit in favor of the landlord totaling $2,023 that were reduced to $1,013 on August 31, 2010 and can be further reduced to $506 on August 31, 2014. The letter of credit is collateralized by a certificate of deposit in an equal amount. Future minimum lease payments and rentals under lease agreements which expire through 2017 are as follows: | | | | | | | | | | | | | | | | Minimum
Lease
Commitments | | | Non-
cancellable
Subleases | | | Minimum Net
Rentals | | Remainder of 2012 | | $ | 1,755 | | | $ | (274 | ) | | $ | 1,481 | | 2013 | | | 3,342 | | | | (600 | ) | | | 2,742 | | 2014 | | | 3,345 | | | | (317 | ) | | | 3,028 | | 2015 | | | 3,293 | | | | (331 | ) | | | 2,962 | | 2016 | | | 3,239 | | | | (331 | ) | | | 2,908 | | Thereafter | | | 2,429 | | | | (248 | ) | | | 2,181 | | | | | | | | | | | | | | | Total | | $ | 17,403 | | | $ | (2,101 | ) | | $ | 15,302 | | | | | | | | | | | | | | |
In 2009, the Company abandoned a portion of its unutilized space at its headquarters and subleased the space through September 29, 2017. The Company recorded a lease abandonment charge in 2009 in the amount of $1,154 (on a net present value basis). The balance of the related liability at January 1, 2011 was $894, which was reduced by lease payments during 2011 of $174, resulting in an ending balance at December 31, 2011 of $720. This liability was further reduced by lease payments during the six months ended June 30, 2012 of $58. On May 1, 2012, the Company reoccupied space at its headquarters that it had previously abandoned in 2009. As a result, the Company released the remaining abandonment-related liability of $662, and wrote off prepaid interest expense of $86, resulting in a net lease abandonment reversal of $576. This reversal was recorded in general and administrative expense in the consolidated statement of operations. The liability is included in Deferred Rent on the Condensed Consolidated Statement of Financial Condition at December 31, 2011.
| | | | | | | | | | | | | | | | Minimum
Lease
Commitments | | | Non-cancellable
Subleases | | | Minimum Net
Rentals | | Remainder of 2013 | | $ | 2,756 | | | $ | (538 | ) | | $ | 2,218 | | 2014 | | | 3,675 | | | | (444 | ) | | | 3,231 | | 2015 | | | 3,632 | | | | (458 | ) | | | 3,174 | | 2016 | | | 3,590 | | | | (458 | ) | | | 3,132 | | 2017 | | | 2,780 | | | | (354 | ) | | | 2,426 | | | | | | | | | | | | | | | Total | | $ | 16,433 | | | $ | (2,252 | ) | | $ | 14,181 | | | | | | | | | | | | | | |
In 2010, an escrow account was funded by a sub-tenant whose sub-lease with the Company commenced on January 1, 2011. Pursuant to the sub-lease, the tenant was required to deposit the first 16 months of rent into the escrow account totaling $452. The initial deposit was depleted as of April 2012, and an additional depositdeposits of $99 wasin June 2012 and $339 in December 2012 were made by the sub-tenant. This account has been recorded as restricted certificates of deposit and escrow on the consolidated balance sheet.Condensed Consolidated Statements of Financial Condition. As of June 30, 2012,March 31, 2013, the remaining balance in the escrow account was $99.$255. The Company recorded a loss on this sub-lease charge in 2011 of $150 (on a net present value basis). The related unamortized liability of $247,that was established in January 2011 was $247 and was reduced by lease payments during the year2011 of $85, resulting in an ending balance at December 31, 2011during 2012 of $162. This liability was further reduced by lease payments$85 and during the sixthree months ended June 30, 2012March 31, 2013 of $42,$21, resulting in an ending balance at June 30, 2012March 31, 2013 of $120.$56. This liability is included in Deferred Rentdeferred rent on the Condensed Consolidated StatementStatements of Financial Condition.
The Company has capital leases for certain office equipment. The principal balance of these leases was $43 and $55$33 as of June 30, 2012March 31, 2013 and December 31, 2011, respectively.2012. Contingent Consideration In connection with its acquisition of MCG in October 2008, the Company entered into a contingent consideration agreement whereby the former members of MCG were entitled to contingent consideration equal to 22% of adjusted annual EBITDA for each of the five years subsequent to the date of acquisition. As the acquisition was completed prior to January 1, 2009, contingent consideration is recognized when the contingency is resolved pursuant to the authoritative guidance on business combinations in effect at the date of the closing of the acquisition. The contingent consideration related to the MCG acquisition is recorded on the date when the contingency is resolved. Contingent consideration payments of $0 and $390 were made during the sixthree months ended June 30,March 31, 2013 and 2012, and 2011respectively, related to MCG wereand are reflected in investing activities in the condensed consolidated statement of cash flows. Indemnification Agreement
On October 13, 2011, Silvercrest Strategic Opportunities Fund (“SSOF”) entered into a $5,000,000 revolving credit agreement (the “SSOF Credit Agreement”) with Pershing LLC (“Pershing”). Simultaneously with the execution of the SSOF Credit Agreement, SAMG LLC, the investment advisor to SSOF, entered into an indemnification agreement (the “Indemnification Agreement”) with Pershing whereby SAMG LLC agreed to indemnify Pershing from claims arising out of the exercise by Pershing of any rights and remedies under the security agreementQuarterly contingent payments related to the obligationsCommodity Advisors acquisition were accrued when the contingency was resolved. The total of SSOF underthese payments for the SSOF Credit Agreement. The SSOF Credit Agreement matured on January 15, 2012three months ended March 31, 2013 was $99, and were recorded as compensation expense in the condensed consolidated statement of December 31, 2011 $3,224 inclusive of interest was outstanding on the revolving credit line.operations.
11. PARTNERS’ INCENTIVE ALLOCATIONS AND ALLOCATION OF INCOME AND LOSSES
| 11. | PARTNERS’ INCENTIVE ALLOCATIONS AND ALLOCATION OF INCOME AND LOSSES |
Pursuant to Silvercrest’s Operating Agreement, as amended and restated, partner incentive allocations are treated as distributions of net income. The remaining net income or loss after partner incentive allocations is generally allocated to the partners based on their pro rata ownership. Net income allocation is subject to the recovery of the allocated losses of prior periods. Distributions of partner incentive allocations of net income for the sixthree months ended June 30,March 31, 2013 and 2012 and 2011 amounted to $8,775$12,104 and $5,073,$6,581, respectively, and are included in excess of liabilities, redeemable partners’ capital and partners’ capital over assets in the Condensed Consolidated Statements of Financial Condition. 12. NOTES RECEIVABLE FROM PARTNERS
| 12. | NOTES RECEIVABLE FROM PARTNERS |
Partner contributions are made in cash, in the form of five or six year interest-bearing promissory notes and/or in the form of nine year interest-bearing limited recourse promissory notes. Limited recourse promissory notes were issued in January 2008, August 2009 and September 2009 with interest rates of 3.53%, 2.77% and 2.84%, respectively. The recourse limitation includes a stated percentage of the initial principal amount of the limited recourse note plus a stated percentage of the accreted principal amount as of the date upon which all amounts due are paid in full plus all costs and expenses required to be paid by the borrower and all amounts required to be paid pursuant to a pledge agreement associated with each note issued. Certain notes receivable are payable in annual installments and are collateralized by the Company’s shares that are purchased with the note. Notes receivable from partners as of June 30, 2012 and December 31, 2011 are as follows: | | | | June 30,
2012 | | December 31,
2011 | | | March 31,
2013 | | December 31,
2012 | | Balance, beginning of period | | $ | 6,024 | | | $ | 6,125 | | | Beginning balance | | | $ | 3,410 | | | $ | 6,024 | | Repayment of notes | | | (950 | ) | | | (1,083 | ) | | | (720 | ) | | | (2,864 | ) | Forgiveness of notes receivable | | | – | | | | (34 | ) | | Interest accrued and capitalized on notes receivable | | | 82 | | | | 180 | | | | 26 | | | | 138 | | New notes receivable issued to partners | | | 112 | | | | 836 | | | | — | | | | 112 | | | | | | | | | | | | | | | Balance, end of period | | $ | 5,268 | | | $ | 6,024 | | | Ending balance | | | $ | 2,716 | | | $ | 3,410 | | | | | | | | | | | | | | |
Full recourse and limited recourse notes receivable from partners as of June 30, 2012March 31, 2013 and December 31, 20112012 are $2,756$1,246 and $2,512$1,953 and $3,549$1,470 and $2,475,$1,457, respectively. There is no allowance for credit losses on notes receivable from partners as of June 30 2012March 31, 2013 and December 31, 2011. During 2011,2012. On April 17, 2013, one of the Company forgave $34Company’s executives repaid outstanding notes payable and accrued interest of notes receivable$167 that were initially issued in connection with the terminationacquisition of a partner whose corresponding capital was forfeited.his partnership interests. 13. RELATED PARTY TRANSACTIONS
| 13. | RELATED PARTY TRANSACTIONS |
During 20122013 and 2011,2012, the Company provided services to the domesticated Silvercrest Hedged Equity Fund LP (formed in 2011 and formerly Silvercrest Hedged Equity Fund), Silvercrest Hedged Equity Fund (International), Silvercrest Hedged Equity Fund Ltd (formed in 2011 and includes ERISA investors of Silvercrest Hedged Equity Fund LP), the domesticated Silvercrest Emerging Markets Fund LP (formed in 2011 and formerly Silvercrest Emerging Markets Fund), Silvercrest Emerging Markets Fund (International), Silvercrest Emerging Markets Fund Ltd (formed in 2011 and includes ERISA investors of Silvercrest Emerging Markets Fund LP), Silvercrest Market Neutral Fund (currently in liquidation), Silvercrest Market Neutral Fund (International) (currently in liquidation), Silvercrest Municipal Advantage Portfolio A LLC, Silvercrest Municipal Advantage Portfolio P LLC, the domesticated Silvercrest Strategic Opportunities Fund LP (formed in 2011 and formerly Silvercrest Strategic Opportunities Fund), and Silvercrest Strategic Opportunities Fund (International) (terminated in 2011). These entities operate as feeder funds investing through master-feeder structures except for Silvercrest Hedged Equity Fund LP, Silvercrest Hedged Equity Fund Ltd, Silvercrest Emerging Markets Fund LP, Silvercrest Emerging Markets Fund Ltd, and Silvercrest Strategic Opportunities Fund LP which operate and invest as stand-alone funds. Silvercrest also provides services for the Silvercrest Global Opportunities Fund, L.P. (currently in liquidation), Silvercrest Global Opportunities Fund (International), Ltd. (currently in liquidation), Silvercrest Capital Appreciation Fund LLC (currently in liquidation), Silvercrest International Equity Fund, L.P., Silvercrest Municipal Special Situations Fund LLC, Silvercrest Municipal Special Situations Fund II LLC, Silvercrest Select Growth Equity Fund, L.P., Silvercrest Global Partners, L.P., Silvercrest Small Cap, L.P. and Silvercrest Special Situations, L.P., and Silvercrest Commodity Strategies Fund, LP which operate and invest separately as stand-alonestand- alone funds. Pursuant to agreements with the above entities, the Company provides investment advisory services and receives an annual management fee of 0% to 1.75% of assets under management and a performance fee or allocation of 0% to 10% of the above entities’ net appreciation over a high-water mark. For the sixthree months ended June 30,March 31, 2013 and 2012, and 2011, the Company earned from the above activities management fee income, which is included in Management and advisory fees in the Consolidated Statement of Operations, of $4,235$2,180, and $2,445,$2,030, respectively, and performance fees and allocations of $16$3, and $31, respectively, which is included in performance fees in the Statement of Operations.$0, respectively. As of June 30, 2012March 31, 2013 and December 31, 2011,2012, the Company was owed $2,033$1,220 and $2,043,$1,622, respectively, from its various funds which are included in Due from Silvercrest Funds in the Consolidated Statements of Financial Condition.funds. For the sixthree months ended June 30,March 31, 2013 and 2012, and 2011, the Company earned advisory fees of $215$103 and $364,$98, respectively, from assets managed on behalf of certain of its partners. As of June 30, 2012March 31, 2013 and December 31, 2011,2012, the Company is owed approximately $29$21 and $19,$17, respectively, from certain of its partners. 14. INCOME TAXES
As of June 30, 2012,March 31, 2013, the Company had net deferred tax liabilities of $105,$157, which is recorded as a non-current deferred tax assetliability of $28$33 (specific to SLP which consists primarily of liabilities related to temporary differences between the financial statement and tax bases of intangible assets offset in part by amounts for deferred rent expense and equity-based compensation offset by a liability for the excess of book over tax basis of intangible assets)expense) and a non-current deferred tax liability of $135$124 related to the corporate activity of SFS which is primarily related to temporary differences between the financial statement and tax bases of intangible assets. These amounts are included in the “prepaidprepaid expenses and other assets”assets and “deferreddeferred tax and other liabilities”liabilities on the balance sheet,Condensed Consolidated Statement of Financial Position, respectively. As of June 30, 2011,March 31, 2012, the Company had net deferred tax liabilities of $53,$131, which is recorded as a non-current deferred tax asset of $95$7 (specific to SLP which consists primarily of assets for deferred rent expense and equity-based compensation offset by a liability for the excess of book over tax basis of intangible assets) and non-current deferred tax liability of $148$138 related to the corporate activity of SFS which is primarily related to temporary differences between the financial statement and tax bases of intangible assets. These amounts are included in the “prepaidprepaid expenses and other assets”assets and “deferreddeferred tax and other liabilities”liabilities on the balance sheet,Condensed Consolidated Statement of Financial Position, respectively. The change in the deferred tax asset for SLP from June 30, 2011March 31, 2012 to June 30, 2012March 31, 2013 is attributable primarily to the long-termcurrent period reversal of deferred tax liability established through purchase accounting for the book over tax basis of Milbank intangible assets in the fourth quarter of 2011.accounts. The current tax expense was $519$303 and $404$249 for the sixthree months ended June 30,March 31, 2013 and 2012, and 2011, respectively. The deferred tax benefitexpense for the sixthree months ended June 30,March 31, 2013 and 2012, was $26 and 2011 was ($3) and ($226),$21, respectively, which when combined with current tax expense, resulted in an income tax provision for the sixthree months ended June 30,March 31, 2013 and 2012 of $329 and 2011 of $516 and $178,$270, respectively, recognized in the Condensed Consolidated Statement of Operations. The current expense increased from the comparable period for 20112012 mainly due to increased profitability during 2012.2013. The deferred benefitexpense difference is attributable primarily to the decreaseincrease in price at which deferred equity units vested and the projectedimpact on the deferred tax rate applicable to the future operations of SFS which was recorded during the first quarter of 2011.account between 2012 and 2013. In the normal course of business, the Company is subject to examination by federal, state, and local tax regulators. As of June 30, 2012,March 31, 2013, the Company’s U.S. federal income tax returns for the years 20082009 through 20102011 are open under the normal three-year statute of limitations and therefore subject to examination. The Company does not believe that it has any tax positions for which it is reasonably possible that the total amounts of unrecognized tax benefits will significantly increase or decrease within the next twelve months. 15. REDEEMABLE PARTNERSHIP UNITS
| 15. | REDEEMABLE PARTNERSHIP UNITS |
Upon the termination of employment, of the Terminated Employee, as defined, of the Company, the Company has a right to call the terminated employee’s partnership units. In addition, the terminated employee also has a right to put the partnership units back to the Company upon termination or death, provided the terminated employee has complied with certain restrictions as described in the partnership agreement. With respect to the two founders of the Company, their estate, heirs or other permitted related parties cannot require the Company to redeem their units prior to April 1, 2013. In accordance with the provisions of the Company’s partnership and operating agreements, the put described above expires with the consummation of an IPO or Sale Transaction, as defined in our partnership and operating agreements. The redemption value per share is based on a multiple of historical EBITDA, pursuant to the Company’s partnership agreement. Once units are called or put back to the Company, the redemption results in the issuance of a promissory note by the Company which is typically paid in installments over four years. The Company has recognized redeemable partners’ capital of $96,360$113,764 and $91,201$102,017 as of June 30, 2012March 31, 2013 and December 31, 2011,2012, respectively, which represents the amount of partners’ capital subject to both put and call rights. 16. EQUITY-BASED COMPENSATION
| 16. | EQUITY-BASED COMPENSATION |
Determining the appropriate fair value model and calculating the fair value of equity compensation awards requires the input of complex and subjective assumptions, including the expected life of the equity compensation awards and the stock price volatility. In addition, determining the appropriate amount of associated periodic expense requires management to estimate the amount of employee forfeitures and the likelihood of the achievement of certain performance targets. The assumptions used in calculating the fair value of equity compensation awards and the associated periodic expense represent management’s best estimates, but these estimates involve inherent uncertainties and the application of judgment. As a result, if factors change and the Company deems it necessary in the future to modify the assumptions it made or to use different assumptions, or if the quantity and nature of the Company’s equity-based compensation awards changes, then the amount of expense may need to be adjusted and future equity compensation expense could be materially different from what has been recorded in the current period. The Company has granted equity-based compensation awards to certain partners under the Company’s 2010, 2011 and 20112012 Deferred Equity programs (the “Equity Programs”). The Equity Programs allow for the granting of deferred equity units based in whole on the fair value of the Company’s units. These deferred equity units contain both service and performance requirements. Each grant includes a deferred equity unit (“Deferred Equity Unit”) and performance unit (“Performance Unit”) subject to various terms including terms of forfeiture and acceleration of vesting. Each 100 Deferred Equity Units represent the unsecured right to receive one unit of Silvercrest GP LLC and 99 units of Silvercrest L.P. The Deferred Equity Unit represents the unsecured right to receive one unit of the Company or the equivalent cash value of up to fifty percent (50%) (or such other percentage as may be determined by the Company’s Executive Committee) of the Company’s units issuable upon the vesting of any such Deferred Equity Units and the remaining fifty percent (50%) in units upon the vesting of any such Deferred Equity Units. Such cash amount is to be calculated using the redemption price of such units as of the applicable vesting date. The Performance Unit represents the unsecured right to receive one unit of the Company for every two units of the Company issuable upon the vesting of any such Deferred Equity Units. Twenty-five percent of the Deferred Equity Units shall vest on each of the first, second, third, and fourth anniversaries of the grant date until the Deferred Equity Units are fully vested. The Performance Units shall be subject to forfeiture and subject to the satisfaction of a predetermined performance target at the end of the four year vesting period. If the performance target is achieved, then the Performance Units shall vest at the end of the four year vesting period. The rights of the partners with respect to the Performance Units shall remain subject to forfeiture at all times prior to the date on which such rights become vested and will be forfeited if the performance target is not achieved. Distributions related to Deferred Equity Units that are paid to partners are charged to excess of liabilities, redeemable partners’ capital and partners’ capital over assets. Distributions related to the unvested portion of Deferred Equity Units that are assumed to be forfeited are recognized as additional compensation expense because these distributions are not required to be returned by partners to the Company upon forfeiture. The Company utilized both discounted cash flow and guideline company valuation methods to determine the grant date fair value of the Deferred Equity Units. The grant date fair values of Performance Units were determined by applying a performance probability factor to the Deferred Equity Unit Value. These methodologies included the use of third party data and discounts for lack of control and marketability. All Deferred Equity Units are considered to be liability awards and are adjusted to fair value at the end of each reporting period. For the sixthree months ended June 30,March 31, 2013 and 2012, and 2011, the Company recorded compensation expense related to such units of $793$620 and $487,$425, respectively, of which $110$54 and $169,$48, respectively, relates to the Performance Units given that there is an explicit service period associated with the Deferred Equity Units, and the likelihood that the performance target will be met is considered probable. Distributions include cash distributions paid on Liability Awards. Cash distributions paid on awards expected to be forfeited were $17$7 and $8$6 for the sixthree months ended June 30,March 31, 2013 and 2012, and 2011, respectively, and are part of total compensation expense for each of the sixthree months then ended. During the sixthree months ended June 30,March 31, 2013 and 2012, $261 and 2011, $63, and $82, respectively, of vested Deferred Equity Units were settled in cash. As of June 30, 2012March 31, 2013 and December 31, 2011,2012, there was $2,481$3,087 and $2,222,$1,428, respectively, of estimated unrecognized compensation expense related to unvested awards. As of June 30, 2012March 31, 2013 and December 31, 2011,2012, the unrecognized compensation expense related to unvested awards is expected to be recognized over a period of 3.671.91 and 3.17 years, respectively.2.16 years. A summary of this share activity forthese equity grants by the Company as of June 30,March 31, 2013 and 2012 and 2011 and changes during the periods then ended is presented below: | | | | Deferred Equity Units | | Performance Units | | | Deferred Equity Units | | Performance Units | | | | | | Units | | Fair Value
per unit | | Units | | Fair Value
per unit | | Balance at January 1, 2013 | | | | 16,788 | | | $ | 205.70 | | | | 13,124 | | | $ | 64.24 | | Granted | | | | — | | | | | | — | | | | Vested | | | | (6,815 | ) | | $ | (300.44 | ) | | | — | | | | Forfeited | | | | — | �� | | | | | (446 | ) | | $ | (93.83 | ) | | | | | | | | | | | | | Balance at March 31, 2013 | | | | 9,973 | | | $ | 300.44 | | | | 12,678 | | | $ | 93.83 | | | | | Units | | Fair Value
per unit | | Units | | Fair Value
per unit | | | Balance at January 1, 2012 | | | 22,353 | | | $ | 157.16 | | | | 12,764 | | | $ | 60.24 | | | | 22,353 | | | $ | 157.16 | | | | 12,764 | | | $ | 60.24 | | Granted | | | 1,000 | | | $ | 241.39 | | | | 500 | | | $ | 92.27 | | | | 1,000 | | | $ | 205.70 | | | | 500 | | | $ | 64.24 | | Vested | | | (6,565 | ) | | $ | (241.39 | ) | | | — | | | $ | (92.27 | ) | | | (6,565 | ) | | $ | (205.70 | ) | | | — | | | | Forfeited | | | — | | | | | | (140 | ) | | | | | — | | | | | | (140 | ) | | $ | (64.24 | ) | | | | | | | | | | | | | | | | | | | | | | Balance at June 30, 2012 | | | 16,788 | | | $ | 241.39 | | | | 13,124 | | | $ | 92.27 | | | | Balance at January 1, 2011 | | | 15,808 | | | $ | 148.35 | | | | 7,904 | | | $ | 81.19 | | | Granted | | | 10,802 | | | $ | 148.35 | | | | 5,401 | | | $ | 81.19 | | | Vested | | | (3,952 | ) | | $ | (148.35 | ) | | | — | | | $ | (81.19 | ) | | Forfeited | | | — | | | | | | (418 | ) | | | | | | | | | | | | | | | | Balance at June 30, 2011 | | | 22,658 | | | $ | 148.35 | | | | 12,887 | | | $ | 81.19 | | | Balance at March 31, 2012 | | | | 16,788 | | | $ | 205.70 | | | | 13,124 | | | $ | 64.24 | |
The Company expects 10% of all awards to be forfeited and the related service period is 4four years. 17. DEFINED CONTRIBUTION AND DEFERRED COMPENSATION PLANS
| 17. | DEFINED CONTRIBUTION AND DEFERRED COMPENSATION PLANS |
SAMG LLC has a defined contribution 401(k) savings plan (the “Plan”) for all eligible employees who meet the minimum age and service requirements as defined in the Plan. The Plan is designed to be a qualified plan under sections 401(a) and 401(k) of the Internal Revenue Code. For employees who qualify under the terms of the Plan, on an annual basis Silvercrest matches dollar for dollar an employee’s contributions up to the first four percent of compensation. For the sixthree months ended June 30,March 31, 2013 and 2012, and 2011, Silvercrest accruedmade matching contributions of $36$16 and $26,$18, respectively, for the benefit of employees. LGI had an annual bonus and deferred compensation plan (the “Deferred Plan”). The amount of a Participant’s Award (as defined) for any Plan Year (as defined) shall equal the product of the Net Revenues (as defined) for such Plan Year multiplied by a percentage, the numerator of which shall be the number of Units (as defined) allocated to such Participant for such Plan Year, and the denominator of which shall be the aggregate number of Units allocated under the Plan (as defined) for such Plan Year; provided, however, that (i) the Award for any Participant in any Plan Year shall, in no event, exceed $10 per Unit and (ii) the aggregate number of Units is subject to increase or decrease, by the Administrator (as defined) in his sole discretion, during such Plan Year to reflect the addition of new employees becoming Participants or to reflect the termination of employment of any Participant. Each Participant may elect to receive their Award in cash, on a deferred basis, or a combination of both subject to various provisions in the Deferred Plan. The Deferred Plan was discontinued as of December 31, 2009. During the year ended December 31, 2010, $154 of payments was made to participants under the plan. The remaining liability at December 31, 2010 of $70 was paid in full in March 2011.
18. SOFT DOLLAR ARRANGEMENTS
| 18. | SOFT DOLLAR ARRANGEMENTS |
The Company obtains research and other services through “soft dollar” arrangements. The Company receives credits from broker-dealers whereby technology-based research, market quotation and/or market survey services are effectively paid for in whole or in part by “soft dollar” brokerage arrangements. Section 28(e) of the Securities Exchange Act of 1934, as amended, provides a “safe harbor” to an investment adviser against claims that it breached its fiduciary duty under state or federal law (including ERISA) solely because the adviser caused its clients’ accounts to pay more than the lowest available commission for executing a securities trade in return for brokerage and research services. To rely on the safe harbor offered by Section 28(e), (i) the Company must make a good-faith determination that the amount of commissions is reasonable in relation to the value of the brokerage and research services being received and (ii) the brokerage and research services must provide lawful and appropriate assistance to the Company in carrying out its investment decision-making responsibilities. If the use of soft dollars is limited or prohibited in the future by regulation, the Company may have to bear the costs of such research and other services. For the sixthree months ended June 30,March 31, 2013 and 2012, and 2011, the Company utilized “soft dollar” credits of $446$248 and $430,$223, respectively. 19. SUBSEQUENT EVENTS
On September 18, 2012 three of the Company’s executives repaid outstanding notes payable and accrued interest of $1,897 that were initially issued in connection with the acquisition of their partnership interest.
The Company has evaluated subsequent events through September 18, 2012,May[ ], 2013, which is the date the consolidated financial statements were available to be issued. **** * * MILBANK WINTHROP & CO., INC. CONSOLIDATED STATEMENTS OF FINANCIAL CONDITION SEPTEMBER 30, 2011 AND DECEMBER 31, 2010 | | | | | | | | | | | | | | | | | | | | SEPTEMBER 30, 2011 | | | DECEMBER 31, 2010 | | | | | (unaudited) | | | | | | | | ASSETS | | | | | | | | | | | | | | | | | Cash and cash equivalents | | | | | | $ | 339,099 | | | | | | | $ | 163,256 | | Investments in securities and partnerships | | | | | | | 8,247 | | | | | | | | 7,818 | | Accounts receivable | | | | | | | 710,965 | | | | | | | | 97,148 | | Prepaid taxes | | | | | | | — | | | | | | | | 34,915 | | Furniture, equipment and leasehold improvements, at cost (net of accumulated depreciation of $285,068 and $284,168) | | | | | | | 28,426 | | | | | | | | 27,073 | | Security deposit | | | | | | | 15,220 | | | | | | | | 15,220 | | Prepaid expenses and other | | | | | | | 79,552 | | | | | | | | 105,898 | | Consolidated Milbank Partnerships: | | | | | | | | | | | | | | | | | Cash and cash equivalents | | $ | 11,708,030 | | | | | | | $ | 18,066,684 | | | | | | Investments in securities | | | 102,190,687 | | | | | | | | 123,483,737 | | | | | | Investments in Funds | | | 167,976,499 | | | | | | | | 198,373,114 | | | | | | Redemptions receivable from investments in Funds | | | 395,139 | | | | | | | | 9,624,700 | | | | | | Accrued income | | | 101,398 | | | | | | | | 173,463 | | | | | | Due from partner | | | 81,402 | | | | | | | | — | | | | | | Prepaid expenses and other | | | 119,190 | | | | 282,572,345 | | | | 153,628 | | | | 349,875,326 | | | | | | | | | | | | | | | | | | | TOTAL ASSETS | | | | | | $ | 283,753,854 | | | | | | | $ | 350,326,654 | | | | | | | | | | | | | | | | | | | LIABILITIES AND STOCKHOLDERS’ EQUITY | | | | | | | | | | | | | | | | | Liabilities: | | | | | | | | | | | | | | | | | Accrued expenses | | | | | | $ | 39,210 | | | | | | | $ | 21,400 | | Taxes payable | | | | | | | 293,543 | | | | | | | | — | | Deferred taxes | | | | | | | 53,668 | | | | | | | | 91,122 | | Consolidated Milbank Partnerships: | | | | | | | | | | | | | | | | | Contributions received in advance | �� | | — | | | | | | | | 500,000 | | | | | | Accrued expenses | | | 287,743 | | | | | | | | 639,584 | | | | | | Redemptions payable | | | 2,211,744 | | | | | | | | 34,305,163 | | | | | | Securities sold short | | | 2,541,031 | | | | 5,040,518 | | | | 4,434,420 | | | | 39,879,167 | | | | | | | | | | | | | | | | | | | Total Liabilities | | | | | | $ | 5,426,939 | | | | | | | $ | 39,991,689 | | | | | | | | | | | | | | | | | | |
Commitments and Contingencies (see Note 5)
| | | | | | | | | | | | | | | | | | | | SEPTEMBER 30, 2011 | | | DECEMBER 31, 2010 | | | | | (unaudited) | | | | | | | | | | ASSETS | | | | | | | | | | | | | | | | | Cash and cash equivalents | | | | | | $ | 339,099 | | | | | | | $ | 163,256 | | Investments in securities and partnerships | | | | | | | 8,247 | | | | | | | | 7,818 | | Accounts receivable | | | | | | | 710,965 | | | | | | | | 97,148 | | Prepaid taxes | | | | | | | — | | | | | | | | 34,915 | | Furniture, equipment and leasehold improvements, at cost (net of accumulated depreciation of $285,068 and $284,168) | | | | | | | 28,426 | | | | | | | | 27,073 | | Security deposit | | | | | | | 15,220 | | | | | | | | 15,220 | | Prepaid expenses and other | | | | | | | 79,552 | | | | | | | | 105,898 | | Consolidated Milbank Partnerships: | | | | | | | | | | | | | | | | | Cash and cash equivalents | | $ | 11,708,030 | | | | | | | $ | 18,066,684 | | | | | | Investments in securities | | | 102,190,687 | | | | | | | | 123,483,737 | | | | | | Investments in Funds | | | 167,976,499 | | | | | | | | 198,373,114 | | | | | | Redemptions receivable from investments in Funds | | | 395,139 | | | | | | | | 9,624,700 | | | | | | Accrued income | | | 101,398 | | | | | | | | 173,463 | | | | | | Due from partner | | | 81,402 | | | | | | | | — | | | | | | Prepaid expenses and other | | | 119,190 | | | | 282,572,345 | | | | 153,628 | | | | 349,875,326 | | | | | | | | | | | | | | | | | | | TOTAL ASSETS | | | | | | $ | 283,753,854 | | | | | | | $ | 350,326,654 | | | | | | | | | | | | | | | | | | | LIABILITIES AND STOCKHOLDERS’ EQUITY | | | | | | | | | | | | | | | | | Liabilities: | | | | | | | | | | | | | | | | | Accrued expenses | | | | | | $ | 39,210 | | | | | | | $ | 21,400 | | Taxes payable | | | | | | | 293,543 | | | | | | | | — | | Deferred taxes | | | | | | | 53,668 | | | | | | | | 91,122 | | Consolidated Milbank Partnerships: | | | | | | | | | | | | | | | | | Contributions received in advance | | | — | | | | | | | | 500,000 | | | | | | Accrued expenses | | | 287,743 | | | | | | | | 639,584 | | | | | | Redemptions payable | | | 2,211,744 | | | | | | | | 34,305,163 | | | | | | Securities sold short | | | 2,541,031 | | | | 5,040,518 | | | | 4,434,420 | | | | 39,879,167 | | | | | | | | | | | | | | | | | | | Total Liabilities | | | | | | $ | 5,426,939 | | | | | | | $ | 39,991,689 | | | | | | | | | | | | | | | | | | | Commitments and Contingencies
(see Note 5) | | | | | | | | | | | | | | | | |
The accompanying notes are an integral part of these consolidated financial statements. MILBANK WINTHROP & CO., INC. CONSOLIDATED STATEMENTS OF FINANCIAL CONDITION SEPTEMBER 30, 2011 AND DECEMBER 31, 2010 (continued) | | | | September 30, 2011 | | | December 31, 2010 | | | September 30, 2011 | | December 31, 2010 | | | | | (unaudited) | | | | | | | (unaudited) | | | | Stockholders’ Equity: | | | | | | | | | Common stock: | | | | | | | | | 7,000 Class A par $0.05 shares authorized; | | | | | | | | | 3,922 shares issued and outstanding | | $ | 196 | | | $ | 196 | | | $ | 196 | | | $ | 196 | | 7,000 Class B par $0.05 shares authorized; | | | | | | | | | 2,496 shares issued and outstanding | | | 125 | | | | 125 | | | | 125 | | | | 125 | | Additional paid in capital | | | 454,839 | | | | 454,839 | | | | 454,839 | | | | 454,839 | | Retained earnings | | | 1,190,660 | | | | 867,957 | | | | 1,190,660 | | | | 867,957 | | | | | | | | | | | | | | | Total Milbank Winthrop & Co., Inc. | | | | | | Stockholders’ Equity | | | 1,645,820 | | | | 1,323,117 | | | Total Milbank Winthrop & Co., Inc. Stockholders’ Equity | | | | 1,645,820 | | | | 1,323,117 | | Minority interests in Consolidated Milbank Partnerships | | | 276,681,095 | | | | 309,011,848 | | | | 276,681,095 | | | | 309,011,848 | | | | | | | | | | | | | | | Total Stockholders’ Equity | | | 278,326,915 | | | | 310,334,965 | | | | 278,326,915 | | | | 310,334,965 | | | | | | | | | | | | | | | | | | | | | TOTAL LIABILITIES AND STOCKHOLDERS’ EQUITY | | $ | 283,753,854 | | | $ | 350,326,654 | | | $ | 283,753,854 | | | $ | 350,326,654 | | | | | | | | | | | | | | |
The accompanying notes are an integral part of these consolidated financial statements. MILBANK WINTHROP & CO., INC. CONSOLIDATED STATEMENTS OF OPERATIONS FOR THE NINE MONTHS ENDED SEPTEMBER 30: | | | | 2011 | | 2010 | | | 2011 | | 2010 | | | | | (unaudited) | | (unaudited) | | | (unaudited) | | (unaudited) | | REVENUES: | | | | | | | | | | | | | | | | | Investment advisory fees | | | | $ | 1,501,604 | | | | | $ | 1,355,072 | | | | | $ | 1,501,604 | | | | | $ | 1,355,072 | | Other income | | | | | 535 | | | | | | 1,016 | | | | | | 535 | | | | | | 1,016 | | Consolidated Milbank Partnerships | | | | | | | | | | | | | | | | | Dividends | | $ | 1,629,197 | | | | | $ | 1,477,273 | | | | | $ | 1,629,197 | | | | | $ | 1,477,273 | | | | Interest | | | 394,230 | | | | 2,023,427 | | | | 521,669 | | | | 1,998,942 | | | | 394,230 | | | | 2,023,427 | | | | 521,669 | | | | 1,998,942 | | | | | | | | | | | | | | | | | | | | | | | | | | | Total revenues | | | | | 3,525,566 | | | | | | 3,355,030 | | | | | | 3,525,566 | | | | | | 3,355,030 | | | | | | | | | | | | | | | | | | | | | | | EXPENSES: | | | | | | | | | | | | | | | | | Compensation and benefits | | | | | 3,780,024 | | | | | | 3,551,485 | | | | | | 3,780,024 | | | | | | 3,551,485 | | Rent | | | | | 130,348 | | | | | | 130,157 | | | | | | 130,348 | | | | | | 130,157 | | Insurance | | | | | 105,167 | | | | | | 99,247 | | | | | | 105,167 | | | | | | 99,247 | | Office and administrative | | | | | 138,384 | | | | | | 152,014 | | | | | | 138,384 | | | | | | 152,014 | | Computer services | | | | | 80,251 | | | | | | 69,574 | | | | | | 80,251 | | | | | | 69,574 | | Professional fees | | | | | 134,371 | | | | | | 27,806 | | | | | | 134,371 | | | | | | 27,806 | | Depreciation | | | | | 900 | | | | | | 900 | | | | | | 900 | | | | | | 900 | | Consolidated Milbank Partnerships: | | | | | | | | | | | | | | | | | Management and advisory fees | | | 1,409,795 | | | | | | 1,240,705 | | | | | | 1,409,795 | | | | | | 1,240,705 | | | | Interest and dividends | | | 232,863 | | | | | | 223,503 | | | | | | 232,863 | | | | | | 223,503 | | | | Professional fees | | | 266,334 | | | | | | 285,558 | | | | | | 266,334 | | | | | | 285,558 | | | | Office and administrative | | | 42,694 | | | | | | 127,245 | | | | | | 42,694 | | | | | | 127,245 | | | | Other expenses | | | 83,436 | | | | 2,035,122 | | | | 90,158 | | | | 1,967,169 | | | | 83,436 | | | | 2,035,122 | | | | 90,158 | | | | 1,967,169 | | | | | | | | | | | | | | | | | | | | | | | | | | | Total expenses | | | | | 6,404,567 | | | | | | 5,998,352 | | | | | | 6,404,567 | | | | | | 5,998,352 | | | | | | | | | | | | | | | | | | | | | | | LOSS BEFORE NET GAIN (LOSS) FROM CONSOLIDATED | | | | | | | | | | MILBANK PARTNERSHIPS | | | | | (2,879,001 | ) | | | | | (2,643,322 | ) | | LOSS BEFORE NET GAIN (LOSS) FROM CONSOLIDATED MILBANK PARTNERSHIPS | | | | | | (2,879,001 | ) | | | | | (2,643,322 | ) | Net gain (loss) from investment activities of Consolidated Milbank Partnerships: | | | | | | | | | | | | | | | | | Realized gain on investments in securities, net | | | 4,987,983 | | | | | | 6,703,204 | | | | | | 4,987,983 | | | | | | 6,703,204 | | | | Realized gain on investments in Funds, net | | | 766,884 | | | | | | — | | | | | | 766,884 | | | | | | — | | | | Unrealized gain (loss) on investments in securities, net change | | | (19,574,394 | ) | | | | | 2,940,362 | | | | | | (19,574,394 | ) | | | | | 2,940,362 | | | | Unrealized gain (loss) on investments in Funds, net change | | | (21,155,552 | ) | | | (34,975,079 | ) | | | 14,582,651 | | | | 24,226,217 | | | | (21,155,552 | ) | | | (34,975,079 | ) | | | 14,582,651 | | | | 24,226,217 | | | | | | | | | | | | | | | | | | | | | | | | | | | INCOME (LOSS) BEFORE INCOME TAX EXPENSE | | | | | (37,854,080 | ) | | | | | 21,582,895 | | | | | | (37,854,080 | ) | | | | | 21,582,895 | | Income tax expense | | | | | 330,019 | | | | | | 232,567 | | | | | | 330,019 | | | | | | 232,567 | | | | | | | | | | | | | | | | | | | | | | | NET INCOME (LOSS) | | | | | (38,184,099 | ) | | | | | 21,350,328 | | | | | | (38,184,099 | ) | | | | | 21,350,328 | | | | | | | | | | | | | | | | | | | | | | | Minority interest in Consolidated Milbank Partnerships | | | | | (38,506,802 | ) | | | | | 21,093,366 | | | | | | (38,506,802 | ) | | | | | 21,093,366 | | | | | | | | | | | | | | | | | | | | | | | NET INCOME ATTRIBUTABLE TO MILBANK WINTHROP & CO., INC. | | | | $ | 322,703 | | | | | $ | 256,962 | | | | | $ | 322,703 | | | | | $ | 256,962 | | | | | | | | | | | | | | | | | | | | | | |
The accompanying notes are an integral part of these consolidated financial statements. MILBANK WINTHROP & CO., INC. CONSOLIDATED STATEMENTS OF CHANGES IN STOCKHOLDERS’ EQUITY FOR THE NINE MONTHS ENDED SEPTEMBER 30, 2011 (unaudited) AND THE YEAR ENDED DECEMBER 31, 2010 | | | | | | | | | | | | | | | | | | | | | | | | | | | | | | | | | | | | Number of
Class A Shares | | | Par Value | | | Number of
Class B Shares | | | Par Value | | | Additional
Paid-in Capital | | | Retained
Earnings | | | Minority
Interests in
Consolidated
Milbank
Partnerships | | | Total | | Balance at December 31, 2009 | | | 3,922 | | | $ | 196 | | | | 2,496 | | | $ | 125 | | | $ | 454,839 | | | $ | 800,541 | | | $ | 299,512,994 | | | $ | 300,768,695 | | Contributions | | | — | | | | — | | | | — | | | | — | | | | — | | | | — | | | | 2,900,000 | | | | 2,900,000 | | Redemptions | | | — | | | | — | | | | — | | | | — | | | | — | | | | — | | | | (37,863,210 | ) | | | (37,863,210 | ) | Net Income | | | — | | | | — | | | | — | | | | — | | | | — | | | | 67,416 | | | | 44,462,064 | | | | 44,529,480 | | | | | | | | | | | | | | | | | | | | | | | | | | | | | | | | | | | Balance at December 31, 2010 | | | 3,922 | | | | 196 | | | | 2,496 | | | | 125 | | | | 454,839 | | | | 867,957 | | | | 309,011,848 | | | | 310,334,965 | | Contributions | | | — | | | | — | | | | — | | | | — | | | | — | | | | — | | | | 12,539,311 | | | | 12,539,311 | | Withdrawals | | | — | | | | — | | | | — | | | | — | | | | — | | | | — | | | | (6,363,262 | ) | | | (6,363,262 | ) | Net Income (Loss) | | | — | | | | — | | | | — | | | | — | | | | — | | | | 322,703 | | | | (38,506,802 | ) | | | (38,184,099 | ) | | | | | | | | | | | | | | | | | | | | | | | | | | | | | | | | | | Balance at September 30, 2011 (unaudited) | | | 3,922 | | | $ | 196 | | | | 2,496 | | | $ | 125 | | | $ | 454,839 | | | $ | 1,190,660 | | | $ | 276,681,095 | | | $ | 278,326,915 | | | | | | | | | | | | | | | | | | | | | | | | | | | | | | | | | | |
The accompanying notes are an integral part of these consolidated financial statements. MILBANK WINTHROP & CO., INC. CONSOLIDATED STATEMENTS OF CASH FLOWS FOR THE NINE MONTHS ENDED SEPTEMBER 30: | | | | | | | | | | | | 2011 | | | 2010 | | | | | (unaudited) | | | (unaudited) | | CASH FLOWS FROM OPERATING ACTIVITIES: | | | | | | | | | Net income | | $ | 322,703 | | | $ | 256,962 | | Adjustments to reconcile net income to net cash provided by operating activities | | | | | | | | | Consolidated Milbank Partnerships: | | | | | | | | | Net income (loss) | | | (38,506,802 | ) | | | 21,093,366 | | Depreciation | | | 900 | | | | 900 | | Deferred taxes | | | (37,454 | ) | | | 26,942 | | Sales of securities and partnerships | | | — | | | | 17,130 | | Unrealized (gain) on investments in securities and partnerships, net change | | | (429 | ) | | | (8,076 | ) | Realized loss on investments in securities and partnerships, net | | | — | | | | 8,119 | | Consolidated Milbank Partnerships: | | | | | | | | | Realized (gain) on investments in securities, net | | | (4,987,983 | ) | | | (6,703,204 | ) | Realized (gain) on investments in Funds, net | | | (766,884 | ) | | | — | | Unrealized (gain) loss on investments in securities, net change | | | 19,574,394 | | | | (2,940,362 | ) | Unrealized (gain) loss on investments in Funds, net change | | | 21,155,552 | | | | (14,582,651 | ) | Purchases of investments in securities | | | (62,909,399 | ) | | | (146,801,804 | ) | Purchases of investments in Funds | | | (7,000,000 | ) | | | — | | Sales of investments in securities | | | 67,722,649 | | | | 152,615,257 | | Sales of investments in Funds | | | 17,007,947 | | | | 4,060,065 | | (Increase) decrease in operating assets: | | | | | | | | | Accounts receivable | | | (613,817 | ) | | | (507,379 | ) | Prepaid taxes | | | 34,915 | | | | 43,955 | | Prepaid expenses and other | | | 26,346 | | | | (22,391 | ) | Consolidated Milbank Partnerships: | | | | | | | | | Cash and cash equivalents | | | 6,358,654 | | | | 6,075,279 | | Redemptions receivable from investments in Funds | | | 9,229,561 | | | | 82,760,368 | | Accrued income | | | 72,065 | | | | 137,334 | | Prepaid expenses and other | | | 34,438 | | | | (22,572 | ) | Increase (decrease) in operating liabilities: | | | | | | | | | Accrued expenses | | | 17,810 | | | | 1,731 | | Taxes payable | | | 293,543 | | | | 130,337 | | Consolidated Milbank Partnerships: | | | | | | | | | Accrued expenses | | | (351,841 | ) | | | (1,299,427 | ) | | | | | | | | | | Net cash provided by operating activities | | $ | 26,676,868 | | | $ | 94,339,879 | | | | | | | | | | |
The accompanying notes are an integral part of these consolidated financial statements. MILBANK WINTHROP & CO., INC. CONSOLIDATED STATEMENTS OF CASH FLOWS FOR THE NINE MONTHS ENDED SEPTEMBER 30: (continued) | | | | | | | | | | | | 2011 | | | 2010 | | | | | (unaudited) | | | (unaudited) | | CASH FLOWS FROM INVESTING ACTIVITIES: | | | | | | | | | Purchase of fixed assets | | $ | (2,253 | ) | | $ | (665 | ) | | | | | | | | | | Net cash used in investing activities | | | (2,253 | ) | | | (665 | ) | | | | | | | | | | CASH FLOWS FROM FINANCING ACTIVITIES: | | | | | | | | | Contributions to Milbank Partnerships | | | 11,957,909 | | | | 775,000 | | Withdrawals from Milbank Partnerships | | | (38,456,681 | ) | | | (95,064,326 | ) | | | | | | | | | | Net cash used in financing activities | | | (26,498,772 | ) | | | (94,289,326 | ) | | | | | | | | | | NET CHANGE IN CASH AND CASH EQUIVALENTS | | | 175,843 | | | | 49,888 | | Cash and cash equivalents at beginning of period: | | | 163,256 | | | | 126,858 | | | | | | | | | | | Cash and cash equivalents at end of period: | | $ | 339,099 | | | $ | 176,746 | | | | | | | | | | | Supplemental cash flow information: | | | | | | | | | Cash paid during the period for taxes | | $ | 1,561 | | | $ | 31,333 | | | | | | | | | | | Cash paid during the period for interest | | $ | 215,690 | | | $ | 200,505 | | | | | | | | | | |
The accompanying notes are an integral part of these consolidated financial statements. MILBANK WINTHROP & CO., INC. NOTES TO THE CONSOLIDATED FINANCIAL STATEMENTS SEPTEMBER 30, 2011 (unaudited) NOTE 1.ORGANIZATION Milbank Winthrop & Co., Inc. (“Milbank”) was incorporated in Delaware in 1980. “Milbank” conducts an investment advisory business in New York City and is registered with the Securities and Exchange Commission under the Investment Advisers Act of 1940. Milbank is the general partner (the “General Partner”) of three investment partnerships, MW Global Partners, L.P., MW Small Cap, L.P. and MW Special Situations, L.P. (the “Partnerships”) which are consolidated in these financial statements (collectively the “Company”). The Partnerships invest in a mix of securities and independent investment partnerships (the “Funds”). NOTE 2.SIGNIFICANT ACCOUNTING POLICIES Basis of Presentation The accompanying consolidated financial statements are presented in conformity with accounting principles generally accepted in the United States of America (“GAAP”). Basis of Accounting The Company follows the accrual method of accounting. Income is recorded when earned, and expenses are recorded when incurred in the period to which they pertain. Purchases and sales of securities are recorded on the trade date basis. Purchases and sales of Funds are recorded on the effective dates as specified in the Funds’ investment agreements. Basis of Consolidation Milbank consolidates the Partnerships in which the General Partner is presumed to have control under Accounting Standards Codification (“ASC”) 810-20. Although Milbank holds non-substantive equity-at-risk in the Partnerships, Milbank’s related parties, including its de facto agents, hold substantive equity-at-risk. Further, the limited partners do not have the right to dissolve the Partnerships or have substantive kick out rights or participating rights that would overcome the presumption of control by Milbank. Accordingly, Milbank consolidates the assets, liabilities and operating results of the Partnerships and records the minority interests held by the limited partners in the accompanying consolidated financial statements. All material intercompany transactions and balances have been eliminated. Use of Estimates The preparation of financial statements in conformity with GAAP requires management to make estimates and assumptions that affect the reported amounts of assets and liabilities and disclosure of contingent assets and liabilities at the date of the financial statements and the reported amounts of revenues and expenses during the reporting period. Actual results could differ from those estimates. MILBANK WINTHROP & CO., INC. NOTES TO THE CONSOLIDATED FINANCIAL STATEMENTS SEPTEMBER 30, 2011 (unaudited) (continued) NOTE 2.SIGNIFICANT ACCOUNTING POLICIES (continued) Cash and Cash Equivalents Cash and cash equivalents consist of cash on hand and liquid investments with maturities of less than 90 days. For purposes of the statement of cash flows, cash and cash equivalents includes cash in banks and readily available money market funds in investment accounts. MILBANK WINTHROP & CO., INC.
NOTES TO THE CONSOLIDATED FINANCIAL STATEMENTS
SEPTEMBER 30, 2011
(unaudited)
(continued)
NOTE 2. SIGNIFICANT ACCOUNTING POLICIES (continued)
Consolidated Milbank Partnerships - Partnerships—Cash and Cash Equivalents Cash and cash equivalents held by the Partnerships are not available to fund any of the liquidity needs of Milbank. Fair Value Measurements GAAP establishes a framework for measuring fair value and requires disclosures about fair value measurements, including a fair value hierarchy that prioritizes the inputs to value techniques used to measure fair value into three broad levels explained below: Level 1 - 1—Valuations based on quoted prices available in active markets for identical investments. Level 2 - 2—Valuations based on quoted prices in markets that are not active or for which all significant inputs are observable, either directly or indirectly. Level 3 - 3—Valuations based on inputs that are unobservable and significant to the overall fair value measurement. The inputs or methodology used for valuing investments are not necessarily an indication of the risks associated with holding those investments. Valuation and Revenue Recognition Investments in securities, option contracts, and securities sold short which are traded on a national securities exchange or listed on NASDAQ are valued at the last reported sales price on the last business day of the year. Investments in securities and securities sold short which are traded in the over-the-counter market are valued at the last reported bid and ask prices, respectively. Securities for which market quotations are not readily available are valued at their fair value as determined in good faith under consistently applied procedures established by the General Partner. Although the General Partner and the Funds’ administrators use their best judgment in estimating the fair value of the investments in the Funds, there are inherent limitations in any estimation technique. Therefore, the values presented herein are not necessarily indicative of the amount that could be realized in a current transaction. Future events will also affect the estimates of fair value, and the effects of such events on the estimates of fair value could be material. The valuation of the Funds has been deemed reasonable based on inquiry and the documentation provided from the Funds’ general partners or administrators. MILBANK WINTHROP & CO., INC. NOTES TO THE CONSOLIDATED FINANCIAL STATEMENTS SEPTEMBER 30, 2011 (unaudited) (continued) NOTE 2.SIGNIFICANT ACCOUNTING POLICIES (continued) Valuation and Revenue Recognition (continued) The Funds may carry investments for which market quotations are not readily available and are valued at their fair values as determined in good faith by their respective general partners or administrators. A change in the estimated values may occur in the near term. Certain Funds invest in emerging markets. The risks of investments are often increased in developing countries. These risks include repatriation restrictions, foreign exchange fluctuations, low trading volume in MILBANK WINTHROP & CO., INC.
NOTES TO THE CONSOLIDATED FINANCIAL STATEMENTS
SEPTEMBER 30, 2011
(unaudited)
(continued)
NOTE 2. SIGNIFICANT ACCOUNTING POLICIES (continued)
Valuation and Revenue Recognition (continued)
securities markets of emerging countries, lack of uniform reporting standards, and political, economic and legal uncertainties. Milbank investment advisory fees are billed quarterly and recorded as revenue in the period earned. These fees are based on a percentage of assets under management. Income from Funds is recognized based upon the Company’s allocable share of the earnings of the Funds which carry their investments at fair value, which include unrealized gains and losses. Accounts Receivable Accounts receivable consists of advisory fees due from clients and Funds. Redemptions Receivable from Investments in Funds Redemptions receivable from investments in funds consists of withdrawal requests issued to the Funds, primarily to fund redemption requests of Fund partners. Furniture, Equipment and Leasehold Improvements Furniture, equipment and leasehold improvements are capitalized at cost. Depreciation is calculated using accelerated methods applied over the expected lives of the assets. The difference between these accelerated methods and the straight line depreciation required by GAAP is deemed immaterial in comparison to these consolidated financial statements taken as a whole. Leases The Company expenses payments on operating leases on a straight line basis over the term of the lease. Income Taxes The Company is subject to federal and state corporate income taxes. The Company calculates both current and deferred taxes based on the difference between the financial statement carrying value of assets and liabilities versus their tax basis. A provision for these taxes has been made and is reflected on the consolidated statement of operations. Management has determined that the Company has no uncertain tax positions that would require financial statement adjustment or disclosure. The tax years that remain subject to examination by taxing authorities are 2008, 2009 and 2010. MILBANK WINTHROP & CO., INC. NOTES TO THE CONSOLIDATED FINANCIAL STATEMENTS SEPTEMBER 30, 2011 (unaudited) (continued) NOTE 2.SIGNIFICANT ACCOUNTING POLICIES (continued) Foreign Securities The value of securities and cash equivalents which are denominated in foreign currencies are stated using the exchange rate in effect on the last business day of the period. Purchases and sales of securities, interest and MILBANK WINTHROP & CO., INC.
NOTES TO THE CONSOLIDATED FINANCIAL STATEMENTS
SEPTEMBER 30, 2011
(unaudited)
(continued)
NOTE 2. SIGNIFICANT ACCOUNTING POLICIES (continued)
Foreign Securities (continued)
dividend income and expenses, which are denominated in foreign currencies, are recorded at the exchange rate as of the date of the transactions. For financial statement purposes, the Company does not isolate that portion of the gain or loss on securities resulting from exchange rate fluctuation. Such changes are combined with changes in market prices and shown as realized or unrealized gain or loss. Accounting Developments In June 2009, the Financial Accounting Standards Board (“FASB”) issued Statement of Financial Accounting Standards (“SFAS”) No. 167, Amendments to FASB Interpretation No. 46(R), which changes the approach to determining the primary beneficiary of a Variable Interest Entity (“VIE”) and requires companies to more frequently assess whether they must consolidate VIEs. This pronouncement is effective for the first annual reporting period beginning after November 15, 2009 and for interim periods within that first annual reporting period. In November 2009, the FASB agreed to defer the effective date of this pronouncement for certain types of asset manager funds until the completion of its consolidation project. The Company is currently assessing the potential impacts, if any, on its consolidated financial statements and disclosures. In January 2010, the FASB issued Accounting Standards Update 2010-06, Improving Disclosures about Fair Value Measurements (“ASU 2010-06”). ASU 2010-06 requires disclosing separately the amount of significant transfers in and out of the Level 1 and Level 2 categories and the reasons for the transfers and it requires that Level 3 purchases, sales, issuances and settlements activity be reported on a gross rather than a net basis. ASU 2010-06 also requires fair value measurement disclosures for each class of assets and liabilities and disclosures about valuation techniques and inputs used to measure fair value for both recurring and nonrecurring fair value measurements for Level 2 and Level 3 measurements. These disclosures are effective for fiscal periods beginning after December 15, 2009, except for the Level 3 gross reporting which is effective for fiscal periods beginning after December 15, 2010. The Company does not anticipate that the adoption of ASU 2010-06 will have a material impact on its consolidated financial statements. In May 2011, the FASB issued amended guidance on fair value measurements to achieve common fair value measurement and disclosure requirements in GAAP and International Financial Reporting Standards. The amended guidance specifies that the concepts of highest and best use and valuation premise in a fair value measurement are relevant only when measuring the fair value of nonfinancial assets and are not relevant when measuring the fair value of financial assets or liabilities. The amendments include requirements specific to measuring the fair value of those instruments, such as equity interests used as consideration in a business combination. An entity should measure the fair value of its own equity instrument from the perspective of a market participant that holds the instrument as an asset. With respect to financial instruments that are managed as part of a portfolio, an exception to fair value requirements is provided. That exception permits a reporting entity to measure the fair value of such financial assets and liabilities at the price that would be received to sell a net asset position for a particular risk or to transfer a net liability position for a particular risk in an orderly transaction between market participants at the measurement date. The amendments also clarify that premiums and discounts should only be applied if market participants would do so when pricing the asset or liability. MILBANK WINTHROP & CO., INC. NOTES TO THE CONSOLIDATED FINANCIAL STATEMENTS SEPTEMBER 30, 2011 (unaudited) (continued) NOTE 2.SIGNIFICANT ACCOUNTING POLICIES (continued) Accounting Developments (continued) Premiums and discounts related to the size of an entity’s holding (e.g., a blockage factor) rather than as a characteristic of the asset or liability (e.g., a control premium) are not permitted in a fair value measurement. The guidance also requires enhanced disclosures about fair value measurements, including, among other things, MILBANK WINTHROP & CO., INC.
NOTES TO THE CONSOLIDATED FINANCIAL STATEMENTS
SEPTEMBER 30, 2011
(unaudited)
(continued)
NOTE 2. SIGNIFICANT ACCOUNTING POLICIES (continued)
Accounting Developments (continued)
(a) for fair value measurements categorized within Level III of the fair value hierarchy, (1) a quantitative disclosure of the unobservable inputs and assumptions used in the measurement, (2) the valuation process used by the reporting entity, and (3) a narrative description of the sensitivity of the fair value measurement to changes in unobservable inputs and the interrelationships between those unobservable inputs, if any, and (b) the categorization by level of the fair value hierarchy for items that are not measured at fair value in the statement of financial condition but for which the fair value is required to be disclosed (for example, a financial instrument that is measured at amortized cost in the statement of financial condition but for which fair value is disclosed). The guidance also amends disclosure requirements for significant transfers between Level I and Level II and now requires disclosure of all transfers between Levels I and II in the fair value hierarchy. The amended guidance is effective for interim and annual periods beginning after December 15, 2011. As the impact of the guidance is primarily limited to enhanced disclosures, adoption is not expected to have a material impact on the Company’s consolidated financial statements. NOTE 3.FAIR VALUE MEASUREMENTS The following table summarizes investments under the fair value hierarchy the valuation of the Company’s as of September 30, 2011: | Assets | | Level 1 | | Level 2 | | Level 3 | | Total | | | Level 1 | | Level 2 | | Level 3 | | Total | | Investments in Securities and Partnerships | | $ | 3,247 | | | $ | — | | | $ | 5,000 | | | $ | 8,247 | | | $ | 3,247 | | | $ | — | | | $ | 5,000 | | | $ | 8,247 | | | From Consolidated Milbank Partnerships: | | | | | | | | | | | | | | | | | Investments in Securities | | | 96,449,023 | | | | 5,059,848 | | | | 681,816 | | | | 102,190,687 | | | Investments in | | | | | | | | | | Securities | | | | 96,449,023 | | | | 5,059,848 | | | | 681,816 | | | | 102,190,687 | | Investments in Funds | | | — | | | | 154,867,659 | | | | 13,108,840 | | | | 167,976,499 | | | | — | | | | 154,867,659 | | | | 13,108,840 | | | | 167,976,499 | | | | | | | | | | | | | | | | | | | | | | | | | | | Total | | $ | 96,452,270 | | | $ | 159,927,507 | | | $ | 13,795,656 | | | $ | 270,175,433 | | | $ | 96,452,270 | | | $ | 159,927,507 | | | $ | 13,795,656 | | | $ | 270,175,433 | | | | | | | | | | | | | | | | | | | | | | | | | | | Liabilities | | | | | | | | | | | | | | | | | Securities Sold Short | | $ | (927,955 | ) | | $ | (1,281,162 | ) | | $ | (331,914 | ) | | $ | (2,541,031 | ) | | $ | (927,955 | ) | | $ | (1,281,162 | ) | | $ | (331,914 | ) | | $ | (2,541,031 | ) | | | | | | | | | | | | | | | | | | | | | | | | | |
MILBANK WINTHROP & CO., INC. NOTES TO THE CONSOLIDATED FINANCIAL STATEMENTS SEPTEMBER 30, 2011 (unaudited) (continued) NOTE 3.FAIR VALUE MEASUREMENTS (continued) The following table discloses a reconciliation of investments measured at fair value on a recurring basis using significant unobservable inputs (Level 3) during the nine months ended September 30, 2011: | | | | | Assets | | Investments | | Beginning balance, December 31, 2010 | | $ | 8,568,283 | | Total gains or (losses), realized and unrealized | | | (188,890 | ) | Purchases and sales, net | | | 5,416,263 | | | | | | | Ending balance, September 30, 2011 | | $ | 13,795,656 | | | | | | | The amount of gain (losses) included in income attributable to the change in unrealized gains (losses) relating to assets still held at September 30, 2011 | | $ | (267,353 | ) | | | | | |
MILBANK WINTHROP & CO., INC.
NOTES TO THE CONSOLIDATED FINANCIAL STATEMENTS
SEPTEMBER 30, 2011
(unaudited)
(continued)
| | | | | Assets | | Investments | | Beginning balance, December 31, 2010 | | $ | 8,568,283 | | Total gains or (losses), realized and unrealized | | | (188,890 | ) | Purchases and sales, net | | | 5,416,263 | | | | | | | Ending balance, September 30, 2011 | | $ | 13,795,656 | | | | | | | The amount of gain (losses) included in income attributable to the change in unrealizedgains (losses) relating to assets still heldat September 30, 2011 | | $ | (267,353 | ) | | | | | |
NOTE 3. FAIR VALUE MEASUREMENTS (continued)
| Liabilities | | Securities Sold Short | | | Securities Sold
Short | | Beginning balance, December 31, 2010 | | $ | (312,096 | ) | | $ | (312,096 | ) | Total gains or (losses), realized and unrealized | | | 17,419 | | | | 17,419 | | Purchases and sales, net | | | (37,237 | ) | | | (37,237 | ) | | | | | | | | Ending balance, September 30, 2011 | | $ | (331,914 | ) | | $ | (331,914 | ) | | | | | | The amount of gains (losses) included in income attributable to the change in unrealized gains (losses) relating to liabilities still held at September 30, 2011 | | $ | 17,419 | | | $ | 17,419 | | | | | | | | |
The following table summarizes the valuation of the Company’s investments under the fair value hierarchy, as described above, as of December 31, 2010: | | | | Level 1 | | | Level 2 | | | Level 3 | | | Total | | | | | | | | | | Assets | | | | | | | | | | Level 1 | | | Level 2 | | | Level 3 | | | Total | | Investment in securities and partnerships | | $ | 2,818 | | | $ | — | | | $ | 5,000 | | | $ | 7,818 | | | $ | 2,818 | | | $ | — | | | $ | 5,000 | | | $ | 7,818 | | From consolidated affiliated Partnerships: | | | | | | | | | | | | | | | | | Investment in securities | | | 114,505,465 | | | | 7,887,319 | | | | 1,090,953 | | | | 123,483,737 | | | | 114,505,465 | | | | 7,887,319 | | | | 1,090,953 | | | | 123,483,737 | | Investment in Funds | | | — | | | | 190,900,784 | | | | 7,472,330 | | | | 198,373,114 | | | | — | | | | 190,900,784 | | | | 7,472,330 | | | | 198,373,114 | | | | | | | | | | | | | | | | | | | | | | | | | | | Total | | $ | 114,508,283 | | | $ | 198,788,103 | | | $ | 8,568,283 | | | $ | 321,864,669 | | | $ | 114,508,283 | | | $ | 198,788,103 | | | $ | 8,568,283 | | | $ | 321,864,669 | | | | | | | | | | | | | | | | | | | | | | | | | | | Liabilities | | | | | | | | | | | | | | | | | Securities sold short | | $ | 2,143,953 | | | $ | 1,978,371 | | | $ | 312,096 | | | $ | 4,434,420 | | | $ | 2,143,953 | | | $ | 1,978,371 | | | $ | 312,096 | | | $ | 4,434,420 | | | | | | | | | | | | | | | | | | | | | | | | | | |
MILBANK WINTHROP & CO., INC. NOTES TO THE CONSOLIDATED FINANCIAL STATEMENTS SEPTEMBER 30, 2011 (unaudited) (continued) NOTE 3.FAIR VALUE MEASUREMENTS (continued) The following table discloses a reconciliation of investments measured at fair value on a recurring basis using significant unobservable inputs (Level 3) during the year ended December 31, 2010: | | | | | Assets | | Investments | | Beginning balance, December 31, 2009 | | $ | 168,393,421 | | Total gains or (losses), realized and unrealized | | | 29,106,390 | | Purchases and sales, net | | | 2,544,680 | | Transferred in (out) of Level 3 | | | (191,476,208 | ) | | | | | | Ending balance, December 31, 2010 | | $ | 8,568,283 | | | | | | | The amount of gains (losses) included in income attributable to the change in unrealized gains (losses) relating to assets still held at December 31, 2010 | | $ | 1,540,210 | | | | | | |
MILBANK WINTHROP & CO., INC.
NOTES TO THE CONSOLIDATED FINANCIAL STATEMENTS
SEPTEMBER 30, 2011
(unaudited)
(continued)
NOTE 3. FAIR VALUE MEASUREMENTS (continued)
| Liabilities | | Securities Sold Short | | | Assets | | | Investments | | Beginning balance, December 31, 2009 | | $ | (71,500 | ) | | $ | 168,393,421 | | Total gains or (losses), realized and unrealized | | | 271,608 | | | | 29,106,390 | | Purchases and sales, net | | | (526,454 | ) | | | 2,544,680 | | Transferred in (out) of Level 3 | | | 14,250 | | | | (191,476,208 | ) | | | | | | | | Ending balance, December 31, 2010 | | $ | (312,096 | ) | | $ | 8,568,283 | | | | | | | | | The amount of gains (losses) included in income attributable to the change in unrealized gains (losses) relating to assets still held at December 31, 2010 | | | $ | 1,540,210 | | | | | | | | Liabilities | | | Securities Sold
Short | | Beginning balance, December 31, 2009 | | | $ | (71,500 | ) | Total gains or (losses),realized and unrealized | | | | 271,608 | | Purchases and sales, net | | | | (526,454 | ) | Transferred in (out) of Level 3 | | | | 14,250 | | | | | | | Ending balance, December 31, 2010 | | | $ | (312,096 | ) | | | | | | The amount of gains (losses) included in income attributable to the change in unrealized gains (losses) relating to liabilities still held at December 31, 2010 | | $ | 214,358 | | | $ | 214,358 | | | | | | | | |
Gains (losses), realized and unrealized, if any, are included in the net realized gain (loss) on investments or Funds and net change in unrealized gain (loss) on investments or Funds in the consolidated statement of operations. The Company values its Level 2 investments in securities based on the last price in non-active markets. The Company values its Level 2 and 3 investments in Funds based on their proportionate share of the net assets of the Funds. Transfers between levels are recognized at the end of the reporting period. NOTE 4.INVESTMENTS IN FUNDS As of September 30, 2011 and December 31, 2010, the Partnerships invested in other Funds, none of which were related parties. The investment objectives of the Funds primarily relate to the maximization of appreciation through the investments in equity, debt and related instruments. The Funds utilize one of the following strategies: | a. | Long Only Strategy - Strategy—This category includes Funds that invest in long positions only, primarily in common stocks. Management of the Funds has the ability to shift the investments from value to growth strategies and from small to large capitalization stocks, |
| b. | Equity Long/Short Strategy - Strategy—This category includes Funds that invest both long and short, primarily in common stocks. Management of the Funds has the ability to shift investments from value to growth strategies, from small to large capitalization stocks, and from a net long position to a net short position. |
MILBANK WINTHROP & CO., INC. NOTES TO THE CONSOLIDATED FINANCIAL STATEMENTS SEPTEMBER 30, 2011 (unaudited) (continued) NOTE 4. INVESTMENTS IN FUNDS (continued) | c. | Multi-strategy Funds - Funds—This category includes Funds that pursue multiple strategies to diversify risks and reduce volatility. The Funds’ composite portfolio for this category includes investments in U.S. common stocks, non-U.S. common stocks, distressed debt, commodities and arbitrage investments. In addition, some of the Funds invest in various special situation investments. |
| d. | Global Strategy Funds - Funds—This category includes Funds that hold investments in non-U.S. common stocks, primarily in the energy, information technology, utilities, and telecommunications sectors. They also hold investments in emerging markets and real estate sectors as well as investments in diversified currencies. |
Cost is determined based on capital contributions to, and withdrawals from, the Funds, plus reinvested realized net income. MILBANK WINTHROP & CO., INC.
NOTES TO THE CONSOLIDATED FINANCIAL STATEMENTS
SEPTEMBER 30, 2011
(unaudited)
(continued)
NOTE 4. INVESTMENTS IN FUNDS (continued)
Substantially all of the Funds in which the Partnerships invest charge management fees at varying rates, principally 0.75% to 2% annually of periodic net asset values. Substantially all of the Funds in which the Partnerships invest provide for a specific allocation or fee to their respective general partner or affiliate, which is calculated at various rates, primarily 20% of appreciation, as defined in their respective partnership agreements. Some of the Funds permit partial withdrawals during the year on either a monthly, quarterly or semiannual basis; however, substantially all of the Funds permit full withdrawals only at the end of the year. The activities of certain Funds include the purchase and sale of a variety of derivative financial instruments such as equity options, index options, swap agreements, futures and forward contracts, and other similar instruments. These derivatives are used for trading purposes and for managing risk associated with their portfolio of securities and securities sold short. The use of derivative instruments may involve elements of market risk in excess of the amount recognized in the statement of financial condition of these Funds. In many cases, these Funds limit their risk by holding offsetting security or option positions. The Partnerships, through their investment in other Funds, are subject to certain inherent risks arising from their investing activities of short selling and entering into forward contracts. The ultimate cost to acquire these securities or settle these contracts may exceed the liability reflected in their financial statements. NOTE 5.LEASE COMMITMENT The Company is subject to a lease for office space in New York City through April 30, 2012. The base rent is $149,400 per year and includes electricity. It is also subject to real estate tax and operating cost escalations. Future minimum lease commitments are as follows: | | | | | | | | | | | | September 30, 2011 | | | December 31, 2010 | | 2011 | | $ | 37,350 | | | $ | 149,400 | | 2012 | | | 49,800 | | | | 49,800 | | | | | | | | | | | Total | | $ | 87,150 | | | $ | 199,200 | | | | | | | | | | |
Total rent expense for the nine months ended September 30, 2011 and 2010 was $130,348 and $130,157, respectively. MILBANK WINTHROP & CO., INC. NOTES TO THE CONSOLIDATED FINANCIAL STATEMENTS SEPTEMBER 30, 2011 (unaudited) (continued) NOTE 6.PENSION PLAN The Company sponsors a 401(k) retirement plan for its employees. The Company contributes 3% of eligible employees’ compensation. The plan also permits elective deferrals by employees. Total Pension costs for the nine months ended September 30, 2011 and 2010 were $8,460 and $10,013, respectively. MILBANK WINTHROP & CO., INC.
NOTES TO THE CONSOLIDATED FINANCIAL STATEMENTS
SEPTEMBER 30, 2011
(unaudited)
(continued)
NOTE 7.PREPAID EXPENSES AND OTHER The details of Milbank’s prepayments at September 30, 2011 and December 31, 2010, respectively, are as follows: | | | | | | | | | | | | September 30, 2011 | | | December 31, 2010 | | Insurance | | $ | 59,091 | | | $ | 86,685 | | Rent | | | 12,450 | | | | 12,450 | | Other | | | 8,011 | | | | 6,763 | | | | | | | | | | | | | $ | 79,552 | | | $ | 105,898 | | | | | | | | | | |
NOTE 8.RELATED PARTY TRANSACTIONS Milbank earns advisory fees for client assets invested with the Partnerships. It is also reimbursed for costs incurred in providing administrative services to the Partnerships. For the nine months ending September 30, 2011 and 2010, Milbank earned $3,251,445 and $2,737,402, respectively, in advisory fees and $379,170 and $356,062, respectively, in administrative fees from the Partnerships. These intercompany fees have been fully eliminated in the consolidated financial statements. NOTE 9.INCOME TAXES The Company’s income tax expenses for the nine months ended September 30, 2011 and 2010 has been determined as follows: | | | | | | | | | | | | 2011 | | | 2010 | | Current taxes | | | | | | | | | Federal | | $ | 257,231 | | | $ | 143,938 | | State and local | | | 110,242 | | | | 61,687 | | | | | | | | | | | | | | 367,473 | | | | 205,625 | | Deferred taxes | | | | | | | | | Federal | | | (37,454 | ) | | | 26,942 | | | | | | | | | | | | | $ | 330,019 | | | $ | 232,567 | | | | | | | | | | |
Current taxes are provided using statutory tax rates as applied to taxable income. Deferred taxes are provided at approximately 35% of unrealized appreciation of investments in excess of tax basis. MILBANK WINTHROP & CO., INC. NOTES TO THE CONSOLIDATED FINANCIAL STATEMENTS SEPTEMBER 30, 2011 (unaudited) (continued) NOTE 10.FURNITURE, EQUIPMENT AND LEASEHOLD IMPROVEMENTS Furniture, equipment and leasehold improvements are stated at cost less accumulated depreciation. As discussed in Note 2, the Company applies accelerated methods of depreciation over the estimated useful lives of the assets. | | | | | | | | | Assets at cost: | | September 30, 2011 | | | December 31, 2010 | | Furniture and equipment | | $ | 222,796 | | | $ | 220,543 | | Leasehold improvements | | | 90,698 | | | | 90,698 | | Total cost | | | 313,494 | | | | 311,241 | | Less: accumulated depreciation | | | (285,068 | ) | | | (284,168 | ) | | | | | | | | | | Net fixed assets | | $ | 28,426 | | | $ | 27,073 | | | | | | | | | | |
Depreciation expense for both the nine months ended September 30, 2011 and 2010 was $900. NOTE 11.SHARES OF STOCK Under the Certificate of Amendment of the Certificate of Incorporation dated January 9, 1997 (the “Certificate”), 7,000 shares of Class A Common Stock, having a par value of $0.05 per share, were authorized. Holders of Class A Common Stock are entitled to one vote per share. At September 30, 2011 and December 31, 2010, 3,922 shares were issued and outstanding. Also under the Certificate, 7,000 shares of Class B Common Stock, having a par value of $0.05 per share, were authorized. Class B Common Stock is non-voting stock. At September 30, 2011 and December 31, 2010, 2,496 shares were issued and outstanding. NOTE 12.SUBSEQUENT EVENTS Subsequent events have been evaluated through March 14, 2012, which is the date the consolidated financial statements were available to be issued. Milbank was purchased by Silvercrest Asset Management Group LLC on November 1, 2011. A gross rather than a net basis. ASU 2010-06 also requires fair value measurement disclosures for each class of assets and liabilities and disclosures about valuation techniques and inputs used to measure fair value for both recurring and nonrecurring fair value measurements for Level 2 and Level 3 measurements. These disclosures are effective for fiscal periods beginning after December 15, 2009, except for the Level 3 gross reporting which is effective for fiscal periods beginning after December 15, 2010. We do not anticipate that the adoption of ASU 2010-06 will have a material impact on the Company’s financial statements. MILBANK WINTHROP & CO., INC. NOTES TO THE CONSOLIDATED FINANCIAL STATEMENTS SEPTEMBER 30, 2011 (unaudited) (continued) NOTE 3.FAIR VALUE MEASUREMENTS The following table summarizes the valuation of the Company’s investments under the fair value hierarchy, as described above, as of December 31, 2010: | | | | | | | | | | | | | | | | | | Assets | | Level 1 | | | Level 2 | | | Level 3 | | | Total | | Investment in securities and partnerships | | $ | 2,818 | | | $ | — | | | $ | 5,000 | | | $ | 7,818 | | From consolidated affiliated Partnerships: | | | | | | | | | | | | | | | | | Investment in securities | | | 114,505,465 | | | | 7,887,319 | | | | 1,090,953 | | | | 123,483,737 | | Investment in Funds | | | — | | | | 190,900,784 | | | | 7,472,330 | | | | 198,373,114 | | | | | | | | | | | | | | | | | | | Total | | $ | 114,508,283 | | | $ | 198,788,103 | | | $ | 8,568,283 | | | $ | 321,864,669 | | | | | | | | | | | | | | | | | | | Liabilities | | | | | | | | | | | | | | | | | Securities sold short | | $ | 2,143,953 | | | $ | 1,978,371 | | | $ | 312,096 | | | $ | 4,434,420 | | | | | | | | | | | | | | | | | | |
INDEPENDENT AUDITORS’ REPORT To the Stockholders of Milbank Winthrop & Co., Inc.: We have audited the accompanying consolidated statement of financial condition of Milbank Winthrop & Co., Inc. (the “Company”), as of December 31, 2010, and the related consolidated statements of income, changes in stockholders’ equity and cash flows for the year then ended. These financial statements are the responsibility of the Company’s management. Our responsibility is to express an opinion on these financial statements based on our audit. We conducted our audit in accordance with auditing standards generally accepted in the United States of America. Those standards require that we plan and perform the audit to obtain reasonable assurance about whether the financial statements are free of material misstatement. An audit includes examining, on a test basis, evidence supporting the amounts and disclosures in the financial statements. An audit also includes assessing the accounting principles used and significant estimates made by management, as well as evaluating the overall financial statement presentation. We believe that our audit provides a reasonable basis for our opinion. In our opinion, the consolidated financial statements referred to above present fairly, in all material respects, the financial position of Milbank Winthrop & Co., Inc. as of December 31, 2010, and the results of its operations and its cash flows for the year then ended in conformity with accounting principles generally accepted in the United States of America. /s/ Fulvio & Associates, LLP New York, New York September 2, 2011 MILBANK WINTHROP & CO., INC. CONSOLIDATED STATEMENTS OF FINANCIAL CONDITION YEAR ENDED DECEMBER 31, 2010 | | | | | | | | | ASSETS | | | | | | | | | Cash and cash equivalents | | | | | | $ | 163,256 | | Investments in securities and partnerships | | | | | | | 7,818 | | Accounts receivable | | | | | | | 97,148 | | Prepaid taxes | | | | | | | 34,915 | | Furniture, equipment and leasehold improvements, at cost (net of accumulated depreciation of $284,168) | | | | | | | 27,073 | | Security deposit | | | | | | | 15,220 | | Prepaid expenses and other | | | | | | | 105,898 | | Consolidated Milbank Partnerships: | | | | | | | | | Cash and cash equivalents | | $ | 18,066,684 | | | | | | Investments in securities | | | 123,483,737 | | | | | | Investments in Funds | | | 198,373,114 | | | | | | Redemptions receivable from investments in Funds | | | 9,624,700 | | | | | | Accrued income | | | 173,463 | | | | | | Prepaid expenses and other | | | 153,628 | | | | 349,875,326 | | | | | | | | | | | TOTAL ASSETS | | | | | | $ | 350,326,654 | | | | | | | | | | | LIABILITIES AND STOCKHOLDERS’ EQUITY | | | | | | | | | Liabilities: | | | | | | | | | Accrued expenses | | | | | | $ | 21,400 | | Deferred taxes | | | | | | | 91,122 | | Consolidated Milbank Partnerships: | | | | | | | | | Contributions received in advance | | $ | 500,000 | | | | | | Accrued expenses | | | 639,584 | | | | | | Redemptions payable | | | 34,305,163 | | | | | | Securities sold short | | | 4,434,420 | | | | 39,879,167 | | | | | | | | | | | Total Liabilities | | | | | | | 39,991,689 | | | | | | | | | | | Commitments and Contingencies (see Note 5) | | | | | | | | | Stockholders’ Equity: | | | | | | | | | Common stock: | | | | | | | | | 7,000 Class A par $0.05 shares authorized; 3,922 shares issued and outstanding | | | | | | | 196 | | 7,000 Class B par $0.05 shares authorized; 2,496 shares issued and outstanding | | | | | | | 125 | | Additional paid in capital | | | | | | | 454,839 | | Retained earnings | | | | | | | 867,957 | | | | | | | | | | | Total Milbank Winthrop & Co., Inc. Stockholders’ Equity | | | | | | | 1,323,117 | | | | | | | | | | | Minority interests in Consolidated Milbank Partnerships | | | | | | | 309,011,848 | | | | | | | | | | | Total Stockholders’ Equity | | | | | | | 310,334,965 | | | | | | | | | | | TOTAL LIABILITIES AND STOCKHOLDERS’ EQUITY | | | | | | $ | 350,326,654 | | | | | | | | | | |
The accompanying notes are an integral part of these consolidated financial statements. MILBANK WINTHROP & CO., INC. CONSOLIDATED STATEMENT OF INCOME FOR THE YEAR ENDED DECEMBER 31, 2010 | | | | | | | | | REVENUES: | | | | | | | | | Investment advisory fees | | | | | | $ | 1,822,748 | | Other income | | | | | | | 755 | | Consolidated Milbank Partnerships: | | | | | | | | | Dividends | | $ | 1,996,373 | | | | | | Interest | | | 663,103 | | | | 2,659,476 | | | | | | | | | | | Total revenues | | | | | | | 4,482,979 | | | | | | | | | | | EXPENSES: | | | | | | | | | Compensation and benefits | | | | | | | 5,505,058 | | Rent | | | | | | | 167,506 | | Insurance | | | | | | | 133,034 | | Office and administrative | | | | | | | 132,650 | | Computer services | | | | | | | 93,653 | | Professional fees | | | | | | | 39,606 | | Depreciation | | | | | | | 6,751 | | Other | | | | | | | 83,703 | | Consolidated Milbank Partnerships: | | | | | | | | | Management and advisory fees | | | 1,591,767 | | | | | | Office and administrative | | | 538,045 | | | | | | Professional fees | | | 377,634 | | | | | | Interest and dividends | | | 318,727 | | | | 2,826,173 | | | | | | | | | | | Total expenses | | | | | | | 8,988,134 | | | | | | | | | | | LOSS BEFORE NET GAINS FROM CONSOLIDATED MILBANK PARTNERSHIPS | | | | | | | (4,505,155 | ) | Net gains from investment activities of Consolidated Milbank Partnerships: | | | | | | | | | Realized gain on investments in securities, net | | | 11,004,979 | | | | | | Unrealized gain on investments in securities, net change | | | 9,205,034 | | | | | | Unrealized gain on investments in Funds, net change | | | 28,901,005 | | | | 49,111,018 | | | | | | | | | | | INCOME BEFORE INCOME TAX EXPENSE | | | | | | | 44,605,863 | | Income tax expense | | | | | | | 76,383 | | | | | | | | | | | NET INCOME | | | | | | | 44,529,480 | | | | | | | | | | | Minority Interests in Consolidated Milbank Partnerships | | | | | | | (44,462,064 | ) | | | | | | | | | | NET INCOME ATTRIBUTABLE TO MILBANK WINTHROP & CO., INC. | | | | | | $ | 67,416 | | | | | | | | | | |
The accompanying notes are an integral part of these consolidated financial statements. MILBANK WINTHROP & CO., INC. CONSOLIDATED STATEMENT OF CHANGES IN STOCKHOLDERS’ EQUITY FOR THE YEAR ENDED DECEMBER 31, 2010 | | | | Number of
Class A Shares | | | Par Value | | | Number of
Class B Shares | | | Par Value | | | Additional
Paid-in Capital | | | Retained
Earnings | | | Minority
Interests in
Consolidated
Milbank
Partnerships | | Total | | | Number of
Class A Shares | | | Par Value | | | Number of
Class B Shares | | | Par Value | | | Additional
Paid-in Capital | | | Retained
Earnings | | | Minority
Interests in
Consolidated
Milbank
Partnerships | | Total | | Balance at December 31, 2009 | | | 3,922 | | | $ | 196 | | | | 2,496 | | | $ | 125 | | | $ | 454,839 | | | $ | 800,541 | | | $ | 299,512,994 | | | $ | 300,768,695 | | | | 3,922 | | | $ | 196 | | | | 2,496 | | | $ | 125 | | | $ | 454,839 | | | $ | 800,541 | | | $ | 299,512,994 | | | $ | 300,768,695 | | Contributions | | | — | | | | — | | | | — | | | | — | | | | — | | | | — | | | | 2,900,000 | | | | 2,900,000 | | | | — | | | | — | | | | — | | | | — | | | | — | | | | — | | | | 2,900,000 | | | | 2,900,000 | | Redemptions | | | — | | | | — | | | | — | | | | — | | | | — | | | | — | | | | (37,863,210 | ) | | | (37,863,210 | ) | | | — | | | | — | | | | — | | | | — | | | | — | | | | — | | | | (37,863,210 | ) | | | (37,863,210 | ) | Net Income | | | — | | | | — | | | | — | | | | — | | | | — | | | | 67,416 | | | | 44,462,064 | | | | 44,529,480 | | | | — | | | | — | | | | — | | | | — | | | | — | | | | 67,416 | | | | 44,462,064 | | | | 44,529,480 | | | | | | | | | | | | | | | | | | | | | | | | | | | | | | | | | | | | | | | | | | | | | | | | | | | Balance at September 30, 2011 | | | 3,922 | | | $ | 196 | | | | 2,496 | | | $ | 125 | | | $ | 454,839 | | | $ | 867,957 | | | $ | 309,011,848 | | | $ | 310,334,965 | | | | 3,922 | | | $ | 196 | | | | 2,496 | | | $ | 125 | | | $ | 454,839 | | | $ | 867,957 | | | $ | 309,011,848 | | | $ | 310,334,965 | | | | | | | | | | | | | | | | | | | | | | | | | | | | | | | | | | | | | | | | | | | | | | | | | | |
The accompanying notes are an integral part of these consolidated financial statements. MILBANK WINTHROP & CO., INC. CONSOLIDATED STATEMENT OF CASH FLOWS FOR THE YEAR ENDED DECEMBER 31, 2010 | CASH FLOWS FROM OPERATING ACTIVITIES: | | | | | | | | | Net income | | | | $ | 67,416 | | | | | $ | 67,416 | | Adjustments to reconcile net income to net cash provided by operating activities | | | | | | Consolidated Milbank Partnerships: | | | | | | Adjustments to reconcile net income to net cash provided by operating activities Consolidated Milbank Partnerships: | | | | | | Net income | | $ | 44,462,064 | | | | | $ | 44,462,064 | | | | Depreciation | | | 6,751 | | | | | | 6,751 | | | | Deferred taxes | | | 34,905 | | | | | | 34,905 | | | | Sales of securities and partnerships | | | 17,173 | | | | | | 17,173 | | | | Unrealized gain on investments in securities and partnerships, net change | | | (331 | ) | | | | | (331 | ) | | | | Consolidated Milbank Partnerships: | | | | | | | | | Realized gain on investments in securities, net | | | (11,004,979 | ) | | | | | (11,004,979 | ) | | | Unrealized gain on investments in securities, net change | | | (9,205,034 | ) | | | | | (9,205,034 | ) | | | Unrealized gain on investments in funds, net change | | | (28,901,005 | ) | | | | | (28,901,005 | ) | | | Purchases of investments in securities | | | (164,514,871 | ) | | | | | (164,514,871 | ) | | | Purchases of investments in funds | | | (13,524 | ) | | | | | (13,524 | ) | | | Sales of investments in securities | | | 174,448,934 | | | | | | 174,448,934 | | | | Sales of investments in funds | | | 14,502,312 | | | | | | 14,502,312 | | | | | (Increase) decrease in operating assets: | | | | | | | | | Accounts receivable | | | 57,783 | | | | | | 57,783 | | | | Prepaid taxes | | | 9,040 | | | | | | 9,040 | | | | Security deposit | | | (203 | ) | | | | | (203 | ) | | | Prepaid expenses and other | | | 1,668 | | | | | | 1,668 | | | | Consolidated Milbank Partnerships | | | | | | | | | Cash and cash equivalents | | | (473,962 | ) | | | | | (473,962 | ) | | | Redemption receivable from investments in funds | | | 74,517,538 | | | | | | 74,517,538 | | | | Prepaid investments | | | 61,430 | | | | | | 61,430 | | | | Accrued income | | | 18,754 | | | | | | 18,754 | | | | Prepaid expenses and other | | | (36,671 | ) | | | | | (36,671 | ) | | | | Increase (decrease) in operating liabilities: | | | | | | | | | Accrued expenses | | | (18,081 | ) | | | | | (18,081 | ) | | | Consolidated Milbank Partnerships | | | | | | | | | Accrued expenses | | | (1,009,006 | ) | | | | | (1,009,006 | ) | | | | | | | | | | | | | | Total Adjustments | | | | $ | 92,960,685 | | | | | $ | 92,960,685 | | | | | | | | | | | | | Net Cash Provided by Operating Activities | | | | $ | 93,028,101 | | | | | $ | 93,028,101 | | | | | | | | | | | | |
The accompanying notes are an integral part of these consolidated financial statements. MILBANK WINTHROP & CO., INC. CONSOLIDATED STATEMENT OF CASH FLOWS FOR THE YEAR ENDED DECEMBER 31, 2010 (continued) | | | | | CASH FLOWS FROM INVESTING ACTIVITIES: | | | | | Purchase of fixed assets | | $ | (5,627 | ) | | | | | | Net cash used in investing activities | | | (5,627 | ) | | | | | | CASH FLOWS FROM FINANCING ACTIVITIES: | | | | | Contributions to Milbank Partnerships | | | 3,375,000 | | Redemptions from Milbank Partnerships | | | (96,361,076 | ) | | | | | | Net cash used in financing activities | | | (92,986,076 | ) | | | | | | NET CHANGE IN CASH AND CASH EQUIVALENTS | | | 36,398 | | Cash and Cash Equivalents at December 31, 2009 | | | 126,858 | | | | | | | Cash and Cash Equivalents at December 31, 2010 | | $ | 163,256 | | | | | | | Supplemental cash flow information: | | | | | Cash paid during the period for taxes | | $ | 32,438 | | | | | | |
The accompanying notes are an integral part of these consolidated financial statements. MILBANK WINTHROP & CO., INC. NOTES TO THE CONSOLIDATED FINANCIAL STATEMENTS DECEMBER 31, 2010 NOTE 1.ORGANIZATION Milbank Winthrop & Co., Inc. (“Milbank”) was incorporated in Delaware in 1980. “Milbank” conducts an investment advisory business in New York City and is registered with the Securities and Exchange Commission under the Investment Advisors Act of 1940. Milbank is the General Partner (the “General Partner”) of three investment partnerships, MW Global Partners, L.P., MW Small Cap, L.P. and MW Special Situations, L.P. (the “Partnerships”) which are consolidated in these financial statements (collectively the “Company”). The Partnerships invest in a mix of securities and independent investment partnerships (the “Funds”). NOTE 2.SIGNIFICANT ACCOUNTING POLICIES Basis of Presentation The accompanying financial statements are presented in conformity with accounting principles generally accepted in the United States of America (“GAAP”). Basis of Accounting The Company follows the accrual method of accounting. Income is recorded when earned, and expenses are recorded when incurred in the period to which they pertain. Purchases and sales of securities are recorded on the trade date basis. Basis of Consolidation Milbank consolidates the Partnerships in which the General Partner is presumed to have control under Accounting Standards Codification (“ASC”) 810-20. Although Milbank holds non-substantive equity-at-risk in the Partnerships, Milbank’s related parties, including its de facto agents, hold substantive equity-at-risk. Further, the limited partners do not have the right to dissolve the Partnerships or have substantive kick out rights or participating rights that would overcome the presumption of control by Milbank. Accordingly, Milbank consolidates the assets, liabilities and operating results of the Partnerships and records the minority interests held by the limited partners in the accompanying financial statements. All material intercompany transactions and balances have been eliminated. Use of Estimates The preparation of financial statements in conformity with GAAP requires management to make estimates and assumptions that affect the reported amounts of assets and liabilities at the date of the financial statements and the reported amounts of revenues and expenses during the reporting period. Actual results could differ from those estimates. Cash and Cash Equivalents For purposes of the statements of cash flows, cash and cash equivalents includes cash in banks and readily available money market funds in investment accounts. MILBANK WINTHROP & CO., INC. NOTES TO THE CONSOLIDATED FINANCIAL STATEMENTS DECEMBER 31, 2010 (continued) NOTE 2.SIGNIFICANT ACCOUNTING POLICIES (continued) Consolidated Milbank Partnerships - Partnerships—Cash and Cash Equivalents Cash and cash equivalents held by the Partnerships are not available to fund any of the liquidity needs of Milbank. Fair Value Measurements GAAP establishes a framework for measuring fair value and requires disclosures about fair value measurements, including a fair value hierarchy that prioritizes the inputs to value techniques used to measure fair value into three broad levels explained below: Level 1 - 1—Valuations based on quoted prices available in active markets for identical investments. Level 2 - 2—Valuations based on quoted prices in markets that are not active or for which all significant inputs are observable, either directly or indirectly. Level 3 - 3—Valuations based on inputs that are unobservable and significant to the overall fair value measurement. The inputs or methodology used for valuing investments are not necessarily an indication of the risks associated with investing in those investments. Valuation and Revenue Recognition Investments in securities, option contracts, and securities sold short which are traded on a national securities exchange or listed on. NASDAQ are valued at the last reported sales price on the last business day of the year. Investments in securities and securities sold short which are traded in the over-the-counter market are valued at the last reported bid and ask prices, respectively. Securities for which market quotations are not readily available are valued at their fair value as determined in good faith under consistently applied procedures established by the General Partner. Although the General Partner and the Funds’ administrators use their best judgment in estimating the fair value of the investments in the Funds, there are inherent limitations in any estimation technique. Therefore, the values presented herein are not necessarily indicative of the amount that could be realized in a current transaction. Future events will also affect the estimates of fair value, and the effects of such events on the estimates of fair value could be material. The valuation of the Funds has been deemed reasonable based on inquiry and the documentation provided from the Funds’ general partners or administrators. The Funds may carry investments for which market quotations are not readily available and are valued at their fair value as determined in good faith by their respective general partners or administrators. A change in the estimated value may occur in the near term. Certain Funds invest in emerging markets. The risks of investments are often increased in developing countries. These risks include repatriation restrictions, foreign exchange fluctuations, low trading volume in securities markets of emerging countries, lack of uniform reporting standards, and political, economic and legal uncertainties. MILBANK WINTHROP & CO., INC. NOTES TO THE CONSOLIDATED FINANCIAL STATEMENTS DECEMBER 31, 2010 (continued) NOTE 2.SIGNIFICANT ACCOUNTING POLICIES (continued) Valuation and Revenue Recognition (continued) Milbank investment advisory fees are billed quarterly and recorded as revenue in the period earned. These fees are based on a percentage of assets under management. MILBANK WINTHROP & CO., INC.
NOTES TO THE CONSOLIDATED FINANCIAL STATEMENTS
DECEMBER 31, 2010
(continued)
NOTE 2. SIGNIFICANT ACCOUNTING POLICIES (continued)
Valuation and Revenue Recognition (continued)
Income from Funds is recognized based upon the Company’s allocable share of the earnings of the Funds which carry their investments at fair value, which include unrealized gains and losses. Accounts Receivable Accounts Receivable consists of advisory fees due from clients and Funds. Redemptions Receivable from Investments in Funds Redemptions receivable from investments in funds consists of withdrawal requests issued to the Funds, primarily to fund redemption requests of Fund partners. Furniture, Equipment and Leasehold Improvements Furniture, equipment and leasehold improvements are capitalized at cost. Depreciation is calculated using accelerated methods applied over the expected lives of the assets. The difference between these accelerated methods and the straight line depreciation required by GAAP is deemed immaterial in comparison to these financial statements taken as a whole. Leases The Company expenses payments on operating leases on a straight line basis over the term of the lease. Income Taxes The Company is subject to federal and state corporate income taxes. The Company calculates both current and deferred taxes based on the difference between the financial statement carrying value of assets and liabilities versus their tax basis. A provision for these taxes has been made and is reflected on the statement of income. Management has determined that the Company has no uncertain tax positions that would require financial statement adjustment or disclosure. The tax years that remain subject to examination by taxing authorities are 2007, 2008 and 2009. Foreign Securities The value of securities and cash equivalents which are denominated in foreign currencies are stated using the exchange rate in effect on the last business day of the year. Purchases and sales of securities, interest and dividend income and expenses, which are denominated in foreign currencies, are recorded at the exchange rate as of date of the transactions. For financial statement purposes, the Company does not isolate that portion of the gain or loss on securities resulting from exchange rate fluctuation. Such changes are combined with changes in market prices and shown as realized or unrealized gain or loss. MILBANK WINTHROP & CO., INC. NOTES TO THE CONSOLIDATED FINANCIAL STATEMENTS DECEMBER 31, 2010 (continued) NOTE 2.SIGNIFICANT ACCOUNTING POLICIES (continued) Accounting Developments In June 2009, the Financial Accounting Standards Board (“FASB”) issued Statement of Financial Accounting Standards (“SFAS”) No. 167, Amendments to FASB Interpretation No. 46(R), which changes the approach to determining the primary beneficiary of a Variable Interest Entity (“VIE”) and requires companies to more frequently assess whether they must consolidate VIEs. This pronouncement is effective for the first annual reporting period beginning after November 15, 2009 and for interim periods within that first annual reporting period. In November 2009, the FASB agreed to defer the effective date of this pronouncement for certain types of asset manager funds until the completion of its consolidation project. The Company is currently assessing the potential impacts, if any, on its consolidated financial statements and disclosures. In January 2010, the FASB issued Accounting Standards Update 2010-06, Improving Disclosures About Fair Value Measurements (“ASU 2010-06”). ASU 2010-06 requires disclosing separately the amount of significant transfers in and out of the Level 1 and Level 2 categories and the reasons for the transfers and it requires that Level 3 purchases, sales, issuances and settlements activity be reported on a gross rather than a net basis. ASU 2010-06 also requires fair value measurement disclosures for each class of assets and liabilities and disclosures about valuation techniques and inputs used to measure fair value for both recurring and nonrecurring fair value measurements for Level 2 and Level 3 measurements. These disclosures are effective for fiscal periods beginning after December 15, 2009, except for the Level 3 gross reporting which is effective for fiscal periods beginning after December 15, 2010. We do not anticipate that the adoption of ASU 2010-06 will have a material impact on the Company’s financial statements. NOTE 3.FAIR VALUE MEASUREMENTS The following table summarizes the valuation of the Company’s investments under the fair value hierarchy, as described above, as of December 31, 2010: | | | | Level 1 | | | Level 2 | | | Level 3 | | | Total | | | | | | | | | | Assets | | | | | | | | | | Level 1 | | | Level 2 | | | Level 3 | | | Total | | Investment in securities and partnerships | | $ | 2,818 | | | $ | — | | | $ | 5,000 | | | $ | 7,818 | | | $ | 2,818 | | | $ | — | | | $ | 5,000 | | | $ | 7,818 | | | From consolidated affiliated Partnerships: | | | | | | | | | | | | | | | | | Investment in securities | | | 114,505,465 | | | | 7,887,319 | | | | 1,090,953 | | | | 123,483,737 | | | | 114,505,465 | | | | 7,887,319 | | | | 1,090,953 | | | | 123,483,737 | | Investment in Funds | | | — | | | | 190,900,784 | | | | 7,472,330 | | | | 198,373,114 | | | | — | | | | 190,900,784 | | | | 7,472,330 | | | | 198,373,114 | | | | | | | | | | | | | | | | | | | | | | | | | | | Total | | $ | 114,508,283 | | | $ | 198,788,103 | | | $ | 8,568,283 | | | $ | 321,864,669 | | | $ | 114,508,283 | | | $ | 198,788,103 | | | $ | 8,568,283 | | | $ | 321,864,669 | | | | | | | | | | | | | | | | | | | | | | | | | | | Liabilities | | | | | | | | | | | | | | | | | Securities sold short | | $ | 2,143,953 | | | $ | 1,978,371 | | | $ | 312,096 | | | $ | 4,434,420 | | | $ | 2,143,953 | | | $ | 1,978,371 | | | $ | 312,096 | | | $ | 4,434,420 | | | | | | | | | | | | | | | | | | | | | | | | | | |
MILBANK WINTHROP & CO., INC. NOTES TO THE CONSOLIDATED FINANCIAL STATEMENTS DECEMBER 31, 2010 (continued) NOTE 3.FAIR VALUE MEASUREMENTS (continued) The following table discloses a reconciliation of investments measured at fair value on a recurring basis using significant unobservable inputs (Level 3) during the year ended December 31, 2010: | | | | | Assets | | Investments | | Beginning balance, December 31, 2009 | | $ | 168,393,421 | | Total gains or (losses), realized and unrealized | | | 29,106,390 | | Purchases and sales, net | | | 2,544,680 | | Transferred in (out) of Level 3 | | | (191,476,208 | ) | | | | | | Ending balance, December 31, 2010 | | $ | 8,568,283 | | | | | | | The amount of gains (losses) included in income attributable to the change in unrealized gains (losses) relating to assets still held at December 31, 2010 | | $ | 1,540,210 | | | | | | |
| Liabilities | | Securities Sold Short | | | Securities Sold Short | | Beginning balance, December 31, 2009 | | $ | (71,500 | ) | | Total gains or (losses), realized and unrealized | | | 271,608 | | | Beginning balance, December 31, 2009 Total gains or (losses), | | | $ | (71,500 | ) | realized and unrealized | | | | 271,608 | | Purchases and sales, net | | | (526,454 | ) | | | (526,454 | ) | Transferred in (out) of Level 3 | | | 14,250 | | | | 14,250 | | | | | | | | | Ending balance, December 31, 2010 | | $ | (312,096 | ) | | $ | (312,096 | ) | | | | | | | | The amount of gains (losses) included in income attributable to the change in unrealized gains (losses) relating to liabilities still held at December 31, 2010 | | $ | 214,358 | | | $ | 214,358 | | | | | | | | |
Gains (losses), realized and unrealized, if any, are included in the net realized gain (loss) on investments or Funds and net change in unrealized gain (loss) on investments or Funds in the Statement of Income. The Company values its Level 2 investments in securities based on the last price in non-active markets. The Company values its Level 2 and 3 investments in Funds based on their proportionate share of the net assets of the Funds. Transfers between levels are recognized at the end of the reporting period. NOTE 4 4.INVESTMENTS IN FUNDS As of December 31, 2010, the Partnerships invested in other Funds, none of which were related parties. The investment objectives of the Funds primarily relate to the maximization of appreciation through the investments in equity, debt and related instruments. The Funds utilize one of the following strategies: | a | Long Only Strategy - Strategy—This category includes Funds that invest in long positions only, primarily in common stocks. Management of the Funds has the ability to shift the investments from value to growth strategies and from small to large capitalization stocks. |
MILBANK WINTHROP & CO., INC.
NOTES TO THE CONSOLIDATED FINANCIAL STATEMENTS
DECEMBER 31, 2010
(continued)
NOTE 4. INVESTMENTS IN FUNDS (continued)
| b | Equity Long/Short Strategy - Strategy—This category includes Funds that invest both long and short, primarily in common stocks. Management of the Funds has the ability to shift investments from value to growth strategies, from small to large capitalization stocks, and from a net long position to a net short position. |
| c | Multi-strategy Funds - Funds—This category includes Funds that pursue multiple strategies to diversify risks and reduce volatility. The Funds’ composite portfolio for this category includes investments in U.S. common stocks, non-U.S. common stocks, distressed debt, commodities and arbitrage investments. In addition, some of the Funds invest in various special situation investments. |
MILBANK WINTHROP & CO., INC. NOTES TO THE CONSOLIDATED FINANCIAL STATEMENTS DECEMBER 31, 2010 (continued) NOTE 4.INVESTMENTS IN FUNDS (continued) | d | Global Strategy Funds - Funds—This category includes Funds that hold investments in non-U.S. common stocks, primarily in the energy, information technology, utilities, and telecommunications sectors. They also hold investments in emerging markets and real estate sectors as well as investments in diversified currencies. |
Cost is determined based on capital contributions to, and withdrawals from, the Funds, plus reinvested realized net income. Substantially all of the Funds in which the Partnerships invest are charged management fees at varying rates, principally 0.75% to 2% annually of periodic net asset values. Substantially all of the Funds in which the Partnerships invest provide for a specific allocation or fee to their respective general partner or affiliate, which is calculated at various rates, primarily 20% of appreciation, as defined in their respective partnership agreements. Some of the Funds permit partial withdrawals during the year on either a monthly, quarterly or semiannual basis; however, substantially all of the Funds permit full withdrawals only at the end of the year. The activities of certain Funds include the purchase and sale of a variety of derivative financial instruments such as equity options, index options, swap agreements, futures and forward contracts, and other similar instruments. These derivatives are used for trading purposes and for managing risk associated with their portfolio of securities and securities sold short. The use of derivative instruments may involve elements of market risk in excess of the amount recognized in the statement of assets and liabilities of these Funds. In many cases, these Funds limit their risk by holding offsetting security or option positions. The Partnerships, through their investment in other Funds, is subject to certain inherent risks arising from their investing activities of short selling and entering into forward contracts. The ultimate cost to acquire these securities or settle these contracts may exceed the liability reflecting in their financial statements. NOTE 5.LEASE COMMITMENT The Company is subject to a lease for office space in New York City through April 30, 2012. The base rent is $149,400 per year and includes electricity. It is also subject to real estate tax and operating cost escalations. Future minimum lease commitments for the year ending December 31 are as follows: | | | | | 2011 | | $ | 149,400 | | 2012 | | | 49,800 | | | | | | | | | $ | 199,200 | | | | | | |
Total rent expense for the year ended December 31, 2010 was $167,506. MILBANK WINTHROP & CO., INC.
NOTES TO THE CONSOLIDATED FINANCIAL STATEMENTS
DECEMBER 31, 2010
(continued)
NOTE 6.PENSION PLAN The Company sponsors a 401(k) retirement plan for its employees. The Company contributes 3% of eligible employee’s compensation. The plan also permits elective deferrals by employees. Total Pension costs for the year ended December 31, 2010 were $13,350. MILBANK WINTHROP & CO., INC. NOTES TO THE CONSOLIDATED FINANCIAL STATEMENTS DECEMBER 31, 2010 (continued) NOTE 7.PREPAID EXPENSES AND OTHER The details of Milbank’s prepayments at December 31, 2010 are as follows: | | | | | Insurance | | $ | 86,685 | | Rent | | | 12,450 | | Other | | | 6,763 | | | | | | | | | $ | 105,898 | | | | | | |
NOTE 8.RELATED PARTY TRANSACTIONS Milbank earns advisory fees for client assets invested with the Partnerships. It is also reimbursed for costs incurred in providing administrative services to the Partnerships. During 2010, Milbank earned $3,829,228 in advisory fees and $505,200 in administrative fees from the Partnerships. These intercompany fees have been fully eliminated in the consolidated financial statements. NOTE 9.INCOME TAXES The Company’s income tax expense for the year ended December 31, 2010 has been determined as follows: | | | | | Current taxes | | | | | Federal | | $ | (11,820 | ) | State and local | | | 53,298 | | | | | | | | | | 41,478 | | Deferred taxes | | | | | Federal | | | 34,905 | | | | | | | | | $ | 76,383 | | | | | | |
Current taxes are provided using statutory tax rates as applied to taxable income. Deferred taxes are provided at approximately 35% of unrealized appreciation of investments in excess of tax basis. MILBANK WINTHROP & CO., INC.
NOTES TO THE CONSOLIDATED FINANCIAL STATEMENTS
DECEMBER 31, 2010
(continued)
NOTE 10.FURNITURE, EQUIPMENT AND LEASEHOLD IMPROVEMENTS Furniture, equipment and leasehold improvements are stated at cost less accumulated depreciation. As discussed in Note 2, the Company applies accelerated methods of depreciation over the estimated useful lives of the assets. | | | | | Asset at cost: | | | | | Furniture and equipment | | $ | 220,543 | | Leasehold improvement | | | 90,698 | | Total cost | | | 311,241 | | Less accumulated depreciation | | | (284,168 | ) | | | | | | Net fixed assets | | $ | 27,073 | | | | | | |
Depreciation expense for the year ended December 31, 2010 was $6,751. MILBANK WINTHROP & CO., INC. NOTES TO THE CONSOLIDATED FINANCIAL STATEMENTS DECEMBER 31, 2010 (continued) NOTE 11.SHARES OF STOCK Under the Certificate of Amendment of the Certificate of Incorporation dated January 9, 1997 (the “Certificate”), 7,000 shares of Class A Common Stock, having a par value of $0.05 per share, were authorized. Holders of Class A Common Stock are entitled to one vote per share. At December 31, 2010, 3,922 shares were issued and outstanding. Also under the Certificate, 7,000 shares of Class B Common Stock, having a par value of $0.05 per share, were authorized. Class B Common Stock is non-voting stock. At December 31, 2010, 2,496 shares were issued and outstanding. NOTE 12.SUBSEQUENT EVENTS Subsequent events have been evaluated through September 2, 2011, which is the date the financial statements were available to be issued. The Company is engaged in negotiations to merge with an outside entity. INDEPENDENT AUDITORS’ REPORT To the Shareholders of Milbank Winthrop & Co., Inc.: We have audited the accompanying consolidated statement of financial condition of Milbank Winthrop & Co., Inc. (the “Company”), as of December 31, 2009, and the related consolidated statements of income, changes in stockholders’ equity and cash flows for the year then ended. These financial statements are the responsibility of the Company’s management. Our responsibility is to express an opinion on these financial statements based on our audit. We conducted our audit in accordance with auditing standards generally accepted in the United States of America. Those standards require that we plan and perform the audit to obtain reasonable assurance about whether the financial statements are free of material misstatement. An audit includes examining, on a test basis, evidence supporting the amounts and disclosures in the financial statements. An audit also includes assessing the accounting principles used and significant estimates made by management, as well as evaluating the overall financial statement presentation. We believe that our audit provides a reasonable basis for our opinion. In our opinion, the consolidated financial statements referred to above present fairly, in all material respects, the financial position of Milbank Winthrop & Co., Inc. as of December 31, 2009, and the results of its operations and its cash flows for the year then ended in conformity with accounting principles generally accepted in the United States of America. /s/ Fulvio & Associates, LLP New York, New York August 30, 2011 MILBANK WINTHROP & CO., INC. CONSOLIDATED STATEMENT OF FINANCIAL CONDITION DECEMBER 31, 2009 | | | | | | | | | ASSETS | | | | | | | | | Cash and cash equivalents | | | | | | $ | 126,858 | | Investments in securities and partnerships | | | | | | | 24,660 | | Accounts receivable | | | | | | | 18,173 | | Prepaid taxes | | | | | | | 43,955 | | Furniture, equipment and leasehold improvements, at cost (net of accumulated depreciation of $277,417) | | | | | | | 28,197 | | Security deposit | | | | | | | 15,017 | | Prepaid expenses and other | | | | | | | 107,566 | | Consolidated Milbank Partnerships: | | | | | | | | | Cash and cash equivalents | | $ | 17,592,722 | | | | | | Investments in securities | | | 112,117,035 | | | | | | Investments in Funds | | | 183,960,896 | | | | | | Redemptions receivable from investments in Funds | | | 84,142,238 | | | | | | Accrued income | | | 253,647 | | | | | | Prepaid expenses and other | | | 116,957 | | | | 398,183,495 | | | | | | | | | | | TOTAL ASSETS | | | | | | $ | 398,547,921 | | | | | | | | | | | LIABILITIES AND STOCKHOLDERS’ EQUITY | | | | | | | | | Liabilities: | | | | | | | | | Accrued expenses | | | | | | $ | 39,481 | | Deferred taxes | | | | | | | 56,217 | | Consolidated Milbank Partnerships: | | | | | | | | | Contributions received in advance | | $ | 25,000 | | | | | | Accrued expenses | | | 1,511,832 | | | | | | Redemptions payable | | | 92,803,029 | | | | | | Securities sold short | | | 3,343,667 | | | | 97,683,538 | | | | | | | | | | | Total Liabilities | | | | | | | 97,779,226 | | | | | | | | | | | Commitments and Contingencies (see Note 5) | | | | | | | | | Stockholders’ Equity: | | | | | | | | | Common stock: | | | | | | | | | 7,000 Class A par $0.05 shares authorized; 3,922 shares issued and outstanding | | | | | | | 196 | | 7,000 Class B par $0.05 shares authorized; 2,496 shares issued and outstanding | | | | | | | 125 | | Additional paid in capital | | | | | | | 454,839 | | Retained earnings | | | | | | | 800,541 | | | | | | | | | | | Total Milbank Winthrop & Co., Inc. Stockholders’ Equity | | | | | | | 1,255,701 | | | | | | | | | | | Minority interests in Consolidated Milbank Partnerships | | | | | | | 299,512,994 | | | | | | | | | | | Total Stockholders’ Equity | | | | | | | 300,768,695 | | | | | | | | | | | TOTAL LIABILITIES AND STOCKHOLDERS’ EQUITY | | | | | | $ | 398,547,921 | | | | | | | | | | |
The accompanying notes are an integral part of these consolidated financial statements. MILBANK WINTHROP & CO., INC. CONSOLIDATED STATEMENT OF INCOME FOR THE YEAR ENDED DECEMBER 31, 2009 | | | | | | | | | REVENUES: | | | | | | | | | Investment advisory fees | | | | | | $ | 1,732,854 | | Other income | | | | | | | 5,074 | | Consolidated Milbank Partnerships: | | | | | | | | | Dividends | | $ | 1,837,732 | | | | | | Interest | | | 1,134,922 | | | | 2,972,654 | | | | | | | | | | | Total revenues | | | | | | | 4,710,582 | | | | | | | | | | | EXPENSES: | | | | | | | | | Compensation and benefits | | | | | | | 5,293,535 | | Rent | | | | | | | 164,251 | | Insurance | | | | | | | 140,120 | | Office and administrative | | | | | | | 134,206 | | Professional fees | | | | | | | 109,482 | | Depreciation | | | | | | | 2,097 | | Other | | | | | | | 156,041 | | Consolidated Milbank Partnerships: | | | | | | | | | Management and advisory fees | | | 1,582,597 | | | | | | Office and administrative | | | 1,226,115 | | | | | | Professional fees | | | 396,815 | | | | | | Interest and dividends | | | 295,978 | | | | 3,501,505 | | | | | | | | | | | Total expenses | | | | | | | 9,501,237 | | | | | | | | | | | LOSS BEFORE NET GAINS FROM CONSOLIDATED MILBANK PARTNERSHIPS | | | | | | | (4,790,655 | ) | Net gains from investment activities of Consolidated Milbank Partnerships: | | | | | | | | | Realized gain on investments in securities, net | | | 2,239,337 | | | | | | Unrealized gain on investments in securities, net change | | | 36,511,370 | | | | | | Realized gain on investments in Funds, net | | | 1,861,609 | | | | | | Unrealized gain on investments in Funds, net change | | | 56,060,996 | | | | 96,673,312 | | | | | | | | | | | INCOME BEFORE INCOME TAX EXPENSE | | | | | | | 91,882,657 | | Income tax expense | | | | | | | 138,669 | | | | | | | | | | | NET INCOME | | | | | | | 91,743,988 | | | | | | | | | | | Minority Interests in Consolidated Milbank Partnerships | | | | | | | (91,653,265 | ) | | | | | | | | | | NET INCOME ATTRIBUTABLE TO MILBANK WINTHROP & CO., INC. | | | | | | $ | 90,723 | | | | | | | | | | |
The accompanying notes are an integral part of these consolidated financial statements. MILBANK WINTHROP & CO., INC. CONSOLIDATED STATEMENT OF CHANGES IN STOCKHOLDERS’ EQUITY FOR THE YEAR ENDED DECEMBER 31, 2009 | | | | | | | | | | | | | | | | | | | | | | | | | | | | | | | | | | | | Number of
Class A Shares | | | Par Value | | | Number of
Class B Shares | | | Par Value | | | Additional
Paid-in Capital | | | Retained
Earnings | | | Minority
Interests in
Consolidated
Milbank
Partnerships | | | Total | | Balance at December 31, 2008 | | | 3,922 | | | $ | 196 | | | | 2,496 | | | $ | 125 | | | $ | 454,839 | | | $ | 709,818 | | | $ | 299,398,031 | | | $ | 300,563,009 | | Contributions | | | — | | | | — | | | | — | | | | — | | | | — | | | | — | | | | 2,150,000 | | | | 2,150,000 | | Redemptions | | | — | | | | — | | | | — | | | | — | | | | — | | | | — | | | | (93,688,302 | ) | | | (93,688,302 | ) | Net Income | | | — | | | | — | | | | — | | | | — | | | | — | | | | 90,723 | | | | 91,653,265 | | | | 91,743,988 | | | | | | | | | | | | | | | | | | | | | | | | | | | | | | | | | | | Balance at December 31, 2009 | | | 3,922 | | | $ | 196 | | | | 2,496 | | | $ | 125 | | | $ | 454,839 | | | $ | 800,541 | | | $ | 299,512,994 | | | $ | 300,768,695 | | | | | | | | | | | | | | | | | | | | | | | | | | | | | | | | | | |
The accompanying notes are an integral part of these consolidated financial statements. MILBANK WINTHROP & CO., INC. CONSOLIDATED STATEMENT OF CASH FLOWS FOR THE YEAR ENDED DECEMBER 31, 2009 | CASH FLOWS FROM OPERATING ACTIVITIES: | | | | | | | | | Net income | | | | $ | 90,723 | | | | | $ | 90,723 | | Adjustments to reconcile net income to net cash provided by operating activities | | | | | | | | | Consolidated Milbank Partnerships: | | | | | | | | | Net income | | $ | 91,653,265 | | | | | $ | 91,653,265 | | | | Depreciation | | | 2,097 | | | | | | 2,097 | | | | Deferred taxes | | | 56,217 | | | | | | 56,217 | | | | Purchases of securities and partnerships | | | (28,808 | ) | | | | | (28,808 | ) | | | Sales of securities and partnerships | | | 103 | | | | | | 103 | | | | Unrealized gain on investments in securities and partnerships, net change | | | (4,514 | ) | | | | | (4,514 | ) | | | Consolidated Milbank Partnerships: | | | | | | | | | Realized gain on investments in securities, net | | | (2,239,337 | ) | | | | | (2,239,337 | ) | | | Unrealized gain on investments in securities, net change | | | (36,511,370 | ) | | | | | (36,511,370 | ) | | | Realized gain on investments in funds, net | | | (1,861,609 | ) | | | | | (1,861,609 | ) | | | Unrealized gain on investments in funds, net change | | | (56,060,996 | ) | | | | | (56,060,996 | ) | | | Purchases of investments in securities | | | (122,598,527 | ) | | | | | (122,598,527 | ) | | | Purchases of investments in funds | | | (10,000,000 | ) | | | | | (10,000,000 | ) | | | Sales of investments in securities | | | 150,623,210 | | | | | | 150,623,210 | | | | Sales of investments in funds | | | 84,466,655 | | | | | | 84,466,655 | | | | (Increase) decrease in operating assets: | | | | | | | | | Accounts receivable | | | 16,348 | | | | | | 16,348 | | | | Prepaid taxes | | | (43,955 | ) | | | | | (43,955 | ) | | | Security deposit | | | (203 | ) | | | | | (203 | ) | | | Prepaid expenses and other | | | (2,488 | ) | | | | | (2,488 | ) | | | Consolidated Milbank Partnerships: | | | | | | | | | Cash and cash equivalents | | | (7,342,804 | ) | | | | | (7,342,804 | ) | | | Redemption receivable from investments in funds | | | (52,342,738 | ) | | | | | (52,342,738 | ) | | | Prepaid investments | | | 7,000,000 | | | | | | 7,000,000 | | | | Accounts receivable | | | 159,750 | | | | | | 159,750 | | | | Accrued income | | | 215,963 | | | | | | 215,963 | | | | Prepaid expenses and other | | | 10,596 | | | | | | 10,596 | | | | Increase (decrease) in operating liabilities: | | | | | | | | | Accrued expenses | | | 16,792 | | | | | | 16,792 | | | | Consolidated Milbank Partnerships: | | | | | | | | | Accrued expenses | | | 805,938 | | | | | | 805,938 | | | | | | | | | | | | | | | Total Adjustments | | | | | 45,989,585 | | | | | | 45,989,585 | | | | | | | | | | | | | Net cash provided by Operating Activities | | | | $ | 46,080,308 | | | | | $ | 46,080,308 | | | | | | | | | | | | | CASH FLOWS FROM FINANCING ACTIVITIES: | | | | | | Contributions to Milbank Partnerships | | | | | $ | 2,175,000 | | Redemption from Milbank Partnerships | | | | | | (48,233,273 | ) | | | | | | | | Net cash used in financing activities | | | | | | (46,058,273 | ) | | | | | | | | NET CHANGE IN CASH AND CASH EQUIVALENTS | | | | | | 22,035 | | Cash and Cash Equivalents at December 31, 2008 | | | | | | 104,823 | | | | | | | | | Cash and Cash Equivalents at December 31, 2009 | | | | | $ | 126,858 | | | | | | | | | Supplemental cash flow information: | | | | | | Cash paid during the period for taxes | | | | | $ | 88,729 | | | | | | | | |
The accompanying notes are an integral part of these consolidated financial statements. MILBANK WINTHROP & CO., INC. CONSOLIDATED STATEMENT OF CASH FLOWS
FOR THE YEAR ENDED DECEMBER 31, 2009
(continued)
| | | | | CASH FLOWS FROM FINANCING ACTIVITIES: | | | | | Contributions to Milbank Partnerships | | $ | 2,175,000 | | Redemption from Milbank Partnerships | | | (48,233,273 | ) | | | | | | Net cash used in financing activities | | | (46,058,273 | ) | | | | | | NET CHANGE IN CASH AND CASH EQUIVALENTS | | | 22,035 | | Cash and Cash Equivalents at December 31, 2008 | | | 104,823 | | | | | | | Cash and Cash Equivalents at December 31, 2009 | | $ | 126,858 | | | | | | | Supplemental cash flow information: | | | | | Cash paid during the period for taxes | | $ | 88,729 | | | | | | |
The accompanying notes are an integral part of these consolidated financial statements.
MILBANK WINTHROP & CO., INC
NOTES TO THE CONSOLIDATED FINANCIAL STATEMENTS DECEMBER 31, 2009 NOTE 1.ORGANIZATION Milbank Winthrop & Co., Inc. (“Milbank”) was incorporated in Delaware in 1980. “Milbank” conducts an investment advisory business in New York City and is registered with the Securities and Exchange Commission under the Investment Advisors Act of 1940. Milbank is the General Partner (the “General Partner”) of three investment partnerships, MW Global Partners, L.P., MW Small Cap, L.P. and MW Special Situations, L.P. (the “Partnerships”) which are consolidated in these financial statements (collectively the “Company”). The Partnerships invest in a mix of securities and independent investment partnerships (the “Funds”). NOTE 2.SIGNIFICANT ACCOUNTING POLICIES Basis of Presentation The accompanying financial statements are presented in conformity with accounting principles generally accepted in the United States of America (“GAAP”). Basis of Accounting The Company follows the accrual method of accounting. Income is recorded when earned, and expenses are recorded when incurred in the period to which they pertain. Purchases and sales of securities are recorded on the trade date basis. Basis of Consolidation Milbank consolidates the Partnerships in which the General Partner is presumed to have control under Accounting Standards Codification (“ASC”) 810-20. Although Milbank holds non-substantive equity-at-risk in the Partnerships, Milbank’s related parties, including its de facto agents, hold substantive equity-at-risk. Further, the limited partners do not have the right to dissolve the Partnerships or have substantive kick out rights or participating rights that would overcome the presumption of control by Milbank. Accordingly, Milbank consolidates the assets, liabilities and operating results of the Partnerships and records the minority interests held by the limited partners in the accompanying financial statements. All material intercompany transactions and balances have been eliminated. Use of Estimates The preparation of financial statements in conformity with GAAP requires management to make estimates and assumptions that affect the reported amounts of assets and liabilities at the date of the financial statements and the reported amounts of revenues and expenses during the reporting period. Actual results could differ from those estimates. Cash and Cash Equivalents For purposes of the statement of cash flows, cash and cash equivalents includes cash in banks and readily available money market funds in investment accounts. MILBANK WINTHROP & CO., INC. NOTES TO THE CONSOLIDATED FINANCIAL STATEMENTS DECEMBER 31, 2009 (continued) NOTE 2.SIGNIFICANT ACCOUNTING POLICIES (continued) Consolidated Milbank Partnerships - Partnerships—Cash and Cash Equivalents Cash and cash equivalents held by the Partnerships are not available to fund any of the liquidity needs of Milbank. Fair Value Measurements GAAP establishes a framework for measuring fair value and requires disclosures about fair value measurements, including a fair value hierarchy that prioritizes the inputs to value techniques used to measure fair value into three broad levels explained below: Level 1 - 1—Valuations based on quoted prices available in active markets for identical investments. Level 2 - 2—Valuations based on quoted prices in markets that are not active or for which all significant inputs are observable, either directly or indirectly. Level 3 - 3—Valuations based on inputs that are unobservable and significant to the overall fair value measurement. The inputs or methodology used for valuing investments are not necessarily an indication of the risks associated with investing in those investments. Valuation and Revenue Recognition Investments in securities, option contracts, and securities sold short which are traded on a national securities exchange or listed on NASDAQ are valued at the last reported sales price on the last business day of the year. Investments in securities and securities sold short which are traded in the over-the-counter market are valued at the last reported bid and ask prices, respectively. Securities for which market quotations are not readily available are valued at their fair value as determined in good faith under consistently applied procedures established by the General Partner. Although the General Partner and the Funds’ administrators use their best judgment in estimating the fair value of the investments in the Funds, there are inherent limitations in any estimation technique. Therefore, the values presented herein are not necessarily indicative of the amount that could be realized in a current transaction. Future events will also affect the estimates of fair value, and the effects of such events on the estimates of fair value could be material. The valuation of the Funds has been deemed reasonable based on inquiry and the documentation provided from the Funds’ general partners or administrators. The Funds may carry investments for which market quotations are not readily available and are valued at their fair value as determined in good faith by their respective general partners or administrators. A change in the estimated value may occur in the near term. Certain Funds invest in emerging markets. The risks of investments are often increased in developing countries. These risks include repatriation restrictions, foreign exchange fluctuations, low trading volume in securities markets of emerging countries, lack of uniform reporting standards, and political, economic and legal uncertainties. MILBANK WINTHROP & CO., INCINC. NOTES TO THE CONSOLIDATED FINANCIAL STATEMENTS DECEMBER 31, 2009 (continued) NOTE 2.SIGNIFICANT ACCOUNTING POLICIES (continued) Valuation and Revenue Recognition (continued) Milbank investment advisory fees are billed quarterly and recorded as revenue in the period earned. These fees are based on a percentage of assets under management. Income from Funds is recognized based upon the Company’s allocable share of the earnings of the Funds which carry their investments at fair value, which include unrealized gains and losses. Accounts Receivable Accounts Receivable consists of advisory fees due from clients and Funds Redemptions Receivable from Investments in Funds Redemptions receivable from investments in funds consists of withdrawal requests issued to the Funds, primarily to fund redemption requests of Fund partners. Furniture, Equipment and Leasehold Improvements Furniture, equipment and leasehold improvements are capitalized at cost. Depreciation is calculated using accelerated methods applied over the expected lives of the assets. The difference between these accelerated methods and the straight line depreciation required by GAAP is deemed immaterial in comparison to these financial statements taken as a whole. Leases The Company expenses payments on operating leases on a straight line basis over the term of the lease. Income Taxes The Company is subject to federal and state corporate income taxes. The Company calculates both current and deferred taxes based on the difference between the financial statement carrying value of assets and liabilities versus their tax basis. A provision for these taxes has been made and is reflected on the statement of income. Management has determined that the Company has no uncertain tax positions that would require financial statement adjustment or disclosure. The tax years that remain subject to examination by taxing authorities are 2006, 2007 and 2008. Foreign Securities The value of securities and cash equivalents which are denominated in foreign currencies are stated using the exchange rate in effect on the last business day of the year. Purchases and sales of securities, interest and dividend income and expenses, which are denominated in foreign currencies, are recorded at the exchange rate as of date of the transactions. For financial statement purposes, the Company does not isolate that portion of the gain or loss on securities resulting from exchange rate fluctuation. Such changes are combined with changes in market prices and shown as realized or unrealized gain or loss. MILBANK WINTHROP & CO., INC. NOTES TO THE CONSOLIDATED FINANCIAL STATEMENTS DECEMBER 31, 2009 (continued) NOTE 2.SIGNIFICANT ACCOUNTING POLICIES (continued) Accounting Developments In July 2006, the Financial Accounting Standards Board (“FASB”) issued FASB Interpretation Number (“FIN”) 48 which is part of ASC 740, Income Taxes. ASC 740 clarifies the accounting for income taxes recognized in financial statements. This interpretation prescribes a comprehensive model for how an entity should recognize, measure, present and disclose in its financial statements uncertain tax positions that the entity has taken or expects to take on a tax return. In February 2008, the FASB issued Staff Position FIN 48-2, Effective Date of FASB Interpretation No. 48 for Certain Nonpublic Enterprises, deferring the effective date for certain nonpublic enterprises, including the Company, to annual financial statements beginning after December 15, 2007. In January 2009, the FASB issued Staff Position FIN 48-3, Effective Date of FASB Interpretation No. 48 for Certain Nonpublic Enterprises, to provide another one-year delay of the effective date for certain nonpublic entities including the Company. Eligible entities that elect the deferral will be required to apply the uncertain tax position guidance of ASC 740 to annual financial statements for fiscal years beginning after December 15, 2008. Effective January 1, 2009, the Company adopted the application of uncertain tax positions which did not have a material effect on its consolidated financial statements. In May 2007, the FASB issued FASB Staff Position FIN 46(R)-7, Application of FIN 46(R) to Investment Companies (incorporated into ASC 810) (“ASC 810 Interpretation”) which amends ASC 810 to make permanent the temporary deferral of the application of ASC 810 to entities within the scope of the revised audit guide under Statement of Position (“SOP”) 07-1, Clarification of the Scope of the Audit and Accounting Guide Investment Companies and Accounting by Parent Companies and Equity Method Investors for Investments in Investment Companies (formerly SOP 07-1 and now incorporated into ASC 946-10 Financial Services – Services—Investment Companies) (“ASC 946-10”). ASC 810 Interpretation is effective upon adoption of ASC 946-10. In February 2008, the FASB indefinitely deferred the effective date of ASC 946-10. The Company does not expect the adoption of ASC 810 Interpretation to have a material impact on its consolidated financial statements. In December 2007, the FASB issued SFAS No. 141(R), Business Combinations, now ASC 805 (“ASC 805”). ASC 805 requires the acquiring entity in a business combination to recognize the full fair value of assets, liabilities, contractual contingencies and contingent consideration obtained in the transaction (whether for a full or partial acquisition); establishes the acquisition date fair value as the measurement objective for all assets acquired and liabilities assumed; requires expensing of most transaction and restructuring costs; and requires the acquirer to disclose to investors and other users all of the information needed to evaluate and understand the nature and financial effect of the business combination. ASC 805 applies to all transactions or other events in which the Company obtains control of one or more businesses, including those sometimes referred to as “true mergers” or “mergers of equals” and combinations achieved without the transfer of consideration, for example, by contract alone or through the lapse of minority veto rights. ASC 805 applies prospectively to business combinations for which the acquisition date is on or after January 1, 2009. The adoption of ASC 805 did not have an impact on the Company’s consolidated financial statements. In December 2007, the FASB issued Statement of Financial Accounting Standards (“SFAS”) No. 160, Noncontrolling Interests in Consolidated Financial Statements—an amendment of Accounting Research Bulletin No. 51, now incorporated into ASC 810. This pronouncement requires reporting entities to present non-controlling (minority) interests as equity (as opposed to as a liability or mezzanine equity) and provides guidance on the accounting for transactions between an entity and noncontrolling interests. This pronouncement applies prospectively as of January 1, 2009, except for the presentation and disclosure requirements which will be applied retrospectively for all periods presented. The adoption of this pronouncement did not have an impact on the Company’s consolidated financial statements. MILBANK WINTHROP & CO., INC. NOTES TO THE CONSOLIDATED FINANCIAL STATEMENTS DECEMBER 31, 2009 (continued) NOTE 2.SIGNIFICANT ACCOUNTING POLICIES (continued) Accounting Developments (continued) be applied retrospectively for all periods presented. The adoption of this pronouncement did not have an impact on the Company’s consolidated financial statements.
In April 2008, the FASB issued Staff Position Financial Accounting Standards (“FAS”) 142-3, Determination of the Useful Life of Intangible Assets (incorporated into ASC 350) (“ASC 350 Interpretation”). ASC 350 Interpretation amends the factors an entity should consider in developing renewal or extension assumptions used in determining the useful life of recognized intangible assets under ASC 350, Goodwill and Other Intangible Assets. ASC 350 Interpretation affects entities with recognized intangible assets and is effective for financial statements issued for fiscal years beginning after December 15, 2008, and interim periods within those fiscal years. Early adoption is prohibited. The new guidance applies prospectively to (1) intangible assets that are acquired individually or with a group of other assets and (2) both intangible assets acquired in business combinations and asset acquisitions. The adoption of ASC 350 Interpretation by the Company did not have an impact on its consolidated financial statements. In June 2009, the FASB issued SFAS No. 167, Amendments to FASB Interpretation No. 46(R), which changes the approach to determining the primary beneficiary of a Variable Interest Entity (“VIE”) and requires companies to more frequently assess whether they must consolidate VIEs. This pronouncement is effective for the first annual reporting period beginning after November 15, 2009 and for interim periods within that first annual reporting period. In November 2009, the FASB agreed to defer the effective date of this pronouncement for certain types of asset manager funds until the completion of its consolidation project. The Company is currently assessing the potential impacts, if any, on its consolidated financial statements and disclosures. In July 2009, the FASB Accounting Standards Codification and the Hierarchy of Generally Accepted Accounting Principles (the “Codification”) were issued. The Codification is effective for interim and annual periods ending after September 15, 2009. The Codification combines the previous GAAP hierarchy which included four levels of authoritative accounting literature distributed among a number of different sources. The Codification does not by itself create new accounting standards but instead reorganizes existing GAAP accounting rules into approximately 90 accounting topics. All existing accounting standard documents are superseded by the Codification and all other accounting literature not included in the Codification is now considered nonauthoritative. The Codification is now the single source of authoritative nongovernmental accounting standards in the United States of America. In 2009, FASB amended ASC 855, Subsequent Events (“ASC 855”). ASC 855 establishes the period after the balance sheet date during which management of a reporting entity shall evaluate events or transactions that may occur for potential recognition or disclosure in the financial statements, the circumstances under which an entity shall recognize events or transactions occurring after the balance sheet date in its financial statements and the disclosures that an entity shall make about events or transactions that occurred after the balance sheet date. We have evaluated events that have occurred subsequent to December 31, 2009 as prescribed by the FASB. In January 2010, the FASB issued Accounting Standards Update 2010-06, Improving Disclosures About Fair Value Measurements (“ASU 2010-06”). ASU 2010-06 requires disclosing separately the amount of significant transfers in and out of the Level 1 and Level 2 categories and the reasons for the transfers and it requires that Level 3 purchases, sales, issuances and settlements activity be reported on a gross rather than a net basis. ASU 2010-06 also requires fair value measurement disclosures for each class of assets and liabilities and MILBANK WINTHROP & CO., INC.
NOTES TO THE CONSOLIDATED FINANCIAL STATEMENTS
DECEMBER 31, 2009
(continued)
NOTE 2. SIGNIFICANT ACCOUNTING POLICIES (continued)
Accounting Developments (continued)
disclosures about valuation techniques and inputs used to measure fair value for both recurring and nonrecurring fair value measurements for Level 2 and Level 3 measurements. These disclosures are effective for fiscal periods beginning after December 15, 2009, except for the Level 3 gross reporting which is effective for fiscal periods beginning after December 15, 2010. The Company is currently assessing the potential impacts, if any, on its consolidated financial statements and disclosures. MILBANK WINTHROP & CO., INC. NOTES TO THE CONSOLIDATED FINANCIAL STATEMENTS DECEMBER 31, 2009 (continued) NOTE 3.FAIR VALUE MEASUREMENTS The following table summarizes the valuation of the Company’s investments under the fair value hierarchy, as described above, as of December 31, 2009: | | | | | | | | | | | | | | | | | Assets | | Level 1 | | | Level 2 | | | Level 3 | | | Total | | Investments in securities and partnerships | | $ | 2,487 | | | $ | — | | | $ | 22,173 | | | $ | 24,660 | | From Consolidated affiliated Partnerships: | | | | | | | | | | | | | | | | | Investments in securities | | | 99,416,010 | | | | 10,239,480 | | | | 2,461,545 | | | | 112,117,035 | | Investments in Funds | | | — | | | | 18,051,193 | | | | 165,909,703 | | | | 183,960,896 | | | | | | | | | | | | | | | | | | | Total | | $ | 99,418,497 | | | $ | 28,290,673 | | | $ | 168,393,421 | | | $ | 296,102,591 | | | | | | | | | | | | | | | | | | | Liabilities | | | | | | | | | | | | | | | | | Securities sold short | | $ | 1,844,370 | | | $ | 1,427,797 | | | $ | 71,500 | | | $ | 3,343,667 | | | | | | | | | | | | | | | | | | |
The following table discloses a reconciliation of investments measured at fair value on a recurring basis using significant unobservable inputs (Level 3) during the year ended December 31, 2009: | | | | | Assets | | Investments | | Beginning balance, December 31, 2008 | | $ | 203,148,415 | | Total gains or (losses), realized and unrealized | | | 51,669,953 | | Purchases and sales, net | | | (70,575,571 | ) | Transferred in/out of Level 3 | | | (15,849,376 | ) | | | | | | Ending balance, December 31, 2009 | | $ | 168,393,421 | | | | | | | The amount of gains (losses) included in income attributable to the change in unrealized gains (losses) relating to assets still held at December 31, 2009 | | $ | 52,044,937 | | | | | | |
MILBANK WINTHROP & CO., INC.
NOTES TO THE CONSOLIDATED FINANCIAL STATEMENTS
DECEMBER 31, 2009
(continued)
NOTE 3. FAIR VALUE MEASUREMENTS (continued)
| | Liabilities | | Securities Sold Short | | | Securities Sold
Short | | Beginning balance, December 31, 2008 | | $ | (179,100 | ) | | $ | (179,100 | ) | Total gains or (losses), realized and unrealized | | | 52,368 | | | | 52,368 | | Purchases and sales, net | | | 55,232 | | | | 55,232 | | | | | | | | | Ending balance, December 31, 2009 | | $ | (71,500 | ) | | $ | (71,500 | ) | | | | | | | | The amount of gains (losses) included in income attributable to the change in unrealized gains (losses) relating to liabilities still held at December 31, 2009 | | $ | 7,300 | | | $ | 7,300 | | | | | | | | |
Gains (losses), realized and unrealized, if any, are included in the net realized gain (loss) on investments or Funds and net change in unrealized gain (loss) on investments or Funds in the Statement of Income. The Company values its Level 2 investments in securities based on the last price in non-active markets. The Company values its Level 2 and 3 investments in Funds based on their proportionate share of the net assets of the Funds. Transfers between levels are recognized at the end of the reporting period. MILBANK WINTHROP & CO., INC. NOTES TO THE CONSOLIDATED FINANCIAL STATEMENTS DECEMBER 31, 2009 (continued) NOTE 4.INVESTMENTS IN FUNDS As of December 31, 2009, the Partnerships invested in other Funds, none of which were related parties. The investment objectives of the Funds primarily relate to the maximization of appreciation through the investments in equity, debt and related instruments. The Funds utilize one of the following strategies: | | a | Long Only Strategy - Strategy—This category includes Funds that invest in long positions only, primarily in common stocks. Management of the Funds has the ability to shift the investments from value to growth strategies and from small to large capitalization stocks. |
| | b | Equity Long/Short Strategy - Strategy—This category includes Funds that invest both long and short, primarily in common stocks. Management of the Funds has the ability to shift investments from value to growth strategies, from small to large capitalization stocks, and from a net long position to a net short position. |
| | c | Multi-strategy Funds - Funds—This category includes Funds that pursue multiple strategies to diversify risks and reduce volatility. The Funds’ composite portfolio for this category includes investments in U.S. common stocks, non-U.S. common stocks, distressed debt, commodities and arbitrage investments. In addition, some of the Funds invest in various special situation investments. |
| | d | Global Strategy Funds - Funds—This category includes Funds that hold investments in non-U.S. common stocks, primarily in the energy, information technology, utilities, and telecommunications sectors. They also hold investments in emerging markets and real estate sectors as well as investments in diversified currencies. |
Cost is determined based on capital contributions to, and withdrawals from, the Funds, plus reinvested realized net income. Substantially all of the Funds in which the Partnerships invest are charged management fees at varying rates, principally 0.75% to 2% annually of periodic net asset values. MILBANK WINTHROP & CO., INC.
NOTES TO THE CONSOLIDATED FINANCIAL STATEMENTS
DECEMBER 31, 2009
(continued)
NOTE 4. INVESTMENTS IN FUNDS (continued)
Substantially all of the Funds in which the Partnerships invest provide for a specific allocation or fee to their respective general partner or affiliate, which is calculated at various rates, primarily 20% of appreciation, as defined in their respective partnership agreements. Some of the Funds permit partial withdrawals during the year on either a monthly, quarterly or semiannual basis; however, substantially all of the Funds permit full withdrawals only at the end of the year. The activities of certain Funds include the purchase and sale of a variety of derivative financial instruments such as equity options, index options, swap agreements, futures and forward contracts, and other similar instruments. These derivatives are used for trading purposes and for managing risk associated with their portfolio of securities and securities sold short. The use of derivative instruments may involve elements of market risk in excess of the amount recognized in the statement of assets and liabilities of these Funds. In many cases, these Funds limit their risk by holding offsetting security or option positions. The Partnerships, through their investment in other Funds, are subject to certain inherent risks arising from their investing activities of short selling and entering into forward contracts. The ultimate cost to acquire these securities or settle these contracts may exceed the liability reflecting in their financial statements. MILBANK WINTHROP & CO., INC. NOTES TO THE CONSOLIDATED FINANCIAL STATEMENTS DECEMBER 31, 2009 (continued) NOTE 5.LEASE COMMITMENT The Company is subject to a lease for office space in New York City through April 30, 2012. The base rent is $149,400 per year and includes electricity. It is also subject to real estate tax and operating cost escalations. Future minimum lease commitments for the year ending December 31 are as follows: | | | | | 2010 | | $ | 149,400 | | 2011 | | | 149,400 | | 2012 | | | 49,800 | | | | | | | | | $ | 348,600 | | | | | | |
Total rent expense for the year ended December 31, 2009 was $164,251. NOTE 6.PENSION PLAN The Company sponsors a 401(k) retirement plan for its employees. The Company contributes 3% of eligible employee’s compensation. The plan also permits elective deferrals by employees. Total Pension costs for the year ended December 31, 2009 were $15,150. MILBANK WINTHROP & CO., INC.
NOTES TO THE CONSOLIDATED FINANCIAL STATEMENTS
DECEMBER 31, 2009
(continued)
NOTE 7.PREPAID EXPENSES AND OTHER The details of Milbank’s prepayments at December 31, 2009 are as follows: | | | | | Insurance | | $ | 84,116 | | Rent | | | 12,450 | | Other | | | 11,000 | | | | | | | | | $ | 107,566 | | | | | | |
NOTE 8.RELATED PARTY TRANSACTIONS Milbank earns advisory fees for client assets invested with the Partnerships. It is also reimbursed for costs incurred in providing administrative services to the Partnerships. During 2009, Milbank earned $3,807,621 in advisory fees and $474,750 in administrative fees from the Partnerships. These intercompany fees have been fully eliminated in the consolidated financial statements. MILBANK WINTHROP & CO., INC. NOTES TO THE CONSOLIDATED FINANCIAL STATEMENTS DECEMBER 31, 2009 (continued) NOTE 9.INCOME TAXES The Company’s income tax expense for the year ended December 31, 2009 has been determined as follows: | | | | | Current taxes | | | | | Federal | | $ | 14,347 | | State and local | | | 68,100 | | | | | | | | | | 82,447 | | Deferred taxes | | | | | Federal | | | 56,222 | | | | | | | | | $ | 138,669 | | | | | | |
Current taxes are provided using statutory tax rates as applied to taxable income. Deferred taxes are provided at approximately 35% of unrealized appreciation of investments in excess of tax basis. NOTE 10.FURNITURE, EQUIPMENT AND LEASEHOLD IMPROVEMENTS Furniture, equipment and leasehold improvements are stated at cost less accumulated depreciation. As discussed in Note 2, the Company applies accelerated methods of depreciation over the estimated useful lives of the assets. | | | | | Assets at cost: | | | | | Furniture and equipment | | $ | 214,916 | | Leasehold improvement | | | 90,698 | | | | | | | Total cost | | | 305,614 | | Less accumulated depreciation | | | (277,417 | ) | | | | | | Net fixed assets | | $ | 28,197 | | | | | | |
Depreciation expense for the year ended December 31, 2009 was $2,097. MILBANK WINTHROP & CO., INC.
NOTES TO THE CONSOLIDATED FINANCIAL STATEMENTS
DECEMBER 31, 2009
(continued)
NOTE 11.SHARES OF STOCK Under the Certificate of Amendment of the Certificate of Incorporation dated January 9, 1997 (the “Certificate”), 7,000 shares of Class A Common Stock, having a par value of $0.05 per share, were authorized. Holders of Class A Common Stock are entitled to one vote per share. At December 31, 2009, 3,922 shares were issued and outstanding. Also under the Certificate, 7,000 shares of Class B Common Stock, having a par value of $0.05 per share, were authorized. Class B Common Stock is non-voting stock. At December 31, 2009, 2,496 shares were issued and outstanding. NOTE 12.SUBSEQUENT EVENTS Subsequent events have been evaluated through August 30, 2011, which is the date the financial statements were available to be issued. The Company is engaged in negotiations to merge with an outside entity. INDEPENDENT AUDITORS’ REPORT To the Member of MW Commodity Advisors, LLC: We have audited the accompanying consolidated statement of financial condition of MW Commodity Advisors, LLC (the “Company”), as of December 31, 2011, and the related consolidated statements of operations, changes in member’s equity and cash flows for the year then ended. These consolidated financial statements are the responsibility of the Company’s management. Our responsibility is to express an opinion on these consolidated financial statements based on our audit. We conducted our audit in accordance with auditing standards generally accepted in the United States of America. Those standards require that we plan and perform the audit to obtain reasonable assurance about whether the financial statements are free of material misstatement. An audit includes examining, on a test basis, evidence supporting the amounts and disclosures in the financial statements. An audit also includes assessing the accounting principles used and significant estimates made by management, as well as evaluating the overall financial statement presentation. We believe that our audit provides a reasonable basis for our opinion. In our opinion, the consolidated financial statements referred to above present fairly, in all material respects, the financial position of MW Commodity Advisors, LLC as of December 31, 2011, and the results of its operations and its cash flows for the year then ended in conformity with accounting principles generally accepted in the United States of America. /s/ Fulvio & Associates, LLP New York, New York March 15, 2012 MW COMMODITY ADVISORS, LLC CONSOLIDATED STATEMENT OF FINANCIAL CONDITION DECEMBER 31, 2011 | | | | | | | | | ASSETS | | | | | | | | | Cash and cash equivalents | | | | | | $ | 2,919 | | Accounts receivable | | | | | | | 4,000 | | MW Commodity Strategies, L.P.: | | | | | | | | | Cash and cash equivalents | | $ | 141,356 | | | | | | Investments in Funds | | | 29,919,624 | | | | | | Other assets | | | 488 | | | | 30,061,468 | | | | | | | | | | | TOTAL ASSETS | | | | | | $ | 30,068,387 | | LIABILITIES AND MEMBER’S EQUITY | | | | | | | | | Liabilities: | | | | | | | | | Professional fees payable | | | | | | $ | 4,915 | | MW Commodity Strategies, L.P.: | | | | | | | | | Redemptions payable | | | 194,946 | | | | | | Professional fees payable | | | 27,325 | | | | | | Other liabilities | | | 20,614 | | | | 242,885 | | | | | | | | | | | Total Liabilities | | | | | | | 247,800 | | | | | | | | | | | Member’s Equity: | | | | | | | | | Member’s Equity | | | | | | | 71,811 | | Minority interests in MW Commodity Strategies, L.P. | | | | | | | 29,748,776 | | | | | | | | | | | Total Member’s Equity | | | | | | | 29,820,587 | | | | | | | | | | | TOTAL LIABILITIES AND MEMBER’S EQUITY | | | | | | $ | 30,068,387 | | | | | | | | | | |
The accompanying notes are an integral part of these consolidated financial statements. MW COMMODITY ADVISORS, LLC CONSOLIDATED STATEMENT OF OPERATIONS FOR THE YEAR ENDED DECEMBER 31, 2011 | REVENUES: | | | | | | | | | MW Commodity Strategies, L.P.: | | | | $ | 203 | | | | | | | | | | | | | Interest | | | | | | | | $ | 203 | | | | | | | 203 | | | | | | | Total revenues | | | | | | 203 | | | | | | | | | | | | | Total revenues | | | | | | EXPENSES: | | | | | | | | | Account fees | | | | | 27,164 | | | | | | 27,164 | | Other | | | | | 9,703 | | | | | | 9,703 | | MW Commodity Strategies, L.P.: | | | | | | | | | Professional fees | | $ | 41,138 | | | | | $ | 41,138 | | | | Other | | | 17,031 | | | | 58,169 | | | | 17,031 | | | | 58,169 | | | | | | | | | | | | | | | Total expenses | | | | | 95,036 | | | | | | 95,036 | | | | | | | | | | | | | LOSS BEFORE NET GAINS (LOSS) FROM | | | | | | | | | MW COMMODITY STRATEGIES, L.P. | | | | | (94,833 | ) | | | | | (94,833 | ) | Net loss from MW Commodity Strategies, L.P.: | | | | | | | | | Realized loss on investments in Funds, net | | | (288,915 | ) | | | | | (288,915 | ) | | | Unrealized loss on investments in Funds, net change | | | (2,287,676 | ) | | | (2,576,591 | ) | | | (2,287,676 | ) | | | (2,576,591 | ) | | | | | | | | | | | | | | NET LOSS | | | | | (2,671,424 | ) | | | | | (2,671,424 | ) | | | | | | | | | | | | Minority Interests in MW Commodity Strategies, L.P. | | | | | 2,793,270 | | | | | | 2,793,270 | | | | | | | | | | | | | NET INCOME ATTRIBUTABLE TO MW COMMODITY ADVISORS, LLC | | | | $ | 121,846 | | | | | $ | 121,846 | | | | | | | | | | | | |
The accompanying notes are an integral part of these consolidated financial statements. MW COMMODITY ADVISORS, LLC CONSOLIDATED STATEMENT OF CHANGES IN MEMBER’S EQUITY FOR THE YEAR ENDED DECEMBER 31, 2011 | | | | MW Commodity
Advisors, LLC
Sole Member | | Minority
Interests in MW
Commodity
Strategies, L.P. | | Total | | | MW Commodity
Advisors, LLC
Sole Member | | Minority
Interests in MW
Commodity
Strategies, L.P. | | Total | | Member’s Equity - December 31, 2010 | | $ | 169,965 | | | $ | 27,650,761 | | | $ | 27,820,726 | | | Member’s Equity—December 31, 2010 | | | $ | 169,965 | | | $ | 27,650,761 | | | $ | 27,820,726 | | Contributions- | | | — | | | | 5,650,000 | | | | 5,650,000 | | | | — | | | | 5,650,000 | | | | 5,650,000 | | Withdrawals | | | (220,000 | ) | | | (758,715 | ) | | | (978,715 | ) | | | (220,000 | ) | | | (758,715 | ) | | | (978,715 | ) | Net Income (Loss) | | | 121,846 | | | | (2,793,270 | ) | | | (2,671,424 | ) | | | 121,846 | | | | (2,793,270 | ) | | | (2,671,424 | ) | | | | | | | | | | | | | | | | | | | | Member’s Equity - December 31, 2011 | | $ | 71,811 | | | $ | 29,748,776 | | | $ | 29,820,587 | | | Member’s Equity—December 31, 2011 | | | $ | 71,811 | | | $ | 29,748,776 | | | $ | 29,820,587 | �� | | | | | | | | | | | | | | | | | | | |
The accompanying notes are an integral part of these consolidated financial statements. MW COMMODITY ADVISORS, LLC CONSOLIDATED STATEMENT OF CASH FLOWS FOR THE YEAR ENDED DECEMBER 31, 2011 | | | | | | | | | CASH FLOWS FROM OPERATING ACTIVITIES: | | | | | | | | | Net income | | | | | | $ | 121,846 | | Adjustments to reconcile net income to net cash used in operating activities: | | | | | | | | | MW Commodity Strategies, L.P.: | | | | | | | | | Net loss | | $ | (2,793,270 | ) | | | | | Realized loss on investments in Funds, net | | | 288,915 | | | | | | Unrealized loss on investments in Funds, net change | | | 2,287,676 | | | | | | Purchase of investments in Funds | | | (8,500,000 | ) | | | | | Proceeds from investments in Funds | | | 4,273,076 | | | | | | (Increase) decrease in operating assets: | | | | | | | | | Accounts receivable | | | (4,000 | ) | | | | | MW Commodity Strategies, L.P.: | | | | | | | | | Cash and cash equivalents | | | 909,153 | | | | | | Redemptions receivable from investments in Funds | | | 100,000 | | | | | | Other assets | | | 6,893 | | | | | | Increase (decrease) in operating liabilities: | | | | | | | | | Professional fees payable | | | 4,915 | | | | | | MW Commodity Strategies, L.P.: | | | | | | | | | Professional fees payable | | | (46,575 | ) | | | | | Other liabilities | | | 7,857 | | | | | | | | | | | | | | | Total adjustments | | | | | | | (3,465,360 | ) | | | | | | | | | | Net Cash Used in Operating Activities | | | | | | | (3,343,514 | ) | | | | | | | | | | CASH FLOWS FROM FINANCING ACTIVITIES: | | | | | | | | | Withdrawals | | | (220,000 | ) | | | | | MW Commodity Strategies, L.P.: | | | | | | | | | Contributions | | | 5,650,000 | | | | | | Withdrawals | | | (2,155,810 | ) | | | | | | | | | | | | | | Net Cash Provided by Financing Activities | | | | | | | 3,274,190 | | | | | | | | | | | NET CHANGE IN CASH AND CASH EQUIVALENTS | | | | | | | (69,324 | ) | Cash and Cash Equivalents at December 31, 2010 | | | | | | | 72,243 | | | | | | | | | | | Cash and Cash Equivalents at December 31, 2011 | | | | | | $ | 2,919 | | | | | | | | | | |
The accompanying notes are an integral part of these consolidated financial statements. MW COMMODITY ADVISORS, LLC NOTES TO THE CONSOLIDATED FINANCIAL STATEMENTS DECEMBER 31, 2011 NOTE 1.ORGANIZATION MW Commodity Advisors, LLC (“Advisors”), a single member limited liability company formed in Delaware on June 17, 2005, conducts an investment advisory business in New York City and is an affiliate of Milbank Winthrop & Co., an investment advisor registered under the Investment Advisers Act of 1940, as amended. Advisors is the general partner (the “General Partner”) of MW Commodity Strategies, L.P., an investment partnership (the “Partnership”) which is consolidated in these financial statements (collectively, the “Company”). The Partnership invests in various independent investment partnerships (the “Funds”). NOTE 2.SIGNIFICANT ACCOUNTING POLICIES Basis of Presentation The financial statements are presented in conformity with accounting principles generally accepted in the United States of America (“GAAP”). Basis of Accounting The Company follows the accrual method of accounting. Income is recorded when earned, and expenses are recorded when incurred in the period to which they pertain. Purchases and sales of securities are recorded on the trade date basis. Purchases and sales of Funds are recorded on the effective date as specified in the Funds’ investment agreements. Use of Estimates The presentation of financial statements in conformity with GAAP may require management to make estimates and assumptions that affect the reported amounts of assets and liabilities and disclosure of contingent assets and liabilities at the date of the financial statements and the reported amounts of revenues and expenses during the reporting period. Actual results could differ from those estimates. Cash and Cash Equivalents Cash and cash equivalents consist of cash on hand and liquid investments with maturities of less than 90 days. For purposes of the statement of cash flows, cash and cash equivalents includes cash in banks and readily available money market funds in investment accounts. Basis of Consolidation Advisors consolidates the Partnership in which the General Partner is presumed to have control under Accounting Standards Codification (“ASC”) 810-20. Although Advisors holds non-substantive equity-at-risk in the Partnership, Advisors’ related parties, including its de facto agents, hold substantive equity-at-risk. Further, the limited partners do not have the right to dissolve the Partnership or have substantive kick out rights or participating rights that would overcome the presumption of control by Advisors. Accordingly, Advisors consolidates the assets, liabilities and operating results of the Partnership and records the minority interests held by the limited partners in the accompanying financial statements. All material intercompany transactions and balances have been eliminated. MW COMMODITY ADVISORS, LLC NOTES TO THE CONSOLIDATED FINANCIAL STATEMENTS DECEMBER 31, 2011 (continued) NOTE 2.SIGNIFICANT ACCOUNTING POLICIES (continued) MW Commodity Strategies, L.P. - —Cash and Cash Equivalents Cash and cash equivalents held by the Partnership are not available to fund any of the liquidity needs of Advisors. Fair Value Measurements GAAP establishes a framework for measuring fair value and requires disclosures about fair value measurements, including a fair value hierarchy that prioritizes the inputs to valuation techniques used to measure fair value into three broad levels explained below: Level 1 - Valuations based on quoted prices available in active markets for identical investments. Level 2 - Valuations based on quoted prices in markets that are not active or for which all significant inputs are observable, either directly or indirectly. Level 3 - Valuations based on inputs that are unobservable and significant to the overall fair value measurement. The inputs or methodology used for valuing investments are not necessarily an indication of the risks associated with holding those investments. Valuation and Revenue Recognition Investments in securities, option contracts, and securities sold short which are traded on a national securities exchange or listed on NASDAQ are valued at the last reported sales price on the last business day of the year. Investments in securities and securities sold short which are traded in the over-the-counter market are valued at the last reported bid and ask prices, respectively. Securities for which market quotations are not readily available are valued at their fair value as determined in good faith under consistently applied procedures established by the General Partner. Although the General Partner and the Funds’ administrators use their best judgment in estimating the fair value of the investments in the Funds, there are inherent limitations in any estimation technique. Therefore, the values presented herein are not necessarily indicative of the amount that could be realized in a current transaction. Future events will also affect the estimates of fair value, and the effects of such events on the estimates of fair value could be material. The valuation of the Funds has been deemed reasonable based on inquiry and the documentation provided from the Funds’ general partners or administrators. The Funds may carry investments for which market quotations are not readily available and are valued at their fair value as determined in good faith by their respective general partners or administrators. A change in the estimated value may occur in the near term. Certain Funds invest in emerging markets. The risks of investments are often increased in developing countries. These risks include repatriation restrictions, foreign exchange fluctuations, low trading volume in securities markets of emerging countries, lack of uniform reporting standards, and political, economic and legal uncertainties. MW COMMODITY ADVISORS, LLC NOTES TO THE CONSOLIDATED FINANCIAL STATEMENTS DECEMBER 31, 2011 (continued) NOTE 2.SIGNIFICANT ACCOUNTING POLICIES (continued) Valuation and Revenue Recognition (continued) Income from Funds is recognized based upon the Company’s allocable share of the earnings of the Funds which carry their investments at fair value, which include unrealized gains and losses. The Funds generally value their investments according to the following guidelines: Short-term investments are valued at amortized cost, which approximates fair value. Securities held and sold short listed on a national securities exchange are valued at the last sale price on the date of valuation, or if no sale occurred on such date, at the last bid or ask price thereon or at an appropriate discount from such price if such securities are restricted. Non-marketable securities are carried at estimated fair value as determined by the management of the Funds. Trade debt, bank debt, and warrants for which market quotations are not readily available are generally valued by the management of the Funds at fair value after consideration of a variety of factors including quotations available from dealers who make a market in these financial instruments and model produced valuations. Private equity investments are carried at fair value, which may be estimated using methods such as comparable companies’ earnings multiples, cash flow analyses, and review of underlying financial conditions. Loan participations are interests in short-term loans valued at fair value, which generally approximates cost plus accrued interest. Options for the purchase or sale of securities traded on an exchange are valued at the mean of the last report bid and ask prices. Forward contracts are valued by adjusting the spot market price of the underlying security for the cost of carrying from the trade date to the settlement date. All other securities are valued initially at cost, with subsequent adjustment to value which reflect either the basis of meaningful third party transactions in the private market or the fair value deemed appropriate by the general partner of each of the Funds. In such instances, consideration is also given to the financial condition and operating results of the issuer, the amount that Funds can reasonably expect to realize upon the sale of the securities and any other factors deemed relevant. The Fund’s general partners’ estimates and assumptions of fair value of the non-marketable securities may differ significantly from the values that would have been used had a ready market existed, and the differences could be material. Interest and Dividends Interest income is recognized on an accrual basis. Dividend income is recognized on the ex-dividend date. Income Taxes Advisors and the Partnership themselves are not subject to U.S. Federal income taxes. Each member/partner is individually liable for income taxes, if any, on its share of the entity’s net taxable income. Interest, dividends and other income realized by the Partnership from non-U.S. sources and capital gains realized on the sale of securities of non-U.S. issuers may be subject to withholding and other taxes levied by the jurisdiction in which the income is sourced. The General Partner determined that there are no uncertain tax positions which would require adjustments or disclosures on the financial statements. The tax years that remain subject to examination by taxing authorities are 2008, 2009 and 2010. MW COMMODITY ADVISORS, LLC NOTES TO THE CONSOLIDATED FINANCIAL STATEMENTS DECEMBER 31, 2011 (continued) NOTE 2.SIGNIFICANT ACCOUNTING POLICIES (continued) Accounting Developments In June 2009, the Financial Accounting Standards Board (“FASB”) issued Statement of Financial Accounting Standard (“SFAS”) No. 167, Amendments to FASB Interpretation No. 46(R), which changes the approach to determining the primary beneficiary of a Variable Interest Entity (“VIE”) and requires companies to more frequently assess whether they must consolidate VIEs. This pronouncement is effective for the first annual reporting period beginning after November 15, 2009 and for interim periods within that first annual reporting period. In November 2009, the FASB agreed to defer the effective date of this pronouncement for certain types of asset manager funds until the completion of its consolidation project. The Company is currently assessing the potential impacts, if any, on its consolidated financial statements and disclosures. In January 2010, the FASB issued. Accounting Standards Update 201006, Improving Disclosures About Fair Value Measurements (“ASU 2010-06”). ASU 2010-06 requires disclosing separately the amount of significant transfers in and out of the Level 1 and Level 2 categories and the reasons for the transfers and it requires that Level 3 purchases, sales, issuances and settlements activity be reported on a gross rather than a net basis. ASU 2010-06 also requires fair value measurement disclosures for each class of assets and liabilities and disclosures about valuation techniques and inputs used to measure fair value for both recurring and nonrecurring fair value measurements for Level 2 and Level 3 measurements. These disclosures are effective for fiscal periods beginning after December 15, 2009, except for the Level 3 gross reporting which is effective for fiscal periods beginning after December 15, 2010. The Company does not anticipate that the adoption of ASU 2010-06 will have a material impact on its consolidated financial statements. In May 2011, the FASB issued amended guidance on fair value measurements to achieve common fair value measurement and disclosure requirements in GAAP and International Financial Reporting Standards. The amended guidance specifies that the concepts of highest and best use and valuation premise in a fair value measurement are relevant only when measuring the fair value of nonfinancial assets and are not relevant when measuring the fair value of financial assets or liabilities. The amendments include requirements specific to measuring the fair value of those instruments, such as equity interests used as consideration in a business combination. An entity should measure the fair value of its own equity instrument from the perspective of a market participant that holds the instrument as an asset. With respect to financial instruments that are managed as part of a portfolio, an exception to fair value requirements is provided. That exception permits a reporting entity to measure the fair value of such financial assets and liabilities at the price that would be received to sell a net asset position for a particular risk or to transfer a net liability position for a particular risk in an orderly transaction between market participants at the measurement date. The amendments also clarify that premiums and discounts should only be applied if market participants would do so when pricing the asset or liability. Premiums and discounts related to the size of an entity’s holding (e.g., a blockage factor) rather than as a characteristic of the asset or liability (e.g., a control premium) are not permitted in a fair value measurement. The guidance also requires enhanced disclosures about fair value measurements, including, among other things, (a) for fair value measurements categorized within Level III of the fair value hierarchy, (1) a quantitative disclosure of the unobservable inputs and assumptions used in the measurement, (2) the valuation process used by the reporting entity, and (3) a narrative description of the sensitivity of the fair value measurement to changes in unobservable inputs and the interrelationships between those unobservable inputs, if any, and (b) the categorization by level of the fair value hierarchy for items that are not measured at fair value in the statement of financial condition but for which the fair value is required to be disclosed (for example, a financial instrument that is measured at amortized cost in the statement of financial condition but for which fair value is disclosed). The guidance also amends disclosure requirements for significant transfers between Level I and Level II and now MW COMMODITY ADVISORS, LLC NOTES TO THE CONSOLIDATED FINANCIAL STATEMENTS DECEMBER 31, 2011 (continued) NOTE 2.SIGNIFICANT ACCOUNTING POLICIES (continued) Accounting Developments (continued) requires disclosure of all transfers between Levels I and II in the fair value hierarchy. The amended guidance is effective for interim and annual periods beginning after December 15, 2011. As the impact of the guidance is primarily limited to enhanced disclosures, adoption is not expected to have a material impact on the Company’s consolidated financial statements. In December 2011, the FASB issued a deferral of the effective date for certain disclosures relating to the comprehensive income, specifically with respect to the presentation of reclassifications of items out of accumulated other comprehensive income. The deferral is effective for fiscal years, and interim periods within those years, beginning after December 15, 2011. As the amendments are limited to presentation only, adoption is not expected to have a material impact on the Company’s financial statements. NOTE 3.INVESTMENTS IN FUNDS As of December 31, 2011, the Company was invested in 13 Funds, none of which are related parties. The Funds employ, to varying degrees, directional, volatility and relative value based strategies for investments in the commodity and macro markets. See detailed descriptions of the Fund strategies below. The partnership agreements of the Funds provide for compensation to the investment managers in the form of management fees ranging from 0% to 2% annually of net assets and an incentive allocation not exceeding 30% of net new profits earned. | Fund and (Strategy) | | Fair Value at
December 31, 2011 | | | Capital
Liquidity | | | Fair Value at
December 31, 2011 | | | Capital
Liquidity | Covepoint Emerging Markets Macro
Fund, L.P. CI. A. (d) | | $ | 2,258,119 | | | | Quarterly | | | $ | 2,258,119 | | | Quarterly | Covepoint Emerging Markets Macro
Fund, L.P. CI. B. (d) | | | 448,619 | | | | Quarterly | | | | 448,619 | | | Quarterly | Dynamic Domestic Fund L.P. (d) | | | 2,898,050 | | | | Monthly | | | | 2,898,050 | | | Monthly | Goldfinch Capital Management, L.P. (b) | | | 1,939,801 | | | | Monthly | | | | 1,939,801 | | | Monthly | Hard Assets Partners 2X L.P. (d) | | | 2,112,717 | | | | Quarterly | | | | 2,112,717 | | | Quarterly | Peak Partners, L.P. (d) | | | 1,922,912 | | | | Monthly | | | | 1,922,912 | | | Monthly | Tiverton Investments, LLC (d) | | | 4,432,502 | | | | Monthly | | | | 4,432,502 | | | Monthly | Vardana Partners, LP (d) | | | 2,728,342 | | | | Quarterly | | | | 2,728,342 | | | Quarterly | Wexford Catalyst Fund, L.P. (d) | | | 3,180,816 | | | | Quarterly | | | | 3,180,816 | | | Quarterly | Bocage Global Resource Fund, L.P. (b) | | | 4,257,486 | | | | Monthly | | | | 4,257,486 | | | Monthly | Taylor Woods (b) | | | 3,250,111 | | | | Quarterly | | | | 3,250,111 | | | Quarterly | Other Funds (a), (c) | | | 490,149 | | | | | | 490,149 | | | | | | | | | | | | | | | Total Investments in Funds | | $ | 29,919,624 | | | | | $ | 29,919,624 | | | | | | | | | | | | | | |
As of December 31, 2011, the investments in Funds had no remaining significant lockups and all Funds qualified as Level 2 investments. The Partnership values Level 2 investments based on its proportionate share of the net asset value of the Funds. Gains and losses (realized and unrealized), if any, are included in the net realized gain (loss) on investments in Funds and net change in unrealized gain (loss) on investments in Funds in the statement of operations. Transfers between levels are recognized at the end of the reporting period. MW COMMODITY ADVISORS, LLC NOTES TO THE CONSOLIDATED FINANCIAL STATEMENTS DECEMBER 31, 2011 (continued) NOTE 3.INVESTMENTS IN FUNDS (continued) The Fund investment strategies are as follows: a) Equity Long/Short Funds: This category includes investments in Funds that invest both long and short primarily in U.S. common stocks. Portfolio managers have the ability to shift investments from value to growth strategies, from small to large capitalization stocks, and from a net long position to a net short position. The fair values of the investments in this category have been estimated using the net asset value per share of the investments which are provided by the Fund’s associated administrators. b) Futures and Derivatives Funds: This category includes investments in Funds that invest primarily in commodity futures and derivatives. The Portfolio manager’s investment strategy may use fundamental analysis, technical analysis or a combination of the two. Investment decisions target both short and long term price movement in the commodity and associated markets. In certain instances, managers may use relative value based strategies, weighing different time horizons or commodities against each other. The fair values of the investments in this category have been estimated using the net asset value per share of the investments which are provided by the Fund’s associated administrators. c) Macro Funds: The category is similar to Futures and Derivatives Funds above but with a focus on using macro-based strategies, which may include commodity futures and derivatives, currencies (including “commodity” currencies), fixed income instruments and securities. The economics of the commodity markets may influence the portfolio manager’s decisions in this category. The fair value of the investments in this category have been estimated using the net asset value per share of the investments which are provided by the Fund’s associated administrators. d) Multi-Strategy Funds: This category includes investments in Funds which utilize a combination of the preceding Equity Long/Short, Futures and Derivatives and Macro Funds approaches. Portfolio managers will determine allocations to such strategies based on their expectations of return and risk. The fair values of the investments in this category have been estimated using the net asset value per share of the investments which are provided by the Fund’s associated administrators. MW COMMODITY ADVISORS, LLC
NOTES TO THE CONSOLIDATED FINANCIAL STATEMENTS
DECEMBER 31, 2011
(continued)
NOTE 4.OFF-BALANCE SHEET RISK, CONCENTRATION OF CREDIT RISK, AND OTHER RISKS In the normal course of business, the Funds in which the Partnership invests trade various financial instruments and enter into various investment activities with off-balance sheet risk. These include, but are not limited to, short selling activities, writing option contracts, and equity swaps. To the extent that the Partnership’s investment activity is limited to making investments in Funds via limited partnership interests or limited liability company holdings, the Partnership’s risk of loss in these Funds is generally limited to the value of these investments reported by the Partnership. To date, the Partnership has only invested in such limited partnership interests and limited liability company holdings. MW COMMODITY ADVISORS, LLC NOTES TO THE CONSOLIDATED FINANCIAL STATEMENTS DECEMBER 31, 2011 (continued) NOTE 4.OFF-BALANCE SHEET RISK, CONCENTRATION OF CREDIT RISK, AND OTHER RISKS (continued) There are a number of other risks to the Partnership. Three principal types of risk that can adversely affect the Partnership’s investment approach are market risk, strategy risk, and manager risk. The Partnership is also subject to multiple manager risks, possible limitations in investment opportunities, allocation risks, illiquidity, lack of diversification, and other risks for the Partnership and potentially for each Fund. NOTE 5.COMMITMENTS AND CONTINGENCIES In the normal course of business, the Company may enter into contracts that contain a variety of representations and warranties and which provide general indemnifications. The general indemnifications apply not only to the extent such representations and warranties are untrue but also may cover third parties such as the Partnership’s Administrator for claims related to the services performed for the Partnership. The Company’s maximum exposure under any such arrangements are unknown, as exposure only arises to the extent further claims that have not yet occurred are made against the Company. NOTE 6.RELATED PARTY TRANSACTIONS Advisors earned $158,015 in management fees from the Partnership during 2011. These intercompany fees have been fully eliminated in these consolidated financial statements. NOTE 7.SUBSEQUENT EVENTS Subsequent events have been evaluated through March 15, 2012, which is the date the consolidated financial statements were available to be issued. In January, 2012, Advisors signed an agreement to sell its assets to Silvercrest Asset Management Group LLC on March 31, 2012. INDEPENDENT AUDITORS’ REPORT To the Member of MW Commodity Advisors, LLC: We have audited the accompanying consolidated statement of financial condition of MW Commodity Advisors, LLC (the “Company”), as of December 31, 2010, and the related consolidated statements of income, changes in member’s equity and cash flows for the year then ended. These financial statements are the responsibility of the Company’s management. Our responsibility is to express an opinion on these financial statements based on our audit. We conducted our audit in accordance with auditing standards generally accepted in the United States of America. Those standards require that we plan and perform the audit to obtain reasonable assurance about whether the financial statements are free of material misstatement. An audit includes examining, on a test basis, evidence supporting the amounts and disclosures in the financial statements. An audit also includes assessing the accounting principles used and significant estimates made by management, as well as evaluating the overall financial statement presentation. We believe that our audit provides a reasonable basis for our opinion. In our opinion, the consolidated financial statements referred to above present fairly, in all material respects, the financial position of MW Commodity Advisors, LLC as of December 31, 2010, and the results of its operations and its cash flows for the year then ended in conformity with accounting principles generally accepted in the United States of America. /s/ Fulvio & Associates, LLP New York, New York October 28, 2011 MW COMMODITY ADVISORS, LLC CONSOLIDATED STATEMENT OF FINANCIAL CONDITION DECEMBER 31, 2010 | | | | | | | | | ASSETS | | | | | | | | | Cash and cash equivalents | | | | | | $ | 72,243 | | MW Commodity Strategies, L.P.: | | | | | | | | | Cash and cash equivalents | | $ | 1,050,509 | | | | | | Investments in Funds | | | 28,269,291 | | | | | | Redemptions receivable | | | 100,000 | | | | | | Other assets | | | 7,381 | | | | 29,427,181 | | | | | | | | | | | TOTAL ASSETS | | | | | | $ | 29,499,424 | | | | | | | | | | | LIABILITIES AND MEMBER’S EQUITY | | | | | | | | | Liabilities: | | | | | | | | | MW Commodity Strategies, L.P.: | | | | | | | | | Redemptions payable | | $ | 1,592,041 | | | | | | Professional fees payable | | | 73,900 | | | | | | Other liabilities | | | 12,757 | | | | | | | | | | | | | | | Total Liabilities | | | | | | $ | 1,678,698 | | | | | | | | | | | Member’s Equity: | | | | | | | | | Member’s Equity | | | | | | | 169,965 | | | | | | | | | | | Minority interests in MW Commodity Strategies, L.P. | | | | | | | 27,650,761 | | | | | | | | | | | Total Member’s Equity | | | | | | | 27,820,726 | | | | | | | | | | | TOTAL LIABILITIES AND MEMBER’S EQUITY | | | | | | $ | 29,499,424 | | | | | | | | | | |
The accompanying notes are an integral part of these consolidated financial statements. MW COMMODITY ADVISORS, LLC CONSOLIDATED STATEMENT OF INCOME FOR THE YEAR ENDED DECEMBER 31, 2010 | | | | | | | | | REVENUES: | | | | | | | | | MW Commodity Strategies, L.P.: | | | | | | | | | Interest | | | | | | $ | 679 | | | | | | | | | | | Total revenues | | | | | | | 679 | | | | | | | | | | | EXPENSES: | | | | | | | | | Account fees | | | | | | | 26,384 | | Liability fees | | | | | | | 18,648 | | Filing fees | | | | | | | 783 | | Other | | | | | | | 2,211 | | MW Commodity Strategies, L.P.: | | | | | | | | | Professional fees | | $ | 86,482 | | | | | | Other | | | 14,510 | | | | 100,992 | | | | | | | | | | | Total expenses | | | | | | | 149,018 | | | | | | | | | | | LOSS BEFORE NET GAINS FROM MW COMMODITY STRATEGIES, L.P. | | | | | | | (148,339 | ) | Net gains from investment activities of MW Commodity Strategies, L.P.: | | | | | | | | | Realized gain on investments in Funds, net | | | 84,434 | | | | | | Unrealized gain on investments in Funds, net change | | | 1,125,925 | | | | 1,210,359 | | | | | | | | | | | NET INCOME | | | | | | $ | 1,062,020 | | | | | | | | | | | Minority Interests in MW Commodity Strategies, L.P. | | | | | | | (939,734 | ) | | | | | | | | | | NET INCOME ATTRIBUTABLE TO MW COMMODITY ADVISORS, LLC | | | | | | $ | 122,286 | | | | | | | | | | |
The accompanying notes are an integral part of these consolidated financial statements. MW COMMODITY ADVISORS, LLC CONSOLIDATED STATEMENT OF CHANGES IN MEMBER’S EQUITY FOR THE YEAR ENDED DECEMBER 31, 2010 | | | | MW Commodity
Advisors, LLC
Sole Member | | Minority
Interests in MW
Commodity
Strategies, L.P. | | Total | | | MW Commodity
Advisors, LLC Sole
Member | | Minority
Interests in MW
Commodity
Strategies, L.P. | | Total | | Member’s Equity - December 31, 2009 | | $ | 167,590 | | | $ | 26,957,046 | | | $ | 27,124,636 | | | Member’s Equity—December 31, 2009 | | | $ | 167,590 | | | $ | 26,957,046 | | | $ | 27,124,636 | | Contributions | | | — | | | | 4,708,688 | | | | 4,708,688 | | | | — | | | | 4,708,688 | | | | 4,708,688 | | Withdrawals | | | (119,911 | ) | | | (4,954,707 | ) | | | (5,074,618 | ) | | | (119,911 | ) | | | (4,954,707 | ) | | | (5,074,618 | ) | Net Income | | | 122,286 | | | | 939,734 | | | | 1,062,020 | | | | 122,286 | | | | 939,734 | | | | 1,062,020 | | | | | | | | | | | | | | | | | | | | | Member’s Equity - December 31, 2010 | | $ | 169,965 | | | $ | 27,650,761 | | | $ | 27,820,726 | | | Member’s Equity—December 31, 2010 | | | $ | 169,965 | | | $ | 27,650,761 | | | $ | 27,820,726 | | | | | | | | | | | | | | | | | | | | |
The accompanying notes are an integral part of these consolidated financial statements. MW COMMODITY ADVISORS, LLC CONSOLIDATED STATEMENT OF CASH FLOWS FOR THE YEAR ENDED DECEMBER 31, 2010 | | | | | | | | | CASH FLOWS FROM OPERATING ACTIVITIES: | | | | | | | | | Net income | | | | | | $ | 122,286 | | Adjustments to reconcile net income to net cash provided by operating activities: | | | | | | | | | MW Commodity Strategies, L.P.: | | | | | | | | | Net income | | $ | 939,734 | | | | | | Proceeds from investments | | | 69,911 | | | | | | Realized gain on investments in Funds, net | | | (84,434 | ) | | | | | Unrealized gain on investments in Funds, net change | | | (1,125,925 | ) | | | | | Purchase of investments in Funds | | | (4,000,000 | ) | | | | | Proceeds from investments in Funds | | | 2,018,051 | | | | | | (Increase) decrease in operating assets: | | | | | | | | | Accounts receivable | | | 8,669 | | | | | | MW Commodity Strategies, L.P.: | | | | | | | | | Cash and cash equivalents | | | 9,101,694 | | | | | | Redemptions receivable from investments in Funds | | | 1,235,938 | | | | | | Other assets | | | 6,887 | | | | | | Increase (decrease) in operating liabilities: | | | | | | | | | MW Commodity Strategies, L.P.: | | | | | | | | | Professional fees payable | | | (92,106 | ) | | | | | Other liabilities | | | 5,435 | | | | | | | | | | | | | | | Total adjustments | | | | | | | 8,083,854 | | | | | | | | | | | Net Cash Flows Provided by Operating Activities | | | | | | | 8,206,140 | | | | | | | | | | | CASH FLOWS FROM FINANCING ACTIVITIES: | | | | | | | | | Withdrawals | | | (119,911 | ) | | | | | MW Commodity Strategies, L.P.: | | | | | | | | | Contributions | | | 2,408,688 | | | | | | Withdrawals | | | (10,464,144 | ) | | | | | | | | | | | | | | Net Cash Used in Financing Activities | | | | | | | (8,175,367 | ) | | | | | | | | | | NET CHANGE IN CASH AND CASH EQUIVALENTS | | | | | | | 30,773 | | Cash and Cash Equivalents at December 31, 2009 | | | | | | | 41,470 | | | | | | | | | | | Cash and Cash Equivalents at December 31, 2010 | | | | | | $ | 72,243 | | | | | | | | | | |
The accompanying notes are an integral part of these consolidated financial statements. MW COMMODITY ADVISORS, LLC NOTES TO THE CONSOLIDATED FINANCIAL STATEMENTS DECEMBER 31, 2010 NOTE 1.ORGANIZATION MW Commodity Advisors, LLC (“Advisors”), a single member limited liability company formed in Delaware on June 17, 2005, conducts an investment advisory business in New York City and is an affiliate of Milbank Winthrop & Co., an investment advisor registered under the Investment Advisors Act of 1940, as amended. Advisors is the general partner (the “General Partner”) of MW Commodity Strategies, L.P., an investment partnership (the “Partnership”) which is consolidated in these financial statements (collectively, the “Company”). The Partnership invests in various independent investment partnerships (the “Funds”). NOTE 2.SIGNIFICANT ACCOUNTING POLICIES Basis of Presentation The financial statements are presented in conformity with accounting principles generally accepted in the United States of America (“GAAP”). Basis of Accounting The Company follows the accrual method of accounting. Income is recorded when earned, and expenses are recorded when incurred in the period to which they pertain. Purchases and sales of securities are recorded on the trade date basis. Purchases and sales of Funds are recorded on the effective date as specified in the Funds investment agreements. Use of Estimates The presentation of financial statements in conformity with GAAP may require management to make estimates and assumptions that affect the reported amounts of assets and liabilities and disclosure of contingent assets and liabilities at the date of the financial statements and the reported amounts of revenues and expenses during the reporting period. Actual results could differ from those estimates. Cash and Cash Equivalents Cash and cash equivalents consist of cash on hand and liquid investments with maturities of less than 90 days. For purposes of the statement of cash flows, cash and cash equivalents includes cash in banks and readily available money market funds in investment accounts. Basis of Consolidation Advisors consolidates the Partnership in which the General Partner is presumed to have control under Accounting Standards Codification (“ASC”) 810-20. Although Advisors holds non-substantive equity-at-risk in the Partnership, Advisors’ related parties, including its de facto agents, hold substantive equity-at-risk. Further, the limited partners do not have the right to dissolve the Partnership or have substantive kick out rights or participating rights that would overcome the presumption of control by Advisors. Accordingly, Advisors consolidates the assets, liabilities and operating results of the Partnership and records the minority interests held by the limited partners in the accompanying financial statements. All material intercompany transactions and balances have been eliminated. MW COMMODITY ADVISORS, LLC NOTES TO THE CONSOLIDATED FINANCIAL STATEMENTS DECEMBER 31, 2010 (continued) NOTE 2.SIGNIFICANT ACCOUNTING POLICIES (continued) MW Commodity Strategies, L.P. - —Cash and Cash Equivalents Cash and cash equivalents held by the Partnership are not available to fund any of the liquidity needs of Advisors. Fair Value Measurements GAAP establishes a framework for measuring fair value and requires disclosures about fair value measurements, including a fair value hierarchy that prioritizes the inputs to valuation techniques used to measure fair value into three broad levels explained below: Level 1 - 1—Valuations based on quoted prices available in active markets for identical investments. Level 2 - 2—Valuations based on quoted prices in markets that are not active or for which all significant inputs are observable, either directly or indirectly. Level 3 - 3—Valuations based on inputs that are unobservable and significant to the overall fair value measurement. The inputs or methodology used for valuing investments are not necessarily an indication of the risks associated with holding those investments. Valuation and Revenue Recognition Investments in securities, option contracts, and securities sold short which are traded on a national securities exchange or listed on NASDAQ are valued at the last reported sales price on the last business day of the year. Investments in securities and securities sold short which are traded in the over-the-counter market are valued at the last reported bid and ask prices, respectively. Securities for which market quotations are not readily available are valued at their fair value as determined in good faith under consistently applied procedures established by the General Partner. Although the General Partner and the Funds’ administrators use their best judgment in estimating the fair value of the investments in the Funds, there are inherent limitations in any estimation technique. Therefore, the values presented herein are not necessarily indicative of the amount that could be realized in a current transaction. Future events will also affect the estimates of fair value, and the effects of such events on the estimates of fair value could be material. The valuation of the Funds has been deemed reasonable based on inquiry and the documentation provided from the Funds’ general partners or administrators. The Funds may carry investments for which market quotations are not readily available and are valued at their fair value as determined in good faith by their respective general partners or administrators. A change in the estimated value may occur in the near term. Certain Funds invest in emerging markets. The risks of investments are often increased in developing countries. These risks include repatriation restrictions, foreign exchange fluctuations, low trading volume in securities markets of emerging countries, lack of uniform reporting standards, and political, economic and legal uncertainties. MW COMMODITY ADVISORS, LLC NOTES TO THE CONSOLIDATED FINANCIAL STATEMENTS DECEMBER 31, 2010 (continued) NOTE 2.SIGNIFICANT ACCOUNTING POLICIES (continued) Valuation and Revenue Recognition (continued) Income from Funds is recognized based upon the Company’s allocable share of the earnings of the Funds which carry their investments at fair value, which include unrealized gains and losses. The Funds generally value their investments according to the following guidelines: Short-term investments are valued at amortized cost, which approximates fair value. Securities held and sold short listed on a national securities exchange are valued at the last sale price on the date of valuation, or if no sale occurred on such date, at the last bid or ask price thereon or at an appropriate discount from such price if such securities are restricted. Non-marketable securities are carried at estimated fair value as determined by the management of the Funds. Trade debt, bank debt, and warrants for which market quotations are not readily available are generally valued by the management of the Funds at fair value after consideration of a variety of factors including quotations available from dealers who make a market in these financial instruments and model produced valuations. Private equity investments are carried at fair value, which may be estimated using methods such as comparable companies’ earnings multiples, cash flow analyses, and review of underlying financial conditions. Loan participations are interests in short-term loans valued at fair value, which generally approximates cost plus accrued interest. Options for the purchase or sale of securities traded on an exchange are valued at the mean of the last report bid and ask prices. Forward contracts are valued by adjusting the spot market price of the underlying security for the cost of carrying from the trade date to the settlement date. All other securities are valued initially at cost, with subsequent adjustment to value which reflect either the basis of meaningful third party transactions in the private market or the fair value deemed appropriate by the general partner of each of the Funds. In such instances, consideration is also given to the financial condition and operating results of the issuer, the amount that Funds can reasonably expect to realize upon the sale of the securities and any other factors deemed relevant. The Fund’s general partners’ estimate and assumption of fair value of the non-marketable securities may differ significantly from the values that would have been used had a ready market existed, and the differences could be material. Interest and Dividends Interest income is recognized on an accrual basis. Dividend income is recognized on the ex-dividend date. Income Taxes Advisors and the Partnership themselves are not subject to U.S. Federal income taxes. Each member/partner is individually liable for income taxes, if any, on its share of the entity’s net taxable income. Interest, dividends and other income realized by the Partnership from non-U.S. sources and capital gains realized on the sale of securities of non-U.S. issuers may be subject to withholding and other taxes levied by the jurisdiction in which the income is sourced. MW COMMODITY ADVISORS, LLC NOTES TO THE CONSOLIDATED FINANCIAL STATEMENTS DECEMBER 31, 2010 (continued) NOTE 2.SIGNIFICANT ACCOUNTING POLICIES (continued) Income Taxes (continued) The General Partner determined that there are no uncertain tax positions which would require adjustments or disclosures on the financial statements. The tax years that remain subject to examination by taxing authorities are 2007, 2008 and 2009. Accounting Developments In June 2009, the Financial Accounting Standards Board (“FASB”) issued Statement of Financial Accounting Standard (“SFAS”) No. 167, Amendments to FASB Interpretation No. 46(R), which changes the approach to determining the primary beneficiary of a Variable Interest Entity (“VIE”) and requires companies to more frequently assess whether they must consolidate VIEs. This pronouncement is effective for the first annual reporting period beginning after November 15, 2009 and for interim periods within that first annual reporting period. In November 2009, the FASB agreed to defer the effective date of this pronouncement for certain types of asset manager funds until the completion of its consolidation project. The Company is currently assessing the potential impacts, if any, on its consolidated financial statements and disclosures. In January 2010, the FASB issued Accounting Standards Update 2010-06, Improving Disclosures About Fair Value Measurements (“ASU 2010-06”). ASU 2010-06 requires disclosing separately the amount of significant transfers in and out of the Level 1 and Level 2 categories and the reasons for the transfers and it requires that Level 3 purchases, sales, issuances and settlements activity be reported on a gross rather than a net basis. ASU 2010-06 also requires fair value measurement disclosures for each class of assets and liabilities and disclosures about valuation techniques and inputs used to measure fair value for both recurring and nonrecurring fair value measurements for Level 2 and Level 3 measurements. These disclosures are effective for fiscal periods beginning after December 15, 2009, except for the Level 3 gross reporting which is effective for fiscal periods beginning after December 15, 2010. We do not anticipate that the adoption of ASU 2010-06 will have a material impact on the Company’s financial statements. MW COMMODITY ADVISORS, LLC NOTES TO THE CONSOLIDATED FINANCIAL STATEMENTS DECEMBER 31, 2010 (continued) NOTE 3.INVESTMENTS IN FUNDS As of December 31, 2010, the Partnership was invested in 12 Funds, none of which are related parties. The Funds employ to varying degrees directional, volatility and relative value based strategies for investment in the commodity and macro markets. See detailed descriptions of the Fund strategies below. The partnership agreements of the Funds provide for compensation to the investment managers in the form of management fees ranging from 0% to 2% annually of net assets and an incentive allocation not exceeding 30% of net new profits earned. | Fund and (Strategy) | | Fair Value at
December 31, 2010 | | | Liquidity
Capital | | | Fair Value at
December 31,
2010 | | | Liquidity
Capital | | Covepoint Emerging Markets Macro Fund, L.P. (d) | | $ | 4,005,911 | | | | Quarterly | | | $ | 4,005,911 | | | | Quarterly | | Dynamic Domestic Fund L.P. (d) | | | 2,711,778 | | | | Monthly | | | | 2,711,778 | | | | Monthly | | Goldfinch Capital Management, L.P. (b) | | | 1,611,218 | | | | Monthly | | | | 1,611,218 | | | | Monthly | | Hard Assets Partners 2X L.P. (d) | | | 2,440,332 | | | | Quarterly | | | | 2,440,332 | | | | Quarterly | | Peak Partners, L.P. (d) | | | 2,941,146 | | | | Monthly | | | | 2,941,146 | | | | Monthly | | Quantitative Global 1X Fund LLC (b) | | | 2,795,278 | | | | Monthly | | | | 2,795,278 | | | | Monthly | | Tiverton Investments, LLC (d) | | | 4,606,234 | | | | Monthly | | | | 4,606,234 | | | | Monthly | | Vardana Partners, LP (d) | | | 1,731,625 | | | | Quarterly | | | | 1,731,625 | | | | Quarterly | | Wexford Catalyst Fund, L.P. (d) | | | 3,442,623 | | | | Quarterly | | | | 3,442,623 | | | | Quarterly | | Other Investments (a),(c) | | | 1,983,146 | | | | | Other Investments (a), (c) | | | | 1,983,146 | | | | | | | | | | | | | | | | | $ | 28,269,291 | | | | | $ | 28,269,291 | | | | | | | | | | | | | | |
As of December 31, 2010, the investments in the Funds had no remaining significant lockups. The Fund investment strategies are as follows: a) Equity Long/Short Funds: This category includes investments in Funds that invest both long and short primarily in U.S. common stocks. Portfolio managers have the ability to shift investments from value to growth strategies, from small to large capitalization stocks, and from a net long position to a net short position. The fair values of the investments in this category have been estimated using the net asset value per share of the investments which are provided by the Fund’s associated administrators. b) Futures and Derivatives Funds: This category includes investments in Funds that invest primarily in commodity futures and derivatives. The Portfolio manager’s investment strategy may use fundamental analysis, technical analysis or a combination of the two. Investment decisions target both short and long term price movement in the commodity and associated markets. In certain instances, managers may use relative value based strategies, weighing different time horizons or commodities against each other. The fair values of the investments in this category have been estimated using the net asset value per share of the investments which are provided by the Fund’s associated administrators. c) Macro Funds: The category is similar to Futures and Derivatives Funds above but with a focus on using macro-based strategies, which may include commodity futures and derivatives, currencies (including “commodity” MW COMMODITY ADVISORS, LLC NOTES TO THE CONSOLIDATED FINANCIAL STATEMENTS DECEMBER 31, 2010 (continued) NOTE 3.INVESTMENTS IN FUNDS (continued) currencies), fixed income instruments and securities. The economics of the commodity markets may influence the portfolio manager’s decisions in this category. The fair value of the investments in this category have been estimated using the net asset value per share of the investments which are provided by the Fund’s associated administrators. d) Multi-Strategy Funds: This category includes investments in Funds which utilize a combination of the preceding Equity Long/Short, Futures and Derivatives and Macro Funds approaches. Portfolio managers will determine allocations to such strategies based on their expectations of return and risk. The fair values of the investments in this category have been estimated using the net asset value per share of the investments which are provided by the Fund’s associated administrators. NOTE 4.FAIR VALUE MEASUREMENTS The following table discloses a reconciliation of investments measured at fair value on a recurring basis using significant unobservable inputs (Level 3) during the year ended December 31, 2010: | | | | | | | | Investments in
Funds | | Beginning balance, December 31, 2009 | | $ | 25,076,983 | | Total gains or losses (realized and unrealized) | | | 1,210,359 | | Purchases and sales, net | | | 1,981,949 | | Transfer in (out) of Level 3 | | | (28,269,291 | ) | | | | | | Ending balance, December 31, 2010 | | $ | — | | | | | | | The amount of gains (losses) included in income attributable to the change in unrealized gains (losses) relating to assets still held at December 31, 2010 | | $ | — | | | | | | |
Gains and losses (realized and unrealized), if any, are included in the net realized gain on investments in Funds and net change in unrealized gain on investments in Funds in the statement of income. The Partnership values Level 2 investments based on its proportionate share of the net asset value of the Funds. At December 31, 2010, all investments were valued using Level 2 inputs. Transfers between levels are recognized at the end of the reporting period. NOTE 5.OFF-BALANCE SHEET RISK, CONCENTRATION OF CREDIT RISK, AND OTHER RISKS In the normal course of business, the Funds in which the Partnership invests trade various financial instruments and enter into various investment activities with off-balance sheet risk. These include, but are not limited to, short selling activities, writing option contracts, and equity swaps. To the extent that the Partnership’s investment activity is limited to making investments in Funds via limited partnership interests or limited liability company holdings, the Partnership’s risk of loss in these Funds is generally limited to the value of these investments reported by the Partnership. To date, the Partnership has only invested in such limited partnership interests and limited liability company holdings. MW COMMODITY ADVISORS, LLC NOTES TO THE CONSOLIDATED FINANCIAL STATEMENTS DECEMBER 31, 2010 (continued) NOTE 5.OFF-BALANCE SHEET RISK, CONCENTRATION OF CREDIT RISK, AND OTHER RISKS (continued) There are a number of other risks to the Partnership. Three principal types of risk that can adversely affect the Partnership’s investment approach are market risk, strategy risk, and manager risk. The Partnership is also subject to multiple manager risks, possible limitations in investment opportunities, allocation risks, illiquidity, lack of diversification, and other risks for the Partnership and potentially for each Fund. NOTE 6.COMMITMENTS AND CONTINGENCIES In the normal course of business, the Company may enter into contracts that contain a variety of representations and warranties and which provide general indemnifications. The general indemnifications apply not only to the extent such representations and warranties are untrue but also may cover third parties such as the Partnership’s Administrator for claims related to the services performed for the Partnership. The Company’s maximum exposure under any such arrangements is unknown, as exposure only arises to the extent further claims that have not yet occurred are made against the Company. NOTE 7.RELATED PARTY TRANSACTIONS Advisors earned $132,685 in management fees from the Partnership during 2010. These intercompany fees have been fully eliminated in these consolidated financial statements. NOTE 8.SUBSEQUENT EVENTS Subsequent events have been evaluated through October 28, 2011, which is the date the financial statements were available to be issued. The Company is in negotiations to merge with an outside entity. Shares 

Silvercrest Asset Management Group Inc. PRELIMINARY PROSPECTUS SANDLER O’NEILL + PARTNERS, L.P. RAYMOND JAMES , 2013 Until , all dealers that effect transactions in these securities, whether or not participating in this offering, may be required to deliver a prospectus. This is in addition to the dealer’s obligation to deliver a prospectus when acting as an underwriter and with respect to unsold allotments or subscriptions.
PART II INFORMATION NOT REQUIRED IN PROSPECTUS Item 13. Other Expenses of Issuance and Distribution. The following table sets forth the estimated expenses payable by the registrant in connection with the sale and distribution of the securities registered hereby. All amounts are estimates except for the SEC registration fee, the FINRA filing fee and Nasdaq listing fee. | SEC Registration Fee | | $ | 6,876 | | | $ | 8,184 | | FINRA Filing Fee | | $ | 9,500 | | | | 9,500 | | Nasdaq Listing Fee | | $ | 25,000 | | | | 25,000 | | Accounting Fees and Expenses | | $ | * | | | | | * | Legal Fees and Expenses | | $ | * | | | | | * | Printing Fees and Expenses | | $ | * | | | | | * | Miscellaneous | | $ | * | | | | | * | | | | | | Total: | | $ | * | | | $ | | * | | | | | |
| * | To be filed by amendment. |
Item 14. Indemnification of Directors and Officers. Our second amended and restated certificate of incorporation provides that we, to the full extent permitted by Section 145 of the DGCL, as amended from time to time, shall indemnify all persons whom it may indemnify pursuant thereto. It further provides that expenses (including attorneys’ fees) incurred by an officer or director in defending any civil, criminal, administrative, or investigative action, suit or proceeding for which such officer or director may be entitled to indemnification hereunder shall be paid by us in advance of the final disposition of such action, suit or proceeding upon receipt of an undertaking by or on behalf of such director or officer to repay such amount if it shall ultimately be determined that he or she is not entitled to be indemnified by us as authorized thereby. Insofar as indemnification for liabilities arising under the Securities Act may be permitted to our directors, officers, and controlling persons pursuant to the foregoing provisions, or otherwise, we have been advised that in the opinion of the SEC such indemnification is against public policy as expressed in the Securities Act and is, therefore, unenforceable. In the event that a claim for indemnification against such liabilities (other than the payment of expenses incurred or paid by a director, officer or controlling person in a successful defense of any action, suit or proceeding) is asserted by such director, officer or controlling person in connection with the securities being registered, we will, unless in the opinion of its counsel the matter has been settled by controlling precedent, submit to the court of appropriate jurisdiction the question whether such indemnification by it is against public policy as expressed in the Securities Act and will be governed by the final adjudication of such issue. Item 15. Recent Sales of Unregistered Securities. On May 7, 2012, the Registrant issued 10 shares of its Class A common stock, par value $0.01 per share, to Mr. Cochran in exchange for $100. The issuance was exempt from registration under Section 4(2) of the Securities Act, as a transaction by an issuer not involving any public offering. II-1
Item 16. Exhibits and Financial Statements Schedules. | | | | | Exhibit
Number | | | Description of Document | | | | | 1.1 * | 1.1* | | Form of Underwriting Agreement. | | | | | 3.13.1† | | | Second Amended and Restated Certificate of Incorporation of Silvercrest Asset Management Group Inc. | | | | | 3.2 †3.2† | | | Amended and Restated Bylaws of Silvercrest Asset Management Group Inc. | | | | | 4.1 * | 4.1† | | Specimen stock certificate for shares of Class A common stock. | | | | | 4.2 | | | 2012 Exchange Agreement. | | | | | 4.3 | | | Resale and Registration Rights Agreement. | | | | | 4.4 | 4.4† | | 2012 Equity Incentive Plan. | | | | | 4.54.5* | | | Class B Stockholders Agreement. | | | | | 4.6 † | 4.6† | | Form of February 2010 Deferred Equity Unit Award Agreement. | | | | | 5.1 * | 5.1* | | Opinion of Bingham McCutchen LLP. | | | | 10.1 | | | Form of Second Amended and Restated Limited Partnership Agreement of Silvercrest L.P. | | | | 10.2 | | | Tax Receivable Agreement. | | | | 10.3 † | 10.3† | | Form of Indemnification Agreement with directors. | | | | 21.1 †10.4† | | Form of Purchase and Sale Agreement. | | | | 21.1† | | List of Subsidiaries. | | | | 23.1 | | | Consent of Deloitte & Touche LLP. | | | | 23.2 | | | Consent of Deloitte & Touche LLP. | | | | 23.3 | | | Consent of Fulvio & Associates, LLP. | | | | 23.4 * | 23.4* | | Consent of Bingham McCutchen LLP (included as part of Exhibit 5.1). | | | | 23.5 * | 23.5* | | Consent of Cerulli Associates. | | | | 24.1 † | 24.1† | | Powers of Attorney (included in the Registration Statement filed SeptemberApril 18, 20122013 under “Signatures”). |
| * | To be filed by amendment. |
II-2
Item 17. Undertakings. | (1) | The undersigned registrant hereby undertakes to provide to the underwriter at the closing specified in the underwriting agreements, certificates in such denominations and registered in such names as required by the underwriter to permit prompt delivery to each person. |
| (2) | Insofar as indemnification for liabilities arising under the Securities Act may be permitted to directors, officers and controlling persons of the registrant pursuant to the foregoing provisions, or otherwise, the registrant has been advised that in the opinion of the SEC, such indemnification is against public policy as expressed in the Securities Act and is, therefore, unenforceable. In the event that a claim for indemnification against such liabilities (other than the payment by the registrant of expenses incurred or paid by a director, officer or controlling person of the registrant in the successful defense of any action, suit or proceeding) is asserted by such director, officer or controlling person in connection with the securities being registered, the registrant will, unless in the opinion of its counsel, the matter has been settled by controlling precedent, submit to a court of appropriate jurisdiction the question whether such indemnification by it is against public policy as expressed in the Securities Act and will be governed by the final adjudication of such issue. |
II-2
| (3) | The undersigned registrant hereby undertakes that: |
| | (a) | For purposes of determining any liability under the Securities Act, the information omitted from the form of prospectus filed as part of this registration statement in reliance upon Rule 430A and contained in a form of prospectus filed by the registrant pursuant to Rule 424(b) (1) or (4) or 497(h) under the Securities Act shall be deemed to be part of this registration statement as of the time it was declared effective. |
| | (b) | For the purpose of determining any liability under the Securities Act, each post-effective amendment that contains a form of prospectus shall be deemed to be a new registration statement relating to the securities offered therein, and the offering of such securities at that time shall be deemed to be the initial bona fide offering thereof. |
II-3
SIGNATURES Pursuant to the requirements of the Securities Act of 1933, the registrant has duly caused this Amendment No. 1 to the Registration Statement to be signed on its behalf by the undersigned, thereunto duly authorized, in the city of New York, state of New York on October 9, 2012.May 22, 2013. | | | SILVERCREST ASSET MANAGEMENT GROUP INC. | | | By: | | /s/ G. Moffett Cochran | | | G. Moffett Cochran | | | Chief Executive Officer | | | By: | | /s/ Scott A. Gerard | | | Scott A. Gerard | | | Chief Financial Officer |
Pursuant to the requirements of the Securities Act of 1933, this Amendment No. 1 to the Registration Statement has been signed by the following persons in the capacities indicated on the 922thnd day of October, 2012:May, 2013: | | | | | Signature | | Title | | Date | | | | /s/ G. Moffett Cochran G. Moffett Cochran | | (Principal Executive Officer) and Director | | October 9, 2012May 22, 2013 | | | | /s/ Scott A. Gerard Scott A. Gerard | | (Principal Financial and Accounting
Officer) | | October 9, 2012
May 22, 2013 | | | | */s/ Richard R. Hough III
Richard R. Hough III | | Director | | October 9, 2012
May 22, 2013 | | | | * Winthrop B. Conrad, Jr. | | Director | | October 9, 2012
May 22, 2013 | | | | * Wilmot H. Kidd III | | Director | | October 9, 2012
May 22, 2013 | | | | * Richard S. Pechter | | Director | | October 9, 2012
May 22, 2013 |
| | | | | | *By: | | /s/ G. Moffett Cochran | | | G. Moffett Cochran
as attorney-in-fact
|
II-4
| | | | | Exhibit
Number | | | Description of Document | | | | | 1.1 * | 1.1* | | Form of Underwriting Agreement. | | | | | 3.1 3.1† | | | Second Amended and Restated Certificate of Incorporation of Silvercrest Asset Management Group Inc. | | | | | 3.2 †3.2† | | | Amended and Restated Bylaws of Silvercrest Asset Management Group Inc. | | | | | 4.1 * | 4.1† | | Specimen stock certificate for shares of Class A common stock. | | | | | 4.2 | | | 2012 Exchange Agreement. | | | | | 4.3 | | | Resale and Registration Rights Agreement. | | | | | 4.4 | 4.4† | | 2012 Equity Incentive Plan. | | | | | 4.54.5* | | | Class B Stockholders Agreement. | | | | | 4.6 † | 4.6† | | Form of February 2010 Deferred Equity Unit Award Agreement. | | | | | 5.1 * | 5.1* | | Opinion of Bingham McCutchen LLP. | | | | 10.1 | | | Form of Second Amended and Restated Limited Partnership Agreement of Silvercrest L.P. | | | | 10.2 | | | Tax Receivable Agreement. | | | | 10.3 † | 10.3† | | Form of Indemnification Agreement with directors. | | | | 21.1 †10.4† | | Form of Purchase and Sale Agreement. | | | | 21.1† | | List of Subsidiaries. | | | | 23.1 | | | Consent of Deloitte & Touche LLP. | | | | 23.2 | | | Consent of Deloitte & Touche LLP. | | | | 23.3 | | | Consent of Fulvio & Associates, LLP. | | | | 23.4 * | 23.4* | | Consent of Bingham McCutchen LLP (included as part of Exhibit 5.1). | | | | 23.5 * | 23.5* | | Consent of Cerulli Associates. | | | | 24.1 † | 24.1† | | Powers of Attorney (included in the Registration Statement filed SeptemberApril 18, 20122013 under “Signatures”). |
| * | To be filed by amendment. |
II-5 |