
As filed with the U.S. Securities and Exchange Commission on March 10, 2014January 26, 2015
Registration No. 333-193438333-
UNITED STATES
SECURITIES AND EXCHANGE COMMISSION
Washington, D.C. 20549
AMENDMENT NO. 1
TO
FORMS-1
REGISTRATION STATEMENT
UNDER
THE SECURITIES ACT OF 1933
SABRE CORPORATION
(Exact name of Registrant as specified in its charter)
| Delaware | 7370 | 20-8647322 | ||
(State or other jurisdiction of incorporation or organization) | (Primary Standard Industrial Classification Code Number) | (I.R.S. Employer Identification No.) |
3150 Sabre Drive
Southlake, TX 76092
Telephone:(682) 605-1000
(Address including zip code, telephone number, including area code, of Registrant’s Principal Executive Offices)
Sterling L. Miller,Rachel A. Gonzalez, Esq.
Executive Vice President and General Counsel & Corporate Secretary
Sabre Corporation
3150 Sabre Drive
Southlake, TX 76092
Telephone:(682) 605-1000
Telecopy:(682) 605-7523
(Name, address including zip code, telephone number, including area code, of agent for service)
Copies To:
David Lopez, Esq. Pamela L. Marcogliese, Esq. Cleary Gottlieb Steen & Hamilton LLP One Liberty Plaza New York, NY 10006 (212)225-2000 |
Craig E. Marcus, Esq. Ropes & Gray LLP Prudential Tower, 800 Boylston Street Boston, MA 02199 (617)951-7000 |
Approximate date of commencement of proposed sale to the public:public: As soon as practicable after the effective date hereof.this Registration Statement becomes effective.
If any of the securities being registered on this form are to be offered on a delayed or continuous basis pursuant to Rule 415 under the Securities Act, check the following box. ¨
If this form is filed to register additional securities for an offering pursuant to Rule 462(b) under the Securities Act, check the following box and list the Securities Act registration statement number of the earlier effective registration statement for the same offering. ¨
If this form is apost-effective amendment filed pursuant to Rule 462(c) under the Securities Act, check the following box and list the Securities Act registration statement number of the earlier effective registration statement for the same offering. ¨
If this form is apost-effective amendment filed pursuant to Rule 462(d) under the Securities Act, check the following box and list the Securities Act registration statement number of the earlier effective registration statement for the same offering. ¨
Indicate by check mark whether the registrant is a large accelerated filer, an accelerated filer, anon-accelerated filer, or a smaller reporting company. See the definitions of “large accelerated filer,” “accelerated filer” and “smaller reporting company” inRule 12b-2 of the Exchange Act (Check one):
| Large accelerated filer ¨ | Accelerated filer ¨ | Non-accelerated filer x | Smaller reporting company ¨ | |||
| (Do not check if a smaller reporting company) |
CALCULATION OF REGISTRATION FEE
| ||||
| Title of Each Class of Securities to be Registered | Amount to be Registered(1)(2) | Amount of Registration Fee | ||
Common Stock, $0.01 par value per share | $400,000,000 | $46,480.00 | ||
| ||||
| ||||
| (1) | Includes shares that the underwriters have an option to purchase from the Principal Stockholders. |
| (2) | Estimated solely for the purpose of calculating the registration fee pursuant to Rule 457(o) promulgated under the Securities Act of 1933, as amended. |
The Registrant hereby amends this Registration Statement on such date or dates as may be necessary to delay its effective date until the Registrant shall file a further amendment which specifically states that this Registration Statement shall thereafter become effective in accordance with Section 8(a) of the Securities Act of 1933 or until the Registration Statement shall become effective on such date as the Commission, acting pursuant to said Section 8(a), may determine.
The information in this preliminary prospectus is not complete and may be changed. WeThese securities may not sell these securitiesbe sold until the registration statement filed with the Securities and Exchange Commission is effective. This preliminary prospectus is not an offer to sell these securities and it is not soliciting an offer to buy these securities in any jurisdiction where the offer or sale is not permitted.
Prospectus (Subject to Completion)
Dated March 10, 2014January 26, 2015
Shares
Sabre Corporation
Common Stock
This isThe selling stockholders (as identified in “Principal and Selling Stockholders,” the “Selling Stockholders”), which include the beneficial owners of a majority of our initial public offering, and no public market currently exists for our common stock. Sabre Corporation is offering shares of common stock. The selling stockholders identified in this prospectusstock, are selling an additionaloffering shares of our common stock. WeThe Selling Stockholders will not receive anyall of the net proceeds from the sale of our common stocksuch shares, and we will not receive any of the proceeds from the sale of such shares being sold by the selling stockholders. After this offering, we will be a “controlled company” within the meaning of the NASDAQ rules.Selling Stockholders.
Prior to this offering, there has been no public market for our common stock. The initial public offering price of theOur common stock is expected to be between $ and $ per share. We will apply to listlisted on The NASDAQ Stock Market (“NASDAQ”) under the symbol “SABR.” The last reported closing sale price of our common stock on the NASDAQ Stock Market under the symbol “SABR”.on January 23, 2015 was $20.71 per share.
Investing in our common stock involves a high degree of risk. See “Risk Factors” beginning on page 20.27.
Price $ A Share
Per Share | Total | |||||||||
| $ | $ | ||||||||
Underwriting discounts | ||||||||||
| $ | $ | ||||||||
Proceeds, before expenses, to | $ | $ | ||||||||
| (1) | See |
WeThe Principal Stockholders (as defined below) have granted the underwriters an option to purchase up to an additional shares of common stock and the selling stockholders have granted the underwriters an option to purchase up to an additional shares of common stock, in each case at the offering price less the underwriting discount. The underwriters can exercise this right at any time and from time to time, in whole or in part, within 30 days after the offering.
Delivery of the shares of common stock will be made on or about , 2014.2015.
Neither the Securities and Exchange Commission nor any state securities commission has approved or disapproved these securities or determined if this prospectus is truthful or complete. Any representation to the contrary is a criminal offense.
| GOLDMAN, SACHS & CO. | BofA MERRILL LYNCH |
The date of this prospectus is , 2015.

Prospectus |
The date of this prospectus is , 2014.
| 1 | |||||
| 19 | |||||||||
Summary Historical and Pro Forma Consolidated Financial and Other Data | 21 | ||||||||
| 27 | |||||||||
| 60 | |||||||||
| 69 | |||||||||
Management’s Discussion and Analysis of Financial Condition and Results of Operations | |||||||||
| |||||||||
Material U.S. Federal Income and Estate Tax Considerations toNon-U.S. Holders | |||||||||
| F-1 | |||||||||
We are responsible for the information contained in this prospectus and in any relatedfree-writing prospectus we may prepare or authorize to be delivered to you. We have not authorized anyone to give you any other information, and we take no responsibility for any other information that others may give you. We andare not, the selling stockholdersSelling Stockholders are not, and the underwriters are not, making an offer of these securities in any jurisdiction where the offer is not permitted. You should not assume that the information contained in this prospectus is accurate as of any date other than the date on the front of this prospectus, regardless of the time of delivery of this prospectus or any sale of our common stock.
The information contained on our website or that can be accessed through our website will not be deemed to be incorporated into this prospectus or the registration statement of which this prospectus forms a part, and investors should not rely on any such information in deciding whether to purchase our common stock.
i
The “GDS-processed air bookings” share figures in this prospectus are calculated based on the total number of air bookings processed through the three global distribution systems (“GDSs”), specifically Sabre, Amadeus, and Travelport (including the Worldspan, Galileo and Apollo systems). Measurements of such GDS-processed air bookings are based primarily on Marketing Information Data Tapes and are supplemented with other transaction data and estimates that we believe provide a more accurate measure of GDS-processed air bookings. Because GDSs generally process air bookings for their joint venture partners and/or share in the economics of their joint venture partners’ travel transactions, we include the GDS-processed air booking volumes of each GDS’s joint venture partners in the GDS-processed air bookings share calculations. For example, GDS-processed air bookings from Abacus International PTE Ltd. (“Abacus”) and INFINI Travel Information, Inc. (“Infini”) are included in our GDS-processed air bookings volume and our estimate of GDS-processed air bookings from Topas, Amadeus’ Korean joint venture partner, is included in the Amadeus GDS-processed air bookings volume.
Based on our internal estimates, we believe GDS-processed air bookings comprise approximately 75% of total air bookings processed through third-party distribution systems in 2013, with the remaining 25% comprised of air bookings processed through regional distribution systems that are not joint venture partners of one of the three GDSs. Due to the lack of available industry information on the number of air bookings processed by such regional distribution systems and through direct distribution channels we use the number of GDS-processed air bookings as a proxy for the number of overall industry air bookings. Similarly, we believe industry air bookings share is a good proxy for overall GDS share in our Travel Network business because air bookings comprise the vast majority of the total bookings of the three GDSs.
The GDS-processed air bookings used for GDS-processed air bookings share calculations do not necessarily correspond to the number of bookings billed by each GDS provider because not all processed bookings are billed due to the fact that each GDS provider has a different policy (often varying by region and supplier) as to which transactions processed through its GDS platform are billed.
The regional air bookings share figures in this prospectus are calculated based on the total number of GDS-processed air bookings in each of the following four regions, with key countries or sub-regions identified:
The hospitality Central Reservation System (“CRS”) hotel room share figures in this prospectus are calculated based on data for hotel rooms serviced by third-party CRS providers and processed through our GDS. We estimate that approximately a quarter of global hotel properties are available through our GDS and believe this data to be the best available representation of the hotel market due to the lack of comprehensive industry data. Using this data, we compute CRS hotel room share based on total hotel room capacity hosted by the various third-party hospitality CRS providers. We believe this to be the most reliable measure of market share available to us. However, this metric is one we have only recently begun to measure and represents a snapshot in time, which prevents it from being able to convey a trend in market share over time. Therefore, we also include information in this prospectus regarding third-party hospitality CRS bookings share of our GDS because that data is more consistently available for historical periods. Using our GDS data, we compute third-party hospitality CRS bookings share based on total bookings by the various third-party hospitality CRS providers over time.
ii
Though we believe third-party hospitality CRS room share to be a more accurate representation of market share, we believe third-party hospitality CRS bookings share is a reasonable proxy to convey changes in third-party hospitality CRS market share over time.
The “Customer Retention” rate figures in this prospectus are calculated as the aggregate of prior year revenue associated with customers that did not terminate their contract in the given year, as a percentage of the prior year revenue. Customer Retention for Travel Network is calculated based on travel agency contracts, and is measured based on revenue we earn from bookings made by those travel agencies. Customer Retention for Airline Solutions is calculated based on passengers boarded (“PBs”) fee-based revenue for our reservation contracts, our principal Airline Solutions offering. Customer Retention for Hospitality Solutions is based on CRS, digital marketing services and call center revenues, which represent over 90% of revenues of our Hospitality Solutions business in each period from 2011 through December 31, 2013. Customer Retention does not measure whether the revenue from any travel agency or reservations customer has increased in the given year compared to the prior year. For example, if ten travel agencies terminated their Travel Network contracts in 2013, and those travel agencies represented a combined 5% of Travel Network revenue in 2012, the Customer Retention for Travel Network in 2013 would be 95%.
The “Recurring Revenue” figures for our:
Revenues in each of (i), (ii) and (iii) are tied to a travel supplier’s transaction volumes rather than to its unit pricing for an airplane ticket, hotel room or other travel product. However, this revenue is not generally contractually committed to recur annually under our agreements with our travel suppliers. As a result, our Recurring Revenue is highly dependent on the global travel industry and directly correlates with global travel, tourism and transportation transaction volumes. See “Risk Factors—Risks Related to Our Business and Industry—Our revenue is highly dependent on transaction volumes in the global travel industry, particularly air travel transaction volumes.”
We own or have rights to various trademarks, service marks and trade names that we use in connection with the operation of our business. This prospectus may also contain trademarks, service marks and trade names of third parties, which are the property of their respective owners. Our use or display of third parties’ trademarks, service marks, trade names or products in this prospectus is not intended to, and does not, imply a relationship with, or endorsement or sponsorship by, us. Solely for convenience, the trademarks, service marks and trade names referred to in this prospectus may appear without the®,TM orSM symbols, but such references are not intended to indicate, in any way, that we will not assert, to the fullest extent under applicable law, our rights or the right of the applicable licensor to these trademarks, service marks and trade names.
ClientBase, GetThere, lastminute.com, Sabre, Sabre Holdings, the Sabre logo, Sabre AirCentre, Sabre Airline Solutions, Sabre AirVision, Sabre Hospitality Solutions, Sabre Red, Sabre Travel Network, SabreSonic, Travelocity, Travelocity Partner Network, TripCase, TruTrip and our other registered or common law trademarks, service marks or trade names appearing in this prospectus are the property of Sabre.
iii
This summary highlights information contained elsewhere in this prospectus. It may not contain all the information that may be important to you. You should read the entire prospectus carefully, including the section entitled “Risk Factors” and our financial statements and the related notes included elsewhere in this prospectus before making an investment decision to purchase shares of our common stock.
In this prospectus, unless we indicate otherwise or the context requires, references to the “company,” “Sabre,” “we,” “our,” “ours” and “us” refer to Sabre Corporation and its consolidated subsidiaries, references to “Sabre GLBL” refer to Sabre GLBL Inc., formerly known as Sabre Inc., references to “TPG” refer to TPG Global, LLC and its affiliates, references to the “TPG Funds” refer to one or more of TPG Partners IV, L.P. (“TPG Partners IV”), TPG Partners V, L.P. (“TPG Partners V”), TPG FOFV-A, L.P. (“TPG FOFV-A”) and TPG FOFV-B, L.P. (“TPG FOFV-B”), references to “Silver Lake” refer to Silver Lake Management Company, L.L.C. and its affiliates and references to “Silver Lake Funds” refer to either or both of Silver Lake Partners II, L.P. and Silver Lake Technology Investors II, L.P. In the context of our Travel Network business, references to “travel buyers” refer to buyers of travel, such as online and offline travel agencies, travel management companies (“TMCs”) and corporate travel departments, and references to “travel suppliers” refer to suppliers of travel services such as airlines, hotels, car rental brands, rail carriers, cruise lines and tour operators. The following summary is qualified in its entirety by the more detailed information and consolidated financial statements and notes thereto included elsewhere in this prospectus.
Our Company
We are a leading technology solutions provider to the global travel and tourism industry. We span the breadth of a highly complex $6.6$7 trillion global travel ecosystem, providing key software and services to a broad range of travel suppliers and travel buyers. Through our Travel Network business, we process hundreds of millions of transactions annually, connecting the world’s leading travel suppliers, including airlines, hotels, car rental brands, rail carriers, cruise lines and tour operators, with travel buyers in a comprehensive travel marketplace. We offer efficient, global distribution of travel content from approximately 125,000 travel suppliers to approximately 400,000 online and offline travel agents. To those agents, we offer a platform to shop, price, book and ticket comprehensive travel content in a transparent and efficient workflow. We also offervalue-added solutions that enable our customers to better manage and analyze their businesses. Through our airline solutions business (“Airline Solutions”) and hospitality solutions business (“Hospitality Solutions” and, together with Airline Solutions, “Airline and Hospitality Solutions”), we offer travel suppliers an extensive suite of leading software solutions, ranging from airline and hotel reservations systems tohigh-value marketing and operations solutions. These solutions such asinclude planning airline crew schedules,re-accommodating passengers during irregular flight operations andmanaging day-to-day hotel operations. These solutions allow our customers to market, distribute and sell their products more efficiently, manage their core operations, and deliver an enhanced travel experience. Through our complementary Travel Network and Airline and Hospitality Solutions businesses, we believe we offer the broadest,end-to-end portfolio of technology solutions to the travel industry.
Our portfolio of technology solutions has enabled us to become the leadingend-to-end technology provider in the travel industry. For example, we are one of the largest GDSglobal distribution systems (“GDSs”) providers in the world, with a 36% share ofGDS-processed air bookings in 2013. More specifically, we are the #1 GDS provider in North America and also in higher growth markets such as APACLatin America and Latin America,Asia Pacific (“APAC”), in each case based onGDS-processed air bookings in 2013. In those three markets, ourGDS-processed air bookings share was approximately 50% on a combined basis in 2013. In our Airline and Hospitality Solutions business, we believe we have the most comprehensive portfolio of solutions. In 2013, we had the largestthird-party hospitality CRSCentral Reservation System (“CRS”) room share based on our approximately 27% share of
1
third-party hospitality CRS hotel rooms distributed through our GDS, and, according to T2RL’sTravel Technology Research (“T2RL”)’s Market for Airline Passenger Services Systems-2013Systems (“T2RL PSS”) 2013 data for 2012,2013, we had the second largest airline reservations system globally. We also believe that we have the leading portfolio of airline marketing and operations products across the solutions that we provide. In addition, we operate Travelocity, one of the world’s
most recognizable brands in the online consumer travel e-commerce industry, which provides us with business insights into our broader customer base.
Through our solutions, which span the breadth of the travel ecosystem, we have developed deep domain expertise. Our success is built on this expertise, combined with our significant technology investment and focus on innovation. This foundation has enabled us to develop highly scalable andtechnology-rich solutions that directly address the key opportunities and challenges facing our customers. For example, we have invested to scale our GDS platform to meet massive transaction processing requirements. In 2013, our systems processed over $100 billion of estimated travel spending and more than 1.1 trillion system messages, with nearly 100,000 system messages per second at peak times. Our investment in innovation has enabled our Travel Network business to evolve into a dynamic marketplace providing a broad range of highly scalable solutions from distribution to workflow to business intelligence. Our investment in our Airline and Hospitality Solutions offerings has allowed us to create a broad portfolio ofvalue-added products for our travel supplier customers, ranging from reservations platforms to operations solutions typically delivered via highly scalable and flexiblesoftware-as-a-service (“SaaS”) and hosted platforms. We have a long history of engineering innovative travel technology solutions. For example, we believe we were the first GDS to enable airlines to sell ancillary products like premium seats through the GDS, the firstthird-party provider to automate passenger reaccommodationre-accommodation during large operational disruptions and the first GDS to launch abusiness-to-business (“B2B”) app marketplace for our travel agency customers that allows them to customize and augment our Travel Network platform. Our innovation has been consistently recognized in the market, with awards including the Business Traveler Innovation Award from the Global Business Travel Association, an unaffiliated entity, in 2011 and 2012, for which we applied and were one of eight award winners chosen by popular vote. We were also recognized by the InformationWeek 500 in 2013 as one of the Most Innovative Users of Business Technology for the eleventh consecutive year. These 500 companies are invited to apply and are chosen by InformationWeek, an unaffiliated entity, based on their unconventional approaches and new ways of solving complex business problems with IT.
Our SaaS and hosted technology platforms allow us to serve our customers primarily through a recurring,transaction-based revenue model based primarily on travel events such as air segments booked, PBspassengers boarded (“PBs”) or other relevant metrics. For the year ended December 31, 2013, 91% of our Travel Network and Airline and Hospitality Solutions revenue, on a weighted average basis, was Recurring Revenue. See “Method of Calculation” for a description of Recurring Revenue. This model has benefits for both our customers and for us. For our customers, our delivery model allows otherwise fixed technology investments to be variable, providing flexibility in their cost base and smoothing investment cycles as they grow, while enabling them to benefit from the continuous evolution of our platform. For us, this recurring,transaction-based revenue model allows us to expand with our customers in the travel industry, a segment of the economy whichthat has grown significantly faster than global GDP over the last 40 years. Since our revenues are primarily linked to our customers’ transaction volumes, rather than to airline budget cycles or cyclicalend-customer pricing, which we believe are more volatile than transaction volumes, this model facilitates greater stability in our business, particularly during negative economic cycles. In addition, as a technology solutions and transaction processing company, we do not take airline, hotel or other inventory risk, nor are we directly exposed to fuel price volatility or labor unions.
Our recurring,transaction-based revenue model, combined with ourhigh-quality products, reinvestment in our technology,multi-year customer contracts and disciplined operational management, has contributed to our strong growth profile, as demonstrated by our Adjusted EBITDA having increased each year since 2008 despite the global economic downturn and resulting travel slowdown. From 2009 through 2013, we grew our revenue and Adjusted EBITDA at 7% and 11% compound annual growth rates (“CAGRs”), respectively, and increased Adjusted EBITDA margins by 396394 basis points (“bps”), in each case, excluding Travelocity and intersegment
2
eliminations. During the same period, net loss attributable to Sabre Corporation decreased 37% and net loss margin decreased by 258 bps. See “Non-GAAP“Non-GAAP Financial Measures” and “—Summary“Summary Historical and Pro Forma Consolidated Financial and Other Data” for additional information regarding Adjusted EBITDA, including a reconciliation of Adjusted EBITDA to the most directly comparable GAAP measure.
Our Business
We currently operate through threetwo business segments: (i) Travel Network and (ii) Airline and Hospitality Solutions,Solutions. On December 16, 2014, we announced that we had received a binding offer from Bravofly Rumbo Group to acquire lastminute.com, and (iii) Travelocity. on January 23, 2015, we announced the sale of Travelocity.com to Expedia, Inc., which included the termination of the Expedia SMA. See “Recent Developments.” We will reclassify and report all of the businesses associated with our Travelocity segment as discontinued operations in our 2014 Annual Report on Form 10-K as the segment was considered held for sale as of December 31, 2014.
Our segments operate with shared infrastructure and technology capabilities, and provide key solutions to our customers. Collectively, our integrated business enables the entire travel lifecycle, from route planning topost-trip business intelligence and analysis. The graphic below provides illustrative examples of the points where Sabre enables the travel lifecycle:

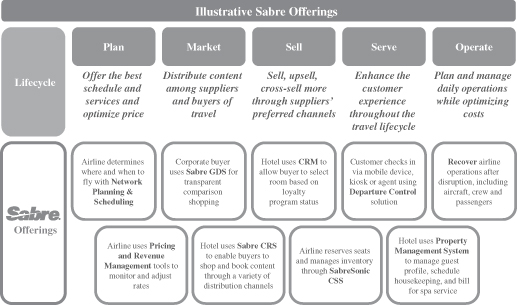
Travel Network is our global B2B travel marketplace and consists primarily of our GDS and a broad set of capabilities that integrate with our GDS to add value for travel suppliers and travel buyers. Our GDS offers content from a broad array of travel suppliers, including approximately 400 airlines, 125,000 hotel properties, 30 car rental brands, 50 rail carriers, 16 cruise lines and 200 tour operators, to tens of thousands of travel buyers, including online and offline travel agencies, TMCs and corporate travel departments. Our Airline and Hospitality Solutions business offers a broad portfolio of software technology products and solutions, primarily through SaaS and hosted models, to approximately 225 airlines, 17,00017,500 hotel properties and 700 other travel suppliers. Our flexible software and systems applications help automate and optimize our customers’ business processes, including reservations systems, marketing tools, commercial planning solutions and enterprise operations tools. Travelocity iswas our family of online consumer travele-commerce businesses through which we provideprovided travel content and booking functionality primarily for leisure travelers. In August 2013, Travelocity entered into an
3
exclusive,long-term strategic marketing agreement with Expedia which was recently amended and restated in March 2014 to reflect changed commercial terms (as amended and restated,from time to time, the “Expedia SMA”). Under the Expedia SMA, Expedia will powerpowered the technology platforms of Travelocity’s existing U.S. and Canadian websites, as well as provideprovided access to Expedia’s supply and customer service platforms. Additionally, in the first quarter of 2014, Travelocity recently sold its Travelocity Partner Network (“TPN”) business, a B2B loyalty and private label website offering, to Orbitz. Furthermore, on December 16, 2014, we announced that we had received a binding offer from Bravofly Rumbo Group to acquire lastminute.com and on January 23, 2015, we announced the sale of Travelocity.com to Expedia, Inc., which included the termination of the Expedia SMA. See “Recent Developments.”
For the nine months ended September 30, 2014 and 2013, we recorded revenue of $2,229 million and $2,303 million, respectively, net income attributable to Sabre Corporation of $23 million and loss of $127 million respectively, and Adjusted EBITDA of $617 million and $584 million, respectively, reflecting a 1% and (6)% net income (loss) margin and a 28% and 25% Adjusted EBITDA margin, respectively. For the nine months ended September 30, 2014, Travel Network contributed 63%, Airline and Hospitality Solutions contributed 25%, and Travelocity contributed 12% of our revenue (excluding intersegment eliminations). During this period, shares of Adjusted EBITDA for Travel Network, Airline and Hospitality Solutions, and Travelocity were approximately 77%, 25% and (2)%, respectively (excluding corporate overhead allocations such as finance, legal, human resources and certain information technology shared services). See “Recent Developments” regarding our Travelocity business segment moving to discontinued operations.
For the years ended December 31, 2013 and 2012, we recorded revenue of $3,050 million and $2,974 million, respectively, gross margin of $1,145 million and $1,155 million, respectively, net loss attributable to Sabre Corporation of $100 million and $611 million respectively, and Adjusted EBITDA of $791 million and $787 million, respectively, reflecting a 3% and 21% net loss margin and a 26% and 26% Adjusted EBITDA
margin, respectively. For additional information regarding Adjusted EBITDA, including a reconciliation of Adjusted EBITDA to the most directly comparable GAAP measure, see “Non-GAAP Financial Measures” and “—Summary Consolidated Financial Data.” For the year ended December 31, 2013, Travel Network contributed 58%, Airline and Hospitality Solutions contributed 23%, and Travelocity contributed 19% of our revenue (excluding intersegment eliminations). During this period, shares of Adjusted EBITDA for Travel Network, Airline and Hospitality Solutions, and Travelocity were approximately 77%, 21% and 2%, respectively (excluding corporate overhead allocations such as finance, legal, human resources and certain information technology shared services). See “Recent Developments” regarding our Travelocity business segment moving to discontinued operations.
For additional information regarding Adjusted EBITDA, including a reconciliation of Adjusted EBITDA to the most directly comparable GAAP measure, see “Non-GAAP Financial Measures” and Summary Historical and Pro Forma Consolidated Financial and Other Data.”
Recent Developments
Travelocity business segment moved to discontinued operations
Consistent with our strategy to focus on the growth opportunities in Airline and Hospitality Solutions and Travel Network, we made significant progress toward exiting the online travel agency business, including the completed sale of Travelocity.com on January 23, 2015 and the receipt of a binding offer from Bravofly Rumbo Group to acquire lastminute.com as announced on December 16, 2014. We will reclassify and report all of the businesses associated with the Travelocity segment as discontinued operations in our 2014 Annual Report on Form 10-K as the segment was considered held for sale as of December 31, 2014. As previously reported for the nine month period ended September 30, 2014, the Travelocity segment contributed $269 million to total Adjusted Revenue and $(18) million to Adjusted EBITDA. Unless otherwise indicated, the historical financial information included in this prospectus does not reflect this reclassification.
Sale of Travelocity.com and Binding offer for lastminute.com
On January 23, 2015, we announced the sale of Travelocity.com to Expedia, Inc. for $280 million in cash consideration.
4
Additionally, on December 16, 2014, we announced that we had received a binding offer from Bravofly Rumbo Group to acquire lastminute.com for a total transaction value of approximately $120 million resulting primarily from the transfer of commercial liabilities and an expanded long-term commercial agreement, in which Bravofly Rumbo Group’s brands and lastminute.com would continue to use our GDS. The transaction is expected to be completed in the first quarter of 2015. We cannot provide any assurance that this transaction will occur on the terms described herein or at all.
Below is a summary of key pro forma financial metrics for the most recent three years and nine months ended September 30, 2014. The pro forma information reflects the impact of reclassifying the Travelocity business segment to discontinued operations. Travel Network and Airline and Hospitality Solutions historical segment revenue and Adjusted EBITDA results will not be impacted by the reclassification of the Travelocity business segment to discontinued operations. A more complete presentation, as well as reconciliations between GAAP and non-GAAP measures, is available in the sections entitled “Unaudited Pro Forma Financial Information” and “Summary Historical and Pro Forma Consolidated Financial and Other Data.”
| Nine Months Ended Sept. 30, 2014 | ||||||||||||||||
Summary Results | FY 2013 | FY 2012 | FY 2011 | |||||||||||||
| (In millions except per share information) | ||||||||||||||||
Revenue (pro forma) | $ | 1,985 | $ | 2,524 | $ | 2,382 | $ | 2,252 | ||||||||
Operating Income (pro forma) | 318 | 381 | (7 | ) | 331 | |||||||||||
Adjusted EBITDA (pro forma) | 641 | 779 | 731 | 649 | ||||||||||||
Adjusted Net Income from Continuing Operations (pro forma) | 173 | 182 | 148 | 217 | ||||||||||||
Net Income Attributable to Common Shareholders | 11 | (137 | ) | (646 | ) | (99 | ) | |||||||||
Diluted Net Income Attributable to Common Shareholders per Share | $ | 0.05 | $ | (0.77 | ) | $ | (3.65 | ) | $ | (0.56 | ) | |||||
Adjusted Net Income from Continuing Operations per Share (pro forma) | $ | 0.73 | $ | 0.98 | $ | 0.81 | $ | 1.20 | ||||||||
Preliminary Fourth Quarter 2014 Results
Based on preliminary unaudited information, we expect to report fourth quarter results for continuing operations (excluding the Travelocity business segment) as follows:
5
Preliminary Full Year 2014 Results
Based on preliminary unaudited information, we expect to report full year 2014 results for continuing operations (excluding the Travelocity business segment) as follows:
6
The following tables reconcile Net Income/(Loss) Attributable to Common Shareholders to Adjusted Net Income from Continuing Operations and Adjusted EBITDA and presents Adjusted Net Income from Continuing Operations per Share for the ranges presented above:
| Financial Results for the Three Months Ended December 31, 2014 is Expected to be Between | Financial Results for the Twelve Months Ended December 31, 2014 is Expected to be Between | |||||||||||||||
| (In millions except per share information) | ||||||||||||||||
Reconciliation of net income to Adjusted Net Income and to Adjusted EBITDA: | ||||||||||||||||
Net income attributable to common shareholders | $ | 41 | $ | 51 | $ | 53 | $ | 63 | ||||||||
Preferred stock dividends | — | — | 11 | 11 | ||||||||||||
(Income) loss from discontinued operations, net of tax | (6 | ) | (6 | ) | 39 | 39 | ||||||||||
Net income (loss) attributable to noncontrolling interests(1) | 1 | 1 | 3 | 3 | ||||||||||||
|
|
|
|
|
|
|
| |||||||||
Income from continuing operations | 36 | 46 | 106 | 116 | ||||||||||||
Adjustments: | ||||||||||||||||
Acquisition related amortization expense(2a) | 23 | 23 | 99 | 99 | ||||||||||||
Loss on extinguishment of debt | — | — | 34 | 34 | ||||||||||||
Other, net(4) | 63 | 63 | 64 | 64 | ||||||||||||
Restructuring and other costs(5) | 2 | 2 | 10 | 10 | ||||||||||||
Litigation and taxes, including penalties(6) | 3 | 3 | 14 | 14 | ||||||||||||
Stock–based compensation | 6 | 6 | 20 | 20 | ||||||||||||
Management fees(7) | — | — | 24 | 24 | ||||||||||||
Tax impact of net income adjustments(8) | (78 | ) | (78 | ) | (144 | ) | (144 | ) | ||||||||
|
|
|
|
|
|
|
| |||||||||
Adjusted Net Income from continuing operations | $ | 55 | $ | 65 | $ | 227 | $ | 237 | ||||||||
|
|
|
|
|
|
|
| |||||||||
Adjusted Net Income from continuing operations per share | $ | 0.20 | $ | 0.24 | $ | 0.92 | $ | 0.96 | ||||||||
Weighted-average shares outstanding adjusted for assumed inclusion of common stock equivalents | 274 | 274 | 247 | 247 | ||||||||||||
Adjusted Net Income from continuing operations | $ | 55 | $ | 65 | $ | 227 | $ | 237 | ||||||||
Adjustments: | ||||||||||||||||
Depreciation and amortization of property and equipment(2b) | 38 | 38 | 158 | 158 | ||||||||||||
Amortization of capitalized implementation costs(2c) | 9 | 9 | 36 | 36 | ||||||||||||
Amortization of upfront incentive consideration(3) | 12 | 12 | 45 | 45 | ||||||||||||
Interest expense, net | 52 | 52 | 219 | 219 | ||||||||||||
Remaining provision (benefit) for income taxes | 28 | 28 | 150 | 150 | ||||||||||||
|
|
|
|
|
|
|
| |||||||||
Adjusted EBITDA | $ | 194 | $ | 204 | $ | 835 | $ | 845 | ||||||||
|
|
|
|
|
|
|
| |||||||||
7
| (1) | Net income attributable to non-controlling interests represents an adjustment to include earnings allocated to non-controlling interest held in (i) Sabre Travel Network Middle East of 40% for all periods presented and (ii) Sabre Seyahat Dagitim Sistemleri A.S. of 40% beginning in April 2014. |
| (2) | Depreciation and amortization expenses: |
| a. | Acquisition related amortization represents amortization of intangible assets from the take-private transaction in 2007 as well as intangibles associated with acquisitions since that date and amortization of the excess basis in our underlying equity in joint ventures. |
| b. | Depreciation and amortization of property and equipment includes software developed for internal use. |
| c. | Amortization of capitalized implementation costs represents amortization of upfront costs to implement new customer contracts under our SaaS and hosted revenue model. |
| (3) | Our Travel Network business at times provides upfront incentive consideration to travel agency subscribers at the inception or modification of a service contract, which are capitalized and amortized to cost of revenue over an average expected life of the service contract, generally over three to five years. Such consideration is made with the objective of increasing the number of clients or to ensure or improve customer loyalty. Such service contract terms are established such that the supplier and other fees generated over the life of the contract will exceed the cost of the incentive consideration provided upfront. Such service contracts with travel agency subscribers require that the customer commit to achieving certain economic objectives and generally have terms requiring repayment of the upfront incentive consideration if those objectives are not met. |
| (4) | Other, net primarily includes a fourth quarter charge of $66 million as a result of an increase to our TRA liability. The increase in our TRA liability is due to a reduction in a valuation allowance maintained against our deferred tax assets. This charge is fully offset by a benefit recognized in the fourth quarter of 2014 from the reduction in the valuation allowance which is included in tax impacts of net income adjustments. Also includes foreign exchange gains and losses related to the remeasurement of foreign currency denominated balances included in our consolidated balance sheets into the relevant functional currency. |
| (5) | Restructuring and other costs represents charges associated with business restructuring and associated changes implemented which resulted in severance benefits related to employee terminations, integration and facility opening or closing costs and other business reorganization costs. |
| (6) | Litigation settlement and tax payments for certain items represent charges or settlements associated with airline antitrust litigation (see Note 13, Contingencies, to our unaudited consolidated financial statements and Note 20, Commitments and Contingencies, to our audited consolidated financial statements included elsewhere in this prospectus). |
| (7) | We paid an annual management fee to TPG and Silver Lake in an amount between (i) $5 million and (ii) $7 million, the actual amount of which was calculated based upon 1% of Adjusted EBITDA, as defined in the management services agreement (the “MSA”), earned by the company in such fiscal year up to a maximum of $7 million. In addition, the MSA provided for the reimbursement of certain costs incurred by TPG and Silver Lake, which are included in this line item. In connection with our initial public offering, we paid to TPG and Silver Lake, in the aggregate, a $21 million fee pursuant to the MSA. The MSA was terminated at the completion of our initial public offering. |
| (8) | Includes a $66 million benefit recognized in the fourth quarter of 2014 from the reduction in a valuation allowance maintained against our deferred tax assets. |
We have provided a range for the preliminary results for the fourth quarter and fiscal year ended December 31, 2014 because our financial closing procedures for the month and fiscal quarter ended December 31, 2014 are not yet complete. The ranges provided for certain financial measurements are based on estimates derived from the amount of work completed to date on the quarterly closing process, revenue and expense forecasts that have been made by management during the month of December and from monitoring key operating performance metrics throughout the month of December. As a result, there is a possibility that final results will vary from these preliminary estimates. We currently expect that our final results will be within the
8
ranges described above. It is possible, however, that the final results will not be within the ranges we currently estimate. We expect to complete our closing procedures for the fiscal quarter ended December 31, 2014 in February 2015.
As a result of the foregoing considerations and the other limitations on non-GAAP measures described herein, investors are cautioned not to place undue reliance on this preliminary financial information. See “Risk Factors—Risks Related to Our Business and Industry—There are material limitations with making estimates of our results for current or prior periods prior to the completion of our normal review procedures for such periods,” “Cautionary Note Regarding Forward-Looking Statements,” “Selected Consolidated Financial and Other Data,” “Management’s Discussion and Analysis of Financial Condition and Results of Operations” and our consolidated financial statements and the related notes thereto included elsewhere in this prospectus.
These preliminary financial data have been prepared by, and are the responsibility of, management. Ernst & Young LLP has not audited, reviewed, compiled or performed any procedures with respect to the accompanying preliminary financial data. Accordingly, Ernst & Young LLP does not express an opinion or any other form of assurance on these preliminary financial data.
Possible acquisition
As of the date of the Registration Statement of which this prospectus forms part, it is possible that we will enter into an agreement in the first quarter of 2015, for a proposed acquisition within the Travel Network business segment. If consummated, we anticipate that the acquisition would close in the second quarter of 2015 and require approximately $500 million in funds, including advisory and financing costs. We expect to meet these funding needs through some combination of cash on hand, revolver draw and debt financing. With respect to our consolidated income statement for the year ended December 31, 2014, on a pro forma basis, we expect the acquisition would have resulted in a revenue increase of approximately $0.25 billion and would have resulted in an increase in Adjusted EBITDA. In 2015, we expect the transaction to be approximately neutral to Adjusted EPS, which excludes customary costs such as transaction and restructuring costs and the amortization of intangibles, and to have a positive impact on Adjusted EPS thereafter. We cannot assure you that this acquisition will occur on the terms described herein or at all or that it will have the expected impact on our financial results as described above.
Our Industry
The travel and tourism industry is one of the world’s largest industry segments, contributing $6.6$7 trillion to global GDP in 2012,2013, according to the World Travel & Tourism Council’s Economic Impact of Travel & Tourism 20132014 (“WTTC”). The industry encompasses travel suppliers, including airlines, hotels, car rental brands, rail carriers, cruise lines and tour operators around the world, as well as travel buyers, including online and offline travel agencies, TMCs and corporate travel departments.
The travel and tourism industry has been a growing area of the broader economy. For example, based on 40 years of data from the IATA Monthly Traffic Analysis Archives (“IATA Traffic”), air traffic has historically grown at an average rate of approximately 1.5x the rate of global GDP growth. Going forward, Euromonitor International Passport Travel and Tourism Database (“Euromonitor Database”) expects a 4%4.5% CAGR in air travel and hotel spending from 2013combined between 2014 and 2018. According to 2017, withAirbus Global Market Forecast 2013-2032 (“Airbus”), air traffic in developing markets such as APAC, Latin America and the Middle East is expected to grow at even faster rates of 6%, 6% and 7%, respectively, from 2012 to 2032, according to Airbus Global Market Forecast 2013-2032 (“Airbus”).2032. In addition to growth in emerging geographies, hybrid carriers andlow-cost carriers (“LCCs”, and collectively, “LCC/hybrids”) have continued to grow, with LCCs’ share of global air travel volume expected to increase from 17% of revenue passenger kilometers in 2012 to 21% of revenue passenger kilometers by 2032, according to Airbus.
9
Technology is integral to that growth, enabling the operation of the modern travel ecosystem by powering the industry lifecycle from distribution to operations. With the increasing complexity created by the large, fragmented and global nature of the travel industry, reliance on technology will only increase. That reliance drove technology spending by the air transportation and hospitality industries to $60 billion in 2013, with expenditures expected to exceed $70 billion in 2017, according to Gartner Enterprise IT Spending by Vertical Industry Market, Worldwide,2011-2017 (“Gartner Enterprise”). Some recent trends in the travel industry which we expect to further technology innovation and spending include:
Outsourcing:Outsourcing: Historically, technology solutions were builtin-house by travel suppliers and travel buyers. As complexity and the pace of innovation have increased,third-party providers have emerged to offer morecost-effective and advanced solutions. Additionally, the travel technology industry has shifted to a more flexible and scalable technology delivery model including SaaS and hosted implementations that allow for shared development, reduced deployment costs, increased scalability and a “pay-as-you-go”“pay-as-you-go” cost model.
Airline Ancillary Revenue:Revenue: The sale of ancillary products is now a major source of revenue for many airlines worldwide, and has grown to comprise as much as 20%30% of total revenues for some carriers and more than $36$31.5 billion in the aggregate across the travel industry in 2012,2013, according to CarTrawler Worldwide Estimate of Ancillary Revenue (“IdeaWorks”). Enabling the sale of ancillary products is technologically complex and requires coordinated changes to multiple interdependent systems including reservations platforms, inventory systems, point of sale locations, revenue accounting, merchandising, shopping, analytics and other systems. Technology providers such as Sabre have already significantly enhanced their systems to provide these capabilities and we expect these providers to take further advantage of this significant opportunity going forward.
Mobile:Mobile: Mobile platforms have created new ways for customers to research, book and experience travel, and are expected to account for over 30%35% of online travel value sales by 2017,2018, according to Euromonitor International World Travel Market Global Trends Report 20132014 (“Euromonitor Report”). Accordingly, travel suppliers, including airlines and hospitality providers, are upgrading their systems to allow for delivery of services via mobile platforms from booking tocheck-in to travel management. According to SITA’s 2013 Air Transport Industry Insights: The Airline IT Trends Survey (“SITA Survey”), 97% of airlines are investing in mobile channels with the intention of increasing mobile access across the entire travel experience. This mobile trend also extends to the use of tablets and wireless connectivity by the airline workforce, such as automating cabin crew services and providing flight crews with electronic flight bags. Travel technology companies like Sabre are enabling and benefitting from this trend as travel suppliers upgrade their systems and travel buyers look for new sources of client connectivity.
Personalization:Personalization: Concurrently with the rise of ancillary products and mobile devices as a customer service tool, travel suppliers have an opportunity to provide increased personalization across the customer travel experience, from seat selection andon-board entertainment to loyalty program management and mobile concierge services.Data-driven business intelligence products can help travel companies use available customer data to identify the types of products,add-ons and upgrades customers are more likely to purchase and market these products effectively to various customer segments according to their needs and preferences. In addition to providing the technology platform to facilitate these services, we believe technology providers like Sabre can leverage theirdata-rich platforms and travel technology domain expertise to offer analytics and business intelligence to support travel suppliers in delivering more personalized service offerings.
Increasing Use of Data and Analytics:Analytics: The use of data has always been an asset in the travel industry. Airlines were pioneers in the use of data to optimize seat pricing, crew scheduling and flight routing. Similarly, hotels employed data to manage room inventory and optimize pricing. The travel industry was also one of the first to capitalize on the value of customer data by developing products such as customer loyalty programs.
10
Historically, this data has largely beentransaction-based, such as booking reservations, recording account balances, and tracking points in loyalty programs. Today,analytics-driven business intelligence products are evolving to further and better utilize available data to help travel companies make decisions, serve customers, optimize their operations and analyze their competitive landscape. Technology providers like Sabre have developed and continue to developlarge-scale,data-rich platforms that include these business intelligence and data analytics tools that can identify new business opportunities and global, integrated andhigh-value solutions for travel suppliers.
Our Competitive Strengths
We believe the following attributes differentiate us from our competitors and have enabled us to become a leading technology solutions provider to the global travel industry.
Broadest Portfolio of Leading Technology Solutions in the Travel Industry
We offer the broadest, most comprehensive technology solutions portfolio available to the travel industry from a single provider, and our solutions are key to the operations of many of our travel supplier and travel agency customers. Travel Network, for example, provides a key technology platform that enables efficient shopping, booking and management of travel itineraries for online and offline travel agencies, TMCs and corporate travel departments. In addition to offering these and other advanced functionalities, it is a valuable distribution and merchandising channel for travel suppliers to market to a broad array of customers, particularly outside their home countries and regions. Additionally, we provide SaaS and hosted solutions that run many of the most important operations systems for our travel supplier customers, such as airline and hotel reservations systems, revenue management, crew scheduling and flight operations. We believe that our Travel Network and
Airline and Hospitality Solutions offerings address customer needs across the entire travel lifecycle, and that we are the only company that provides such a broad portfolio of technology solutions to the travel industry. This breadth affords us significant competitive advantages including the ability to leverage shared infrastructure, a common technology organization and product development. Beyond scale and efficiency, our position spanning the breadth of the travel ecosystem helps us to develop deep domain expertise and to anticipate the needs of our customers. Taken together, the value, quality, and breadth of our technology, software and related customer services contribute to our strong competitive position.
Global Leadership Across Growing End Markets
We operate in areas of the global travel industry that have large and growing addressable customer bases. Each of our businesses is a leader in its respective area. Sabre is the leading GDS provider in North America, Latin America, and APAC, with 55%, 57%, and 39% share ofGDS-processed air bookings, respectively, in 2013. Additionally, Airline Solutions is the second largest provider of reservations systems, with an 18% global share of 2012 PBs, according to T2RL.T2RL PSS. We believe that we have the leading portfolio of airline marketing and operations products across the solutions that we provide. We also believe our Hospitality Solutions business is the leader in hotel reservations, handling 27% ofthird-party hospitality CRS hotel rooms through our GDS in 2013. See “Method of Calculation” for an explanation of the methodology underlying ourGDS-processed air bookings share andthird-party hospitality CRS hotel room share calculations.
Looking forward, we expect to benefit from attractive growth in our end markets. Euromonitor expects a 4%4.5% CAGR in air travel and hotel spending from 2013 to 2017.combined between 2014 and 2018. Gartner, Inc. (“Gartner”) expects technology spending by the air transportation and hospitality sectors to grow significantly from $60 billion in 2013 to over $70 billion in 2017. Within our Travel Network business, we also expect our presence in economies with strong GDP growth and regions with faster air traffic growth, such as APAC, Latin America MEA and APAC,the Middle East and Africa (“MEA”), will further contribute to the growth of our businesses. Similarly, our
11
Airline Solutions reservations products customers are weighted toward faster-growingfaster growing LCC/hybrids, which represented approximately 29% of our 2013 PBs based on T2RL data. In 2012, LCC/hybrids represented approximately 45% of our 2012 PBs. T2RL’s LCC/hybrid group included JetBlue and Lion Airlines in 2012, which we consider LCC/hybrid carriers. T2RL’s 2013 calculation excludes these carriers from the LCC/hybrid group. If these two carriers were included as LCC/hybrids in the 2013 calculation, LCC/hybrids would have represented approximately 41% of our 2013 PBs.
Innovative and Scalable Technology
Two pillars underpin our technology strategy: innovation and scalability. To drive innovation in our travel marketplace business, we make significant investments in technology to develop new products and add incremental features and functionality, including advanced algorithms, decision support, data analysis and other valuable intellectual property. This investment is supported by our global technology teams comprising approximately 4,000 employees and contractors. This scale andcross-business technology organization creates efficiency and a flexible environment that allows us to apply knowledge and resources across our broad product portfolio, which in turn fuels innovation. In addition, our investments in technology have created a highly scalable set of solutions across our businesses. For example, we believe our GDS is one of the most heavily utilized Service Oriented Architecture (“SOA”) environments in the world, processing more than 1.1 trillion system messages in 2013, with nearly 100,000 system messages per second at peak times. Our Airline and Hospitality Solutions business employs highly reliable software technology products and SaaS and hosted infrastructure. Compared to traditionalin-house software installations, SaaS and hosted technology offers our customers advantages in terms of cost savings, more robust functionality, increased flexibility and scale, and faster upgrades. As an example of the SaaS and hosted scalability benefit, our delivery model has facilitated an increase in the number of PBs in our Airline Solutions business from 288 million to 478 million from 2009 to 2013. Our investments in technology maintain and extend our technology platform which has supported ourindustry-leading product innovation. On the scale at which we operate, we believe that the combination of an expanding network and technology investments continues to create a significant competitive advantage for us.
Stable, Resilient, and Diversified Business Models
Travel Network and much of Airline and Hospitality Solutions operate with atransaction-based business model that ties our revenue to a travel supplier’s transaction volumes rather than to its unit pricing for an airplane ticket, hotel room or other travel product.Travel-related businesses withvolume-based revenue models have generally shown strong visibility, predictability and resilience across economic cycles because travel suppliers have historically sought to maintain traveler volumes by reducing prices in an economic downturn.
Our resilience is also partially attributable to ournon-exclusive,multi-year contracts in our Travel Network business. For example, although most of our contracts have terms of one to three years, contracts with our major travel buyer and travel supplier customers, which represent the majority of Travel Network revenue, have five to ten year terms and three to five year terms, respectively. Similarly, our Airline Solutions business has contracts that typically range from three to seven years in length, and our Hospitality Solutions business has contracts that typically range from one to five years in length. Our Travel Network and Airline and Hospitality Solutions businesses also deliver solutions that are integral components of our customers’ businesses and have historically remained in place once implemented. In our Travel Network business and our Airline and Hospitality Solutions business, 94% and 84% of our revenue was Recurring Revenue, respectively, in 2013.
In addition to being stable, our businesses are also diversified. Travel Network and Airline and Hospitality Solutions generate a broad geographic revenue mix, with a combined 43% of revenue generated outside the United States in 2013. None of our travel buyers or travel suppliers accounted for more than 10% of our revenue for the years ended December 31, 2013 or 2012.
12
Strong,Long-Standing Customer Relationships
We have strong,long-standing customer relationships with both travel suppliers and travel buyers. These relationships have allowed us to gain a deep understanding of our customers’ needs, which positions us well to continue introducing new products and services that add value by helping our customers improve their business performance. In our Travel Network business, for example, by providing efficient and quality services, we have developed and maintained strong customer relationships with TMCs, major corporate travel departments and travel suppliers, with some of these relationships dating back over 20 years. Through our Travelocity business, we have gained important insights into what online travel companies need in order to best serve their customers, and we are able to leverage that knowledge to develop products and services to address those needs.
We believe that our strong value proposition is demonstrated by our ability to retain customers in a highly competitive marketplace. For each of the years ended December 31, 2013, 2012 and 2011, our Customer Retention rate for Travel Network was 99%. For our Airline Solutions business, our Customer Retention rate was 98%, 96% and 96% for the years ended December 31, 2013, 2012 and 2011 respectively, and our Customer Retention rate for our Hospitality Solutions business was 96%, 96% and 98% for the same periods, respectively. See “Method of Calculation” for a description of Customer Retention.
Deep and Experienced Leadership Team with Informed Insight into the Travel Industry
Our management team is highly experienced, with comprehensive expertise in the travel and technology industries. Many of our leaders have more than 20 years of experience in multiple segments of the travel industry and have held positions in more than one of our businesses, which provides them with a holistic and interdisciplinary perspective on our company and the travel industry.
By investing in training, skills development and rotation programs, we seek to develop leaders with broad knowledge of our company, the industry, technology, and specific customer needs. We also hire externally as needed to bring in new expertise. Our blend of experience and new hires across our team provides a solid foundation on which we develop new capabilities, new business models and new solutions to complex industry problems.
Our Growth Strategy
We believe we arewell-positioned for future growth. First, we expect the continued macroeconomic recovery to generate travel growth, compounded by the continuing trend towards the outsourcing of travel technology. In addition, we arewell-positioned in market segments which are growing faster than the overall travel industry, with leading market positions in our Travel Network business in Latin America and APAC. In our Airline Solutions reservations systems, LCC/hybrids, which are growing traffic faster than traditional airlines, accounted for approximately 45%29% of our PBs in 2012.2013 based on T2RL data. In 2012, LCC/hybrids represented approximately 45% of our 2012 PBs. T2RL’s LCC/hybrid group included JetBlue and Lion Airlines in 2012, which we consider LCC/hybrid carriers. T2RL’s 2013 calculation excludes these carriers from the LCC/hybrid group. If these two carriers were included as LCC/hybrids in the 2013 calculation, LCC/hybrids would have represented approximately 41% of our 2013 PBs. Supported by these industry trends, we believe both our Travel Network and our Airline and Hospitality Solutions businesses have significant opportunities to expand their customer bases, further penetrate existing customers, extend their geographic footprint and develop new products. WeBy executing on the following strategies and, when appropriate, selective strategically aligned acquisitions, we intend to capitalize on these positive trends by executing on the following strategies:trends:
Leverage ourIndustry-Leading Technology Platforms
We have made significant investments in our technology platforms and infrastructure to develop robust, scalable software as well as SaaS and hosted solutions. We plan to continue leveraging these investments across our organization, particularly in our Travel Network and Airline and Hospitality Solutions businesses, to catalyze product innovation andspeed-to-market. We will also continue to shift toward SaaS and hosted infrastructure and solutions as we further develop our product portfolio.
13
Expand our Global Travel Marketplace Leadership
Travel Network intends to remain the global B2B travel marketplace of choice for travel suppliers and travel buyers by executing on the following initiatives:
| • | Targeting Geographic Expansion: From 2009 to 2013, we increased ourGDS-processed air bookings share in the Middle East, Russia and |
| • | Attracting and Enabling New Marketplace Content: We are actively adding new travel supplier content which generates revenue directly through incremental booking volumes associated with the new content and reinforces the virtuous cycle of our Travel Network business: as we add more supplier content to our marketplace, we experience increased participation from travel buyers, which, in turn, encourages travel suppliers to contribute additional content to our marketplace. We have been successful in converting notable carriers that previously only used direct distribution, such as JetBlue and Norwegian, to join our GDS, and we believe there is a similar opportunity to increase the participation ofless-penetrated content types like hotel properties, where we estimate that |
| • | Continuing to Invest in Innovative Products and Capabilities: The development ofcutting-edge products and capabilities has been critical to our success. We plan to continue to invest significant resources in solutions that address key customer needs, including mobility (e.g., TripCase), data analytics and business intelligence (e.g., Sabre Dev Studio, Hotel Heatmaps, Contract Optimization Services), and workflow optimization (e.g., Sabre Red App Centre, TruTrip). |
Drive Continued Airline and Hospitality Solutions Growth and Innovation
Our Airline and Hospitality Solutions business has been a key growth engine for us increasing bothwith a CAGR of 14% for revenue and 15% for Adjusted EBITDA by 72% from 2009 to 2013. We believe Airline and Hospitality Solutions will continue to drive company growth through a combination of underlying customer and market growth, as well as through the following strategic growth initiatives:
| • | Invest in Innovative Airline Products and Capabilities: We have a long history of investment in innovation. For example, we believe we were the first technology solutions provider to providereal-time revenue integrity and |
| • | Continue to Add New Airline Reservations Customers: Over the last |
14
| • | Further Penetrate Existing Airline Solutions Customers: We believe there is an opportunity to sell more of our extensive solution set to our existing customers. Of our 2013 customers in T2RL’s top 100 passenger airlines, |
| • | Invest Behind Rapidly Growing Hospitality Solutions Business: Our Hospitality Solutions business has grown rapidly, with 19% revenue CAGR from 2009 to 2013, and we are focused on continuing that growth going forward. We currently have initiatives to grow in our existing footprint and expand our presence in APAC and |
Continue to Focus on Operational Efficiency Supported by Leading Technology
As an organization, weWe have a track record of improving operational efficiency and capitalizing on our scalable technology platform and operating leverage in our business model. We have expanded Adjusted EBITDA margins in our Travel Network business by over 550 bps since 2009 in our Travel Network business while growing the business and introducing new products. We intend to continue to increase our operational efficiency by following a shared capabilities, technology and insights approach across our businesses. For example,Through a comprehensive labor strategy, we are driving operating efficiencies and cost savings through a proactive approach that focuses on adding and retaining talent and achieving the Expedia SMA, we intendoptimal personnel mix across our global development centers. We expect the outcome of this program to reduce directbetter scale development costs associated with Travelocity and expect to improve our Adjusted EBITDA by providing our customers with the benefit of Expedia’s long-term investment in its technology platform to increase conversion, improve operational efficiency, and shift our focus to Travelocity’s strengths in marketing and retailing. Additionally, Travelocity recently sold its TPN business, a B2B loyalty and private label website offering, to Orbitz. We will continue to work toward identifying operational and technological efficiencies while continuing to support our investments and strategic priorities to maintain our leadership position in the travel industry.over time.
Summary of RisksRisks
Significant risks that could materially and adversely affect our business, financial condition and results of operations include:
15
See “Risk Factors” beginning on page 2027 for additional risks that could impact our business.
Redemption of Preferred Stock
Prior to the closing of this offering, we will exercise our right to redeem (the “Redemption”) all of our Series A Preferred Stock (the “Series A Preferred Stock”). The redemption price will be paid with a mix of cash and stock, which we will deliver pro rata to the holders thereof concurrently with the closing of this offering. Assuming we sell the total number of shares set forth on the cover of this prospectus at an initial public offering price equal to the midpoint of the price range on the cover of this prospectus, we will deliver an estimated aggregate of $ million in cash and shares of our common stock in payment of the related redemption price plus accumulated but unpaid dividends as of March 31, 2014 (the “Redemption Payment”). A $1.00 increase in the estimated net proceeds of this offering would increase the aggregate cash component of the Redemption Payment by $1.00 and decrease the common stock component by shares, which represents a value of $1.00 based on the assumed offering price. Conversely, a $1.00 decrease in the estimated net proceeds of this offering would cause us to decrease the aggregate cash component of the Redemption Payment by $1.00 and to increase the common stock component by shares, which represents a value of $1.00 based on the assumed offering price. In all cases, the common stock delivered in the Redemption will be valued at the actual initial public offering price.
The Redemption of the Series A Preferred Stock will simplify our capital structure by leaving only one class of capital stock – our common stock – outstanding following the closing of this offering. For more information, see “Description of Capital Stock – Series A Preferred Stock”.
Tax Receivable Agreement
Immediately prior to the completion of this offering, we will enter into a tax receivable agreement (“TRA”) that provides the right to receive future payments by us to certain of our pre-IPO stockholders and equity award holders (collectively, the “Existing Stockholders”) of 85% of the amount of cash savings, if any, in U.S. federal income tax that we and our subsidiaries realize as a result of the utilization of certain tax assets attributable to periods prior to our initial public offering, including federal net operating losses, capital losses and the ability to realize tax amortization of certain intangible assets (collectively, the “Pre-IPO Tax Assets”). We expect that future payments under the TRA will aggregate to between $ and $ million over the next five years and do not expect material payments to occur before 2016. See “Certain Relationships and Related Party Transactions—Tax Receivable Agreement.”
Corporate and Other Information
Sabre Holdings Corporation is a Delaware corporation formed in 1996. It was operated as a division of AMR Corporation, its parent company, until it was spun off completely in 2000. Sabre Corporation is a Delaware corporation formed in December 2006 and is the parent company of Sabre Holdings Corporation and Sabre GLBL. Prior to our acquisition in 2007 by the Principal Stockholders (as defined below), we were previously apublicly-held travel technology company. Our initial public offering occurred on April 17, 2014 and our shares are listed on NASDAQ. We are headquartered in Southlake, Texas, and employ approximately 10,0008,000 people in approximately 60 countries around the world. We serve our customers throughcutting-edge technology developed in six facilities located across four continents.
Our principal executive offices are located at 3150 Sabre Drive, Southlake, TX 76092, and our telephone number is(682) 605-1000. Our corporate website address is www.sabre.com. The information contained on our website or that can be accessed through our website will not be deemed to be incorporated into this prospectus or the registration statement of which this prospectus forms a part, and investors should not rely on any such information in deciding whether to purchase our common stock.
Principal Stockholders
Our Relationship with the TPG Funds and Silver Lake Funds
We are currently privately held as a result of our acquisition inIn 2007, we were acquired by the TPG Funds and the Silver Lake Funds. On March 30, 2007, we entered into a Stockholders’ Agreement by and among the TPG Funds, the Silver Lake Funds, SovereignCo-Invest, LLC (“
16
(“SovereignCo-Invest,” an entityco-managed by TPG and Silver Lake, and together with the TPG Funds and the Silver Lake Funds, the “Principal Stockholders”), and Sabre Corporation (formerly known as Sovereign Holdings, Inc.), which will bewas amended and restated in connection with the completion of thisour initial public offering (as amended and restated, the “Stockholders’ Agreement”). See “Certain Relationships and Related Party Transactions—Stockholders’ Agreement.”
As of January 15, 2015, the Principal Stockholders owned approximately 79.3% of our common stock. As of January 15, 2015, the TPG Funds, the Silver Lake Funds and Sovereign Co-Invest owned approximately 37.2%, 22.9% and 19.2%, respectively, of our common stock. Following the completion of this offering, the Principal Stockholders will own approximately % of our common stock or approximately % if the underwriters’ option to purchase additional shares from the Principal Stockholders is fully exercised. The TPG Funds, the Silver Lake Funds and the Sovereign Co-Invest will own approximately %, % and %, respectively, of our common stock or approximately %, % and %, respectively, if the underwriters’ option to purchase additional shares from the Principal Stockholders is fully exercised. As a result, we expectare and, upon completion of this offering, will continue to be a “controlled company” within the meaning of the corporate governance requirements of the NASDAQ on which we intend to apply to list our shares of common stock.NASDAQ. See “Risk Factors—Risks Related to the Offering and Ourour Common Stock—We expectare and, upon completion of this offering, will continue to be a “controlled company” within the meaning of the NASDAQ rules and, as a result, we will qualify for exemptions from certain corporate governance requirements. You may not have the same protections afforded to stockholders of companies that are subject to such requirements.”
TPG
TPG is a leading global private investment firm founded in 1992 with over $59$65 billion of assets under management as of December 31 2013, as adjusted for commitments accepted on January 2,September 30, 2014 and offices in San Francisco, Fort Worth, Austin, Beijing, Chongqing,Dallas, Hong Kong, Houston, London, Luxembourg, Melbourne, Moscow, Mumbai, New York, Paris, São Paulo, Shanghai, Singapore, Tokyo and Tokyo.Toronto. TPG has extensive experience with global public and private investments executed through leveraged buyouts, recapitalizations, spinouts, growth investments, joint ventures and restructurings. The firm’s investments span a variety of industries, including financial services, travel and entertainment, technology, energy, industrials, retail, consumer, real estate, media and communications, and healthcare. For more information please visit www.tpg.com.
Silver Lake
Silver Lake is a global investment firm focused on the technology,technology-enabled and related growth industries with offices in Silicon Valley, New York, London, Hong Kong, Shanghai and Tokyo. Silver Lake was founded in 1999 and has over $20 billion in combined assets under management and committed capital across itslarge-cap private equity,middle-market private equity, growth equity and credit investment strategies.
17
Summary of Corporate Structure
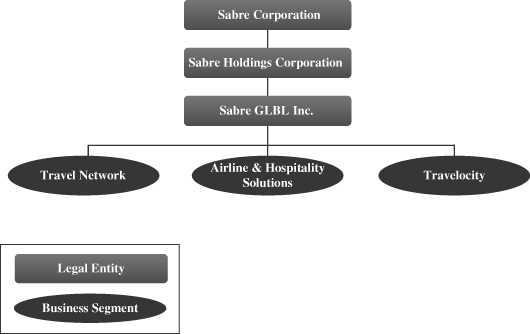
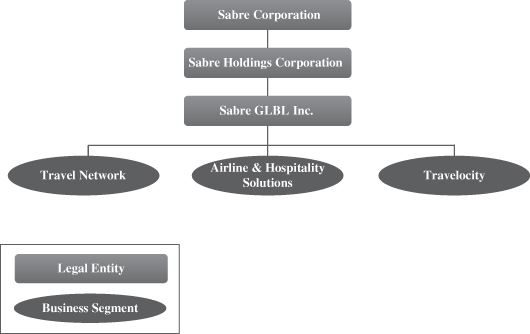
Going forward, the Travelocity business segment will not be a part of our corporate structure as a result of the divestiture of the businesses in the segment. See “Recent Developments.”
18
|
Common stock offered by the | shares of common stock. |
Common stock to be outstanding after this offering |
Selling Stockholders | See “Principal and Selling Stockholders.” |
Underwriters’ option to purchase additional shares |
Use of proceeds |
Dividend policy | Our board of directors has declared cash dividends of $0.09 per share of our common stock, which were paid on September 16, 2014 to shareholders of record as of September 1, 2014, and on December 30, 2014 to shareholders of record as of December 15, 2014. We |
The ability of our subsidiaries to pay cash dividends, which could then be further distributed to holders of our common stock, is currently restricted in certain circumstances by the covenants in our Credit Facility (as defined in “Description of Certain Indebtedness”) and the indenture governing |
of future debt or preferred securities. |
Risk factors | Investing in our common stock involves a high degree of risk. See “Risk Factors” beginning on page |
| “SABR” |
|
19
The number of shares of common stock to be outstanding after this offering is based on shares of common stock outstanding and shares to be sold in this offering.
The numberassumes no issuance of shares of common stock to be outstanding after this offering does not take into accountreserved for issuance under our equity incentive plans. As of January 15, 2015, an aggregate of 11,847,105 shares of common stock were reserved for future issuance under the Sabre Corporation 2014 Omnibus Incentive Compensation Plan (the “2014 Omnibus Plan”). which includes 2,844,254 shares of common stock that were available for future issuance under our prior equity plans. Additionally, the number of shares of common stock to be outstanding after this offering assumes:
In addition, except as otherwise noted, all information in this prospectus assumes the underwriters do not exercise their option to purchase additional shares.shares from the Principal Stockholders.
20
SUMMARY HISTORICAL AND PRO FORMA CONSOLIDATED FINANCIAL AND OTHER DATA
The following tables present summary consolidated historical and pro forma financial data for our business. You should read these tables along with “Risk Factors,” “Use of Proceeds,” “Capitalization,” “Management’s Discussion and Analysis of Financial Condition and Results of Operations,” “Business”“Business,” “Unaudited Pro Forma Financial Information,” and our audited consolidated financial statements and the notes thereto included elsewhere in this prospectus.
The historical consolidated statements of operations data, historical consolidated statements of cash flows data and historical consolidated balance sheet data as of and for the nine months ended September 30, 2014 and 2013 are derived from our unaudited consolidated financial statements and the notes thereto included elsewhere in this prospectus. The unaudited consolidated financial statements have been prepared on the same basis as our audited consolidated financial statements and, in the opinion of our management, reflect all adjustments, consisting of normal recurring adjustments, necessary for a fair presentation of this data. The historical consolidated statements of operations data and historical consolidated statements of cash flow data for the years ended December 31, 2013, 2012 and 2011 and the historical consolidated balance sheet data as of December 31, 2013 and 2012 are derived from our audited consolidated financial statements and the notes thereto included elsewhere in this prospectus. The historical consolidated balance sheet data as of December 31, 2011 are derived from our unaudited consolidated financial statements and the notes thereto not included in this prospectus.
The summary historical financial data include the results of our Travelocity business, which, as of September 30, 2014, was included in continuing operations. The summary consolidated financial data presented below are not necessarily indicative of the results to be expected for any future period, and results for any interim period presented below are not necessarily indicative of the results to be expected for the full year.
The summary pro forma consolidated statement of operations data for the nine months ended September 30, 2014 and the years ended December 31, 2013, 2012 and 2011 are derived from our unaudited pro forma financial statements included elsewhere in this prospectus and gives effect to our divestiture of the Travelocity business as if it occurred on January 1, 2011. The summary pro forma consolidated balance sheet data as of September 30, 2014 are derived from our unaudited pro forma financial information included elsewhere in this prospectus and gives effect to our divestiture of the Travelocity business as if it occurred on September 30, 2014. The unaudited pro forma financial information is for informational purposes only and is not necessarily indicative of what our financial performance would have been had the transactions been completed on the dates assumed nor is such unaudited pro forma financial information necessarily indicative of the results to be expected in any future period.
| Year Ended December 31, | ||||||||||||
| 2013 | 2012 | 2011 | ||||||||||
| (Amounts in thousands) | ||||||||||||
Consolidated Statements of Operations Data: | ||||||||||||
Revenue | $ | 3,049,525 | $ | 2,974,364 | $ | 2,855,961 | ||||||
Gross margin | 1,144,675 | 1,155,129 | 1,119,920 | |||||||||
Selling, general and administrative | 792,929 | 1,188,248 | 806,435 | |||||||||
Impairment | 138,435 | 573,180 | 185,240 | |||||||||
Restructuring and other costs | 36,551 | — | — | |||||||||
Operating income (loss) | 176,760 | (606,299 | ) | 128,245 | ||||||||
Net loss attributable to Sabre Corporation | (100,494 | ) | (611,356 | ) | (66,074 | ) | ||||||
Net loss attributable to common shareholders | (137,198 | ) | (645,939 | ) | (98,653 | ) | ||||||
Basic and diluted loss per share attributable | (0.77 | ) | (3.65 | ) | (0.56 | ) | ||||||
Weighted average common shares outstanding: | 178,125 | 177,206 | 176,703 | |||||||||
Consolidated Statements of Cash Flows Data: | ||||||||||||
Cash provided by operating activities | $ | 157,188 | $ | 312,336 | $ | 356,444 | ||||||
Additions to property and equipment | 226,026 | 193,262 | 164,638 | |||||||||
Cash payments for interest | 255,620 | 264,990 | 184,449 | |||||||||
Other Financial Data: | ||||||||||||
Adjusted Gross Margin | $ | 1,383,809 | $ | 1,389,862 | $ | 1,330,514 | ||||||
Adjusted Net Income | 217,151 | 150,886 | 236,166 | |||||||||
Adjusted EBITDA | 791,323 | 786,629 | 720,163 | |||||||||
Adjusted Capital Expenditures | 284,840 | 271,805 | 223,747 | |||||||||
| Pro Forma | Historical | |||||||||||
| Nine Months Ended September 30, | Nine Months Ended September 30, | |||||||||||
| 2014 | 2014 | 2013 | ||||||||||
| (Amounts in thousands) | ||||||||||||
Consolidated Statements of Operations Data(1): | ||||||||||||
Revenue | $ | 1,985,275 | $ | 2,229,286 | 2,303,399 | |||||||
Cost of revenue | 1,315,669 | 1,399,919 | 1,423,242 | |||||||||
Selling, general and administrative | 352,574 | 575,413 | 620,226 | |||||||||
Impairment | — | — | 138,435 | |||||||||
Restructuring (adjustments) charges | (604 | ) | 2,325 | 15,889 | ||||||||
Operating income | 317,636 | 251,629 | 105,607 | |||||||||
Income (loss) from continuing operations | 69,643 | 33,008 | (104,224 | ) | ||||||||
Loss from discontinued operations, net of tax | (44,652 | ) | (8,017 | ) | (20,895 | ) | ||||||
Net income (loss) attributable to Sabre Corporation | 22,823 | 22,823 | (127,254 | ) | ||||||||
Net income (loss) attributable to common shareholders | 11,442 | 11,442 | (154,473 | ) | ||||||||
Basic and diluted earnings (loss) per share attributable to common shareholders | $ | 0.05 | $ | 0.05 | $ | (0.87 | ) | |||||
Basic weighted average common shares outstanding | 229,405 | 229,405 | 178,051 | |||||||||
Diluted weighted average common shares outstanding | 237,994 | 237,994 | 178,051 | |||||||||
Other Financial Data: | ||||||||||||
Adjusted EBITDA | $ | 641,354 | $ | 617,350 | $ | 583,963 | ||||||
Adjusted Net Income from continuing operations | $ | 172,556 | $ | 158,829 | $ | 147,697 | ||||||
Adjusted Net Income from continuing operations per share | $ | 0.73 | $ | 0.67 | $ | 0.80 | ||||||
21
| As of December 31, | ||||||||||||
| 2013 | 2012 | 2011 | ||||||||||
| (Amounts in thousands) | ||||||||||||
Consolidated Balance Sheet Data | ||||||||||||
Cash and cash equivalents | $ | 308,236 | $ | 126,695 | $ | 58,350 | ||||||
Total assets | 4,755,708 | 4,711,245 | 5,252,780 | |||||||||
Long-term debt | 3,643,548 | 3,420,927 | 3,307,905 | |||||||||
Working capital (deficit) | (273,591 | ) | (428,569 | ) | (411,485 | ) | ||||||
Redeemable preferred stock | 634,843 | 598,139 | 563,557 | |||||||||
Noncontrolling interest | 508 | 88 | (18,693 | ) | ||||||||
Total stockholders’ equity (deficit) | (952,536 | ) | (876,875 | ) | (196,919 | ) | ||||||
Key Metrics | ||||||||||||
Travel Network | ||||||||||||
Direct Billable Bookings—Air | 314,275 | 326,175 | 328,200 | |||||||||
Direct Billable Bookings—Non-Air | 53,503 | 53,669 | 53,683 | |||||||||
Total Direct Billable Bookings | 367,778 | 379,844 | 381,883 | |||||||||
Airline Solutions Passengers Boarded | 478,088 | 405,420 | 364,420 | |||||||||
| Pro Forma | Historical | |||||||||||||||||||||||
| Year Ended December 31, | Year Ended December 31, | |||||||||||||||||||||||
| 2013 | 2012 | 2011 | 2013 | 2012 | 2011 | |||||||||||||||||||
| (Amounts in thousands) | ||||||||||||||||||||||||
Consolidated Statements of Operations Data(1): | ||||||||||||||||||||||||
Revenue | $ | 2,523,546 | $ | 2,382,148 | $ | 2,252,446 | $ | 3,049,525 | $ | 2,974,364 | $ | 2,855,961 | ||||||||||||
Cost of revenue | 1,705,163 | 1,575,186 | 1,529,026 | 1,904,850 | 1,819,235 | 1,736,041 | ||||||||||||||||||
Selling, general and administrative | 429,290 | 793,294 | 392,308 | 792,929 | 1,188,248 | 806,435 | ||||||||||||||||||
Impairment | — | 20,254 | — | 138,435 | 573,180 | 185,240 | ||||||||||||||||||
Restructuring charges | 8,163 | — | — | 36,551 | — | — | ||||||||||||||||||
Operating income (loss) | 380,930 | (6,586 | ) | 331,112 | 176,760 | (606,299 | ) | 128,245 | ||||||||||||||||
Income (loss) from continuing operations | 52,066 | (215,427 | ) | 113,478 | (90,455 | ) | (621,726 | ) | (79,294 | ) | ||||||||||||||
Loss from discontinued operations, net of tax | (149,696 | ) | (394,410 | ) | (193,873 | ) | (7,176 | ) | (48,947 | ) | (23,461 | ) | ||||||||||||
Net loss attributable to Sabre Corporation | (100,494 | ) | (611,356 | ) | (66,074 | ) | (100,494 | ) | (611,356 | ) | (66,074 | ) | ||||||||||||
Net loss attributable to common shareholders | (137,198 | ) | (645,939 | ) | (98,653 | ) | (137,198 | ) | (645,939 | ) | (98,653 | ) | ||||||||||||
Basic and diluted loss per share attributable to common shareholders | $ | (0.77 | ) | $ | (3.65 | ) | $ | (0.56 | ) | $ | (0.77 | ) | $ | (3.65 | ) | $ | (0.56 | ) | ||||||
Basic weighted average common shares outstanding | 178,125 | 177,206 | 176,703 | 178,125 | 177,206 | 176,703 | ||||||||||||||||||
Diluted weighted average common shares outstanding | 184,978 | 177,206 | 181,889 | 178,125 | 177,206 | 176,703 | ||||||||||||||||||
Other Financial Data: | ||||||||||||||||||||||||
Adjusted EBITDA | $ | 778,754 | $ | 731,412 | $ | 649,285 | $ | 791,323 | $ | 786,629 | $ | 720,163 | ||||||||||||
Adjusted Net Income from continuing operations | 182,186 | 147,734 | 217,482 | 217,151 | 150,886 | 236,166 | ||||||||||||||||||
Adjusted Net Income from continuing operations per share | $ | 0.98 | $ | 0.81 | $ | 1.20 | $ | 1.17 | $ | 0.83 | $ | 1.30 | ||||||||||||
| Pro Forma | Historical | |||||||||||||||||||
| As of September 30, | As of September 30, | As of December 31, | ||||||||||||||||||
| 2014 | 2014 | 2013 | 2012 | 2011 | ||||||||||||||||
| (Amounts in thousands) | ||||||||||||||||||||
Consolidated Balance Sheet Data: | ||||||||||||||||||||
Cash and cash equivalents | $ | 437,747 | $ | 157,747 | $ | 308,236 | $ | 126,695 | $ | 58,350 | ||||||||||
Total assets | 4,778,396 | 4,672,394 | 4,755,708 | 4,711,245 | 5,252,780 | |||||||||||||||
Long-term debt | 3,065,440 | 3,065,440 | 3,643,548 | 3,420,927 | 3,307,905 | |||||||||||||||
Working capital deficit | 99,252 | (246,557 | ) | (273,591 | ) | (428,569 | ) | (411,482 | ) | |||||||||||
Redeemable preferred stock | — | — | 634,843 | 598,139 | 563,557 | |||||||||||||||
Noncontrolling interest | 57 | 57 | 508 | 88 | (18,693 | ) | ||||||||||||||
Total stockholders’ equity (deficit) | 242,023 | 69,048 | (952,536 | ) | (876,875 | ) | (196,919 | ) | ||||||||||||
| Historical | ||||||||||||||||||||
| Nine Months Ended | ||||||||||||||||||||
| September 30, | Year Ended December 31, | |||||||||||||||||||
| 2014 | 2013 | 2013 | 2012 | 2011 | ||||||||||||||||
| (Amounts in thousands) | ||||||||||||||||||||
Key Metrics: | ||||||||||||||||||||
Travel Network | ||||||||||||||||||||
Direct Billable Bookings—Air | 251,145 | 244,267 | 314,275 | 326,175 | 328,200 | |||||||||||||||
Direct Billable Bookings—Non-Air | 21,275 | 40,734 | 53,503 | 53,669 | 53,683 | |||||||||||||||
Total Direct Billable Bookings | 292,419 | 285,001 | 367,778 | 379,844 | 381,883 | |||||||||||||||
Airline Solutions Passengers Boarded | 385,611 | 358,428 | 478,088 | 405,420 | 364,420 | |||||||||||||||
| (1) | Certain historical amounts previously reported in our December 31, 2012 and 2011 financial statements have been reclassified to conform to the December 31, 2013 presentation of Holidays Auto as a discontinued operation. See Note 2, Summary of Significant Accounting Policies—Reclassifications, to our audited consolidated financial statements included elsewhere in this prospectus. In June 2013, we sold certain assets of our Holiday Autos operations to a third party and in November 2013, we completed the closing of the remainder of the Holiday Autos operations such that it represented a discontinued operation. See Note 4, Discontinued Operations and Dispositions, to our audited consolidated financial statements included elsewhere in this prospectus. The impact on our revenue was a reduction of $65 million and $76 million for the years ended December 31, 2012 and 2011, respectively. The impact on our operating income was an increase of $12 million for the year ended December 31, 2012 and a reduction of less than $1 million for the year ended December 31, 2011. Pro forma results include the impacts of Holidays Auto as a discontinued operation as well as adjustments described in “Unaudited Pro Forma Financial Information.” |
22
Non-GAAP MeasurementsMeasures
The following table setstables set forth the reconciliation of gross marginnet income (loss) attributable to Adjusted Gross Margin:
| Year Ended December 31, | ||||||||||||
| 2013 | 2012 | 2011 | ||||||||||
| (Amounts in thousands) | ||||||||||||
Gross margin | $ | 1,144,675 | $ | 1,155,129 | $ | 1,119,920 | ||||||
Adjustments: | ||||||||||||
Depreciation and amortization(3) | 202,485 | 198,206 | 172,846 | |||||||||
Amortization of upfront incentive consideration(8) | 36,649 | 36,527 | 37,748 | |||||||||
|
|
|
|
|
| |||||||
Adjusted gross margin | $ | 1,383,809 | $ | 1,389,862 | $ | 1,330,514 | ||||||
|
|
|
|
|
| |||||||
The following table sets forthcommon shareholders, the reconciliation ofmost directly comparable GAAP measure, to Adjusted Net Income and Adjusted EBITDA to net loss attributable to Sabre Corporation, the most directly comparable GAAP measure.EBITDA.
For Adjusted EBITDA by segment, see “Selected Historical Consolidated FinancialData—Non-GAAP Measurements. Measures.”
| Year Ended December 31, | ||||||||||||
| 2013 | 2012 | 2011 | ||||||||||
| (Amounts in thousands) | ||||||||||||
Reconciliation of net income (loss) to Adjusted | ||||||||||||
Net loss attributable to Sabre Corporation | $ | (100,494 | ) | $ | (611,356 | ) | $ | (66,074 | ) | |||
Net loss from discontinued operations, net of tax | 7,176 | 48,947 | 23,461 | |||||||||
Net income (loss) attributable to noncontrolling interests(1) | 2,863 | (59,317 | ) | (36,681 | ) | |||||||
|
|
|
|
|
| |||||||
Loss from continuing operations | (90,455 | ) | (621,726 | ) | (79,294 | ) | ||||||
Adjustments: | ||||||||||||
Impairment(2) | 138,435 | 596,980 | 185,240 | |||||||||
Acquisition related amortization expense(3a) | 143,765 | 162,517 | 162,312 | |||||||||
Gain on sale of business and assets | — | (25,850 | ) | — | ||||||||
Loss on extinguishment of debt | 12,181 | — | — | |||||||||
Other, net(4) | 6,724 | 1,385 | (1,156 | ) | ||||||||
Restructuring and other costs(5) | 59,052 | 6,776 | 12,986 | |||||||||
Litigation and taxes, including penalties(6) | 39,431 | 418,622 | 21,601 | |||||||||
Stock-based compensation | 9,086 | 9,834 | 7,334 | |||||||||
Management fees(7) | 8,761 | 7,769 | 7,191 | |||||||||
Tax impact of net income adjustments | (109,829 | ) | (405,421 | ) | (80,048 | ) | ||||||
|
|
|
|
|
| |||||||
Adjusted Net Income from continuing operations | 217,151 | 150,886 | 236,166 | |||||||||
Adjustments: | ||||||||||||
Depreciation and amortization of property and equipment(3b) | 131,483 | 135,561 | 122,640 | |||||||||
Amortization of capitalized implementation costs(3c) | 35,551 | 20,855 | 11,365 | |||||||||
Amortization of upfront incentive consideration(8) | 36,649 | 36,527 | 37,748 | |||||||||
Interest expense, net | 274,689 | 232,450 | 174,390 | |||||||||
Remaining (benefit) provision for income taxes | 95,800 | 210,350 | 137,854 | |||||||||
|
|
|
|
|
| |||||||
Adjusted EBITDA | $ | 791,323 | $ | 786,629 | $ | 720,163 | ||||||
|
|
|
|
|
| |||||||
| Pro Forma | Historical | |||||||||||
| Nine Months Ended September 30, | Nine Months Ended September 30, | |||||||||||
| 2014 | 2014 | 2013 | ||||||||||
| (Amounts in thousands) | ||||||||||||
Reconciliation of net income (loss) to Adjusted Net Income and to Adjusted EBITDA: | ||||||||||||
Net income (loss) attributable to common shareholders | $ | 11,442 | $ | 11,442 | $ | (154,473 | ) | |||||
Preferred stock dividends | 11,381 | 11,381 | 27,219 | |||||||||
Loss from discontinued operations, net of tax | 44,652 | 8,017 | 20,895 | |||||||||
Net income attributable to noncontrolling interests(1) | 2,168 | 2,168 | 2,135 | |||||||||
|
|
|
|
|
| |||||||
Income (loss) from continuing operations | 69,643 | 33,008 | (104,224 | ) | ||||||||
Adjustments: | ||||||||||||
Impairment(2) | — | — | 138,435 | |||||||||
Acquisition related amortization expense(3a) | 76,741 | 83,344 | 107,955 | |||||||||
Loss on extinguishment of debt | 33,538 | 33,538 | 12,181 | |||||||||
Other, net(5) | 840 | (760 | ) | 1,099 | ||||||||
Restructuring and other costs(6) | 8,834 | 24,056 | 26,296 | |||||||||
Litigation and taxes, including penalties(7) | 11,370 | 12,497 | 31,543 | |||||||||
Stock–based compensation | 13,848 | 22,434 | 5,446 | |||||||||
Management fees(8) | 23,701 | 23,701 | 7,347 | |||||||||
Amortization of Expedia SMA incentive payments | — | 7,625 | — | |||||||||
Tax impact of net income adjustments | (65,959 | ) | (80,614 | ) | (78,131 | ) | ||||||
|
|
|
|
|
| |||||||
Adjusted Net Income from continuing operations | $ | 172,556 | $ | 158,829 | $ | 147,697 | ||||||
|
|
|
|
|
| |||||||
Adjusted Net Income from continuing operations per share | $ | 0.73 | $ | 0.67 | $ | 0.80 | ||||||
Weighted-average shares outstanding adjusted for assumed inclusion of common stock equivalents | 237,994 | 237,944 | 184,893 | |||||||||
Adjusted Net Income from continuing operations | $ | 172,556 | $ | 158,829 | $ | 147,697 | ||||||
Adjustments: | ||||||||||||
Depreciation and amortization of property and equipment(3b) | 119,609 | 122,409 | 97,687 | |||||||||
Amortization of capitalized implementation costs(3c) | 27,070 | 27,111 | 27,038 | |||||||||
Amortization of upfront incentive consideration(4) | 33,177 | 33,177 | 28,736 | |||||||||
Interest expense, net | 167,332 | 167,332 | 209,653 | |||||||||
Remaining provision (benefit) for income taxes | 121,610 | 108,492 | 73,152 | |||||||||
|
|
|
|
|
| |||||||
Adjusted EBITDA | $ | 641,354 | $ | 617,350 | $ | 583,963 | ||||||
|
|
|
|
|
| |||||||
The components of Adjusted Capital Expenditures are presented below:
| Year Ended December 31, | ||||||||||||
| 2013 | 2012 | 2011 | ||||||||||
(Amounts in thousands) | ||||||||||||
Additions to property and equipment | $ | 226,026 | $ | 193,262 | $ | 164,638 | ||||||
Capitalized implementation costs | 58,814 | 78,543 | 59,109 | |||||||||
|
|
|
|
|
| |||||||
Adjusted capital expenditures | $ | 284,840 | $ | 271,805 | $ | 223,747 | ||||||
|
|
|
|
|
| |||||||
23
| Pro Forma | Historical | |||||||||||||||||||||||
| Year Ended December 31, | Year Ended December 31, | |||||||||||||||||||||||
| 2013 | 2012 | 2011 | 2013 | 2012 | 2011 | |||||||||||||||||||
Reconciliation of net loss to Adjusted Net Income and to Adjusted EBITDA: | ||||||||||||||||||||||||
Net loss attributable to common shareholders | $ | (137,198 | ) | $ | (645,939 | ) | $ | (98,653 | ) | $ | (137,198 | ) | $ | (645,939 | ) | $ | (98,653 | ) | ||||||
Preferred stock dividends | 36,704 | 34,583 | 32,579 | 36,704 | 34,583 | 32,579 | ||||||||||||||||||
Loss from discontinued operations, net of tax | 149,696 | 394,410 | 193,873 | 7,176 | 48,947 | 23,461 | ||||||||||||||||||
Net income (loss) attributable to noncontrolling interests(1) | 2,863 | 1,519 | (14,322 | ) | 2,863 | (59,317 | ) | �� | (36,681 | ) | ||||||||||||||
|
|
|
|
|
|
|
|
|
|
|
| |||||||||||||
Income (loss) from continuing operations | 52,065 | (215,427 | ) | 113,477 | (90,455 | ) | (621,726 | ) | (79,294 | ) | ||||||||||||||
Adjustments: | ||||||||||||||||||||||||
Impairment(2) | — | 44,054 | — | 138,435 | 596,980 | 185,240 | ||||||||||||||||||
Acquisition related amortization expense(3a) | 132,685 | 129,869 | 129,235 | 143,765 | 162,517 | 162,312 | ||||||||||||||||||
Gain on sale of business and assets | — | (25,850 | ) | — | — | (25,850 | ) | — | ||||||||||||||||
Loss on extinguishment of debt | 12,181 | — | — | 12,181 | — | — | ||||||||||||||||||
Other, net(5) | 305 | 6,635 | (65 | ) | 6,724 | 1,385 | (1,156 | ) | ||||||||||||||||
Restructuring and other costs(6) | 27,921 | 5,408 | 4,578 | 59,052 | 6,776 | 12,986 | ||||||||||||||||||
Litigation and taxes, including penalties(7) | 18,514 | 396,412 | 21,601 | 39,431 | 418,622 | 21,601 | ||||||||||||||||||
Stock–based compensation | 3,387 | 4,365 | 4,088 | 9,086 | 9,834 | 7,334 | ||||||||||||||||||
Management fees(8) | 8,761 | 7,769 | 7,191 | 8,761 | 7,769 | 7,191 | ||||||||||||||||||
Tax impact of net income adjustments | (73,633 | ) | (205,501 | ) | (62,623 | ) | (109,829 | ) | (405,421 | ) | (80,048 | ) | ||||||||||||
|
|
|
|
|
|
|
|
|
|
|
| |||||||||||||
Adjusted Net Income from continuing operations | $ | 182,186 | $ | 147,734 | $ | 217,482 | $ | 217,151 | $ | 150,886 | $ | 236,166 | ||||||||||||
|
|
|
|
|
|
|
|
|
|
|
| |||||||||||||
Adjusted Net Income from continuing operations per share | $ | 0.98 | $ | 0.81 | $ | 1.20 | $ | 1.17 | $ | 0.83 | $ | 1.30 | ||||||||||||
Weighted-average shares outstanding adjusted for assumed inclusion of common stock equivalents | 184,978 | 182,830 | 181,889 | 184,978 | 182,830 | 181,889 | ||||||||||||||||||
Adjusted Net Income from continuing operations | $ | 182,186 | $ | 147,734 | $ | 217,482 | $ | 217,151 | $ | 150,886 | $ | 236,166 | ||||||||||||
Adjustments: | ||||||||||||||||||||||||
Depreciation and amortization of property and equipment(3b) | 123,414 | 96,668 | 78,867 | 131,483 | 135,561 | 122,640 | ||||||||||||||||||
Amortization of capitalized implementation costs(3c) | 34,144 | 19,439 | 11,365 | 35,551 | 20,855 | 11,365 | ||||||||||||||||||
Amortization of upfront incentive consideration(4) | 36,649 | 36,527 | 37,748 | 36,649 | 36,527 | 37,748 | ||||||||||||||||||
Interest expense, net | 274,689 | 232,450 | 174,390 | 274,689 | 232,450 | 174,390 | ||||||||||||||||||
Remaining provision (benefit) for income taxes | 127,672 | 198,594 | 129,433 | 95,800 | 210,350 | 137,854 | ||||||||||||||||||
|
|
|
|
|
|
|
|
|
|
|
| |||||||||||||
Adjusted EBITDA | $ | 778,754 | $ | 731,412 | $ | 649,285 | $ | 791,323 | $ | 786,629 | $ | 720,163 | ||||||||||||
|
|
|
|
|
|
|
|
|
|
|
| |||||||||||||
24
The following table sets forth the reconciliation of GAAP basic weighted-average common shares outstanding to the adjusted weighted-average shares outstanding for the assumed inclusion of common stock equivalents (in thousands):
| Nine Months Ended September 30, | Year Ended December 31, | |||||||||||||||||||
| 2014 | 2013 | 2013 | 2012 | 2011 | ||||||||||||||||
| (Amounts in thousands) | ||||||||||||||||||||
GAAP basic weighted-average common shares outstanding | 229,405 | 178,051 | 178,125 | 177,206 | 176,703 | |||||||||||||||
Dilutive effect of stock options and restricted stock awards | 8,589 | 6,842 | 6,853 | 5,624 | 5,186 | |||||||||||||||
|
|
|
|
|
|
|
|
|
| |||||||||||
Weighted-average common shares outstanding adjusted for assumed inclusion of common stock equivalents | 237,994 | 184,893 | 184,978 | 182,830 | 181,889 | |||||||||||||||
|
|
|
|
|
|
|
|
|
| |||||||||||
| (1) | Net income (loss) attributable to non-controlling interests represents an adjustment to include earnings allocated to non-controlling interest held in (i) Sabre Travel Network Middle East of 40% for all periods presented, (ii) Sabre Australia Technologies I Pty Ltd (“Sabre Pacific”) of 49% through February 24, 2012, the date we sold this business, |
| (2) | Represents impairment charges to assets (see Note 7, Goodwill and Intangible Assets, to our audited consolidated financial statements included elsewhere in this prospectus) as well as $24 million in 2012, representing our share of impairment charges recorded by one of our equity method investments, Abacus. |
| (3) | Depreciation and amortization expenses (see Note 2, Summary of Significant Accounting Policies, to our audited consolidated financial statements included elsewhere in this prospectus for associated asset lives): |
| a. | Acquisition related amortization represents amortization of intangible assets from the take-private transaction in 2007 as well as intangibles associated with acquisitions since that date and amortization of the excess basis in our underlying equity in joint ventures. |
| b. | Depreciation and amortization of property and equipment |
| c. | Amortization of capitalized implementation costs represents amortization of upfront costs to implement new customer contracts under our SaaS and hosted revenue model. |
| (4) |
| Our Travel Network business at times provides upfront incentive consideration to travel agency subscribers at the inception or modification of a service contract, which are capitalized and amortized to cost of revenue over an average expected life of the service contract, generally over three to five years. Such consideration is made with the objective of increasing the number of clients or to ensure or improve customer loyalty. Such service contract terms are established such that the supplier and other fees generated over the life of the contract will exceed the cost of the incentive consideration provided upfront. Such service contracts with travel agency subscribers require that the customer commit to achieving certain economic objectives and generally have terms requiring repayment of the upfront incentive consideration if those objectives are not met. |
| (5) | Other, net primarily represents foreign exchange gains and losses related to the remeasurement of foreign currency denominated balances included in our consolidated balance sheets into the relevant functional currency. |
| (6) | Restructuring and other costs represents charges associated with business restructuring and associated changes implemented which resulted in severance benefits related to employee terminations, integration and facility opening or closing costs and other business reorganization costs. |
25
| (7) | Litigation settlement and tax payments for certain items represent charges or settlements associated with airline antitrust litigation as well as payments or reserves taken in relation to certain retroactive hotel occupancy and excise tax disputes (see Note 13, Contingencies, to our unaudited consolidated financial statements and Note 20, Commitments and Contingencies, to our audited consolidated financial statements included elsewhere in this prospectus). |
| (8) | We paid an annual management fee to TPG and Silver Lake in an amount between (i) $5 million and (ii) $7 million, the actual amount of which was calculated based upon 1% of Adjusted EBITDA, as defined in the management services agreement (the “MSA”), earned by the company in such fiscal year up to a maximum of $7 million. In addition, the MSA provided for the reimbursement of certain costs incurred by TPG and Silver Lake, which are included in this line item. In connection with our initial public offering, we paid to TPG and Silver Lake, in the aggregate, a $21 million fee pursuant to the MSA. The MSA was terminated at the completion of our initial public offering. |
26
Investing in our common stock involves a high degree of risk. We have disclosed all known, material risks associated with an investment in our common stock in the risk factors described below. If any of the risks described below actually occur, our business, financial condition and results of operations could be materially and adversely affected. In such case, the trading price of our common stock could decline and you may lose all or part of your investment. You should carefully consider all the information in this prospectus, including the risks and uncertainties described below, before making an investment decision.
Risks Related to Our Business and Industry
Our revenue is highly dependent on transaction volumes in the global travel industry, particularly air travel transaction volumes.
Although for the year ended December 31, 2013, 94% and 84% of our Travel Network and Airline and Hospitality Solutions revenue, respectively, was Recurring Revenue in that it is largely tied to travel suppliers’ transaction volumes rather than to their unit pricing for an airplane ticket, hotel room or other travel product (see “Method of Calculation”), this revenue is generally not contractually committed to recur annually under our agreements with our travel suppliers. As a result, our revenue is highly dependent on the global travel industry, particularly air travel from which we derive a substantial amount of our revenue, and directly correlates with global travel, tourism and transportation transaction volumes. For example, the terrorist attacks of September 11, 2001, the most recent global economic downturn and the U.S. government sequestration that began in 2013 significantly affected and may continue to affect travel volumes worldwide and had a significant impact on our business during the relevant reporting periods. Our revenue is therefore highly susceptible to declines in or disruptions to leisure and business travel that may be caused by factors entirely out of our control, and therefore may not recur if these declines or disruptions occur.
Various factors may cause temporary or sustained disruption to leisure and business travel. The impact such disruptions would have on our business depends on the magnitude and duration of such disruption. These factors include, among others:
Our Travel Network business and our Airline and Hospitality Solutions business depend on maintaining and renewing contracts with their customers and other counterparties.counterparties.
In our Travel Network business, we enter into participating carrier distribution and services agreements with airlines. Our contracts with major carriers typically last for three to five year terms and are generally subject to automatic renewal at the end of the term, unless terminated by either party with the required advance notice. Our contracts with smaller airlines generally last for one year and are also subject to automatic renewal at the end of
the term, unless terminated by either party with the required advance notice. Airlines are not contractually obligated to distribute exclusively through our GDS during the contract term and may terminate their agreements
27
with us upon providing the required advance notice after the expiration of the initial term. We haverenewed 24 out of 24 planned renewals in 2013 (representing approximately 25% of our Travel Network revenue for the twelve months ended December 31, 2013). We renewed 28 out of 28 planned renewals in 2014 (representing approximately 22% of our Travel Network revenue for the yeartwelve months ended December 31, 2013) and 242014). We have 38 planned renewals in 2015 (representing approximately 5%20% of our Travel Network revenue for the yeartwelve months ended December 31, 2013), assuming we reach multi-year agreements for the contracts expected to be renewed in 2014.2014). Although we renewed 2428 out of 2428 planned renewals in 20132014 (representing approximately 25%22% of Travel Network revenue for the year ended December 31, 2013)2014), we cannot guarantee that we will be able to renew our airline contracts in the future on favorable economic terms or at all.
We also enter into contracts with travel buyers. Although most of our travel buyer contracts have terms of one to three years, we typically havenon-exclusive, five to ten year contracts with our major travel agency customers. We also typically have three to five year contracts with corporate travel departments, which generally renew automatically unless terminated with the required advance notice. A meaningful portion of our travel buyer agreements, typically representing approximately 15% to 20% of our bookings, are up for renewal in any given year. We cannot guarantee that we will be able to renew our travel buyer agreements in the future on favorable economic terms or at all.
Similarly, our Airline and Hospitality Solutions business is based on contracts with travel suppliers for a typical duration of three to seven years for airlines and one to five years for hotels. As of December 31, 2013, we had contracts with approximately 225 airlines for the provision of one or more of our airline solutions. Although airlineAirline reservations contracts representing less than 5% of Airline Solutions’ 2013expected 2014 revenue are scheduled for renewal in each of 20142015 and 2015, airline reservationsreservation contracts representing approximately 10%2% of Airline Solutions’ 2013Solutions expected 2014 revenue are scheduled for renewal in each2016. Airline reservations contracts representing approximately 9% of 2016 andAirline Solutions’ expected 2014 revenue are scheduled for renewal in 2017. Hospitality Solutions contract renewals are relatively evenly spaced, with approximatelyone-third of contracts representing approximatelyone-third of Hospitality Solutions’ 2013 revenue coming up for renewal in any given year. We cannot guarantee that we will be able to renew our solutions contracts in the future on favorable economic terms or at all.
Additionally, we use severalthird-party distributor partners and four joint ventures to extend our GDS services in APAC and EMEA. The termination of our contractual arrangements with any suchthird-party distributor partners and joint ventures could adversely impact our Travel Network business in the relevant markets. See “Business—Our Businesses—Travel Network—Geographic Scope” and “—We rely onthird-party distributor partners and joint ventures to extend our GDS services to certain regions, which exposes us to risks associated with lack of direct management control and potential conflicts of interest” for more information on our relationships with ourthird-party distributor partners and joint ventures.
Our failure to renew some or all of these agreements on economically favorable terms or at all, or the early termination of these existing contracts, would adversely affect the value of our Travel Network business as a marketplace due to our limited content and distribution reach, which could cause some of our subscribers to move to a competing GDS or use other travel technology providers for the solutions we provide and would materially harm our business, reputation and brand. Our business therefore relies on our ability to renew our agreements with our travel buyers, travel suppliers,third-party distributor partners and joint ventures or developing relationships with new travel buyers and travel suppliers to offset any customer losses.
We are subject to a certain degree of revenue concentration among a portion of our customer base. Our topThe five largest travel buyers of Travel Network customers were responsible for bookings that represented approximately 32% of our Travel Network revenue for the nine months ended September 30, 2014, and 32% and 36% of our Travel Network revenue for the years ended December 31, 2013 and December 31, 2012, respectively. Over the same period, ourOur top five Airline and Hospitality Solutions customers represented 24% of our Airline and Hospitality Solutions revenue for the nine months ended September 30, 2014, and 22% and 20% of our Airline and Hospitality Solutions revenues,revenue for the years ended December 31, 2013 and 2012, respectively. Because of this concentration among a small number of customers, if an event were to adversely affect one of these customers, it would have a material impact on our business.
28
Our Travel Network business is exposed to pricing pressure from travel suppliers.
Travel suppliers continue to look for ways to decrease their costs and to increase their control over distribution. For example, the consolidation in the airline industry and the recent economic downturn, among other factors, have driven some airlines to negotiate for lower fees during contract renegotiations, thereby exerting increased pricing pressure on our Travel Network business, which, in turn, negatively affects our revenues and margins. In addition, travel suppliers’ use of alternative distribution channels, such as direct distribution throughsupplier-operated websites, may also adversely affect our contract renegotiations with these suppliers and negatively impact our transaction fee revenue. For example, as we attempt to renegotiate new agreements with our travel suppliers, they may withhold some or all of their content (fares and associated economic terms) for distribution exclusively through their direct distribution channels (for example, the relevant airline’s website) or offer travelers more attractive terms for content available through those direct channels after their contracts expire. As a result of these sources of negotiating pressure, we may have to decrease our prices to retain their business. If we are unable to renew our contracts with these travel suppliers on similar economic terms or at all, or if our ability to provide such content is similarly impeded, this would also adversely affect the value of our Travel Network business as a marketplace due to our more limited content. See “—Travel suppliers’ use of alternative distribution models, such as direct distribution models, could adversely affect our Travel Network and Travelocity businesses.”
Our Travel Network business depends on relationships with travel buyers.
Our Travel Network business relies on relationships with several large travel buyers, including TMCs and online travel agencies (“OTAs”), to generate a large portion of its revenue through bookings made by these travel companies. Although no individual travel buyer accounts for more than 10% of our Travel Network revenue, the five largest travel buyers of our Travel Network business were responsible for bookings that represented approximately 32% of our Travel Network revenue for the nine months ended September 30, 2014, and 32% and 36% of our Travel Network revenue for the years ended December 31, 2013 and 2012, respectively. Such revenue concentration in a relatively small number of travel buyers makes us particularly dependent on factors affecting those companies. For example, if demand for their services decreases, or if a key supplier pulls its content from us, travel buyers may stop utilizing our services or move all or some of their business to competitors or competing channels. Furthermore, one of our major TMC customers, American Express, closed an agreement at the end of the second quarter of 2014 with an investor group to create a joint venture relating to its global travel division. In 2013, we derived less than 10% of our Travel Network revenue from bookings made by American Express. Our contracts with American Express remain in effect, and we continue to evaluate what effects, if any, this transaction may have on our future relationship with American Express and this new joint venture.
Although our contracts with larger travel agencies often increase the incentive consideration when the travel agency processes a certain volume or percentage of its bookings through our GDS, travel buyers are not contractually required to book exclusively through our GDS during the contract term. Travel buyers may shift bookings to other distribution intermediaries for many reasons, including to avoid becoming overly dependent on a single source of travel content or to increase their bargaining power with GDS providers. For example, Expedia shifted a significant portion of its business from Travel Network to a competitor GDS in late 2012, resulting in ayear-over-year decline in our transaction volumes and revenue in 2013. Additionally, some regulations allow travel buyers to terminate their contracts earlier. For example, according to European GDS regulations, small travel buyers may terminate a contract with a GDS vendor on three months’ notice after the first year of the contract.
These risks are exacerbated by increased consolidation among travel agencies and TMCs, which may ultimately reduce the pool of travel agencies that subscribe to GDSs. We must compete with other GDSs and other competitors for their business by offering competitive upfront incentive consideration, which, due to the strong bargaining power of these large travel buyers, tend to increase in each round of contract renewals. See “Management’s Discussion and Analysis of Financial Condition and Results of Operations—Factors Affecting
29
our Results—Results and Comparability—Increasing travel agency incentive consideration” for more information about our incentive consideration. However, any reduction in transaction fees from travel suppliers due to supplier consolidation or other market forces could limit our ability to increase incentive consideration to travel agencies in acost-effective manner or otherwise affect our margins.
Our travel supplier customers may experience financial instability or consolidation, pursue cost reductions, change their distribution model or undergo other changes.
We generate the majority of our revenue and accounts receivable from airlines, with approximately 66% and 65%, respectively, of our revenue for the years ended December 31, 2013 and 2012, and 58% of our trade accounts receivable attributable to these customers as of both December 31, 2013 and December 31, 2012. We also derive revenue from hotels, car rental brands, rail carriers, cruise lines, tour operators and other suppliers in the travel and tourism industries. Adverse changes in any of these relationships or the inability to enter into new relationships could negatively impact the demand for and competitiveness of our travel products and services. For example, a lack of liquidity in the capital markets or weak economic performance may cause our travel suppliers to increase the time they take to pay or to default on their payment obligations, which could lead to a higher level of bad debt expense and negatively affect our results. We regularly monitor the financial condition of the air transportation industry and have noted the financial difficulties faced by several air carriers. Anylarge-scale bankruptcy or other insolvency proceeding of an airline or hospitality supplier could subject our agreements with that customer to rejection or early termination. Because we generally do not require security or collateral from our customers as a condition of sale, our revenues may be subject to credit risk more generally.
Furthermore, supplier consolidation, particularly in the airline industry, could harm our business. Our Travel Network business depends on a relatively small number ofU.S.-based airlines for a substantial portion of its revenue, and all of our businesses are highly dependent on airline ticket volumes. Consolidation among airlines, including the recent consolidation of Southwest Airlines with AirTran Airways and American Airlines with US Airways, could result in the loss of an existing customer and the related fee revenue, decreased airline ticket volumes due to capacity restrictions implemented concurrently with the consolidation, and increased airline concentration and bargaining power to negotiate lower transaction fees. For example, the consolidation of American Airlines with US Airways could adversely affect our business if future contract negotiations with the merged entity result in adverse changes compared to our existing relationships with these two airlines. These adverse changes may include, but are not limited to, renegotiated distribution or solutions contracts that contain less favorable terms to us or the loss of such contracts entirely. In addition, consolidation among travel suppliers may result in one or more suppliers refusing to provide certain content to Sabre but rather making it exclusively available on the suppliers’ proprietary websites, hurting the competitive position of our GDS relative to those websites. See “—Travel suppliers’ use of alternative distribution models, such as direct distribution models, could adversely affect our Travel Network and Travelocity businesses.”
Our business could be harmed by adverse global and regional economic and political conditions.
Travel expenditures are sensitive to personal and business discretionary spending levels and grow more slowly or decline during economic downturns. We derive the majority of our revenue from the United States and Europe, approximately 58% and 16%, respectively, for the year ended December 31, 2013, and 62% and 16%, respectively, for the year ended December 31, 2012. Our geographic concentration in the United States and Europe makes our business particularly vulnerable to economic and political conditions that adversely affect business and leisure travel originating in or traveling to these countries.
For example, beginning in December 2007, there was a rapid deterioration of the U.S. economy and several countries in Europe began experiencing worsening credit and economic conditions. The U.S. and certain European governments are still operating at large financial deficits, which has contributed to the challenging macroeconomic conditions and the struggling economic recovery. This resulted in a significant decline in travel to the extent that these challenging macroeconomic conditions affect personal and business discretionary
30
spending on travel. MostMore recently, the shutdown of the U.S. government and the continued U.S. government sequestration affected and in the case of the U.S. governmental sequestration continues to affect, government andgovernment-related travel throughout the United States. Because a large number of our travel buyer subscribers book travel on behalf of the U.S. government, our Travel Network business has been more negatively impacted than that of our competitors. Moreover, the increase in the Transportation Security Agency security
charge in the recent U.S. federal budget deal will likely increase airline ticket prices, which may result in decreased travel volumes and may negatively affect our business.
Despite signs of gradual recovery, there is still weakness in parts of the global economy, including increased unemployment, reduced financial capacity of both business and leisure travelers, diminished liquidity and credit availability, declines in consumer confidence and discretionary income and general uncertainty about economic stability. We cannot predict the magnitude, length or recurrence of recessionary economic patterns, which have impacted, and may continue to impact, demand for travel and lead to reduced spending on the services we provide.
We derive the remainder of our revenues primarily from APAC, Latin America and MEA, where political instability and regulatory uncertainty is significantly higher than in Europe and the United States. Any unfavorable economic, political or regulatory developments in those regions could negatively affect our business, such as delays in payment ornon-payment of contracts, delays in contract implementation or signing, carrier control issues and increased costs from regulatory changes particularly as parts of our growth strategy involve expanding our presence in these emerging markets. For example, the Russian economy has recently been negatively impacted by economic sanctions and the declining price of oil. These adverse economic conditions may negatively impact our business results in that region.
As an additional example, Venezuela has imposed currency controls, including volume restrictions on the conversion of bolivars to U.S. dollars, which impact the ability of certain of our airline customers operating in the country to obtain U.S. dollars to make timely payments to us. Consequently, the collection of accounts receivable due to us can be, and has been, delayed. Due to the nature of this delay, we have recorded specific reserves against all outstanding balances due to us and are deferring the recognition of any future revenues effective January 1, 2014 until cash is collected in accordance with our policies. Accordingly, our accounts receivable are subject to a general collection risk, as there can be no assurance that we will be paid from such customers in a timely manner, if at all. We collected approximately $14 million of accounts receivable due to us during the nine months ended September 30, 2014, and had $9 million of accounts receivable outstanding as of September 30, 2014, which will be recognized as revenue when cash is received. We collected an additional $7 million of accounts receivable due to us from October to December 2014. In January 2014, Venezuela announced a dual-foreign exchange rate system, which has effectively devalued the local currency and subjected airlines to an exchange rate for U.S. dollars available at auctions that has been significantly higher than the official exchange rate. In conjunction with the political and economic uncertainty in Venezuela, demand for travel by local consumers has declined. Certain airlines have scaled back operations in response to the reduced demand as well as the currency controls which has impacted our airline customers in Venezuela. As a result, our revenues derived from our Venezuelan operations in 2014 were reduced as compared to our revenues for 2013. During the year ended December 31, 2013, we derived 1% of our total revenue from our airline customers operating in Venezuela.
Travel suppliers’ use of alternative distribution models, such as direct distribution models, could adversely affect our Travel Network and Travelocity businesses.
Some travel suppliers that provide content to Travel Network and Travelocity, including some of Travel Network’s largest airline customers, have sought to increase usage of direct distribution channels. For example, these travel suppliers are trying to move more consumer traffic to their proprietary websites, and some travel suppliers have explored direct connect initiatives linking their internal reservations systems directly with travel agencies or TMCs, thereby bypassing the GDSs. This direct distribution trend enables them to apply pricing pressure on intermediaries and negotiate travel distribution arrangements that are less favorable to intermediaries.
31
With travel suppliers’ adoption of certain technology solutions over the last decade, including those offered by our Airline and Hospitality Solutions business, air travel suppliers have increased the proportion of direct bookings relative to indirect bookings. Although we believe the rate at which bookings are shifting from indirect to direct distribution channels in the United States has stabilized at very low levels in 2012 and 2013, we cannot predict whether this low rate of shift will continue. In the future, airlines may increase their use of direct distribution, which may cause a material decrease in their use of our GDS. Travel suppliers may also offer travelers advantages through their websites such as special fares and bonus miles, which could make their offerings more attractive than those available through our GDS platform. For example, in 2010 American Airlines announced its “Boarding and Flexibility” package which, according to American Airlines, provided additional benefits to travelers who book their airline tickets directly through their website.
In addition, with respect to ancillary products, travel suppliers may choose not to comply with the technical standards that would allow ancillary products to be immediately distributed via intermediaries, thus resulting in a delay before these products become available through our GDS relative to availability through direct distribution. For example, airlines have been “unbundling” from base airfares various ancillary products such as food and beverage, checked baggage andpre-reserved seats, and the recent SITA Survey shows that the vast majority of ancillary revenues are earned through direct sales channels, such as the airline website. In addition, if enough travel suppliers choose not to develop ancillary products in a standardized way with respect to technical standards our investment in adapting our various systems to enable the sale of ancillary products may not be successful. Similarly, some airlines have also further limited the type of fare content information that is distributed through OTAs, including Travelocity.
Companies with close relationships with end consumers, like Facebook, as well as new entrants introducing new paradigms into the travel industry, such as metasearch engines, may promote alternative distribution channels to our GDS by diverting consumer traffic away from intermediaries. For example, Google acquired ITA Software, a flight information software company that provides air shopping capabilities, and launched Google Flights and Google Hotel Finder in 2011. If Google Hotel Finder changes its model to bypass GDS and OTA
intermediaries by referring consumers to direct hotel distribution channels or if Google Flights, which already refers customers directly to airline websites, becomes a more popular way to shop and book travel, our GDS and OTA businesses may be adversely affected.
Additionally, technological advancements may allow airlines and hotels to facilitate broader connectivity to and integration with large travel buyers, such that certain airline and hotel offerings could be made available directly to such travel buyers without the involvement of intermediaries such as Travel Network and its competitors.
We rely onthird-party distributor partners and joint ventures to extend our GDS services to certain regions, which exposes us to risks associated with lack of direct management control and potential conflicts of interest.
Our Travel Network business utilizesthird-party distributor partners and joint ventures to extend our GDS services in APAC and EMEA. We work with these partners to establish and maintain commercial and customer service relationships with both travel suppliers and travel buyers. Since we do not exercise management control over theirday-to-day operations, the success of their marketing efforts and the quality of the services they provide are beyond our control. If these partners do not meet our standards for distribution, our reputation may suffer materially, and sales in those regions could decline significantly. Any interruption in thesethird-party services, deterioration in their performance or termination of our contractual arrangements with them could negatively impact our ability to extend our GDS services in the relevant markets.
In addition, our business may be harmed due to potential conflicts of interest with our joint venture partners. Large regional airlines collectively control a majority of the outstanding equity interests in our Abacus joint venture, aSingapore-based distribution provider that serves the APAC region. As travel suppliers, these airlines’
32
interests differ from our Travel Network business’ interests as a distribution intermediary. For example, the airline owners may not agree to provide incentive consideration to travel agencies at the same rate as our GDS competitors. Subject to some exceptions, we are also prohibited from competing with Abacus by directly or indirectly engaging in the GDS business in Asia, Australia, New Zealand and certain Pacific islands.
The travel distribution market is highly competitive, and we are subject to competition from other GDS providers, direct distribution by travel suppliers and new entrants or technologies that may challenge the GDS business model.
The evolution of the global travel and tourism industry, the introduction of new technologies and standards and the expansion of existing technologies in key markets, among other factors, could contribute to an intensification of competition in the business areas and regions in which we operate. Increased competition could require us to increase spending on marketing activities or product development, to decrease our booking or transaction fees and other charges (or defer planned increases in such fees and charges), to increase incentive consideration or take other actions that could harm our business. A GDS has two broad categories of customers: (i) travel suppliers, such as airlines, hotels, car rental brands, rail carriers, cruise lines and tour operators, and (ii) travel buyers, such as online and offline travel agencies, TMCs and corporate travel departments. The competitive positioning of a GDS depends on the success it achieves with both customer categories. Other factors that may affect the competitive success of a GDS include the comprehensiveness, timeliness and accuracy of the travel content offered, the reliability, ease of use and innovativeness of the technology, the incentive consideration provided to travel agencies, the transaction fees charged to travel suppliers and the range of products and services available to travel suppliers and travel buyers. Our GDS competitors could seek to capture market share by offering more differentiated content, products or services, increasing the incentive consideration to travel agencies, or decreasing the transaction fees charged to travel suppliers, which would harm our business to the extent they gain market share from us or force us to respond by lowering our prices or increasing the incentive consideration we provide.
Our Travel Network business principally faces competition from:
��
We cannot guarantee that we will be able to compete successfully against our current and future competitors in the travel distribution market, some of which may achieve greater brand recognition than us, have greater financial, marketing, personnel and other resources or be able to secure services and products from travel suppliers on more favorable terms. If we fail to overcome these competitive pressures, we may lose market share and our business may otherwise be negatively affected.
Our ability to maintain and grow our Airline and Hospitality Solutions business may be negatively affected by competition from otherthird-party solutions providers and new participants that seek to enter the solutions market.
Our Airline and Hospitality Solutions business principally faces competition from existingthird-party solutions providers. For our Airline Solutions business, these competitors include (i) Amadeus, our closest
33
competitor in terms of size and breadth, (ii) traditional technology companies, such asHewlett-Packard (“HP”), Unisys and Navitaire (a division of Accenture), and (iii) airline industry participants, such as Jeppesen (a division of Boeing), Lufthansa Systems, and SITA. We also compete with various point solutions providers, such as PROS, ITA Software, Datalex and Travelport, on a more limited basis in several discrete functional areas. For our Hospitality Solutions business, we face competition across many aspects of our business but our primary competitors are in the hospitality CRS and Property Management Systems (“PMSs”) fields, including MICROS, TravelClick, Pegasus and Trust, among others. Although new entrants specializing in a particular type of software occasionally enter the solutions market, they typically focus on emerging or evolving business problems, niche solutions or small regional customers.
Factors that may affect the competitive success of our Airline and Hospitality Solutions business include our pricing structure, our ability to keep pace with technological developments, the effectiveness and reliability of our implementation and system migration processes, our ability to meet a variety of customer specifications, the effectiveness and reliability of our systems, the cost and efficiency of our system upgrades and our customer support services. Our failure to compete effectively on these and other factors could decrease our market share and negatively affect our Airline and Hospitality Solutions business.
The recently signed strategic marketing agreement with Expedia may not be successfully implemented or may not result in the benefits anticipated by the parties.
In August 2013, Travelocity entered into an exclusive, long-term strategic marketing agreement with Expedia, which was recently amended and restated in March 2014 to reflect changed commercial terms. Under the Expedia SMA, Expedia will power the technology platforms for Travelocity’s U.S. and Canadian websites as well as provide Travelocity with access to Expedia’s supply and customer service platforms. Both parties began development and implementation of this arrangement after signing the Expedia SMA. As of December 31, 2013,
the majority of the online hotel and air offering has been migrated to the Expedia platform, and a launch of the majority of the remainder is expected in early 2014. See “Business—Our Businesses—Travelocity.” If we do not implement the Expedia SMA on the expected schedule, we are subject to a number of risks:
Moreover, we are still subject to a number of post-implementation risks. Our success is dependent on many factors, including:
��
The Expedia SMA requires us to guarantee Travelocity’s indemnification obligations for liabilities that may arise out of certain litigation matters, which may materially adversely affect our cash flows. Our financial condition may also be harmed if Expedia does not pay us in a timely manner for our share of the performance-based marketing fee.
Expedia is required to use our GDS for shopping and booking of the air travel booked through Travelocity.com and Travelocity.ca until 2019, at which time it may choose to use another intermediary for a portion or all of such air travel, subject to earlier termination under certain circumstances. We do not expect that Expedia will use Travel Network for shopping and booking of a portion of non-air travel for Travelocity.com and Travelocity.ca after the launch of the Expedia SMA.
Although the term of the amended and restated Expedia SMA is nine years and automatically renews under certain conditions, the agreement may be terminated by Expedia upon the occurrence of certain events, some of which are outside our control, including, among others, (i) failure to meet minimum revenue amounts, (ii) the occurrence of a material adverse effect, and (iii) force majeure. The early termination of this agreement may result in a significant impact on our earnings.
As part of our negotiations to amend and restate the Expedia SMA, we also agreed to a separate put/call agreement with Expedia that supersedes the previous put/call arrangement (the new put/call agreement, the “Expedia Put/Call”), whereby Expedia may acquire, or we may sell to Expedia, certain assets relating to the Travelocity business. Our put right may be exercised during the first 24 months of the Expedia Put/Call only upon the occurrence of certain triggering events primarily relating to implementation, which are outside of our control. The occurrence of such events is not considered probable. During this period, the amount of the put right is fixed. After the 24 month period, the put right is only exercisable for a limited period of time in 2016 and 2017 at a discount to fair market value. The call right held by Expedia is exercisable at any time during the term of the Expedia Put/Call. If the call right is exercised, although we expect the amount paid will be fair value, the call right provides for a floor for a limited time that may be higher than fair value and a ceiling for the duration of the Expedia Put/Call that may be lower than fair value. In any case, we would no longer benefit from the financial performance of Travelocity in future periods.
Implementation of software solutions often involves a significant commitment of resources, and any failure to deliver as promised on a significant implementation could adversely affect our business.
In our Travel Network business and our Airline and Hospitality Solutions business, the implementation of software solutions often involves a significant commitment of resources and is subject to a number of significant risks over which we may or may not have control. These risks include:
As a result of these and other risks, some of our customers may incur large, unplanned costs in connection with the purchase and installation of our software products. Also, implementation projects could take longer than planned or fail. We may not be able to reduce or eliminate protracted installation or significant additional costs. Significant delays or unsuccessful customer implementation projects could result in claims from customers, harm our reputation and negatively impact our operating results.
We use open source software in our solutions that may subject our software solutions to general release or require us to re-engineer our solutions.
We use open source software in our solutions and may use more open source software in the future. From time to time, there have been claims by companies claiming ownership of software that was previously thought to be open source and that was incorporated by other companies into their products. As a result, we could be subject to suits by parties claiming ownership of what we believe to be open source software. Some open source licenses contain requirements that we make available source code for modifications or derivative works we create based upon the open source software and that we license such modifications or derivative works under the terms of a particular open source license or other license granting third parties certain rights of further use. If we combine or, in some cases, link our proprietary software solutions with or to open source software in a certain manner, we could, under certain of the open source licenses, be required to release the source code of our proprietary software solutions or license such proprietary solutions under the terms of a particular open source license or other license granting third parties certain rights of further use. In addition to risks related to license requirements, usage of open source software can lead to greater risks than use of third-party commercial software, as open source licensors generally do not provide warranties or controls on origin of the software. In addition, open source license terms may be ambiguous and many of the risks associated with usage of open source cannot be eliminated, and could, if not properly addressed, negatively affect our business. If we were found to have inappropriately used open source software, we may be required to seek licenses from third parties in order to continue offering our software, to re-engineer our solutions, to discontinue the sale of our solutions in the event re-engineering cannot be accomplished on a timely basis or take other remedial action that may divert resources away from our development efforts, any of which could adversely affect our business, operating results and financial condition.
We rely on the availability and performance of information technology services provided by third parties, including HP, which manages a significant portion of our systems.
Our businesses are largely dependent on the computer data centers and network systems operated for us by HP. We also rely on other developers and service providers to maintain and support our global telecommunications infrastructure, including to connect our computer data center and call centers to end-users.
Our success is dependent on our ability to maintain effective relationships with these third-party technology and service providers. Some of our agreements with third-party technology and service providers are terminable for cause on short notice and often provide limited recourse for service interruptions. For example, our agreement with HP provides us with limited indemnification rights. We could face significant additional cost or business disruption if:
Our OTAs are subject to a number of risks specific to their activities.
Our OTAs are subject to certain risks inherent in the consumer-facing OTA industry. Notwithstanding the Expedia SMA, Travelocity will continue to be exposed to these risks because its revenue stream is largely dependent upon Expedia’s performance. These risks include, but are not limited to, the following:
We rely on the value of our brands, which may be damaged by a number of factors, some of which are out of our control.
We believe that maintaining and expanding our portfolio of product and service brands are important aspects of our efforts to attract and expand our customer base, particularly for our OTA business. Our brands may be negatively impacted by, among other things, unreliable service levels from third-party providers, customers’ inability to properly interface their applications with our technology, the loss or unauthorized disclosure of personal data or other bad publicity due to litigation, regulatory concerns or otherwise relating to our business. Any inability to maintain or enhance awareness of our brands among our existing and target customers could negatively affect our current and future business prospects.
For example, awareness, perceived quality and perceived differentiated attributes of our OTA brands, especially Travelocity, are important aspects of our efforts to attract and expand the number of travelers who use our OTA websites and mobile apps. We are responsible for marketing and retailing capabilities for our OTAs, such as building brand awareness and customer relationships and working on customer acquisition and customer analytics. There is an inherent level of risk associated with our marketing investments such that we could fail to attract new or repeat travelers to our websites or mobile apps in a cost-effective manner and may not be able to convert a sufficient portion of these visitors into booking customers.
Any inability or failure to adapt to technological developments or the evolving competitive landscape could harm our business operations and competitiveness.
We depend upon the use of sophisticated information technology and systems. See “Business—Research, Development and Technology.” Our competitiveness and future results depend on our ability to maintain and make timely and cost-effective enhancements, upgrades and additions to our products, services, technologies and
systems in response to new technological developments, industry standards and trends and customer demands. For example, we currently utilize mainframe infrastructure technology for certain of our enterprise applications and platforms due to its ability to provide the reliability and scalability we require for our complex technological operations. Although we believe that IBM, currently the only provider of this technology, is committed to investing in mainframes, the number of users and programmers able to service this technology is decreasing. We may eventually have to migrate to another business environment, which could cause us to incur substantial costs, result in instability and business interruptions and materially harm our business.
Adapting to new technological and marketplace developments, such as IATA’s proposed new distribution capability (“NDC”), may require substantial expenditures and lead time and we cannot guarantee that projected future increases in business volume will actually materialize. We may experience difficulties that could delay or prevent the successful development, marketing and implementation of enhancements, upgrades and additions. Moreover, we may fail to maintain, upgrade or introduce new products, services, technologies and systems as quickly as our competitors or in a cost-effective manner. For example, we must constantly update our GDS with new capabilities to adapt to the changing technological environment and customer needs. However, this process can be costly and time-consuming, and our efforts may not be successful as compared to our competitors in the travel distribution market. Those that we do develop may not achieve acceptance in the marketplace sufficient to generate material revenue or may be rendered obsolete or non-competitive by our competitors’ offerings. For example, Microsoft is currently developing Travel 2015, a trip-planning tool that uses predictive modeling to anticipate travelers’ preferred flight options, which may become a significant competitor to our TripCase mobile app. Also, Concur Technologies’ TripLink, which captures travel reservations information regardless of the channel on which bookings were made, has the potential to evolve and pose a significant risk to our Travel Network business.
In addition, our competitors are constantly increasing their product and service offerings through organic research and development or through strategic acquisitions. For example, Amadeus recently acquired Hitit Computer Services, an airline customer relationship management (“CRM”) and loyalty solutions provider. This allows Amadeus to maintain a relationship with Etihad Airways and Virgin Australia, customers that have recently migrated to our Sabre reservations platform. More recently, Amadeus also acquired Newmarket International, a hotel IT solutions provider, which will allow Amadeus to broaden its portfolio of supplier solutions. As a result, we must continue to invest significant resources in research and development in order to continually improve the speed, accuracy and comprehensiveness of our services and we may be required to make changes to our technology platforms or increase our investment in technology, increase marketing, adjust prices or business models and take other actions, which could affect our financial performance and liquidity.
Our success depends on maintaining the integrity of our systems and infrastructure, which may suffer from failures, capacity constraints, business interruptions and forces outside of our control.
We may be unable to maintain and improve the efficiency, reliability and integrity of our systems. Unexpected increases in the volume of our business could exceed system capacity, resulting in service interruptions, outages and delays. Such constraints can also lead to the deterioration of our services or impair our ability to process transactions. We occasionally experience system interruptions that make certain of our systems unavailable including, but not limited to, our GDS and the services that our Airline and Hospitality Solutions business provides to airlines and hotels. For example, in August 2013, we experienced a significant outage of the Sabre platform due to a failure on the part of one of our service providers. This outage lasted a number of hours and caused significant problems for our customers. System interruptions may prevent us from efficiently providing services to customers or other third parties, which could cause damage to our reputation and result in our losing customers and revenues or cause us to incur litigation and liabilities. Although we have contractually limited our liability for damages caused by outages of our GDS (other than damages caused by our gross negligence or willful misconduct), we cannot guarantee that we will not be subject to lawsuits or other claims for compensation from our customers in connection with such outages for which we may not be indemnified or compensated.
Our systems may also be susceptible to external damage or disruption. Much of the computer and communications hardware upon which we depend is located across multiple data center facilities in a single geographic region. Our systems could be damaged or disrupted by power, hardware, software or telecommunication failures, human errors, natural events including floods, hurricanes, fires, winter storms, earthquakes and tornadoes, terrorism,break-ins, hostilities, war or similar events. Computer viruses, denial of service attacks, physical or electronicbreak-ins and similar disruptions affecting the Internet, telecommunication services or our systems could cause service interruptions or the loss of critical data, and could prevent us from providing timely services. Failure to efficiently provide services to customers or other third parties could cause damage to our reputation and result in the loss of customers and revenues, significant recovery costs or litigation and liabilities. Moreover, such risks are likely to increase as we expand our business and as the tools and techniques involved become more sophisticated.
Although we have implemented measures intended to protect certain systems and critical data and provide comprehensive disaster recovery and contingency plans for certain customers that purchase this additional protection, these protections and plans are not in place for all systems. Furthermore, several of our existing critical backup systems are located in the same metropolitan area as our primary systems and we may not have sufficient disaster recovery tools or resources available, depending on the type or size of the disruption. Disasters affecting our facilities, systems or personnel might be expensive to remedy and could significantly diminish our reputation and our brands, and we may not have adequate insurance to cover such costs.
34
Customers and otherend-users who rely on our software products and services, including our SaaS and hosted offerings, for applications that are integral to their businesses may have a greater sensitivity to product errors and security vulnerabilities than customers for software products generally. Additionally, security breaches that affect third parties upon which we rely, such as travel suppliers, may further expose us to negative publicity, possible liability or regulatory penalties. Events outside our control could cause interruptions in our IT systems, which could have a material adverse effect on our business operations and harm our reputation.
Security breaches could expose us to liability and damage our reputation and our business.
We process, store, and transmit large amounts of data, including personal information of our customers, and it is critical to our business strategy that our facilities and infrastructure, including those provided by HP or other vendors, remain secure and are perceived by the marketplace to be secure. Our infrastructure may be vulnerable to physicalbreak-ins, computer viruses, attacks by hackers or nefarious actors or similar disruptive problems. Any physical or electronicbreak-in or other security breach or compromise of the information handled by us or our service providers may jeopardize the security or integrity of information in our computer systems and networks or those of our customers and cause significant interruptions in our and our customers’ operations. Consumer-facing e-commerce websites are frequently subject to cybersecurity attacks due to the public nature of such websites
Any systems and the personal information they collect and store. From time to time,processes that we have experienced certain immaterial security breaches relating to our Travelocity business.
Although we have developed systems and processes that are designed to protect customer information and prevent data loss and other security breaches such measures cannot provide absolute security. In addition, we may not successfully implement remediation plans to address all potential exposures. It is possible that we may have to expend additional financial and other resources to address such problems. Failure to prevent or mitigate data loss or other security breaches could expose us or our customers to a risk of loss or misuse of such information, cause customers to lose confidence in our data protection measures, damage our reputation, adversely affect our operating results or result in litigation or potential liability for us. While we maintain insurance coverage that may, subject to policy terms and conditions, cover certain aspects of cyber risks, such insurance coverage may be insufficient to cover all our losses.
Implementation of software solutions often involves a significant commitment of resources, and any failure to deliver as promised on a significant implementation could adversely affect our business.
In our Travel Network business and our Airline and Hospitality Solutions business, the implementation of software solutions often involves a significant commitment of resources and is subject to a number of significant risks over which we may or may not have control. These risks include:
As a result of these and other risks, some of our customers may incur large, unplanned costs in connection with the purchase and installation of our software products. Also, implementation projects could take longer than planned or fail. We may not be able to reduce or eliminate protracted installation or significant additional costs. Significant delays or unsuccessful customer implementation projects could result in claims from customers, harm our reputation and negatively impact our operating results.
35
We rely on the availability and performance of information technology services provided by third parties, including HP, which manages a significant portion of our systems.
Our businesses are largely dependent on the computer data centers and network systems operated for us by HP. We also rely on other developers and service providers to maintain and support our global telecommunications infrastructure, including to connect our computer data center and call centers toend-users.
Our success is dependent on our ability to maintain effective relationships with thesethird-party technology and service providers. Some of our agreements withthird-party technology and service providers are terminable for cause on short notice and often provide limited recourse for service interruptions. For example, our agreement with HP provides us with limited indemnification rights. We could face significant additional cost or business disruption if:
Any inability or failure to adapt to technological developments or the evolving competitive landscape could harm our business operations and competitiveness.
We depend upon the use of sophisticated information technology and systems. See “Business—Research, Development and Technology.” Our competitiveness and future results depend on our ability to maintain and make timely andcost-effective enhancements, upgrades and additions to our products, services, technologies and systems in response to new technological developments, industry standards and trends and customer demands. For example, we currently utilize mainframe infrastructure technology for certain of our enterprise applications and platforms due to its ability to provide the reliability and scalability we require for our complex technological operations. Although we believe that IBM, currently the only provider of this technology, is committed to investing in mainframes, the number of users and programmers able to service this technology is decreasing. We may eventually have to migrate to another business environment, which could cause us to incur substantial costs, result in instability and business interruptions and materially harm our business.
Adapting to new technological and marketplace developments, such as IATA’s proposed new distribution capability (“NDC”), may require substantial expenditures and lead time and we cannot guarantee that projected future increases in business volume will actually materialize. We may experience difficulties that could delay or prevent the successful development, marketing and implementation of enhancements, upgrades and additions. Moreover, we may fail to maintain, upgrade or introduce new products, services, technologies and systems as quickly as our competitors or in acost-effective manner. For example, we must constantly update our GDS with new capabilities to adapt to the changing technological environment and customer needs. However, this process can be costly andtime-consuming, and our efforts may not be successful as compared to our competitors in the travel distribution market. Those that we do develop may not achieve acceptance in the marketplace sufficient to generate material revenue or may be rendered obsolete ornon-competitive by our competitors’ offerings. For example, Microsoft is currently developing Travel 2015, atrip-planning tool that uses predictive modeling to anticipate travelers’ preferred flight options, which may become a significant competitor to our TripCase mobile app. Also, Concur Technologies’ TripLink, which captures travel reservations information regardless of the channel on which bookings were made, has the potential to evolve and pose a significant risk to our Travel Network business.
36
In addition, our competitors are constantly increasing their product and service offerings through organic research and development or through strategic acquisitions. For example, Amadeus recently acquired Hitit Computer Services, an airline customer relationship management (“CRM”) and loyalty solutions provider. This allows Amadeus to maintain a relationship with Etihad Airways and Virgin Australia, customers that have recently migrated to our Sabre reservations platform. More recently, Amadeus also acquired Newmarket International, a hotel IT solutions provider, which will allow Amadeus to broaden its portfolio of supplier solutions. In September 2014, SAP announced an agreement to acquire Concur Technologies, a travel and expense management software provider. As a result, we must continue to invest significant resources in research and development in order to continually improve the speed, accuracy and comprehensiveness of our services and we may be required to make changes to our technology platforms or increase our investment in technology, increase marketing, adjust prices or business models and take other actions, which could affect our financial performance and liquidity.
We use open source software in our solutions that may subject our software solutions to general release or require us tore-engineer our solutions.
We use open source software in our solutions and may use more open source software in the future. From time to time, there have been claims by companies claiming ownership of software that was previously thought to be open source and that was incorporated by other companies into their products. As a result, we could be subject to suits by parties claiming ownership of what we believe to be open source software. Some open source licenses contain requirements that we make available source code for modifications or derivative works we create based upon the open source software and that we license such modifications or derivative works under the terms of a particular open source license or other license granting third parties certain rights of further use. If we combine or, in some cases, link our proprietary software solutions with or to open source software in a certain manner, we could, under certain of the open source licenses, be required to release the source code of our proprietary software solutions or license such proprietary solutions under the terms of a particular open source license or other license granting third parties certain rights of further use. In addition to risks related to license requirements, usage of open source software can lead to greater risks than use ofthird-party commercial software, as open source licensors generally do not provide warranties or controls on origin of the software. In addition, open source license terms may be ambiguous and many of the risks associated with usage of open source cannot be eliminated, and could, if not properly addressed, negatively affect our business. If we were found to have inappropriately used open source software, we may be required to seek licenses from third parties in order to continue offering our software, tore-engineer our solutions, to discontinue the sale of our solutions in the eventre-engineering cannot be accomplished on a timely basis or take other remedial action that may divert resources away from our development efforts, any of which could adversely affect our business, operating results and financial condition.
Our ability to recruit, train and retain technical employees is critical to our results of operations and future growth.
Our continued ability to compete effectively depends on our ability to recruit new employees and retain and motivate existing employees, particularly professionals with experience in our industry, information technology and systems. The specialized skills we require can be difficult andtime-consuming to acquire and are often in short supply. There is high demand and competition forwell-qualified employees, such as software engineers, developers and other technology professionals with specialized knowledge in software development, especially expertise in certain programming languages. This competition affects both our ability to retain key employees and to hire new ones. Any of our employees may choose to terminate their employment with us at any time, and a lengthy period of time is required to hire and train replacement employees when such skilled individuals leave the company. If we fail to attractwell-qualified employees or to retain or motivate existing employees, our business could be materially hindered by, for example, a delay in our ability to deliver products and services under contract, bring new products and services to market or respond swiftly to customer demands or new offerings from competitors. Even if we are able to maintain our employee base, the resources needed to recruit and retain such employees may adversely affect our business, financial condition and results of operations.
37
We operate a global business that exposes us to risks associated with international activities.
Our international operations involve risks that are not generally encountered when doing business in the United States. These risks include, but are not limited to:
Any of the foregoing risks may adversely affect our ability to conduct and grow our business internationally.
We are exposed to risks associated with acquiring or divesting businesses or business operations.
We have acquired, or divested, and, as part of our growth strategy, may in the future acquire, or divest, businesses or business operations. Since 2010, we have acquired FlightLine Data Services, Inc. (“FlightLine”), Calidris ehf, (“Calidris”), f:wz,
PRISM Group Inc. and PRISM Technologies LLC (collectively “PRISM”), SoftHotel, and Zenon N.D.C., Limited.Limited and Genares. We may not be able to identify suitable candidates for additional business combinations and strategic investments, obtain financing on acceptable terms for such transactions, obtain necessary regulatory approvals or otherwise consummate such transactions on acceptable terms, or at all. Any acquisitions that we are able to identify and complete may also involve a number of risks, including our inability to successfully or profitably integrate, operate, maintain and manage our newly acquired operations or employees; the diversion of our management’s attention from our existing business to integrate operations and personnel; possible material adverse effects on our results of operations during the integration process; becoming subject to contingent or other liabilities, including liabilities arising from events or conduct predating the acquisition that were not known to us at the time of the acquisition; and our possible inability to achieve the intended objectives of the transaction, including the inability to achieve cost savings and synergies. Acquisitions may also have unanticipated tax, regulatory and accounting ramifications.ramifications, including recording goodwill and nonamortizable intangible assets that are subject to impairment testing on a regular basis and potential periodic impairment charges and incurring amortization expenses related to certain intangible assets. To consummate any such transactions, we may need to raise external funds through the sale of equity or debt in the capital markets or through private placements, which may affect our liquidity and may dilute the value of our common stock.
38
We have also divested, and may in the future divest, businesses or business operations. In December 2014, we announced that Bravofly Rumbo Group made a binding offer to acquire lastminute.com. Furthermore, on January 23, 2015, we announced the sale of Travelocity.com to Expedia, Inc. See “Summary–Recent Developments.” Since 2012, we have divested D.V. Travels Guru Pvt. Ltd. and Desiya Online Distribution Pvt. Ltd. (collectively “TravelGuru”), Zuji Properties A.V.V. and Zuji Pte Ltd along with its operating subsidiaries, (collectively “Zuji”), Travelocity Business (“TBiz”), Travelocity Nordics, Holiday Autos, Sabre Pacific, TPN and other businesses. Any divestitures may involve a number of risks, including the diversion of management’s attention, significant costs and expenses, the loss of customer relationships and cash flow, and the disruption of the affected business or business operations. Failure to timely complete or to consummate a divestiture may negatively affect the valuation of the affected business or business operations or result in restructuring charges.
We rely on the value of our brands, which may be damaged by a number of factors, some of which are out of our control.
We believe that maintaining and expanding our portfolio of product and service brands are important aspects of our efforts to attract and expand our customer base. Our brands may be negatively impacted by, among other things, unreliable service levels fromthird-party providers, customers’ inability to properly interface their applications with our technology, the loss or unauthorized disclosure of personal data or other bad publicity due to litigation, regulatory concerns or otherwise relating to our business. Any inability to maintain or enhance awareness of our brands among our existing and target customers could negatively affect our current and future business prospects.
There are material limitations with making estimates of our results for current or prior periods prior to the completion of our normal review procedures for such periods.
The preliminary financial data contained in “Summary—Recent Developments” is not a comprehensive statement of our financial data for the quarter ended and as of December 31, 2014 and has not been reviewed or audited by our independent registered public accounting firm or any other independent auditors. The actual data for the quarter ended December 31, 2014 may vary from our expectations and may be materially different from the preliminary financial estimates we have provided due to completion of quarterly close procedures, final adjustments and other developments that may arise between now and the time the financial data for this period are finalized. Accordingly, investors should not place undue reliance on such preliminary financial information.
Risk Factor Related to Travelocity
Our Travelocity business segment has historically been subject to the risk factor that is listed below. On December 16, 2014, we announced that we had received a binding offer from Bravofly Rumbo Group to acquire lastminute.com and on January 23, 2015, we announced the sale of Travelocity.com to Expedia, Inc. Following the sale of Travelocity.com to Expedia, Inc. the Expedia SMA was terminated. See “Summary—Recent Developments.” As a result, our Travelocity business segment will in the future only remain subject to this risk factor until the sale of lasminute.com has closed.
Our OTAs are subject to a number of risks specific to their activities.
Our OTAs are subject to certain risks inherent in theconsumer-facing OTA industry. These risks include, but are not limited to, the following:
| • | Competition. The OTA industry is an increasingly competitive global environment with a number of established and emerging online and traditional sellers oftravel-related services, including other OTAs, offline travel agents, travel suppliers, large online portal and search companies, travel metasearch engines and increasingly, mobile platform travel apps and social apps. Recently, we have seen increasing consolidation among our competitors, including Priceline’s acquisition of Kayak in November 2012 and Expedia’s acquisition of trivago in March 2013. These players compete on price, |
39
travel inventory availability and breadth, technological sophistication, ability to meet rapidly evolving consumer trends and demands, brand recognition, search engine rankings, ease of use and accessibility, customer service and reliability. If we cannot adequately address these trends and provide travelers with the content they seek at acceptable prices, our OTAs may not be able to compete successfully against current and future competitors. |
| • | Content. OTAs use their website content and ability to comparison shop to attract and convert visitors into booking customers and repeat users. The success of our OTAs in attracting users depends, in part, upon our continued ability to collect, create and distributehigh-quality, commercially valuable content that meets customers’ specific needs in acost-effective manner. Failing to meet the specific needs of consumers could make our OTAs less competitive. Changes in the cost structure by which our OTAs currently obtain their content, or changes in travelers’ relative appreciation of that content, could negatively impact our OTAs’ business and financial performance. |
| • | Relationships with travel suppliers and travel distribution partners. OTAs depend on travel suppliers and distribution partners for access to inventory and derive a substantial portion of their revenue from these suppliers and distribution partners in the form of compensation for bookings. Many travel suppliers have reduced or eliminated and may continue to reduce or eliminate, commissions and fees paid to travel agencies, and our OTA business could be harmed if this trend continues. Also, if travel suppliers or GDSs attempt to implement multiple costly direct connections or charge travel agencies for or otherwise restrict access to content, our OTAs’ ability to offer competitive inventory and pricing may be adversely affected, leading to decreased revenues and margins. |
| • | Changes in search engine algorithms and other traffic sources. We increasingly utilize internet search engines to generate traffic to our OTAs, principally through the purchase oftravel-related keywords. Search engines, including Google, frequently update and change the algorithm that determines the placement and display of search results such that our links could be placed lower on the page or displayed less prominently. We also depend onpay-per-click and display advertising campaigns on search and shopping providers like Google, Kayak, and TripAdvisor to direct a significant amount of traffic to our OTAs. Our business may be harmed if we cannot keep pace with the rapidly changing pricing and operating dynamics for these traffic sources. |
| • | Media. Our OTAs receive fees from companies and organizations, such as those in the travel industry, for display and referral advertising products. If a significant portion of our advertisers feel that our OTAs are no longer attracting or referring relevant customers, and accordingly reduce their advertising with our OTAs, our revenues could decline. |
| • | License requirements. In some of the jurisdictions where we provide travel services through our OTAs, we are required to obtain certain licenses and approvals from the relevant regulatory authorities. These regulatory authorities generally have broad discretion to grant, renew and revoke such licenses and approvals. Any of these regulatory authorities could permanently or temporarily suspend the necessary licenses and approvals in respect of some or all of our travel agency and related activities in such jurisdictions, which would adversely impact the activities of the affected OTA. |
Regulatory and Other Legal Risks
We are involved in various legal proceedings which may cause us to incur significant fees, costs and expenses and may result in unfavorable outcomes.
We are involved in various legal proceedings that involve claims for substantial amounts of money or which involve how we conduct our business. See “Business—Legal Proceedings.” For example, a number of state and local governments have filed lawsuits against us pertaining to sales or occupancy taxes they claim are due on some or all of our fees relating to hotel content distributed and sold via the merchant revenue model. In the merchant revenue model, the customer pays us an amount at the time of booking that includes (i) service fees,
40
which we retain, and (ii) the price of the hotel room and amounts for occupancy or other local taxes, which we pass along to the hotel supplier. The complaints generally allege, among other things, that we have failed to pay to the relevant taxing authority hotel accommodations taxes on the service fees. Even if we are successful in defending these types of lawsuits, state and local governments could adopt new ordinances directly taxing hotel booking fees and we may not be able to successfully challenge such ordinances.
Additionally, we are involved in antitrust litigation with US Airways. If we cannot resolve this matter favorably, we could be subject to (i) monetary damages, including treble damages under the antitrust laws and, depending on the amount of any such judgment, if we do not have sufficient cash on hand, we may be required to seek financing through the issuance of additional equity or from private or public financing or (ii) injunctive relief. Other airlines might likewise seek to benefit from any unfavorable outcome by bringing their own claims against us on the same or similar grounds. We are also subject to a U.S. Department of Justice (“DOJ”) antitrust investigation relating to the pricing and conduct of the airline distribution industry. We received a civil investigative demand (“CID”) from the DOJ and we are fully cooperating. The DOJ has also sent CIDs to other companies in the travel industry. Based on its findings in the investigation, the DOJ may (i) close the file, (ii) seek a consent decree to remedy issues it believes violate the antitrust laws, or (iii) file suit against us for violating the antitrust laws, seeking injunctive relief. With respect to both the US Airways and DOJ proceedings, if injunctive relief were to be granted, depending on its scope, it could affect the manner in which our airline distribution business is operated and potentially force changes to the existing airline distribution business model.
The defense of these actions, as well as any of the other actions described under “Business—Legal Proceedings” and any other actions brought against us in the future, is time consuming and diverts management’s attention. Even if we are ultimately successful in defending ourselves in such matters, we are likely to incur significant fees, costs and expenses as long as they are ongoing. Any of these consequences could have a material adverse effect on our business, financial condition and results of operations.
Intellectual property infringement actions against us could be costly and time consuming to defend and may result in business harm if we are unsuccessful in our defense.
Third parties may assert, including by means of counterclaims against us as a result of the assertion of our intellectual property rights, that our products, services or technology, or the operation of our business, violate their intellectual property rights. We are currently subject to such assertions, including patent infringement claims, and may be subject to such assertions in the future. Such assertions may also be made against our customers who may seek indemnification from us. In the ordinary course of business, we enter into agreements that contain indemnity obligations whereby we are required to indemnify our customers against such assertions arising from our customers’ usage of our products, services or technology. As the competition in our industry increases and the functionality of technology offerings further overlaps, such claims and counterclaims could become more common. We cannot be certain that we do not or will not infringe third parties’ intellectual property rights.
Legal proceedings involving intellectual property rights are highly uncertain, and can involve complex legal and scientific questions. Any intellectual property claim against us, regardless of its merit, could result in significant liabilities to our business, and can be expensive and time consuming to defend. Depending on the nature of such claims, our businesses may be disrupted, our management’s attention and other company resources may be diverted and we may be required to redesign, reengineer or rebrand our products and services, if feasible, to stop offering certain products and services or to enter into royalty or licensing agreements in order to obtain the rights to use necessary technologies, which may not be available on terms acceptable to us, if at all, and may result in a decrease of our competitive advantage. Our failure to prevail in such matters could result in loss of intellectual property rights, judgments awarding substantial damages, including possible treble damages and attorneys’ fees, and injunctive or other equitable relief against us. If we are held liable, we may be unable to exploit some or all of our intellectual property rights or technology. Even if we are not held liable, we may choose to settle claims by making a monetary payment or by granting a license to intellectual property rights that we otherwise would not license. Further, judgments may result in loss of reputation, may force us to take costly
41
remediation actions, delay selling our products and offering our services, reduce features or functionality in our services or products, or cease such activities altogether. Insurance may not cover or be insufficient for any such claim.
We may not have sufficient insurance to cover our liability in pending litigation claims and future claims either due to coverage limits or as a result of insurance carriers seeking to deny coverage of such claims, which in either case could expose us to significant liabilities.
We maintainthird-party insurance coverage against various liability risks, including securities, shareholder derivative, ERISA, and product liability claims, as well as other claims that form the basis of litigation matters pending against us. We believe these insurance programs are an effective way to protect our assets against liability risks. However, the potential liabilities associated with litigation matters pending against us, or that could arise in the future, could exceed the coverage provided by such programs. In addition, our insurance carriers have sought or may seek to rescind or deny coverage with respect to pending claims or lawsuits, completed investigations or pending or future investigations and other legal actions against us. See “Business—Legal Proceedings—Insurance Carriers” for more information on our current litigation with our insurance carriers. If we do not have sufficient coverage under our policies, or if the insurance companies are successful in rescinding or denying coverage, we may be required to make material payments in connection withthird-party claims.
We may not be able to protect our intellectual property effectively, which may allow competitors to duplicate our products and services.
Our success and competitiveness depend, in part, upon our technologies and other intellectual property, including our brands. Among our significant assets are our proprietary and licensed software and other proprietary information and intellectual property rights. We rely on a combination of copyright, trademark and patent laws, laws protecting trade secrets, confidentiality procedures and contractual provisions to protect these assets both in the United States and in foreign countries. The laws of some jurisdictions may provide less protection for our technologies and other intellectual property assets than the laws of the United States.
There is no certainty that our intellectual property rights will provide us with substantial protection or commercial benefit. Despite our efforts to protect our intellectual property, some of our innovations may not be protectable, and our intellectual property rights may offer insufficient protection from competition or unauthorized use, lapse or expire, be challenged, narrowed, invalidated, or misappropriated by third parties, or be deemed unenforceable or abandoned, which could have a material adverse effect on our business, financial condition and results of operations and the legal remedies available to us may not adequately compensate us. We cannot be certain that others will not independently develop, design around, or otherwise acquire equivalent or superior technology or intellectual property rights.
Our patent applications may not be granted, and the patents we own could be challenged, invalidated, narrowed or circumvented by others and may not be of sufficient scope or strength to provide us with
any meaningful protection or commercial advantage. Once our patents expire, or if they are invalidated, narrowed or circumvented, our competitors may be able to utilize the technology protected by our patents which may adversely affect our business.
|
42
We license software and other intellectual property from third parties. Such licensors may breach or otherwise fail to perform their obligations, or claim that we have breached or otherwise attempt to terminate their license agreements with us. We also rely on license agreements to allow third parties to use our intellectual property rights, including our software, but there is no guarantee that our licensees will abide by the terms of our license agreements or that the terms of our agreements will always be enforceable.
In addition, policing unauthorized use of and enforcing intellectual property can be difficult and expensive. The fact that we have intellectual property rights, including registered intellectual property rights, may not guarantee success in our attempts to enforce these rights against third parties. Besides general litigation risks, changes in, or interpretations of, intellectual property laws may compromise our ability to enforce our rights. We may not be aware of infringement or misappropriation, or elect not to seek to prevent it. Our decisions may be based on a variety of factors, such as costs and benefits of taking action, and contextual business, legal, and other issues. Any inability to adequately protect our intellectual property on acost-effective basis could harm our business.
Intellectual property infringement actions against us could be costly and time consuming to defend and may result in business harm if we are unsuccessful in our defense.
Third parties may assert, including by means of counterclaims against us as a result of the assertion of our intellectual property rights, that our products, services or technology, or the operation of our business, violate their intellectual property rights. We are currently subject to such assertions, including patent infringement claims, and may be subject to such assertions in the future. Such assertions may also be made against our customers who may seek indemnification from us. In the ordinary course of business, we enter into agreements that contain indemnity obligations whereby we are required to indemnify our customers against such assertions arising from our customers’ usage of our products, services or technology. As the competition in our industry increases and the functionality of technology offerings further overlaps, such claims and counterclaims could become more common. We cannot be certain that we do not or will not infringe third parties’ intellectual property rights.
Legal proceedings involving intellectual property rights are highly uncertain, and can involve complex legal and scientific questions. Any intellectual property claim against us, regardless of its merit, could result in significant liabilities to our business, and can be expensive and time consuming to defend. Depending on the nature of such claims, our businesses may be disrupted, our management’s attention and other company resources may be diverted and we may be required to redesign, reengineer or rebrand our products and services, if feasible, to stop offering
certain products and services or to enter into royalty or licensing agreements in order to obtain the rights to use necessary technologies, which may not be available on terms acceptable to us, if at all, and may result in a decrease of our competitive advantage. Our failure to prevail in such matters could result in loss of intellectual property rights, judgments awarding substantial damages, including possible treble damages and attorneys’ fees, and injunctive or other equitable relief against us. If we are held liable, we may be unable to exploit some or all of our intellectual property rights or technology. Even if we are not held liable, we may choose to settle claims by making a monetary payment or by granting a license to intellectual property rights that we otherwise would not license. Further, judgments may result in loss of reputation, may force us to take costly remediation actions, delay selling our products and offering our services, reduce features or functionality in our services or products, or cease such activities altogether. Insurance may not cover or be insufficient for any such claim.
Defects in our products may subject us to significant warranty liabilities or product liability claims and we may have insufficient product liability insurance to pay material uninsured claims.
Our Airline and Hospitality Solutions business exposes us to the risk of product liability claims that are inherent in software development. We may inadvertently create defective software, or supply our customers with defective software or software components that we acquire from third parties, which could result in personal injury or property damage, and may result in warranty or product liability claims brought against us, our travel supplier customers or third parties.
Under our Airline and Hospitality Solutions business’ agreements, we generally must indemnify our customers for liability arising from intellectual property infringement claims with respect to our software. These indemnification obligations could be significant and we may not have adequate insurance coverage to protect us against all claims. We currently rely on a combination ofself-insurance andthird-party insurance to cover potential product liability exposure. The combination of our insurance coverage, cash flows and reserves may not be adequate to satisfy product liabilities we may incur in the future. Even meritless claims could subject us to adverse publicity, hinder us from securing insurance coverage in the future, require us to incur significant legal fees, decrease demand for any products that we successfully develop, divert management’s attention, and force us to limit or forgo further development and commercialization of these products. The cost of any product liability litigation or other proceedings, even if resolved in our favor, could be substantial.
We are involved in various legal proceedings which may cause us to incur significant fees, costs and expenses and may result in unfavorable outcomes.
We are involved in various legal proceedings that involve claims for substantial amounts of money or which involve how we conduct our business. See “Business—Legal Proceedings.” For example, a number of state and local governments have filed lawsuits against us pertaining to sales or occupancy taxes they claim are due on some or all of our fees relating to hotel content distributed and sold via the merchant revenue model. In the merchant revenue model, the customer pays us an amount at the time of booking that includes (i) service fees, which we collect, and (ii) the price of the hotel room and amounts for occupancy or other local taxes, which we pass along to the hotel supplier. The complaints generally allege, among other things, that we have failed to pay to the relevant taxing authority hotel accommodations taxes on the service fees. Pursuant to the Expedia SMA, we will continue to be liable for fees, charges, costs and settlements relating to litigation arising from hotels booked on the Travelocity platform prior to the Expedia SMA. However, fees, charges, costs and settlements relating to litigation from hotels booked subsequent to the Expedia SMA will be shared with Expedia according to the terms of the Expedia SMA. The Expedia SMA also requires us to guarantee Travelocity’s indemnification obligations for liabilities that may arise out of such litigation matters. Even if we are successful in defending these types of lawsuits, state and local governments could adopt new ordinances directly taxing hotel booking fees and we may not be able to successfully challenge such ordinances.
Additionally, we are involved in antitrust litigation with US Airways. If we cannot resolve this matter favorably, we could be subject to (i) monetary damages, including treble damages under the antitrust laws and,
depending on the amount of any such judgment, if we do not have sufficient cash on hand, we may be required to seek financing through the issuance of additional equity or from private or public financing or (ii) injunctive relief. Other airlines might likewise seek to benefit from any unfavorable outcome by bringing their own claims against us on the same or similar grounds. We are also subject to a U.S. Department of Justice (“DOJ”) antitrust investigation relating to the pricing and conduct of the airline distribution industry. We received a civil investigative demand (“CID”) from the DOJ and we are fully cooperating. The DOJ has also sent CIDs to other companies in the travel industry. Based on its findings in the investigation, the DOJ may (i) close the file, (ii) seek a consent decree to remedy issues it believes violate the antitrust laws, or (iii) file suit against us for violating the antitrust laws, seeking injunctive relief. With respect to both the US Airways and DOJ proceedings, if injunctive relief were to be granted, depending on its scope, it could affect the manner in which our airline distribution business is operated and potentially force changes to the existing airline distribution business model.
In addition, we are involved in a number of antitrust class action lawsuits alleging a conspiracy among OTAs and hotels to fix hotel prices. We are also involved from time to time with patent litigation with non-practicing entities or “patent trolls” that seek quick settlement payments that are often far less than the cost of mounting a defense, regardless of the merits of the patent or whether or not we have actually infringed.
The defense of these actions, as well as any of the other actions described under “Business—Legal Proceedings” and any other actions brought against us in the future, is time consuming and diverts management’s attention. Even if we are ultimately successful in defending ourselves in such matters, we are likely to incur significant fees, costs and expenses as long as they are ongoing. Any of these consequences could have a material adverse effect on our business, financial condition and results of operations.
We may not have sufficient insurance to cover our liability in pending litigation claims and future claims either due to coverage limits or as a result of insurance carriers seeking to deny coverage of such claims, which in either case could expose us to significant liabilities.
We maintain third-party insurance coverage against various liability risks, including securities, shareholder derivative, ERISA, and product liability claims, as well as other claims that form the basis of litigation matters pending against us. We believe these insurance programs are an effective way to protect our assets against liability risks. However, the potential liabilities associated with litigation matters pending against us, or that could arise in the future, could exceed the coverage provided by such programs. In addition, our insurance carriers have sought or may seek to rescind or deny coverage with respect to pending claims or lawsuits, completed investigations or pending or future investigations and other legal actions against us. See “Business—Legal Proceedings—Insurance Carriers” for more information on our current litigation with our insurance carriers. If we do not have sufficient coverage under our policies, or if the insurance companies are successful in rescinding or denying coverage, we may be required to make material payments in connection with third-party claims.
Any failure to comply with regulations or any changes in such regulations governing our businesses could adversely affect us.
Parts of our business operate in regulated industries and could be adversely affected by unfavorable changes in or the enactment of new laws, rules or regulations applicable to us, which could decrease demand for our products and services, increase costs or subject us to additional liabilities. Moreover, regulatory authorities have relatively broad discretion to grant, renew and revoke licenses and approvals and to implement or interpret regulations. Accordingly, such regulatory authorities could prevent or temporarily suspend us from carrying on some or all of our activities or otherwise penalize us if our practices were found not to comply with the applicable regulatory or licensing requirements or any interpretation of such requirements by the regulatory authority. Our failure to comply with any of these requirements or interpretations could have a material adverse effect on our operations. In particular, after a voluntary disclosure, we received a warning letter from the Bureau of Industry and Security regarding our failure to comply fully with the Export Administration Regulations as to software updates for a few
travel agency customers located outside the United States. Although the Bureau of Industry and Security declined to prosecute or sanction us, if we were to violate the Export Administration Regulations again, the matter could be reopened or taken into consideration when investigating future matters and we may be subject to criminal prosecution or administrative sanctions. See
Further, the United States has imposed economic sanctions that affect transactions with designated foreign countries, including Cuba, Iran, Sudan and Syria, and nationals and others of those countries, and certain specifically targeted individuals and entities engaged in conduct detrimental to U.S. national security interests. These sanctions are administered by the U.S. Department of the Treasury’s Office of Foreign Assets Control (“OFAC”) and are typically known as the OFAC regulations. For a description of OFAC regulations and additional information on economic sanctions, see “Business—Government Regulation—Office of Foreign Asset Control Regulation”Regulation.” Failure to comply with such regulations could subject us to legal and reputational consequences, including civil and criminal penalties.
We have GDS contracts with carriers that fly to Cuba, Iran, Sudan and Syria but are based outside of those countries and are not owned by those governments or nationals of those governments. With respect to Iran, Sudan and Syria we believe that our activities comply with certaintravel-related exemptions. With respect to Cuba, for additionalcustomers outside the United States we display on the Sabre GDS flight information for, and support booking and ticketing of, services ofnon-Cuban airlines that offer service to Cuba. Based on economic sanctionsadvice of counsel, we believe these activities to fall under an exemption from OFAC regulations applicable to the transmission of information and informational materials and transactions related thereto.
We believe that our activities with respect to these countries are known to OFAC. We note, however, that OFAC regulations and related interpretive guidance are complex and subject to varying interpretations. Due to this complexity, OFAC’s interpretation of its own regulations and guidance vary on a case to case basis. As a result, we cannot provide any guarantees that OFAC will not challenge any of our activities in the future, which we must comply.could have a material adverse effect on our results of operations.
In Europe, GDS regulations or interpretations thereof may increase our cost of doing business or lower our revenues, limit our ability to sell marketing data, impact relationships with travel buyers, airlines, rail carriers or others, impair the enforceability of existing agreements with travel buyers and other users of our system, prohibit or limit us from offering services or products, or limit our ability to establish or change fees. Although regulations specifically governing GDSs have been lifted in the United States, they remain subject to general regulation regarding unfair trade practices by the U.S. Department of Transportation (“DOT”). In addition, continued regulation of GDSs in the EU and elsewhere could also create the operational challenge of supporting different products, services and business practices to conform to the different regulatory regimes. See “Business—Government Regulation—Computer Reservations System Industry Regulation” for additional information. We do not currently maintain a central database of all regulatory requirements affecting our worldwide operations and, as a result, the risk ofnon-compliance with the laws and regulations described above
44
is heightened. Our failure to comply with these laws and regulations may subject us to fines, penalties and potential criminal violations. Any changes to these laws or regulations or any new laws or regulations may make it more difficult for us to operate our business.
Our collection, processing, storage, use and transmission of personal data could give rise to liabilities as a result of governmental regulation, conflicting legal requirements, differing views on data privacy or security breaches.
In our processing of travel transactions, we collect, process, store, use and transmit large amounts of sensitive personal data. This information is increasingly subject to legal restrictions around the world, which may result in conflicting legal requirements in the United States and other jurisdictions. For example, the U.S. Congress and federal agencies, including the Federal Trade Commission, have started to take a more aggressive stance in drafting and enforcing privacy and data protection laws. The EU is also in the process of proposing reforms to its existing data protection legal framework. These legal restrictions are generally intended to protect the privacy and security of personal information, including credit card information that is collected, processed and transmitted in or from the governing jurisdiction. Companies that handle this type of data have also been subject to investigations, lawsuits and adverse publicity due to allegedly improper disclosure or use of sensitive personal information. As privacy and data protection becomes an increasingly politicized issue, we may also become exposed to potential liabilities as a result of conflicting legal requirements, differing views on the privacy of travel data or failure to comply with applicable requirements. Our business could be materially adversely affected if we are unable or unwilling to comply with legal restrictions on the use of sensitive personal information or if such restrictions are expanded to require changes in our current business practices or are interpreted in ways that conflict with or negatively impact our present or future business practices.
We Additionally, we are exposedrequired to risks associatedindemnify some of our customers for liability arising from data breaches under the terms of our agreements with payment card industry (“PCI”) compliance.
The PCI Data Security Standard (“PCI DSS”) is a set of comprehensive requirements endorsed by credit card issuers for enhancing payment account data security that includes requirements for security management, policies, procedures, network architecture, software design and other critical protective measures. PCI DSS compliance is required in order to maintain credit card processing facilities. The cost of compliance with the PCI DSS issuch customers. These indemnification obligations could be significant and we may increase. Although we are currently in compliance with the PCI DSS, compliance does not guarantee a completely secure environment. Moreover, compliance is an ongoing activity, since the formal requirements evolve as new threats and protective measures are identified. In the event that we werehave adequate insurance coverage to lose PCI DSS compliance (or fail to achieve compliance with a future version of the PCI DSS), we could be exposed to fines and penalties and, in extreme circumstances, may have our credit card processing privileges revoked, which would have a material adverse effect on our business.protect us against all claims.
We may have higher than anticipated tax liabilities.
We are subject to a variety of taxes in many jurisdictions globally, including income taxes in the United States at the federal, state and local levels, and in many other countries. Significant judgment is required in determining our worldwide provision for income taxes. In the ordinary course of our business, there are many transactions and calculations where the ultimate tax determination is uncertain. We operate in numerous countries where our income tax returns are subject to audit and adjustment by local tax authorities. Because we operate globally, the nature of the uncertain tax positions is often very complex and subject to change, and the amounts at issue can be substantial. It is inherently difficult and subjective to estimate such amounts, as we have to determine the probability of various possible outcomes. Were-evaluate uncertain tax positions on a quarterly basis. This evaluation is based on factors including, but not limited to, changes in facts or circumstances, changes in tax law, effectively settled issues under audit and new audit activity. Although we believe our tax estimates are reasonable, the final determination of tax audits could be materially different from our historical income tax provisions and accruals. Our effective tax rate may change from year to year based on changes in the mix of activities and income allocated or earned among various jurisdictions, tax laws in these jurisdictions, tax treaties between countries, our eligibility for benefits under those tax treaties, and the estimated values of deferred tax assets and liabilities. Such changes could result in an increase in the effective tax rate applicable to all or a portion of our income which would reduce our profitability.
We establish reserves for our potential liability for U.S. andnon-U.S. taxes, including sales, occupancy andvalue-added taxes (“VAT”), consistent with applicable accounting principles and in light of all current facts and circumstances. We have also established reserves relating to the collection of refunds related tovalue-added taxes, which are subject to audit and collection risks in various regions of Europe. Recently our right to recover certainvalue-added tax receivables associated with our European businesses has been questioned by tax
45
authorities. These reserves represent our best estimate of our contingent liability for taxes. The interpretation of tax laws and the determination of any potential liability under those laws are complex, and the amount of our liability may exceed our established reserves.
We consider the undistributed earnings of our foreign subsidiaries as of December 31, 2013 to be indefinitely reinvested and, accordingly, no U.S. income taxes have been provided thereon. As of December 31, 2013, the amount of indefinitely reinvested foreign earnings was approximately $157 million. As of December 31, 2013, $70.8 million of cash, cash equivalents, and marketable securities were held by our foreign subsidiaries. If such cash, cash equivalents and marketable securities are needed for our operations in the United States, we would be required to accrue and pay taxes on up to $44 million of these funds to repatriate all such cash, cash equivalents and marketable securities. We have not, nor do we anticipate the need to, repatriate funds to the United States to satisfy domestic liquidity needs arising in the ordinary course of business, including liquidity needs associated with our domestic debt service requirements. In the event funds from foreign operations are needed to fund operations in the United States or if we elect to repatriate these funds, we would be required to accrue and pay additional U.S. taxes.
New tax laws, statutes, rules, regulations or ordinances could be enacted at any time and existing tax laws, statutes, rules, regulations and ordinances could be interpreted, changed, modified or applied adversely to us. These events could require us to pay additional tax amounts on a prospective or retroactive basis, as well as require us to pay fees, penalties or interest for past amounts deemed to be due. For example, there have been proposals to amend U.S. tax laws that would significantly impact how U.S. companies are taxed on foreign earnings. New, changed, modified or newly interpreted or applied laws could also increase our compliance, operating and other costs, as well as the costs of our products and services.
We will beare required to pay to stockholders and equity award holders that were stockholders or equity award holders immediately prior to the closing of our Existing Stockholdersinitial public offering 85% of certain tax benefits, related to Pre-IPO Tax Assets, and could be required to make substantial cash payments in which the stockholders purchasing shares in this offering will not participate.
Immediately prior to the completion of thisour initial public offering, we will enterentered into a TRAtax receivable agreement (“TRA”) that provides the right to receive future payments by us to stockholders and equity award holders that were our stockholders and equity award holders, respectively, immediately prior to the closing of our initial public offering (collectively, the “Pre-IPO Existing StockholdersStockholders”) of 85% of the amount of cash savings, if any, in U.S. federal income tax that we and our subsidiaries realize as a result of the utilization of certain tax assets attributable to periods prior to our initial public offering, including federal net operating losses (“NOLs”), capital losses and the ability to realize tax amortization of certain intangible assets (collectively, the“Pre-IPO Tax Assets.Assets”). Consequently, stockholders purchasing shares in this offering will only be entitled to the economic benefit of thePre-IPO Tax Assets to the extent of our continuing 15% interest in those assets. See “Certain Relationships and Related Party Transactions—Tax Receivable Agreement.”
These payment obligations will beare our obligations and not obligations of any of our subsidiaries. The actual utilization of thePre-IPO Tax Assets, as well as the timing of any payments under the TRA, will vary depending upon a number of factors, including the amount, character and timing of our and our subsidiaries’ taxable income in the future.
We expect that the payments we make under this TRA will be material. Assuming no material changes in the relevantBased on current tax law,laws and assuming that we and our subsidiaries earn sufficient taxable income to realize the full tax benefits subject to the TRA, we expect that future payments under the TRA willrelating to thePre-IPO Tax Assets could aggregate to between $$330 million and $$380 million over the next five years.
Upon the effective datesix years (assuming no changes to current limitations on our ability to utilize our NOLs under Section 382 of the TRA,Internal Revenue Code (the “Code”), which we estimate will represent approximately 85% to 95% of total payments we will recognizebe required to make under the TRA.
We recognized a liability of $$321 million after considering the valuation allowance of $66 million recorded against the Pre-IPO Tax Assets for the payments (estimated as of March 31, 2014) to be made under the TRA. The TRA which will be accounted forliability was recorded as a
46
reduction ofto additional paid-in capital onand an increase to other noncurrent liabilities. No payments have been made under the TRA during the nine months ended September 30, 2014 and we do not expect material payments to occur prior to 2016. Any payments made under the TRA will be classified as a financing activity in our consolidated balance sheet.
statement of cash flows. Changes in the utility of our thePre-IPO Tax Assets will impact the amount of the liability that will be paid to our Pre-IPO Existing Stockholders. Changes in the utility of thesePre-IPO Tax Assets are recorded in income tax expense (benefit) and any changes in the obligation under the TRA is recorded in other income (expense). Based on our current taxable income estimates, we expect to repay the majority of this obligation by the end of our 2019 fiscal year.
In addition, the TRA provides that upon certain mergers, stock and asset sales, other forms of business combinations or other changes of control, the TRA will terminate and we will be required to make a payment intended to equal to the present value of future payments under the TRA, which payment would be based on certain assumptions, including those relating to our and our subsidiaries’ future taxable income. In these situations, our obligations under the TRA could have a substantial negative impact on our liquidity and could have the effect of delaying, deferring or preventing certain mergers, asset sales, other forms of business combinations or other changes of control.
Different timing rules will apply to payments under the TRA to be made to pre-IPO holders that, prior to the completion of the initial public offering, held stock options and restricted stock units (collectively, the “Award“Pre-IPO Award Holders”). Such payments will generally be deemed invested in a notional account rather than made on the scheduled payment dates, and the account will be distributed on the fifth anniversary of the initial public offering, together with an amount equal to the net present value of such Award Holder’s future expected payments, if any, under the TRA. Moreover, payments to holders of pre-IPO unvested stock options will bethat were unvested prior to the completion of the initial public offering are subject to vesting on the same schedule as thesuch holder’s unvested stock options.
The TRA contains a Change of Control definition that includes, among other things, a change of a majority of the Board of Directors without approval of a majority of the then existing Board members (the “Continuing Directors Provision”). Recent Delaware case law has stressed that such Continuing Directors Provisions could have a potential adverse impact on shareholders’ right to elect a company’s directors. In this regard, decisions of the Delaware Chancery Court (not involving us or our securities) have considered change of control provisions and noted that a board of directors may “approve” a dissident shareholders’ nominees solely to avoid triggering the change of control provisions, without supporting their election, if the board determines in good faith that the election of the dissident nominees would not be materially adverse to the interests of the corporation or its stockholders. Further, according to these decisions, the directors’ duty of loyalty to shareholders under Delaware law may, in certain circumstances, require them to give such approval.
Our counterparties under the TRA will not reimburse us for any payments previously made under the TRA if such benefits are subsequently disallowed (although future payments would be adjusted to the extent possible to reflect the result of such disallowance). As a result, in certain circumstances, payments could be made under the TRA in excess of our cash tax savings.
Certain transactions by the company could cause it to recognize taxable income (possibly material amounts of income) without a current receipt of cash. Payments under the TRA with respect to such taxable income would
cause a net reduction in our available cash. For example, transactions giving rise to cancellation of debt income, the accrual of income from original issue discount or deferred payments, a “triggering event” requiring the recapture of dual consolidated losses, or “Subpart F” income would each produce income with no corresponding increase in cash. In these cases, we may use some of thePre-IPO Tax Assets to offset income from these transactiontransactions and, under the TRA, would be required to make a payment to our Pre-IPO Existing Stockholders even though we receive no cash from such income.
Because we are a holding company with no operations of our own, our ability to make payments under the TRA is dependent on the ability of our subsidiaries to make distributions to us. To the extent that we are unable to make payments under the TRA for specified reasons, such payments will be deferred and will accrue interest at a rate of the London Interbank Offered Rate (“LIBOR”) plus 1.00% per annum until paid.
If we did not enter into the TRA, we would be entitled to realize the full economic benefit of the Pre-IPO Tax Assets.
47
The TRA is designed with the objective of causing our annual cash costs attributable to federal income taxes (without regard to our continuing 15% interest in thePre-IPO Tax Assets) to be the same as we would have paid had we not had thePre-IPO Tax Assets available to offset our federal taxable income. As a result, stockholders purchasing shares in this offering will not be entitled to the economic benefit of thePre-IPO Tax Assets that would have been available if the TRA were not in effect (except to the extent of our continuing 15% interest in thePre-IPO Tax Assets).
We may recognize impairments onlong-lived assets, including goodwill and other intangible assets, or recognize impairments on our equity method investments.
Our consolidated balance sheet at December 31, 2013 contained intangible assets, net, including goodwill, of approximately $2,773 million. Our investments in joint ventures on the consolidated balance sheet as of December 31, 2013 includes $93 million of excess basis over our underlying equity in joint ventures. This differential represents goodwill in addition to identifiable intangible assets which are being amortized to joint venture intangible amortization over their estimated lives. Future acquisitions that result in the recognition of additional goodwill and intangible assets would cause an increase in these types of assets. We do not amortize goodwill and intangible assets that are determined to have indefinite useful lives, but we amortizedefinite-lived intangible assets on astraight-line basis over their useful economic lives, which range from four to thirty years, depending on classification.
We evaluate goodwill for impairment on an annual basis or earlier if impairment indicators exist and we evaluatedefinite-lived intangible assets for impairment whenever events or changes in circumstances indicate that the carrying amount ofdefinite-lived intangible assets used in combination to generate cash flows largely independent of other assets may not be recoverable. We record an impairment charge whenever the estimated fair value of our reporting units or of such intangible assets is less than its carrying value. We have also recognized a share of impairment charges recorded by one of our equity method investments, Abacus. As of June 30, 2013, our Travelocity reporting unit had no remaining goodwill.
The fair values used in our impairment evaluation are estimated using a combined approach based upon discounted future cash flow projections and observed market multiples for comparable businesses. Changes in estimates based on changes inrisk-adjusted discount rates, future booking and transaction volume levels, future price levels, rates of growth in our consumer and corporate direct booking businesses, rates of increase in operating expenses, cost of revenue and taxes could result in material impairment charges.
Our pension plan obligations are currently unfunded, and we may have to make significant cash contributions to our plans, which could reduce the cash available for our business.
Our pension plans in the aggregate are underfundedestimated to be unfunded by approximately $55$90.1 million as of December 31, 2013.2014. With approximately 5,300 participants in our pension plans, we incur substantial costs relating to pension benefits, which can vary substantially as a result of changes in healthcare laws and costs, volatility in investment returns on pension plan assets and changes in discount rates used to calculate related liabilities. Our estimates of liabilities and expenses for pensions and otherpost-retirement healthcare benefits require the use of assumptions, including assumptions relating to the rate used to discount the future estimated liability, the rate of return on plan assets, inflation and several assumptions relating to the employee workforce (medical costs, retirement age and mortality). Actual results may differ, which may have a material adverse effect on our business, prospects, financial condition or results of operations. Future volatility and disruption in the stock markets could cause a decline in the asset values of our pension plans. In addition, a decrease in the discount rate used to determine minimum funding requirements could result in increased future contributions. If either occurs, we may need to make additional pension contributions above what is currently estimated, which could reduce the cash available for our businesses.
48
We are exposed to risks associated with payment card industry (“PCI”) compliance.
The PCI Data Security Standard (“PCI DSS”) is a set of comprehensive requirements endorsed by credit card issuers for enhancing payment account data security that includes requirements for security management, policies, procedures, network architecture, software design and other critical protective measures. PCI DSS compliance is required in order to maintain credit card processing facilities. The cost of compliance with the PCI DSS is significant and may increase as the requirements change. We are tested periodically for compliance with the current version and our last assessment completed in June 2014. We were found to be compliant in that assessment and our 2015 assessment is scheduled to be completed in June 2015. Compliance does not guarantee a completely secure environment. Moreover, compliance is an ongoing activity and the formal requirements likely will evolve as new threats and protective measures are identified. In the event that we were to lose PCI DSS compliance (or fail to achieve compliance with a future version of the PCI DSS), we could be exposed to increased operating costs, fines and penalties and, in extreme circumstances, may have our credit card processing privileges revoked, which would have a material adverse effect on our business.
Risks Related to Our Indebtedness and Liquidity
We may require more cash than we generate in our operating activities, and additional funding on reasonable terms or at all may not be available.
We cannot guarantee that our business will generate sufficient cash flow from operations to fund our capital investment requirements or other liquidity needs. For example, with the migration of our U.S. and Canadian Travelocity businesses to the Expedia platform, our working capital will decrease as we pay travel suppliers for travel booked on our platform, without being offset by new bookings. Moreover, because we are a holding company with no material direct operations, we depend on loans, dividends and other payments from our subsidiaries to generate the funds necessary to meet our financial obligations. Our subsidiaries are legally distinct from us and may be prohibited or restricted from paying dividends or otherwise making funds available to us under certain conditions.
As a result, we may be required to finance our cash needs through public or private equity offerings, bank loans, additional debt financing or otherwise. Our ability to arrange financing and the cost of such financing are dependent on numerous factors, including but not limited to:
There can be no assurance that financing will be available on terms favorable to us or at all, which could force us to delay, reduce or abandon our growth strategy, increase our financing costs, or both. Additional funding from debt financings may make it more difficult for us to operate our business because a portion of our cash generated from internal operations would be used to make principal and interest payments on the indebtedness and we may be obligated to abide by restrictive covenants contained in the debt financing agreements, which may, among other things, limit our ability to make business decisions and further limit our ability to pay dividends.
In addition, any downgrade of our debt ratings by Standard & Poor’s, Moody’s Investor Service or similar ratings agencies, increases in general interest rate levels and credit spreads or overall weakening in the credit markets could increase our cost of capital. Furthermore, raising capital through public or private sales of equity to finance acquisitions or expansion could cause earnings or ownership dilution to your shareholding interests in our company.
We have a significant amount of indebtedness, which could adversely affect our cash flow and our ability to operate our business and to fulfill our obligations under our indebtedness.
We have a significant amount of indebtedness. As of December 31, 2013, on an as adjusted basis after giving effect to this offering and the application of the net proceeds from this offering as described under “Use of Proceeds,”September 30, 2014, we would have had $$3,102 million of indebtedness outstanding in addition to $$345 million of availability under the revolving portion of our Credit
49
Facility (as defined in “Description of Certain Indebtedness”), after taking into account the availability reduction of $$60 million for letters of credit issued under the revolving portion. Of this indebtedness, none will be due on or before the end of 2014.2015. See “Description of Certain Indebtedness—Senior Secured Credit Facilities” for a description of the amendments to the Credit Facility after December 31, 2013. Our substantial level of indebtedness will increase the possibility that we may not generate enough cash flow from operations to pay, when due, the principal of, interest on or other amounts due in respect of, these obligations. Other risks relating to ourlong-term indebtedness include:
In addition, it is possible that we may need to incur additional indebtedness in the future in the ordinary course of business. The terms of our Credit Facility, the indentures governing ourthe 2016 Notes and ourthe 2019 Notes (each as defined in “Description of Certain Indebtedness”) allow us to incur additional debt subject to certain limitations. If new debt is added to current debt levels, the risks described above could intensify. In addition, our inability to maintain certain leverage ratios could result in acceleration of a portion of our debt obligations and could cause us to be in default if we are unable to repay the accelerated obligations.
The terms of our debt covenants could limit our discretion in operating our business and any failure to comply with such covenants could result in the default of all of our debt.
The agreements governing our indebtedness contain and the agreements governing our future indebtedness will likely contain various covenants, including those that restrict our or our subsidiaries’ ability to, among other things:
These covenants may limit our ability to effectively operate our businesses or maximize stockholder value. In addition, our Credit Facility requires that we meet certain financial tests, including the maintenance of a leverage ratio and a minimum net worth. Our ability to satisfy these tests may be affected by factors and events beyond our control, and we may be unable to meet such tests in the future.
Any failure to comply with the restrictions of our Credit Facility, the indentures governing our 2016 Notes and our 2019 Notes or any agreement governing our other indebtedness may result in an event of default under those agreements. Such default may allow the creditors to accelerate the related debt, which may trigger cross-acceleration or cross-default provisions in other debt. In addition, lenders may be able to terminate any commitments they had made to supply us with further funds.
We are exposed to interest rate fluctuations.
Our floating rate indebtedness exposes us to fluctuations in prevailing interest rates. To reduce the impact of large fluctuations in interest rates, we typically hedge a portion of our interest rate risk by entering into derivative agreements with financial institutions. Our exposure to interest rates relates primarily to our borrowings under the Credit Facility. See “Description of Certain Indebtedness.”
The derivative agreements that we use to manage the risk associated with fluctuations in interest rates may not be able to eliminate the exposure to these changes. Interest rates are sensitive to numerous factors outside of our control, such as government and central bank monetary policy in the jurisdictions in which we operate. Depending on the size of the exposures and the relative movements of interest rates, if we choose not to hedge or fail to effectively hedge our exposure, we could experience a material adverse effect on our results of operations and financial condition. As of December 31, 2013,2014, we have entered into floating-to-fixedforward starting interest rate swaps with a 1% floor that effectively convert $750 million of floating interest rate senior secured debt into a fixed rate obligation.obligation for a three year period starting December 31, 2015. See “Management’s Discussion and Analysis of Financial Condition and Results of Operations—Quantitative and Qualitative Disclosures about Market Risk—Interest Rate Risk.”
We are exposed to exchange rate fluctuations.
We conduct various operations outside the United States, primarily in Canada, South America, Europe, Australia and Asia. For the years ended December 31, 2013 and 2012, we incurred $682 million and $708 million in foreign currency operating expenses, representing approximately 25% and 23% of our total
50
operating expenses, respectively. Our most significant foreign currency operating expenses are in the Euro, representing approximately 9% and 7% of our operating expenses for the years ended December 31, 2013 and December 31, 2012, respectively. As a result, we face exposure to movements in currency exchange rates. These exposures include but are not limited to:
Depending on the size of the exposures and the relative movements of exchange rates, if we choose not to hedge or fail to hedge effectively our exposure, we could experience a material adverse effect on our results of operations and financial condition. As we have seen in some recent periods, in the event of severe volatility in exchange rates, these exposures can increase, and the impact on our results of operations and financial condition can be more pronounced. In addition, the current environment and the increasingly global nature of our business have made hedging these exposures more complex and costly.
To reduce the impact of this earnings volatility, we hedge approximately 43% of our foreign currency exposure by entering into foreign currency forward contracts on several of our largest foreign currency exposures, including the Euro, the British Pound Sterling, the Polish Zloty and the Indian Rupee. In 2013, we hedged approximately 43% of our foreign currency exposure. The notional amounts of these forward contracts, totaling $123$151 million at December 31, 2013,September 30, 2014, represent obligations to purchase foreign currencies at a predetermined exchange rate to fund a portion of our expenses that are denominated in foreign currencies. Such derivative instruments areshort-term in nature and not designed to hedge against currency fluctuation that could impact our foreign currency denominated revenue or gross profit.cost of revenue. See “Management’s Discussion and Analysis of Financial Condition and Results of Operations—Quantitative and Qualitative Disclosures about Market Risk—Foreign Currency Risk” and Note 12, Derivatives, to our unaudited consolidated financial statements included elsewhere in this prospectus. Although we have increased and may continue to increase the scope, complexity and duration of our foreign exchange risk management strategy, our current or future hedging activities may not sufficiently protect us from the adverse effects of currency exchange rate movements. Moreover, we make a number of estimates in conducting hedging activities, including in some cases the level of future bookings, cancellations, refunds, customer stay patterns and payments in foreign currencies. In the event those estimates differ significantly from actual results, we could experience greater volatility as a result of our hedging activities.
The terms of our debt covenants could limit our discretion in operating our business and any failure to comply with such covenants could result in the default of all of our debt.
The agreements governing our indebtedness contain and the agreements governing our future indebtedness will likely contain various covenants, including those that restrict our or our subsidiaries’ ability to, among other things:
51
These covenants may limit our ability to effectively operate our businesses or maximize stockholder value. In addition, our Credit Facility requires that we meet certain financial tests, including the maintenance of a leverage ratio and a minimum net worth. Our ability to satisfy these tests may be affected by factors and events beyond our control, and we may be unable to meet such tests in the future.
Any failure to comply with the restrictions of our Credit Facility, the indentures governing the 2016 Notes and the 2019 Notes or any agreement governing our other indebtedness may result in an event of default under those agreements. Such default may allow the creditors to accelerate the related debt, which may triggercross-acceleration orcross-default provisions in other debt. In addition, lenders may be able to terminate any commitments they had made to supply us with further funds.
Risks Related to the Offering and Ourour Common Stock
An active trading market may not develop or be sustained.
Although we intend to list our common stock on the NASDAQ, it is possible that, after this offering, an active trading market will not develop or continue. As a result, shareholders may have difficulty selling their shares or selling their shares at a certain price. In addition, the initial public offering price or future price of our common stock may not reflect our actual financial performance.
The initial public offering price per share of our common stock will be determined by negotiation among us and the representatives of the underwriters and may not be indicative of the price at which the shares of our common stock will trade in the public market after this offering.
The market price and trading volume of our common stock may be volatile, which could result in rapid and substantial losses for our stockholders.
Even if an active trading market develops,Since our initial public offering on April 17, 2014 through January 23, 2015, the price of our common stock has ranged from a low of $14.86 on October 14, 2014 to a high of $20.91 on June 19, 2014. In the future, the market price of our common stock may be highly volatile and could be subject to wide fluctuations. In addition, the trading volume in our common stock may fluctuate and cause significant price variations to occur. If the market price of our common stock declines significantly, you may be unable to resell your shares at or above the price at which you purchased them, if at all. The market price of our common stock may fluctuate or decline significantly in the future. Factors that could negatively affect our share price or result in fluctuations in the price or trading volume of our common stock include, but are not limited to, those listed elsewhere in this “Risk Factors” section and the following, some of which are beyond our control regardless of our actual operating performance:
52
Volatility in our stock price could also make us less attractive to certain investors, and/or invite speculative trading in our common stock or debt instruments.
In addition, securities exchanges, and in particular the NASDAQ, have experienced extreme price and volume fluctuations that have affected and continue to affect the market prices of equity securities of many technology companies. In the past, stockholders have instituted securities class action litigation following periods of market volatility. If we were involved in securities litigation, we could incur substantial costs and our resources and the attention of management could be diverted from our business.
Maintaining and improving our financial controls and the requirements of being a public company may strain our resources, divert management’s attention and affect our ability to attract and retain qualified board members.
As a public company, we will beare subject to the reporting requirements of the Securities Exchange Act of 1934 (the “Exchange Act”), theSarbanes-Oxley Act of 2002 (the “Sarbanes-Oxley“Sarbanes-Oxley Act”), theDodd-Frank Wall Street Reform and Consumer Protection Act of 2010 (the “Dodd-Frank“Dodd-Frank Act”) and the NASDAQ rules. TheFollowing our initial public offering, the requirements of these rules and regulations have increased and will continue to significantly increase our legal and financial compliance costs, including costs associated with the hiring of additional personnel, making some activities more difficult,time-consuming or costly, and may also place undue strain on our personnel, systems and resources. The Exchange Act requires, among other things, that we file annual, quarterly and current reports with respect to our business and financial condition.
TheSarbanes-Oxley Act requires, among other things, that we maintain disclosure controls and procedures and internal control over financial reporting. Ensuring that we have adequate internal financial and accounting
53
controls and procedures in place is a costly andtime-consuming effort that needs to bere-evaluated frequently. We have documented our internal controls and are in the initial stageprocess of documenting our internal control procedures and have not begun testing these procedurescontrols in order to comply with the requirements of Section 404 of theSarbanes-Oxley Act (“Section 404”). Section 404 will require that we evaluate our internal control over financial reporting to enable management to report on, and our independent auditors to audit as of the end of our fiscal year ended December 31, 2015, the effectiveness of those controls. Both we and our independent registered public accounting firm will be testing our internal controls in connection with the Section 404 requirements and could, as part of that documentation and testing, identify material weaknesses, significant deficiencies or other areas for further attention or improvement.
Implementing any appropriate changes to our internal controls may require specific compliance training for our directors, officers and employees, require the hiring of additional finance, accounting and other personnel, entail substantial costs to modify our existing accounting systems, and take a significant period of time to complete. Such changes may not, however, be effective in maintaining the adequacy of our internal controls, and any failure to maintain that adequacy, or consequent inability to produce accurate financial statements on a timely basis, could increase our operating costs and could materially impair our ability to operate our business.
Moreover, adequate internal controls are necessary for us to produce reliable financial reports and are important to help prevent fraud. As a result, our failure to satisfy the requirements of Section 404 on a timely basis could result in the loss of investor confidence in the reliability of our financial statements, which in turn could cause the market value of our common stock to decline.
Various rules and regulations applicable to public companies make it more difficult and more expensive for us to maintain directors’ and officers’ liability insurance, and we may be required to accept reduced coverage or incur substantially higher costs to maintain coverage. If we are unable to maintain adequate directors’ and officers’ liability insurance, our ability to recruit and retain qualified officers and directors, especially those directors who may be deemed independent for purposes of the NASDAQ rules, will be significantly curtailed.
If you invest in this offering, you will experience immediate and substantial dilution.
We expect that the initial public offering price of our common stock will be substantially higher than the pro forma net tangible book value per share issued and outstanding immediately after this offering. Our pro forma net tangible book value per share as of December 31, 2013 was approximately $ and represents the amount of book value of our total tangible assets minus the book value of our total liabilities, divided by the number of our shares of common stock then issued and outstanding. Investors who purchase common stock in this offering will pay a price per share that substantially exceeds the net tangible book value per share of common stock. If you purchase shares of our common stock in this offering, you will experience immediate and substantial dilution of $ in the pro forma net tangible book value per share, based upon the initial public offering price of $ per share (the midpoint of the estimated initial public offering price range set forth on the cover of this prospectus). Investors that purchase common stock in this offering will have purchased % of the shares issued and outstanding immediately after the offering, but will have paid % of the total consideration for those shares. See “Dilution.”
Concentration of ownership among our Principal Stockholders may prevent new investors from influencing significant corporate decisions and may result in conflicts of interest.
Upon consummationAs of January 15, 2015, our Principal Stockholders own, in the aggregate, approximately 79.3% of our outstanding common stock and, upon completion of this offering, ourthe Principal Stockholders will own, in the aggregate, approximately % of our outstanding common stock, and will own, in the aggregate, approximately %assuming no exercise of our outstanding common stock if the underwriters’ option to purchase additional shares is fully exercised.from the Principal Stockholders. Pursuant to the Stockholders’ Agreement at the completion of this offering, the Silver Lake Funds and the TPG Funds will have the right to designate for nomination two directors and three directors, respectively, and as a result of which directors have been designated by the Silver Lake Funds and directors have been designated by the TPG Funds, which number of directors collectively representswill represent a majority of the members of our board of directors. In addition, the Silver Lake Funds and the TPG Funds also jointly have the right to designate for nomination in the future, in connection with the expansion of our board of directors by one member, one additional director, defined herein as the Joint Designee, who must qualify as independent under the NASDAQ rules and must meet the additional independence requirements ofRule 10A-3 of the Exchange Act.Act so long as they collectively own at least 10% of their collective Closing Date Shares (as defined in “Certain Relationships and Related Party Transactions—Stockholders’ Agreement”). As a result, the Principal Stockholders are and, following completion of this offering, will continue to be, able to exercise significant influence over all matters requiring stockholder approval, including: the election of directors; approval of mergers or a sale of all or substantially all of our assets and other significant corporate transactions; and the amendment of our Certificate of Incorporation (as defined herein) and our Bylaws (as(each as defined herein)in “Description of Capital Stock”). This concentration of influence may delay, deter or prevent acts that would be favored by our other stockholders, who may have interests different from those of our Principal Stockholders. For example, our Principal Stockholders could delay or prevent an acquisition or merger deemed beneficial to other stockholders, or seek to cause us to take courses of action that, in their judgment, could enhance their investment in us, but which might involve risks to our other stockholders or adversely affect us or our other stockholders, including investors in this offering. Our Principal Stockholders may be able to cause or prevent a change in control of us or a change in the composition of our board of directors and could preclude any unsolicited acquisition of us. This may have the effect of delaying, preventing or deterring a change in control. In addition, this significant
54
concentration of share ownership may adversely affect the trading price of our common stock because investors often perceive disadvantages in owning common stock in companies with Principal Stockholders.
We expectare and, upon completion of this offering, will continue to be a “controlled company” within the meaning of the NASDAQ rules and, as a result, we will qualify for exemptions from certain corporate governance requirements. You may not have the same protections afforded to stockholders of companies that are subject to such requirements.
Because the Principal Stockholders will own a majority of our outstanding common stock, following thewe are and, upon completion of this offering, we will continue to be considered a “controlled company” as that term is set forth in the NASDAQ rules. Under these rules, a company of which more than 50% of the voting power is held by another person or group of persons acting together is a “controlled company” and may elect not to comply with certain NASDAQ rules regarding corporate governance, including:
Following this offering, we intend to utilize these exemptions. As a result, we may not have a majority of independent directors and our governance and nominating committee and compensation committee may not consist entirely of independent directors. See “Management and Board of Directors—Board Composition” and “Management and Board of Directors—Committees of the Board of Directors” for a description of the current composition of our board of directors and each of our committees. As a result, you may not have the same protections afforded to stockholders of companies that are subject to all of the NASDAQ rules regarding corporate governance. Our status as a controlled company could make our common stock less attractive to some investors or otherwise harm our stock price.
Future issuances of debt or equity securities by us may adversely affect the market price of our common stock.
After this offering, assuming the underwriters exercise their option to purchase additional shares in full,As of January 15, 2015, we will have an aggregate of 697,554,321 shares of common stock authorized but unissued and not reserved for issuance under our incentive plans. We may issue all of these shares of common stock without any action or approval by our stockholders, subject to certain exceptions.
In the future, we may attempt to obtain financing or to increase further our capital resources by issuing additional shares of our common stock or offering debt or other equity securities, including commercial paper,medium-term notes, senior or subordinated notes, debt securities convertible into equity or shares of preferred stock. Future acquisitions could require substantial additional capital in excess of cash from operations. We would expect to finance the capital required for acquisitions through a combination of additional issuances of equity, corporate indebtedness,asset-backed acquisition financing and/or cash from operations. In addition, we also expect to issue additional shares in connection with exercise of our stock options under our incentive plans.
Issuing additional shares of our common stock or other equity securities or securities convertible into equity for financing or in connection with our incentive plans, acquisitions or otherwise may dilute the economic and voting rights of our existing stockholders or reduce the market price of our common stock or both. Upon liquidation, holders of our debt securities and preferred shares, if issued, and lenders with respect to other borrowings would receive a distribution of our available assets prior to the holders of our common stock. Debt securities convertible into equity could be subject to adjustments in the conversion ratio pursuant to which certain events may increase the number of equity securities issuable upon conversion. Preferred shares, if issued, could have a preference with respect to liquidating distributions or a preference with respect to dividend payments that
55
could limit our ability to pay dividends to the holders of our common stock. Our decision to issue securities in any future offering will depend on market conditions and other factors beyond our control, which may adversely affect the amount, timing or nature of our future offerings. Thus, holders of our common stock bear the risk that our future offerings may reduce the market price of our common stock and dilute their stockholdings in us. See “Description of Capital Stock.”
Future salesThe market price of our common stock orcould decline due to the perception in the public markets that these sales may occur, may depresslarge number of outstanding shares of our common stock price.eligible for future sale.
Sales of substantial amounts of our common stock in the public market after this offering,in future offerings, or the perception that these sales could occur, could adversely affectcause the market price of our common stock to decline. These sales could also make it more difficult for us to sell equity or equity-related securities in the future, at a time and could impair our ability to raise capital throughprice that we deem appropriate. In addition, the additional sale of additional shares. Upon completion of this offering, we will have shares ofour common stock outstandingby our officers, directors and shares ifPrincipal Stockholders in the underwriters’ optionpublic market, or the perception that such sales may occur, could cause the market price of our common stock to purchase additional shares is fully exercised.
decline. All of the shares of common stock (or shares ifsold by the underwriters exercise their option to purchase additional shares in full) soldSelling Stockholders in this offering will be freely tradable without restrictionsrestriction or further registration under the Securities ActAct. See “Shares Eligible for Future Sale” for a more detailed description of 1933 (“Securities Act”), except for anythe restrictions on selling shares of our common stock after this offering.
We may issue shares of our common stock or other securities from time to time as consideration for, or to finance, future acquisitions and investments or for other capital needs. We cannot predict the size of future issuances of our shares or the effect, if any, that future sales and issuances of shares would have on the market price of our common stock. If any such acquisition or investment is significant, the number of shares of common stock or the number or aggregate principal amount, as the case may be, heldof other securities that we may issue may in turn be substantial and may result in additional dilution to our shareholders. We may also grant registration rights covering shares of our common stock or acquired by our directors, executive officersother securities that we may issue in connection with any such acquisitions and other affiliates, as that term is defined in the Securities Act, which will be restricted securities under the Securities Act. Restricted securities may not be sold in the public market unless the sale is registered under the Securities Act or an exemption from registration is available.investments.
We, each of our executive officers, directors the Principal Stockholders and the selling stockholdersSelling Stockholders have agreed with the underwriters not to transfer or dispose of, directly or indirectly, any shares of common stock or any securities convertible into or exercisable or exchangeable for shares of common stock, for a period of 18090 days after the date of this prospectus, except for certain limited exceptions. See “Underwriting (Conflicts of Interest).“Underwriting.” Approximately shares, or % of outstanding shares of our common stock or % of outstanding shares of our common stock if the underwriters’ option to purchase additional shares of common stockfrom the Principal Stockholders is fully exercised, are subject to theselock-up agreements.
After the expiration of the90-daylock-up period under thelock-up period, agreement these shares may be sold in the public market, subject to prior registration or qualification for an exemption from registration, including, in the case of shares held by affiliates, compliance with the volume restrictions and other securities laws. See “Shares Eligible for Future Sale” for a more detailed description of the restrictions on selling shares of our common stock after this offering. To the extent that any of these stockholders sell, or indicate an intent to sell, substantial amounts of our common stock in the public market after the contractuallock-ups and other legal restrictions on resale discussed in this prospectus lapse, the trading price of our common stock could decline significantly.
Morgan Stanley & Co. LLC and Goldman, Sachs & Co., on behalf of the underwriters, may, in theirits sole discretion, release all or some portion of the shares subject to the 180-day lock-up90-daylock-up agreements prior to expiration of such period. However, any such release by Goldman, Sachs & Co. would not impact the transfer restrictions in the Management Stockholders’ Agreement as described below, to the extent they have not been waived.
Pursuant to the Management Stockholders’ Agreement (as defined in “Certain Relationships and Related Party Transactions—Management Stockholders’ Agreement”), certain stockholders, which group of stockholders
56
excludes our Principal Stockholders, have agreed not to transfer, sell, assign, pledge, hypothecate or encumber any of the shares of common stockthen-currently owned by such stockholder (which can be waived by us at our option at any time), subject to certain limited exceptions, at any time prior to the termination of such Management Stockholders’ Agreement. The restrictions on transfer have been waived with effect from October 14, 2014 for certain of our former employees who are party to the Management Stockholders’ Agreement holding approximately 3 million shares of common stock and 2 million stock options and with effect from November 21, 2014 for certain of our current and former employees who are party to the Management Stockholders’ Agreement holding approximately 1.3 million shares of common stock and 4.2 million stock options. In addition, the Management Stockholders’ Agreement provides these stockholders with piggyback registration rights to participate on a pro rata basis in any registered offering in which the TPG Funds or the Silver Lake Funds are registering shares of common stock. Except with respect to the piggyback registration rights described immediately prior, the Management Stockholders’ Agreement terminates if our common stock is registered and if at least 20% of our total outstanding common stock trades regularly in, on or through the facilities of a securities exchange and/orinter-dealer quotation system or any designated offshore securities market, which conditions are expected to be met in connection with the completion of this offering, assuming the Selling Stockholders sell at least 5,415,142 shares. If the Management Stockholders’ Agreement does not terminate, the transfer restrictions contained therein would continue to be applicable except to the extent they are waived.
To the extent that any of these stockholders sell, or indicate an intent to sell, substantial amounts of our common stock in the public market the trading price of our common stock could decline significantly.
Certain provisions of our Stockholders’ Agreement, our Certificate of Incorporation, our Bylaws and Delaware law could hinder, delay or prevent a change in control of us that you might consider favorable, which could also adversely affect the price of our common stock.
Certain provisions under our Stockholders’ Agreement, our Certificate of Incorporation, our Bylaws and Delaware law could discourage, delay or prevent a transaction involving a change in control of our company, even if doing so would benefit our stockholders. These provisions include:
57
Anti-takeover provisions could substantially impede the ability of public stockholders to benefit from a change in control or change of our management and board of directors and, as a result, may adversely affect the market price of our common stock and your ability to realize any potential change of control premium. These provisions could also discourage proxy contests and make it more difficult for you and other stockholders to elect directors of your choosing and to cause us to take other corporate actions you desire. Because our board of directors is responsible for appointing the members of our management team, these provisions could in turn affect any attempt to replace current members of our management team. As a result, you may lose your ability to sell your stock for a price in excess of the prevailing market price due to these protective measures, and efforts by stockholders to change the direction or management of the company may be unsuccessful. See “Description of Capital Stock.”Stock” for additional information regarding the provisions included in our Certificate of Incorporation and our Bylaws.
We do not expectOur ability to pay anyregular dividends to our stockholders is subject to the discretion of our board of directors and may be limited by our holding company structure and applicable provisions of Delaware law.
We intend to continue to pay quarterly cash dividends foron our common stock. However, our board of directors may, in its sole discretion, change the foreseeable future.
Becauseamount or frequency of dividends or discontinue the payment of dividends entirely. In addition, because we are a holding company with no material direct operations, we are dependent on loans, dividends and other payments from our operating subsidiaries to generate the funds necessary to pay dividends on our common stock. OurWe expect to cause our subsidiaries are legally distinct fromto make distributions to us in an amount sufficient for us to pay dividends. However, their ability to make such distributions will be subject to their operating results, cash requirements and financial condition, the applicable provisions of Delaware law that may be prohibitedlimit the amount of funds available for distribution and our ability to pay cash dividends, compliance with covenants and financial ratios related to existing or restricted from payingfuture indebtedness, including under our Credit Facility and the 2019 Notes, and other agreements with third parties. In addition, each of the companies in our corporate chain must manage its assets, liabilities and working capital in order to meet all of its cash obligations, including the payment of dividends or otherwise making funds availabledistributions. As a consequence of these various limitations and restrictions, we may not be able to us under certain conditions. Our subsidiaries are currently restricted from paying cashmake, or may have to reduce or eliminate, the payment of dividends on our common stock by the covenants in our Credit Facility andstock. Any change in the indenture governing our 2019 Notes and may be further restricted by the terms of future debt or preferred securities. We do not anticipate that we will pay any cash dividends on shareslevel of our common stock fordividends or the foreseeable future. Any determination to pay dividends in the future will be at the discretion of our board of directors and will depend upon results of operations, financial condition, contractual restrictions, restrictions imposed by applicable law and other factors our board of directors deems relevant. In addition, no dividend or distribution can be declared or paid with respectsuspension of the common stock, and we cannot redeem, purchase, acquire,
or retire for valuepayment thereof could adversely affect the common stock, unless and until the full amount of any unpaid dividends accrued on the Series A Preferred Stock has been paid or contemporaneously declared and paid.
Accordingly, if you purchase shares in this offering, realization of a gain on your investment will depend on the appreciation of themarket price of our common stock, which may never occur. Investors seeking cash dividends in the foreseeable future should not purchase our common stock.
Certain of our stockholders have the right to engage or invest in the same or similar businesses as us.
Our Principal Stockholders have other investments and business activities in addition to their ownership of us. Under our Certificate of Incorporation, the Principal Stockholders have the right, and have no duty to abstain
58
from exercising such right, to engage or invest in the same or similar businesses as us or which we propose to engage, including those lines of business deemed to be competing with us, do business with any of our clients, customers or vendorssuppliers or employ or otherwise engage any of our officers, directors or employees. If the Principal Stockholders or any of their officers, directors or employees acquire knowledge of a potential transaction that could be a corporate opportunity, they have, no duty, to the fullest extent permitted by applicable law, no duty to offer or communicate such corporate opportunity to us, our stockholders or our affiliates even if it is a corporate opportunity that we might reasonably have pursued. This may cause the strategic interests of our Principal Stockholders to differ from, and conflict with, the interests of our company and of our other shareholders in material respects.
Conflicts of interest may exist with respect to certain underwriters of this offering.
Affiliates of Morgan Stanley & Co. LLC, Goldman, Sachs & Co., and Merrill Lynch, Pierce, Fenner & Smith Incorporated, and Deutsche Bank Securities Inc., each an underwriterunderwriters of this offering, are lenders under our $352$405 million Revolving FacilityRevolver and our $1,775 million Term Loan B Facility (each as defined in “Description of Certain Indebtedness”). In addition, affiliates of Goldman, Sachs & Co. and Merrill Lynch, Pierce, Fenner & Smith Incorporated, and Deutsche Bank Securities Inc. are lenders under our $425 million Term C Facility (as defined in “Description of Certain Indebtedness”) and affiliates of SanfordLoan C. Bernstein & Co., LLC, an underwriter in this offering, hold a portion of our 2019 Notes.
It is expected that affiliates of Sanford C. Bernstein & Co., LLC will receive more than 5% of the net proceeds of this offering. In addition, the TPG Funds are affiliates of TPG Capital BD, LLC, an underwriter in its offering, and, as holders of a portion of our Series A Preferred Stock, we estimate they will receive more than 5% of the net proceeds of this offering, based upon an assumed initial public offering price of $ per share, the midpoint of the range set forth on the cover page of this prospectus.
Therefore, conflicts of interest could exist because underwriters or their affiliates could receive proceeds in this offering in addition to the underwriting discounts and commissions described in this prospectus.
We will have broad discretion in the use of a significant part of the net proceeds from this offering and may not use them effectively.
Our management intends to use the net proceeds from this offering in the manner described in “Use of Proceeds”, which includes approximately $ million for general corporate purposes. Therefore, our management will have broad discretion in the application of a significant portion of the net proceeds from this offering. The failure by our management to apply the funds that are designated for general corporate purposes effectively could affect our ability to operate and grow our business.
59
CAUTIONARY NOTE REGARDINGFORWARD-LOOKING STATEMENTS
Some of the statements contained in this prospectus constituteforward-looking statements.Forward-looking statements relate to expectations, beliefs, projections, future plans and strategies, anticipated events or trends and similar expressions concerning matters that are not historical facts, such as statements regarding our future financial condition or results of operations, our prospects and strategies for future growth, the development and introduction of new products, and the implementation of our marketing and branding strategies. In many cases, you can identifyforward-looking statements by terms such as “may,” “will,” “should,” “expects,” “plans,” “anticipates,” “believes,” “estimates,” “predicts,” “potential” or the negative of these terms or other comparable terminology.
Theforward-looking statements contained in this prospectus are based on our current expectations and assumptions regarding our business, the economy and other future conditions and are subject to risks, uncertainties and changes in circumstances that may cause events or our actual activities or results to differ significantly from those expressed in anyforward-looking statement. Although we believe that the expectations reflected in theforward-looking statements are reasonable, we cannot guarantee future events, results, actions, levels of activity, performance or achievements. Readers are cautioned not to place undue reliance on theseforward-looking statements. A number of important factors could cause actual results to differ materially from those indicated by theforward-looking statements, including, but not limited to, those factors described in “Risk Factors” and “Management’s Discussion and Analysis of Financial Condition and Results of Operations.” These factors include, without limitation, economic, business, competitive, market and regulatory conditions and the following:
60
61
These statements are based on current plans, estimates and projections, and therefore you should not place undue reliance on them.Forward-looking statements speak only as of the date they are made, and we undertake no obligation to update them publicly in light of new information or future events.
You should carefully consider the risks specified in the “Risk Factors” section of this prospectus and subsequent public statements or reports filed with or furnished to the Securities and Exchange Commission (the “SEC”), before making any investment decision with respect to our common stock. If any of these trends, risks or uncertainties actually occurs or continues, our business, financial condition or results of operations could be materially adversely affected, the trading prices of our common stock could decline and you could lose all or part of your investment. Allforward-looking statements attributable to us or persons acting on our behalf are expressly qualified in their entirety by this cautionary statement.
62
The“GDS-processed air bookings” share figures in this prospectus are calculated based on the total number of air bookings processed through the three GDSs, specifically Sabre, Amadeus, and Travelport (including the Worldspan, Galileo and Apollo systems). Measurements of suchGDS-processed air bookings are based primarily on Marketing Information Data Tapes and are supplemented with other transaction data and estimates that we believe provide a more accurate measure ofGDS-processed air bookings. Because GDSs generally process air bookings for their joint venture partners and/or share in the economics of their joint venture partners’ travel transactions, we include theGDS-processed air booking volumes of each GDS’s joint venture partners in theGDS-processed air bookings share calculations. For example,GDS-processed air bookings from Abacus and INFINI Travel Information, Inc. (“Infini”) are included in ourGDS-processed air bookings volume and our estimate ofGDS-processed air bookings from Topas, Amadeus’ Korean joint venture partner, is included in the AmadeusGDS-processed air bookings volume.
Based on our internal estimates, we believeGDS-processed air bookings comprise approximately 75% of total air bookings processed throughthird-party distribution systems in 2013, with the remaining 25% comprised of air bookings processed through regional distribution systems that are not joint venture partners of one of the three GDSs. Due to the lack of available industry information on the number of air bookings processed by such regional distribution systems and through direct distribution channels we use the number ofGDS-processed air bookings as a proxy for the number of overall industry air bookings. Similarly, we believe industry air bookings share is a good proxy for overall GDS share in our Travel Network business because air bookings comprise the vast majority of the total bookings of the three GDSs.
TheGDS-processed air bookings used forGDS-processed air bookings share calculations do not necessarily correspond to the number of bookings billed by each GDS provider because not all processed bookings are billed due to the fact that each GDS provider has a different policy (often varying by region and supplier) as to which transactions processed through its GDS platform are billed.
The regional air bookings share figures in this prospectus are calculated based on the total number ofGDS-processed air bookings in each of the following four regions, with key countries orsub-regions identified:
The hospitality CRS hotel room share figures in this prospectus are calculated based on data for hotel rooms serviced bythird-party CRS providers and processed through our GDS. We estimate that approximately a quarter of global hotel properties are available through our GDS and believe this data to be the best available representation of the hotel market due to the lack of comprehensive industry data. Using this data, we compute CRS hotel room share based on total hotel room capacity hosted by the variousthird-party hospitality CRS providers. We believe this to be the most reliable measure of market share available to us. However, this metric is one we have only recently begun to measure and represents a snapshot in time, which prevents it from being able to convey a trend in market share over time. Therefore, we also include information in this prospectus regardingthird-party hospitality CRS bookings share of our GDS because that data is more consistently available for historical periods. Using our GDS data, we computethird-party hospitality CRS bookings share based on total bookings by the variousthird-party hospitality CRS providers over time. Though we believethird-party
63
hospitality CRS room share to be a more accurate representation of market share, we believethird-party hospitality CRS bookings share is a reasonable proxy to convey changes inthird-party hospitality CRS market share over time.
The “Customer Retention” rate figures in this prospectus are calculated as the aggregate of prior year revenue associated with customers that did not terminate their contract in the given year, as a percentage of the prior year revenue. Customer Retention for Travel Network is calculated based on travel agency contracts, and is measured based on revenue we earn from bookings made by those travel agencies. Customer Retention for Airline Solutions is calculated based on PBsfee-based revenue for our reservation contracts, our principal Airline Solutions offering. Customer Retention for Hospitality Solutions is based on CRS, digital marketing services and call center revenues, which represent over 90% of revenues of our Hospitality Solutions business in each period from 2011 through December 31, 2013. Customer Retention does not measure whether the revenue from any travel agency or reservations customer has increased in the given year compared to the prior year. For example, if ten travel agencies terminated their Travel Network contracts in 2013, and those travel agencies represented a combined 5% of Travel Network revenue in 2012, the Customer Retention for Travel Network in 2013 would be 95%.
The “Recurring Revenue” figures for our:
| (i) | Travel Network business is comprised of transaction, subscription and other revenue that is of a recurring nature from travel suppliers and travel buyers, and excludes revenue of anon-recurring nature, such asset-up fees and shortfall payments; |
| (ii) | Airline Solutions business is comprised ofvolume-based and subscription fees and other revenue that is of a recurring nature associated with various solutions, and excludes revenue of anon-recurring nature, such as license fees and consulting fees; and |
| (iii) | Hospitality Solutions business is comprised ofvolume-based and subscription fees and other revenue that is of a recurring nature associated with various solutions, and excludes revenue of anon-recurring nature, such asset-up fees and website development fees. |
Revenues in each of (i), (ii) and (iii) are tied to a travel supplier’s transaction volumes rather than to its unit pricing for an airplane ticket, hotel room or other travel product. However, this revenue is not generally contractually committed to recur annually under our agreements with our travel suppliers. As a result, our Recurring Revenue is highly dependent on the global travel industry and directly correlates with global travel, tourism and transportation transaction volumes. See “Risk Factors—Risks Related to Our Business and Industry—Our revenue is highly dependent on transaction volumes in the global travel industry, particularly air travel transaction volumes.”
We own or have rights to various trademarks, service marks and trade names that we use in connection with the operation of our business. This prospectus may also contain trademarks, service marks and trade names of third parties, which are the property of their respective owners. Our use or display of third parties’ trademarks, service marks, trade names or products in this prospectus is not intended to, and does not, imply a relationship with, or endorsement or sponsorship by, us. Solely for convenience, the trademarks, service marks and trade names referred to in this prospectus may appear without the®,TM orSM symbols, but such references are not intended to indicate, in any way, that we will not assert, to the fullest extent under applicable law, our rights or the right of the applicable licensor to these trademarks, service marks and trade names.
ClientBase, GetThere, lastminute.com, Sabre, Sabre Holdings, the Sabre logo, Sabre AirCentre, Sabre Airline Solutions, Sabre AirVision, Sabre Hospitality Solutions, Sabre Red, Sabre Travel Network, SabreSonic, TripCase, TruTrip and our other registered or common law trademarks, service marks or trade names appearing in this prospectus are the property of Sabre.
64
We have included both financial measures compiled in accordance with GAAP and certainnon-GAAP financial measures in this registration statement, of which this prospectus forms a part, including Adjusted Revenue, Adjusted Gross Margin, Adjusted Net Income, Adjusted EBITDA, Adjusted Capital Expenditures, Free Cash Flow, Adjusted Free Cash Flow and ratios based on these financial measures.
We define Adjusted Revenue as revenue adjusted for the amortization of Expedia SMA incentive payments, which are recorded as a reduction to revenue and are being amortized over the non-cancellable term of the Expedia SMA contract (see Note 3, Restructuring Charges, to our unaudited consolidated financial statements included elsewhere in this prospectus).
We define Adjusted Gross Margin as gross marginoperating income (loss) adjusted for selling, general and administrative expenses, impairments, depreciation and amortization, amortization of upfront incentive consideration, restructuring and depreciationother costs, litigation and amortization.taxes, including penalties, stock-based compensation and amortization of Expedia SMA incentive payments. The definition of Adjusted Gross Margin was revised in the first quarter of 2014 to adjust for restructuring and other costs, litigation and taxes, including penalties and stock-based compensation included in cost of revenue which differs from Adjusted Gross Margin presented in our prospectus filed with the SEC pursuant to Rule 424(b) under the Securities Act on April 17, 2014. Adjusted Gross Margin for the prior year periods has been recast to conform to our revised definition.
We define Adjusted Net Income as income (loss) from continuing operations adjusted for impairment, acquisition related amortization expense, loss (gain) on sale of business and assets, loss on extinguishment of debt, other expense (income), net, restructuring and other costs, litigation and taxes, including penalties,stock-based compensation, management fees, amortization of Expedia SMA incentive payments and tax impact of net income adjustments.
We define Adjusted EBITDA as Adjusted Net Income adjusted for depreciation and amortization of property and equipment, amortization of capitalized implementation costs, amortization of upfront incentive consideration, interest expense, net, and remaining (benefit) provision for income taxes. This Adjusted EBITDA metric differs from (i) the EBITDA metric referenced in the section entitled “Management’s Discussion and Analysis of Financial Condition and Results of Operations—Liquidity and Capital Resources—Senior Secured Credit Facilities”, which is calculated for the purposes of compliance with our debt covenants, and (ii) the Pre-VCPPre-VCP/EIP EBITDA and EBITDA metrics referenced in the section entitled “Compensation Discussion and Analysis”, which are calculated for the purposes of our annual incentive compensation program andperformance-based awards, respectively.
We define Adjusted Capital Expenditures as additions to property and equipment and capitalized implementation costs during the period presented.
We define Free Cash Flow as cash provided by operating activities less cash used in additions to property and equipment. We define Adjusted Gross MarginFree Cash Flow as Free Cash Flow plus the cash flow effect of restructuring and Adjusted EBITDAother costs, litigation settlement and tax payments for certain items, other litigation costs, management fees and the Travelocity working capital impact from the Expedia SMA and the sale of TPN (see “Management’s Discussion and Analysis of Financial Condition and Results of Operations—Factors Affecting our Results and Comparability—Travelocity”).
These non-GAAP financial measures are key metrics used by management and our board of directors to monitor our ongoing core operations because historical results have been significantly impacted by events that are unrelated to our core operations as a result of changes to our business and the regulatory environment. We believe that Adjusted Gross Margin, Adjusted Net Income, Adjusted EBITDA and Adjusted Capital Expendituresthese non-GAAP financial measures are used by investors, analysts and other interested parties as measures of financial performance and to evaluate our ability to service debt obligations, fund capital
65
expenditures and meet working capital requirements. Adjusted Capital Expenditures includes cash flows used in investing activities, for property and equipment, and cash flows used in operating activities, for capitalized implementation costs. Our management uses this combined metric in making product investment decisions and determining development resource requirements. We also believe that Adjusted Gross Margin, Adjusted Net Income, Adjusted EBITDA and Adjusted Capital Expenditures assist investors in company-to-company and period-to-period comparisons by excluding differences caused by variations in capital structures (affecting interest expense), tax positions and the impact of depreciation and amortization expense. In addition, amounts derived from Adjusted EBITDA are a primary component of certain covenants under our senior secured credit facilities.
Adjusted Revenue, Adjusted Gross Margin, Adjusted Net Income, Adjusted EBITDA, Adjusted Capital Expenditures, Free Cash Flow, Adjusted Free Cash Flow and ratios based on these financial measures are not recognized terms under GAAP. Adjusted Revenue, Adjusted Gross Margin, Adjusted Net Income, Adjusted EBITDA, Adjusted Capital Expenditures, Free Cash Flow, Adjusted Free Cash Flow and ratios based on these financial measures have important limitations as analytical tools, and should not be viewed in isolation and do not purport to be alternatives to net income as indicators of operating performance or cash flows from operating activities as measures of liquidity. Adjusted Revenue, Adjusted Gross Margin, Adjusted Net Income, Adjusted EBITDA, Adjusted Capital Expenditures, Free Cash Flow, Adjusted Free Cash Flow and ratios based on these financial measures exclude some, but not all, items that affect net income or cash flows from operating activities and these measures may vary among companies. Our use of Adjusted Revenue, Adjusted Gross Margin, Adjusted Net
Income, and Adjusted EBITDA, Adjusted Capital Expenditures, Free Cash Flow, Adjusted Free Cash Flow has limitations as an analytical tool, and you should not consider them in isolation or as substitutes for analysis of our results as reported under GAAP. Some of these limitations are:
See “Summary Historical and Pro Forma Consolidated Financial and Other Data,” “Selected Historical Consolidated Financial Data” and “Management’s Discussion and Analysis of Financial Condition and Results of Operations” for definitions ofnon-GAAP financial measures used in this prospectus and reconciliations thereof to the most directly comparable GAAP measures.
66
MARKET AND INDUSTRY DATA AND FORECASTS
This prospectus includes industry data and forecasts that we obtained from industry publications and surveys, public filings and internal company sources. Statements as to our ranking, market position and market estimates are based on independent industry publications, government publications,third-party forecasts and management’s estimates and assumptions about our markets and our internal research. We have included explanations of certain internal estimates and related methods provided in this prospectus along with these estimates. See “Business” and “Management’s Discussion and Analysis of Financial Condition and Results of Operations.” While we are not aware of any misstatements regarding our market, industry or similar data presented herein, such data involve risks and uncertainties and are subject to change based on various factors, including those discussed in “Cautionary Note RegardingForward-Looking Statements” and “Risk Factors” in this prospectus.
The T2RL information quoted or cited herein is the property of T2RL and is sourced from www.t2rl.net, copyright all rights reserved.
The Gartner material quoted or cited herein, (the “Gartner Material”) represent(s) data, research opinion or viewpoints published, as part of a syndicated subscription service, by Gartner, Inc., and are not representations of fact. The Gartner Material speaks as of its original publication date (and not as of the date of this filing) and the opinions expressed in the Gartner Material are subject to change without notice.
The Euromonitor material quoted or cited herein, (the “Euromonitor Material”) represent(s) data, research opinion or viewpoints published by Euromonitor International, LTD., and are not representations of fact. The Euromonitor Material speaks as of its original publication date (and not as of the date of this filing) and the opinions expressed in the Euromonitor Material are subject to change without notice.
67
We estimate that ourThe Selling Stockholders will receive all of the net proceeds from the sale of shares of our common stock offered by us will be approximately $ million or approximately $ million ifthem pursuant to this prospectus. The aggregate proceeds to the underwriters exercise their option to purchase additionalSelling Stockholders from the sale of shares in full (in each case, at an assumed initial public offering price of $ per share of common stock will be the midpointpurchase price of the price range set forth on the covershares of this prospectus), after deducting underwritingcommon stock less discounts and estimated offering expenses payable by us of approximately $ million.
commissions, if any. We will not receive any proceeds from the sale of ourthese shares of common stock, including from any exercise by the selling stockholders, including any shares sold by the selling stockholders pursuant to the underwriters’underwriters of their option to purchase additional shares. We will bear the costs, other than underwriting discounts and commissions and transfer taxes, associated with this offering in accordance with the Management Stockholders’ Agreement and the Registration Rights Agreement (as defined below), as applicable. See “Principal and Selling Stockholders” and “Underwriting.”
68
MARKET PRICE OF OUR COMMON STOCK
Our common stock has been listed on The selling stockholders will receive approximately $ million or approximately $ million ifNASDAQ Stock Market under the underwriters exercise their option to purchase additional sharessymbol “SABR” since it was listed on April 17, 2014 in full (in each case, at an assumedconnection with our initial public offering price of $ per share of common stock (the midpoint of the price range set forth on the cover of this prospectus) and after deducting the underwriting discount.
We intend to use the net proceeds from this offering to repay $ million of our outstanding indebtedness under the Term B Facility, Incremental Term Facility and/or Term C Facility (each as defined in “Description of Certain Indebtedness”) portion of our senior secured credit facilities. Such term loans mature in February 2019, February 2019 and December 2017, respectively, and, as of December 31, 2013, bear interest at a rate of LIBOR plus 4.00%, LIBOR plus 3.50% and LIBOR plus 3.00%, respectively and, as of , 2014, bear interest at a rate of %, % and %, respectively. We also intend to repay $ million aggregate principal amount of our 8.5% senior secured notes due May 2019, plus a call premium of $ million and accrued and unpaid interest of $ million through the date of redemption, assuming a redemption date of , 2014. We intend to use $ million to pay to TPG and Silver Lake, in the aggregate, a $21 million fee pursuant to the MSA, which will thereafter be terminated, and $ , the remaining portion of the net proceeds from this offering, to redeem the Series A Preferred Stock.
If the underwriters exercise their option to acquire additional shares of common stock, we intend to use any net proceeds we receive to repay additional outstanding indebtedness under our senior secured credit facilities. If the actual net proceeds of the offering increase for reasons other than the exercise of the underwriters’ option or if the actual net proceeds decrease, the cash component of the Redemption Payment made in respect of our Series A Preferred Stock will be adjusted as described below.
By establishing aoffering. Before then, there was no public market for our common stock, this offering is also intended to facilitatestock. The following table sets forth, for the periods indicated, the high and low sales prices of our future access to public markets.
A $1.00 increase (decrease) in the assumed initial public offering price of $ (the midpoint of the price range set forth on the cover of this prospectus) would increase (decrease) our estimated net proceeds to us from this offering by $ million, assuming the number of shares of common stock offeredas reported by us, as set forthThe NASDAQ Stock Market:
| High | Low | |||||||
Quarter ended June 30, 2014(1) | $ | 20.91 | $ | 15.00 | ||||
Quarter ended September 30, 2014 | $ | 20.26 | $ | 17.65 | ||||
Quarter ended December 31, 2014 | $ | 20.57 | $ | 14.86 | ||||
| (1) | Represents the period from April 17, 2014, the date on which our common stock first began trading on The NASDAQ Stock Market after the pricing of our initial public offering, through June 30, 2014, the end of our second fiscal quarter. |
On January 23, 2015, the last reported sale price on the coverThe NASDAQ Stock Market of this prospectus, remains the same and after deducting the underwriting discounts and commissions and estimated offering expenses payable by us. Similarly, a change in theour common stock was $20.71 per share. As of January 15, 2015, we had approximately 291 holders of record of our shares of common stock. A substantially greater number of shareholders are beneficial holders of our shares of common stock we sell would increase or decrease our net proceeds.
Prior to the closing of this offering, we will exercise our right to redeem all of our Series A Preferred Stock. The redemption price will be paid with a mix of cashin “street name” through banks, brokers and stock, which we will deliver pro rata to the holders thereof concurrently with the closing of this offering. Assuming we sell the total number of shares set forth on the cover of this prospectus at an initial public offering price equal to the midpoint of the price range on the cover of this prospectus, we will deliver an estimated aggregate of $ million in cash and shares of our common stock in payment of the related Redemption Payment as of March 31, 2014. Accordingly, such amounts do not take into account shares of our common stock to be issued in satisfaction of dividendsother financial institutions that accrue on or after April 1, 2014 and to, but excluding, the closing date of this offering. Each share of Series A Preferred Stock accumulates dividends at a rate of 6% per annum. See “Description of Capital Stock—Series A Preferred Stock.” Such dividends will accrue at a rate of $ per day in the aggregate and, assuming the shares of common stockare record holders.
are offered at $ per share (the midpoint of the estimated price range set forth on the cover of this prospectus), we will deliver approximately additional shares of our common stock in the Redemption.
A $1.00 increase in the estimated net proceeds of this offering would increase the aggregate cash component of the Redemption Payment by $1.00 and decrease the common stock component by shares, which represents a value of $1.00 based on the assumed offering price. Conversely, a $1.00 decrease in the estimated net proceeds of this offering would cause us to decrease the aggregate cash component of the Redemption Payment by $1.00 and to increase the common stock component by shares, which represents a value of $1.00 based on the assumed offering price. In all cases, the common stock will be valued at the initial public offering price.69
If the net proceeds increase due to a higher initial public offering price, we will use the additional proceeds to increase the cash component of the Redemption. By increasing the cash component of the Redemption, the number of shares of common stock issued in the share component of the Redemption will be reduced. In addition, the number of shares of common stock issued in the Redemption for each share of Series A Preferred Stock in the Redemption will be further reduced because the initial public offering price will be higher, which affects the redemption ratio between a share of Series A Preferred Stock to a share of common stock.
If the net proceeds decrease due to a lower initial public offering price, we will decrease the cash component of the Redemption. By reducing the cash component of the Redemption, the number of shares of common stock issued in the share component of the Redemption will be increased. In addition, the number of common shares issued in the Redemption for each share of Series A Preferred Stock in the Redemption will be further increased because the initial public offering price will be lower, which affects the redemption ratio between a share of Series A Preferred Stock to a share of common stock.
If the number of common shares we issue in this offering increases, we will use the additional proceeds to increase the cash component of the Redemption to the extent that such increase in the number of common shares also increases our aggregate net proceeds. In this case, the issuance of additional common shares in the offering will increase the number of common shares outstanding following this offering. The additional proceeds therefrom will increase the cash component of the Redemption and thereby reduce the number of shares of common stock issued in the share component of the Redemption.
If the number of common shares we issue in this offering decreases, we will decrease the cash component of the Redemption to the extent that such decrease in the number of common shares also decreases our aggregate net proceeds. In this case, the issuance of fewer common shares in the offering will decrease the number of common shares outstanding following this offering. The lower proceeds therefrom will decrease the cash component of the Redemption, and thereby increase the number of shares of common stock issued in the share component of the Redemption.
Certain affiliates of Sanford Bernstein & Co., LLC, an underwriter in this offering, hold a portion of our 2019 Notes. It is expected that these affiliates of Sanford C. Bernstein & Co., LLC will receive more than 5% of the net proceeds of the offering. Also, affiliates of TPG Capital BD, LLC, an underwriter in this offering, will own in excess of 10% of our issued and outstanding common stock following this offering. In addition, the TPG Funds are affiliates of TPG Capital BD, LLC and, as holders of a portion of the Series A Preferred Stock, we estimate will receive more than 5% of the net proceeds of this offering, based upon an assumed initial offering price of $ per share, the midpoint of the range set forth on the cover page of this prospectus. See “Underwriting (Conflicts of Interest).”
Our board of directors declared cash dividends of $0.09 per share of our common stock, which were paid on September 16, 2014 to shareholders of record as of September 1, 2014, and on December 30, 2014 to shareholders of record as of December 15, 2014. We do not expect to continue to pay quarterly cash dividends on our common stock, forsubject to the foreseeable future. Instead, we anticipate that allsole discretion of our earnings inboard of directors and the foreseeableconsiderations discussed below. We intend to fund any future will be used for the operation and expansion ofdividends from distributions made by our business.operating subsidiaries from their available cash generated from operations.
Future cash dividends, if any, will be at the discretion of our board of directors and the amount of cash dividends per share will depend upon, among other things, our future operations and earnings, capital requirements and surplus, general financial condition, contractual restrictions, number of shares of common stock outstanding and other factors the board of directors may deem relevant. The timing and amount of future dividend payments will be at the discretion of our board of directors. See “Risk Factors—We do not expectRisks Related to the Offering and our Common Stock—Our ability to pay any cashregular dividends forto our stockholders is subject to the foreseeable future.discretion of our board of directors and may be limited by our holding company structure and applicable provisions of Delaware law.”
Because we are a holding company with no material direct operations, we are dependent on loans, dividends and other payments from our operating subsidiaries to generate the funds necessary to pay dividends on our common stock. Our subsidiaries are currently restricted from paying cash dividends on our common stock in certain circumstances by the covenants in our Credit Facility and in the indenture governing ourthe 2019 Notes and may be further restricted by the terms of future debt or preferred securities. In addition, no
Our dividend or distribution can be declared or paidpolicy has certain risks and limitations, particularly with respect to liquidity. Although we expect to pay dividends according to our dividend policy, we may not pay dividends according to our policy, or at all, if, among other things, we do not have the cash necessary to pay our intended dividends. By paying cash dividends rather than saving or investing that cash, we risk, among other things, slowing the pace of the common stock,our growth and we cannot redeem, purchase, acquire,having insufficient cash to fund our operations or retire for value the common stock, unless and until the full amount of any unpaid dividends accrued on the Series A Preferred Stock has been paid or contemporaneously declared and paid.unanticipated capital expenditures.
For a discussion of the application of withholding taxes on dividends, see “Material U.S. Federal Income and Estate Tax Considerations toNon-U.S. Holders.”
70
The following table sets forth our cash and cash equivalents and our capitalization as of December 31, 2013:
historical basis.
You should read the following table in conjunction with the sections titled “Summary Historical and Pro Forma Consolidated Financial and Other Data,” “Selected Historical Consolidated Financial Data,” “Management’s Discussion and Analysis of Financial Condition and Results of Operations,” “Description of Certain Indebtedness” and our financial statements and related notes included elsewhere in this prospectus.
| As of December 31, 2013 (in thousands) | ||||||||||||
| Actual | As Adjusted (4) | As of September 30, 2014 | ||||||||||
| (unaudited) | (in thousands) | |||||||||||
Cash and cash equivalents | $ | 308,236 | $ | $ | 157,747 | |||||||
|
|
| ||||||||||
Long-term debt, including current portion: | ||||||||||||
2019 Notes | $ | 799,823 | $ | $ | 480,779 | |||||||
2016 Notes | 389,321 | 392,767 | ||||||||||
Credit Facility(1) | 2,456,980 | 2,131,681 | ||||||||||
Mortgage Facility | 83,541 | 82,631 | ||||||||||
|
| |||||||||||
Total Long-term debt | 3,729,665 | 3,087,858 | ||||||||||
Temporary Equity: | ||||||||||||
Series A redeemable preferred stock: $0.01 par value; 225,000,000 shares authorized; 87,229,703 shares issued and 87,184,179 shares outstanding on an actual basis and shares issued and outstanding on an as adjusted basis | 634,843 | |||||||||||
Stockholders’ deficit: | ||||||||||||
Sabre Corporation Class A Common Stock, $0.01 par value; 450,000,000 shares authorized; 178,633,409 shares issued and 178,491,568 shares outstanding on an actual basis and shares issued and outstanding on an as adjusted basis(2),(3) | 1,786 | |||||||||||
Stockholders’ equity: | ||||||||||||
Common Stock: $0.01 par value; 450,000,000 authorized shares; 265,224,958 and 178,633,409 shares issued, 264,787,572 outstanding | 2,652 | |||||||||||
Additional paid in capital | 880,619 | 1,911,172 | ||||||||||
Treasury Stock, at cost, 437,386 shares | (5,297 | ) | ||||||||||
Retained deficit | (1,785,554 | ) | (1,797,944 | ) | ||||||||
Accumulated other comprehensive loss | (49,895 | ) | (41,592 | ) | ||||||||
Non-controlling interest | 508 | 57 | ||||||||||
|
| |||||||||||
Total stockholders’ deficit | (952,536 | ) | ||||||||||
Total stockholders’ equity(2) | 69,048 | |||||||||||
|
| |||||||||||
Total capitalization | $ | 2,777,129 | $ | 3,156,906 | ||||||||
|
| |||||||||||
| (1) | As of |
| outstanding under the letter of creditsub-facility, which |
| (2) | The outstanding share information set forth above |
71
A $1.00 increase or decrease
72
UNAUDITED PRO FORMA FINANCIAL INFORMATION
In the fourth quarter of 2014, we committed to a plan to divest of our Travelocity business. On January 23, 2015, we completed the sale of our Travelocity business in the assumed initial public offering price of $ per shareUnited States and Canada. In addition, on December 16, 2014, we announced that we received a binding offer to acquire lastminute.com, the European portion of our common stock in this offering would increase cash and cash equivalents and decrease long-term debt by $ million, assuming we use % of the additional net proceedsTravelocity business, which is expected to repay debt and assuming the number of shares offered by us, as set forth on the cover of this prospectus remains the same and after deducting underwriting discounts and commissions and estimated offering expenses. Similarly, an increase or decreasebe completed in the numberfirst quarter of shares we sell in2015. Our Travelocity segment will have no remaining operations once the offering will increase or decrease our net proceeds by an amount equal to such number of shares multiplied by the public offering price, less underwriting discounts and commissions and estimated offering expenses.lastminute.com transaction is completed.
Because the number of shares of common stock issued for each share of our Series A Preferred Stock will be determined by reference to the initial public offering price, a change in the assumed initial public offering price would have a corresponding impact on the number of shares of common stock issued for shares of our Series A Preferred Stock pursuant to the Redemption upon the closing of this offering and the relative percentage ownership of the investors in this offering and our existing stockholders.
If the initial public offering price is equal to $ per share, the midpoint of the price range set forth on the cover of this prospectus, an aggregate of shares of our common stock would be issued in the share component of the Redemption upon the closing of this offering, assuming that the closing occurs on , 2014.
If you invest in our common stock, your ownership interest will be diluted to the extent of the difference between the initial public offering price per share of our common stock in this offering and theThe following unaudited pro forma as adjusted net tangible book value per share offinancial information is based on our common stockhistorical consolidated financial statements after giving effect to the Redemption and this offering. Dilution results from the fact that the per share offering pricedivestiture of our common stock is substantially in excess of the net tangible book value per share attributable to the existing equity holders. Net tangible book value per share represents the amount of temporary equity and stockholders’ equity excluding intangible assets, divided by the number of shares of common stock outstanding at that date.Travelocity business.
Our historical net tangible book valueThe unaudited pro forma consolidated balance sheet as of ,September 30, 2014, was $ million, or approximately $ per share of common stock (assuming shares of common stock outstanding).
After givinghas been prepared to give effect to the Redemption, ourdivestiture of the assets of the Travelocity business as if it occurred on September 30, 2014. The unaudited pro forma net tangible book valueconsolidated statement of operations for the nine months ended September 30, 2014 and the years ended December 31, 2013, 2012 and 2011 have been prepared to give effect to the divestiture of the Travelocity business as if it occurred on January 1, 2011.
The unaudited pro forma financial information was prepared utilizing our historical financial data derived from our unaudited consolidated financial statements and the notes thereto and from the audited consolidated financial statements and the notes thereto included elsewhere in this prospectus. The pro forma adjustments are described in the notes to the unaudited pro forma information and are based upon available information and assumptions that we believe are reasonable.
The unaudited pro forma financial information is for informational purposes only and is not necessarily indicative of , 2014what our financial performance and financial position would have been $ million, or approximately $had the transactions been completed on the dates assumed nor is such unaudited pro forma financial information necessarily indicative of the results to be expected in any future period.
73
SABRE CORPORATION
UNAUDITED PRO FORMA CONSOLIDATED BALANCE SHEET
AS OF SEPTEMBER 30, 2014
(in thousands, except share amounts)
| As Reported | (a) Divestiture in Travelocity Business | Pro Forma | ||||||||||
Assets | ||||||||||||
Current assets | ||||||||||||
Cash and cash equivalents | $ | 157,747 | $ | 280,000 | $ | 437,747 | ||||||
Restricted cash | 755 | — | 755 | |||||||||
Accounts receivable, net | 466,753 | (45,784 | ) | 420,969 | ||||||||
Prepaid expenses and other current assets | 56,315 | (17,966 | ) | 38,349 | ||||||||
Current deferred income taxes | 39,184 | — | 39,184 | |||||||||
Other receivables, net | 28,902 | — | 28,902 | |||||||||
Assets of discontinued operations | 9,364 | — | 9,364 | |||||||||
|
|
|
|
|
| |||||||
Total current assets | 759,020 | 216,250 | 975,270 | |||||||||
Property and equipment, net | 526,722 | (8,226 | ) | 518,496 | ||||||||
Investments in joint ventures | 142,639 | — | 142,639 | |||||||||
Goodwill | 2,152,590 | — | 2,152,590 | |||||||||
Trademarks and brandnames, net | 307,445 | (66,200 | ) | 241,245 | ||||||||
Other intangible assets, net | 261,581 | — | 261,581 | |||||||||
Other assets, net | 522,397 | (35,822 | ) | 486,575 | ||||||||
|
|
|
|
|
| |||||||
Total assets | $ | 4,672,394 | $ | 106,002 | $ | 4,778,396 | ||||||
|
|
|
|
|
| |||||||
Liabilities and stockholders’ equity | ||||||||||||
Current liabilities | ||||||||||||
Accounts payable | $ | 129,555 | $ | (1,939 | ) | $ | 127,616 | |||||
Travel supplier liabilities and related deferred revenue | 107,409 | (82,833 | ) | 24,576 | ||||||||
Accrued compensation and related benefits | 91,700 | (4,862 | ) | 86,838 | ||||||||
Accrued subscriber incentives | 168,019 | — | 168,019 | |||||||||
Deferred revenues | 176,990 | (2,357 | ) | 174,633 | ||||||||
Litigation settlement liability and related deferred revenue | 75,409 | — | 75,409 | |||||||||
Other accrued liabilities | 210,196 | (37,568 | ) | 172,628 | ||||||||
Current portion of debt | 22,418 | — | 22,418 | |||||||||
Liabilities of discontinued operations | 23,881 | — | 23,881 | |||||||||
|
|
|
|
|
| |||||||
Total current liabilities | 1,005,577 | (129,559 | ) | 876,018 | ||||||||
Deferred income taxes | 8,601 | 63,298 | 71,899 | |||||||||
Other noncurrent liabilities | 523,728 | (712 | ) | 523,016 | ||||||||
Long-term debt | 3,065,440 | — | 3,065,440 | |||||||||
Stockholders’ equity | ||||||||||||
Common Stock: $0.01 par value; 450,000,000 authorized shares; 265,224,958 shares issued and 264,787,572 outstanding | 2,652 | — | 2,652 | |||||||||
Additional paid-in capital | 1,911,172 | — | 1,911,172 | |||||||||
Treasury Stock, at cost, 437,386 shares | (5,297 | ) | — | (5,297 | ) | |||||||
Retained deficit | (1,797,944 | ) | 172,975 | (1,624,969 | ) | |||||||
Accumulated other comprehensive loss | (41,592 | ) | — | (41,592 | ) | |||||||
Noncontrolling interest | 57 | — | 57 | |||||||||
|
|
|
|
|
| |||||||
Total stockholders’ equity | 69,048 | 172,975 | 242,023 | |||||||||
|
|
|
|
|
| |||||||
Total liabilities and stockholders’ equity | $ | 4,672,394 | $ | 106,002 | $ | 4,778,396 | ||||||
|
|
|
|
|
| |||||||
74
SABRE CORPORATION
UNAUDITED PRO FORMA CONSOLIDATED STATEMENT OF OPERATIONS
FOR THE NINE MONTHS ENDED SEPTEMBER 30, 2014
(in thousands, except per share of common stock. Pro forma net tangible book valueamounts)
| Nine Months Ended September 30, 2014 | ||||||||||||
| As Reported | (b) Divestiture in Travelocity Business | Pro Forma | ||||||||||
Revenue | $ | 2,229,286 | $ | (244,011 | ) | $ | 1,985,275 | |||||
Cost of revenue | 1,399,919 | (84,250 | ) | 1,315,669 | ||||||||
Selling, general and administrative | 575,413 | (222,839 | ) | 352,574 | ||||||||
Restructuring charges (adjustments) | 2,325 | (2,929 | ) | (604 | ) | |||||||
|
|
|
|
|
| |||||||
Operating income | 251,629 | 66,007 | 317,636 | |||||||||
Other income (expense): | ||||||||||||
Interest expense, net | (167,332 | ) | — | (167,332 | ) | |||||||
Loss on extinguishment of debt | (33,538 | ) | — | (33,538 | ) | |||||||
Joint venture equity income | 9,367 | — | 9,367 | |||||||||
Other, net | 760 | (1,599 | ) | (839 | ) | |||||||
|
|
|
|
|
| |||||||
Total other expense, net | (190,743 | ) | (1,599 | ) | (192,342 | ) | ||||||
|
|
|
|
|
| |||||||
Income from continuing operations before income taxes | 60,886 | 64,408 | 125,294 | |||||||||
Provision for income taxes | 27,878 | 27,773 | 55,651 | |||||||||
|
|
|
|
|
| |||||||
Income from continuing operations | 33,008 | 36,635 | 69,643 | |||||||||
Net income attributable to noncontrolling interests | 2,168 | — | 2,168 | |||||||||
Preferred stock dividends | 11,381 | — | 11,381 | |||||||||
|
|
|
|
|
| |||||||
Net income from continuing operations available to common shareholders | $ | 19,459 | $ | 36,635 | $ | 56,094 | ||||||
|
|
|
|
|
| |||||||
Net income from continuing operations per share available to common shareholders: | ||||||||||||
Basic | $ | 0.08 | $ | 0.16 | $ | 0.24 | ||||||
Diluted | $ | 0.08 | $ | 0.15 | $ | 0.24 | ||||||
Weighted-average common shares outstanding: | ||||||||||||
Basic | 229,405 | 229,405 | ||||||||||
|
|
|
| |||||||||
Diluted | 237,994 | 237,994 | ||||||||||
|
|
|
| |||||||||
75
SABRE CORPORATION
UNAUDITED PRO FORMA CONSOLIDATED STATEMENT OF OPERATIONS
FOR THE YEAR ENDED DECEMBER 31, 2013
(in thousands, except per share represents the amountamounts)
| Year Ended December 31, 2013 | ||||||||||||
| As Reported | (b) Divestiture in Travelocity Business | Pro Forma | ||||||||||
Revenue | $ | 3,049,525 | $ | (525,979 | ) | $ | 2,523,546 | |||||
Cost of revenue | 1,904,850 | (199,687 | ) | 1,705,163 | ||||||||
Selling, general and administrative | 792,929 | (363,639 | ) | 429,290 | ||||||||
Impairment | 138,435 | (138,435 | ) | — | ||||||||
Restructuring charges | 36,551 | (28,388 | ) | 8,163 | ||||||||
|
|
|
|
|
| |||||||
Operating income | 176,760 | 204,170 | 380,930 | |||||||||
Other income (expense): | ||||||||||||
Interest expense, net | (274,689 | ) | — | (274,689 | ) | |||||||
Loss on extinguishment of debt | (12,181 | ) | — | (12,181 | ) | |||||||
Joint venture equity income | 12,350 | — | 12,350 | |||||||||
Other, net | (6,724 | ) | 6,419 | (305 | ) | |||||||
|
|
|
|
|
| |||||||
Total other expense, net | (281,244 | ) | 6,419 | (274,825 | ) | |||||||
|
|
|
|
|
| |||||||
(Loss) income from continuing operations before income taxes | (104,484 | ) | 210,589 | 106,105 | ||||||||
(Benefit) provision for income taxes | (14,029 | ) | 68,068 | 54,039 | ||||||||
|
|
|
|
|
| |||||||
(Loss) income from continuing operations | (90,455 | ) | 142,521 | 52,066 | ||||||||
Net income attributable to noncontrolling interests | 2,863 | — | 2,863 | |||||||||
Preferred stock dividends | 36,704 | — | 36,704 | |||||||||
|
|
|
|
|
| |||||||
Net (loss) income from continuing operations available to common shareholders | $ | (130,022 | ) | $ | 142,521 | $ | 12,499 | |||||
|
|
|
|
|
| |||||||
Net (loss) income from continuing operations per share available to common shareholders: | ||||||||||||
Basic | $ | (0.73 | ) | $ | 0.80 | $ | 0.07 | |||||
Diluted | $ | (0.73 | ) | $ | 0.80 | $ | 0.07 | |||||
Weighted-average common shares outstanding: | ||||||||||||
Basic | 178,125 | 178,125 | ||||||||||
|
|
|
| |||||||||
Diluted | 178,125 | 184,978 | ||||||||||
|
|
|
| |||||||||
76
SABRE CORPORATION
UNAUDITED PRO FORMA CONSOLIDATED STATEMENT OF OPERATIONS
FOR THE YEAR ENDED DECEMBER 31, 2012
(in thousands, except per share amounts)
| Year Ended December 31, 2012 | ||||||||||||
| As Reported | (b) Divestiture in Travelocity Business | Pro Forma | ||||||||||
Revenue | $ | 2,974,364 | $ | (592,216 | ) | $ | 2,382,148 | |||||
Cost of revenue | 1,819,235 | (244,049 | ) | 1,575,186 | ||||||||
Selling, general and administrative | 1,188,248 | (394,954 | ) | 793,294 | ||||||||
Impairment | 573,180 | (552,926 | ) | 20,254 | ||||||||
|
|
|
|
|
| |||||||
Operating loss | (606,299 | ) | 599,713 | (6,586 | ) | |||||||
Other income (expense): | ||||||||||||
Interest expense, net | (232,450 | ) | — | (232,450 | ) | |||||||
Gain on sale of business | 25,850 | — | 25,850 | |||||||||
Joint venture equity income | (2,513 | ) | — | (2,513 | ) | |||||||
Other, net | (1,385 | ) | (5,250 | ) | (6,635 | ) | ||||||
|
|
|
|
|
| |||||||
Total other expense, net | (210,498 | ) | (5,250 | ) | (215,748 | ) | ||||||
|
|
|
|
|
| |||||||
Loss from continuing operations before income taxes | (816,797 | ) | 594,463 | (222,334 | ) | |||||||
Benefit for income taxes | (195,071 | ) | 188,164 | (6,907 | ) | |||||||
|
|
|
|
|
| |||||||
Loss from continuing operations | (621,726 | ) | 406,299 | (215,427 | ) | |||||||
Net (loss) income attributable to noncontrolling interests | (59,317 | ) | 60,836 | 1,519 | ||||||||
Preferred stock dividends | 34,583 | — | 34,583 | |||||||||
|
|
|
|
|
| |||||||
Net loss from continuing operations available to common shareholders | $ | (596,992 | ) | $ | 345,463 | $ | (251,529 | ) | ||||
|
|
|
|
|
| |||||||
Net loss from continuing operations per share available to common shareholders: | ||||||||||||
Basic | $ | (3.37 | ) | $ | 1.95 | $ | (1.42 | ) | ||||
Diluted | $ | (3.37 | ) | $ | 1.95 | $ | (1.42 | ) | ||||
Weighted-average common shares outstanding: | ||||||||||||
Basic | 177,206 | 177,206 | ||||||||||
|
|
|
| |||||||||
Diluted | 177,206 | 177,206 | ||||||||||
|
|
|
| |||||||||
77
SABRE CORPORATION
UNAUDITED PRO FORMA CONSOLIDATED STATEMENT OF OPERATIONS
FOR THE YEAR ENDED DECEMBER 31, 2011
(in thousands, except per share amounts)
| Year Ended December 31, 2011 | ||||||||||||
| As Reported | (b) Divestiture in Travelocity Business | Pro Forma | ||||||||||
Revenue | $ | 2,855,961 | $ | (603,515 | ) | $ | 2,252,446 | |||||
Cost of revenue | 1,736,041 | (207,015 | ) | 1,529,026 | ||||||||
Selling, general and administrative | 806,435 | (414,127 | ) | 392,308 | ||||||||
Impairment | 185,240 | (185,240 | ) | — | ||||||||
|
|
|
|
|
| |||||||
Operating income | 128,245 | 202,867 | 331,112 | |||||||||
Other income (expense): | ||||||||||||
Interest expense, net | (174,390 | ) | — | (174,390 | ) | |||||||
Joint venture equity income | 23,501 | — | 23,501 | |||||||||
Other, net | 1,156 | (1,091 | ) | 65 | ||||||||
|
|
|
|
|
| |||||||
Total other expense, net | (149,733 | ) | (1,091 | ) | (150,824 | ) | ||||||
|
|
|
|
|
| |||||||
(Loss) income from continuing operations before income taxes | (21,488 | ) | 201,776 | 180,288 | ||||||||
Provision for income taxes | 57,806 | 9,004 | 66,810 | |||||||||
|
|
|
|
|
| |||||||
(Loss) income from continuing operations | (79,294 | ) | 192,772 | 113,478 | ||||||||
Net loss attributable to noncontrolling interests | (36,681 | ) | 22,359 | (14,322 | ) | |||||||
Preferred stock dividends | 32,579 | — | 32,579 | |||||||||
|
|
|
|
|
| |||||||
Net (loss) income from continuing operations available to common shareholders | $ | (75,192 | ) | $ | 170,413 | $ | 95,221 | |||||
|
|
|
|
|
| |||||||
Net (loss) income from continuing operations per share available to common shareholders: | ||||||||||||
Basic | $ | (0.43 | ) | $ | 0.96 | $ | 0.54 | |||||
Diluted | $ | (0.43 | ) | $ | 0.95 | $ | 0.52 | |||||
Weighted-average common shares outstanding: | ||||||||||||
Basic | 176,703 | 176,703 | ||||||||||
|
|
|
| |||||||||
Diluted | 176,703 | 181,889 | ||||||||||
|
|
|
| |||||||||
78
SABRE CORPORATION
NOTES TO UNAUDITED PRO FORMA FINANCIAL INFORMATION
Sale of temporary equity and stockholders’ equity excluding intangible assets, divided by the number of shares of common stock outstanding at , 2014 prior toTravelocity.com
On January 23, 2015, we announced the sale of sharesour global online travel business operated under the Travelocity brand (“Travelocity.com”) to Expedia, Inc., pursuant to the terms of our common stock in this offering but assuming the completionan asset purchase agreement (the “Purchase Agreement”), dated January 23, 2015, by and among Sabre GLBL Inc. and Travelocity.com LP, and Expedia. The signing and closing of the Redemption.
After giving effectPurchase Agreement occurred contemporaneously. Expedia purchased Travelocity.com pursuant to the RedemptionPurchase Agreement for cash consideration of $280 million. The Purchase Agreement contains customary representations and warranties, covenants and indemnities for a transaction of this nature. We expect to utilize the cash proceeds for general corporate purposes.
As a result of the sale of sharesTravelocity.com pursuant to the Purchase Agreement, the previously disclosed strategic marketing agreement, pursuant to which Expedia powered the technology platforms of common stockTravelocity’s existing U.S. and Canadian websites, and the related put/call arrangement, pursuant to which Expedia could have acquired, or we could have sold to Expedia, assets relating to Travelocity.com, have been terminated.
Binding offer for lastminute.com
On December 16, 2014, we announced that we had received a binding offer from Bravofly Rumbo Group to acquire lastminute.com, the European portion of our Travelocity business. The transaction will be completed through the transfer of net liabilities and is expected to close during first quarter of 2015. We will not receive any cash proceeds or any other significant consideration in the transaction. We cannot provide any assurance that this offering at an assumed initial public offering price of $ per share, the midpoint of the price range set forthtransaction will occur on the coverterms described herein or at all.
Continuing Cash Flows
Our Travel Network business earns revenue from airlines for bookings transacted through our GDS. Historically, Travel Network recognized intersegment incentive consideration expense for bookings generated by our Travelocity business. Such costs are representative of this prospectus,costs incurred on a consolidated basis relating to Travel Network’s revenue from airlines for bookings transacted through our GDS. The acquirer of Travelocity.com has signed, and after deducting the underwriting discounts and commissions,acquirer of lastminute.com has committed to sign as part of its binding offer, a long term agreement with our Travel Network business to continue to utilize our GDS for bookings which will generate incentive consideration to be paid by us to the estimated effect of the TRA and estimated offering expenses, our pro forma as adjusted net tangible book value as of , 2014 would have been approximately $ million or approximately $ per share of common stock. This amount represents an immediate increase in pro forma net tangible book value of $ per share to existing stockholders and an immediate dilution in pro forma net tangible book value of $ per share to purchasers of common stock in this offering, as illustrated in the following table.acquirers.
Pro Forma Adjustments
| (a) | ||||||||
| ||||||||
| ||||||||
| ||||||||
| ||||||||
| ||||||||
| ||||||||
A $1.00 increase or decrease in the assumed initial public offering price of $ per share would increase or decrease, as applicable, our pro forma as adjusted net tangible book value by approximately $ million or approximately $ per share, and the dilution in the pro forma as adjusted net tangible book value per share to investors in this offering by approximately $ per share, assuming the number of shares offered by us, as set forth on the cover of this prospectus, remains the same and after deducting underwriting discounts and commissions and estimated offering expenses. This pro forma information is illustrative only, and following the completion of this offering, will be adjusted based on the actual initial public offering price and other terms of this offering determined at pricing.
The following table summarizes, as of , 2014, on the pro forma basis described above, the differences between existing stockholders and new investors with respect to the number of shares of common stock purchased from us, the total consideration paid, and the average price per share of our common stock paid by existing stockholders. The calculation with respect to shares purchased by new investors in this offering reflects the issuance by us of shares of our common stock in this offering at an assumed initial public offering price of $ per share, the midpoint of the range set forth on the cover of this prospectus, before deducting the underwriting discounts and commissions and estimated offering expenses.
| ||||||||||||||||||
| ||||||||||||||||||
| if they occurred on September 30, 2014. | |||||||||||||||||
If the net proceeds increase due to a higher initial public offering price, we will use the additional proceeds to increase the cash component of the Redemption. By increasing the cash component of the Redemption, the number of shares of common stock issued in the share component of the Redemption will be reduced. In addition, the number of shares of common stock issued in the Redemption for each share of Series A Preferred Stock in the Redemption will be further reduced because the initial public offering price will be higher, which affects the redemption ratio between a share of Series A Preferred Stock to a share of common stock.
If the net proceeds decrease due to a lower initial public offering price, we will decrease the cash component of the Redemption. By reducing the cash component of the Redemption, the number of shares of common stock issued in the share component of the Redemption will be increased. In addition, the number of common shares issued in the Redemption for each share of Series A Preferred Stock in the Redemption will be further increased because the initial public offering price will be lower, which affects the redemption ratio between a share of Series A Preferred Stock to a share of common stock.
If the number of common shares we issue in this offering increases, we will use the additional proceeds to increase the cash component of the Redemption to the extent that such increase in the number of common shares also increases our aggregate net proceeds. In this case, the issuance of additional common shares in the offering will increase the number of common shares outstanding following this offering. The additional proceeds therefrom will increase the cash component of the Redemption and thereby reduce the number of shares of common stock issued in the share component of the Redemption.
If the number of common shares we issue in this offering decreases, we will decrease the cash component of the Redemption to the extent that such decrease in the number of common shares also decreases our aggregate net proceeds. In this case, the issuance of fewer common shares in the offering will decrease the number of common shares outstanding following this offering. The lower proceeds therefrom will decrease the cash component of the Redemption, and thereby increase the number of shares of common stock issued in the share component of the Redemption.
If the underwriters exercise their option to purchase additional shares in full from us, the number of shares of common stock held by new investors will increase to , or % of the total number of shares of our common stock outstanding after this offering and the number of shares of common stock held by existing stockholders will decrease to , or % of the total number of shares of our common stock outstanding after this offering.
The table below sets forth the number of shares of our common stock that would be issued in the Redemption, assuming the initial public offering prices for our common stock shown below and a closing on , 2014:
| ||||||||||||||||||||
| ||||||||||||||||||||
| ||||||||||||||||||||
| ||||||||||||||||||||
| ||||||||||||||||||||
| ||||||||||||||||||||
|
The sale of shares of common stock by the selling stockholders in this offering will reduce the number of shares held by existing stockholders, as of , 2014, to , or % of the total shares outstanding as of , 2014, and will increase the number of shares held by new investors to , or % of the total shares of common stock outstanding as of , 2014. In addition, if the underwriters exercise their option to purchase additional shares in full from the selling stockholders, the number of shares of common stock held by existing stockholders, as of , 2014, will be further reduced to , or % of the total number of shares of common stock outstanding as of , 2014, and the number of shares of common stock held by new investors will be further increased to shares, or % of the total shares of common stock outstanding as of , 2014.79
The discussion and table above assume no exercise of stock options outstanding and no issuance of shares reserved for issuance under our equity incentive plans and excludes shares of common stock to be issued in the share component of the Redemption assuming we sell in this offering the total number of shares set forth on the cover of the prospectus at an initial public offering price equal to the midpoint of the range set forth on the cover of this prospectus. As of , 2014, there were an aggregate of shares of common stock reserved for future issuance under the equity incentive plans. Following the closing of this offering, there will also be shares of common stock reserved for future issuance under the 2014 Omnibus Plan.
SELECTED HISTORICAL CONSOLIDATED FINANCIAL DATA
The following tables present selected historical consolidated financial data for our business. You should read these tables along with “Risk Factors,” “Use of Proceeds,” “Capitalization,” “Management’s Discussion and Analysis of Financial Condition and Results of Operations,” “Business” and our audited consolidated financial statements and the notes thereto included elsewhere in this prospectus.
The consolidated statements of operations data, consolidated statements of cash flows data and consolidated balance sheet data as of and for the nine months ended September 30, 2014 and 2013 are derived from our unaudited consolidated financial statements and the notes thereto included elsewhere in this prospectus. The unaudited consolidated financial statements have been prepared on the same basis as our audited consolidated financial statements and, in the opinion of our management, reflect all adjustments, consisting of normal recurring adjustments, necessary for a fair presentation of this data. The consolidated statements of operations data and consolidated statements of cash flows data for the years ended December 31, 2013, 2012 and 2011 and the consolidated balance sheet data as of December 31, 2013 and 2012 are derived from our audited consolidated financial statements and the notes thereto included elsewhere in this prospectus. The consolidated statements of operations data and consolidated statements of cash flows data for the years ended December 31, 2010 and 2009 and the consolidated balance sheet data as of December 31, 2011, 2010 and 2009 are derived from our unaudited consolidated financial statements and the notes thereto not included in this prospectus. The unaudited consolidatedhistorical financial statements have been prepared ondata include the same basis as our audited consolidated financial statements and, in the opinionresults of our management, reflect all adjustments, consistingTravelocity business, which, as of normal recurring adjustments, necessary for a fair presentation of this data.September 30, 2014, was included in continuing operations.
The historical consolidated results presented below are not necessarily indicative of the results to be expected for any future period.period, and results for any interim period presented below are not necessarily indicative of the results to be expected for the full year.
| Year Ended December 31, | Nine Months Ended September 30, | Year Ended December 31, | ||||||||||||||||||||||||||||||||||||||||||||||
| 2013 | 2012 | 2011 | 2010 | 2009 | 2014 | 2013 | 2013 | 2012 | 2011 | 2010 | 2009 | |||||||||||||||||||||||||||||||||||||
| (Amounts in thousands) | (Amounts in thousands) | |||||||||||||||||||||||||||||||||||||||||||||||
Consolidated Statements of Operations Data: | ||||||||||||||||||||||||||||||||||||||||||||||||
Consolidated Statements of Operations Data(1): | ||||||||||||||||||||||||||||||||||||||||||||||||
Revenue | $ | 3,049,525 | $ | 2,974,364 | $ | 2,855,961 | $ | 2,758,847 | $ | 2,577,391 | $ | 2,229,286 | $ | 2,303,399 | $ | 3,049,525 | $ | 2,974,364 | $ | 2,855,961 | $ | 2,758,847 | $ | 2,577,391 | ||||||||||||||||||||||||
Gross margin | 1,144,675 | 1,155,129 | 1,119,920 | 1,117,724 | 1,065,358 | |||||||||||||||||||||||||||||||||||||||||||
Cost of revenue | 1,399,919 | 1,423,242 | 1,904,850 | 1,819,235 | 1,736,041 | 1,636,132 | 1,503,323 | |||||||||||||||||||||||||||||||||||||||||
Selling, general and administrative | 792,929 | 1,188,248 | 806,435 | 784,186 | 797,240 | 575,413 | 620,226 | 792,929 | 1,188,248 | 806,435 | 789,177 | 805,961 | ||||||||||||||||||||||||||||||||||||
Impairment | 138,435 | 573,180 | 185,240 | 401,400 | 211,612 | — | 138,435 | 138,435 | 573,180 | 185,240 | 401,400 | 211,612 | ||||||||||||||||||||||||||||||||||||
Restructuring and other costs | 36,551 | — | — | — | — | |||||||||||||||||||||||||||||||||||||||||||
Restructuring charges | 2,325 | 15,889 | 36,551 | — | — | — | — | |||||||||||||||||||||||||||||||||||||||||
Operating income (loss) | 176,760 | (606,299 | ) | 128,245 | (67,862 | ) | 56,486 | 251,629 | 105,607 | 176,760 | (606,299 | ) | 128,245 | (67,862 | ) | 56,495 | ||||||||||||||||||||||||||||||||
Net loss attributable to Sabre Corporation | (100,494 | ) | (611,356 | ) | (66,074 | ) | (268,852 | ) | (158,734 | ) | ||||||||||||||||||||||||||||||||||||||
Net loss attributable to common shareholders | (137,198 | ) | (645,939 | ) | (98,653 | ) | (299,649 | ) | (102,441 | ) | ||||||||||||||||||||||||||||||||||||||
Basic and diluted loss per share attributable | ||||||||||||||||||||||||||||||||||||||||||||||||
to common shareholders | (0.77 | ) | (3.65 | ) | (0.56 | ) | (1.71 | ) | (0.59 | ) | ||||||||||||||||||||||||||||||||||||||
Weighted average common shares outstanding: | ||||||||||||||||||||||||||||||||||||||||||||||||
Basic and diluted | 178,125 | 177,206 | 176,703 | 175,655 | 174,535 | |||||||||||||||||||||||||||||||||||||||||||
Net income (loss) attributable to Sabre Corporation | 22,823 | (127,254 | ) | (100,494 | ) | (611,356 | ) | (66,074 | ) | (268,852 | ) | (158,734 | ) | |||||||||||||||||||||||||||||||||||
Net income (loss) attributable to common shareholders | 11,442 | (154,473 | ) | (137,198 | ) | (645,939 | ) | (98,653 | ) | (299,649 | ) | (102,441 | ) | |||||||||||||||||||||||||||||||||||
Basic and diluted income (loss) per share attributable to common shareholders | $ | 0.05 | $ | (0.87 | ) | $ | (0.77 | ) | $ | (3.65 | ) | $ | (0.56 | ) | $ | (1.71 | ) | $ | (0.59 | ) | ||||||||||||||||||||||||||||
Basic weighted average common shares outstanding | 229,405 | 178,051 | 178,125 | 177,206 | 176,703 | 175,655 | 174,535 | |||||||||||||||||||||||||||||||||||||||||
Diluted weighted average common shares outstanding | 237,994 | 178,051 | 178,125 | 177,206 | 176,703 | 175,655 | 174,535 | |||||||||||||||||||||||||||||||||||||||||
Consolidated Statements of Cash Flows Data: | ||||||||||||||||||||||||||||||||||||||||||||||||
Cash provided by operating activities | $ | 157,188 | $ | 312,336 | $ | 356,444 | $ | 380,928 | $ | 284,159 | $ | 121,679 | $ | 252,062 | $ | 157,188 | $ | 312,336 | $ | 356,444 | $ | 380,928 | $ | 284,159 | ||||||||||||||||||||||||
Cash used in investing activities | (191,949 | ) | (189,220 | ) | (246,502 | ) | (236,034 | ) | (176,260 | ) | (184,787 | ) | (108,053 | ) | ||||||||||||||||||||||||||||||||||
Cash (used in) provided by financing activities | (59,289 | ) | 274,717 | 262,172 | (25,120 | ) | (271,540 | ) | (48,500 | ) | (335,702 | ) | ||||||||||||||||||||||||||||||||||||
Additions to property and equipment | 226,026 | 193,262 | 164,638 | 130,028 | 106,554 | (160,385 | ) | (168,744 | ) | (226,026 | ) | (193,262 | ) | (164,638 | ) | (130,028 | ) | (106,554 | ) | |||||||||||||||||||||||||||||
Cash payments for interest | 255,620 | 264,990 | 184,449 | 195,550 | 251,812 | (157,412 | ) | (181,970 | ) | (255,620 | ) | (264,990 | ) | (184,449 | ) | (195,550 | ) | (251,812 | ) | |||||||||||||||||||||||||||||
Other Financial Data: | ||||||||||||||||||||||||||||||||||||||||||||||||
Adjusted Gross Margin | $ | 1,383,809 | $ | 1,389,862 | $ | 1,330,514 | $ | 1,302,762 | $ | 1,228,402 | $ | 1,044,076 | $ | 1,084,535 | $ | 1,419,047 | $ | 1,418,289 | $ | 1,333,754 | $ | 1,310,280 | $ | 1,243,403 | ||||||||||||||||||||||||
Adjusted Net Income | 217,151 | 150,886 | 236,166 | 205,955 | 195,320 | |||||||||||||||||||||||||||||||||||||||||||
Adjusted Net Income from continuing operations | 158,829 | 147,697 | 217,151 | 150,886 | 236,166 | 205,955 | 195,320 | |||||||||||||||||||||||||||||||||||||||||
Adjusted EBITDA | 791,323 | 786,629 | 720,163 | 691,016 | 627,179 | 617,350 | 583,963 | 791,323 | 786,629 | 720,163 | 691,016 | 627,179 | ||||||||||||||||||||||||||||||||||||
Adjusted Capital Expenditures | 284,840 | 271,805 | 223,747 | 163,694 | 126,955 | 187,987 | 217,430 | 284,840 | 271,805 | 223,747 | 163,694 | 126,955 | ||||||||||||||||||||||||||||||||||||
Adjusted Free Cash Flow | 204,101 | 160,487 | 160,923 | 285,221 | 233,586 | 276,512 | 208,657 | |||||||||||||||||||||||||||||||||||||||||
Consolidated Balance Sheet Data Cash and cash equivalents Total assets Long-term debt Working capital (deficit) Redeemable preferred stock Noncontrolling interest Total stockholders’ equity (deficit) Key Metrics Travel Network Direct Billable Bookings - Air Direct Billable Bookings - Non-Air Total Direct Billable Bookings Airline Solutions Passengers Boarded As of December 31, 2013 2012 2011 2010 2009 (Amounts in thousands) $ 308,236 $ 126,695 $ 58,350 $ 176,521 $ 61,206 4,755,708 4,711,245 5,252,780 5,524,279 5,878,388 3,643,548 3,420,927 3,307,905 3,350,860 3,696,378 (273,591 ) (428,569 ) (411,485 ) (491,864 ) (331,197 ) 634,843 598,139 563,557 530,975 500,178 508 88 (18,693 ) 19,831 88,429 (952,536 ) (876,875 ) (196,919 ) (34,738 ) 298,251 314,275 326,175 328,200 325,370 301,686 53,503 53,669 53,683 49,229 43,084 367,778 379,844 381,883 374,599 344,770 478,088 405,420 364,420 313,959 287,591
80
| As of September 30, | As of December 31, | |||||||||||||||||||||||
| 2014 | 2013 | 2012 | 2011 | 2010 | 2009 | |||||||||||||||||||
| (Amounts in thousands) | ||||||||||||||||||||||||
Consolidated Balance Sheet Data: | ||||||||||||||||||||||||
Cash and cash equivalents | $ | 157,747 | $ | 308,236 | $ | 126,695 | $ | 58,350 | $ | 176,521 | $ | 61,206 | ||||||||||||
Total assets | 4,672,394 | 4,755,708 | 4,711,245 | 5,252,780 | 5,524,279 | 5,878,388 | ||||||||||||||||||
Long-term debt | 3,065,440 | 3,643,548 | 3,420,927 | 3,307,905 | 3,350,860 | 3,696,378 | ||||||||||||||||||
Working capital deficit | (246,557 | ) | (273,591 | ) | (428,569 | ) | (411,482 | ) | (491,864 | ) | (331,197 | ) | ||||||||||||
Redeemable preferred stock | — | 634,843 | 598,139 | 563,557 | 530,975 | 500,178 | ||||||||||||||||||
Noncontrolling interest | 57 | 508 | 88 | (18,693 | ) | 19,831 | 88,429 | |||||||||||||||||
Total stockholders’ equity (deficit) | 69,048 | (952,536 | ) | (876,875 | ) | (196,919 | ) | (34,738 | ) | 298,251 | ||||||||||||||
| Nine Months Ended September 30, | Year Ended December 31, | |||||||||||||||||||||||||||
| 2014 | 2013 | 2013 | 2012 | 2011 | 2010 | 2009 | ||||||||||||||||||||||
| (Amounts in thousands) | ||||||||||||||||||||||||||||
Key Metrics: | ||||||||||||||||||||||||||||
Travel Network | ||||||||||||||||||||||||||||
Direct Billable Bookings—Air | 251,145 | 244,267 | 314,275 | 326,175 | 328,200 | 325,370 | 301,686 | |||||||||||||||||||||
Direct Billable Bookings—Non-Air | 41,274 | 40,734 | 53,503 | 53,669 | 53,683 | 49,229 | 43,084 | |||||||||||||||||||||
Total Direct Billable Bookings | 292,419 | 285,001 | 367,778 | 379,844 | 381,883 | 374,599 | 344,770 | |||||||||||||||||||||
Airline Solutions Passengers Boarded | 385,611 | 358,428 | 478,088 | 405,420 | 364,420 | 313,959 | 287,591 | |||||||||||||||||||||
| (1) | Certain amounts previously reported in our December 31, 2012, 2011, 2010 and 2009 financial statements have been reclassified to conform to the December 31, 2013 presentation of Holiday Autos as a discontinued operations. See Note 2, Summary of Significant Accounting Policies—Reclassifications, to our audited consolidated financial statements included elsewhere in this prospectus. In June 2013, we sold certain assets of our Holiday Autos operations to a third party and in November 2013, we completed the closing of the remainder of the Holiday Autos operations such that it represented a discontinued operation. See Note 4, Discontinued Operations and Dispositions, to our audited consolidated financial statements included elsewhere in this prospectus. The impact on our revenue was a reduction of $65 million, $76 million, $74 million and $78 million for the years ended December 31, 2012, 2011, 2010 and 2009, respectively. The impact on our operating income was an increase of $12 million for the year ended December 31, 2012, a reduction of less than $1 million and $5 million for the years ended December 31, 2011 and 2010, respectively, and an increase of $44 million for the year ended December 31, 2009. |
81
Non-GAAP MeasurementsMeasures
The following table sets forth the reconciliation of Adjusted Net Income and Adjusted EBITDA to net lossincome (loss) attributable to Sabre Corporation, the most directly comparable GAAP measure:measure, to Adjusted Net Income and Adjusted EBITDA:
| Year Ended December 31, | Nine Months Ended September 30, | Year Ended December 31, | ||||||||||||||||||||||||||||||||||||||||||||||
| 2013 | 2012 | 2011 | 2010 | 2009 | 2014 | 2013 | 2013 | 2012 | 2011 | 2010 | 2009 | |||||||||||||||||||||||||||||||||||||
| (Amounts in thousands) | (Amounts in thousands) | |||||||||||||||||||||||||||||||||||||||||||||||
Reconciliation of net income (loss) to Adjusted Net Income and to Adjusted EBITDA: | ||||||||||||||||||||||||||||||||||||||||||||||||
Net loss attributable to Sabre Corporation | $ | (100,494 | ) | $ | (611,356 | ) | $ | (66,074 | ) | $ | (268,851 | ) | $ | (158,734 | ) | |||||||||||||||||||||||||||||||||
Net loss from discontinued operations, net of tax | 7,176 | 48,947 | 23,461 | 16,949 | 56,021 | |||||||||||||||||||||||||||||||||||||||||||
Net income (loss) attributable to Sabre Corporation | $ | 22,823 | $ | (127,254 | ) | $ | (100,494 | ) | $ | (611,356 | ) | $ | (66,074 | ) | $ | (268,851 | ) | $ | (158,734 | ) | ||||||||||||||||||||||||||||
Loss from discontinued operations, net of tax | 8,017 | 20,895 | 7,176 | 48,947 | 23,461 | 16,949 | 56,021 | |||||||||||||||||||||||||||||||||||||||||
Net income (loss) attributable to noncontrolling interests(1) | 2,863 | (59,317 | ) | (36,681 | ) | (64,382 | ) | (7,476 | ) | 2,168 | 2,135 | 2,863 | (59,317 | ) | (36,681 | ) | (64,382 | ) | (7,476 | ) | ||||||||||||||||||||||||||||
|
|
|
|
|
|
|
|
|
|
|
| |||||||||||||||||||||||||||||||||||||
Loss from continuing operations | (90,455 | ) | (621,726 | ) | (79,294 | ) | (316,284 | ) | (110,189 | ) | ||||||||||||||||||||||||||||||||||||||
Income (loss) from continuing operations | 33,008 | (104,224 | ) | (90,455 | ) | (621,726 | ) | (79,294 | ) | (316,284 | ) | (110,189 | ) | |||||||||||||||||||||||||||||||||||
Adjustments: | ||||||||||||||||||||||||||||||||||||||||||||||||
Impairment(2) | 138,435 | 596,980 | 185,240 | 401,400 | 211,612 | — | 138,435 | 138,435 | 596,980 | 185,240 | 401,400 | 211,612 | ||||||||||||||||||||||||||||||||||||
Acquisition related amortization expense(3a) | 143,765 | 162,517 | 162,312 | 163,213 | 183,850 | 83,344 | 107,955 | 143,765 | 162,517 | 162,312 | 163,213 | 183,850 | ||||||||||||||||||||||||||||||||||||
Loss (gain) on sale of business and assets | — | (25,850 | ) | — | — | — | ||||||||||||||||||||||||||||||||||||||||||
Loss on extinguishment of debt | 12,181 | — | — | — | (31,565 | ) | ||||||||||||||||||||||||||||||||||||||||||
Other, net(4) | 6,724 | 1,385 | (1,156 | ) | (5,871 | ) | (18,070 | ) | ||||||||||||||||||||||||||||||||||||||||
Gain on sale of business and assets | — | — | — | (25,850 | ) | — | — | — | ||||||||||||||||||||||||||||||||||||||||
Loss (gain) on extinguishment of debt | 33,538 | 12,181 | 12,181 | — | — | — | (31,565 | ) | ||||||||||||||||||||||||||||||||||||||||
Other (income) expense, net(5) | (760 | ) | 1,099 | 6,724 | 1,385 | (1,156 | ) | (5,871 | ) | (18,070 | ) | |||||||||||||||||||||||||||||||||||||
Restructuring and other costs | 59,052 | 6,776 | 12,986 | 17,282 | 22,387 | 24,056 | 26,296 | 59,052 | 6,776 | 12,986 | 17,282 | 22,387 | ||||||||||||||||||||||||||||||||||||
Litigation and taxes, including penalties | 39,431 | 418,622 | 21,601 | 1,600 | 1,405 | 12,497 | 31,543 | 39,431 | 418,622 | 21,601 | 1,600 | 1,405 | ||||||||||||||||||||||||||||||||||||
Stock—based compensation | 9,086 | 9,834 | 7,334 | 5,300 | 4,108 | |||||||||||||||||||||||||||||||||||||||||||
Stock–based compensation | 22,434 | 5,446 | 9,086 | 9,834 | 7,334 | 5,300 | 4,108 | |||||||||||||||||||||||||||||||||||||||||
Management fees | 8,761 | 7,769 | 7,191 | 6,730 | 7,260 | 23,701 | 7,347 | 8,761 | 7,769 | 7,191 | 6,730 | 7,260 | ||||||||||||||||||||||||||||||||||||
Amortization of Expedia SMA incentive payments | 7,625 | — | — | — | — | — | — | |||||||||||||||||||||||||||||||||||||||||
Tax impact of net income adjustments | 109,829 | (405,421 | ) | (80,048 | ) | (67,415 | ) | (75,478 | ) | (80,614 | ) | (78,381 | ) | (109,829 | ) | (405,421 | ) | (80,048 | ) | (67,415 | ) | (75,478 | ) | |||||||||||||||||||||||||
|
|
|
|
|
|
|
|
|
|
|
| |||||||||||||||||||||||||||||||||||||
Adjusted Net Income from continuing operations | 217,151 | 150,886 | 236,166 | 205,955 | 195,320 | 158,829 | 147,697 | 217,151 | 150,886 | 236,166 | 205,955 | 195,320 | ||||||||||||||||||||||||||||||||||||
Adjustments: | ||||||||||||||||||||||||||||||||||||||||||||||||
Depreciation and amortization of property and equipment | 131,483 | 135,561 | 122,640 | 110,748 | 99,326 | |||||||||||||||||||||||||||||||||||||||||||
Depreciation and amortization of property and equipment(3b) | 122,409 | 97,687 | 131,483 | 135,561 | 122,640 | 110,748 | 99,326 | |||||||||||||||||||||||||||||||||||||||||
Amortization of capitalized implementation costs(3c) | 35,551 | 20,855 | 11,365 | 8,162 | 3,035 | 27,111 | 27,038 | 35,551 | 20,855 | 11,365 | 8,162 | 3,035 | ||||||||||||||||||||||||||||||||||||
Amortization of upfront incentive consideration( 8) | 36,649 | 36,527 | 37,748 | 26,572 | 29,554 | |||||||||||||||||||||||||||||||||||||||||||
Amortization of upfront incentive consideration(4) | 33,177 | 28,736 | 36,649 | 36,527 | 37,748 | 26,572 | 29,554 | |||||||||||||||||||||||||||||||||||||||||
Interest expense, net | 274,689 | 232,450 | 174,390 | 200,945 | 234,758 | 167,332 | 209,653 | 274,689 | 232,450 | 174,390 | 200,945 | 234,758 | ||||||||||||||||||||||||||||||||||||
Remaining (benefit) provision for income taxes | 95,800 | 210,350 | 137,854 | 138,634 | 65,186 | |||||||||||||||||||||||||||||||||||||||||||
Remaining provision for income taxes | 108,492 | 73,152 | 95,800 | 210,350 | 137,854 | 138,634 | 65,186 | |||||||||||||||||||||||||||||||||||||||||
|
|
|
|
|
|
|
|
|
|
|
| |||||||||||||||||||||||||||||||||||||
Adjusted EBITDA | $ | 791,323 | $ | 786,629 | $ | 720,163 | $ | 691,016 | $ | 627,179 | $ | 617,350 | $ | 583,963 | $ | 791,323 | $ | 786,629 | $ | 720,163 | $ | 691,016 | $ | 627,179 | ||||||||||||||||||||||||
|
|
|
|
|
|
|
|
|
|
|
| |||||||||||||||||||||||||||||||||||||
82
The following tables set forth the reconciliation of gross marginoperating income (loss), the most directly comparable GAAP measure, to Adjusted Gross Margin and Adjusted EBITDA by business segment:
| Fiscal Year Ended December 31, 2013 | ||||||||||||||||||||||||
| Travel Network | Airline and Hospitality Solutions | Travelocity | Eliminations | Corporate | Total | |||||||||||||||||||
(Amounts in thousands) | ||||||||||||||||||||||||
Gross Margin | $ | 773,890 | $ | 187,293 | $ | 345,474 | $ | (717 | ) | $ | (161,265 | ) | $ | 1,144,675 | ||||||||||
Adjustments: | ||||||||||||||||||||||||
Amortization of upfront incentive consideration(8) | 36,649 | — | — | — | — | 36,649 | ||||||||||||||||||
Depreciation and amortization(3) | 50,254 | 75,093 | 8,015 | — | 69,123 | 202,485 | ||||||||||||||||||
|
|
|
|
|
|
|
|
|
|
|
| |||||||||||||
Adjusted gross margin | 860,793 | 262,386 | 353,489 | (717 | ) | (92,142 | ) | 1,383,809 | ||||||||||||||||
Selling, general and administrative | (106,392 | ) | (51,538 | ) | (331,334 | ) | 717 | (304,382 | ) | (792,929 | ) | |||||||||||||
Joint venture equity income | 15,554 | — | — | — | — | 15,554 | ||||||||||||||||||
Adjustments: | — | |||||||||||||||||||||||
Depreciation and amortization(3) | 2,253 | 2,227 | 697 | — | 99,933 | 105,110 | ||||||||||||||||||
Restructuring and other costs(5) | — | — | — | — | 22,501 | 22,501 | ||||||||||||||||||
Stock-based compensation | — | — | — | — | 9,086 | 9,086 | ||||||||||||||||||
Litigation and taxes, including penalties(6) | — | — | — | — | 39,431 | 39,431 | ||||||||||||||||||
Management fees(7) | — | — | — | — | 8,761 | 8,761 | ||||||||||||||||||
|
|
|
|
|
|
|
|
|
|
|
| |||||||||||||
Adjusted EBITDA | $ | 772,208 | $ | 213,075 | $ | 22,852 | $ | — | $ | (216,812 | ) | $ | 791,323 | |||||||||||
|
|
|
|
|
|
|
|
|
|
|
| |||||||||||||
| Nine Months Ended September 30, 2014 | ||||||||||||||||||||||||
| Travel Network | Airline and Hospitality Solutions | Travelocity | Eliminations | Corporate | Total | |||||||||||||||||||
| (Amounts in thousands) | ||||||||||||||||||||||||
Operating income (loss) | $ | 515,093 | $ | 117,957 | $ | (29,326 | ) | $ | — | $ | (352,095 | ) | $ | 251,629 | ||||||||||
Add back: | ||||||||||||||||||||||||
Selling, general and administrative | 76,810 | 38,555 | 202,240 | (7,498 | ) | 265,306 | 575,413 | |||||||||||||||||
Restructuring charges | — | — | — | — | 2,325 | 2,325 | ||||||||||||||||||
Cost of revenue adjustments: | ||||||||||||||||||||||||
Depreciation and amortization(3) | 44,943 | 79,034 | 3,585 | — | 29,584 | 157,146 | ||||||||||||||||||
Amortization of upfront incentive consideration(4) | 33,177 | — | — | — | — | 33,177 | ||||||||||||||||||
Restructuring and other costs(6) | — | — | — | — | 10,016 | 10,016 | ||||||||||||||||||
Litigation and taxes, including penalties(7) | — | — | — | — | 1,127 | 1,127 | ||||||||||||||||||
Stock-based compensation | — | — | — | — | 5,618 | 5,618 | ||||||||||||||||||
Amortization of Expedia SMA incentive payments | — | — | 7,625 | — | — | 7,625 | ||||||||||||||||||
|
|
|
|
|
|
|
|
|
|
|
| |||||||||||||
Adjusted Gross Margin | 670,023 | 235,546 | 184,124 | (7,498 | ) | (38,119 | ) | 1,044,076 | ||||||||||||||||
Selling, general and administrative | (76,810 | ) | (38,555 | ) | (202,240 | ) | 7,498 | (265,306 | ) | (575,413 | ) | |||||||||||||
Joint venture equity income | 9,367 | — | — | — | — | 9,367 | ||||||||||||||||||
Joint venture intangible amortization(3a) | 2,403 | — | — | — | — | 2,403 | ||||||||||||||||||
Selling, general and administrative adjustments: | ||||||||||||||||||||||||
Depreciation and amortization(3) | 1,654 | 695 | — | — | 70,966 | 73,315 | ||||||||||||||||||
Restructuring and other costs(6) | — | — | — | — | 11,715 | 11,715 | ||||||||||||||||||
Litigation and taxes, including penalties(7) | — | — | — | — | 11,370 | 11,370 | ||||||||||||||||||
Stock-based compensation | — | — | — | — | 16,816 | 16,816 | ||||||||||||||||||
Management fees(8) | — | — | — | — | 23,701 | 23,701 | ||||||||||||||||||
|
|
|
|
|
|
|
|
|
|
|
| |||||||||||||
Adjusted EBITDA | $ | 606,637 | $ | 197,686 | $ | (18,116 | ) | $ | — | $ | (168,857 | ) | $ | 617,350 | ||||||||||
|
|
|
|
|
|
|
|
|
|
|
| |||||||||||||
| Fiscal Year Ended December 31, 2012 | ||||||||||||||||||||||||
| Travel Network | Airline and Hospitality Solutions | Travelocity | Eliminations | Corporate | Total | |||||||||||||||||||
(Amounts in thousands) | ||||||||||||||||||||||||
Gross Margin | $ | 772,712 | $ | 167,026 | $ | 377,102 | $ | (1,010 | ) | $ | (160,701 | ) | $ | 1,155,129 | ||||||||||
Adjustments: | ||||||||||||||||||||||||
Amortization of upfront incentive consideration(8) | 36,527 | — | — | — | — | 36,527 | ||||||||||||||||||
Depreciation and amortization(3) | 34,624 | 51,395 | 36,700 | — | 75,487 | 198,206 | ||||||||||||||||||
|
|
|
|
|
|
|
|
|
|
|
| |||||||||||||
Adjusted gross margin | 843,863 | 218,421 | 413,802 | (1,010 | ) | (85,214 | ) | 1,389,862 | ||||||||||||||||
Selling, general and administrative | (101,934 | ) | (52,754 | ) | (355,875 | ) | 1,010 | (678,695 | ) | (1,188,248 | ) | |||||||||||||
Joint venture equity income | 24,487 | — | — | — | — | 24,487 | ||||||||||||||||||
Adjustments: | ||||||||||||||||||||||||
Depreciation and amortization(3) | 2,036 | 615 | 3,192 | — | 111,684 | 117,527 | ||||||||||||||||||
Restructuring and other costs(5) | — | — | — | — | 6,776 | 6,776 | ||||||||||||||||||
Stock-based compensation | — | — | — | — | 9,834 | 9,834 | ||||||||||||||||||
Litigation and taxes, including penalties(6) | — | — | — | — | 418,622 | 418,622 | ||||||||||||||||||
Management fees(7) | — | — | — | — | 7,769 | 7,769 | ||||||||||||||||||
|
|
|
|
|
|
|
|
|
|
|
| |||||||||||||
Adjusted EBITDA | $ | 768,452 | $ | 166,282 | $ | 61,119 | $ | — | $ | (209,224 | ) | $ | 786,629 | |||||||||||
|
|
|
|
|
|
|
|
|
|
|
| |||||||||||||
| Nine Months Ended September 30, 2013 | ||||||||||||||||||||||||
| Travel Network | Airline and Hospitality Solutions | Travelocity | Eliminations | Corporate | Total | |||||||||||||||||||
| (Amounts in thousands) | ||||||||||||||||||||||||
Operating income (loss) | $ | 505,446 | $ | 88,260 | $ | (1,298 | ) | $ | — | $ | (486,801 | ) | $ | 105,607 | ||||||||||
Add back: | ||||||||||||||||||||||||
Selling, general and administrative | 82,204 | 39,784 | 271,839 | (514 | ) | 226,913 | 620,226 | |||||||||||||||||
Impairment | — | — | — | — | 138,435 | 138,435 | ||||||||||||||||||
Restructuring charges | — | — | — | — | 15,889 | 15,889 | ||||||||||||||||||
Cost of revenue adjustments: | ||||||||||||||||||||||||
Depreciation and amortization(2) | 36,182 | 55,193 | 7,354 | — | 51,712 | 150,441 | ||||||||||||||||||
Amortization of upfront incentive consideration(3) | 28,736 | — | — | — | — | 28,736 | ||||||||||||||||||
Restructuring and other costs (5) | — | — | — | — | 4,521 | 4,521 | ||||||||||||||||||
Litigation and taxes, including penalties(6) | — | — | — | — | 19,864 | 19,864 | ||||||||||||||||||
Stock-based compensation | — | — | — | — | 816 | 816 | ||||||||||||||||||
|
|
|
|
|
|
|
|
|
|
|
| |||||||||||||
Adjusted Gross Margin | 652,568 | 183,237 | 277,895 | (514 | ) | (28,651 | ) | 1,084,535 | ||||||||||||||||
Selling, general and administrative | (82,204 | ) | (39,784 | ) | (271,839 | ) | 514 | (226,913 | ) | (620,226 | ) | |||||||||||||
Joint venture equity income | 7,873 | — | — | — | — | 7,873 | ||||||||||||||||||
Joint venture intangible amortization(2a) | 2,403 | — | — | — | — | 2,403 | ||||||||||||||||||
Selling, general and administrative adjustments: | ||||||||||||||||||||||||
Depreciation and amortization(2) | 1,628 | 2,032 | 1,472 | — | 74,704 | 79,836 | ||||||||||||||||||
Restructuring and other costs (5) | — | — | — | — | 5,886 | 5,886 | ||||||||||||||||||
Litigation and taxes, including penalties(6) | — | — | — | — | 11,679 | 11,679 | ||||||||||||||||||
Stock-based compensation | — | — | — | — | 4,630 | 4,630 | ||||||||||||||||||
Management fees(7) | — | — | — | — | 7,347 | 7,347 | ||||||||||||||||||
|
|
|
|
|
|
|
|
|
|
|
| |||||||||||||
Adjusted EBITDA | $ | 582,268 | $ | 145,485 | $ | 7,528 | $ | — | $ | (151,318 | ) | $ | 583,963 | |||||||||||
|
|
|
|
|
|
|
|
|
|
|
| |||||||||||||
(Amounts in thousands) Gross Margin Adjustments: Amortization of upfront incentive consideration(8) Depreciation and amortization(3) Adjusted gross margin Selling, general and administrative Joint venture equity income Adjustments: Depreciation and amortization(3) Restructuring and other costs(5) Stock-based compensation Litigation and taxes, including penalties(6) Management fees(7) Adjusted EBITDA (Amounts in thousands) Gross Margin Adjustments: Amortization of upfront incentive consideration(8) Depreciation and amortization(3) Adjusted gross margin Selling, general and administrative Joint venture equity income Adjustments: Depreciation and amortization(3) Restructuring and other costs(5) Stock-based compensation Litigation and taxes, including penalties(6) Management fees(7) Adjusted EBITDA Fiscal Year Ended December 31, 2011 Travel
Network Airline and
Hospitality
Solutions Travelocity Eliminations Corporate Total $ 705,421 $ 153,560 $ 407,772 $ (1,083 ) $ (145,750 ) $ 1,119,920 37,748 37,748 29,584 31,587 40,018 — 71,657 172,846 772,753 185,147 447,790 (1,083 ) (74,093 ) 1,330,514 (111,003 ) (50,306 ) (374,801 ) 1,083 (271,408 ) (806,435 ) 26,701 — — — — 26,701 4,120 343 3,480 — 112,328 120,271 — — — — 12,986 12,986 — — — — 7,334 7,334 — — — — 21,601 21,601 — — — — 7,191 7,191 $ 692,571 $ 135,184 $ 76,469 $ — $ (184,061 ) $ 720,163 Fiscal Year Ended December 31, 2010 Travel
Network Airline and
Hospitality
Solutions Travelocity Eliminations Corporate Total $ 617,257 $ 166,520 $ 451,609 $ (591 ) $ (117,071 ) $ 1,117,724 26,629 — — — — 26,629 32,349 19,663 36,986 — 69,411 158,409 676,235 186,183 488,595 (591 ) (47,660 ) 1,302,762 (71,495 ) (39,417 ) (401,452 ) 591 (272,413 ) (784,186 ) 21,071 — — — — 21,071 — 4,172 450 3,216 — 112,619 120,457 — — — — 17,282 17,282 — — — — 5,300 5,300 — — — — 1,600 1,600 — — — — 6,730 6,730 $ 629,983 $ 147,216 $ 90,359 $ — $ (176,542 ) $ 691,016
Gross Margin Adjustments: Amortization of upfront incentive consideration(8) Depreciation and amortization(3) Adjusted gross margin Selling, general and administrative Joint venture equity income Adjustments: Depreciation and amortization(3) Restructuring and other costs(5) Stock-based compensation Litigation and taxes, including penalties(6) Management fees(7) Adjusted EBITDA Fiscal Year Ended December 31, 2009 Travel
Network Airline and
Hospitality
Solutions Travelocity Eliminations Corporate Total (Amounts in thousands) $ 569,975 $ 154,018 $ 471,307 $ (527 ) $ (129,415 ) $ 1,065,358 29,554 29,554 29,968 11,038 35,764 — 56,720 133,490 629,497 165,056 507,071 (527 ) (72,695 ) 1,228,402 (85,870 ) (41,970 ) (390,295 ) 527 (279,643 ) (797,251 ) 11,356 — — — — 11,356 1,588 729 3,110 — 144,085 149,512 — — — — 22,387 22,387 — — — — 4,108 4,108 — — — — 1,405 1,405 — — — — 7,260 7,260 $ 556,571 $ 123,815 $ 119,886 $ — $ (173,093 ) $ 627,179
| Fiscal Year Ended December 31, 2013 | ||||||||||||||||||||||||
| Travel Network | Airline and Hospitality Solutions | Travelocity | Eliminations | Corporate | Total | |||||||||||||||||||
| (Amounts in thousands) | ||||||||||||||||||||||||
Operating income (loss) | $ | 667,498 | $ | 135,755 | $ | 14,140 | $ | — | $ | (640,633 | ) | $ | 176,760 | |||||||||||
Add back: | ||||||||||||||||||||||||
Selling, general and administrative | 106,392 | 51,538 | 331,334 | (717 | ) | 304,382 | 792,929 | |||||||||||||||||
Impairment(2) | — | — | — | — | 138,435 | 138,435 | ||||||||||||||||||
Restructuring charges(6) | — | — | — | — | 36,551 | 36,551 | ||||||||||||||||||
Cost of revenue adjustments: | ||||||||||||||||||||||||
Depreciation and amortization(3) | 50,254 | 75,093 | 8,015 | — | 69,123 | 202,485 | ||||||||||||||||||
Amortization of upfront incentive consideration(4) | 36,649 | — | — | — | — | 36,649 | ||||||||||||||||||
Restructuring and other costs(6) | — | — | — | — | 12,615 | 12,615 | ||||||||||||||||||
Litigation and taxes, including penalties(7) | — | — | — | — | 20,921 | 20,921 | ||||||||||||||||||
Stock-based compensation | — | — | — | — | 1,702 | 1,702 | ||||||||||||||||||
|
|
|
|
|
|
|
|
|
|
|
| |||||||||||||
Adjusted Gross Margin | 860,793 | 262,386 | 353,489 | (717 | ) | (56,904 | ) | 1,419,047 | ||||||||||||||||
Selling, general and administrative | (106,392 | ) | (51,538 | ) | (331,334 | ) | 717 | (304,382 | ) | (792,929 | ) | |||||||||||||
Joint venture equity income | 12,350 | — | — | — | — | 12,350 | ||||||||||||||||||
Joint venture intangible amortization(3a) | 3,204 | — | — | — | — | 3,204 | ||||||||||||||||||
Selling, general and administrative adjustments: | ||||||||||||||||||||||||
Depreciation and amortization(3) | 2,253 | 2,227 | 697 | — | 99,933 | 105,110 | ||||||||||||||||||
Restructuring and other costs(6) | — | — | — | — | 9,886 | 9,886 | ||||||||||||||||||
Litigation and taxes, including penalties(7) | — | — | — | — | 18,510 | 18,510 | ||||||||||||||||||
Stock-based compensation | — | — | — | — | 7,384 | 7,384 | ||||||||||||||||||
Management fees(8) | — | — | — | — | 8,761 | 8,761 | ||||||||||||||||||
|
|
|
|
|
|
|
|
|
|
|
| |||||||||||||
Adjusted EBITDA | $ | 772,208 | $ | 213,075 | $ | 22,852 | $ | — | $ | (216,812 | ) | $ | 791,323 | |||||||||||
|
|
|
|
|
|
|
|
|
|
|
| |||||||||||||
| Fiscal Year Ended December 31, 2012 | ||||||||||||||||||||||||
| Travel Network | Airline and Hospitality Solutions | Travelocity | Eliminations | Corporate | Total | |||||||||||||||||||
| (Amounts in thousands) | ||||||||||||||||||||||||
Operating income (loss) | $ | 670,778 | $ | 114,272 | $ | 21,227 | $ | — | $ | (1,412,576 | ) | $ | (606,299 | ) | ||||||||||
Add back: | ||||||||||||||||||||||||
Selling, general and administrative | 101,934 | 52,754 | 355,875 | (1,010 | ) | 678,695 | 1,188,248 | |||||||||||||||||
Impairment(2) | — | — | — | — | 573,180 | 573,180 | ||||||||||||||||||
Cost of revenue adjustments: | ||||||||||||||||||||||||
Depreciation and amortization(3) | 34,624 | 51,395 | 36,700 | — | 75,487 | 198,206 | ||||||||||||||||||
Amortization of upfront incentive consideration(4) | 36,527 | — | — | — | — | 36,527 | ||||||||||||||||||
Restructuring and other costs(6) | — | — | — | — | 4,525 | 4,525 | ||||||||||||||||||
Litigation and taxes, including penalties(7) | — | — | — | — | 22,187 | 22,187 | ||||||||||||||||||
Stock-based compensation | — | — | — | — | 1,715 | 1,715 | ||||||||||||||||||
|
|
|
|
|
|
|
|
|
|
|
| |||||||||||||
Adjusted Gross Margin | 843,863 | 218,421 | 413,802 | (1,010 | ) | (56,787 | ) | 1,418,289 | ||||||||||||||||
Selling, general and administrative | (101,934 | ) | (52,754 | ) | (355,875 | ) | 1,010 | (678,695 | ) | (1,188,248 | ) | |||||||||||||
Joint venture equity income | 21,287 | — | — | — | — | 21,287 | ||||||||||||||||||
Joint venture intangible amortization(3a) | 3,200 | — | — | — | — | 3,200 | ||||||||||||||||||
Selling, general and administrative adjustments: | ||||||||||||||||||||||||
Depreciation and amortization(3) | 2,036 | 615 | 3,192 | — | 111,684 | 117,527 | ||||||||||||||||||
Restructuring and other costs(6) | — | — | — | — | 2,251 | 2,251 | ||||||||||||||||||
Litigation and taxes, including penalties(7) | — | — | — | — | 396,435 | 396,435 | ||||||||||||||||||
Stock-based compensation | — | — | — | — | 8,119 | 8,119 | ||||||||||||||||||
Management fees(8) | — | — | — | — | 7,769 | 7,769 | ||||||||||||||||||
|
|
|
|
|
|
|
|
|
|
|
| |||||||||||||
Adjusted EBITDA | $ | 768,452 | $ | 166,282 | $ | 61,119 | $ | — | $ | (209,224 | ) | $ | 786,629 | |||||||||||
|
|
|
|
|
|
|
|
|
|
|
| |||||||||||||
84
| Fiscal Year Ended December 31, 2011 | ||||||||||||||||||||||||
| Travel Network | Airline and Hospitality Solutions | Travelocity | Eliminations | Corporate | Total | |||||||||||||||||||
| (Amounts in thousands) | ||||||||||||||||||||||||
Operating income (loss) | $ | 594,418 | $ | 103,254 | $ | 32,971 | $ | — | $ | (602,398 | ) | $ | 128,245 | |||||||||||
Add back: | ||||||||||||||||||||||||
Selling, general and administrative | 111,003 | 50,306 | 374,801 | (1,083 | ) | 271,408 | 806,435 | |||||||||||||||||
Impairment(2) | — | — | — | — | 185,240 | 185,240 | ||||||||||||||||||
Cost of revenue adjustments: | ||||||||||||||||||||||||
Depreciation and amortization(3) | 29,584 | 31,587 | 40,018 | — | 71,657 | 172,846 | ||||||||||||||||||
Amortization of upfront incentive consideration(4) | 37,748 | — | — | — | — | 37,748 | ||||||||||||||||||
Restructuring and other costs(6) | — | — | — | — | 1,786 | 1,786 | ||||||||||||||||||
Litigation and taxes, including penalties(7) | — | — | — | — | — | — | ||||||||||||||||||
Stock-based compensation | — | — | — | — | 1,454 | 1,454 | ||||||||||||||||||
|
|
|
|
|
|
|
|
|
|
|
| |||||||||||||
Adjusted Gross Margin | 772,753 | 185,147 | 447,790 | (1,083 | ) | (70,853 | ) | 1,333,754 | ||||||||||||||||
Selling, general and administrative | (111,003 | ) | (50,306 | ) | (374,801 | ) | 1,083 | (271,408 | ) | (806,435 | ) | |||||||||||||
Joint venture equity income | 23,501 | — | — | — | — | 23,501 | ||||||||||||||||||
Joint venture intangible amortization(3a) | 3,200 | — | — | — | — | 3,200 | ||||||||||||||||||
Selling, general and administrative adjustments: | ||||||||||||||||||||||||
Depreciation and amortization(3) | 4,120 | 343 | 3,480 | — | 112,328 | 120,271 | ||||||||||||||||||
Restructuring and other costs(6) | — | — | — | — | 11,201 | 11,201 | ||||||||||||||||||
Litigation and taxes, including penalties(7) | — | — | — | — | 21,600 | 21,600 | ||||||||||||||||||
Stock-based compensation | — | — | — | — | 5,880 | 5,880 | ||||||||||||||||||
Management fees(8) | — | — | — | — | 7,191 | 7,191 | ||||||||||||||||||
|
|
|
|
|
|
|
|
|
|
|
| |||||||||||||
Adjusted EBITDA | $ | 692,571 | $ | 135,184 | $ | 76,469 | $ | — | $ | (184,061 | ) | $ | 720,163 | |||||||||||
|
|
|
|
|
|
|
|
|
|
|
| |||||||||||||
| Fiscal Year Ended December 31, 2010 | ||||||||||||||||||||||||
| Travel Network | Airline and Hospitality Solutions | Travelocity | Eliminations | Corporate | Total | |||||||||||||||||||
| (Amounts in thousands) | ||||||||||||||||||||||||
Operating income (loss) | $ | 545,762 | $ | 127,103 | $ | 50,157 | $ | — | $ | (790,884 | ) | $ | (67,862 | ) | ||||||||||
Add back: | ||||||||||||||||||||||||
Selling, general and administrative | 71,495 | 39,417 | 406,443 | (591 | ) | 272,413 | 789,177 | |||||||||||||||||
Impairment | — | — | — | — | 401,400 | 401,400 | ||||||||||||||||||
Cost of revenue adjustments: | ||||||||||||||||||||||||
Depreciation and amortization(3) | 32,349 | 19,663 | 31,995 | — | 69,411 | 153,418 | ||||||||||||||||||
Amortization of upfront incentive consideration(4) | 26,572 | — | — | — | — | 26,572 | ||||||||||||||||||
Restructuring and other costs(6) | — | — | — | — | 4,863 | 4,863 | ||||||||||||||||||
Litigation and taxes, including penalties(7) | — | — | — | — | 1,600 | 1,600 | ||||||||||||||||||
Stock-based compensation | — | — | — | — | 1,112 | 1,112 | ||||||||||||||||||
|
|
|
|
|
|
|
|
|
|
|
| |||||||||||||
Adjusted Gross Margin | 676,178 | 186,183 | 488,595 | (591 | ) | (40,085 | ) | 1,310,280 | ||||||||||||||||
Selling, general and administrative | (71,495 | ) | (39,417 | ) | (406,443 | ) | 591 | (272,413 | ) | (789,177 | ) | |||||||||||||
Joint venture equity income | 17,871 | — | — | — | — | 17,871 | ||||||||||||||||||
Joint venture intangible amortization(3a) | 3,200 | — | — | — | — | 3,200 | ||||||||||||||||||
Selling, general and administrative adjustments: | ||||||||||||||||||||||||
Depreciation and amortization(3) | 4,172 | 450 | 8,207 | — | 112,676 | 125,505 | ||||||||||||||||||
Restructuring and other costs(6) | — | — | — | — | 12,419 | 12,419 | ||||||||||||||||||
Stock-based compensation | — | — | — | — | 4,188 | 4,188 | ||||||||||||||||||
Management fees(8) | — | — | — | — | 6,730 | 6,730 | ||||||||||||||||||
|
|
|
|
|
|
|
|
|
|
|
| |||||||||||||
Adjusted EBITDA | $ | 629,926 | $ | 147,216 | $ | 90,359 | $ | — | $ | (176,485 | ) | $ | 691,016 | |||||||||||
|
|
|
|
|
|
|
|
|
|
|
| |||||||||||||
85
| Fiscal Year Ended December 31, 2009 | ||||||||||||||||||||||||
| Travel Network | Airline and Hospitality Solutions | Travelocity | Eliminations | Corporate | Total | |||||||||||||||||||
| (Amounts in thousands) | ||||||||||||||||||||||||
Operating income (loss) | $ | 484,105 | $ | 112,048 | $ | 81,012 | $ | — | $ | (620,670 | ) | $ | 56,495 | |||||||||||
Add back: | ||||||||||||||||||||||||
Selling, general and administrative | 85,870 | 41,970 | 399,005 | (527 | ) | 279,643 | 805,961 | |||||||||||||||||
Impairment | — | — | — | — | 211,612 | 211,612 | ||||||||||||||||||
Cost of revenue adjustments: | ||||||||||||||||||||||||
Depreciation and amortization(3) | 29,968 | 11,038 | 27,054 | — | 56,720 | 124,780 | ||||||||||||||||||
Amortization of upfront incentive consideration(4) | 29,554 | — | — | — | — | 29,554 | ||||||||||||||||||
Restructuring and other costs(6) | — | — | — | — | 12,730 | 12,730 | ||||||||||||||||||
Litigation and taxes, including penalties(7) | — | — | — | — | 1,405 | 1,405 | ||||||||||||||||||
Stock-based compensation | — | — | — | — | 866 | 866 | ||||||||||||||||||
|
|
|
|
|
|
|
|
|
|
|
| |||||||||||||
Adjusted Gross Margin | 629,497 | 165,056 | 507,071 | (527 | ) | (57,694 | ) | 1,243,403 | ||||||||||||||||
Selling, general and administrative | (85,870 | ) | (41,970 | ) | (399,005 | ) | 527 | (279,643 | ) | (805,961 | ) | |||||||||||||
Joint venture equity income | 8,156 | — | — | — | — | 8,156 | ||||||||||||||||||
Joint venture intangible amortization(3a) | 3,200 | — | — | — | — | 3,200 | ||||||||||||||||||
Selling, general and administrative adjustments: | ||||||||||||||||||||||||
Depreciation and amortization(3) | 1,588 | 729 | 11,820 | — | 144,085 | 158,222 | ||||||||||||||||||
Restructuring and other costs(6) | — | — | — | — | 9,657 | 9,657 | ||||||||||||||||||
Stock-based compensation | — | — | — | — | 3,242 | 3,242 | ||||||||||||||||||
Management fees(8) | — | — | — | — | 7,260 | 7,260 | ||||||||||||||||||
|
|
|
|
|
|
|
|
|
|
|
| |||||||||||||
Adjusted EBITDA | $ | 556,571 | $ | 123,815 | $ | 119,886 | $ | — | $ | (173,093 | ) | $ | 627,179 | |||||||||||
|
|
|
|
|
|
|
|
|
|
|
| |||||||||||||
The components of Adjusted Capital Expenditures are presented below:
| Year Ended December 31, | Nine Months Ended September 30, | Year Ended December 31, | ||||||||||||||||||||||||||||||||||||||||||||||
| 2013 | 2012 | 2011 | 2010 | 2009 | 2014 | 2013 | 2013 | 2012 | 2011 | 2010 | 2009 | |||||||||||||||||||||||||||||||||||||
(Amounts in thousands) | (Amounts in thousands) | |||||||||||||||||||||||||||||||||||||||||||||||
Additions to property and equipment | $ | 226,026 | $ | 193,262 | $ | 164,638 | $ | 130,028 | $ | 106,554 | $ | 160,385 | $ | 168,744 | $ | 226,026 | $ | 193,262 | $ | 164,638 | $ | 130,028 | $ | 106,554 | ||||||||||||||||||||||||
Capitalized implementation costs | 58,814 | 78,543 | 59,109 | 33,666 | 20,401 | 27,602 | 48,686 | 58,814 | 78,543 | 59,109 | 33,666 | 20,401 | ||||||||||||||||||||||||||||||||||||
|
|
|
|
|
|
|
|
|
|
|
| |||||||||||||||||||||||||||||||||||||
Adjusted capital expenditures | $ | 284,840 | $ | 271,805 | $ | 223,747 | $ | 163,694 | $ | 126,955 | $ | 187,987 | $ | 217,430 | $ | 284,840 | $ | 271,805 | $ | 223,747 | $ | 163,694 | $ | 126,955 | ||||||||||||||||||||||||
|
|
|
|
|
|
|
|
|
|
|
| |||||||||||||||||||||||||||||||||||||
The following tables present historical information from our statements of cash flows and set forth the reconciliation of cash provided by operating activities, the most directly comparable GAAP measure, to Adjusted Free Cash Flow:
| Nine Months Ended September 30, | Year Ended December 31, | |||||||||||||||||||||||||||
| 2014 | 2013 | 2013 | 2012 | 2011 | 2010 | 2009 | ||||||||||||||||||||||
| (Amounts in thousands) | ||||||||||||||||||||||||||||
Cash provided by operating activities | $ | 121,679 | $ | 252,062 | $ | 157,188 | $ | 312,336 | $ | 356,444 | $ | 380,928 | $ | 284,159 | ||||||||||||||
Cash used in investing activities | (191,949 | ) | (189,220 | ) | (246,502 | ) | (236,034 | ) | (176,260 | ) | (184,787 | ) | (108,053 | ) | ||||||||||||||
Cash (used in) provided by financing activities | (59,289 | ) | 274,717 | 262,172 | (25,120 | ) | (271,540 | ) | (48,500 | ) | (335,702 | ) | ||||||||||||||||
86
| Nine Months Ended September 30, | Year Ended December 31, | |||||||||||||||||||||||||||
| 2014 | 2013 | 2013 | 2012 | 2011 | 2010 | 2009 | ||||||||||||||||||||||
| (Amounts in thousands) | ||||||||||||||||||||||||||||
Cash provided by operating activities | $ | 121,679 | $ | 252,062 | $ | 157,188 | $ | 312,336 | $ | 356,444 | $ | 380,928 | $ | 284,159 | ||||||||||||||
Additions to property and equipment | (160,385 | ) | (168,744 | ) | (226,026 | ) | (193,262 | ) | (164,638 | ) | (130,028 | ) | (106,554 | ) | ||||||||||||||
|
|
|
|
|
|
|
|
|
|
|
|
|
| |||||||||||||||
Free Cash Flow | (38,706 | ) | 83,318 | (68,838 | ) | 119,074 | 191,806 | 250,900 | 177,605 | |||||||||||||||||||
Adjustments: | ||||||||||||||||||||||||||||
Restructuring and other costs(6)(10) | 38,527 | 12,933 | 29,069 | 6,776 | 12,988 | 17,282 | 22,387 | |||||||||||||||||||||
Litigation settlement and tax payments for certain items(7)(11) | 69,286 | 46,221 | 150,584 | 100,000 | — | — | — | |||||||||||||||||||||
Other litigation costs(7)(10) | 11,148 | 10,668 | 17,419 | 51,602 | 21,601 | 1,600 | 1,405 | |||||||||||||||||||||
Management fees(8)(10) | 23,701 | 7,347 | 8,761 | 7,769 | 7,191 | 6,730 | 7,260 | |||||||||||||||||||||
Travelocity working capital as impacted by the Expedia SMA and the sale of TPN(9) | 100,145 | — | 23,928 | — | — | — | — | |||||||||||||||||||||
|
|
|
|
|
|
|
|
|
|
|
|
|
| |||||||||||||||
Adjusted Free Cash Flow | $ | 204,101 | $ | 160,487 | $ | 160,923 | $ | 285,221 | $ | 233,586 | $ | 276,512 | $ | 208,657 | ||||||||||||||
|
|
|
|
|
|
|
|
|
|
|
|
|
| |||||||||||||||
| (1) | Net income (loss) attributable to non-controlling interests represents an adjustment to include earnings allocated to non-controlling interest held in (i) Sabre Travel Network Middle East of 40% for all periods presented, (ii) Sabre |
| (2) | Represents impairment charges to assets (see Note 7, Goodwill and Intangible Assets, to our audited consolidated financial statements included elsewhere in this prospectus) as well as $24 million in 2012, representing our share of impairment charges recorded by one of our equity method investments, Abacus. |
| (3) | Depreciation and amortization expenses (see Note 2, Summary of Significant Accounting Policies, to our audited consolidated financial statements included elsewhere in this prospectus for associated asset lives): |
| a. | Acquisition related amortization represents amortization of intangible assets from the take-private transaction in 2007 as well as intangibles associated with acquisitions since that date and amortization of the excess basis in our underlying equity in joint ventures. |
| b. | Depreciation and amortization of property and equipment |
| c. | Amortization of capitalized implementation costs represents amortization of upfront costs to implement new customer contracts under our SaaS and hosted revenue model. |
| (4) |
| Our Travel Network business at times provides upfront incentive consideration to travel agency subscribers at the inception or modification of a service contract, which are capitalized and amortized to cost of revenue over an average expected life of the service contract, generally over three to five years. Such consideration is made with the objective of increasing the number of clients or to ensure or improve customer loyalty. Such service contract terms are established such that the supplier and other fees generated over the life of the contract will exceed the cost of the incentive consideration provided upfront. Such service contracts with travel agency subscribers require that the customer commit to achieving certain economic objectives and generally have terms requiring repayment of the upfront incentive consideration if those objectives are not met. |
| (5) | Other, net primarily represents foreign exchange gains and losses related to the remeasurement of foreign currency denominated balances included in our consolidated balance sheets into the relevant functional currency. |
| (6) | Restructuring and other costs represents charges associated with business restructuring and associated changes implemented which resulted in severance benefits related to employee terminations, integration and facility opening or closing costs and other business reorganization costs. |
| (7) | Litigation settlement and tax payments for certain items represent charges or settlements associated with airline antitrust litigation as well as payments or reserves taken in relation to certain retroactive hotel occupancy and excise tax disputes (see Note 13, Contingencies, to our unaudited consolidated financial statements and Note 20, Commitments and Contingencies, to our audited consolidated financial statements included elsewhere in this prospectus). |
| (8) | We paid an annual management fee to TPG and Silver Lake in an amount between (i) $5 million and (ii) $7 million, the actual amount of which was calculated based upon 1% of Adjusted EBITDA, as defined in the management services agreement (the “MSA”), earned by the company in such fiscal year up to a maximum of $7 million. In addition, the MSA provided for the reimbursement of certain costs incurred by TPG and Silver Lake, which are included in this line item. In connection with our initial public offering, we paid to TPG and Silver Lake, in the aggregate, a $21 million fee pursuant to the MSA. The MSA was terminated at the completion of our initial public offering. |
| (9) | Represents the impact of the Expedia SMA and the sale of TPN on working capital for the nine months ended September 30, 2014, which is primarily attributable to the migration of bookings from our technology platform to Expedia’s platform and wind down activities associated with TPN. For the year ended December 31, 2013, represents the impact by the Expedia SMA on travel supplier liabilities of $19 million and accounts payable of $5 million for the period November 1, 2013 through December 31, 2013 compared to the period November 1, 2012 through December 31, 2012, which is primarily attributable to the migration of bookings from our technology platform to Expedia’s platform during this period in 2013 (see “Management’s Discussion and Analysis of Financial Condition and Results of Operations—Factors Affecting our Results and Comparability—Travelocity”). |
87
| (10) | The adjustments to reconcile cash provided by operating activities to Adjusted Free Cash Flow reflect the amounts expensed in our statements of operations in the respective periods adjusted for cash and non-cash portions in instances where material. |
| (11) | Includes payment credits used by American Airlines to pay for purchases of our technology services during the nine months ended September 30, 2014 and the year ended December 31, 2013. The payment credits were provided by us as part of our litigation settlement with American Airlines (see Note 20, Commitments and Contingencies, to our audited consolidated financial statements included elsewhere in this prospectus). Also includes a $50 million payment to American Airlines made in the third quarter of 2014 in conjunction with the new Airline Solutions contract, which will be amortized as a reduction to revenue over the contract term. This payment reduces payment credits originally offered to American Airlines as a part of the litigation settlement in 2012, contingent upon the signature of a new reservation agreement, which were extended to include the combined American Airlines and US Airways reservation contract. The payment credits would have been utilized for future billings under the new agreement. |
88
MANAGEMENT’S DISCUSSION AND ANALYSIS OF
FINANCIAL CONDITION AND RESULTS OF OPERATIONS
The following discussion and analysis containsforward-looking statements about trends, uncertainties and our plans and expectations of what may happen in the future.Forward-looking statements are based on a number of assumptions and estimates that are inherently subject to significant risks and uncertainties and our results could differ materially from the results anticipated by ourforward-looking statements as a result of many known or unknown factors, including, but not limited to, those factors discussed in the sections entitled “Risk Factors” and “Cautionary Note RegardingForward-Looking Statements” and elsewhere in this prospectus.
The following discussion and analysis should be read in conjunction with our consolidated financial statements and related notes and the information contained elsewhere in this prospectus under the captions “Risk Factors,” “Selected Historical Consolidated Financial Data” and “Business.”
Overview
We are a leading technology solutions provider to the global travel and tourism industry. We span the breadth of a highly complex $6.6$7 trillion global travel ecosystem currently through threetwo business segments: (i) Travel Network, our global B2B travel marketplace for travel suppliers and travel buyers, and (ii) Airline and Hospitality Solutions, an extensive suite of leading software solutions primarily for airlines and hotel properties, and (iii) Travelocity, our portfolio of online consumer travel e-commerce businesses through which we provide travel content and booking functionality primarily for leisure travelers.properties. Collectively, these offerings enable travel suppliers to better serve their customers across the entire travel lifecycle, from route planning topost-trip business intelligence and analysis. Items that are not allocated to our business segments are identified as corporate and include primarily certain shared technology costs as well asstock-based compensation expense, litigation costs related to occupancy or other taxes and other items that are not identifiable with one of our segments. On December 16, 2014, we announced that we had received a binding offer from Bravofly Rumbo Group to acquire lastminute.com and on January 23, 2015, we announced the sale of Travelocity.com to Expedia, Inc. See “Summary–Recent Developments.” We will reclassify and report the Travelocity segment, which was comprised of a portfolio of online consumer travele-commerce businesses through which we provided travel content and booking functionality primarily for leisure travelers, as discontinued operations in our 2014 Annual Report on Form 10-K as the segment was considered held for sale as of December 31, 2014.
Through our Travel Network business, we process hundreds of millions of transactions annually, connecting the world’s leading travel suppliers, including airlines, hotels, car rental brands, rail carriers, cruise lines and tour operators, with travel buyers in a comprehensive travel marketplace. We offer efficient, global distribution of travel content from approximately 125,000 travel suppliers to approximately 400,000 online and offline travel agents. To those agents, we offer a platform to shop, price, book and ticket comprehensive travel content in a transparent and efficient workflow. We also offervalue-added solutions that enable our customers to better manage and analyze their businesses. Through our Airline and Hospitality Solutions business, we offer travel suppliers an extensive suite of leading software solutions, ranging from airline and hotel reservations systems tohigh-value marketing and operations solutions. These solutions such as planning airline crew schedules, includere-accommodating passengers during irregular flight operations and managingday-to-day hotel operations. These solutions allow our customers to market, distribute and sell their products more efficiently, manage their core operations, and deliver an enhanced travel experience. Through our complementary Travel Network and Airline and Hospitality Solutions businesses, we believe we offer the broadest,end-to-end portfolio of technology solutions to the travel industry.
Our portfolio of technology solutions has enabled us to become the leadingend-to-end technology provider in the travel industry. For example, we are one of the largest GDS providers in the world, with a 36% share ofGDS-processed air bookings in 2013. More specifically, we are the #1 GDS provider in North America and also in higher growth markets such as Latin America and APAC, in each case based onGDS-processed air bookings in 2013. In those three markets, ourGDS-processed air bookings share was approximately 50% on a combined basis in 2013. In Airline and Hospitality Solutions, we believe we have the most comprehensive portfolio of solutions. In 2013, we had the largest third-party hospitality CRS room share based on our approximately 27%
89
share ofthird-party hospitality CRS hotel rooms distributed through our GDS, and, according to T2RL PSS data for 2012, we had the second largest airline reservations system globally. We also believe that we have the leading portfolio of airline marketing and operations products across the solutions that we provide. In addition, we operate Travelocity, one of the world’s most recognizable brands in the online consumer travel e-commerce industry, which provides us with business insights into our broader customer base.provide
A significant portion of our revenue is generated through transaction based fees that we charge to our customers. For Travel Network, this fee is in the form of a transaction fee for bookings on our GDS; for Airline and Hospitality Solutions, this fee is a recurringusage-based fee for the use of our SaaS and hosted systems, as well as implementation fees and consulting fees.
For the nine months ended September 30, 2014 and 2013, we recorded revenue of $2,229 million and $2,303 million, respectively, net income attributable to Sabre Corporation of $23 million and loss of $127 million respectively, and Adjusted EBITDA of $617 million and $584 million, respectively, reflecting a 1% and (6)% net income (loss) margin and a 28% and 25% Adjusted EBITDA margin, respectively. For the nine months ended September 30, 2014, Travel Network contributed 63%, Airline and Hospitality Solutions contributed 25%, and Travelocity contributed 12% of our revenue (excluding intersegment eliminations). During this period, shares of Adjusted EBITDA for Travel Network, Airline and Hospitality Solutions, and Travelocity were approximately 77%, 25% and (2)%, respectively (excluding corporate overhead allocations such as finance, legal, human resources and certain information technology shared services). See “Summary-Recent Developments” regarding our Travelocity business segment moving to discontinued operations.
We recorded revenue of $3,050 million and $2,974 million, net loss attributable to Sabre Corporation of $100 million and $611 million and Adjusted EBITDA of $791 million and $787 million, reflecting a 3% and 21% net loss margin and a 26% and 26% Adjusted EBITDA margin, for the years ended December 31, 2013 and 2012, respectively. For additional information regarding Adjusted EBITDA, including a reconciliation of Adjusted EBITDA to the most directly comparable GAAP measure, see “Non-GAAP Financial Measures” and “Summary—Summary Consolidated Financial Data—Non-GAAP Measurements.” For the year ended December 31, 2013, Travel Network contributed 58%, Airline and Hospitality Solutions contributed 23%, and Travelocity contributed 19% of our revenue (excluding intersegment eliminations). During this period, shares of Adjusted EBITDA were approximately 77%, 21% and 2% for Travel Network, Airline and Hospitality Solutions and Travelocity, respectively (excluding corporate overhead allocations such as finance, legal, human resources and certain information technology shared services). For the year ended December 31, 2012, Travel Network contributed 59% and 77%, Airline and Hospitality Solutions contributed 20% and 17%, and Travelocity contributed 21% and 6% of our revenue (excluding intersegment eliminations) and Adjusted EBITDA (excluding corporate overhead allocations), respectively. See “Summary-Recent Developments” regarding our Travelocity business segment moving to discontinued operations.
For additional information regarding Adjusted EBITDA, including a reconciliation of Adjusted EBITDA to the most directly comparable GAAP measure, see “Non-GAAP Financial Measures” and “Summary Historical and Pro Forma Consolidated Financial and Other Data.”
Factors Affecting our Results and Comparability
The following is a discussion of trends that we believe are the most significant opportunities and challenges currently impacting our business and industry. The discussion also includes management’s assessment of the effects these trends have had and are expected to have on our results of continuing operations. This information is not an exhaustive list of all of the factors that could affect our results and should be read in conjunction with the factors referred to in the sections entitled “Risk Factors” and “Cautionary Note RegardingForward-Looking Statements” included elsewhere in this prospectus.
Travel volumes and the travel industry
Our business and results of operations are dependent upon travel volumes and the overall health of the travel industry, particularly in North America. The travel industry has shown strong and resilient expansion with growth rates typically outperforming general macroeconomic performance. For example, based on 40 years of IATA Traffic data, air traffic has historically grown at an average rate of approximately 1.5x the rate of global GDP growth. Although the global economic downturn significantly impacted the travel industry, conditions have
90
generally improved in the last several years. For example, although hotel sales are still hampered by an economic environment characterized by austerity and consumer caution, other less expensive suppliers, including LCC/hybrids, are benefiting. Tourism flows and travel spending have returned to growth as developed markets, particularly in the United States, Japan and Europe, recover from the global economic downturn. According to the Euromonitor Report,business-related travel by U.S. residents has increased since the global economic downturn, reaching 228229 million trips in 2012.2013 compared to 223 million trips in 2010. According to IATA Traffic, global airline passenger volume has grown at a 6% CAGR from 2009 to 2012. Looking forward, air travel and hotel spending is expected to grow at a 4% CAGR from 2013 to 2017, as growing consumer confidence and increasing connectivity continue to expand the opportunities for travel and tourism, according to Euromonitor Database.2013. However, in recent years, several airlines, especially in the United States, have implemented capacity reductions in response to slowing customer demand following the global economic downturn and in order to improve pricing power. These capacity reductions have resulted in lower inventory and higher ticket prices, amid increased airline industry consolidation.
Geographic mix
We have a leading share ofGDS-processed air bookings in the largest travel market, North America (55%), as well as in two large growth markets, Latin America (57%) and APAC (39%) in 2013. See “Method of
Calculation” for an explanation of the methodology underlying ourGDS-processed air bookings share calculation. For the year ended December 31, 2013, we derived approximately 58% of our revenue from the United States, 16% from Europe and 26% from the rest of the world. For the year ended December 31, 2012, we derived approximately 62% of our revenue from the United States, 16% from Europe and 22% from the rest of the world.
There are structural differences between the geographies in which we operate. Due to our geographic concentration, our results of operations are particularly sensitive to factors affecting North America. For example, booking fees per transaction in North America have traditionally been lower than those in Europe. By growing internationally with our TMC and OTA customers and expanding the travel content available on our GDS to target regional traveler preferences, we anticipate that we will maintain share in North America and grow share in Europe, APAC and Latin America.
Continued focus by travel suppliers oncost-cutting and exerting influence over distribution
Travel suppliers continue to look for ways to decrease their costs and to increase their control over distribution. Airline consolidations, pricing pressure during contract renegotiations and the use of direct distribution may continue to subject our business to challenges.
The shift from indirect distribution channels, such as our GDS and Travelocity, to direct distribution channels, may result from increased content availability onsupplier-operated websites or from increased participation ofmeta-search engines, such as Kayak and Google, which direct consumers tosupplier-operated websites. This trend may adversely affect our Travel Network contract renegotiations with suppliers that use alternative distribution channels. For example, airlines may withhold part of their content for distribution exclusively through their own direct distribution channels or offer more attractive terms for content available through those direct channels. Similarly, some airlines have also limited the fare content information they distribute through OTAs, including Travelocity.
However, since 2010, we believe the rate at which bookings are shifting from indirect to direct distribution channels has slowed for a number of reasons, including the increased participation of LCC/hybrids in indirect channels. Over the last several years, notable carriers that previously only distributed directly, including JetBlue and Norwegian, have adopted our GDS. Other carriers such as EVA Airways and Virgin Australia have further increased their participation in a GDS. In 2012 and 2013, we believe the rate of shift away from GDSs in the United States stabilized at very low levels, although we cannot predict whether this low rate of shift will continue.
91
These trends have impacted the revenue of Travel Network, which recognizes revenue for airline ticket sales based on transaction volumes, the revenue of Airline and Hospitality Solutions, which recognizes a portion of its revenue based on the number of PBs, and the results of Travelocity, the profitability of which is based on both the volume of sales and the amount spent by the traveler, depending upon the applicable revenue model. Simultaneously, this focus oncost-cutting and direct distribution has also presented opportunities for Airline and Hospitality Solutions. Many airlines have turned to outside providers for key systems, process and industry expertise and other products that assist in their cost cutting initiatives in order to focus on their primaryrevenue-generating activities.
We have 28 planned Travel Network airline contract renewals in 2014, representing 22% of our Travel Network revenue for the year ended December 31, 2013 and 24 planned renewals in 2015 (representing 5% of our Travel Network revenue for the year ended December 31, 2013). Although we renewed 24 out of 24 planned renewals in 2013 (representing approximately 25% of our Travel Network revenue for the twelve months ended December 31, 2013). We renewed 28 out of 28 planned renewals in 2014 (representing approximately 22% of our Travel Network revenue for the twelve months ended December 31, 2014). We have 38 planned renewals in 2015 (representing approximately 20% of our Travel Network revenue for the twelve months ended December 31, 2014). Although we renewed 28 out of 28 planned renewals in 2014 (representing approximately 22% of Travel Network revenue for the year ended December 31, 2013)2014), we cannot guarantee that we will be able to renew our airline contracts in the future on favorable economic terms or at all.
Shift to SaaS and hosted solutions by airlines and hotels to manage their daily operations
Initially, large travel suppliers built customin-house software and applications for their business process needs. In response to a desire for more flexible systems given increasingly complex and constantly changing technological requirements, reduced IT budgets and increased focus on cost efficiency, many travel suppliers turned tothird-party solutions providers for many of their key technologies and began to license software from software providers. We believe that significant revenue opportunity remains in this outsourcing trend, as legacyin-house systems continue to migrate and upgrade tothird-party systems. By moving away fromone-time license fees to recurring monthly fees associated with our SaaS and hosted solutions, our revenue stream has become more predictable and sustainable. The SaaS and hosted models’ centralized deployment also allows us to save time and money by reducing maintenance and implementation tasks and lowering operating costs.
Increasing importance of LCC/hybrids in Travel Network and Airline and Hospitality Solutions
Hybrid and LCCs have become a significant segment of the air travel market, stimulating demand for air travel through low fares. LCC/hybrids have traditionally relied on direct distribution for the majority of their bookings. However, as these LCC/hybrids are evolving, many are increasing their distribution through indirect channels to expand their offering intohigher-yield markets and tohigher-yield customers, such as business and international travelers. Other LCC/hybrids, especiallystart-up carriers, may choose not to distribute through the GDS until wider distribution is desired.
Over the last fourfive years, we have added airline customers representing over 110 million PBs, including many innovative,fast-growing LCC/hybrids. According to Airbus, LCCs’ share of global air travel volume is expected to increase from 17% of revenue passenger kilometers in 2012 to 21% of revenue passenger kilometers by 2032. In our airline reservations products, our travel supplier customer base is weighted towardsfaster-growing LCC/hybrids, which represented approximately 45%29% of our 20122013 PBs based on T2RL data, and we expect to continue to take advantage of this growth opportunity. In 2012, LCC/hybrids represented approximately 45% of our 2012 PBs. T2RL’s LCC/hybrid group included JetBlue and Lion Airlines in 2012, which we consider LCC/hybrid carriers. T2RL’s 2013 calculation excludes these carriers from the LCC/hybrid group. If these two carriers were included as LCC/hybrids in the 2013 calculation, LCC/hybrids would have represented approximately 41% of our 2013 PBs. Furthermore, because of the breadth of our solution set and our proportion of LCC/hybrid customers, we expect to be able to sell more of our solutions to our existing customers as they grow. As our growing LCC/hybrid customers demand additional solutions and capabilities, we expect Airline and Hospitality Solutions revenue to continue benefiting from the higher growth in these types of airlines.
92
Travel buyers can shift their bookings to or from our Travel Network business
Our Travel Network business relies on relationships with several large travel buyers, including TMCs and OTAs, to drive a large portion of its revenue. Although no individual travel buyer accounts for more than 10% of our Travel Network revenue, the five largest travel buyers of Travel Network were responsible for bookings that representrepresented approximately 32% of our Travel Network revenue for the nine months ended September 30, 2014, and 32% and 36% of our Travel Network revenue for the years ended December 31, 2013 and 2012, respectively. Although our contracts with larger travel agencies often increase the amount of the incentive consideration when the travel agency processes a certain volume or percentage of its bookings through our GDS, travel buyers are not contractually required to book exclusively through our GDS during the contract term. Travel buyers may shift bookings to other distribution intermediaries for many reasons, including to avoid becoming overly dependent on a single source of travel content and increase their bargaining power with the GDS providers. For example, in late 2012, Expedia adopted a dual GDS provider strategy and shifted a sizeable portion of its business from our GDS to a competitor GDS, resulting in ayear-over-year decline in our transaction volumes in 2013. Conversely, certain European OTAs including Unister, eTravel and Bravofly that did not previously use our GDS shifted a portion of their business to our GDS.
Increasing travel agency incentive consideration
Travel agency incentive consideration is a large portion of Travel Network expenses. The vast majority of incentive consideration is tied to absolute booking volumes based on transactions such as flight segments booked. Incentive consideration, which often increases once a certain volume or percentage of bookings is met,
is provided in two ways, according to the terms of the agreement: (i) on a periodic basis over the term of the contract and (ii) in some instances, up front at the inception or modification of contracts, which is capitalized and amortized over the expected life of the contract. Although this consideration has been increasing in real terms, it has been relatively stable as a percentage of Travel Network revenue over the last four years, partially due to our focus on managing incentive consideration. We believe we have been effective in mitigating the trend towards increasing incentive consideration by offeringvalue-added products and content, such as Sabre Red Workspace, a SaaS product available to our travel buyers that provides an easy to use interface along with many travel agency workflow and productivity tools.
Growing demand for continued technology improvements in the fragmented hotel market
Most of the hotel market is highly fragmented. Independent hotels andsmall- tomedium-sized chains (groups of less than 300 properties) comprise a majority of hotel properties and available hotel rooms, with global and regional chains comprising the balance. Hotels use a number of different technology systems to distribute and market their products and operate efficiently. We offer technology solutions to all segments of the hospitality market, particularly independent hotels andsmall- tomedium-sized chains. As these markets continue to grow, we believe independent hotel owners and operators will continue to seek increased connectivity and integrated solutions to ensure access to global travelers. Gartner estimates that technology spending by the hospitality industry is expected to reach $32 billion in 2017 (Gartner Enterprise), and we believe we will bewell-positioned to meet this increased demand by continuing to provide affordable,web-based distribution technology. For example, we believe our innovative PMS, which is used by more than 4,500 properties globally, is one of the leading third-party web-basedthird-partyweb-based PMSs. Our PMS platform complements ourindustry-leading CRS platform and we expect to launch an integrated hospitality management suite that will centralize all distribution, operations and marketing aspects to facilitate increased accuracy, elimination of redundancies, and increased revenue and cost savings. We anticipate that this will contribute to the continued growth of Airline and Hospitality Solutions, which is ultimately dependent upon these hoteliers accepting and utilizing our products and services.
Travelocity
Travelocity’s results have beenwere adversely impacted by several factors in recent years, including margin pressure from suppliers and reduced bookings on our websites. For the three years ended December 31, 2013, Travelocity
93
experienced an approximately 8%9% compound annual revenue decline due to intense competition within the travel industry, including from supplier direct websites, online agencies and other suppliers of travel products and services. The increased level of competition has led to declines in fees paid to us pursuant to newlong-term supplier agreements with several large North American airlines in 2011 as well as lower transaction volumes. In 2012, transaction revenues were impacted by the loss of a key TPN customer late in the third quarter as a result of this customer’s contract ending without renewal. This loss was partially offset by the addition of a new TPN customer, which signed amulti-year agreement.
Lower transaction volumes on our websites have also impacted our media revenue.revenue. Due to the reduction in site traffic associated with lower hotel transaction volumes and the change in customer demographics associated with the loss of a key TPN customer in 2012, Travelocity’s relevance as an advertising platform and the media revenues we derivederived from advertising have beenwere negatively affected. In 2012, these challenges have contributed to a significant decline year over year. For the year ended December 31, 2013, we experienced a $5 million decline in media revenue compared to 2012.
Intense competition in the travel industry has historically led OTAs and travel suppliers to spend aggressively on online marketing. The amount we spent on online marketing declined in 2011 and was less effective at driving transaction revenue than it was in 2010. In response, we modified our customer acquisition strategy in 2012, refocusing on more efficient marketing channels and refreshing the approach to the brand, while reducing the amount spent on marketing. If our online marketing strategy is not successful, it could lead to continued declines in Travelocity revenue.
As a result of these and other factors, we initiated plans in the third quarter of 2013 to shift our Travelocity business in the United States and Canada away from a highfixed-cost model to alower-cost,performance-based revenue structure. On August 22, 2013, Travelocity entered into an exclusive,long-term strategic marketing agreement with Expedia, which was recently amended and restated in March 2014 to reflect changed commercial terms.Expedia. Under the Expedia SMA, Expedia will powerpowered the technology platforms for Travelocity’s existing U.S. and Canadian websites as well as provideprovided Travelocity with access to Expedia’s supply and customer service platforms. In connection with the Expedia SMA we also entered into the Put/Call Agreement. The Expedia SMA representsrepresented a strategic decision to reduce direct costs associated with Travelocity and to provide our customers with the benefit of Expedia’slong-term investment in its technology platform as well as its supply and customer service platforms, which we expectexpected to increase conversion and operational efficiency and allows us to shift our focus to Travelocity’s marketing strengths. Both parties began development and implementation of this arrangement after signing the Expedia SMA. As of December 31, 2013, the majority of the online hotel and air offering has been migrated to the Expedia platform, and a launch of the majority of the remainder is expected in early 2014. See “Business—Our Businesses—Travelocity.”
Under the terms of the Expedia SMA and through the date of the sale of Travelocity.com to Expedia, will payInc. on January 23, 2015, Expedia paid us a performance-based marketing fee that will varyvaried based on the amount of travel booked through Travelocity-branded websites powered by Expedia. The marketing fee we receive will bereceived was recorded as marketing fee revenue and the cost we incurincurred to promote the Travelocity brand and for marketing will bewas recorded as selling, general and administrative expense in our results of operations. As a result of transactions being processed through Expedia’s platform instead of the Travelocity platform, the revenue we derivederived from the merchant, agency and media revenue models will decline.declined. In connection with this migration, we will no longer bewere considered the merchant of record for merchant transactions, and therefore we will no longer collectcollected cash from consumers, receivereceived transaction fees and commissions directly from travel suppliers, receivereceived service fees or insurance related revenue directly from customers or directly market or receivereceived media revenue from advertisers on our websites. We will instead collectcollected the marketing fee revenue from Expedia, which iswas net of costs incurred by Expedia in connection with these activities. Additionally, Travelocity will no longer receivereceived incentive consideration from Travel Network as intersegment revenue, and we doExpedia was not expect that Expedia willrequired to use Travel Network for shopping and booking of a portion of non-air travel for Travelocity.com and Travelocity.ca afterTravelocity.ca.
In the launchfourth quarter of 2013, we continued our restructuring of Travelocity by implementing a plan to restructure lastminute.com, the European portion of the Travelocity business, in order to allow lastminute.com to operate independently. During the year ended December 31, 2013, we recorded $6 million in restructuring charges associated with employee termination benefits related to this restructuring plan. We did not record material charges during the nine months ended September 30, 2014 associated with this restructuring plan.
94
In February 2014, as a further step in our restructuring plans for Travelocity, we completed a sale of assets associated with Travelocity Partner Network (“TPN”), a business-to-business private white label website offering. In connection with the sale, Travelocity entered into a Transition Services Agreement (“TSA”) with the acquirer to provide services to maintain the websites and certain technical and administrative functions for the acquirer until a complete transition occurs or the TSA terminates. The proceeds to be received under the sale agreement and the TSA were allocated across these multiple agreements based on a relative fair value allocation. During the nine months ended September 30, 2014, we recorded a loss on disposition of $3 million which is included in restructuring charges in our consolidated statements of operations.
On August 27, 2014, we announced that we were reviewing strategic options for lastminute.com as part of our strategy to focus on our core business as the world’s leading technology provider to the global travel and tourism industry. On December 16, 2014, we announced that Bravofly Rumbo Group made a binding offer to acquire lastminute.com. The transaction is expected to be completed in the first quarter of 2015. We cannot provide any assurance that this transaction will occur on the terms described herein or at all. See “Summary–Recent Developments.”
On January 23, 2015, we announced the sale of Travelocity.com to Expedia, SMA. In addition,Inc. Following the sale of Travelocity.com to Expedia, may chooseInc., the Expedia SMA was terminated. See “Summary–Recent Developments.” The acquirer of Travelocity.com has signed, and the acquirer of lastminute.com has committed to use another intermediarysign as part of its binding offer, a long term agreement with our Travel Network business to continue to utilize our GDS for shopping and booking of a portion or all ofbookings which will generate incentive consideration to be paid by us to the air travel booked through Travelocity.com and Travelocity.ca beginning in 2019, subject to earlier termination under certain circumstances.acquirers.
As a result of the factors described above, we expect our revenue to declinechange in connection withTravelocity’s business model under the Expedia SMA; we expectSMA, prior to the sale of Travelocity.com, and the sale of our TPN business, the revenue contribution from Travelocity-branded websites to bethe Travelocity segment was in the range of 50%55% to 60%65% of current levels.2013 levels after the Expedia SMA was implemented. Due to the elimination of the intersegment revenue between Travelocity and Travel Network, we expect intersegment eliminations to substantially decreasedecreased in connection with the Expedia SMA. See “—Components of Revenues and Expenses—Intersegment Transactions.”
Correspondingly, we will wind downceased certain internal processes, including back office functions, as transactions move fromassociated with our Travelocity-branded technology platforms and TPN business. Through the date of the sale of Travelocity.com to those of Expedia. We therefore expectExpedia, Inc. on January 23, 2015, our costs tofrom the Travelocity segment have significantly decreasedecreased and to beare in the range of 40%45% to 50%55% of current levels once the transition to the Expedia SMA and restructuring is complete.2013 levels. Ongoing costs willin our Travelocity business in the United States and Canada primarily consistconsisted of marketing the Travelocity website, marketing staff and support staff. Under the Expedia SMA, we have committed to continue investing in the marketing of the Travelocity-branded websites in a manner that is consistent with past practice.
As a result, we expect our plan to resultresulted in improved margins and profitability for our Travelocity segment.
Our success is dependent on many factors, including:
We cannot be certain that this plan will be successful.
The implementation of the Expedia SMA will resultresulted in various restructuring costs, including asset impairments, exit charges including employee termination benefits and contract termination fees, and other related costs such as consulting and legal fees. As a result of this restructuring plan, we recorded $22 million in restructuring charges in our results of operations during the year ended December 31, 2013, which included $4 million of asset impairments, $12 million of employee termination benefits, and $6 million of other related costs. We estimate that we will incur additionaldid not record any material restructuring charges in our results of approximately $11 millionoperations during the nine months ended September 30, 2014 or twelve months ended December 31, 2014 in 2014 consisting of $6 million in contract termination costs, $2 million in employee termination benefits, and $3 million of other related costs.connection with these transactions. Contract termination costs represent an estimate of costs we may incur as we negotiate with our vendors to terminate contracts and costs for contracts we are unable to renegotiate and receive no future benefit. The actual amount incurred may differ significantly from this estimate.
We also expect ourTravelocity’s working capital to bewas impacted in connection withby the Expedia SMA and the sale of TPN. As of September 30, 2014 and December 31, 2013, we had approximately $107 million and $214 million, respectively, in total travel supplier liabilities of which $23 million and $129 million, recorded as arespectively, represents the liability to travel suppliers in the United Statesconnection with Travelocity.com and Canada.TPN. This liability will decline materiallyis being extinguished as a result of the Expedia SMA and the sale of TPN and as we continue to pay travel suppliers for travel consumed that originated on our technology platforms; however, we will
95
platforms. We no longer receive cash directly from consumers and willdo not incur a payable to travel suppliers for new bookings on our balance sheets. Going forward,Subsequent to the Expedia SMA and the sale of TPN, ourTravelocity-related working capital will primarily consistconsisted of amounts attributable to lastminute.com balances as well as amounts due from Expedia offset by payables for marketing and labor related costs, which we expect to reduce the quarterly volatility that exists today.costs. As described in “Description of Certain Indebtedness—Senior Secured Credit Facilities,” we have used a portion of the proceeds from our Incremental Term Loan Facility for such working capital purposes.
As part of our negotiations to amend and restate the Expedia SMA, we also agreed to a separate Expedia Put/Call agreement that supersedes the previous put/call arrangement, whereby Expedia may acquire, or we may sell to Expedia, certain assets relating to the Travelocity business. Our put right may be exercised during the first 24 months of the Expedia Put/Call only upon the occurrence of certain triggering events primarily relating to implementation, which are outside of our control. The occurrence of such events is not considered probable. During this period, the amount of the put right is fixed. After the 24 month period, the put right is only exercisable for a limited period of time in 2016 and 2017 at a discount to fair market value. The call right held by Expedia is exercisable at any time during the term of the Expedia Put/Call. If the call right is exercised, although we expect the amount paid will be fair value, the call right provides for a floor for a limited time that may be higher than fair value and a ceiling for the duration of the Expedia Put/Call that may be lower than fair value.
The term of the amended and restated Expedia SMA is nine years and automatically renews under certain conditions.
In the fourth quarter of 2013, we continued our restructuring of Travelocity by implementing a plan to restructure lastminute.com, the European portion of the Travelocity business. Travelocity will continue to be managed as one reportable segment. During the year ended December 31, 2013, we recorded $6 million in restructuring charges associated with employee termination benefits related to this restructuring plan. Additionally, Travelocity recently sold its TPN business, a B2B loyalty and private label website offering, to Orbitz.
See “Business—Our Businesses—Travelocity.”
Litigation and related costs
We are involved in various claims, legal proceedings and governmental inquiries related to contract disputes, business practices, intellectual property and other commercial, employment and tax matters. We believe we have adequately accrued for such matters, and for the costs of defending against such matters, which have been and may continue to be expensive. However, litigation is inherently unpredictable and although we believe
that our accruals are adequate and we have valid defenses in these matters, unfavorable resolutions could occur, which could have a material adverse effect on our results of operations or cash flows in a particular reporting period. See “Business—Legal Proceedings.”
Pursuant to the Expedia SMA, we will continue to be liable for fees, charges, costs and settlements relating to litigation arising from hotels booked on the Travelocity platform prior to the Expedia SMA. However, fees, charges, costs and settlements relating to litigation from hotels booked subsequent to the Expedia SMA will be shared with Expedia according to the terms of the Expedia SMA.
On October 30, 2012, we entered into a settlement agreement to resolve the outstanding state and federal lawsuits with American Airlines filed in 2011 and, as a result of the terms of the settlement, among other things renewed our distribution agreement with American Airlines. The settlement and distribution agreement was approved by the court presiding over the restructuring proceedings for AMR Corporation, American Airlines’ parent company, pursuant to an order made final on December 20, 2012. We expensed $347 million in 2012 related to this settlement agreement. On April 21, 2011, US Airways sued us in federal court in the Southern District of New York alleging federal antitrust claims. We are also involved in an antitrust investigation by the DOJ relating to pricing and the conduct of our GDS business and in antitrust litigation involving hotel room prices. See Note 20, Commitments and Contingencies—Legal Proceedings—US Airways Antitrust Litigation, Department of Justice Investigation and Hotel Related Antitrust Proceedings, to our audited consolidated financial statements included elsewhere in this prospectus. See also Note 13, Contingencies—Legal Proceedings—US Airways Antitrust Litigation and DOJ Investigation, to our unaudited consolidated financial statements included elsewhere in this prospectus.
Customer Mix
We believe we have a broadly diversified customer mix which supports our stable revenue base. We serve two principal types of customers: travel suppliers, which we serve in both our Travel Network business and Airline and Hospitality Solutions business; and travel buyers, which we serve in our Travel Network business and who purchase a wide variety of travel content in our marketplace. Today, our Travel Network marketplace includes a diversified group of travel suppliers, including approximately 400 airlines, 125,000 hotel properties, 30 car rental brands, 50 rail carriers, 16 cruise lines and 200 tour operators. We connect these travel suppliers via our GDS platform to approximately 400,000 travel agents, spread globally across 145 countries. Importantly, none of our travel buyers or travel suppliers represented more than 10% of our total Travel Network revenue for the years ended December 31, 2013 and 2012. Additionally, our Airline and Hospitality Solutions segment represented approximately 225 airlines, 17,00017,500 hotel properties, and more than 700 other customers, including airports, corporate aviation fleets, governments and tourism boards. Within our Airline and Hospitality Solutions business, no single customer represented more than 10% of total Airline and Hospitality Solutions revenues for the years ended December 31, 2013 and 2012.
Due to the quality of our products and services, we have experienced a high level of historical Customer Retention in both our Travel Network and Airline and Hospitality Solutions businesses. In general, our business is characterized by non-exclusive multi-yearnon-exclusivemulti-year agency and supplier contracts, with durations that typically range
96
from three to five years for our major airline suppliers and five to ten years for our major travel agency customers in our Travel Network business, and in our Airline and Hospitality Solutions business, three to seven years among our airline customers and one to five years among our hospitality customers. Furthermore, our Travel Network airline supplier contracts expire at different times, with 28 and 2438 planned renewals for fiscal years 2014 and 2015, respectively.year 2015. We renewed 24 out of 24 planned renewals in 2013.2013 and 28 out of 28 planned renewals in 2014. A meaningful portion of our travel buyer agreements, typically representing approximately 15% to 20% of our bookings, are up for renewal in any given year. With respect to our Airline and Hospitality Solutions business, airline reservations contracts representing less than 5% of our Airline Solutions’ 2013expected 2014 revenue are scheduled for renewal in each of 2014 and 2015 and in each of 2016 and 2017, airline reservationsreservation contracts representing approximately 10%2% of Airline Solutions’ 2013Solutions expected 2014 revenue are scheduled for renewal in each2016. Airline reservations contracts representing approximately 9% of 2016 andAirline Solutions’ expected 2014 revenue are scheduled for renewal in 2017. Hospitality Solutions contract renewals are relatively evenly spaced, with approximatelyone-third of contracts representing approximatelyone-third of Hospitality Solutions’ 2013 revenue coming up for renewal in any given year. For the year 2013, our
Customer Retention rate was approximately 99% for Travel Network, 98% for Airline Solutions and 96% for Hospitality Solutions. We cannot guarantee that we will be able to renew our travel supplier or travel buyer agreements in the future on favorable economic terms or at all.
Our revenue base is broadly diversified, with no single customer comprising more than 10% of our total revenues for the year ended December 31, 2013 or the year ended December 31, 2012. We are subject to a certain degree of revenue concentration among a portion of our customer base. Our topThe five largest travel buyers of Travel Network customers were responsible for bookings that represented approximately 32% of our Travel Network revenue for the nine months ended September 30, 2014, and 32% and 36% of our Travel Network revenue for the years ended December 31, 2013 and 2012, respectively. Over the same period, ourOur top five Airline and Hospitality Solutions customers represented 24% of our Airlines and Hospitality Solutions revenue for the nine months ended September 30, 2014, and 22% and 20% of our Airline and Hospitality Solutions revenues, for the years ended December 31, 2013 and 2012, respectively. Historical consolidation in the global airline industry, including the mergers of American Airlines and US Airways, Delta and Northwest Airlines, United Airlines and Continental Airlines, as well as Southwest Airlines and AirTran, have generally increased our revenue concentration. If additional consolidation in the airline industry were to occur in the future, our levels of revenue concentration may further increase.
Revenue Models
We employ several revenue models across our businesses with some revenue models employed in multiple businesses. Travel Network primarily employs the transaction revenue model. Airline and Hospitality Solutions primarily employs the SaaS and hosted and consulting revenue models, as well as the software licensing fee model to a lesser extent. Travelocity primarily employed two revenue models: (i) the merchant revenue model or our “Net Rate Program” (applicable to a majority of our hotel net rate revenues) and (ii) the agency revenue model (applicable to most of our airline, car and cruise commission revenues and a small portion of hotel commission revenues). In connection with the Expedia SMA, Travelocity has begun to employemployed the marketing fee revenue model (applicable to revenue generated throughTravelocity-branded websites operated by Expedia). Travel Network and, historically, Travelocity also, employemployed the media revenue model (applicable to advertising revenues). We report revenue net of anyrevenue-based taxes assessed by governmental authorities that are imposed on and concurrent with specificrevenue-producing transactions.
Transaction Revenue Model—This model accounts for substantially all of Travel Network’s revenue. We define a “Direct Billable Booking” as any booking that generates a fee directly to Travel Network. These include bookings made through our GDS (e.g., air, car and hotel bookings) and through our joint venture partners in cases where we are paid directly by the travel supplier. Under this model, a transaction occurs when a travel agency or corporate travel department books, or reserves, a travel supplier’s product on our GDS, for which we receive a fee. Transaction fees include, but are not limited to, transaction fees paid by travel suppliers for selling their inventory through our GDS and transaction fees paid by travel agency subscribers related to their use of our GDS. We receive revenue from the travel supplier and the travel agency according to the commercial arrangement with each.
97
Transaction revenue for airline travel reservations is recognized at the time of the booking of the reservation, net of transaction fee reserves for estimated future cancellations. Our transaction fee cancellation reserve was $8 million at December 31, 2013 and December 31, 2012. Transaction revenue for car rental, hotel bookings and other travel services is recognized at the time the reservation is used by the customer.
SaaS and Hosted Revenue Model—The SaaS and hosted revenue model is the primary revenue model employed by Airline and Hospitality Solutions. This revenue model applies to situations where we host software solutions on our own secure platforms or deploy it through our SaaS solutions, and we maintain the software as well as the infrastructure it employs. Our customers pay us an implementation fee and a recurringusage-based fee for the use of such software pursuant to contracts with terms that typically range between three and ten years and generally include minimum annual volume requirements. Thisusage-based fee arrangement allows our customers to pay for software normally on a monthly basis to the extent that it is used. Similar contracts with the
same customer which are entered into at or around the same period are analyzed for revenue recognition purposes on a combined basis. Revenue from implementation fees is generally recognized over the term of the agreement. The amount of periodic usage fees is typically based on a metric relevant to the software purchased. We recognize revenue from recurringusage-based fees in the period earned. Over the last several years, our customers have shifted toward the SaaS and hosted revenue model as license fee contracts expire, and we expect to continue to facilitate the shift from license fee contracts to the SaaS and hosted revenue model going forward.
Consulting Revenue Model—Airline and Hospitality Solutions offerings that utilize the SaaS and hosted revenue model are sometimes sold as part ofmultiple-element agreements for which we also provide consultingprofessional services. Our professional services consist primarily of consulting services are primarily focused on helping customers achieve better utilization of and return on their software investment. Often, we provide consulting services during the implementation phase of our SaaS solutions. We account for consulting service revenue separately from implementation and recurringusage-based fees, with value assigned to each element based on its relative selling price to the total selling price. We perform a market analysis on a periodic basis to determine the range of selling prices for each product and service. The revenue for consulting services is generally recognized over the period the consulting services are performed.
Software Licensing Fee Revenue Model—The software licensing fee revenue model is also utilized by Airline and Hospitality Solutions. Under this model, we generate revenue by charging customers for the installation and use of our software products. Some contracts under this model generate additional revenue for the maintenance of the software product. When software is sold without associated customization or implementation services, revenue from software licensing fees is recognized when all of the following are met: (i) the software is delivered, (ii) fees are fixed or determinable, (iii) no undelivered elements are essential to the functionality of delivered software, and (iv) collection is probable. When software is sold with customization or implementation services, revenue from software licensing fees is recognized based on the percentage of completion of the customization and implementation services. Fees for software maintenance are recognized ratably over the life of the contract. We are unable to determinevendor-specific objective evidence of fair value for software maintenance fees. Therefore, when fees for software maintenance are included in software license agreements, revenue from the software license, customization, implementation and the maintenance are recognized ratably over the related contract term.
Travelocity Revenue Models
The Marketing Fee, Merchant, Agency and Media Revenue Models are primarily utilized by the Travelocity segment and effective with the dispositions of Travelocity.com and lastminute.com in 2015 will no longer be utilized.
Marketing Fee Revenue Model—With the implementation of Expedia’s technology for our U.S. and Canadian websites beginning late in 2013, Expedia is required to paypaid us aperformance-based marketing fee that will varyvaried based on the amount of travel booked throughTravelocity-branded websites powered by Expedia. The marketing fee we receive will bereceived was recorded as revenue and the costs we incurincurred for marketing and to promote the Travelocity brand will bewere recorded as selling, general and administrative expense in our results of operations. The revenue recognized under this model was not material to our results of operations for the year ended December 31, 2013. See “—Factors Affecting our Results—Results and Comparability—Travelocity.”
98
Merchant Revenue Model—The merchant revenue model or the “Net Rate Program” is utilizedhas been used by Travelocity, except to the extent the marketing fee revenue model applies. We primarily use this model for revenue from hotel reservations and dynamically packaged combinations of travel components. Pursuant to this model, we are the merchant of record for credit card processing for travel accommodations. Even though we are the merchant of record for these transactions, we do not purchase and resell travel accommodations, and we do not have any obligations with respect to the travel accommodations we offer online that we do not sell. Instead, we act as an intermediary by entering into agreements with travel suppliers for the right to market their products, services and other offerings atpre-determined net rates. We market net rate offerings to travelers at prices that include an amount sufficient to pay the travel supplier for providing the travel accommodations and any occupancy and other local taxes, as well as additional amounts representing our service fees, which is how we generate revenue under this model. Under this revenue model, we require prepayment by the traveler at the time of booking.
Travelocity recognizeshas recognized net rate revenue forstand-alone air travel at the time the travel is booked with a reserve for estimated future canceled bookings. Revenues from vacation packages and car rentals as well as hotel net rate revenues are recognized at the time the reservation is used by the consumer.
For net rate and dynamically packaged combinations sold through Travelocity, we record net rate revenues based on the total amount paid by the customer for products and services, net of our payment to the travel supplier. At the time a customer makes and prepays a reservation, we accrue a supplier liability based on the amount we expect to be billed by our travel suppliers. In some cases, a portion of Travelocity’s prepaid net rate and travel package transactions goes unused by the traveler. In suchthese circumstances, Travelocity may not be billed the full amount of the accrued supplier liability. Therefore, we reduce the accrued supplier liability for amounts aged more than six months after the reservation goes unused and record the aged amount as revenue if certain conditions are met. Our process for determining when aged amounts may be recognized as revenue includes consideration of key factors such as the age of the supplier liability, historical billing and payment information, among others.
See “—Factors Affecting our Results—Results and Comparability—Travelocity.”
Agency Revenue Model—This model ishas been employed by Travelocity, except to the extent the marketing fee revenue model applies, and applies to revenues generated via commissions from travel suppliers for reservations made by travelers through our websites. Under this model, we act as an agent in the transaction by passing reservations booked by travelers to the relevant airline, hotel, car rental company, cruise line or other travel supplier, while the travel supplier serves as merchant of record and processes the payment from the traveler.
Under the agency revenue model, Travelocity recognizeshas recognized commission revenue forstand-alone air travel at the time the travel is booked with a reserve for estimated future canceled bookings. Commissions from car and hotel travel suppliers are recognized upon the scheduled date of travel consumption. We record car and hotel commission revenue net of an estimated reserve for cancellations,no-shows and uncollectable commissions. As of December 31, 2013 and 2012, our reserve was approximately $2 million and $3 million, respectively.
See “—Factors Affecting our Results—Results and Comparability—Travelocity.”
Media Revenue Model—The media revenue model ishas been used to record advertising revenue from entities that advertise products on Travelocity’s websites, except to the extent the marketing fee revenue model applies, and, to a lesser extent, on our GDS. Advertisers use two types of advertising metrics: (i) display advertising and (ii) action advertising. In display advertising, advertisers usually pay based on the number of customers who view the advertisement, and are charged based on cost per thousand impressions. In action advertising, advertisers usually pay based on the number of customers who perform a specific action, such as click on the advertisement, and are charged based on the cost per action. Advertising revenues are recognized in the period that the advertising impressions are delivered or theclick-through or other specific action occurs.
See “—Factors Affecting our Results—Results and Comparability—Travelocity.”
99
Components of Revenues and Expenses
Revenues
Travel Network
Travel Network primarily generates revenues from the transaction revenue model, as well as revenue from certain services we provide our joint ventures and the sale of aggregated bookings data to carriers. See “—Revenue Models.”
Airline and Hospitality Solutions
Airline and Hospitality Solutions primarily generates revenue from the SaaS and hosted revenue model, the consulting revenue model, as well as the software licensing fee model to a lesser extent. Over the last several years, our customers have shifted toward the SaaS and hosted revenue model as license fee contracts expire, and we expect to continue to facilitate the shift from license fee contracts to the SaaS and hosted revenue model going forward. See “—Revenue Models.”
Travelocity
Travelocity generatesgenerated transaction revenue through the merchant revenue model and the agency revenue model, andnon-transaction revenue, in each case, except to the extent the marketing fee model applies.applied. See “—Factors Affecting our Results—Results and Comparability—Travelocity.” Transaction revenue is comprised of(i) stand-alone air transaction revenue (i.e., revenue from the sale of air travel without any other products) and (ii) other transaction revenue (i.e., revenue from hotel suppliers, packages which include multiple travel products, lifestyle products such as theatre tickets and services). Both are accounted for under either the merchant or agency revenue models.
Except to the extent the marketing fee model applies,applied, Travelocity also generatesgenerated revenues from fees from offline (e.g., call center agent transacted) bookings for air and packages and insurance revenues fromthird-party insurance providers whose air, total trip and cruise insurance we offer on our websites.
Additionally, Travelocity generatesgenerated intersegment transaction revenue from Travel Network, consisting of incentive consideration earned for Travelocity transactions processed through our GDS and fees paid by Travel Network and Airline and Hospitality Solutions for corporate trips booked through the Travelocity online booking technology. We expectFor the nine months ended September 30, 2014, intersegment revenue to substantially decreasedecreased in connection with the Expedia SMA. Intersegment transaction revenue is eliminated in consolidation.
Non-transaction revenue consistsconsisted of advertising revenue from the media revenue model, paper ticket fees and services, and change and reissue fees.
Cost of Revenue
Travel Network
Travel Network cost of revenues consists primarily of:
| • | Incentive Consideration—payments or other consideration to travel agencies for reservations made on our GDS which have accrued on a monthly basis. Incentive consideration |
| • | Technology Expenses—data processing, data center management, application hosting, applications development and maintenance and related charges. |
100
| • | Labor Expenses—salaries and benefits paid to employees supporting the operations of the business. |
| • | Other Expenses—includes services purchased, facilities and corporate overhead. |
Airline and Hospitality Solutions
Airline and Hospitality Solutions cost of revenues consists primarily of:
| • | Labor Expenses—salaries and benefits paid to employees for the development, delivery and implementation of software. |
| • | Technology Expenses—data processing, data center management, application hosting, applications development and maintenance and related charges resulting from the hosting of our solutions. |
| • | Other Expenses—includes services purchased, facilities and other costs. |
Travelocity
Except as described below, Travelocity cost of revenue has consisted primarily of:
| • | Volume Related Expenses—customer service costs; credit card fees and technology fees; charges related to fraudulent bookings and compensation to customers, i.e., for service related issues. |
| • | Technology Expenses—data processing, data center management, applications development, maintenance and related charges. |
| • | Labor Expenses—salaries and benefits paid to employees supporting the operations of the business. |
| • | Other Expenses—includes services purchased, facilities and other costs. |
In connection withFollowing the Expedia SMA, Travelocity willdid not incur significant cost of revenues with respect to Travelocity’s existing websites in the United States and Canada.
Corporate
Corporate cost of revenue includes certain shared technology costs as well asstock-based compensation expense, litigation expenses associated with occupancy or other taxes and other items that are not identifiable with one of our segments.
Depreciation and amortization
Cost of revenue includes depreciation and amortization associated with property and equipment andequipment; software developed for internal use that supports our revenue, businesses and systems. Depreciation and amortization also includessystems; amortization of contract implementation costs which relates to Airlines and Hospitality Solutions; and intangible assets for technology purchased through acquisitions or established with ourtake-private transaction.
Amortization of upfront incentive consideration
We provide upfront payments or other consideration to travel agencies for reservations made on our GDS which are capitalized and amortized over the expected life of the contract.
Selling, General and Administrative Expenses
Selling, general and administrative expenses consist ofpersonnel-related expenses for employees that sell our services to new customers and administratively support the business, commission payments made to travel agency and distribution partners of Travelocity, advertising and promotional costs primarily for Travelocity, certain settlement costs and costs to defend legal disputes, bad debt expense, depreciation and amortization and
101
other costs. In connection with the Expedia SMA, Travelocity will no longer incur incurred significantnon-marketing related expenses; instead, the marketing fee we will receivereceived under the Expedia SMA will beis net of costs incurred by Expedia in connection with these activities. However, theThe marketing costs we incurincurred to promote the Travelocity brand will beare recorded as selling, general and administrative expenses.
Intersegment Transactions
We account for significant intersegment transactions as if the transactions were with third parties, that is, at estimated current market prices. The majority of the intersegment revenues and cost of revenues are between Travelocity and Travel Network, consisting mainly of accruals for incentive consideration, net of data processing fees incurred, by Travel Network to Travelocity for transactions processed through our GDS, transaction fees paid by Travelocity to Travel Network for transactions facilitated through our GDS in which the travel supplier pays Travelocity directly, and fees paid by Travel Network to Travelocity for corporate trips booked through the Travelocity online booking technology. During the second quarter of 2014, Travel Network charged Travelocity a fee of approximately $7 million for not meeting certain minimum booking level requirements. This fee was recorded as revenue on Travel Network and expensed on Travelocity in our segment results and is eliminated in consolidation. In addition, Airline and Hospitality Solutions pays fees to Travel Network for airline tripsand hotel segments booked through our GDS. Due to the elimination of the intersegment revenue between Travelocity.comTravelocity and Travel Network with the Expedia SMA, we expect intersegment eliminations have substantially decreased for the nine months ended September 30, 2014 compared to substantially decrease in 2014 from current levels.the prior year. See Note 21,14, Segment Information, to our auditedunaudited consolidated financial statements included elsewhere in this prospectus.
Matters Affecting Comparability
Mergers and Acquisitions
Our results of operations have been affected by mergers and acquisitions as summarized below.
Mergers and Acquisitions in 2014
On September 11, 2014, we acquired the assets of Genares, a global, privately-held hospitality technology company, to further strengthen Sabre’s position as a leading technology partner to hoteliers worldwide. The acquisition added more than 2,300 independent and chain hotel properties to Sabre’s existing Hospitality Solutions portfolio.
Mergers and Acquisitions in 2013
We had no acquisitions in the year ended December 31, 2013.
Mergers and Acquisitions in 2012
In the third quarter of 2012, we acquired all of the outstanding stock and ownership interests of PRISM, a leading provider ofend-to-end airline contract business intelligence and decision support software. The acquisition, which adds to our portfolio of products within the Airline and Hospitality Solutions, allows for new relationships with airlines and adds to our existing business intelligence capabilities.
Mergers and Acquisitions in 2011
In the first quarter of 2011, we completed the acquisition of Zenon N.D.C., Limited, a provider of GDS services to travel agents in Cyprus. This acquisition further expands Travel Network within Europe.
In the second quarter of 2011, we completed the acquisition of SoftHotel, Inc., a provider ofweb-based property management solutions for the hospitality industry. This acquisition brings Airline and Hospitality Solutions closer to a fully integratedweb-based solution that combines distribution, marketing and operations into a single platform for hotel customers.
102
Dispositions Impacting Results from Continuing Operations
Dispositions in 2014
In February 2014, as a further step in our restructuring plans for Travelocity, we completed a sale of assets associated with TPN. In connection with the sale, Travelocity entered into a TSA with the acquirer to provide services to maintain the websites and certain technical and administrative functions for the acquirer until a complete transition occurs. The proceeds to be received under the sale agreement and the TSA were allocated across these multiple agreements based on a relative fair value allocation which resulted in no gain or loss on the sale.
Dispositions in 2013
Certain Assets of Travelocity—On June 18, 2013, we completed the sale of certain assets of TBiz operations to athird-party, which resulted in reduced revenue and expenses for Travelocity in 2013 compared to 2012. TBiz provides managed corporate travel services for corporate customers. We recorded a loss on the sale of $3 million, net of tax, including thewrite-off of $9 million of goodwill attributed to TBiz based on the relative fair value to the Travelocity North America reporting unit, in our consolidated statement of operations.
Dispositions in 2012
Sabre Pacific—On February 24, 2012, we completed the sale of our 51% stake in Sabre Pacific, an entity jointly owned by a subsidiary of Sabre (51%) and Abacus (49%), to Abacus for $46 million of proceeds, which resulted in reduced revenue and expense for Travel Network in 2013 compared to 2012, and to a greater extent, in 2012 compared to 2011. Of the proceeds received, $9 million was for the sale of stock, $18 million represented the repayment of an intercompany note receivable from Sabre Pacific, which was entered into when the joint venture was originally established, and the remaining $19 million represented the settlement of operational intercompany receivable balances with Sabre Pacific and associated amounts we owed to Abacus. We recorded $25 million as gain on sale of business in our consolidated statements of operations. We have also entered into a license and distribution agreement with Sabre Pacific, under which it will market,sub-license, distribute, provide access to and support for our GDS in Australia, New Zealand and surrounding territories. Sabre Pacific is required to pay us an ongoing transaction fee based on booking volumes under this agreement. As of December 31, 2011, the assets and liabilities of Sabre Pacific were classified as held for sale on our consolidated balance sheet. For the year ended December 31, 2012, joint venture equity income included a $24 million impairment of goodwill recorded by Abacus associated with its acquisition of Sabre Pacific.
Dispositions in 2011
During 2011, we completed no significant dispositions impacting our results of continuing operations.
For a complete list of dispositions, including dispositions classified as discontinued operations, see Note 2, Discontinued Operations and Dispositions to our unaudited consolidated financial statements and Note 4, Discontinued Operations and Dispositions, to our audited consolidated financial statements included elsewhere in this prospectus.
Seasonality
The travel industry is seasonal in nature. Travel bookings for Travel Network, and the revenue we derive from those bookings, decrease significantly each year in the fourth quarter, primarily in December. We recognizeair-related revenue at the date of booking and, because customers generally book their November and December holidayleisure-related travel earlier in the year, andbusiness-related travel declines during the holiday season, revenue resulting from bookings is typically lower in the fourth quarter. Travelocity revenues arewere also impacted by the seasonality of travel bookings, but to a lesser extent since commissions from car and hotel travel
103
suppliers and net rate revenue for hotel stays and vacation packages are recognized at the date of travel. There is a slight increase in Travelocity revenues for the second and third quarters compared to the first and fourth quarters due to European travel patterns. Airline and Hospitality Solutions does not experience any significant seasonality patterns in revenue.
Other Items Impacting Comparability
Travelocity business segment moved to discontinued operations
On December 16, 2014, we announced that we had received a binding offer from Bravofly Rumbo Group to acquire lastminute.com and on January 23, 2015, we announced the sale of Travelocity.com to Expedia, Inc. See “Summary–Recent Developments.” We will reclassify and report all of the businesses associated with the Travelocity segment as discontinued operations in our 2014 Annual Report on Form 10-K as the segment was considered held for sale as of December 31, 2014. Our historical results contained in this prospectus present the Travelocity segment as a continuing operation.
Reduction of insurance sales fees
On January 24, 2012, the U.S. Department of Transportation implemented new regulations that prohibit carriers and ticket agents from including additional optional services in connection with air transportation, a tour or tour component if the optional service is automatically added to the consumer’s purchase if the consumer takes no other action (i.e., if the consumer does not “opt-out”“opt-out”). Prior to the effectiveness of this regulation, wepre-checked the “Yes” box on Travelocity’s websites for certain optional services such as travel insurance, while at the same time providing clear and conspicuous disclosure of the inclusion of such services, itemized pricing thereof and the option to remove such services prior to payment andcheck-out. The implementation of this regulation resulted in significantly fewer customers electing to purchase such services. For the year ended December 31, 2012, we experienced an $11 million, or 38%, decrease in revenue from insurance sales compared with the year ended December 31, 2011.
Results of Operations
The following table setstables below set forth our consolidated statement of operations data for each of the periods presented:presented. Certain amounts previously reported in our December 31, 2012 and 2011 financial statements have been reclassified to conform to the December 31, 2013 presentation as a result of discontinued operations. In June 2013, we sold certain assets of our Holiday Autos operations to a third party and in November 2013, we completed the closing of the remainder of the Holiday Autos operations such that it represented a discontinued operation. See Note 4, Discontinued Operations and Dispositions, to our audited consolidated financial statements included elsewhere in this prospectus. The impact on our revenue was a reduction of $65 million and $76 million for the years ended December 31, 2012 and 2011, respectively. The impact on our operating income was an increase of $12 million for the year ended December 31, 2012 and a reduction of less than $1 million for the year ended December 31, 2011.
| Year Ended December 31, | Nine Months Ended September 30, | Year Ended December 31, | ||||||||||||||||||||||||||||||
| 2013 | 2012 | 2011 | 2014 | 2013 | 2013 | 2012 | 2011 | |||||||||||||||||||||||||
| (Amounts in thousands) | (Amounts in thousands) | |||||||||||||||||||||||||||||||
Revenue | $ | 3,049,525 | $ | 2,974,364 | $ | 2,855,961 | $ | 2,229,286 | $ | 2,303,399 | $ | 3,049,525 | $ | 2,974,364 | $ | 2,855,961 | ||||||||||||||||
Cost of revenue | 1,904,850 | 1,819,235 | 1,736,041 | 1,399,919 | 1,423,242 | 1,904,850 | 1,819,235 | 1,736,041 | ||||||||||||||||||||||||
|
|
| ||||||||||||||||||||||||||||||
Gross margin | 1,144,675 | 1,155,129 | 1,119,920 | |||||||||||||||||||||||||||||
Selling, general and administrative | 792,929 | 1,188,248 | 806,435 | 575,413 | 620,226 | 792,929 | 1,188,248 | 806,435 | ||||||||||||||||||||||||
Impairment | 138,435 | 573,180 | 185,240 | — | 138,435 | 138,435 | 573,180 | 185,240 | ||||||||||||||||||||||||
Restructuring charges | 36,551 | — | — | 2,325 | 15,889 | 36,551 | — | — | ||||||||||||||||||||||||
|
|
|
|
|
|
|
| |||||||||||||||||||||||||
Operating income (loss) | 176,760 | (606,299 | ) | 128,245 | 251,629 | 105,607 | 176,760 | (606,299 | ) | 128,245 | ||||||||||||||||||||||
Interest expense, net | (274,689 | ) | (232,450 | ) | (174,390 | ) | (167,332 | ) | (209,653 | ) | (274,689 | ) | (232,450 | ) | (174,390 | ) | ||||||||||||||||
Loss on extinguishment of debt | (12,181 | ) | — | — | (33,538 | ) | (12,181 | ) | (12,181 | ) | — | — | ||||||||||||||||||||
Gain on sale of business | — | 25,850 | — | — | — | — | 25,850 | — | ||||||||||||||||||||||||
Joint venture equity income | 15,554 | 24,487 | 26,701 | |||||||||||||||||||||||||||||
intangible amortization | (3,204 | ) | (27,000 | ) | (3,200 | ) | ||||||||||||||||||||||||||
Joint venture equity income (loss) | 9,367 | 7,873 | 12,350 | (2,513 | ) | 23,501 | ||||||||||||||||||||||||||
Other, net | (6,724 | ) | (1,385 | ) | 1,156 | 760 | (1,099 | ) | (6,724 | ) | (1,385 | ) | 1,156 | |||||||||||||||||||
|
|
|
|
|
|
|
| |||||||||||||||||||||||||
Loss from continuing operations before income taxes | (104,484 | ) | (816,797 | ) | (21,488 | ) | ||||||||||||||||||||||||||
(Benefit) provision for income taxes | (14,029 | ) | (195,071 | ) | 57,806 | |||||||||||||||||||||||||||
Income (loss) from continuing operations before income taxes | 60,886 | (109,453 | ) | (104,484 | ) | (816,797 | ) | (21,488 | ) | |||||||||||||||||||||||
Provision (benefit) for income taxes | 27,878 | (5,229 | ) | (14,029 | ) | (195,071 | ) | 57,806 | ||||||||||||||||||||||||
|
|
|
|
|
|
|
| |||||||||||||||||||||||||
Loss from continuing operations | $ | (90,455 | ) | $ | (621,726 | ) | $ | (79,294 | ) | |||||||||||||||||||||||
Income (loss) from continuing operations | $ | 33,008 | $ | (104,224 | ) | $ | (90,455 | ) | $ | (621,726 | ) | $ | (79,294 | ) | ||||||||||||||||||
|
|
|
|
|
|
|
| |||||||||||||||||||||||||
104
Nine months ended September 30, 2014 and 2013
Revenue
| Year Ended December 31, | Change | Nine Months Ended September 30, | ||||||||||||||||||||||||||||||||||||||||||
| 2013 | 2012 | 2011 | 2013 vs. 2012 | 2012 vs. 2011 | 2014 | 2013 | Change | |||||||||||||||||||||||||||||||||||||
| (Amounts in thousands) | (Amounts in thousands) | |||||||||||||||||||||||||||||||||||||||||||
Revenue by Segment | ||||||||||||||||||||||||||||||||||||||||||||
Travel Network | $ | 1,821,498 | $ | 1,795,127 | $ | 1,740,007 | $ | 26,371 | 1 | % | $ | 55,120 | 3 | % | $ | 1,420,341 | $ | 1,381,105 | $ | 39,236 | 3 | % | ||||||||||||||||||||||
Airline and Hospitality Solutions | 711,745 | 597,649 | 522,692 | 114,096 | 19 | % | 74,957 | 14 | % | 571,975 | 522,794 | 49,181 | 9 | % | ||||||||||||||||||||||||||||||
Travelocity | 585,989 | 659,472 | 699,604 | (73,483 | ) | (11 | )% | (40,132 | ) | (6 | )% | 268,848 | 457,518 | (188,670 | ) | (41 | )% | |||||||||||||||||||||||||||
Eliminations | (24,253 | ) | (58,018 | ) | 33,765 | 58 | % | |||||||||||||||||||||||||||||||||||||
|
|
|
|
|
|
|
|
|
|
| ||||||||||||||||||||||||||||||||||
Total segment revenue | 3,119,232 | 3,052,248 | 2,962,303 | 66,984 | 2 | % | 89,945 | 3 | % | |||||||||||||||||||||||||||||||||||
Eliminations | (69,707 | ) | (77,884 | ) | (106,342 | ) | 8,177 | 10 | % | 28,458 | 27 | % | ||||||||||||||||||||||||||||||||
Total Adjusted Revenue | 2,236,911 | 2,303,399 | (66,488 | ) | (3 | )% | ||||||||||||||||||||||||||||||||||||||
Amortization of Expedia SMA incentive payments | (7,625 | ) | — | (7,625 | ) | * | *% | |||||||||||||||||||||||||||||||||||||
|
|
|
|
|
|
|
|
|
|
| ||||||||||||||||||||||||||||||||||
Total revenue | $ | 3,049,525 | $ | 2,974,364 | $ | 2,855,961 | $ | 75,161 | 3 | % | $ | 118,403 | 4 | % | $ | 2,229,286 | $ | 2,303,399 | $ | (74,113 | ) | (3 | )% | |||||||||||||||||||||
|
|
|
|
|
|
|
|
|
|
| ||||||||||||||||||||||||||||||||||
| ** | not meaningful |
Revenue decreased $74 million, or 3%, for the nine months ended September 30, 2014 compared to the same period in the prior year.
Travel Network—Revenue increased $39 million, or 3%, for the nine months ended September 30, 2014 compared to the same period in the prior year.
The $39 million increase in revenue primarily resulted from:
Airline and Hospitality Solutions—Revenue increased $49 million, or 9%, for the nine months ended September 30, 2014 compared to the same period in the prior year.
The $49 million increase in revenue primarily resulted from:
a $22 million increase in Airline Solutions’ SabreSonic CSS revenue for the nine months ended September 30, 2014 compared to the same period in the prior year. PBs increased 27 million, or 8%, to 386 million for the nine months ended September 30, 2014 which resulted in an increase in revenue of $13 million. The increase in PBs was driven by growth from existing customers. In addition, we recognized $9 million in revenue during the three months ended September 30, 2014 associated with
105
the extension of a services contract with a significant customer. This contract was extended in conjunction with a litigation settlement agreement with that customer in 2012. These increases were partially offset by a decrease in revenue from professional services; |
Travelocity—Revenue decreased $189 million, or 41%, for the nine months ended September 30, 2014 compared to the same period in the prior year. The decrease in revenue was primarily due to a $105 million decrease as a result of the restructuring of our Travelocity business discussed above, as well as a decrease of $83 million due to the sale of both Travelocity’s TPN business in February of 2014 and TBiz in June of 2013.
Eliminations—Intersegment eliminations decreased $34 million, or 58%, for the nine months ended September 30, 2014 compared to the prior year due to a reduction in the amount of incentive consideration payable to Travelocity from Travel Network as a result of the change in Travelocity’s business model. Air travel booked through our Travelocity-branded websites powered by Expedia is contractually required to be processed by Travel Network through the beginning of 2019. The reduction in incentive consideration payable was partially offset by the $7 million fee Travel Network charged to Travelocity discussed above.
Cost of revenue
| Nine Months Ended September 30, | ||||||||||||||||
| 2014 | 2013 | Change | ||||||||||||||
| (Amounts in thousands) | ||||||||||||||||
Cost of revenue | ||||||||||||||||
Travel Network | $ | 750,318 | $ | 728,496 | $ | 21,822 | 3 | % | ||||||||
Airline and Hospitality Solutions | 336,429 | 339,554 | (3,125 | ) | (1 | )% | ||||||||||
Travelocity | 84,722 | 179,623 | (94,901 | ) | (53 | )% | ||||||||||
Eliminations | (16,754 | ) | (57,505 | ) | 40,751 | 71 | % | |||||||||
|
|
|
|
|
|
|
| |||||||||
Total segment cost of revenue | 1,154,715 | 1,190,168 | (35,453 | ) | (3 | )% | ||||||||||
Corporate | 54,881 | 53,897 | 984 | 2 | % | |||||||||||
Depreciation and amortization | 157,146 | 150,441 | 6,705 | 4 | % | |||||||||||
Amortization of upfront incentive consideration | 33,177 | 28,736 | 4,441 | 15 | % | |||||||||||
|
|
|
|
|
|
|
| |||||||||
Total cost of revenue | $ | 1,399,919 | $ | 1,423,242 | $ | (23,323 | ) | (2 | )% | |||||||
|
|
|
|
|
|
|
| |||||||||
Cost of revenue decreased by $23 million, or 2%, for the nine months ended September 30, 2014 compared to the same period in the prior year.
Travel Network—Cost of revenue increased $22 million, or 3%, for the nine months ended September 30, 2014 compared to the same period in the prior year. The increase primarily resulted from a $27 million increase in incentive consideration, partially offset by a decrease in labor and other costs.
Airline and Hospitality Solutions—Cost of revenue decreased $3 million, or 1%, for the nine months ended September 30, 2014 compared to the same period in the prior year. The decrease is the result of a $11 million decrease in labor costs, partially offset by a $7 million increase in technology and transaction-related expenses driven by higher transaction volumes.
Travelocity—Cost of revenue decreased $95 million, or 53%, for the nine months ended September 30, 2014 compared to the same period in the prior year primarily due to the impact of the Expedia SMA and the sale of our TPN and TBiz businesses. The decrease in cost of revenue is primarily driven by reduced labor and call center costs, lower transaction-related expenses including credit card fees and lower data processing costs.
106
Eliminations—Intersegment eliminations decreased $41 million, or 71%, for the nine months ended September 30, 2014 compared to the prior year due to a reduction in the amount of incentive consideration payable to Travelocity from Travel Network as a result of the change in Travelocity’s business model. Air travel booked through our Travelocity-branded websites powered by Expedia is contractually required to be processed by Travel Network through the beginning of 2019.
Corporate—Cost of revenue associated with corporate unallocated costs increased $1 million, or 2%, for the nine months ended September 30, 2014 compared to the same period in the prior year. The increase is primarily due to a $13 million increase in unallocated labor and other costs and a $7 million settlement received from a service provider in the same period of the prior year, partially offset by a $19 million decrease in expenses associated with the general excise tax litigation with the State of Hawaii compared to the same period in the prior year.
Depreciation and amortization—Depreciation and amortization increased $7 million, or 4%, for the nine months ended September 30, 2014 compared to the same period in the prior year. The increase is primarily due to the completion and amortization of software developed for internal use, partially offset by a decrease in amortization of intangible assets.
Amortization of upfront incentive consideration—Amortization of upfront incentive consideration increased $4 million, or 15%, for the nine months ended September 30, 2014 compared to the same period in the prior year. The increase is primarily due to an increase in upfront consideration provided to travel agencies in the nine months ended September 30, 2014 compared to the prior year.
Selling, general and administrative expenses
| Nine Months Ended September 30, | ||||||||||||||||
| 2014 | 2013 | Change | ||||||||||||||
| (Amounts in thousands) | ||||||||||||||||
Personnel | $ | 192,942 | $ | 213,813 | $ | (20,871 | ) | (10 | )% | |||||||
Advertising and promotion | 133,795 | 127,838 | 5,957 | 5 | % | |||||||||||
Commission payments to affiliates | 21,813 | 58,759 | (36,946 | ) | (63 | )% | ||||||||||
Bad debt | 6,372 | 7,129 | (757 | ) | (11 | )% | ||||||||||
Management fees | 23,701 | 5,221 | 18,480 | 354 | % | |||||||||||
Other | 130,715 | 127,630 | 3,085 | 2 | % | |||||||||||
Depreciation and amortization | 73,315 | 79,836 | (6,521 | ) | (8 | )% | ||||||||||
Eliminations | (7,240 | ) | — | (7,240 | ) | * | *% | |||||||||
|
|
|
|
|
|
|
| |||||||||
Total selling, general and administrative | $ | 575,413 | $ | 620,226 | $ | (44,813 | ) | (7 | )% | |||||||
|
|
|
|
|
|
|
| |||||||||
| ** | not meaningful |
Selling, general and administrative expenses decreased by $45 million, or 7%, for the nine months ended September 30, 2014 compared to the same period in the prior year. The decreases in commission payments to affiliates of $37 million and personnel costs of $21 million are primarily the result of our Travelocity restructuring activities including the sale of our TPN business in February 2014. The decrease in depreciation and amortization of $7 million is driven by decreases in amortization of acquisition-related intangible assets. These decreases were partially offset by an $18 million increase in management fees paid to TPG and Silver Lake related to our initial public offering and a $6 million increase in advertising and promotion primarily in our Travelocity business in the U.S. and Canada in conjunction with the Expedia SMA.
107
Impairment
| Nine Months Ended September 30, | ||||||||||||||||
| 2014 | 2013 | Change | ||||||||||||||
| (Amounts in thousands) | ||||||||||||||||
Impairment | $ | — | $ | 138,435 | $ | (138,435 | ) | **% | ||||||||
| ** | not meaningful |
In connection with the disposals of TBiz and Holiday Autos in the second quarter of 2013, we initiated an impairment analysis of goodwill and long lived assets in the Travelocity segment which resulted in impairment charges of $96 million associated with Travelocity—North America and $42 million associated with Travelocity—Europe. As a result of the impairment charges, the Travelocity segment had no remaining goodwill.
Interest expense, net
| Nine Months Ended September 30, | ||||||||||||||||
| 2014 | 2013 | Change | ||||||||||||||
| (Amounts in thousands) | ||||||||||||||||
Interest expense, net | $ | 167,332 | $ | 209,653 | $ | (42,321 | ) | (20 | )% | |||||||
Interest expense, net, decreased $42 million, or 20%, for the nine months ended September 30, 2014 compared to the same period in the prior year. The decrease is primarily due to the prepayments on our 2019 Notes and Term Loan C and a lower effective interest rate as a result of our repricing amendments completed in February 2014. In addition, interest expense decreased due to lower modification expenses and lower imputed interest expense related to payments made in the fourth quarter of 2013 for our litigation settlement payable to American Airlines.
Loss on extinguishment of debt
| Nine Months Ended September 30, | ||||||||||||||||
| 2014 | 2013 | Change | ||||||||||||||
| (Amounts in thousands) | ||||||||||||||||
Loss on extinguishment of debt | $ | 33,538 | $ | 12,181 | $ | 21,357 | **% | |||||||||
| ** | not meaningful |
During the nine months ended September 30, 2014, we recognized losses on extinguishment of debt of $31 million in connection with the prepayments on our 2019 Notes and Term Loan C and $3 million related to the repricing of our Term Loan B completed in February 2014. During the nine months ended September 30, 2013, we recognized a loss on extinguishment of debt of $12 million as a result of our Amended and Restated Credit Agreement (see “Liquidity and Capital Resources—Senior Secured Credit Facilities”).
Joint venture equity income
| Nine Months Ended September 30, | ||||||||||||||||
| 2014 | 2013 | Change | ||||||||||||||
| (Amounts in thousands) | ||||||||||||||||
Joint venture equity income | $ | 9,367 | $ | 7,873 | $ | 1,494 | 19 | % | ||||||||
108
Joint venture equity income increased by $1 million for the nine months ended September 30, 2014 compared to the same period in the prior year.
Other (income) expenses, net
| Nine Months Ended September 30, | ||||||||||||||||
| 2014 | 2013 | Change | ||||||||||||||
| (Amounts in thousands) | ||||||||||||||||
Other (income) expenses, net | $ | (760 | ) | $ | 1,099 | $ | (1,859 | ) | **% | |||||||
| ** | not meaningful |
Other income, net, increased $2 million for the nine months ended September 30, 2014 compared to the prior year. The increase was driven primarily by realized and unrealized foreign currency exchange gains.
Provision (benefit) for income taxes
| Nine Months Ended September 30, | ||||||||||||||||
| 2014 | 2013 | Change | ||||||||||||||
| (Amounts in thousands) | ||||||||||||||||
Provision (benefit) for income taxes | $ | 27,878 | $ | (5,229 | ) | $ | 33,107 | **% | ||||||||
| ** | not meaningful |
Our effective tax rates for the nine months ended September 30, 2014 and 2013 were 46% and 5%, respectively. The increase in the effective tax rate for the nine months ended September 30, 2014 as compared to the same period in 2013 was primarily due to the impairment of nondeductible goodwill in the prior year, the amount of current year losses for which no tax benefit can be recognized relative to the amount of pre-tax income and the impact of other discrete items, partially offset by the increase in forecasted earnings in lower tax jurisdictions.
The differences between our effective tax rates and the U.S. federal statutory income tax rate primarily result from our geographic mix of taxable income in various tax jurisdictions as well as the discrete tax items referenced above.
Years ended December 31, 2013, 2012 and 2011
Revenue
| Year Ended December 31, | Change | |||||||||||||||||||||||||||
| 2013 | 2012 | 2011 | 2013 vs. 2012 | 2012 vs. 2011 | ||||||||||||||||||||||||
| (Amounts in thousands) | ||||||||||||||||||||||||||||
Revenue by Segment | ||||||||||||||||||||||||||||
Travel Network | $ | 1,821,498 | $ | 1,795,127 | $ | 1,740,007 | $ | 26,371 | 1 | % | $ | 55,120 | 3 | % | ||||||||||||||
Airline and Hospitality Solutions | 711,745 | 597,649 | 522,692 | 114,096 | 19 | % | 74,957 | 14 | % | |||||||||||||||||||
Travelocity | 585,989 | 659,472 | 699,604 | (73,483 | ) | (11 | )% | (40,132 | ) | (6 | )% | |||||||||||||||||
|
|
|
|
|
|
|
|
|
|
|
|
|
| |||||||||||||||
Total segment revenue | 3,119,232 | 3,052,248 | 2,962,303 | 66,984 | 2 | % | 89,945 | 3 | % | |||||||||||||||||||
Eliminations | (69,707 | ) | (77,884 | ) | (106,342 | ) | 8,177 | 10 | % | 28,458 | 27 | % | ||||||||||||||||
|
|
|
|
|
|
|
|
|
|
|
|
|
| |||||||||||||||
Total revenue | $ | 3,049,525 | $ | 2,974,364 | $ | 2,855,961 | $ | 75,161 | 3 | % | $ | 118,403 | 4 | % | ||||||||||||||
|
|
|
|
|
|
|
|
|
|
|
|
|
| |||||||||||||||
109
2013 compared to 2012
Revenue increased $75 million, or 3%, for the year ended December 31, 2013 compared with the year ended December 31, 2012.
Travel Network—Revenue increased $26 million, or 1%, for the year ended December 31, 2013 compared with the year ended December 31, 2012. The increase was driven by a $25 million increase in other revenue primarily from payments in connection with certain services provided to our joint ventures. Transaction-based revenue was flat at $1,590 million for the year ended December 31, 2013 compared to the prior year. We processed 368 million Direct Billable Bookings in 2013, representing a decrease of 12 million Direct Billable Bookings, or 3%, compared to 2012. This decrease was offset by a 3% increase in the average booking fee.
Airline and Hospitality Solutions—Revenue increased $114 million, or 19%, for the year ended December 31, 2013 compared with the year ended December 31, 2012.
This $114 million increase in revenue primarily resulted from:
Travelocity—Revenue decreased $73 million, or 11%, for the year ended December 31, 2013 compared with the year ended December 31, 2012. This decrease in revenue primarily resulted from a $59 million decrease resulting from a 5% decline in transaction volumes and a 6% decline in average transaction value, primarily driven by the loss of a large TPN customer in 2012, and aan $11 million decrease in revenue related to the disposition of TBiz during 2013. Media and advertising revenues also declined by $5 million in the year ended December 31, 2013 compared to the prior year. Additionally, Travelocity recently sold its TPN business, a B2B loyalty and private label website offering, to Orbitz.
2012 compared to 2011
Revenue increased $118 million, or 4%, for the year ended December 31, 2012 compared with the year ended December 31, 2011.
Travel Network—Revenue increased $55 million, or 3%, for the year ended December 31, 2012 compared with the year ended December 31, 2011.
This $55 million increase in revenue primarily resulted from:
Airline and Hospitality Solutions—Revenue increased $75 million, or 14%, for the year ended December 31, 2012 compared with the year ended December 31, 2011.
110
This $75 million increase in revenue primarily resulted from:
Travelocity—Revenue decreased $40 million, or 6%, for the year ended December 31, 2012 compared with the year ended December 31, 2011.
This $40 million decrease in revenue primarily resulted from:
Gross MarginCost of revenue
| Year Ended December 31, | Change | Year Ended December 31, | Change | |||||||||||||||||||||||||||||||||||||||||||||||||||||
| 2013 | 2012 | 2011 | 2013 vs. 2012 | 2012 vs. 2011 | 2013 | 2012 | 2011 | 2013 vs. 2012 | 2012 vs. 2011 | |||||||||||||||||||||||||||||||||||||||||||||||
| (Amounts in thousands) | �� | (Amounts in thousands) | ||||||||||||||||||||||||||||||||||||||||||||||||||||||
Adjusted Gross Margin by Segment | ||||||||||||||||||||||||||||||||||||||||||||||||||||||||
Travel Network | $ | 860,793 | $ | 843,863 | $ | 772,753 | $ | 16,930 | 2 | % | $ | 71,110 | 9 | % | $ | 960,705 | $ | 951,264 | $ | 967,254 | $ | 9,441 | 1 | % | $ | (15,990 | ) | (2 | )% | |||||||||||||||||||||||||||
Airline and Hospitality Solutions | 262,386 | 218,421 | 185,147 | 43,965 | 20 | % | 33,274 | 18 | % | 449,359 | 379,228 | 337,545 | 70,131 | 18 | % | 41,683 | 12 | % | ||||||||||||||||||||||||||||||||||||||
Travelocity | 353,489 | 413,802 | 447,790 | (60,313 | ) | (15 | )% | (33,988 | ) | (8 | )% | 232,500 | 245,670 | 251,814 | (13,170 | ) | (5 | )% | (6,144 | ) | (2 | )% | ||||||||||||||||||||||||||||||||||
Eliminations | (717 | ) | (1,010 | ) | (1,083 | ) | 293 | (29 | )% | 73 | (7 | )% | (68,990 | ) | (76,874 | ) | (105,259 | ) | 7,884 | 10 | % | 28,385 | 27 | % | ||||||||||||||||||||||||||||||||
|
|
|
|
|
|
| ||||||||||||||||||||||||||||||||||||||||||||||||||
Total segment cost of revenue | 1,573,574 | 1,499,288 | 1,451,354 | 74,286 | 5 | % | 47,934 | 3 | % | |||||||||||||||||||||||||||||||||||||||||||||||
Corporate | (92,142 | ) | (85,214 | ) | (74,093 | ) | (6,928 | ) | (8 | )% | (11,121 | ) | (15 | )% | 92,142 | 85,214 | 74,093 | 6,928 | 8 | % | 11,121 | 15 | % | |||||||||||||||||||||||||||||||||
|
|
|
|
|
|
| ||||||||||||||||||||||||||||||||||||||||||||||||||
Total adjusted gross margin | 1,383,809 | 1,389,862 | 1,330,514 | (6,053 | ) | — | % | 59,348 | 4 | % | ||||||||||||||||||||||||||||||||||||||||||||||
|
|
|
|
|
|
| ||||||||||||||||||||||||||||||||||||||||||||||||||
Depreciation and amortization | (202,485 | ) | (198,206 | ) | (172,846 | ) | (4,279 | ) | (2 | )% | (25,360 | ) | (15 | )% | 202,485 | 198,206 | 172,846 | 4,279 | 2 | % | 25,360 | 15 | % | |||||||||||||||||||||||||||||||||
Amortization of upfront incentive consideration | (36,649 | ) | (36,527 | ) | (37,748 | ) | (122 | ) | — | % | 1,221 | 3 | % | 36,649 | 36,527 | 37,748 | 122 | 0 | % | (1,221 | ) | (3 | )% | |||||||||||||||||||||||||||||||||
|
|
|
|
|
|
|
|
|
|
|
|
|
| |||||||||||||||||||||||||||||||||||||||||||
Total gross margin | $ | 1,144,675 | $ | 1,155,129 | $ | 1,119,920 | $ | (10,454 | ) | (1 | )% | $ | 35,209 | 3 | % | |||||||||||||||||||||||||||||||||||||||||
Total cost of revenue | $ | 1,904,850 | $ | 1,819,235 | $ | 1,736,041 | $ | 85,615 | 5 | % | $ | 83,194 | 5 | % | ||||||||||||||||||||||||||||||||||||||||||
|
|
|
|
|
|
|
|
|
|
|
|
|
| |||||||||||||||||||||||||||||||||||||||||||
2013 compared to 2012
Total gross margin decreasedThe total cost of revenue increased by $10$86 million, or 5%, for the year ended December 31, 2013 compared with the year ended December 31, 2012.
111
Travel Network—Cost of revenue increased $9 million, or 1%, for the year ended December 31, 2013 compared with the year ended December 31, 2012.
Travel Network—Adjusted gross margin increased $17 million, or 2%, for the year ended December 31, 2013 compared with the year ended December 31, 2012. This increase reflects a $26 million increase in revenue, as described above, partially offset by a $9 million increase in the cost of revenue.
The $9 million increase in cost of revenue2012, which primarily resulted from:
Airline and Hospitality Solutions—Adjusted Gross MarginCost of revenue increased $44$70 million, or 20%18%, for the year ended December 31, 2013 compared with the year ended December 31, 2012. This increase is on account of the net effect of a $114 million increase in revenue, as described above, partially offset by a $70 million increase in cost of revenue.
The $70 million increase in cost of revenue2012, which primarily resulted from:
Travelocity—Adjusted Gross MarginCost of revenue decreased $60$13 million, or 15%5%, for the year ended December 31, 2013 compared with the year ended December 31, 2012. This decrease is on account of the net effect of a $73 million decrease in revenue, as described above, partially offset by a $13 million decrease in cost of revenue.
The $13 million decrease in cost of revenue2012, which primarily resulted from:
Corporate—Adjusted Gross MarginCost of revenue associated with corporate unallocated costs decreased byincreased $7 million, or 8%, for the year ended December 31, 2013 compared with the year ended December 31, 2012. The increase in cost of revenue was2012, primarily the result of an increase ofrelated to labor costs, which increased by $8 million in labor costs to $20 million in 2013.
Depreciation and amortizationamortization——Depreciation and amortization decreasedCost of revenue increased $4 million, or 2%, for the year ended December 31, 2013 compared with the year ended December 31, 2012. At the end of 2012, we impaired certain property and equipment and intangible assets related to Travelocity. The resulting decreased asset base drove which primarily resulted from:
Amortization of upfront incentive consideration—Amortization of upfront incentive consideration of $37 million for the year ended December 31, 2013 was flat compared to the prior year.
2012 compared to 2011
Total gross marginThe total cost of revenue increased by $35$83 million, or 3%5%, for the year ended December 31, 2012 compared with the year ended December 31, 2011.
112
Travel Network—Adjusted Gross Margin increased $71Cost of revenue decreased $16 million, or 9%2%, for the year ended December 31, 2012 compared with the year ended December 31, 2011. This increase reflects a $55 million increase in revenue, as described above, and a $16 million decrease in the cost of revenue.
The $16 million decrease in cost of revenue2011, which primarily resulted from:
Airline and Hospitality Solutions—Adjusted Gross MarginCost of revenue increased $33$42 million, or 18%12%, for the year ended December 31, 2012 compared with the year ended December 31, 2011. This increase is on account of the net effect of a $75 million increase in revenue, as described above, offset by a $42 million increase in cost of revenue.
The $42 million increase in cost of revenue2011, which primarily resulted from:
Travelocity—Adjusted Gross MarginCost of revenue decreased $34$6 million, or 8%2%, for the year ended December 31, 2012 compared with the year ended December 31, 2011. This decrease is on account of the net effect of a $40 million decrease in revenue, as described above, partially offset by a $6 million decrease in cost of revenue.
The $6 million decrease in cost of revenue2011, which primarily resulted from:
Corporate—Adjusted Gross MarginCost of revenue associated with our corporate unallocated costs decreasedincreased by $11 million, or 15%, for the year ended December 31, 2012 compared with the year ended December 31, 2011. The increase in cost of revenue was primarily the result of $25 million in back excise taxes, penalties and interest in 2012 mainly in connection with general excise tax litigation with the State of Hawaii (see Note 20, Commitment and Contingencies, to our audited consolidated financial statements included elsewhere in this prospectus) and a $9 million increase in shared technology-related expenses. These increases were offset by a $24 million decrease in labor costs to $13 million compared to $37 million in the prior year.year due to an increase of development labor charges to the segments.
Depreciation and amortization—Depreciation and amortizationCost of revenue increased $25 million, or 15%, for the year ended December 31, 2012 compared with the year ended December 31, 2011. The2011, which primarily resulted from:
by Airline and Hospitality Solutions’ (i)associated with the completion and amortization of various projects to develop software developed for internal use (ii) new customeras well as capitalized implementation projectscosts; and (iii) the scheduled
Amortization of upfront incentive consideration—Amortization of upfront incentive consideration decreased by $1 million, or 3%, for the year ended December 31, 2013 compared to recent acquisitions.the prior year.
113
Selling, general and administrative expenses
| Year Ended December 31, | Change | Year Ended December 31, | Change | |||||||||||||||||||||||||||||||||||||||||||||||||||||
| 2013 | 2012 | 2011 | 2013 vs. 2012 | 2012 vs. 2011 | 2013 | 2012 | 2011 | 2013 vs. 2012 | 2012 vs. 2011 | |||||||||||||||||||||||||||||||||||||||||||||||
| (Amounts in thousands) | (Amounts in thousands) | |||||||||||||||||||||||||||||||||||||||||||||||||||||||
Personnel | $ | 278,019 | $ | 261,560 | $ | 239,267 | $ | 16,459 | 6 | % | $ | 22,293 | 9 | % | $ | 278,019 | $ | 261,560 | $ | 239,267 | $ | 16,459 | 6 | % | $ | 22,293 | 9 | % | ||||||||||||||||||||||||||||
Advertising and promotion | 151,589 | 160,837 | 187,492 | (9,248 | ) | (6 | )% | (26,655 | ) | (14 | )% | 151,589 | 160,837 | 187,492 | (9,248 | ) | (6 | )% | (26,655 | ) | (14 | )% | ||||||||||||||||||||||||||||||||||
Commission payments to affiliates | 72,002 | 85,143 | 97,141 | (13,141 | ) | (15 | )% | (11,998 | ) | (12 | )% | 72,002 | 85,143 | 97,141 | (13,141 | ) | (15 | )% | (11,998 | ) | (12 | )% | ||||||||||||||||||||||||||||||||||
Litigation charges | — | 346,515 | — | (346,515 | ) | * | * | 346,515 | * | * | — | 346,515 | — | (346,515 | ) | ** | % | 346,515 | ** | % | ||||||||||||||||||||||||||||||||||||
Allowance for bad debt | 9,030 | 4,465 | 3,670 | 4,565 | 102 | % | 795 | 22 | % | |||||||||||||||||||||||||||||||||||||||||||||||
Bad debt | 9,030 | 4,465 | 3,670 | 4,565 | 102 | % | 795 | 22 | % | |||||||||||||||||||||||||||||||||||||||||||||||
Other | 177,179 | 212,201 | 158,595 | (35,022 | ) | (17 | )% | 53,606 | 34 | % | 177,179 | 212,201 | 158,595 | (35,022 | ) | (17 | )% | 53,606 | 34 | % | ||||||||||||||||||||||||||||||||||||
Depreciation and amortization | 105,110 | 117,527 | 120,270 | (12,417 | ) | (11 | )% | (2,743 | ) | (2 | )% | 105,110 | 117,527 | 120,270 | (12,417 | ) | (11 | )% | (2,743 | ) | (2 | )% | ||||||||||||||||||||||||||||||||||
|
|
|
|
|
|
|
|
|
|
|
|
|
| |||||||||||||||||||||||||||||||||||||||||||
Total selling, general and administrative | $ | 792,929 | $ | 1,188,248 | $ | 806,435 | $ | (395,319 | ) | (33 | )% | $ | 381,813 | 47 | % | $ | 792,929 | $ | 1,188,248 | $ | 806,435 | $ | (395,319 | ) | (33 | )% | $ | 381,813 | 47 | % | ||||||||||||||||||||||||||
|
|
|
|
|
|
|
|
|
|
|
|
|
| |||||||||||||||||||||||||||||||||||||||||||
| ** | not meaningful |
2013 compared to 2012
Selling, general and administrative expenses decreased $395 million, or 33%, for the year ended December 31, 2013 compared with the year ended December 31, 2012.
This decrease in selling, general and administrative expenses was primarily driven by a $347 million litigation charge recorded during the year ended December 31, 2012 for the settlement of the state and federal cases with American Airlines, which did not reoccur in the year ended December 31, 2013. Additionally, legal fees within other expenses decreased $33 million as a result of the settlement of our dispute with American Airlines in 2012. These reductions within other expenses are offset by $7 million of costs incurred by Travelocity to enhance its offering and pursue a new TPN customer, which did not materialize.
During the year ended December 31, 2013, we also had a decline of $13 million in commission payments to affiliates due to the loss of a large TPN partner in 2012. These declines are offset by increases in personnel-related expenses including $16 million in higher salaries and benefits attributed to increased corporate headcount to support the growth of the business and an increase in compensation costs in Travel Network attributed to higher variable compensation awards for employees as a result of improved overall performance. Additionally, Travelocity recently sold its TPN business, a B2B loyalty and private label website offering, to Orbitz.
Depreciation and amortization decreased $12 million, or 11%, for the year ended December 31, 2013 compared to the prior year. The decrease was the result of the impairment of intangible assets related to Travelocity in the fourth quarter of 2012.
2012 compared to 2011
Selling, general and administrative expenses increased $382 million, or 47%, for the year ended December 31, 2012 compared with the year ended December 31, 2011. This increase was primarily driven by $347 million of expenses related to the litigation settlement with American Airlines that occurred during the year ended December 31, 2012. Within other expenses is $47 million of increased legal fees and other costs associated with various legal disputes throughout 2012 and $3 million in increased services purchased to facilitate the move of a Travelocity call center to Poland. Personnel-related expenses increased $22 million as a result of $10$11 million in increased corporate headcount and variable compensation awards as well as $10$11 million of higher labor costs
to support Travelocity. Partially offsetting these increases was a decrease of $12 million in commission payments to affiliates due to the loss of a large TPN partner in 2012 by Travelocity. Advertising and promotional costs declined due to reductions taken by Travelocity. Travelocity had a $27 million reduction in advertising spend driven by fewer purchases of non-brand search engine key words and other promotions.
114
Impairment
| Year Ended December 31, | Change | |||||||||||||||||||||||||||
| 2013 | 2012 | 2011 | 2013 vs. 2012 | 2012 vs. 2011 | ||||||||||||||||||||||||
| (Amounts in thousands) | ||||||||||||||||||||||||||||
Impairment | $ | 138,435 | $ | 573,180 | $ | 185,240 | $ | (434,745 | ) | (76 | )% | $ | 387,940 | 209 | % | |||||||||||||
2013 compared to 2012
Impairment expense was $138 million for the year ended December 31, 2013. In the second quarter of 2013, we allocated $9 million and $36 million in goodwill to TBiz and Holiday Autos, which are assets within the Travelocity—North America and Travelocity—Europe reporting units, respectively. We therefore initiated an impairment analysis on the remainder of the goodwill associated with these reporting units. Further declines in our current projections of the discounted future cash flows of these reporting units and current market participant considerations led to a $96 million impairment in Travelocity—North America and a $40 million impairment in Travelocity—Europe which have been recorded in our results of operations. As of December 31, 2013, Travelocity had no remaining goodwill.
2012 compared to 2011
Impairment expense was $573 million for the year ended December 31, 2012 compared with $185 million for the year ended December 31, 2011.
Travelocity goodwill was impaired by $63 million as a result of one of its competitors announcing plans to move towards offering hotel customers a choice of payment options which could adversely affect hotel margins over time. We therefore initiated an impairment analysis of Travelocity as of September 30, 2012. The expected change in the competitive business environment and the resulting impact on our current projections of the discounted future cash flows led to a $58 million impairment in Travelocity—North America and a $5 million impairment in Travelocity—Europe. In the fourth quarter of 2012, we continued to see further weakness in Travelocity’s business performance resulting in lower projected revenues and declining margins for Travelocity—North America and Travelocity—Europe thus requiring an impairment assessment of Travelocity as of December 31, 2012. As a result, we recorded impairments on long-lived assets of $281 million for Travelocity—North America, of which $30 million pertained to software developed for internal use, $7 million pertained to computer equipment $6 million related to capitalized implementation costs and the remainder related to definite-lived intangible assets. We also recorded impairments of $154 million for Travelocity—Europe, of which $11 million pertained to software developed for internal use, $4 million pertained to computer equipment and the remainder related to definite lived intangible assets. We also recorded an additional goodwill impairment charge for Travelocity Europe for $65 million as a result of our updated analysis. In 2012, we further recorded $20 million of impairment related to leasehold improvements associated with a corporate building that is not occupied and for which we no longer anticipate being able to sublease to a third-party before the end of the lease term. During 2011, we recorded $185 million of impairment as Travelocity was impacted by a continuing decline in margins due to pressure from competitive pricing, reduced bookings and the resulting impact on our projections of the discounted future cash flows, as well as a still weak economic environment.
Restructuring Chargescharges
| Year Ended December 31, | Change | |||||||||||||||||||||||||||
| 2013 | 2012 | 2011 | 2013 vs. 2012 | 2012 vs. 2011 | ||||||||||||||||||||||||
| (Amounts in thousands) | ||||||||||||||||||||||||||||
Restructuring charges | $ | 36,551 | $ | — | $ | — | $ | 36,551 | ** | % | $ | — | ** | % | ||||||||||||||
| Year Ended December 31, | Change | |||||||||||||||||||||||||||
| 2013 | 2012 | 2011 | 2013 vs. 2012 | 2012 vs. 2011 | ||||||||||||||||||||||||
| (Amounts in thousands) | ||||||||||||||||||||||||||||
Restructuring charges | $ | 36,551 | $ | — | $ | — | $ | 36,551 | **% | $ | — | **% | ||||||||||||||||
| ** | not meaningful |
115
In the third quarter of 2013, we initiated plans to restructure our Travelocity business and our technology organization. With respect to our plans for Travelocity,in connection with which we recorded restructuring charges totaling $28 million for the year ended December 31, 2013, which included $18 million of employee termination benefits, $4 million of asset impairments and $6 million of other related costs. With respect$22 million of these restructuring charges was attributable to the restructuring of our plans forTravelocity businesses in the United States and Canada in connection with the Expedia SMA and the remaining $6 million was attributable to employee termination benefits in connection with the restructuring of lastminute.com, the European portion of our Travelocity business. See “—Factors Affecting Our Results and Comparability—Travelocity.”
In the fourth quarter of 2013, we also initiated a restructuring plan to simplify our technology organization, better align costs with our current business, reduce our spend on third-party resources, and to increase focus on product development. The majority of this plan will be completed in 2014. As a part of this restructuring plan, we will reduce our employee base by approximately 350 employees. We recorded restructuring chargesa charge of $8 million associated with employee termination benefits.benefits in the fourth quarter of 2013 and do not expect to record material charges in 2014 related to this action. See “—Factors Affecting Our Results—Travelocity” and Note 5, Restructuring Charges, to our audited consolidated financial statements included elsewhere in this prospectus.
Interest expense, net
| Year Ended December 31, | Change | |||||||||||||||||||||||||||
| 2013 | 2012 | 2011 | 2013 vs. 2012 | 2012 vs. 2011 | ||||||||||||||||||||||||
| (Amounts in thousands) | ||||||||||||||||||||||||||||
Interest expense, net | $ | 274,689 | $ | 232,450 | $ | 174,390 | $ | 42,239 | 18 | % | $ | 58,060 | 33 | % | ||||||||||||||
2013 compared to 2012
Interest expense, net, increased $42 million, or 18%, for year ended December 31, 2013 compared with the year ended December 31, 2012. We entered into multiple debt transactions during 2012 and 2013 that increased our overall effective interest rate and increased our debt levels which resulted in additional interest expense of $40 million during the year ended December 31, 2013. See Note 11, Debt—Senior Secured Credit Facility, to our audited consolidated financial statements included elsewhere in this prospectus. Additionally, debt modification expenses and original issue discount amortization increased by $8 million during the year ended December 31, 2013 compared to the prior year. We also incurred $17 million of imputed interest related to a litigation settlement payable during the year ended December 31, 2013. Offsetting these increases was a $16 million reduction associated with accelerating the amortization of our debt issuance cost in 2012 as well as a $9 million increase in interest savings as a result of the maturity of certain of our interest rates swaps in 2012. See Note 12, Derivatives, to our audited consolidated financial statements included elsewhere in this prospectus.
2012 compared to 2011
Interest expense, net, increased $58 million, or 33%, for the year ended December 31, 2012 compared with the year ended December 31, 2011. The change was due to an increase in the interest rate spread on $2 billion of our term loan as a result of amendments to our credit agreements on February 28, 2012, May 9, 2012 and August 15, 2012, made in connection with the maturity dates of certain loans, as well as the issuance of $800 million of 8.5% senior secured notes due in 2019. In the first half of 2012, we extended the maturity of $284 million, or 57%, of our revolving credit facility to 2016 and also extended the maturity of $1,854 million, or 65%, of our term loan outstanding to 2017, with an increase in interest rate spread from the LIBOR plus 2.00% to LIBOR plus 5.75%. In the second quarter we issued $400 million of 8.5% senior secured notes due in 2019. In the third quarter of 2012, we paid down $773 million of ournon-extended term loans maturing 2014 through the issuance of $375 million non-extended term loans maturing in 2017, which bears interest at a rate of LIBOR plus 6.00%, and $400 million of 8.5% senior secured notes due in 2019.
116
The increase in interest rates reflected current market pricing for similarly rated debt offerings and resulted in a $49 million increase in interest expense. Additionally, we incurred $22 million of expense due to our issuance of senior secured notes in May and September 2012 at a rate of 8.5%. The increase was partially offset by a $14 million decrease as a result of paying down $324 million of senior secured notes on August 1, 2011.
Loss on extinguishment of debt
| Year Ended December 31, | Change | |||||||||||||||||||||||||||
| 2013 | 2012 | 2011 | 2013 vs. 2012 | 2012 vs. 2011 | ||||||||||||||||||||||||
| (Amounts in thousands) | ||||||||||||||||||||||||||||
Loss on extinguishment of debt | $ | 12,181 | $ | — | $ | — | $ | 12,181 | **% | $ | — | **% | ||||||||||||||||
| * | not meaningful |
Loss on extinguishment of debt was $12 million for the year ended December 31, 2013 as a result of our debt restructuring transaction in the first quarter of 2013. See “Description of Certain Indebtedness—Senior Secured Credit Facilities.”
Gain on sale of business
| Year Ended December 31, | Change | |||||||||||||||||||||||||||
| 2013 | 2012 | 2011 | 2013 vs. 2012 | 2012 vs. 2011 | ||||||||||||||||||||||||
| (Amounts in thousands) | ||||||||||||||||||||||||||||
Gain on sale of business | $ | — | $ | 25,850 | $ | — | $ | (25,850 | ) | * | *% | $ | 25,850 | * | *% | |||||||||||||
| Year Ended December 31, | Change | |||||||||||||||||||||||||||
| 2013 | 2012 | 2011 | 2013 vs. 2012 | 2012 vs. 2011 | ||||||||||||||||||||||||
| (Amounts in thousands) | ||||||||||||||||||||||||||||
Gain on sale of business | $ | — | $ | 25,850 | $ | — | $ | (25,850 | ) | **% | $ | 25,850 | **% | |||||||||||||||
| ** | not meaningful |
Gain on sale of business for the year ended December 31, 2012 was $26 million and primarily related to the sale of our 51% stake in Sabre Pacific to Abacus for $46 million of proceeds. See “—Matters Affecting Comparability—Dispositions.”
Joint venture equity income goodwill impairment and intangible amortization(loss)
| Year Ended December 31, | Change | |||||||||||||||||||||||||||
| 2013 | 2012 | 2011 | 2013 vs. 2012 | 2012 vs. 2011 | ||||||||||||||||||||||||
| (Amounts in thousands) | ||||||||||||||||||||||||||||
Joint venture equity income | $ | 15,554 | $ | 24,487 | $ | 26,701 | $ | (8,933 | ) | (36 | )% | $ | (2,214 | ) | (8 | )% | ||||||||||||
Joint venture goodwill impairment and intangible amortization | (3,204 | ) | (27,000 | ) | (3,200 | ) | 23,796 | * | *% | (23,800 | ) | ** | % | |||||||||||||||
| Year Ended December 31, | Change | |||||||||||||||||||||||||||
| 2013 | 2012 | 2011 | 2013 vs. 2012 | 2012 vs. 2011 | ||||||||||||||||||||||||
| (Amounts in thousands) | ||||||||||||||||||||||||||||
Joint venture equity income (loss) | $ | 12,350 | $ | (2,513 | ) | $ | 23,501 | $ | 14,863 | **% | $ | (26,014 | ) | **% | ||||||||||||||
| ** | not meaningful |
2013 compared to 2012
Joint venture equity income decreased $9increased $15 million or 36%, for the year ended December 31, 2013 compared with the year ended December 31, 2012. This change was driven by a $24 million impairment of goodwill recognized in the year ended December 31, 2012, partially offset by decreased performance of our joint ventures in 2013 compared with the year ended December 31, 2012. Joint venture intangible amortization was flat compared to the prior year. In the year ended December 31, 2012, Abacus recognized an impairment of goodwill. We recognized our share of this impairment at $24 million.
2012 compared to 2011
Joint venture equity income decreased $2$26 million or 8%, for the year ended December 31, 2012 compared with the year ended December 31, 2011. This change was driven by a $24 million impairment of goodwill recognized in the year ended December 31, 2012 and a decreased performance of our joint ventures in 2012 compared with the year ended December 31, 2011. Joint venture intangible amortization was flat compared to the prior year. In the year ended December 31, 2012, Abacus recognized an impairment of goodwill. We recognized our share of this impairment at $24 million.
117
Other expenses (income), net
| Year Ended December 31, | Change | |||||||||||||||||||||||||||
| 2013 | 2012 | 2011 | 2013 vs . 2012 | 2012 vs . 2011 | ||||||||||||||||||||||||
| (Amounts in thousands) | ||||||||||||||||||||||||||||
Other expenses (income), net | $ | 6,724 | $ | 1,385 | $(1,156) | $5,339 | * | *% | $ | 2,541 | ** | % | ||||||||||||||||
| Year Ended December 31, | Change | |||||||||||||||||||||||||||
| 2013 | 2012 | 2011 | 2013 vs. 2012 | 2012 vs. 2011 | ||||||||||||||||||||||||
| (Amounts in thousands) | ||||||||||||||||||||||||||||
Other expenses (income), net | $ | 6,724 | $ | 1,385 | $ | (1,156 | ) | $ | 5,339 | **% | $ | 2,541 | **% | |||||||||||||||
| ** | not meaningful |
2013 compared to 2012
Other expenses, net, increased $5 million for the year ended December 31, 2013 compared with the year ended December 31, 2012. The increase was driven primarily by realized and unrealized foreign currency exchange losses.
2012 compared to 2011
Other expenses, net, increased $3 million for the year ended December 31, 2012 compared with the year ended December 31, 2011. The increase was driven primarily by realized and unrealized foreign currency exchange losses.
(Benefit) Provision for income taxes
| Year Ended December 31, | Change | |||||||||||||||||||||||||||
| 2013 | 2012 | 2011 | 2013 vs. 2012 | 2012 vs. 2011 | ||||||||||||||||||||||||
| (Amounts in thousands) | ||||||||||||||||||||||||||||
(Benefit) provision for income taxes | $ | (14,029 | ) | $ | (195,071 | ) | $ | 57,806 | $ | 181,042 | ** | % | $ | (252,877 | ) | ** | % | |||||||||||
| Year Ended December 31, | Change | |||||||||||||||||||||||||||
| 2013 | 2012 | 2011 | 2013 vs. 2012 | 2012 vs. 2011 | ||||||||||||||||||||||||
| (Amounts in thousands) | ||||||||||||||||||||||||||||
(Benefit) provision for income taxes | $ | (14,029 | ) | $ | (195,071 | ) | $ | 57,806 | $ | 181,042 | **% | $ | (252,877 | ) | **% | |||||||||||||
| ** | not meaningful |
2013 compared to 2012
We recognized a benefit for income taxes of $14 million for the year ended December 31, 2013 compared to a benefit of $195 million for the year ended December 31, 2012. The decrease in the benefit for income taxes was primarily the result of the decrease in pre-tax loss from continuing operations. The effective tax rates were 13% and 24% for the years ended December 31, 2013 and 2012, respectively. Excluding the impacts of (i) impairment charges, (ii) acquisition related amortization expense, (iii) restructuring and other costs, (iv) litigation and taxes, including penalties, (v) sales of businesses and assets, (vi) changes in valuation allowances, and (vii) other non-recurring tax and non-tax adjustments, our effective tax rates would have been 39% and 37% for the years ended December 31, 2013 and 2012, respectively.
2012 compared to 2011
We recognized a benefit for income taxes of $195 million for the year ended December 31, 2012 compared to a provision for income taxes of $58 million in the year ended December 31, 2011. The change was driven primarily by the decreaseincrease in earnings before income taxes.pre-tax loss from continuing operations. The effective tax rates were 24% and (269)% for the years ended December 31, 2012 and 2011, respectively. Excluding the impacts of (i) non-recurring impairment charges, (ii) acquisition related amortization expense, (iii) restructuring and other costs, (iv) litigation and taxes, (v) sale of business and assets, (vi) changes in valuation allowances, (vii) increases in tax losses for non-controlling interest, and (vii)(viii) other tax and non-tax adjustments, our effective tax rates would have been 37% and 35% for the years ended December 31, 2012 and 2011, respectively.
118
Quarterly Results of Operations
The following table presents our historical consolidated financial data for our business for each of the eighteleven quarters in the period ended December 31, 2013.September 30, 2014. The unaudited quarterly statement of operations data have been prepared on the same basis as our audited consolidated financial statements and, in the opinion of our management, reflect all adjustments, consisting of normal recurring adjustments, necessary for a fair presentation of this data. The historical consolidated data presented below are not necessarily indicative of the results expected for any future period. The following quarterly financial data should be read in conjunction with our audited consolidated financial statements and the related notes included elsewhere in this prospectus.
| Three Months Ended | Three Months Ended | |||||||||||||||||||||||||||||||||||||||||||||||||||||||||||||||||||||||||||
| Dec. 31, 2013 | Sep. 30, 2013 | Jun. 30, 2013 | Mar. 31, 2013 | Dec. 31, 2012 | Sep. 30, 2012 | Jun. 30, 2012 | Mar. 31, 2012 | Sep. 30, 2014 | Jun. 30, 2014 | Mar. 31, 2014 | Dec. 31, 2013 | Sep. 30, 2013 | Jun. 30, 2013 | Mar. 31, 2013 | Dec. 31, 2012 | Sep. 30, 2012 | Jun. 30, 2012 | Mar. 31, 2012 | ||||||||||||||||||||||||||||||||||||||||||||||||||||||||||
| (Unaudited, amounts in thousands) | (Unaudited, amounts in thousands) | |||||||||||||||||||||||||||||||||||||||||||||||||||||||||||||||||||||||||||
Consolidated Statements of Operations Data: | ||||||||||||||||||||||||||||||||||||||||||||||||||||||||||||||||||||||||||||
Revenue | $ | 746,126 | $ | 775,823 | $ | 768,232 | $ | 759,344 | $ | 699,606 | $ | 756,740 | $ | 748,726 | $ | 769,292 | $ | 756,303 | $ | 717,573 | $ | 755,410 | $ | 746,126 | $ | 775,823 | $ | 768,232 | $ | 759,344 | $ | 699,606 | $ | 756,740 | $ | 748,726 | $ | 769,292 | ||||||||||||||||||||||||||||||||||||||
Gross margin | 264,518 | 301,733 | 300,867 | 277,557 | 221,791 | 319,716 | 314,146 | 299,476 | ||||||||||||||||||||||||||||||||||||||||||||||||||||||||||||||||||||
Cost of revenue(a) | 465,689 | 444,276 | 490,723 | 481,608 | 474,090 | 467,365 | 481,787 | 477,815 | 437,024 | 434,580 | 469,816 | |||||||||||||||||||||||||||||||||||||||||||||||||||||||||||||||||
Selling, general and administrative | 172,703 | 208,033 | 212,364 | 199,829 | 292,926 | 469,278 | 213,656 | 212,388 | 169,183 | 205,152 | 200,309 | 172,703 | 208,033 | 212,364 | 199,829 | 292,926 | 469,278 | 213,656 | 212,388 | |||||||||||||||||||||||||||||||||||||||||||||||||||||||||
Impairment | — | 2,837 | 135,598 | — | 496,351 | 76,829 | — | — | — | — | — | — | 2,837 | 135,598 | — | 496,351 | 76,829 | — | — | |||||||||||||||||||||||||||||||||||||||||||||||||||||||||
Restructuring charges | 20,662 | 15,889 | — | — | — | — | — | — | ||||||||||||||||||||||||||||||||||||||||||||||||||||||||||||||||||||
Restructuring charges (adjustments)(a) | 4,735 | — | (2,410 | ) | 20,662 | 15,889 | — | — | — | — | — | — | ||||||||||||||||||||||||||||||||||||||||||||||||||||||||||||||||
Operating income (loss) | 71,153 | 74,974 | (47,095 | ) | 77,728 | (567,486 | ) | (226,391 | ) | 100,490 | 87,088 | 116,696 | 68,145 | 66,788 | 71,153 | 74,974 | (47,095 | ) | 77,728 | (567,486 | ) | (226,391 | ) | 100,490 | 87,088 | |||||||||||||||||||||||||||||||||||||||||||||||||||
Net income (loss) attributable to Sabre Corporation | 26,760 | 5,372 | (116,862 | ) | (15,764 | ) | (505,613 | ) | (186,647 | ) | 21,357 | 59,547 | ||||||||||||||||||||||||||||||||||||||||||||||||||||||||||||||||
Net (loss) income attributable to Sabre Corporation | 36,563 | (10,897 | ) | (2,843 | ) | 26,760 | 5,372 | (116,862 | ) | (15,764 | ) | (505,613 | ) | (186,647 | ) | 21,357 | 59,547 | |||||||||||||||||||||||||||||||||||||||||||||||||||||||||||
Net (loss) income attributable to common shareholders | 17,275 | (3,870 | ) | (125,867 | ) | (24,736 | ) | (514,551 | ) | (195,354 | ) | 12,872 | 51,094 | 36,563 | (13,132 | ) | (11,989 | ) | 17,275 | (3,870 | ) | (125,867 | ) | (24,736 | ) | (514,551 | ) | (195,354 | ) | 12,872 | 51,094 | |||||||||||||||||||||||||||||||||||||||||||||
Consolidated Statements of Cash Flows Data: | ||||||||||||||||||||||||||||||||||||||||||||||||||||||||||||||||||||||||||||
Cash provided by operating activities | $ | (94,869 | ) | $ | 181,006 | $ | (21,332 | ) | $ | 92,383 | $ | (87,238 | ) | $ | 118,255 | $ | 131,451 | $ | 149,868 | $ | 44,171 | $ | 5,310 | $ | 72,198 | $ | (94,874 | ) | $ | 81,007 | $ | 78,672 | $ | 92,383 | $ | (87,238 | ) | $ | 118,255 | $ | 131,451 | $ | 149,868 | |||||||||||||||||||||||||||||||||
Additions to property and equipment | 57,282 | 57,257 | 58,786 | 52,701 | 55,596 | 50,217 | 44,989 | 42,460 | 49,802 | 58,944 | 51,639 | 57,282 | 57,257 | 58,786 | 52,701 | 55,596 | 50,217 | 44,989 | 42,460 | |||||||||||||||||||||||||||||||||||||||||||||||||||||||||
Other Financial Data: | ||||||||||||||||||||||||||||||||||||||||||||||||||||||||||||||||||||||||||||
Adjusted Gross Margin(a) | $ | 324,528 | $ | 360,539 | $ | 359,127 | $ | 339,615 | $ | 286,205 | $ | 377,347 | $ | 371,077 | $ | 355,233 | ||||||||||||||||||||||||||||||||||||||||||||||||||||||||||||
Adjusted Net Income from continuing operations(b) | 69,456 | 51,737 | 51,953 | 44,005 | (51,922 | ) | 60,247 | 70,239 | 72,318 | |||||||||||||||||||||||||||||||||||||||||||||||||||||||||||||||||||
Adjusted Gross | $ | 358,354 | $ | 343,000 | $ | 342,722 | $ | 334,512 | $ | 369,054 | $ | 362,920 | $ | 352,565 | $ | 287,713 | $ | 378,978 | $ | 371,977 | $ | 379,621 | ||||||||||||||||||||||||||||||||||||||||||||||||||||||
Adjusted Net Income from continuing operations(c) | 39,019 | 55,381 | 33,521 | 69,453 | 51,737 | 52,006 | 43,955 | (51,918 | ) | 60,247 | 70,239 | 72,318 | ||||||||||||||||||||||||||||||||||||||||||||||||||||||||||||||||
Adjusted EBITDA(c) | 207,363 | 201,349 | 190,058 | 192,553 | 157,172 | 220,051 | 213,988 | 195,414 | 229,926 | 203,707 | 183,717 | 207,360 | 201,349 | 190,111 | 192,503 | 157,176 | 220,051 | 213,988 | 195,414 | |||||||||||||||||||||||||||||||||||||||||||||||||||||||||
Adjusted capital expenditures(d) | 67,410 | 67,280 | 75,420 | 74,730 | 78,294 | 70,863 | 65,212 | 57,436 | 59,807 | 68,888 | 59,292 | 67,410 | 67,280 | 75,420 | 74,730 | 78,294 | 70,863 | 65,212 | 57,436 | |||||||||||||||||||||||||||||||||||||||||||||||||||||||||
Consolidated Balance Sheet Data | ||||||||||||||||||||||||||||||||||||||||||||||||||||||||||||||||||||||||||||
Cash and cash equivalents | $ | 308,236 | $ | 491,588 | $ | 186,012 | $ | 150,233 | $ | 126,695 | $ | 302,383 | $ | 285,755 | $ | 93,177 | $ | 157,747 | $ | 252,380 | $ | 286,356 | $ | 308,236 | $ | 491,588 | $ | 186,012 | $ | 150,233 | $ | 126,695 | $ | 302,383 | $ | 285,755 | $ | 93,177 | ||||||||||||||||||||||||||||||||||||||
Long-term debt | 3,643,548 | 3,664,942 | 3,338,653 | 3,357,751 | 3,420,927 | 3,418,987 | 3,415,628 | 3,301,291 | 3,065,440 | 3,069,502 | 3,621,680 | 3,643,548 | 3,664,942 | 3,338,653 | 3,357,751 | 3,420,927 | 3,418,987 | 3,415,628 | 3,301,291 | |||||||||||||||||||||||||||||||||||||||||||||||||||||||||
Working capital (deficit) | (273,590 | ) | (265,601 | ) | (539,295 | ) | (517,591 | ) | (428,568 | ) | (232,419 | ) | (174,034 | ) | (328,236 | ) | (246,557 | ) | (179,111 | ) | (279,646 | ) | (273,590 | ) | (265,601 | ) | (539,295 | ) | (517,591 | ) | (428,568 | ) | (232,419 | ) | (174,034 | ) | (328,236 | ) | ||||||||||||||||||||||||||||||||||||||
| (a) |
| Three Months Ended | ||||||||||||||||||||||||||||||||
| Dec. 31, 2013 | Sep. 30, 2013 | Jun. 30, 2013 | Mar. 31, 2013 | Dec. 31, 2012 | Sep. 30, 2012 | Jun. 30, 2012 | Mar. 31, 2012 | |||||||||||||||||||||||||
| (Unaudited, amounts in thousands) | ||||||||||||||||||||||||||||||||
Gross Margin | $ | 264,518 | $ | 301,733 | $ | 300,867 | $ | 277,557 | $ | 221,791 | $ | 319,716 | $ | 314,146 | $ | 299,476 | ||||||||||||||||
Depreciation and amortization | 52,097 | 49,421 | 48,508 | 52,459 | 55,319 | 49,007 | 47,436 | 46,444 | ||||||||||||||||||||||||
Amortization of upfront incentive consideration | 7,913 | 9,385 | 9,752 | 9,599 | 9,095 | 8,624 | 9,495 | 9,313 | ||||||||||||||||||||||||
|
|
|
|
|
|
|
|
|
|
|
|
|
|
|
| |||||||||||||||||
Adjusted Gross Margin | $ | 324,528 | $ | 360,539 | $ | 359,127 | $ | 339,615 | $ | 286,205 | $ | 377,347 | $ | 371,077 | $ | 355,233 | ||||||||||||||||
|
|
|
|
|
|
|
|
|
|
|
|
|
|
|
| |||||||||||||||||
119
| (b) | The following table presents a reconciliation of |
| Three Months Ended | ||||||||||||||||||||||||||||||||||||||||||||
| Sep. 30, 2014 | Jun. 30, 2014 | Mar. 31, 2014 | Dec. 31, 2013 | Sep. 30, 2013 | Jun. 30, 2013 | Mar. 31, 2013 | Dec. 31, 2012 | Sep. 30, 2012 | Jun. 30, 2012 | Mar 31, 2012 | ||||||||||||||||||||||||||||||||||
| (Unaudited, amounts in thousands) | ||||||||||||||||||||||||||||||||||||||||||||
Operating income (loss) | $ | 116,696 | $ | 68,145 | $ | 66,788 | $ | 71,153 | $ | 74,974 | $ | (47,095 | ) | $ | 77,728 | $ | (567,486 | ) | $ | (226,391 | ) | $ | 100,490 | $ | 87,088 | |||||||||||||||||||
Add back: | ||||||||||||||||||||||||||||||||||||||||||||
Selling, general and administrative | 169,183 | 205,152 | 200,309 | 172,703 | 208,033 | 212,364 | 199,829 | 292,926 | 469,278 | 213,656 | 212,388 | |||||||||||||||||||||||||||||||||
Impairment | — | — | — | — | 2,837 | 135,598 | — | 496,351 | 76,829 | — | — | |||||||||||||||||||||||||||||||||
Restructuring charges(6) | 4,735 | — | — | 20,662 | 15,889 | — | — | — | — | — | — | |||||||||||||||||||||||||||||||||
Cost of revenue adjustments: | ||||||||||||||||||||||||||||||||||||||||||||
Depreciation and amortization(3) | 47,252 | 49,087 | 60,807 | 52,044 | 49,421 | 48,512 | 52,512 | 55,319 | 49,007 | 47,436 | 46,444 | |||||||||||||||||||||||||||||||||
Amortization of upfront incentive | 10,388 | 11,742 | 11,047 | 7,913 | 9,385 | 9,752 | 9,599 | 9,094 | 8,624 | 9,496 | 9,313 | |||||||||||||||||||||||||||||||||
Restructuring and other | 4,865 | 3,726 | (216 | ) | 8,094 | 2,582 | 1,348 | 591 | 950 | 666 | 775 | 2,134 | ||||||||||||||||||||||||||||||||
Litigation and taxes, including penalties(7) | 188 | 333 | 606 | 1,057 | 5,389 | 2,627 | 11,848 | (23 | ) | — | — | 22,210 | ||||||||||||||||||||||||||||||||
Stock-based compensation | 2,172 | 1,940 | 1,506 | 886 | 544 | (186 | ) | 458 | 582 | 965 | 124 | 44 | ||||||||||||||||||||||||||||||||
Amortization of Expedia SMA incentive payments | 2,875 | 2,875 | 1,875 | — | — | — | — | — | — | — | — | |||||||||||||||||||||||||||||||||
|
|
|
|
|
|
|
|
|
|
|
|
|
|
|
|
|
|
|
|
|
| |||||||||||||||||||||||
Adjusted Gross Margin | $ | 358,354 | $ | 343,000 | $ | 342,722 | $ | 334,512 | $ | 369,054 | $ | 362,920 | $ | 352,565 | $ | 287,713 | $ | 378,978 | $ | 371,977 | $ | 379,621 | ||||||||||||||||||||||
|
|
|
|
|
|
|
|
|
|
|
|
|
|
|
|
|
|
|
|
|
| |||||||||||||||||||||||
120
| (c) | The following table presents a reconciliation of net loss attributable to Sabre Corporation, the most directly comparable GAAP |
| Three Months Ended | ||||||||||||||||||||||||||||||||
| Dec. 31, 2013 | Sep. 30, 2013 | Jun. 30, 2013 | Mar. 31, 2013 | Dec. 31, 2012 | Sep. 30, 2012 | Jun. 30, 2012 | Mar. 31, 2012 | |||||||||||||||||||||||||
| (Unaudited, amounts in thousands) | ||||||||||||||||||||||||||||||||
Reconciliation of net income (loss) to Adjusted Net Income and to Adjusted EBITDA: | ||||||||||||||||||||||||||||||||
Net loss attributable to Sabre Corporation | $ | 26,763 | $ | 5,372 | $ | (116,915 | ) | $ | (15,714 | ) | $ | (505,613 | ) | $ | (186,647 | ) | $ | 21,357 | $ | 59,547 | ||||||||||||
Net loss from disc ops, net of tax | (13,719 | ) | (3,015 | ) | 12,893 | 11,017 | 40,492 | (9,282 | ) | 6,355 | 11,382 | |||||||||||||||||||||
Net income (loss) attributable to noncontrolling interests(1) | 728 | 714 | 837 | 584 | (49,842 | ) | (4,673 | ) | (717 | ) | (4,085 | ) | ||||||||||||||||||||
|
|
|
|
|
|
|
|
|
|
|
|
|
|
|
| |||||||||||||||||
Net loss from continuing operations | 13,772 | 3,071 | (103,185 | ) | (4,113 | ) | (514,963 | ) | (200,602 | ) | 26,995 | 66,844 | ||||||||||||||||||||
Adjustments: | ||||||||||||||||||||||||||||||||
Impairment(2) | — | 2,837 | 135,598 | — | 520,147 | 76,829 | — | — | ||||||||||||||||||||||||
Acquisition related amortization(3) | 35,811 | 35,794 | 36,209 | 35,951 | 41,749 | 40,815 | 39,745 | 40,208 | ||||||||||||||||||||||||
Loss (gain) on sale of business and assets | — | — | — | — | — | (785 | ) | — | (25,065 | ) | ||||||||||||||||||||||
Loss (gain) on extinguishment of debt | — | — | — | 12,181 | — | — | — | — | ||||||||||||||||||||||||
Other, net(4) | 5,624 | 2,429 | 3,796 | (5,125 | ) | 1,613 | 3,535 | 2,923 | (6,686 | ) | ||||||||||||||||||||||
Restructuring and other costs(5) | 32,756 | 21,754 | 2,376 | 2,166 | 3,104 | 952 | 1,113 | 1,607 | ||||||||||||||||||||||||
Litigation and taxes, including penalties(6) | 7,887 | 8,579 | 8,327 | 14,638 | 122,901 | 270,923 | 15,868 | 8,930 | ||||||||||||||||||||||||
Stock-based compensation | 3,640 | 2,686 | 36 | 2,724 | 1,214 | 1,106 | 5,184 | 2,330 | ||||||||||||||||||||||||
Management fees(7) | 1,414 | 2,126 | 2,499 | 2,722 | 1,512 | 2,476 | 1,905 | 1,876 | ||||||||||||||||||||||||
Tax impact of net income adjustments | (31,448 | ) | (27,539 | ) | (33,703 | ) | (17,139 | ) | (229,199 | ) | (135,002 | ) | (23,494 | ) | (17,726 | ) | ||||||||||||||||
|
|
|
|
|
|
|
|
|
|
|
|
|
|
|
| |||||||||||||||||
Adjusted Net Income | 69,456 | 51,737 | 51,953 | 44,005 | (51,922 | ) | 60,247 | 70,239 | 72,318 | |||||||||||||||||||||||
Adjustments: | ||||||||||||||||||||||||||||||||
Depreciation and amortization of property and equipment(3) | 33,796 | 32,936 | 31,404 | 33,347 | 36,525 | 33,976 | 32,591 | 32,469 | ||||||||||||||||||||||||
Amortization of capitalized implementation costs(3) | 8,513 | 8,437 | 7,720 | 10,881 | 6,537 | 5,325 | 4,855 | 4,138 | ||||||||||||||||||||||||
Amortization of upfront incentive consideration(8) | 7,913 | 9,385 | 9,752 | 9,599 | 9,094 | 8,624 | 9,496 | 9,313 | ||||||||||||||||||||||||
Interest expense, net | 65,036 | 63,454 | 63,669 | 82,530 | 61,191 | 64,973 | 58,870 | 47,416 | ||||||||||||||||||||||||
Remaining (benefit) provision for income taxes | 22,649 | 35,400 | 25,560 | 12,191 | 95,747 | 46,906 | 37,937 | 29,760 | ||||||||||||||||||||||||
|
|
|
|
|
|
|
|
|
|
|
|
|
|
|
| |||||||||||||||||
Adjusted EBITDA |
$ |
207,363 |
|
$ |
201,349 |
|
$ |
190,058 |
|
$ |
192,553 |
|
$ |
157,172 |
|
$ |
220,051 |
|
$ |
213,988 |
|
$ |
195,414 |
| ||||||||
|
|
|
|
|
|
|
|
|
|
|
|
|
|
|
| |||||||||||||||||
| Three Months Ended | ||||||||||||||||||||||||||||||||||||||||||||
| Sep. 30, | Jun. 30, | Mar. 31, | Dec. 31, | Sep. 30, | Jun. 30, | Mar. 31, | Dec. 31, | Sep. 30, | Jun. 30, | Mar. 31, | ||||||||||||||||||||||||||||||||||
| 2014 | 2014 | 2014 | 2013 | 2013 | 2013 | 2013 | 2012 | 2012 | 2012 | 2012 | ||||||||||||||||||||||||||||||||||
| (Unaudited, amounts in thousands) | ||||||||||||||||||||||||||||||||||||||||||||
Reconciliation of net income and (loss) to Adjusted Net Income to Adjusted EBITDA: | ||||||||||||||||||||||||||||||||||||||||||||
Net (loss) income attributable to Sabre Corporation | $ | 36,563 | $ | (10,897 | ) | $ | (2,843 | ) | $ | 26,760 | $ | 5,372 | $ | (116,862 | ) | $ | (15,764 | ) | $ | (505,613 | ) | $ | (186,647 | ) | $ | 21,357 | $ | 59,547 | ||||||||||||||||
Income (loss) from disc ops, net of tax | 1,736 | 5,183 | 1,098 | (13,719 | ) | (3,015 | ) | 12,893 | 11,017 | 40,492 | (9,282 | ) | 6,355 | 11,382 | ||||||||||||||||||||||||||||||
Net income (loss) attributable to noncontrolling interests(1) | 720 | 702 | 746 | 728 | 714 | 837 | 584 | (49,842 | ) | (4,673 | ) | (717 | ) | (4,085 | ) | |||||||||||||||||||||||||||||
|
|
|
|
|
|
|
|
|
|
|
|
|
|
|
|
|
|
|
|
|
| |||||||||||||||||||||||
(Loss) income from continuing operations | 39,019 | (5,012 | ) | (999 | ) | 13,769 | 3,071 | (103,132 | ) | (4,163 | ) | (514,963 | ) | (200,602 | ) | 26,995 | 66,844 | |||||||||||||||||||||||||||
Adjustments: | ||||||||||||||||||||||||||||||||||||||||||||
Impairment(2) | — | — | — | — | 2,837 | 135,598 | — | 520,151 | 76,829 | — | — | |||||||||||||||||||||||||||||||||
Acquisition related amortization expense(3) | 23,905 | 23,961 | 35,478 | 35,811 | 35,794 | 36,209 | 35,951 | 41,749 | 40,815 | 39,745 | 40,208 | |||||||||||||||||||||||||||||||||
Gain on sale of business and assets | — | — | — | — | — | — | — | — | (785 | ) | — | (25,065 | ) | |||||||||||||||||||||||||||||||
Gain on extinguishment of debt | — | 30,558 | 2,980 | — | — | — | 12,181 | — | — | — | — | |||||||||||||||||||||||||||||||||
Other, net(5) | (565 | ) | �� | (1,082 | ) | 887 | 5,624 | 2,429 | 3,796 | (5,125 | ) | 1,613 | 3,535 | 2,923 | (6,686 | ) | ||||||||||||||||||||||||||||
Restructuring and other costs(6) | 14,482 | 6,867 | 2,708 | 32,756 | 21,754 | 2,376 | 2,166 | 3,104 | 952 | 1,113 | 1,607 | |||||||||||||||||||||||||||||||||
Litigation and taxes, including penalties(7) | 4,440 | 2,904 | 5,152 | 7,887 | 8,579 | 8,327 | 14,638 | 122,901 | 270,923 | 15,868 | 8,930 | |||||||||||||||||||||||||||||||||
Stock-based compensation | 5,472 | 11,383 | 5,579 | 3,640 | 2,686 | 36 | 2,724 | 1,214 | 1,106 | 5,184 | 2,330 | |||||||||||||||||||||||||||||||||
Management fees(8) | 193 | 21,576 | 1,932 | 1,414 | 2,126 | 2,499 | 2,722 | 1,512 | 2,476 | 1,905 | 1,876 | |||||||||||||||||||||||||||||||||
Amortization of Expedia SMA incentive payments | 2,875 | 2,875 | 1,875 | — | — | — | — | — | — | — | — | |||||||||||||||||||||||||||||||||
Tax impact of net income adjustments | (19,894 | ) | (38,649 | ) | (22,071 | ) | (31,448 | ) | (27,539 | ) | (33,703 | ) | (17,139 | ) | (229,199 | ) | (135,002 | ) | (23,494 | ) | (17,726 | ) | ||||||||||||||||||||||
|
|
|
|
|
|
|
|
|
|
|
|
|
|
|
|
|
|
|
|
|
| |||||||||||||||||||||||
Adjusted Net Income | 69,927 | 55,381 | 33,521 | 69,453 | 51,737 | 52,006 | 43,955 | (51,918 | ) | 60,247 | 70,239 | 72,318 | ||||||||||||||||||||||||||||||||
Adjustments: | ||||||||||||||||||||||||||||||||||||||||||||
Depreciation and amortization of property and equipment(3) | 39,524 | 41,304 | 41,581 | 33,796 | 32,936 | 31,404 | 33,347 | 36,525 | 33,976 | 32,591 | 32,469 | |||||||||||||||||||||||||||||||||
Amortization of capitalized implementation costs(3) | 9,084 | 8,891 | 9,136 | 8,513 | 8,437 | 7,720 | 10,881 | 6,537 | 5,325 | 4,855 | 4,138 | |||||||||||||||||||||||||||||||||
Amortization of upfront incentive payments(4) | 10,388 | 11,742 | 11,047 | 7,913 | 9,385 | 9,752 | 9,599 | 9,094 | 8,624 | 9,496 | 9,313 | |||||||||||||||||||||||||||||||||
Interest expense, net | 50,153 | 53,235 | 63,944 | 65,036 | 63,454 | 63,669 | 82,530 | 61,191 | 64,973 | 58,870 | 47,416 | |||||||||||||||||||||||||||||||||
Remaining (benefit) provision for income taxes | 50,850 | 33,154 | 24,488 | 22,649 | 35,400 | 25,560 | 12,191 | 95,747 | 46,906 | 37,937 | 29,760 | |||||||||||||||||||||||||||||||||
|
|
|
|
|
|
|
|
|
|
|
|
|
|
|
|
|
|
|
|
|
| |||||||||||||||||||||||
Adjusted EBITDA | $ | 229,926 | $ | 203,707 | $ | 183,717 | $ | 207,360 | $ | 201,349 | $ | 190,111 | $ | 192,503 | $ | 157,176 | $ | 220,051 | $ | 213,988 | $ | 195,414 | ||||||||||||||||||||||
|
|
|
|
|
|
|
|
|
|
|
|
|
|
|
|
|
|
|
|
|
| |||||||||||||||||||||||
| (1) | Net income (loss) attributable to non-controlling interests represents an adjustment to include earnings allocated to non-controlling interest held in (i) Sabre Travel Network Middle East of 40% for all periods presented, (ii) Sabre Pacific of 49% through February 24, 2012, the date we sold this business, |
| (2) | Represents impairment charges to assets (see Note 7, Goodwill and Intangible Assets, to our audited consolidated financial statements included elsewhere in this prospectus) as well as $24 million in 2012, representing our share of impairment charges recorded by one of our equity method investments, Abacus. |
| (3) | Depreciation and amortization expenses (see Note 2, Summary of Significant Accounting Policies, to our audited consolidated financial statements included elsewhere in this prospectus for associated asset lives): |
| a. | Acquisition related amortization represents amortization of intangible assets from the take-private transaction in 2007 as well as intangibles associated with acquisitions since that date and amortization of the excess basis in our underlying equity in joint ventures. |
| b. | Depreciation and amortization of property and equipment |
| c. | Amortization of capitalized implementation costs represents amortization of |
121
| (4) |
| Our Travel Network business at times provides upfront incentive consideration to travel agency subscribers at the inception or modification of a service contract, which are capitalized and amortized to cost of revenue over an average expected life of the service contract, generally over three to five years. Such consideration is made with the objective of increasing the number of clients or to ensure or improve customer loyalty. Such service contract terms are established such that the supplier and other fees generated over the life of the contract will exceed the cost of the incentive consideration provided upfront. Such service contracts with travel agency subscribers require that the customer commit to achieving certain economic objectives and generally have terms requiring repayment of the upfront incentive consideration if those objectives are not met. |
| (5) | Other, net primarily represents foreign exchange gains and losses related to the remeasurement of foreign currency denominated balances included in our consolidated balance sheets into the relevant functional currency. |
| (6) | Restructuring and other costs represents charges associated with business restructuring and associated changes implemented which resulted in severance benefits related to employee terminations, integration and facility opening or closing costs and other business reorganization costs. |
| (7) | Litigation settlement and tax payments for certain items represents charges or settlements associated with airline antitrust litigation as well as payments or reserves taken in relation to certain retroactive hotel occupancy and excise tax disputes (see Note 13, Contingencies, to our unaudited consolidated financial statements and Note 20, Commitments and Contingencies, to our audited consolidated financial statements included elsewhere in this prospectus). |
| (8) | We paid an annual management fee to TPG and Silver Lake in an amount between (i) $5 million and (ii) $7 million, the actual amount of which was calculated based upon 1% of Adjusted EBITDA, as defined in the MSA, earned by the company in such fiscal year up to a maximum of $7 million. In addition, the MSA provided for the reimbursement of certain costs incurred by TPG and Silver Lake, which are included in this line item. In connection with our initial public offering, we paid to TPG and Silver Lake, in the aggregate, a $21 million fee pursuant to the MSA. The MSA was terminated at the completion of our initial public offering. |
| Includes capital expenditures and capitalized implementation costs as summarized below: |
| Three Months Ended | Three Months Ended | |||||||||||||||||||||||||||||||||||||||||||||||||||||||||||||||||||||||||||
| Dec. 31, 2013 | Sep. 30, 2013 | Jun. 30, 2013 | Mar. 31, 2013 | Dec. 31, 2012 | Sep. 30, 2012 | Jun. 30, 2012 | Mar. 31, 2012 | Sep. 30, 2014 | Jun. 30, 2014 | Mar. 31, 2014 | Dec. 31, 2013 | Sep. 30, 2013 | Jun. 30, 2013 | Mar. 31, 2013 | Dec. 31, 2012 | Sep. 30, 2012 | Jun. 30, 2012 | Mar 31, 2012 | ||||||||||||||||||||||||||||||||||||||||||||||||||||||||||
| (Unaudited, amounts in thousands) | (Unaudited, amounts in thousands) | |||||||||||||||||||||||||||||||||||||||||||||||||||||||||||||||||||||||||||
Additions to property and equipment | $ | 57,282 | $ | 57,257 | $ | 58,786 | $ | 52,701 | $ | 55,596 | $ | 50,217 | $ | 44,989 | $ | 42,460 | $ | 49,802 | $ | 58,944 | $ | 51,639 | $ | 57,282 | $ | 57,257 | $ | 58,786 | $ | 52,701 | $ | 55,596 | $ | 50,217 | $ | 44,989 | $ | 42,460 | ||||||||||||||||||||||||||||||||||||||
Capitalized implementation costs | 10,128 | 10,023 | 16,634 | 22,029 | 22,698 | 20,646 | 20,223 | 14,976 | 10,005 | 9,944 | 7,653 | 10,128 | 10,023 | 16,634 | 22,029 | 22,698 | 20,646 | 20,223 | 14,976 | |||||||||||||||||||||||||||||||||||||||||||||||||||||||||
|
|
|
|
|
|
|
|
|
|
|
|
|
|
|
|
|
|
| ||||||||||||||||||||||||||||||||||||||||||||||||||||||||||
Adjusted capital expenditures | $ | 67,410 | $ | 67,280 | $ | 75,420 | $ | 74,730 | $ | 78,294 | $ | 70,863 | $ | 65,212 | $ | 57,436 | $ | 59,807 | $ | 68,888 | $ | 59,292 | $ | 67,410 | $ | 67,280 | $ | 75,420 | $ | 74,730 | $ | 78,294 | $ | 70,863 | $ | 65,212 | $ | 57,436 | ||||||||||||||||||||||||||||||||||||||
|
|
|
|
|
|
|
|
|
|
|
|
|
|
|
|
|
|
| ||||||||||||||||||||||||||||||||||||||||||||||||||||||||||
Liquidity and Capital Resources
On April 23, 2014, we closed our initial public offering of our common stock in which we sold 39,200,000 shares, and on April 25, 2014, the underwriters exercised in full their option to purchase which resulted in the sale of an additional 5,880,000 shares of our common stock. Our shares of common stock were sold at an initial public offering price of $16.00 per share, which generated $672 million of net proceeds from the offering after deducting underwriting discounts and commissions and offering expenses.
We used the net proceeds from our initial public offering to repay (i) $296 million aggregate principal amount of our Term Loan C (see “—Senior Secured Credit Facilities”) and (ii) $320 million aggregate principal amount of our senior secured notes due 2019 at a redemption price of 108.5% of the principal amount. We also used the net proceeds from our offering to pay the $27 million redemption premium and $13 million in accrued but unpaid interest on the 2019 Notes. We used the remaining portion of the net proceeds from our offering to pay a $21 million fee, in the aggregate, to TPG and Silver Lake pursuant to the MSA, which was thereafter terminated.
Our principal sources of liquidity are: (i) cash flows from operations, (ii) cash and cash equivalents and (iii) borrowings under our $352$405 million Revolving Facility.Revolver (see “—Senior Secured Credit Facilities”). Borrowing availability under our Revolving FacilityRevolver is reduced by our outstanding letters of credit and restricted cash collateral. AtAs of September 30, 2014 and December 31, 2013, 2012 and 2011, our cash and cash equivalents, restricted cash, Revolving Facility,Revolver, and outstanding letters of credit and restricted cash collateral were as follows:follows (in thousands):
| As of December 31, | ||||||||||||
| 2013 | 2012 | 2011 | ||||||||||
| (Amounts in thousands) | ||||||||||||
Cash and cash equivalents | $ | 308,236 | $ | 126,695 | $ | 58,350 | ||||||
Restricted cash | 2,359 | 4,440 | 8,786 | |||||||||
Revolving facility outstanding balance | — | — | 82,000 | |||||||||
Outstanding letters of credit | 67,139 | 113,529 | 120,101 | |||||||||
Restricted cash collateral | 810 | 2,075 | 2,038 | |||||||||
Available balance under the revolving facility | 285,671 | 388,546 | 299,937 | |||||||||
| September 30, 2014 | December 31, 2013 | |||||||
| (Amounts in thousands) | ||||||||
Cash and cash equivalents | $ | 157,747 | $ | 308,236 | ||||
Revolver outstanding balance | — | — | ||||||
Available balance under the Revolver | 345,106 | 285,671 | ||||||
Outstanding letters of credit | (60,057 | ) | (67,949 | ) | ||||
122
We consider cash equivalents to be highly liquid investments that are readily convertible into cash. Securities with contractual maturities of three months or less, when purchased, are considered cash equivalents. We record changes in a book overdraft position, in which our bank account is not overdrawn but recently issued and outstanding checks result in a negative general ledger balance, as cash flows from financing activities.
We invest in a money market fund which is classified as cash and cash equivalents in our consolidated balance sheets and statements of cash flows.
We held no short-term investments as of September 30, 2014 and December 31, 2013.
Utilization
We utilize cash and cash equivalents primarily to pay our operating expenses, make capital expenditures, invest in our products and offerings, pay quarterly dividends on our common stock and service our debt and other long-term liabilities. ForIn the years ended December 31,fourth quarter of 2013, and 2012, we also used a portion of our cash and cash equivalents to pay our litigation settlement with American Airlines includingmake a $100 million litigation settlement payment made into American Airlines. In the fourththird quarter of 2013. We2014, we made a $50 million payment to American Airlines in conjunction with the new Airline Solutions contract, which will also usebe amortized as a portionreduction to revenue over the contract term. This payment reduces non-cash payment credits originally offered to American Airlines as a part of the litigation settlement in 2012, contingent upon the signature of a new reservation agreement, which were extended to include the combined American Airlines and US Airways reservation contract. The non-cash payment credits would have been utilized for future billings under the new agreement.
For the nine months ended September 30, 2014, we have used $100 million of our cash and cash equivalents asto wind down working capital in Travelocity impacted by the Expedia SMA and the sale of December 31, 2013 to pay travel suppliersTPN as described above under “—Factors“Factors Affecting Our Results—Travelocity”our Results and Comparability—Travelocity Restructuring.”
In the third quarter of 2014, we paid $30 million of contingent consideration and contingent employment payments related to the acquisition of PRISM due in August 2014.
Ability to Generate Cash in the Future
Our ability to generate cash depends on many factors beyond our control, and any failure to meet our debt service obligations could harm our business, financial condition and results of operations. Our ability to make payments on and to refinance our indebtedness, and to fund working capital needs, and planned capital expenditures and dividends will depend on our ability to generate cash in the future, which is subject to general economic, financial, competitive, business, legislative, regulatory and other factors that are beyond our control. See “Risk Factors—Risks Related to our Indebtedness and Liquidity—We may require more cash than we generate in our operating activities, and additional funding on reasonable terms or at all may not be available.”
Senior Secured Credit Facilities
On February 19, 2013, Sabre GLBL entered into an agreement that amended and restated its existing senior secured credit facilities.facilities (the “Amended and Restated Credit Agreement”). The agreement replaced (i) the existing term loans with new classes of term loans of $1,775 million (Term B Facility)(the “Term Loan B”) and $425 million (Term C Facility)(the “Term Loan C”) and (ii) the existing revolving credit facility with a new revolving credit facility of $352 million (Revolving Facility)(the “Revolver”). The Term Loan B Facility matures on February 19, 2019 and amortizes in equal quarterly installments of 0.25%. The Term Loan C Facility matures on December 31, 2017. As a result of the April 2014 prepayment, quarterly principal payments on Term Loan C are no longer required. We are obligated to pay $17 million on September 30, 2017 and amortizes in equal quarterly installments of 3.75% in 2013 and 2014, increasing to equal quarterly installments of 4.375%, 5.625% and 7.5% in 2015, 2016 and 2017, respectively.the remaining balance on December 31, 2017. A portion of the Revolving FacilityRevolver matures on February 19, 2018. On September 30, 2013, Sabre GLBL entered into an agreement to amend its amended and restated credit agreement to add a new class of term loans in the amount of $350 million (Incremental(the “Incremental Term Facility)Loan Facility”). Sabre
123
GLBL has used a portion, and intends to use the remainder, of the proceeds of the Incremental Term Loan Facility for working capital and ongoingone-time costs associated with the Expedia SMA and future strategic actions related to Travelocity,sale of TPN, including the payment of travel suppliers for travel consumed that originated on our existing websites as described above under “—Factors Affecting Our Results—Travelocity”.technology platforms and for general corporate purposes. The Incremental Term Loan Facility matures on February 19, 2019 and amortizes in equal quarterly installments of 0.25% commencing with the last business day of December 2013. We are scheduled to make $85$22 million in principal payments on our senior secured credit facilities over the next twelve months. On February 20, 2014, we entered into an agreementa series of amendments to amend our amendedAmended and restated credit agreementRestated Credit Agreement (“Repricing Amendments”) to, among other things, (i) reduce the interest rate margin applicable to the Term Loan B Facility to (x) between 3.00% to 3.25% per annum for Eurocurrency rate loans and (y) between 2.00% to 2.25% per annum for base rate loans and (ii) reduce the Eurocurrency rate floor to 1.00% and the base rate floor to 2.00%. In addition, on February 20, 2014, we entered into (i) an agreement to amend our amended and restated credit agreement to extendthe Repricing Amendments extended the maturity date of $317 million of the Revolving FacilityRevolver to February 19, 2019 and (ii) an agreement to amend our amended and restated credit agreement to provideprovided for ana revolving commitment increase of $53 million under the extended portion of the Revolving Facility,Revolver, increasing total commitments under the Revolving FacilityRevolver to $405 million. The extended portion of the Revolving FacilityRevolver includes an accelerated maturity of November 19, 2018 if on November 19, 2018, the Term Loan B Facility (or permitted refinancings thereof) remains outstanding with a maturity date occurring less than one year after the maturity date of the extended portion of the Revolving Facility.Revolver.
UnderIn April 2014, we made partial prepayments totaling $296 million of our outstanding indebtedness under the credit agreement that governsTerm Loan C portion of our senior secured credit facilities using proceeds from our initial public offering.
Under the Amended and Restated Credit Agreement, the loan parties are subject to certain customary non-financial covenants, including certain restrictions on incurring certain types of indebtedness, creation of liens on certain assets, making of certain investments, and payment of dividends, as well as a maximum senior secured leverage ratio, which applies if our revolver utilization exceeds certain thresholds. This ratio is calculated as senior secured debt (net of cash) to EBITDA, as defined by the credit agreement. This ratio was 5.5 to 1.0 for 2013 and is 5.0 to 1.0 for 2014. The definition of EBITDA is based on a trailing twelve months EBITDA adjusted for certain items including non-recurring expenses and the pro forma impact of cost saving initiatives. This EBITDA is calculated for the purposes of compliance with our debt covenants and differs from the Adjusted EBITDA metric used elsewhere in this prospectus. See Note 11, Debt—Senior Secured Credit Facilities, to our audited consolidated financial statements included elsewhere in this prospectus.
We are also required to pay down the term loans by an amount equal to 50% of annual excess cash flow, as defined in the credit agreement that governsAmended and Restated Credit Agreement. No excess cash flow payment is required in 2014 with respect to our results for the senior secured credit facilities, each fiscal year end after our audited consolidated financial statements are delivered, if we achieve certain leverage ratios.ended December 31, 2013. This percentage
requirement may decrease or be eliminated if certain leverage ratios are achieved. We are further required to pay down the term loan with proceeds from certain asset sales or borrowings as defined in the credit agreement that governs the senior secured credit facilities.Amended and Restated Credit Agreement.
Liquidity Outlook
We believe that cash flows from operations, cash and cash equivalents on hand and the revolving credit facilityRevolver provide adequate liquidity for our operational and capital expenditures, quarterly dividends on our common stock and other obligations over the next twelve months. From a long-term perspective,time to time, we may need to supplement our current liquidity through debt or equity offerings to support future strategic investments or to pay down our $400 million of senior unsecured notes due in 2016, if we decide not to refinance this indebtedness. See Note 11, Debt, to our audited consolidated financial statements included elsewhere in this prospectus. See “Risk Factors—Risks Related to our Indebtedness and Liquidity—We may require more cash than we generate in our operating activities, and additional funding on reasonable terms or at all may not be available.”
Litigation Settlement Agreement
As a result of our litigation settlement agreement with American Airlines in 2012, we have accrued a settlement liability which consists of several elements, including cash to be paid directly to American Airlines, payment credits to pay for future technology services that we provide, as defined in the settlement agreements, and the estimated fair value of other service agreements entered into concurrently with the settlement agreement.
124
As of December 31, 2013,September 30, 2014, our remaining settlement liability under the settlement agreement was $137$112 million, of which the current portion of $39$75 million is recorded in litigation settlement liability and related deferred revenue and the noncurrent portion of $98$37 million is recorded in other noncurrent liabilities. In accordance with the settlement agreement, we paid $100 million during the fourth quarter of 2013 and $100 million during the fourth quarter of 2012. We expect to realize cash tax benefits over the next one to four years and payment credits are expected to be used from 2014 through 2017, depending on the level of services we provide to American Airlines. As of December 31, 2012, we recorded the estimated settlement charge of $347 million, or $222 million, net of tax, into our results of operations.
Contingent Consideration on PRISM Acquisition
On August 1, 2012, we acquired PRISM for a purchase price of approximately $116 million. Included in the purchase price are future payments totaling $60 million, due 12 and 24 months following the acquisition date. The first installment of $30 million was paid in August 2013. The second installment of $30 million, due in August 2014, is contingent primarily on contractual performance measures which have been met. See Note 3, Acquisitions,20, Commitments and Contingencies, to our audited consolidated financial statements included elsewhere in this prospectus.
Accumulated Dividends
We paid cash dividends on our common stock in the third and fourth quarter of 2014 and expect to continue to pay quarterly cash dividends thereafter. Our board of directors declared cash dividends of $0.09 per share of our common stock, which were paid on September 16, 2014 to shareholders of record as of September 1, 2014, and on December 30, 2014 to shareholders of record as of December 15, 2014. We funded this dividend, and intend to fund any future dividends, from cash generated from our operations. Future cash dividends, if any, will be at the discretion of our board of directors and the amount of cash dividends per share will depend upon, among other things, our future operations and earnings, capital requirements and surplus, general financial condition, contractual restrictions, number of shares of common stock outstanding and other factors the board of directors may deem relevant. The timing and amount of future dividend payments will be at the discretion of our board of directors. See “Risk Factors—Risks Related to the Offering and our Common Stock—Our ability to pay regular dividends to our stockholders is subject to the discretion of our board of directors and may be limited by our holding company structure and applicable provisions of Delaware law.”
Redemption of Preferred Stock
Each share of our Series A Preferred Stock accumulates dividends at an annual rate of 6%. Accumulated but unpaid dividends totaled $134 million and $97 million at December 31, 2013 and December 31, 2012, respectively. Prior to the closing of thisour initial public offering, we will exerciseamended our Certificate of Incorporation and exercised our right to redeem all of our Series A Cumulative Preferred Stock. Following anThe amendment to our Certificate of Incorporation modified the redemption price will be paid withfeature of the Series A Cumulative Preferred Stock to allow for settlement using cash, shares of our common stock or a mix of cash and shares of our common stock. On April 23, 2014, we redeemed all of our outstanding shares of Series A Cumulative Preferred Stock in exchange for 40,343,529 shares of our common stock, which we will deliverwas delivered pro rata to the holders thereof concurrently with the closing of thisour initial public offering. See “Summary—Redemption of Preferred Stock.”
Tax Receivable Agreement
We expectImmediately prior to pay between $ millionthe closing of our initial public offering, we entered into the TRA. Based on current tax laws and $ million relatedassuming that we and our subsidiaries earn sufficient taxable income to realize the full tax benefits subject to the TRA, (i) we expect that future payments under the TRA relating to the Pre-IPO Tax Assets could aggregate to between $330 million and $380 million over the next five years. The payment range is basedsix years (assuming no changes to current limitations on our assumptions using various items, including valuation analysisability to utilize our NOLs under Section 382 of the Code), which we estimate will represent approximately 85% to 95% of the total payments we will be required to make under the TRA and current tax law.(ii) we do not expect material payments to occur before 2016. Payments under the TRA are not conditioned upon the parties’ continuedcontinuing ownership of the company. See “Certain Relationships
Political and Related Party Transactions—Tax Receivable Agreement.”Economic Environment in Venezuela
Venezuela has imposed currency controls, including volume restrictions on the conversion of bolivars to U.S. dollars, which impact the ability of certain of our airline customers operating in the country to obtain U.S. dollars to make timely payments to us. Consequently, the collection of accounts receivable due to us can be, and has been, delayed. Due to the nature of this delay, we have recorded specific reserves against all outstanding balances due to us and are deferring the recognition of any future revenues effective January 1, 2014 until cash is
125
collected in accordance with our policies. Accordingly, our accounts receivable are subject to a general collection risk, as there can be no assurance that we will be paid from such customers in a timely manner, if at all. We collected approximately $14 million of accounts receivable due to us during the nine months ended September 30, 2014, and had $9 million of accounts receivable outstanding as of September 30, 2014, which will be recognized as revenue when cash is received. We collected an additional $7 million of accounts receivable due to us from October to December 2014. In January 2014, Venezuela announced a dual-foreign exchange rate system, which has effectively devalued the local currency and subjected airlines to an exchange rate for U.S. dollars available at auctions that has been significantly higher than the official exchange rate. In conjunction with the political and economic uncertainty in Venezuela, demand for travel by local consumers has declined. Certain airlines have scaled back operations in response to the reduced demand as well as the currency controls which has impacted our airline customers in Venezuela. As a result, our revenues derived from our Venezuelan operations in 2014 were reduced as compared to our revenues for 2013. During the year ended December 31, 2013, we derived 1% of our total revenue from our airline customers operating in Venezuela.
Working Capital
| As of December 31, | Change | As of December 31, | Change | |||||||||||||||||||||||||||||||||||||
| 2013 | 2012 | 2011 | 2013 vs. 2012 | 2012 vs. 2011 | 2013 | 2012 | 2011 | 2013 vs. 2012 | 2012 vs. 2011 | |||||||||||||||||||||||||||||||
(Amounts in thousands) | (Amounts in thousands) | |||||||||||||||||||||||||||||||||||||||
Current assets | ||||||||||||||||||||||||||||||||||||||||
Cash and cash equivalents | $ | 308,236 | $ | 126,695 | $ | 58,351 | $ | 181,541 | $ | 68,344 | $ | 308,236 | $ | 126,695 | $ | 58,351 | $ | 181,541 | $ | 68,344 | ||||||||||||||||||||
Restricted cash | 2,359 | 4,440 | 8,786 | (2,081 | ) | (4,346 | ) | 2,359 | 4,440 | 8,786 | (2,081 | ) | (4,346 | ) | ||||||||||||||||||||||||||
Accounts receivable, net | 434,288 | 417,240 | 380,729 | 17,048 | 36,511 | 434,288 | 417,240 | 380,729 | 17,048 | 36,511 | ||||||||||||||||||||||||||||||
Prepaid expenses and other current assets | 53,378 | 46,020 | 38,960 | 7,358 | 7,060 | 53,378 | 46,020 | 38,960 | 7,358 | 7,060 | ||||||||||||||||||||||||||||||
Current deferred income taxes | 41,431 | 32,938 | 31,629 | 8,493 | 1,309 | 41,431 | 32,938 | 31,629 | 8,493 | 1,309 | ||||||||||||||||||||||||||||||
Other receivables, net | 29,511 | 42,334 | 77,783 | (12,823 | ) | (35,449 | ) | 29,511 | 42,334 | 77,783 | (12,823 | ) | (35,449 | ) | ||||||||||||||||||||||||||
Current assets held for sale | — | — | 27,624 | — | (27,624 | ) | — | — | 27,624 | — | (27,624 | ) | ||||||||||||||||||||||||||||
Assets of discontinued operations | 13,624 | 87,003 | 144,386 | (73,379 | ) | (57,385 | ) | 13,624 | 87,003 | 144,386 | (73,379 | ) | (57,383 | ) | ||||||||||||||||||||||||||
|
|
|
|
|
|
|
|
|
| |||||||||||||||||||||||||||||||
Total current assets | 882,827 | 756,670 | 768,248 | 126,157 | (11,578 | ) | 882,827 | 756,670 | 768,248 | 126,157 | (11,578 | ) | ||||||||||||||||||||||||||||
|
|
|
|
|
|
|
|
|
| |||||||||||||||||||||||||||||||
Current liabilities | ||||||||||||||||||||||||||||||||||||||||
Accounts payable | $ | 111,386 | $ | 124,893 | $ | 168,307 | $ | (13,507 | ) | $ | (43,414 | ) | $ | 111,386 | $ | 124,893 | $ | 168,307 | $ | (13,507 | ) | $ | (43,414 | ) | ||||||||||||||||
Travel supplier liabilities and related deferred revenue | 213,504 | 218,023 | 203,615 | (4,519 | ) | 14,408 | 213,504 | 218,023 | 203,615 | (4,519 | ) | 14,408 | ||||||||||||||||||||||||||||
Accrued compensation and related benefits | 117,689 | 89,439 | 49,320 | 28,250 | 40,119 | 117,689 | 89,439 | 49,320 | 28,250 | 40,119 | ||||||||||||||||||||||||||||||
Accrued incentive consideration | 142,767 | 127,099 | 114,404 | 15,668 | 12,695 | 142,767 | 127,099 | 114,404 | 15,668 | 12,695 | ||||||||||||||||||||||||||||||
Deferred revenues | 136,380 | 137,614 | 96,936 | (1,234 | ) | 40,678 | 136,380 | 137,614 | 96,936 | (1,234 | ) | 40,678 | ||||||||||||||||||||||||||||
Litigation settlement and related deferred revenue | 38,920 | 117,873 | — | (78,953 | ) | 117,873 | 38,920 | 117,873 | — | (78,953 | ) | 117,873 | ||||||||||||||||||||||||||||
Other accrued liabilities | 267,867 | 245,633 | 303,018 | 22,234 | (57,385 | ) | 267,867 | 245,633 | 303,018 | 22,234 | (57,385 | ) | ||||||||||||||||||||||||||||
Current portion of debt | 86,117 | 23,232 | 30,150 | 62,885 | (6,918 | ) | 86,117 | 23,232 | 30,150 | 62,885 | (6,918 | ) | ||||||||||||||||||||||||||||
Revolving credit facility | — | — | 82,000 | — | (82,000 | ) | — | — | 82,000 | — | (82,000 | ) | ||||||||||||||||||||||||||||
Current liabilities held for sale | — | — | 34,952 | — | (34,952 | ) | — | — | 34,952 | — | (34,952 | ) | ||||||||||||||||||||||||||||
Liabilities of discontinued operations | 41,788 | 101,433 | 97,028 | (59,645 | ) | 4,405 | 41,788 | 101,433 | 97,028 | (59,645 | ) | 4,405 | ||||||||||||||||||||||||||||
|
|
|
|
|
|
|
|
|
| |||||||||||||||||||||||||||||||
Total current liabilities | 1,156,418 | 1,185,239 | 1,179,733 | (28,821 | ) | 5,506 | 1,156,418 | 1,185,239 | 1,179,730 | (28,821 | ) | 5,509 | ||||||||||||||||||||||||||||
|
|
|
|
|
|
|
|
|
| |||||||||||||||||||||||||||||||
Working Capital Deficit | $ | (273,591 | ) | $ | (428,569 | ) | $ | (411,485 | ) | $ | 154,978 | $ | (17,084 | ) | $ | (273,591 | ) | $ | (428,569 | ) | $ | (411,482 | ) | $ | 154,978 | $ | (17,087 | ) | ||||||||||||
|
|
|
|
|
|
|
|
|
| |||||||||||||||||||||||||||||||
As of December 31, 2013, we had a deficit in our working capital of $274 million, compared to a deficit of $429 million as of December 31, 2012. The decrease in working capital deficit is largely attributable to a $182 million increase in cash as a result of the Incremental Term Loan Facility and a $79 million decrease in other
126
accrued liabilities due to a decrease in litigation settlement payable in connection with our settlement agreement with American Airlines, offset by a $63 million increase in the current portion of debt due to refinancing of our existing senior secured credit facilities in February 2013.
As of December 31, 2012, we had a deficit in our working capital of $429 million, compared to a deficit of $411 million as of December 31, 2011. WorkingThe increase in working capital increased duedeficit is primarily attributable to the recognition of the current portion of litigation charges related to our settlement with American Airlines, partially offset by an increase in cash from our bond issuances in May and September 2012 and by the pay downpaydown of our Revolving Facility, offset by recording the current portion of the litigation charges related to our settlement with American Airlines.Revolver.
Based on the business environment in which we operate, we consider it a normal circumstance for us to operate with a negative working capital. A summary by segment is as follows:
| As of December 31, 2013 | ||||||||
| Accounts Receivable | DSO(1) | |||||||
| (Amounts in thousands) | ||||||||
Travel Network | $ | 200,454 | 40 | |||||
Airline and Hospitality Solutions | 153,286 | 79 | ||||||
Travelocity | 79,751 | 50 | ||||||
|
| |||||||
Total segment value | 433,491 | 51 | ||||||
|
| |||||||
Corporate | 797 | |||||||
|
| |||||||
Total Company | $ | 434,288 | ||||||
|
| |||||||
| (1) | Calculated as accounts receivable divided by average daily revenue for the year ended December 31, 2013. |
| As of December 31, 2013 | As of December 31, 2013 | |||||||||||||||||||||||||||||||||||||||
| Accounts Payable | Travel Supplier Liabilities | Accrued Incentive Consideration | Other Accrued Liabilities | Total Operating Liabilities | Accounts Payable | Travel Supplier Liabilities | Accrued Incentive Consideration | Other Accrued Liabilities | Total Operating Liabilities | |||||||||||||||||||||||||||||||
(Amounts in thousands) | (Amounts in thousands) | |||||||||||||||||||||||||||||||||||||||
Travel Network | $ | 59,091 | $ | — | $ | 142,767 | $ | 77,587 | $ | 279,445 | $ | 59,091 | $ | — | $ | 142,767 | $ | 77,587 | $ | 279,445 | ||||||||||||||||||||
Airline and Hospitality Solutions | 4,937 | — | — | 49,947 | 54,884 | 4,937 | — | — | 49,947 | 54,884 | ||||||||||||||||||||||||||||||
Travelocity(1) | 29,973 | 213,504 | — | 71,647 | 315,124 | 29,973 | 213,504 | — | 71,647 | 315,124 | ||||||||||||||||||||||||||||||
|
|
|
|
|
|
|
|
|
| |||||||||||||||||||||||||||||||
Total segments | 94,001 | 213,504 | 142,767 | 199,181 | 649,453 | 94,001 | 213,504 | 142,767 | 199,181 | 649,453 | ||||||||||||||||||||||||||||||
|
|
|
|
|
|
|
|
|
| |||||||||||||||||||||||||||||||
Corporate | 17,385 | — | — | 68,686 | 86,071 | 17,385 | — | — | 68,686 | 86,071 | ||||||||||||||||||||||||||||||
|
|
|
|
|
|
|
|
|
| |||||||||||||||||||||||||||||||
Total Company | $ | 111,386 | $ | 213,504 | $ | 142,767 | $ | 267,867 | $ | 735,524 | $ | 111,386 | $ | 213,504 | $ | 142,767 | $ | 267,867 | $ | 735,524 | ||||||||||||||||||||
|
|
|
|
|
|
|
|
|
| |||||||||||||||||||||||||||||||
| (1) |
Travel Network exhibits seasonal fluctuations in transaction volumes and working capital. Transactions are weighted towards the first nine months of the year, resulting in receivables growth outpacing payables and driving negative cash flows related to working capital. Transactions decrease significantly each year in the fourth quarter, primarily in December. We record a receivable at the date of booking and, because customers generally book their November and December holiday leisure-related travel earlier in the year and business-related travel also declines during the holiday season, receivables are typically lower in the fourth quarter. This results in receivables declining faster than payables and positive cash flows related to working capital during the fourth quarter.
We collect a portion of the receivables from airlines through the Airline Clearing House (“ACH”) and other similar clearing houses. ACH requires participants to deposit certain balances into their demand deposit accounts by certain deadlines which facilitates a timely settlement process. As of December 31, 2013, 2012 and 2011,
127
approximately 50%, 48% and 46%, respectively, of outstanding receivables for Travel Network were due from customers using ACH. Due in part to the proportion of receivables processed through ACH for Travel Network, such receivables are collected on average in 40 days.
Our Airline and Hospitality Solutions has a lower proportion of its receivables due from customers using ACH. As of December 31, 2013, 2012 and 2011, approximately 20%, 41% and 30%, respectively, of outstanding receivables for Airline and Hospitality Solutions were due from customers who use ACH. Receivables for Airline and Hospitality Solutions are collected on average in 79 days.
Airline and Hospitality Solution days sales outstanding can also be impacted by large upfront billings to new customers which are generally due at the initiation of a contract and result in deferred revenue. The timing of these billings is dependent on individual contractual terms.
Travelocity Working Capital.Travelocity’s working capital includes receivables from credit card transactions with customers, which are short in days sales outstanding, and receivables from advertisers on the Travelocity websites which have a longer days sales outstanding. Travelocity’s payables primarily include travel supplier liabilities, where we are the merchant of record for credit card processing for travel accommodations. We record the payable to the travel supplier and associated deferred revenue at the time the related travel is booked and paid by the consumer. This liability is not settled until the travel is consumed. In connection withSee “—Factors Affecting our Results and Comparability—Travelocity.”
Travelocity’s working capital has been impacted by the Expedia SMA and with the migrationsale of bookings from our technology platform to Expedia’s platform, thisTPN. As of September 30, 2014 and December 31, 2013, we had approximately $107 million and $214 million, respectively, in total travel supplier liabilities of which $23 million and $129 million, respectively, represents the liability will impact our working capitalto travel suppliers in connection with Travelocity.com and TPN. This liability is being extinguished as a result of the near termExpedia SMA and the sale of TPN as we continue to pay travel suppliers for the consumption of travel consumed that was bookedoriginated on our existing websites. However, becausetechnology platforms; however, we will no longer receive cash directly from consumers and will not incur a payable to travel suppliers for new bookings on our balance sheet. Subsequent to the Expedia SMA and the sale of TPN, our Travelocity-related working capital primarily consists of amounts attributable to lastminute.com balances as well as amounts due from Expedia offset by payables for marketing and labor related costs.
On September 30, 2013, Sabre GLBL entered into the Incremental Term Loan Facility in the amount of $350 million. Sabre GLBL has used a portion, and intends to use the remainder, of the proceeds of the Incremental Term Loan Facility for working capital and one-time costs associated with the Expedia SMA and sale of TPN, including the payment of travel suppliers for travel consumed that originated on our technology platforms, and for general corporate purposes. With respect to Travelocity-related working capital, we have used approximately $106 million for the payment of travel suppliers for travel consumed that originated on our technology platforms as described above. In addition, we have used cash of $11 million and $6 million from the Incremental Term Loan Facility during the nine months ended September 30, 2014 and year ended December 31, 2013, respectively, to pay for Travelocity restructuring activities associated with employee termination benefits and other related costs. We did not record any material restructuring charges in our balance sheets, this liability should have lessresults of an impact on our working capital.operations. See “—Factors Affecting our Results—Travelocity.“Description of Certain Indebtedness—Senior Secured Credit Facilities.”
128
The table below, which is derived from our consolidated statements of cash flows, shows the changes in our operating assets and liabilities during the years ended December 31, 2013, 2012 and 2011. For a detailed discussion of these changes, see “—Operating Activities” below.
| Year Ended December 31, | Year Ended December 31, | |||||||||||||||||||||||
| 2013 | 2012 | 2011 | 2013 | 2012 | 2011 | |||||||||||||||||||
(Amounts in thousands) | (Amounts in thousands) | |||||||||||||||||||||||
Accounts and other receivables | $ | (29,150 | ) | $ | (2,691 | ) | $ | (49,220 | ) | $ | (29,150 | ) | $ | (2,691 | ) | $ | (49,220 | ) | ||||||
Prepaid expenses and other current assets | (4,480 | ) | (3,374 | ) | 8,680 | (4,480 | ) | (3,374 | ) | 8,680 | ||||||||||||||
Capitalized implementation costs | (58,814 | ) | (78,543 | ) | (59,109 | ) | (58,814 | ) | (78,543 | ) | (59,109 | ) | ||||||||||||
Other assets | (64,259 | ) | (8,704 | ) | (52,817 | ) | (64,259 | ) | (8,704 | ) | (52,817 | ) | ||||||||||||
Accounts payable and other accrued liabilities | (31,064 | ) | 13,022 | 93,735 | (31,064 | ) | 13,022 | 93,735 | ||||||||||||||||
Pensions and other postretirement benefits | (2,579 | ) | (20,236 | ) | (9,306 | ) | (2,579 | ) | (20,236 | ) | (9,306 | ) | ||||||||||||
|
|
|
|
|
| |||||||||||||||||||
Changes in operating assets and liabilities | $ | (190,346 | ) | $ | (100,526 | ) | $ | (68,037 | ) | $ | (190,346 | ) | $ | (100,526 | ) | $ | (68,037 | ) | ||||||
|
|
|
|
|
| |||||||||||||||||||
We will reclassify and report all of the businesses associated with the Travelocity segment as discontinued operations in our 2014 Annual Report on Form 10-K following the sale of Travelocity.com and the receipt of a binding offer to acquire lastminute.com as the segment was considered held for sale as of December 31, 2014.
Capital Expenditures and Development Projects
Our Adjusted Capital Expenditures for the nine months ended September 30, 2014 and 2013 and the years ended December 31, 2013, 2012 and 2011 were as follows:
| Year Ended December 31, | Nine Months Ended September 30, | Year Ended December 31, | ||||||||||||||||||||||||||||||
| 2013 | 2012 | 2011 | 2014 | 2013 | 2013 | 2012 | 2011 | |||||||||||||||||||||||||
| (Amounts in thousands) | (Amounts in thousands) | |||||||||||||||||||||||||||||||
Additions to property and equipment | $ | 226,026 | $ | 193,262 | $ | 164,638 | $ | 160,385 | $ | 168,744 | $ | 226,026 | $ | 193,262 | $ | 164,638 | ||||||||||||||||
Capitalized implementation costs | 58,814 | 78,543 | 59,109 | 27,602 | 48,686 | 58,814 | 78,543 | 59,109 | ||||||||||||||||||||||||
|
|
|
|
|
|
|
| |||||||||||||||||||||||||
Adjusted Capital Expenditures | $ | 284,840 | $ | 271,805 | $ | 223,747 | $ | 187,987 | $ | 217,430 | $ | 284,840 | $ | 271,805 | $ | 223,747 | ||||||||||||||||
|
|
|
|
|
|
|
| |||||||||||||||||||||||||
As a percentage of revenue: | ||||||||||||||||||||||||||||||||
Additions to property and equipment | 7.4 | % | 6.5 | % | 5.8 | % | 7.2 | % | 7.3 | % | 7.4 | % | 6.5 | % | 5.8 | % | ||||||||||||||||
Capitalized implementation costs | 1.9 | % | 2.6 | % | 2.1 | % | 1.2 | % | 2.1 | % | 1.9 | % | 2.6 | % | 2.1 | % | ||||||||||||||||
|
|
|
|
|
|
|
| |||||||||||||||||||||||||
Adjusted Capital Expenditures | 9.3 | % | 9.1 | % | 7.8 | % | 8.4 | % | 9.4 | % | 9.3 | % | 9.1 | % | 7.8 | % | ||||||||||||||||
|
|
|
|
|
|
|
| |||||||||||||||||||||||||
Capitalized costs associated with software developed for internal use represent a significant portion of additions to property and equipment, as we have focused our development resources on developing and enhancing our GDS and our SaaS and hosted systems. Software developed for internal use includes costs incurred to develop or obtain applications, infrastructure and graphics development for our GDS, our SaaS and
hosted systems and our websites. Capitalized implementation costs are upfront costs we incur related to the implementation of new customer contracts under our SaaS and hosted revenue model. In our financial statements, additions to property and equipment are included in Cash flows from investing activities while Capitalized implementation costs are included in Cash flows from operating activities. Development-related costs that were expensed as incurred totaled $284 million, $258 million and $250 million for the years ended December 31, 2013, 2012 and 2011, respectively. Research and development costs approximated $6 million, $4 million and $3 million for the years ended December 31, 2013, 2012 and 2011, respectively. See Note 2, Summary of Significant Accounting Policies, to our audited consolidated financial statements included elsewhere in this prospectus.
Undistributed Earnings from Foreign Subsidiaries
We consider the undistributed earnings of our foreign subsidiaries as of December 31, 2013 to be indefinitely reinvested and, accordingly, no U.S. income taxes have been provided thereon. As of December 31,
129
2013, the amount of indefinitely reinvested foreign earnings was approximately $157 million. As of December 31, 2013, $71 million of cash, cash equivalents, and marketable securities were held by our foreign subsidiaries. If such cash, cash equivalents and marketable securities are needed for our operations in the United States, we would be required to accrue and pay taxes on up to $44 million of these funds to repatriate all such cash, cash equivalents and marketable securities. We have not, nor do we anticipate the need to, repatriate funds to the United States to satisfy domestic liquidity needs arising in the ordinary course of business, including liquidity needs associated with our domestic debt service requirements. If these funds are needed to satisfy domestic liquidity needs, we would be required to accrue and pay U.S. taxes to repatriate them.
Future Minimum Contractual Obligations
As of December 31, 2013, future minimum payments required under our senior secured credit facilities, senior unsecured notes due 2016 Notes and senior secured notes due 2019 Notes and other indebtedness, the Mortgage Facility (as defined in “Description of Certain Indebtedness”),mortgage facility, operating lease agreements with terms in excess of one year for facilities, equipment and software licenses and other significant contractual cash obligations were as follows:
| Payments Due by Period | Payments Due by Period | |||||||||||||||||||||||||||||||||||||||||||||||||||||||
Contractual Obligations | 2014 | 2015 | 2016 | 2017 | 2018 | Thereafter | Total | 2014 | 2015 | 2016 | 2017 | 2018 | Thereafter | Total | ||||||||||||||||||||||||||||||||||||||||||
| (Amounts in thousands) | (Amounts in thousands) | |||||||||||||||||||||||||||||||||||||||||||||||||||||||
Total debt(1) | $ | 320,662 | $ | 315,929 | $ | 726,845 | $ | 360,459 | $ | 244,391 | $ | 2,855,934 | $ | 4,824,220 | $ | 320,662 | $ | 315,929 | $ | 726,845 | $ | 360,459 | $ | 244,391 | $ | 2,855,934 | $ | 4,824,220 | ||||||||||||||||||||||||||||
Mortgage Facility(2) | 5,984 | 5,984 | 5,984 | 80,895 | — | — | 98,847 | |||||||||||||||||||||||||||||||||||||||||||||||||
Headquarters mortgage(2) | 5,984 | 5,984 | 5,984 | 80,895 | — | — | 98,847 | |||||||||||||||||||||||||||||||||||||||||||||||||
Operating lease obligations(3) | 31,450 | 27,217 | 23,363 | 15,435 | 9,668 | 25,789 | 132,922 | 31,450 | 27,217 | 23,363 | 15,435 | 9,668 | 25,789 | 132,922 | ||||||||||||||||||||||||||||||||||||||||||
IT outsourcing agreement(4) | 165,983 | 156,492 | 135,307 | 99,305 | — | — | 557,087 | 165,983 | 156,492 | 135,307 | 99,305 | — | — | 557,087 | ||||||||||||||||||||||||||||||||||||||||||
Purchase orders(5) | 137,456 | 2,146 | 1,565 | — | — | — | 141,167 | 137,456 | 2,146 | 1,565 | — | — | — | 141,167 | ||||||||||||||||||||||||||||||||||||||||||
Letters of credit(6) | 65,238 | 128 | 1,621 | — | — | 151 | 67,138 | 65,238 | 128 | 1,621 | — | — | 151 | 67,138 | ||||||||||||||||||||||||||||||||||||||||||
WNS agreement(7) | 23,777 | 24,910 | — | — | — | — | 48,687 | 23,777 | 24,910 | — | — | — | — | 48,687 | ||||||||||||||||||||||||||||||||||||||||||
Other purchase obligations(8) | 39,175 | — | — | — | — | — | 39,175 | 39,175 | — | — | — | — | — | 39,175 | ||||||||||||||||||||||||||||||||||||||||||
Unrecognized tax benefits(9) | — | — | — | — | — | — | 66,620 | — | — | — | — | — | — | 66,620 | ||||||||||||||||||||||||||||||||||||||||||
|
|
|
|
|
|
|
|
|
|
|
|
|
| |||||||||||||||||||||||||||||||||||||||||||
Total contractual cash obligations(10) | $ | 789,725 | $ | 532,806 | $ | 894,685 | $ | 556,094 | $ | 254,059 | $ | 2,881,874 | $ | 5,975,863 | $ | 789,725 | $ | 532,806 | $ | 894,685 | $ | 556,094 | $ | 254,059 | $ | 2,881,874 | $ | 5,975,863 | ||||||||||||||||||||||||||||
|
|
|
|
|
|
|
|
|
|
|
|
|
| |||||||||||||||||||||||||||||||||||||||||||
| (1) | Includes all interest and principal related to the 2016 Notes and 2019 Notes. Also |
| (2) | Includes all interest and principal related to our $85 million Mortgage Facility, which matures on March 1, 2017. See Note 11, Debt, to our audited consolidated financial statements included elsewhere in this prospectus. |
| (3) | We lease approximately two million square feet of office space in 97 locations in 47 countries. Lease payment escalations are based on fixed annual increases, local consumer price index changes or market rental reviews. We have renewal options of various term lengths at 65 locations, and we have no purchase options and no restrictions imposed by our leases concerning dividends or additional debt. |
| (4) | Represents minimum amounts due to HP under the terms of an outsourcing agreement through which HP manages a significant portion of our information technology systems. |
| (5) | Purchase obligations represent an estimate of all open purchase orders and contractual obligations in the ordinary course of business for which we have not received the goods or services as of December 31, 2013. |
130
| Although open purchase orders are considered enforceable and legally binding, the terms generally allow us the option to cancel, reschedule and adjust our requirements based on our business needs prior to the delivery of goods or performance of services. |
| (6) | Our letters of credit consist ofstand-by letters of credit, underwritten by a group of lenders, which we primarily issue for certain regulatory purposes as well as to certain hotel properties to secure our payment for hotel room transactions. The contractual expiration dates of these letters of credit are shown in the table above. There were no claims made against anystand-by letters of credit during the years ended December 31, 2013, 2012 and 2011. |
| (7) |
| (8) |
| (9) | Unrecognized tax benefits include associated interest and penalties. The timing of related cash payments for substantially all of these liabilities is inherently uncertain because the ultimate amount and timing of such liabilities is affected by factors which are variable and outside our control. |
| (10) | Excludes pension obligations (see Note 9, Pension and Other Postretirement Benefit Plans, to our audited consolidated financial statements included elsewhere in this prospectus), the Redemption and payments to the Pre-IPO Existing Stockholders under the TRA. |
Cash Investments
We consider cash equivalentsOn February 20, 2014, we entered into the Repricing Amendments, one of which reduced the Term Loan B’s applicable margin for Eurocurrency and Base rate borrowings to be highly liquid investments that are readily convertible into cash. Securities3.25% and 2.25%, respectively, with contractual maturitiesa step down to 3.00% and 2.00%, respectively, if the Senior Secured Leverage Ratio is less than or equal to 3.25 to 1.00. It also reduced the Eurocurrency rate floor to 1.00% and the Base rate floor to 2.00%. In the second quarter of three months or less, when purchased, are considered cash equivalents. We record changes in2014, we used the proceeds from our initial public offering to repay (i) $296 million aggregate principal amount of our Term Loan C (see “—Senior Secured Credit Facilities”) and (ii) $320 million aggregate principal amount of our senior secured notes due 2019 at a book overdraft position, in which our bank account is not overdrawn but recently issued and outstanding checks result in a negative general ledger balance, as cash flows from financing activities.
We invest in a money market fund which is classified as cash and cash equivalents in our consolidated balance sheets and statementsredemption price of cash flows.
We held no short-term investments as108.5% of December 31, 2013, 2012 and 2011.
Financing Arrangements
Our financing arrangements includethe principal amount. As of September 30, 2014, future minimum payments required under our senior secured credit facilities, senior secured notes due 2019, unsecured notes due 2016 and asenior secured notes due 2019 were as follows:
| Total Debt Payments(1) | ||||
Three months ending December 31, 2014 | $ | 47,522 | ||
2015 | 181,840 | |||
2016 | 576,329 | |||
2017 | 228,384 | |||
2018 | 180,253 | |||
Thereafter | 2,516,077 | |||
|
| |||
Total | $ | 3,730,405 | ||
|
| |||
| (1) | Excludes all interest and principal related to our mortgage facility. Includes all interest and principal related to the senior unsecured notes due 2016 and the senior secured notes due 2019. Also includes all interest and principal related to borrowings under the senior secured credit facility, the Term Loan C portion of which will mature in 2017, the Term Loan B portion of which will mature in 2019 and the Incremental Term Loan Facility portion of which will mature in 2019. Under certain circumstances, we may be required to pay a percentage of the excess cash flow, if any, generated each year to our lenders which obligation is not reflected in the table above. Interest on the term loan is based on LIBOR plus an applicable margin and includes the effect of interest rate swaps. For purposes of this table, we have used projected LIBOR rates for all future periods. See Note 7, Debt, to our unaudited consolidated financial statements included elsewhere in this prospectus. |
131
Immediately prior to the closing of our initial public offering, we entered into the TRA. Based on current tax laws and assuming that we and our subsidiaries earn sufficient taxable income to realize the full tax benefits subject to the TRA, (i) we expect that future payments under the TRA relating to the Pre-IPO Tax Assets could aggregate to between $330 million and $380 million over the next six years (assuming no changes to current limitations on our ability to utilize our NOLs under Section 382 of the Code), which we estimate will represent approximately 85% to 95% of the total payments we will be required to make under the TRA and (ii) we do not expect material payments to occur before 2016. Payments to the recipients under the TRA are not conditioned upon the recipient continuing to be an equity holder in the Company.
As of September 30, 2014, purchase orders for the next twelve months totaled $143 million and were not material in the years thereafter. There were no other material changes to our future minimum contractual obligations as of December 31, 2013, 2012 and 2011, the outstanding balances for our financing arrangements were as stated below.2013.
| December 31, | ||||||||||||||||
| Rate* | Maturity | 2013 | 2012 | 2011 | ||||||||||||
| (Amounts in thousands) | ||||||||||||||||
Senior secured credit facility: | ||||||||||||||||
Term B facility | L+4.00%(1) | February 2019 | $ | 1,747,378 | $ | — | $ | — | ||||||||
Incremental term loan facility | L+3.50% | February 2019 | 349,125 | — | — | |||||||||||
Term C facility | L+3.00% | December 2017 | 360,477 | — | — | |||||||||||
Revolving facility | L+3.75%(1) | February 2018 | — | — | 82,000 | |||||||||||
Initial term loan facility | L+5.75% | September 2014 | — | — | 800,000 | |||||||||||
Initial term loan facility | L+2.00% | September 2014 | — | 238,335 | 2,071,788 | |||||||||||
First extended term loan facility | L+5.75% | September 2017 | — | 1,162,622 | — | |||||||||||
Second extended term loan facility | L+5.75% | December 2017 | — | 401,515 | — | |||||||||||
Incremental term facility | L+6.00% | December 2017 | — | 370,536 | — | |||||||||||
Senior unsecured notes due 2016 | 8.350% | March 2016 | 389,321 | 385,099 | 381,267 | |||||||||||
Senior secured notes due 2019 | 8.500% | May 2019 | 799,823 | 801,712 | — | |||||||||||
Mortgage facility | 5.800% | March 2017 | 83,541 | 84,340 | 85,000 | |||||||||||
|
|
|
|
|
| |||||||||||
Total debt | $ | 3,729,665 | $ | 3,444,159 | $ | 3,420,055 | ||||||||||
|
|
|
|
|
| |||||||||||
Current portion of debt | $ | 86,117 | $ | 23,232 | $ | 112,150 | ||||||||||
Long-term debt | 3,643,548 | 3,420,927 | 3,307,905 | |||||||||||||
|
|
|
|
|
| |||||||||||
Total debt | $ | 3,729,665 | $ | 3,444,159 | $ | 3,420,055 | ||||||||||
|
|
|
|
|
| |||||||||||
Cash Flows
| Year Ended December 31, | Nine months ended September 30, | Year Ended December 31, | ||||||||||||||||||||||||||||||
| 2013 | 2012 | 2011 | 2014 | 2013 | 2013 | 2012 | 2011 | |||||||||||||||||||||||||
| (Amounts in thousands) | (Amounts in thousands) | |||||||||||||||||||||||||||||||
Cash provided by operating activities | $ | 157,188 | $ | 312,336 | $ | 356,444 | $ | 121,679 | $ | 252,062 | $ | 157,188 | $ | 312,336 | $ | 356,444 | ||||||||||||||||
Cash used in investing activities | (246,502 | ) | (236,034 | ) | (176,260 | ) | (191,949 | ) | (189,220 | ) | (246,502 | ) | (236,034 | ) | (176,260 | ) | ||||||||||||||||
Cash provided by (used in) financing activities | 262,172 | (25,120 | ) | (271,540 | ) | |||||||||||||||||||||||||||
Cash provided by (used in) discontinued operations | 6,400 | 12,845 | (29,791 | ) | ||||||||||||||||||||||||||||
Cash (used in) provided by financing activities | (59,289 | ) | 274,717 | 262,172 | (25,120 | ) | (271,540 | ) | ||||||||||||||||||||||||
Cash (used in) provided by discontinued operations | (21,664 | ) | 26,854 | 6,400 | 12,845 | (29,791 | ) | |||||||||||||||||||||||||
Effect of exchange rate changes on cash and cash equivalents | 2,283 | 4,318 | 2,976 | 734 | 480 | 2,283 | 4,318 | 2,976 | ||||||||||||||||||||||||
|
|
|
|
|
|
|
| |||||||||||||||||||||||||
Increase (decrease) in cash and cash equivalents | $ | 181,541 | $ | 68,345 | $ | (118,171 | ) | |||||||||||||||||||||||||
(Decrease) increase in cash and cash equivalents | $ | (150,489 | ) | $ | 364,893 | $ | 181,541 | $ | 68,345 | $ | (118,171 | ) | ||||||||||||||||||||
|
|
|
|
|
|
|
| |||||||||||||||||||||||||
Operating Activities
Cash provided by operating activities for the nine months ended September 30, 2014 was $122 million and consisted of net income of $25 million, adjustments for non-cash and other items of $342 million and a decrease in cash from changes in operating assets and liabilities of $245 million. The adjustments for non-cash and other items consist primarily of $230 million of depreciation and amortization, $34 million loss on extinguishment of debt, $33 million in amortization of upfront incentive consideration, $22 million stock-based compensation expense and $8 million of losses from discontinued operations, partially offset by $9 million of joint venture equity income. The decrease in cash from changes in operating assets and liabilities of $245 million was primarily the result of a $58 million increase in accounts receivable due to seasonality, $58 million increase in other assets primarily due to a $50 million payment made to American Airlines in conjunction with the new Airlines Solutions contract, $32 million used for upfront incentive consideration, $28 million used for capitalized implementation costs, a $32 million decrease in accounts payable and other accrued liabilities and a $23 million decrease in accrued compensation and related benefits. The decrease in accounts payable and other accrued liabilities was due to the payment of travel supplier liabilities for Travelocity North America of $106 million as a result of the change in Travelocity’s business model and sale of TPN, partially offset by an increase in deferred revenue and trade payables.
Cash provided by operating activities for the nine months ended September 30, 2013 was $252 million and consisted of net loss of $125 million, adjustments for non-cash and other items of $436 million and a decrease in cash of $58 million from changes in operating assets and liabilities. The adjustments for non-cash and other items consist primarily of $230 million of depreciation and amortization, $138 million of goodwill impairment charges, $29 million in amortization of upfront incentive consideration, $14 million of debt modification costs, $12 million of loss on extinguishment of debt and $21 million of losses from discontinued operations, partially offset by $19 million of deferred taxes. The decrease in cash of $58 million from changes in operating assets and
132
liabilities was primarily the result of an increase in other assets of $63 million due to increases in deferred customer discounts, $49 million used for capitalized implementation costs, an increase of $46 million in accounts receivables in all of our segments due to seasonality and $27 million used for upfront incentive consideration. These decreases were partially offset by an increase of $110 million in accounts payable and other accrued liabilities primarily due to seasonality in travel supplier liabilities.
Cash provided by operating activities for the year ended December 31, 2013 was $157 million and consisted of net loss of $98 million, adjustments for non-cash and other items of $445 million and a decrease in cash from changes in operating assets and liabilities of $190 million. The adjustments for non-cash and other items consist primarily of $308 million of depreciation and amortization, $138 million of impairment charges and $4 million in restructuring charges, partially offset by $65 million of deferred income taxes and $16 million of joint venture
equity income. The decrease in cash from changes in operating assets and liabilities of $190 million was primarily the result of a $64 million increase in other assets due to increases in deferred customer discounts and deferred upfront incentive consideration, $59 million used for capitalized implementation costs, a $31 million decrease in accounts payable and accrued liabilities due to a $100 million litigation settlement payment that was partially offset by an increase in restructuring related accruals and other accrued liabilities, and a $29 million increase in accounts receivable due to the timing of collections.
Cash provided by operating activities for the year ended December 31, 2012 was $312 million and consisted of net loss of $671 million, adjustments for non-cash and other items of $1,083 million and a decrease in cash of $101 million from changes in operating assets and liabilities. The adjustments for non-cash and other items consist primarily of $573 million of impairment charges, $345 million of litigation charges, $316 million of depreciation and amortization, and $49 million of losses from discontinued operations, partially offset by $232 million of deferred taxes. The decrease in cash of $101 million from changes in operating assets and liabilities was primarily the result of $79 million used for capitalized implementation costs and $20 million used for pension and other postretirement benefits. These decreases were partially offset by an increase of $13 million in accounts payable and accrued liabilities.
Cash provided by operating activities for the year ended December 31, 2011 was $356 million and consisted of net loss of $103 million, adjustments for non-cash and other items of $527 million and a decrease in cash of $68 million from changes in operating assets and liabilities. The adjustments for non-cash and other items consist primarily of $293 million of depreciation and amortization, $185 million of impairment charges, and $34 million of deferred taxes, partially offset by $27 million of joint venture equity income. The decrease in cash of $68 million from changes in operating assets and liabilities was primarily the result of $59 million used for capitalized implementation costs and a $49 million increase in accounts receivable due to higher revenue and the timing of collections, partially offset by an increase of $94 million in accounts payable and accrued liabilities which was primarily the due to the timing of vendor payments.
Investing Activities
For the nine months ended September 30, 2014, we used cash of $160 million on capital expenditures, including $134 million related to software developed for internal use, $7 million related to software developed for sale and $19 million related to purchases of property, plant and equipment.
For the nine months ended September 30, 2013, we used cash of $169 million on capital expenditures, including $144 million related to software developed for internal use and $24 million related to purchases of property, plant and equipment. In addition, we paid contingent consideration of $27 million related to the acquisition of PRISM in 2012 and we received $10 million in proceeds from the sale of TBiz.
For the year ended December 31, 2013, we used cash of $247 million for investing activities. Significant highlights of our investing activities included:
133
For the year ended December 31, 2012, we used cash of $236 million for investing activities. Significant highlights of our investing activities included:
For the year ended December 31, 2011, we used cash of $176 million for investing activities. Significant highlights of our investing activities included:
Financing Activities
Immediately prior to the completionclosing of this offer,our initial public offering, we will enterentered into the TRA. Based on current tax laws and assuming that we and our subsidiaries earn sufficient taxable income to realize the full tax benefits subject to the TRA, which provides the right to receive(i) we expect that future payments by usunder the TRA relating to our Existing Stockholders of 85% of the amount of cash savings, if any, in U.S. federal income tax that we realize (or are deemed to realize in the case of a change of control or certain other transactions) as a result of the utilization of our and our subsidiaries’ Pre-IPO Tax Assets. We expectAssets could aggregate to pay between $$330 million and $$380 million in cash related to this agreement over the next fivesix years based(assuming no changes to current limitations on our current taxable income estimates,ability to utilize our NOLs under Section 382 of the Code), which we estimate will represent approximately 85% to 95% of the total payments we will be required to make under the TRA and will record a liability of $ million (estimated as of March 31, 2014) on our consolidated balance sheet for 85% of our Pre-IPO Tax Assets. We(ii) we do not expect material payments related to this agreement to occur before 2016. Payments to the recipients under the TRA are not conditioned upon the recipient continuing to be an equity holder in the Company.
Different timing rules will apply to payments under the TRA to be made to Pre-IPO Award Holders. Such payments will generally be deemed invested in a notional account rather than made on the scheduled payment dates, and the account will be distributed on the fifth anniversary of the initial public offering, together with an amount equal to the net present value of such Award Holder’s future expected payments, if any, under the TRA. Moreover, payments to holders of pre-IPO unvested stock options will bethat were unvested prior to the completion of our initial public offering are subject to vesting on the same schedule as thesuch holder’s unvested stock options.
For the nine months ended September 30, 2014, we used $59 million for financing activities. Significant highlights of our financing activities include:
134
For the nine months ended September 30, 2013, we generated $275 million from financing activities. Significant highlights of our financing activities included:
For the year ended December 31, 2013, we had a $262 million cash inflow for financing activities. Significant highlights of our financing activities included:
For the year ended December 31, 2012, we used $25 million for financing activities. Significant highlights of our financing activities included:
For the year ended December 31, 2011, we used $272 million for financing activities. We paid down $324 million of principal on our unsecured notes which matured on August 1, 2011, we repaid $30 million under the senior secured notes and on a net basis, and we borrowed $82 million under the Revolving Facility.Revolver.
Off Balance Sheet Arrangements
We had no off balance sheet arrangements during the nine months ended September 30, 2014 and years ended December 31, 2013, 2012 and 2011.
Recent Accounting Pronouncements
In February 2013,August 2014, the Financial Accounting Standards Board (“FASB”) issued guidance on management’s responsibility in the evaluation and disclosures of going-concern uncertainties in the financial statements. The new standard requires management to perform interim and annual assessments of the company’s ability to continue as a going concern within one year of the date the financial statements are issued. If substantial doubt
135
exists in the company’s ability to continue as a going concern, certain disclosures are required to be provided. The standard is effective for annual periods ending after December 15, 2016, and interim periods thereafter, with early adoption permitted. We do not believe that the adoption will have a material impact on our consolidated financial statements.
In June 2014, the FASB issued final guidance that a performance target in a share-based payment that affects vesting and that could be achieved after the requisite service period should be accounted for as a performance condition. The guidance was issued to resolve diversity in practice. The standard is effective for annual and interim reporting periods beginning after December 15, 2015. We do not believe that the adoption will have a material impact on our consolidated financial statements.
In May 2014, the FASB issued a comprehensive update to revenue recognition guidance that will replace current standards. Under the updated standard, revenue is recognized when a company transfers promised goods or services to customers in an amount that reflects the consideration that is expected to be received for those goods and services. The updated standard also requires additional disclosures on the nature, timing, and uncertainty of revenue and related cash flows. The standard is effective for annual and interim reporting periods beginning after December 15, 2016. We are currently evaluating the impact this standard will have on our consolidated financial statements.
In April 2014, the FASB issued updated guidance that raises the threshold for disposals to qualify as discontinued operations and allows companies to have significant continuing involvement and continuing cash flows with the discontinued operations. The standard also requires additional disclosures for discontinued operations and new disclosures for individually material disposal transactions that do not meet the definition of a discontinued operation. The standard is effective for annual and interim reporting periods beginning in 2015. Early adoption is permitted in certain circumstances. We do not believe that the adoption will have a material impact on our consolidated financial statements.
In February 2013, the FASB issued guidance regarding the reporting of amounts reclassified out of accumulated other comprehensive income (“OCI”) to net income. The standard requires companies to disclose the individual income statement line items in which the accumulated other comprehensive income amounts have been reclassified. Additionally, a tabular reconciliation of amounts recorded to other comprehensive income for the period is required. We have incorporated the new disclosure guidance on the reclassification of accumulated other comprehensive income into the footnotes to our consolidated financial statements.
In January 2013, the FASB issued updated guidance on when it is appropriate to reclassify currency translation adjustments (“CTA”) into earnings. This guidance is intended to reduce the diversity in practice in accounting for CTA when an entity ceases to have a controlling interest in a subsidiary group or group of assets that is a business within a foreign entity and when there is a loss of a controlling financial interest in a foreign entity or a step acquisition. The standard is effective for annual and interim reporting periods for fiscal years beginning after December 15, 2013. We doThe adoption of this guidance did not believe that the adoption will have a material impact on our consolidated financial statements.
In December 2011, the FASB issued guidance enhancing the disclosure requirements about the nature of an entity’s right to offset and related arrangements associated with its financial and derivative instruments. The new guidance requires the disclosure of the gross amounts subject to rights of set-off, amounts offset in accordance with the accounting standards followed, and related net exposure. In January 2013, the FASB issued revised guidance clarifying that the scope of this guidance applies to derivatives, including bifurcated embedded derivatives, repurchase agreements and reverse repurchase agreements, and securities borrowing and lending transactions that are either offset or subject to an enforceable master netting arrangement, or similar arrangement. Our adoption of this guidance did not have a material impact on our consolidated financial statements.
136
Critical Accounting Policies
This discussion and analysis of our financial condition and results of operations is based on our consolidated financial statements, which have been prepared in accordance with GAAP. The preparation of these financial statements requires us to make estimates and judgments that affect our reported assets and liabilities, revenues and expenses and other financial information. Actual results may differ significantly from these estimates, and our reported financial condition and results of operations could vary under different assumptions and conditions. In addition, our reported financial condition and results of operations could vary due to a change in the application of a particular accounting standard.
Our accounting policies that include significant estimates and assumptions include: (i) estimation of the revenue recognition for software development, (ii) collectability of accounts receivable, (iii) amounts for future cancellations of bookings processed through our GDS, (iv) determination of the fair value of assets and liabilities acquired in a business combination, (v) determination of the fair value of derivatives, (vi) determination of the fair value of our stock and related stock compensation expense, (vii) the evaluation of the recoverability of the carrying value of intangible assets and goodwill, (viii) assumptions utilized in the determination of pension and other postretirement benefit liabilities, (ix) assumptions made in the calculation of restructuring liabilities and (x) the evaluation of uncertainties surrounding the calculation of our tax assets and liabilities. We regard an accounting estimate underlying our financial statements as a “critical accounting estimate” if the accounting estimate requires us to make assumptions about matters that are uncertain at the time of estimation and if changes in the estimate are reasonably likely to occur and could have a material effect on the presentation of financial condition, changes in financial condition, or results of operations.
We have included below a discussion of the accounting policies involving material estimates and assumptions that we believe are most critical to the preparation of our financial statements, how we apply such policies and how results differing from our estimates and assumptions would affect the amounts presented in our financial statements. We have discussed the development, selection and disclosure of these accounting policies with our audit committee. Although we believe these policies to be the most critical, other accounting policies also have a significant effect on our financial statements and certain of these policies also require the use of estimates and assumptions. For further information about our significant accounting policies, see Note 2, Summary of Significant Accounting Policies, to our audited consolidated financial statements included elsewhere in this prospectus.
SaaS and Hosted Revenue Model
Our revenue recognition for Airline and Hospitality Solutions includes SaaS and hosted transactions which are sometimes sold as part of agreements which also require us to provide consulting and implementation services. Due to the multiple element arrangement, revenue recognition sometimes involves judgment, including estimates of the selling prices of goods and services, assessments of the likelihood of nonpayment and estimates of total costs and costs to complete a project.
The consulting and implementation services are generally performed in the early stages of the agreements. We evaluate revenue recognition for agreements with customers which generally are represented by individual contracts but could include groups of contracts if the contracts are executed at or near the same time. Typically, our consulting services are separated from the implementation and software hosting services. We account for separable elements on an individual basis with value assigned to each element based on its relative selling price. A comprehensive market analysis is performed on an annual basis to determine the range of selling prices for each product and service. In making these judgments we analyze various factors, including competitive landscapes, value differentiators, continuous monitoring of market prices, customer segmentation and overall market and economic conditions. Based on these results, estimated selling prices are set for each product and service delivered to customers. Changes in judgments related to these items, or deterioration in industry or general economic conditions, could materially impact the timing and amount of revenue and costs recognized. The revenue for consulting services is generally recognized as the services are performed, and the revenue for the implementation and the SaaS and hosted services is recognized ratably over the term of the agreement.
137
Accounts Receivable and Air Booking Cancellation Reserve
We evaluate the collectability of our accounts receivable based on a combination of factors. In circumstances where we are aware of a specific customer’s inability to meet its financial obligations to us (e.g., bankruptcy filings, failure to pay amounts due to us or others), we record a specific reserve for bad debts against amounts due to reduce the net recorded receivable to the amount we reasonably believe will be collected. For all other customers, we record reserves for bad debts based on past write-off history (average percentage of receivables written off historically) and the length of time the receivables are past due.
Transaction revenue for airline travel reservations is recognized by Travel Network at the time of the booking of the reservation, net of estimated future cancellations. Cancellations prior to the day of departure are estimated based on the historical level of cancellations rates, adjusted to take into account any recent factors which could cause a change in those rates. In circumstances where expected cancellation rates or booking behavior changes, our estimates are revised, and in these circumstances, future cancellation rates could vary materially, with a corresponding variation in revenue net of estimated future cancellations. Factors that could have a significant effect on our estimates include global security issues, epidemics or pandemics, natural disasters, general economic conditions, the financial condition of travel suppliers, and travel related accidents.
Business Combinations
Authoritative guidance for business combinations requires us to recognize separately from goodwill the assets acquired and the liabilities assumed at their acquisition date fair values. Goodwill as of the acquisition date
is measured as the excess of consideration transferred over the net of the acquisition date fair values of the assets acquired and the liabilities assumed. While we use our best estimates and assumptions to accurately value assets acquired and liabilities assumed at the acquisition date as well as contingent consideration, where applicable, our estimates are inherently uncertain and, as a result, actual results may differ from estimates.
Accounting for business combinations requires our management to make significant estimates and assumptions, especially at the acquisition date including our estimates for intangible assets, contractual obligations assumed, pre-acquisition contingencies and contingent consideration, where applicable. Although we believe the assumptions and estimates we have made in the past have been reasonable and appropriate, they are based in part on historical experience and information obtained from the management of the acquired companies and are inherently uncertain.
Examples of critical estimates in valuing certain of the intangible assets we have acquired include, but are not limited to: future expected cash flows from software sales through the SaaS model, support agreements, consulting contracts, other customer contracts, acquired developed technologies and patents; the acquired company’s brand and competitive position, as well as assumptions about the period of time the acquired brand will continue to be used in the combined company’s product portfolio; and discount rates. Unanticipated events and circumstances may occur that may affect the accuracy or validity of such assumptions, estimates or actual results.
For a given acquisition, we may identify certain pre-acquisition contingencies as of the acquisition date and may extend our review and evaluation of these pre-acquisition contingencies throughout the measurement period in order to obtain sufficient information to assess whether we include these contingencies as a part of the fair value estimates of assets acquired and liabilities assumed and, if so, to determine their estimated amounts. If we cannot reasonably determine the fair value of a pre-acquisition contingency (non-income tax related) by the end of the measurement period, which is generally the case given the nature of such matters, we will recognize an asset or a liability for such pre-acquisition contingency if: (i) it is probable that an asset existed or a liability had been incurred at the acquisition date and (ii) the amount of the asset or liability can be reasonably estimated. Subsequent to the measurement period, changes in our estimates of such contingencies will affect earnings and could have a material effect on our results of operations and financial position.
138
Depending on the circumstances, the fair value of contingent consideration is determined based on management’s best estimate of fair value given the specific facts and circumstances of the contractual arrangement, considering the likelihood of payment, payment terms and management’s best estimates of future performance results on the acquisition date, if applicable.
In addition, uncertain tax positions and tax related valuation allowances assumed in connection with a business combination are initially estimated as of the acquisition date. We reevaluate these items quarterly based upon facts and circumstances that existed as of the acquisition date with any adjustments to our preliminary estimates being recorded to goodwill if identified within the measurement period. Subsequent to the measurement period or our final determination of the tax allowance’s or contingency’s estimated value, whichever comes first, changes to these uncertain tax positions and tax-related valuation allowances will affect our provision for income taxes in our consolidated statement of operations and could have a material impact on our results of operations and financial position.
Goodwill and Long-Lived Assets
We evaluate goodwill for impairment on an annual basis or when impairment indicators exist. We begin our evaluation with a qualitative assessment of whether it is more likely than not that a reporting unit’s fair value is less than its carrying value before applying the two-step goodwill impairment model described below. If it is determined through the qualitative assessment that a reporting unit’s fair value is more likely than not greater than its carrying value, the remaining impairment steps are unnecessary. Otherwise, we perform a comparison of
the estimated fair value of the reporting unit to which the goodwill has been assigned to the sum of the carrying value of the assets and liabilities of that unit. If the sum of the carrying value of the assets and liabilities of a reporting unit exceeds the estimated fair value of that reporting unit, the carrying value of the reporting unit’s goodwill is reduced to its implied fair value through an adjustment to the goodwill balance, resulting in an impairment charge. Goodwill was assigned to each reporting unit based on that reporting unit’s percentage of enterprise value as of the date of the acquisition of Sabre Corporation (formerly known as Sovereign Holdings, Inc.) by TPG and Silver Lake plus goodwill associated with acquisitions since that time. We have identified six reporting units which include Travelocity—North America, Travelocity—Europe, Travelocity—Asia Pacific, Travel Network, Airline Solutions and Hospitality Solutions. The Travelocity—Asia Pacific reporting unit was sold in 2012.
The fair values used in our evaluation are estimated using a combined approach based upon discounted future cash flow projections and observed market multiples for comparable businesses. The cash flow projections are based upon a number of assumptions, including risk-adjusted discount rates, future booking and transaction volume levels, future price levels, rates of growth in our consumer and corporate direct booking businesses and rates of increase in operating expenses, cost of revenue and taxes. Additionally, in accordance with authoritative guidance on fair value measurements, we made a number of assumptions, including assumptions related to market participants, the principal markets and highest and best use of the reporting units. We have recognized goodwill impairment charges of $136 million, $129 million, and $183$185 million for the years ended December 31, 2013, 2012 and 2011, respectively. The goodwill impairment charges were associated with Travelocity which has no remaining goodwill as of December 31, 2013. Goodwill related to our other reporting units was $2,138 million as of December 31, 2013. Changes in the assumptions used in our impairment testing may result in future impairment losses which could have a material impact on our results of operations. A change of 10% in the future cash flow projections, risk-adjusted discount rates, and rates of growth used in our fair value calculations would not result in impairment of the remaining goodwill for any of our reporting units.
Definite-lived intangible assets are assigned depreciable lives of four to thirty years, depending on classification, and are evaluated for impairment whenever events or changes in circumstances indicate that the carrying amount of definite-lived intangible assets used in combination to generate cash flows largely independent of other assets may not be recoverable. If impairment indicators exist for definite-lived intangible assets, the undiscounted future cash flows associated with the expected service potential of the assets are compared to the carrying value of the assets. If our projection of undiscounted future cash flows is in excess of
139
the carrying value of the intangible assets, no impairment charge is recorded. If our projection of undiscounted cash flows is less than the carrying value of the intangible assets, an impairment charge is recorded to reduce the intangible assets to fair value. We also evaluate the need for additional impairment disclosures based on our Level 3 inputs. For fair value measurements categorized within Level 3 of the fair value hierarchy, we disclose the valuation processes used by the reporting entity.
The most significant assumptions used in the discounted cash flows calculation to determine the fair value of our reporting units in connection with impairment testing include: (i) the discount rate, (ii) the expected long-term growth rate and (iii) annual cash flow projections. See Note 13, Fair Value Measurements, to our audited consolidated financial statements included elsewhere in this prospectus.
Equity-Based Compensation
We account for our stock awards and options by recognizing compensation expense, measured at the grant date based on the fair value of the award net of estimated forfeitures, on a straight-line basis over the award vesting period.
Stock Options
We measure the value of stock-option awards at the grant date fair value as calculated by the Black-Scholes option-pricing model which requires the input of highly subjective assumptions, including the fair value of the
underlying common stock, the expected term of the option, the expected volatility of the price of our common stock prior to our initial public offering, risk-free interest rates, and the expected dividend yield of our common stock. The assumptions used in our option-pricing model represent management’s best estimates. These estimates involve inherent uncertainties and the application of management’s judgment. If these assumptions change and different factors are used, our stock-based compensation expense could be materially different in the future. These estimates willare not be necessary to determine the fair value of new awards oncenow that the underlying shares beginawards are trading publicly. These assumptions are as follows:
| • | Fair value of our common stock. |
| • | Expected term.The expected term |
| • | Volatility. As we |
| • | Risk-free rate. The risk-free interest rate is based on the yields of U.S. Treasury securities with maturities appropriate for the term of employee options. |
| • | Dividend yield. |
If any of the assumptions used in the Black-Scholes option-pricing model change significantly, stock-based compensation expense may differ materially in the future from that recorded in the current period. The fair value
140
of the stock options granted during the year ended December 31, 2013 was estimated at the date of grant using the Black-Scholes option pricing model with the following weighted-average assumptions:
Implied volatility | 30.75 | % | ||
Expected life (in years) | 6.11 | |||
Risk free interest rate | 1.53 | % | ||
Dividend yield | 0.00 | % |
Restricted Stock
Restricted stock is measured based on the fair market value of the underlying stock on the date of the grant. Shares of Sabre Corporation common stock are delivered on the vesting dates with the applicable statutory tax withholding requirements to be satisfied per the terms of the Sovereign Holdings, Inc. Restricted Stock Grant Agreement.
Common Stock Valuation
The fair value of the common stock underlying our stock-based awards was determined by the audit committee of our board of directors, with input from management and contemporaneous third-party valuations. We believe that the audit committee of our board of directors has the relevant experience and expertise to determine the fair value of our common stock. As described below, the exercise price of our share-based awards
was determined by the audit committee of our board of directors based on input from management and the most recent contemporaneous third-party valuation as of the grant date.
Given the absence of a public trading market of our common stock prior to our initial public offering, and in accordance with the American Institute of Certified Public Accountants Accounting and Valuation GuideGuide:: Valuation of Privately-Held-Company Equity Securities Issued as Compensation, the audit committee of our board of directors exercised reasonable judgment and considered numerous objective and subjective factors to determine the best estimate of the fair value of our common stock including:
The nature of the material assumptions and estimates considered, to determine the fair market value of our common stock are highly complex and subjective.
In valuing our common stock through December 31, 2013, the audit committee of our board of directors determined the business enterprise value (“BEV”) of our business generally using the income approach and the market approach using the market comparable method.
141
The income approach estimates fair value based on the expectation of future cash flows that a company will generate such as cash earnings, cost savings, tax deductions, and the proceeds from disposition of assets. These future cash flows are discounted to their present values using a discount rate which reflects the risks inherent in our cash flows. This approach requires significant judgment in estimating projected growth rates and cost trends and in determining a discount rate adjusted for the risks associated with our business.
The market comparable method estimates fair value based on a comparison of the subject company to comparable public companies in similar lines of business. From the comparable companies, a representative market value multiple is determined which is applied to the subject company’s operating results to estimate the value of the subject company. In our valuations, the multiple of the comparable companies was determined using a ratio of the market value of invested capital to projected revenue and/or earnings before interest, taxes and depreciation and amortization for the current and following year. Our peer group of companies included a number of market leaders in transaction processing, travel distribution, SaaS and software and internet related businesses similar to, or adjacent to our own business. The market comparable method requires judgment in selecting the public companies that are most similar to our business and in the application of the relevant market multiples to our financial performance metrics. We have from time to time updated the set of comparable companies utilized as new or more relevant information became available, including changes in the market and our business models and input from third party market experts.
Once we determine our BEV under each approach, we apply a weighting to the income approach and the market approach primarily based on the relevance of the peer companies chosen for the market approach analysis
as well as other relevant factors. We then reduce the BEV by our total net debt and total redeemable preferred stock value to arrive at the estimated fair value of our common stock. Based on this information, the audit committee of our board of directors makes the final determination of the estimated fair value of our equity and common stock.
Pension and Other Postretirement Benefits
We sponsor the Sabre Inc. Legacy Pension Plan (“LPP”), which is a tax-qualified defined benefit pension plan for employees meeting certain eligibility requirements. The LPP was amended to freeze pension benefit accruals as of December 31, 2005, so that no additional pension benefits are accrued after that date. We also sponsor a defined benefit pension plan for certain employees in Canada.
Pension and other postretirement benefits for defined benefit plans are actuarially determined and affected by assumptions which include, among other factors, the discount rate and the estimated future return on plan assets. In conjunction with outside actuaries, we evaluate the assumptions on a periodic basis and make adjustments as necessary.
The discount rate used in the measurement of our benefit obligations as of December 31, 2013 and December 31, 2012 is as follows:
| Pension Benefits December 31, | Other Benefits December 31, | |||||||||||||||
| 2013 | 2012 | 2013 | 2012 | |||||||||||||
Weighted-average discount rate | 5.10 | % | 4.19 | % | 0.55 | % | 2.07 | % | ||||||||
The LPP plan is valued annually as of the beginning of each fiscal year. The principal assumptions used in the measurement of our net benefit costs for the three years ended December 31, 2013, 2012 and 2011 are as follows:
| Pension Benefits | Other Benefits | |||||||||||||||||||||||
| 2013 | 2012 | 2011 | 2013 | 2012 | 2011 | |||||||||||||||||||
Discount rate | 4.19 | % | 5.32 | % | 5.88 | % | 1.16 | % | 2.32 | % | 2.69 | % | ||||||||||||
Expected return on plan assets | 7.75 | % | 7.75 | % | 7.75 | % | — | — | — | |||||||||||||||
142
Our discount rate is determined based upon the review of year-end high quality corporate bond rates. Lowering the discount rate by 50 bps as of December 31, 2013 would increase our pension and postretirement benefits obligations by approximately $21 million and a nominal amount, respectively, and decrease 2014 pension expense and estimated postretirement benefits expense by nominal amounts.
The expected return on plan assets is based upon an evaluation of our historical trends and experience taking into account current and expected market conditions and our target asset allocation of 25% U.S. equities, 25% non-U.S. equities, 43% long duration fixed income, 5% real estate and 2% cash equivalents. The expected return on plan assets component of our net periodic benefit cost is calculated based on the fair value of plan assets and our target asset allocation. We monitor our actual asset allocation and believe that our long-term asset allocation will continue to approximate the target allocation. Lowering the expected long-term rate of return on plan assets by 50 bps as of December 31, 2013 would increase 2014 pension expense by approximately $2 million.
Derivative Instruments
We use derivative instruments as part of our overall strategy to manage our exposure to market risks primarily associated with fluctuations in foreign currency and interest rates. As a matter of policy, we do not use derivatives for trading or speculative purposes. We determine the fair value of our derivative instruments using
pricing models that use inputs from actively quoted markets for similar instruments and other inputs which require judgment. These amounts include fair value adjustments related to our own credit risk and counterparty credit risk. Subsequent to initial recognition, we adjust the initial fair value position of the derivative instruments for the creditworthiness of the banking counterparty (if the derivative is an asset) or for our own creditworthiness (if the derivative is a liability). This adjustment is calculated based on the default probability of the banking counterparty and on our default probability, as applicable, and is obtained from active credit default swap markets and is then applied to the projected cash flows.
Restructuring Activities
Restructuring charges are typically comprised of employee severance costs, costs of consolidating duplicate facilities and contract termination costs. Restructuring charges are based upon plans that have been committed to by our management, but may be refined in subsequent periods. A liability for costs associated with an exit or disposal activity is recognized and measured at its fair value in our consolidated statement of operations in the period in which the liability is incurred. When estimating the fair value of facility restructuring activities, assumptions are applied regarding estimated sub-lease payments to be received, which can differ materially from actual results. This may require us to revise our initial estimates which may materially affect our results of operations and financial position in the period the revision is made.
Income and Non-Income Taxes
We recognize deferred tax assets and liabilities based on the temporary differences between the financial statement carrying amounts and the tax bases of assets and liabilities. We regularly review deferred tax assets by jurisdiction to assess their potential realization and establish a valuation allowance for portions of such assets that we believe will not be ultimately realized. In performing this review, we make estimates and assumptions regarding projected future taxable income, the expected timing of the reversals of existing temporary differences and the implementation of tax planning strategies. A change in these assumptions could cause an increase or decrease to the valuation allowance resulting in an increase or decrease in the effective tax rate, which could materially impact our results of operations. At year end, we had a valuation allowance on certain loss carryforwards based on our assessment that it is more likely than not that the deferred tax asset will not be realized. We believe that our estimates for the valuation allowances against deferred tax assets are appropriate based on current facts and circumstances.
As of December 31, 2013, we had approximately $647$632 million of NOLs for U.S. federal income tax purposes, approximately $17 million of which are subject to an annual limitation on their ability to be utilized
143
under Section 382 of the Internal Revenue Code (the “Code”).Code. These NOLs are Pre-IPO Tax Assets under the TRA, which provides for the payment by us to our Pre-IPO Existing Stockholders of 85% of the amount of cash savings, if any, in U.S. federal income tax that we and our subsidiaries are deemed to realize as a result of the utilization of the Pre-IPO Tax Assets. See “Certain Relationships and Related Party Transactions—Tax Receivable Agreement.”
We believe that it is more likely than not that the benefit from certain U.S. and non-U.S. deferred tax assets will not be realized. As a result, we established a valuation allowance of approximately $86 million against our U.S. deferred tax assets as of December 31, 2013, which includes our U.S. federal income tax NOL. In addition, we have an allowance on the U.S. deferred tax assets of TVL Common, Inc. that was merged into our capital structure on December 31, 2012 of $5 million and on the non-U.S. deferred tax assets of our lastminute.com subsidiaries of $163 million and $177 million as of December 31, 2013 and 2012, respectively. We reassess these assumptions regularly, which could cause an increase or decrease to the valuation allowance resulting in an increase or decrease in the effective tax rate, and could materially impact our results of operations.
We operate in numerous countries where our income tax returns are subject to audit and adjustment by local tax authorities. Because we operate globally, the nature of the uncertain tax positions is often very complex and subject to change, and the amounts at issue can be substantial. It is inherently difficult and subjective to estimate
such amounts, as we have to determine the probability of various possible outcomes. We re-evaluate uncertain tax positions on a quarterly basis. This evaluation is based on factors including, but not limited to, changes in facts or circumstances, changes in tax law, effectively settled issues under audit, and new audit activity. At December 31, 2013 and December 31, 2012, we had a liability, including interest and penalty, of $66$67 million and $55$58 million, respectively, for unrecognized tax benefits, which would affect our effective tax rate if recognized. Such a change in recognition or measurement would result in the recognition of a tax benefit or an additional charge to the tax provision.
With respect to value-added taxes, we have established reserves regarding the collection of refunds which are subject to audit and collection risks in various regions of Europe. Our reserves are based on factors including, but not limited to, changes in facts or circumstances, changes in law, effectively settled issues under audit, and new audit activity. Changes in any of these factors could significantly impact our reserves and materially impact our results of operations. At December 31, 2013 and December 31, 2012, we carried reserves of approximately $4 million and $37 million, respectively, associated with these risks.
Occupancy Taxes
Over the past nineten years, various state and local governments in the United States have filed approximately 70 lawsuits against us pertaining primarily to whether Travelocity (and other OTAs) owes sales or occupancy taxes on some or all of the revenues it earns from facilitating hotel reservations using the merchant revenue model. In addition to the lawsuits, there are a number of administrative proceedings pending against us which could result in an assessment of sales or occupancy taxes on fees. See “Business—Legal Proceedings—Litigation and Administrative Audit Proceedings Relating to Hotel Occupancy Taxes.”
Quantitative and Qualitative Disclosures about Market Risk
Market Risk Management
Market risk is the potential loss from adverse changes in: (i) prevailing interest rates, (ii) foreign exchange rates, (iii) credit risk and (iv) inflation. Our exposure to market risk relates to interest payments due on our long-term debt, revolving credit facility, derivative instruments, income on cash and cash equivalents, accounts receivable and payable and travel supplier liabilities and related deferred revenue. We manage our exposure to these risks through established policies and procedures. We do not engage in trading, market making or other speculative activities in the derivatives markets. Our objective is to mitigate potential income statement, cash flow and fair value exposures resulting from possible future adverse fluctuations in interest and foreign exchange rates.
144
Interest Rate Risk
As of December 31, 2013, our exposure to interest rates relates primarily to our interest rate swaps, our senior secured debt and our borrowings on the revolving credit agreement. Offsetting some of this exposure is interest income received from our money market funds. The objectives of our investment in money market funds are (i) preservation of principal, (ii) liquidity and (iii) yield. If future short-term interest rates averaged 10% lower than they were during the year ended December 31, 2013, our interest income from money market funds would have decreased by a negligible amount. This amount was determined by applying the hypothetical interest rate change to our average money market funds invested.
As of September 30, 2014 and December 31, 2013, 2012 and 2011, the outstanding carryingface values of our outstanding financing obligations were as stated below.below:
| December 31, | ||||||||||||||||
| Rate* | Maturity | 2013 | 2012 | 2011 | ||||||||||||
| (Amounts in thousands) | ||||||||||||||||
Senior secured credit facility: | ||||||||||||||||
Term B facility | L+4.00%(1) | February 2019 | $ | 1,747,378 | $ | — | $ | — | ||||||||
Incremental term facility | L+3.50% | February 2019 | 349,125 | — | — | |||||||||||
Term C facility | L+3.00% | December 2017 | 360,477 | — | — | |||||||||||
Revolving facility | L+3.75%(1) | February 2018 | — | — | 82,000 | |||||||||||
Initial term loan facility | L+5.75% | September 2014 | — | — | 800,000 | |||||||||||
Initial term loan facility | L+2.00% | September 2014 | — | 238,335 | 2,071,788 | |||||||||||
First extended term loan facility | L+5.75% | September 2017 | — | 1,162,622 | — | |||||||||||
Second extended term loan facility | L+5.75% | December 2017 | — | 401,515 | — | |||||||||||
Incremental term facility | L+6.00% | December 2017 | — | 370,536 | — | |||||||||||
Senior unsecured notes due 2016 | 8.350% | March 2016 | 389,321 | 385,099 | 381,267 | |||||||||||
Senior secured notes due 2019 | 8.500% | May 2019 | 799,823 | 801,712 | — | |||||||||||
Mortgage facility | 5.800% | March 2017 | 83,541 | 84,340 | 85,000 | |||||||||||
|
|
|
|
|
| |||||||||||
Total debt | $ | 3,729,665 | $ | 3,444,159 | $ | 3,420,055 | ||||||||||
|
|
|
|
|
| |||||||||||
Current portion of debt | 86,117 | 23,232 | 112,150 | |||||||||||||
Long-term debt | 3,643,548 | 3,420,927 | 3,307,905 | |||||||||||||
|
|
|
|
|
| |||||||||||
Total debt | $ | 3,729,665 | $ | 3,444,159 | $ | 3,420,055 | ||||||||||
|
|
|
|
|
| |||||||||||
| Rate* | Maturity | September 30, 2014 | December 31, 2013 | |||||||||
| (Amounts in thousands) | ||||||||||||
Senior secured credit facilities: | ||||||||||||
Term Loan B | L+3.00% | February 2019 | $ | 1,743,938 | $ | 1,757,250 | ||||||
Incremental term loan facility | L+3.00% | February 2019 | 346,500 | 349,125 | ||||||||
Term Loan C | L+2.50% | December 2017 | 49,313 | 361,250 | ||||||||
Revolver, $370 million | L+2.75% | February 2019 | — | — | ||||||||
Revolver, $35 million | L+3.25% | February 2018 | — | — | ||||||||
Senior unsecured notes due 2016 | 8.35% | March 2016 | 400,000 | 400,000 | ||||||||
Senior secured notes due 2019 | 8.50% | May 2019 | 480,000 | 800,000 | ||||||||
Mortgage facility | 5.80% | March 2017 | 82,457 | 83,286 | ||||||||
|
|
|
| |||||||||
Face value of total debt outstanding | 3,102,208 | 3,750,911 | ||||||||||
Less current portion of debt outstanding | (22,418 | ) | (86,117 | ) | ||||||||
|
|
|
| |||||||||
Face value of long-term debt outstanding | $ | 3,079,790 | $ | 3,664,794 | ||||||||
|
|
|
| |||||||||
| * | “L” refers to LIBOR. |
We enter into interest rate swap agreements to manage interest rate risk exposure. Our interest rate swaps that were outstanding and effective during 2014 matured on September 30, 2014. As of December 31, 2014, we have entered into forward starting interest rate swaps with a 1% floor that effectively convert $750 million of floating interest rate senior secured debt into a fixed rate obligation.obligation for a three year period starting December 31, 2015. The terms of theour outstanding and matured interest rate swaps relevant to the years ended December 31, 2013, 2012 and 2011 wereare as follows:
| Interest Rate Received | Interest Rate Paid | Effective Date | Maturity Date | |||||||||||||||||||
Outstanding: | $ | 750 million | 1 month LIBOR | 1.48 | % | December 31, 2015 | December 31, 2016 | |||||||||||||||
| $ | 750 million | 1 month LIBOR | 2.19 | % | December 31, 2016 | December 31, 2017 | ||||||||||||||||
| $ | 750 million | 1 month LIBOR | 2.61 | % | December 31, 2017 | December 31, 2018 | ||||||||||||||||
Matured: | $ | 400 million | 1 month LIBOR | 2.03 | % | July 29, 2011 | September 30, 2014 | |||||||||||||||
| $ | 350 million | 1 month LIBOR | 2.51 | % | April 30, 2012 | September 30, 2014 | ||||||||||||||||
| ||||||||||||||||||||||
Since outstanding balances under our senior secured credit facilities incur interest at rates based on LIBOR, subject to a 1.00% floor, increases in short-term interest rates would not impact our interest expense until LIBOR exceeded 1.00%. If our mix of interest rate-sensitive assets and liabilities changes significantly, we may enter into additional derivative transactions to manage our net interest rate exposure.
Foreign Currency Risk
We have operations outside of the United States, primarily in Canada, South America, Europe, Australia and Asia. We are exposed to foreign currency fluctuations whenever we enter into purchase or sale transactions denominated in a currency other than the functional currency of the operations. The principal foreign currencies
145
involved include the Euro, the British Pound Sterling, the Polish Zloty, the Canadian Dollar, the Indian Rupee, and the Australian Dollar. Our most significant foreign currency denominated operating expenses is in the Euro, which comprised approximately 9%, 7% and 8%9% of our operating expenses for the years ended December 31, 2013, 2012 and 2011, respectively. In recent years, exchange rates between these currencies and the U.S. dollar have fluctuated significantly and may continue to do so in the future. During times of volatile currency movements, this risk can materially impact our earnings. To reduce the impact of this earnings volatility, we hedged approximately 43% ofhedge our foreign currency exposure by entering into foreign currency forward contracts on several of our largest foreign currency exposures.exposures, including the Euro, the British Pound Sterling, the Polish Zloty and the Indian Rupee. In 2013, we hedged approximately 43% of our foreign currency exposure. The notional amounts of these forward contracts, totaled $123totaling $151 million $126 million and $94 million as of December 31, 2013, 2012 and 2011, respectively.at September 30, 2014. The forward contracts represent obligations to purchase foreign currencies at a predetermined exchange rate to fund a portion of our expenses that are denominated in foreign currencies. The fair value of these forward contracts recognized as an asset in our consolidated balance sheets was $5 million and $3 million as of December 31, 2013 and December 31, 2012, respectively.
We are also exposed to foreign currency fluctuations through the translation of the financial condition and results of operations of our foreign operations into U.S. dollars in consolidation. Such gains and losses are recognized as a component of accumulated other comprehensive income (loss) and is included in stockholders’ equity (deficit). Translation gains (losses) recognized as other comprehensive income (loss) were $13 million, $(2) million and $2 million for the years ended December 31, 2013, 2012 and 2011, respectively.
Credit Risk
Our customers are primarily located in the United States, Canada, Europe, Latin America and Asia, and are concentrated in the travel industry.
We generate a significant portion of our revenues and corresponding accounts receivable from services provided to the commercial air travel industry. As of December 31, 2013, 2012 and 2011,2012, approximately $178 million or 58% and $189 million or 58%, respectively, of our trade accounts receivable were attributable to commercial air travel industry customers. Our other accounts receivable are generally due from other participants in the travel and transportation industry. We generally do not require security or collateral from our customers as a condition of sale. See “Risk Factors—Risks Related to Our Business and Industry—Our travel supplier customers may experience financial instability or consolidation, pursue cost reductions, change their distribution model or undergo other changes.”
We regularly monitor the financial condition of the air transportation industry and have noted the financial difficulties faced by several air carriers. We believe the credit risk related to the air carriers’ difficulties is mitigated somewhat by the fact that we collect a significant portion of the receivables from these carriers through the ACH and other similar clearing houses.
As of December 31, 2013, 2012 and 2011, approximately 57%, 58%55%, and 55%57%, respectively, of our air customers make payments through the ACH which accounts for approximately 94%, 95% and 95%94%, respectively, of our air billings. ACH requires participants to deposit certain balances into their demand deposit accounts by
certain deadlines, which facilitates a timely settlement process. For these carriers, we believe the use of ACH mitigates our credit risk with respect to airline bankruptcies. For those carriers from whom we do not collect payments through the ACH or other similar clearing houses, our credit risk is higher. However, we monitor these carriers and account for the related credit risk through our normal reserve policies.
Inflation
Competitive market conditions and the general economic environment have minimized inflation’s impact on our results of operations in recent periods. There can be no assurance, however, that our operating results will not be affected by inflation in the future.
146
Travel Industry Overview
The travel and tourism industry is one of the world’s largest industry segments, contributing $6.6$7 trillion to global GDP in 2012,2013, according to the WTTC. The industry encompasses travel suppliers, including airlines, hotels, car rental brands, rail carriers, cruise lines and tour operators around the world, as well as travel buyers, including online and offline travel agencies, TMCs and corporate travel departments.
The travel and tourism industry has been a growing area of the broader economy. For example, based on 40 years of IATA Traffic data, air traffic has historically grown at an average rate of approximately 1.5x the rate of global GDP growth. According to Euromonitor, Database,outbound travel volumes have benefited and are expected to continue to benefit from GDP growth and corresponding rising income levels particularly in growth markets such as APAC, Latin America, APAC and MEA. According to IATA Traffic, global airline passenger volume has grown at a 6% CAGR from 2009 to 2012. Looking forward, air travel and hotel spending is expected to grow at a 4% CAGR from 2013 to 2017, as growing consumer confidence and increasing connectivity continue to expand the opportunities for travel and tourism, according to Euromonitor Database.2013. Air traffic in developing markets such as APAC, Latin America and the Middle East is expected to grow at even faster rates—6%, 6%, and 7%, respectively, from 2012 to 2032, according to Airbus. This emerging market growth is relevant for all our businesses but especially our Travel Network business, which had leadingGDS-processed air bookings shares in both APAC and Latin America in 2013. Certain segments of the travel market are also growing faster than average. For example, LCC/hybrids, which represented approximately 45%29% of our 20122013 PBs based on T2RL data served by our Airline Solutions reservations products, have continued to grow. In 2012, LCC/hybrids represented approximately 45% of our 2012 PBs. T2RL’s LCC/hybrid group included JetBlue and Lion Airlines in 2012, which we consider LCC/hybrid carriers. T2RL’s 2013 calculation excludes these carriers from the LCC/hybrid group. If these two carriers were included as LCC/hybrids in the 2013 calculation, LCC/hybrids would have represented approximately 41% of our 2013 PBs. According to Airbus, LCCs’ share of global air travel volume is expected to increase from 17% of revenue passenger kilometers in 2012 to 21% of revenue passenger kilometers by 2032.2032. Finally, according to Euromonitor Report,business-related travel by U.S. residents, which is primarily served through GDS channels, has increased since the global economic downturn, reaching 228229 million trips in 2012.2013 compared to 223 million trips in 2010. According to IATA’s Airline Industry Forecast2013-2017, overall air travel is expected to sustain a growth rate approaching the historical 5% to 6% growth trend at least through 2017.2017, and Boeing’s Current Market Outlook projects a 5% CAGR in global passenger traffic growth from 2013 to 2033, measured in revenue passenger kilometers.
Travel Industry Technology
The travel industry is highly fragmented and complex, with approximately 800 airlines serving 3 billion passengers (T2RL), 470,000480,000 hotel properties (Euromonitor Database), over 35,000 car rental outlets (PhoCusWright December 2013 (“PhoCusWright”)), and numerous rail, cruise, tour and other operators around the world. Each of these types of travel suppliers requires technology to solve their complex and key marketing, sales, service and operational needs. In addition, there are tens of thousands of commercial buyers of travel including online and offline travel agencies, TMCs and corporate travel departments that serve both business and leisure travelers. These travel buyers rely on highly sophisticated shopping technology to filter the universe of travel options to identify desired itineraries that fit travelers’ personal preferences and comply with corporate policies. For example, there are billions of itinerary and fare options from New York to London on any given day, but only a small subset of those with available seats, on the preferred airline, with the optimal routing and at the desired time. The GDS search technology narrows the options down to the lowest fares that meet the traveler’s criteria so the informed agency can help the traveler make the best choice quickly. For these flights, air carriers need to set prices, manage inventory and distribute their seats as well as plan, staff and operate their routes and aircraft, all while carefully analyzing their financial and operational results. Hotels face similar challenges, as millions of customers check in and check out of their properties daily. There is a significant amount of technology required to enable this ecosystem.
147
To operate successfully, travel suppliers as well as travel buyers must solve this broad range of challenges from planning to distribution to operations. Historically, technology solutions were builtin-house by travel suppliers and travel buyers. Over time,third-party providers emerged to offer morecost-effective and advanced solutions, and the market has increasingly shifted to an outsourced model. We believe that significant outsourcing will continue as legacyin-house systems continue to migrate and upgrade tothird-party systems.
A broad set of technology solutions has evolved to manage this complex,high-frequency andhighly-orchestrated travel lifecycle. In addition, these travel technology solutions must keep pace with constantly evolving customer needs. Travel suppliers and travel buyers leverage technology solutions to optimize how travel products are marketed and sold, howend-customers are served, and how operations are managed. As illustrated by the following graphic, the technology required to enable the travel ecosystem includes comprehensive, global travel marketplaces like our Travel Network business, which processed more than 1.1 trillion system messages in 2013, with nearly 100,000 per second at peak times, as well as advanced reservation, planning, marketing and operations systems provided by solutions providers like our Airline and Hospitality Solutions business, which manages everything from hotel room inventory to crew scheduling on flights. Given the nature of these solutions, they generally represent integral elements of a travel supplier’s and travel buyer’sday-to-day business. This reliance on technology drove spending by the air transportation and hospitality industries to $60 billion in 2013 with expenditures expected to exceed $70 billion in 2017, according to Gartner.
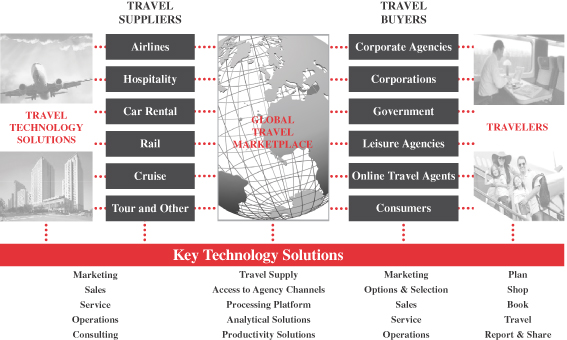
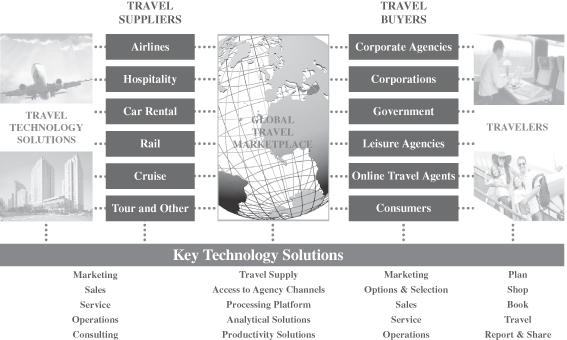
We believe that technology providers with deep domain expertise have become critical for the industry. As the demands of the industry continue to rapidly evolve, they will be presented with significant additional opportunities. For example, the combination of rapid developments in consumer electronics and the proliferation of customers carrying one or more digital devices is driving innovation ranging from mobile shopping to remotecheck-in and trip management. Similarly, intense competition has driven suppliers to explore new ways of merchandising their products, including the sale of ancillary products like preferred seating and checked baggage. This requires technology companies to create solutions to facilitate that product lifecycle from selling ancillary products and distribution management to inventory control. Technology providers are also helping travel suppliers and travel buyers to derive increasing value from advanced data analytics and business intelligence solutions, driving better operations, enhanced customer experiences and the personalization of travel products. In addition, the travel industry is focusing on streamlining operations, developing creative solutions
148
such as the fully electronic, mobile flight bag for pilots, which eliminates the need for expensive and cumbersome printed flight manuals and documentation. Some recent trends in the travel industry which we expect to further technology innovation and spending include:
Outsourcing:Outsourcing: Historically, technology solutions were builtin-house by travel suppliers and travel buyers. As complexity and the pace of innovation have increased,third-party providers have emerged to
offer morecost-effective and advanced solutions. Additionally, the travel technology industry has shifted to a more flexible and scalable technology delivery model including SaaS and hosted implementations that allow for shared development, reduced deployment costs, increased scalability and a “pay-as-you-go”“pay-as-you-go” cost model.
Airline Ancillary Revenue:Revenue: The sale of ancillary products is now a major source of revenue for many airlines worldwide, and has grown to comprise as much as 20%30% of total revenues for some carriers and more than $36$31.5 billion in the aggregate across the travel industry in 2012,2013, according to IdeaWorks. Enabling the sale of ancillary products is technologically complex and requires coordinated changes to multiple interdependent systems including reservations platforms, inventory systems, point of sale locations, revenue accounting, merchandising, shopping, analytics and other systems. Technology providers such as Sabre have already significantly enhanced their systems to provide these capabilities and we expect these providers to take further advantage of this significant opportunity going forward.
Mobile:Mobile: Mobile platforms have created new ways for customers to research, book and experience travel, and are expected to account for over 30%35% of online travel value sales by 2017,2018, according to Euromonitor.the Euromonitor Report. Accordingly, travel suppliers, including airlines and hospitality providers, are upgrading their systems to allow for delivery of services via mobile platforms from booking tocheck-in to travel management. The recent SITA Survey found that 97% of airlines are investing in mobile channels with the intention of increasing mobile access across the entire travel experience. This mobile trend also extends to the use of tablets and wireless connectivity by the airline workforce, such as automating cabin crew services and providing flight crews with electronic flight bags. Travel technology companies like Sabre are enabling and benefitting from this trend as travel suppliers upgrade their systems and travel buyers look for new sources of client connectivity.
Personalization:Personalization: Concurrently with the rise of ancillary products and mobile devices as a customer service tool, travel suppliers have an opportunity to provide increased personalization across the customer travel experience,from seat selection andon-board entertainment to loyalty program management and mobile concierge services.Data-driven business intelligence products can help travel companies use available customer data to identify the types of products,add-ons and upgrades customers are more likely to purchase and market these products effectively to various customer segments according to their needs and preferences. In addition to providing the technology platform to facilitate these services, we believe technology providers like Sabre can leverage theirdata-rich platforms and travel technology domain expertise to offer analytics and business intelligence to support travel suppliers in delivering more personalized service offerings.
Increasing Use of Data and Analytics:Analytics: The use of data has always been an asset in the travel industry. Airlines were pioneers in the use of data to optimize seat pricing, crew scheduling and flight routing. Similarly, hotels employed data to manage room inventory and optimize pricing. The travel industry was also one of the first to capitalize on the value of customer data by developing products such as customer loyalty programs. Historically, this data has largely beentransaction-based, such as booking reservations, recording account balances, and tracking points in loyalty programs. Today,analytics-driven business intelligence products are evolving to further and better utilize available data to help travel companies make decisions, serve customers, optimize their operations and analyze their competitive landscape. Technology providers like Sabre have developed and continue to developlarge-scale,data-rich platforms that include these business intelligence and data analytics tools that can identify new business opportunities and global, integrated andhigh-value solutions for travel suppliers.
With the increasing complexity created by the large, fragmented and global nature of the travel industry, we believe reliance on technology will only increase. Technology spending by the air transportation and hospitality industries totaled $60 billion in 2013, with expenditures expected to exceed $70 billion in 2017, according to Gartner Enterprise.
149
We offer a broad portfolio of sophisticated and comprehensive technology solutions and services on scalable platforms to travel suppliers, travel buyers and other industry participants that range from planning to
distribution to operations. We currently organize our business in threetwo segments: (i) Travel Network, our global B2B travel marketplace for travel suppliers and travel buyers and (ii) Airline and Hospitality Solutions, an extensive suite of leading software solutions primarily for airlines and hotel properties, and (iii) Travelocity, our portfolio of online consumer travel e-commerce businesses through which we provide travel content and booking functionality primarily for leisure travelers.properties. Collectively, our integrated business enables the entire travel lifecycle, from route planning topost-trip business intelligence and analysis.
Global Distribution System and Travel Marketplace
Sabre developed the first airline CRS. As the industry and technology evolved and Sabre’s and other CRS providers’ systems expanded globally to accommodate a large variety of travel suppliers and attract a broad set of travel buyers, these systems became known as GDSs, or global distribution systems. In recent years, certain GDS providers, including Sabre, have significantly broadened their product offering and value proposition to include a range of integrated technologies and solutions for travel suppliers and travel buyers. Combinations of the GDSs and these solutions offerings have increasingly become known as global travel marketplaces.
GDS providers facilitate the operation of the travel industry in several ways. First, these travel marketplaces have an extensive network of travel buyers, including online and offline travel agencies, TMCs and corporate travel departments, as well as travel suppliers, including airlines, hotels, car rental brands, rail carriers, cruise lines and tour operators. GDSs efficiently bring together travel content such as inventory, prices and availability from travel suppliers and allow travel buyers to purchase that content through a transparent, searchable and consistently presented marketplace platform. A fundamental value proposition to the travel buyer is access to comprehensive and competitive travel content, including core content such as inventory and pricing equivalent to that directly available through a travel supplier’s own website or sales office. For travel suppliers, these marketplaces provide efficient andcost-effective distribution of the travel supplier’s services to a diverse customer base and also provide many OTAs with access to the travel content displayed on their websites. Based on our internal estimates and Marketing Information Data Tapes data, there were over one billionGDS-processed air bookings in 2013, representing more than $250 billion in global travel sales.
150
In addition, some GDS providers augment their distribution offering with advanced merchandising and other capabilities. For example, workflow management solutions, like Sabre Red Workspace; automation tools that assist travel agencies in serving their customers before, during and after the trip; andweb-based products are integral components of travel agents’ technology systems that help them market their services effectively and operate more efficiently. The graphic below illustrates the potential value of the GDS and related solutions to both travel suppliers and travel buyers:

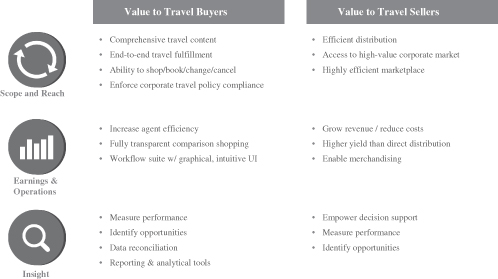
Buyers can purchase travel inventory (e.g., booking reservations for air or hotel) in two primary ways. They can purchase directly from the travel supplier, which we refer to as “direct distribution,” or they can purchase through a travel agency or other intermediary that typically uses a GDS. We refer to this as “indirect distribution.”
With travel suppliers’ adoption of certain technology solutions over the last decade, including those offered by our Airline and Hospitality Solutions business, air travel suppliers have increased the proportion of direct bookings relative to indirect bookings. However, we believe that the rate at which bookings are shifting from indirect to direct distribution channels has slowed for a number of reasons, and that the rate of shift in the United States stabilized at very low levels in 2012 and 2013, although we cannot predict whether this low rate of shift will continue. Reasons for this include the increased participation of LCC/hybrids in indirect distribution channels as well as other airlines increasing their participation in GDSs in recent years. We believe this is due to the effectiveness and efficiency of the GDS as a global travel marketplace for travel suppliers to market and sell their travel content, particularly for TMCs, corporate travel departments and OTAs. In addition, travel suppliers using the GDS incur a booking fee which is, on average, only approximately 2% of the value of the booking. Therefore, the revenue generated through the GDS leads to a return on investment that is attractive compared to the incremental cost, in part because many of the tickets sold on the GDS platform are more expensivelong-haul and business travel tickets (particularly those originating outside the home country of the airline) as well as tickets with additional booking complexity (e.g., multiple airline itineraries). These platforms also offer a particularlycost-effective means of accessing markets where a travel supplier’s brand is less recognized by using local travel agencies to reach end consumers.
As evidence of the value of the GDS platform, we estimate that Representative Airlines have an approximately 90% participation rate in a GDS (weighted by PB volume), as of December 31, 2013. We define “Representative Airlines” as all IATA member airlines as of December 2013, as well as Air Asia, Allegiant, Lion Air, Ryanair, Tiger Airways and Wizz Air, which, based on T2RL, collectively carried approximately
151
three-quarters of PBs globally in 2012. Over the last several years, notable carriers that previously only distributed directly, including JetBlue and Norwegian, have adopted our GDS. Other carriers such as EVA Airways and Virgin Australia have further increased their participation in a GDS. On the hotel side, a recent TravelClick study shows that travel agents’ use of GDSs for hotel booking is growing faster than their use of any other distribution channel for hotel bookings.
There are other technology initiatives that could impact the use of GDSs. For example, over the past ten years, several travel suppliers have proposed direct distribution initiatives. We believe that the direct distribution initiatives offered to date lack key functionality provided by the GDS, and would require each travel agency to implement a direct connection to each airline or other travel supplier, requiring significant and redundant IT expenditures. To date, we believe that direct distribution initiatives have not and will not have significant adoption by travel agents since their cost and lack of features currently make them less competitive than GDS offerings. In 2012, IATA proposed NDC, a new distribution capability, for adoption by airlines and travel distribution companies. As originally proposed, NDC is a combination of technical standards and business model, similar to some direct distribution initiatives, and we believe it suffers from many of the same problems noted above. We are not aware of any GDS industry participant or major travel agency that has committed the necessary investment for NDC. That said, we are committed to working with IATA to develop uniform technical standards that would incorporate NDC capabilities in a manner that integrates with the GDS for the benefit of travel buyers and travel suppliers.
Travel buyers, such as online and offline travel agencies, TMCs and corporate travel departments continue to utilize GDS platforms to provide travel content to their customers. Such customers continue to demand the broadest possible offerings at the best available prices in a single comparable format that we believe can most effectively be offered by GDSs at present. Additionally, travel buyers demand functionalities that provide nearreal-time results and allow flexible search parameters. Such enhanced functionalities have not typically been available via direct distribution channels, which have historically had less sophisticated search engines and have been limited to a single travel supplier’s inventory. In addition, we believe that travel agencies value other attributes of the GDS, including incentive consideration that supplements their income, tools that facilitate
booking data integration within their mid-and back-officemid-andback-office systems, and consistent user interfaces across all travel content shopped and sold. In particular, we believe that the wide variety of functionalities provided by GDSs is attractive to corporate travel departments due to their complex travel requirements and corporate travel contracts. For these reasons, we expect that travel buyers will continue to use GDSs to provide travel content in order to meet the needs of their customers and remain competitive.
152
Business Model
The distribution platform component of a GDS plays the role of a transaction processor for the travel industry, while thevalue-added integrated solutions make the GDS a true B2B travel marketplace. Generally, GDSs collect a transaction fee from the travel suppliers for each reservation they process, with no charge to travel suppliers for listing or shopping of their content. These travel marketplaces often implement a revenue sharing arrangement with travel agencies to incentivize them to consolidate demand and use the system efficiently. In such arrangements, GDS providers pay travel agencies a booking incentive for each booking that generates revenue for the GDS provider, sometimes after certain minimum booking levels are met. The following diagram presents an overview of the key financial flows for this two-sided transaction-basedtwo-sidedtransaction-based business model:
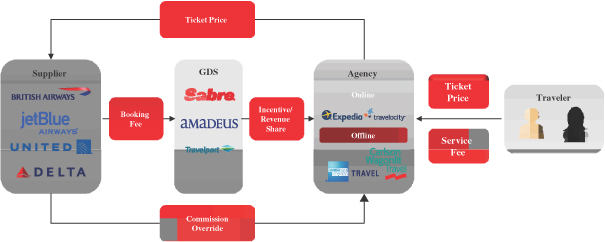
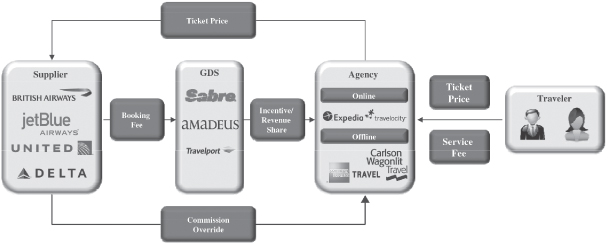
Because GDS revenue is directly dependent upontravel-related transaction activity, GDS revenue growth has historically correlated with growth in the overall travel market. Based on 40 years of IATA Traffic data, air traffic has historically grown at an average rate of approximately 1.5x the rate of global GDP growth. According to Marketing Information Data Tapes data and our internal estimates,GDS-processed bookings, for example, have already surpassedpre-recession levels, growing 3% per year from 2009 through 2013, and is expected to grow over the next four years. In addition to general economic conditions, certain factors, such as the increasing propensity of LCC/hybrids to expand their distribution through these global travel marketplaces in order to attract new customers beyond their home markets, may aid growth, while the U.S. government budget sequestration and shutdown may negatively impact this growth. See “Risk Factors—Risks Related to our Business and Industry—Our business could be harmed by adverse global and regional economic and political conditions” and “—Our revenue is highly dependent on transaction volumes in the global travel industry, particularly air travel transaction volumes.”
Competitive Environment
Travel marketplace participants include:
153
We believe that travel marketplace participants strive to differentiate themselves by providing travel buyers with some or all of the following services and functionality: reliable, easy to use and innovative technology; comprehensive, accurate and timely travel content or services; global coverage or regional expertise; booking incentives to travel agencies; and comprehensive solutions for business productivity, revenue maximization or cost savings. In addition, we believe that travel marketplace participants that serve travel suppliers strive to maintain an extensive network of travel buyer customers to provide a comprehensive global or regional offering of sales channels while offering low transaction fees. Some of these market participants also offer capabilities for travel suppliers to advertise, merchandise and personalize their products and services through the GDS.
Compared to other types of participants, global travel marketplaces such as Travel Network tend to offer more of these attributes to both travel buyers and travel suppliers.
In the United States, full deregulation of the GDS industry occurred in 2004. GDSs and airline carriers in Europe are still subject to rules aimed at preventinganti-competitive behavior and ensuring the supply of neutral information to consumers. Airlines that have decisive influence over a GDS, such as Air France, Iberia and the parent company of Lufthansa, all of which partially own Amadeus, must abide by specific rules prohibiting discrimination by an airline against another GDS that is competing with theairline-owned GDS. The Chinese travel marketplace is heavily regulated to provide thestate-controlled GDS, TravelSky, with monopoly control, which has largely kept other GDS providers out of the Chinese market. However, China has recently agreed to a phased, selective easing of some of these regulations, though progress has been slow, according to PhoCusWright. Canada still has some GDS regulations as well, primarily around the display of air carriers’ services.
Travel Technology Solutions
Travel technology companies provide travel suppliers with solutions that address a myriad of business processes, including commercial planning, revenue management, inventory management, customer acquisition and merchandising, sales ande-commerce, operations planning and management, business intelligence, and market intelligence. These solutions are typically comprised of SaaS solutions, hosted solutions and locally deployed solutions. Some of these solutions are developed by travel suppliersin-house and others are developed by third parties such as travel technology companies.
Historically, large travel suppliers built customin-house software and applications for their business process needs. In response to a desire for more flexible systems given increasingly complex technological requirements, reduced IT budgets and increased pricing pressure, many travel suppliers turned tothird-party solutions providers for many of their key technologies and began to license software from software providers.
Business Model
In addition to the continuing technology outsourcing trend, the industry has also seen a shift to more flexible and scalable technology delivery models. Although traditional software licensing remains an important part of
the industry, leading technology providers like Sabre have been at the forefront of a shift to SaaS and hosted implementations that allow for shared development, reduced deployment costs, increased scalability and a “pay-as-you-go”“pay-as-you-go” pricing model. This model also allows customers to benefit from constantly evolving platforms in a highly dynamic environment. By amortizing the cost of the solution over a customer’s transactions (e.g., PBs or room reservations made), solutions providers can often help customers reduce upfront technology costs and convert them to variable costs linked to company growth. Given the capital intensive nature of many travel suppliers’ businesses, we believe that this pricing flexibility is attractive to travel suppliers.
154
Competitive Environment
Participants in the travel technology solutions market include boththird-party solutions providers and travel suppliers within-house systems. As the technology outsourcing trend continues,third-party solutions providers compete for business based on a number of factors, including: the breadth of solutions offered, scope and complexity of business needs addressed, ability to meet a variety of customer specifications, proven effectiveness and reliability, implementation and system migration processes, flexibility, scalability and ease of use, pricing, level of integration with customers’ existing technology, global footprint, industry and technology expertise, cost and efficiency of system upgrades and customer support services. We believe that competitors who offer solutions that meet a range of complex needs and supplement those solutions with reliable support and a deep understanding of industry processes are more attractive to potential customers because they are able to solve more complex problems while reducing the total number of solutions providers that the customer needs.
Developing effective solutions requires complex and specific travel industry expertise. Also, most travel suppliers generally favor solutions providers that already serve other large travel suppliers in a given region. Airlines in particular are focused on the proven reliability of technology that is integral to operational efficiency and passenger safety, and hotels generally desire the technological sophistication and capabilities used by the larger and more prestigious hotel brands. Furthermore, due to the large size of many airline and hotel customers, solutions providers that can provide the scale to accommodate large volumes and deliver a broad portfolio of solutions have a competitive advantage. We believe that currently only a few SaaS and hosted technology solutions providers have the breadth, industry knowledge and technology expertise to effectively compete on a large scale. Although new entrants specializing in a particular type of software occasionally enter the solutions market, they typically focus on emerging or evolving business problems, niche solutions or small regional customers.
Airline Supplier Technology
Gartner estimates that technology spending by the air transportation industry totaled approximately $33 billion in 2013 (Gartner Enterprise). According to our internal estimates and T2RL passenger data, more than 600 airlines, representing over 95% of global passenger volumes, use a variety of software solutions to manage and integrate complex business processes. SITA estimates that airlines currently spend approximately 1.5% of global airline revenue on operational IT (SITA Survey). These systems include functionalities that support core capabilities of the air carrier, including reservations booking and related processes, merchandising and points of sale, CRS,check-in and boarding. According to T2RL PSS, the world market for such passenger sales and service systems is now worth more than $2 billion per year. Although the number of new reservations opportunities varies materially by year, in 2013 and 2014, T2RL expectsestimated that contracts representing over 1.31 billion PBs will come up for renewal between 2014 and 2017.
In addition to passenger sales and service solutions, certain technology providers, such as Sabre, offer othervalue-added software solutions. These solutions range in functionality from commercial planning to airline enterprise operations management, including software that manages flight operations, crew scheduling, route planning, pricing optimization, contract management and compliance and a host of other key airline functionalities. Based on our industry experience and internal data, we believe that a similar amount is spent each year on otherindustry-specific,software-enabled solutions.
Hotel Supplier Technology
Hotels use a number of different technology systems to distribute and market their products and improve their operational efficiency. According to Gartner Enterprise, technology spending by the hospitality industry totaled approximately $27 billion in 2013. Most of the hotel market is highly fragmented. Independent hotels andsmall- tomedium-sized chains (groups of less than 300 properties) comprise a substantial majority of hotel properties and available hotel rooms, while global and regional chains comprise the balance. These independent hotels and small-to medium-sizedsmall- tomedium-sized chains rely heavily on externalweb-based CRSs to distribute their inventory
155
across a variety of channels. CRS platforms provide GDS access, connectivity to major OTAs, internet booking capabilities, call center booking platforms, channel management and access to other distribution services on a shared platform. CRS providers may also differentiate themselves withvalue-added services such as digital marketing services, call center outsourcing services, and marketing consulting that help hotels compete. We expect opportunities for the top CRS providers to expand significantly, as hotels’ migration to external CRS platforms continues, including larger hotel chains now considering outsourcing this service to athird-party platform.
Additionally, hotels are migrating towardweb-based PMSs as recent technical advances, availability and lower total cost of ownership are making them increasingly attractive compared toon-site PMSs, which have historically been expensive to maintain.Web-based PMSs also make it possible to create an integrated CRS-PMS web-basedCRS-PMSweb-based solution, which, based on an internal survey that we conducted, is a product that the majority of hotels with ten or more properties would be interested in purchasing when they next upgrade their PMS.
As the hotel industry shifts from offline advertising to online marketing, CRS providers offering marketing capabilities such as website optimization, search engine optimization and online advertising will be more competitive players. We also believe that similar opportunities exist in the areas of revenue management, CRM and other operational functions that integrate with the CRS and PMS.
Online Travel Agencies
An OTA is ane-commerce business that allows travelers to conveniently and efficiently shop, compare and purchase a broad array oftravel-related products and services, often sourced in part from GDS platforms. According to Euromonitor Report, global online travel sales will grow at 10% over the next five years.
OTAs compete with traditional offline travel agencies as well as many alternative online travel distribution channels, including travel supplier direct distribution and metasearch companies such as Kayak, trivago and TripAdvisor. These market participants differentiate themselves on the basis of ease of use, price, customer satisfaction, availability of product type or rate, service, amount, accessibility and reliability of information, brand image and breadth of products offered. This requires OTAs to have effective branding and marketing, an efficient website to support shopping and booking capabilities, as well as strong relationships with travel suppliers orthird-party aggregators to offer a broad supply of travel content to attract customers and generate transaction and advertising revenue. We believe that customers’ need to trust the provider to fulfill and service their travel purchase often results in brand loyalty to a single site.
156
Overview
We are a leading technology solutions provider to the global travel and tourism industry. We span the breadth of a highly complex $6.6$7 trillion global travel ecosystem, providing key software and services to a broad range of travel suppliers and travel buyers. Through our Travel Network business, we process hundreds of millions of transactions annually, connecting the world’s leading travel suppliers, including airlines, hotels, car rental brands, rail carriers, cruise lines and tour operators, with travel buyers in a comprehensive travel marketplace. We offer efficient, global distribution of travel content from approximately 125,000 travel suppliers to approximately 400,000 online and offline travel agents. To those agents, we offer a platform to shop, price, book and ticket comprehensive travel content in a transparent and efficient workflow. We also offervalue-added solutions that enable our customers to better manage and analyze their businesses. Through our Airline Hospitality Solutions business, we offer travel suppliers an extensive suite of leading software solutions, ranging from airline and hotel reservations systems tohigh-value marketing and operations solutions. These solutions such asinclude planning airline crew schedules,re-accommodating passengers during irregular flight operations and managingday-to-day hotel operations. These solutions allow our customers to market, distribute and sell their products more efficiently, manage their core operations, and deliver an enhanced travel experience. Through our complementary Travel Network and Airline and Hospitality Solutions businesses, we believe we offer the broadest,end-to-end portfolio of technology solutions to the travel industry.
Our portfolio of technology solutions has enabled us to become the leadingend-to-end technology provider in the travel industry. For example, we are one of the largest GDS providers in the world, with a 36% share ofGDS-processed air bookings in 2013. More specifically, we are the #1 GDS provider in North America and also in higher growth markets such as Latin America and APAC, in each case based onGDS-processed air bookings in 2013. In those three markets, ourGDS-processed air bookings share was approximately 50% on a combined basis in 2013. In our Airline and Hospitality Solutions business, we believe we have the most comprehensive portfolio of solutions. In 2013, we had the largestthird-party hospitality CRS room share based on our approximately 27% share ofthird-party hospitality CRS hotel rooms distributed through our GDS, and, according to T2RL PSS data for 2012, we had the second largest airline reservations system globally. We also believe that we have the leading portfolio of airline marketing and operations products across the solutions that we provide. In addition, we operate Travelocity, one of the world’s most recognizable brands in the online consumer travel e-commerce industry, which provides us with business insights into our broader customer base.
Through our solutions, which span the breadth of the travel ecosystem, we have developed deep domain expertise. Our success is built on this expertise, combined with our significant technology investment and focus on innovation. This foundation has enabled us to develop highly scalable andtechnology-rich solutions that directly address the key opportunities and challenges facing our customers. For example, we have invested to scale our GDS platform to meet massive transaction processing requirements. In 2013, our systems processed over $100 billion of estimated travel spending and more than 1.1 trillion system messages, with nearly 100,000 system messages per second at peak times. Our investment in innovation has enabled our Travel Network business to evolve into a dynamic marketplace providing a broad range of highly scalable solutions from distribution to workflow to business intelligence. Our investment in our Airline and Hospitality Solutions offerings has allowed us to create a broad portfolio ofvalue-added products for our travel supplier customers, ranging from reservations platforms to operations solutions typically delivered via highly scalable and flexible SaaS and hosted platforms. We have a long history of engineering innovative travel technology solutions. For example, we believe we were the first GDS to enable airlines to sell ancillary products like premium seats through the GDS, the firstthird-party provider to automate passenger reaccommodation during large operational disruptions and the first GDS to launch a B2B app marketplace for our travel agency customers that allows them to customize and augment our Travel Network platform. Our innovation has been consistently recognized in the market, with awards including the Business Traveler Innovation Award from the Global Business Travel Association, an unaffiliated entity, in 2011 and 2012, for which we applied and were one of eight award winners chosen by popular vote. We were also recognized by the InformationWeek 500 in 2013 as one of the Most
157
Innovative Users of
Business Technology for the eleventh consecutive year. These 500 companies are invited to apply and are chosen by InformationWeek, an unaffiliated entity, based on their unconventional approaches and new ways of solving complex business problems with IT.
We continue to improve our existing solutions and expand our offerings to meet the constantly evolving needs of our customers. For example, as demonstrated in the following graphic, we have current orin-development solutions that address five of the six major technology investment priorities highlighted in the recent SITA Survey of major airline carriers:
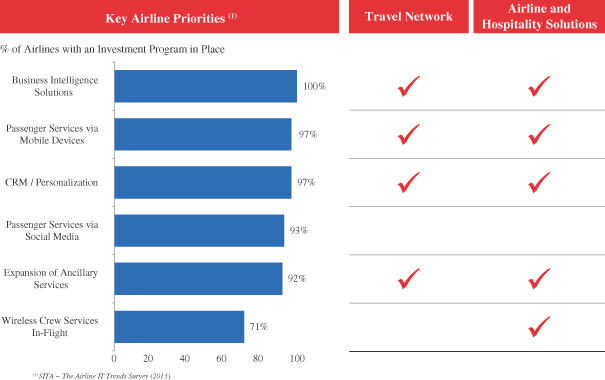

Our SaaS and hosted technology platforms allow us to serve our customers primarily through a recurring,transaction-based revenue model based primarily on travel events such as air segments booked, PBs or other relevant metrics. For the year ended December 31, 2013, 91% of our Travel Network and Airline and Hospitality Solutions revenue, on a weighted average basis, was Recurring Revenue. See “Method of Calculation” for a description of Recurring Revenue. This model has benefits for both our customers and for us. For our customers, our delivery model allows otherwise fixed technology investments to be variable, providing flexibility in their cost base and smoothing investment cycles as they grow, while enabling them to benefit from the continuous evolution of our platform. For us, this recurring,transaction-based revenue model allows us to expand with our customers in the travel industry, a segment of the economy whichthat has grown significantly faster than global GDP over the last 40 years. Since our revenues are primarily linked to our customers’ transaction volumes, rather than to airline budget cycles or cyclicalend-customer pricing, which we believe are more volatile than transaction volumes, this model facilitates greater stability in our business, particularly during negative economic cycles. In addition, as a technology solutions and transaction processing company, we do not take airline, hotel or other inventory risk, nor are we directly exposed to fuel price volatility or labor unions.
Our recurring,transaction-based revenue model, combined with ourhigh-quality products, reinvestment in our technology,multi-year customer contracts and disciplined operational management, has contributed to our strong growth profile, as demonstrated by our Adjusted EBITDA having increased each year since 2008 despite
158
the global
economic downturn and resulting travel slowdown. From 2009 through 2013, we grew our revenue and Adjusted EBITDA at 7% and 11% CAGRs, respectively, and increased Adjusted EBITDA margins by 396394 bps, in each case, excluding Travelocity and intersegment eliminations. During the same period, net loss attributable to Sabre Corporation decreased 37% and net loss margin decreased by 258 bps. See “Non-GAAP“Non-GAAP Financial Measures” and “Summary—Summary“Summary Historical and Pro Forma Consolidated Financial and Other Data” for additional information regarding Adjusted EBITDA, including a reconciliation of Adjusted EBITDA to the most directly comparable GAAP measure.
We currently operate through threetwo business segments: (i) Travel Network and (ii) Airline and Hospitality Solutions,Solutions. On December 16, 2014, we announced that we had received a binding offer from Bravofly Rumbo Group to acquire lastminute.com and (iii) Travelocity. on January 23, 2015, we announced the sale of Travelocity.com to Expedia, Inc. See “Summary–Recent Developments.” We will reclassify and report all of the businesses associated with the Travelocity segment as discontinued operations in our 2014 Annual Report on Form 10-K as the segment was considered held for sale as of December 31, 2014.
Our segments operate with shared infrastructure and technology capabilities, and provide key solutions to our customers. Collectively, our integrated business enables the entire travel lifecycle, from route planning topost-trip business intelligence and analysis. The graphic below provides illustrative examples of the points where Sabre enables the travel lifecycle:
Travel Network is our global B2B travel marketplace and consists primarily of our GDS and a broad set of capabilities that integrate with our GDS to add value for travel suppliers and travel buyers. Our GDS offers content from a broad array of travel suppliers, including approximately 400 airlines, 125,000 hotel properties, 30 car rental brands, 50 rail carriers, 16 cruise lines and 200 tour operators, to tens of thousands of travel buyers, including online and offline travel agencies, TMCs and corporate travel departments. Our Airline and Hospitality Solutions business offers a broad portfolio of software technology products and solutions, primarily through SaaS and hosted models, to approximately 225 airlines, 17,00017,500 hotel properties and 700 other travel suppliers. Our flexible software and systems applications help automate and optimize our customers’ business processes, including reservations systems, marketing tools, commercial planning solutions and enterprise operations tools. Travelocity iswas our family of online consumer travele-commerce businesses through which we provideprovided travel content and booking functionality primarily for leisure travelers. In August 2013, Travelocity entered into an exclusive,long-term strategic marketing agreement with Expedia, which was recently amended and restated in March 2014 to reflect changed commercial terms.Expedia. Under the Expedia SMA, Expedia will powerpowered the
159
technology platforms of Travelocity’s existing U.S. and Canadian websites, as well as provide access to Expedia’s supply and customer service platforms. Additionally, in the first quarter of 2014, Travelocity recently sold its TPN business, a B2B loyalty and private label website offering, to Orbitz. Furthermore, on December 16, 2014, we announced that we had received a binding offer from Bravofly Rumbo Group to acquire lastminute.com and on January 23, 2015, we announced the sale of Travelocity.com to Expedia, Inc. Following our sale of Travelocity.com to Expedia, Inc., the Expedia SMA was terminated. See “Summary–Recent Developments.”
For the yearnine months ended September 30, 2014 and 2013, we recorded revenue of $2,229 million and $2,303 million, respectively, net income attributable to Sabre Corporation of $23 million and loss of $127 million respectively, and Adjusted EBITDA of $617 million and $584 million, respectively, reflecting a 1% and (6)% net income (loss) margin and a 28% and 25% Adjusted EBITDA margin, respectively. For the nine months ended September 30, 2014, Travel Network contributed 63%, Airline and Hospitality Solutions contributed 25%, and Travelocity contributed 12% of our revenue (excluding intersegment eliminations). During this period, shares of Adjusted EBITDA for Travel Network, Airline and Hospitality Solutions, and Travelocity were approximately 77%, 25% and (2)%, respectively (excluding corporate overhead allocations such as finance, legal, human resources and certain information technology shared services). See “Recent Developments” regarding our Travelocity business segment moving to discontinued operations.
For the years ended December 31, 2013 and December 31, 2012, we recorded revenue of $3,050 million and $2,974 million, respectively, gross margin of $1,145 million and $1,155 million, respectively, net loss attributable to Sabre Corporation of $100 million and $611 million, respectively, and Adjusted EBITDA of $791 million and $787 million, respectively, reflecting a 3% and 21% net loss margin and a 26% and 26% Adjusted EBITDA margin, respectively. For additional information regarding Adjusted EBITDA, including a reconciliation of Adjusted EBITDA to the most directly comparable GAAP measure, see “Non-GAAP Financial Measures” and “Summary—Summary Consolidated Financial Data.” For the year ended December 31, 2013, Travel Network contributed 58%, Airline and Hospitality Solutions contributed 23%, and Travelocity contributed 19% of our revenue (excluding intersegment eliminations). During this period, shares of Adjusted EBITDA for Travel Network, Airline and Hospitality Solutions, and Travelocity were approximately 77%, 21% and 2%, respectively, (excluding corporate overhead allocations such as finance, legal, human resources and certain information technology shared services). See “Recent Developments” regarding our Travelocity business segment moving to discontinued operations.
For additional information regarding Adjusted EBITDA, including a reconciliation of Adjusted EBITDA to the most directly comparable GAAP measure, see “Non-GAAP Financial Measures” and “Summary Historical and Pro Forma Consolidated Financial and Other Data.”
We are headquartered in Southlake, Texas, and employ approximately 10,0008,000 people in approximately 60 countries around the world. We serve our customers throughcutting-edge technology developed in six facilities located across four continents.
Our Competitive Strengths
We believe the following attributes differentiate us from our competitors and have enabled us to become a leading technology solutions provider to the global travel industry.
Broadest Portfolio of Leading Technology Solutions in the Travel Industry
We offer the broadest, most comprehensive technology solutions portfolio available to the travel industry from a single provider, and our solutions are key to the operations of many of our travel supplier and travel agency customers. Travel Network, for example, provides a key technology platform that enables efficient shopping, booking and management of travel itineraries for online and offline travel agencies, TMCs and corporate travel departments. In addition to offering these and other advanced functionalities, it is a valuable distribution and merchandising channel for travel suppliers to market to a broad array of customers, particularly outside their home countries and regions. Additionally, we provide SaaS and hosted solutions that run many of the most important operations systems for our travel supplier customers, such as airline and hotel reservations systems, revenue management, crew scheduling and flight operations. We believe that our Travel Network and Airline and Hospitality Solutions offerings address customer needs across the entire travel lifecycle, and that we
160
are the only company that provides such a broad portfolio of technology solutions to the travel industry. This breadth affords us significant competitive advantages including the ability to leverage shared infrastructure, a common technology organization and product development. Beyond scale and efficiency, our position spanning the breadth of the travel ecosystem helps us to develop deep domain expertise and to anticipate the needs of our customers. Taken together, the value, quality, and breadth of our technology, software and related customer services contribute to our strong competitive position.
Global Leadership Across Growing End Markets
We operate in areas of the global travel industry that have large and growing addressable customer bases. Each of our businesses is a leader in its respective area. Sabre is the leading GDS provider in North America, Latin America, and APAC, with 55%, 57%, and 39% share ofGDS-processed air bookings, respectively, in 2013. Additionally, Airline Solutions is the second largest provider of reservations systems, with an 18% global share of 2012 PBs, according to T2RL PSS. We believe that we have the leading portfolio of airline marketing and operations products across the solutions that we provide. We also believe our Hospitality Solutions business is the leader in hotel reservations, handling 27% ofthird-party hospitality CRS hotel rooms through our GDS in 2013. See “Method of Calculation” for an explanation of the methodology underlying ourGDS-processed air bookings share andthird-party hospitality CRS hotel room share calculations.
Looking forward, we expect to benefit from attractive growth in our end markets. Euromonitor expects a 4%4.5% CAGR in air travel and hotel spending from 2013 to 2017combined between 2014 and 2018 (Euromonitor Database). According to Gartner Enterprise, technology spending by the air transportation and hospitality industriessectors is expected to grow significantly from $60 billion in 2013 to over $70 billion in 2017. Within our Travel Network business, we also expect our presence in economies with strong GDP growth and regions with faster air traffic growth, such as APAC, Latin America and MEA,EMEA, will further contribute to the growth of our businesses. Similarly, our Airline Solutions reservations products, customers are weighted towardfaster-growing LCC/hybrids, which represented approximately 29% of our 2013 PBs based on T2RL data. In 2012, LCC/hybrids represented approximately 45% of our 2012 PBs. T2RL’s LCC/hybrid group included JetBlue and Lion Airlines in 2012, which we consider LCC/hybrid carriers. T2RL’s 2013 calculation excludes these carriers from the LCC/hybrid group. If these two carriers were included as LCC/hybrids in the 2013 calculation, LCC/hybrids would have represented approximately 41% of our 2013 PBs.
Innovative and Scalable Technology
Two pillars underpin our technology strategy: innovation and scalability. To drive innovation in our travel marketplace business, we make significant investments in technology to develop new products and add incremental features and functionality, including advanced algorithms, decision support, data analysis and other valuable intellectual property. This investment is supported by our global technology teams comprising approximately 4,000 employees.employees and contractors. This scale andcross-business technology organization creates efficiency and a flexible environment that allows us to apply knowledge and resources across our broad product portfolio, which in turn fuels innovation. In addition, our investments in technology have created a highly scalable set of solutions across our businesses. For example, we believe our GDS is one of the most heavily utilized SOA environments in the world, processing more than 1.1 trillion system messages in 2013, with nearly 100,000 system messages per second at peak times. Our Airline and Hospitality Solutions business employs highly reliable software technology products and SaaS and hosted infrastructure. Compared to traditionalin-house software installations, SaaS and hosted technology offers our customers advantages in terms of cost savings, more robust functionality, increased flexibility and scale, and faster upgrades. As an example of the SaaS and hosted scalability benefit, our delivery model has facilitated an increase in the number of PBs in our Airline Solutions business from 288 million to 478 million from 2009 to 2013. Our investments in technology maintain and extend our technology platform which has supported ourindustry-leading product innovation. On the scale at which we operate, we believe that the combination of an expanding network and technology investments continues to create a significant competitive advantage for us.
161
Stable, Resilient, and Diversified Business Models
Travel Network and much of Airline and Hospitality Solutions operate with atransaction-based business model that ties our revenue to a travel supplier’s transaction volumes rather than to its unit pricing for an airplane ticket, hotel room or other travel product.Travel-related businesses withvolume-based revenue models have generally shown strong visibility, predictability and resilience across economic cycles because travel suppliers have historically sought to maintain traveler volumes by reducing prices in an economic downturn.
Our resilience is also partially attributable to our non-exclusive multi-yearnon-exclusivemulti-year contracts, in our Travel Network business. For example, although most of our contracts have terms of one to three years, contracts with our major travel buyer and travel supplier customers, which represent the majority of Travel Network revenue, have five to ten year terms and three to five year terms, respectively. Similarly, our Airline Solutions business has contracts that typically range from three to seven years in length, and our Hospitality Solutions business has contracts that typically range from one to five years in length. Our Travel Network and Airline and Hospitality Solutions businesses also deliver solutions that are integral components of our customers’ businesses, and have historically remained in place once implemented. In our Travel Network business and our Airline and Hospitality Solutions business, 94% and 84% of our revenue was Recurring Revenue, respectively, in 2013.
In addition to being stable, our businesses are also diversified. Travel Network and Airline and Hospitality Solutions generate a broad geographic revenue mix, with a combined 43% of revenue from these segments generated outside the United States in 2013. None of our travel buyers or travel suppliersuppliers accounted for more than 10% of our revenue for the years ended December 31, 2013 or December 31, 2012, respectively.2012.
Strong,Long-Standing Customer Relationships
We have strong,long-standing customer relationships with both travel suppliers and travel buyers. These relationships have allowed us to gain a deep understanding of our customers’ needs, which positions us well to continue introducing new products and services that add value by helping our customers improve their business performance. In our Travel Network business, for example, by providing efficient and quality services, we have developed and maintained strong customer relationships with TMCs, major corporate travel departments and travel suppliers, with some of these relationships dating back over 20 years. Through our Travelocity business, we have gained important insights into what online travel companies need in order to best serve their customers, and we are able to leverage that knowledge to develop products and services to address those needs.
We believe that our strong value proposition is demonstrated by our ability to retain customers in a highly competitive marketplace. For each of the years ended December 31, 2013, 2012 and 2011, our Customer Retention rate for Travel Network was 99%. For our Airline Solutions business, our Customer Retention rate was 98%, 96% and 96%, for the years ended December 31, 2013, 2012 and 2011, respectively, and our Customer Retention rate for our Hospitality Solutions business was 96%, 96% and 98%, for the same periods, respectively. See “Method of Calculation” for a description of Customer Retention.
Deep and Experienced Leadership Team with Informed Insight into the Travel Industry
Our management team is highly experienced, with comprehensive expertise in the travel and technology industries. Many of our leaders have more than 20 years of experience in multiple segments of the travel industry and have held positions in more than one of our businesses, which provides them with a holistic and interdisciplinary perspective on our company and the travel industry.
By investing in training, skills development and rotation programs, we seek to develop leaders with broad knowledge of our company, the industry, technology, and specific customer needs. We also hire externally as needed to bring in new expertise. Our blend of experience and new hires across our team provides a solid foundation on which we develop new capabilities, new business models and new solutions to complex industry problems.
162
Our Growth Strategy
We believe we arewell-positioned for future growth. First, we expect the continued macroeconomic recovery to generate travel growth, compounded by the continuing trend towards the outsourcing of travel technology. In addition, we arewell-positioned in market segments which are growing faster than the overall travel industry, with leading market positions in our Travel Network business in Latin America and APAC. In our Airline Solutions reservations systems, LCC/hybrids, which are growing traffic faster than traditional airlines, accounted for approximately 45%29% of our PBs in 2012.2013 based on T2RL data. In 2012, LCC/hybrids represented approximately 45% of our 2012 PBs. T2RL’s LCC/hybrid group included JetBlue and Lion Airlines in 2012, which we consider LCC/hybrid carriers. T2RL’s 2013 calculation excludes these carriers from the LCC/hybrid group. If these two carriers were included as LCC/hybrids in the 2013 calculation, LCC/hybrids would have represented approximately 41% of our 2013 PBs. Supported by these industry trends, we believe both our Travel Network and our Airline and Hospitality Solutions businesses have significant opportunities to expand their customer bases, further penetrate existing customers, extend their geographic footprint and develop new products. WeBy executing on the following strategies and, when appropriate, selective strategically aligned acquisitions, we intend to capitalize on these positive trends by executing on the following strategies:trends:
Leverage ourIndustry-Leading Technology Platforms
We have made significant investments in our technology platforms and infrastructure to develop robust, scalable software as well as SaaS and hosted solutions. We plan to continue leveraging these investments across our organization, particularly in our Travel Network and Airline and Hospitality Solutions businesses, to catalyze product innovation andspeed-to-market. We will also continue to shift toward SaaS and hosted infrastructure and solutions as we further develop our product portfolio.
Expand our Global Travel Marketplace Leadership
Travel Network intends to remain the global B2B travel marketplace of choice for travel suppliers and travel buyers by executing on the following initiatives:
| • | Targeting Geographic Expansion: From 2009 to 2013, we increased ourGDS-processed air bookings share in the Middle East, Russia and |
| • | Attracting and Enabling New Marketplace Content: We are actively adding new travel supplier content which generates revenue directly through incremental booking volumes associated with the new content and reinforces the virtuous cycle of our Travel Network business: as we add more supplier content to our marketplace, we experience increased participation from travel buyers, which, in turn, encourages travel suppliers to contribute additional content to our marketplace. We have been successful in converting notable carriers that previously only used direct distribution, such as JetBlue and Norwegian, to join our GDS, and we believe there is a similar opportunity to increase the participation ofless-penetrated content types like hotel properties, where we estimate that |
| • | Continuing to Invest in Innovative Products and Capabilities: The development ofcutting-edge products and capabilities has been critical to our success. We plan to continue to invest significant resources in solutions that address key customer needs, including mobility (e.g., TripCase), data analytics and business intelligence (e.g., Sabre Dev Studio, Hotel Heatmaps, Contract Optimization Services), and workflow optimization (e.g., Sabre Red App Centre, TruTrip). |
163
Drive Continued Airline and Hospitality Solutions Growth and Innovation
Our Airline and Hospitality Solutions business has been a key growth engine for us increasingwith a CAGR of 14% for revenue and 15% for Adjusted EBITDA by 72% from 2009 to 2013. We believe Airline and Hospitality Solutions will continue to drive company growth through a combination of underlying customer and market growth, as well as through the following strategic growth initiatives.
| • | Invest in Innovative Airline Products and Capabilities: We have a long history of investment in innovation. For example, we believe we were the first technology solutions provider to providereal-time revenue integrity and the firstthird-party provider to automate passenger reaccommodation during large operational disruptions. We see a continued opportunity to innovate in areas such as retailing solutions, mobile capabilities, data analytics and business intelligence offerings. |
| • | Continue to Add New Airline Reservations Customers: Over the last |
| • | Further Penetrate Existing Airline Solutions Customers: We believe there is an opportunity to sell more of our extensive solution set to our existing customers. Of our 2013 customers in T2RL’s top 100 passenger airlines, |
| • | Invest Behind Rapidly Growing Hospitality Solutions Business: Our Hospitality Solutions business has grown rapidly, with 19% revenue CAGR from 2009 to 2013, and we are focused on continuing that growth going forward. We currently have initiatives to grow in our existing footprint and expand our presence in APAC and EMEA, which collectively accounted for only 32% of our Hospitality Solutions business revenue in 2013. We plan to accomplish this organically and through |
Continue to Focus on Operational Efficiency Supported by Leading Technology
As an organization, we have a track record of improving operational efficiency and capitalizing on our scalable technology platform and operating leverage in our business model. We have expanded Adjusted EBITDA margins in our Travel Network business by over 550 bps since 2009 in our Travel Network business while growing the business and introducing new products. We intend to continue to increase our operational efficiency by following a shared capabilities, technology and insights approach across our businesses. For example,Through a comprehensive labor strategy, we are driving operating efficiencies and cost savings through a proactive approach that focuses on adding and retaining talent and achieving the Expedia SMA we intendoptimal personnel mix across our global development centers. We expect the outcome of this program to reduce directbetter scale development costs associated with Travelocity and expect to improve our Adjusted EBITDA by providing our customers with the benefit of Expedia’s long-term investment in its technology platform to increase conversion, improve operational efficiency, and shift our focus to Travelocity’s strengths in marketing and retailing. Additionally, Travelocity recently sold its TPN business, a B2B loyalty and private label website offering, to Orbitz. We will continue to work toward identifying operational and technological efficiencies while continuing to support our investments and strategic priorities to maintain our leadership position in the travel industry.over time.
164
Our Businesses
Travel Network
Travel Network is our global B2B travel marketplace and consists primarily of our GDS and a broad set of solutions that integrate with our GDS to add value for travel suppliers and travel buyers. The distribution platform component of a GDS serves the role of a transaction processor for the travel industry, while thevalue-added integrated solutions make the GDS a true marketplace. Our GDS facilitates travel by efficiently bringing together travel content such as inventory, prices, and availability from a broad array of travel suppliers, including airlines, hotels, car rental brands, rail carriers, cruise lines and tour operators, with a large network of travel buyers, including online and offline travel agencies, TMCs and corporate travel departments. We deliver value to our travel buyer customers by providing them with comprehensive and competitive travel content. Similarly, we bring value to our travel supplier customers by providing efficient andcost-effective distribution and merchandising services reaching approximately 400,000 travel agents. We are one of the largest GDS providers in the world, with a 36% share ofGDS-processed air bookings in 2013. More specifically, we are the #1 GDS provider in North America and also in higher growth markets such as Latin America and APAC. In those three markets, our GDS-processsedGDS-processed air bookings share was approximately 50% on a combined basis in 2013. See
“Method “Method of Calculation” for an explanation of the methodology underlying ourGDS-processed air bookings share calculation. The following chart illustrates our share ofGDS-processed air bookings as of December 31, 2013:
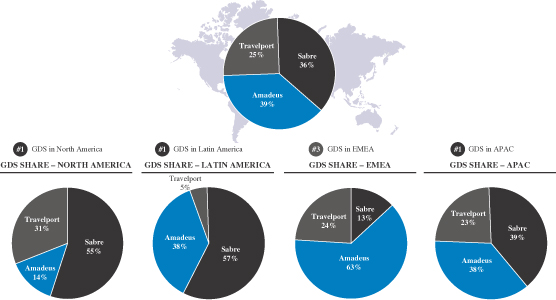
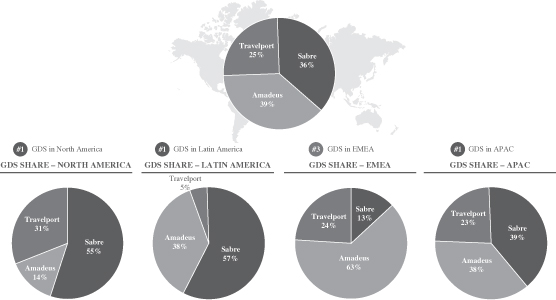
Source: internal estimates
We expect Travel Network’s market position in economies with robust GDP growth, such as APAC, Latin America and MEA,EMEA, will drive continued growth for our businesses, while the strength of our GDS in large, developed regions, such as North America and Europe, positions us for stable growth as the recovery from the global economic downturn continues. In addition, we serve a large portion of APAC through our regional joint venture partners, including Abacus and Infini. 100% of the GDS transactions of these joint venture partners are processed and powered by our GDS.
Travel buyers can shop and book approximately 400 airlines, 125,000 hotel properties, 30 car rental brands, 50 rail carriers, 16 cruise lines and 200 tour operators using our GDS. In 2013, our systems processed over $100 billion of estimated travel spending, including sales from our joint venture partners. In addition, we believe
165
that our business benefits from a virtuous cycle. As we add more supplier content to our marketplace, we experience increased participation from travel buyers. This, in turn, encourages travel suppliers to contribute additional content to our marketplace, driving a virtuous cycle.
Our travel marketplace also includes advanced capabilities and automated solutions that, among other things, enable travel suppliers and travel buyers to operate more efficiently, optimize their performance across various metrics and provide insight into customer booking patterns. Through our GetThere products, we offer a suite of tools that tailor these services to corporate travel departments, providing capabilities such as facilitating rate negotiations, simplifying compliance with corporate travel policies and tracking business travel online. We are continually investing to enhance our solutions offering, such as our data analytics and business intelligence capabilities, and to enable emerging travel technologies and innovative apps, including mobile. For example, our product offerings include TripCase, our mobile and web traveler services platform that provides passengers with mobile itinerary management andreal-time trip details.
Relative to our competitors, we believe we are the travel marketplace of choice among many global travel buyers, with:
Strategy
We are executing on a number of strategies to support our future growth going forward, including:
Targeting Geographic ExpansionExpansion.. We intend to accelerate the growth of our leadingtechnology-enabled solutions by deepening our presence inhigh-growth geographies. We believe that our strategies will position our solutions to better serve travel suppliers and travel buyers in those geographies as travel consumption grows. With our global content, strength in the corporate segment, andindustry-leading search technology, we have a demonstrated ability to rapidly expand our geographic footprint. For example, from 2009 to 2013, we increased ourGDS-processed air bookings share in the Middle East, Russia and BrazilColombia by 744 bps, 327 bps and 267990 bps, respectively. We are currently pursuing a number of initiatives to continue our geographic expansion, including:
| • | European growth: Expand our presence in Europe, includinghigh-growth Eastern European markets, by leveraging our global relationships with travel suppliers and travel buyers operating in those markets and by adapting our product capabilities to meet regional needs. For example, we are implementing dynamic schedule updates to additional European airlines to improve scheduling accuracy through the GDS, and we are integrating hotel pricing components in certain markets to improve travel agent workflow. |
| • | APAC growth: Secure our leadership position by optimizing our strategic partnerships, leveraging our corporate relationships and continuing to addAPAC-focused travel suppliers. For example, we have recently added Jetstar and PAL Express to our GDS. |
| • | Latin American growth: Add agency customers and enhance travel content in key Latin American countries with differentiated and innovative products. For example, Total Trip, a graphical module that sells prepaid hotels and is integrated with the Sabre Red Workspace, has gained significant popularity among our Latin American customers. |
166
Attracting and Enabling New Marketplace Content.We are actively adding content to reinforce the virtuous cycle of Travel Network as well as generate revenue directly through incremental bookings volumes associated with the new content. We believe there are two broad categories of opportunities to do so:
| • | Add new supplier segments: Historically, we have grown the number and participation levels of travel suppliers. For example, we have increased the utilization of our GDS by airlines such as JetBlue and Virgin Australia. Beyond air content, we believe there is a significant opportunity to add other types of content, such as hotel properties. We estimate that, as of December 31, 2013, |
| • | Add new travel content from existing suppliers: We aim to increase the types of travel content available on our GDS from existing suppliers. Many travel suppliers, especially airlines, are separately monetizing ancillary products that were previously bundled with seat inventory or other core content at no additional charge. Ancillary revenue was worth more than |
Continuing to Invest in Innovative Products and Capabilities. In addition to extending our marketplace and technology leadership with our GDS solution, we strive to develop new products to enhance the value of our Travel Network offering. We have focused our investment efforts on addressing travel suppliers’ and travel buyers’ most significant business needs, including:
| • | Mobile: Mobile platforms have created new ways for customers to research, book and experience travel, and are expected to account for over |
| • | Data analytics and business intelligence: Travel suppliers and travel buyers are increasingly focused on data analytics to inform and enable betterdecision-making. In fact, according to the SITA Survey, 100% of surveyed airlines are investing in business intelligence solutions. Ourdata-rich platform contains significanttravel-related data such as shopping and purchasing behavior. Our customers can benefit from tools that allowdata-driven insights. We are developing products to satisfy this demand. |
167
For example, Sabre Dev Studio offers travel andnon-travel businesses access to the most comprehensive travel data set in the world; over 3,500 companies rely on Sabre’s application programming interfaces, travel data streams, and notification services to power their applications and websites. Hotel Heatmaps allow hotel suppliers to analyze shopping and conversion volume by customer segment over time. Contract Optimization Services uses sophisticated analytics around booking trends, origin/destination data and other data to help travel management companies and their corporate customers optimize their travel policies. We believe these and several other business intelligence solutions position us well to capitalize on the positive secular trends around data analytics. |
| • | Workflow optimization: We believe that our innovative workflow tools are significant differentiators that encourage TMCs and corporate participants in the travel ecosystem to choose Travel Network. As a result, the development of new and improved workflow tools has long been a tenet of our innovation |
strategy. For example, with Sabre Red Workspace, we created a pioneering, fully graphical interface that is now used by thousands of travel agents. In 2012, we introduced Sabre Red App Centre, becoming the first GDS to provide an online B2B marketplace to connect travel buyers with application providers. With access to over 150 different applications, travel agencies can service a wide range of business needs, from tracking agent productivity to converting currency to building trip plans for clients. As part of our recognition in the InformationWeek 500 in 2012, InformationWeek also chose to highlight Sabre Red App Centre as one of the Top 20 Great Ideas to Steal of 2012. In 2013, we announced our plans to develop TruTrip, which is designed to help corporate travel managers and TMCs manage and track bookings regardless of the channel through which they were booked. |
Geographic Scope
As of December 31, 2013, approximately 400,000 travel agents in 145 countries on six continents use our GDS. Additionally, more than half of Travel Network’s employees are located outside North America. We are one of the largest GDS providers in the world, with a 36% share ofGDS-processed air bookings in 2013. More specifically, we are the #1 GDS provider in North America and also in higher growth markets such as Latin America and APAC. In those three markets, ourGDS-processed air bookings share was approximately 50% on a combined basis in 2013. See “Method of Calculation” for an explanation of the methodology underlying ourGDS-processed air bookings share calculation. By growing internationally with our TMC and OTA customers and expanding the travel content available on our GDS to target regional traveler preferences, we anticipate that we will maintain share in key developed markets and grow share in Europe, APAC and Latin America.
Internationally, we market our GDS both directly and through joint venture and distribution arrangements. Our marketing partners principally include airlines that have strong relationships with travel agents in APAC and the Middle East as well as entities that operate regional computer reservations systems or othertravel-related network services. With the combined strength of our technology and content as well as our partners’ local commercial skills and market knowledge, these partnerships allow us to gain traction in local markets and grow our share and distribution reach with lower risk. Through these partnerships, we are able to form strong relationships with key airlines and other travel suppliers that we can utilize in our other businesses.
Travel Network’s joint venture and distribution partners include:
168
Key Metrics
During the year ended December 31, 2013, Travel Network generated 368 million Direct Billable Bookings. During the nine months ended September 30, 2014, Travel Network generated 292 million Direct Billable Bookings. Our Recurring Revenue, as a percentage of total Travel Network revenues, was 94% in each of the years ended December 31, 2013, 2012 and 2011. See “Method of Calculation” for an explanation of the methodology underlying ourGDS-processed air bookings share calculation. For additional segment information, see Note 21, Segment Information, to our audited consolidated financial statements included elsewhere in this prospectus.
Product Offering
In its early years, our B2B travel product offering was comprised of our GDS, which had shopping, booking and fulfillment capabilities for airline seats, and later, hotel and other travel inventory. As our travel buyers’ and travel suppliers’ businesses have become increasingly complex, Travel Network adapted its offerings to include a broad set of products and services that bring additional value to our customers and help them use the marketplace more effectively. Today, Travel Network is a global B2B travel marketplace that offers content from a broad array of travel suppliers, including approximately 400 airlines, 125,000 hotel properties, 30 car rental brands, 50 rail carriers, 16 cruise lines and 200 tour operators, to tens of thousands of travel buyers, including online and offline travel agencies, TMCs and corporate travel departments.
169
In addition to our GDS, which provides shopping, booking and fulfillment services, we provide a wide range of products and services to our four customer segments: (i) travel suppliers, (ii) travel agencies, (iii) corporations and travelers, and (iv) other travel industry participants. The following graphic illustrates the various components of our Travel Network business, including the original capabilities supported by our GDS in addition to the enhanced capabilities now available through our global travel marketplace:
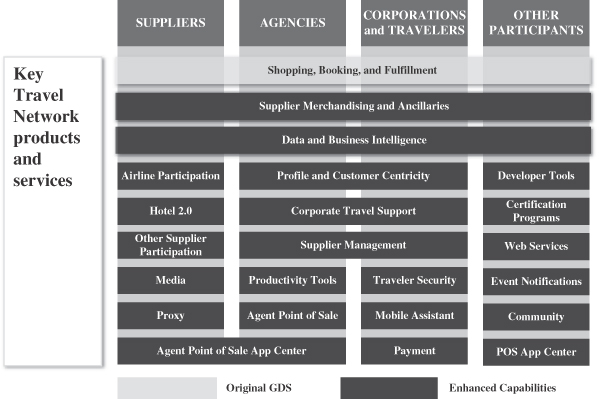
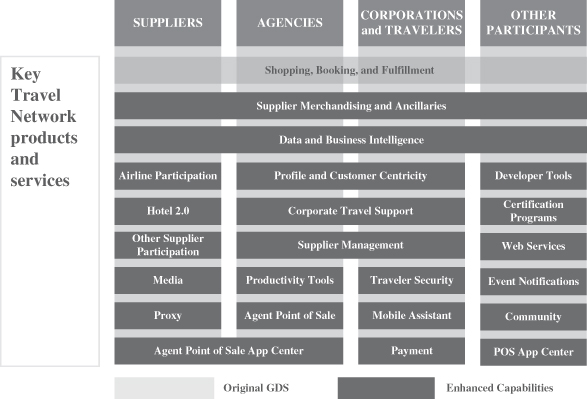
We continue to develop and offerdata-driven business intelligence tools that provide all of our customers with decision support and reporting capabilities to manage customer, vendor, agency and competitive performance. For example, we offer customized low fare shopping tools that automate the ticket shopping and exchange process as well as highly differentiated contract and pricing optimization services that allow agencies, TMCs and corporate travel departments to manage the placement of travel content during the shopping process to optimize travel savings and improve compensation from preferred suppliers and fare markups.
We offer solutions for travel suppliers that help them display, promote and differentiate their brands and products globally; generate, maximize and secure revenue; and obtain, analyze and utilize relevant and accurate data for strategicdecision-making. Our marketplace supports key travel supplier needs, such as airline codesharing and marketing and optimization capabilities. Our solutions also providemulti-channel merchandising capabilities that allow for distribution of ancillary products as well as dynamic pricing, inventory and revenue management tools. For example, Sabre Custom Offers provides travel suppliers with the ability to create personalized offers such as special rates and room upgrades for hotels and premium seating orcheck-in for airlines based on known customer characteristics and preferences.
We regularly measure our ability to find low fares, consistently finding that our GDS outperforms competitors in this critical capacity. The most recentthird-party evaluation by Fried & Partner found that Sabre finds the lowest fares more often than leading competitors in all regions around the world.
170
Travel Network also offers many advanced products and capabilities that add value for travel agencies. Our GDS offers an award-winning user-friendlyaward-winninguser-friendly interface and flexible search parameters, including the option to search for hotels that adhere to Global Sustainable Tourism Council standards. It also offers travel agenciespost-booking automation providing quality control checks, ticketing and documentation support. More than 200,000 offline travel agents in 143 countries access our GDS using Sabre Red Workspace. Sabre Red Workspace is our primary travel agency point of sale software and includes features such as customizable screen displays to maximize preferred supplier agreements, customizable process automation, integration with travel agency applications, tools and websites, and new mobile tablet access points. OTAs can access our GDS through Sabre Web Services, our primary point of sale for customers that require access to our global travel marketplace through web services.
We also provide travel agencies with integrated solutions that allow them to improve workflow, maximize revenue, reduce costs and improve customer service. For example, our ClientBase solution includes a CRM system that provides complete profile, contact and trip management abilities for developing and maintaining customer relationships and increasing productivity as well as a marketing tool that allows travel agents to select suppliers, create, track and send targeted marketing programs and obtain tracking reports to measure success.
For corporations and the travel agencies and corporate travel departments that serve them, we offer GetThere, a tool that automates the travel shopping and booking process, facilitates rate negotiations with suppliers, simplifies compliance with corporate travel policies, tracks information to safeguard business traveler security, integrates with the customer’s expense reporting system and includes customer loyalty and business performance capabilities.
Our B2B travel business product offerings also reach a variety of other travel customer segments. We serve travelers through TripCase, our mobile and web traveler services platform that keeps travelers informed of their trip itineraries and booking information for all reservations made, regardless of booking origin. For new entrants to the travel industry and Sabre-certified third-partySabre-certifiedthird-party developers, we offer the ability to create and monetize Sabre Red Apps, an array of applications designed to meet travel agency needs made available through the Sabre Red App Centre. Through our Sabre Dev Studio, we provide tools, support and revenue opportunities to these new travel industry players andnon-traditional GDS consumers who want access to our travel information and large global network of travel suppliers and travel buyers. Our developer tools include a portfolio of Sabre application programming interfaces travel data streams, software development kits, notification services, documentation and
sample code. Travel Network also provides data, transaction processing and product development services to our regional joint venture partners, including Abacus and Infini.
Customers
Customers of Travel Network include:
As of December 31, 2013, approximately 400,000 travel agents in 145 countries on six continents use our GDS, making reservations with approximately 125,000 travel suppliers around the world. We intend to increase our international presence by expanding the travel content available on our GDS to target regional traveler preferences.
171
Because of strong products and services, the top ten airline and the top ten travel agency customers of our Travel Network business have been customers for more than a decade with their diverse technology needs supported by our broad range of products and services. Our Recurring Revenue percentage for our Travel Network business was approximately 94% in each of the fiscal years ended December 31, 2013, 2012 and 2011.
Airlines. Approximately 400 airlines, including full service carriers and LCC/hybrids from all regions of the world, choose to market and sell their inventory through our GDS. Unlike airline direct distribution, our GDS supports codesharing functionality that allows our airline customers to market their services with partner carriers and creates opportunities for low fare value. Our largest Travel Network suppliers include American Airlines, Delta, US Airways, United, Air Canada, Lufthansa, Air France, British Airways and Emirates, but no customer contributed more than 10% to Travel Network’s revenue for the years ended December 31, 2013, 2012, or 2011. Over the last several years, notable carriers that previously only distributed directly, including JetBlue and Norwegian, have adopted our GDS. Other carriers such as EVA Airways and Virgin Australia have recently upgraded their technical connections and increased the level of content they market and sell through our GDS.
Our contracts with major carriers typically last for three to five year terms and are generally subject to automatic renewal at the end of the term, unless terminated by either party with the required advance notice. Our contracts with smaller airlines generally last for one year and are also subject to automatic renewal at the end of the term, unless terminated by either party with the required advance notice. We haverenewed 24 out of 24 planned renewals in 2013 (representing approximately 25% of our Travel Network revenue for the twelve months ended December 31, 2013). We renewed 28 out of 28 planned renewals in 2014 (representing approximately 22% of our Travel Network revenue for the yeartwelve months ended December 31, 2013) and 242014). We have 38 planned renewals in 2015 (representing approximately 5%20% of our Travel Network revenue for the yeartwelve months ended December 31, 2013), assuming we reach multi-year agreements for the contracts expected to be renewed in 2014.2014). Although we renewed 2428 out of 2428 planned renewals in 20132014 (representing approximately 25%22% of Travel Network revenue for the year ended December 31, 2013)2014), we cannot guarantee that we will be able to renew our airline contracts in the future on favorable economic terms or at all.
Airlines are not contractually required to distribute their content exclusively through our GDS. To provide our travel buyer customers with the widest possible range of travel content, we seek to secure (and generally have been able to secure, with important exceptions) agreements in which the airline agrees to provide most or all of their publicly available fares for distribution through our GDS. However, to ensure competitiveness between the travel agents using our GDS, these agreements also typically require that the airline does not discriminate against travelers that book using our GDS or impose surcharges on such bookings. So long as the airline abides by its content and
other commitments, we generally agree to display, load, and process airline data in anon-discriminatory manner on our GDS. We chargetransaction-based booking fees for each reservation we process, and pricing depends upon various factors, such as the airline’s size, home market, product offering and price, and the length of its relationship with us. These airline contracts contain standard representations and warranties, covenants and indemnification provisions.
Other travel suppliers. A broad portfolio of other travel suppliers also distribute their inventory through our GDS, including approximately 125,000 hotel properties, 30 car rental brands, 50 rail lines, 16 cruise lines and 200 tour operators. We have enjoyedlong-term relationships with our travel suppliers, with some relationships exceeding ten years with respect to cruise lines and thirty years with respect to hotels and car rental companies.
Our largest hotel customers include Hilton, Marriott International, Starwood and Intercontinental. Our contracts with our hotel customers arenon-exclusive and generally last from three to five years and typically renew automatically unless terminated by either party with the required advance notice. Our leading car rental brands include Hertz, Avis Budget and Enterprise. Our contracts with car rental companies and cruise lines arenon-exclusive and generally last from two to seven years, and typically renew automatically unless terminated by either party with the required advance notice. Hotels, car rental companies and cruise lines paytransaction-based booking fees based on the number of rooms booked, the number of bookings for vehicle pickup and the number of sailed cabins, respectively. These hotel, car rental and cruise line contracts contain standard representations and warranties, covenants and indemnification provisions.
172
Corporate travel departments. Travel Network serves corporate travel departments through our GDS and other solutions, particularly through our GetThere products. Due to our service and product offerings, we have relationships with corporate travel departments that have been established for over a decade. Illustrative customers include Accenture, Apple, AT&T, BP, GE, Oracle, UBS and UPS. Corporate travelers are more likely to require flexible scheduling and more complex itineraries, with reservations completed much closer to the departure date, and therefore provide significantly higher revenue per trip. As of December 31, 2013, over 80% of the Business Travel News Corporate Travel 100, which are the corporations with the largest travel expenditures, choose to use our global travel marketplace.
Our contracts with major corporate customers typically last three to five years and generally renew automatically for successive one to three year periods unless terminated by either party with the required advance notice. Corporate travel buyers pay aone-time set up fee and monthly fees based on the number of bookings made through the system. These contracts with corporate travel departments contain standard representations and warranties, covenants and indemnification provisions.
Travel agenciesagencies.. OTAs and TMCs were our two largest global travel agency segments in 2013. Our principal OTA customers are Expedia, Travelocity and Despegar. The four largest global TMCs are American Express Travel, Carlson Wagonlit Travel, BCD Travel, and Hogg Robinson Group, each of which has had anon-exclusive business relationship with us for more than 10 years. We serve large travel agencies and TMCs that process travel for the U.S. government. We also have thousands of other regional travel agency customers that serve business, leisure and/or niche travelers.
We typically havenon-exclusive, five to ten year contracts with our major travel agency customers. Our contracts with TMCs and offline travel agencies typically renew automatically, but the vast majority of our contracts with online travel agencies do not automatically renew. Most travel agencies can terminate the contract anytime without cause with the required advance notice. A meaningful portion of our travel agency agreements, typically representing approximately 15% to 20% of our bookings, are up for renewal in any given year.
A travel agency contracts with us for use of our technology, which enables and enhances the agency’s business operations by providing efficient access to broad travel supplier content and the ability to book, reserve and manage such content. We typically provide travel agencies with incentive consideration for each booking
that generates revenue for us from a travel supplier, sometimes after certain minimum booking levels are met. Thisrevenue-sharing arrangement incentivizes travel agencies to consolidate demand and use our GDS efficiently. Our contracts with larger travel agencies often increase the incentive consideration when the travel agency processes a certain volume or percentage of its bookings through our GDS. Although we generally provide incentive consideration on a periodic basis over the term of the contract, sometimes we provide incentive consideration in advance based on an anticipated level of bookings, and the travel agency must repay or rebate some or all of the incentive consideration if the anticipated level of bookings is not met. Smaller agencies do not typically have volume orshare-based incentive consideration of this kind. Our contracts with travel agencies contain standard representations and warranties, covenants and indemnification provisions.
Travelers.Travelers. Travel Network serves travelers directly through TripCase, our mobile and web traveler services platform, and through GetThere, for business travelers. We are also expanding our offerings to business travelers through initiatives such as enhanced online and mobile access to itinerary and trip planning information.
Other Sellers of Travel and Consumers of Travel Information.Information. We provide travel data, merchandising, transaction processing and product development services to many other customers, including other travel marketplaces, metasearch engines, new entrants to the travel industry, developers and industry analysts.
173
Competitors
Travel Network competes with several other travel marketplace providers, including both regional and global players. In addition to Sabre, other key global B2B travel marketplace providers include:
Sabre is one of the largest GDS providers in the world, with a 36% share ofGDS-processed air bookings in 2013. More specifically, we are the #1 GDS provider in North America and also in higher growth markets such as Latin America and APAC. In those three markets, ourGDS-processed air bookings share was approximately 50% on a combined basis in 2013. We believeGDS-processed air bookings share is a good proxy for overall share in the business because air bookings comprise the vast majority of the total bookings of the three GDSs. See “Method of Calculation” for an explanation of the methodology underlying ourGDS-processed air bookings share calculation.
In addition to competing with other GDSs, our GDS competes with local distribution systems and travel marketplace providers primarily owned by airlines or government entities and operate primarily in their home countries, including TravelSky in China and Sirena in Russia and the Commonwealth of Independent States.
Our GDS also competes with direct distribution by travel suppliers, in which travel suppliers bypass travel agencies and sell their services directly through their own websites and distribution channels. See “Risk Factors—Travel suppliers’ use of alternative distribution models, such as direct distribution models, could adversely affect our Travel Network and Travelocity businesses.” Travel suppliers using the GDS incur a booking fee which is, on average, only approximately 2% of the value of the booking. Therefore, the revenue generated through the GDS leads to a return on investment that is attractive compared to the incremental cost, in part because many of the tickets sold on the GDS platform are more expensivelong-haul and business travel tickets (particularly those originating outside the home country of the airline) as well as tickets with additional booking complexity (e.g., multiple airline itineraries). These platforms also offer a particularlycost-effective means of accessing markets where a travel supplier’s brand is less recognized by using local travel agencies to reach end consumers.
The value of the GDS platform is further reinforced by both the new content that continues to enter the system and by increasing participation rates—we estimate that Representative Airlines have an approximately 90% participation rate in a GDS (weighted by PB volume), as of December 31, 2013. Over the last several years, notable carriers that previously only distributed directly, including JetBlue and Norwegian, have adopted our GDS. Other carriers such as EVA Airways and Virgin Australia have further increased their participation in our GDS. Other studies also underscore the value of the global travel marketplace, including a recent TravelClick study showing that agents’ use of GDSs for hotel booking is growing faster than their use of any other channel.
In addition to other GDSs and direct distributors, there are a number of other competitors in the travel distribution marketplace. New entrants in the travel space, including Google (through Google Hotel Finder and Flight Search), TripAdvisor and Kayak offer metasearch capabilities that direct shoppers to supplier websites and/or OTAs. The impact of these new entrants on the Travel Network business model remains uncertain. See “Risk Factors—Travel suppliers’ use of alternative distribution models, such as direct distribution models, could adversely affect our Travel Network and Travelocity businesses.”Third-party aggregators, such as FareLogix, TravelFusion and AgentWare, offer solutions to book travel content from a variety of sources, including options
174
outside of our GDS, though we believe their offerings have not yet been widely adopted by travel agents or travel suppliers due to cost and technology issues. Also,peer-to-peer options for travel services such as accommodations, tours and car sharing that do not distribute through our GDS are becoming increasingly popular among consumers worldwide.
Our corporate travel booking tool, GetThere, competes with similar offerings from travel agencies, airlines and other travel suppliers, including Concur Technologies, Deem, KDS, eTravel and Egencia.
As with other travel marketplace participants, Travel Network strives to provide a variety of attributes to our travel buyer and travel supplier customers. See “Industry—Global Distribution System and Travel Marketplace—Competitive Environment” for a discussion of the factors on which such participants compete.
Airline and Hospitality Solutions
Our Airline and Hospitality Solutions business offers a broad portfolio of software technology products and solutions, through SaaS and hosted delivery model, to approximately 225 airlines, 17,00017,500 hotel properties and 700 other travel suppliers. In 2013, our Airline Solutions business represented 84% of Airline and Hospitality Solutions revenue and our Hospitality Solutions business represented the remaining 16%. We believe our flexible software and systems applications, including reservations systems, marketing tools, commercial planning solutions and enterprise operations tools, help automate and optimize our customers’ business processes and that our deep domain expertise and product capabilities enable our customers to address more complex business problems as they grow.
Compared to traditionalin-house software installations, our SaaS and hosted models drive value for our customers in a variety of ways: (i) lower total ownership costs (i.e., acquisition costs and operating costs of a solution) as centralized hosting allows our customers to reduce theirin-house software and hardware capital outlay, management and maintenance expenses; (ii) a “pay-as-you-go”“pay-as-you-go” cost structure, which allows our customers to spread their costs over time and link their IT expense with their growth; (iii) more robust functionality than would becost-effective to developin-house; (iv) scalable delivery that allows us to adapt our services to changes in our customers’ technological systems as they grow; and (v) a platform for faster deployment of upgrades compared to traditional installations.
The SaaS and hosted approach also benefits our business. On the revenue side, by moving away fromone-time license fees to recurring monthly fees, our revenue stream has become more predictable. On the cost side, the SaaS and hosted models’ centralized deployment allows us to save time and money by reducing maintenance and implementation tasks and lowering operating costs.
Strategy
We believe the following strategies will help us continue to grow and realize the potential of Airline and Hospitality Solutions:
Invest in Innovative Airline Products and Capabilities. We plan to continue investing in innovative technology products that solve the travel industry’s most pressing business problems, as illustrated below:
| • | Retailing: According to IdeaWorks, ancillary airline revenue, such as the sale of checked bags, was worth more than |
| • | Mobile: Mobile platforms have created new ways for customers to research, book and experience travel, and are expected to account for over |
175
upgrading their systems to allow for delivery of services via mobile platforms from booking tocheck-in to travel management. The recent SITA Survey found that 97% of airlines are investing in mobile channels with the intention of driving mobile across the entire travel experience. This mobile trend also extends to the use of tablets and wireless connectivity by the airline workforce, for example automating cabin crew services and providing flight crews with electronic flight bags, which we are addressing through our eFlight Manager product family. As airlines increasingly leverage mobile workforce solutions, we are investing in mobile capabilities that enable a connected airline, such as electronic flight management solutions that providereal-time connectivity between the cockpit and the airport operations control center. |
| • | Data analytics and business intelligence: Business intelligence is one of the top two most important airline IT investment areas, according to the SITA Survey. We recently acquired PRISM, a leading provider of innovative business intelligence and decision support software for airlines to maximize the value of their corporate contracts. Looking forward, we are investing in products such as a platform for applications that can support data analytics across multiple systems. Rules can be applied to this aggregated data to influencedecision-making, business processes, and forecasts to create innovative solutions in areas such as customer centricity, revenue management, and airline operations. |
Continue to Add New Airline Reservations Customers.Customers. Over the last fourfive years, we have added airline customers representing over 110 million in annual PBs from manyfast-growing airlines such as Etihad Airways, Virgin Australia, JetBlue and LAN. Although the number of new reservations opportunities varies materially by year, in 2013 and 2014, T2RL estimated that contracts representing over 1.31 billion PBs will come up for renewal between 2014 to 2017, of which over 1.1approximately 0.7 billion PBs are from airlines whothat do not pay us PB fees today. As of this filing, airlines won but not yet implemented by Sabre boarded over 220250 million PBs in 2012, according to T2RL.T2RL data. This includes along-term agreement announced in January 2014 with American Airlines for Sabre to be its reservations system provider following its merger with US Airways.
Further Penetrate Existing Airline Solutions Customers.Customers. We believe our solution set is one of the most extensive in the industry and positions us to address the diverse needs of our customers. We have already established commercial relationships with approximately 225 passenger carrier customers,airlines, including 8179 of T2RL’s top 100 passenger airlines, which we believe offers the opportunity to sell more of our solutions to our existing customers. For example, of our 2013 customers in T2RL’s top 100 passenger airlines, 36%35% had one or twonon-reservations solution sets, 35%36% had three to five and 29% had more than five. Historically, the average revenue would have approximately tripled if a customer moved from the first category to the second, and nearly tripled again if a customer moved to the third category. Leveraging our brand, we intend to continue to promote the adoption of our products within and across our existing customers.
Invest Behind Rapidly Growing Hospitality Solutions Business. Our Hospitality Solutions business has grown rapidly, with 19% revenue CAGR from 2009 to 2013, and we are focused on continuing to drive that growth going forward. We currently have initiatives to grow in our existing footprint and expand our presence in APAC and EMEA, which collectively accounted for only 32% of our Hospitality Solutions business revenue in 2013. We plan to accomplish this through a combination of strategies, including increasing our share of wallet with customers, expanding our global reseller network and providing more integrated products. For example, we are planning to launchlaunched in November 2014 the SynXis Enterprise Platform, an integrated Hospitality Management Solution which combines previously siloed products such as reservationshospitality technology solution and PMSs. InSynXis Property Manager, a recent survey we conducted, a majority of hotelshotel property management solution that integrates with ten or more properties would be interested in purchasing such an integrated solution when they next upgrade their PMS.our CRS.
Airline Solutions
Our Airline Solutions business providesindustry-leading and comprehensive software solutions that help our airline customers better market, sell, serve and operate. We offer dynamic and customizable reservations software that supports all the essentials of a passenger service system. Our other software solutions help airlines
176
make important decisions around marketing and planning, merchandising offerings and managing network operations. Over the past 25 years, we have built a broad portfolio of solutions that we believe are distinctive in the industry in their ability to collectively solve airlines’ most complex problems.
We believe we offer the airline industry the broadest choices available in the marketplace across reservations systems, marketing and planning solutions and enterprise operations solutions, due to the following attributes:
Broadest portfolio of integrated solutions. In a fragmented competitive landscape, we offer the broadest portfolio in the business, which enables airlines to leverage a single relationship to address increasingly complex and interconnected business problems. Our competitors, most of which specialize in either one solution or a limited functionality set, cannot easily replicate the comprehensiveness we provide in a single relationship. Our wide range of offerings also equips us with multiple strategies to win new customers and further penetrate our existing customers. For example, we can serve airlines that have already developedin-house functionalities or that use otherthird-party solutions providers by providing solutions that meet needs outside the capabilities of their existing solutions and build on these relationships over time tocross-sell additional solutions.
Flexible capabilities. Unlike other solutions providers, whose offerings are often optimized to serve airlines of a particular scale, our solutions are designed to serve airlines of various sizes and business models, and are able to accommodate change in an airline’s scale and business processes. For example, we believe we arewell-positioned to serve LCC/hybrids as they evolve and add new classes of service, aircraft diversity, international flying and codesharing, becoming more complex and requiring more advanced technology solutions. Furthermore, the modular nature of our products allows us to integrate withnon-Sabre systems.
Industry expertise. Our deep industry expertise allows us to enhance our solutions, as we understand how our solutions integrate with airlines’ technology and business processes. Many of our team members have roots in the airline industry, having used or developed airline systems and processes as former airline employees.
Scalable SaaS delivery. We offer many of our reservations systems and software applications through SaaS and hosted delivery. Not only do the SaaS and hosted models allow the airline to refocus its resources onrevenue-generating andcustomer-facing services instead of on maintaining technology, it also closely links an airline’s software expenses with business growth, as software usage is typically related to passenger volumes or other relevant operating metrics. Through our SaaS and hosted delivery, we are able to consistently release new functionalities and provide software hosting of higher quality than what a typical airline could afford on its own.
Key Metrics
Our reservations system, offered through our SabreSonic CSS product line, is our core offering, comprising 55% of overall Airline Solutions revenue for the year ended December 31, 2013. We consider the following key metrics for our reservations system to be representative of our overall Airline Solutions business:
For additional segment information, see Note 21, Segment Information, to our audited consolidated financial statements included elsewhere in this prospectus.
177
Product Offering
We offer reservations systems and software applications in three functional suites: SabreSonic CSS, Sabre AirVision Marketing & Planning and Sabre AirCentre Enterprise Operations. Our broad portfolio provides a comprehensive solutions offering that automates key airline processes, from planning to reservations to operations. Our solutions are backed by extensive expertise in passenger sales and service, decision support, optimization, business processes, and operations management. Many of our solutions are available through SaaS and hosted delivery and are complementary with one another as well asin-house and otherthird-party solutions, allowing customers to bundle components that best suit their needs.
Airlines typically buy our solutions from within our functional suites, but we are increasingly engaging with our customers oncross-portfolio opportunities at the executive level. To address this opportunity, we are offering several new products and services which combine competencies from across our functional suites to provide holistic solutions. For example, we are developing our mobile platform to include features that enable airlines to extend capabilities to their customers and staff, like mobilecheck-in and itinerary management. We are also investing in a platform for applications that can support data analytics across multiple systems.
As with many software solutions providers, we offer a range of professional services and support services that enable customers to optimize the value of our solutions in the context of their individual business strategies. We also offer business consulting services which draw upon the depth and breadth of our industry expertise to craft solutions that best fit our customers’ specific needs.
Reservations Systems: SabreSonic Customer Sales & Service
Our SabreSonic CSS reservations offerings provide comprehensive capabilities around managing sales and customer service across an airline’s diverse touch points. These capabilities are designed to drive airline revenue, operational efficiency, and customer experience. Our core platform and variousadd-on solutions are designed to serve airlines of various sizes and business models and are able to accommodate change in an airline’s scale and business processes. For example, we believe we arewell-positioned to serve LCC/hybrids as they evolve and add new services, such as new classes of service, aircraft diversity, international flying and codesharing, becoming
more complex and requiring more advanced technology solutions. SabreSonic CSS includes the following solution families:
Solution Family | Description | |
Sales & reservations | Fully integrated core inventory and reservations platform that supports the various steps of an airline’s sales process. Enables airlines to manage and shop inventory, configure offerings, book seats and ancillaries, generate and manage tickets and process payments across all points of direct and indirect sales. This fully integrated solution powers an airline’s internet booking engine, call center, inventory control, loyalty system, data warehouse, and departure control. Customer profiles ensure customer data availability at all touch points, enabling a consistent customer experience and the ability to provide differentiated service to specific passengers. Supports the various sales and service elements of partnership agreements such as interline, codeshare, and alliance participation, allowing airlines to provide a seamless customer experience across partner carriers. Distributes an airline’s merchandising strategy across all channels and | |
| enables inventory management through enhanced inventory controls, segmentation, andreal-time planning. Ticketing capabilities deliver a robust automated exchange and refunds processing solution, provide comprehensive reporting and reconciliation for monitoring sales activities, and enable multiple forms of local and international payment options including credit cards, PayPal, Bill Me Later ande-Bank. |
178
Solution Family | Description | |
Airport solutions | Departure control system that manages passengercheck-in and aircraft boarding; includes passengerself-service capabilities such as mobilecheck-in, kioskcheck-in, webcheck-in and gate reader. Enables automated merchandising of ancillaries and accurate collection of ancillary fees to support an airline’s merchandising strategy, reduces staffing costs withself-service solutions, streamlines agent productivity through an intuitive user interface and ensures efficient flight loading and safety with an integrated weight and balance application. | |
Airline retailing | E-commerce platform that provides fundamental tools for customer acquisition, merchandising, booking and itinerary management. Accessible to consumers via web, mobile, and kiosk. Capabilities include branded fares and ancillary sales, targeted deal management, andself-service exchange and refund management. | |
B2B distribution | Agency management tool that integrates with the airline retailinge-commerce solution to track bookings for agencies that do not participate in electronic billing and settlement plans, automates the sales reporting process and allows airlines to assess the credit liability of its agency community. | |
Platform services | Tool that allows airlines to develop their ownuser-friendly graphical interfaces and automated processes to quickly solve complex business problems across multiplethird-party systems; using this tool, airlines can build their own solutions that are easy to develop, customize, maintain, and deploy in multiple environments. Web services allow airlines to control and differentiate their customer touch points by accessing core sales and service capabilities through a robust, efficient programming interface that focuses on the presentation layer, where differentiation is most critical. | |
| Irregular operations (IROPS) reaccommodation | Integratedadd-on solution that manages reaccommodation of passengers when flight schedules change, including automatic inventory search, itinerary adjustment and passenger notification, and coordinates other aspects of irregular operations recovery, such as crew reassignment and flight schedule adjustment. | |
Customer centricity | Loyalty programs and rules engines for effective CRM, enabling an airline to provide a differentiated customer experience that reflects the airline’s unique brand. Enables an airline to leverage data from multiple systems, combined with rules engines, to create a personalized customer experience across different touch points. | |
Marketing & Planning: Sabre AirVision
Our Sabre AirVision Marketing & Planning is a set of strategic airline commercial planning solutions that focuses on helping our customers improve profitability and develop their brand. Our Sabre AirVision offerings include:
Solution Family | Description | |
| Network planning and scheduling | Solutions that manage and support network planning decisions, such as data analysis to designrevenue-maximizing city pairs and network layouts. Includes tools to manage service dates and times, fleet and airport gate assignments and codeshare agreements against different demand levels, operating cost scenarios, and spill/recapture rates. Airlines can optimize departure times in an entire hub to maximize connections and revenue, evaluate potential profitability of different forecasted routes usingwhat-if scenarios, and perform |
179
Solution Family | Description | |
| Pricing and revenue management | Solutions that manage different aspects of revenue flows for passenger and cargo airlines, includingcross-channel fares management, yield management and revenue integrity to identify and address fraudulent bookings. A pricing decision support solution helps airline analysts examine relevant market data to make optimal pricing decisions. A group management solution manages airline group traffic and optimizes group pricing and availability decisions based on the booking’s impact on total network revenue. Revenue management solutions leverage customer choice modeling to more accurately forecast future demand. A revenue integrity solution performsreal-time reviews of bookings as they are made to identify unintentional and deliberate booking rule violations, and then returns them to inventory so they can be purchased by paying customers. | |
Sales and revenue analysis | Solutions that manage corporate contracts and include market intelligence tools that leverage our proprietary data set, which provides a complete, aggregated view of true market demand developed by blending 50 input sources from across the industry. Commercial intelligence tools also incorporate data from across an airline’s own network to provide analysis for decision support. A revenue accounting solution ensures fast and accurate settlement by automating the accounting of revenue across multiple airline systems. | |
| Onboard catering and provisioning | Solutions that managein-flight services to optimize customer experience and brand perception, including provision planning, ordering materials, galley management and business intelligence. This solution reduceslabor-intensive tasks with automated planning, decreases overall inventory carrying costs, and integrates with multiple systems to centralize pricing decisions and management of multiple vendors. | |
Enterprise Operations: Sabre AirCentre
Our Sabre AirCentre Enterprise Operations is a set of strategic solutions that drive operational effectiveness through holistic planning and management of airline, airport and customer operations. The Sabre AirCentre suite focuses on improving efficiency, controlling costs, and managing change through maximizing operational control. Our Sabre AirCentre offerings include:
Solution Family | Description | |
Flight management | Solutions that manage aircraft flight operations, including developing flight plans and schedules, providing maps and weather information, and tracking aircraft. A flight plan solution determines the optimal route based on airline priorities regarding fuel conservation, time, and revenue, and then it automates the costly routine processes associated with flight plan distribution. Anaircraft-to-ground messaging system reduces delays by providing vital information prior to gate arrival and automating data transfer for aircraft initialization at takeoff. A situational display solution provides an integrated display of flight information, weather, and operational data that enablesreal-time operationaldecision-making to improve efficiency, productivity, and customer experience. An electronic flight bag transitions the airline from a paperless to an electronic environment for flight operations and it also enhances communications and reduces delays by integrating aircraft into the airline network. |
180
Solution Family | Description | |
Operations management | Solutions that forecast and fulfilllong-range crew needs, optimize crew placement while complying with industry and government regulations and schedule requirements, manage crew movements, ensure accurate payroll, assign aircraft to flight schedule during regular and irregular operations and track aircraft movements on the ground. Enable adjustment of aircraft and crew schedules in response to interference causing irregular operations; early monitoring of impending operational disruptions allows for more efficient resolution, reduced costs and improved customer experience. | |
Airport management | Solutions that manage airline usage of airport resources, such as gate operations and usage as well as airport staff scheduling, rosters and operations. A gate management solution optimizeson-time performance throughdemand-driven resourcing, proactively addresses potential issues to reduce operational disruptions, and reduces tarmac waiting times and associated fuel burn. A ground support equipment planning solution uses scenario modeling to forecast ground equipment needs and optimize resource planning across an airport. A hub management solution provides an integrated view of data needed to efficiently plan and manage every aircraft turnaround. A staff management solution enhances airport handling operations through sophisticated planning models, visual alerts, and streamlined information access to help plan and manage optimal daily staff planning and deployment of the associated handling tasks. | |
Customers
As of December 31, 2013, we served approximately 225 airlines of all sizes and in every region of the world, including LCC/hybrids, global network carriers and regional network carriers. We also served approximately 700 other customers such as airports, corporate aviation fleets, governments and tourism boards. We have a global customer base, serving 8179 of T2RL’s top 100 passenger airlines, which represent the majority of PBs worldwide, based on 2012 PBs as reported by T2RL and combined with our own competitive industry insights. We have recently won reservations system contracts from Etihad Airways, LAN, WestJet, Virgin Australia, Virgin America and JetBlue. In January 2014, we reached along-term agreement with American Airlines to be the provider of the reservations system for the merged American Airlines and US Airways entity.
We serve the following types of airlines:
LCC/hybrids. LCC/hybrids are typically carriers that have become more operationally complex as they evolve away from a model focused onlow-cost and simplified operations. LCC/hybrids also tend to be thought leaders in the industry and grow faster, adding codesharing capabilities and new cabin classes, distributing through more indirect channels and diversifying their fleets. Examples of LCC/hybrids include Virgin America, Lion Air and JetBlue. A number of our recent customer acquisitions have been in this customer segment, with approximately 45%29% of our PBs represented by LCC/hybrids in 2012.2013 based on T2RL data. In 2012, LCC/hybrids represented approximately 45% of our 2012 PBs. T2RL’s LCC/hybrid group included JetBlue and Lion Airlines in 2012, which we consider LCC/hybrid carriers. T2RL’s 2013 calculation excludes these carriers from the LCC/hybrid group. If these two carriers were included as LCC/hybrids in the 2013 calculation, LCC/hybrids would have represented approximately 41% of our 2013 PBs. In our airline reservations products, our travel supplier customer base is weighted towards this faster growing customer segment relative to our nearest competitor which has less than 10%. This leading presence among LCC/hybrids provides us with strong organic growth potential, as these carriers have recently grown faster than network carriers. As our growing LCC/hybrid customers demand additional solutions and capabilities, we can take advantage of thesebuilt-in opportunities to further increase our penetration of these customers.
Global network carriers. These carriers are typically largefull-service airlines with a global presence that tend to participate in major global alliances. Examples of global network carriers include Delta, British Airways
181
and Japan Airlines. We estimate that global network carriers, each of which serves over 25 million PBs per year, together boarded approximatelyone-third of PBs worldwide, as reported by T2RL in 2012.
Regional network carriers. These network carriers range in size but generally tend to focus primarily on one geographic region. They tend to be more price sensitive and less operationally complex than the global network carriers. Examples of regional network carriers include Virgin Australia and Vietnam Airlines.Mid-size and large regional carriers, which have a moderate level of complexity in their reservations requirements, are more likely than global network carriers to rely onthird-party solutions providers for reservations functionality.
Our contracts tend to be non-exclusive multi-yearnon-exclusivemulti-year agreements, with our reservations systems contracts generally lasting between five to ten years and software solutions contracts generally lasting between three to five years. We typically price our offerings based on relevant metrics that scale with the customer’s business, such as PBs for reservations or number of aircraft for flight planning. In most cases, airlines commit to annual minimum volumes of such relevant metrics. If actual number of units is less than the annual minimum volume commitment, the airline will pay for any shortfall up to the annual minimum volume commitment. Our fees are generally paid on a monthly basis. Depending on the type of software products purchased, we also charge our customers for consulting fees, software licensing fees and other service fees. These contracts contain standard representations and warranties, covenants and indemnification provisions.
Although airlineAirline reservations contracts representing less than 5% of Airline Solutions’ 2013Solutions’expected 2014 revenue are scheduled for renewal in each of 20142015 and 2015, airline reservationsreservation contracts representing approximately 10%2% of Airline Solutions’ 2013Solutions expected 2014 revenue are scheduled for renewal in each2016. Airline reservations contracts representing approximately 9% of 2016 andAirline Solutions’ expected 2014 revenue are scheduled for renewal in 2017. We cannot guarantee that we will be able to renew our solutions contracts in the future on favorable economic terms or at all.
Competitors
The airline software industry is very competitive and highly fragmented. We are currently aware of over 100 competitors providing many types of reservations systems and software applications solutions.
The closest competitor to us in terms of size and breadth of product offering is Amadeus. We also compete with traditional technology companies such as HP, Unisys and Navitaire (a division of Accenture) and with airline industry participants such as Jeppesen (a division of Boeing), Lufthansa Systems, and SITA. In addition, various point solutions providers such as PROS, ITA Software, Datalex and Travelport compete with us on a more limited basis in several discrete functional areas. We differentiate ourselves by offering the broadest portfolio of software solutions, including reservations, marketing and planning and enterprise operations systems solutions in more than a dozen different areas of expertise. We have a competitive advantage in offering a
comprehensive portfolio through a single relationship as compared to our competitors, most of which specialize in either one solution or a limited functionality set.
We are the second largest provider of passenger reservations systems, with an 18% share of airline PBs, according to T2RL PSS data for 2012, following closely behind Amadeus, which accounts for 21% share, and leading Navitaire, which accounts for 12% share. Despite facing significant implementation costs involved in switching passenger sales and service systems providers, a number of airlines have recently migrated from Amadeus and Navitaire systems to our SabreSonic CSS system, including Etihad Airways and Virgin Australia. Navitaire focuses on serving ultralow-cost carriers, as their passenger sales and service system is a simplified version of the traditional model of selling airline seats, while our system can accommodate the increased complexity of LCC/hybrids and network carriers.
We also believe that we have the leading portfolio of airline marketing and operations products across the solutions that we provide, based on our internal share estimates calculated based on our market intelligence combined with 2012 T2RL airline data.
182
There are also airlines that develop their own software applications and reservations systemsin-house, some of which use athird-party mainframe in their data center and outsource the operation to a services vendor such as IBM or HP. Some regional carriers buy the spare capacity in a larger airline’s reservations systems, which is often based on a common language or an alliance relationship. As airlines continue to move toward relying onthird-party solutions providers for the technology that they currently hostin-house, we believe our flexible, scalable and broad portfolio, SaaS and hosted delivery model, strong penetration in the market with a focus onhigh-growth segments, industry expertise and customer support position us well to continue gaining share in airline software applications and reservations systems.
See “Industry—Travel Technology Solutions—Competitive Environment” for a discussion of the factors on whichthird-party solutions providers compete.
Hospitality Solutions
Our Hospitality Solutions business providesindustry-leading distribution, operations and marketing solutions to more than 17,000approximately 17,500 hotel properties around the world. Our offerings include reservations systems, PMSs, marketing services through our customers’ various distribution channels and consulting services that optimize distribution and marketing. With our comprehensive portfolio of SaaS solutions andvalue-added services, we believe we arewell-positioned to add value in the hotel industry and to address the continued global growth and complexity of operational, distribution and marketing needs.
On September 11, 2014, we acquired the assets of Genares, a global, privately-held hospitality technology company, to further strengthen Sabre’s position as a leading technology partner to hoteliers worldwide. The acquisition added more than 2,300 independent and chain hotel properties to Sabre’s existing Hospitality Solutions portfolio.
We are a leading provider of hospitality solutions to hotel suppliers based on the following attributes:
Leader in reservations. Our CRS platform serves approximately 13,000 properties and approximately 80 chains globally. Historically, generating GDS hotel bookings has been the primary reason that hotels use CRS services. Based on our estimates, in 2013, we had the largest hospitality CRS solution based on our approximately 27% market share ofthird-party hospitality CRS hotel rooms distributed through our GDS, with our next closest competitor at 17%. See “Method of Calculation” for an explanation of the methodology underlying ourthird-party hospitality CRS hotel room share calculation.
Leadingweb-based PMS. Our innovative PMS is used by more than 4,500 properties globally and we believe our product is one of the leading third-party web-basedthird-partyweb-based PMSs. Our PMS platform complements ourindustry-leading CRS platform and we expect to launch an integrated hospitality management suite that will centralize all distribution, operations and marketing aspects to facilitate increased accuracy, elimination of redundancies, and increased revenue and cost savings. In a recent internal survey, a majority of hotels with ten or more properties would be interested in purchasing this type of integrated PMS-CRS web-basedPMS-CRSweb-based solution when they next upgrade their PMS. Over time, we expect that this system will change the industry approach to distribution and guest management, as well as drive greatercross-utilization among our customer base.
Industry expertise. Our deep industry expertise in hotel distribution enhances the value of our solutions, which help hotels manage content across multiple global, regional, and local distribution channels more effectively. Our Hospitality Solutions business leadership team has an average of over 16 years of hospitality industry experience, and our industry expertise stems from relationships with hotels, travel agencies and distribution partners going back over 20 years.
Scalable SaaS delivery. The vast majority of our revenue is generated by solutions delivered as SaaS. This delivery model provides hotels, which previously performed these functions manually, with access to ourstate-of-the-art technology without prohibitive infrastructure costs. Our SaaS solutions platform is sophisticated
183
enough to accommodate any hotel’s needs, from an independent hotel to a global chain with multiple brands and thousands of properties. We believe this sets us apart from many of our competitors and provides our customers with the scale needed to replacein-house technology and focus their resources to serve travelers.
Key Metrics
Our revenue growth is associated primarily with the product functionality and the scalability of our business due to the economies of scale realized through our SaaS delivery model. Our Recurring Revenue as a percentage of total Hospitality Solutions revenue has remained high for our Hospitality Solutions business at 93%, 95% and 92% for the years ended December 31, 2013, 2012 and 2011, respectively. For the year ended December 31, 2013, we processed approximately 14 million room reservations. For additional segment information, see Note 21, Segment Information, to our audited consolidated financial statements included elsewhere in this prospectus.
Product Offering
We offer a comprehensive set of SaaS solutions for hoteliers to manage distribution, operations and marketing across multiple channels and segments globally. Customers can bundle components of our modular and integrated software offerings to create a solution that best suits their specifications. Our solutions can also be integrated with other hotel systems; as an active member of Open Travel Alliance and Hotel Technology Next Generation, we work with the most current XML standard interface specifications so that new interfaces can easily and quickly be added as needed.
Product Category | Description | |
Distribution | SynXis CRS: aweb-based system that distributes a hotel’s inventory to various channels, including the GDS, our proprietary Guest Connect internet booking engine (which includes mobile booking capabilities), call center (which is offered as an outsourced service and/or an agent booking application called Voice Agent) and direct connections tothird-party OTAs. Allows hotels to manage availability, rates and content across these channels and send targeted marketing messages to customers at the point of sale. Includes revenue management tools that integrate with other important property systems to provide a holistic view of a hotel’s revenue streams and help optimize revenue. | |
Operations | Sabre PMS: aweb-based system that helps a hotel manage all aspects of its operations, with functionalities including inventory and reservations management, guest profile management, staffing, cleaning, back office and payment system integration, and a night audit/reporting module. Serves over 4,500 properties, including Red Roof Hotels and nine Wyndham brands. | |
Marketing | Include a broad portfolio of solutions including website design and hosting, search engine optimization,pay-per-click and online advertising, mobile solutions, social media marketing, content management systems, behavioral targeting and custom flash development. Also include the sale of Sabre GDS media, integration with CRM and loyalty systems and email marketing campaign management. | |
|
| |
Other | Consulting services for revenue management, marketing campaign planning and CRM, partnering with our customers to provide education around and maximize the return on investment in our tools and services, identify new revenue opportunities and stay up to date on the latest industry trends.
A Consortia/Request for Proposal (“RFP”) solution targets certain customer segments to generatehigher-revenue bookings than those generated through the internet. Comprised of (i) Sabre Hotel RFP which provides hotels with leads for corporate travel contracts and sends hotel bids to corporations and agencies and | |
184
Product Category | Description | |
| (ii) Consortia Management Program which markets preferred rates to qualified travel agent groups or consortia and helps establish strong relationships with major consortia agents for the corporate direct leisure and general travel agency sectors. | ||
Customers
We have a global customer base with more than 17,000approximately 17,500 hotel properties of all sizes, with 35% of hotel rooms distributed through our GDS for the year ended December 31, 2013 in North America, 9% in Latin America, 34% in EMEA and 22% in APAC. The combination of our functionality, system flexibility, and ease of deployment has enabled significant global growth across all regions and customer segments. We have grown from approximately 10,000 properties in 2008 to approximately 17,500 properties in 2013.2014. The breadth of our customer base provides us with opportunities tocross-sell our many offerings to hotels with which we already have a relationship. The flexibility of our solutions allows us to serve hospitality customers that range from individual hotels to large chains comprised of thousands of properties. For example, we serve strong, stable brands such as Wyndham,Shangri-La Hotels and Resorts, Mandarin Oriental, Peninsula, Rosewood Hotels and Resorts, Preferred Hotel Group, Harrah’s, Kimpton and Red Roof Inns. Our tools help these branded chains manage their brand and distribution mix across multiple properties in multiple regions. In total, we represent approximately 80 different hotel chains and over 8,000 independent hotels. A large part of our strength and success in the independent hotel segment is due to our global reseller network of over 30 partners that allows us to extend our sales presence internationally in acost-effective manner.
Our contracts usually have one to five year terms, and typically renew automatically for one to three year periods until notice of termination is given by either party prior to the end of the current term. Customers whose contracts allow termination at will may have to pay early termination fees or may only terminate after a certain period of time has passed. We receive configuration and monthly subscription fees from our customers. Monthly transaction fees are comprised of reservations fees per room booking, net of cancellations, in that month. Customers have agreed to annual or periodic reservations fee increases in many of our contracts. These contracts contain standard representations and warranties, covenants and indemnification provisions.
Hospitality Solutions contract renewals are relatively evenly spaced, with approximatelyone-third of contracts representing approximatelyone-third of Hospitality Solutions’ 2013 revenue coming up for renewal in any given year. We cannot guarantee that we will be able to renew our solutions contracts in the future on favorable economic terms or at all.
Competitors
We face competition across many aspects of our business but our primary competitors are in the hospitality CRS and PMS fields, including MICROS, TravelClick, Pegasus and Trust, among others. However, in 2013, we had the largest hospitality CRS solution, based on our approximately 27% market share ofthird-party hospitality CRS hotel rooms distributed through our GDS.
185
The chart below reflects thelong-term trend of ourthird-party hospitality CRS market share (compared against certain key competitors) as measured by our GDS bookings. This metric is different from the metric we use elsewhere in this prospectus which is based on share of hotel rooms, and we use it because we believe it accurately reflects the direction of the market over time. See “Method of Calculation” for an explanation of the methodology underlying these two different metrics.
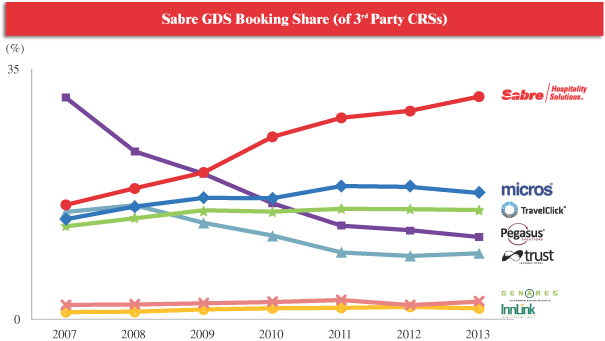
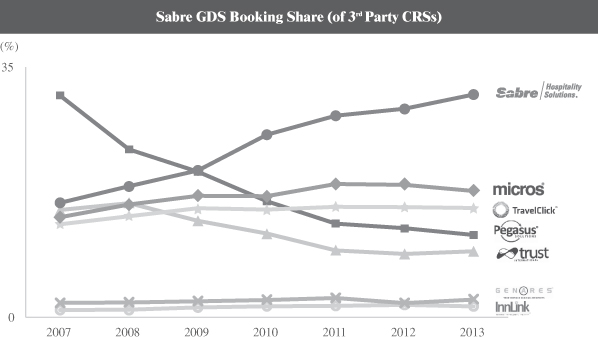
| * | Sabre acquired Generas on September 11, 2014 |
There are also hotels that develop their own software applications and CRSsin-house, including global hotel chains. As hotels continue to move toward relying onthird-party solutions providers for the technology that they currently hostin-house, we believe our flexible, scalable and extensive portfolio, SaaS delivery model, focus onhigh-growth segments, industry expertise and customer support position us well to continue gaining share in the hospitality solutions industry.
See “Industry—Travel Technology Solutions—Competitive Environment” for a discussion of the factors on whichthird-party solutions providers compete.
Travelocity
On December 16, 2014, we announced that we had received a binding offer from Bravofly Rumbo Group to acquire lastminute.com and on January 23, 2015, we announced the sale of Travelocity.com to Expedia, Inc. See “Summary—Recent Developments.”
Travelocity iswas our family of online consumer travele-commerce businesses that servesserved primarily leisure travelers. We connectconnected these travelers with travel products and services fromwell-known global brands. Through our websites, travelers cancould research, shop and book over 400 airlines, over 150,000 hotels, all major car rental companies, most major cruise lines, numerous vacation andlast-minute travel packages as well as access traveler reviews and othertravel-related services.
Travelocity iswas comprised primarily of Travelocity.com, an OTA focusing on the United States and Canada and lastminute.com, an OTA focusing on Europe. Our Travelocity and lastminute.com brands remain well-recognized; for example, in February 2012, Travelocity was named the top travel site by the American Consumer Satisfaction Index, and, according to our internal brand trackers, as of December 2013, we were among the leaders in the United States in terms of brand awareness, as compared with our principal OTA competitors.
186
Founded in 1996, Travelocity.com was the first OTA and one of the first online retailers. In 2013, Travelocity was the fourth largest global OTA, generating $7 billion in annual gross travel sales. Travelocity’s results have been adversely impacted by several factors in recent years, including margin pressure and reduced bookings on its websites. For the three years ended December 31, 2013, Travelocity experienced an approximately 8% compound annual revenue decline due to intense competition within the travel industry. This increased level of competition led to declines in fees on newlong-term supplier agreements signed with several large North American airlines in 2012 and lower transaction volumes, which also impacted our media revenue. In order to help improve Travelocity results, we initiated plans in the third quarter of 2013 to shift our Travelocity businesses in the United States and Canada away from a highfixed-cost model to alower-cost,performance-based revenue structure.
On August 22, 2013, Travelocity entered into an exclusive,long-term strategic marketing agreement with Expedia, which was recently amended and restated in March 2014 to reflect changed commercial terms.Expedia. Under the Expedia SMA, Expedia will powerpowered the technology platforms for Travelocity’s existing U.S. and Canadian websites as well as provideprovided Travelocity with access to Expedia’s supply and customer service platforms. In connection with the Expedia SMA we also entered into the Put/Call Agreement. The Expedia SMA representsrepresented a strategic decision to reduce direct costs associated with Travelocity and to provide our customers with the benefit of Expedia’slong-term investment in its technology platform as well as its supply and customer service platforms, which we expectexpected to increase conversion and operational efficiency and allowsallow us to shift our focus to Travelocity’s marketing strengths.
We believe Travelocity and lastminute.com have strong brand awareness. According to internal surveys, our brand consideration for Travelocity was the second highest among OTAs in North America, and our hotel shopping preference for lastminute.com was the highest among OTAs in the United Kingdom, which is lastminute.com’s primary market. We believe we can use this brand awareness and consideration to drive customer traffic and create opportunities for improving customer conversion. We are focusing our marketing efforts on promoting our brands, increasing brand recognition and customer loyalty, driving customer traffic and optimizing our return on marketing investment through a wide range of advertising channels. These advertising channels include offline advertising, paid search, search engine optimization, personalized traveler communications via our websites and through direct e-mail correspondence with our travelers, affiliate marketing and social media. We intend to continue improving upon Travelocity’s brand messaging and marketing efficiency as well as finding new ways to lead by building deeper connections with customers, investing in differentiated content and engaging customers through social media.
Under the terms of the Expedia SMA, Expedia is required to paypaid us a performance-based marketing fee that will varyvaried based on the amount of travel booked through Travelocity-branded websites that are powered by Expedia. The marketing fee we receive will bereceived was recorded as marketing fee revenue and the cost we incurincurred to promote the Travelocity brand and for marketing will bewas recorded as selling, general and administrative expense in our results of operations.
Pursuant to our Expedia SMA, we will continue to be liable for fees, charges, costs and settlements relating to litigation arising from hotels booked on As a result of transactions being processed through Expedia’s platform instead of the Travelocity platform, priorthe revenue we derived from the merchant, agency and media revenue models declined. In connection with this migration, we were no longer considered the merchant of record for merchant transactions, and therefore we no longer collected cash from consumers, received transaction fees and commissions directly from travel suppliers, received service fees or insurance related revenue directly from customers or directly marketed or received media revenue from advertisers on our websites. We instead collected the marketing fee revenue from Expedia, which was net of costs incurred by Expedia in connection with these activities.
Additionally, Travelocity no longer received incentive consideration from Travel Network as intersegment revenue, and Expedia was not required to the Expedia SMA. However, fees, charges, costs and settlements relating to litigation from hotels booked subsequent to the Expedia SMA will be shared with Expedia according to the terms of the Expedia SMA. The Expedia SMA requires us to guarantee Travelocity’s indemnification obligations for liabilities that may arise out of such litigation matters, which may materially adversely affect our cash flows. Additionally, the Expedia SMA contains standard representations and warranties, covenants and indemnifications.
Expedia will use our GDSTravel Network for shopping and booking of non-air travel for Travelocity.com and Travelocity.ca after the launch of the Expedia SMA.
In the fourth quarter of 2013, we continued our restructuring of Travelocity by implementing a plan to restructure lastminute.com, the European portion of the Travelocity business, in order to allow lastminute.com to operate independently. Additionally, in the first quarter of 2014, Travelocity sold its TPN business to Orbitz. TPN is a B2B offering that provides travel content and booking functionality to, and sells products and services through, loyalty and private label websites for suppliers and distribution partners. On January 23, 2015, we announced the sale of Travelocity.com to Expedia, Inc., following which, the Expedia SMA was terminated. Expedia will still be required to use our GDS for booking of air travel booked through Travelocity.com and Travelocity.ca until 2019, at which time it may choose to use another intermediary for a portion or all of such air travel, subject to earlier termination under certain circumstances. We doExpedia is not expect that Expedia will useusing Travel Network for shopping and booking of a portion of non-air travel for Travelocity.com and Travelocity.ca after the launch of the Expedia SMA. Both parties began development and implementation after signing the Expedia
SMA. As of December 31, 2013, the majority of the online hotel and air offering has been migrated to the Expedia platform, and a launch of the majority of the remainder is expected in early 2014.
As part of our negotiations to amend and restate the Expedia SMA, we also agreed to a separate Expedia Put/Call agreement that supersedes the previous put/call arrangement, whereby Expedia may acquire, or we may sell to Expedia, certain assets relating to the Travelocity business. Our put right may be exercised during the first 24 months of the Expedia Put/Call only upon the occurrence of certain triggering events primarily relating to implementation, which are outside of our control. The occurrence of such events is not considered probable. During this period, the amount of the put right is fixed. After the 24 month period, the put right is only exercisable for a limited period of time in 2016 and 2017 at a discount to fair market value. The call right held by Expedia is exercisable at any time during the term of the Expedia Put/Call. If the call right is exercised, although we expect the amount paid will be fair value, the call right provides for a floor for a limited time that may be higher than fair value and a ceiling for the duration of the Expedia Put/Call that may be lower than fair value.
The term of the amended and restated Expedia SMA is nine years, subject to certain termination provisions, and automatically renews under certain conditions. See “Risk Factors—Risks Related to our Business and Industry—The recently signed strategic marketing agreement with Expedia may not be successfully implemented or may not result in the benefits anticipated by the parties.”
In the fourth quarter of 2013, we continued our restructuring of Travelocity by implementing a plan to restructure lastminute.com, the European portion of the Travelocity business. Travelocity will continue to be managed as one operating segment. Additionally, Travelocity recently sold its TPN business to Orbitz. TPN is a B2B offering that provides travel content and booking functionality to, and sells products and services through, loyalty and private label websites for suppliers and distribution partners.Travelocity.ca.
Key Metrics
For the year ended December 31, 2013, Travelocity gross travel booked was $7 billion. For additional segment information, see Note 21, Segment Information, to our audited consolidated financial statements included elsewhere in this prospectus.
187
Product Offering
Our product offering includes:included:
Competitors
Travelocity’s main competitors include:included:
See “Risk Factors—Risks Related to our Business and Industry—Travel suppliers’ use of alternative distribution models, such as direct distribution models, could adversely affect our Travel Network and Travelocity businesses.”
We competecompeted on the basis of ease of use; price; customer satisfaction; availability of product type or rate; service; amount, accessibility and reliability of information; breadth of products offered and customers reached. We expect that the Expedia SMA will help us enhance the quality and breadth of our travel offerings, our competitive pricing and timely promotions, as well as the customer service and quality of our travel planning content and insight.
Research, Development and Technology
Introduction
We invest heavily in software development, delivery and operational support capabilities and strive forbest-in-class products that we can provide for our customers. We operate standardized infrastructure in our data center environments across hardware, operating systems, databases, and other key enabling technologies to minimize costs onnon-differentiators.
Our architecture has evolved from amainframe-centric transaction processing environment to a secure processing platform that we believe is one of the world’s most heavily used and resilient SOA environments. In 2013, our platform processed more than 1.1 trillion system messages, with peak volumes of nearly 100,000 system messages per second and an average response time of less than three seconds. This represents approximately a 25% CAGR from the approximately 700 billion system messages processed in 2011. Our data centers have more than 14,000 servers/virtual machines and leverage over 10,000 terabytes of storage.
188
A variety of products and services run on this technology infrastructure:high-volume air shopping systems;desktop-access applications providing continuous,real-time data access to travel agents; airline operations and decision support systems; an array of customized applications available through the Sabre Red App Centre; andweb-based services that provide an automated interface between us and our travel suppliers and customers. The flexibility and scale of our standardizedSOA-based technology infrastructure allow us to quickly deliver a broad variety of SaaS and hosted solutions.
Product Development
A technology staff of approximately 4,000 employees and contractors provides varying skill sets to deliver quality and innovation to our customers. This staff is based around the world in six facilities located inDallas-Fort Worth, Boston, Krakow, Bangalore, Montevideo and Buenos Aires. This global footprint puts us closer to our customers and gives our developers insight into local market needs that benefits our products and services. Additional offices around the world also let us use a “follow the sun” approach, meaning that our development teams are active24-hours-a-day in order to provide rapid time to market. We also have the flexibility to adapt quickly andre-allocate work across regions and businesses as needed.
Our core product development is complemented by dedicated analytics and operations research staff. This team, which includes individuals with advanced degrees in operations research, computer science, mathematics
and statistics, applies the latest thinking on advanced algorithms and data analysis to drive continuous improvement in the innovation, efficiency, and performance of our products and services.
Processing and Storage Capacity
Sabre has significant processing and storage capacity to enable efficient processing of business volumes, leveraging multiple data centers around the world for production, certification, integration, and development environments.
The majority of our systems operate in a private cloud environment. This, coupled with a standardized infrastructure stack, enables rapid deployment of capacity and automation across the operational environment. We expect that increasing levels of automation over time will enable us to continue to make better use of our processing and storage capacity and to increase the efficiency and speed with which we can deploy capacity to areas of need across our business.
Operational Reliability and Performance
Our technology strategy is based on achievingcompany-wide stability and performance at the most efficient price point. Significant investment has gone into building a commoditized, centralized and standardized middleware environment with an emphasis on simplicity, security, and scalability. Teams of developers focus solely on the creation and improvement of core services that are leveraged in product development across our businesses, ensuring consistency and a common foundation for operational stability. In addition, our enterprise technology operations team leverageindustry-standard Information Technology Infrastructure Library operational processes.
Disaster Recovery
Our primary data centers are Tier 3 facilities and have been built to provide ahigh-availability environment. They are designed to withstand most natural events, were placed geographically above flood lines and are in areas with very low probability of earthquakes. This physical design is coupled with operational and site management processes designed to eliminate points of failure and provide availability24-hours-a-day,7-days-a-week,365-days-a-year. They have redundant power, advanced cooling systems, network infrastructure, fire detection, and emergency systems. The data centers are also equipped with comprehensive security systems
189
to mitigate potential physical compromise of the facilities or services. See “Risk Factors—Risks Related to Our Business and Industry—Our success depends on maintaining the integrity of our systems and infrastructure, which may suffer from failures, capacity constraints, business interruptions and forces outside our control.”
Data Security
We employ data protection measures in an effort to safeguard both corporate and customer data. Additionally, many initiatives are planned or are already underway to further strengthen our information security position.
We scan our credit card processing environment regularly, run annual internal and external penetration testing to identify vulnerabilities, and conduct annual risk assessments on applications and processes in order to maintain a high degree of data security awareness. See “Risk Factors—Regulatory and Other Legal Risks—Our collection, processing, storage, use and transmission of personal data could give rise to liabilities as a result of governmental regulation, conflicting legal requirements, differing views on data privacy or security breaches” and “Risk Factors—Regulatory and Other Legal Risks—We are exposed to risks associated with payment card industry
(“PCI”) compliance” for more information about the data security related risks and requirements to which we are subject.
Much of our operational computing environment, including our mainframe systems, is managed by athird-party service provider, which allows us to capitalize on the service provider’s operational and security expertise. See “Risk Factors—Risks Related to Our Business and Industry—We rely on the availability and performance of information technology services provided by third parties, including HP, which manages a significant portion of our systems” for more information about our relationship withthird-party service providers.
Product and Service Quality
We operate several labs that have primary accountability for validating the functional capabilities of application code, confirming code compatibility and integration, and testing code performance for high volume resiliency. These capabilities support institutionalized application engineering best practices and formalized processes that mandate the implementation and use of specific testing environments for development, integration, and certification before code moves to production. Our software developmentlife-cycle emphasis includes the execution of documented, traceable standards and measures from initiation of a product through retirement. These include specific architectural reviews, code inspections, andpre-release readiness reviews.
Operational Efficiency
We leverage SOA to build a standard infrastructure across our business, which has allowed us to obtain efficient, streamlined operational support of our services and applications through enhanced and standardized deployment, discovery and visibility across business segments. Our operational environment has common systems and processes across the business, standardized hardware and software,multi-core and virtualization technologies for efficiency and sustainability, and a data center footprint that allows for expansion and quick integration of any new data centers resulting from acquisition of other companies.
The focus on standardization during ourmulti-year move to an agile development approach has allowed teams to increase their throughput and reduce rework. Our product development teams are staying more in synch with internal and external customer needs through more frequent touch points, early demonstration of features and functions, and a continuous focus on quality, ensuring more alignment once products are delivered. In addition, the introduction of supporting tool sets that work well with the methodology and technology architecture forcomponent-level testing have further increased productivity at the team level.
190
Finally, by strategically locating approximately half of our technology staff in various facilities and closely monitoring and adjusting our technology investment, we are able to introduce increasingly more advanced development and operational practices while reducing unnecessary resources and costs.
Intellectual Property
Companies in the travel and travel technology industries increasingly rely on patents, copyrights, trademarks, and trade secrets, as well as licenses of the foregoing. Such companies constantly develop new products and innovations, and the travel and travel technology industries are subject to constant and rapid technological change.
We use software, business processes and proprietary information to carry out our business. These assets and related intellectual property rights are significant assets of our business. We rely on a combination of patent, copyright, trade secret and trademark laws, confidentiality procedures, and contractual provisions to protect these assets and we license software and other intellectual property both to and from third parties. We may seek patent protection on technology, software and business processes relating to our business, and our software and related documentation may also be protected under trade secret and copyright laws where applicable. We may also benefit from both statutory andcommon-law protection of our trademarks. We do not believe that our business is dependent on any single item of intellectual property, or that any single item of intellectual property is material to the operation of our business. Rather, we believe that our intellectual property provides a competitive advantage, and from time to time we have taken steps to enforce our intellectual property rights.
The scope of such intellectual property protection varies depending on the laws of the local jurisdiction, which, in some jurisdictions, may provide less protection than the laws of the United States. Moreover, the duration of protection varies between different types of intellectual property rights. For instance, in the United States patents generally remain in force for 20 years from the filing of the patent application. Our issued United States patents are expected to expire between 2014 and 2033.
Although we rely heavily on our brands, associated trademarks, and domain names, we do not believe that our business is dependent on any single item of intellectual property, or that any single item of intellectual property is material to the operation of our business. However, since we consider trademarks to be a valuable asset of our business, we maintain our trademark portfolio throughout the world by filing trademark applications with the relevant trademark offices, renewing appropriate registrations and regularly monitoring potential infringement of our trademarks in certain key markets. See “Risk Factors—Regulatory and Other Legal Risks—We may not be able to protect our intellectual property effectively, which may allow competitors to duplicate our products and services” and “Risk Factors—Regulatory and Other Legal Risks—Intellectual property infringement actions against us could be costly and time consuming to defend and may result in business harm if we are unsuccessful in our defense” for more information about our intellectual property.
Insurance
We insure against certain corporate risks, including damage to our property and other material assets and business interruption. Our insurance coverage includes:
191
While we consider that our insurance coverage is consistent with industry standards in light of the activities we conduct, we can provide no assurance that our insurance coverage will adequately protect us from all the risks that may arise or in amounts sufficient to prevent material loss. See “Risk Factors—Regulatory and Other Legal Risks—We may not have sufficient insurance to cover our liability in pending litigation claims and future claims either due to coverage limits or as a result of insurance carriers seeking to deny coverage of such claims, which in either case could expose us to significant liabilities.”
Legal Proceedings
While certain legal proceedings and related indemnification obligations to which we are a party specify the amounts claimed, suchthese claims may not represent reasonably possible losses. Given the inherent uncertainties of litigation, the ultimate outcome of these matters cannot be predicted at this time, nor can the amount of possible loss or range of loss, if any, be reasonably estimated, except in circumstances where an aggregate litigation accrual has been recorded for probable and reasonably estimable loss contingencies. A determination of the amount of accrual required, if any, for these contingencies is made after careful analysis of each matter. The
required accrual may change in the future due to new information or developments in each matter or changes in approach such as a change in settlement strategy in dealing with these matters. See “Risk Factors—Regulatory and Other Legal Risks—We are involved in various legal proceedings which may cause us to incur significant fees, costs and expenses and may result in unfavorable outcomes.”
On December 16, 2014, we announced that we had received a binding offer from Bravofly Rumbo Group to acquire lastminute.com. In connection with this binding offer, we expect that certain liabilities will be retained.
Furthermore, on January 23, 2015, we announced the sale of Travelocity.com to Expedia, Inc. Pursuant to the Asset Purchase Agreement entered into with Expedia, we will continue to be liable for pre-closing liabilities of Travelocity, including fees, charges, costs and settlements relating to litigation arising from hotels booked on the Travelocity platform prior to the Expedia SMA. Fees, charges, costs and settlements relating to litigation from hotels booked on Travelocity.com subsequent to the Expedia SMA and prior to the date of the sale of Travelocity.com to Expedia will be shared with Expedia in accordance with the terms that were in the Expedia SMA. We are jointly and severally liable for Travelocity’s indemnification obligations under the Asset Purchase Agreement for liabilities that may arise out of such litigation matters, which could adversely affect our cash flow.
Litigation and Administrative Audit Proceedings Relating to Hotel Occupancy Taxes
Over the past nineten years, various state and local governments in the United States have filed approximately 70 lawsuits against us and other OTAs pertaining primarily to whether Travelocity and other OTAs owe sales or occupancy taxes on some or all of the revenues they earn from facilitating hotel reservations using the merchant revenue model. In the merchant revenue model, the customer pays us an amount at the time of booking that includes (i) service fees, which we collect, and (ii) the price of the hotel room and amounts for occupancy or other local taxes, which we pass along to the hotel supplier. The complaints generally allege, among other things, that the defendants failed to pay to the relevant taxing authority hotel accommodations taxes on the service fees. Courts have dismissed approximately 30 of these lawsuits, some for failure to exhaust administrative remedies and some on the basis that we are not subject to the sales or occupancy tax at issue based on the construction of the language in the ordinance. The Fourth, Sixth and Eleventh Circuits of the United States Courts of Appeals each have ruled in our favor on the merits, as have state appellate courts in Missouri, Alabama, Texas, California, Kentucky, Florida, Colorado and Pennsylvania, and a number of state and federal trial courts. The remaining
192
lawsuits are in various stages of litigation. We have also settled some cases individually, most for nuisance value, and with respect to suchthese settlements, have generally reserved our rights to challenge any effort by the applicable tax authority to impose occupancy taxes in the future.
Among theWe have received recent favorable decisions on January 23, 2013,pertaining to cases in North Carolina, California, Montana, Arizona and Colorado. On August 19, 2014, the California SupremeNorth Carolina Court declined to hear the appeals of the City of Anaheim and the City of Santa Monica from lower court decisionsAppeals affirmed a judgment in favor of Travelocity and other OTAs after concluding they are not operators of hotels, motel or similar-type businesses and therefore are not subject to hotel occupancy tax. The plaintiffs have filed a petition for discretionary review with the North Carolina Supreme Court. On May 28, 2014, an administrative hearing officer in Arizona ruled that Travelocity is not responsible for collecting or remitting local hotel taxes and set aside assessments made by twelve municipalities in Arizona, including Phoenix, Scottsdale, Tempe, and Tucson. On March 27, 2014, a California court of appeals upheld a trial court ruling that OTAs, including Travelocity, are not subject to the City of San Diego’s transient occupancy tax because they are not hotel operators or managing agents. The City of San Diego has filed a petition asking the Supreme Court of California to review the case. This marked the third time that a California appellate court has ruled in favor of Travelocity on the issuequestion of whether localOTAs are subject to transient occupancy taxes apply toin California, the merchant revenue model. Weprior two cases being brought by the City of Anaheim and other OTAs haveCity of Santa Monica. Travelocity also has prevailed on summary judgment motionsat the trial court level in cases brought by San Francisco and Los Angeles. We believe these decisions should be helpful in resolving any other California cases,Angeles, both of which are either currently pending or subsequently brought, in our favor.
Similarly, on January 23, 2013,being appealed by the Missouri Court of Appeals upheldcities. On March 6, 2014, a lowerMontana trial court decision in favor ofruled by summary judgment that Travelocity and other OTAs on the issue of whether local occupancy taxes in the City of Branson applyare not subject to the merchant revenue model. On February 28, 2013, the First District CourtState of Appeals in Florida affirmed a summary judgment ruling in favor of TravelocityMontana’s lodging facility use tax or its sales tax on accommodations and other OTAs on the issue of whether local accommodation taxes levied by Leon County and 18 other counties in Florida apply to the merchant revenue model.vehicles. The Florida Supreme Court is currently reviewing this decision. Likewise, on March 29, 2013, a federal district court in New Mexico granted summary judgment, ruling that OTAs are not vendors subject to hotel occupancy tax in New Mexico. On December 13, 2013, the Eleventh Circuit Court of Appeals affirmed summary judgment in our favor in a case thatlawsuit had been pending in Rome, Georgia, finding there was no evidence that we collected but failed to remit tax, that the counties could not recover on their common law claims, and that there is no basis in Georgia law (statutory or otherwise) for an award of back taxes. On March 5, 2014, the California Court of Appeals affirmed the trial court’s grant of summary judgment in our favor in the hotel occupancy tax litigation brought against us by the City of San Diego. On March 7, 2014, the trial court in our lawsuit with the Montana Department of Revenue, granted our (andwhich has appealed the other OTA defendants’) motiondecision. On July 3, 2014, the Colorado Court of Appeals affirmed a final judgment that Travelocity and OTAs are not liable for summary judgment.lodging taxes as claimed by the City of Denver. The City of Denver has petitioned the Supreme Court of Colorado to review the decision.
Although we have prevailed in the majority of these lawsuits and proceedings, there have been several adverse judgments or decisions on the merits, some of which are subject to appeal.
Among On April 3, 2014, the recent adverse decisions,Supreme Court of Wyoming affirmed a decision by the Wyoming State Board of Equalization that Travelocity and other OTAs are subject to sales tax on June 21, 2013,lodging. Similarly, on March 4, 2014, a state trial court in Cook County, IllinoisWashington D.C. entered final judgment in favor of the District of Columbia on its claim that Travelocity and other OTAs are subject to the District’s hotel occupancy tax. Travelocity has appealed the trial court’s decision. We did not record material charges associated with these cases during the three and nine months ended September 30, 2014 and 2013. As of September 30, 2014, our reserve for these cases totaled $6 million and is included in other accrued liabilities in our consolidated balance sheets.
In late 2012, the Tax Appeal Court of the State of Hawaii granted summary judgment in favor of Travelocity and other OTAs on the issue of whether Hawaii’s transient accommodation tax applies to the merchant revenue model. However, in January 2013, the same court granted summary judgment in favor of the CityState of ChicagoHawaii and against Travelocity and other OTAs ruling thaton the City’s hotelissue of whether the state’s general excise tax, which is assessed on all business activity in the state, applies to the fees retained bymerchant revenue model for the OTAs because, accordingperiod from 2002 to 2011.
We recorded charges of $1 million and $17 million in cost of revenue for the nine months ended September 30, 2014 and 2013, respectively, which represents the amount we would owe to the trial court, OTAs actState of Hawaii, prior to appealing the Tax Appeal Court’s ruling, in back excise taxes, penalties and interest based on the court’s interpretation of the statute. As of September 30, 2014, we maintained an accrued liability of $9 million for this case and have not made material payments in the nine months ended September 30, 2014. Payment of such amount is not an admission that we believe we are subject to the taxes in question.
The State of Hawaii has appealed the Tax Appeal Court’s decision that Travelocity is not subject to transient accommodation tax, and Travelocity has likewise appealed the Tax Appeal Court’s determination that we are subject to general excise tax, as we believe the decision is incorrect and inconsistent with the same court’s prior rulings. If any excise tax is in fact owed (which we dispute), we believe the correct amount should be under $10 million. The ultimate resolution of these contingencies may differ from the liabilities recorded. To the extent our
193
appeal is successful in reducing or eliminating the assessed excise tax amounts, the State of Hawaii would be required to refund such amounts, plus interest. On May 20, 2013, the State of Hawaii issued additional assessments of general excise tax and hotel “managers” when facilitating hotel reservations. The court did not address damages. Afteroccupancy tax for the calendar year 2012. Travelocity has appealed these assessments to the Tax Appeal Court, and these assessments have been stayed pending a final judgment is entered, Travelocity intends to appeal the court’sappellate decision on the basis thatoriginal assessments.
On December 9, 2013, the State of Hawaii also issued assessments of general excise tax for merchant rental car bookings facilitated by Travelocity and other OTAs for the period 2001 to 2012 for which we do not believe that we “manage” hotels.
On July 18, 2014, the State of Hawaii also issued additional assessments of general excise tax and hotel occupancy tax for the calendar year 2013. Travelocity appealed those assessments to the Tax Appeal Court, which has stayed the assessments pending a final appellate decision on the original assessments.
On November 21, 2013, the New York State Court of Appeals ruled against Travelocity and other OTAs, holding that New York City’s hotel occupancy tax, which was amended in 2009 to capture revenue from fees charged to customers by third-party travel companies, is constitutional because such fees constitute rent as they are a condition of occupancy. We haveTravelocity had been collecting and remitting taxes under the statute, so the ruling doesdid not have any impact on ourits financial results in that regard.
On June 21, 2013, a state trial court in Cook County, Illinois granted summary judgment in favor of the City of Chicago and against Travelocity and other OTAs, ruling that Chicago’s hotel tax applies to the fees retained by the OTAs because, according to the trial court, OTAs act as hotel “managers” when facilitating hotel reservations. Travelocity subsequently settled the lawsuit prior to the entry of final judgment or any ruling on damages for an amount not material to our results of operations.
On April 4, 2013, the United States District Court for the Western District of Texas (“W.D.T.”) entered a final judgment against Travelocity and other OTAs in a class action lawsuit filed by the City of San Antonio. The final judgment was based on a jury verdict from October 30, 2009 that the OTAs “control” hotels for purposes of city hotel occupancy taxes. Following that jury verdict, on July 1, 2011, the Western District of TexasW.D.T. concluded that fees charged by the OTAs are subject to city hotel occupancy taxes and that the OTAs have a duty to assess, collect and remit these taxes. We disagree with the jury’s finding that we “control” hotels, and with the Western District of Texas’W.D.T.’s conclusions based on the jury finding, and intend to appeal the final judgment to the United States Court of Appeals for the Fifth Circuit. The verdict against us, including penalties and interest, is $4 million which we do not believe we will ultimately pay and therefore have not accrued any loss related to this case.
We believe the Fifth Circuit’s resolution of the San Antonio appeal may be affected by a separate Texas state appellate court decision in our favor. On October 26, 2011, the Fourteenth Court of Appeals of Texas affirmed a trial court’s summary judgment ruling in favor of the OTAs in a case brought by the City of Houston and the Harris County-Houston Sports Authority on a similarly worded tax ordinance as the one at issue in the San Antonio case. The Texas Supreme Court denied the City of Houston’s petition to review the case. We believe this decision should provide persuasive authority to the Fifth Circuit in its review of the San Antonio case.
On September 24, 2012, a trial court in Washington D.C. granted summary judgment in favor of the District of Columbia on its claim that the OTAs are subject to hotel occupancy tax. The court has not yet addressed any questions related to damages, but is expected to do so during the first quarter of 2014. After final judgment is entered, Travelocity intends to appeal the court’s decision.
In late 2012, the Tax Appeal Court of the State of Hawaii granted summary judgment in favor of Travelocity and other OTAs on the issue of whether Hawaii’s hotel occupancy tax applies to the merchant revenue model. However, in January 2013, the same court granted summary judgment in favor of the State of Hawaii and against Travelocity and other OTAs on the issue of whether the state’s general excise tax, which is assessed on all business activity in the state, applies to the merchant revenue model for the period from 2002 to 2011.
We expensed $19 million and $25 million in the years ended December 31, 2013 and 2012, respectively, which represents the amount we would owe to the State of Hawaii, prior to appealing the Tax Appeal Court’s ruling, in back excise taxes, penalties and interest based on the court’s interpretation of the statute. In 2013, we made payments totaling $35 million and maintained an accrued liability of $9 million. Payment of such amount is not an admission that we believe we are subject to the taxes in question.
Travelocity has appealed the Tax Appeal Court’s determination that we are subject to general excise tax, as we believe the decision is incorrect and inconsistent with the same court’s prior rulings. If any such taxes are in fact owed (which we dispute), we believe the correct amount would be under $10 million. The ultimate resolution of these contingencies may differ from the liabilities recorded. To the extent our appeal is successful in reducing or eliminating the assessed amounts, the State of Hawaii would be required to refund such amounts, plus interest.
On May 20, 2013, the State of Hawaii issued an additional general excise tax assessment for the calendar year 2012. Travelocity has appealed this recent assessment to the Tax Appeal Court, and this assessment has been stayed pending a final appellate decision on the original assessment.
On December 9, 2013, the State of Hawaii also issued assessments of general excise tax for merchant rental car bookings facilitated by Travelocity and other OTAs for the period 2001 to 2012 for which we recorded a $2 million reserve in the fourth quarter of 2013. Travelocity has appealed the assessment to the Tax Appeal Court and does not believe the excise tax is applicable.
The aggregate impact to our results of operations for all litigation and administrative audit proceedings relating to hotel sales, occupancy or excise taxes for the year ended December 31, 2013 was $27 million, which amount includes all amounts expensed for the State of Hawaii during that period. As of December 31, 2013,September 30, 2014, we have a remaining reserve of $18$20 million, included in other accrued liabilities onin the consolidated balance sheet, for the potential resolution of issues identified related to litigation involving hotel sales, occupancy or excise taxes, which amount includes the $9$11 million liability for the remaining payments to the State of Hawaii. As of December 31, 2013, the reserve for litigation involving hotel sales, occupancy or excise taxes was $18 million. Our estimated liability is based on our current best estimate but the ultimate resolution of these issues may be greater or less than the amount recorded and, if greater, could adversely affect our results of operations.
194
In addition to the actions by the tax authorities, four consumer class action lawsuits have been filed against us and other OTAs in which the plaintiffs allege that we made misrepresentations concerning the description of the fees received in relation to facilitating hotel reservations. Generally, the consumer claims relate to whether Travelocity and the other OTAs provided adequate notice to consumers regarding the nature of our fees and the amount of taxes charged or collected. One of these lawsuits was dismissed by the Texas Supreme Courttrial court and suchthis dismissal was subsequently affirmed;affirmed by the Texas Supreme Court; one was voluntarily dismissed by the plaintiffs; one is pending in Texas state court, where the court is currently considering the plaintiffs’ motion to certify a class action; and the last is pending in federal court, but has been stayed pending the outcome of the Texas state court action. We believe the notice we provided was appropriate.
In addition to the lawsuits, a number of state and local governments have initiated inquiries, audits and other administrative proceedings that could result in an assessment of sales or occupancy taxes on fees. If we do not prevail at the administrative level, those cases could lead to formal litigation proceedings.
Pursuant to our Expedia SMA, we will continue to be liable for fees, charges, costsUS Airways Antitrust Litigation and settlements relating to litigation arising from hotels booked on the Travelocity platform prior to the Expedia SMA. However, fees, charges, costs and settlements relating to litigation from hotels booked subsequent to the Expedia SMA will be shared with Expedia according to the terms of the Expedia SMA. The Expedia SMA requires us to guarantee Travelocity’s indemnification obligations for liabilities that may arise out of such litigation matters, which could adversely affect our cash flow.DOJ Investigation
US Airways Antitrust Litigation
In April 2011, US Airways sued us in federal court in the Southern District of New York, alleging violations of the Sherman Act Section 1 (anticompetitive agreements) and Section 2 (monopolization). The complaint was filed two months after we entered into a new distribution agreement with US Airways. In September 2011, the court dismissed all claims relating to Section 2. The claims that were not dismissed are claims brought under Section 1 of the Sherman Act that relate to our contracts with airlines, especially US Airways itself, which US Airways says contain anticompetitive content-related provisions, and an alleged conspiracy with the other GDSs, allegedly to maintain the industry structure and not to implement US Airways’ preferred system of distributing its Choice Seats product. We strongly deny all of the allegations made by US Airways. In September 2013, US Airways issued a report in which it purported to quantifyinitially quantified its damages at either $281$317 million or $425$482 million (before trebling), depending on certain assumptions. We believe both estimates are based on faulty assumptions and analysis and therefore are highly overstated. In the event US Airways were to prevail on the merits of its claim, we believe any monetary damages awarded (before trebling) would be significantly less than either of US Airways’ proposed damage amounts.
Document, discoveryfact and factexpert witness discovery are complete. We are now in the process of completing expert witness discovery. We expect to complete expert depositions in March 2014. Summary judgment motions
are scheduled to be were filed in April 2014 withand in January 2015, the court issued a summary judgment opinion, which has not yet been published in full briefingin order to preserve some of those motions expectedthe confidential information of the parties and other parties. Based on the ruling, the judge eliminated the claims related to a majority of the alleged damages as well as rejected a request that would require us to modify language in our customer contracts. Based on the ruling, the potential remaining range of single damages has been significantly reduced. In respect of all of the remaining claims, US Airways claims damages (before trebling) of either $45 million or $73 million. US Airways has filed a motion for reconsideration on two issues decided in our favor. If the motion for reconsideration is granted in full, US Airways’ damages claim would, per US Airways’ calculations, be completedeither $184 million or $274 million. With respect to all of the remaining claims in May 2014. All court settingsthis case, we believe that our business practices and contract terms are lawful and fair, and we will continue to vigorously defend against the remaining claims. The claims that have been dismissed to date are subject to change. No trial date has been set and we anticipate the most likely trial date would be in September or October 2014, assuming no delays with the court’s schedule and that we do not prevail completely with our summary judgment motions.appeal.
We have and will incur significant fees, costs and expenses for as long as the litigation is ongoing. In addition, litigation by its nature is highly uncertain and fraught with risk, and it is therefore difficult to predict the outcome of any particular matter. If favorable resolution of the matter is not reached, any monetary damages are subject to trebling under the antitrust laws and US Airways would be eligible to be reimbursed by us for its costs and attorneys’ fees. Depending on the amount of any such judgment, if we do not have sufficient cash on hand, we may be required to seek financing through the issuance of additional equity or from private or public financing. Additionally,As noted, US Airways can and hashad sought injunctive relief, though we believe injunctive relief for USwhich the Court in its recent summary judgment ruling dismissed. (US Airways is precluded byhas not sought reconsideration of this aspect of the settlement agreement we reached with American Airlines in 2012, which covers affiliates, including through merger, of American Airlines.Court’s ruling.) If injunctive relief were granted, depending on its scope, it could affect the manner in which our airline distribution business is operated and potentially force changes to the existing airline distribution business model. Any of these consequences could have a material adverse effect on our business, financial condition and results of operations.
195
Department of Justice Investigation
On May 19, 2011, we received a CIDcivil investigative demand (“CID”) from the DOJU.S. Department of Justice (“DOJ”) investigating alleged anticompetitive acts related to the airline distribution component of our business. We are fully cooperating with the DOJ investigation and are unable to make any prediction regarding its outcome. The DOJ is also investigating other companies that own GDSs, and has sent CIDs to other companies in the travel industry. Based on its findings in the investigation, the DOJ may (i) close the file, (ii) seek a consent decree to remedy issues it believes violate the antitrust laws, or (iii) file suit against us for violating the antitrust laws, seeking injunctive relief. If injunctive relief were granted, depending on its scope, it could affect the manner in which our airline distribution business is operated and potentially force changes to the existing airline distribution business model. Any of these consequences would have a material adverse effect on our business, financial condition and results of operations.
Indian Income Tax Litigation
We are currently a defendant in income tax litigation brought by the Indian Director of Income Tax (“DIT”) in the Supreme Court of India. The dispute arose in 1999 when the DIT asserted that we have a permanent establishment within the meaning of the Income Tax Treaty between the United States and the Republic of India and accordingly issued tax assessments for assessment years ending March 1998 and March 1999, and later issued further tax assessments for assessment years ending March 2000 through March 2006. We appealed the tax assessments and the Indian Commissioner of Income Tax Appeals returned a mixed verdict. We filed further appeals with the Income Tax Appellate Tribunal , or the ITAT. The ITAT ruled in our favor on June 19, 2009 and July 10, 2009, stating that no income would be chargeable to tax for assessment years ending March 1998 and March 1999, and from March 2000 through March 2006. The DIT appealed those decisions to the Delhi High Court, which found in our favor on July 19, 2010. The DIT has appealed the decision to the Supreme Court of India and no hearing date has been set.
We intend to continue to aggressively defend against these claims. Although we do not believe that the outcome of the proceedings will result in a material impact on our business or financial condition, litigation is by its nature uncertain. If the DIT were to fully prevail on every claim, we could be subject to taxes, interest and penalties of approximately $26 million as of September 30, 2014, which could have a material adverse effect on our business, financial condition and results of operations. We do not believe this outcome is probable and therefore have not made any provisions or recorded any liability for the potential resolution of this matter.
Litigation Relating to Patent Infringement
In April 2010, CEATS, Inc. (“CEATS”) filed a patent infringement lawsuit against several ticketing companies and airlines, including JetBlue, in the Eastern District of Texas. CEATS alleged that the mouse-over seat map that appears on the defendants’ websites infringes certain of its patents. JetBlue’s website is provided by our Airline Solutions business under the SabreSonic Web service. On June 11, 2010, JetBlue requested that we indemnify and defend it for and against the CEATS lawsuit based on the indemnification provision in our agreement with JetBlue, and we agreed to a conditional indemnification. CEATS claimed damages of $0.30 per segment sold on JetBlue’s website during the relevant time period which totaled $10 million. A jury trial began on March 12, 2012, which resulted in a jury verdict invalidating the CEATS’ patents. Final judgment was entered and the plaintiff appealed. The Federal Circuit affirmed the jury’s decision in our favor on April 26, 2013. CEATS did not appeal the Federal Circuit’s decision, and its deadline to do so has passed. On June 28, 2013, the Eastern District denied CEATS’ previously filed motion to vacate the judgment based on an alleged conflict of interest with a mediator. CEATS appealed that decision and the Federal Circuit heard the appeal on May 5, 2014, and subsequently denied the appeal. On July 22, 2014, CEATS filed a motion for rehearing en banc before the Federal Circuit which was denied on September 5, 2014. On December 4, 2014, CEATS filed a petition seeking a review with the Supreme Court. Defendants are expected to file their response to the petition opposing review in February 2015.
196
Insurance Carriers
We have disputes against twosome of our insurance carriers for failing to reimburse defense costs incurred in theour American Airlines antitrust litigation, which we settled in October 2012. For a description of the American Airlines antitrust litigation, see Note 20, Commitments and Contingencies—Legal Proceedings—Airline Antitrust Litigation, US Airways Antitrust Litigation, and DOJ Investigation to our audited consolidated financial statements included elsewhere in this prospectus. Both carriers admitted there is coverage, but reserved their rights not to pay should we be found liable for certain of American Airlines’ allegations. Despite their admission of coverage, the insurers have only reimbursed us for a small portion of our significant defense costs. We filed suit against the entities in New York state court alleging breach of contract and a statutory cause of action for failure to promptly pay claims. If we prevail, we may recover some or all amounts already tendered to the insurance companies for payment within the limits of the policies and wouldmay be entitled to 18% interest on such amounts. To date, settlement discussions have been unsuccessful. We are currently in the discovery process. The court has not yet scheduled a trial date though we anticipate trial to begin in the latter partsecond half of 2014.2015.
Hotel Related Antitrust Proceedings
On August 20, 2012, two individuals alleging to represent a putative class of bookers of online hotel reservations filed a complaint against Sabre Holdings, Travelocity.com LP, and several other online travel companies and hotel chains in the U.S. District Court for the Northern District of California, alleging federal and state antitrust and related claims. The complaint alleges generally that the defendants conspired to enter into illegal agreements relating to the price of hotel rooms. Over 30 copycat suits were filed in various courts in the United States. In December 2012, the Judicial Panel on Multi-District Litigation centralized these cases in the U.S. District
Court in the Northern District of Texas, which subsequently consolidated them. The proposed class period iswas January 1, 2003 through May 1, 2013. On June 15, 2013, the court granted Travelocity’s motion to compel arbitration of claims involving Travelocity bookings made on or after February 4, 2010. While all claims from February 4, 2010 through May 1, 2013 are now excluded from the lawsuit and must be arbitrated if pursued at all, the lawsuit still covers claims from January 1, 2003 through February 3, 2010. Together with the other defendants, Travelocity and Sabre filed a motion to dismiss. On February 18, 2014, the court granted the motion and dismissed the plaintiff’s claims without prejudice. The court gave the plaintiffs 30 days from the date of its February 18, 2014 order to seekhad moved for leave to file an amended complaint. We deny any conspiracy or any anti-competitive actions and we intend to aggressively defend againstcomplaint but the claims.
Even if we are ultimately successful in defending ourselves in this matter, we are likely to incur significant fees, costs and expenses for as long as it is ongoing. In addition, litigation by its nature is highly uncertain and fraught with risk, and it is difficult to predict the outcome of any particular matter. If favorable resolution of the matter is not reached, we could be subject to monetary damages, including treble damages under the antitrust laws, as well as injunctive relief. If injunctive relief were granted, depending on its scope, it could affect the manner in which our Travelocity business is operated and potentially force changes to the existing business model. Any of these consequences could have a material adverse effect on our business, financial condition and results of operations.
Litigation Relating to Value Added Tax Receivables
In the United Kingdom, Her Majesty’s Revenue & Customs (“HMRC”) asserted that our subsidiary, Secret Hotels2 Limited failed to account for United Kingdom VAT on margins earned from hotels located within the EU. HMRC issued assessments of tax totaling approximately $11 million for the period October 1, 2004 to September 30, 2007. We appealed the assessments and in March 2010 the VAT and Duties Tribunal (the “First Tribunal”)judge denied the appeal. We then appealed tomotion on October 27, 2014 and dismissed the Upper Tribunal (Finance and Tax Chamber) and in July 2011 were successful overturning HMRC’s original assessment. HMRC appealed this decision to the Court of Appeal who on December 3, 2012 found against Secret Hotels2 Limited upholding the decision of the First Tribunal in favor of HMRC. Based upon this Court of Appeal judgment and the limited ability to obtain leave to appeal, we accrued $17 million of expense in discontinued operations during the year ended December 31, 2012, included in liabilities of discontinued operations in the consolidated balance sheet as of December 31, 2012. Secret Hotels2 Limited successfully obtained leave to appeal the Court of Appeal decision to the Supreme Court in 2013, which is the final court of appeal in the United Kingdom, and on March 5, 2014 judgment was given in favor of Secret Hotels2 Limited. We therefore reversed our reserve in 2013 in discontinued operations. Any further opportunities to appeal this decision through the European courts are considered remote.
Additionally, HMRC has begun a review of other parts of our lastminute.com business in the United Kingdom. We believe that we have paid the correct amount of VAT on all relevant transactions as now reinforced by the outcome of Secret Hotels2 caseclaims with the Supreme Court and will vigorously defend our position with HMRC or through the courts if necessary.
Litigation Relating to Patent Infringement
In April 2010, CEATS, Inc. (“CEATS”) filed a patent infringement lawsuit against several ticketing companies and airlines, including JetBlue, in the Eastern District of Texas. CEATS alleged that the mouse-over seat map that appears on the defendants’ websites infringes certain of its patents. JetBlue’s website is provided by our Airline Solutions business under the SabreSonic Web service. On June 11, 2010, JetBlue requested that we indemnify and defend it for and against the CEATS lawsuit based on the indemnification provision in our agreement with JetBlue, and we agreed to a conditional indemnification. CEATS claimed damages of $0.30 per segment sold on JetBlue’s website during the relevant time period totaling $10 million. A jury trial began on March 12, 2012, which resulted in a jury verdict invalidating the plaintiff’s patents. Final judgment was entered and the plaintiff appealed.prejudice. The Federal Circuit affirmed the jury’s decision in our favor on April 26, 2013.
CEATSplaintiffs did not appeal and their opportunity to appeal has expired. The Court closed the Federal Circuit’s decision,case on January 17, 2015 and its deadline to do so has passed. On June 28, 2013, the Eastern District denied CEATS’ previously filed motion to vacate the judgment based on an alleged conflict of interest with a mediator. CEATS has appealed that decision.
Indian Income Tax Litigation
We are currently a defendant in income tax litigation brought by the Indian Director of Income Tax (“DIT”) in the Supreme Court of India. The dispute arose in 1999 when the DIT asserted that we have a permanent establishment within the meaning of the Income Tax Treaty between the United Statesregard this matter as fully and the Republic of India and accordingly issued tax assessments for assessment years ending March 1998 and March 1999, and later issued further tax assessments for assessment years ending March 2000 through March 2006. We appealed the tax assessments and the Indian Commissioner of Income Tax Appeals returned a mixed verdict. We filed further appeals with the Income Tax Appellate Tribunal (the “ITAT”). The ITAT ruled in our favor on June 19, 2009 and July 10, 2009, stating that no income would be chargeable to tax for assessment years ending March 1998 and March 1999, and from March 2000 through March 2006. The DIT appealed those decisions to the Delhi High Court, which found in our favor on July 19, 2010. The DIT has appealed the decision to the Supreme Court of India and no trial date has been set.
We intend to continue to aggressively defend against these claims. Although we do not believe that the outcome of the proceedings will result in a material impact on our business or financial condition, litigation is by its nature uncertain. If the DIT were to fully prevail on every claim, we could be subject to taxes, interest and penalties of approximately $25 million, which could have a material adverse effect on our business, financial condition and results of operations. We do not believe this outcome is probable and therefore have not made any provisions or recorded any liability for the potential resolution of this matter.finally resolved.
Litigation Relating to Routine Proceedings
We are also engaged from time to time in other routine legal and tax proceedings incidental to our business. We do not believe that any of these routine proceedings will have a material impact on the business or our financial condition.
Property
As a company with global operations, we operate in many countries with a variety of sales, administrative, product development, and customer service roles provided in these offices.
Americas: Our corporate and business unit headquarters and domestic operations are located in a property which we own in Southlake, Texas. Travelocity corporate headquarters is located in Westlake, Texas, with a lease that expires in 2017. There are 1615 additional offices across North America and 1413 offices across Latin America that serve in various sales, administration, software development and customer service capacities. All of these additional offices are leased.
Europe: Travel Network has its European regional headquarters in London, United Kingdom, with a lease that expires in 2027. lastminute.com also has its regional headquarters in London, with a lease that expires in 2022. There are 2730 additional offices across Europe that serve in various sales, administration, software development and customer service capacities. All of these additional offices are leased.
APAC: Travel Network and Airline and Hospitality Solutions have the APAC regional operations headquartered in Singapore under a lease that expires in 2017. All of our businesses share a single office. There are 10 additional offices across APAC that serve in various sales, administration, software development and customer service capacities. All of these additional offices are leased.
197
The table below provides a summary of our key facilities as of December 31, 2013:September 30, 2014:
Location | Purpose | Employees | Leased or Owned | |||||||
HEADQUARTERS | ||||||||||
Southlake, Texas, USA | Sabre worldwide corporate and domestic headquarters | Owned | ||||||||
Westlake, Texas, USA | Travelocity corporate headquarters | Leased | ||||||||
London, United Kingdom | Travel Network regional headquarters | Leased | ||||||||
London, United Kingdom | lastminute.com regional headquarters | Leased | ||||||||
Singapore | Travel Network and Airline and Hospitality Solutions regional headquarters | Leased | ||||||||
DEVELOPMENT CENTERS | ||||||||||
Buenos Aires, Argentina | Development Center for Travelocity, Sabre Technology and Travel Network | Leased | ||||||||
Bangalore, India | Development Center for Sabre Technology, Travelocity, Sabre | Leased | ||||||||
Krakow, Poland | Development Center for Sabre technology and Travel Network | Leased | ||||||||
CUSTOMER CARE CENTERS | ||||||||||
| ||||||||||
| ||||||||||
Montevideo, Uruguay | Travel Network and Airline Solutions Customer Care Center | Leased | ||||||||
Government Regulation
We are subject to or affected by international, federal, state and local laws, regulations and policies, which are constantly subject to change. The descriptions of the laws, regulations and policies that follow are summaries and should be read in conjunction with the texts of the laws and regulations. The descriptions set out below do not purport to describe all present and proposed laws, regulations and policies that affect our businesses.
To the best of our knowledge and belief, we are in material compliance with these laws, regulations and policies. We cannot, however, predict the effect of changes to the existing laws, regulations and policies or of the proposed laws, regulations and policies that are described below. We are not aware of proposed changes or proposed new laws, regulations and policies that will have a material adverse effect on our businesses. See “Risk Factors—Regulatory and Other Legal Risks—Any failure to comply with regulations or any changes in such regulations governing our businesses could adversely affect us.”
Computer Reservations System Industry Regulation
GDS Regulation in the EU
GDS operations are regulated in the EU by Council Regulation (EC) No. 80/2009 of the European Parliament and of the Council of January 14, 2009 on a Code of Conduct for computerized reservations systems and repealing Council Regulation (EEC) No. 2299/89 (“Code of Conduct”). The previous legislative framework essentially obliged GDS providers to charge the same booking fee for the same service provided to any airline, where the costs associated with the services was the same, and airlines to provide the same fare content to all the GDS providers in which they participated. The revised Code of Conduct substantially simplifies this regime and gives GDS operators, airlines, and other travel suppliers more flexibility in negotiating their commercial arrangements.
Under the Code of Conduct, particular rules apply to dealings between each GDS, air carriers, and rail transport operators, or participating carriers, and subscribers, which are typically offline or online travel agents. Additional rules apply to air carriers that control or have decisive influence over a GDS (“parent carriers”). As
198
described in an explanatory note of the European Commission, published alongside the Code of Conduct, a participating carrier becomes a parent carrier if it controls a GDS or has sufficient capital or board representation rights to have decisive influence over the GDS. Parent carriers are subject to specific rules, in particular prohibiting discrimination against a GDS competing with the GDS in which they participate, for example, by withholding booking capability or linking incentives or disincentives to the use of a specific GDS. We do not have a parent carrier for purposes of the current EU regulation. The Code of Conduct also seeks to ensure that travel agents’ displays provide a full and neutral selection of the relevant travel information processed by a GDS and that the privacy of end consumers is respected.
Under the Code of Conduct, a GDS may not attach unfair conditions to a contract with a participating carrier or with a subscriber. Additionally, a GDS may not reserve any processing procedure or other distribution facility for one or more participating carriers, including parent carriers, and must keep all participating carriers informed of any changes.
The Code of Conduct provides that small subscribers (employing fewer than 50 persons and with an annual turnover of up to €10 million) may terminate a contract with a GDS vendor on three months’ notice after the first year of the contract.
GDS providers may commercialize marketing, booking and sales data provided that such data is offered with equal timeliness and on anon-discriminatory basis to all participating carriers, including parent carriers. This data is typically provided through Marketing Information Data Tapes.
With regard to the interface with subscribers and end consumers, the GDS must ensure that the principal display of fares corresponding to a particular search is presented to subscribers in a neutral and comprehensive manner, without discrimination for or against any particular participating carrier and without misleading the viewer. From this principal display, the system may thereafter include biased screens; however, the information provided to a consumer must be unbiased unless the consumer specifically requests another display. Also, personal data collected by a GDS in the course of its activities must be processed in a manner compatible with its responsibilities as a data controller under Article 2(d) of Directive 1995/46/EU.
The European Commission monitors the ownership structure and governance model of each GDS, in particular through independent audited reports prepared by each GDS at least every four years.
If the European Commission finds that a GDS provider has, intentionally or negligently, infringed the Code of Conduct, it may require the GDS provider to bring the infringement to an end and impose fines not exceeding 10% of the GDS provider’s total gross turnover in the preceding business year. The Commission may also impose fines for not responding to information requests. These sanctions are civil, not criminal, and may be appealed to the Court of Justice of the European Communities.
We believe that we comply in all aspects with the Code of Conduct. We have no parent carriers and so are not subject to the specific rules in that regard.
GDS Regulation in Canada
There are GDS regulations in Canada issued under the regulatory authority of the Canadian Department of Transportation. On April 27, 2004, a significant number of these regulations were lifted, including the elimination of the “obligated carrier” rule, which required larger airlines in Canada to participate equally in all GDSs, and elimination of the requirement that transaction fees charged by GDSs to airlines benon-discriminatory. Due to the elimination of the obligated carrier rule in Canada, Air Canada, the dominant
Canadian airline, could choose distribution channels that it owns and controls or distribution through another GDS rather than through our GDS.
199
GDS Regulation in the United States
As of July 31, 2004, all GDS regulations in the United States (which only covered airline distribution) expired. Nonetheless, the DOT has retained the authority to intervene as it considers necessary under 49 U.S.C. § 41712. To date, the DOT has not intervened in relation to our GDS activities in the United States, but has provided guidance regarding, among other things, any biasing of air carrier GDS displays. This guidance largely tracks our process with respect to any carrier specific bias we may choose to implement in our primary display. To the best of our knowledge, the DOT has not intervened in relation to the GDS activity of any other provider, with the exception of the display of air carrier codeshares by Amadeus. The DOT is currently considering enacting rules that would require airlines choosing to distribute via a GDS to provide the GDS with any core ancillary fares (seats, bags, etc.). No rule has yet been proposed.
GDS Regulation Elsewhere
GDS services have been regulated in Peru since 2000. In July 2010, India enacted GDS regulations. Both sets of regulations are similar to GDS regulation in the EU. The regulations in Peru and India have not caused any material issues for our business.
Data Protection and Privacy Regulation
We are subject to the application of data protection and privacy regulations in many of the countries in which we operate and any breach of such regulations could result in economic sanctions, which could be material and/or harm our reputation.
In our businesses, customers provide us with personally identifiable information (“personal data”) that has been specifically and voluntarily given. Personal data includes information that can identify a customer or a specific individual, such as name, phone number, ore-mail address. We obtain personal data from airlines, hotels, and other travel suppliers and from travel buyers and other travel retailers with which we have a commercial or business relationship. We collect, use, disclose and transfer personal data in conformance with applicable privacy laws and regulations, and implement technical and organizational measures designed to protect against unauthorized access, use, disclosure, modification, and destruction of personal data that we collect and maintain.
A primary source of privacy regulations to which our operations are subject is the EU Data Protection Directive 1995/46/EC of the European Parliament and Council (October 24, 1995). Pursuant to this directive, individual countries within the EU have specific regulations related to the transborder flow of personal information (i.e., sending personal information from one country to another). The EU Data Protection Directive requires companies doing business in EU Member States to comply with its standards. It provides for, among other things, specific regulations requiring allnon-EU countries doing business with EU Member States to provide adequate data privacy protection when processing personal data from any of the EU Member States. Sabre’s GetThere subsidiary and PRISM subsidiary haveself-certified compliance with theU.S.-E.U. Safe Harbor and theU.S.-Swiss Safe Harbor frameworks. Our GDS business is covered by the EU GDS Code of Conduct.
Many other countries have adopted data protection regimes. An example is Canada’s Personal Information and Protection of Electronic Documents Act (“PIPEDA”). PIPEDA provides Canadian residents with privacy protections with regard to transactions with businesses and organizations in the private sector.
We believe we are in compliance with all applicable laws in this area.
Office of Foreign Assets Control Regulation
The United States has imposed economic sanctions that affect transactions with designated foreign countries, nationals and others. The United States prohibits U.S. persons from engaging with individuals and
200
entities identified as “Specially Designated Nationals,” such as terrorists and narcotics traffickers. These prohibitions are administered by the U.S. Department of the Treasury’s Office of Foreign Assets Control (“OFAC”) and are typically known as the OFAC rules. The OFAC rules prohibit U.S. persons from engaging in financial transactions with or relating to the prohibited individual, entity or country, require the blocking of assets in which the individual, entity or country has an interest, and prohibit transfers of property subject to U.S. jurisdiction (including property in the possession or control of U.S. persons) to such individual, entity or country. Blocked assets (e.g., property or bank deposits) cannot be paid out, withdrawn, set off or transferred in any manner without a license from OFAC. We maintain a global sanctions program designed to ensure compliance with OFAC requirements. Failure to comply with such requirements could subject us to legal and reputational consequences, including criminal penalties. See “Risk Factors—Any failure to comply with regulations or any changes in such regulations governing our business could adversely affect us.”
Other Regulation
We are actively monitoring the status of certain proposed U.S. federal and state legislation related to privacy that may be enacted in the future. It is unclear what effect, if any, the passage of any such U.S. federal or state legislation would have on our businesses.
Our businesses may also be subject to regulations affecting issues such as: trade sanctions, exports of technology, telecommunications, ande-commerce. Any such regulations may vary among jurisdictions. We do not currently maintain a central database of regulatory requirements affecting our worldwide operations and, as a result, the risk ofnon-compliance with the laws and regulations described above is heightened. However, we believe that we are capable of addressing these regulatory issues as they arise.
Employees
As of December 31, 2013,September 30, 2014, we employed approximately 10,0008,000 people. As a global company with significant operations outside the United States, our employee composition reflects the global nature of our business. Approximately 47%46% of our employees are based in the United States and 53%54% in the rest of the world.
Our ability to attract and retain highly qualified employees is important to our success in maintaining leadership in our businesses. Competition for qualified personnel in our industry is intense. We have a policy of usingequity-based compensation programs to reward and motivate significant contributors among our employees. Our employees are not represented by a labor union in the United States.
We have a Works Council covering some of our operations in several European countries, as required by law. A Works Council is a representative body of the employees of a company elected by the employees. Management of the subsidiary must seek thenon-binding advice of the Works Council before taking certain decisions, such as a major restructuring, a change of control or the appointment or dismissal of a member of the board of management. Certain other decisions that directly involve employment matters applicable either to all employees or certain groups of employees require the Works Council’s approval unless approved by the appropriate judicial body.
We have not experienced any work stoppages and consider our relations with our employees to be good.
201
MANAGEMENT AND BOARD OF DIRECTORS
The following table sets forth the name, age, position and description of the business experience as of March 1, 2014January 15, 2015 of individuals who serve as executive officers and directors of our company and brief statements of those aspects of our directors’ backgrounds that led us to conclude that they should serve as directors.
Name | Age | Position | ||
| Chief Executive Officer, President and Director, Sabre | |||
Richard A. Simonson | Executive Vice President and Chief Financial Officer, Sabre | |||
| President and General Manager, Sabre Hospitality Solutions | |||
Rachel A. Gonzalez | 45 | Executive Vice President | ||
Hugh W. Jones | Executive Vice President, Sabre and President, Sabre Airline | |||
|
| |||
|
| |||
Deborah Kerr | 42 | Executive Vice President and Chief Product and Technology Officer, Sabre | ||
William G. Robinson, Jr. | Executive Vice President and Chief Human Resources Officer, Sabre | |||
| Executive Vice President, | |||
Lawrence W. Kellner | 55 | Chairman of the Board of Directors | ||
| 56 |
| ||
| Director | |||
Gary Kusin | Director | |||
Greg Mondre | Director | |||
Judy Odom | 62 | Director | ||
Joseph Osnoss | Director | |||
Karl Peterson | Director | |||
Executive Officers
ThomasTom Kleinis CEO and president of Sabre and has more than 17 years of experience managing large scale, international technology businesses. Before being named CEO and president of Sabre in August 2013, Mr. Klein served as company president since January 2010. His role prior to that was executive vice president, Sabre, and group president of ourSabre Travel Network and Sabre Airline and Hospitality Solutions businesses. Earlier roles included various senior leadership positions within Sabre, both in the United States and in Latin America, and he served as the first director general of Sabre Sociedad Tecnologica,Tecnológica, aMexico-based joint venture company owned by Sabre, Aeromexico and Mexicana. Prior to joining Sabre in 1994, Mr. Kleinhe held a variety of sales, marketing and operations positions at American Airlines and Consolidated Freightways, Inc. Mr. Klein serves on the Board of Directors and chairs the compensation committee for Cedar Fair Entertainment. In 2010, Mr. Kleinhe was appointed to the Board of Directors for Brand USA by the U.S. Secretary of Commerce and now serves as vice chairman. Mr. Klein serves on the Board of Directors and chairs the compensation committee for Cedar Fair Entertainment. Mr. KleinHe also serves on the executive committee of the World Travel &and Tourism Council and the Dean’s Board of the Villanova School of Business. Mr. Klein holds a bachelor’s degree in business administration from Villanova University. Mr. Klein’s long service at our company, travel technology industry experience and his leadership experience make him a valuable asset to our management and our board of directors.
Richard A. Simonson is executive vice president and chief financial officer. He leads the company’s global finance organization and is responsible for all finance and controls, reporting, investor relations and corporate development activities. He brings a combination of experiences with global finance, operations and capital markets focused on technology sectors. Before joining Sabre in March 2013, Mr. Simonson most recently served as CFO and president for business operations at Rearden Commerce, ane-commerce company from March 2011
202
to May 2012 and as an independent advisor to companies in the telecom, media and technology industry from May 2012 to March 2013 and from July 2010 to May 2011. From September 2001 to July 2010 he worked at Nokia Corporation in several global roles based in locations around the world—in Helsinki, Zurich and New York—including executive vice president and general manager of Nokia’s mobile phones unit and more than five years as executive vice president and CFO. Mr. Simonson’s career includes time with Barclays Capital as managing director in the telecom and media investment banking group. He also spent 16 years with Bank of America Securities, where he held various finance and investment banking positions in San Francisco and Chicago. Mr. Simonson currently serves on the board of directors of Electronic Arts, where he is lead Director and chairs the nominating and governanceaudit committee, and Silver Spring Networks, where he chairs the audit committee. He graduated from the Colorado School of Mines and holds an M.B.A. from Wharton School of Business at the University of Pennsylvania.
Gregory T. Webbis executive vice president and president of Travel Network, and before being named to his current role, gained experience with all aspects of the business, from leading the marketing organization to managing our supplier relationships, Travel Network business in Asia and Hospitality Solutions business. Since joining Sabre in 1995, Mr. Webb has held several senior leadership positions including chief marketing officer for both our Travel Network and Airline and Hospitality Solutions businesses and senior vice president of global product marketing for Sabre. Early in his career, he served as director of project consulting and risk assessment for American Airlines and Sabre. Prior to joining the company, Mr. Webb was vice president and chief information officer for BellSouth Telecommunications and also served as a senior consultant at Andersen Consulting. Mr. Webb earned a master’s degree in business administration with an emphasis in marketing from Louisiana Tech University and a bachelor’s degree in advertising from Southern Methodist University. He serves on the board of directors for Abacus.
Hugh W. Jones is executive vice president and president of Sabre Airline Solutions and is a 25-year veteran of the travel industry. Immediately prior to being named to his current role in April 2011, Mr. Jones served as Travelocity’s president and CEO beginning in January 2008 and before that, he held a number of executive roles at Sabre including senior vice president and chief operating officer for our Travel Network and Airline and Hospitality Solutions businesses, where he oversaw airline supplier initiatives and global customer support. He also led Travel Network in North America and served as senior vice president and controller for Sabre. Mr. Jones began his career with American Airlines in 1988 and held a variety of finance positions including financial controller for the airline’s European and Pacific airport, sales and reservations operations. He earned a master’s degree in business administration from Southern Methodist University and a bachelor’s degree in geology and geophysics from the University of Wisconsin.
Carl Sparks is executive vice president and president and chief executive officer of Travelocity, and oversees a portfolio of travel brands including Travelocity.com, Travelocity.ca and Travelocity.mx in North America and lastminute.com in Europe. Mr. Sparks brings an extensive background in e-commerce, consumer brands and retailing to his role. Before joining Travelocity in April 2011, he served as president of Gilt Groupe from 2010 to 2011 and as chief marketing officer from 2009 to 2010, a leading online fashion and travel retailer in the United States and a pioneer in social and mobile commerce. Prior to that, Mr. Sparks held several senior leadership positions at Expedia Inc. between June 2004 and October 2009 including general manager for Hotels.com North America and chief marketing officer for Expedia.com. Earlier in his career, he served as vice president of direct business and brand at Capital One, and held senior marketing and strategy roles at Guinness, PepsiCo and Boston Consulting Group. Mr. Sparks serves on the board of directors of the Dunkin’ Brands Group Inc. and Vonage Holdings Corporation. Mr. Sparks graduated from Princeton University and received his M.B.A. from Harvard University.
Alexander S. Alt is president and general manager of Sabre Hospitality Solutions, and oversees one of Sabre’s two SaaS businesses. Prior to being named president, Mr. Alt served in an expanded chief operating officer role at Sabre Hospitality Solutions, where he oversaw customer care, data services, implementations, call center and similar services. As part of the Sabre Hospitality Solutions management team, he also helped drive overall business strategy. Before joining Sabre in 2012, Mr. Alt served as senior vice president of global development and strategy at Rosewood Hotels & Resorts, where he played a key role in the global growth and expansion of the business. Prior to joining Rosewood Hotels in 2006, he was a senior engagement manager at McKinsey & Company. Earlier in his career, he worked in the finance department of Sabre as a manager and senior analyst in the financial planning and analysis group. Mr. Alt is a member of the Dallas Development Board of The Nature Conservancy.Conservancy and is on the Advisory Board of the School of Undergraduate Studies at the University of Texas in Austin. He graduated from the University of Texas in Austin and received his M.B.A. from Harvard University.
Rachel A. Gonzalez is executive vice president and general counsel of Sabre, a position she assumed in September 2014. She manages the global legal department responsible for legal strategy, regulatory affairs, corporate compliance and government affairs. Prior to joining Sabre, Ms. Gonzalez served as executive vice president, general counsel and corporate secretary with Dean Foods in Dallas, Texas from March 2013 to September 2014, as executive vice president, general counsel designate from November 2012 to March 2013. Ms. Gonzalez joined Dean Foods in 2008 as chief counsel, corporate & securities and served as the deputy general counsel prior to her promotion in November 2012. Previously, Ms. Gonzalez was senior vice president and group counsel with Affiliated Computer Services. Ms. Gonzalez was a partner with the law firm of Morgan, Lewis & Bockius, where she focused on corporate finance, mergers & acquisitions, SEC compliance and corporate governance. Ms. Gonzalez serves on the Board of Directors of Girl Scouts of Northeast Texas and their Audit and Board Development Committees. Ms. Gonzalez earned her J.D. degree from Boalt Hall School of Law the University of California, Berkeley and her bachelor’s degree in comparative literature from the University of California, Berkeley.
Hugh W. Jones is executive vice president and president of Sabre Airline Solutions and is a26-year veteran of the travel industry. Immediately prior to being named to his current role in April 2011, Mr. Jones served as Travelocity’s president and CEO beginning in February 2009 and before that, he held a number of executive roles at Sabre including senior vice president and chief operating officer for our Travel Network and Airline and Hospitality Solutions businesses, where he oversaw airline supplier initiatives and global customer support. He also led Travel Network in North America and served as senior vice president and controller for Sabre. Mr. Jones began his career with American Airlines in 1988 and held a variety of finance positions including financial controller for the airline’s European and Pacific airport, sales and reservations operations. He earned a master’s degree in business administration from Southern Methodist University and a bachelor’s degree in geology and geophysics from the University of Wisconsin.
Deborah Kerr is executive vice president and chief product and technology officer at Sabre, and is responsible for leading the global product and technology organization. Prior to her appointment at Sabre in
203
March 2013, she served as executive vice president, chief product and technology officer at FICO from 2009 to April 2012, a leader in predictive analytics and decision management technology. Prior experience includes senior leadership roles with HP, Peregrine Systems and NASA’s Jet Propulsion Laboratory. Ms. Kerr is a director of the Davis and Henderson Corporation.Corporation and EXLService Holdings, Inc. She was previously a director of Mitchell International from January 2010 until October 2013. Ms. Kerr holds a master’s degree in Computer Science and a bachelor’s degree in Psychology.
William G. Robinson, Jr. is executive vice president and chief human resources officer. He is responsible for leading Sabre’s global human resources organization, including talent management, organizational leadership and culture. Prior to joining Sabre in December 2013, Mr. Robinson served as the senior vice president and chief human resources officer at Coventry Health Care, a diversified managed health care company with 14,000 employees, from 2012 to 2013. From 2010 to 2011, Mr. Robinson served as senior vice president for human resources at Outcomes Health Information Solutions, a healthcare analytics and information company specializing in the optimization and acquisition of medical records. Prior to that, from 1990 to 2010, he worked for General Electric, where he held several human resources leadership roles in diverse industries including information technology, healthcare, energy and industrial. Most recently, he was the human resources leader within the GE Enterprise Solutions division where he led a global team in an organization of 20,000 employees in 200 locations worldwide. Mr. Robinson also previously worked with Outcomes Health Information Solutions LLC. He holds a M.A. in Human Resources Development from Bowie State University and a B.S. in Communications from Wake Forest University.
Sterling MillerGregory T. Webb is executive vice president general counsel and corporate secretarypresident of Sabre, a position he assumed in 2008. He manages the global legal departmentTravel Network, and government affairs group that provides legal counsel to all of our lines of business and represents the company before federal and local courts and government agencies. He also serves as the chief compliance officer. Priorbeing named to his current role, gained experience with all aspects of the business, from leading the marketing organization to managing our supplier relationships, Travel Network business in Asia and Hospitality Solutions business. Since joining Sabre in 1995, Mr. Miller served asWebb has held several senior leadership positions including chief marketing officer for both our Travel Network and Airline and Hospitality Solutions businesses and senior vice president of global product marketing for Sabre. Early in his career, he served as director of project consulting and general counsel for Travelocity. Earlier roles include deputy general counsel for litigation and regulatory affairs for Sabre and an attorneyrisk assessment for American Airlines. BeforeAirlines and Sabre. Prior to joining American Airlines, hethe company, Mr. Webb was vice president and chief information officer for BellSouth Telecommunications and also served as a senior consultant at Andersen Consulting. Mr. Webb earned a master’s degree in business administration with an attorney with the firm of Gallop, Johnson & Neumanemphasis in St. Louis, Missouri. Mr. Miller earned his J.D. degreemarketing from WashingtonLouisiana Tech University in St. Louis and hisa bachelor’s degree in political scienceadvertising from Nebraska WesleyanSouthern Methodist University. He is a memberserves on the board of the Texas and Missouri Bar Associations.directors of Abacus.
Our executive officers will serve until their successors have been duly elected and qualified.
Our Board of Directors
Our business and affairs are managed under the direction of our board of directors. Our Certificate of Incorporation will provideprovides that our board of directors shall consist of at least five directors but no more than eleven directors; provided, however, prior to the time when the Principal Stockholders beneficially own, collectively, less than %40% of the outstanding shares of our common stock, the board of directors shall not
consist of more than nine directors. Our board of directors is currently comprised of eight directors. The directors are elected at the annual meeting of the stockholders and each director serves until the election and qualification of his or her successor.
The board of directors met five times in 2014. All of the directors attended in excess of 75 percent of the total number of meetings of the board and the committees on which they served.
Our Corporate Governance Guidelines provide that directors are expected to attend all or substantially all board meetings and meetings of the committees of the board on which they serve, as well as our Annual Meeting of Stockholders. Our 2014 Annual Meeting was held prior to our initial public offering, and no directors attended that meeting.
204
Thomas KleinTom Klein.. See executive officer bio above.Mr. Klein’s biographical information above under “—Executive Officers.” Mr. Klein’s long service at our company, travel technology industry experience and leadership experience make him a valuable asset to our management and our board of directors.
Lawrence W. Kellner joined the company asnon-executive Chairman of our Board of Directors in August 2013. He has served as President of Emerald Creek Group, LLC, a private equity firm, since 2010. He served as Chairman and Chief Executive Officer of Continental Airlines, Inc., an international airline company, from December 2004 through December 2009. He served as President and Chief Operating Officer of Continental Airlines from March 2003 to December 2004, as President from May 2001 to March 2003 and was a member of Continental Airlines’ board of directors from May 2001 to December 2009. Mr. Kellner serves on the board of directors of The Boeing Company, The Chubb Corporation and Marriott International, Inc. He is active in numerous community and civic organizations and currently serves on the Rice University Board of Trustees and the Board of the Greater Houston Partnership. We believe that Mr. Kellner is a valuable asset and well qualified to sit on our board of directors as a result of his significant travel industry experience, significant corporate governance experience and financial expertise.
Timothy DunnGeorge R. Bravante, Jr. is a TPG Operating Partner and has served on our board of directors since OctoberDecember 2014. He is the co-founder and the managing member of the general partner of Bravante-Curci Investors, LP, an investment firm focusing on real estate investments in California. He has held this position since 1996. Since 2005, he has also been the owner of Bravante Produce, a grower, packer and shipper of premium California table grapes and citrus. Previously, Mr. Bravante served as chairman of the board of ExpressJet Holdings, Inc. from 2005 to 2010 and was a member of its board from 2004 to 2010. From 1994 to 1996, Mr. Dunn joined TPG as directorBravante was President and Chief Operating Officer of operations in 2005, after serving as CFO for HotwireColony Advisors, Inc., a real estate asset management company, and before that as senior vice presidentPresident and CFO at Gap,Chief Operating Officer of America Real Estate Group, Inc., where he was responsible for domesticled strategic management, restructuring and international finance and real estate for the Gap Brand. From 1986 to 1998,disposition of assets. We believe that Mr. Dunn served in various domestic and international finance roles, most recently as vice president and controller, for PepsiCo Restaurants Intl. Mr. Dunn currently serves as a director of Nordstrom FSB. Mr. Dunn graduated magna cum laude from the University of Southern California, where he earned a bachelor’s degree in finance with an emphasis in accounting. He is a certified public accountant in California (inactive status). Because of Mr. Dunn’s financial expertise and his experience as an executive officer of major corporations, including of a travel technology company, we believe Mr. Dunn is qualified toBravante should serve on our board of directors.
Michael S. (“Sam”) Gillilandrecently decided to step down as the Chairman and CEO of Sabre in August 2013, after nearly ten years in the role. Prior to this role, he served in several senior leadership positions including president and CEO of Travelocity, president of Airline Solutions and chief marketing officer of Sabre. Before joining Sabre in 1988, Mr. Gilliland worked for Lockheed Missiles and Space in Austin, Texas, developing hardware and software for land- and air-based defense systems. A recognized leader in the travel and tourism industry, Mr. Gilliland was appointed to the President’s Management Advisory Board by U.S. President, Barack Obama, in March 2011. In 2012 he was appointed to serve as vice chair during a third term on the U.S. Commerce Department’s Travel and Tourism Advisory Committee to the Secretary of Commerce. Also in 2012, Mr. Gilliland joined the Energy Security Leadership Council, a group of prominent business and military leaders who support long-term policies to reduce U.S. oil dependence. Additionally, Mr. Gilliland serves on the board of directors for Rackspace Hosting, Inc., a service leader in cloud computing and previously served on the board of directors for Broadview Security (formerly Brink’s Home Security) from November 2008 to May 2010. He holds an M.B.A. from the University of Texas at Dallas and a bachelor’s degree in electrical engineering from the University of Kansas. As a resultbecause of his servicetravel industry experience, as our prior CEOwell as his investment experience and his twenty-five years of experience with the company, we believe Mr. Gilliland brings a deep understanding of all aspects of ourfinancial and strategic business and therefore should serve on our board of directors.knowledge.
Gary Kusin is an independent consultant focused on assisting companies on strategic and operational matters. He has served on our board of directors since March 2007. Among other engagements, Mr. Kusin acts as a TPG senior advisor, pursuant to which he provides his expertise to selected TPG portfolio companies as well as to selected TPG potential investment opportunities. Mr. Kusin previously served as president and CEO of FedEx
Kinko’s, today operating as FedEx Office from 2001 to 2006. Prior to joining Kinko’s in 2001, Mr. Kusin served as CEO of HQ Global Workplaces (now part of Regus), which provides offices, meeting rooms and network access at locations around the world. In 1995 he co-founded Laura Mercier Cosmetics, which sold to Neiman Marcus in 1998. He also co-founded Babbage’s Inc. (now GameStop), a leading consumer software specialty chain, in 1983 and served as its president. Earlier in his career, he was vice president and general merchandise manager for the Sanger-Harris division of the Federated Department Store (now Macy’s). An Inc. magazine “Entrepreneur of the Year,” Mr. Kusin serves on the board of directors of Petco, Fleetpride, American Tire Distributor, and Savers. Mr. Kusin earned his Bachelor of Arts degree from The University of Texas at Austin and his M.B.A. from the Harvard Business School. We believe that Mr. Kusin should serve on our board of directors because of his substantial expertise in executive management and corporate governance as a result of his extensive experience both as an investor and an executive officer of major corporations.
Greg Mondreis a Managing Partner and Managing Director with Silver Lake and has served on our board of directors since March 2007. Mr. Mondre joined the firm in 1999 and has significant experience in private equity investing and expertise in sectors of the technology and technology-enabled industries. Prior to joining Silver Lake, Mr. Mondre was a principal at TPG, where he focused on private equity investments across a wide range of industries, with a particular focus on technology. Earlier in his career, Mr. Mondre worked as an investment banker in the Communications, Media and Entertainment Group of Goldman, Sachs & Co. He currently serves as a director of Avaya, Inc., Go Daddy Operating Company, LLC, IPC Systems, Inc. and Vantage Data Centers, and is on the operating committee of SunGard Capital Corp. Mr. Mondre graduated from The Wharton School at the University of Pennsylvania with a bachelor’s degree in economics. Because Mr. Mondre has over seventeen years of private equity investing and banking experience focused on technology companies andtech-enabled businesses, we believe that he would bring to our board of directors specialized knowledge and experience in portfolio management, analyzing potential acquisitions, raising equity, and setting corporate strategy.
205
Judy Odom joined the company as a director in March 2014. From 1985 until her retirement in 2002, Ms. Odom held numerous positions, most recently chief executive officer and chairman of the board, at Software Spectrum, Inc., a global business to business software services company, which she co-founded in 1983. Prior to founding Software Spectrum, Ms. Odom was a partner with the international accounting firm, Grant Thornton. Ms. Odom currently serves on the board of directors of Harte-Hanks, Inc., a marketing services company, and Leggett & Platt, Inc., a diversified manufacturing company. She previously served on the board of Storage Technology Corporation, a provider of data storage hardware and software products and services, from November 2003 to August 2005. Ms. Odom graduated from Texas Tech University, where she earned a B.B.A. in accounting. We believe that Ms. Odom’s qualifications to serve on our board include her board service with several companies allowing her to offer a broad leadership perspective on strategic and operating issues facing companies today. Ms. Odom’s experienceco-founding Software Spectrum, growing it to a large public company before selling it to another public company and serving as board chair provides the insight and perspective of a successful entrepreneur andlong-serving chief executive officer with international operating experience.
Joseph Osnossis a Managing Director of Silver Lake, which he joined in 2002. He has served on our board of directors since March 2007. He is currentlyFrom 2010 to 2014, before returning to the U.S., Mr. Osnoss was based in Silver Lake’s London office, where he helps tohelped oversee the firm’s activities in Europe, the Middle East, and Africa. Mr. Osnoss also is a director of Global Blue, Interactive Data Corporation, Mercury Payment Systems, and Virtu Financial, and previously served on the board of directorsboards of Instinet Incorporated.Incorporated and Mercury Payment Systems. Prior to joining Silver Lake, Mr. Osnoss worked in investment banking at Goldman, Sachs & Co., where he focused on mergers and financings in the technology and relatedtelecommunications industries. He previously held positions at Coopers & Lybrand Consulting in France and at Bracebridge Capital, a fixed income arbitrage hedge fund. Mr. Osnoss graduated summa cum laude from Harvard College with an A.B. in Applied Mathematics-Economics and a citation in French language. He currently is a Visiting Professor at the London School of Economics, where he participates in teaching and research activities within the Department of Finance. Mr. Osnoss’ extensive experience investing in private equity and serving on the boardboards of directors of other companies, both domestically and internationally, positions him to contribute meaningfully to our board of directors.
Karl Peterson is a Senior Partner of TPG and Managing Partner of TPG Capital LLP, the firm’s European operations. He has served on our board of directors since March 2007. Since joining TPG in 2004, Mr. Peterson has led investments for the firm in technology, media, financial services and travel sectors. Prior to 2004, he was a co-founder and the president and CEO of Hotwire.com, the internet travel portal. He led the business from its launch in 2000 through its sale to InterActiveCorp in 2003. Before Hotwire, Mr. Peterson was a principal at TPG in San Francisco, and from 1992 to 1995 he was a financial analyst at Goldman, Sachs & Co. Mr. Peterson is currently a director of TES Global, Saxo Bank and Norwegian Cruise Lines, as well as Caesars Acquisition Company. Mr. Peterson graduated with high honors from the University of Notre Dame, where he earned a B.B.A. in finance and business administration. We believe that as a result of his experience as a director of several travel and technology companies, as a former executive of an online travel company, and as a private equity investor, Mr. Peterson will bring a keen strategic understanding of our industry and of the competitive landscape for our company.
Controlled Company
AfterAs of January 15, 2015, the Principal Stockholders control a majority of our outstanding common stock. The TPG Funds, the Silver Lake Funds and Sovereign Co-Invest own approximately 37.2%, 22.9% and 19.2%, respectively, of our common stock. Following the completion of this offering, the Principal Stockholders will control a majorityown approximately % of our outstanding common stock.stock or approximately % if the underwriters’ option to purchase additional shares from the Principal Stockholders is fully exercised. The TPG Funds, the Silver Lake Funds and Sovereign Co-Invest will own approximately %, % and %, respectively, of our common stock (oror approximately %, % and %, respectively, if the underwriters exercise in full theirunderwriters’ option to purchase additional shares) aftershares from the completion of this offering.Principal Stockholders is fully exercised. As a result, we are and, upon completion of this offering, will continue to be a “controlled company” within the meaning of the NASDAQ rules. Under the NASDAQ rules, a company of
206
which more than 50% of the voting power is held by an individual, group or another company is a “controlled company” and may elect not to comply with certain NASDAQ corporate governance standards, including: the requirement that a majority of the board of directors consist of independent directors; the requirement that our governance and nominating committee is composed entirely of independent directors; and the requirement that we have a compensation committee that is composed entirely of independent directors with a written charter addressing the committee’s responsibilities. Following this offering, we intend to utilize these exemptions. As a result, we may not have a majority of independent directors and our governance and nominating committee and compensation committee may not consist entirely of independent directors. Accordingly, you may not have the same protections afforded to stockholders of companies that are subject to all of the NASDAQ rules regarding corporate governance.
The “controlled company” exception does not modify the independence requirements for the audit committee,committee. We are in compliance, and we intend to continue to comply, with the audit committee requirements ofRule 10A-3 under the Exchange Act and the NASDAQ rules. Pursuant to such rules, we arewere required to have at least one independent director on our audit committee during the90-day period beginning on the date of effectiveness of the registration statement filed with the SEC in connection with thisour initial public offering. After such90-day period and until one year from the date of effectiveness of the registration statement, we are required to have a majority of independent directors on our audit committee. Thereafter, our audit committee is required to be comprised entirely of independent directors.
Board Composition
Our board of directors is currently comprised of eight directors. TheOur Certificate of Incorporation provides that the number of directors on our board of directors shall be not less than five directors nor more than eleven directors, as determined by the affirmative vote of the majority of the board of directors then in office. However, prior to the time when the Principal Stockholders beneficially own, collectively, less than %40% of the outstanding shares of our common stock, the board of directors shall not consist of more than nine individuals.directors. At any meeting of the board of directors, the attendance of a majority of the total number of authorized directors then in office will constitute a quorum for all purposes; provided, however, for so long as the board of director then-currently includes at least directors designated for nomination by the TPG Funds orand, if the Silver Lake Funds or the TPG Funds, as applicable,then-currently has designated, solely and not jointly, for nomination pursuant to the Stockholders’ Agreement at least one director who is serving on the board of directors, one director designated by the Silver Lake Funds or the TPG Funds, as applicable, will constitute a quorum will requirequorum; provided that the attendance ofSilver Lake Funds or the TPG Funds, as applicable, may, in its sole discretion, agree to waive the requirement that at least one director designated for nomination by each of the TPG Funds and the Silver Lake Funds. such entity must be present to constitute a quorum.
Our board of directors has determined that George R. Bravante, Jr., Lawrence Kellner, Gary Kusin, Greg Mondre, Joseph Osnoss, Judy Odom and Karl Peterson are independent as defined under the corporate governance rules of the NASDAQ. In making these determinations, the board of directors considered the applicable legal standards and any relevant transactions, relationships or arrangements, including (i) the fees paid to TPG and Silver Lake under the MSA, which was terminated at the completion of our initial public offering, and (ii) that we do business with other companies affiliated with the Principal Stockholders. See “Certain Relationships and Related Party Transactions.”
Our board of directors is divided into three classes, with each director serving a3-year term and one class being elected at each year’s annual meeting of stockholders. serveKarl Peterson, Judy Odom and Lawrence Kellner are serving as Class I directors with an initial term expiring in 20 . serve2015. Joseph Osnoss, Tom Klein and George Bravante are serving as Class II directors with an initial term expiring in 20 . serve2016. Greg Mondre and Gary Kusin are serving as Class III directors with an initial term expiring in 20 .2017. Upon the expiration of the initial term of office for each class of directors, each director in such class shall be elected for a term of three years and serve until a successor is duly elected and qualified or until his or her earlier death, resignation or removal. Any additional directorships resulting from an increase in the number of directors or a vacancy may be filled by the directors then in office.
207
Committees of the Board of Directors
The board of directors has established fourfive standing committees to assist it in carrying out its responsibilities: the audit committee, the governance and nominating committee, the compensation committee, the technology committee and the technologyexecutive committee. Each of the committees operates under its own written charter adopted by the
board of directors, each of which will beis available on our corporate website at www.sabre.com upon the closing of this offering.www.sabre.com. In addition, ad hoc committees may be designated under the direction of our board of directors when necessary to address specific issues.
Because we are a “controlled company” under the NASDAQ rules, our compensation committee and our governance and nominating committee are not required to be fully independent, though they currently are. If such rules change in the future or we no longer meet the definition of a controlled company under the current rules, we will adjust the composition of these committees accordingly in order to comply with these rules. Following the completing of this offering, we will however, continue to be a “controlled company”.
Audit Committee
The audit committee is responsible for, among other things:
The members of the audit committee are Judy Odom (Chairman), George Bravante, Gary Kusin and . Upon effectiveness of the registration statement, members of the committee will beJoseph Osnoss. Judy Odom, George Bravante and Gary Kusin are “independent,” as defined under the NASDAQ rules andRule 10A-3 of the Exchange Act. Our board of directors has determined that each director appointed to the audit committee is financially literate, and the board of directors has determined that is oureach director appointed to the audit committee meets the criteria of the rules and regulations set forth by the SEC for an “audit committee financial expert.”
The audit committee met ten times in 2014.
Governance and Nominating Committee
The governance and nominating committee is responsible for, among other things:
208
The members of the nominating and corporate governance committee are (Chairman), and . Because we will be a “controlled company” under the NASDAQ rules, our governance and nominating committee is not required to be fully independent, although if such rules change in the future or we no longer meet the definition of a controlled company under the current rules, we will adjust the composition of the governance and nominating committee accordinglyare Lawrence Kellner (Chairman), Gary Kusin, Greg Mondre and Karl Peterson, each of whom is “independent,” as defined under the NASDAQ rules.
The governance and nominating committee met three times in order to comply with such rules.
Compensation Committee
The compensation committee is responsible for, among other things:
The members of the compensation committee are Gary Kusin (Chairman), Lawrence Kellner, Greg Mondre and . Because we will be a “controlled company”Karl Peterson, each of whom is “independent,” as defined under the NASDAQ rules, ourrules.
The compensation committee is not required to be fully independent, although if such rules changemet four times in the future or we no longer meet the definition of a controlled company under the current rules, we will adjust the composition of the nominating and corporate committees accordingly in order to comply with such rules.2014.
Technology Committee
The technology committee is responsible for, among other things:
The members of the technology committee are Joseph Osnoss (Chairman), Tom Klein and Greg Mondre.
The technology committee met three times in 2014.
Executive Committee
The executive committee’s principal function is to exercise, when necessary between board meetings, the board’s powers and authority in the management of our business and affairs and to act on behalf of the board.
The members of the executive committee are Lawrence Kellner (Chairman), Tom Klein, Greg Mondre and Karl Peterson.
The executive committee met two times in 2014.
209
Compensation Committee Interlocks and Insider Participation
None of our executive officers currently serves, or in the past year has served, as a member of the board of directors or compensation committee of any entity that has one or more executive officers serving on our board of directors or compensation committee.
Business Ethics Policy and Senior Officer Code of Ethics
We have adoptedmaintain a Business Ethics Policy, which is the code of business conduct and ethics (“Business Ethics Policy”) applicable to all of our employees, including our principal executive, financial and accountingdirectors, officers and all persons performing similar functions. A copyemployees. We have also adopted a Code of Ethics applicable to our CEO and senior financial officers (the “Senior Officers’ Code”), which sets forth the principles and responsibilities specifically applicable to those officers. The Senior Officers’ Code is designed to be read and applied in conjunction with our Business Ethics Policy. Both the Senior Officers’ Code and the Business Ethics Policy isare available in the investors section on our corporate website at www.sabre.com. We expect thatAny change or amendment to the Senior Officers’ Code, and any amendments to such code, or any material waivers of its requirementsthe Senior Officers’ Code or the Business Ethics Policy for our principal executive anddirectors, CEO or senior financial officers, will be disclosedposted to our website at the above location.
Corporate Governance Guidelines
The board of directors has adopted Corporate Governance Guidelines, which govern the structure and proceedings of the board and contain the board’s position on many governance issues. These Guidelines are available in the investors section of our website.website at www.sabre.com.
210
COMPENSATION DISCUSSION AND ANALYSIS
This Compensation Discussion and Analysis addresses the principles underlying our executive compensation program and the policies and practices that contributed to our executive compensation actions and decisions for the year ended December 31, 2013 (“Fiscal 2013”)2014 for the following individuals (i) who served as (i) our principal executive officer at any time during Fiscal 2013,2014, (ii) who served as our principal financial officer at any time during Fiscal 2013,2014, and (iii) who were the three other mosthighly-compensated executive officers who were serving as our executive officers as of December 31, 2013. During Fiscal 2013,2014. For 2014, these individuals were:
We refer to these executive officers collectively in this Compensation Discussion and Analysis and the related compensation tables as the “Named Executive Officers.”
In addition, we provide certain compensation information regarding Carl Sparks, our former Executive Vice President and President and CEO, Travelocity, whose employment terminated on April 28, 2014. References in the following discussion to the “Named Executive Officers” do not include Mr. Sparks unless we specify otherwise.
This Compensation Discussion and Analysis provides an overview of our executive compensation philosophy, the overall objectives of our executive compensation program, and each material element of compensation that we provided to our executive officers, including the Named Executive Officers, in 2014. In addition, we explain how and why the compensation committee arrived at the specific compensation actions and decisions involving the Named Executive Officers during 2014.
Our overall corporate rewards strategy, which is embodied in our executive compensation program, is designed to advance four principal objectives:
| • | Pay for performance: Link a significant portion of the target total direct compensation opportunities of our executive officers to our annual andlong-term business performance and each individual’s contribution to that |
| • | Attract, motivate, and retain: Set compensation at market competitive levels that enable us to hire, incentivize, and retainhigh-caliber |
| • | Long-term equity participation: Provide opportunities, consistent with the interests of our stockholders, for |
| • | Transparency: Ensure an efficient, simple, and transparent process for designing our compensation arrangements, setting performance objectives for annual andlong-term incentive compensation opportunities, and making compensation decisions. |
Fiscal 2013 Management Changes
Mr. Gilliland stepped down from his position as our CEO on August 15, 2013 and retired effective September 21, 2013. Mr. Klein was promoted to serve as our CEO and President on August 15, 2013. As part of this leadership transition, Mr. Gilliland agreed to continue to serve as a member of our board of directors.
On March 11, 2013, Mr. Simonson joined us and was appointed as our Executive Vice President and CFO. Mr. Miller terminated his employment effective July 1, 2013.211
On March 11,2013, Ms. Kerr joined us and was appointed as our Executive Vice President and Chief Product and Technology Officer, and on December 16, 2013, Mr. Robinson joined us and was appointed our Executive Vice President and Chief Human Resources Officer.
Fiscal 2014 Management Changes
In connection with the Expedia SMA becoming operationally complete, Mr. Sparks’ employment with us will terminate on April 28, 2014. At such time, day-to-day operation of the Travelocity business in North America will be managed by Roshan Mendis, currently the President of Travelocity North America. The day-to- day operation of lastminute.com will be managed by Matthew Crummack, currently the CEO of lastminute.com. Mr. Sparks may act in an advisory role to Sabre for some period of time after his departure.
In connection with Mr. Sparks’ resignation, Mr. Sparks will receive a customary separation package, including certain payments and benefits required pursuant to the terms and conditions of his employment agreement.
Specifically, this Compensation Discussion and Analysis provides an overview of our executive compensation philosophy, the overall objectives of our executive compensation program, and each material element of compensation that we provided to our executive officers, including the Named Executive Officers, in Fiscal 2013. In addition, we explain how and why the Compensation Committee of our board of directors (the “Compensation Committee”) arrived at the specific compensation actions and decisions involving the Named Executive Officers during Fiscal 2013.
Executive Summary
Business Overview
We are a leading technology solutions provider to the global travel and tourism industry. We currently operate through threetwo business segments:
| • | Travel Network, our global B2B travel marketplace for travel suppliers and travel buyers; and |
| • | Airline and Hospitality Solutions, an extensive suite of leading software solutions primarily for airlines and hotel |
In March 2007, we were acquired by investment funds affiliated with or managed by the Principal Stockholders.Stockholders (the “2007 Acquisition”). Prior to that time, we were an independent, publicly-traded company with our common stock listed on the New York Stock Exchange.
In connection with the acquisition, the Principal Stockholders appointed Mr. Gilliland to serve as our CEO and2007 Acquisition, we entered into employment agreements and other arrangements with the members of our-then senior management. Of the Named Executive Officers who are currently employees, only Messrs. Gilliland, Miller,Klein and KleinWebb were employed with us at that time. In negotiating thesethe initial employment agreements with Messrs. Klein and arrangements with our current Named Executive Officers,Webb, our board of directors, whose members then consisted of representatives of the Principal Stockholders, placed significant emphasis on aligning management’s interests with those of the Principal Stockholders. In particular, Messrs. GillilandKlein and Klein eachWebb made a significant equity investment in our common stock in connection with the acquisition2007 Acquisition and received equity awards that included performance vestingperformance-based stock options that would vest upon the Principal Stockholders receiving reasonablecertain rates of return on their invested capital.
The Principal Stockholders directed our senior management to lead an aggressive plan to eliminate organizational inefficiencies, expand the scope of our various businesses and to secure our position as the leading technology provider for the travel and tourism industries. To date, we have been successful in strengthening our business, developing into a global brand, and increasing revenue growth and sustained profitability, in part, through the design of our executive compensation program.
As we have prepared for this initial public offering, we have focused on attracting and retaining a talented management team with the necessary experience to manage our business as a newly-public company. The Named Executive Officers have strong transformational experience and, collectively, more than 160 years of technology sector experience among them.
Prior to consummation of this offering, we intend to adopt the 2014 Omnibus Plan, which we believe will allow us to compete for executive talent and align the interests of our executive officers with those of our stockholders.
While we have begun to review and revise our executive compensation program and related policies and practices in anticipation of this offering, we are still in the process of determining specific details of certain aspects of our executive compensation program that will take effect following the offering. Overall, we anticipate that our executive compensation program following the offering will be based on the same principles and designed to achieve the same objectives as our prior executive compensation program.
Given our recent history, our executive compensation program has been designed by the Compensation Committeecompensation committee consistent with the Principal Stockholders’ objective of incentivizing our executive officers to stabilize and strengthen us as a company, including in the areas of technology consolidation, product quality, and geographic expansion, in an effort to drive sustained financial performance and further our business objectives. Accordingly, our current executive compensation program has been designed to advance three principal objectives:
Fiscal 20132014 Compensation Highlights
We compete with many other companies in seeking to attract and retain a skilled executive team. To meet this challenge, we have embraced a compensation philosophy of offering our executive officers competitive compensation and benefits packages that are focused on long-term value creation and rewarding them for achieving our financial and strategic objectives. In Fiscal 2013, we employed this philosophy to enhance and broaden the strength of our executive team as we began to prepare for this offering and commence the transition to becoming a public reporting company.
Consistent with this philosophy,these objectives, we took the following actions with respect to the Fiscal 20132014 compensation of the Named Executive Officers:
212
Pay-for-Performance
Our executive compensation philosophy, which is embodied in the design and operation of ourshort-term andlong-term incentive compensation plans, ensures that a substantial portion of the compensation for our executive officers, including the Named Executive Officers, is contingent on our ability to meet and exceed our annual andlong-term financial plan objectives. Consequently, we believe that our executive compensation program creates commonality of interest between our executive officers and stockholders forlong-term value creation. Our commitment to a “pay-for-performance”“pay-for-performance” compensation philosophy includes:
The Compensation Committeecompensation committee monitors our executive compensation program on a continuous basis, and updates and refines our executive compensation policies and practices as appropriate to enhance our compensation philosophy.
Executive Compensation Policies and Practices
We endeavor to maintain sound governance standards consistent with our executive compensation policies and practices. The Compensation Committeecompensation committee evaluates our executive compensation program on an ongoing basis to ensure that it is consistent with ourshort-term andlong-term business objectives given the dynamic nature of the global economy and the market in which we compete for executive talent. TheOur executive compensation program includes the following policies and practices were implemented during Fiscal 2013 and/or were in effect at the time of filing of the registration statement of which this prospectus forms a part:practices:
| • | Independent Compensation Committee |
213
| • | Annual Executive Compensation |
| • | Executive Compensation Policies and |
| • | Compensation |
| • | No Retirement |
| • | Nominal |
| • | No Special Health or Welfare |
| • | No Tax |
| • | “Double-Trigger”Change-in-Control |
| • | Performance-Based |
| • | Multi-Year Vesting |
| • | No Stock Option Repricings.We prohibit the repricing of outstanding options to purchase our common stock without prior stockholder |
| • | Succession |
This Compensation Discussion and Analysis describes the material elements of compensation for the Named Executive Officers for 2014 as determined by the Compensation Committee for the year prior to the completion of this offering. It also includes some of the key expectations aboutcompensation committee.
2014 Management Changes
In connection with changes to our executive compensationTravelocity business, Mr. Sparks’ employment with us terminated on April 28, 2014. In connection with his resignation, Mr. Sparks received a separation package, including certain payments and benefits pursuant to the terms and conditions of his employment agreement, accelerated vesting and settlement of certain outstanding incentive awards, and a cash retention payment. See “Potential Payments upon Termination or Change in Control—Post-Employment Compensation—Mr. Sparks’ Post-Employment Compensation.” Mr. Sparks did not participate in our 2014 annual cash incentive program going forward.or receive an equity award in 2014.
214
On September 22, 2014, Ms. Gonzalez joined us as our Executive Vice President and General Counsel and we entered into an employment agreement with her in connection with the commencement of employment.
Compensation Philosophy and Objectives
The philosophy underlying our executive compensation program is to provide an attractive, flexible, and effective total compensation opportunity to our executive officers, including the Named Executive Officers, tied to our corporate performance and aligned with the interests of our stockholders. Our objective is to recruit, motivate, and retain the caliber of executive officers necessary to deliver sustained high performance to our stockholders, customers, and other stakeholders.
Equally important, we view our compensation policies and practices as a means for communicating our goals and standards of conduct and performance and for motivating and rewarding employees in relation to their achievements. Overall, the same principles that govern the compensation of our executive officers also apply to the compensation of all our salaried employees. Within this framework, we observe the following principles:
| • | Retain and hiretop-caliber executive officers: Executive officers should have base salaries and employee benefits that are market competitive and that permit us to hire and retainhigh-caliber individuals at all |
| • | Pay for performance: A significant portion of the target total direct compensation opportunities of our executive officers should vary with annual andlong-term business performance and each individual’s contribution to that performance, while the level of |
| • | Rewardlong-term growth and profitability: Executive officers should be rewarded for achievinglong-term results, and |
| • | Tie compensation to performance of our core businesses: A significant portion of each executive officer’s compensation should be tied to measures of performance of the business or businesses over which he or she has the greatest |
| • | Align compensation with stockholder interests: The interests of our executive officers should be linked with those of our stockholders through the risks and rewards of the ownership of shares of our common |
| • | Provide limited personal benefits: Perquisites and other personal benefits for our executive officers should be minimal and limited to items that serve a reasonable business |
| • | Reinforce succession planning process: The overall compensation program for our executive officers should reinforce our robust succession planning process. |
We believe that our compensation philosophy, as reinforced by these principles, has been very effective in aligning our executive compensation with the creation of sustainablelong-term stockholder value.
Compensation Mix
Our executive compensation program has been designed to reward strong performance by focusingperformance. The program seeks to focus a significant portion of each executive officer’s total direct compensation opportunity on annual and long-term incentives that depend upon our performance as a whole, as well as the performance of our individual businesses. Each executive officer, at either the time of the acquisition2007 Acquisition by the Principal Stockholders, his or her initial employment, or his promotion to a more senior position, has been granted a significant stake in us in the form of an equity award to closely link his or her interests to those of the Principal Stockholders andour stockholders. These equity awards also seek to focus his or her efforts on the successful execution of our long-term strategic and financial objectives. Consequently, whether viewed on an annual basis or over their entire tenure with us, fixed compensation (in the form of base salary and benefits) has represented substantially less than half of the target total direct
215
compensation opportunity of each current executive officer, including each Named Executive Officer, with the remainder delivered in the form of annual and long-term incentive compensation and performance bonuses.
Compensation-Setting Process
Role of the Compensation Committee
The Compensation Committeecompensation committee is responsible for overseeing our executive compensation program (including our executive compensation policies and practices), approving the compensation of our executive officers, including the Named Executive Officers, and administering our various employee stock plans.
Pursuant to its charter, the Compensation Committeecompensation committee has sole responsibility for reviewing and determining the compensation of our CEO at least annually, as well as for evaluating our CEO’s performance in light of the corporate goals and objectives applicable to him. In reviewing our CEO’s compensation each year and considering any potential adjustments, the Compensation Committeecompensation committee exercises its business judgment after taking into consideration several factors, including our financial results, his individual performance and strategic leadership, its understanding of competitive market data and practices, and his current total compensation and pay history.
In addition, each year the Compensation Committeecompensation committee reviews and determines the compensation of our other executive officers, including the other Named Executive Officers, as well as any employment agreements with our executive officers. In doing so, the Compensation Committeecompensation committee is responsible for ensuring that the compensation of our executive officers, including the Named Executive Officers, is consistent with our executive compensation philosophy and objectives.
Role of Executive Officers
The Compensation Committeecompensation committee receives support from our Human Resources Department in designing our executive compensation program and analyzing competitive market practices. Our General Counsel attends regular meetings of the Compensation Committee to provide support and assistance with respect to the legal implications of our compensation decisions. In addition, our Senior Vice President, Corporate Human Resources attends meetings of the Compensation Committee as requested. Our CEO and CFO also regularly participate in Compensation Committeecompensation committee meetings, providing management input on organizational structure, executive development, and financial analysis.
Our CEO evaluates the performance of each of our executive officers, including the other Named Executive Officers, against the annual objectives established by the Compensation Committeecompensation committee for the business or functional area for which such executive officer is responsible. Our CEO then reviews each executive officer’s target total direct compensation opportunity, and based upon his or her target total direct compensation opportunity and his or her performance, proposes compensation adjustments for him or her, subject to review and approval by the Compensation Committee.compensation committee. Our CEO presents the details of each executive officer’s target total direct compensation opportunity and performance to the Compensation Committeecompensation committee for its consideration and approval of the recommendations. Our CEO does not participate in the evaluation of his own performance.
In making executive compensation decisions, the Compensation Committeecompensation committee reviews a variety of information for each executive officer, including his or her current total compensation and pay history, his or her equity holdings, individual performance, and its understanding of competitive market data and practices for comparable positions. OurNeither our CEO nor our other executive officers are not present when their specific compensation arrangements are discussed.
Role of Compensation Consultant
In fulfilling its duties and responsibilities, the Compensation Committeecompensation committee has the authority to engage the services of outside advisers, including compensation consultants. In Fiscal 2013,2014, the Compensation Committeecompensation committee engaged Compensia, Inc., a national compensation consulting firm, to assist it with compensation matters. A representative of Compensia attends regularly scheduled meetings of the Compensation Committee as requested,compensation committee, responds to inquiries from members of the Compensation Committee,compensation committee, and provides his or her analysis with respect to these inquiries.
216
The nature and scope of services provided to the Compensation Committeecompensation committee by Compensia in Fiscal 20132014 were as follows:
| • | Providedad hoc advice and support following its engagement. |
Compensia does not provide any services to us, other than the services provided to the Compensation Committee.compensation committee. The Compensation Committeecompensation committee has assessed the independence of Compensia taking into account, among other things, the factors set forth in Exchange ActRule 10C-1 and the listing standards of the NASDAQ, and has concluded that no conflict of interest exists with respect to the work that Compensia performs for the Compensation Committee.compensation committee.
Competitive Positioning
Periodically, the Compensation Committeecompensation committee reviews competitive market data for comparable executive positions in the market as one factor for determining the structure of our executive compensation program and establishing target compensation levels for our executive officers, including the Named Executive Officers.
For purposes of its review of the competitive market prior to November 2013, the Compensation Committee received a market analysis prepared by our Human Resources Department which was developed using relevantThe compensation data drawn from a select group of peer companies, as well as survey data of comparably sized companies in the national market. This compensation peer group consisted of the following companies:
|
|
This compensation data was size-adjusted to reflect our approximate annual revenues of $3 billion. The specific compensation surveys used in this market analysis were the Culpepper High Technology Survey, the IPAS Global Technology Survey, the Mercer Benchmark Database, and the Radford Global Technology Survey. This market analysis provided the Compensation Committee with a broad perspective on the national labor market for executive talent.
In November 2013, the Compensation Committee,committee, with the assistance of Compensia, has developed a new compensation peer group based on an evaluation of companies that it believed were comparable to us with respect to operations, industry segment, revenue level, and enterprise value as a reference source in its executive compensation deliberations. This compensation peer group, which will beis used by the Compensation Committeecompensation committee as a reference in the course of its future executive compensation deliberations, consists of the following companies:
Akamai Technologies, Inc. | Global Payments, Inc. | |
| Alliance Data Systems Corp. | Nuance Communications, Inc. | |
| Broadridge Financial Solutions, Inc. | Synopsys, Inc. | |
| Citrix Systems, Inc.
|
Total System Services, Inc. | |
| Equinix, Inc. | Vantiv, Inc. | |
| Fiserv, Inc. | Verisk Analytics, Inc. | |
| Gartner, Inc. |
The companies in the compensation peer group areU.S.-based global companies in the technology sector, and, therefore, are representative of the companies with which we compete for executive talent. In addition, these companies have similar revenue levels (generally, 0.5x to 2.0x our revenue level), enterprise values (generally, 0.5x to 3.0x our enterprise value), and revenue and operating profitability growth rates. Compensation peer group
comparison data will beare collected frompublicly-available information contained in the SEC filings of the compensation peer group companies, as well as from the Radford Global Technology Survey. The Radford survey provides market data and other information related to trends and competitive practices in executive compensation.
217
The competitive market data described above hashave not been and will not be used by the Compensation Committeecompensation committee in isolation but rather servesserve as one point of reference in its deliberations on executive compensation. The Compensation Committeecompensation committee uses the competitive market data as a guide when making decisions about total direct compensation, as well as individual elements of compensation; however, the Compensation Committeecompensation committee does not formally benchmark our executive officers’ compensation against this data. While market competitiveness is important, it is not the only factor we consider when establishing compensation opportunities of our executive officers. Actual compensation decisions also depend upon the consideration of other factors that the Compensation Committeecompensation committee considers relevant, such as the financial and operational performance of our businesses, individual performance, specific retention concerns, and internal equity.
Compensation-Related Risk Assessment
The Compensation Committeecompensation committee considers potential risks when reviewing and approving the various elements of our executive compensation program. In evaluating each element of our executive compensation program, the Compensation Committeecompensation committee assesses the element to ensure that it does not encourage our executive officers to take excessive or unnecessary risks or to engage indecision-making that promotesshort-term results at the expense of ourlong-term interests. In addition, we have designed our executive compensation program, including our incentive compensation plans, with specific features to address potential risks while rewarding our executive officers for achieving financial and strategic objectives through prudent business judgment and appropriate risk taking. Further, the following policies and practices have been incorporated into our executive compensation program:
| • | Balanced Mix of Compensation Components |
| • | Minimum Performance Measure Threshold |
| • | Long-Term Incentive Compensation Vesting |
| • | Capped Incentive Awards |
Compensation Elements
Our executive compensation program is designed around the concept of total direct compensation, and consists of the following principal elements:
In setting the appropriate level of total direct compensation, the Compensation Committeecompensation committee seeks to establish each compensation element at a level that is both competitive and attractive for motivating top executive talent, while also keeping the overall compensation levels aligned with stockholder interests and job responsibilities. These compensation elements are structured to motivate our executive officers and to align their financial interests with those of our stockholders.
218
Base Salary
We believe that a competitive base salary is essential in attracting and retaining key executive talent. Historically, the Compensation Committeecompensation committee has reviewed the base salaries of our executive officers, including the Named Executive Officers, on an annual basis or as needed to address changes in job title, a promotion, assumption of additional job responsibilities, or other unique circumstances.
In evaluating the base salaries of our executive officers, the Compensation Committeecompensation committee considers several factors, including our financial performance, his or her contribution towards meeting our financial objectives, his or her qualifications, knowledge, experience, tenure, and scope of responsibilities, his or her past performance as against individual goals, his or her future potential, competitive market practices, our desired compensation position with respect to the competitive market, and internal equity.
Fiscal 20132014 Base Salary Decisions
In May 2013,January 2014, the Compensation Committeecompensation committee reviewed the base salaries of our executive officers and made no adjustments to the base salaries of any of the Named Executive Officers whose positions and duties were consistent with their prior positions and duties.
increased Mr. Klein’s annualWebb’s base salary waseffective in February 2014, based upon a review of his position, duties and competitive market data. Other than this change, the compensation committee made no changes to the Named Executive Officers’ base salaries at that time. Following our initial public offering, the compensation committee reviewed the base salaries again in June 2014, and increased from $600,000 to $900,000 in connection with his appointment as our CEO in August 2013. In addition, Messrs. SimonsonKlein’s and RobinsonSimonson’s and Ms. Kerr’s base salaries, were established through arms-length negotiation when they joined us in March 2013, December 2013,based upon a review of their positions, duties and March 2013, respectively.competitive market data, effective August 2014.
The base salaries paid to the Named Executive Officers during Fiscal 20132014 are set forth in the “Fiscal 2013“2014 Summary Compensation Table” below.
Annual Incentive Compensation
We use annual incentive compensation to support and encourage the achievement of our specific annual corporate and business segment goals as reflected in our annual operating plan. Each year, our executive officers at the level of senior vice president or above are eligible to receive annual cash bonuses under our Executive Incentive Program (the “EIP”).EIP.
Typically, at the beginning of the fiscal year the Compensation Committeecompensation committee approves the terms and conditions of the EIP for the year, including the selection of one or more performance measures as the basis for determining the funding of annual cash bonuses for the year. Subject to available funding, the EIP provides cash bonuses based upon our achievement as measured against thepre-established target levels for these performance measures.
Target Annual Cash Bonus Opportunities
For purposes of the Fiscal 20132014 EIP, the target annual cash bonus opportunity for each of our eligible executive officers, including the Named Executive Officers, was expressed as a percentage of his or her base salary paid during 2014, subject to a maximum annual cash bonus opportunity as specified for each executive officer (which was
200% of his or her target annual cash bonus opportunity). The target annual cash bonus opportunities of the current Named Executive Officers for Fiscal 20132014 were as follows:
Named Executive Officer(1) | Target Cash Bonus Opportunity (as a percentage of base salary) | |
Mr. Klein | ||
Mr. Simonson | 80% | |
| 80% | |
Ms. Kerr | 80% | |
Mr. |
219
| (1) |
| (2) | Through August |
The target annual cash bonus opportunities were established by the Compensation Committeecompensation committee based on its consideration of several factors, including each eligible executive officer’s qualifications, knowledge, experience, tenure, and scope of responsibilities, his or her past performance, his or her future potential, competitive market practices, our desired compensation position with respect to the competitive market, and internal equity.
Corporate Performance Measure
For purposes of the Fiscal 20132014 EIP, the Compensation Committeecompensation committee selected EBITDA as the sole performance measure. The Compensation Committeecompensation committee believed that EBITDAthis measure continued to be the best measureindicator of both corporate and business segment profitability and that as we began to prepare for our initial public offering, overall profitability would best position us for a successfulre-entry into the public marketplace.
For purposes of the Fiscal 20132014 EIP, EBITDA was adjusted to exclude the following items: goodwill impairments, prior periodnon-cash adjustments, andone-time costs associated with specific business enhancement initiatives. Our board of directors approved these adjustments to better reflect the efforts and performance of our executive officers in relation to the current year’s business performance, as well as to encourage them to make decisions that improve the potential for future growth without being penalized for theshort-term investment required to achieve that growth. In addition to these adjustments, for purposes of the Fiscal 20132014 EIP, EBITDA was to be calculated before making allowance for the amounts payable pursuant to our annual incentive compensation plan for employees at the level below senior vice president, the Sabre Corporation Variable Compensation Plan (“Pre-VCPAdjustedPre-VCP/EIP EBITDA”).
Bonus Formula
For our executive officers withcompany-wide responsibility, the Pre-VCPAdjusted Pre-VCP/EIP EBITDA performance measure was based entirely on corporateconsolidated Adjusted Pre-VCP/EIP EBITDA. For our executive officers with business segment responsibilities, the Pre-VCPAdjusted Pre-VCP/EIP EBITDA performance measure was based in part on business segment Adjusted Pre-VCP/EIP EBITDA (weighted 50%) and in part on corporateconsolidated Adjusted Pre-VCP/EIP EBITDA (weighted 50%). The Compensation Committeecompensation committee determined that these weightings provided an appropriate balance to foster company teamwork while at the same time providing “line-of-sight”“line-of-sight” accountability for business segment results.
Our Pre-VCPAdjusted Pre-VCP/EIP EBITDA target level for Sabre as a whole for purposes of the Fiscal 20132014 EIP was $868.6$900 million.
The actual cash bonus payments for the Named Executive Officers (other than Mr. Sparks) areWebb) were to be based on our overallconsolidated financial results and, in the case of Mr. Sparks, areWebb, were to be based on our overallconsolidated financial results and those of his individual business unit.
The funding of the annual bonus pool with respect to the Pre-VCPAdjusted Pre-VCP/EIP EBITDA performance measure varied according to each Named Executive Officer’s area of responsibility as follows:
| • |
|
220
performance level with maximum funding (200% of target funding) upon the achievement of 123% of the target performance level. Funding levels decreased at a more moderate rate between 100% |
| • |
The Compensation Committeecompensation committee believed that these formulas provided a fair value sharing between our stockholders and the Named Executive Officers.
For purposes of the Fiscal 20132014 EIP, the Compensation Committeecompensation committee reserved the discretion to adjust the amount of the actual cash bonus payments to be received by any Named Executive Officer.
Annual Cash Bonus Decisions
The Compensation Committee approvedcompensation committee will approve the cash bonus payments under the Fiscal 20132014 EIP at its meeting in January 2014.February 2015.
Based on our Fiscal 2013 financial performance, the Fiscal 2013 cash bonus payments for the Named Executive Officers ranged from approximately 31% to approximately 87% of their target annual cash bonus opportunities as summarized below.
Named Executive Officer | Fiscal 2013 Target Cash Bonus Opportunity | Fiscal 2013 Actual Cash Bonus Payment | Actual Cash Bonus Payment as Percentage of Target Cash Bonus Award | |||||||||
Mr. Klein | $ | 784,788 | (1) | $ | 682,757 | 87 | % | |||||
Mr. Simonson | $ | 387,692 | (2) | $ | 337,292 | 87 | % | |||||
Mr. Sparks | $ | 480,000 | $ | 148,800 | 31 | % | ||||||
Ms. Kerr | $ | 323,077 | (2) | $ | 281,077 | 87 | % | |||||
Mr. Robinson(3) | — | — | — | |||||||||
The cash bonuses actually paid to the Named Executive Officers for Fiscal 20132014 are set forth in the “Fiscal 2013“2014 Summary Compensation Table” below.
Additional Discretionary Bonuses
In connection with its determination of the Fiscal 2013 cash bonus payments, the Compensation Committee considered Mr. Klein’s recommendation that Mr. Simonson and Ms. Kerr each receive an additional bonus payment in recognition of their strong individual contributions to the company during Fiscal 2013. Based on his efforts in preparing the company for this initial public offering, as well as his overall performance, the Compensation Committee approved a discretionary bonus payment for Mr. Simonson in the amount of $62,708. Based on her efforts in advancing our product development and successfully completing several of our technology initiatives during Fiscal 2013, as well as her overall performance, the Compensation Committee approved a discretionary bonus payment for Ms. Kerr in the amount of $18,923.
Long-Term Incentive Compensation
We uselong-term incentive compensation in the form of equity awards as the principal element of our executive compensation program in order to align the financial interests of our executive officers, including the Named Executive Officers, with those of our stockholders. Upon the Principal Stockholders’ acquisition of us in March 2007 Acquisition, we sought to retain top executive talent and drivelong-term stockholder value creation through the use of equity-based long-termequity-basedlong-term incentive compensation.
Except in the case of Mr. Sparks, from March 2007 through November 2012, we generally provided long-term incentive compensation to our executive officers, including the Named Executive Officers who were then our employees, in the form of options to purchase shares of our common stock. We believed that options provided an effective performance incentive because our executive officers would derive value from their options only if our stock price increased (which would benefit all stockholders) and they remained employed with us beyond the date that their options vested.
With respect to the awards of options granted during 2007, typically, half of the options were subject to a time-based vesting requirement, which vested 25% on the first anniversary of the date of grant and thereafter ratably on a quarterly basis over the subsequent four years. The other half of these options were subject to a performance-based vesting condition based on a threshold multiple of money (“MoM”) being realized by the Principal Stockholders for their initial shares acquired in our business upon a specified liquidity event, such as a qualified initial public offering or a change in control of us.
Starting in 2008 and continuing through November 2012, the options granted to our executive officers were subject solely to time-based vesting requirements. Pursuant to these requirements, the shares of our common stock subject to such options vest and become exercisable as to 25% of such shares on the first anniversary of the date of grant and ratably as to 4.6875% of such shares on a successive three-month basis over the subsequent four years, subject to each executive officer’s continued employment through each vesting date.
In the case of Mr. Sparks, we granted him a restricted stock award covering shares of our common stock rather than options to purchase shares of our common stock, when he joined us in 2011 and a restricted stock unit award covering shares of our common stock in 2012. In addition to equity awards for shares of our common stock, Mr. Sparks, as the President and CEO of Travelocity, was also granted a tandem stock appreciation right covering the common units of Travelocity.com LLC and the shares of Travelocity Holdings, Inc., but which can
be settled in cash or shares of our common stock, in the good faith discretion of our board of directors. Further, in 2010 Messrs. Klein and Miller were granted equity awards in the form of options to purchase 350,000 common units of Travelocity.com LLC.
Beginning in December 2012, we began delivering long-term incentive compensation to our executive officers, including the Named Executive Officers who were then our employees, using a mix of options to purchase shares of our common stock and restricted stock unit awards covering shares of our common stock. At that time, we determined that this equity award mix would effectively align the interests of our executive officers with those of our stockholders and provide each individual executive officer with a significant incentive to manage us from the perspective of an owner with an equity stake in the business. We also determined that these equity awards would serve as an effective retention tool for our executive officers, as unvested awards would generally be forfeited if he or she voluntarily left our employ. Half of the value of these equity awards granted to our executive officers is delivered in the form of atime-based option and half in the form of a performance-based restricted stock unit award. For a detailed description of these awards, see the “Fiscal 2013 Grants of Plan-Based Awards Table” below.
In determining the value of thelong-term incentive compensation opportunities for our executive officers, the Compensation Committeecompensation committee considers several factors, including our financial performance, the executive officer’s contribution towards meeting our financial objectives, his or her qualifications, knowledge, experience, tenure, and scope of responsibilities, his or her past performance as against individual goals, his or her future potential, his or her current equity position (including the value of any unvested equity awards), competitive market practices, our desired compensation position with respect to the competitive market, and internal equity.
Change in Award Practices Related to our Initial Public Offering
As noted above, since our 2007 acquisition by the Principal Stockholders we have sought to retain top executive talent and motivate long-term stockholder value creation primarily through the one-time grant of equity awards upon hire and subsequent periodic awards. Following this initial public offering, the Compensation Committee intends to modify our approach to the use of long-term incentiveThe compensation by makingcommittee makes annual long-term incentive compensation awards to our executive officers, including the Named Executive Officers, using a “portfolio” mix oftime-based andperformance-based equity awards. We believe these changes to our executive compensation program will better alignthis approach aligns the interests of our executive officers and stockholders, aidaids in attracting and retaining talent by conforming more closely to the practices among members of our peer group, and further mitigatemitigates excessive risk incentives by ensuring that we provide incentive compensation with diversified performance measures.
221
Fiscal 20132014 Equity Awards
During Fiscal 2013,2014, the Compensation Committeecompensation committee granted equity awards to Mr. Kleineach of the Named Executive Officers, other than Ms. Gonzalez, in connection with his promotion to serve asour initial public offering in April 2014. For 2014, the compensation committee set the long-term equity incentive compensation award value for each Named Executive Officer (other than Ms. Gonzalez) after reviewing their position, duties, performance, competitive market data, and the recommendations of our CEO and(except with respect to Messrs. Simonsonhis own award). This award value was then divided into two separate grants, consisting of:
Ms. KerrGonzalez was granted an equity award in connection with theirher initial employment with us. TheFor Ms. Gonzalez’s initial equity award, the award value was divided into two separate grants consisting of these equity awards was determined in arms-length negotiation between the individual executive officertime-based restricted stock units and the Compensation Committee. For purposesstock options, each of these negotiations, the Compensation Committee referenced, in part, competitive market data.which constituted 50% of her target grant date value for long-term incentive compensation.
For a detailed description of these equity awards, see “—Employment Agreements” and the “Fiscal 2013“2014 Summary Compensation Table” and the “Fiscal 2013“2014 Grants ofPlan-Based Awards Table” below.
New Travelocity Equity Awards
On March 23, 2010, our board of directors granted Mr. Klein an option to purchase 350,000 common units of Travelocity.com LLC with an exercise price equal to the fair market value of such units on the date of grant.
On April 25, 2011 our board of directors granted Mr. Sparks a restricted stock award, which was fully vested at the time of his departure, and tandem stock appreciation rights (SARs), which were cancelled in May 2012. On May 15, 2012, our board of directors granted Mr. Sparks 2,931,035 tandem SARs each in units of Travelocity.com LLC and Travelocity Holdings, Inc., which could be settled in cash or shares of our common stock, in the good faith discretion of our board of directors. On November 1, 2012, our board of directors granted Mr. Sparks a restricted stock unit award based on an aggregate value of up to $3,000,000, to vest over six tranches in increasing amounts by tranche, with final vesting on June 15, 2015. For each of the first three tranches, Mr. Sparks agreed to surrender a portion of his SARs granted during 2012. Mr. Sparks received the first four tranches, cash value of $1,840,000, settled in shares of our common stock, and the remaining two tranches were forfeited by Mr. Sparks upon his departure. The remaining Travelocity SARs that had not been surrendered by Mr. Sparks were cancelled at the time of our initial public offering in April 2014, when we cancelled these equity grants. At the time the grants were cancelled, there was no value associated with the awards or the underlying equity.
In April 2014, we cancelled, for no consideration, all outstanding stock-based awards issued under the Travelocity.com LLC Stock Option Grant Agreements, the Travelocity Equity 2012 Plan and the Sovereign Holdings, Inc. Amended and Restated Stock Incentive Plan for Travelocity’s CEO—Stock Settled SARs with Respect to Travelocity Equity; terminated all related plans and award agreements; and recorded an aggregate stock compensation expense, including that associated with the cancellation of Messrs. Klein’s and Sparks’ Travelocity equity awards, of $6,949,507, representing the remaining unrecognized compensation expense of all the Travelocity equity awards at the cancellation date.
Omnibus Equity Compensation Plan
In connection with thisour initial public offering, our board of directors plans to adoptadopted the 2014 Omnibus Plan. Allequity-based awards granted on or after thisthe initial public offering will be granted under the 2014 Omnibus Plan. The Compensation Committee, serving as the plan administrator, will select participants from among our employees, independent contractors, and the non-employee members of our board of directors.
The purpose of the 2014 Omnibus Plan will be to promote our interests by providing for the grant to participants of incentives in the form of equity awards. These equity awards will be intended to provide our employees with a proprietary interest in us and to align the interests of our employees and stockholders.
The 2014 Omnibus Plan will provide for the grant of stock options, other stock-based awards, cash incentive awards, and performance-based compensation. The Compensation Committee will also have the discretion to provide for dividends or dividend equivalents in connection with an award under the 2014 Omnibus Plan.222
Health, Welfare, and Other Employee Benefits
We have established atax-qualified Section 401(k) retirement plan for all employees who satisfy certain eligibility requirements, including requirements relating to age and length of service. We currently match contributions made to the plan by our employees, including our executive officers, up to 6% of their eligible compensation. We intend for the plan to qualify under Section 401(a) of the Internal Revenue Code (the “Code”) so that contributions by employees to the plan, and income earned on plan contributions, are not taxable to employees until withdrawn from the plan.
In addition, we provide other benefits to our executive officers, including the Named Executive Officers, on the same basis as all of ourfull-time employees. These benefits include medical, dental, and vision benefits, medical and dependent care flexible spending accounts,short-term andlong-term disability insurance, accidental death and dismemberment insurance, and basic life insurance coverage.
We design our employee benefits programs to be affordable and competitive in relation to the market, as well as compliant with applicable laws and practices. We adjust our employee benefits programs as needed based upon regular monitoring of applicable laws and practices and the competitive market.
Perquisites and Other Personal Benefits
Currently, we do not view perquisites or other personal benefits as a significant component of our executive compensation program. Accordingly, we provide perquisites and other personal benefits to our executive officers in limited situations where we believe it is appropriate to assist an individual in the performance of his or her duties, to make our executive officers more efficient and effective, and for recruitment and retention purposes. For example, each of our executive officers is eligible to receive financial planning benefits, subject to an annual allowance of up to $10,000 per year for our Chief Executive Officer and up to $5,000 per year.year for the other Named Executive Officers. In addition, our executive officers are eligible to participate in our annual physical program. This program provides for an annual executive physical up to an amount of $3,700.$5,000. The Compensation Committeecompensation committee believes that these personal benefits are a reasonable component of our overall executive compensation program and are consistent with market practices.
In addition, historically we paid the dues for a country club membership for certain executive officers, including Messrs. Klein and Gilliland. While they received some incidental benefits from these memberships, we believe that the primary purpose has been to facilitate opportunities for conducting business with existing and prospective customers and business partners. Accordingly, although we disclose the cost to us of these memberships in the Fiscal 2013 Summary Compensation Table, we believe that they served a legitimate and important business purpose for us. In connection with his promotion to serve as our CEO and President, Mr. Klein relinquished his membership in September 2013. In connection with his retirement in September 2013, we converted Mr. Gilliland’s membership to a personal membership (at no cost to us) and ceased to pay any further dues on such membership.
In the future, we may provide perquisites or other personal benefits in limited circumstances, such as where we believe it is appropriate to assist an individual executive officer in the performance of his or her duties, to make our executive officers more efficient and effective, and for recruitment, motivation, or retention purposes. All future practices with respect to perquisites or other personal benefits will be approved and subject to periodic review by the Compensation Committee.compensation committee.
Employment Agreements
We have entered into a written employment agreement with each of the Named Executive Officers; most recently, with Mr. Klein, our President and CEO and Mr. Robinson, our Executive Vice President and Chief Human Resources Officer. Mr. Klein’s employment agreement was negotiated on our behalf by the Chairman of the Compensation Committee and approved by our board of directors; all of the other employment agreements were negotiated on our behalf by our CEO and approved by the Compensation Committee.Officers. We believe that these employment agreements were necessary to induce these individuals to forego other employment opportunities or leave their current employer for the uncertainty of a demanding position in a new and unfamiliar organization.
In filling these executive positions, our board of directors or the Compensation Committee,compensation committee, as applicable, was aware that it would be necessary to recruit candidates with the requisite experience and skills to manage a growing business in a dynamic andever-changing industry. Accordingly, it recognized that it would need to develop competitive compensation packages to attract qualified candidates in ahighly-competitive labor market. At the same time, our board of directors or the Compensation Committee,compensation committee, as applicable, was sensitive to the need to integrate new executive officers into the executive compensation structure that it was seeking to develop, balancing both competitive and internal equity considerations.
For a detailed description of the employment arrangementsagreements of the Named Executive Officers, see “—Employment Arrangements”Agreements” below.
223
Post-Employment Compensation
Each of the written employment arrangementsagreements with the Named Executive Officers, as described in “—Employment Arrangements”Agreements” below, provides them with the opportunity to receive various payments and benefits in the event of an involuntary termination of employment under certain specified circumstances, including an involuntary termination of employment in connection with a change in control of us.Sabre.
We provide these arrangements to encourage the Named Executive Officers to work at a dynamic and rapidly growing business where theirlong-term compensation largely depends on future stock price appreciation. Specifically, the arrangements are intended to mitigate a potential disincentive for the Named Executive Officers when they are evaluating a potential acquisition of us, particularly when their services may not be required by the acquiring entity. In such a situation, we believe that these arrangements are necessary to encourage retention of the Named Executive Officers through the conclusion of the transaction, and to ensure a smooth management transition. These arrangements have been drafted to provide each of the Named Executive Officers with consistent treatment that is competitive with current market practices. We believe that the level of benefits provided under these various agreements is in line with market practice and help us to attract and retain key talent.
For a detailed description of thepost-employment compensation arrangements of the Named Executive Officers, see “—Potential Payments upon Termination or Change in Control” below.
Other Compensation Policies
In anticipation of becoming a public reporting company,2014, we are in the process of adoptingadopted several policies that we believe are important components of apublic-company executive compensation program.
Stock Ownership Policy
Currently,In June 2014, we do not have equity securityadopted a stock ownership guidelines or requirementspolicy for our executive officers. Nonetheless, mostofficers and the non-employee members of our board of directors. Under this policy, the individuals who have been designated as an executive officer or Senior Vice President of Sabre are required to own that number of shares of our common stock with a value equal to a specified multiple of their annual base salary divided by the volume-weighted average price of our common stock on the trading day immediately preceding April 1st of each year. As adopted, these base salary multiples are as follows:
Position | Market Value of Stock That Must be Owned (As a Multiple of Base Salary) | |
Chief Executive Officer | Five | |
Executive Vice Presidents | Three | |
Senior Vice Presidents | Two |
Shares of our common stock that count towards satisfaction of the guidelines include shares beneficially owned by the individual or immediate family members, shares held in trust for the benefit of the individual or immediate family members, vested shares of restricted stock, vested restricted stock units that have been settled in stock, and shares acquired as a result of the exercise of vested stock options. Unvested restricted stock awards or restricted stock unit awards, and unexercised stock options do not count towards satisfaction of the guidelines.
In addition, until such time as an executive officer has met his or her specified ownership level, he or she is required to retain an amount equal to 50% of the net shares of Sabre common stock (i.e., shares remaining after the payment of the exercise price or the tax withholding obligations with respect to an equity award) received as the result of the exercise, vesting, or payment of any equity awards granted to him or her.
In the case of the non-employee members of our board of directors, each individual is required to own that number of shares of our common stock with a market value equal to five times his or her annual retainer divided by the volume-weighted average price of our common stock on the trading day immediately preceding April 1st of each year.
224
Our executive officers and the non-employee members of our board of directors are required to meet these ownership requirements within five years of the later of (i) the effective date of our initial public offering or (ii) becoming an executive officer or non-employee member of our board of directors, as applicable.
Although the stock ownership policy was adopted in 2014, several of our executive officers including the Named Executive Officers, have significant stock ownership in us. Some of this stock was purchased by these executive officers in March 2007 in conjunction with
our becoming a privately-held entity. Other executive officers have received significant equity awards in connection with joining us. The Compensation Committeecompensation committee believes that this stock ownership aligns the financial interests of our executive officers with those of our stockholders. To further this ownership objective, we intend to adopt stock ownership policies for our executive officers and the non-employee members of our board of directors in connection with this offering.
Compensation Recovery Policy
Currently, we have not implemented a policy regarding retroactive adjustments to any cash orequity-based incentive compensation paid to our executive officers and other employees where the payments were predicated upon the achievement of financial results that were subsequently the subject of a financial restatement. We intend to adopt a general compensation recovery (“clawback”) policy covering our annual andlong-term incentive award plans and arrangements once the SEC adopts final rules implementing the requirement of Section 954 of theDodd-Frank Act.
Derivatives Trading and Hedging and Pledging Policies
In connection with thisour initial public offering, we intend to adoptadopted a general insider trading policy that provides that no employee,executive officer or member of our board of directors may acquire, sell, or trade in any interest or position relating to the future price of our securities, such as a put option, a call option or a short sale (including a short sale “against the box”), or, without our prior consent, engage in hedging transactions (including “cashless collars”). Similarly, we intend to adopt a generalour policy thatgenerally prohibits our executive officers and members of our board of directors from pledging any of their shares of our common stock as collateral for a loan or other financial arrangement.
Equity Award Grant Policy
We have notIn October 2014, we adopted a formal policy for the timing of equity awards. The Compensation Committee, however, follows an informal practicepolicy provides that our annual grant pool is approved at a meeting of granting annual equity awardsour compensation committee held in the first quarter of each fiscal year and grants are made on the calendar year. We have also granted awards infifteenth day of the casethird month of new hires, promotionsour fiscal year or special retention awards. We intend to adoptif such day is not a formal policy for the timing of equity awards in connection with this offering. It is anticipated that, pursuant to this policy, the Compensation Committee will grant equity awards at approximately the same time each year, generally duringbusiness day, the first quarterbusiness day immediately preceding such day. Under our equity grant policy all grants to our executive officers must be made by the compensation committee. Grants to newly elected non-employee directors will be made on the date of the calendar year.board meeting at which the new director is elected. If the specified grant date falls on a non-business day, the grant date will be the first business day immediately preceding that day.
Tax and Accounting Considerations
Deductibility of Compensation
Section 162(m) of the Code generally disallows public companies a tax deduction for federal income tax purposes of remuneration in excess of $1 million paid to the CEO and each of the three other mosthighly-compensated executive officers (other than the chief financial officer) in any taxable year. Generally, remuneration in excess of $1 million may only be deducted if it is “performance-based“performance-based compensation” within the meaning of the Code. In this regard, the compensation income realized upon the exercise of stock options granted under astockholder-approved stock option plan generally will be deductible so long as the options are granted by a committee whose members arenon-employee directors and certain other conditions are satisfied.
As we are not currently only becamepublicly-traded as of April 17, 2014, the Compensation Committeecompensation committee has not in recent years taken the deductibility limit imposed by Section 162(m) into consideration in setting compensation for our
225
executive officers. In approving the amount and form of compensation for our executive officers in the future, however, the Compensation Committeecompensation committee will consider all elements of the cost to us of providing such compensation, including the potential impact of Section 162(m). Further, as a newly public company, we intend to rely upon certain transition relief under Section 162(m).
Nonetheless, the Compensation Committeecompensation committee believes that, in establishing the cash and equity incentive compensation plans and arrangements for our executive officers, the potential deductibility of the compensation payable under those plans and arrangements should be only one of a number of relevant factors taken into consideration, and not the sole governing factor. For that reason, the Compensation Committeecompensation committee may deem it appropriate to provide one or more executive officers with the opportunity to earn incentive compensation, whether through cash incentive awards tied to our financial performance or equity incentive awards tied to the executive officer’s continued service, which may be in excess of the amount deductible by reason of Section 162(m) or other provisions of the Code. Further, the Compensation Committeecompensation committee reserves the discretion, in its judgment, to approve, from time to time, compensation arrangements that may not be tax deductible for us, such as base salary and equity awards withtime-based vesting requirements, or which do not comply with an exemption from the deductibility limit when it believes that such arrangements are appropriate to attract and retain executive talent.
The Compensation Committeecompensation committee believes it is important to maintain cash and equity incentive compensation at the requisite level to attract and retain the individuals essential to our financial success, even if all or part of that compensation may not be deductible by reason of the Section 162(m) limitation.
“Golden Parachute” Payments
Sections 280G and 4999 of the Code provide that executive officers and directors who hold significant equity interests and certain other service providers may be subject to an excise tax if they receive payments or benefits in connection with a change in control of us that exceeds certain prescribed limits, and that we, or a successor, may forfeit a deduction on the amounts subject to this additional tax. We did not provide any executive officer, including any Named Executive Officer, with a “gross-up”“gross-up” or other reimbursement payment for any tax liability that he or she might owe as a result of the application of Sections 280G or 4999 during Fiscal 20132014 and we have not agreed and are not otherwise obligated to provide any Named Executive Officer with such a “gross-up”“gross-up” or other reimbursement.
Accounting forStock-Based Compensation
We follow Financial Accounting Standard Board Accounting Standards Codification Topic 718 (“ASC Topic 718”), for ourstock-based compensation awards. ASC Topic 718 requires companies to measure the compensation expense for allshare-based payment awards made to employees and directors, including stock options, based on the grant date “fair value” of these awards. This calculation is performed for accounting purposes and reported in the compensation tables below, even though our executive officers may never realize any value from their awards. ASC Topic 718 also requires companies to recognize the compensation cost of theirstock-based compensation awards in their income statements over the period that an executive officer is required to render service in exchange for the option or other award.
Fiscal 2013226
2014 Summary Compensation Table
The following table sets forth the compensation paid to, received by, or earned during Fiscalfiscal years 2014 and 2013 by the Named Executive Officers:
Name and Principal Position | Fiscal Year | Salary ($) | Bonus ($)(1) | Stock Awards ($)(2) | Option Awards ($)(2) | Non- Equity Incentive Plan Compen- sation ($)(3) | All Other Compensation ($)(4) | Total ($) | ||||||||||||||||||||||||
Thomas Klein, | 2013 | $ | 711,923 | — | $ | 1,968,206 | $ | 1,729,168 | $ | 682,757 | $ | 27,258 | $ | 5,119,312 | ||||||||||||||||||
President and CEO | ||||||||||||||||||||||||||||||||
Richard Simonson, | 2013 | $ | 484,615 | $62,708 | $ | 2,991,000 | $ | 2,010,000 | $ | 337,292 | $ | 283,266 | $ | 6,168,881 | ||||||||||||||||||
Executive Vice President and Chief | ||||||||||||||||||||||||||||||||
Financial Officer(4) | ||||||||||||||||||||||||||||||||
Carl Sparks, | 2013 | $ | 600,000 | — | — | — | $ | 148,800 | $ | 28,884 | $ | 777,684 | ||||||||||||||||||||
Executive Vice President and President and | ||||||||||||||||||||||||||||||||
CEO, Travelocity | ||||||||||||||||||||||||||||||||
Deborah Kerr, | 2013 | $ | 403,846 | $ | 243,923 | $ | 1,994,000 | $ | 2,010,000 | $ | 281,077 | $ | 258,158 | $ | 5,191,004 | |||||||||||||||||
Executive Vice President and Chief Product and Technology Officer(5) | ||||||||||||||||||||||||||||||||
William G. Robinson, Jr., | 2013 | $ | 16,154 | $ | 50,000 | $ | 1,383,894 | $ | 1,389,821 | — | $ | 1,140 | $ | 2,841,009 | ||||||||||||||||||
Executive Vice President and Chief Human | ||||||||||||||||||||||||||||||||
Resources Officer(6) | ||||||||||||||||||||||||||||||||
| Michael S. Gilliland, | 2013 | $ | 730,769 | — | — | — | — | $ | 2,334,105 | $ | 3,064,874 | |||||||||||||||||||||
former CEO(7) | ||||||||||||||||||||||||||||||||
Mark Miller, | 2013 | $ | 210,000 | — | — | — | — | $ | 374,479 | $ | 584,479 | |||||||||||||||||||||
former Executive Vice President and Chief | ||||||||||||||||||||||||||||||||
Financial Officer(8) | ||||||||||||||||||||||||||||||||
Name and Principal Position | Fiscal Year | Salary ($) | Bonus ($)(1) | Stock Awards ($)(2) | Option Awards ($)(2) | Non- Equity Incentive Plan Compen- sation ($)(3) | Change in Pension Value and Non- qualified Deferred Compen- sation Earnings(4) | All Other Compensation ($)(5) | Total ($) | |||||||||||||||||||||||||||
Tom Klein | 2014 | $ | 907,692 | — | $ | 3,825,008 | $ | 1,274,999 | $ | $ | 45,100 | $ | 24,114 | $ | ||||||||||||||||||||||
President and CEO | 2013 | $ | 711,923 | — | $ | 1,968,206 | $ | 1,729,168 | $ | 682,757 | — | $ | 27,258 | $ | 5,119,312 | |||||||||||||||||||||
Richard Simonson | 2014 | $ | 611,538 | — | $ | 974,996 | $ | 325,001 | $ | — | $ | 23,830 | $ | |||||||||||||||||||||||
Executive Vice President and Chief Financial Officer | 2013 | $ | 484,615 | $ | 182,708 | $ | 2,991,000 | $ | 2,010,000 | $ | 337,292 | — | $ | 283,266 | $ | 6,288,881 | ||||||||||||||||||||
Rachel Gonzalez | 2014 | $ | 125,192 | $ | 50,000 | $ | 850,007 | $ | 849,999 | $ | — | $ | 1,156 | $ | ||||||||||||||||||||||
Executive Vice President and General Counsel(6) | ||||||||||||||||||||||||||||||||||||
Deborah Kerr | 2014 | $ | 526,923 | — | $ | 862,506 | $ | 287,501 | $ | — | $ | 11,582 | $ | |||||||||||||||||||||||
Executive Vice President and Chief Product and Technology Officer | 2013 | $ | 403,846 | $ | 243,923 | $ | 1,994,000 | $ | 2,010,000 | $ | 281,077 | — | $ | 258,158 | $ | 5,191,004 | ||||||||||||||||||||
Gregory Webb | 2014 | $ | 490,769 | — | $ | 787,496 | $ | 262,501 | $ | $ | 1,500 | $ | 14,263 | $ | ||||||||||||||||||||||
Executive Vice President and President, Travel Network | ||||||||||||||||||||||||||||||||||||
Carl Sparks | 2014 | $ | 198,462 | $ | 1,500,000 | $ | 41,053 | (8) | — | — | — | $ | 737,039 | $ | 2,476,554 | | ||||||||||||||||||||
Former Executive Vice President and President and CEO, Travelocity(7) | 2013 | $ | 600,000 | — | — | — | $ | 148,800 | — | $ | 28,884 | $ | 777,684 | |||||||||||||||||||||||
| (1) | The amounts reported in the “Bonus” column for 2014 represent |
| (2) | The amounts reported in the “Stock Awards” and “Option Awards” columns represent the aggregate grant date fair value of thestock-based awards granted to the Named Executive Officers during |
| (3) | The amounts reported in the |
| (4) | For 2013, the aggregate value of Mr. Klein’s pension benefit decreased by $8,300. Because this amount decreased, it has been excluded from the table above under the SEC’s regulations. Messrs. Simonson and Sparks and Ms. Gonzalez and Ms. Kerr do not participate in the LPP. |
227
| (5) | The amounts reported in the “All Other Compensation” column are described in more detail in the following table. The amounts reported for perquisites and other benefits represent the actual cost incurred by us in providing these benefits to the indicated Named Executive Officer. |
Name | Group Term Life Insurance Premiums | Country Club Membership Dues(a) | Executive Physical Examin- ation | Financial Planning Services | Relocation | Section 401(k) Plan Matching Contribution | Post-Employment Compensation Payments(b) | Year | Group Term Life Insurance Premiums | Country Club Membership Dues(a) | Executive Physical Examin- ation | Financial Planning Services | Relocation | Section 401(k) Plan Matching Contribution | Post-Employment Compensation Payments(b) | Total | ||||||||||||||||||||||||||||||||||||||||||||||||
Mr. Klein | $ | 713 | $ | 3,058 | $ | 3,277 | $ | 4,910 | $ | 15,300 | — | 2014 | $ | 599 | — | $ | — | $ | 7,915 | — | $ | 15,600 | — | $ | 24,114 | |||||||||||||||||||||||||||||||||||||||
| 2013 | $ | 713 | $ | 3,058 | $ | 3,277 | $ | 4,910 | — | $ | 15,300 | — | $ | 27,258 | ||||||||||||||||||||||||||||||||||||||||||||||||||
Mr. Simonson | $ | 579 | — | $ | 3,697 | $ | 5,000 | $ | 258,690 | (c) | $ | 15,300 | — | 2014 | $ | 404 | — | $ | 2,826 | $ | 5,000 | — | $ | 15,600 | — | $ | 23,830 | |||||||||||||||||||||||||||||||||||||
| 2013 | $ | 579 | — | $ | 3,697 | $ | 5,000 | $ | 258,690 | (c) | $ | 15,300 | — | $ | 283,266 | |||||||||||||||||||||||||||||||||||||||||||||||||
Ms. Gonzalez | 2014 | $ | 83 | — | — | — | — | $ | 1,073 | — | $ | 1,156 | ||||||||||||||||||||||||||||||||||||||||||||||||||||
Ms. Kerr | 2014 | $ | 348 | — | $ | 3,434 | — | — | $ | 7,800 | — | $ | 11,582 | |||||||||||||||||||||||||||||||||||||||||||||||||||
| 2013 | $ | 508 | — | — | — | $ | 250,000 | (d) | $ | 7,650 | — | $ | 258,158 | |||||||||||||||||||||||||||||||||||||||||||||||||||
Mr. Webb | 2014 | $ | 324 | — | $ | 3,539 | — | — | $ | 10,400 | — | $ | 14,263 | |||||||||||||||||||||||||||||||||||||||||||||||||||
Mr. Sparks | $ | 792 | — | $ | 2,792 | $ | 10,000 | (d) | $ | 15,300 | — | 2014 | $ | 131 | — | — | $ | 5,000 | — | $ | 11,908 | $ | 720,000 | $ | 737,039 | |||||||||||||||||||||||||||||||||||||||
Ms. Kerr | $ | 508 | — | — | — | $ | 250,000 | (e) | $ | 7,650 | — | |||||||||||||||||||||||||||||||||||||||||||||||||||||
Mr. Robinson | — | — | — | — | $ | 1,140 | (f) | — | — | |||||||||||||||||||||||||||||||||||||||||||||||||||||||
Mr. Gilliland | $ | 796 | $ | 5,965 | $ | 3,475 | — | $ | 14,700 | $ | 2,309,169 | |||||||||||||||||||||||||||||||||||||||||||||||||||||
Mr. Miller | $ | 267 | — | $ | 2,267 | — | $ | 12,600 | $ | 359,345 | ||||||||||||||||||||||||||||||||||||||||||||||||||||||
| 2013 | $ | 792 | — | $ | 2,792 | $ | 10,000 | — | $ | 15,300 | — | $ | 28,884 | |||||||||||||||||||||||||||||||||||||||||||||||||||
| (a) | Historically, we paid the dues for a country club membership for certain executive officers, including |
| September 2013. |
| (b) | The amounts reported in this column representpost-employment compensation payments and benefits provided to |
| (c) | In connection with his joining us as our Executive Vice President and Chief Financial Officer, we paid a relocation company the reported amount for the costs associated with Mr. Simonson’s relocation to Dallas, Texas. In |
| (d) |
| In connection with her joining us as our Executive Vice President and Chief Product and Technology Officer, and pursuant to the terms and conditions of her employment agreement, we paid Ms. Kerr the reported amount to reimburse her for the costs associated with her relocation to Dallas, Texas. |
| (7) | Mr. |
| (8) | Represents the incremental charge related to the acceleration of the vesting of Mr. Sparks’ restricted stock unit award from June 15, 2014 to April 28, 2014. |
Fiscal 2013
228
2014 Grants ofPlan-Based Awards Table
The following table sets forth, for each of the Named Executive Officers, theplan-based awards granted to him or her during Fiscal 2013.2014.
Name | Grant Date | Estimated Possible Payouts Under Non- Equity Incentive Plan Awards (Target) ($)(1) | Estimated Possible Payouts Under Non- Equity Incentive Plan Awards (Maximum) ($)(1) | Estimated Future Payouts Under Equity Incentive Plan Awards (#)(2) | All Other Option Awards: Number of Securities Underlying Options (#)(3) | Exercise or Base Price of Option Awards ($/sh) | Grant Date Fair Value of Stock and Option Awards ($)(4) | Grant Date | Approval Date(1) | Estimated Possible Payouts UnderNon- Equity Incentive Plan Awards (Target) ($)(2) | Estimated Possible Payouts UnderNon- Equity Incentive Plan Awards (Maximum) ($)(2) | Estimated Future Payouts Under Equity Incentive Plan Awards (#)(3) | All Other Option Awards: Number of Securities Underlying Options (#)(4) | Exercise or Base Price of Option Awards ($/sh) | Grant Date Fair Value of Stock and Option Awards ($)(5) | |||||||||||||||||||||||||||||||||||||||||||
Mr. Klein | $ | 784,778 | $ | 1,569,556 | $ | 1,223,114 | $ | 2,446,228 | ||||||||||||||||||||||||||||||||||||||||||||||||||
| 08/15/2013 | 198,563 | $ | 13.22 | $ | 808,151 | |||||||||||||||||||||||||||||||||||||||||||||||||||||
| 08/15/2013 | 66,188 | $ | 875,005 | |||||||||||||||||||||||||||||||||||||||||||||||||||||||
| 10/25/2013 | 200,221 | $ | 14.01 | $ | 921,017 | 04/17/2014 | 03/24/2014 | 263,975 | $ | 16.68 | $ | 1,274,999 | ||||||||||||||||||||||||||||||||||||||||||||||
| 10/25/2013 | 78,030 | $ | 1,093,200 | 04/17/2014 | 03/24/2014 | 229,317 | $ | 3,825,008 | ||||||||||||||||||||||||||||||||||||||||||||||||||
Mr. Simonson | $ | 387,692 | $ | 775,384 | $ | 489,231 | $ | 978,461 | ||||||||||||||||||||||||||||||||||||||||||||||||||
| 03/11/2013 | 600,000 | $ | 9.97 | $ | 2,010,000 | 04/17/2014 | 03/24/2014 | 67,288 | $ | 16.68 | $ | 325,001 | ||||||||||||||||||||||||||||||||||||||||||||||
| 03/11/2013 | 300,000 | $ | 2,991,000 | 04/17/2014 | 03/24/2014 | 58,453 | $ | 974,996 | ||||||||||||||||||||||||||||||||||||||||||||||||||
Mr. Sparks | $ | 480,000 | $ | 960,000 | ||||||||||||||||||||||||||||||||||||||||||||||||||||||
Ms. Gonzalez | $ | 100,154 | $ | 200,308 | ||||||||||||||||||||||||||||||||||||||||||||||||||||||
| 10/15/2014 | 08/25/2014 | 230,978 | $ | 15.36 | $ | 849,999 | ||||||||||||||||||||||||||||||||||||||||||||||||||||
| 10/15/2014 | 08/25/2014 | 55,339 | $ | 850,007 | ||||||||||||||||||||||||||||||||||||||||||||||||||||||
Ms. Kerr | $ | 323,077 | $ | 646,154 | $ | 421,538 | $ | 843,077 | ||||||||||||||||||||||||||||||||||||||||||||||||||
| 03/11/2013 | 600,000 | $ | 9.97 | $ | 2,010,000 | 04/17/2014 | 03/24/2014 | 59,524 | $ | 16.68 | $ | 287,501 | ||||||||||||||||||||||||||||||||||||||||||||||
| 03/11/2013 | 200,000 | $ | 1,994,000 | 04/17/2014 | 03/24/2014 | 51,709 | $ | 862,506 | ||||||||||||||||||||||||||||||||||||||||||||||||||
Mr. Robinson | — | — | ||||||||||||||||||||||||||||||||||||||||||||||||||||||||
Mr. Webb | $ | 392,615 | $ | 785,231 | ||||||||||||||||||||||||||||||||||||||||||||||||||||||
| 12/16/2013 | 296,337 | $ | 14.01 | $ | 1,389,821 | 04/17/2014 | 03/24/2014 | 54,348 | $ | 16.68 | $ | 262,501 | ||||||||||||||||||||||||||||||||||||||||||||||
| 12/16/2013 | 98,779 | $ | 1,383,894 | 04/17/2014 | 03/24/2014 | 47,212 | $ | 787,496 | ||||||||||||||||||||||||||||||||||||||||||||||||||
Mr. Gilliland | $ | 1,500,000 | (5) | — | ||||||||||||||||||||||||||||||||||||||||||||||||||||||
Mr. Miller | $ | 294,000 | (5) | — | ||||||||||||||||||||||||||||||||||||||||||||||||||||||
Mr. Sparks | — | — | — | — | — | — | — | — | ||||||||||||||||||||||||||||||||||||||||||||||||||
| (1) | Date of compensation committee approval of grants for Messrs. Klein, Simonson and Webb and Ms. Gonzalez and Ms. Kerr. |
| (2) | The amounts reported reflect the target and maximum annual cash bonus opportunities payable to the Named Executive Officer under the |
| The performance-based restricted stock unit awards granted on April 17, 2014 under |
All options to purchase shares of our common stock granted to the Named Executive Officers in |
With the exception of the option granted to Mr. Klein, 25% of the shares of our common stock subject to each such option vests on the first anniversary of the date of grant and as to 6.25% of such shares at the end of each successive three-month period thereafter, subject to the Named Executive Officer’s continued employment through each vesting date. Mr. Klein’s option vested as to 25% of the shares of our common stock subject to such option on the date of grant and as to 6.25% of such shares at the end of each successive three-month period thereafter, subject to his continued employment through each vesting date.
229
| employment through each vesting date. The option granted effective October 15, 2014 under the 2014 Omnibus Plan to Ms. Gonzalez as part of her employment agreement vests as to 25% of the shares of our common stock subject to each such option on the first anniversary of the date of grant and as to 6.25% of such shares at the end of each successive three month period thereafter, subject to the her continued employment through each vesting date. |
| (5) | These amounts reflect the aggregate grant date fair value of option and stock awards computed in accordance with ASC Topic 718. The fair value of each option award was estimated on the date of grant using the |
Fiscal 20132014 Outstanding Equity Awards atYear-End Table
The following table sets forth, for each of the Named Executive Officers, the equity awards outstanding as of December 31, 2013.2014.
Name | Date of Grant of Equity Award | Option/SAR Awards— Number of Securities Underlying Unexercised Options/SARs (#) Exercisable(1) | Option/SAR Awards— Number of Securities Underlying Unexercised Options/SARs (#) Unexercisable(1) | Option/SAR Awards— Equity Incentive Plan Awards: Number of Securities Underlying Unexercised Unearned Options (#)(3) | Option/SAR Awards— Option/SAR Exercise Price ($) | Option/SAR Awards— Option/SAR Expiration Date | Equity Incentive Plan Awards— Number of Unearned Shares, Units, or Other Rights That Have Not Vested (#)(2) | Equity Incentive Plan Awards— Market or Payout Value of Unearned Shares, Units, Other Rights That Have Not Vested ($) | Date of Grant of Equity Award | Option/SAR Awards— Number of Securities Underlying Unexercised Options/SARs (#) Exercisable(1) | Option/SAR Awards— Number of Securities Underlying Unexercised Options/SARs (#) Unexercisable(1) | Option/SAR Awards— Equity Incentive Plan Awards: Number of Securities Underlying Unexercised Unearned Options (#)(2) | Option/SAR Awards— Option/SAR Exercise Price ($) | Option/SAR Awards— Option/SAR Expiration Date | Equity Incentive Plan Awards— Number of Unearned Shares, Units, or Other Rights That Have Not Vested (#)(3) | Equity Incentive Plan Awards— Market or Payout Value of Unearned Shares, Units, Other Rights That Have Not Vested ($) | ||||||||||||||||||||||||||||||||||||||||||||||||
Mr. Klein | 06/11/2007 | 317,250 | $ | 5.00 | 06/11/2017 | 06/11/2007 | 634,500 | $ | 5.00 | 06/11/2017 | ||||||||||||||||||||||||||||||||||||||||||||||||||||||
| 06/11/2007 | 634,500 | — | $ | 5.00 | 06/11/2017 | 06/11/2007 | — | 317,250 | $ | 5.00 | 06/11/2017 | |||||||||||||||||||||||||||||||||||||||||||||||||||||
| 01/31/2008 | 11,250 | $ | 5.00 | 01/31/2018 | 01/31/2008 | 22,500 | $ | 5.00 | 01/31/2018 | |||||||||||||||||||||||||||||||||||||||||||||||||||||||
| 01/31/2008 | 22,500 | — | $ | 5.00 | 01/31/2018 | 01/31/2008 | — | 11,250 | $ | 5.00 | 01/31/2018 | |||||||||||||||||||||||||||||||||||||||||||||||||||||
| 03/31/2009 | 381,250 | 18,750 | (4) | $ | 3.00 | 03/31/2019 | 03/31/2009 | 400,000 | $ | 3.00 | 03/31/2019 | |||||||||||||||||||||||||||||||||||||||||||||||||||||
| 03/31/2009 | 156,550 | 7,700 | (4) | $ | 3.00 | 03/31/2019 | 03/31/2009 | 164,250 | $ | 3.00 | 03/31/2019 | |||||||||||||||||||||||||||||||||||||||||||||||||||||
| 03/23/2010 | 267,968 | 82,032 | (4) | $ | 5.23 | 03/23/2020 | 03/23/2010 | 333,593 | 16,407 | (4) | $ | 5.23 | 03/23/2020 | |||||||||||||||||||||||||||||||||||||||||||||||||||
| 03/23/2010 | — | 350,000 | (5) | $ | 0.6251 | (6) | 03/23/2020 | 12/03/2012 | 20,000 | 20,000 | (6) | $ | 9.97 | 12/03/2022 | ||||||||||||||||||||||||||||||||||||||||||||||||||
| 10,000 | 30,000 | (7) | $ | 9.97 | 12/03/2022 | 08/15/2013 | 111,691 | 86,872 | (7) | $ | 13.22 | 08/15/2023 | ||||||||||||||||||||||||||||||||||||||||||||||||||||
| 12/03/2012 | 62,050 | 136,513 | (8) | $ | 13.22 | 08/15/2023 | 10/25/2013 | 112,624 | 87,597 | (7) | $ | 14.01 | 10/25/2023 | |||||||||||||||||||||||||||||||||||||||||||||||||||
| 08/15/2013 | 62,569 | 137,652 | (8) | $ | 14.01 | 10/25/2023 | 04/17/2014 | 263,975 | (5) | $ | 16.68 | 04/17/2024 | ||||||||||||||||||||||||||||||||||||||||||||||||||||
| 10/25/2013 | 20,000 | $ | 280,200 | 12/03/2012 | 15,000 | 304,050 | ||||||||||||||||||||||||||||||||||||||||||||||||||||||||||
| 12/03/2012 | 66,188 | $ | 927,294 | 08/15/2013 | 49,641 | 1,006,223 | ||||||||||||||||||||||||||||||||||||||||||||||||||||||||||
| 08/15/2013 | 78,030 | $ | 1,093,200 | 10/25/2013 | 58,523 | 1,186,261 | ||||||||||||||||||||||||||||||||||||||||||||||||||||||||||
| 10/25/2013 | 04/17/2014 | 229,317 | 4,648,256 | |||||||||||||||||||||||||||||||||||||||||||||||||||||||||||||
Mr. Simonson | 03/11/2013 | — | 600,000 | (7) | $ | 9.97 | 03/11/2023 | 03/11/2013 | 262,500 | 337,500 | (6) | $ | 9.97 | 03/11/2023 | ||||||||||||||||||||||||||||||||||||||||||||||||||
| 03/11/2013 | 300,000 | $ | 4,203,000 | 04/17/2014 | — | 67,288 | (5) | $ | 16.68 | 04/17/2024 | ||||||||||||||||||||||||||||||||||||||||||||||||||||||
Mr. Sparks | 04/25/2011 | 118,064 | (10) | $ | 1,654,077 | |||||||||||||||||||||||||||||||||||||||||||||||||||||||||||
| 03/11/2013 | 225,000 | 4,560,750 | ||||||||||||||||||||||||||||||||||||||||||||||||||||||||||||||
| 04/17/2014 | 58,453 | 1,184,842 | ||||||||||||||||||||||||||||||||||||||||||||||||||||||||||||||
Ms. Gonzalez | 10/15/2014 | — | 230,978 | (6) | $ | 15.36 | 10/15/2024 | |||||||||||||||||||||||||||||||||||||||||||||||||||||||||
| 10/15/2014 | — | 55,339 | 1,121,722 | |||||||||||||||||||||||||||||||||||||||||||||||||||||||||||||
Ms. Kerr | 03/11/2013 | 262,500 | 337,500 | (6) | $ | 9.97 | 03/11/2023 | |||||||||||||||||||||||||||||||||||||||||||||||||||||||||
| 04/17/2014 | — | 59,524 | (5) | $ | 16.68 | 04/17/2024 | ||||||||||||||||||||||||||||||||||||||||||||||||||||||||||
| 05/15/2012 | 1,831,896 | 219,828 | (9) | $ | 2.77 | 05/15/2022 | 03/11/2013 | 150,000 | 3,040,500 | |||||||||||||||||||||||||||||||||||||||||||||||||||||||
| 05/15/2012 | 1,831,896 | 219,828 | (9) | $ | 0.13 | 05/15/2022 | (11) | 04/17/2014 | 51,709 | 1,048,141 | ||||||||||||||||||||||||||||||||||||||||||||||||||||||
| $ | 1,680,000 | |||||||||||||||||||||||||||||||||||||||||||||||||||||||||||||||
Ms. Kerr | 03/11/2013 | — | 600,000 | (7) | $ | 9.97 | 03/11/2023 | |||||||||||||||||||||||||||||||||||||||||||||||||||||||||
| 03/11/2013 | 200,000 | $ | 2,802,000 | |||||||||||||||||||||||||||||||||||||||||||||||||||||||||||||
Mr. Robinson | 12/16/2013 | — | 296,337 | (7) | $ | 14.01 | 12/16/2023 | |||||||||||||||||||||||||||||||||||||||||||||||||||||||||
| 12/16/2013 | 98,779 | (12) | $ | 1,383,894 | ||||||||||||||||||||||||||||||||||||||||||||||||||||||||||||
Mr. Gilliland | 06/11/2007 | 1,587,500 | — | $ | 5.00 | 09/21/2015 | (15) | |||||||||||||||||||||||||||||||||||||||||||||||||||||||||
| 04/01/2008 | 62,500 | — | $ | 5.00 | 09/21/2015 | (15) | ||||||||||||||||||||||||||||||||||||||||||||||||||||||||||
| 04/01/2009 | 825,000 | — | $ | 3.00 | 09/21/2015 | (15) | ||||||||||||||||||||||||||||||||||||||||||||||||||||||||||
| 04/01/2009 | 750,000 | — | $ | 3.00 | 09/21/2015 | (15) | ||||||||||||||||||||||||||||||||||||||||||||||||||||||||||
| 12/03/2012 | 108,668 | 326,007 | (13) | $ | 9.97 | 09/21/2015 | ||||||||||||||||||||||||||||||||||||||||||||||||||||||||||
Mr. Miller | 06/11/2007 | — | — | 112,575 | (14) | $ | 5.00 | 06/30/2015 | ||||||||||||||||||||||||||||||||||||||||||||||||||||||||
Mr. Webb | 06/11/2007 | 328,950 | $ | 5.00 | 06/11/2017 | |||||||||||||||||||||||||||||||||||||||||||||||||||||||||||
| 06/11/2007 | 337,725 | — | $ | 5.00 | 06/30/2015 | 01/31/2008 | 22,500 | $ | 5.00 | 01/31/2018 | ||||||||||||||||||||||||||||||||||||||||||||||||||||||
| 01/31/2008 | — | — | 5,100 | (14) | $ | 5.00 | 06/30/2015 | 03/31/2009 | 100,000 | $ | 3.00 | 03/31/2019 | ||||||||||||||||||||||||||||||||||||||||||||||||||||
| 01/31/2008 | 15,300 | — | $ | 5.00 | 06/30/2015 | 03/31/2009 | 58,575 | $ | 3.00 | 03/31/2019 | ||||||||||||||||||||||||||||||||||||||||||||||||||||||
| 03/31/2009 | 304,476 | — | $ | 3.00 | 06/30/2015 | 03/14/2012 | 173,437 | 126,563 | (4) | $ | 8.18 | 03/14/2022 | ||||||||||||||||||||||||||||||||||||||||||||||||||||
| 03/23/2010 | 235,156 | — | $ | 5.23 | 06/30/2015 | 12/03/2012 | 37,500 | 37,500 | (6) | $ | 9.97 | 12/03/2022 | ||||||||||||||||||||||||||||||||||||||||||||||||||||
| 04/17/2014 | 54,348 | (5) | $ | 16.68 | 04/17/2024 | |||||||||||||||||||||||||||||||||||||||||||||||||||||||||||
| 12/03/2012 | 28,125 | 570,094 | ||||||||||||||||||||||||||||||||||||||||||||||||||||||||||||||
| 04/17/2014 | 47,212 | 956,987 | ||||||||||||||||||||||||||||||||||||||||||||||||||||||||||||||
Mr. Sparks | — | — | — | — | — | — | — | — | ||||||||||||||||||||||||||||||||||||||||||||||||||||||||
230
| (1) | Each option to purchase shares of our common stock (i) granted prior to 2012 was granted pursuant to our 2007 Management Equity Incentive Plan (amended in 2010) |
| (2) | These options to purchase shares of our common stock vest and become exercisable upon a liquidity event where the Principal Stockholders realize a threshold multiple of money (“MoM”) for their interest in us, as determined by our board of directors, or, following the third anniversary of an initial public offering of our common stock, upon a determination by our board of directors that such MoM could be realized by our Principal Stockholders if they sold their remaining interest in us and subject to the Named Executive Officer’s continued employment through such date. |
| (3) | Each restricted stock unit award covering shares of our common stock granted during 2013 was granted pursuant to our 2012 Management Equity Incentive Plan and granted after 2014 was granted pursuant to the 2014 Omnibus Plan. |
| (4) | These options to purchase shares of our common stock vest and become exercisable as to 25% of the shares of common stock subject to each such option on the first anniversary of the date of grant and as to 4.6875% of such shares at the end of each successivethree-month period thereafter, subject to the Named Executive Officer’s continued employment through each vesting date. |
| (5) |
| (6) |
| These options to purchase shares of our common stock vest and become exercisable as to 25% of the shares of common stock subject to each such option on the first anniversary of the date of grant and as to 6.25% of such shares at the end of each successive three-month period thereafter, subject to the Named Executive Officer’s continued employment through each vesting date. |
| These options to purchase shares of our common stock vest and become exercisable as to 25% of the shares of common stock subject to each such option on the date of grant and as to 6.25% of such shares at the end of each successivethree-month period thereafter, subject to the Named Executive Officer’s continued employment through each vesting date. |
2014 |
Fiscal 2013 Options Exercised and Stock Vested Table
The following table sets forth, for each of the Named Executive Officers, the number of shares of our common stock acquired upon the exercise of stock options and vesting of restricted stock awards and restricted stock unitsunit awards during the year ended December 31, 2013,2014, and the aggregate value realized upon the exercise or vesting of such awards. For purposes of the table, the value realized is based upon the fair market value of our common stock on the various exercise or vesting dates. No stock options were exercised by the Named Executive Officers during 2014.
Name Mr. Klein Mr. Simonson Ms. Gonzalez Ms. Kerr Mr. Webb Mr. Sparks |
| |||||||||||||||||||||||||||||||||||||||||||||||||||||||||||||||||||||||||||||||||||||
| ||||||||||||||||||||||||||||||||||||||||||||||||||||||||||||||||||||||||||||||||||||||
| ||||||||||||||||||||||||||||||||||||||||||||||||||||||||||||||||||||||||||||||||||||||
| ||||||||||||||||||||||||||||||||||||||||||||||||||||||||||||||||||||||||||||||||||||||
| ||||||||||||||||||||||||||||||||||||||||||||||||||||||||||||||||||||||||||||||||||||||
| ||||||||||||||||||||||||||||||||||||||||||||||||||||||||||||||||||||||||||||||||||||||
| ||||||||||||||||||||||||||||||||||||||||||||||||||||||||||||||||||||||||||||||||||||||
| ||||||||||||||||||||||||||||||||||||||||||||||||||||||||||||||||||||||||||||||||||||||
Fiscal 20132014 Pension Benefits Table
The following table sets forth, for each of the Named Executive Officers, information about the pension benefits that have been earned by him or her under our Legacy Pension Plan (the “LPP”). The benefits to be received under the LPP depend, in part, upon the length of employment of each Named Executive Officer with us. The LPP was frozen to further benefit accruals as of December 31, 2005. Consequently, the information appearing in the column entitled “Number of Years of Credited Service” reflectsdoes not reflect any subsequent employment only through that date.service.
The column entitled “Present Value of Accumulated Benefit” represents a financial calculation that estimates the cash value of the full pension benefit that has been earned by each Named Executive Officer. It is based on various assumptions, including assumptions about how long each Named Executive Officer will live and future interest rates. Additional details about the pension benefits disclosed for each Named Executive Officer follow the table.
Name | Plan Name | Number of Years Credited Service (#)(1) | Present Value of Accumulated Benefit ($)(2) | Payments During Last Fiscal Year ($) | Plan Name | Number of Years Credited Service (#)(2) | Present Value of Accumulated Benefit ($)(3) | Payments During Last Fiscal Year ($) | ||||||||||||||||||||
Mr. Klein | The Sabre, Inc. Legacy Pension Plan | 7.5 | $ | 184,100 | — | The Sabre, Inc. Legacy Pension Plan | 7.5 | $ | 232,500 | — | ||||||||||||||||||
Mr. Simonson | — | — | — | — | — | — | — | — | ||||||||||||||||||||
Ms. Gonzalez | — | — | — | — | ||||||||||||||||||||||||
Ms. Kerr | — | — | — | — | ||||||||||||||||||||||||
Mr. Webb | The Sabre, Inc. Legacy Pension Plan | 0.5 | $ | 6,900 | — | |||||||||||||||||||||||
Mr. Sparks | — | — | — | — | — | — | — | — | ||||||||||||||||||||
Ms. Kerr | — | — | — | — | ||||||||||||||||||||||||
Mr. Robinson | — | — | — | — | ||||||||||||||||||||||||
Mr. Gilliland | The Sabre, Inc. Legacy Pension Plan | 8.0 | $ | 194,400 | — | |||||||||||||||||||||||
Mr. Miller | The Sabre, Inc. Legacy Pension Plan | 0.5 | $ | 8,800 | — | |||||||||||||||||||||||
| (1) | Messrs. Simonson and Sparks and Ms. Gonzalez and Ms. Kerr do not participate in the LPP. |
| (2) | Effective December 31, 2005, the LPP was frozen to further benefit accruals. Accordingly, the number of years reported in the “Number of Years Credited Service” column reflects employment only through that date. |
| The present value of the accumulated retirement benefit for each Named Executive Officer was calculated using a |
Summary Information
The LPP is atax-qualified pension plan that was open to all employees who met the eligibility requirements until March 15, 2000 and that was frozen to further benefit accruals as of December 31, 2005.
Within the LPP, a variety of formulas are used to determine pension benefits. Different benefit formulas apply as a legacy of ourspin-off from American Airlines, Inc. The accrued benefit payable is the greatest benefit determined by the following four formulas:
1. Final Average Benefit Formula | Single Life Annuity equal to 1.667% of Final Average Compensation multiplied by Years of Credited Service | |
2. Basic Benefit Formula (Career Average) | Single Life Annuity equal to Prior Plan Basic Benefit as of 12/31/96, plus for service January 1, | |
232
3. Social Security Offset Formula: | Single Life Annuity equal to 2% of Final Average Annualized Compensation x Years of Credited Service minus 1.5% of Annual Social Security benefit x Years of Credited Service (up to a maximum of 50% of the Social Security benefit) | |
4. Minimum Benefit Formula | Single Life Annuity equal to Minimum Benefit Rate (Minimum Benefit Rate is equal to $282 if Final Average Annualized Compensation is less than $15,000; otherwise it is $288) multiplied by Years of Credited Service | |
For each formula listed in the chart above, compensation taken into account in calculating pension benefits includes base salary and commission,commissions, but excludes bonuses, overtime pay, premium pay, shift differentials, variable compensation, profit sharing awards, expense reimbursements, and expense allowances.
The benefit formulas set forth above describe the pension benefits in terms of a single life annuity. Participants are eligible to receive their benefits in other payment forms, however, including lump sums, joint and survivor annuities, period certain annuities, and level income payments. No matter which form of payment a participant may select, each has the same actuarially equivalent value.
In addition, the LPP provides an option for early retirement. At age 62 or greater with at least 10 years of service, a participant may commence an unreduced benefit. A participant who is between the ages of 55 and 62 with at least 15 years of service may begin a benefit reduced by 3% for each year the benefit commences prior to age 62. Finally, in the case of a participant less than age 62 with at least 10 years of service but not more than 15 years of service, he or she may begin a benefit reduced 3% for each year prior to age 65.
Nonqualified Deferred Compensation
We did not maintain any nonqualified defined contribution or other deferred compensation plans or arrangements for the Named Executive Officers during Fiscal 2013.2014.
Employment ArrangementsAgreements
We have entered into employment agreements with each of the Named Executive Officers as described below.
Typically, these agreements provide for employment for a specified period of time (typically, two or three years; five years in the case of Mr. Sparks)years), subject to automatic renewal for additionalone-year terms unless either party provided written notice ofnon-renewal in accordance with the terms and conditions of the agreement.
In addition, these agreements included the Named Executive Officer’s initial base salary or base salary at the time the agreement was executed, an annual bonus opportunity under our Executive Incentive Plan,EIP, and standard employee benefit plan and program participation. Occasionally, these agreements also provided for a recommended equity award grant to be submitted to our board of directors for approval, with an exercise price, in the case of an option to purchase shares of our common stock, equal to the fair market value of the shares of our common stock on the date of grant and subject to our specified vesting requirements. These offers of employment were each subject to covenants during the period of employment and for a specified period thereafter involvingnon-solicitation of customers, suppliers, and employees,non-competition, andnon-disclosure of confidential information and trade secrets.
233
Mr. Klein
On August 14, 2013, we entered into a new employment agreement with Mr. Klein in connection with his appointment as our CEO that provides for his general employment terms, including certain compensation arrangements. Mr. Klein’s employment agreement also provides for specified payments and benefits in the event of his termination of employment under certain specified circumstances, including in connection with a change in control of Sabre, which are described in greater detail under “Potential Payments upon Termination or Change in Control” below.
Under the terms of his employment agreement, Mr. Klein’s initial annual base salary in connection with his appointment as CEO was set at $900,000, less applicable withholding taxes, and is subject to annual review for a possible increase (but not decrease). See “2014 Summary Compensation Table” for information on Mr. Klein’s base salary paid in 2014. Mr. Klein is also eligible to receive an annual target bonus based on his attainment of one or morepre-established performance criteria established by our board of directors or a committee of our board of directors, with his initial target bonus opportunity equal to 125% of histhen-current annual base salary and a maximum bonus opportunity equal to 200% of histhen-current annual base salary.
Further, Mr. Klein was granted an option to purchase 198,563 shares of our common stock with an exercise price equal to the fair market value of such shares of common stock on the date of grant and a restricted stock unit award covering 66,188 shares of our common stock. The option was to vest as to 25% of the shares of our common stock subject to the option on the date of grant and thereafter as to 6.25% of such shares at the end of each successivethree-month period thereafter, subject to his continued employment through each vesting date. The restricted stock unit award was to vest as to 25% of the shares of our common stock subject to such award on March 15th in each of calendar years 2014, 2015, 2016, and 2017 if, as of the end of our most recent fiscal year ending prior to each such vesting date, we have achieved at least 95% of the EBITDA target level established for such fiscal year as determined by our board of directors, consistent with the annual business plan for such fiscal year. The vesting of the shares of common stock subject to these equity awards is also subject to acceleration as described in greater detail under “Potential Payments upon Termination or Change in Control” below.
Subsequently, on October 25, 2013, to give effect to its original objective of providing Mr. Klein with along-term incentive compensation opportunity with a grant date fair value of approximately $3,500,000 which was not accomplished with the awards described above, our board of directors granted Mr. Klein an additional option to purchase 200,221 shares of our common stock with an exercise price equal to the fair market value of such shares of common stock on the date of grant and a restricted stock unit award covering 78,030 shares of our common stock. These equity awards were subject to vesting requirements similar to the vesting requirements applicable to the equity awards granted to Mr. Klein at the time that we entered into the new employment agreement with him.
Mr. Simonson
Effective March 11, 2013, we entered into an employment agreement with Mr. Simonson in connection with his appointment as our Executive Vice President and Chief Financial Officer that provided for his general employment terms, including certain compensation arrangements. Mr. Simonson’s employment agreement also provides for specified payments and benefits in the event of his termination of employment under certain specified circumstances, including in connection with a change in control of us,Sabre, which are described in greater detail under “Potential Payments upon Termination or Change in Control” below.
Under the terms of his employment agreement, Mr. Simonson received an initial annual base salary of $600,000, less applicable withholding taxes, which is subject to annual review for a possible increase (but not decrease). See “2014 Summary Compensation Table” for information on Mr. Simonson’s base salary paid in 2014. Mr. Simonson also received aone-time “sign on” bonus in the amount of $120,000, subject to repayment under certain conditions.
234
Mr. Simonson is also eligible to receive an annual target bonus based on his attainment of one or morepre-established performance criteria established by our board of directors or a committee of our board of directors, with his initial target bonus opportunity equal to 80% of histhen-current annual base salary.
Further, Mr. Simonson was granted an option to purchase 600,000 shares of our common stock with an exercise price equal to the fair market value of such shares of common stock on the date of grant and a restricted stock unit award covering 300,000 shares of our common stock. The option to purchase shares of our common stock vests as to 25% of the shares of common stock subject to such option on the first anniversary of the date of grant and thereafter as to 6.25% of such shares at the end of each successivethree-month period thereafter, subject to his continued employment through each vesting date. The restricted stock unit award vests as to 25% of the shares of our common stock subject to such award on March 15th15 in each of calendar years 2014, 2015, 2016, and 2017 if, as of the end of our most recent fiscal year ending prior to each such vesting date, we have achieved at least 95% of the EBITDA target level established for such fiscal year as determined by our board of directors, consistent with the annual business plan for such fiscal year, subject to his continued employment through each vesting date. The vesting of the shares of common stock subject to such awards is also subject to acceleration as described in greater detail under “Potential Payments upon Termination or Change in Control” below.
Ms. Gonzalez
Effective September 22, 2014, we entered into an employment agreement with Ms. Gonzalez in connection with her appointment as our Executive Vice President and General Counsel that provides for her general employment terms, including certain compensation arrangements. Ms. Gonzalez’s employment agreement also provides for specified payments and benefits in the event of her termination of employment under certain specified circumstances, including in connection with a change in control of Sabre, which are described in greater detail under “Potential Payments upon Termination or Change in Control” below.
Under the terms of her employment agreement, Ms. Gonzalez received an initial annual base salary of $465,000, less applicable withholding taxes, which is subject to annual review for a possible increase (but not decrease). See “2014 Summary Compensation Table” for information on Ms. Gonzalez’s base salary paid in 2014. Ms. Gonzalez also received a one-time “sign-on” bonus in the amount of $75,000, subject to repayment under certain conditions, of which $50,000 was paid in 2014.
Ms. Gonzalez is also eligible to receive an annual bonus based on her attainment of one or morepre-established performance criteria established by our board of directors or a committee of our board of directors, with her initial target bonus opportunity equal to 80% of her then-current annual base salary.
Further, Ms. Gonzalez was granted an option to purchase 230,978 shares of our common stock with an exercise price equal to the fair market value of such shares of common stock on the date of grant and a restricted stock unit award covering 55,339 shares of our common stock. The option to purchase shares of our common stock vests as to 25% of the shares of common stock subject to such option on the first anniversary of the date of grant and thereafter as to 6.25% of such shares at the end of each successive three-month period thereafter, subject to her continued employment through each vesting date. The restricted stock unit award vests as to 25% of the shares of our common stock subject to such award on October 15 in each of calendar years 2015, 2016, 2017, and 2018, subject to her continued employment through each vesting date. The vesting of the shares of common stock subject to such awards is also subject to acceleration as described in greater detail under “Potential Payments upon Termination or Change in Control” below.
Ms. Kerr
Effective March 11, 2013, we entered into an employment agreement with Ms. Kerr in connection with her appointment as our Executive Vice President and Chief Product and Technology Officer that provides for her general employment terms, including certain compensation arrangements. Ms. Kerr’s employment agreement
235
also provides for specified payments and benefits in the event of her termination of employment under certain specified circumstances, including in connection with a change in control of Sabre, which are described in greater detail under “Potential Payments upon Termination or Change in Control” below.
Under the terms of her employment agreement, Ms. Kerr received an initial annual base salary of $500,000, less applicable withholding taxes, which is subject to annual review for a possible increase (but not decrease). See “2014 Summary Compensation Table” for information on Ms. Kerr’s base salary paid in 2014. Ms. Kerr also received aone-time “sign on” bonus in the amount of $225,000, subject to repayment under certain conditions.
Ms. Kerr is also eligible to receive an annual target bonus based on her attainment of one or morepre-established performance criteria established by our board of directors or a committee of our board of directors, with her initial target bonus opportunity equal to 80% of herthen-current annual base salary.
Under the terms of her employment agreement, Ms. Kerr was eligible to receive alump-sum payment in the amount of $250,000 to assist her in defraying the costs of relocating her residence to Dallas, Texas, subject to her execution of an appropriate repayment agreement with us.
Further, Ms. Kerr was granted an option to purchase 600,000 shares of our common stock with an exercise price equal to the fair market value of such shares of common stock on the date of grant and a restricted stock unit award covering 200,000 shares of our common stock. The option to purchase shares of our common stock vests as to 25% of the shares of common stock subject to such option on the first anniversary of the date of grant and thereafter as to 6.25% of such shares at the end of each successivethree-month period thereafter, subject to her continued employment through each vesting date. The restricted stock unit award vests as to 25% of the shares of our common stock subject to such award on March 15 in each of calendar years 2014, 2015, 2016, and 2017 if, as of the end of our most recent fiscal year ending prior to each such vesting date, we have achieved at least 95% of the EBITDA target level established for such fiscal year as determined by our board of directors, consistent with the annual business plan for such fiscal year, subject to her continued employment through each vesting date. The vesting of the shares of common stock subject to such awards is also subject to acceleration as described in greater detail under “Potential Payments upon Termination or Change in Control” below.
Mr. Webb
Effective January 31, 2011, we entered into an employment agreement with Mr. Webb in connection with his appointment as our Executive Vice President and President, Sabre Travel Network that provided for his general employment terms, including certain compensation arrangements. Mr. Webb’s employment agreement also provides for specified payments and benefits in the event of his termination of employment under certain specified circumstances, including in connection with a change in control of Sabre, which are described in greater detail under “Potential Payments upon Termination or Change in Control” below.
Under the terms of his employment agreement, Mr. Webb received an initial annual base salary of $350,000, less applicable withholding taxes, which is subject to annual review for a possible increase (but not decrease). See “2014 Summary Compensation Table” for information on Mr. Webb’s base salary paid in 2014.
Mr. Webb is also eligible to receive an annual target bonus based on his attainment of one or morepre-established performance criteria established by our board of directors or a committee of our board of directors, with his initial target bonus opportunity equal to 60% of histhen-current annual base salary.
Mr. Sparks
Effective March 22, 2011, Mr. Sparks entered into an employment agreement with our wholly-owned subsidiary, Travelocity.com LP, in connection with his appointment as Executive Vice President and President and CEO of Travelocity that providesprovided for his general employment terms, including certain compensation
236
arrangements. Mr. Sparks’ employment agreement also providesprovided for specified payments and benefits in the event of his termination of employment under certain specified circumstances, including in connection with a change in control of us,Sabre, which are described in greater detail under “Potential Payments upon Termination or Change in Control” below.
Mr. Sparks’ employment agreement providesprovided for an initial annual base salary of $600,000, less applicable withholding taxes, which is subject to annual review for a possible increase (but not decrease). Mr. Sparks iswas also eligible to receive an annual target bonus based on his attainment of one or more pre-established performance criteria established by our board of directors or a committee of our board of directors, with his initial target bonus opportunity equal to 80% of his then-current annual base salary.
Further, Mr. Sparks was granted equity awards in the form of a restricted stock award covering 354,191 shares of our common stock and a tandem stock appreciation right covering 2,931,035 shares of the stock or units of each of Travelocity Holdings, Inc. and Travelocity.com LLC, respectively, with a strike price equal to the fair market value of such shares and common units on the date of grant. The restricted stock award was to vest as to one-third of the total number of shares of our common stock subject to such award on each of the first, second, and third anniversaries of the date of grant, subject to his continued employment through each vesting date. The tandem stock appreciation right was to vest as to 25% of the shares of the common stock of Travelocity Holdings, Inc. and common units of Travelocity.com LLC subject to such awards on the first anniversary of the date of grant and as to 4.6875% of such shares and common units at the end of each successive three-month period thereafter, subject to his continued employment through each vesting date. The stock appreciation right could also be exercised for cash or shares of our common stock, in the good faith discretion of our board of directors.
In May 2012, we cancelled the tandem stock appreciation right and granted Mr. Sparks a new stock appreciation right covering 2,931,035 shares of the stock or common units of each of Travelocity Holdings, Inc. and Travelocity.com LLC with a strike price equal to the fair market value of such shares and common units on the date of grant. Generally, this award was subject to the terms and conditions of the prior stock appreciation right award agreement. The vesting of the shares of common stock or common units subject to such awards is also subject to acceleration as described in greater detail under “Potential Payments upon Termination or Change in Control” below.
In connection with the grant ofNovember 2012, we granted Mr. Sparks a restricted stock unit award with an aggregate value of $3,000,000 which was to vest as to certain prescribed values in six installments on December 15, 2012, June 15 and December 15 of 2013 and 2014, and on June 15, 2015, in each case, subject to his continued employment through each such vesting date. In connection with this restricted stock unit award, Mr. Sparks in November 2012, he agreed that, as a condition of his right to settlement of the award, he would forfeit up to 30% of the number of unvested shares and common units subject to his stock appreciation right, with the forfeiture of such shares and common units occurring in three equal installments on December 15, 2012, June 15, 2013, and December 15, 2013, respectively.
Ms. Kerr
Effective March 11, 2013, we entered into anMr. Sparks’ employment and employment agreement with Ms. Kerr in connection with her appointment as our Executive Vice President and Chief Product and Technology Officer that provides for her general employment terms, including certain compensation arrangements. Ms. Kerr’s employment agreement also provides for specified payments and benefits in the event of her termination of employment under certain specified circumstances, including in connection with a change in control of us, which are described in greater detail underwere each terminated on April 28, 2014.
See “Potential Payments upon Termination or Change in Control” below.
Under the terms of her employment agreement, Ms. Kerr received an initial annual base salary of $500,000, less applicable withholding taxes, which is subject to annual review for a possible increase (but not decrease). Ms. Kerr also received a one-time “sign on” bonus in the amount of $225,000, subject to repayment under certain conditions.
Ms. Kerr is also eligible to receive an annual target bonus based on her attainment of one or more pre-established performance criteria established by our board of directors or a committee of our board of directors, with her initial target bonus opportunity equal to 80% of her then-current annual base salary.
Under the terms of her employment agreement, Ms. Kerr was eligible to receive a lump-sum payment in the amount of $250,000 to assist her in defraying the costs of relocating her residence to Dallas, Texas, subject to her execution of an appropriate repayment agreement with us.
Further, Ms. Kerr was granted an option to purchase 600,000 shares of our common stock with an exercise price equal to the fair market value of such shares of common stock on the date of grant and a restricted stock unit award covering 200,000 shares of our common stock. The option to purchase shares of our common stock vests as to 25% of the shares of common stock subject to such option on the first anniversary of the date of grant and thereafter as to 6.25% of such shares at the end of each successive three-month period thereafter, subject to her continued employment through each vesting date. The restricted stock unit award vests as to 25% of the shares of our common stock subject to such award on March 15th in each of calendar years 2014, 2015, 2016, and 2017 if, as of the end of our most recent fiscal year ending prior to each such vesting date, we have achieved at least 95% of the EBITDA target level established for such fiscal year as determined by our board of directors, consistent with the annual business plan for such fiscal year, subject to her continued employment through each vesting date. The vesting of the shares of common stock subject to such awards is also subject to acceleration as described in greater detail under “Potential Payments upon Termination or Change in Control” below.
Control—Mr. RobinsonSparks’ Post-Employment Compensation.”
Effective December 16, 2013, we entered into an employment agreement with Mr. Robinson in connection with his appointment as our Executive Vice President and Chief Human Resources Officer that provides for his general employment terms, including certain compensation arrangements.
Under the terms of his employment agreement, Mr. Robinson received an initial annual base salary of $420,000, less applicable withholding taxes. Mr. Robinson also received a one-time “sign-on” bonus in the amount of $50,000, subject to repayment under certain conditions.
Mr. Robinson is also eligible to receive an annual bonus based on his attainment of one or morepre-established performance criteria established by our board of directors or a committee of our board of directors, with his initial target bonus opportunity equal to 70% of his then-current annual base salary.
Further, Mr. Robinson was granted an option to purchase 296,337 shares of our common stock with an exercise price equal to the fair market value of such shares of common stock on the date of grant and a restricted stock unit award covering 98,779 shares of our common stock. The option to purchase shares of our common stock vests as to 25% of the shares of common stock subject to such option on the first anniversary of the date of grant and thereafter as to 6.25% of such shares at the end of each successive three-month period thereafter, subject to his continued employment through each vesting date. The restricted stock unit award vests as to 25% of the shares of our common stock subject to such award on March 15th in each of calendar years 2014, 2015, 2016, and 2017 if, as of the end of our most recent fiscal year ending prior to each such vesting date, we have achieved at least 95% of the EBITDA target level established for such fiscal year as determined by our board of directors, consistent with the annual business plan for such fiscal year, subject to his continued employment through each vesting date. The vesting of the shares of common stock subject to such awards is also subject to acceleration as described in greater detail under “Potential Payments upon Termination or Change in Control” below.
Mr. Gilliland
On June 11, 2007, we entered into an employment agreement with Mr. Gilliland that provided for his general employment terms, including certain compensation arrangements, and specified payments and benefits in the event of his termination of employment under certain specified circumstances, including in connection with a change in control of us.
Under the terms of his employment agreement, Mr. Gilliland received an initial annual base salary of $800,000, less applicable withholding taxes, which was subject to annual review for a possible increase (but not decrease). Mr. Gilliland was also eligible to receive an annual target bonus based on his attainment of one or more pre-established performance criteria established by our board of directors or a committee of our board of directors, with his initial target bonus opportunity equal to 150% of his then-current annual base salary.
Further, Mr. Gilliland was granted an option to purchase 3,175,000 shares of our common stock with an exercise price equal to the fair market value of such shares of common stock on the date of grant. Half of the shares of our common stock subject to the option were subject to a time-based vesting schedule, with 25% of such shares to vest on the first anniversary of the effective date of the merger transaction and as to 4.6875% of such shares at the end of each complete fiscal quarter thereafter, subject to his continued employment through each vesting date. The remaining shares of our common stock subject to the option were subject to a performance-based vesting requirement with respect to a liquidity event involving us. The vesting of the shares of the common stock subject to such option was also subject to acceleration as described in greater detail under “Potential Payments upon Termination or Change in Control” below.
The employment agreement with Mr. Gilliland was subsequently amended on December 31, 2008 to comply with the requirements of Section 409A of the Code, again on June 26, 2009 to extend its term until April 1, 2012 and make certain conforming changes, again on June 30, 2012 to further extend its term for successive one-year terms and make certain conforming changes, and on January 9, 2013 to adjust the number of shares of our common stock subject to the stock option granted to him in December 2012.
Mr. Miller
On July 31, 2009, we entered into an employment agreement with Mr. Miller that provided for his general employment terms, including certain compensation arrangements, and specified payments and benefits in the event of his termination of employment under certain specified circumstances, including in connection with a change in control of us.
Under the terms of his employment agreement, Mr. Miller received an initial annual base salary of $325,000, less applicable withholding taxes, which was subject to annual review for a possible increase (but not decrease). Mr. Miller was also eligible to receive an annual target bonus based on his attainment of one or more pre-established performance criteria established by our board of directors or a committee of our board of directors, with his initial target bonus opportunity equal to 60% of his then-current annual base salary.
Potential Payments upon Termination or Change in Control
Each of the current Named Executive Officers is eligible to receive certain severance payments and benefits under his or her employment agreement in connection with his or her termination of employment under various circumstances, including following a change in control of us.Sabre.
The estimated potential severance payments and benefits payable to each Named Executive Officer in the event of a termination of employment as of December 31, 20132014 are described below.
237
The actual amounts that would be paid or distributed to the Named Executive Officers as a result of one of the termination events occurring in the future may be different than those presented below as many factors will affect the amount of any payments and benefits upon a termination of employment. For example, some of the factors that could affect the amounts payable include the Named Executive Officer’s base salary and the market price of the shares of our common stock. Although we have entered into written arrangements to provide these payments and benefits to the Named Executive Officers in connection with a termination of employment under particular circumstances, we, or an acquirer, may mutually agree with the Named Executive Officers onpost-employment compensation terms that vary from those provided in thesepre-existing arrangements. Finally, in addition to the amounts presented below, each Named Executive Officer would also be able to exercise anypreviously-vested options to purchase shares of our common stock that he or she held. For more information about the Named Executive Officers outstanding equity awards as of December 31, 2013,2014, see “Fiscal 2013“2014 Outstanding Equity Awards at FiscalYear-End Table.”
Along with the payments and benefits described in a Named Executive Officer’s individualpost-employment compensation arrangement, these executive officers are eligible to receive any benefits accrued under ourbroad-based benefit plans, such as accrued vacation pay, in accordance with the terms of those plans and policies.
Mr. Klein
Under his employment agreement with us, Mr. Klein is eligible to receive certain payments and benefits in the event of a termination of his employment by us without cause“cause” or a termination of employment by him for good reason“good reason” (as each of these terms is defined in his employment agreement). For these purposes, a termination of employment by us as a result of notice ofnon-renewal at the end of anythen-current term will be deemed for all purposes as a termination of employment without cause.“cause.”
In the event of a termination of employment by us without cause“cause” or by him for “good reason”, Mr. Klein, upon execution of a binding agreement and general release of claims in our favor, will be eligible to receive:
In the case of Mr. Klein’s death or if his employment is terminated as a result of his disability (as well as in the event of a termination of employment by us without cause“cause” or by him for good reason)“good reason”), he will be eligible to receive (i) his base salary through the date of termination, (ii) reimbursement of any unreimbursed business expenses properly incurred prior to the date of termination that are subject to reimbursement, and (iii) payment for any accrued but unused vacation time (the “Accrued Obligations”). In addition to the foregoing amounts, if his employment is terminated in the case of his death, Mr. Klein’s estate or beneficiaries are eligible to receive an amount equal to apro rata portion of his annual bonus for the year of termination of employment, based on actual performance for the relevant fiscal year. The Accrued Obligations also are payable to him in the event of (A) a termination of employment by us for cause or (B) a voluntary termination of employment by him.
238
In addition, in the event that Mr. Klein terminates his employment with us, he agrees to resign his position as a member of our board of directors (and any other positions he holds by virtue of his employment with us), at our request.
Definitions for Mr. Klein’sPost-Employment Compensation Arrangements
Under Mr. Klein’s employment agreement, “Cause”“cause” means (i) willful misconduct or gross negligence that is materially injurious to us, any affiliated entity, or the Principal Stockholders at the time of execution of the employment agreement;agreement, (ii) any knowing or deliberate violation of any of the covenants set forth in the employment agreement;agreement, (iii) any material breach or violation of any material policy of our board of directors which is not promptly remedied following notification of such breach or violation;violation, (iv) any deliberate and persistent failure to perform or honor an express written directive of our board of directors;directors, or (v) the indictment for, or a plea ofnolo contendereto, a felony or other serious crime that could reasonably be expected to result in material harm to us.
Under Mr. Klein’s employment agreement, “Good Reason”“good reason” means any of the following events which occur without his written consent: (i) any materially adverse change to his responsibilities, duties, authority, or status from those set forth in the employment agreement or any materially adverse change in his positions, titles, or reporting responsibility (provided, however, that becomingpublicly-traded is expressly deemed not a material adverse change);, (ii) a relocation of his principal business location to an area outside a 50 mile radius of its current location or a moving of him from our headquarters;headquarters, (iii) a failure of any of our successors to assume in writing any obligations arising out of his employment agreement;agreement, (iv) a reduction of his annual base salary or target bonus or payments due under his employment agreement in connection with his employment (provided, however, that a reduction in base salary or target bonus of less than 5% that is proportionately applied to our employees generally will not constitute Good Reason);, or (v) a material breach by us of his employment agreement or any other material agreement with him relating to his compensation.
Other Named Executive Officers
Under their employment agreements with us, Messrs. Simonson Sparks, and RobinsonWebb and Ms. Gonzalez and Ms. Kerr are eligible to receive certain payments and benefits in the event of a termination of their employment by us without cause“cause” or a termination of employment by the Named Executive Officer for good reason“good reason” (as each of these terms is defined in thehis or her employment agreements). For these purposes, a termination of employment by us as a result of notice ofnon-renewal at the end of anythen-current term will be deemed for all purposes as a termination of employment without cause.“cause.”
In the event of a termination of employment by us without cause“cause” or by a Named Executive Officer for good“good reason,” the Named Executive Officer, upon execution of a binding agreement and general release of claims in our favor, will be eligible to receive:
In the case of a Named Executive Officer’s death or disability (as well as in the event of a termination of employment by us without cause“cause” or by a Named Executive Officer for good reason)“good reason”), he or she will be eligible to receive (i) his or her base salary through the date of termination, (ii) reimbursement of any unreimbursed business expenses properly incurred prior to the date of termination that are subject to
239
reimbursement, (iii) payment for any accrued but unused vacation time, and (iv) an amount equal to any accrued but unpaid annual bonus for the immediately preceding year. The same amounts, except for the amount of any accrued but unpaid annual bonus for the immediately preceding year, are payable to a Named Executive Officer in the event of (A) a termination of employment by us for cause or (B) a voluntary termination of employment by a Named Executive Officer.
Definitions for Other Named Executive OfficerPost-Employment Compensation Arrangements
Under the employment agreements of Messrs. Simonson Sparks, and RobinsonWebb and Ms. Gonzalez and Ms. Kerr, “Cause”“cause” means any of the following events: (i) a majority of our board of directors determines that the Named Executive Officer (A) was guilty of gross negligence or willful misconduct in the performance of his or her duties for us;us, (B) materially breached or violated any agreement between him or her and us or any material policy in our code of conduct or similar employee conduct policy;policy, or (C) committed an act of dishonesty or breach of trust with regard to us, any of itsour subsidiaries or affiliates, or (ii) the Named Executive Officer is indicted for, or pleads guilty ornolo contendereto, a felony or other crime of moral turpitude.
Under the employment agreements of Messrs. Simonson Sparks, and RobinsonWebb and Ms. Gonzalez and Ms. Kerr, “Good Reason”“good reason” means any of the following events which occur without the Named Executive Officer’s consent: (i) any materially adverse change to his or her responsibilities, duties, authority, or status or materially adverse change in his or her positions, titles, or reporting responsibility (provided, however, that usour becoming or ceasing to bepublicly-traded is expressly deemed not to be a material adverse change);, (ii) a relocation of his or her principal business location to an area outside a 50 mile radius of its current location or a moving of him or her from our headquarters;headquarters, (iii) a failure of any of our successors to assume in writing any obligations arising out of his or her employment agreement;agreement, (iv) a reduction of his or her annual base salary or target bonus or payments due under his or her employment agreement in connection with his or her employment (provided, however, that a reduction in base salary or target bonus of less than 5% that is proportionately applied to our employees generally will not constitute Good Reason);, or (v) a material breach by us of his or her employment agreement or any other material agreement with him or her relating to his or her compensation.
Equity Awards
Generally, under our 2007 Management Equity Incentive Plan (as amended in 2010) and, our 2012 Management Equity Incentive Plan and our 2014 Omnibus plan, in the event of a termination of employment:
Further, under our 2007 Management Equity Incentive Plan (as amended in 2010) and our 2012 Management Equity Incentive Plan, if following a change in control of us,Sabre, an executive officer’s employment is terminated by us for any reason other than “cause” or he or she terminates his or her employment for “good reason”:
240
In addition,performance-based options to purchase shares of our common stock may vest and become exercisable upon a change in control of us,Sabre, to the extent the transaction results in the achievement by our Principal StockholderStockholders of certain specified MoM milestones on their initial investment in us.us and the Principal Stockholders have achieved liquidity as defined in the 2007 Management Equity Incentive Plan.
Further, under our 2014 Omnibus Plan, except as otherwise provided in the award agreement, if following a change in control of Sabre, an executive officer’s employment is terminated by us for any reason other than “cause” or he or she terminates his or her employment for “good reason, or if following a change in control of Sabre, the outstanding awards are not assumed, continued or substituted by the surviving corporation, then all restrictions applicable to awards granted under the 2014 Omnibus Plan will lapse as of the time of the change in control, and any unvested award will become fully exercisable and vested as of the time of the change in control.
The terms of the 2014 grant agreements under the 2014 Omnibus Plan provide that, if awards and grants are not assumed and if following a change in control of Sabre, an executive officer’s employment is terminated by us for any reason other than “cause” or he or she terminates his or her employment for “good reason”:
The table below provides an estimate of the value of such accelerated vesting of outstanding and unvested equity awards assuming that a change in control of usSabre and a qualifying termination of employment occurred on December 31, 20132014 and assuming a stock price of $14.01$20.27 per share, the fair market valueclosing price of a share of our common stock on NASDAQ as of such date, as determined by an independent third-party valuation.date. The table below also reflects the assumption that, as of December 31, 2013,2014, based on this valuation, the firstall three requisite MoM milestone wouldand liquidity milestones have been met and, consequently, one-thirdall of the shares of our common stock subject to theperformance-based options would have vested, while the remaining two-thirds of such shares would have been forfeited.vested. The table further reflects the assumption that, as of December 31, 2013,2014, the EBITDA target level for Fiscal 20132014 in respect of the restricted stock unit awards granted under our 2012 Management Equity Incentive Plan and the revenue target level for 2014 under our 2014 Omnibus Plan would have been met, and therefore, one-fourththe next tranche of the shares of our common stock subject to such restricted stock unit awards would have vested, while the remaining three-fourthsunvested tranches of such shares would have been forfeited.
We have entered into certainnon-competition agreements with the Named Executive Officers that restrict their ability to compete with us during a specifiedpost-employment period.
Summary of Estimated Payments and Benefits
The following table summarizes the estimatedpost-employment payments and benefits that would have been payable to the current Named Executive Officers in the event that their employment had been terminated or a change in control of usSabre had occurred as of December 31, 2013.2014. Nopost-employment compensation is payable to any Named Executive Officer who voluntarily terminates his or her employment with us (other than a voluntary resignation for good reason). The information set forth in the table is based on the assumption, in each
241
case, that termination of employment or the change in control of usSabre occurred on December 31, 2013.2014. Pension benefits, which are described elsewhere in this registration statement of which this prospectus forms a part, are not included in the table, even though they may become payable at the times specified in the table.
Potential Payments and Benefits
upon Termination of Employment
or Change in Control Table
Triggering Event(1) | Mr. Klein(2) | Mr. Simonson(3) | Mr. Sparks(4) | Ms. Kerr(5) | Mr. Robinson(6) | Mr. Klein(2) | Mr. Simonson(3) | Ms. Gonzalez(4) | Ms. Kerr(5) | Mr. Webb(6) | ||||||||||||||||||||||||||||||
Involuntary Termination of Employment Not in Connection With Change in Control | ||||||||||||||||||||||||||||||||||||||||
Base Salary | $ | 1,800,000 | $ | 900,000 | $ | 900,000 | $ | 750,000 | $ | 630,000 | $ | 1,840,000 | $ | 945,000 | $ | 697,500 | $ | 855,000 | $ | 750,000 | ||||||||||||||||||||
Annual Bonus | $ | 784,778 | $ | 720,000 | $ | 720,000 | $ | 600,000 | $ | 441,000 | $ | 1,223,115 | $ | 756,000 | $ | 558,000 | $ | 684,000 | $ | 600,000 | ||||||||||||||||||||
Accelerated Vesting of Stock Options | — | — | — | — | — | — | — | — | — | — | ||||||||||||||||||||||||||||||
Accelerated Vesting of Restricted Stock Unit Awards | — | — | — | — | — | — | — | — | — | — | ||||||||||||||||||||||||||||||
Health and Welfare Benefits | $ | 14,767 | $ | 23,267 | $ | 23,267 | $ | 16,428 | $ | 23,267 | $ | 29,029 | $ | 24,619 | $ | 15,089 | $ | 7,942 | $ | 29,029 | ||||||||||||||||||||
Outplacement Services(10) | $ | 25,000 | $ | 25,000 | $ | 25,000 | $ | 25,000 | $ | 25,000 | $ | 25,000 | $ | 25,000 | $ | 25,000 | $ | 25,000 | $ | 25,000 | ||||||||||||||||||||
TOTAL | $ | 2,624,545 | $ | 1,668,267 | $ | 1,668,267 | $ | 1,391,428 | $ | 1,119,267 | ||||||||||||||||||||||||||||||
Total | $ | 3,117,144 | $ | 1,750,619 | $ | 1,295,589 | $ | 1,571,942 | $ | 1,404,029 | ||||||||||||||||||||||||||||||
Involuntary Termination of Employment in Connection With Change in Control(7)(11) | ||||||||||||||||||||||||||||||||||||||||
Base Salary | $ | 1,800,000 | $ | 900,000 | $ | 900,000 | $ | 750,000 | $ | 630,000 | $ | 1,840,000 | $ | 945,000 | $ | 697,500 | $ | 855,000 | $ | 750,000 | ||||||||||||||||||||
Annual Bonus | $ | 784,778 | $ | 720,000 | $ | 720,000 | $ | 600,000 | $ | 441,000 | $ | 1,223,115 | $ | 756,000 | $ | 558,000 | $ | 684,000 | $ | 600,000 | ||||||||||||||||||||
Accelerated Vesting of Stock Option(8) | $ | 2,227,096 | $ | 2,424,000 | — | $ | 2,424,000 | — | $ | 7,577,431 | $ | 3,717,814 | $ | 1,134,102 | $ | 3,689,941 | $ | 2,111,506 | ||||||||||||||||||||||
Accelerated Vesting of Restricted Stock Unit Awards(9) | $ | 575,174 | $ | 1,050,750 | $ | 1,654,077 | $ | 700,500 | $ | 345,973 | ||||||||||||||||||||||||||||||
Accelerated Vesting of Restricted Stock/Restricted Stock Unit Awards(9) | $ | 1,994,242 | $ | 1,816,461 | $ | 280,431 | $ | 1,275,535 | $ | 429,278 | ||||||||||||||||||||||||||||||
Health and Welfare Benefits | $ | 14,767 | $ | 23,267 | $ | 23,267 | $ | 16,428 | $ | 23,267 | $ | 29,029 | $ | 24,619 | $ | 15,089 | $ | 7,942 | $ | 29,029 | ||||||||||||||||||||
Outplacement Services(10) | $ | 25,000 | $ | 25,000 | $ | 25,000 | $ | 25,000 | $ | 25,000 | $ | 25,000 | $ | 25,000 | $ | 25,000 | $ | 25,000 | $ | 25,000 | ||||||||||||||||||||
TOTAL | $ | 5,426,815 | $ | 5,143,017 | $ | 3,322,344 | $ | 4,515,928 | $ | 1,465,240 | ||||||||||||||||||||||||||||||
Total | $ | 12,688,817 | $ | 7,284,894 | $ | 2,710,122 | $ | 6,537,418 | $ | 3,944,813 | ||||||||||||||||||||||||||||||
| (1) | The calculations presented in this table illustrate the estimated payments and benefits that would have been paid to each of the Named Executive Officers had their employment been terminated on December 31, |
| (2) | For purposes of this analysis, Mr. Klein’s compensation is assumed to be as follows: base salary equal to |
| (3) | For purposes of this analysis, Mr. Simonson’s compensation is assumed to be as follows: base salary equal to |
242
| 404,788 shares of our common stock, the vesting of which all such shares would accelerate, and outstanding unvested restricted stock unit awards covering |
| (4) | For purposes of this analysis, |
| (5) | For purposes of this analysis, Ms. Kerr’s compensation is assumed to be as follows: base salary equal to $570,000, a target annual bonus opportunity of $456,000, outstanding unvested options to purchase 397,024 shares of our common stock, the vesting of which all of such shares would accelerate, and outstanding unvested restricted stock unit awards covering 201,709 shares of our common stock, the vesting of which the next tranche of each such shares would accelerate. |
| (6) | For purposes of this analysis, Mr. Webb’s compensation is assumed to be as follows: base salary equal to $500,000, a target annual bonus opportunity of $400,000, outstanding unvested options to purchase |
| (7) | The change in control calculations assume that on December 31, |
| (8) | This amount represents the “intrinsic” value of outstanding and unvested options subject totime-based andperformance-based vesting requirements to purchase shares of our common stock based on a stock price of |
| (9) | This amount represents the fair market value of |
| (10) | Pursuant to our policy, we also provide the Named Executive Officers with aone-time payment for outplacement services. |
| (11) | The potential payments and benefits reflect the maximum amounts that may be paid. Should the actual payments and benefits trigger an excise tax under Section 4999 of the |
Post-Employment Compensation
Mr. Gilliland’s Sparks’Post-Employment Compensation
In connection with his retirement in September 2013 and pursuantthe restructuring of Travelocity, Mr. Sparks departed Sabre on April 28, 2014. Pursuant to the terms and conditions of his employment agreement, upon his termination of employment Mr. GillilandSparks received the following payments and benefits:
In addition, pursuant to the third amendment to Mr. Gilliland’s employment agreement and the terms of a letter agreement dated September 18, 2013, we agreed to extend the period for the vesting and exercise of his outstanding options to purchase shares of our common stock until September 21, 2015.
Mr. Miller’s Post-Employment Compensation
In connection with his resignation of his position as our Executive Vice President and Chief Financial Officer in March 2013 and pursuant to the terms and conditions of his employment agreement, upon his termination of employment Mr. Miller became entitled to receive the following payments and benefits:
243
In addition, pursuant to a letter agreement dated April 12, 2013, we agreed to extend the period for the exercise of his outstanding and vested options for the purchase of shares of our common stock that were subject to time-based vesting requirements until June 30, 2015 and foraccelerate the vesting and exercise of his outstanding and unvested performance-based options for the purchase of shares of our common stock until June 30, 2015 as well.
Employee Stock Plans
Sovereign Holdings, Inc. 2007 Management Incentive Plan (as amended April 22, 2010)
On June 11, 2007, our board of directors adopted our 2007 Management Equity Incentive Plan (the “2007 Management Equity Incentive Plan”), which permitted the grant of options to purchase shares of our common stock. Our employees, directors, and, in certain instances, other service providers and consultants to us and our affiliates were eligible to receive awards under the 2007 Management Equity Incentive Plan. The exercise price of such stock options must be at least equal to the fair market value of our common stock on the date of grant. Stock options could be granted subject to either time-based or performance-based vesting requirements and were subject to a maximum term of 10 years. Subsequently, our board of directors amended the 2007 Management Equity Incentive Plan on April 22, 2010.
The purpose of the 2007 Management Equity Incentive Plan was to promote our interests and those of our stockholders by providing our key employees and, in certain circumstances, directors, service providers, and consultants, and those of our affiliates with an appropriate incentive to encourage them to continue in our employ or the employ of our affiliates and to improve our growth and profitability. We discontinued use of the 2007 Management Equity Incentive Plan upon the adoption of a new management equity incentive plan in September 2012. All of the shares of our common stock subject to issuance under the 2007 Management Equity Incentive Plan that had not been granted subject to an outstanding equity award were transferred to the new management equity incentive plan.
Sovereign Holdings, Inc. 2012 Management Equity Incentive Plan
On September 14, 2012, our board of directors adopted our 2012 Management Equity Incentive Plan (the “2012 Management Equity Incentive Plan”), which permits the grant of equity and equity-based incentive awards, including stock options, restricted stock, restricted stock units and other stock-based awards. Our employees, directors, and independent contractors and those of our subsidiaries and affiliates are eligible to receive awards under the 2012 Management Equity Incentive Plan.
The purpose of the 2012 Management Equity Incentive Plan is to promote our interests and those of our stockholders by providing key employees, directors, and independent contractors with an appropriate incentive to continue in our service and that of our subsidiaries and affiliates and to improve our growth and profitability. The following is a summary of the material terms of the 2012 Management Equity Incentive Plan, but does not include all of the provisions of such plan. For further information about the 2012 Management Equity Incentive
Plan, we refer you to the complete text of the 2012 Management Equity Incentive Plan, which is filed as an exhibit to the registration statement of which this prospectus is a part.
Administration
The 2012 Management Equity Incentive Plan is administered by our board of directors or such committee as designated by our board of directors (the “Committee”). Among the Committee’s powers under the 2012 Management Equity Incentive Plan are the power to determine those of our employees and independent contractors who will be granted awards and the amount, type and other terms and conditions of awards. The Committee may grant awards to the members of our board of directors. The Committee may also prescribe the form of and terms and conditions of any grant agreement evidencing any award; adopt, amend and rescind such rules and regulations as, in its opinion, may be advisable for the administration of the plan; construe and interpret the plan, such rules and regulations and the grant agreements; and make all other determinations necessary or advisable for the administration of the 2012 Management Equity Incentive Plan. Any award, determination, prescription or other act of the Committee is final and conclusively binding upon all persons.
Available Shares
The aggregate number of shares of our common stock which may be issued or transferred pursuant to awards granted under the 2012 Management Equity Incentive Plan may not exceed 1,800,000 shares and any additional shares of our common stock authorized for issuance by our board of directors, which may be either authorized and unissued shares of our common stock or previously-issued shares of our common stock acquired by us, or both. In addition, shares of our common stock that remained available for issuance under the 2007 Management Equity Incentive Plan were also available for issuance under the 2012 Management Equity Incentive Plan.
In general, if awards granted under the 2012 Management Equity Incentive Plan or the 2007 Management Equity Incentive Plan expire or are forfeited, cancelled or terminated without the issuance of shares of our common stock, or are settled for cash in lieu of shares of common stock, or are exchanged for an award not involving shares of common stock, the shares covered by such awards will remain or become available for issuance under the 2012 Management Equity Incentive Plan.
Eligibility for Participation
The persons eligible to receive awards under the 2012 Management Equity Incentive Plan are our employees, directors, and independent contractors of those of our subsidiaries and affiliates as selected by the Committee and our board of directors.
Stock Options
The Committee may grant nonqualified stock options, that is, options that are not intended to qualify as “incentive stock options” within the meaning of Section 422 of the Code, to purchase shares of our common stock. The Committee determines the number of shares of common stock subject to each option, the vesting schedule (provided that no option may be exercisable after the expiration of ten years after the date of grant), the method and procedure to exercise vested options, restrictions on transfer of options and any shares acquired pursuant to the exercise of an option, and the other terms of each option. The exercise price per share of common stock covered by any option must be at least equal to the fair market value of a share of our common stock on the date of grant.
The Committee will specify in the grant agreement for an option the time or times at which, or the conditions upon which, the option or any portion thereof will become vested and exercisable, provided, however, that no option may be exercisable after the expiration of ten years from the date of grant. Such vesting conditions
may relate to service through a specified date, or may be based on the achievement of one or more performance measures, a combination of the foregoing, or such other criteria as the Committee may establish from time to time. Each option will be subject to earlier vesting, expiration, cancellation or termination as provided in the 2012 Management Equity Incentive Plan or in the relevant grant agreement.
In addition, in the event of a qualifying termination of employment following a change in control (as defined in the 2012 Management Equity Incentive Plan) of us, all outstanding options that vest solely based on continued service through a specified date or dates held by a participant will immediately vest and become exercisable as of such qualifying termination of employment following a change in control.
Restricted Stock and Restricted Stock Unit Awards
The Committee may grant restricted stock or restricted stock unit awards for shares of our common stock. The Committee, in its sole discretion, will specify in the grant agreement the time or times at which, or the conditions upon which, an award of restricted stock or a portion thereof will become vested and no longer be forfeitable and the time or times at which, or the conditions upon which, an award of restricted stock units or portion thereof will become vested and settled. As of the applicable vesting date, each restricted stock award, or portion thereof, granted under the 2012 Management Equity Incentive Plan will cease to be subject to forfeiture and all restrictions will lapse and each restricted stock unit award, or portion thereof, will become subject to settlement at the time or times set forth in the relevant grant agreement. Notwithstanding the foregoing, each restricted stock or restricted stock unit award may be subject to earlier vesting, expiration, settlement, cancellation or termination as provided in the 2012 Management Equity Incentive Plan or in the relevant grant agreement.
Subject to the terms of the grant agreement, a participant will be entitled, at all times on and after the date of grant, to exercise all rights of a stockholder with respect to the shares of our common stock subject to a restricted stock award; provided, however, that unless otherwise determined by our board of directors at or after the time of grant, the participant will grant to our board of directors a proxy to vote the shares of restricted stock owned beneficially and of record by the participant in such manner as may be determined by our board of directors in its sole discretion. Subject to the terms of the 2012 Management Equity Incentive Plan, prior to the vesting date of each restricted stock award, or portion thereof, all cash, securities and other property paid or otherwise distributed with respect to the restricted stock award may, at the discretion of our board of directors (i) be paid out to the holders of the restricted stock awards, (ii) be held in custody by us and subject to the same vesting and forfeiture conditions to which the award is subject, as specified in the grant agreement or such other conditions as our board of directors may determine or (iii) be forfeited. For purposes of clarification, participants will not have any voting or dividend rights with respect to shares of our common stock to be issued on vesting and settlement of outstanding restricted stock unit awards unless otherwise determined bythat were scheduled to vest from June 15, 2014 to April 28, 2014, with an intrinsic value resulting from the Committee.
Performance-Based Awards
The Committee may from time to time grant awards, including, without limitation, options, restricted stock awards oracceleration of $41,053. He forfeited his restricted stock unit awards wherethat were scheduled to vest on December 15, 2014 and June 15, 2015. We also agreed to accelerate the payment of his cash award or portion thereof will become vested based on the attainment of one or more specified performance measures as established by the Committee and set forth in the participant’s grant agreement. At the time a performance award is granted, the Committee, in its sole discretion, will determine and set forth in the relevant grant agreement, (i) the length of the performance period, (ii) the performance measure or measures and (iii) the performance target levelsoriginally scheduled to be achieved during the performance period. If the Committee determines that certain performance measures or performance target levels are unsuitable given a change in our operation or structure, or other events or circumstances, the Committee may, in its discretion, modify such performance measures or performance target levels, in whole or in part, as it deems appropriate.
Other Stock-Based Awards
paid on September 15, 2014, to be paid within 30 days of April 28, 2014. The Committee may grant other equity-based or equity-related awards in such amounts and subject to such terms and conditions as the Committee may determine. Each such other stock award may (i) involve the transfer of actual shares of our common to the participant, eitherpayment was made at the timetarget amount of grant or thereafter, or$1,500,000. The second payment under Mr. Sparks’ cash award agreement to be paid in cash or otherwise of amounts based on2015 was cancelled, as Mr. Sparks had departed the value of the shares of common stock, (ii) be subject to performance-based and/or service-based conditions or (iii) beorganization in the form of stock appreciation rights, phantom stock, performance shares or share-denominated performance units, provided that each other stock-based award will be denominated in, or will have a value determined by reference to, a number of shares of our common stock that is specified at the time of the grant of such award.2014.
Stockholder RightsDirector Compensation Program
Except as otherwise expressly specified in the 2012 Management Equity Incentive Plan or in a grant agreement, no participant will have any rights as a stockholder with respect to any shares of our common stock covered by or relating to any award granted pursuant to the 2012 Management Equity Incentive Plan until the date a participant becomes the registered owner of such shares of common stock.
Amendment and Termination
Notwithstanding any other provision of the 2012 Management Equity Incentive Plan, ourOur board of directors may, in its sole discretion, terminate the plan or amend the plan or the terms of any award; provided, however, that any such amendment may not materially impair or adversely affect the participants’ existing rights under the plan or such award without such participant’s written consent.
Transferability
Awards granted under the 2012 Management Equity Incentive Plan are generally nontransferable (other than by will or the laws of descent and distribution); provided, however, that a participant may assign or transfer his or her rights to exercise with respect to any or all of the options held by such participant to: (i) such participant’s beneficiaries or estate upon the death of the participant (by will, by the laws of descent and distribution or otherwise) and (ii) subject to the prior written approval by our board of directors and compliance with all applicable tax, securities and other laws, any trust or custodianship created by the participant, the beneficiaries of which may include only the participant, the participant’s spouse or the participant’s lineal descendants (by blood or adoption).
Travelocity.com LLC Stock Option Grant Agreement with Mr. Klein
On March 23, 2010, our board of directors granted Mr. Klein an option to purchase 350,000 common units of Travelocity.com LLC with an exercise price equal to the fair market value of such units on the date of grant. The exercise price of the stock option increases quarterly at 6.00% per annum until the option has been exercised in full. The initial exercise price of the option was $0.50 per common unit. This stock option expires 10 years from the date of grant.
This stock option vested and became exercisable as to 25% of the common units subject to such option on the first anniversary of the date of grant. Subsequently, this stock option vests and becomes exercisable as to 4.6875% of such units at the end of each successive three-month period, subject to Mr. Klein’s continued employment through each vesting date. This stock option was granted with a companion option in respect of shares of our common stock and may only be exercised if the aggregate fair market value of both options is greater than the aggregate exercise price of both options. In this circumstance, the exercisable percentage of the stock option (not to exceed 100%) is calculated as follows: 100 multiplied by the quotient of (A) the aggregate fair market value minus the aggregate exercise price divided by (B) the fair market value minus the exercise price, in each case at the time of determination of the exercisable percentage.
Director Compensation
We have not hadadopted a formal compensation program for the non-employee members of our board of directors. Except as set forth indirectors (other than our Chairman) who are also not employees of TPG or Silver Lake. This compensation program consists of the following table, during Fiscal 2013 we did not pay any compensation toelements:
Type of Compensation | Dollar Value of Board Compensation | |
Annual retainer | $75,000, paid quarterly | |
Audit Committee chairman annual retainer | additional $20,000, paid quarterly | |
Compensation Committee chairman annual retainer | additional $10,000, paid quarterly | |
Governance and Nominating Committee chairman annual retainer | additional $10,000, paid quarterly | |
Audit Committee member annual retainer | additional $10,000, paid quarterly |
In addition, the non-employee members of our board of directors who are also not employees of TPG or Silver Lake are also eligible to receive a one-time restricted stock unit award with a grant date value of $400,000 in connection with their appointment to the board, which vests ratably on a quarterly basis over four years from the date of grant and an annual restricted stock unit award on March 15 of each year with a grant date value of $150,000, which will vest in full on the first anniversary of the date of grant.
Our current Chairman is compensated under a separate program. He receives an annual retainer of $250,000, payable quarterly in arrears and receives no additional fees for service onbeing a committee chairman or member. Additionally, he received a restricted stock unit award and option grant when he joined our board of directors.directors in August 2013. Our current Chairman did not receive the one-time restricted stock unit award being given to new directors but, in the future, is eligible for the annual restricted stock unit award with a grant date value of $150,000.
Fiscal 2013Non-Employee Directors Compensation Deferral Plan
In October 2014, the board adopted the Sabre Corporation Non-Employee Directors Compensation Deferral Plan, a non-qualified deferred compensation plan that allows non-employee directors to defer all or a portion of their restricted stock unit awards. Each participating non-employee director has a notional account established to reflect vesting of restricted stock units and associated notional dividend equivalents. Non-employee directors are fully vested in their accounts. Deferrals are distributed in the form of Sabre common stock after the director terminates his or her service on the board or in the event of a change in control of Sabre.
244
2014 Director Compensation Table
The following table presents the total compensation for each person who served as anon-employee member of our board of directors during Fiscal 2013.2014. Other than as set forth in the table and described more fully below, in Fiscal 20132014 we did not pay any compensation to any person who served as anon-employee member of our board of directors who is affiliated with our Principal Stockholders or any fees to, reimburse any expense of, make any equity awards ornon-equity awards to, or pay any other compensation to any of the othernon-employee members of our board of directors. Mr. Klein, who is our CEOPresident and President,CEO, receives no compensation for his service as a director, and is not included in this table. Similarly, Mr. Gilliland received no compensation for his service as a director while he was our CEO. The compensation received by Messrs.Mr. Klein and Gilliland as employeesan employee is presented in the “Fiscal 2013“2014 Summary Compensation Table” above.
Director | Fees Earned or Paid in Cash ($) | Stock Awards ($)(1)(2) | Option Awards ($)(1)(2) | Total ($) | Fees Earned or Paid in Cash ($) | Stock Awards ($)(1)(2) | Option Awards ($)(1)(2) | All Other Compensation ($) | Total ($) | |||||||||||||||||||||||||||
George Bravante, Jr. | $ | 3,003 | $ | 399,998 | — | — | $ | 403,001 | ||||||||||||||||||||||||||||
Lawrence W. Kellner | $ | 83,333 | $ | 2,115,200 | $ | 758,000 | $ | 2,956,533 | $ | 250,000 | — | — | — | $ | 250,000 | |||||||||||||||||||||
Michael S. Gilliland(3) | $ | 68,644 | — | $ | 68,644 | |||||||||||||||||||||||||||||||
Gary Kusin | $ | 107,019 | $ | 400,003 | — | — | $ | 507,022 | ||||||||||||||||||||||||||||
Greg Mondre | — | — | — | — | — | |||||||||||||||||||||||||||||||
Judy Odom | $ | 73,361 | $ | 400,003 | — | — | $ | 473,364 | ||||||||||||||||||||||||||||
Joseph Osnoss | — | — | — | |||||||||||||||||||||||||||||||||
Karl Peterson | — | — | — | — | — | — | — | — | ||||||||||||||||||||||||||||
Gary Kusin | — | — | — | |||||||||||||||||||||||||||||||||
Timothy Dunn | — | — | — | |||||||||||||||||||||||||||||||||
Greg Mondre | — | — | — | |||||||||||||||||||||||||||||||||
Joe Osnoss | — | — | — | |||||||||||||||||||||||||||||||||
Timothy Dunn(4) | — | — | — | — | — | |||||||||||||||||||||||||||||||
Michael S. Gilliland(5) | $ | 62,500 | — | $ | 1,935,288 | (3) | $ | 368,836 | $ | 2,366,624 | ||||||||||||||||||||||||||
| (1) | The amounts reported in the Stock Awards and Option Awards columns represent the grant date fair value of the restricted stock unit award for shares of our common stock and the option to purchase shares of our common stock granted |
245
| (2) | The following table sets forth information on the restricted stock unit |
Director Name | Grant Date | Number of Shares Subject to Stock or Option Award | Number of Shares Underlying Stock and Option Awards Held as of December 31, | |||||||||||||
George Bravante, Jr. | 12/19/2014 | 19,950 | — | |||||||||||||
Lawrence W. Kellner | | 08/30/2013
|
|
|
|
|
| |||||||||
| 110,000 | (a) | ||||||||||||||
| 08/30/2013 | 200,000 | 200,000 | (b) | |||||||||||||
Gary Kusin | 04/17/2014 | 23,981 | 20,984 | (c) | ||||||||||||
Greg Mondre | — | — | — | |||||||||||||
Judy Odom | 04/17/2014 | 23,981 | 20,984 | (c) | ||||||||||||
Joseph Osnoss | — | — | — | |||||||||||||
Karl Peterson | — | — | — | |||||||||||||
| ||||||||||||||||
Timothy Dunn | — | — | — | |||||||||||||
Michael S. Gilliland | 06/11/2007 | |||||||||||||||
| 1,587,500 | (d) | ||||||||||||||
| 04/01/2008 | 62,500 | (b) | ||||||||||||||
| 04/01/2009 | 750,000 | (e) | ||||||||||||||
| 04/01/2009 | ||||||||||||||||
| 825,000 | (f) | ||||||||||||||
| 12/03/2012 | (g) | |||||||||||||||
| (a) | As of December 31, |
| (b) | As of December 31, |
| (c) |
| (d) | As of December 31, 2014, this option to purchase shares of our common stock was exercisable as to 1,587,500 shares of common stock. |
| (e) | As of December 31, 2014, this option to purchase shares of our common stock was exercisable as to 750,000 shares of common stock. |
| (f) | As of December 31, 2014, this option to purchase shares of our common stock was exercisable as to 825,000 shares of common stock. |
| (g) | As of December 31, 2014, this option to purchase shares of our common stock was exercisable as to 434,675 shares of common stock. |
| (3) | As of December 31, 2014, this option to purchase shares of our common stock was exercisable as to 434,675 shares of our common stock. |
| (4) | Mr. Dunn resigned from our board of directors effective December 19, 2014. |
| (5) | Upon his retirement as our CEO, Mr. Gilliland agreed to continue to serve as a member of our board of directors. For this service, he |
Thenon-employee members of our board of directors are reimbursed for their reasonable travel and otherout-of-pocket expenses in attending board of directors’ and board committee meetings.
New Director Compensation Program
In connection with this offering, our board of directors adopted a formal compensation program for the non-employee membersmeetings of our board of directors who are also not employees of TPG or Silver Lake. This compensation program consists of the following elements:and board committees.
|
| |
| ||
| ||
| ||
| ||
|
In addition, the non-employee members of our board of directors are also eligible to receive a one-time restricted stock unit award with a grant date value of $400,000 in connection with their appointment to the board, which vests ratably over four years from the date of grant and, starting on the first anniversary of their service as a non-employee director, an annual restricted stock unit award with a grant date value of $150,000, which will vest in full on the first anniversary of the date of grant.
PRINCIPAL AND SELLING STOCKHOLDERS
Beneficial ownership is determined in accordance with the rules and regulations of the SEC. These rules generally provide that a person is the beneficial owner of securities if such person has or shares the power to vote or direct the voting thereof, or to dispose or direct the disposition thereof or has the right to acquire such powers within 60 days. Percentage of beneficial ownership is based on 178,633,409267,865,537 shares of common stock outstanding as of December 31, 2013, and shares of common stock to be outstanding after the completion of this offering based on an assumed share price of $ , the midpoint of the price range on the cover of this prospectus.January 15, 2015. Except as disclosed in the footnotes to thisthe table below and subject to applicable community property laws, we believe that each stockholder identified in the table possesses sole voting and investment power over all shares of common stock shown as beneficially owned by the stockholder.
For further information regarding material transactions between us and certain of our stockholders, see “Certain Relationships and Related Party Transactions.”
In connection with this offering and depending on the applicable facts and circumstances, a Selling Stockholder may be deemed to be an “underwriter” within the meaning of such term under the Securities Act.
The following table sets forth information regarding the beneficial ownership of our common stock (i) as of December 31, 2013January 15, 2015 and (ii) as adjusted to give effect to this offering for:
Unless otherwise noted below, the address of each beneficial owner listed on the table is c/o Sabre Corporation, 3150 Sabre Drive, Southlake, TX 76092.
Name and Address of Beneficial Owner | Prior to this Offering | Shares Offered | After this Offering | |||||||||||||||||
| Shares Beneficially Owned(1) | Number of Shares being Offered | Number of Shares Subject to Underwriters Option to Purchase Additional Shares | Shares Beneficially Owned (if Underwriters do not Exercise their Option to Purchase Additional Shares)(1) | Shares Beneficially Owned (if Underwriters Exercise their Option to Purchase Additional Shares)(1) | ||||||||||||||||
| Number | Percent | Number | Percent | Number | Percent | |||||||||||||||
5% Stockholders: | ||||||||||||||||||||
TPG Funds(2). | 80,982,612 | 45.3 | % | |||||||||||||||||
Silver Lake Funds(3). | 49,835,474 | 27.9 | % | |||||||||||||||||
Sovereign Co-Invest, LLC(4) | 41,819,521 | 23.4 | % | |||||||||||||||||
Named Executive Officers and Directors: | ||||||||||||||||||||
Thomas Klein(5) | 1,787,604 | * | ||||||||||||||||||
Carl Sparks | 180,691 | * | ||||||||||||||||||
Deborah Kerr | — | — | ||||||||||||||||||
Richard Simonson | — | — | ||||||||||||||||||
William G. Robinson | — | — | ||||||||||||||||||
Timothy Dunn | — | — | ||||||||||||||||||
Mark Miller(6) | 908,577 | * | ||||||||||||||||||
Gary Kusin(7) | — | — | ||||||||||||||||||
Greg Mondre(8) | — | — | ||||||||||||||||||
Joseph Osnoss(9) | — | — | ||||||||||||||||||
Karl Peterson(10) | — | — | ||||||||||||||||||
Michael S. Gilliland(11) | 3,969,417 | 2.2 | % | |||||||||||||||||
Lawrence W. Kellner(12) | 22,500 | * | ||||||||||||||||||
All Executive Officers and Directors as a group (17 Persons)(13) | 9,488,579 | 5.1 | % | |||||||||||||||||
| Shares owned following completion of this offering | ||||||||||||||||||
| Shares Owned as of January 15, 2015(1) | Shares offered in this offering | Assuming no exercise of the underwriters’ option to purchase additional shares | Assuming full exercise of the underwriters’ option to purchase additional shares | |||||||||||||||
Name and Address of Beneficial Owner | Number | % | Number | Number | % | Number | % | |||||||||||
5% Stockholders: | ||||||||||||||||||
TPG Funds(2) | 99,715,530 | 37.2 | % | |||||||||||||||
Silver Lake Funds(3) | 61,363,423 | 22.9 | % | |||||||||||||||
Sovereign Co-Invest, LLC(4) | 51,493,478 | 19.2 | % | |||||||||||||||
Individual Selling Stockholders: | ||||||||||||||||||
Hugh W. Jones(5) | 1,525,969 | * | ||||||||||||||||
Gregory Webb(6) | 822,920 | * | ||||||||||||||||
Named Executive Officers and Directors: | ||||||||||||||||||
Tom Klein(7) | 2,122,297 | * | ||||||||||||||||
Richard Simonson(8) | 364,824 | * | ||||||||||||||||
Rachel Gonzalez | — | — | ||||||||||||||||
Deborah Kerr(9) | 349,114 | * | ||||||||||||||||
Carl Sparks** | 274,931 | * | ||||||||||||||||
George R. Bravante, Jr | — | — | ||||||||||||||||
Lawrence W. Kellner(10) | 135,000 | * | ||||||||||||||||
Gary Kusin(11) | 4,496 | * | ||||||||||||||||
Greg Mondre(12) | — | — | ||||||||||||||||
Judy Odom(13) | 4,496 | * | ||||||||||||||||
Joseph Osnoss(14) | — | — | ||||||||||||||||
Karl Peterson(15) | — | — | ||||||||||||||||
AllExecutiveOfficersandDirectorsasagroup(16 Persons)(16) |
| 5,811,544 |
|
| 2.1 | % | ||||||||||||
247
| * | Represents beneficial ownership of less than 1% |
| ** | Shares owned as of October 13, 2014 |
| (1) | Shares shown in the table above include shares held in the beneficial owner’s name or jointly with others, or in the name of a bank, nominee or trustee for the beneficial owner’s account. |
| (2) | The TPG Funds hold an aggregate of |
| (3) | The Silver Lake Funds hold an aggregate of |
| (4) | Sovereign Co-Invest, LLC, a Delaware limited liability company (“Sovereign Co-Invest”), holds |
| (5) | Includes |
| (6) | Includes |
| (7) | Includes 1,892,575 shares of common stock underlying options that are currently exercisable or exercisable within 60 days of January 15, 2015 for shares of common stock. Does not include 98,384 performance-based restricted stock units that may vest within 60 days of January 15, 2015 because performance has not been determined |
| (8) | Includes 316,822 shares of common stock underlying options that are currently exercisable or exercisable within 60 days of January 15, 2015 for shares of common stock. Does not include 89,613 performance-based restricted stock units that may vest within 60 days of January 15, 2015 because performance has not been determined |
| (9) | Includes 314,881 shares of common stock underlying options that are currently exercisable or exercisable within 60 days of January 15, 2015 for shares of common stock. Does not include 62,927 performance-based restricted stock units that may vest within 60 days of January 15, 2015 because performance has not been determined |
| (10) | Includes 75,000 shares of common stock underlying options that are currently exercisable or exercisable within 60 days of January 15, 2015 for shares of common stock and 10,000 time-base restricted stock units that vest on February 28, 2015 |
| (11) | Gary Kusin, who is one of our directors, is a TPG senior advisor. Mr. Kusin has no voting or investment power over and disclaims beneficial ownership of the TPG Shares. The address of Mr. Kusin is c/o TPG Global, LLC, 301 Commerce Street, Suite 3300, Fort Worth, TX 76102. Includes 1,499 time-based restricted stock units that vest on January 17, 2015 |
| Greg Mondre, who is one of our directors, is a Managing Partner and Managing Director of Silver Lake. Mr. Mondre has no voting or investment power over, and disclaims beneficial ownership of, the Silver Lake Shares. The address for Mr. Mondre is c/o Silver Lake, 9 West 57th Street, 32nd Floor, New York, NY 10019. |
| Includes 1,499 time-based restricted stock units that vest on January 17, 2015 |
| (14) | Joseph Osnoss, who is one of our directors, is a Managing Director of Silver Lake. Mr. Osnoss has no voting or investment power over, and disclaims beneficial ownership of, the Silver Lake Shares. The address for Mr. Osnoss is c/o Silver Lake, |
248
| Karl Peterson, who is one of our directors, is a TPG Partner. Mr. Peterson has no voting or investment power over and disclaims beneficial ownership of the TPG Shares. The address of Mr. Peterson is c/o TPG Global, LLC, 301 Commerce Street, Suite 3300, Fort Worth, TX 76102. |
| Includes |
249
CERTAIN RELATIONSHIPS AND RELATED PARTY TRANSACTIONS
The following is a summary of material provisions of various transactions we have entered into with our executive officers, board members or 5% or greater stockholders and their affiliates since January 1, 2011. We believe the terms and conditions in these agreements are reasonable and customary for transactions of these types.
Pursuant toIn connection with our initial public offering, we adopted a written related party transaction policypolicy. Pursuant to be adopted in connection with this offering,policy, the audit committee of the board of directors will beis responsible for evaluating each related party transaction and determining whether the transaction is fair, reasonable and within our policy, and whether it should be ratified or approved. The audit committee, in evaluating a transaction, will considerconsiders various factors, including the benefit of the transaction to us, the terms of the transaction and whether they are atarm’s-length and in the ordinary course of our business, the direct or indirect nature of the related party’s interest in the transaction, the size and expected term of the transaction and other facts and circumstances that bear on the materiality of the related party transaction under applicable law and listing standards. If less than a majority of the members of the audit committee is qualified to ratify or approve a transaction, the audit committee will submit the transaction to the disinterested directors of the board of directors, who will apply the same factors to evaluate, ratify or approve the transaction. The audit committee will review, at least annually, a summary of our transactions with our directors and officers and with firms that employ our directors, as well as any other related party transactions.
We did not have a written policy regarding the review and approval of related person transactions immediately prior to our initial public offering. Nevertheless, with respect to such transactions, it was our policy for our board of directors to consider the nature of and business reason for such transactions, how the terms of such transactions compared to those which might be obtained from unaffiliated third parties and whether such transactions were otherwise fair to and in the best interests of, or not contrary to, our best interests.
Stockholders’ Agreement
On March 30, 2007, we entered into a Stockholders’ Agreement with the TPGSilver Lake Funds, the Silver LakeTPG Funds and Sovereign Co-Invest, which will bewas amended and restated in connection with the completion of thisour initial public offering.
The Stockholders’ Agreement will provideprovides that the Silver Lake Funds and the TPG Funds will have certain nomination rights to designate candidates for nomination to our board of directors and, subject to any restrictions under applicable law or the NASDAQ rules, the ability to appoint members to each board committee.
As set forth in the Stockholders’ Agreement, for so long as the Silver Lake Funds collectively own at least % of the22 million shares of our common stock, held by them at the closing of this offering (the “Closing Date Shares”), they will be entitled to designate for nomination two of the seats on our board of directors. Thereafter, the Silver Lake Funds will be entitled to designate for nomination one director so long as they own at least %7 million shares of their Closing Date Shares.our common stock. Further, for so long as the TPG Funds collectively own at least %44 million shares of their Closing Date Shares,our common stock, they will be entitled to designate for nomination three of the seats on our board of directors. When the TPG Funds collectively own less than %,44 million shares of our common stock, but at least %22 million shares of their Closing Date Shares,our common stock, the TPG Funds will be entitled to designate for nomination two directors. Thereafter, the TPG Funds will be entitled to designate for nomination one director so long as they own at least %7 million shares of their Closing Date Shares.our common stock.
In addition, the Silver Lake Funds and the TPG Funds also jointly have the right to designate for nomination one additional director (the “Joint Designee”), who must qualify as independent under the NASDAQ rules and must meet the independence requirements ofRule 10A-3 of the Exchange Act, so long as theythe Silver Lake Funds and the TPG Funds collectively own at least %10% of their collective share of our common stock held by them at the closing of our initial public offering (the “Closing Date Shares”). However, if the Silver Lake Funds and the
250
TPG Funds collectively own at least 10% of their collective Closing Date Shares and either individually owns less than 5% of its individual Closing Date Shares, then the Joint Designee shall be designated for nomination solely by the entity that owns more than 5% of its individual Closing Date Shares.
We are required, to the extent permitted by applicable law, to take all necessary action (as defined in the Stockholders’ Agreement) to cause the board of directors and the governance and nominating committee to include such persons designated by the Silver Lake Funds or the TPG Funds, as applicable, in the slate of director nominees recommended by the board of directors for election by the stockholders.stockholders and solicit proxies and consents in favor of such director nominees. Subject to the terms of the Stockholders’ Agreement, each Principal Stockholder agrees to vote its shares in favor of the election of the director nominees designated by the Silver Lake Funds and the TPG Funds.
In accordance with the Stockholders’ Agreement, the TPG Funds have appointed Mr. Dunn,Bravante, Mr. Kusin and Mr. Peterson to our board of directors and the Silver Lake Funds has appointed Mr. Mondre and Mr. Osnoss to our board of directors.
In addition, the StockholdersStockholders’ Agreement contains agreements among the parties, including with respect to transfer restrictions,tag-along rights,drag-along rights and rights of first refusal. The Stockholders’ Agreement also will provideprovides that, so long as the Silver Lake Funds and the TPG Funds collectively own at least %40% of their collective Closing Date Shares, approval of at least a majority of the board of directors, including at least one director nominated for designation by the Silver Lake Funds and one director nominated by the TPG Funds must be obtained before we are permitted to take the any of the following actions:
In the case of a vacancy on our board of directors created by the removal or resignation of a director designated by the Silver Lake Funds or the TPG Funds, as applicable, the Stockholders’ Agreement will requirerequires us to nominate an individual designated by such entity for election to fill the vacancy.
Registration Rights Agreement
On March 30, 2007, we entered into a registration rights agreement (the “Registration Rights Agreement”) with the TPG Funds, the Silver Lake Funds and Sovereign Co-Invest, which will bewas amended and restated in connection with the completion of this offering.our initial public offering in April 2014. This registration rights agreementRegistration Rights Agreement provides the Silver Lake Funds and the TPG Funds with demand and shelf registration rights following the
251
expiration of the 180-day lock-up period.180-daylock-up period relating to the initial public offering and Sovereign Co-Invest with the right to participate in such demand and shelf registrations. In addition, the registration rights agreementRegistration Rights Agreement also provides the Principal Stockholders with piggyback registration rights on any registration statement, other than on FormsS-4,S-8 or any other successor form, to be filed by the company. These registration rights are subject to certain conditions and limitations, including the right of the underwriters to limit the number of shares to be included in a registration statement and our right to delay a registration statement under certain circumstances.
Under the registration rights agreement,Registration Rights Agreement, we have agreed to pay certain expenses related to any such registration to indemnify the Silver Lake Funds and the TPG FundsPrincipal Stockholders against certain liabilities that may arise under the Securities Act.
Directors
Prior to our initial public offering, our directors (other than Messrs. Kellner Gilliland and Kusin)Kusin and Ms. Odom) were not compensated for their services as directors. For additional information on the compensation provided to our board of directors, see “Compensation Discussion and Analysis—Director Compensation.Compensation Program.”
Management Services Agreement
On March 30, 2007, we entered into an MSA with affiliates of TPG and Silver Lake (the “Managers”) to provide us with management, advisory and consulting services. Pursuant to the MSA, we have been required to pay to the Managers management fees, payable quarterly in arrears, totaling to between $5 million to $7 million per year, the actual amount of which is calculated based upon 1% of Adjusted EBITDA, as defined in the MSA, earned by the company in such fiscal year up to a maximum of $7 million. During the years ended December 31, 2013, 2012 and 2011, the annual management fee paid to the Managers was $7 million $7 million and $7 million, respectively.in each year. Additionally, we reimbursereimbursed the Managers for allout-of-pocket expenses incurred by them or their affiliates in connection with services provided to us pursuant to the MSA. For the years ended December 31, 2013 and 2012 the amount reimbursed in expenses was $2 million and $1 million, respectively. For the year ended December 31, 2011, the amount reimbursed in expenses was not material. In connection with the completion our initial public offering in April 2014 and in contemplation of thisproviding continued services to the company after the initial public offering, the Managers are entitled toreceived a fee payable pursuant to the MSA in an amount equal to, in the aggregate, $21 million plus other unpaid fees and expenses and, thereafter, the MSA will bewas terminated. The MSA includesincluded customary exculpation and indemnification provisions in favor of the affiliates of TPG and Silver Lake.
Management Stockholders’ Agreement
We and certain investors,stockholders, including certain members of our executive officers and directors, have entered into a management stockholders agreement (the “Management Stockholders’ Agreement”). The Management Stockholders’ Agreement contains certain agreements among the parties including with respect to restrictions on the transfer of shares of common stock, call rights in certain specified situations for shares of common stockthen-currently owned, drag along rights and tag along rights. Pursuant to the Management Stockholders’ Agreement, certain stockholders, which group of stockholders excludes our Principal Stockholders, have also agreed not to transfer, sell, assign, pledge, hypothecate or encumber any of the shares of common stockthen-currently owned by such stockholder (which can be waived by us at our option at any time), subject to certain limited exceptions, at any time prior to the termination of such Management Stockholders’ Agreement. The restrictions on transfer have been waived with effect from October 14, 2014 for certain of our former employees who are party to the Management Stockholders’ Agreement holding approximately 3 million shares of common stock and 2 million stock options and with effect from November 21, 2014 for certain of our current and former employees who are party to the Management Stockholders’ Agreement holding approximately 1.3 million shares of common stock and 4.2 million stock options. In addition, the Management Stockholders’ Agreement provides these investorsstockholders with piggyback registration rights to participate on a pro rata basis in any registered offering in which the TPG Funds or the Silver Lake Funds are registering shares of common stock. Except with respect to the piggyback registration
252
rights described immediately prior, the Management Stockholders’ Agreement terminates if our common stock is registered and if at least 20% of our total outstanding common stock trades regularly in, on or through the facilities of a securities exchange and/orinter-dealer quotation system or any designated offshore securities market, as iswhich conditions are expected to occur afterbe met in connection with the completion of this offering.offering, assuming the Selling Stockholders sell at least 5,415,142 shares. If the Management Stockholders’ Agreement does not terminate, the transfer restrictions contained therein would continue to be applicable except to the extent they are waived.
Tax Receivable Agreement
FollowingImmediately prior to the closing of our initial public offering, we expect to be able to utilize the Pre-IPO Tax Assets, which arose prior to the initial public offering and are therefore attributable to our Existing Stockholders (i.e., the TPG Funds, the Silver Lake Funds and other investors). These Pre-IPO Tax Assets will reduce the amount of tax that we and our subsidiaries would otherwise be required to pay in the future. See “Risk Factors—We will be required to pay our Existing Stockholders 85% of certain tax benefits related to Pre-IPO Tax Assets, and could be required to make substantial cash payments in which the stockholders purchasing shares in this offering will not participate.”
Immediately prior to the completion of this offer, we will enterentered into the TRA and thereby distribute to ourwhich provides the Pre-IPO Existing Stockholders the right to receive payment byfuture payments from us of 85% of the amount of cash savings, if any, in U.S. federal income tax that we and our subsidiaries realize (or are deemed to realize in the case of a change of control or certain other transactions, as discussed below) as a result of the utilization of our and our subsidiaries’the Pre-IPO Tax Assets.
In addition, we will pay interest on the payments we will make to the Pre-IPO Existing Stockholders with respect to the amount of this cash savings from the due date (without extensions) of our tax return where we realize this savings to the payment date at a rate equal to LIBOR plus 1.00% per annum. Different timing rules will apply to payments under the TRA to be made to Pre-IPO Award Holders. Such payments will generally be deemed invested in a notional account rather than made on the scheduled payment dates, and the account will be distributed on the fifth anniversary of the initial public offering, together with an amount equal to the net present value of such Pre-IPO Award Holder’s future expected payments, if any, under the TRA. Moreover, payments to holders of pre-IPO unvested stock options will bethat were unvested prior to the completion of our initial public offering are subject to vesting on the same schedule as thesuch holder’s unvested stock options. See “Risk Factors—We are required to pay to stockholders and equity award holders that were stockholders or equity award holders immediately prior to the closing of our initial public offering 85% of certain tax benefits, and could be required to make substantial cash payments in which the stockholders purchasing shares in this offering will not participate.”
For purposes of the TRA, cash savings in income tax are computed by reference to the reduction in the liability for income taxes resulting from the utilization of the tax benefits subject to the TRA. The term of the TRA will commencecommenced upon consummation of our initial public offering in , 2014 and will continuecontinues until there is no potential for any future tax benefit payments.
Our counterparties under the TRA will not reimburse us for any payments previously made if such tax benefits are subsequently disallowed (although future payments would be adjusted to the extent possible to reflect the result of such disallowance). As a result, in such circumstances we could make payments under the TRA that are greater than our actual cash tax savings.
While the actual amount and timing of any payments under the TRA will vary depending upon a number of factors, including the amount and timing of the taxable income we and our subsidiaries generate in the future, and our and our subsidiaries’ use ofPre-IPO Tax Assets, we expect that, during the term of the TRA, the payments that we may make could be material. Assuming no material changes in the relevantBased on current tax lawlaws and assuming that we and our subsidiaries earn sufficient taxable income to realize the full tax benefits subject to the TRA, (i) we would expect that payments under the TRA willrelating to thePre-IPO Tax Assets could aggregate to approximately $$330 million to $$380 million over the next five years.
Upon the effective datesix years (assuming no changes in current limitations on our ability to utilize our NOLs under Section 382 of the TRA,Code), which we estimate will represent approximately 85% to 95% of the total payments we will recognizebe required to make under the TRA and (ii) we do not expect material payments to occur before 2016. Payments to the recipients under the TRA are not conditioned upon the recipient continuing to be an equity holder in the Company.
We recognized a liability of $$321 million after considering the valuation allowance of $66 million recorded against the Pre-IPO Tax Assets for the payments (estimated as of March 31, 2014) to be made under the TRA. The TRA which will be accounted forliability was recorded as a reduction ofto additional paid-in capital on consolidated balance sheet.and an increase to other noncurrent liabilities. No payments have been
253
made under the TRA during the nine months ended September 30, 2014 and we do not expect material payments to occur prior to 2016. Any future changespayments made under the TRA will be classified as a financing activity in our statement of cash flows. Changes in the utility of our thePre-IPO Tax Assets will impact the amount of the liability that will be paid to our Pre-IPO Existing Stockholders. Changes in the utility of thesePre-IPO Tax Assets will beare recorded in income tax expense (benefit) and any changes in the obligation under the TRA will beis recorded in other income (expense). Based on our current taxable income estimates, we expect to repay the majority of this obligation by the end of our 2019 fiscal year. We expect to pay between $ million and $ million in cash related to this agreement over the next five years, based on our current taxable income estimates. We plan to use cash flow from operations and availability under our credit facilities to fund this obligation.
If we undergo a Change of Control, the TRA will terminate and we will be required to make a payment equal to the present value of future payments under the TRA, which payment would be based on certain assumptions, including those relating to our and our subsidiaries’ future taxable income. Additionally, if we sell or otherwise dispose of any of our subsidiaries in a transaction that is not a Change of Control, we will be required to make a payment equal to the present value of future payments under the TRA attributable to thePre-IPO Tax Assets of such subsidiary that is sold or disposed of, applying the assumptions described above.
The TRA provides that in the event that we breach any of our material obligations under it, whether as a result of our failure to make any payment when due (subject to a specified cure period), failure to honor any other material obligation under it or by operation of law as a result of the rejection of it in a case commenced under the United States Bankruptcy Code or otherwise, then all our payment and other obligations under the TRA will be accelerated and will become due and payable applying the same assumptions described above. Such payments could be substantial and could exceed our actual cash tax savings under the TRA.
Certain transactions by the company could cause it to recognize taxable income (possibly material amounts of income) without a current receipt of cash. Payments under the TRA with respect to such taxable income would cause a net reduction in our available cash. For example, transactions giving rise to cancellation of debt income, the accrual of income from original issue discount or deferred payments, a “triggering event” requiring the recapture of dual consolidated losses, or “Subpart F” income would each produce income with no corresponding increase in cash. In these cases, we may use some of thePre-IPO Tax Assets to offset income from these transactiontransactions and, under the TRA, would be required to make a payment to our Pre-IPO Existing Stockholders even though we receive no cash from such income.
Because we are a holding company with no operations of our own, our ability to make payments under the TRA is dependent on the ability of our subsidiaries to make distributions to us. To the extent that we are unable to make payments under the TRA for specified reasons, such payments will be deferred and will accrue interest at a rate of LIBOR plus 1.00% per annum until paid.
In the event that any determinations must be made under or any dispute arises involving the TRA, the Pre-IPO Existing Stockholders will be represented by a shareholder representative that is an entity controlled by the TPG Funds and the Silver Lake Funds. In any such instance, should any representatives of the TPG Funds and the Silver Lake Funds then be serving on our board of directors, such directors will be excluded from decisions of the board related to the relevant determination or dispute.
The TRA is filed as an exhibit to the registration statement of which this prospectus forms a part and the foregoing description of the TRA is qualified by a reference thereto.
Abacus
In February 1998, we acquired a 35% interest in Abacus, which is a joint venture between Sabre and Abacus International Holdings, a consortium of eleven Asian airlines. Abacus distributes a GDS in Asia, using GDS technology that we license to Abacus for its exclusive use in Asia. We also operate that GDS technology, and perform associated applications maintenance and development services, on behalf of Abacus. Our related party transactions with Abacus are summarized and presented in the table below.
| Year Ended December 31, | ||||||||||||
| 2013 | 2012 | 2011 | ||||||||||
| (Amounts in thousands) | ||||||||||||
Revenue earned from Abacus | $ | 91,998 | $ | 71,957 | $ | 52,073 | ||||||
| December 31, | ||||||||
| 2013 | 2012 | |||||||
| (Amounts in thousands) | ||||||||
Receivable from Abacus | $ | 29,377 | $ | 13,939 | ||||
Payable to Abacus for Economic Benefit Transfer | (8,648 | ) | (8,452 | ) | ||||
Current deferred revenue related to Abacus data processing | (2,571 | ) | (2,571 | ) | ||||
Long-term deferred revenue related to Abacus data processing | (12,857 | ) | (15,428 | ) | ||||
|
|
|
| |||||
Related party receivable (liability), net | $ | 5,301 | $ | (12,512 | ) | |||
|
|
|
| |||||
For additional information on our related party transactions with Abacus, see Note 6, Equity Method Investment’s, to our audited consolidated financial statements.
Certain Relationships
From time to time, we do business with other companies affiliated with the Principal Stockholders. We believe that all such arrangements have been entered into in the ordinary course of business and have been conducted on anarms-length basis.
254
The following is a description of the material terms of our third amended and restated certificate of incorporation (the “Certificate of Incorporation”) and second amended and restated bylaws (the “Bylaws”) as they are in effect upon completionas of this offering. TheyJanuary 23, 2015. This description may not contain all of the information that is important to you. To understand them fully, you should read our Certificate of Incorporation and Bylaws, copies of which are filed with the SEC as exhibits to the registration statement of which this prospectus is aforms part, as well as the relevant portions of the Delaware General Corporation Law, as amended (“DGCL”).
For purposes of calculating the Principal Stockholders’ share ownership thresholds described under “—“—Anti-Takeover Effects of Provisions of Our Certificate of Incorporation and Our Bylaws”, the shares of common stock owned by the Sovereign Co-Invest will be deemed to be owned by the Principal Stockholders for purposes of such calculations so long as these shares are owned directly by the Sovereign Co-Invest or the managing member of the Sovereign Co-Invest has been granted a proxy for purposes of voting such shares.
Common Stock
General.Our Certificate of Incorporation will authorizeauthorizes the issuance of up to 1 billion shares of common stock, par value $0.01, up to of which may be issued and designated as non-voting shares. Prior to the consummation of this offering,$0.01. On January 15, 2015, there were 267,865,537 shares of common stock outstanding. After this offering, there will be shares of our common stock outstanding, or shares if the underwriters exercise their option to purchase additional shares in full. None of our outstanding common stock has been designated asnon-voting.
Voting RightsRights.. Holders of common stock are entitled to one vote for each share held on all matters submitted to a vote of stockholders and do not have cumulative voting rights. Accordingly, holders of a majority of the shares of common stock entitled to vote in any election of directors may elect all of the directors standing for election. Except for the election of directors, if a quorum is present, an action on a matter is approved if the votes cast favoring the action or matter exceed the votes cast against the action or matter, unless the vote of a greater number is required by applicable law, the DGCL, our Certificate of Incorporation or our Bylaws. The election of directors will be determined by a plurality of the votes cast in respect of the shares present in person or represented by proxy at the meeting and entitled to vote, meaning that the nominees with the greatest number of votes cast, even if less than a majority, will be elected. The rights, preferences and privileges of holders of common stock are subject to, and may be impacted by, the rights of the holders of shares of our outstanding Series A Preferred Stock and any other series of preferred stock that we may designate and issue in the future.
Dividends.Subject to preferences of our outstanding Series A Preferred Stock, as described below, and which may be applicable to any other then outstanding preferred stock, holders Holders of our common stock are entitled to receive ratably those dividends, if any, as may be declared by the board of directors out of legally available funds.
Liquidation, Dissolution, and Winding Up.Upon our liquidation, dissolution or winding up, the holders of our common stock will be entitled to share ratably in the net assets legally available for distribution to stockholders after the payment of all of our debts and other liabilities, subject to the prior rights of any preferred stock then outstanding, including, currently, the Series A Preferred Stock, which will be redeemed in the Redemption prior to the closing of this offering.liabilities.
Preemptive Rights.Holders of our common stock have no preemptive or conversion rights or other subscription rights, and there are no redemption or sinking funds provisions applicable to our common stock.
Assessment.All outstanding shares of our common stock are and the shares of our common stock to be outstanding upon completion of this offering will be, fully paid and nonassessable.
Preferred Stock
Our amended and restated certificateCertificate of incorporation will authorizeIncorporation authorizes the issuance of up to additional225 million shares of preferred stock. Prior to the consummation of this offering, there were 87,184,179 shares of Series A Preferred Stock outstanding as of December 31, 2013, which will be redeemed in the Redemption prior to the closing of this offering.
Under our Certificate of Incorporation, our board of directors may issue additional shares of preferred stock, without stockholder approval, in such series and with such designations, preferences, conversion or other rights, powers, including voting powers, and qualifications, limitations or restrictions thereof, as the board of directors
255
deems appropriate. While the board of directors has no current intention of doing so, it could, without stockholder approval, issue shares of preferred stock with voting, conversion and other rights that could adversely affect the voting power and impact other rights of the holders of the common stock. Our board of directors may issue shares of preferred stock as ananti-takeover measure without any further action by the holders of common stock. This may have the effect of delaying, deferring or preventing a change of control of our company by increasing the number of shares necessary to gain control of the company. Except as described below, ourOur board of directors has not authorized the issuance of any shares of preferred stock, and we have no agreements or current plans for the issuance of any shares of preferred stock.
Series A Preferred Stock
As of December 31, 2013, there were 87,184,179 shares of our Series A Preferred Stock, par value $0.01 per share outstanding. Holders of the Series A Preferred Stock have no voting rights except with respect to the creation of any class or series of capital stock having any preference or priority over the Series A Preferred Stock or the amendment or repeal of any provision of the constituent documents of the company that adversely changes the powers, preferences or special rights of the Series A Preferred Stock.
Each share of Series A Preferred Stock accumulates dividends at a rate of 6% per annum. Accumulated but unpaid dividends on the Series A Preferred Stock amounted to $134 million and $97 million at December 31, 2013 and December 31, 2012, respectively. No dividend or distribution can be declared or paid with respect of the common stock or any other series of preferred stock that does not expressly provide that it ranks senior or pari passu with the Series A Preferred Stock, and we cannot redeem, purchase, acquire, or retire for value the common stock or any other series of preferred stock that does not expressly provide that it ranks senior or pari passu with the Series A Preferred Stock, and we cannot redeem, unless and until the full amount of any unpaid dividends accrued on the Series A Preferred Stock has been paid or contemporaneously declared and paid.
Holders of the Series A Preferred Stock have the right to require us to repurchase each of their shares of Series A Preferred Stock for cash in an amount equal to the stated value per share plus accrued and unpaid dividends upon the occurrence of certain specified liquidation events, including the first underwritten public offering and sale of equity securities of the company for cash. For a further description of the liquidity events, see Note 15, Redeemable Preferred Stock, to our audited consolidated financial statements included elsewhere in this prospectus.
In addition, following an amendment to our Certificate of Incorporation, we will have the right, at our option, at any time, to redeem all or part of the Series A Preferred Stock in cash or common stock, or any combination thereof, in an amount equal to the stated value of $ million in the aggregate or $ per share of Series A Preferred Stock, plus accrued and unpaid dividends. As of March 31, 2014, accrued and unpaid dividends are $ million in the aggregate or $ per share of Series A Preferred Stock (the stated value together with accrued and unpaid dividends, the “Redemption Value”). The actual number of shares issued in the Redemption will be based on the accumulated dividends through the redemption date. Any common stock delivered in connection with a redemption shall be valued at fair market value, as determined by our Board of Directors, except that any shares issued at the time of the closing of an initial public offering shall be presumed to be valued at the initial offering price to the public.
Prior to the closing of this offering, we will exercise our right to redeem all of our Series A Preferred Stock. The redemption price will be paid with a mix of cash and stock, which we will deliver pro rata to the holders thereof concurrently with the closing of this offering. Assuming we sell the total number of shares set forth on the cover of this prospectus at an initial public offering price equal to the midpoint of the price range on the cover of this prospectus, we will deliver an estimated aggregate of $ million in cash and shares of our common stock in payment of the related redemption price plus accumulated but unpaid dividends as of March 31, 2014. The actual number of shares of common stock and amount of cash that will be used in the Redemption are subject to change based on the initial public offering price and the closing date of this offering.
The Redemption of the Series A Preferred Stock will simplify our capital structure by leaving only one class of capital stock—our common stock—outstanding following the closing of this offering.
Anti-Takeover Effects of Provisions of Our Certificate of Incorporation and Our Bylaws
Our Certificate of Incorporation and our Bylaws contain provisions that may delay, defer or discourage another party from acquiring control of us. We expect that these provisions will discourage coercive takeover practices or inadequate takeover bids. These provisions are also designed to encourage persons seeking to acquire control of us to first negotiate with the board of directors, which we believe may result in an improvement of the terms of any such acquisition in favor of our stockholders. However, they may also discourage acquisitions that some stockholders may favor. These provisions include:
Classified Board. Our Certificate of Incorporation provides that our board of directors will beis divided into three classes of directors, with the classes as nearly equal in number as possible. As a result, approximatelyone-third of our board of directors will beis elected each year. The classification of directors has the effect of making it more difficult for stockholders to change the composition of our board. Our Certificate of Incorporation also provides that, subject to any rights of holders of preferred stock to elect additional directors under specified circumstances, the number of directors will beis fixed exclusively pursuant to a resolution adopted by the board of directors, provided that, the board of directors shall consist of not fewer than five directors, nor more than eleven directors; provided, however, prior to the time when the Principal Stockholders beneficially own, collectively, less than %40% of the outstanding shares of our common stock, the board of directors shall not consist of more than nine directors. Our board of directors will initially haveis currently comprised of eight directors.
Authorized but Unissued or Undesignated Capital Stock. Our authorized capital stock consists of 1 billion shares of common stock and additional225 million shares of preferred stock beyond the 87,184,179 shares of Series A Preferred Stock currently outstanding.stock. A large quantity of authorized but unissued shares may deter potential takeover attempts because of the ability of our board of directors to authorize the issuance of some or all of these shares to a friendly party, or to the public, which would make it more difficult for a potential acquirer to obtain control of us. This possibility may encourage persons seeking to acquire control of us to negotiate first with our board of directors. The authorized but unissued stock may be issued by the board of directors in one or more transactions. In this regard, our Certificate of Incorporation grants the board of directors broad power to establish the rights and preferences of authorized and unissued preferred stock. The issuance of shares of preferred stock pursuant to the board of directors’ authority described above could decrease the amount of earnings and assets available for distribution to holders of common stock and adversely affect the rights and powers, including voting rights, of such holders and may have the effect of delaying, deferring or preventing a change of control. The preferred stock could also be used in connection with the issuance of a shareholder rights plan, sometimes referred to as a “poison pill.” Our board of directors is able to implement a shareholder rights plan without further action by our stockholders. The board of directors does not currently intend to seek stockholder approval prior to any issuance of preferred stock, unless otherwise required by law.
Action by Written Consent.Consent. Our Certificate of Incorporation provides that stockholder action can be taken only at an annual meeting or special meeting of stockholders and cannot be taken by written consent in lieu of a meeting once the Principal Stockholders cease to beneficially own, collectively, more than %40% of the outstanding shares of our common stock.
Special MeetingsofStockholders. Our Certificate of Incorporation provides that special meetings of our stockholders may be called only by our board of directors or the chairman of the board of directors; provided,
256
however, at any time when the Principal Stockholders beneficially owns,own, collectively, at least %40% of the outstanding shares of our common stock, special meetings of our stockholders may also be called by the board of directors, the chairman of the board of directors or the board of directors or the chairman of the board at the request of either the Silver Lake Funds or the TPG Funds. Our Bylaws prohibit the conduct of any business at a special meeting other than as specified in the notice for such meeting.
Advance Notice Procedures. Our Bylaws establish advance notice procedures with respect to stockholder proposals and the nomination of candidates for election as directors, other than nominations made by or at the direction of the board of directors. In order for any matter to be “properly brought” before a meeting, a stockholder will have to comply with advance notice requirements and provide us with certain information. Generally, to be timely, a stockholder’s notice must be received at our principal executive offices not earlier than the opening of business 120 days prior, and not later than the close of business 90 days before, the first anniversary date of the immediately preceding annual meeting of stockholders. Our Bylaws also specify requirements as to the form and content of a stockholder’s notice. Under our Bylaws, the board of directors may adopt by resolution the rules and regulations for the conduct of meetings. These advance notice provisions willdo not apply to the Silver Lake Funds or the TPG Funds so long as the Stockholders’ Agreement remains in effect. Except to the extent inconsistent with such rules and regulations adopted by the board of directors, the chairman of the meeting of stockholders shall have the right to adopt rules and regulations for the conduct of meetings, which may have the effect of precluding the conduct of certain business at a meeting if the rules and regulations are not followed. These provisions may also defer, delay or discourage a potential acquirer from conducting a solicitation of proxies to elect the acquirer’s own slate of directors or otherwise attempting to influence or obtain control of us.
Super Majority Approval Requirements.Requirements. Our Certificate of Incorporation and Bylaws provide that the board of directors is expressly authorized to adopt, make, alter, amend or repeal our Bylaws without a stockholder vote in any matter not inconsistent with the laws of the state of Delaware. For as long as the Principal Stockholders beneficially own, collectively, at least %40% of the outstanding shares of our common stock, any adoption, alteration, amendment or repeal of our Bylaws by our stockholders requires the affirmative vote of the holders of a majority of the voting power of our outstanding common stock. At any time when the Principal Stockholders beneficially own, collectively, less than %40% of the outstanding shares of our common stock, any adoption, alteration, amendment, or repeal of our Bylaws by our stockholders requires the affirmative vote of holders of at least %75% of the voting power of our outstanding common stock.
The DGCL provides generally that the affirmative vote of a majority of the outstanding shares then entitled to vote is required to amend a corporation’s certificate of incorporation, unless the certificate of incorporation requires a greater percentage. Our Certificate of Incorporation provides that at any time when the Principal Stockholders beneficially owns,own, collectively, less than %40% of the outstanding shares of our common stock, certain specified provisions in our Certificate of Incorporation, including those relating to actions by written consent of stockholders, calling of special meetings by stockholders, a classified board, and outlining the requirements for the number and removal of directors and amendment of the Certificate of Incorporation and Bylaws, may be amended only by a vote of at least %75% of the voting power of our outstanding common stock.
The combination of the classification of our board of directors, the lack of cumulative voting and the supermajority voting requirements will make it more difficult for our existing stockholders to replace our board of directors as well as for another party to obtain control of us by replacing our board of directors. Because our board of directors has the power to retain and discharge our officers, these provisions could also make it more difficult for existing stockholders or another party to effect a change in management.
These provisions may have the effect of deterring hostile takeovers or delaying or preventing changes in control of our management or of us, such as a merger, reorganization or tender offer. These provisions are
intended to enhance the likelihood of continued stability in the composition of our board of directors and its policies and to discourage certain types of transactions that may involve an actual or threatened acquisition of us.
257
These provisions are designed to reduce our vulnerability to an unsolicited acquisition proposal. The provisions are also intended to discourage certain tactics that may be used in proxy fights. However, such provisions could have the effect of discouraging others from making tender offers for our shares and, as a consequence, they may also inhibit fluctuations in the market price of our shares of common stock that could result from actual or rumored takeover attempts.
Removal of Directors. Until the point in time at which the Principal Stockholders no longer beneficially own shares representing, collectively, at least %40% of the outstanding shares of our common stock, any director may be removed from office at any time, with or without cause, by holders of a majority of the voting power of our outstanding common stock. Our Certificate of Incorporation provides that, after the point in time at which the Principal Stockholders no longer beneficially own shares representing, collectively, at least %40% of the outstanding shares of our common stock, our directors may be removed only for cause by the affirmative vote of at least %75% of the voting power of our outstanding common stock. This requirement of a supermajority vote to remove directors could enable a minority of our stockholders to prevent a change in the composition of our board.
Business Combinations with Interested Stockholders. We
Pursuant to our Certificate of Incorporation, we have opted out of the provisions of Section 203 of the DGCL, which regulates business combinations with “interested stockholders”.stockholders,” but only until the first date on which each of the Principal Stockholders and their affiliates no longer meets the requirements to be an “interested stockholder” as defined by Section 203 of the DGCL, but excluding for purposes thereof, clause (ii) of such definition of “interested stockholder.”
Corporate Opportunities
Our Certificate of Incorporation provides that we renounce, to the fullest extent permitted by applicable law, any interest or expectancy in the business opportunities of our Principal Stockholders and their affiliates. In addition our Certificate of Incorporation provides that the Principal Stockholders have no obligation to offer us or even communicate to us an opportunity to participate in business opportunities presented to such Principal Stockholder or its respective affiliates even if the opportunity is one that we might reasonably have pursued (and therefore may be free to compete with us in the same business or similar businesses of which we or our affiliates now engage or propose to engage) and that, to the fullest extent permitted by applicable law, neither the Principal Stockholders nor their respective affiliates will be liable to us or our stockholders for breach of any duty by reason of any such activities described immediately above. Stockholders will beare deemed to have notice of and consented to this provision of our Certificate of Incorporation.
Limitation of Liability and Indemnification of Officers and Directors
Our Certificate of Incorporation provides that no director shall be personally liable to us or any of our stockholders for monetary damages for breach of fiduciary duty as a director, except to the extent such exemption from liability or limitation thereof is not permitted under the DGCL. Our Bylaws provide that we will indemnify, to the fullest extent permitted by the DGCL, any person made or threatened to be made a party to any action or is involved in a proceeding by reason of the fact that the person is or was our director or officer, or servesour director or served asofficer who, while a director or officer, is or was serving at the request of anythe company as a director, officer, employee, agent or manager of another corporation, partnership, limited liability company, joint venture, trust or other enterprise at our request.ornon-profit entity, including service with respect to an employee benefit plan. Our Bylaws also provide that, subject to applicable law, the company may, by action of its board of directors, grant rights to indemnification and advancement of expenses to persons other than its directors and officers with such scope and effect as the board of directors may then determine. We intend to enterhave entered into separatecustomary indemnification agreements with each of our directors and officers. Eachthat provide them, in general, with customary indemnification agreement will provide, among other things, for indemnificationin connection with their service to the fullest extent permitted by law and underus or on our amended and restated certificate of incorporation and amended and restated bylaws against any and all expenses, judgments, fines, penalties and amounts paid in settlement of any claim.behalf.
258
Choice of Forum
Our Certificate of Incorporation provides that unless we consent to the selection of an alternate forum, the Court of Chancery of the State of Delaware is the sole and exclusive forum for any derivative action or proceeding brought on our behalf; any action asserting a breach of fiduciary duty; any action asserting a claim
against us arising pursuant to the DGCL, our Certificate of Incorporation or Bylaws; or any action asserting a claim against us that is governed by the internal affairs doctrine. Any person or entity purchasing or otherwise acquiring any interest in our shares of common stock shall be deemed to have notice of and consented to the forum provisions in our Certificate of Incorporation.
Transfer Agent and Registrar
The company expects to enter into an agreement with American Stock Transfer & Trust Company, LLC to act asis the transfer agent and registrar for our common stock.
Registration Rights
For a description of registration rights with respect to our common stock, see the information under the heading “Certain Relationships and Related Party Transactions—Registration Rights Agreement.”
Exchange
We intend to apply to have ourOur common stock is listed on the NASDAQ under the symbol “SABR”.“SABR.”
259
DESCRIPTION OF CERTAIN INDEBTEDNESS
The following descriptions of our indebtedness are qualified in their entirety by reference to their respective governing documents which are filed as exhibits to the registration statement of which this prospectus is a part.
Senior Secured Credit Facilities
On February 19, 2013, Sabre GLBL completed a refinancing of its former senior secured credit facilities pursuant to an amended and restated credit agreement (the “Amended and Restated Credit Agreement”). As part of this refinancing, it repaid or converted all outstanding term loans totaling $2,177 million and obtained new senior secured credit facilities consisting of (i) a term loan facility (the “Term B Facility”Loan B”) in an aggregate principal amount of $1,775 million; (ii) a term loan facility (the “Term C Facility”Loan C”) in an aggregate principal amount of $425 million; and (iii) amulti-currency revolving facility revolver (the “Revolving Facility”“Revolver”) in an aggregate principal amount of $352 million. The Revolving FacilityRevolver includes a letter of creditsub-facility in an aggregate principal amount equal to $350 million and a swingline loansub-facility in an aggregate principal amount of $75 million.
The Amended and Restated Credit Agreement also allows for the incurrence of incremental term loans and increases in the revolving commitments, subject to certain conditions and an aggregate cap of $500 million plus an additional amount to the extent that the Senior SecuredFirst-Lien Net Leverage Ratio (as defined in the Amended and Restated Credit Agreement) would not exceed 4.0:1.0. This ratio is calculated as senior securedfirst-lien debt (net of cash) to LTM Debt Covenant EBITDA (as defined in the Amended and Restated Credit Agreement).
On September 30, 2013, Sabre GLBL entered into an incremental amendment to provide for incremental term loans in an aggregate principal amount of $350 million (the “Incremental Term Loan Facility” and together with the Term Loan B, Facility, the Term Loan C Facility and the Revolving Facility,Revolver, the “Credit Facility”) under the Amended and Restated Credit Agreement. Sabre GLBL has used a portion, and intends to use the remainder of, the proceeds of the Incremental Term Loan Facility for general corporate purposes, including working capital andone-time costs associated with the Expedia SMA signedand sale of TPN, including the payment of travel suppliers for travel consumed that originated on August 22, 2013.our technology platforms, and for general corporate purposes.
On February 20, 2014, Sabre GLBL entered into (i) an amendment to the Amended and Restated Credit Agreement to, among other things, reduce the interest rate margins applicable to the Term Loan B Facility and to reduce the Eurocurrency rate floor and base rate floor, (ii) a revolver extension amendment to extend the maturity date of $317 million of the Revolving FacilityRevolver and (iii) an incremental revolving credit facility amendment to provide for an revolving commitment increase of $53 million under the extended portion of the revolving facility.Revolver.
In April 2014, we made partial prepayments totaling $296 million of our outstanding indebtedness under the Term Loan C portion of our senior secured credit facilities using proceeds from our initial public offering.
As of December 31, 2013, on an as adjusted basis after giving effect to this offering and the application of the net proceeds from this offering as described under “Use of Proceeds,” Sabre GLBL would haveSeptember 30, 2014, we had $$3,102 million of indebtedness outstanding under the Credit Facility in addition to $$345 million of availability under the Revolvingrevolving portion of our Credit Facility, after taking into account the availability reduction of $$60 million for letters of credit issued under the Revolving Facility.revolving portion. Of this indebtedness, none will be due on or before the end of 2014.2015.
The following is a summary of the material terms of the Amended and Restated Credit Agreement, as amended by the Incremental Term Loan Facility described above (the “Credit Agreement”). The description does not purport to be complete and is qualified in its entirety by reference to the provisions of the Credit Agreement.
Maturity.Maturity. The Term Loan B Facility and the Incremental Term Loan Facility both mature on February 19, 2019. The Term Loan C Facility matures on February 19, 2018, but is expected to be fully repaid through quarterly repayments ending on the last business day of December 2017. A portion of the commitments under the Revolving FacilityRevolver terminate
260
on February 19, 2018 with the remainder terminating on February 19, 2019 (subject to an accelerated maturity of November 19, 2018 if on November 19, 2018, the Term Loan B Facility (or permitted refinancings there
of)thereof) remains outstanding with a maturity date occurring less than one year after the maturity date of the extended portion of the Revolving Facility)Revolver).
Sabre GLBL must make quarterly repayments in an amount equal to 0.25% of the original aggregate principal amount outstanding under the Term Loan B Facility as of February 19, 2013 and 0.25% of the original aggregate principal amount outstanding under the Incremental Term Loan Facility as of September 30, 2013. The scheduled quarterly repayments are approximately $21 million annually and are due on the last business day of each March, June, September and December.
Sabre GLBL must also make quarterly repayments in an amount equal toAs a percentageresult of the aggregateApril 2014 prepayment of Term Loan C, quarterly principal amount outstanding under thepayments on Term Loan C Facility as of February 19, 2013. The applicable percentage is currently 3.75% and will increase to 4.375%, 5.625% and 7.5% on the last business day of March 2015, March 2016 and March 2017, respectively. The scheduled quarterly repayments are due on the last business day of each March, June, September and December, with the final such payment on the last business day of December 2017.no longer required.
Guarantee.Guarantee. Sabre GLBL’s obligations under the Credit Agreement are guaranteed on a senior secured basis by Sabre Holdings and each of Sabre GLBL’s existing and future wholly owned material domestic subsidiaries, other than certain excluded subsidiaries as set forth in the Credit Agreement (such guarantors, together with Sabre GLBL, the “Loan Parties”).
Security and Ranking.Ranking. Sabre GLBL’s obligations under the Credit Agreement are secured by a perfected first priority security interest in substantially all of each Loan Party’s tangible and intangible assets, including capital stock of Sabre GLBL and capital stock of domestic subsidiaries directly held by any Loan Party and 65% of the voting capital stock of material foreign subsidiaries directly held by a Loan Party. Thefirst-priority security interest in these assets are shared on a pari passu basis with the first priority security interest securing the 2019 Notes. For so long as the 2016 Notes (as defined below) remain outstanding, certain properties and capital stock and debt of subsidiaries that own such properties are excluded from the collateral securing Sabre GLBL’s obligations under the Credit Agreement.
Interest.The term loans made under the Term Loan B Facility bear interest at a rate equal to the adjusted Eurocurrency rate (subject to a 1.00% floor) plus 3.00% to 3.25% per annum or, at Sabre GLBL’s option, the base rate (subject to a 2.00% floor) plus 2.00% to 2.25% per annum, in each case based on the Senior SecuredFirst-Lien Net Leverage Ratio. The Credit Agreement also provides for an increase in such rates to maintain a difference of not more than 50 bps relative to future incremental term loans.
The term loans made under the Term Loan C Facility bear interest at a rate equal to the adjusted Eurocurrency rate (subject to a 1.00% floor) plus 2.50% to 3.00% per annum or, at Sabre GLBL’s option, the base rate (subject to a 2.00% floor) plus 1.50% to 2.00% per annum, in each case based on the Senior SecuredFirst-Lien Net Leverage Ratio.
The term loans made under the Incremental Term Loan Facility bear interest at a rate equal to the adjusted Eurocurrency rate (subject to a 1.00% floor) plus 3.00% to 3.50% per annum or, at Sabre GLBL’s option, the base rate (subject to a 2.00% floor) plus 2.00% to 2.50% per annum, in each case based on the Senior SecuredFirst-Lien Net Leverage Ratio. The Credit Agreement also provides for an increase in such rates to maintain a difference of not more than 50 bps relative to future incremental term loans.
The average effective interest rates on the term loans excluding the impact of our interest rate swaps for the fiscal years ended December 31, 2013, 2012 and 2011 were 6.21%, 5.65% and 2.72%, respectively. The average effective interest rate on the term loans including the impact of our interest rate swaps for the fiscal years ended December 31, 2013, 2012 and 2011 were 6.86%, 6.53% and 4.31%, respectively.
The revolving loans made under the Revolving FacilityRevolver bear interest at a rate equal to the adjusted Eurocurrency rate plus (x) 3.25% to 3.75% per annum for the portion allocable to thenon-extended portion of the Revolving FacilityRevolver and
261
(y) 3.00% to 2.75% per annum for the portion allocable to the extended portion of the Revolving FacilityRevolver or, at Sabre GLBL’s option (in the case of U.S.dollar-denominated revolving loans only), the base rate plus (x) 2.25% to 2.75% per annum for the portion allocable to thenon-extended portion of the Revolving FacilityRevolver and (y) 1.75% to 2.00% per annum for the portion allocable to the extended portion of the Revolving Facility,Revolver, in each case based on the Senior SecuredFirst-Lien Net Leverage Ratio. In addition, the Revolving FacilityRevolver is subject to a commitment fee payable quarterly in arrears ranging from 0.375% to 0.500% per annum, based on the Senior SecuredFirst-Lien Net Leverage Ratio, on the daily amount of the undrawn portion of the revolving commitments.
Prepayments.Sabre GLBL may, at its option, voluntarily prepay any amounts outstanding under the Credit Agreement in whole or in part without premium or penalty. However, if Sabre GLBL prepays or refinances the term loans under the Term Loan B Facility prior to August 20, 2014 withlong-term bank debt financing that is marketed or syndicated to banks and other institutional investors and is incurred for the primary purpose of reducing the effective yield, it will be required to pay a repricing premium of 1.0% of the principal amount that is refinanced.
In addition, Sabre GLBL is required to make mandatory prepayments under the Credit Agreement in certain situations, depending on the Senior SecuredFirst-Lien Net Leverage Ratio, including but not limited to: a percentage of excess cash flow; a percentage of proceeds from certain asset dispositions; the amount of indebtedness incurred other than permitted indebtedness; and the amount of borrowings under the Revolving FacilityRevolver exceeding the commitments under such facility.
Extensions, Refinancings and Incremental Credit Extension.Sabre GLBL may, without further approval from a majority of lenders, (a) extend the revolving commitments and term loans in one or more tranches, (b) refinance the revolving commitments and term loans with one or more new facilities with secured, subordinated or unsecured notes or loans, and (c) issue incremental credit in the form of incremental term loans, revolving commitment increases or additional secured, subordinated or unsecured notes or loans; in each case upon the satisfaction of certain conditions.
Covenants.The Credit Agreement contains certain affirmative covenants, including, among others, covenants to furnish the lenders with financial statements and other financial information, to provide the lenders notice of material events and information regarding collateral, to cause certain newly formed restricted subsidiaries to guarantee and pledge their assets as security for the Credit Agreement, to correct documentation with respect to the collateral, to provide the agent with mortgages to secure real property, as necessary, and to maintain title insurance policies with respect to any such mortgaged property, and to only redesignate restricted subsidiaries as unrestricted subsidiaries and vice versa in certain situations specified in the Credit Agreement.
The Credit Agreement contains negative covenants that restrict the ability of Sabre GLBL and its restricted subsidiaries, subject to certain exceptions, to incur additional indebtedness, grant liens on assets, undergo fundamental changes, make investments, sell assets, make acquisitions, make restricted payments, engage in transactions with its affiliates, amend or modify certain agreements and charter documents and change its fiscal year. The Credit Agreement also contains negative covenants that restrict the ability of Sabre Holdings to engage in any business or operations other than those incidental to ownership of Sabre and other activities specifically permitted under the Credit Agreement, including the performance of its obligations with respect to its existing indebtedness, any public offering of equity interests and certain financing activities. Sabre Holdings is also restricted from creating or acquiring any material direct subsidiaries other than Sabre GLBL or any holding company for Sabre GLBL.
In addition, Sabre GLBL is required to maintain a Senior SecuredFirst-Lien Net Leverage Ratio as of any fiscal quarter end if on such date the sum of (x) outstanding loans under the Revolving Facility,Revolver, (y) letters of
credit issued under the Revolving FacilityRevolver that guarantee debt for borrowed money, capital leases or obligations evidenced by notes or other instruments and (z) other letters of credit issued under the Revolving FacilityRevolver in excess of $50 million (but only to the extent of such excess), exceeds 20% of the principal amount of the Revolving Facility.Revolver. The applicable Senior SecuredFirst-Lien Net Leverage Ratio is 5.5:1.0, declining to 5.0:1.0, 4.5:1.0 and 4.0:1.0 on March 31, 2014, March 31, 2015 and March 31, 2016, respectively.
262
If certain material travel event disruptions set forth in the Credit Agreement occur, the foregoing requirement is suspended from the last date of the quarter in which such disruption occurs until the last date of the second succeeding quarter; however, during such suspension period, Sabre may be subject to additional restrictions on its ability to make restricted payments, acquisitions or investments.
As of December 31, 2013,September 30, 2014, Sabre GLBL and Sabre Holdings were in compliance with all covenants under the Credit Agreement.
8.5% Senior Secured Notes due 2019
On May 9, 2012, Sabre GLBL issued $400 million aggregate principal amount of senior secured notes due 2019 (“Initial 2019 Notes”), bearing interest at a rate of 8.5% per annum. On September 27, 2012, Sabre GLBL issued an additional $400 million aggregate principal amount of senior secured notes due 2019, under the same indenture and bearing interest at a rate of 8.5% per annum, to be treated as a single series with the Initial 2019 Notes and with substantially the same terms as the Initial 2019 Notes (together with the Initial 2019 Notes, the “2019 Notes”).
In May 2014, we exercised our contingent call option and prepaid $320 million, or 40%, of the outstanding principal on the 2019 Notes at the redemption price of 108.5% of the principal amount. As a result of the prepayment, we recognized a loss on extinguishment of $30 million, which included the $27 million redemption premium.
The following is a summary of the material terms of the 2019 Notes. This description does not purport to be complete and is qualified, in its entirety, by reference to the provisions of the indenture governing the 2019 Notes.
Maturity.The 2019 Notes mature on May 15, 2019.
Guarantee.Sabre GLBL’s obligations under the 2019 Notes are guaranteed on a senior secured basis by Sabre Holdings and each of Sabre GLBL’s existing and future wholly owned material domestic subsidiaries, other than certain excluded subsidiaries as set forth in the Credit Agreement.
Security. The 2019 Notes and related guarantees are secured, subject to permitted liens, by afirst-priority security interest in substantially all the assets of Sabre GLBL and each of the guarantors.
Interest. Interest on the 2019 Notes is payablesemi-annually on May 15 and November 15 of each year, commencing November 15, 2012.
Ranking.The 2019 Notes are general senior secured obligations of Sabre GLBL and each guarantor. They rank equally in right of payment to all existing and future unsubordinated indebtedness of Sabre GLBL and senior in right of payment to all existing and future subordinated indebtedness of Sabre GLBL They are effectively senior to all unsecured indebtedness of Sabre GLBL (including Sabre GLBL’s guarantee of the 2016 Notes), to the extent of the value of the collateral securing the 2019 Notes, which it sharespari passuwith the Credit Facility. They are structurally subordinated to all existing and future indebtedness, claims of holders of preferred stock and other liabilities of subsidiaries of the Sabre GLBL that do not guarantee the 2019 Notes.
Optional Redemption.The 2019 Notes are redeemable, in whole or in part, at any time and at Sabre GLBL’s option. TheBefore May 15, 2015, the applicable redemption price is equal to 100% of the principal amount of the 2019 Notes redeemed plus accrued and unpaid interest, if any, to the redemption date and a “make-whole”“make-whole” premium. On or after May 15, 2015, the 2019 Notes may be redeemed at the redemption prices set forth in the indenture plus accrued and unpaid interest, if any, to the redemption date. In addition, until May 15, 2015, Sabre GLBL may, at its option, redeem up to 40% of the aggregate principal amount of the 2019 Notes at a redemption
263
price equal to 108.5% of the principal amount of the 2019 Notes redeemed, plus accrued and unpaid interest to the redemption date to be paid from the net proceeds received from one or more Equity Offerings (as defined in the indenture governing the 2019 Notes), provided that (i) at least 50% of the aggregate principal amount of the 2019 Notes remains outstanding immediately after each such redemption and (ii) each such redemption occurs within 120 days of the date of closing of each such Equity Offering.
Covenants.The 2019 Notes include certainnon-financial covenants, including restrictions on incurring certain types of indebtedness, creation of liens on certain assets, making of certain investments, and payment of dividends. These covenants are similar in nature to those existing on the Credit Facility.
As of December 31, 2013,September 30, 2014, Sabre GLBL was in compliance with all covenants under the indenture for the 2019 Notes.
8.35% Senior Notes due 2016
On March 13, 2006, Sabre Holdings issued $400 million aggregate principal amount of senior unsecured notes due 2016 (“2016 Notes”), that initially bore interest at a rate of 6.35% per annum. On March 16, 2007, the interest rate on the 2016 Notes increased to 8.35% per annum, due to a credit rating decline resulting from the increased indebtedness associated with the sale of Sabre Holdings to private investors.
The following is a summary of the material terms of the 2016 Notes. This description does not purport to be complete and is qualified, in its entirety, by reference to the provisions of the indenture by and between Sabre Holdings and SunTrust Bank dated as of August 3,7, 2001, as supplemented by a second supplemental indenture dated as of March 13, 2006, governing the 2016 Notes.
Maturity.The 2016 Notes mature on March 15, 2016.
Guarantee.Sabre Holdings’ obligations under the 2016 Notes are guaranteed on a senior, unsecured basis by Sabre GLBL
Interest.Interest on the 2016 Notes is payablesemi-annually on March 15 and September 15 of each year, commencing September 15, 2006. Interest on the 2016 Notes may increase by up to two percentage points per annum to a maximum rate of 8.35% per annum in the event credit ratings of the 2016 Notes decline below certain thresholds after the occurrence of a change of control (as occurred in March 2007); however, upon subsequent improvements to the credit ratings, the interest rate on the 2016 Notes could decrease to a lower rate, with a floor of 6.35% per annum.
Ranking.The 2016 Notes are general unsecured obligations of Sabre Holdings. They rank equally in right of payment with all other existing and future unsecured indebtedness of Sabre Holdings. They are effectively subordinated to all existing and future secured indebtedness, including the Credit Agreement and the 2019 Notes, to the extent of the value of the assets securing such indebtedness. They are structurally subordinated to all existing and future indebtedness and other liabilities of Sabre Holdings’ subsidiaries, including Sabre GLBL’s obligations under the Credit Agreement and the 2019 Notes and its subsidiaries’ guarantees of obligations under the Credit Agreement, the Mortgage Facility (as defined below) and trade payables.
Optional Redemption.The 2016 Notes are redeemable, in whole or in part, at any time and at Sabre Holdings’ option. The applicable redemption price is the sum of (i) the greater of (x) 100% of the principal amount outstanding and (y) the sum of the remaining principal and interest payments, reduced to present value based on the adjusted treasury rate plus 30 bps, and (ii) accrued and unpaid interest as of the redemption date.
Covenants.The 2016 Notes include certainnon-financial covenants, including restrictions on incurring certain secured indebtedness without ratably securing obligations under the 2016 Notes, subject to certain exceptions; entering into certain sale and leaseback transactions; and entering into mergers, consolidations or a transfer of substantially all its assets.
264
As of December 31, 2013,September 30, 2014, Sabre Holdings was in compliance with all covenants under the indentures governing the 2016 Notes.
Mortgage Facility
On March 29, 2007, we purchased through Sabre Headquarters, LLC, our special purpose subsidiary, the buildings, land and furniture and fixtures located at our headquarters facilities in Southlake, Texas, which were
previously financed under a capital lease facility. The total purchase price of the assets was $104 million. The purchase was financed through $85 million borrowed under the mortgage facility (“Mortgage Facility”) and $19 million from cash on hand. The Mortgage Facility carries an interest rate of 5.7985% per annum. The following is a summary of the material terms of the Mortgage Facility. This description does not purport to be complete and is qualified, in its entirety, by reference to the provisions of the Mortgage Facility.
Maturity.The Mortgage Facility matures on March 1, 2017 and all unpaid principal will be due at that time. As of December 31, 2013, $84September 30, 2014, $82 million remained outstanding under the Mortgage Facility.
Interest.Payments on the Mortgage Facility are payable monthly on the first business day of each month. Payments made through April 1, 2012 were applied to accrued interest only. Subsequent to that date, a portion of payments is also applied to the principal balance of the note.
Security.The Mortgage Facility is secured by a perfected first priority security interest in the land and improvements located at our headquarters facilities in Southlake, Texas.
Covenants.Sabre Headquarters, LLC is subject to various customary affirmative covenants under the Mortgage Facility, including, but not limited to: payment of property taxes, granting of lender access to inspect the properties, cooperating in legal proceedings, obtaining insurance awards, providing financial statements, providing estoppel certificates, paying foreclosure costs, lender consent to any leases and lender consent to certain alterations and improvements. The Mortgage Facility also contains various customary negative covenants, including restrictions on incurring liens other than permitted liens, dissolving the borrower or changing its business, forgiving debt, changing its principal place of business and transferring the property.
As of December 31, 2013,September 30, 2014, Sabre Headquarters, LLC was in compliance with all covenants under the Mortgage Facility.
265
SHARES ELIGIBLE FOR FUTURE SALE
Prior to this offering, there has been no public market for our common stock, and we cannot assure you that a liquid trading market for our common stock will develop or be sustained after this offering. Future sales of substantial amounts of common stock, including shares issued upon exercise of options, in the public market, after this offering, or the anticipation of such sales or the perception that such sales may occur, could adversely affect the market price of our common stock prevailing from time to time and could impair our ability to raise capital through sales of our equity securities. No prediction can be made as to the effect, if any, future sales of shares, or the availability of shares for future sales, will have on the market price of our common stock prevailing from time to time.
The 45,080,000 shares of common stock sold in our initial public offering are freely tradable without restriction or further registration under the Securities Act, except for any such shares which may be held or acquired by an “affiliate” of ours, as that term is defined in Rule 144 of the Securities Act (“Rule 144”), which shares are subject to the volume limitations and other restrictions of Rule 144 described below.
Sales of Restricted Shares
Upon the closing of this offering, we will have outstanding an aggregate of shares of common stock, assuming shares are sold in the offering based on an assumed share price of $ (the midpoint of the price range on the cover of this prospectus). Of these shares, weWe expect all of the shares of common stock being sold in this offering will be freely tradable without restriction or further registration under the Securities Act, except for any such shares which may be held or acquired by an “affiliate” of ours, as that term is defined in Rule 144, of the Securities Act (“Rule 144”), which shares will be subject to the volume limitations and other restrictions of Rule 144 described below. The remaining shares of common stock held by our existing stockholders upon completionPrincipal Stockholders and current and former employees as of January 15, 2015, which are not offered in this offering, will beare “restricted securities,” as that phrase is defined in Rule 144, and may be resold only after registration under the Securities Act or pursuant to an exemption from such registration under Rule 144 or any other applicable exemption under the Securities Act. Subject to the lock-up agreements and the transfer restrictions in the Management Stockholders’ Agreement, applicable to certain stockholders, described below and the provisions of Rules 144 and 701, additional shares will be available for sale as set forth below.
Lock-up Agreements
We, each of our executive officers, directors Principal Stockholders and the selling stockholders,Selling Stockholders have agreed with the underwriters that, subject to certain exceptions described immediately below, for a period of 18090 days after the date of this prospectus, we and they will not offer, sell, contract to sell, pledge, grant any option to purchase, make any short sale, or otherwise dispose of any of the shares of common stock, or any options or warrants to purchase any shares of common stock or securities convertible into or exchangeable for shares of common stock, or that represent the right to receive shares of common stock, whether now owned or hereinafter acquired, or, in our case, cause a registration statement covering any common stock to be filed, without the prior written consent of Morgan Stanley Co. LLC and Goldman, Sachs & Co.
With respect to the company, these restrictions do not apply to (i) any shares of common stock or securities convertible or exercisable into, exchangeable for or that represent the right to receive shares of common stock, issued by the company, in each case pursuant to the company’s equity plans as described therein; (ii) the filing of a registration statement on FormS-8 (or equivalent form) with the SEC in connection with an employee stock compensation plan or agreement of the company, which plan or agreement is described herein; (iii) the issuance of shares of common stock or other securities (including securities convertible into shares of common stock) in connection with the acquisition by the company or any of its subsidiaries of the securities, businesses, properties or other assets of another person or entity or pursuant to any employee benefit plan assumed by the company in connection with any such acquisition; or (iv) the issuance of shares of common stock or other securities (including securities convertible into shares of common stock) in connection with joint ventures, commercial relationships or other strategic transactions; provided that, in the case of clauses (iii) and (iv), except forthe aggregate number of shares of common stock issued in all such acquisitions and transactions does not exceed 10% of the issued and outstanding common stock of the company issued and outstanding immediately following the completion of this offering and any recipients of such shares of commons stock shall deliver alock-up agreement to Goldman, Sachs & Co. consistent in scope as described above.
266
With respect to each of our executive officers, directors and Selling Stockholders the restrictions described above do not apply to transfers (i) as abona fide gift or gifts; (ii) to any trust for the direct or indirect benefit of such person or the immediate family of such person; (iii) by way of testate or intestate succession or by operation of law; (iv) to any members of the immediate family of such person; (v) to a corporation, partnership, or limited liability company or other entity that controls or is controlled by, or is under common control with, such person and/or by members of the immediate family of such person, or to any investment fund or other entity controlled or managed by the undersigned; (iv)(vi) if the shares of common stock are held by a corporation, partnership, limited liability company or other entity, to any of its stockholders, partners, members or affiliates or any of its affiliates’ directors, officers and employees; (v)(vii) to the company in connection with the “net” or “cashless” exercise of any options outstanding as of the date of thelock-up agreement and having an expiration date during the 180-day lock-up90-daylock-up period to acquire shares pursuant to the employee benefit plans described herein; (vi)(viii) to the company for the primary purposes of satisfying any tax or other governmental withholding obligation with respect to shares issued upon the exercise of an option or warrant (or upon the exchange of another security or securities) pursuant to a plan described in the prospectus, or issued under an employee equity or benefit plan described herein; (vii) in connection with the conversion, exchange or redemption of the outstanding preferred stock of the company into shares of common stock, cash or a combination thereof; (viii)(ix) pursuant to the underwriting agreement. Morgan Stanley Co. LLC and
Goldman, Sachs & Co. may, in theirits sole discretion, waive these restrictions or release any of these shares from these
restrictions at any time. See “Underwriting (Conflicts of Interest).“Underwriting.” Approximately shares or % of our outstanding shares of our common stock, or % of outstanding shares of our common stock if the underwriters’ option to purchase additional shares iffrom the Principal Stockholders is fully exercised, are subject to theselock-up agreements.
The 180-day90-day restricted period described in the preceding paragraphabove will be automatically extended (except as described in the immediately following sentence) if (i) during the last 17 days of the 180-day90-day restricted period we issue an earnings release or announce material news or a material event relating to us occurs or (ii) prior to the expiration of the 180-day90-day restricted period, we announce that we will release earnings results during the15-day period beginning on the day following the180-day90-day restricted period, in which case the restrictions described in the preceding paragraph will continue to apply until the expiration of the18-day period beginning on the issuance of the earnings release or the announcement of the material news or material event, unless Morgan Stanley Co. LLC and Goldman, Sachs & Co. provideprovides a written waiver of such extension. Morgan Stanley Co. LLC andThe extension described in the proviso to the immediately preceding sentence shall not apply beyond the time that the representatives can publish issuer-specific research reports regarding the Company pursuant to NASD Rule 2711(f)(4) as a result of the exemption pursuant to Rule 139 of the Securities Exchange Act of 1933, as amended, (except that, for purposes of this sentence, the condition specified in Rule 139(a)(1)(iii) shall be deemed to be satisfied) so long as the Company’s securities are then “actively-traded securities” as defined in Regulation M. Goldman, Sachs & Co. havehas no present intent or arrangement to release any of the securities subject to theselock-up agreements. The release of anylock-up is considered on a case by case basis. Factors in deciding whether to release shares may include the length of time before thelock-up expires, the number of shares involved, the reason for the requested release, market conditions, the trading price of our common stock, historical trading volumes of our common stock and whether the person seeking the release is an officer, director or affiliate of the company.
Management Stockholders’ Agreement Transfer Restrictions
Pursuant to the Management Stockholders’ Agreement, certain of our stockholders, which group of stockholders excludes our Principal Stockholders have agreed not to transfer, sell, assign, pledge, hypothecate or encumber any of the shares of common stockthen-currently owned by such stockholder (which can be waived by us at our option at any time), subject to certain limited exceptions, at any time prior to the termination of such Management Stockholders’ Agreement. The restrictions on transfer have been waived with effect from October 14, 2014 for certain of our former employees who are party to the Management Stockholders’ Agreement holding approximately 3 million shares of common stock and 2 million stock options and with effect from November 21, 2014 for certain of our current and former employees who are party to the Management Stockholders’ Agreement holding approximately 1.3 million shares of common stock and 4.2 million stock options. The Management Stockholders’ Agreement terminates if our common stock is registered and if at least 20% of our total outstanding common stock trades regularly in, on or through the facilities of a securities exchange and/orinter-dealer quotation system or any designated offshore securities market, which conditions are
267
expected to be met in connection with the completion of this offering, assuming the Selling Stockholders sell at least 5,415,142 shares. If the Management Stockholders’ Agreement does not terminate, the transfer restrictions contained therein would continue to be applicable except to the extent they are waived.
Rule 144
In general, under Rule 144, persons who became the beneficial owner of shares of our common stock prior to the completion of thisour initial public offering may not sell their shares until the earlier of (i) the expiration of asix-month holding period, if we have been subject to the reporting requirements of the Exchange Act and have filed all required reports for at least 90 days prior to the date of the sale, or (ii) aone-year holding period.
At the expiration of thesix-month holding period, a person who was not one of our affiliates at any time during the three months preceding a sale is entitled to sell an unlimited number of shares of our common stock provided current public information about us is available, and a person who was one of our affiliates at any time during the 90 days preceding a sale is entitled to sell within anythree-month period only a number of shares of common stock that does not exceed the greater of either of the following:
At the expiration of theone-year holding period, a person who was not one of our affiliates at any time during the 90 days preceding a sale would be entitled to sell an unlimited number of shares of our common stock without restriction. A person who was one of our affiliates at any time during the 90 days preceding a sale would remain subject to the volume restrictions described above.
All sales under Rule 144 are subject to the availability of current public information about us. In addition, sales under Rule 144 by affiliates or persons who have been affiliates within the previous 90 days are also subject to manner of sale provisions and notice requirements. Upon completion of the 180-day lock-up90-daylock-up period, subject to any extension of thelock-up period under circumstances described above, and the termination of the Management Stockholders’ Agreement, which is expected to occur assuming the Selling Stockholders sell at least 5,415,142 shares, approximately shares of our outstanding restricted securities will be eligible for sale under Rule 144 subject to limitations on sales by affiliates.
Rule 701
In general, under Rule 701, any of our employees, directors, officers, consultants or advisors who purchased shares from us in connection with a compensatory stock or option plan or other written agreement before the
effective date of our initial public offering, or who purchased shares from us after that date upon the exercise of options granted before that date, are eligible to resell such shares in reliance upon Rule 144 beginning 90 days after the date of this prospectus.our initial public offering. If such person is not an affiliate, the sale may be made without compliance with the holding period or current public information requirements contained in Rule 144. If such a person is an affiliate, the sale may be made under Rule 144 without compliance with itsone-year minimum holding period, but subject to the other Rule 144 restrictions.
Registration Rights
Pursuant to the amendment and restatement to our Stockholders’ Agreement,registration rights agreement, the Principal Stockholders and any other parties thereto from time to time will have in certain circumstances, certain customary demand, piggyback and shelf registration rights at any time following the expiration of the 180-day lock-up90 day lock up period described above. Upon the effectiveness of such a registration statement, all shares covered by such future registration statement will be freely transferable. If these registration rights are exercised and the Principal Stockholders sell a large number of shares of common stock, the market price of our common stock could decline. See “Certain Relationships and Related Party Transactions—Registration Rights and Stockholders’ Agreement” for a more detailed description of these registration rights.
268
MATERIAL U.S. FEDERAL INCOME AND ESTATE TAX CONSIDERATIONS
TONON-U.S. HOLDERS
The following discussion is a summary of material U.S. federal income and estate tax considerations generally applicable to the purchase, ownership and disposition of our common stock byNon-U.S. Holders. A “Non-U.S.“Non-U.S. Holder” means:
This discussion deals only with common stock held as capital assets byNon-U.S. Holders who purchased common stock in this offering. This discussion does not cover all aspects of U.S. federal income taxation that may be relevant to the purchase, ownership or disposition of our common stock by prospective investors in light of their specific facts and circumstances. In particular, this discussion does not address all of the tax considerations that may be relevant to persons in special tax situations, including persons that will hold shares of our common stock in connection with a U.S. trade or business or a U.S. permanent establishment, hold more than 5% of our common stock, certain former citizens or residents of the United States, are a “controlled foreign corporation,” a “passive foreign investment company” or a partnership or otherpass-through entity for U.S. federal income tax purposes, or are otherwise subject to special treatment under the Code, as amended. This section does not address any other U.S. federal tax considerations (such as gift tax) or any state, local ornon-U.S. tax considerations. You should consult your own tax advisors about the tax consequences of the purchase, ownership and disposition of our common stock in light of your own particular circumstances, including the tax consequences under state, local, foreign and other tax laws and the possible effects of any changes in applicable tax laws.
Furthermore, this summary is based on the tax laws of the United States, including the Code, existing and proposed regulations, administrative and judicial interpretations, all as currently in effect. Such authorities may be repealed, revoked, modified or subject to differing interpretations, possibly on a retroactive basis, so as to result in U.S. federal income tax or estate tax consequences different from those discussed below.
Dividends
As discussed in “Dividend Policy,” we do not currently expect to continue to pay dividends. In the event thatquarterly cash dividends on our common stock. When we do make a distribution of cash or property with respect to our common stock, any such distributions generally will constitute dividends for U.S. federal income tax purposes to the extent of our current or accumulated earnings and profits, as determined under U.S. federal income tax principles. If a distribution exceeds our current and accumulated earnings and profits, the excess will be treated as atax-free return of your investment, up to your tax basis in the common stock. Any remaining excess will be treated as capital gain, subject to the tax treatment described below in “—Sale, Exchange or Other Taxable Disposition of Common Stock.”
Dividends paid to you generally will be subject to U.S. federal withholding tax at a 30% rate, or such lower rate as may be specified by an applicable tax treaty. Even if you are eligible for a lower treaty rate, we and other payers will generally be required to withhold at a 30% rate (rather than the lower treaty rate) on dividend payments to you, unless:
269
If you are eligible for a reduced rate of U.S. federal withholding tax pursuant to an applicable income tax treaty or otherwise, you may obtain a refund of any excess amounts withheld by timely filing an appropriate claim for refund with the IRS. Investors are encouraged to consult with their own tax advisors regarding the possible implications of these withholding requirements on their investment in the common stock.
Dividends that are “effectively connected” with your conduct of a trade or business within the United States will be exempt from the withholding tax described above and instead will be subject to U.S. federal income tax on a net income basis. We and other payers generally are not required to withhold tax from “effectively connected” dividends, provided that you have furnished to us or another payer a valid IRS FormW-8ECI (or an acceptable substitute form) upon which you represent, under penalties of perjury, that you are anon-U.S. person and that the dividends are effectively connected with your conduct of a trade or business within the United States and are includible in your gross income. If you are a corporatenon-U.S. holder, “effectively connected” dividends that you receive may, under certain circumstances, be subject to an additional branch profits tax at a 30% rate, or at a lower rate if you are eligible for the benefits of an income tax treaty that provides for a lower rate.
Sale, Exchange or Other Taxable Disposition of Common Stock
You generally will not be subject to U.S. federal income tax with respect to gain recognized on a sale, exchange or other taxable disposition of shares of our common stock unless:
In the case of the sale or disposition of common stock on or after January 1, 2017, you may be subject to a 30% withholding tax on the gross proceeds of the sale or disposition unless the requirements described in the last bullet point under “—Dividends” above are satisfied. Investors are encouraged to consult with their own tax advisors regarding the possible implications of these withholding requirements on their investment in the common stock and the potential for a refund or credit in the case of any withholding tax.
We have not been, are not and do not anticipate becoming a United States real property holding corporation for U.S. federal income tax purposes.
Information Reporting and Backup Withholding
We must report annually to the IRS and to eachNon-U.S. holder the amount of dividends paid to such holder and the tax withheld with respect to such dividends, regardless of whether withholding was required.
270
Copies of the information returns reporting such dividends and withholding may also be made available to the tax authorities in the country in which you reside under the provisions of an applicable income tax treaty.
You may be subject to backup withholding for dividends paid to you unless you certify under penalty of perjury that you are aNon-U.S. holder or otherwise establish an exemption. Any amounts withheld under the backup withholding rules may be allowed as a refund or a credit against your U.S. federal income tax liability provided the required information is timely furnished to the IRS.
U.S. Federal Estate Tax
Shares of our common stock held (or deemed held) by an individualNon-U.S. Holder at the time of his or her death will be included in suchNon-U.S. Holder’s gross estate for U.S. federal estate tax purposes, unless an applicable estate tax treaty provides otherwise.
271
UNDERWRITING (CONFLICTS OF INTEREST)
Under the terms and subject to the conditions contained in an underwriting agreement dated the date of this prospectus, Morgan Stanley & Co. LLC, Goldman, Sachs & Co., and Merrill Lynch, Pierce, Fenner & Smith Incorporated and Deutsche Bank Securities Inc. are acting as the representatives of the underwriters and as jointbook-running managers. The underwriters have severally agreed to purchase, and we and the selling stockholdersSelling Stockholders have agreed to sell to them, severally the number of shares indicated below:
Name | Number of | |
| ||
Goldman, Sachs & Co. | ||
Merrill Lynch, Pierce, Fenner & Smith Incorporated | ||
| ||
| ||
| ||
| ||
| ||
| ||
| ||
| ||
| ||
| ||
Total | ||
The underwriters and the representatives are collectively referred to as the “underwriters” and the “representatives,” respectively. The underwriters are offering the shares of common stock subject to their acceptance of the shares from us and the selling stockholdersSelling Stockholders and subject to prior sale. The underwriting agreement provides that the obligations of the several underwriters to pay for and accept delivery of the shares of common stock offered by this prospectus are subject to the approval of certain legal matters by their counsel and to certain other conditions. The underwriters are obligated to take and pay for all of the shares of common stock offered by this prospectus if any such shares are taken. However, the underwriters are not required to take or pay for the shares covered by the underwriters’ option to purchase additional shares described below. The offering of the shares by the underwriters is subject to receipt and acceptance and subject to the underwriters’ right to reject any order in whole or in part.
The underwriters initially propose to offer part of the shares of common stock directly to the public at the public offering price listed on the cover page of this prospectus and part to certain dealers at a price that represents a concession not in excess of $ a share under the public offering price. After the initial offering of the shares of common stock, the offering price and other selling terms may from time to time be varied by the representatives, including in connection with sales of unsold allotments of common stock or subsequent sales of common stock purchased by the representatives in stabilizing and related transactions.
The underwriters have an option to buy up to an additional shares from us and an additional shares from the selling stockholdersPrincipal Stockholders to cover sales by the underwriters of a greater number of shares than the total number set forth in the table above. They may exercise that option for 30 days from the date of this prospectus. To the extent the option is exercised, each underwriter will become obligated, subject to certain conditions, to purchase about the same percentage of the additional shares of common stock as the number listed next to the underwriter’s name in the preceding table bears to the total number of shares of common stock listed next to the names of all underwriters in the preceding table.
Commissions and expenses
The following tables showtable shows the per share and total underwriting discounts and commissions to be paid to the underwriters by us and the selling stockholdersSelling Stockholders at the public offering price listed on the cover page of this prospectus, less underwriting discounts and commissions. Such amounts are shown assuming both no exercise and full exercise of the underwriters’ option to purchase additional shares.
Paid by usshares from the Principal Stockholders.
| No Exercise | Full Exercise | |||||||
Per Share | $ | $ | ||||||
Total | $ | $ | ||||||
Paid by the Selling Stockholders
| ||||||||
| ||||||||
272
We will bear the costs, other than underwriting discounts and commissions and transfer taxes, associated with this offering in accordance with the Management Stockholders’ Agreement and the Registration Rights Agreement, as applicable. The estimated offering expenses of this offering are approximately $ million, which includes legal, accounting and printing costs and various other fees associated with the registration of the common stock to be sold pursuant to this prospectus. In addition, we have agreed to reimburse the underwriters for certain expenses of approximately $ .
Discretionary Sales
The underwriters have informed us that they do not intend sales to discretionary accounts to exceed 5% of the total number of shares of common stock offered by them.
Lock-Up Agreements
We, intend to apply to listeach of our common stock on the NASDAQ under the symbol “SABR”.
Prior to the offering, there has been no public market for the shares. The initial public offering price has been negotiated among the companyexecutive officers, directors and the representatives. Among the factors to be considered in determining the initial public offering price of the shares, in addition to prevailing market conditions, will be the company’s historical performance, estimates of the business potential and earnings prospects of the company, an assessment of the company’s management and the consideration of the above factors in relation to market valuation of companies in related businesses.
We, the selling stockholders, including the PrincipalSelling Stockholders and all of our directors and executive officers have agreed that, without the prior written consent of Morgan Stanley & Co. LLC and Goldman, Sachs & Co. on behalf of the underwriters, we and they will not, during the period ending 18090 days after the date of this prospectus:
whether any such transaction described in the first two bullet points above is to be settled by delivery of common stock or such other securities, in cash or otherwise.
TheWith respect to the company, the restrictions described in the immediately preceding paragraphparagraphs do not apply to:
provided that, in the case of the last two bullet points above, the aggregate number of shares of common stock issued in all such acquisitions and transactions does not exceed 10% of the issued and outstanding common stock of the company issued and outstanding immediately following the completion of this offering and any recipients of such shares of commons stock shall deliver alock-up agreement to Goldman, Sachs & Co. consistent in scope and length as described in the preceding paragraphs above.
273
With respect to each of our executive officers, directors and the Selling Stockholders, the restrictions described in the preceding paragraphs do not apply to transfers:
| • | as abona fide gift or gifts; |
The 180-day90-day restricted period described in the preceding paragraphs will be extended if:
in which case the restrictions described in the preceding paragraphs will continue to apply until the expiration of the18-day period beginning on the issuance of the earnings release or the occurrence of the material news or material event. The extension described in the proviso to the immediately preceding sentence shall not apply beyond the time that the representatives can publish issuer-specific research reports regarding the Company pursuant to NASD Rule 2711(f)(4) as a result of the exemption pursuant to Rule 139 of the Securities Exchange Act of 1933, as amended, (except that, for purposes of this sentence, the condition specified in Rule 139(a)(1)(iii) shall be deemed to be satisfied) so long as the Company’s securities are then “actively-traded securities” as defined in Regulation M.
Morgan Stanley & Co. LLC and Goldman, Sachs & Co., in theirits sole discretion, may release the common stock and other securities subject to thelock-up agreements described above in whole or in part at any time with or without notice.
Stabilization, Short Positions and Penalty Bids
In order to facilitate this offering of the common stock, the underwriters may engage in transactions that stabilize, maintain or otherwise affect the price of the common stock. Specifically, the underwriters may sell more shares than they are obligated to purchase under the underwriting agreement, creating a short position. A short sale is covered if the short position is no greater than the number of shares available for purchase by the underwriters under their option to purchase additional shares.shares from the Principal Stockholders. The underwriters can close out a covered short sale by exercising their option to purchase additional shares or purchasing shares in the open market. In determining the source of shares to close out a covered short sale, the underwriters will consider, among other things, the open market price of shares compared to the price available under their option to purchase additional shares. The underwriters may also sell shares in excess of their option to purchase additional shares, creating a naked short position. The underwriters must close out any naked short position by purchasing shares in the open market. A
naked short position is more likely to be created if the underwriters are
274
concerned that there may be downward pressure on the price of the common stock in the open market after pricing that could adversely affect investors who purchase in this offering. In addition, to stabilize the price of common stock, the underwriters may bid for, and purchase, shares of common stock in the open market. Finally, the underwriting syndicate may reclaim selling concessions allowed to an underwriter or a dealer for distributing the common stock in this offering, if the syndicate repurchases previously distributed common stock to cover syndicate short positions or to stabilize the price of the common stock. These activities may raise or maintain the market price of the common stock above independent market levels or prevent or retard a decline in the market price of the common stock. The underwriters are not required to engage in these activities and may end any of these activities at any time.
The underwriters may also impose a penalty bid. This occurs when a particular underwriter repays to the underwriters a portion of the underwriting discount received by it because the representatives have repurchased shares sold by or for the account of such underwriter in stabilizing or short covering transactions.
Indemnification
We, the Selling Stockholders and the several underwriters have agreed to indemnify each other against certain liabilities, including liabilities under the Securities Act.
Relationships
The underwriters and their respective affiliates arefull-service financial institutions engaged in various activities, which may include securities trading, commercial and investment banking, financial advisory, investment management, investment research, principal investment, hedging, financing and brokerage activities.
From time to time, certain of the underwriters and/or their respective affiliates may provide investment banking services to us. In the ordinary course of their various business activities, the underwriters and their respective affiliates may make or hold a broad array of investments and actively trade debt and equity securities (or related derivative securities) and financial instruments (including bank loans) for their own account and for the accounts of their customers, and such investment and securities activities may involve securities and/or instruments of Sabre, including the 2016 Notes and the 2019 Notes. The underwriters and their respective affiliates may also make investment recommendations and/or publish or express independent research views in respect of such securities or instruments and may at any time hold, or recommend to clients that they acquire, long and/or short positions in such securities and instruments. TheCertain of the underwriters and their affiliates have in the past engaged, currently engage and may in the future engage, in transactions with and perform services for, including commercial banking, financial advisory and investment banking services, us and our affiliates in the ordinary course of business for which they have received or will receive customary fees and expenses. We also have, and expect to continue to have, economic hedges, cash management relationships and/or other swaps and hedges in place with certain of the underwriters or their affiliates on customary economic terms.
Morgan Stanley & Co. LLC, Goldman, Sachs & Co., and Merrill Lynch, Pierce, Fenner & Smith Incorporated Deutsche Bank Securities Inc., Natixis Securities Americas LLC and Mizuho Securities USA Inc. were initial purchasers in connection with our May 2012 and September 2012 offerings of the 2019 Notes.
Affiliates of Morgan Stanley & Co. LLC, Goldman, Sachs & Co., and Merrill Lynch, Pierce, Fenner & Smith Incorporated Deutsche Bank Securities Inc., Natixis Securities Americas LLC and Mizuho Securities USA Inc. are lenders and/or agents under our senior secured credit facilities.
We, the selling stockholdersGoldman, Sachs & Co. and the severalMerrill Lynch, Pierce, Fenner & Smith Incorporated acted as underwriters have agreed to indemnify each other against certain liabilities, including liabilities under the Securities Act.in connection with our initial public offering in April 2014.
Electronic Distribution
A prospectus in electronic format may be made available on websites maintained by one or more underwriters, or selling group members, if any, participating in this offering. The representatives may agree to allocate a number of shares of common stock to underwriters for sale to their online brokerage account holders. Internet distributions will be allocated by the representatives to underwriters that may make Internet distributions on the same basis as other allocations.
Conflicts of Interest
Certain affiliates of Sanford C. Bernstein & Co., LLC, an underwriter of this offering, hold a portion of our 2019 Notes. It is expected that these affiliates of Sanford C. Bernstein & Co., LLC will receive more than 5% of the net proceeds of the offering. See “Use of Proceeds.” Also, affiliates of TPG Capital BD, LLC, an underwriter of this offering, will own in excess of 10% of our issued and outstanding common stock following this offering. In addition, the TPG Funds are affiliates of TPG Capital BD, LLC and, as holders of a portion of our Series A Preferred Stock, we estimate they will receive more than 5% of the net proceeds of this offering, based upon an assumed initial public offering price of $ per share, the midpoint of the range set forth on the cover page of this prospectus.275
As a result of the foregoing relationships, each of Sanford C. Bernstein & Co., LLC and TPG Capital BD, LLC is deemed to have a “conflict of interest” within the meaning of FINRA Rule 5121. Accordingly, this offering will be made in compliance with the applicable provisions of FINRA Rule 5121. Pursuant to that rule, the appointment of a qualified independent underwriter is not necessary in connection with this offering. In accordance with FINRA Rule 5121(c), no sales of the shares will be made to any discretionary account over which Sanford C. Bernstein & Co., LLC or TPG Capital BD, LLC exercises discretion without the prior specific written approval of the account holder. See “Underwriting (Conflicts of Interest).”
Selling Restrictions
European Economic Area
In relation to each Member State of the European Economic Area which has implemented the Prospectus Directive (each referred to as a “Relevant Member State”), each underwriter has represented and agreed that with effect from and including the date on which the Prospectus Directive is implemented in that Relevant Member State (the “Relevant Implementation Date”), it has not made and will not make an offer of shares to the public which are the subject of the offering contemplated by this prospectus in that Relevant Member State, except that an offer to the public in that Relevant Member State of any shares may be made at any time with effect from and including the Relevant Implementation Date under the following exemptions under the Prospectus Directive, if they have been implemented in that Relevant Member State:
(a) to any legal entity which is a qualified investor as defined in the Prospectus Directive.
(b) to fewer than 100 or, if the Relevant Member State has implemented the relevant provision of the 2010 PD Amending Directive, 150, natural or legal persons (other than qualified investors as defined in the Prospectus Directive), as permitted under the Prospectus Directive subject to obtaining the prior consent of the relevant Dealer or Dealers nominated by the Issuer for any such offer; or
(c) in any other circumstances falling within Article 3(2) of the Prospectus Directive,
provided that no such offer of shares shall require the company or any underwriter to publish a prospectus pursuant to Article 3 of the Prospectus Directive.
For the purposes of this provision, the expression an “offer of shares to the public” in relation to any shares in any Relevant Member State means the communication in any form and by any means of sufficient information on the terms of the offer and the shares to be offered so as to enable an investor to decide to purchase or subscribe for the shares, as the same may be varied in that Member State by any measure implementing the Prospectus Directive in that Member State, the expression “Prospectus Directive” means Directive 2003/71/EC (and amendments thereto, including the 2010 PD Amending Directive, to the extent implemented in the Relevant Member State), and includes any relevant implementing measure in the Relevant Member State and the expression “2010 PD Amending Directive” means Directive 2010/73/EU.
This EEA selling restriction is in addition to any other selling restrictions set out in this prospectus.
United Kingdom
Each underwriter has represented, warranted and agreed that:
(a) it has only communicated or caused to be communicated and will only communicate or cause to be communicated an invitation or inducement to engage in investment activity (within the meaning of Section 21 of the FSMA) received by it in connection with the issue or sale of the shares in circumstances in which Section 21(1) of the FSMA does not apply to the Issuer or the Guarantors; and
(b) it has complied and will comply with all applicable provisions of the FSMA with respect to anything done by it in relation to the shares in, from or otherwise involving the United Kingdom.
France
Neither this prospectus nor any other offering material relating to the shares described in this prospectus has been submitted to the clearance procedures of the Autorité des Marchés Financiers or of the competent authority of another member state of the European Economic Area and notified to the Autorité des Marchés Financiers and to the company. The shares have not been offered or sold and will not be offered or sold, directly or indirectly, to the public in France. Neither this prospectus nor any other offering material relating to the shares has been or will be:
276
Such offers, sales and distributions have been and will only be made in France:
The shares may be resold directly or indirectly, only in compliance with articlesL.411-1,L.411-2,L.412-1 andL.621-8 throughL.621-8-3 of the French Code monétaire et financier and applicable regulations thereunder.
Hong Kong
The shares may not be offered or sold in Hong Kong by means of any document other than (i) in circumstances which do not constitute an offer to the public within the meaning of the Companies Ordinance (Cap.32, Laws of Hong Kong), or (ii) to “professional investors” within the meaning of the Securities and Futures Ordinance (Cap.571, Laws of Hong Kong) and any rules made thereunder, or (iii) in other circumstances which do not result in the document being a “prospectus” within the meaning of the Companies Ordinance (Cap.32, Laws of Hong Kong), and no advertisement, invitation or document relating to the shares may be issued or may be in the possession of any person for the purpose of issue (in each case whether in Hong Kong or elsewhere), which is directed at, or the contents of which are likely to be accessed or read by, the public in Hong Kong (except if permitted to do so under the laws of Hong Kong) other than with respect to shares which are or
are intended to be disposed of only to persons outside Hong Kong or only to “professional investors” within the meaning of the Securities and Futures Ordinance (Cap. 571, Laws of Hong Kong) and any rules made thereunder.
Singapore
This prospectus has not been registered as a prospectus with the Monetary Authority of Singapore. Accordingly, this prospectus and any other document or material in connection with the offer or sale, or invitation for subscription or purchase, of the shares may not be circulated or distributed, nor may the shares be offered or sold, or be made the subject of an invitation for subscription or purchase, whether directly or indirectly, to persons in Singapore other than (i) to an institutional investor under Section 274 of the Securities and Futures Act, Chapter 289 of Singapore (the “SFA”), (ii) to a relevant person pursuant to Section 275(1), or any person pursuant to Section 275(1A), and in accordance with the conditions, specified in Section 275 of the SFA or (iii) otherwise pursuant to, and in accordance with the conditions of, any other applicable provision of the SFA.
Where the shares are subscribed or purchased under Section 275 by a relevant person which is: (a) a corporation (which is not an accredited investor (as defined in Section 4A of the SFA)) the sole business of which is to hold investments and the entire share capital of which is owned by one or more individuals, each of whom is an accredited investor; or (b) a trust (where the trustee is not an accredited investor) whose sole purpose is to hold investments and each beneficiary is an accredited investor, shares, debentures and units of shares and debentures of that corporation or the beneficiaries’ rights and interest in that trust shall not be transferable for 6 months after that corporation or that trust has acquired the shares under Section 275 except: (1) to an institutional investor under Section 274 of the SFA or to a relevant person, or any person pursuant to Section 275(1A), and in accordance with the conditions, specified in Section 275 of the SFA; (2) where no consideration is given for the transfer; or (3) by operation of law.
277
Japan
The shares offered in this prospectus have not been and will not be registered under the Financial Instruments and Exchange Act of Japan (the “Financial Instruments and Exchange Act”). Each underwriter has agreed that the shares have not been offered or sold and will not be offered or sold, directly or indirectly, in Japan or to or for the account of any resident of Japan, (which term as used herein means any person resident in Japan, including any corporation or other entity organized under the laws of Japan) or to others forre-offering or resale, directly or indirectly, in Japan or to a resident of Japan, except (i) pursuant to an exemption from the registration requirements of the Financial Instruments and Exchange Act and (ii) in compliance with any other applicable requirements of the Financial Instruments and Exchange Act and any other applicable laws, regulations and ministerial guidelines of Japan.
Switzerland
This document as well as any other offering or marketing material relating to the shares which are the subject of the offering contemplated by this prospectus has been prepared without regard to the disclosure standards for issuance prospectuses under art. 652a or art. 1156 of the Swiss Code of Obligations. The shares will not be listed on the SIX Swiss Exchange and, therefore, the documents relating to the shares, including, but not limited to, this document, do not claim to comply with the disclosure standards of the listing rules of SIX Swiss Exchange and corresponding prospectus schemes annexed to the listing rules of the SIX Swiss Exchange.
Neither this document nor any other offering or marketing material relating to the shares which are the subject of the offering contemplated by this prospectus will be filed with or approved by any Swiss regulatory authority. In particular, this document will not be filed with, and the offer of shares will not be supervised by, the Swiss Financial Market Supervisory Authority FINMA, and the offer of shares has not been and will not be authorized under the Swiss Federal Act on Collective Investment Schemes (“CISA”). The investor protection afforded to acquirers of interests in collective investment schemes under the CISA does not extend to acquirers of shares.
The shares are being offered in Switzerland by way of a private placement, i.e., to a small number of selected investors only, without any public offer and only to investors who do not purchase the shares with the intention to distribute them to the public. The investors will be individually approached by the company from time to time.
This document as well as any other material relating to the shares is personal and confidential and do not constitute an offer to any other person. This document may only be used by those investors to whom it has been handed out in connection with the offering described herein and may neither directly nor indirectly be distributed or made available to other persons without express consent of the company. It may not be used in connection with any other offer and shall in particular not be copied and/or distributed to the public in (or from) Switzerland.
Dubai International Financial Centre
This document relates to an Exempt Offer in accordance with the Offered Securities Rules of the Dubai Financial Services Authority. This document is intended for distribution only to persons of a type specified in those rules. It must not be delivered to, or relied on by, any other person. The Dubai Financial Services Authority has no responsibility for reviewing or verifying any documents in connection with Exempt Offers. The Dubai Financial Services Authority has not approved this document nor taken steps to verify the information set out in it, and has no responsibility for it. The shares which are the subject of the offering contemplated by this prospectus may be illiquid and/or subject to restrictions on their resale.
Prospective purchasers of the shares offered should conduct their own due diligence on the shares. If you do not understand the contents of this document you should consult an authorised financial adviser.
278
Australia
No placement document, prospectus, product disclosure statement or other disclosure document has been lodged with the Australian Securities and Investments Commission (“ASIC”), in relation to the offering. This prospectus does not constitute a prospectus, product disclosure statement or other disclosure document under the Corporations Act 2001 (the “Corporations Act”), and does not purport to include the information required for a prospectus, product disclosure statement or other disclosure document under the Corporations Act.
Any offer in Australia of the shares may only be made to persons (the “Exempt Investors”) who are “sophisticated investors” (within the meaning of section 708(8) of the Corporations Act), “professional investors” (within the meaning of section 708(11) of the Corporations Act) or otherwise pursuant to one or more exemptions contained in section 708 of the Corporations Act so that it is lawful to offer the shares without disclosure to investors under Chapter 6D of the Corporations Act.
The shares applied for by Exempt Investors in Australia must not be offered for sale in Australia in the period of 12 months after the date of allotment under the offering, except in circumstances where disclosure to investors under Chapter 6D of the Corporations Act would not be required pursuant to an exemption under section 708 of the Corporations Act or otherwise or where the offer is pursuant to a disclosure document which complies with Chapter 6D of the Corporations Act. Any person acquiring shares must observe such Australianon-sale restrictions.
This prospectus contains general information only and does not take account of the investment objectives, financial situation or particular needs of any particular person. It does not contain any securities recommendations or financial product advice. Before making an investment decision, investors need to consider whether the information in this prospectus is appropriate to their needs, objectives and circumstances, and, if necessary, seek expert advice on those matters.
People’s Republic of China
The shares may not be offered or sold directly or indirectly in the People’s Republic of China (the “PRC”) (which, for such purposes, does not include the Hong Kong or Macau Special Administrative Regions or Taiwan), except pursuant to applicable laws and regulations of the PRC. Neither this prospectus nor any material or information contained herein relating to the shares, which have not been and will not be submitted to or approved/verified by or registered with the China Securities Regulatory Commission (the “CSRC”), or other relevant governmental authorities in the PRC pursuant to relevant laws and regulations, may be supplied to the public in the PRC or used in connection with any offer for the subscription or sale of the shares in the PRC. The material or information contained herein relating to the shares does not constitute an offer to sell or the solicitation of an offer to buy any securities in the PRC. The shares may only be offered or sold to the PRC investors that are authorized to engage in the purchase of securities of the type being offered or sold. PRC investors are responsible for obtaining all relevant government regulatory approvals/licenses, verification and/or registrations themselves, including, but not limited to, any which may be required from the CSRC, the State Administration of Foreign Exchange and/or the China Banking Regulatory Commission, and complying with all relevant PRC regulations, including, but not limited to, all relevant foreign exchange regulations and/or foreign investment regulations.
279
Cleary Gottlieb SteenYoung Conaway Stargatt & HamiltonTaylor, LLP will pass on the legality of the shares of common stock to be issuedsold in this offering. Certain legal matters in connection with this offering will be passed upon for us by Cleary Gottlieb Steen & Hamilton LLP. Certain legal matters in connection with this offering will be passed upon for the underwriters by Ropes & Gray LLP.
280
The consolidated financial statements and schedule of Sabre Corporation at December 31, 2013 and 2012, and for each of the three years in the period ended December 31, 2013 appearing in this prospectus and registration statement have been audited by Ernst & Young LLP, independent registered public accounting firm, as set forth in their report thereon appearing elsewhere herein, and are included in reliance upon such report given on the authority of such firm as experts in accounting and auditing.
The combined balance sheets of PRISM Group, Inc. and Affiliate as of December 31, 2011 and 2010, and the related combined statements of income, changes in stockholder’s/member’s equity, and cash flows for the years then ended included in this prospectus, have been so included in reliance on the report of REDW LLC, independent auditors, given on the authority of that firm as experts in auditing and accounting.
281
WHERE YOU CAN FIND MORE INFORMATION
We have filed with the SEC a registration statement on FormS-1 under the Securities Act, with respect to our common stock offered by this prospectus. This prospectus, which forms part of the registration statement, does not contain all of the information set forth in the registration statement and the exhibits to the registration statement. Some items are omitted in accordance with the rules and regulations of the SEC. For further information about us and our common stock, we refer you to the registration statement and the exhibits to the registration statement filed as part of the registration statement. You may read and copy the registration statement, including the exhibits to the registration statement, at the SEC’s Public Reference Room at 100 F Street, N.E., Washington, D.C. 20549. You can also request copies of those documents, upon payment of a duplicating fee, by writing to the SEC. For further information on the operation of the Public Reference Room, please call the SEC at1-800-SEC-0330. In addition, the SEC maintains an Internet site at www.sec.gov, from which you can electronically access the registration statement, including the exhibits to the registration statement.
As a result of this offering, we will becomeWe are subject to the full informational requirements of the Exchange Act. We have fulfilled and will continue to fulfill our obligations with respect to such requirements by filing periodic reports and other information with the SEC. We intend to furnish our stockholders with annual reports containing financial statements that have been examined and reported on, with an opinion expressed by an independent registered public accounting firm. We also maintain an Internet site at www.sabre.com. The information contained on our website or that can be accessed through our website will not be deemed to be incorporated into this prospectus or the registration statement of which this prospectus forms a part, and investors should not rely on any such information in deciding whether to purchase our common stock.
282
SABRE CORPORATION
Audited Consolidated Financial Statements
| SABRE CORPORATION | ||||
| F-2 | ||||
| F-3 | ||||
Consolidated Balance Sheets as of September 30, 2014 and December 31, 2013 | F-4 | |||
Consolidated Statements of Cash Flows for the Nine Months Ended September 30, 2014 and 2013 | F-5 | |||
| F-6 | ||||
| Audited Consolidated Financial Statements | ||||
Consolidated Statements of Operations for the years ended December 31, 2013, 2012 and 2011 | ||||
Consolidated Statements of Comprehensive Loss for the years ended December 31, 2013, 2012 and 2011 | ||||
Consolidated Balance Sheets | ||||
Consolidated Statements of Cash Flows for the years ended December 31, 2013, 2012, and 2011 | ||||
PRISM GROUP, INC. AND AFFILIATE
Audited Combined Financial Statements
| PRISM GROUP, INC. AND AFFILIATE | ||||
| Audited Combined Financial Statements | ||||
Combined Balance Sheets | ||||
Combined Statements of Income for the years ended December 31, 2011 and 2010 | ||||
Combined Statements of Cash Flows for the years ended December 31, 2011 and 2010 | ||||
F-1
PART I – FINANCIAL INFORMATION
| ITEM 1. | FINANCIAL STATEMENTS |
SABRE CORPORATION
CONSOLIDATED STATEMENTS OF OPERATIONS
(In thousands, except per share amounts)
(Unaudited)
| Three Months Ended September 30, | Nine Months Ended September 30, | |||||||||||||||
| 2014 | 2013 | 2014 | 2013 | |||||||||||||
Revenue | $ | 756,303 | $ | 775,823 | $ | 2,229,286 | $ | 2,303,399 | ||||||||
Cost of revenue(1) (2) | 465,689 | 474,090 | 1,399,919 | 1,423,242 | ||||||||||||
Selling, general and administrative(2) | 169,183 | 208,033 | 575,413 | 620,226 | ||||||||||||
Impairment | — | 2,837 | — | 138,435 | ||||||||||||
Restructuring charges | 4,735 | 15,889 | 2,325 | 15,889 | ||||||||||||
|
|
|
|
|
|
|
| |||||||||
Operating income | 116,696 | 74,974 | 251,629 | 105,607 | ||||||||||||
Other income (expense): | ||||||||||||||||
Interest expense, net | (50,153 | ) | (63,454 | ) | (167,332 | ) | (209,653 | ) | ||||||||
Loss on extinguishment of debt | — | — | (33,538 | ) | (12,181 | ) | ||||||||||
Joint venture equity income | 2,867 | 1,841 | 9,367 | 7,873 | ||||||||||||
Other, net | 565 | (2,429 | ) | 760 | (1,099 | ) | ||||||||||
|
|
|
|
|
|
|
| |||||||||
Total other expense, net | (46,721 | ) | (64,042 | ) | (190,743 | ) | (215,060 | ) | ||||||||
|
|
|
|
|
|
|
| |||||||||
Income (loss) from continuing operations before income taxes | 69,975 | 10,932 | 60,886 | (109,453 | ) | |||||||||||
Provision (benefit) for income taxes | 30,956 | 7,861 | 27,878 | (5,229 | ) | |||||||||||
|
|
|
|
|
|
|
| |||||||||
Income (loss) from continuing operations | 39,019 | 3,071 | 33,008 | (104,224 | ) | |||||||||||
(Loss) income from discontinued operations, net of tax | (1,736 | ) | 3,015 | (8,017 | ) | (20,895 | ) | |||||||||
|
|
|
|
|
|
|
| |||||||||
Net income (loss) | 37,283 | 6,086 | 24,991 | (125,119 | ) | |||||||||||
Net income attributable to noncontrolling interests | 720 | 714 | 2,168 | 2,135 | ||||||||||||
|
|
|
|
|
|
|
| |||||||||
Net income (loss) attributable to Sabre Corporation | 36,563 | 5,372 | 22,823 | (127,254 | ) | |||||||||||
Preferred stock dividends | — | 9,242 | 11,381 | 27,219 | ||||||||||||
|
|
|
|
|
|
|
| |||||||||
Net income (loss) attributable to common shareholders | $ | 36,563 | $ | (3,870 | ) | $ | 11,442 | $ | (154,473 | ) | ||||||
|
|
|
|
|
|
|
| |||||||||
Basic net income (loss) per share attributable to common shareholders: | ||||||||||||||||
Income (loss) from continuing operations | $ | 0.14 | $ | (0.04 | ) | $ | 0.08 | $ | (0.75 | ) | ||||||
(Loss) income from discontinued operations | (0.01 | ) | 0.02 | (0.03 | ) | (0.12 | ) | |||||||||
|
|
|
|
|
|
|
| |||||||||
Net income (loss) per common share | $ | 0.14 | $ | (0.02 | ) | $ | 0.05 | $ | (0.87 | ) | ||||||
|
|
|
|
|
|
|
| |||||||||
Diluted net income (loss) per share attributable to common shareholders: | ||||||||||||||||
Income (loss) from continuing operations | $ | 0.14 | $ | (0.04 | ) | $ | 0.08 | $ | (0.75 | ) | ||||||
(Loss) income from discontinued operations | (0.01 | ) | 0.02 | (0.03 | ) | (0.12 | ) | |||||||||
|
|
|
|
|
|
|
| |||||||||
Net income (loss) per common share | $ | 0.13 | $ | (0.02 | ) | $ | 0.05 | $ | (0.87 | )�� | ||||||
|
|
|
|
|
|
|
| |||||||||
Weighted average common shares outstanding: | ||||||||||||||||
Basic | 264,768 | 178,140 | 229,405 | 178,051 | ||||||||||||
Diluted | 273,330 | 178,140 | 237,994 | 178,051 | ||||||||||||
Dividends per common share | $ | 0.09 | $ | — | $ | 0.09 | $ | — | ||||||||
(1) Includes amortization of upfront incentive consideration | $ | 10,388 | $ | 9,385 | $ | 33,177 | $ | 28,736 | ||||||||
(2) Includes stock-based compensation as follows: | ||||||||||||||||
Cost of revenue | $ | 2,172 | $ | 544 | $ | 5,618 | $ | 816 | ||||||||
Selling, general and administrative | 3,300 | 2,142 | 16,816 | 4,630 | ||||||||||||
See Notes to Consolidated Financial Statements.
F-2
SABRE CORPORATION
CONSOLIDATED STATEMENTS OF COMPREHENSIVE INCOME (LOSS)
(In thousands)
(Unaudited)
| Three Months Ended September 30, | Nine Months Ended September 30, | |||||||||||||||
| 2014 | 2013 | 2014 | 2013 | |||||||||||||
Net income (loss) | $ | 37,283 | $ | 6,086 | $ | 24,991 | $ | (125,119 | ) | |||||||
|
|
|
|
|
|
|
| |||||||||
Other comprehensive (loss) income, net of tax: | ||||||||||||||||
Foreign currency translation adjustments (“CTA”): | ||||||||||||||||
Foreign CTA gains (losses), net of tax | 1,522 | (612 | ) | 3,711 | (276 | ) | ||||||||||
Reclassification adjustment for realized losses on foreign CTA, net of tax | — | — | — | 8,162 | ||||||||||||
|
|
|
|
|
|
|
| |||||||||
Net change in foreign CTA gains (losses), net of tax | 1,522 | (612 | ) | 3,711 | 7,886 | |||||||||||
|
|
|
|
|
|
|
| |||||||||
Retirement-related benefit plans: | ||||||||||||||||
Amortization of prior service credits, net of taxes of $129 and $1,041 for the three months ended September 30, 2014 and 2013, respectively, and $386 and $3,740 for the nine months ended September 30, 2014 and 2013, respectively | (229 | ) | (2,405 | ) | (686 | ) | (6,596 | ) | ||||||||
Amortization of actuarial losses, net of taxes of $(454) and $(414) for the three months ended September 30, 2014 and 2013, respectively, and $(1,299) and $(1,482) for the nine months ended September 30, 2014 and 2013, respectively | 803 | 955 | 2,292 | 2,615 | ||||||||||||
|
|
|
|
|
|
|
| |||||||||
Total retirement-related benefit plans | 574 | (1,450 | ) | 1,606 | (3,981 | ) | ||||||||||
|
|
|
|
|
|
|
| |||||||||
Derivatives: | ||||||||||||||||
Unrealized gains (losses), net of taxes of $1,096 and $(1,311) for the three months ended September 30, 2014 and 2013, respectively, and $666 and $(484) for the nine months ended September 30, 2014 and 2013, respectively | (3,799 | ) | 2,752 | (3,181 | ) | 564 | ||||||||||
Reclassification adjustment for realized losses, net of taxes of $(1,057) and $(1,615) for the three months ended September 30, 2014 and 2013, respectively, and $(2,607) and $(4,079) for the nine months ended September 30, 2014 and 2013, respectively | 1,684 | 2,703 | 2,747 | 6,312 | ||||||||||||
|
|
|
|
|
|
|
| |||||||||
Net change in unrealized (losses) gains on derivatives, net of tax | (2,115 | ) | 5,455 | (434 | ) | 6,876 | ||||||||||
|
|
|
|
|
|
|
| |||||||||
Share of other comprehensive income of joint venture | — | — | 3,420 | — | ||||||||||||
|
|
|
|
|
|
|
| |||||||||
Other comprehensive (loss) income | (19 | ) | 3,393 | 8,303 | 10,781 | |||||||||||
|
|
|
|
|
|
|
| |||||||||
Comprehensive income (loss) | 37,264 | 9,479 | 33,294 | (114,338 | ) | |||||||||||
Less: Comprehensive income attributable to noncontrolling interests | (720 | ) | (714 | ) | (2,168 | ) | (2,135 | ) | ||||||||
|
|
|
|
|
|
|
| |||||||||
Comprehensive income (loss) attributable to Sabre Corporation | $ | 36,544 | $ | 8,765 | $ | 31,126 | $ | (116,473 | ) | |||||||
|
|
|
|
|
|
|
| |||||||||
See Notes to Consolidated Financial Statements.
F-3
SABRE CORPORATION
(In thousands, except share amounts)
(Unaudited)
| September 30, 2014 | December 31, 2013 | |||||||
Assets | ||||||||
Current assets | ||||||||
Cash and cash equivalents | $ | 157,747 | $ | 308,236 | ||||
Restricted cash | 755 | 2,359 | ||||||
Accounts receivable, net | 466,753 | 434,288 | ||||||
Prepaid expenses and other current assets | 56,315 | 53,378 | ||||||
Current deferred income taxes | 39,184 | 41,431 | ||||||
Other receivables, net | 28,902 | 29,511 | ||||||
Assets of discontinued operations | 9,364 | 13,624 | ||||||
|
|
|
| |||||
Total current assets | 759,020 | 882,827 | ||||||
Property and equipment, net of accumulated depreciation of $824,146 and $722,916 | 526,722 | 498,523 | ||||||
Investments in joint ventures | 142,639 | 132,082 | ||||||
Goodwill | 2,152,590 | 2,138,175 | ||||||
Trademarks and brandnames, net of accumulated amortization of $554,286 and $545,597 | 307,445 | 323,035 | ||||||
Other intangible assets, net of accumulated amortization of $956,606 and $889,904 | 261,581 | 311,523 | ||||||
Other assets, net | 522,397 | 469,543 | ||||||
|
|
|
| |||||
Total assets | $ | 4,672,394 | $ | 4,755,708 | ||||
|
|
|
| |||||
Liabilities, temporary equity and stockholders’ equity (deficit) | ||||||||
Current liabilities | ||||||||
Accounts payable | $ | 129,555 | $ | 111,386 | ||||
Travel supplier liabilities and related deferred revenue | 107,409 | 213,504 | ||||||
Accrued compensation and related benefits | 91,700 | 117,689 | ||||||
Accrued subscriber incentives | 168,019 | 142,767 | ||||||
Deferred revenues | 176,990 | 136,380 | ||||||
Litigation settlement liability and related deferred revenue | 75,409 | 38,920 | ||||||
Other accrued liabilities | 210,196 | 267,867 | ||||||
Current portion of debt | 22,418 | 86,117 | ||||||
Liabilities of discontinued operations | 23,881 | 41,788 | ||||||
|
|
|
| |||||
Total current liabilities | 1,005,577 | 1,156,418 | ||||||
Deferred income taxes | 8,601 | 10,253 | ||||||
Other noncurrent liabilities | 523,728 | 263,182 | ||||||
Long-term debt | 3,065,440 | 3,643,548 | ||||||
Commitments and contingencies (Note 14) | ||||||||
Temporary equity | ||||||||
Series A Redeemable Preferred Stock: $0.01 par value; 225,000,000 authorized shares; no shares issued and outstanding at September 30, 2014; 87,229,703 shares issued and 87,184,179 outstanding at December 31, 2013 | — | 634,843 | ||||||
Stockholders’ equity (deficit) | ||||||||
Common Stock: $0.01 par value; 450,000,000 authorized shares; 265,224,958 and 178,633,409 shares issued, 264,787,572 and 178,491,568 outstanding at September 30, 2014 and December 31, 2013, respectively | 2,652 | 1,786 | ||||||
Additional paid-in capital | 1,911,172 | 880,619 | ||||||
Treasury Stock, at cost, 437,386 shares at September 30, 2014 | (5,297 | ) | — | |||||
Retained deficit | (1,797,944 | ) | (1,785,554 | ) | ||||
Accumulated other comprehensive loss | (41,592 | ) | (49,895 | ) | ||||
Noncontrolling interest | 57 | 508 | ||||||
|
|
|
| |||||
Total stockholders’ equity (deficit) | 69,048 | (952,536 | ) | |||||
|
|
|
| |||||
Total liabilities, temporary equity and stockholders’ equity (deficit) | $ | 4,672,394 | $ | 4,755,708 | ||||
|
|
|
| |||||
See Notes to Consolidated Financial Statements.
F-4
SABRE CORPORATION
CONSOLIDATED STATEMENTS OF CASH FLOWS
(In thousands)
(Unaudited)
| Nine Months Ended September 30, | ||||||||
| 2014 | 2013 | |||||||
Operating Activities | ||||||||
Net income (loss) | $ | 24,991 | $ | (125,119 | ) | |||
Adjustments to reconcile net income (loss) to cash provided by operating activities: | ||||||||
Depreciation and amortization | 230,461 | 230,277 | ||||||
Impairment | — | 138,435 | ||||||
Restructuring charges | 3,247 | 4,089 | ||||||
Amortization of upfront incentive consideration | 33,177 | 28,736 | ||||||
Litigation related (gains) charges | (6,132 | ) | 6,117 | |||||
Stock-based compensation expense | 22,434 | 5,446 | ||||||
Allowance for doubtful accounts | 6,371 | 7,583 | ||||||
Deferred income taxes | 6,232 | (19,357 | ) | |||||
Joint venture equity income | (9,367 | ) | (7,873 | ) | ||||
Dividends received from joint venture investments | 2,205 | — | ||||||
Amortization of debt issuance costs | 4,779 | 5,323 | ||||||
Debt modification costs | 3,290 | 14,003 | ||||||
Loss on extinguishment of debt | 33,538 | 12,181 | ||||||
Other | 3,658 | (10,210 | ) | |||||
Loss from discontinued operations | 8,017 | 20,895 | ||||||
Changes in operating assets and liabilities: | ||||||||
Accounts and other receivables | (58,435 | ) | (46,394 | ) | ||||
Prepaid expenses and other current assets | (10,612 | ) | 7,314 | |||||
Capitalized implementation costs | (27,602 | ) | (48,686 | ) | ||||
Upfront incentive consideration | (31,633 | ) | (26,634 | ) | ||||
Other assets | (58,120 | ) | (63,389 | ) | ||||
Accrued compensation and related benefits | (23,104 | ) | 7,361 | |||||
Accounts payable and other accrued liabilities | (31,516 | ) | 109,778 | |||||
Pension and other postretirement benefits | (4,200 | ) | 2,186 | |||||
|
|
|
| |||||
Cash provided by operating activities | 121,679 | 252,062 | ||||||
Investing Activities | ||||||||
Additions to property and equipment | (160,385 | ) | (168,744 | ) | ||||
Acquisition, net of cash acquired | (31,799 | ) | (30,476 | ) | ||||
Proceeds from sale of business | — | 10,000 | ||||||
Other investing activities | 235 | — | ||||||
|
|
|
| |||||
Cash used in investing activities | (191,949 | ) | (189,220 | ) | ||||
Financing Activities | ||||||||
Proceeds of borrowings from lenders | 148,307 | 2,540,063 | ||||||
Payments on borrowings from lenders | (797,028 | ) | (2,239,538 | ) | ||||
Proceeds from issuance of common stock in initial public offering, net | 672,137 | — | ||||||
Prepayment fee and debt modification and issuance costs | (30,490 | ) | (19,116 | ) | ||||
Acquisition-related contingent consideration paid | (27,000 | ) | — | |||||
Dividends paid to common shareholders | (23,831 | ) | — | |||||
Other financing activities | (1,384 | ) | (6,692 | ) | ||||
|
|
|
| |||||
Cash (used in) provided by financing activities | (59,289 | ) | 274,717 | |||||
Cash Flows from Discontinued Operations | ||||||||
Net cash (used in) provided by operating activities | (25,424 | ) | 6,352 | |||||
Net cash provided by investing activities | 3,760 | 20,502 | ||||||
|
|
|
| |||||
Net cash (used in) provided by discontinued operations | (21,664 | ) | 26,854 | |||||
Effect of exchange rate changes on cash and cash equivalents | 734 | 480 | ||||||
(Decrease) increase in cash and cash equivalents | (150,489 | ) | 364,893 | |||||
Cash and cash equivalents at beginning of period | 308,236 | 126,695 | ||||||
|
|
|
| |||||
Cash and cash equivalents at end of period | $ | 157,747 | $ | 491,588 | ||||
|
|
|
| |||||
See Notes to Consolidated Financial Statements.
F-5
SABRE CORPORATION
NOTES TO CONSOLIDATED FINANCIAL STATEMENTS
(Unaudited)
1. General Information
Sabre Corporation is a Delaware corporation formed in December 2006. On March 30, 2007, Sabre Corporation acquired Sabre Holdings Corporation (“Sabre Holdings”). Sabre Holdings is the sole subsidiary of Sabre Corporation. Sabre GLBL Inc. is the principal operating subsidiary and sole direct subsidiary of Sabre Holdings. Sabre GLBL Inc. or its direct or indirect subsidiaries conduct all of our businesses. In these consolidated financial statements, references to “Sabre”, the “Company”, “we”, “our”, “ours” and “us” refer to Sabre Corporation and its consolidated subsidiaries unless otherwise stated or the context otherwise requires.
We are a leading technology solutions provider to the global travel and tourism industry. We operate through three business segments: (i) Travel Network, our global travel marketplace for travel suppliers and travel buyers, (ii) Airline and Hospitality Solutions, an extensive suite of travel industry leading software solutions primarily for airlines and hotel properties, and (iii) Travelocity, our portfolio of online consumer travel e-commerce businesses through which we provide travel content and booking functionality primarily for leisure travelers.
Initial Public Offering and Share-based Compensation—On April 23, 2014, we closed our initial public offering of our common stock in which we sold 39,200,000 shares, and on April 25, 2014, the underwriters exercised in full their overallotment option which resulted in the sale of an additional 5,880,000 shares of our common stock. Our shares of common stock were sold at an initial public offering price of $16.00 per share, which generated $672 million of net proceeds from the offering after deducting underwriting discounts and commissions and offering expenses. Upon closing of our initial public offering, we redeemed all of our outstanding shares of Series A Cumulative Preferred Stock in exchange for 40,343,529 shares of our common stock.
We used the net proceeds from this offering to repay (i) $296 million aggregate principal amount of our term loans and (ii) $320 million aggregate principal amount of our senior secured notes due in 2019 at a redemption price of 108.5% of the principal amount, which represents the maximum amount of the contingent call option exercisable in the event of an equity offering (see Note 8, Debt). The term loan prepayment occurred in two installments: the first prepayment of $207 million occurred on April 24, 2014 and the second prepayment of $90 million occurred on April 29, 2014. The redemption of $320 million of our senior secured notes due in 2019 occurred on May 7, 2014. We also used the net proceeds from our offering to pay the $27 million redemption premium and $13 million in accrued but unpaid interest on the senior secured notes due in 2019. We used the remaining portion of the net proceeds from our offering to pay a $21 million fee, in the aggregate, to TPG Global, LLC (“TPG”) and Silver Lake Management Company (“Silver Lake”) pursuant to a management services agreement (the “MSA”), which was thereafter terminated.
On March 20, 2014, our board of directors adopted the Sabre Corporation 2014 Omnibus Incentive Compensation Plan (the “2014 Omnibus Plan”), which permits the grant of cash and equity and equity-based incentive awards. Our employees and the non-employee members of our board of directors and those of our subsidiaries are eligible to receive awards under the 2014 Omnibus Plan. On the effective date of our initial public offering, under the 2014 Omnibus Plan, we granted time-based options to purchase 1,541,627 shares of common stock at an exercise price of $16.68 per share and a total of 2,298,478 shares of performance-based and time-based restricted stock units.
In April 2014, we cancelled all outstanding stock-based awards issued under the Travelocity.com LLC Stock Option Grant Agreements, the Travelocity Equity 2012 Plan and the Sovereign Holdings, Inc. Amended and Restated Stock Incentive Plan for Travelocity’s CEO—Stock Settled SARs with Respect to Travelocity
F-6
Equity, terminated all related plans and award agreements, and recorded stock compensation expense of $7 million, representing the remaining unrecognized compensation expense of the awards at the cancellation date.
Basis of Presentation—The accompanying unaudited consolidated financial statements have been prepared in accordance with U.S. generally accepted accounting principles (“GAAP”) for interim financial information. Accordingly, they do not include all of the information and footnotes required by GAAP for complete financial statements. In the opinion of management, these financial statements contain all adjustments, consisting of normal recurring accruals, necessary to present fairly the financial position, results of operations and cash flows for the periods indicated. Operating results for the three and nine months ended September 30, 2014 are not necessarily indicative of results that may be expected for any other interim period or for the year ended December 31, 2014. The accompanying interim financial statements should be read in conjunction with our annual audited financial statements and related notes thereto for the year ended December 31, 2013 included in our prospectus filed with the SEC pursuant to Rule 424(b) under the Securities Act on April 17, 2014.
We consolidate all of our majority-owned subsidiaries and companies over which we exercise control through majority voting rights. No entities are currently consolidated due to control through operating agreements, financing agreements, or as the primary beneficiary of a variable interest entity.
The consolidated financial statements include our accounts after elimination of all significant intercompany balances and transactions.
Use of Estimates—The preparation of these interim financial statements in conformity with GAAP requires that certain amounts be recorded based on estimates and assumptions made by management. Actual results could differ from these estimates and assumptions. Our accounting policies, which include significant estimates and assumptions, include, among other things, estimation of the collectability of accounts receivable, amounts for future cancellations of bookings processed through the Sabre global distribution system (“GDS”), revenue recognition for software development, determination of the fair value of assets and liabilities acquired in a business combination, determination of the fair value of derivatives, the evaluation of the recoverability of the carrying value of intangible assets and goodwill, assumptions utilized in the determination of pension and other postretirement benefit liabilities, assumptions made in the calculation of restructuring liabilities and the evaluation of uncertainties surrounding the calculation of our tax assets and liabilities. These policies are discussed in our annual audited consolidated financial statements and related notes thereto for the year ended December 31, 2013 included in our prospectus filed with the SEC pursuant to Rule 424(b) under the Securities Act on April 17, 2014.
2. Acquisitions
On September 11, 2014, we acquired certain assets and liabilities of Genares Worldwide Reservation Services, Ltd. (“Genares”), a provider of central reservation systems, revenue management and marketing solutions to more than 2,300 independent and chain hotel properties worldwide. Under the transaction, we acquired the assets of Genares for cash consideration of $32 million. The operating results of Genares have been included in our consolidated statement of operations and results of operations of our Airline and Hospitality Solutions segment from the date of the acquisition. The assets acquired and liabilities assumed have been recorded in our consolidated balance sheet based on preliminary fair value estimates. The final allocation of the purchase price will be based on a complete evaluation of the assets acquired and liabilities assumed. Accordingly, the information presented in our consolidated balance sheet and elsewhere in this report may differ from the final purchase price allocation. The preliminary allocation of the purchase price includes $14 million to goodwill, which is deductible for tax purposes, $17 million to other intangible assets and $1 million to net assets acquired. The other intangible assets consist primarily of $14 million of acquired customer relationships with a useful life of ten years and $2 million of non-compete agreements with a useful life of five years.
F-7
3. Discontinued Operations and Dispositions
We have disposed of or discontinued certain businesses or operations in order to further align Travelocity with its core strategies of focusing on product and customer experiences in profitable locations, and displaying and promoting highly relevant content. We believe these decisions will allow us to reduce our technological complexity by reducing the number of supported business platforms and operations.
Discontinued Operations
The results for the following Travelocity operations are presented in (loss) income from discontinued operations in our consolidated statements of operations:
Holiday Autos—On June 25, 2013, we sold certain assets of our Holiday Autos operations to a third party and, in November 2013, completed the closing of the remainder of the Holiday Autos operations such that it represented a discontinued operation. Holiday Autos was a leisure car hire broker that offered pre-paid, low-cost car rentals in various markets, largely in Europe. In the second quarter of 2013, we recognized an $11 million loss, net of tax, on the sale of Holiday Autos. The loss includes the write-off of $39 million of goodwill and intangible assets attributed to Holiday Autos, with the goodwill portion determined based on Holiday Autos’ relative fair value to the Travelocity Europe reporting unit. The sale provides for us to receive two earn-out payments measured during the 12 month periods ending September 30, 2014 and 2015, totaling up to $12 million, based upon the purchaser exceeding certain booking thresholds as defined in the sale agreement. We recognized $6 million relative to these earn-out provisions and the resulting receivable is reviewed for recovery on a periodic basis. Any earn-out payments received in excess of the $6 million recognized will be recorded as a gain in the period received.
Zuji—In December 2012, we entered into an agreement to sell our shares of Zuji Properties A.V.V. and Zuji Pte Ltd along with its operating subsidiaries (collectively “Zuji”), a Travelocity Asia Pacific-based Online Travel Agency (“OTA”). At that time, the assets were recorded at the lower of the carrying amount or fair value less cost to sell. We recorded an estimated loss on the sale of approximately $14 million, net of tax during 2012. We sold Zuji on March 21, 2013 and recorded an additional $11 million loss on sale, net of tax during the three months ended March 31, 2013. We have continuing cash flows from Zuji due to reciprocal agreements between us and Zuji to provide hotel reservations services over a three year period. The agreements include commissions to be paid to the respective party based on qualifying bookings. The continuing cash flows associated with Zuji were not material to our results of operations for the nine months ended September 30, 2014.
F-8
Results of Discontinued Operations—We have reported the results of operations of Holiday Autos and Zuji as discontinued operations. As part of the Zuji sale agreement, we had retained the rights to receive refunds of certain disputed income taxes outstanding as of the sale date. During the third quarter of 2014, we received a $2 million tax refund associated with the operations of Zuji prior to its disposal which is included in (benefit) provision for income taxes of discontinued operations. The following table summarizes the results of our discontinued operations (in thousands):
| Three Months Ended September 30, | Nine Months Ended September 30, | |||||||||||||||
| 2014 | 2013 | 2014 | 2013 | |||||||||||||
Revenue | $ | — | $ | 12,806 | $ | — | $ | 48,549 | ||||||||
Cost of revenue | 146 | 2,882 | 1,257 | 14,668 | ||||||||||||
Selling, general and administrative | 680 | 469 | 3,023 | 31,030 | ||||||||||||
|
|
|
|
|
|
|
| |||||||||
Operating (loss) income | (826 | ) | 9,455 | (4,280 | ) | 2,851 | ||||||||||
Other income (expense): | ||||||||||||||||
Interest expense, net | (2,559 | ) | 3,613 | (5,917 | ) | 1,493 | ||||||||||
Loss on sale of businesses, net | — | — | — | (27,708 | ) | |||||||||||
Other, net | (392 | ) | (4,283 | ) | (2,044 | ) | (880 | ) | ||||||||
|
|
|
|
|
|
|
| |||||||||
Total other expense, net | (2,951 | ) | (670 | ) | (7,961 | ) | (27,095 | ) | ||||||||
|
|
|
|
|
|
|
| |||||||||
(Loss) income from discontinuing operations before income taxes | (3,777 | ) | 8,785 | (12,241 | ) | (24,244 | ) | |||||||||
(Benefit) provision for income taxes | (2,041 | ) | 5,770 | (4,224 | ) | (3,349 | ) | |||||||||
|
|
|
|
|
|
|
| |||||||||
Net (loss) income from discontinued operations | $ | (1,736 | ) | $ | 3,015 | $ | (8,017 | ) | $ | (20,895 | ) | |||||
|
|
|
|
|
|
|
| |||||||||
Dispositions
Disposition of Certain Assets of Travelocity—In February 2014, as a further step in our restructuring plans for Travelocity, we completed a sale of assets associated with Travelocity Partner Network (“TPN”), a business-to-business private white label website offering, for $10 million in upfront proceeds. Pursuant to the sale agreement, we will receive two annual earn-out payments, totaling up to $10 million, if the purchaser exceeds certain revenue thresholds during the calendar years ending December 31, 2014 and 2015. In connection with the sale, Travelocity entered into a Transition Services Agreement (“TSA”) with the acquirer to provide services to maintain the websites and certain technical and administrative functions for the acquirer until a complete transition occurs or the TSA terminates. Consideration received under both agreements has been allocated to the disposition and the services provided under the TSA; therefore, a significant portion of the upfront proceeds have been deferred, based on fair value of the TSA services. At the time of sale, we recognized no net gain or loss which was comprised of a $3 million loss on disposition, offset by a $3 million receivable for earn-out proceeds. During the third quarter of 2014, we determined that receipt of the earn-out proceeds was no longer probable and therefore fully impaired the receivable. The $3 million loss is included in restructuring charges for the three and nine months ended September 30, 2014 in our consolidated statements of operations.
On June 18, 2013, we completed the sale of certain assets of Travelocity (“TBiz”) operations to a third party for proceeds of $10 million. TBiz provided managed travel services for corporate customers. In the second quarter of 2013, we recognized a pre-tax gain on the sale of TBiz of $1 million which included the write-off of $9 million of goodwill attributed to TBiz based on the relative fair value to the Travelocity North America reporting unit. On an after tax basis, we recognized a loss of $3 million on the sale of TBiz.
4. Restructuring Charges
Travelocity Restructuring—In the third quarter of 2013, we initiated plans to restructure Travelocity, shifting Travelocity in the United States and Canada away from a fixed-cost model to a lower-cost,
F-9
performance-based shared revenue structure. On August 22, 2013 we entered into an exclusive, long-term strategic marketing agreement with Expedia (“Expedia SMA”), in which Expedia powers the technology platforms for Travelocity’s existing U.S. and Canadian websites, as well as provides Travelocity with access to Expedia’s supply and customer service platforms. In connection with the Expedia SMA, we also entered into a put/call agreement with Expedia (the “Put/Call Agreement”). The Expedia SMA represents a strategic decision to reduce direct costs associated with Travelocity and provide our customers with the benefit of Expedia’s long term investment in its technology platform as well as its supply and customer service platforms. Both parties began development and implementation after signing the Expedia SMA. Substantially all supplier offerings have been migrated to the Expedia platform which has resulted in increased conversion and operational efficiency and has allowed us to shift our focus to Travelocity’s marketing strengths. Based on the terms of the Expedia SMA, Expedia earned an incentive payment of $8 million in January 2014 and an additional $3 million in March 2014. We are amortizing these payments over the non-cancellable term of the Expedia SMA as a reduction to revenue.
Expedia pays us a performance-based marketing fee that varies based on the amount of travel booked through Travelocity-branded websites powered by Expedia under this collaborative arrangement. The marketing fee we receive is recorded as marketing fee revenue and the cost we incur to promote the Travelocity brand and for marketing is recorded as selling, general and administrative expense in our results of operations. Correspondingly, we are winding down certain internal processes, including back office functions, as substantially all transactions have moved from our technology platforms to those of Expedia.
Pursuant to the Put/Call Agreement, Expedia may acquire, or we may sell to Expedia, assets relating to the Travelocity-branded portions of our Travelocity business, which primarily include the assets subject to the Expedia SMA. Our put right may be exercised during the first 24 months of the Expedia SMA only upon the occurrence of certain triggering events primarily relating to implementation, which are outside of our control. The occurrence of these events is not considered probable. During this period, the exercise price of the put right is fixed. After the initial 24 month period, the put right is only exercisable for a limited period of time in 2016 and 2017 at a discount to fair market value as defined in the Put/Call Agreement. The call right held by Expedia is exercisable at any time during the term of the Put/Call Agreement. If the call right is exercised, although we expect the amount paid will be fair value, the call right provides for a floor for a limited time that may be higher than fair value and a ceiling for the duration of the Put/Call Agreement that may be lower than fair value.
In the fourth quarter of 2013, we also initiated a plan to restructure lastminute.com, the European portion of the Travelocity business. This plan involved establishing lastminute.com as a stand-alone operation, separating processes from the North America operations, while adding efficiencies to streamline the European operations. Travelocity continues to be managed as one reportable segment.
During the three months ended September 30, 2014, we recorded restructuring charges of $5 million which includes a $3 million loss on the sale of TPN, $1 million in additional severance costs and $1 million in other costs. During the nine months ended September 30, 2014, we recorded restructuring charges of $2 million which includes a $3 million loss on the sale of TPN, $2 million in additional severance costs and $2 million in other costs, net of adjustments to our original estimates of employee termination benefits of $4 million. The adjustments to our original estimates are primarily the result of certain employees transferring to the acquirer of the TPN business without a required severance payment. We estimate that we will incur additional charges for the remainder of 2014 of approximately $3 million consisting of contract termination and other related costs.
Technology Restructuring—Our corporate expenses include a technology organization that provides development and support activities to our business segments. Costs associated with our technology organization are charged to the business segments primarily based on its usage of development resources. For the year ended December 31, 2013, the majority of costs associated with the technology organization were incurred by Travel Network and Airline and Hospitality Solutions. In the fourth quarter of 2013, we initiated a restructuring plan to simplify our technology organization, better align costs with our current business, reduce our spending on
F-10
third-party resources, increase focus on product development and reduce our employee base by approximately 350 employees. The majority of this plan was completed in the first half of 2014 and we do not expect to record material charges in 2014 related to this action.
The change in our restructuring accruals, included in other current liabilities, is as follows (in thousands):
| Employee Termination Benefits | ||||||||||||
| Travelocity | Technology Organization | Total | ||||||||||
Balance as of December 31, 2013 | $ | 17,731 | $ | 8,163 | $ | 25,894 | ||||||
Charges | 2,102 | — | 2,102 | |||||||||
Adjustments | (3,938 | ) | (914 | ) | (4,852 | ) | ||||||
Payments | (9,261 | ) | (6,877 | ) | (16,138 | ) | ||||||
|
|
|
|
|
| |||||||
Balance as of September 30, 2014 | $ | 6,634 | $ | 372 | $ | 7,006 | ||||||
|
|
|
|
|
| |||||||
The charges included in our restructuring accruals do not include items charged directly to expense (e.g., asset impairments) and other periodic costs recognized as incurred, as those items are not reflected in the restructuring reserve in our consolidated balance sheet. Restructuring charges are not allocated to the segments for segment reporting purposes (see Note 15, Segment Information).
5. Equity Method Investments
We have an investment in Abacus International Pte Ltd (“Abacus”) and have entered into a service agreement with Abacus related to data processing services, development labor and other services as requested. The primary revenue generated from Abacus is data processing fees associated with bookings on the Sabre GDS. Development labor and ancillary services are provided upon request. Additionally, in accordance with an agreement with Abacus, we collect booking fees on behalf of Abacus and record a payable, or economic benefit transfer, to Abacus for amounts collected but unremitted at any period end, net of any associated costs we incur.
A summary of Abacus’ income statement information is as follows (in thousands):
| Three Months Ended September 30, | Nine Months Ended September 30, | |||||||||||||||
| 2014 | 2013 | 2014 | 2013 | |||||||||||||
Revenue | $ | 87,039 | $ | 83,237 | $ | 263,536 | $ | 248,814 | ||||||||
Operating income | 12,876 | 15,946 | 42,961 | 41,683 | ||||||||||||
Net income | 10,793 | 8,887 | 34,863 | 30,575 | ||||||||||||
6. Pension and Other Postretirement Benefit Plans
We sponsor the Sabre Inc. Legacy Pension Plan (“LPP”), which is a tax-qualified defined benefit pension plan for employees meeting certain eligibility requirements. The LPP was amended to freeze pension benefit accruals as of December 31, 2005, so that no additional pension benefits are accrued after that date. We also sponsor a defined benefit pension plan for certain employees in Canada.
We previously provided retiree life insurance benefits to certain employees who retired prior to January 1, 2001, and we subsidized a portion of the cost of retiree medical benefits for certain retirees and eligible employees hired prior to October 1, 2000. In February 2009, we amended our retiree medical plan to reduce the subsidies received by participants by 20% per year over five years, with no further subsidies beginning January 1, 2014. This amendment resulted in $57 million of prior service credit recorded in other comprehensive income that was amortized to operating expense over the remaining term which concluded in December 2013. The
F-11
following table provides the components of net periodic benefit costs associated with our pension and other postretirement benefit plans for the three and nine months ended September 30, 2014 and 2013 (in thousands):
| Three Months Ended September 30, | Nine Months Ended September 30, | |||||||||||||||
| 2014 | 2013 | 2014 | 2013 | |||||||||||||
Pension Benefits: | ||||||||||||||||
Interest cost | $ | 4,886 | $ | 4,483 | $ | 14,686 | $ | 13,448 | ||||||||
Expected return on plan assets | (5,909 | ) | (5,908 | ) | (17,959 | ) | (17,726 | ) | ||||||||
Amortization of prior service credit | (358 | ) | (359 | ) | (1,074 | ) | (1,075 | ) | ||||||||
Amortization of actuarial loss | 1,290 | 1,846 | 3,690 | 5,537 | ||||||||||||
|
|
|
|
|
|
|
| |||||||||
Net periodic (credit) cost | $ | (91 | ) | $ | 62 | $ | (657 | ) | $ | 184 | ||||||
|
|
|
|
|
|
|
| |||||||||
Other Benefits: | ||||||||||||||||
Interest cost | — | 10 | 2 | 30 | ||||||||||||
Amortization of prior service credit | — | (3,087 | ) | — | (9,261 | ) | ||||||||||
Amortization of actuarial gain | (33 | ) | (477 | ) | (99 | ) | (1,439 | ) | ||||||||
|
|
|
|
|
|
|
| |||||||||
Net periodic credit | $ | (33 | ) | $ | (3,554 | ) | $ | (97 | ) | $ | (10,670 | ) | ||||
|
|
|
|
|
|
|
| |||||||||
We made contributions of $4 million to fund our defined benefit pension plans during the nine months ended September 30, 2014. No contributions were made during the nine months ended September 30, 2013. Annual contributions to our defined benefit pension plans in the United States and Canada are based on several factors that may vary from year to year. Thus, past contributions are not always indicative of future contributions. Based on current assumptions, we do not expect to make additional contributions to our defined benefit pension plans for the remainder of 2014.
7. Income Taxes
Our effective tax rates for the nine months ended September 30, 2014 and 2013 were 46% and 5%, respectively. The increase in the effective tax rate for the nine months ended September 30, 2014 as compared to the same period in 2013 was primarily due to the impairment of nondeductible goodwill in the prior year, the amount of current year losses for which no tax benefit can be recognized relative to the amount of pre-tax income and the impact of other discrete items, partially offset by the increase in forecasted earnings in lower tax jurisdictions.
The differences between our effective tax rates and the U.S. federal statutory income tax rate primarily result from our geographic mix of taxable income in various tax jurisdictions as well as the discrete tax items referenced above.
We recognize liabilities when we believe that an uncertain tax position may not be fully sustained upon examination by the tax authorities. This requires significant judgment, the use of estimates, and the interpretation and application of complex tax laws. When facts and circumstances change, we reassess these probabilities and record any changes in the consolidated financial statements as appropriate. Our net unrecognized tax benefits, excluding interest and penalties, included in our consolidated balance sheets, were $69 million and $61 million as of September 30, 2014 and December 31, 2013, respectively.
Tax Receivable Agreement
Immediately prior to the closing of our initial public offering, we entered into an income tax receivable agreement (“TRA”) that provides those stockholders and equity award holders that were our stockholders and equity award holders, respectively, immediately prior to the closing of our initial public offering (collectively, the “Existing Stockholders”) the right to receive future payments from us of 85% of the amount of cash savings, if
F-12
any, in U.S. federal income tax that we and our subsidiaries realize as a result of the utilization of certain tax assets attributable to periods prior to our initial public offering, including federal net operating losses, capital losses and the ability to realize tax amortization of certain intangible assets (collectively, the “Pre-IPO Tax Assets”). We recognized an initial liability of $321 million after considering the valuation allowance of $66 million recorded against the Pre-IPO Tax Assets. The TRA liability was recorded as a reduction to additional paid-in capital and an increase to other noncurrent liabilities. No payments have been made under the TRA during the nine months ended September 30, 2014 and we do not expect material payments to occur prior to 2016. Any payments made under the TRA will be classified as a financing activity in our statement of cash flows.
8. Debt
In April 2014, we completed an initial public offering of our common stock and utilized the net proceeds to repay (i) $296 million aggregate principal amount of our Term Loan C (as defined below) and (ii) $320 million aggregate principal amount of our 2019 Notes (as defined below) at a redemption price of 108.5% of the principal amount, which represents the maximum amount of the contingent call option exercisable in the event of an equity offering. As a result of the prepayments on Term Loan C and the 2019 Notes, we recorded an extinguishment loss of $31 million which includes a $27 million redemption premium on the 2019 Notes.
As of September 30, 2014 and December 31, 2013, our outstanding debt included in our consolidated balance sheets totaled $3,088 million and $3,730 million, respectively, net of unamortized discounts of $15 million and $20 million, respectively. The following table sets forth the face values of our outstanding debt as of September 30, 2014 and December 31, 2013 (in thousands):
| Rate | Maturity | September 30, 2014 | December 31, 2013 | |||||||||||||
Senior secured credit facilities: | ||||||||||||||||
Term Loan B | L+3.00 | % | February 2019 | $ | 1,743,938 | $ | 1,757,250 | |||||||||
Incremental term loan facility | L+3.00 | % | February 2019 | 346,500 | 349,125 | |||||||||||
Term Loan C | L+2.50 | % | December 2017 | 49,313 | 361,250 | |||||||||||
Revolver, $370 million | L+2.75 | % | February 2019 | — | — | |||||||||||
Revolver, $35 million | L+3.25 | % | February 2018 | — | — | |||||||||||
Senior unsecured notes due 2016 | 8.35 | % | March 2016 | 400,000 | 400,000 | |||||||||||
Senior secured notes due 2019 | 8.50 | % | May 2019 | 480,000 | 800,000 | |||||||||||
Mortgage facility | 5.80 | % | March 2017 | 82,457 | 83,286 | |||||||||||
|
|
|
| |||||||||||||
Face value of total debt outstanding | 3,102,208 | 3,750,911 | ||||||||||||||
Less current portion of debt outstanding | (22,418 | ) | (86,117 | ) | ||||||||||||
|
|
|
| |||||||||||||
Face value of long-term debt outstanding | $ | 3,079,790 | $ | 3,664,794 | ||||||||||||
|
|
|
| |||||||||||||
Senior Secured Credit Facilities
On February 19, 2013, Sabre GLBL Inc. entered into an agreement that amended and restated its existing senior secured credit facilities (the “Amended and Restated Credit Agreement”). The new agreement replaced (i) the existing initial term loans with new classes of term loans of $1,775 million (the “Term Loan B”) and $425 million (the “Term Loan C”) and (ii) the existing revolver with a new revolver of $352 million (the “Revolver”).
On September 30, 2013, we entered into an agreement for an incremental term loan facility to Term Loan B (the “Incremental Term Loan Facility”), having a face value of $350 million and providing total net proceeds of $350 million. We have used a portion, and intend to use the remainder of the proceeds of the Incremental Term Loan Facility, for working capital, general corporate purposes and ongoing and future strategic actions related to Travelocity. The Incremental Term Loan Facility matures on February 19, 2019 and initially bore interest at a
F-13
rate equal to the LIBOR rate, subject to a 1.00% floor, plus 3.50% per annum. It includes a provision for increases in interest rates to maintain a difference of not more than 50 basis points relative to future term loan extensions or refinancing of amounts under the Amended and Restated Credit Agreement.
On February 20, 2014, we entered into a series of amendments to our Amended and Restated Credit Agreement (the “Repricing Amendments”) the first of which reduced the Term Loan B’s applicable margin for Eurocurrency and Base rate borrowings to 3.25% and 2.25%, respectively, with a step down to 3.00% and 2.00%, respectively, if the Senior Secured Leverage Ratio (as defined in the Amended and Restated Credit Agreement) is less than or equal to 3.25 to 1.00. It also reduced the Eurocurrency rate floor to 1.00% and the Base rate floor to 2.00%.
The Repricing Amendments extended the maturity date of $317 million of the $352 million Revolver to February 19, 2019. The Repricing Amendments also provided for an incremental revolving commitment due February 19, 2019 of $53 million, increasing the Revolver from $352 million to $405 million. The extended and incremental revolving commitments, totaling $370 million (the “Extended Revolver”), reduced the applicable margins to 3.00% for Eurocurrency and 2.00% for Base rate borrowings, with a step down to 2.75% and 1.75%, respectively, if the Senior Secured Leverage Ratio is less than or equal to 3.25 to 1.00. There were no changes in the maturity date and applicable margins of the unextended revolving commitments of $35 million (“Unextended Revolver”). The Extended Revolver also includes an accelerated maturity date of November 19, 2018 if, as of that date, borrowings under the Term Loan B (or permitted refinancing thereof) remain outstanding and mature before February 18, 2020.
Sabre GLBL Inc.’s obligations under the Amended and Restated Credit Agreement are guaranteed by Sabre Holdings and each of Sabre GLBL Inc.’s wholly-owned material domestic subsidiaries, except unrestricted subsidiaries. We refer to these guarantors together with Sabre GLBL Inc., as the Loan Parties. The Amended and Restated Credit Agreement is secured by (i) a first priority security interest on the equity interests in Sabre GLBL Inc. and each other Loan Party that is a direct subsidiary of Sabre GLBL Inc. or another Loan Party, (ii) 65% of the issued and outstanding voting (and 100% of the non-voting) equity interests of each wholly-owned material foreign subsidiary of Sabre GLBL Inc. that is a direct subsidiary of Sabre GLBL Inc. or another Loan Party, and (iii) a blanket lien on substantially all of the tangible and intangible assets of the Loan Parties.
Under the Amended and Restated Credit Agreement, the Loan Parties are subject to certain customary non-financial covenants, as well as a maximum Senior Secured Leverage Ratio, which applies if our Revolver utilization exceeds certain thresholds and is calculated as Senior Secured Debt (net of cash) to EBITDA, as defined by the agreement. This ratio was 5.5 to 1.0 for 2013 and is 5.0 to 1.0 for 2014. The definition of EBITDA is based on a trailing twelve months EBITDA adjusted for certain items including non-recurring expenses and the pro forma impact of cost saving initiatives. As of September 30, 2014, we are in compliance with all covenants under the Amended and Restated Credit Agreement.
As of September 30, 2014 and December 31, 2013, we had no outstanding balance under the Extended and Unextended Revolver. As of September 30, 2014, we had outstanding letters of credit totaling $60 million, which reduces our overall credit capacity under the Revolver. As of December 31, 2013, we had outstanding letters of credit totaling $67 million, of which $66 million reduced our overall credit capacity under the Revolver and $1 million was collateralized with restricted cash.
Principal Payments
Term Loan B and the Incremental Term Loan Facility mature on February 19, 2019, and require principal payments in equal quarterly installments of 0.25%. Term Loan C matures on December 31, 2017. As a result of the April 2014 prepayment, quarterly principal payments on Term Loan C are no longer required. We are obligated to pay $17 million on September 30, 2017 and the remaining balance on December 31, 2017. The Extended Revolver matures on February 19, 2019 and the Unextended Revolver matures on February 19, 2018.
F-14
For the nine months ended September 30, 2014, we made $328 million of principal payments of which $296 million was the prepayment on Term Loan C. We are scheduled to make $22 million in principal payments over the next twelve months.
We are also required to pay down the term loans by an amount equal to 50% of annual excess cash flow, as defined in our Amended and Restated Credit Agreement. This percentage requirement may decrease or be eliminated if certain leverage ratios are achieved. As a result of the Amended and Restated Credit Agreement, no excess cash flow payment was required in 2013 with respect to our results for the year ended December 31, 2012. Additionally, based on our results for the year ended December 31, 2013, we are not required to make an excess cash flow payment in 2014. In the event of certain asset sales or borrowings, the Amended and Restated Credit Agreement requires that we pay down the term loans with the resulting proceeds. Subject to the repricing premium discussed above, we may repay the indebtedness at any time prior to the maturity dates without penalty.
Interest
Borrowings under the Amended and Restated Credit Agreement bear interest at a rate equal to either, at our option: (i) the Eurocurrency rate plus an applicable margin for Eurocurrency borrowings as set forth below, or (ii) a base rate determined by the highest of (1) the prime rate of Bank of America, (2) the federal funds effective rate plus 1/2% or (3) LIBOR plus 1.00%, plus an applicable margin for base rate borrowings as set forth below. The Eurocurrency rate is based on LIBOR for all U.S. dollar borrowings and has a floor.
| Eurocurrency borrowings | Base rate borrowings | |||||||||||||||
| Applicable Margin (1) | Floor | Applicable Margin (1) | Floor | |||||||||||||
Term Loan B, prior to Repricing Amendments | 4.00 | % | 1.25 | % | 3.00 | % | 2.25 | % | ||||||||
Term Loan B, subsequent to Repricing Amendments | 3.25 | % | 1.00 | % | 2.25 | % | 2.00 | % | ||||||||
Incremental term loan facility | 3.50 | % | 1.00 | % | 2.50 | % | 2.00 | % | ||||||||
Term Loan C | 3.00 | % | 1.00 | % | 2.00 | % | 2.00 | % | ||||||||
Revolver, $370 million | 3.00 | % | N/A | 2.00 | % | N/A | ||||||||||
Revolver, $35 million | 3.75 | % | N/A | 2.75 | % | N/A | ||||||||||
| (1) | Applicable margins do not reflect potential step downs which are determined by the Senior Secured Leverage Ratio. See below for additional information. |
Applicable margins for Term Loan B and the Extended Revolver step down 25 basis points for any quarter if the Senior Secured Leverage Ratio is less than or equal to 3.25 to 1.00. Applicable margins for all other borrowings under the Amended and Restated Credit Agreement step down by 50 basis points for any quarter if the Senior Secured Leverage Ratio is less than or equal to 3.0 to 1.0. Applicable margins increase to maintain a difference of not more than 50 basis points relative to future term loan extensions or refinancings. In addition, we are required to pay a quarterly commitment fee of 0.375% per annum for unused revolving commitments. The commitment fee may increase to 0.5% per annum if the Senior Secured Leverage Ratio is greater than 4.0 to 1.0.
We have elected the three-month LIBOR as the floating interest rate on all $2,140 million of our outstanding term loans. As of September 30, 2014, the interest rate, including applicable margin, is 4.0% for the Term Loan B of $1,744 million; 4.0% for the Incremental Term Loan Facility of $347 million; and 3.5% for the Term Loan C of $49 million. Interest payments are due on the last day of each quarter. Interest on a portion of the outstanding loan is hedged with interest rate swaps (see Note 9, Derivatives).
In connection with the prepayment on Term Loan C and the Repricing Amendments, we recognized losses on extinguishment of debt of $1 million and $3 million, respectively. In addition, we incurred costs totaling $3 million as a result of the Repricing Amendments which were recorded as interest expense. In 2013, we incurred costs totaling $19 million associated with the Amended and Restated Credit Agreement and the Incremental
F-15
Term Loan Facility. We charged $14 million to interest expense during the first quarter of 2013, and capitalized $3 million and $2 million as debt issuance costs during the first and third quarter of 2013, respectively. We also recognized a loss on extinguishment of debt of $12 million for the nine months ended September 30, 2013 as a result of the Amended and Restated Credit Agreement. As of September 30, 2014, we had $24 million of unamortized debt issuance costs included in other assets in our consolidated balance sheets associated with all debt transactions under the Amended and Restated Credit Agreement and the previous senior secured credit agreement. These costs are being amortized to interest expense over the maturity period of the Amended and Restated Credit Agreement. Our effective interest rates for the three and nine months ended September 30, 2014 and 2013, inclusive of amounts charged to interest expense as described above, are as follows:
| Three Months Ended September 30, | Nine Months Ended September 30, | |||||||||||||||
| 2014 | 2013 | 2014 | 2013 | |||||||||||||
Including the impact of interest rate swaps | 5.25 | % | 6.26 | % | 5.64 | % | 7.15 | % | ||||||||
Excluding the impact of interest rate swaps | 4.50 | % | 5.51 | % | 4.94 | % | 6.43 | % | ||||||||
Senior Unsecured Notes
As of September 30, 2014, we have, at face value, $400 million in senior unsecured notes currently bearing interest at a rate of 8.35% and maturing on March 15, 2016 (“2016 Notes”). The 2016 Notes include certain non-financial covenants, including restrictions on incurring certain types of debt, entering into certain sale and leaseback transactions and entering into mergers, consolidations or a transfer of substantially all our assets. As of September 30, 2014, we are in compliance with all covenants under the 2016 Notes.
Senior Secured Notes
We have, at face value, $480 million in senior secured notes bearing interest at a rate of 8.50% and maturing on May 15, 2019 (“2019 Notes”). The 2019 Notes include certain non-financial covenants, including certain restrictions on incurring certain types of indebtedness, creation of liens on certain assets, making of certain investments, and payment of dividends. These covenants are similar in nature to those existing in the Amended and Restated Credit Agreement. As of September 30, 2014, we are in compliance with all covenants under the 2019 Notes.
The indenture to the 2019 Notes allowed us, at our option, to redeem up to 40% of the principal amount of the notes outstanding in the event of an equity offering, such as an initial public offering, until May 15, 2015. The contingent call option was at a price of 108.50%, plus accrued and unpaid interest, if any, to the date of redemption. In May 2014, we exercised our contingent call option and prepaid $320 million, or 40%, of the outstanding principal on the 2019 Notes at the redemption price of 108.5% of the principal amount. As a result of the prepayment, we recognized a loss on extinguishment of $30 million, which included the $27 million redemption premium.
Mortgage Facility
We have $82 million outstanding under a mortgage facility for the buildings, land and furniture and fixtures located at our headquarters facilities in Southlake, Texas. The mortgage facility bears interest at a rate of 5.7985% per annum and matures on April 1, 2017. The mortgage facility includes certain customary non-financial covenants, including restrictions on incurring liens other than permitted liens, dissolving the borrower or changing our business, forgiving debt, changing our principal place of business and transferring the property. As of September 30, 2014, we are in compliance with all covenants under the mortgage facility.
F-16
Aggregate Maturities
As of September 30, 2014, aggregate maturities of our long-term debt were as follows (in thousands):
| Amount | ||||
Three months ending December 31, 2014 | $ | 5,601 | ||
2015 | 22,435 | |||
2016 | 422,493 | |||
2017 | 150,303 | |||
2018 | 21,250 | |||
Thereafter | 2,480,125 | |||
|
| |||
Total | $ | 3,102,208 | ||
|
| |||
9. Derivatives
Hedging Objectives—We are exposed to certain risks relating to ongoing business operations. The primary risks managed by using derivative instruments are foreign currency exchange rate risk and interest rate risk. Forward contracts on various foreign currencies are entered into to manage the foreign currency exchange rate risk on operational exposure denominated in foreign currencies. Interest rate swaps are entered into to manage interest rate risk associated with our floating-rate borrowings. In accordance with authoritative guidance on accounting for derivatives and hedging, we designate foreign currency forward contracts as cash flow hedges on operational exposure and interest rate swaps as cash flow hedges of floating-rate borrowings.
Cash Flow Hedging Strategy—To protect against the reduction in value of forecasted foreign currency cash flows, we have instituted a foreign currency cash flow hedging program. We hedge portions of our expenses denominated in foreign currencies with forward contracts. When the dollar strengthens significantly against the foreign currencies, the decline in present value of future foreign currency revenue is offset by gains in the fair value of the forward contracts designated as hedges. Conversely, when the dollar weakens, the increase in the present value of future foreign currency cash flows is offset by losses in the fair value of the forward contracts.
We enter into interest rate swap agreements to manage interest rate risk exposure. The interest rate swap agreements modify our exposure to interest rate risk by converting floating-rate debt to a fixed rate basis, thus reducing the impact of interest rate changes on future interest expense and net earnings. These agreements involve the receipt of floating rate amounts in exchange for fixed rate interest payments over the life of the agreements without an exchange of the underlying principal amount.
For derivative instruments that are designated and qualify as cash flow hedges, the effective portion of the gain or loss on the derivative instrument is reported as a component of other comprehensive income (loss) and reclassified into earnings in the same line item associated with the forecasted transaction and in the same period or periods during which the hedged transaction affects earnings. The remaining gain or loss on the derivative instrument in excess of the cumulative change in the present value of future cash flows of the hedged item, if any (ineffective portion), and hedge components excluded from the assessment of effectiveness, are recognized in the consolidated statements of operations during the current period.
Our interest rate swaps were not designated in a cash flow hedging relationship because we no longer qualified for hedge accounting treatment following the amendment and restatement of our senior secured credit facility in February of 2013 (see Note 8, Debt). Derivatives not designated as hedging instruments are carried at fair value with changes in fair value reflected in the consolidated statement of operations.
Forward Contracts—In order to hedge our operational exposure to foreign currency movements, we are a party to certain foreign currency forward contracts that extend until September 2015. We have designated these instruments as cash flow hedges. No hedging ineffectiveness was recorded in earnings relating to the forward contracts during the three and nine months ended September 30, 2014 and 2013. As the outstanding contracts
F-17
settle, it is estimated that $4 million in losses will be reclassified from other comprehensive income (loss) to earnings. We have also entered into short-term forward contracts to hedge a portion of our foreign currency exposure related to travel supplier liability payments. As part of our risk management strategy, these derivatives were not designated for hedge accounting at inception; therefore, the change in fair value of these contracts is recorded in our consolidated statements of operations. The adjustments to fair value of our foreign currency forward contracts for the three and nine months ended September 30, 2014 were not material to our results of operations.
As of September 30, 2014 and December 31, 2013, we had the following unsettled purchased foreign currency forward contracts that were entered into to hedge our operational exposure to foreign currency movements (in thousands, except for average contract rates):
September 30, 2014 Outstanding Notional Amount | ||||||||||||||
Buy Currency | Sell Currency | Foreign Amount | USD Amount | Average Contract Rate | ||||||||||
US Dollar | Australian Dollar | 6,950 | $ | 6,195 | 0.8914 | |||||||||
Euro | US Dollar | 22,750 | 30,323 | 1.3329 | ||||||||||
British Pound Sterling | US Dollar | 21,950 | 36,239 | 1.6510 | ||||||||||
Indian Rupee | US Dollar | 1,074,000 | 16,680 | 0.0155 | ||||||||||
Polish Zloty | US Dollar | 193,800 | 61,376 | 0.3167 | ||||||||||
December 31, 2013 Outstanding Notional Amount | ||||||||||||||
Buy Currency | Sell Currency | Foreign Amount | USD Amount | Average Contract Rate | ||||||||||
US Dollar | Australian Dollar | 5,625 | $ | 5,041 | 0.8962 | |||||||||
Australian Dollar | US Dollar | 975 | 996 | 1.0215 | ||||||||||
Euro | US Dollar | 12,800 | 16,624 | 1.2988 | ||||||||||
British Pound Sterling | US Dollar | 18,450 | 28,908 | 1.5668 | ||||||||||
Indian Rupee | US Dollar | 1,174,000 | 18,593 | 0.0158 | ||||||||||
Polish Zloty | US Dollar | 170,400 | 52,748 | 0.3096 | ||||||||||
Interest Rate Swap Contracts—In April 2007, in connection with our then existing senior secured credit facilities, we entered into six interest rate swaps, four of which matured prior to 2013. The table below sets forth the remaining two interest rate swaps which matured on September 30, 2014.
Notional Amount | Interest Rate Received | Interest Rate Paid | Effective Date | Maturity Date | ||||||||||
| $400 million | 1 month LIBOR | 2.03 | % | July 29, 2011 | September 30, 2014 | |||||||||
| $350 million | 1 month LIBOR | 2.51 | % | April 30, 2012 | September 30, 2014 | |||||||||
$750 million | ||||||||||||||
The objective of the swaps was to hedge the interest payments associated with floating-rate liabilities on the notional amounts of a portion of our senior secured debt as summarized in the table above. Our interest rate swaps were not designated in a cash flow hedging relationship because we no longer qualified for hedge accounting treatment following the amendment and restatement of our senior secured credit facility in February 2013 (see Note 8, Debt). Derivatives not designated as hedging instruments are carried at fair value with changes in fair value recognized in the consolidated statements of operations. The adjustments to fair value of our interest rate swap agreements for the three and nine months ended September 30, 2014 were not material to our results of operations.
F-18
The estimated fair values of our derivatives designated as hedging instruments as of September 30, 2014 and December 31, 2013 are as follows (in thousands):
| Derivative Assets (Liabilities) | ||||||||||
| Balance Sheet Location | Fair Value as of | |||||||||
Derivatives designated as | September 30, 2014 | December 31, 2013 | ||||||||
Foreign exchange contracts | Prepaid expenses | $ | — | $ | 5,374 | |||||
| Other accrued liabilities | $ | (4,079 | ) | $ | — | |||||
The effects of derivative instruments, net of taxes, on other comprehensive income (loss) (“OCI”) for the three and nine months ended September 30, 2014 and 2013 are as follows (in thousands):
| Amount of Gain (Loss) Recognized in OCI on Derivative (Effective Portion) | ||||||||||||||||
Derivatives in Cash Flow | Three Months Ended September 30, | Nine Months Ended September 30, | ||||||||||||||
| 2014 | 2013 | 2014 | 2013 | |||||||||||||
Foreign exchange contracts | $ | (3,799 | ) | $ | 2,752 | $ | (3,181 | ) | $ | 564 | ||||||
| Amount of Gain (Loss) Reclassified from Accumulated OCI into Income (Effective Portion) | ||||||||||||||||||
Derivatives in Cash Flow Hedging Relationships | Income Statement Location | Three Months Ended September 30, | Nine Months Ended September 30, | |||||||||||||||
| 2014 | 2013 | 2014 | 2013 | |||||||||||||||
Foreign exchange contracts | Cost of revenue | $ | 646 | $ | (370 | ) | $ | 4,242 | $ | 685 | ||||||||
As described in Note 8, Debt, on February 19, 2013 we entered into an agreement that amended and restated our existing senior secured credit facilities. As a result, a critical term of the interest rate swap agreements no longer matched the senior secured debt, and we no longer qualified for hedge accounting as of January 1, 2013. For the three and nine months ended September 30, 2014, we reclassified $4 million ($2 million, net of tax) and $11 million ($7 million, net of tax), respectively, from OCI to interest expense related to the derivatives that no longer qualify for hedge accounting. The interest rate swaps matured on September 30, 2014.
Embedded Derivative Related to Senior Secured Notes—The 2019 Notes included a contingent call option to redeem up to 40% of the notes in the event of an equity offering at a rate of 108.50%, until May 15, 2015. This contingent call option was not clearly and closely related to the hybrid indenture and therefore required separate accounting. In May 2014, we exercised our contingent call option and prepaid 40%, or $320 million, of our 2019 Notes. In conjunction with the prepayment, the fair value of the contingent call option of $2 million was charged to loss on debt extinguishment for the nine months ended September 30, 2014.
10. Fair Value Measurements
Fair value is defined as the price that would be received to sell an asset or paid to transfer a liability in an orderly transaction between market participants at the measurement date in the principal or most advantageous market for that asset or liability. Guidance on fair value measurements and disclosures establishes a valuation hierarchy for disclosure of inputs used in measuring fair value defined as follows:
Level 1—Inputs are unadjusted quoted prices that are available in active markets for identical assets or liabilities.
Level 2—Inputs include quoted prices for similar assets and liabilities in active markets and quoted prices in non-active markets, inputs other than quoted prices that are observable, and inputs that are not directly observable, but are corroborated by observable market data.
F-19
Level 3—Inputs that are unobservable and are supported by little or no market activity and reflect the use of significant management judgment.
A financial asset’s or liability’s classification within the hierarchy is determined based on the least reliable level of input that is significant to the fair value measurement. In determining fair value, we utilize valuation techniques that maximize the use of observable inputs and minimize the use of unobservable inputs to the extent possible. We also consider the counterparty and our own non-performance risk in our assessment of fair value.
Assets and Liabilities that are Measured at Fair Value on a Recurring Basis
Foreign Currency Forward Contracts—The fair value of the foreign currency forward contracts was estimated based upon pricing models that utilize Level 2 inputs derived from or corroborated by observable market data such as currency spot and forward rates.
Interest Rate Swaps—The fair value of our interest rate swaps was estimated using a combined income and market-based valuation methodology based upon Level 2 inputs including credit ratings and forward interest rate yield curves obtained from independent pricing services reflecting broker market quotes. Our outstanding interest rate swaps matured during the third quarter of 2014 and we had no interest rate swaps outstanding as of September 30, 2014.
Contingent Consideration—On August 1, 2012, we acquired all of the outstanding stock and ownership interest of PRISM. Included in the purchase price is contingent consideration, based on management’s best estimate of fair value and future performance results on the acquisition date and is to be paid in 24 months following the acquisition date. Fair value of this payment was estimated considering the timing of the payments and discounted at 4.75%, representing our short-term borrowing rate based on our revolving credit facility at the time of the acquisition, a Level 3 input. For the three and nine months ended September 30, 2014 and 2013, the expense recognized related to the change in fair value was not material. In August 2014, we paid the remaining contingent consideration and contingent employment payments associated with our acquisition of PRISM which totaled $30 million.
Embedded Derivative—As part of the 2019 Notes, we acquired a contingent call option to redeem a portion of the 2019 Notes in the event of an equity offering (see Note 8, Debt). We determined the fair value of this call option by evaluating the difference in fair value of the hybrid instrument with and without the call option requiring separate accounting. We calculated the fair value using Level 3 unobservable inputs such as management’s estimate of the probability of an equity offering, credit spreads and the expected future volatility of interest rates based on historical trends. In May 2014, we exercised our contingent call option and prepaid 40%, or $320 million, of our 2019 Notes.
As of September 30, 2014, we had $4 million of liabilities associated with foreign currency forward contracts classified as Level 2. We had no other assets or liabilities required to be measured at fair value on a recurring basis as of September 30, 2014.
F-20
The following table presents the fair value of our assets (liabilities) that are required to be measured at fair value on a recurring basis as of December 31, 2013 (in thousands):
| Fair Value at Reporting Date Using | ||||||||||||||||
| December 31, 2013 | Level 1 | Level 2 | Level 3 | |||||||||||||
Contingent consideration | $ | (26,303 | ) | $ | — | $ | — | $ | (26,303 | ) | ||||||
Derivatives | ||||||||||||||||
Foreign currency forward contracts (see Note 9) | 5,374 | — | 5,374 | — | ||||||||||||
Interest rate swap contracts (see Note 9) | (11,533 | ) | — | (11,533 | ) | — | ||||||||||
Contingent call option, 2019 Notes (see Note 8) | 1,657 | — | — | 1,657 | ||||||||||||
|
|
|
|
|
|
|
| |||||||||
Total derivatives | (4,502 | ) | — | (6,159 | ) | 1,657 | ||||||||||
|
|
|
|
|
|
|
| |||||||||
Total | $ | (30,805 | ) | $ | — | $ | (6,159 | ) | $ | (24,646 | ) | |||||
|
|
|
|
|
|
|
| |||||||||
Other Financial Instruments
Notes Payable—The fair values of our 2016 Notes, 2019 Notes and term loans under our Amended and Restated Credit Agreement are determined based on quoted market prices for the identical liability when traded as an asset in an active market, a Level 1 input. The outstanding principal balance of our mortgage facility approximated its fair value as of September 30, 2014 and December 31, 2013. The fair values of the mortgage facility were determined based on estimates of current interest rates for similar debt, a Level 2 input.
The following table presents the fair value and carrying value of our 2016 Notes, 2019 Notes and term loans under our Amended and Restated Credit Agreement as of September 30, 2014 and December 31, 2013 (in thousands):
| Fair Value at | Carrying Value at | |||||||||||||||
Financial Instrument | September 30, 2014 | December 31, 2013 | September 30, 2014 | December 31, 2013 | ||||||||||||
Term Loan B | $ | 1,722,138 | $ | 1,777,107 | $ | 1,736,119 | $ | 1,747,378 | ||||||||
Incremental term loan facility | 342,602 | 349,334 | 346,500 | 349,125 | ||||||||||||
Term Loan C | 49,189 | 363,056 | 49,061 | 360,477 | ||||||||||||
Senior unsecured notes due 2016 | 433,000 | 448,320 | 392,767 | 389,321 | ||||||||||||
Senior secured notes due 2019 | 520,500 | 886,000 | 480,779 | 799,823 | ||||||||||||
11. Comprehensive Income (Loss)
At September 30, 2014 and December 31, 2013, the components of accumulated other comprehensive income (loss), net of related deferred income taxes were as follows (in thousands):
| September 30, 2014 | December 31, 2013 | |||||||
Retirement-related benefit plans | $ | (62,156 | ) | $ | (63,762 | ) | ||
Unrealized loss on foreign currency forward contracts and interest rate swaps | (3,118 | ) | (2,684 | ) | ||||
Unrealized foreign currency translation gain | 18,761 | 15,050 | ||||||
Other(1) | 4,921 | 1,501 | ||||||
|
|
|
| |||||
Total accumulated other comprehensive loss, net of tax | $ | (41,592 | ) | $ | (49,895 | ) | ||
|
|
|
| |||||
| (1) | Primarily relates to our share of Abacus’ accumulated other comprehensive income. See Note 5, Equity Method Investments. |
F-21
In the nine months ended September 30, 2013, we reclassified $8 million, net of tax, of foreign currency translation losses from accumulated other comprehensive income into loss from discontinued operations as a result of the disposition of Zuji (see Note 3, Discontinued Operations and Dispositions). The amortization of actuarial losses and periodic service credits associated with our retirement-related benefit plans are included in selling, general and administrative expenses. See Note 9, Derivatives, for information on the income statement line items affected as the result of reclassification adjustments associated with derivatives.
12. Redeemable Preferred Stock
Prior to the closing of our initial public offering, we amended our Certificate of Incorporation and exercised our right to redeem all of our Series A Cumulative Preferred Stock. The amendment to our Certificate of Incorporation modified the redemption feature of the Series A Cumulative Preferred Stock to allow for settlement using cash, shares of our common stock or a mix of cash and shares of our common stock. On April 23, 2014, we redeemed all of our outstanding shares of Series A Cumulative Preferred Stock in exchange for 40,343,529 shares of our common stock, which were delivered pro rata to the holders thereof concurrently with the closing of our initial public offering.
13. Earnings Per Share
The following table reconciles the numerators and denominators used in the computations of basic and diluted earnings per share (in thousands, expect per share data):
| Three Months Ended September 30, | Nine Months Ended September 30, | |||||||||||||||
| 2014 | 2013 | 2014 | 2013 | |||||||||||||
Numerator: | ||||||||||||||||
Income (loss) from continuing operations | $ | 39,019 | $ | 3,071 | $ | 33,008 | $ | (104,224 | ) | |||||||
Net income attributable to noncontrolling interests | 720 | 714 | 2,168 | 2,135 | ||||||||||||
Preferred stock dividends | — | 9,242 | 11,381 | 27,219 | ||||||||||||
|
|
|
|
|
|
|
| |||||||||
Net income (loss) from continuing operations available to common shareholders, basic and diluted | $ | 38,299 | $ | (6,885 | ) | $ | 19,459 | $ | (133,578 | ) | ||||||
|
|
|
|
|
|
|
| |||||||||
Denominator: | ||||||||||||||||
Basic weighted-average common shares outstanding | 264,768 | 178,140 | 229,405 | 178,051 | ||||||||||||
Dilutive effect of stock awards | 8,562 | — | 8,589 | — | ||||||||||||
|
|
|
|
|
|
|
| |||||||||
Diluted weighted-average common shares outstanding | 273,330 | 178,140 | 237,994 | 178,051 | ||||||||||||
|
|
|
|
|
|
|
| |||||||||
Basic earnings per share | $ | 0.14 | $ | (0.04 | ) | $ | 0.08 | $ | (0.75 | ) | ||||||
Diluted earnings per share | $ | 0.14 | $ | (0.04 | ) | $ | 0.08 | $ | (0.75 | ) | ||||||
Basic earnings per share are based on the weighted-average number of common shares outstanding during each period. Diluted earnings per share are based on the weighted-average number of common shares outstanding plus the effect of all dilutive common stock equivalents during each period. The calculation of diluted weighted-average shares excludes the impact of 2 million and 21 million common stock equivalents for the three months ended September 30, 2014 and 2013, respectively, and 1 million and 21 million common stock equivalents for the nine months ended September 30, 2014 and 2013, respectively. As we recorded net losses from continuing operations available to common shareholders in the three and nine months ended September 30, 2013, all common stock equivalents were excluded from the calculation of diluted earnings per share as its inclusion would have been antidilutive.
F-22
14. Contingencies
Value Added Tax Receivables
We generate Value Added Tax (“VAT”) refund claims, recorded as receivables, in multiple jurisdictions through the normal course of our business. Audits related to these claims are in various stages of investigation. If the results of the audit or litigation were to become unfavorable, the uncollectible amounts could be material to our results of operations. In previous years, the right to recover certain VAT receivables associated with European businesses has been questioned by tax authorities. We believe that our claims are valid under applicable law and as such we will continue to pursue collection, possibly through litigation. We assess VAT receivables for collectability and may be required to record reserves in the future. Our VAT receivables totaled $24 million and $23 million as of September 30, 2014 and December 31, 2013, respectively, and are included in other receivables in our consolidated balance sheets.
Litigation and Risks Relating to Value Added Taxes
Holiday Autos, a discontinued operation (see Note 3, Discontinued Operations and Dispositions), conducted a cross border car rental brokering business that involved substantial sums of VAT receivables and payable from the period 2007 to 2009. Certain of the VAT receivables were challenged by tax authorities and successfully defended. In France, however, the Court of Appeal ruled against us on June 18, 2013 in respect of outstanding VAT refund claims of $4 million made for the periods 2007 through 2009. We believe our claims are valid and have appealed the decision to the Supreme Court in France. Due to litigation, significant delays and other factors impacting our settlement of these claims, we have recorded an allowance for losses relating to such events in assets of discontinued operations in our consolidated balance sheets. The allowances recorded as of September 30, 2014 and December 31, 2013, in respect of the French claims subject to litigation, were $4 million. Our VAT receivables, net of reserves, associated with Holiday Autos totaled $5 million and $6 million as of September 30, 2014 and December 31, 2013, respectively, and are included in assets of discontinued operations in our consolidated balance sheets.
As we dissolve subsidiaries associated with discontinued operations, tax authorities may or have initiated audits that could result in challenges to our refund claims and assessments of additional taxes. We believe the merits of our claims are valid and will aggressively defend any denial of our claims.
In the United Kingdom, the Commissioners for Her Majesty’s Revenue & Customs (“HMRC”) had asserted that our subsidiary, Secret Hotels2 Limited (formerly Med Hotels Limited), failed to account for United Kingdom VAT on margins relating to hotels located within the European Union (“EU”). This business was sold in February 2009 to a third-party and we account for it as a discontinued operation. Because the sale was structured as an asset sale, we retained the potential tax liabilities of Secret Hotels2 Limited. HMRC issued assessments of tax totaling approximately $11 million. We appealed the assessments and as a result of an unfavorable ruling against us in the penultimate appeal court, we accrued $17 million of expense included in discontinued operations in the fourth quarter of 2012. On March 5, 2014 judgment was given in favor of Secret Hotels2 Limited. This judgment cannot be further appealed. We therefore reversed our reserve in 2013 in discontinued operations.
HMRC had started a review of other parts of our lastminute.com business in the United Kingdom. Following the favorable judgment in March 2014 associated with Secret Hotels2 Limited, HMRC ceased its review activity and withdrew its VAT claims against lastminute.com.
Legal Proceedings
While certain legal proceedings and related indemnification obligations to which we are a party specify the amounts claimed, these claims may not represent reasonably possible losses. Given the inherent uncertainties of litigation, the ultimate outcome of these matters cannot be predicted at this time, nor can the amount of possible loss or range of loss, if any, be reasonably estimated, except in circumstances where an aggregate litigation
F-23
accrual has been recorded for probable and reasonably estimable loss contingencies. A determination of the amount of accrual required, if any, for these contingencies is made after careful analysis of each matter. The required accrual may change in the future due to new information or developments in each matter or changes in approach such as a change in settlement strategy in dealing with these matters.
Litigation and Administrative Audit Proceedings Relating to Hotel Occupancy Taxes
Over the past ten years, various state and local governments in the United States have filed approximately 70 lawsuits against us and other OTAs pertaining primarily to whether Travelocity and other OTAs owe sales or occupancy taxes on some or all of the revenues they earn from facilitating hotel reservations using the merchant revenue model. In the merchant revenue model, the customer pays us an amount at the time of booking that includes (i) service fees, which we collect, and (ii) the price of the hotel room and amounts for occupancy or other local taxes, which we pass along to the hotel supplier. The complaints generally allege, among other things, that the defendants failed to pay to the relevant taxing authority hotel accommodations taxes on the service fees. Courts have dismissed approximately 30 of these lawsuits, some for failure to exhaust administrative remedies and some on the basis that we are not subject to the sales or occupancy tax at issue based on the construction of the language in the ordinance. The Fourth, Sixth and Eleventh Circuits of the United States Courts of Appeals each have ruled in our favor on the merits, as have state appellate courts in Missouri, Alabama, Texas, California, Kentucky, Florida, Colorado and Pennsylvania, and a number of state and federal trial courts. The remaining lawsuits are in various stages of litigation. We have also settled some cases individually, most for nuisance value, and with respect to these settlements, have generally reserved our rights to challenge any effort by the applicable tax authority to impose occupancy taxes in the future.
We have received recent favorable decisions pertaining to cases in North Carolina, California, Montana, Arizona and Colorado. On August 19, 2014, the North Carolina Court of Appeals affirmed a judgment in favor of Travelocity and other OTAs after concluding they are not operators of hotels, motel or similar-type businesses and therefore are not subject to hotel occupancy tax. The plaintiffs have filed a petition for discretionary review with the North Carolina Supreme Court. On May 28, 2014, an administrative hearing officer in Arizona ruled that Travelocity is not responsible for collecting or remitting local hotel taxes and set aside assessments made by twelve municipalities in Arizona, including Phoenix, Scottsdale, Tempe, and Tucson. On March 27, 2014, a California court of appeals upheld a trial court ruling that OTAs, including Travelocity, are not subject to the City of San Diego’s transient occupancy tax because they are not hotel operators or managing agents. The City of San Diego has filed a petition asking the Supreme Court of California to review the case. This marked the third time that a California appellate court has ruled in favor of Travelocity on the question of whether OTAs are subject to transient occupancy taxes in California, the prior two cases being brought by the City of Anaheim and City of Santa Monica. Travelocity also has prevailed at the trial court level in cases brought by San Francisco and Los Angeles, both of which are being appealed by the cities. On March 6, 2014, a Montana trial court ruled by summary judgment that Travelocity and other OTAs are not subject to the State of Montana’s lodging facility use tax or its sales tax on accommodations and vehicles. The lawsuit had been brought by the Montana Department of Revenue, which has appealed the decision. On July 3, 2014, the Colorado Court of Appeals affirmed a final judgment that Travelocity and OTAs are not liable for lodging taxes as claimed by the City of Denver. The City of Denver has petitioned the Supreme Court of Colorado to review the decision.
Although we have prevailed in the majority of these lawsuits and proceedings, there have been several adverse judgments or decisions on the merits, some of which are subject to appeal. On April 3, 2014, the Supreme Court of Wyoming affirmed a decision by the Wyoming State Board of Equalization that Travelocity and other OTAs are subject to sales tax on lodging. Similarly, on March 4, 2014, a trial court in Washington D.C. entered final judgment in favor of the District of Columbia on its claim that Travelocity and other OTAs are subject to the District’s hotel occupancy tax. Travelocity has appealed the trial court’s decision. We did not record material charges associated with these cases during the three and nine months ended September 30, 2014 and 2013. As of September 30, 2014, our reserve for these cases totaled $6 million and is included in other accrued liabilities in our consolidated balance sheets.
F-24
On November 21, 2013, the New York State Court of Appeals ruled against Travelocity and other OTAs, holding that New York City’s hotel occupancy tax, which was amended in 2009 to capture revenue from fees charged to customers by third-party travel companies, is constitutional because such fees constitute rent as they are a condition of occupancy. Travelocity had been collecting and remitting taxes under the statute, so the ruling did not impact its financial results in that regard.
On June 21, 2013, a state trial court in Cook County, Illinois granted summary judgment in favor of the City of Chicago and against Travelocity and other OTAs, ruling that Chicago’s hotel tax applies to the fees retained by the OTAs because, according to the trial court, OTAs act as hotel “managers” when facilitating hotel reservations. Travelocity subsequently settled the lawsuit prior to the entry of final judgment or any ruling on damages for an amount not material to our results of operations.
On April 4, 2013, the United States District Court for the Western District of Texas (“W.D.T.”) entered a final judgment against Travelocity and other OTAs in a class action lawsuit filed by the City of San Antonio. The final judgment was based on a jury verdict from October 30, 2009 that the OTAs “control” hotels for purposes of city hotel occupancy taxes. Following that jury verdict, on July 1, 2011, the W.D.T. concluded that fees charged by the OTAs are subject to city hotel occupancy taxes and that the OTAs have a duty to assess, collect and remit these taxes. We disagree with the jury’s finding that we “control” hotels, and with the W.D.T.’s conclusions based on the jury finding, and intend to appeal the final judgment to the United States Court of Appeals for the Fifth Circuit. The verdict against us, including penalties and interest, is $4 million which we do not believe we will ultimately pay and therefore have not accrued any loss related to this case.
We believe the Fifth Circuit’s resolution of the San Antonio appeal may be affected by a separate Texas state appellate court decision in our favor. On October 26, 2011, the Fourteenth Court of Appeals of Texas affirmed a trial court’s summary judgment ruling in favor of the OTAs in a case brought by the City of Houston and the Harris County-Houston Sports Authority on a similarly worded tax ordinance as the one at issue in the San Antonio case. The Texas Supreme Court denied the City of Houston’s petition to review the case. We believe this decision should provide persuasive authority to the Fifth Circuit in its review of the San Antonio case.
In late 2012, the Tax Appeal Court of the State of Hawaii granted summary judgment in favor of Travelocity and other OTAs on the issue of whether Hawaii’s transient accommodation tax applies to the merchant revenue model. However, in January 2013, the same court granted summary judgment in favor of the State of Hawaii and against Travelocity and other OTAs on the issue of whether the state’s general excise tax, which is assessed on all business activity in the state, applies to the merchant revenue model for the period from 2002 to 2011.
We recorded charges of $1 million and $17 million in cost of revenue for the nine months ended September 30, 2014 and 2013, respectively, which represents the amount we would owe to the State of Hawaii, prior to appealing the Tax Appeal Court’s ruling, in back excise taxes, penalties and interest based on the court’s interpretation of the statute. As of September 30, 2014, we maintained an accrued liability of $9 million for this case and have not made material payments in the nine months ended September 30, 2014. Payment of such amount is not an admission that we believe we are subject to the taxes in question.
The State of Hawaii has appealed the Tax Appeal Court’s decision that Travelocity is not subject to transient accommodation tax, and Travelocity has likewise appealed the Tax Appeal Court’s determination that we are subject to general excise tax, as we believe the decision is incorrect and inconsistent with the same court’s prior rulings. If any excise tax is in fact owed (which we dispute), we believe the correct amount should be under $10 million. The ultimate resolution of these contingencies may differ from the liabilities recorded. To the extent our appeal is successful in reducing or eliminating the assessed excise tax amounts, the State of Hawaii would be required to refund such amounts, plus interest. On May 20, 2013, the State of Hawaii issued additional
F-25
assessments of general excise tax and hotel occupancy tax for the calendar year 2012. Travelocity has appealed these assessments to the Tax Appeal Court, and these assessments have been stayed pending a final appellate decision on the original assessments.
On December 9, 2013, the State of Hawaii also issued assessments of general excise tax for merchant rental car bookings facilitated by Travelocity and other OTAs for the period 2001 to 2012 for which we recorded a $2 million reserve in the fourth quarter of 2013. Travelocity has appealed the assessment to the Tax Appeal Court, which ordered a stay of the assessment pending a final appellate decision on the original assessments.
On July 18, 2014, the State of Hawaii also issued additional assessments of general excise tax and hotel occupancy tax for the calendar year 2013. Travelocity has appealed those assessments to the Tax Appeal Court and intends to request a stay of the assessments pending a final appellate decision on the original assessments.
As of September 30, 2014, we have a reserve of $20 million, included in other accrued liabilities in the consolidated balance sheet, for the potential resolution of issues identified related to litigation involving hotel sales, occupancy or excise taxes, which includes the $11 million liability for the remaining payments to the State of Hawaii. As of December 31, 2013, the reserve for litigation involving hotel sales, occupancy or excise taxes was $18 million. Our estimated liability is based on our current best estimate but the ultimate resolution of these issues may be greater or less than the amount recorded and, if greater, could adversely affect our results of operations.
In addition to the actions by the tax authorities, four consumer class action lawsuits have been filed against us in which the plaintiffs allege that we made misrepresentations concerning the description of the fees received in relation to facilitating hotel reservations. Generally, the consumer claims relate to whether Travelocity provided adequate notice to consumers regarding the nature of our fees and the amount of taxes charged or collected. One of these lawsuits was dismissed by the trial court and this dismissal was subsequently affirmed by the Texas Supreme Court; one was voluntarily dismissed by the plaintiffs; one is pending in Texas state court, where the court is currently considering the plaintiffs’ motion to certify a class action; and the last is pending in federal court, but has been stayed pending the outcome of the Texas state court action. We believe the notice we provided was appropriate.
In addition to the lawsuits, a number of state and local governments have initiated inquiries, audits and other administrative proceedings that could result in an assessment of sales or occupancy taxes on fees. If we do not prevail at the administrative level, those cases could lead to formal litigation proceedings.
Pursuant to our Expedia SMA, we continue to be liable for fees, charges, costs and settlements relating to litigation arising from hotels booked on the Travelocity platform operated by Travelocity prior to the full implementation of the Expedia SMA. However, fees, charges, costs and settlements relating to litigation from hotels booked subsequent to the Expedia SMA will be shared with Expedia according to the terms of the Expedia SMA. Under the Expedia SMA, we are also required to guarantee Travelocity’s indemnification obligations to Expedia for any liabilities arising out of historical claims with respect to this type of litigation.
US Airways Antitrust Litigation and DOJ Investigation
US Airways Antitrust Litigation
In April 2011, US Airways sued us in federal court in the Southern District of New York, alleging violations of the Sherman Act Section 1 (anticompetitive agreements) and Section 2 (monopolization). The complaint was filed two months after we entered into a new distribution agreement with US Airways. In September 2011, the court dismissed all claims relating to Section 2. The claims that were not dismissed are claims brought under Section 1 of the Sherman Act that relate to our contracts with airlines, especially US Airways itself, which US Airways says contain anticompetitive content-related provisions, and an alleged conspiracy with the other GDSs, allegedly to maintain the industry structure and not to implement US Airways’ preferred system of distributing
F-26
its Choice Seats product. We strongly deny all of the allegations made by US Airways. US Airways quantifies its damages at either $317 million or $482 million (before trebling), depending on certain assumptions. We believe both estimates are based on faulty assumptions and analysis and therefore are highly overstated. In the event US Airways were to prevail on the merits of its claim, we believe any monetary damages awarded (before trebling) would be significantly less than either of US Airways’ proposed damage amounts.
Document, fact and expert witness discovery are complete. Summary judgment motions were filed in April 2014 and we are awaiting a ruling. No trial date has been set and we anticipate the most likely trial date would be in the first half of 2015, assuming no delays with the court’s schedule and that we do not prevail completely with our summary judgment motions.
We have and will incur significant fees, costs and expenses for as long as the litigation is ongoing. In addition, litigation by its nature is highly uncertain and fraught with risk, and it is therefore difficult to predict the outcome of any particular matter. If favorable resolution of the matter is not reached, any monetary damages are subject to trebling under the antitrust laws and US Airways would be eligible to be reimbursed by us for its costs and attorneys’ fees. Depending on the amount of any such judgment, if we do not have sufficient cash on hand, we may be required to seek financing through the issuance of additional equity or from private or public financing. Additionally, US Airways can and has sought injunctive relief, though we believe injunctive relief for US Airways is precluded by the settlement agreement we reached with American Airlines in 2012, which covers affiliates, including through merger, of American Airlines. If injunctive relief were granted, depending on its scope, it could affect the manner in which our airline distribution business is operated and potentially force changes to the existing airline distribution business model. Any of these consequences could have a material adverse effect on our business, financial condition and results of operations.
Department of Justice Investigation
On May 19, 2011, we received a civil investigative demand (“CID”) from the U.S. Department of Justice (“DOJ”) investigating alleged anticompetitive acts related to the airline distribution component of our business. We are fully cooperating with the DOJ investigation and are unable to make any prediction regarding its outcome. The DOJ is also investigating other companies that own GDSs, and has sent CIDs to other companies in the travel industry. Based on its findings in the investigation, the DOJ may (i) close the file, (ii) seek a consent decree to remedy issues it believes violate the antitrust laws, or (iii) file suit against us for violating the antitrust laws, seeking injunctive relief. If injunctive relief were granted, depending on its scope, it could affect the manner in which our airline distribution business is operated and potentially force changes to the existing airline distribution business model. Any of these consequences would have a material adverse effect on our business, financial condition and results of operations.
Insurance Carriers
We have disputes against two of our insurance carriers for failing to reimburse defense costs incurred in the American Airlines antitrust litigation, which we settled in October 2012. Both carriers admitted there is coverage, but reserved their rights not to pay should we be found liable for certain of American Airlines’ allegations. Despite their admission of coverage, the insurers have only reimbursed us for a small portion of our significant defense costs. We filed suit against the entities in New York state court alleging breach of contract and a statutory cause of action for failure to promptly pay claims. If we prevail, we may recover some or all amounts already tendered to the insurance companies for payment within the limits of the policies and may be entitled to 18% interest on such amounts. To date, settlement discussions have been unsuccessful. We are currently in the discovery process. The court has not yet scheduled a trial date though we anticipate trial to begin in the second half of 2015.
F-27
Hotel Related Antitrust Proceedings
On August 20, 2012, two individuals alleging to represent a putative class of bookers of online hotel reservations filed a complaint against Sabre Holdings, Travelocity.com LP, and several other online travel companies and hotel chains in the U.S. District Court for the Northern District of California, alleging federal and state antitrust and related claims. The complaint alleges generally that the defendants conspired to enter into illegal agreements relating to the price of hotel rooms. Over 30 copycat suits were filed in various courts in the United States. In December 2012, the Judicial Panel on Multi-District Litigation centralized these cases in the U.S. District Court in the Northern District of Texas, which subsequently consolidated them. The proposed class period is January 1, 2003 through May 1, 2013. On June 15, 2013, the court granted Travelocity’s motion to compel arbitration of claims involving Travelocity bookings made on or after February 4, 2010. While all claims from February 4, 2010 through May 1, 2013 are now excluded from the lawsuit and must be arbitrated if pursued at all, the lawsuit still covers claims from January 1, 2003 through February 3, 2010. Together with the other defendants, Travelocity and Sabre filed a motion to dismiss. On February 18, 2014, the court granted the motion and dismissed the plaintiff’s claims without prejudice. The plaintiffs had moved for leave to file an amended complaint but the judge denied the motion on October 27, 2014. The plaintiffs will have an opportunity to appeal. We deny any conspiracy or any anti-competitive actions and we intend to aggressively defend against the claims.
Even if we are ultimately successful in defending ourselves in this matter, we are likely to incur significant fees, costs and expenses for as long as it is ongoing. In addition, litigation by its nature is highly uncertain and fraught with risk, and it is difficult to predict the outcome of any particular matter. If favorable resolution of the matter is not reached, we could be subject to monetary damages, including treble damages under the antitrust laws, as well as injunctive relief. If injunctive relief were granted, depending on its scope, it could affect the manner in which our Travelocity business is operated and potentially force changes to the existing business model. Any of these consequences could have a material adverse effect on our business, financial condition and results of operations.
Litigation Relating to Patent Infringement
In April 2010, CEATS, Inc. (“CEATS”) filed a patent infringement lawsuit against several ticketing companies and airlines, including JetBlue, in the Eastern District of Texas. CEATS alleged that the mouse-over seat map that appears on the defendants’ websites infringes certain of its patents. JetBlue’s website is provided by our Airline Solutions business under the SabreSonic Web service. On June 11, 2010, JetBlue requested that we indemnify and defend it for and against the CEATS lawsuit based on the indemnification provision in our agreement with JetBlue, and we agreed to a conditional indemnification. CEATS claimed damages of $0.30 per segment sold on JetBlue’s website during the relevant time period which totaled $10 million. A jury trial began on March 12, 2012, which resulted in a jury verdict invalidating the CEATS’ patents. Final judgment was entered and the plaintiff appealed. The Federal Circuit affirmed the jury’s decision in our favor on April 26, 2013. CEATS did not appeal the Federal Circuit’s decision, and its deadline to do so has passed. On June 28, 2013, the Eastern District denied CEATS’ previously filed motion to vacate the judgment based on an alleged conflict of interest with a mediator. CEATS appealed that decision and the Federal Circuit heard the appeal on May 5, 2014, and subsequently denied the appeal. On July 22, 2014, CEATs filed a motion for rehearing en banc before the Federal Circuit which was denied on September 5, 2014. CEATS has ninety days from the denial to file a petition for a review with the Supreme Court.
Indian Income Tax Litigation
We are currently a defendant in income tax litigation brought by the Indian Director of Income Tax (“DIT”) in the Supreme Court of India. The dispute arose in 1999 when the DIT asserted that we have a permanent establishment within the meaning of the Income Tax Treaty between the United States and the Republic of India and accordingly issued tax assessments for assessment years ending March 1998 and March 1999, and later issued further tax assessments for assessment years ending March 2000 through March 2006. We appealed the tax assessments and the Indian Commissioner of Income Tax Appeals returned a mixed verdict. We filed further appeals with the Income Tax Appellate Tribunal, or the ITAT. The ITAT ruled in our favor on June 19, 2009 and
F-28
July 10, 2009, stating that no income would be chargeable to tax for assessment years ending March 1998 and March 1999, and from March 2000 through March 2006. The DIT appealed those decisions to the Delhi High Court, which found in our favor on July 19, 2010. The DIT has appealed the decision to the Supreme Court of India and no trial date has been set.
We intend to continue to aggressively defend against these claims. Although we do not believe that the outcome of the proceedings will result in a material impact on our business or financial condition, litigation is by its nature uncertain. If the DIT were to fully prevail on every claim, we could be subject to taxes, interest and penalties of approximately $26 million as of September 30, 2014, which could have a material adverse effect on our business, financial condition and results of operations. We do not believe this outcome is probable and therefore have not made any provisions or recorded any liability for the potential resolution of this matter.
Litigation Relating to Routine Proceedings
We are also engaged from time to time in other routine legal and tax proceedings incidental to our business. We do not believe that any of these routine proceedings will have a material impact on the business or our financial condition.
15. Segment Information
Our reportable segments are based upon: our internal organizational structure; the manner in which our operations are managed; the criteria used by our Chief Executive Officer, who is our Chief Operating Decision Maker (“CODM”), to evaluate segment performance; the availability of separate financial information; and overall materiality considerations.
Our business has three reportable segments: Travel Network, Airline and Hospitality Solutions, and Travelocity. Airline and Hospitality Solutions aggregates the Airline Solutions and Hospitality Solutions operating segments as these operating segments have similar economic characteristics, generate revenues on transaction-based fees, incur the same types of expenses and use our SaaS based and hosted applications and platforms to market to the travel industry.
Our CODM utilizes Adjusted Gross Margin and Adjusted EBITDA as the measures of profitability to evaluate performance of our segments and allocate resources. Segment results do not include unallocated expenses or interest expenses which are centrally managed costs. Benefits expense, including pension expense, postretirement benefits, medical insurance and workers’ compensation are allocated to the segments based on headcount. Depreciation expense on the corporate headquarters building and related facilities costs are allocated to the segments through a facility fee based on headcount. Corporate includes certain shared expenses such as accounting, human resources, legal, corporate systems, and other shared technology costs. Corporate also includes all amortization of intangible assets and any related impairments that originate from purchase accounting, as well as stock based compensation expense, restructuring charges, legal reserves, occupancy taxes and other items not identifiable with one of our segments.
We account for significant intersegment transactions as if the transactions were with third parties, that is, at estimated current market prices. The majority of the intersegment revenues and cost of revenues are between Travelocity and Travel Network, consisting mainly of incentive consideration provided, net of data processing fees incurred, by Travel Network to Travelocity for transactions processed through the Sabre GDS, transaction fees paid by Travelocity to Travel Network for transactions facilitated through the Sabre GDS in which the travel supplier pays Travelocity directly, and fees paid by Travel Network to Travelocity for corporate trips booked through the Travelocity online booking technology. During the second quarter of 2014, Travel Network charged Travelocity a fee of approximately $7 million for not meeting certain minimum booking level requirements. This fee was recorded as revenue on Travel Network and expensed on Travelocity in our segment results and is eliminated in consolidation. In addition, Airline and Hospitality Solutions pay fees to Travel Network for airline trips booked through our GDS.
F-29
Our CODM does not review total assets by segment as operating evaluations and resource allocation decisions are not made on the basis of total assets by segment. Our CODM uses Adjusted Capital Expenditures in making product investment decisions and determining development resource requirements.
The performance of our segments is evaluated primarily on Adjusted Revenue, Adjusted Gross Margin and Adjusted EBITDA which are not recognized terms under GAAP. Our uses of Adjusted Revenue, Adjusted Gross Margin and Adjusted EBITDA have limitations as analytical tools, and should not be considered in isolation or as a substitute for analysis of our results as reported under GAAP. We define Adjusted Revenue as revenue adjusted for the amortization of Expedia SMA incentive payments, which are recorded as a reduction to revenue and are being amortized over the non-cancellable term of the Expedia SMA (see Note 4, Restructuring Charges). We define Adjusted Gross Margin as operating income (loss) adjusted for selling, general and administrative expenses, impairment, depreciation and amortization, amortization of upfront incentive consideration, restructuring and other costs, litigation and taxes, including penalties, stock-based compensation and amortization of Expedia SMA incentive payments. The definition of Adjusted Gross Margin was revised in the first quarter of 2014 to adjust for restructuring and other costs, litigation and taxes, including penalties and stock-based compensation included in cost of revenue which differs from Adjusted Gross Margin presented in our prospectus filed with the SEC pursuant to Rule 424(b) under the Securities Act on April 17, 2014. Adjusted Gross Margin for the prior year period has been recast to conform to our revised definition. We define Adjusted EBITDA as income (loss) from continuing operations adjusted for impairment, depreciation and amortization of property and equipment, amortization of capitalized implementation costs, acquisition related amortization, amortization of upfront incentive consideration, interest expense, net, loss on extinguishment of debt, other, net, restructuring and other costs, litigation and taxes including penalties, stock-based compensation, management fees, amortization of Expedia SMA incentive payments and income taxes. We define Adjusted Capital Expenditures as additions to property and equipment and capitalized implementation costs during the periods presented.
F-30
Segment information for the three and nine months ended September 30, 2014 and 2013 is as follows (in thousands):
| Three Months Ended September 30, | Nine Months Ended September 30, | |||||||||||||||
| 2014 | 2013 | 2014 | 2013 | |||||||||||||
Adjusted Revenue | ||||||||||||||||
Travel Network | $ | 466,278 | $ | 449,562 | $ | 1,420,341 | $ | 1,381,105 | ||||||||
Airline and Hospitality Solutions | 208,685 | 182,505 | 571,975 | 522,794 | ||||||||||||
Travelocity | 88,853 | 160,811 | 268,848 | 457,518 | ||||||||||||
Eliminations | (4,638 | ) | (17,055 | ) | (24,253 | ) | (58,018 | ) | ||||||||
|
|
|
|
|
|
|
| |||||||||
Total Adjusted Revenue | 759,178 | 775,823 | 2,236,911 | 2,303,399 | ||||||||||||
Amortization of Expedia SMA incentive payments | (2,875 | ) | — | (7,625 | ) | — | ||||||||||
|
|
|
|
|
|
|
| |||||||||
Total revenue | $ | 756,303 | $ | 775,823 | $ | 2,229,286 | $ | 2,303,399 | ||||||||
|
|
|
|
|
|
|
| |||||||||
Adjusted Gross Margin(a) | ||||||||||||||||
Travel Network | $ | 216,214 | $ | 207,506 | $ | 670,023 | $ | 652,568 | ||||||||
Airline and Hospitality Solutions | 94,747 | 64,539 | 235,546 | 183,237 | ||||||||||||
Travelocity | 66,013 | 102,710 | 184,124 | 277,895 | ||||||||||||
Eliminations | (41 | ) | (123 | ) | (7,498 | ) | (514 | ) | ||||||||
Corporate | (18,579 | ) | (5,578 | ) | (38,119 | ) | (28,651 | ) | ||||||||
|
|
|
|
|
|
|
| |||||||||
Total | $ | 358,354 | $ | 369,054 | $ | 1,044,076 | $ | 1,084,535 | ||||||||
|
|
|
|
|
|
|
| |||||||||
Adjusted EBITDA(b) | ||||||||||||||||
Travel Network | $ | 193,823 | $ | 183,728 | $ | 606,637 | $ | 582,268 | ||||||||
Airline and Hospitality Solutions | 81,671 | 56,940 | 197,686 | 145,485 | ||||||||||||
Travelocity | 15,954 | 7,403 | (18,116 | ) | 7,528 | |||||||||||
|
|
|
|
|
|
|
| |||||||||
Total segments | 291,448 | 248,071 | 786,207 | 735,281 | ||||||||||||
Corporate | (61,522 | ) | (46,722 | ) | (168,857 | ) | (151,318 | ) | ||||||||
|
|
|
|
|
|
|
| |||||||||
Total | $ | 229,926 | $ | 201,349 | $ | 617,350 | $ | 583,963 | ||||||||
|
|
|
|
|
|
|
| |||||||||
Depreciation and amortization | ||||||||||||||||
Travel Network | $ | 14,788 | $ | 13,225 | $ | 46,597 | $ | 37,810 | ||||||||
Airline and Hospitality Solutions | 26,031 | 19,853 | 79,729 | 57,225 | ||||||||||||
Travelocity | 1,122 | 1,237 | 3,585 | 8,826 | ||||||||||||
|
|
|
|
|
|
|
| |||||||||
Total segments | 41,941 | 34,315 | 129,911 | 103,861 | ||||||||||||
Corporate | 29,771 | 42,051 | 100,550 | 126,416 | ||||||||||||
|
|
|
|
|
|
|
| |||||||||
Total | $ | 71,712 | $ | 76,366 | $ | 230,461 | $ | 230,277 | ||||||||
|
|
|
|
|
|
|
| |||||||||
Adjusted Capital Expenditures(c) | ||||||||||||||||
Travel Network | $ | 13,238 | $ | 19,542 | $ | 43,858 | $ | 51,593 | ||||||||
Airline and Hospitality Solutions | 39,994 | 38,993 | 117,784 | 132,563 | ||||||||||||
Travelocity | 2,685 | 3,571 | 6,810 | 14,367 | ||||||||||||
|
|
|
|
|
|
|
| |||||||||
Total segments | 55,917 | 62,106 | 168,452 | 198,523 | ||||||||||||
Corporate | 3,890 | 5,174 | 19,535 | 18,907 | ||||||||||||
|
|
|
|
|
|
|
| |||||||||
Total | $ | 59,807 | $ | 67,280 | $ | 187,987 | $ | 217,430 | ||||||||
|
|
|
|
|
|
|
| |||||||||
F-31
| (a) | The following tables set forth the reconciliation of Adjusted Gross Margin to operating income in our statement of operations (in thousands): |
| Three Months Ended September 30, | Nine Months Ended September 30, | |||||||||||||||
| 2014 | 2013 | 2014 | 2013 | |||||||||||||
Adjusted Gross Margin | $ | 358,354 | $ | 369,054 | $ | 1,044,076 | $ | 1,084,535 | ||||||||
Less adjustments: | ||||||||||||||||
Selling, general and administrative | 169,183 | 208,033 | 575,413 | 620,226 | ||||||||||||
Impairment | — | 2,837 | — | 138,435 | ||||||||||||
Restructuring charges | 4,735 | 15,889 | 2,325 | 15,889 | ||||||||||||
Cost of revenue adjustments: | ||||||||||||||||
Depreciation and amortization(1) | 47,252 | 49,421 | 157,146 | 150,441 | ||||||||||||
Amortization of upfront incentive consideration(2) | 10,388 | 9,385 | 33,177 | 28,736 | ||||||||||||
Restructuring and other costs(4) | 4,865 | 2,582 | 10,016 | 4,521 | ||||||||||||
Litigation and taxes, including penalties(5) | 188 | 5,389 | 1,127 | 19,864 | ||||||||||||
Stock-based compensation | 2,172 | 544 | 5,618 | 816 | ||||||||||||
Amortization of Expedia SMA incentive payments | 2,875 | — | 7,625 | — | ||||||||||||
|
|
|
|
|
|
|
| |||||||||
Operating income | $ | 116,696 | $ | 74,974 | $ | 251,629 | $ | 105,607 | ||||||||
|
|
|
|
|
|
|
| |||||||||
| (b) | The following tables set forth the reconciliation of Adjusted EBITDA to loss from continuing operations in our statement of operations (in thousands): |
| Three Months Ended September 30, | Nine Months Ended September 30, | |||||||||||||||
| 2014 | 2013 | 2014 | 2013 | |||||||||||||
Adjusted EBITDA | $ | 229,926 | $ | 201,349 | $ | 617,350 | $ | 583,963 | ||||||||
Less adjustments: | ||||||||||||||||
Impairment | — | 2,837 | — | 138,435 | ||||||||||||
Depreciation and amortization of property and equipment(1a) | 39,524 | 32,936 | 122,409 | 97,687 | ||||||||||||
Amortization of capitalized implementation costs(1b) | 9,084 | 8,437 | 27,111 | 27,038 | ||||||||||||
Acquisition related amortization(1c) | 23,905 | 35,794 | 83,344 | 107,955 | ||||||||||||
Amortization of upfront incentive consideration(2) | 10,388 | 9,385 | 33,177 | 28,736 | ||||||||||||
Interest expense, net | 50,153 | 63,454 | 167,332 | 209,653 | ||||||||||||
Loss on extinguishment of debt | — | — | 33,538 | 12,181 | ||||||||||||
Other, net(3) | (565 | ) | 2,429 | (760 | ) | 1,099 | ||||||||||
Restructuring and other costs(4) | 14,482 | 21,754 | 24,056 | 26,296 | ||||||||||||
Litigation and taxes, including penalties(5) | 4,440 | 8,579 | 12,497 | 31,543 | ||||||||||||
Stock-based compensation | 5,472 | 2,686 | 22,434 | 5,446 | ||||||||||||
Management fees(6) | 193 | 2,126 | 23,701 | 7,347 | ||||||||||||
Amortization of Expedia SMA incentive payments | 2,875 | — | 7,625 | — | ||||||||||||
Provision (benefit) for income taxes | 30,956 | 7,861 | 27,878 | (5,229 | ) | |||||||||||
|
|
|
|
|
|
|
| |||||||||
Income (loss) from continuing operations | $ | 39,019 | $ | 3,071 | $ | 33,008 | $ | (104,224 | ) | |||||||
|
|
|
|
|
|
|
| |||||||||
F-32
| (1) | Depreciation and amortization expenses: |
| a. | Depreciation and amortization of property and equipment includes software developed for internal use. |
| b. | Amortization of capitalized implementation costs represents amortization of upfront costs to implement new customer contracts under our SaaS and hosted revenue model. |
| c. | Acquisition related amortization represents amortization of intangible assets from the take-private transaction in 2007 as well as intangibles associated with acquisitions since that date and amortization of the excess basis in our underlying equity in joint ventures. |
| (2) | Our Travel Network business at times makes upfront cash payments or other consideration to travel agency subscribers at the inception or modification of a service contract, which are capitalized and amortized over an average expected life of the service contract, generally over three to five years. Such consideration is made with the objective of increasing the number of clients or to ensure or improve customer loyalty. Such service contract terms are established such that the supplier and other fees generated over the life of the contract will exceed the cost of the incentive consideration provided up front. Such service contracts with travel agency subscribers require that the customer commit to achieving certain economic objectives and generally have terms requiring repayment of the upfront incentive consideration if those objectives are not met. |
| (3) | Other, net primarily represents foreign exchange gains and losses related to the remeasurement of foreign currency denominated balances included in our consolidated balance sheets into the relevant functional currency. |
| (4) | Restructuring and other costs represents charges associated with business restructuring and associated changes implemented which resulted in severance benefits related to employee terminations, integration and facility opening or closing costs and other business reorganization costs. |
| (5) | Litigation and taxes, including penalties represents charges or settlements associated with airline antitrust litigation as well as payments or reserves taken in relation to certain retroactive hotel occupancy and excise tax disputes (see Note 14, Contingencies). |
| (6) | We paid an annual management fee to TPG and Silver Lake in an amount between (i) $5 million and (ii) $7 million, the actual amount of which is calculated based upon 1% of Adjusted EBITDA, earned by the company in such fiscal year up to a maximum of $7 million. In addition, the MSA provided for reimbursement of certain costs incurred by TPG and Silver Lake, which are included in this line item. The MSA was terminated in connection with our initial public offering. |
| (c) | Includes capital expenditures and capitalized implementation costs as summarized below (in thousands): |
| Three Months Ended September 30, | Nine Months Ended September 30, | |||||||||||||||
| 2014 | 2013 | 2014 | 2013 | |||||||||||||
Additions to property and equipment | $ | 49,802 | $ | 57,257 | $ | 160,385 | $ | 168,744 | ||||||||
Capitalized implementation costs | 10,005 | 10,023 | 27,602 | 48,686 | ||||||||||||
|
|
|
|
|
|
|
| |||||||||
Adjusted Capital Expenditures | $ | 59,807 | $ | 67,280 | $ | 187,987 | $ | 217,430 | ||||||||
|
|
|
|
|
|
|
| |||||||||
16. Subsequent Events
Divestiture of the Travelocity Segment
In the fourth quarter of 2014, we committed to a plan to divest of our Travelocity business. As a result of the actions described below, the Travelocity segment will be included in discontinued operations in our Annual Report on Form 10-K for the year ended December 31, 2014.
Sale of Travelocity.com
On January 23, 2015, we announced the sale of our global online travel business operated under the Travelocity brand (“Travelocity.com”) to Expedia, Inc., pursuant to the terms of an Asset Purchase Agreement
F-33
(the “Purchase Agreement”), dated January 23, 2015, by and among Sabre GLBL Inc. and Travelocity.com LP, and Expedia. The signing and closing of the Purchase Agreement occurred contemporaneously. Expedia purchased Travelocity.com pursuant to the Purchase Agreement for cash consideration of $280 million. The Purchase Agreement contains customary representations and warranties, covenants and indemnities for a transaction of this nature. We expect to utilize the cash proceeds for general corporate purposes.
As a result of the sale of Travelocity.com pursuant to the Purchase Agreement, the previously disclosed strategic marketing agreement, pursuant to which Expedia powered the technology platforms of Travelocity’s existing U.S. and Canadian websites, and the related put/call arrangement, pursuant to which Expedia could have acquired, or we could have sold to Expedia, assets relating to Travelocity.com, have been terminated.
Binding offer for lastminute.com
On December 16, 2014, we announced that we had received a binding offer from Bravofly Rumbo Group to acquire lastminute.com, the European portion of our Travelocity business. The transaction will be completed through the transfer of net liabilities and is expected to close during first quarter of 2015. We will not receive any cash proceeds or any other significant consideration in the transaction. We cannot provide any assurance that this transaction will occur on the terms described herein or at all.
The acquirer of Travelocity.com has signed, and the acquirer of lastminute.com has committed to sign as part of its binding offer, a long term agreement with our Travel Network business to continue to utilize our GDS for bookings which will generate incentive consideration to be paid by us to the acquirers.
US Airways Antitrust Litigation
In January 2015, the court issued a summary judgment opinion, which has not yet been published in full in order to preserve some of the confidential information of the parties and other parties. Based on the ruling, the judge eliminated the claims related to a majority of the alleged damages as well as rejected a request that would require us to modify language in our customer contracts. Based on the ruling, the potential remaining range of single damages has been significantly reduced. In respect of all of the remaining claims, US Airways claims damages (before trebling) of either $45 million or $73 million. US Airways has filed a motion for reconsideration on two issues decided in our favor. If the motion for reconsideration is granted in full, US Airways’ damages claim would, per US Airways’ calculations, be either $184 million or $274 million. With respect to all of the remaining claims in this case, we believe that our business practices and contract terms are lawful and fair, and we will continue to vigorously defend against the remaining claims. The claims that have been dismissed to date are subject to appeal.
F-34
Report of Independent Registered Public Accounting Firm
The Board of Directors and Stockholders of Sabre Corporation
We have audited the accompanying consolidated balance sheets of Sabre Corporation as of December 31, 2013 and 2012, and the related consolidated statements of operations, comprehensive loss, temporary equity and stockholders’ equity (deficit), and cash flows for each of the three years in the period ended December 31, 2013. Our audits also included the financial statement schedule listed in the Index at Item 16(b). These financial statements and schedule are the responsibility of the Company’s management. Our responsibility is to express an opinion on these financial statements and the schedule based on our audits.
We conducted our audits in accordance with the standards of the Public Company Accounting Oversight Board (United States). Those standards require that we plan and perform the audit to obtain reasonable assurance about whether the financial statements are free of material misstatement. We were not engaged to perform an audit of the Company’s internal control over financial reporting. Our audits included consideration of internal control over financial reporting as a basis for designing audit procedures that are appropriate in the circumstances, but not for the purpose of expressing an opinion on the effectiveness of the Company’s internal control over financial reporting. Accordingly, we express no such opinion. An audit also includes examining, on a test basis, evidence supporting the amounts and disclosures in the financial statements, assessing the accounting principles used and significant estimates made by management, and evaluating the overall financial statement presentation. We believe that our audits provide a reasonable basis for our opinion.
In our opinion, the financial statements referred to above present fairly, in all material respects, the consolidated financial position of Sabre Corporation at December 31, 2013 and 2012, and the consolidated results of its operations and its cash flows for each of the three years in the period ended December 31, 2013, in conformity with U.S. generally accepted accounting principles. Also, in our opinion, the related financial statement schedule, when considered in relation to the basic financial statements taken as a whole, presents fairly in all material respects the information set forth therein.
/s/ ERNST & YOUNG LLP
Dallas, Texas
March 10, 2014
F-35
SABRE CORPORATION
CONSOLIDATED STATEMENTS OF OPERATIONS
| Year Ended December 31, | ||||||||||||
| 2013 | 2012 | 2011 | ||||||||||
| (Amounts in thousands, except per share data) | ||||||||||||
Revenue | $ | 3,049,525 | $ | 2,974,364 | $ | 2,855,961 | ||||||
Cost of revenue(1) (2) | 1,904,850 | 1,819,235 | 1,736,041 | |||||||||
|
|
|
|
|
| |||||||
Gross margin | 1,144,675 | 1,155,129 | 1,119,920 | |||||||||
Selling, general and administrative (2) | 792,929 | 1,188,248 | 806,435 | |||||||||
Impairment | 138,435 | 573,180 | 185,240 | |||||||||
Restructuring charges | 36,551 | — | — | |||||||||
|
|
|
|
|
| |||||||
Operating income (loss) | 176,760 | (606,299 | ) | 128,245 | ||||||||
Other income (expense): | ||||||||||||
Interest expense, net | (274,689 | ) | (232,450 | ) | (174,390 | ) | ||||||
Loss on extinguishment of debt | (12,181 | ) | — | — | ||||||||
Gain on sale of business | — | 25,850 | — | |||||||||
Joint venture equity income | 15,554 | 24,487 | 26,701 | |||||||||
Joint venture goodwill impairment and intangible amortization | (3,204 | ) | (27,000 | ) | (3,200 | ) | ||||||
Other, net | (6,724 | ) | (1,385 | ) | 1,156 | |||||||
|
|
|
|
|
| |||||||
Total other expense, net | (281,244 | ) | (210,498 | ) | (149,733 | ) | ||||||
|
|
|
|
|
| |||||||
Loss from continuing operations before income taxes | (104,484 | ) | (816,797 | ) | (21,488 | ) | ||||||
(Benefit) provision for income taxes | (14,029 | ) | (195,071 | ) | 57,806 | |||||||
|
|
|
|
|
| |||||||
Loss from continuing operations | (90,455 | ) | (621,726 | ) | (79,294 | ) | ||||||
Loss from discontinued operations, net of tax | (7,176 | ) | (48,947 | ) | (23,461 | ) | ||||||
|
|
|
|
|
| |||||||
Net loss | (97,631 | ) | (670,673 | ) | (102,755 | ) | ||||||
Net income (loss) attributable to noncontrolling interests | 2,863 | (59,317 | ) | (36,681 | ) | |||||||
|
|
|
|
|
| |||||||
Net loss attributable to Sabre Corporation | (100,494 | ) | (611,356 | ) | (66,074 | ) | ||||||
Preferred stock dividends | 36,704 | 34,583 | 32,579 | |||||||||
|
|
|
|
|
| |||||||
Net loss attributable to common shareholders | $ | (137,198 | ) | $ | (645,939 | ) | $ | (98,653 | ) | |||
|
|
|
|
|
| |||||||
Basic and diluted loss per share: | ||||||||||||
Continuing operations | $ | (0.73 | ) | $ | (3.37 | ) | $ | (0.43 | ) | |||
Discontinued operations | (0.04 | ) | (0.28 | ) | (0.13 | ) | ||||||
Basic and diluted loss per share attributable to common shareholders | (0.77 | ) | (3.65 | ) | (0.56 | ) | ||||||
Basic and diluted weighted average common shares outstanding | 178,125 | 177,206 | 176,703 | |||||||||
(1) Includes amortization of upfront incentive consideration | $ | 36,649 | $ | 36,527 | $ | 37,748 | ||||||
(2) Includes stock-based compensation as follows: | ||||||||||||
Cost of revenue | $ | 1,702 | $ | 1,715 | $ | 1,454 | ||||||
Selling, general and administrative | 7,384 | 8,119 | 5,880 | |||||||||
See Notes to Consolidated Financial Statements.
CONSOLIDATED STATEMENTS OF COMPREHENSIVE LOSS
| Year Ended December 31, | ||||||||||||
| 2013 | 2012 | 2011 | ||||||||||
| (Amounts in thousands) | ||||||||||||
Net loss | $ | (97,631 | ) | $ | (670,673 | ) | $ | (102,755 | ) | |||
|
|
|
|
|
| |||||||
Other comprehensive income (loss), net of tax | ||||||||||||
Change in foreign currency translation adjustments | 13,116 | (2,125 | ) | 1,681 | ||||||||
Change in defined benefit pension and other post retirement benefit plans | 22,396 | (33,521 | ) | (28,366 | ) | |||||||
Change in unrealized gain (loss) on foreign contracts and interest rate swaps currency forward | 11,538 | 19,465 | (3,927 | ) | ||||||||
Change in other | (1,415 | ) | (2,794 | ) | (3,353 | ) | ||||||
|
|
|
|
|
| |||||||
Other comprehensive income (loss) | 45,635 | (18,975 | ) | (33,965 | ) | |||||||
|
|
|
|
|
| |||||||
Comprehensive loss | (51,996 | ) | (689,648 | ) | (136,720 | ) | ||||||
Less: Comprehensive (income) loss attributable to noncontrolling interests | (2,863 | ) | 59,317 | 36,681 | ||||||||
|
|
|
|
|
| |||||||
Comprehensive loss attributable to Sabre Corporation | $ | (54,859 | ) | $ | (630,331 | ) | $ | (100,039 | ) | |||
|
|
|
|
|
| |||||||
| Year Ended December 31, | ||||||||||||
| 2013 | 2012 | 2011 | ||||||||||
| (Amounts in thousands, except per share data) | ||||||||||||
Revenue | $ | 3,049,525 | $ | 2,974,364 | $ | 2,855,961 | ||||||
Cost of revenue(1)(2) | 1,904,850 | 1,819,235 | 1,736,041 | |||||||||
Selling, general and administrative(2) | 792,929 | 1,188,248 | 806,435 | |||||||||
Impairment | 138,435 | 573,180 | 185,240 | |||||||||
Restructuring charges | 36,551 | — | — | |||||||||
|
|
|
|
|
| |||||||
Operating income (loss) | 176,760 | (606,299 | ) | 128,245 | ||||||||
Other income (expense): | ||||||||||||
Interest expense, net | (274,689 | ) | (232,450 | ) | (174,390 | ) | ||||||
Loss on extinguishment of debt | (12,181 | ) | — | — | ||||||||
Gain on sale of business | — | 25,850 | — | |||||||||
Joint venture equity income | 15,554 | 24,487 | 26,701 | |||||||||
Joint venture goodwill impairment and intangible amortization | (3,204 | ) | (27,000 | ) | (3,200 | ) | ||||||
Other, net | (6,724 | ) | (1,385 | ) | 1,156 | |||||||
|
|
|
|
|
| |||||||
Total other expense, net | (281,244 | ) | (210,498 | ) | (149,733 | ) | ||||||
|
|
|
|
|
| |||||||
Loss from continuing operations before income taxes | (104,484 | ) | (816,797 | ) | (21,488 | ) | ||||||
(Benefit) provision for income taxes | (14,029 | ) | (195,071 | ) | 57,806 | |||||||
|
|
|
|
|
| |||||||
Loss from continuing operations | (90,455 | ) | (621,726 | ) | (79,294 | ) | ||||||
Loss from discontinued operations, net of tax | (7,176 | ) | (48,947 | ) | (23,461 | ) | ||||||
|
|
|
|
|
| |||||||
Net loss | (97,631 | ) | (670,673 | ) | (102,755 | ) | ||||||
Net income (loss) attributable to noncontrolling interests | 2,863 | (59,317 | ) | (36,681 | ) | |||||||
|
|
|
|
|
| |||||||
Net loss attributable to Sabre Corporation | (100,494 | ) | (611,356 | ) | (66,074 | ) | ||||||
Preferred stock dividends | 36,704 | 34,583 | 32,579 | |||||||||
|
|
|
|
|
| |||||||
Net loss attributable to common shareholders | $ | (137,198 | ) | $ | (645,939 | ) | $ | (98,653 | ) | |||
|
|
|
|
|
| |||||||
Basic and diluted loss per share: | ||||||||||||
Continuing operations | $ | (0.73 | ) | $ | (3.37 | ) | $ | (0.43 | ) | |||
Discontinued operations | (0.04 | ) | (0.28 | ) | (0.13 | ) | ||||||
Basic and diluted loss per share attributable to common shareholders | (0.77 | ) | (3.65 | ) | (0.56 | ) | ||||||
Basic and diluted weighted average common shares outstanding | 178,125 | 177,206 | 176,703 | |||||||||
(1) Includes amortization of upfront incentive consideration | $ | 36,649 | $ | 36,527 | $ | 37,748 | ||||||
(2) Includesstock-based compensation as follows: | ||||||||||||
Cost of revenue | $ | 1,702 | $ | 1,715 | $ | 1,454 | ||||||
Selling, general and administrative | 7,384 | 8,119 | 5,880 | |||||||||
See Notes to Consolidated Financial Statements.
F-36
SABRE CORPORATION
CONSOLIDATED STATEMENTS OF COMPREHENSIVE LOSS
| Year Ended December 31, | ||||||||||||
| 2013 | 2012 | 2011 | ||||||||||
| (Amounts in thousands) | ||||||||||||
Net loss | $ | (97,631 | ) | $ | (670,673 | ) | $ | (102,755 | ) | |||
|
|
|
|
|
| |||||||
Other comprehensive income (loss), net of tax | ||||||||||||
Change in foreign currency translation adjustments | 13,116 | (2,125 | ) | 1,681 | ||||||||
Change in defined benefit pension and other post retirement benefit plans | 22,396 | (33,521 | ) | (28,366 | ) | |||||||
Change in unrealized gain (loss) on foreign contracts and interest rate swaps currency forward | 11,538 | 19,465 | (3,927 | ) | ||||||||
Change in other | (1,415 | ) | (2,794 | ) | (3,353 | ) | ||||||
|
|
|
|
|
| |||||||
Other comprehensive income (loss) | 45,635 | (18,975 | ) | (33,965 | ) | |||||||
|
|
|
|
|
| |||||||
Comprehensive loss | (51,996 | ) | (689,648 | ) | (136,720 | ) | ||||||
Less: Comprehensive (income) loss attributable to noncontrolling interests | (2,863 | ) | 59,317 | 36,681 | ||||||||
|
|
|
|
|
| |||||||
Comprehensive loss attributable to Sabre Corporation | $ | (54,859 | ) | $ | (630,331 | ) | $ | (100,039 | ) | |||
|
|
|
|
|
| |||||||
F-37
SABRE CORPORATION
| As of December 31, | As of December 31, | |||||||||||||||
| 2013 | 2012 | 2013 | 2012 | |||||||||||||
| (Amounts in thousands, except share data) | (Amounts in thousands, except share data) | |||||||||||||||
Assets | ||||||||||||||||
Current assets | ||||||||||||||||
Cash and cash equivalents | $ | 308,236 | $ | 126,695 | $ | 308,236 | $ | 126,695 | ||||||||
Restricted cash | 2,359 | 4,440 | 2,359 | 4,440 | ||||||||||||
Accounts receivable, net | 434,288 | 417,240 | 434,288 | 417,240 | ||||||||||||
Prepaid expenses and other current assets | 53,378 | 46,020 | 53,378 | 46,020 | ||||||||||||
Current deferred income taxes | 41,431 | 32,938 | 41,431 | 32,938 | ||||||||||||
Other receivables, net | 29,511 | 42,334 | 29,511 | 42,334 | ||||||||||||
Assets of discontinued operations | 13,624 | 87,003 | 13,624 | 87,003 | ||||||||||||
|
|
|
| |||||||||||||
Total current assets | 882,827 | 756,670 | 882,827 | 756,670 | ||||||||||||
Property and equipment, net | 498,523 | 408,396 | 498,523 | 408,396 | ||||||||||||
Investments in joint ventures | 132,082 | 131,708 | 132,082 | 131,708 | ||||||||||||
Goodwill | 2,138,175 | 2,282,671 | 2,138,175 | 2,282,671 | ||||||||||||
Trademarks and brandnames, net | 323,035 | 343,233 | 323,035 | 343,233 | ||||||||||||
Acquired customer relationships, net | 221,266 | 286,532 | 221,266 | 286,532 | ||||||||||||
Other intangible assets, net | 90,257 | 145,489 | 90,257 | 145,489 | ||||||||||||
Other assets, net | 469,543 | 356,546 | 469,543 | 356,546 | ||||||||||||
|
|
|
| |||||||||||||
Total assets | $ | 4,755,708 | $ | 4,711,245 | $ | 4,755,708 | $ | 4,711,245 | ||||||||
|
|
|
| |||||||||||||
Liabilities, temporary equity and stockholders’ equity (deficit) | ||||||||||||||||
Current liabilities | ||||||||||||||||
Accounts payable | $ | 111,386 | $ | 124,893 | $ | 111,386 | $ | 124,893 | ||||||||
Travel supplier liabilities and related deferred revenue | 213,504 | 218,023 | 213,504 | 218,023 | ||||||||||||
Accrued compensation and related benefits | 117,689 | 89,439 | 117,689 | 89,439 | ||||||||||||
Accrued incentive consideration | 142,767 | 127,099 | 142,767 | 127,099 | ||||||||||||
Deferred revenues | 136,380 | 137,614 | 136,380 | 137,614 | ||||||||||||
Litigation settlement liability and related deferred revenue | 38,920 | 117,873 | 38,920 | 117,873 | ||||||||||||
Other accrued liabilities | 267,867 | 245,633 | 267,867 | 245,633 | ||||||||||||
Current portion of debt | 86,117 | 23,232 | 86,117 | 23,232 | ||||||||||||
Liabilities of discontinued operations | 41,788 | 101,433 | 41,788 | 101,433 | ||||||||||||
|
|
|
| |||||||||||||
Total current liabilities | 1,156,418 | 1,185,239 | 1,156,418 | 1,185,239 | ||||||||||||
|
|
|
| |||||||||||||
Deferred income taxes | 10,253 | 13,653 | 10,253 | 13,653 | ||||||||||||
Other noncurrent liabilities | 263,182 | 370,162 | 263,182 | 370,162 | ||||||||||||
Long-term debt | 3,643,548 | 3,420,927 | 3,643,548 | 3,420,927 | ||||||||||||
Commitments and contingencies (See Note 20) | ||||||||||||||||
Temporary equity | ||||||||||||||||
Series A Redeemable Preferred Stock: $0.01 par value; 225,000,000 authorized shares; 87,229,703 shares issued; 87,184,179 outstanding at December 31, 2013 and 2012 | 634,843 | 598,139 | 634,843 | 598,139 | ||||||||||||
Stockholders’ equity (deficit) | ||||||||||||||||
Class A Common Stock: $0.01 par value; 450,000,000 authorized shares; 178,633,409 and 177,911,922 shares issued, 178,491,568 and 177,789,402 outstanding at December 31, 2013 and 2012, respectively | 1,786 | 1,779 | ||||||||||||||
Common Stock: $0.01 par value; 450,000,000 authorized shares; 178,633,409 and 177,911,922 shares issued, 178,491,568 and 177,789,402 outstanding at December 31, 2013 and 2012, respectively | 1,786 | 1,779 | ||||||||||||||
Additional paid-in capital | 880,619 | 865,144 | 880,619 | 865,144 | ||||||||||||
Retained deficit | (1,785,554 | ) | (1,648,356 | ) | (1,785,554 | ) | (1,648,356 | ) | ||||||||
Accumulated other comprehensive loss | (49,895 | ) | (95,530 | ) | (49,895 | ) | (95,530 | ) | ||||||||
Noncontrolling interest | 508 | 88 | 508 | 88 | ||||||||||||
|
|
|
| |||||||||||||
Total stockholders’ equity (deficit) | (952,536 | ) | (876,875 | ) | (952,536 | ) | (876,875 | ) | ||||||||
|
|
|
| |||||||||||||
Total liabilities, temporary equity and stockholders’ equity (deficit) | $ | 4,755,708 | $ | 4,711,245 | $ | 4,755,708 | $ | 4,711,245 | ||||||||
|
|
|
| |||||||||||||
See Notes to Consolidated Financial Statements.
F-38
SABRE CORPORATION
CONSOLIDATED STATEMENTS OF CASH FLOWS
| Year Ended December 31, | ||||||||||||
| 2013 | 2012 | 2011 | ||||||||||
| (Amounts in thousands) | ||||||||||||
Operating Activities | ||||||||||||
Net loss | $ | (97,631 | ) | $ | (670,673 | ) | $ | (102,755 | ) | |||
Adjustments to reconcile net loss to cash provided by operating activities: | ||||||||||||
Depreciation and amortization | 307,595 | 315,733 | 293,117 | |||||||||
Litigation related charges, net | 8,156 | 345,048 | — | |||||||||
Impairment | 138,435 | 573,180 | 185,240 | |||||||||
Restructuring charges | 4,089 | — | — | |||||||||
Gain on sale of business | — | (25,850 | ) | — | ||||||||
Stock-based compensation for employees | 9,086 | 9,834 | 7,334 | |||||||||
Allowance for doubtful accounts | 9,439 | 4,328 | 3,467 | |||||||||
Deferred income taxes | (64,690 | ) | (232,273 | ) | 34,409 | |||||||
Joint venture equity income | (15,554 | ) | (24,487 | ) | (26,701 | ) | ||||||
Joint venture goodwill impairment and intangible amortization | 3,204 | 27,000 | 3,200 | |||||||||
Distributions of income from joint venture investments | 10,560 | 21,076 | 13,343 | |||||||||
Amortization of debt issuance costs | 7,104 | 23,265 | 12,539 | |||||||||
Third-party fees expensed in connection with the debt modification | 14,003 | 7,600 | — | |||||||||
Loss on extinguishment of debt | 12,181 | — | — | |||||||||
Other | (5,619 | ) | (9,866 | ) | (22,173 | ) | ||||||
Loss from discontinued operations | 7,176 | 48,947 | 23,461 | |||||||||
Changes in operating assets and liabilities: | ||||||||||||
Accounts and other receivables | (29,150 | ) | (2,691 | ) | (49,220 | ) | ||||||
Prepaid expenses and other current assets | (4,480 | ) | (3,374 | ) | 8,680 | |||||||
Capitalized implementation costs | (58,814 | ) | (78,543 | ) | (59,109 | ) | ||||||
Other assets | (64,259 | ) | (8,704 | ) | (52,817 | ) | ||||||
Accounts payable and other accrued liabilities | (31,064 | ) | 13,022 | 93,735 | ||||||||
Pensions and other postretirement benefits | (2,579 | ) | (20,236 | ) | (9,306 | ) | ||||||
|
|
|
|
|
| |||||||
Cash provided by operating activities | 157,188 | 312,336 | 356,444 | |||||||||
Investing Activities | ||||||||||||
Additions to property and equipment | (226,026 | ) | (193,262 | ) | (164,638 | ) | ||||||
Acquisitions, net of cash acquired | (30,200 | ) | (72,441 | ) | (11,338 | ) | ||||||
Proceeds from sale of assets and businesses | 10,000 | 27,915 | — | |||||||||
Proceeds from sale of equity securities | — | 6,355 | — | |||||||||
Other investing activities | (276 | ) | (4,601 | ) | (284 | ) | ||||||
|
|
|
|
|
| |||||||
Cash used in investing activities | (246,502 | ) | (236,034 | ) | (176,260 | ) | ||||||
Financing Activities | ||||||||||||
Proceeds of borrowings from lenders | 2,540,063 | 2,225,082 | — | |||||||||
Payments on borrowings from lenders | (2,261,061 | ) | (2,924,745 | ) | (30,150 | ) | ||||||
Proceeds from borrowings on revolving credit facility | — | 518,200 | 1,007,100 | |||||||||
Payments on borrowings under revolving credit facility | — | (600,200 | ) | (925,100 | ) | |||||||
Proceeds of borrowings under secured notes | — | 801,500 | — | |||||||||
Payments on borrowings under unsecured notes | — | — | (324,188 | ) | ||||||||
Debt issuance costs | (19,116 | ) | (43,275 | ) | — | |||||||
Proceeds from exercise of stock options | 3,073 | 2,696 | 1,202 | |||||||||
Dividends paid | (2,443 | ) | (2,214 | ) | (1,843 | ) | ||||||
Decrease (increase) in restricted cash | 2,081 | 4,346 | (5,342 | ) | ||||||||
Other financing activities | (425 | ) | (6,510 | ) | 6,781 | |||||||
|
|
|
|
|
| |||||||
Cash provided by (used in) financing activities | 262,172 | (25,120 | ) | (271,540 | ) | |||||||
Cash Flows from Discontinued Operations | ||||||||||||
Net cash provided by (used in) operating activities | (14,096 | ) | (6,582 | ) | (25,241 | ) | ||||||
Net cash provided by (used in) investing activities | (6 | ) | 270 | (4,550 | ) | |||||||
Proceeds from sale, net of cash sold | 20,502 | 19,157 | — | |||||||||
|
|
|
|
|
| |||||||
Net cash provided by (used in) discontinued operations | 6,400 | 12,845 | (29,791 | ) | ||||||||
Effect of exchange rate changes on cash and cash equivalents | 2,283 | 4,318 | 2,976 | |||||||||
Increase (decrease) in cash and cash equivalents | 181,541 | 68,345 | (118,171 | ) | ||||||||
Cash and cash equivalents at beginning of period | 126,695 | 58,350 | 176,521 | |||||||||
|
|
|
|
|
| |||||||
Cash and cash equivalents at end of period | $ | 308,236 | $ | 126,695 | $ | 58,350 | ||||||
|
|
|
|
|
| |||||||
Cash payments for income taxes | $ | 4,224 | $ | 20,177 | $ | 32,491 | ||||||
Cash payments for interest | $ | 255,620 | $ | 264,990 | $ | 184,449 | ||||||
Capitalized interest | $ | 10,966 | $ | 8,705 | $ | 6,899 | ||||||
Preferred shares dividend | $ | 36,704 | $ | 34,583 | $ | 32,579 | ||||||
See Notes to Consolidated Financial Statements.
F-39
SABRE CORPORATION
CONSOLIDATED STATEMENTS OF TEMPORARY EQUITY AND
STOCKHOLDERS’ EQUITY (DEFICIT)
| Temporary Equity | Stockholders’ Equity (Deficit) | Temporary Equity | Stockholders’ Equity (Deficit) | |||||||||||||||||||||||||||||||||||||||||||||||||||||||||||||||||||||
| Series A Redeemable Preferred Stock | Class A Common Stock | Additional Paid in Capital | Retained Earnings (Deficit) | Accumulated Other Comprehensive Income (loss) | Noncontrolling Interest | Total Stockholders’ Equity (Deficit) | Series A Redeemable Preferred Stock | Common Stock | Additional Paid in Capital | Retained Earnings (Deficit) | Accumulated Other Comprehensive Income (loss) | Noncontrolling Interest | Total Stockholders’ Equity (Deficit) | |||||||||||||||||||||||||||||||||||||||||||||||||||||||||||
| Shares | Amount | Shares | Amount | Shares | Amount | Shares | Amount | |||||||||||||||||||||||||||||||||||||||||||||||||||||||||||||||||
| (Amounts in thousands, except share data) | (Amounts in thousands, except share data) | |||||||||||||||||||||||||||||||||||||||||||||||||||||||||||||||||||||||
Balance at December 31, 2010 | 87,229,703 | $ | 530,977 | 176,633,134 | $ | 1,766 | $ | 890,016 | $ | (903,764 | ) | $ | (42,590 | ) | $ | 19,831 | $ | (34,741 | ) | 87,229,703 | $ | 530,977 | 176,633,134 | $ | 1,766 | $ | 890,016 | $ | (903,764 | ) | $ | (42,590 | ) | $ | 19,831 | $ | (34,741 | ) | ||||||||||||||||||||||||||||||||||
Comprehensive loss | — | — | — | — | — | (66,074 | ) | (33,965 | ) | (36,681 | ) | (136,720 | ) | — | — | — | — | — | (66,074 | ) | (33,965 | ) | (36,681 | ) | (136,720 | ) | ||||||||||||||||||||||||||||||||||||||||||||||
Issuances pursuant to: | ||||||||||||||||||||||||||||||||||||||||||||||||||||||||||||||||||||||||
Accrued preferred shares dividend | — | 32,579 | — | — | — | (32,579 | ) | — | — | (32,579 | ) | — | 32,579 | — | — | — | (32,579 | ) | — | — | (32,579 | ) | ||||||||||||||||||||||||||||||||||||||||||||||||||
Amortization of stock-based compensation | — | — | — | — | 7,334 | — | — | — | 7,334 | — | — | — | — | 7,334 | — | — | — | 7,334 | ||||||||||||||||||||||||||||||||||||||||||||||||||||||
Settlement of stock-based awards | — | — | 255,686 | 3 | 1,199 | — | — | — | 1,202 | — | — | 255,686 | 3 | 1,199 | — | — | — | 1,202 | ||||||||||||||||||||||||||||||||||||||||||||||||||||||
Dividends paid to noncontrolling interest on subsidiary common stock | — | — | — | — | — | — | — | (1,843 | ) | (1,843 | ) | — | — | — | — | — | — | — | (1,843 | ) | (1,843 | ) | ||||||||||||||||||||||||||||||||||||||||||||||||||
Other | — | — | — | — | 428 | — | — | — | 428 | — | — | — | — | 428 | — | — | — | 428 | ||||||||||||||||||||||||||||||||||||||||||||||||||||||
|
|
|
|
|
|
|
|
|
|
|
|
|
|
|
|
|
| |||||||||||||||||||||||||||||||||||||||||||||||||||||||
Balance at December 31, 2011 | 87,229,703 | $ | 563,556 | 176,888,820 | $ | 1,769 | $ | 898,977 | $ | (1,002,417 | ) | $ | (76,555 | ) | $ | (18,693 | ) | $ | (196,919 | ) | 87,229,703 | $ | 563,556 | 176,888,820 | $ | 1,769 | $ | 898,977 | $ | (1,002,417 | ) | $ | (76,555 | ) | $ | (18,693 | ) | $ | (196,919 | ) | ||||||||||||||||||||||||||||||||
Comprehensive loss | — | — | — | — | — | (611,356 | ) | (18,975 | ) | (59,317 | ) | (689,648 | ) | — | — | — | — | — | (611,356 | ) | (18,975 | ) | (59,317 | ) | (689,648 | ) | ||||||||||||||||||||||||||||||||||||||||||||||
Issuances pursuant to: | ||||||||||||||||||||||||||||||||||||||||||||||||||||||||||||||||||||||||
Accrued preferred shares dividend | — | 34,583 | — | — | — | (34,583 | ) | — | — | (34,583 | ) | — | 34,583 | — | — | — | (34,583 | ) | — | — | (34,583 | ) | ||||||||||||||||||||||||||||||||||||||||||||||||||
Amortization of stock-based compensation | — | — | — | — | 6,859 | — | — | — | 6,859 | — | — | — | — | 6,859 | — | — | — | 6,859 | ||||||||||||||||||||||||||||||||||||||||||||||||||||||
Settlement of stock-based awards | — | — | 828,311 | 8 | 2,688 | — | — | — | 2,696 | — | — | 828,311 | 8 | 2,688 | — | — | — | 2,696 | ||||||||||||||||||||||||||||||||||||||||||||||||||||||
Re-acquisition of non- controlling interest | — | — | 194,791 | 2 | (41,941 | ) | — | — | 40,203 | (1,736 | ) | — | — | 194,791 | 2 | (41,941 | ) | — | — | 40,203 | (1,736 | ) | ||||||||||||||||||||||||||||||||||||||||||||||||||
Other | — | — | — | — | (1,439 | ) | — | — | — | (1,439 | ) | — | — | — | — | (1,439 | ) | — | — | — | (1,439 | ) | ||||||||||||||||||||||||||||||||||||||||||||||||||
Dividends paid to noncontrolling interest on subsidiary common stock | — | — | — | — | — | — | — | (2,214 | ) | (2,214 | ) | — | — | — | — | — | — | — | (2,214 | ) | (2,214 | ) | ||||||||||||||||||||||||||||||||||||||||||||||||||
Sale of controlling interest in Sabre Pacific | — | — | — | — | — | — | — | 40,109 | 40,109 | — | — | — | — | — | — | — | 40,109 | 40,109 | ||||||||||||||||||||||||||||||||||||||||||||||||||||||
|
|
|
|
|
|
|
|
|
|
|
|
|
|
|
|
|
| |||||||||||||||||||||||||||||||||||||||||||||||||||||||
Balance at December 31, 2012 | 87,229,703 | $ | 598,139 | 177,911,922 | $ | 1,779 | $ | 865,144 | $ | (1,648,356 | ) | $ | (95,530 | ) | $ | 88 | $ | (876,875 | ) | 87,229,703 | $ | 598,139 | 177,911,922 | $ | 1,779 | $ | 865,144 | $ | (1,648,356 | ) | $ | (95,530 | ) | $ | 88 | $ | (876,875 | ) | ||||||||||||||||||||||||||||||||||
Comprehensive loss | — | — | — | — | — | (100,494 | ) | 45,635 | 2,863 | (51,996 | ) | — | — | — | — | — | (100,494 | ) | 45,635 | 2,863 | (51,996 | ) | ||||||||||||||||||||||||||||||||||||||||||||||||||
Issuances pursuant to: | ||||||||||||||||||||||||||||||||||||||||||||||||||||||||||||||||||||||||
Accrued preferred shares dividend | — | 36,704 | — | — | — | (36,704 | ) | — | — | (36,704 | ) | — | 36,704 | — | — | — | (36,704 | ) | — | — | (36,704 | ) | ||||||||||||||||||||||||||||||||||||||||||||||||||
Amortization of stock-based compensation | — | — | — | — | 7,564 | — | — | — | 7,564 | — | — | — | — | 7,564 | — | — | — | 7,564 | ||||||||||||||||||||||||||||||||||||||||||||||||||||||
Settlement of stock-based awards | — | — | 721,487 | 7 | 7,911 | — | — | — | 7,918 | — | — | 721,487 | 7 | 7,911 | — | — | — | 7,918 | ||||||||||||||||||||||||||||||||||||||||||||||||||||||
Dividends paid to noncontrolling interest on subsidiary common stock | — | — | — | — | — | — | — | (2,443 | ) | (2,443 | ) | — | — | — | — | — | — | — | (2,443 | ) | (2,443 | ) | ||||||||||||||||||||||||||||||||||||||||||||||||||
|
|
|
|
|
|
|
|
|
|
|
|
|
|
|
|
|
| |||||||||||||||||||||||||||||||||||||||||||||||||||||||
Balance at December 31, 2013 | 87,229,703 | $ | 634,843 | 178,633,409 | $ | 1,786 | $ | 880,619 | $ | (1,785,554 | ) | $ | (49,895 | ) | $ | 508 | $ | (952,536 | ) | 87,229,703 | $ | 634,843 | 178,633,409 | $ | 1,786 | $ | 880,619 | $ | (1,785,554 | ) | $ | (49,895 | ) | $ | 508 | $ | (952,536 | ) | ||||||||||||||||||||||||||||||||||
|
|
|
|
|
|
|
|
|
|
|
|
|
|
|
|
|
| |||||||||||||||||||||||||||||||||||||||||||||||||||||||
See Notes to Consolidated Financial Statements.Statements
F-40
SABRE CORPORATION
NOTES TO CONSOLIDATED FINANCIAL STATEMENTS
1. General Information
Sabre Corporation is a Delaware corporation formed in December 2006. On March 30, 2007, Sabre Corporation acquired Sabre Holdings Corporation (“Sabre Holdings”). Sabre Holdings is the sole subsidiary of Sabre Corporation. Sabre GLBL Inc. is the principal operating subsidiary and sole direct subsidiary of Sabre Holdings. Sabre GLBL Inc. or its direct or indirect subsidiaries conduct all of our businesses. In these consolidated financial statements, references to the “Company”, “we”, “our”, “ours” and “us” refer to Sabre Corporation and its consolidated subsidiaries unless otherwise stated or the context otherwise requires.
We are a leading technology solutions provider to the global travel and tourism industry. We operate through three business segments: (i) Travel Network, our global travel marketplace for travel suppliers and travel buyers, (ii) Airline and Hospitality Solutions, an extensive suite of travel industry leading software solutions primarily for airlines and hotel properties, and (iii) Travelocity, our portfolio of online consumer travele-commerce businesses through which we provide travel content and booking functionality primarily for leisure travelers.
Travel Network
Travel Network is our globalbusiness-to-business travel marketplace and consists primarily of our global distribution system (“GDS”), which serves the role of a transaction processor for the travel industry, and a broad set of solutions that integrate with our GDS to add value for travel supplies and travel buyers. Our GDS facilitates travel by efficiently bringing together travel content such as inventory, prices, and availability from a broad array of travel suppliers, including airlines, hotels, car rental brands, rail carriers, cruise lines and tour operators, with a large network of travel buyers, including online and offline travel agencies, travel management companies, and corporate travel departments. Travel Network primarily generates revenue throughtransaction-based fees.
Airline and Hospitality Solutions
Our Airline and Hospitality Solutions business offers a broad portfolio of software technology products and solutions, through thesoftware-as-a-service (“SaaS”) and hosted delivery model. Our Airline Solutions business provides comprehensive software solutions that help our airline customers better market, sell, serve and operate. We offer customizable reservations software that supports the essentials of a passenger service system. Our other airline software solutions help airline customers make decisions around marketing and planning, merchandising offering and managing network operations. Our Hospitality Solutions business provides distribution, operations and marketing solutions to hotel suppliers. Our offerings include reservations systems, property management systems, marketing services through our customers’ various distribution channels and consulting services. Our Airline and Hospitality Solutions primarily generatestransaction-based fees for the usage of our software pursuant to contracts with terms that typically range between three and ten years and generally include minimum annual volume requirements.
Travelocity
Travelocity is our family of online consumer travele-commerce businesses that serves primarily leisure travelers. We connect these travelers with travel products and services acrosswell-known and trusted global brands. Through our websites, travelers can research, shop and book airlines, hotels, car rental companies, cruise lines, vacation andlast-minute travel packages Travelocity is comprised primarily of (i) Travelocity.com, an online travel agency focusing on the United States and Canada, (ii) lastminute.com, an OTA focusing on Europe,
F-41
and (iii) Travel Partner Network (“TPN”), ourbusiness-to-business offering that provides travel content and booking functionality to, as well as market and sell products and services through, private label websites for suppliers and distribution partners. In the third quarter of 2013, we initiated plans to shift our Travelocity businesses in the United States and Canada away from a highfixed-cost model to alower-cost,performance-based revenue structure. See Note 5, Restructuring Charges. In February 2014, we sold the assets associated with TPN. See Note 22, Subsequent Events.
2. Summary of Significant Accounting Policies
Basis of Presentation—The consolidated financial statements have been prepared in accordance with accounting principles generally accepted in the United States (“GAAP”). We consolidate all of ourmajority-owned subsidiaries and companies over which we exercise control through majority voting rights. Other than as discussed in the following paragraphs, no other entities are currently consolidated due to control through operating agreements, financing agreements, or as the primary beneficiary of a variable interest entity. The consolidated financial statements include our accounts after elimination of all significant intercompany balances and transactions. All dollar amounts in the financial statements and the tables in the notes, exceptper-share amounts, are stated in thousands of U.S. dollars unless otherwise indicated. All amounts in the notes reference results from continuing operations unless otherwise indicated.
In December 2009, ourwholly-owned subsidiary Travelocity.com Inc. was converted into Travelocity.com LLC, a Delaware limited liability company, pursuant to Delaware law, and the capital structure of Travelocity.com LLC was split into common and preferred units. On December 31, 2009, 95% of the common units of Travelocity.com LLC were distributed as a dividend to anewly-formed Delaware corporation, TVL Common, Inc., which is owned by the holders of record of Sabre Corporation’s preferred stock. We retained the remaining 5% of the common units and 100% of the preferred units. On December 31, 2012, we implemented a series of transactions which resulted in the merger of TVL Common, Inc. back into our capital structure. The owners of 95% of the common units of TVL Common, Inc. received shares of Sabre Corporation in exchange. For so long as any preferred units remained outstanding, the holder(s) of the preferred units had full voting rights and control of Travelocity.com LLC and the holder(s) of common units had no voting rights or control. As such, we, as the holder of all of the preferred units, consolidated the results of Travelocity.com LLC and presented a noncontrolling interest for the portion of the common units distributed through the dividend. Profits and losses were allocated in accordance with the limited liability company agreement and securities held by each party. This merger was a reacquisition of a noncontrolling interest from an entity under common control and has been recorded as an equity transaction.
Equity Method Investments—We utilize the equity method to account for our interests in joint ventures and investments in stock of other companies that we do not control but over which we exert significant influence. Investments in the common stock of other companies over which we do not exert significant influence are accounted for at cost. We periodically evaluate equity and debt investments in entities accounted for at cost or under the equity method for impairment by reviewing updated financial information provided by the investee, including valuation information from new financing transactions by the investee and information relating to competitors of investees when available. If we determine that a cost method investment is other than temporarily impaired, the carrying value of the investment is reduced to its estimated fair value through earnings. For the year ended December 31, 2012, joint venture equity income included a $24 million impairment of goodwill recorded by one of our investees. For the years ended December 31, 2013, 2012 and 2011, impairments of investments carried at cost were not material to our results of operations.
F-42
The following table displays the name of each of those investees that we do not control but over which we exert significant influence, and our voting interest in their stock held at December 31, 2013:
Joint Venture | Voting Interest | |||
Auto Holidays (Pty) Limited (South Africa) | 50 | % | ||
ESS Elektroniczne Systemy Spzedazy Sp. zo.o | 40 | % | ||
ABACUS International PTE Ltd | 35 | % | ||
Sabre Bulgaria AD | 20 | % | ||
Our investments in joint ventures on the consolidated balance sheets includes $93 million and $97 million, as of December 31, 2013 and 2012, respectively, of excess basis over our underlying equity in joint ventures. This differential represents goodwill in addition to identifiable intangible assets which are being amortized to joint venture intangible amortization over their estimated lives.
Reclassifications—Certain reclassifications have been made to the prior years’ consolidated financial statements to conform to the 2013 presentation. TheseOther than as described below, these reclassifications are not material, either individually or in the aggregate, to our consolidated financial statements.
In 2013, we have removed the presentation of gross margin from our consolidated statement of operations. Additionally, we have reclassified depreciation and amortization from a single line in our consolidated statement of operations to be reflected as a part of cost of revenues or selling, general and administrative expenses based on the nature of the expense. The impact to cost of revenue and selling, general and administrative, considering the impact of discontinued operations, for the year ended December 31, 2012 was an increase to cost of revenue of $198 million and an increase to selling, general and administrative of $118 million. The impact for the year ended December 31, 2011 was an increase to cost of revenue of $173 million and an increase to selling, general and administrative of $120 million. The amount of depreciation and amortization reclassified to discontinued operations was $2 million for each of the years ended December 31, 2012 and 2011.
In addition, certain amounts previously reported in our December 31, 2012 and 2011 financial statements have been reclassified to conform to December 31, 2013 presentation, as a result of discontinued operations. See Note 4, Discontinued Operations and Dispositions.
Use of Estimates—The preparation of these financial statements in conformity with GAAP requires that certain amounts be recorded based on estimates and assumptions made by management. Actual results could differ from these estimates and assumptions. Our accounting policies, which include significant estimates and assumptions, include, among other things, estimation of the collectability of accounts receivable, amounts for future cancellations of bookings processed through the Sabre global distribution system (“GDS”), revenue recognition for software development, determination of the fair value of assets and liabilities acquired in a business combination, determination of the fair value of derivatives, the evaluation of the recoverability of the carrying value of intangible assets and goodwill, assumptions utilized in the determination of pension and other postretirement benefit liabilities, determination of the fair value of our litigation settlement payable, assumptions made in the calculation of restructuring liabilities and the evaluation of uncertainties surrounding the calculation of our tax assets and liabilities. These policies are discussed in greater detail below.
Revenue Recognition—We employ a number of revenue models across our businesses, depending on the dynamics of the industry segment and the technology on which the revenue is based. Some revenue models are used in multiple businesses. Travel Network primarily employs the transaction revenue model. Airline and Hospitality Solutions primarily employs the SaaS and hosted and consulting revenue models, as well as the software licensing fee model to a lesser extent. Travelocity has primarily employed two revenue models: the merchant model, which we refer to as our “Net Rate Program,” under which we recognize a majority of our hotel revenues, and the agency model, under which we recognize most of our airline, car and cruise revenues and a small portion of hotel revenues. Beginning in the fourth quarter of 2013, Travelocity in the U.S. and Canada
F-43
began shifting to the marketing fee revenue model while Travelocity—Europe continues to primarily employ the merchant model and agency model. Both Travel Network and Travelocity derive some of their revenues from the media model, earning advertising revenues from travel suppliers and other entities that advertise their products to travelers and travel agencies using our networks. We report revenue net of anyrevenue-based taxes assessed by governmental authorities that are imposed on and concurrent with specificrevenue-producing transactions.
Transaction Revenue Model—This model accounts for substantially all of Travel Network’s revenues. We define a direct billable booking as any booking that generates a fee directly to Travel Network. Transaction fees include, but are not limited to, transaction fees paid by travel suppliers for selling their inventory through the Sabre GDS and transaction fees paid by travel agency subscribers related to their use of the Sabre GDS.
Pursuant to this model, a transaction occurs when a travel agency or corporate travel department books, or reserves, a travel supplier’s product on the Sabre GDS. We receive revenue from a travel supplier, travel agency, or corporate travel department depending upon the commercial arrangement represented in each of their contracts.
Transaction revenue for airline travel reservations is recognized at the time of the booking of the reservation, net of estimated future cancellations. Our transaction fee cancellation reserve was $8 million at December 31, 2013 and 2012. Transaction revenue for car rental, hotel bookings and other travel providers is recognized at the time the reservation is used by the customer.
Software-as-a-Service and Hosted Revenue Model—SaaS and hosted is the primary revenue model employed by Airline and Hospitality Solutions. In this revenue model, we host software solutions on our own secure platforms, or deploy it through our SaaS solutions and we maintain the software as well as the infrastructure it employs. Our customers, which include airlines, airports and hotel companies, pay us an implementation fee and a recurringusage-based fee for the use of the software pursuant to contracts with terms that typically range between three and ten years and generally include minimum annual volume requirements. Thisusage-based fee arrangement allows our customers to pay for software normally on a monthly basis, to the extent that it is used. Similar contracts with the same customer which are entered into at or around the same period are analyzed for revenue recognition purposes on a combined basis. Revenue from implementation fees is generally recognized over the term of the agreement. The amount of periodic usage fees is typically based on a metric relevant to the software’s purpose. We recognize revenue from recurringusage-based fees in the period earned, which typically fluctuates based on areal-time metric, such as the actual number of passengers boarded or the actual number of hotel bookings made in a given month.
Consulting Revenue Model—Our SaaS and hosted offerings can be sold as part ofmultiple-element agreements for which we also provide consulting services. Our consulting services are primarily focused on helping customers achieve better utilization of and return on their software investment. Often we provide consulting services during the implementation phase of our SaaS solutions. In such cases, we account for consulting service revenue separately from implementation and recurringusage-based fees, with value assigned to each element based on its relative selling price to the total selling price. We perform a market analysis on a periodic basis to determine the range of selling prices for each product and service. Estimated selling prices are set for each product and service delivered to customers. The revenue for consulting services is generally recognized over the period the services are performed.
Software Licensing Fee Revenue Model—The software licensing fee revenue model is utilized by Airline and Hospitality Solutions. Under this model, we generate revenue by charging customers for the installation and use of our software products. Some contracts under this model generate additional revenue for the maintenance of the software product. When software is sold without associated customization or implementation services, revenue from software licensing fees is recognized when all of the following are met: (i) the software is delivered, (ii) fees are fixed or determinable, (iii) no undelivered elements are essential to the functionality of delivered software, and (iv) collection is probable. When software is sold with customization or implementation services, revenue from software licensing fees is recognized based on the percentage of completion of the
F-44
customization and implementation services. Fees for software maintenance are recognized ratably over the life of the contract. We are unable to determinevendor-specific objective evidence of fair value for software maintenance fees. Therefore, when fees for software maintenance are included in software license agreements, revenue from the software license, customization, implementation and the maintenance are recognized ratably over the related contract term.
Marketing Fee Revenue Model—In the third quarter of 2013, we initiated plans to shift Travelocity in the U.S. and Canada away from afixed-cost model to alower-cost, performance based shared revenue structure. We entered into an exclusive,long-term strategic marketing agreement with Expedia Inc., in which Expedia will power the technology for Travelocity’s existing U.S. and Canadian websites, as well as provide Travelocity with access to Expedia’s supply and customer service platforms. As part of the agreement, Expedia is required to pay
us aperformance-based marketing fee that will vary based on the amount of travel booked throughTravelocity-branded websites powered by Expedia. The marketing fee we receive is recorded as revenue and the costs we incur for marketing and that are to promote the Travelocity brand are recorded as selling, general and administrative expense in our results of operations. The revenue recognized under this model was not material to our results of operations for the year ended December 31, 2013. See Note 5, Restructuring Charges.
Merchant Revenue Model—Pursuant to this Travelocity model, which we refer to as our “Net Rate Program,” we are the merchant of record for credit card processing for travel accommodations. We primarily use this model for revenue from hotel reservations and dynamically packaged combinations. We are the merchant of record for these transactions, but we do not purchase and resell travel accommodations and do not have any obligations with respect to travel accommodations offered online that we do not sell. Instead, we act as an intermediary by entering into agreements with travel suppliers for the right to market their products, services and other content offerings atpre-determined net rates. We market net rate offerings to travelers at prices that include an amount sufficient to pay the travel supplier for providing the travel accommodations and any occupancy and other local taxes, as well as additional amounts representing our service fees. Under this revenue model, we requirepre-payment by the traveler at the time of booking.
Travelocity recognizes net rate revenue forstand-alone air travel at the time the travel is booked with a reserve for estimated future canceled bookings. Vacation packages, car rentals and hotel net rate revenues are recognized at the date of consumption.
For Travelocity’s net rate and dynamically packaged combinations, we record net rate revenues based on the total amount paid by the customer for products and services, minus our payment to the travel supplier. At the time a customer makes and prepays a reservation, we accrue a supplier liability based on the amount we expect to be billed by our travel suppliers. In some cases, a portion of Travelocity’s prepaid net rate and travel package transactions goes unused by the traveler. In those circumstances, Travelocity may not be billed the full amount of the accrued supplier liability. We reduce the accrued supplier liability for amounts aged more than six months and record it as revenue if certain conditions are met. Our process for determining when aged amounts may be recognized as revenue includes consideration of key factors such as the age of the supplier liability, historical billing and payment information, among others.
Agency Revenue Model—This model is employed by Travelocity only and generates revenues via transaction fees and commissions from travel suppliers for reservations made by travelers through our websites. Under this model, we act as an agent in the transaction by passing reservations booked by travelers to the relevant airline, hotel, car rental company, cruise line or other travel supplier, while the travel supplier serves as merchant of record and processes the payment from the traveler.
Under the agency revenue model, Travelocity recognizes commission revenue forstand-alone air travel at the time the travel is booked with a reserve for estimated future canceled bookings. Commissions from car and hotel travel suppliers are recognized upon the scheduled date of travel consumption. We record car and hotel commission revenue net of an estimated reserve for cancellations,no-shows, and uncollectable commissions. As of December 31, 2013 and 2012, our reserve was approximately $2 million and $3 million, respectively.
F-45
Travelocity also generates revenues from fees for offline bookings for air and packages, which are generally booked through call center agents. These fees, net of tax recovery charges collected, are recognized as revenue at the time the related travel is booked or when the travel is canceled or changed. Travelocity also charges service fees to its customers for certain types of transactions booked through itsconsumer-facing websites, including processing service fees on Travelocity.com hotel bookings, as well as miscellaneous service fees including cancellation fees, credit card fees, change fees and delivery fees. These fees, net of tax recovery charges collected, are recognized as revenue at the time the related travel is booked or when the travel is canceled or changed.
Travelocity also generatesinsurance-related revenue from third party insurance providers whose air, total trip and cruise insurance is made available on our websites. Insurance revenue is recognized at the time the travel is booked.
Media Revenue Model—The media revenue model is used to record advertising revenue from travel suppliers and other entities that advertise their products to travelers on Travelocity’s sites and to a lesser extent, on our GDS. Advertisers use two types of advertising metrics: display advertising and action advertising. In display advertising, advertisers usually pay based on the number of customers who view the advertisement, and are charged based on cost per thousand impressions. In action advertising, advertisers usually pay based on the number of customers who perform a specific action, such as click on the advertisement, or other meaningful variable, and are charged based on the cost per action. Advertising revenues are recognized in the period that the advertising impressions are delivered or theclick-through or other specific action occurs.
Advertising Costs—Advertising costs are expensed as incurred. Advertising costs expensed in the years ended December 31, 2013, 2012 and 2011 totaled approximately $153 million, $163 million and $191 million, respectively. From time to time, we enter into advertising barter transactions which are recorded based on the fair value of the advertising surrendered. For the years ended December 31, 2013, 2012 and 2011, we recognized revenue associated with advertising barter transactions of $2 million, $9 million and $16 million, respectively, and expense of $2 million, $9 million and $16 million, respectively.
Research and Development—We define research and development costs as costs incurred up to the point of technological feasibility for software developed to be sold, leased, or marketed to others. Research and development costs are expensed as incurred. We expensed approximated $6 million, $4 million and $3 million of research and development costs for the years ended December 31, 2013, 2012 and 2011, respectively.
Foreign Currency Risk—We are exposed to foreign exchange rate fluctuations as we remeasure foreign currency transactions in the financial statements into the relevant functional currency. If there is a change in foreign currency exchange rates, the conversion of the foreign currency transactions into its functional currency will lead to transaction gains or losses, which are recorded in our consolidated statements of operations as a component of other, net.
We are also exposed to foreign exchange rate fluctuations as we translate the financial statements of ournon-U.S. dollar functional currency foreign subsidiaries into U.S. dollars in consolidation. If there is a change in foreign currency exchange rates, the conversion of the foreign subsidiaries’ financial statements into U.S. dollars will lead to translation gains or losses, which are recorded net as a component of other comprehensive income (loss).
Statements of Cash Flows—We use the “cumulative earnings” approach for determining the cash flow presentation of distributions from our joint ventures. Distributions received on the investments are included in our consolidated statements of cash flows in operating activities, unless the cumulative distributions exceed our portion of cumulative equity in earnings of the joint venture, in which case the excess distributions are deemed to be returns of the investment and are included in our consolidated statements of cash flows in investing activities. During the periods presented, there were no distributions from joint ventures classified as investing cash flows.
F-46
Cash and Cash Equivalents—We classify all highly liquid instruments, including money market funds and money market securities with original maturities of three months or less, as cash equivalents.
Restricted Cash—Restricted cash balances relate to security provided for certain bank guarantees and banking services for specific subsidiaries in Europe within the Travelocity segment.
Financial Instruments—The carrying value of our financial instruments including cash and cash equivalents, and accounts receivable approximate their fair values. Our derivative financial instruments are carried at their estimated fair values. Our debt instruments are recorded at carrying value; the fair value of our
senior unsecured notes issued in March 2006 (“2016 Notes”), our senior unsecured notes issued in May 2012 (“2019 Notes”), and term loan were determined based on quoted market prices for the identical liability when traded as an asset in an active market.
Derivatives—We recognize all derivatives, including embedded derivatives, on the consolidated balance sheets at fair value. If the derivative is designated as a hedge, depending on the nature of the hedge, changes in the fair value of derivatives are offset against the change in fair value of the hedged item through earnings (a “fair value hedge”) or recognized in other comprehensive income until the hedged item is recognized in earnings (a “cash flow hedge”). The ineffective portion of the change in fair value of a derivative designated as a hedge is immediately recognized in earnings. For derivative instruments not designated as hedging instruments, the gain or loss resulting from the change in fair value is recognized in current earnings during the period of change. No hedging ineffectiveness was recorded in earnings during the periods presented.
Income Taxes—Deferred income tax assets and liabilities are determined based on differences between financial reporting and income tax basis of assets and liabilities and are measured using the tax rates and laws in effect at the time of such determination. We regularly review our deferred tax assets for recoverability and a valuation allowance is provided when it is more likely than not that some portion or all of a deferred tax asset will not be realized. In assessing the need for a valuation allowance, we make estimates and assumptions regarding projected future taxable income, our ability to carry back operating losses to prior periods, the reversal of deferred tax liabilities and implementation of tax planning strategies. We reassess these assumptions regularly which could cause an increase or decrease to the valuation allowance resulting in an increase or decrease in the effective tax rate, and could materially impact our results of operations.
We recognize liabilities when we believe that an uncertain tax position may not be fully sustained upon examination by the tax authorities. Liabilities are recognized for uncertain tax positions that do not pass atwo-step approach for recognition and measurement. First, we evaluate the tax position for recognition by determining if based solely on its technical merits, it is more likely than not to be sustained upon examination. Secondly, for positions that pass the first step, we measure the tax benefit as the largest amount which is more than 50% likely of being realized upon ultimate settlement. It is our policy to recognize penalties and interest accrued related to income taxes as a component of the provision (benefit) for income taxes. See Note 10, Income Taxes.
Operating Leases—We lease certain facilities underlong-term,non-cancelable operating leases. Certain of our lease agreements contain renewal options and/or payment escalations based on fixed annual increases, local consumer price index changes or market rental reviews. We recognize rent expense on astraight-line basis over the term of the lease.
Property and Equipment—Property and equipment are stated at cost less accumulated depreciation, which is calculated on thestraight-line basis. Our depreciation and amortization policies are as follows:
Buildings | Lesser of lease term or 35 years | |
Leasehold improvements | Lesser of lease term or useful life | |
Furniture and fixtures | 5 to 15 years | |
Equipment, general office and computer | 3 to 5 years | |
Software developed for internal use | 3 to 7 years |
F-47
We also capitalize certain costs related to applications, infrastructure and graphics development for the Sabre System and our websites under authoritative guidance oninternal-use software intangibles. Capitalizable costs consist of (a) certain external direct costs of materials and services incurred in developing or obtaininginternal-use computer software and (b) payroll andpayroll-related costs for employees who are directly associated with and who devote time to the Sabre System andweb-related development projects. Costs incurred during the preliminary project stage or costs incurred for data conversion activities and training, maintenance and general and administrative or overhead costs are expensed as incurred. Costs that cannot be separated between
maintenance of, and relatively minor upgrades and enhancements to,internal-use software are also expensed as incurred. Depreciation and amortization for property and equipment totaled $131 million, $136 million and $123 million for the years ended December 31, 2013, 2012 and 2011, respectively.
Property and equipment is evaluated for impairment whenever events or changes in circumstances indicate that the carrying amount of the assets used in combination to generate cash flows largely independent of other assets may not be recoverable.
Goodwill and Intangible Assets—Upon the acquisition of a business, we record goodwill and intangible assets at fair value. Additionally, we capitalize the costs incurred to renew or extend the term of our patents. Goodwill and intangible assets determined to have indefinite useful lives are not amortized.Definite-lived intangible assets are amortized on astraight-line basis and assigned useful economic lives of four to thirty years, depending on classification. The useful economic lives are evaluated on an annual basis.
We evaluate goodwill for impairment on an annual basis or if impairment indicators exist. We begin with the qualitative assessment of whether it is more likely than not that a reporting unit’s fair value is less than its carrying value before applying thetwo-step goodwill impairment model described below. If it is determined through the qualitative assessment that a reporting unit’s fair value is more likely than not greater than its carrying value, the remaining impairment steps are unnecessary. Otherwise, we perform a comparison of the estimated fair value of the reporting unit to which the goodwill has been assigned to the sum of the carrying value of the assets and liabilities of that unit. If the sum of the carrying value of the assets and liabilities of a reporting unit exceeds the estimated fair value of that reporting unit, the carrying value of the reporting unit’s goodwill is reduced to its implied fair value through an adjustment to the goodwill balance, resulting in an impairment charge. We have identified six reporting units, including Travelocity—North America, Travelocity—Europe, Travelocity—Asia Pacific, Sabre Travel Network, Sabre Airline Solutions and Sabre Hospitality Solutions. The Travelocity—Asia Pacific reporting unit was held for sale as of December 31, 2012 and was sold in March 2013 (see Note 4, Discontinued Operations and Dispositions).
The fair values used in our evaluation are estimated using a combined approach based upon discounted future cash flow projections and observed market multiples for comparable businesses. The cash flow projections are based upon a number of assumptions, includingrisk-adjusted discount rates, future booking and transaction volume levels, future price levels, rates of growth in our consumer and corporate direct booking businesses, rates of increase in operating expenses, cost of revenue and taxes. Additionally, in accordance with authoritative guidance on fair value measurements, we made a number of assumptions including market participants, the principal markets and highest and best use of the reporting units.
Definite-lived intangible assets are evaluated for impairment whenever events or changes in circumstances indicate that the carrying amount ofdefinite-lived intangible assets used in combination to generate cash flows largely independent of other assets may not be recoverable. If impairment indicators exist fordefinite-lived intangible assets, the undiscounted future cash flows associated with the expected service potential of the assets are compared to the carrying value of the assets. If our projection of undiscounted future cash flows is in excess of the carrying value of the intangible assets, no impairment charge is recorded. If our projection of undiscounted cash flows is less than the carrying value of the intangible assets, an impairment charge is recorded to reduce the intangible assets to fair value. We also evaluate the need for additional impairment disclosures based on our Level 3 inputs. For fair value measurements categorized within Level 3 of the fair value hierarchy, we disclose the valuation processes used.
F-48
Capitalized Implementation Costs—We incurup-front costs to implement new customer contracts under oursoftware-as-a-service revenue model. We capitalize these costs, including (a) certain external direct costs of materials and services incurred to implement a customer contract and (b) payroll and payroll related costs for employees who are directly associated with and devote time to implementation activities.
Capitalized costs are amortized on astraight-line basis over the related contract term, ranging from three to ten years, as they are recoverable through deferred or future revenues associated with the relevant contract.
Deferred Customer Discounts—Deferred advances to customers and customer discounts are amortized in future periods as the related revenue is earned. The assets are reviewed for recoverability based on future contracted revenues. Contracts are priced to generate total revenues over the life of the contract that exceed any discounts or advances provided and any upfront costs incurred to implement the customer contract.
Travel Supplier Liabilities and Related Deferred Revenue—Our travel suppliers provide content, including air travel, hotel stays, car rentals and dynamically packaged combinations of these components, on either afee-based or anet-rate basis. Under ourfee-based arrangements, we collect the full price of the travel from the consumer and remit the payment to the travel supplier, after withholding our service fee. Under ournet-rate agreements, suppliers provide content to us atpre-determined net rates. We marketnet-rate offerings to travelers at a price that includes an amount sufficient to pay the travel supplier for providing the travel accommodations and any occupancy and other local taxes, as well as additional amounts representing our service fees. We record amounts due to travel suppliers and our service fees in Travel supplier liabilities and related deferred revenue on the consolidated balance sheets until these amounts are paid to the suppliers or recognized as revenue upon consumption of the travel.
Incentive Consideration—Certain service contracts with significant travel agency customers contain booking productivity clauses and other provisions that allow travel agency customers to receive cash payments or other consideration. We establish liabilities for these commitments and recognize the related expense as these travel agencies earn incentive consideration based on the applicable contractual terms. Periodically, we make cash payments to these travel agencies at inception or modification of a service contract which are capitalized and amortized to cost of revenue over the expected life of the service contract, which is generally three to five years. Deferred charges related to such contracts are recorded in Other assets, net on the consolidated balance sheets. The service contracts are priced so that the additional airline and other booking fees generated over the life of the contract will exceed the cost of the incentive consideration provided. Incentive consideration paid to the travel agency represents a commission paid to the travel agency for booking travel on our GDS and the amounts paid to travel agencies represent fair value for the services provided.
Equity-Based Compensation—We account for our stock awards and options by recognizing compensation expense, measured at the grant date based on the fair value of the award, on astraight-line basis over the award vesting period, giving consideration as to whether the amount of compensation cost recognized at any date is equal to the portion ofgrant-date value that is vested at that date. We account for our liability awards by remeasuring the fair value of our awards at each reporting date. Changes in fair value of our liability awards are recognized in earnings.Stock-based compensation expense, including liability awards, totaled $9 million, $10 million and $7 million for the years ended December 31, 2013, 2012 and 2011, respectively.
Concentration of Credit Risk—Our customers are primarily located in the United States, Canada, Europe, Latin America and Asia, and are concentrated in the travel industry. We generate a significant portion of our revenues and corresponding accounts receivable from services provided to the commercial air travel industry. As of December 31, 2013 and 2012, approximately $178 million or 58% and $189 million or 58%, respectively, of our trade accounts receivable was attributable to these customers. Our other accounts receivable are generally due from other participants in the travel and transportation industry. Substantially all of our accounts receivable, net represents trade balances. We generally do not require security or collateral from our customers as a condition of sale.
F-49
We regularly monitor the financial condition of the air transportation industry and have noted the financial difficulties faced by several air carriers. We believe the credit risk related to the air carriers’ difficulties is mitigated by the fact that we collect a significant portion of the receivables from these carriers through the Airline Clearing House (“ACH”) and other similar clearing houses. As of December 31, 2013, approximately 57% of our air customers make payments through the ACH which accounts for approximately 94% of our air revenue. For these carriers, we believe the use of ACH mitigates our credit risk with respect to airline
bankruptcies. For those carriers from which we do not collect payments through the ACH or other similar clearing houses, our credit risk is higher. However, we monitor these carriers and account for the related credit risk through our normal reserve policies.
We evaluate the collectability of our accounts receivable based on a combination of factors. In circumstances where we are aware of a specific customer’s inability to meet its financial obligations to us (e.g., bankruptcy filings, failure to pay amounts due to us or others), we record a specific reserve for bad debts against amounts due to reduce the recorded receivable to the amount we reasonably believe will be collected. For all other customers, we record reserves for bad debts based on pastwrite-off history (average percentage of receivables written off historically) and the length of time the receivables are past due. We maintained an allowance for losses of approximately $22 million and $28 million at December 31, 2013 and 2012, respectively, based upon the amount of accounts receivable expected to prove uncollectible.
3. Acquisitions
Pro forma information related to acquisitions occurring during 2013, 2012 and 2011 has not been included, as the effect would not be material to our consolidated financial statements.
2012
Acquisition of PRISM—On August 1, 2012, we acquired all of the outstanding stock and ownership interests of PRISM Group Inc. and PRISM Technologies LLC (collectively “PRISM”), a leading provider ofend-to-end airline contract business intelligence and decision support software. The acquisition added to our portfolio of products within Airline and Hospitality Solutions, allows for new relationships with airlines and added to our existing business intelligence capabilities. The purchase price was $116 million, $66 million of which was paid on August 1, 2012. Contingent consideration totaled $54 million on an undiscounted basis and is to be paid in two installments of $27 million each, due 12 and 24 months following the acquisition date. The first $27 million installment represented a holdback payment primarily for indemnification purposes and the second $27 million payment represents contingent consideration which is based on contractually determined performance measures, which have been met. Additionally, $6 million is also due in two installments of $3 million each at 12 and 24 months, which is contingent upon employment of key employees and is being expensed over the relevant periods of employment and therefore is not considered a part of the purchase price consideration. We made the first holdback and contingent employment payments totaling $30 million in August 2013.
F-50
The results of operations of PRISM are included in our consolidated statements of operations and the results of operations of Airline and Hospitality Solutions from the date of acquisition. The impact to our revenue and net loss from the acquisition of PRISM is not material for all periods presented. Assets acquired and liabilities assumed were recorded at their estimated fair values using management’s best estimates, based in part on an independent valuation of the net assets acquired. The following table summarizes the allocation of the purchase price and the amounts allocated to goodwill (in thousands):
Patents (10 year useful life) | $ | 59,400 | ||
Customer and contractual relationships (10 year useful life) | 10,700 | |||
Trademarks (5 year useful life) | 800 | |||
Goodwill | 35,737 | |||
Accounts receivable, net | 8,059 | |||
Other net assets acquired | 1,458 | |||
|
| |||
Total purchase price | $ | 116,154 | ||
|
|
Other Acquisitions—During 2012, we completed one additional acquisition which was not individually material to our financial statements for a total purchase price of $6 million.
During 2011, we completed two acquisitions which individually were not material to our consolidated financial statements. In the first quarter of 2011, we completed the acquisition of Zenon N.D.C., Limited, a provider of GDS services to travel agents in Cyprus. In the second quarter of 2011, we completed the acquisition of SoftHotel, Inc., a provider ofweb-based property management solutions for the hospitality industry. The results of operations of these 2011 acquisitions have been included in our consolidated statements of operations from the dates of the acquisitions. The total purchase price for these acquisitions was $11 million.
4. Discontinued Operations and Dispositions
During the periods presented, we disposed of or discontinued certain businesses or operations in order to further align Travelocity with its core strategies of focusing on product and customer experiences in profitable locations, and displaying and promoting highly relevant content. We believe these decisions will allow us to reduce our technological complexity by reducing the number of supported business platforms and operations.
Discontinued Operations
The results for the following Travelocity operations are presented in income (loss) from discontinued operations in our consolidated statements of operations:
Holiday Autos—On June 25, 2013, we sold certain assets of our Holiday Autos operations to a third party and, in November 2013, completed the closing of the remainder of the Holiday Autos operations such that it represented a discontinued operation. Holiday Autos was a leisure car hire broker that offeredpre-paid,low-cost car rental in various markets, largely in Europe. We recognized an $11 million loss, net of tax, on the sale of Holiday Autos. The loss includes thewrite-off of $39 million of goodwill and intangible assets attributed to Holiday Autos, with the goodwill portion determined based on Holiday Autos’ relative fair value to the Travelocity Europe reporting unit. The sale provides for us to receive twoearn-out payments measured 12 and 24 months following the date of the sale, totaling up to $12 million, based upon the purchaser exceeding certain booking thresholds as defined in the sale agreement. We recognized $6 million relative to theseearn-out provisions and the resulting receivable is reviewed for recovery on a periodic basis. Anyearn-out payments received in excess of the $6 million recognized will be recorded as a gain in the period received.
Travelocity—Travelocity—Asia Pacific—In July 2012, we completed the sale of two of our subsidiaries in India (collectively “TravelGuru”). These businesses offered a wide array of travel related services and operated a hotel reservations system. We recorded a gain on the sale of approximately $11 million, net of taxes,tax, in the third quarter of 2012.
F-51
Further, in December 2012, we entered into an agreement to sell our shares of Zuji Properties A.V.V. and Zuji Pte Ltd along with its operating subsidiaries (collectively “Zuji”), a Travelocity AsiaPacific-based Online Travel Agency (“OTA”). At that time, the assets were recorded at the lower of the carrying amount or fair value less cost to sell. We recorded an estimated loss on the sale of approximately $14 million, net of tax during 2012. We sold Zuji on March 21, 2013 and recorded an additional $11 million loss on sale, net of tax during the year ended December 31, 2013. We have continuing cash flows from Zuji due to reciprocal agreements between us and Zuji to provide hotel reservations services over a three year period. The agreements include commissions to be paid to the respective party based on qualifying bookings. The continuing cash flows associated with Zuji were not material to our results of operations for the year ended December 31, 2013.
The operations of Zuji and TravelGuru represented our Travelocity—Asia Pacific reporting unit; Travelocity no longer has operations in the Asia Pacific region.
Travelocity Nordics—In December 2012, we sold certain assets of Travelocity’s Nordics business to a third party. The Nordics business is comprised of an online travel agency and event and ticket sales in Sweden, Norway and Denmark. Travelocity no longer has operations in this region.
Results of Discontinued Operations—The results of discontinued operations for the year ended December 31, 2013 include $33 million of gains associated with the reversals of allowances for uncollectablevalue-added tax (“VAT”) receivables related to Holiday Autos (see Note 20, Commitments and Contingencies) and $4 million of other income related to the resolution of a legal contingency that existed at the close of the sale of TravelGuru. The reversals of the VAT receivable allowances were a result of payments received in 2013 and are reflected as a reduction to selling, general and administrative expenses in the table below. The results of discontinued operations for the year ended December 31, 2012 includes $17 million of accrued expenses in cost of revenue for VAT assessments and related penalties and interest associated with our Secret Hotels 2 Limited (formerly Med Hotels Limited) entity which was discontinued in 2008. The $17 million accrued liability was reversed during the year ended December 31, 2013 and is reflected as a reduction to cost of revenue in the below table (see Note 20, Commitments and Contingencies).
The following table summarizes the results of our discontinued operations:
| Year Ended December 31, | ||||||||||||
| 2013 | 2012 | 2011 | ||||||||||
| (Amounts in thousands) | ||||||||||||
Revenue | $ | 49,124 | $ | 107,189 | $ | 124,763 | ||||||
Cost of revenue | (2,176 | ) | 26,694 | 36,502 | ||||||||
Selling, general and administrative | 23,542 | 107,808 | 101,873 | |||||||||
Impairment expense | 516 | 11,250 | — | |||||||||
Depreciation and amortization | 2,599 | 4,412 | 5,440 | |||||||||
|
|
|
|
|
| |||||||
Operating income (loss) | 24,643 | (42,975 | ) | (19,052 | ) | |||||||
Other income (expense): | ||||||||||||
Interest expense, net | (1,217 | ) | (8,898 | ) | (6,368 | ) | ||||||
Loss on sale of businesses, net | (27,709 | ) | (8,266 | ) | — | |||||||
Other, net | 1,988 | (2,607 | ) | (2,161 | ) | |||||||
|
|
|
|
|
| |||||||
Total other expense, net | (26,938 | ) | (19,771 | ) | (8,529 | ) | ||||||
|
|
|
|
|
| |||||||
Loss from discontinuing operations before income taxes | (2,295 | ) | (62,746 | ) | (27,581 | ) | ||||||
Provision (benefit) for income taxes | 4,881 | (13,799 | ) | (4,120 | ) | |||||||
|
|
|
|
|
| |||||||
Net loss from discontinued operations | $ | (7,176 | ) | $ | (48,947 | ) | $ | (23,461 | ) | |||
|
|
|
|
|
| |||||||
F-52
Dispositions
Certain Assets of Travelocity—On June 18, 2013, we completed the sale of certain assets of Travelocity (“TBiz”) operations to a third party. TBiz provides managed corporate travel services for corporate customers. We recorded proceeds of $10 million and a loss on the sale of $3 million, net of tax, including thewrite-off of $9 million of goodwill attributed to TBiz based on the relative fair value to the Travelocity North America reporting unit, in our consolidated statement of operations.
Sabre Pacific—On February 24, 2012, we completed the sale of our 51% stake in Sabre Australia Technologies I Pty Ltd (“Sabre Pacific”), an entity jointly owned by a subsidiary of Sabre (51%) and ABACUS International PTE Ltd (“Abacus”) (49%), to Abacus for $46 million of proceeds. Of the proceeds received, $9 million was for the sale of stock, $18 million represented the repayment of an intercompany note receivable from Sabre Pacific, which was entered into when the joint venture was originally established, and the remaining $19 million represented the settlement of operational intercompany receivable balances with Sabre Pacific and associated amounts we owed to Abacus. We recorded $25 million as gain on sale of business in our consolidated statements of operations. We have also entered into a license and distribution agreement with Sabre Pacific under which it will market,sub-license, distribute, provide access to and support for the Sabre GDS in Australia, New Zealand and surrounding territories. Sabre Pacific will pay us an ongoing transaction fee based on booking volumes under this agreement.
5. Restructuring Charges
Travelocity Restructuring—In the third quarter of 2013, we initiated plans to restructure Travelocity, shifting Travelocity in the United States and Canada away from afixed-cost model to alower-cost,performance-based shared revenue structure. On August 22, 2013 we entered into an exclusive,long-term strategic marketing agreement with Expedia (“Expedia SMA”), in which Expedia will power the technology platforms for Travelocity’s existing U.S. and Canadian websites, as well as provide Travelocity with access to Expedia’s supply and customer service platforms. The Expedia SMA represents a strategic decision to reduce direct costs associated with Travelocity and provide our customers with the benefit of Expedia’s long term investment in its technology platform as well as its supply and customer service platforms, which we expect to increase conversion and operational efficiency and allows us to shift our focus to Travelocity’s marketing strengths. Both parties began development and implementation after signing the Expedia SMA. As of December 31, 2013, the majority of the online hotel and air offering has been migrated to the Expedia platform, and a launch of the majority of the remainder is expected in early 2014. Based on the terms of the agreement, Expedia has earned an incentive payment of $8 million in January 2014, which could increase to $11 million depending on the timing of the full launch in 2014. We plan to amortize this payment over thenon-cancellable term of the marketing agreement as a reduction to revenue.
Under the terms of the agreement, Expedia will pay us aperformance-based marketing fee that will vary based on the amount of travel booked throughTravelocity-branded websites powered by Expedia under this collaborative arrangement. The marketing fee we receive is recorded as marketing fee revenue and the cost we incur to promote the Travelocity brand and for marketing is recorded as selling, general and administrative expense in our results of operations. Correspondingly, we are winding down certain internal processes, including back office functions, as transactions move from our technology platforms to those of Expedia.
We also agreed to a put/call arrangement (“Expedia Put/Call”) whereby Expedia may acquire, or we may sell to Expedia, certain assets relating to the Travelocity business. Our put right may be exercised during the first 24 months of the Expedia SMA only upon the occurrence of certain triggering events primarily relating to implementation, which are outside of our control. The occurrence of such events is not considered probable. During this period, the exercise price of the put right is fixed. After the 24 month period, the put right is only exercisable for a limited period of time in 2016 at a discount to fair market value. The call right held by Expedia is exercisable at any time during the term of the Expedia SMA. If the call right is exercised, it provides for a floor for a limited time that may be higher than fair value and a ceiling for the duration of the agreement that may be lower than fair value.
F-53
In the fourth quarter of 2013, we initiated a plan to restructure the European portion of the Travelocity business. This plan involves establishing Travelocity Europe as astand-alone operational entity, separating processes from the North America operations, while adding efficiencies to streamline the European operations. Travelocity will continue to be managed as one reportable segment.
As a result of the Travelocity restructuring actions, we recorded charges totaling $28 million which included $4 million of asset impairments, $18 million of employee termination benefits, and $6 million of other related costs. We estimate that we will incur additional charges of approximately $11 million in 2014 consisting of $6 million in contract termination costs, $2 million in employee termination benefits, and $3 million of other related costs.
Technology Restructuring—Our corporate expenses include a technology organization that provides development and support activities to our business segments. Costs associated with our technology organization are charged to the business segments primarily based on its usage of development resources. For the year ended December 31, 2013, the majority of costs associated with the technology organization were incurred by Travel Network and Airline and Hospitality Solutions. In the fourth quarter of 2013, we initiated a restructuring plan to simplify our technology organization, better align costs with our current business, reduce our spend onthird-party resources, and to increase focus on product development. The majority of this plan will be completed in
2014. As a part of this restructuring plan, we will reduce our employee base by approximately 350 employees. We recorded a charge of $8 million associated with employee termination benefits in the fourth quarter of 2013 and do not expect to record material charges in 2014 related to this action.
The roll forward of our restructuring accruals, included in other current liabilities, is as follows:
| Employee Termination Benefits | Employee Termination Benefits | |||||||||||||||||||||||
| Travelocity | Technology Organization | Total | Travelocity | Technology Organization | Total | |||||||||||||||||||
| (Amounts in thousands) | (Amounts in thousands) | |||||||||||||||||||||||
Charges | $ | 17,956 | $ | 8,163 | $ | 26,119 | $ | 17,956 | $ | 8,163 | $ | 26,119 | ||||||||||||
Payments | 225 | — | 225 | 225 | — | 225 | ||||||||||||||||||
|
|
|
|
|
| |||||||||||||||||||
Restructuring liability at December 31, 2013 | $ | 17,731 | $ | 8,163 | $ | 25,894 | $ | 17,731 | $ | 8,163 | $ | 25,894 | ||||||||||||
|
|
|
|
|
| |||||||||||||||||||
The charges recognized in the roll forward of our reserve for restructuring charges do not include items charged directly to expense (e.g. asset impairments) and other periodic costs recognized as incurred, as those items are not reflected in our restructuring reserve in our consolidated balance sheet. Restructuring charges are not allocated to the segments for segment reporting purposes (see Note 21, Segment Information).
6. Equity Method Investments
We have an investment in Abacus and have entered into a service agreement with them relative to data processing services, development labor and other services as requested. The primary revenue generated from Abacus is data processing fees associated with bookings on the Sabre GDS. In accordance with a data processing agreement signed in late 2012, Abacus prepaid for data processing fees which will be amortized over the term of the agreement. Development labor and ancillary services are provided upon request. Additionally, in accordance with an agreement with Abacus, we collect booking fees on behalf of Abacus and record a payable, or economic benefit transfer, to them for amounts collected but unremitted at any period end, net of any associated costs we incur.
For the year ended December 31, 2012, Abacus recorded an impairment of goodwill associated with its acquisition of Sabre Pacific, of which our share was $24 million.
Prior to 2012, we held an equity interest in Axess jointly with Abacus. We recorded an amount due to Abacus for its economic share of the equity interest. Our interest in Axess was sold in 2012.
F-54
The condensed consolidated financial information below has been presented in conformity with GAAP.
Abacus’ Condensed Consolidated Statements of Comprehensive Income are as follows:
| Year Ended December 31, | ||||||||||||
| 2013 | 2012 | 2011 | ||||||||||
| (Amounts in thousands) | ||||||||||||
Net income (loss) | $ | 42,368 | $ | (20,366 | ) | $ | 79,452 | |||||
Other comprehensive loss | (4,043 | ) | (9,379 | ) | (3,588 | ) | ||||||
|
|
|
|
|
| |||||||
Comprehensive loss | 38,325 | (29,745 | ) | 75,864 | ||||||||
Less: Comprehensive income (loss) attributable to noncontrolling interests | 88 | (76 | ) | (81 | ) | |||||||
|
|
|
|
|
| |||||||
Comprehensive loss attributable to Abacus | $ | 38,413 | $ | (29,821 | ) | $ | 75,783 | |||||
|
|
|
|
|
| |||||||
Abacus’ Condensed Consolidated Statements of Operations are as follows:
| Year Ended December 31, | Year Ended December 31, | |||||||||||||||||||||||
| 2013 | 2012 | 2011 | 2013 | 2012 | 2011 | |||||||||||||||||||
| (Amounts in thousands) | (Amounts in thousands) | |||||||||||||||||||||||
Revenue | $ | 335,255 | $ | 320,069 | $ | 261,952 | $ | 335,255 | $ | 320,069 | $ | 261,952 | ||||||||||||
Cost of sales | 205,505 | 200,212 | 123,227 | 205,505 | 200,212 | 123,227 | ||||||||||||||||||
General and administrative costs | 43,157 | 42,219 | 25,382 | 43,157 | 42,219 | 25,382 | ||||||||||||||||||
Other expenses | 37,306 | 32,367 | 19,497 | 37,306 | 32,367 | 19,497 | ||||||||||||||||||
|
|
|
|
|
| |||||||||||||||||||
Operating income | 49,287 | 45,271 | 93,846 | 49,287 | 45,271 | 93,846 | ||||||||||||||||||
Impairment losses, net | — | — | (3,057 | ) | — | — | (3,057 | ) | ||||||||||||||||
Gain on disposal of an associate | — | 5,656 | — | — | 5,656 | — | ||||||||||||||||||
Impairment of goodwill | (100 | ) | (65,809 | ) | — | (100 | ) | (65,809 | ) | — | ||||||||||||||
Other non-operating costs | 3,127 | 6,174 | 7,214 | 3,127 | 6,174 | 7,214 | ||||||||||||||||||
|
|
|
|
|
| |||||||||||||||||||
Income before taxes | 52,314 | (8,708 | ) | 98,003 | 52,314 | (8,708 | ) | 98,003 | ||||||||||||||||
Income tax expense | 9,946 | 11,658 | 18,551 | 9,946 | 11,658 | 18,551 | ||||||||||||||||||
|
|
|
|
|
| |||||||||||||||||||
Net income (loss) | $ | 42,368 | $ | (20,366 | ) | $ | 79,452 | $ | 42,368 | $ | (20,366 | ) | $ | 79,452 | ||||||||||
|
|
|
|
|
| |||||||||||||||||||
Noncontrolling interest | (75 | ) | 130 | 103 | (75 | ) | 130 | 103 | ||||||||||||||||
|
|
|
|
|
| |||||||||||||||||||
Net income (loss) attributable to Abacus | $ | 42,443 | $ | (20,496 | ) | $ | 79,349 | $ | 42,443 | $ | (20,496 | ) | $ | 79,349 | ||||||||||
|
|
|
|
|
| |||||||||||||||||||
Abacus’ Condensed Consolidated Balance Sheets are as follows:
| December 31, | ||||||||
| 2013 | 2012 | |||||||
| (Amounts in thousands) | ||||||||
Assets | ||||||||
Current assets | ||||||||
Cash and cash equivalents | $ | 107,729 | $ | 96,194 | ||||
Accounts receivable, net | 43,679 | 51,746 | ||||||
Other receivables, net | 61,481 | 53,219 | ||||||
|
|
|
| |||||
Total current assets | 212,889 | 201,159 | ||||||
Property and equipment, net | 32,167 | 28,130 | ||||||
Goodwill and intangible assets, net | 2,505 | 2,505 | ||||||
Other assets, net | 41,647 | 46,788 | ||||||
|
|
|
| |||||
Total assets | $ | 289,208 | $ | 278,582 | ||||
|
|
|
| |||||
F-55
| December 31, | ||||||||
| 2013 | 2012 | |||||||
| (Amounts in thousands) | ||||||||
Liabilities and stockholders’ equity | ||||||||
Current liabilities | ||||||||
Accounts payable | $ | 19,820 | $ | 30,463 | ||||
Other accrued liabilities | 103,887 | 91,270 | ||||||
Provision for taxation | 47,073 | 48,277 | ||||||
|
|
|
| |||||
Total current liabilities | 170,780 | 170,010 | ||||||
Deferred income taxes | 7,474 | 5,733 | ||||||
Stockholders’ equity | ||||||||
Share capital | 56,580 | 56,580 | ||||||
Retained earnings | 54,159 | 45,746 | ||||||
Noncontrolling interest | 215 | 513 | ||||||
|
|
|
| |||||
Total stockholders’ equity | 110,954 | 102,839 | ||||||
|
|
|
| |||||
Total liabilities and stockholders’ equity | $ | 289,208 | $ | 278,582 | ||||
|
|
|
| |||||
Abacus’ Condensed Consolidated Statements of Cash Flows are as follows:
| Year Ended December 31, | ||||||||||||
| 2013 | 2012 | 2011 | ||||||||||
| (Amounts in thousands) | ||||||||||||
Operating Activities | ||||||||||||
Cash provided by operating activities | $ | 57,899 | $ | 9,214 | $ | 48,833 | ||||||
Investing Activities | ||||||||||||
Cash used in investing activities | (16,154 | ) | (29,183 | ) | (8,560 | ) | ||||||
Financing Activities | ||||||||||||
Dividends paid | (30,000 | ) | (60,486 | ) | (35,000 | ) | ||||||
Other financing activities | (210 | ) | (156 | ) | (109 | ) | ||||||
|
|
|
|
|
| |||||||
Cash used in financing activities | (30,210 | ) | (60,642 | ) | (35,109 | ) | ||||||
Increase (decrease) in cash and cash equivalents | 11,535 | (80,611 | ) | 5,164 | ||||||||
Cash and cash equivalents at beginning of period | 96,194 | 176,805 | 171,641 | |||||||||
|
|
|
|
|
| |||||||
Cash and cash equivalents at end of period | $ | 107,729 | $ | 96,194 | $ | 176,805 | ||||||
|
|
|
|
|
| |||||||
Our related party transactions with Abacus are summarized and presented in the table below.
| Year Ended December 31, | ||||||||||||
| 2013 | 2012 | 2011 | ||||||||||
| (Amounts in thousands) | ||||||||||||
Revenue earned from Abacus | $ | 91,998 | $ | 71,957 | $ | 52,073 | ||||||
| December 31, | ||||||||
| 2013 | 2012 | |||||||
| (Amounts in thousands) | ||||||||
Receivable from Abacus | $ | 29,377 | $ | 13,939 | ||||
Payable to Abacus for Economic Benefit Transfer | (8,648 | ) | (8,452 | ) | ||||
Current deferred revenue related to Abacus data processing | (2,571 | ) | (2,571 | ) | ||||
Long-term deferred revenue related to Abacus data processing | (12,857 | ) | (15,428 | ) | ||||
|
|
|
| |||||
Related party receivable (liability), net | $ | 5,301 | $ | (12,512 | ) | |||
|
|
|
| |||||
F-56
7. Goodwill and Intangible Assets
Impairment Assessments—We perform our annual assessment of possible impairment of goodwill andindefinite-lived intangible assets as of October 1, or more frequently if events and circumstances indicate that impairment may have occurred.
2013—In conjunction with the disposal of TBiz (part of our Travelocity North America reporting unit) and Holidays Autos (part of our Travelocity Europe reporting unit) in the second quarter of 2013, we were required to allocate goodwill to these businesses. We allocated $9 million and $36 million in goodwill to TBiz and Holiday Autos, respectively. In connection with the dispositions, we initiated an impairment analysis as of June 30, 2013 on the remainder of the goodwill andlong-lived assets associated with these reporting units. Further declines in our projections of the discounted future cash flows of these reporting units and current market participant considerations led to a $96 million impairment in Travelocity—North America and a $40 million impairment in Travelocity—Europe goodwill, which has been recorded in our results of operations. As a result of these impairments, the Travelocity segment had no remaining goodwill as of June 30, 2013.
We also recorded a $2 million impairment of Travelocity—Europe software developed for internal use and $1 million impairment of other definite lived intangible assets related to Holiday Autos which is included in our net loss on the sale of that business in discontinued operations.
Based on our annual assessment of possible impairment of goodwill andindefinite-lived intangible assets as of October 1, 2013, we concluded that no additional impairment was necessary.
2012—In the third quarter of 2012, certain competitors of Travelocity announced plans to move towards offering hotel customers a choice of payment options which could adversely affect hotel margins over time. Travelocity’s move to this new revenue model could have additionally impacted its working capital as it would collect less cash up front, reducing the existing supplier liability over time. We therefore initiated an impairment analysis as of September 30, 2012. The expected change in the competitive business environment and the resulting impact on our projections of the discounted future cash flows led to a $58 million goodwill impairment in Travelocity—North America and a $5 million goodwill impairment in Travelocity—Europe.
In the fourth quarter of 2012, we continued to see further weakness in Travelocity’s business performance resulting in lower projected revenues and declining margins for Travelocity—North America and Europe thus requiring further impairment assessment as of December 31, 2012 of goodwill andlong-lived intangible assets. We recorded an additional goodwill impairment charge for Travelocity Europe for $65 million and identifiedlong-lived intangible assets were not deemed recoverable in both North America and Europe. As a result, we recorded impairments on long lived assets of $281 million for Travelocity—North America, of which $30 million pertained to software developed for internal use, $7 million pertained to computer equipment, $6 million related to capitalized implementation costs (see Note 2, Summary of Significant Accounting Policies) and the remainder related todefinite-lived intangible assets. We also recorded impairments of $154 million for Travelocity—Europe, of which $11 million pertained to software developed for internal use, $4 million pertained to computer equipment and the remainder related to definite lived intangible assets. The total impairment for Travelocity in 2012 was $564 million.
2011—During 2011, Travelocity was impacted by weakness in the macroeconomic environment and experienced a decline in margins due to pressure in the industry driven by competitive pricing and reduced bookings which negatively impacted our projections of the discounted future cash flows. These factors led to impairment charges of $173 million for Travelocity North America and $12 million for Travelocity Europe, respectively.
For the purposes of performing the impairment assessment in all periods, we determined that the lowest level of identifiable cash flows is at the reporting unit level for the primary asset in the asset group being the trade name Travelocity.com and lastminute.com related to Travelocity North America and Travelocity Europe,
F-57
respectively. We used an income based valuation approach at the reporting unit level to fair value the asset group and compared those estimates to the respective carrying values. The key assumptions used in determining the estimated fair value of our long lived assets were the terminal growth rates, forecasted revenues, assumed royalty rates and discount rates. Significant judgment was required to select these inputs based on observed market data. Impairments related to continuing operations are recorded in “Impairment” in the consolidated statements of operations. We believe the assumptions used to project future cash flows for the evaluations described above were reasonable. However, if future actual results do not meet our expectations, we may be required to record an additional impairment charge, the amount of which could be material to our results of operations.
There was no impairment charge ondefinitive-lived intangible assets in 2011.
Goodwill—Changes in the carrying amount of goodwill during the year ended December 31, 2013 and December 31, 2012 are as follows:
| Continuing Operations | Discontinued Operations | Continuing Operations | Discontinued Operations | |||||||||||||||||||||||||||||||||||||||||||||||||||||||||||||
| Travel Network | Airline and Hospitality Soltuions | Travelocity | Total | Gross | Accumulated Impairment | Total | Total Goodwill | Travel Network | Airline and Hospitality Solutions | Travelocity | Total | Gross | Accumulated Impairment | Total | Total Goodwill | |||||||||||||||||||||||||||||||||||||||||||||||||
| (Amounts in thousands) | (Amounts in thousands) | |||||||||||||||||||||||||||||||||||||||||||||||||||||||||||||||
Balance as of December 31, 2011 | $ | 1,813,215 | $ | 285,754 | $ | 273,406 | $ | 2,372,375 | $ | 94,555 | $ | (39,573 | ) | $ | 54,982 | $ | 2,427,357 | $ | 1,813,215 | $ | 285,754 | $ | 273,406 | $ | 2,372,375 | $ | 94,555 | $ | (39,573 | ) | $ | 54,982 | $ | 2,427,357 | ||||||||||||||||||||||||||||||
Acquired | — | 39,713 | — | 39,713 | — | — | — | 39,713 | — | 39,713 | — | 39,713 | — | — | — | 39,713 | ||||||||||||||||||||||||||||||||||||||||||||||||
Adjustments(1) | (153 | ) | 22 | — | (131 | ) | 595 | — | 595 | 464 | (153 | ) | 22 | — | (131 | ) | 595 | — | 595 | 464 | ||||||||||||||||||||||||||||||||||||||||||||
Impairment | — | — | (128,708 | ) | (128,708 | ) | — | — | — | (128,708 | ) | — | — | (128,708 | ) | (128,708 | ) | — | — | — | (128,708 | ) | ||||||||||||||||||||||||||||||||||||||||||
Held for Sale | (578 | ) | — | — | (578 | ) | — | (7,420 | ) | (7,420 | ) | (7,998 | ) | (578 | ) | — | — | (578 | ) | — | (7,420 | ) | (7,420 | ) | (7,998 | ) | ||||||||||||||||||||||||||||||||||||||
|
|
|
|
|
|
|
|
|
|
|
|
|
|
|
| |||||||||||||||||||||||||||||||||||||||||||||||||
Balance as of December 31, 2012 | 1,812,484 | 325,489 | 144,698 | 2,282,671 | 95,150 | (46,993 | ) | 48,157 | 2,330,828 | 1,812,484 | 325,489 | 144,698 | 2,282,671 | 95,150 | (46,993 | ) | 48,157 | 2,330,828 | ||||||||||||||||||||||||||||||||||||||||||||||
Acquired | 399 | — | — | 399 | — | — | — | 399 | 399 | — | — | 399 | — | — | — | 399 | ||||||||||||||||||||||||||||||||||||||||||||||||
Adjustments(1) | (197 | ) | — | — | (197 | ) | — | — | — | (197 | ) | (197 | ) | — | — | (197 | ) | — | — | — | (197 | ) | ||||||||||||||||||||||||||||||||||||||||||
Impairment | — | — | (135,598 | ) | (135,598 | ) | — | — | — | (135,598 | ) | — | — | (135,598 | ) | (135,598 | ) | — | — | — | (135,598 | ) | ||||||||||||||||||||||||||||||||||||||||||
Disposals | — | — | (9,100 | ) | (9,100 | ) | (48,157 | ) | — | (48,157 | ) | (57,257 | ) | — | — | (9,100 | ) | (9,100 | ) | (48,157 | ) | — | (48,157 | ) | (57,257 | ) | ||||||||||||||||||||||||||||||||||||||
|
|
|
|
|
|
|
|
|
|
|
|
|
|
|
| |||||||||||||||||||||||||||||||||||||||||||||||||
Balance as of December 31, 2013 | $ | 1,812,686 | $ | 325,489 | $ | — | $ | 2,138,175 | $ | 46,993 | $ | (46,993 | ) | $ | — | $ | 2,138,175 | $ | 1,812,686 | $ | 325,489 | $ | — | $ | 2,138,175 | $ | 46,993 | $ | (46,993 | ) | $ | — | $ | 2,138,175 | ||||||||||||||||||||||||||||||
|
|
|
|
|
|
|
|
|
|
|
|
|
|
|
| |||||||||||||||||||||||||||||||||||||||||||||||||
| (1) | Includes net foreign currency effects during the year. |
Accumulated goodwill impairment charges totaled $1,383 million and $1,247 million as of December 31, 2013 and 2012, respectively. All accumulated goodwill impairment charges are associated with Travelocity.
Intangible Assets—The following table presents our intangible assets at December 31, 2013 and 2012. The impairments discussed above are reflected in accumulated amortization as of December 31, 2013 and 2012.
| December 31, 2013 | December 31, 2012 | |||||||||||||||||||||||
| Gross Carrying Amount | Accumulated Amortization | Net Carrying Amount | Gross Carrying Amount | Accumulated Amortization | Net Carrying Amount | |||||||||||||||||||
| (Amounts in thousands) | ||||||||||||||||||||||||
Trademarks and brandnames | $ | 868,632 | $ | (545,597 | ) | $ | 323,035 | $ | 868,591 | $ | (525,358 | ) | $ | 343,233 | ||||||||||
Acquired customer relationships | 692,863 | (471,597 | ) | 221,266 | 693,863 | (407,331 | ) | 286,532 | ||||||||||||||||
Purchased technology | 468,639 | (392,013 | ) | 76,626 | 468,389 | (338,635 | ) | 129,754 | ||||||||||||||||
Non-compete agreements | 13,325 | (12,894 | ) | 431 | 13,325 | (12,390 | ) | 935 | ||||||||||||||||
Acquired contracts, supplier and distributor agreements | 26,600 | (13,400 | ) | 13,200 | 25,600 | (10,800 | ) | 14,800 | ||||||||||||||||
|
|
|
|
|
|
|
|
|
|
|
| |||||||||||||
Total intangible assets | $ | 2,070,059 | $ | (1,435,501 | ) | $ | 634,558 | $ | 2,069,768 | $ | (1,294,514 | ) | $ | 775,254 | ||||||||||
|
|
|
|
|
|
|
|
|
|
|
| |||||||||||||
F-58
Amortization expense relating to intangible assets subject to amortization totaled $140 million for the year ended December 31, 2013 and $159 million for each of the years ended December 31, 2012 and 2011. Estimated amortization expense related to intangible assets subject to amortization for each of the five succeeding years and beyond is as follows (in thousands):
2014 | $ | 104,399 | ||
2015 | 92,452 | |||
2016 | 92,474 | |||
2017 | 47,111 | |||
2018 | 31,310 | |||
2019 and thereafter | 266,812 | |||
|
| |||
Total | $ | 634,558 | ||
|
|
8. Balance Sheet Components
Other Receivables, Net
Other receivables consisted of the following:
| December 31, | ||||||||
| 2013 | 2012 | |||||||
| (Amounts in thousands) | ||||||||
Value added tax receivable, net | $ | 23,237 | $ | 18,795 | ||||
Federal income tax receivable | 2,024 | 16,634 | ||||||
Other | 4,250 | 6,905 | ||||||
|
|
|
| |||||
Other receivables, net | $ | 29,511 | $ | 42,334 | ||||
|
|
|
| |||||
Property and Equipment, Net
Our property and equipment consists of the following items:
| December 31, | ||||||||
| 2013 | 2012 | |||||||
| (Amounts in thousands) | ||||||||
Buildings & leasehold improvements | $ | 156,086 | $ | 150,424 | ||||
Furniture, fixtures & equipment | 25,749 | 24,558 | ||||||
Computer equipment | 275,378 | 253,336 | ||||||
Software developed for internal use | 764,226 | 583,051 | ||||||
|
|
|
| |||||
| 1,221,439 | 1,011,369 | |||||||
Accumulated depreciation and amortization | (722,916 | ) | (602,973 | ) | ||||
|
|
|
| |||||
Property and equipment, net | $ | 498,523 | $ | 408,396 | ||||
|
|
|
| |||||
F-59
Other Assets, Net
Other assets consisted of the following:
| December 31, | ||||||||
| 2013 | 2012 | |||||||
| (Amounts in thousands) | ||||||||
Capitalized implementation costs, net | $ | 175,886 | $ | 152,837 | ||||
Long-term deferred income taxes | 34,794 | 3,360 | ||||||
Deferred customer discounts | 90,476 | 47,711 | ||||||
Deferred upfront incentive consideration | 81,581 | 69,660 | ||||||
Other | 86,806 | 82,978 | ||||||
|
|
|
| |||||
Other assets, net | $ | 469,543 | $ | 356,546 | ||||
|
|
|
| |||||
Other Noncurrent Liabilities
Other noncurrent liabilities consisted of the following:
| December 31, | ||||||||
| 2013 | 2012 | |||||||
| (Amounts in thousands) | ||||||||
Litigation settlement liability and related deferred revenue | $ | 98,311 | $ | 127,176 | ||||
Deferred revenue | 50,576 | 60,041 | ||||||
Pension and other postretirement benefits | 55,032 | 109,170 | ||||||
Other | 59,263 | 73,775 | ||||||
|
|
|
| |||||
Other noncurrent liabilities | $ | 263,182 | $ | 370,162 | ||||
|
|
|
| |||||
9. Pension and Other Postretirement Benefit Plans
We sponsor the Sabre Inc. 401(k) Savings Plan (“401(k) Plan”), which is atax-qualified defined contribution plan that allowstax-deferred savings by eligible employees to provide funds for their retirement. We make a matching contribution equal to 100% of eachpre-tax dollar contributed by the participant on the first 6% of eligible compensation. We have recorded expenses related to the 401(k) Plan of approximately $21 million, $20 million and $17 million for the years ended December 31, 2013, 2012 and 2011, respectively.
We also sponsor personal pension plans for eligible staff at lastminute.com, a Travelocity entity. lastminute.com contributed 5% of eligible pay on behalf of these employees to the plan. We contributed and expensed approximately $1 million for each of the years December 31, 2013, 2012 and 2011.
Additionally, we sponsor the Sabre Inc. Legacy Pension Plan (“LPP”), which is atax-qualified defined benefit pension plan for employees meeting certain eligibility requirements. The LPP was amended to freeze pension benefit accruals as of December 31, 2005, so that no additional pension benefits are accrued after that date. In April 2008, we amended the LPP to add a lump sum optional form of payment which participants may elect when their plan benefits commence. The effect of the amendment was to decrease the projected benefit obligation by $34 million, which is being amortized over 23.5 years, representing the weighted average of the lump sum benefit period and the life expectancy of all plan participants. We also sponsor a defined benefit pension plan for certain employees in Canada.
We provide retiree life insurance benefits to certain employees who retired prior to January 1, 2001, and we subsidize a portion of the cost of retiree medical benefits for certain retirees and eligible employees hired prior to
October 1, 2000. In February 2009, we amended our retiree medical plan to reduce the subsidies received by
F-60
participants by 20% per year over the next 5 years, with no further subsidies beginning January 1, 2014. This amendment resulted in $57 million of negative prior service cost recorded in other comprehensive income that was amortized to operating expense over the remaining term which concluded in December 2013.
Pursuant to a Travel Privileges Agreement with American Airlines Group (“AAG”), formerly AMR Corporation, we are entitled to purchase personal travel for certain retirees. Eligible employees were required to retire from the Company on or before June 30, 2008 to receive this benefit, unless they met the requirements todual-retire from AAG and Sabre Holdings. Thesedual-retirees will receive these benefits upon retiring from Sabre Holdings. To pay for the provision of flight privileges for eligible retired employees, we make alump-sum payment to AAG in the year the employees retire.
The following tables provide a reconciliation of the changes in the plans’ benefit obligations, fair value of assets and the funded status as of December 31, 2013 and December 31, 2012:
| Pension Benefits | Other Benefits | |||||||||||||||
| 2013 | 2012 | 2013 | 2012 | |||||||||||||
| (Amounts in thousands) | ||||||||||||||||
Change in benefit obligation: | ||||||||||||||||
Benefit obligation at January 1 | $ | (440,752 | ) | $ | (381,506 | ) | $ | (3,045 | ) | $ | (5,723 | ) | ||||
Service cost | — | — | — | — | ||||||||||||
Interest cost | (17,930 | ) | (19,744 | ) | (41 | ) | (91 | ) | ||||||||
Actuarial gains (losses), net | 37,416 | (59,434 | ) | 607 | (100 | ) | ||||||||||
Benefits paid | 24,805 | 19,932 | 1,665 | 2,869 | ||||||||||||
|
|
|
|
|
|
|
| |||||||||
Benefit obligation at December 31 | $ | (396,461 | ) | $ | (440,752 | ) | $ | (814 | ) | $ | (3,045 | ) | ||||
|
|
|
|
|
|
|
| |||||||||
Change in plan assets: | ||||||||||||||||
Fair value of assets at January 1 | $ | 334,701 | $ | 293,255 | $ | — | $ | — | ||||||||
Actual return on plan assets | 30,007 | 41,143 | — | — | ||||||||||||
Employer contributions | 2,579 | 20,235 | 1,665 | 2,869 | ||||||||||||
Benefits paid | (24,805 | ) | (19,932 | ) | (1,665 | ) | (2,869 | ) | ||||||||
|
|
|
|
|
|
|
| |||||||||
Fair value of assets at December 31 | $ | 342,482 | $ | 334,701 | $ | — | $ | — | ||||||||
|
|
|
|
|
|
|
| |||||||||
Funded status at December 31 | $ | (53,979 | ) | $ | (106,051 | ) | $ | (814 | ) | $ | (3,045 | ) | ||||
The cumulative amounts recognized in the consolidated balance sheets as of December 31, 2013 and December 31, 2012, consist of:
| Pension Benefits | Other Benefits | Total | ||||||||||||||||||||||
| December 31, | December 31, | December 31, | ||||||||||||||||||||||
| 2013 | 2012 | 2013 | 2012 | 2013 | 2012 | |||||||||||||||||||
| (Amounts in thousands) | ||||||||||||||||||||||||
Current liabilities | $ | — | $ | — | $ | (743 | ) | $ | (1,913 | ) | $ | (743 | ) | $ | (1,913 | ) | ||||||||
Noncurrent liabilities | (53,979 | ) | (106,051 | ) | (71 | ) | (1,132 | ) | (54,050 | ) | (107,183 | ) | ||||||||||||
|
|
|
|
|
|
|
|
|
|
|
| |||||||||||||
Total | $ | (53,979 | ) | $ | (106,051 | ) | $ | (814 | ) | $ | (3,045 | ) | $ | (54,793 | ) | $ | (109,096 | ) | ||||||
|
|
|
|
|
|
|
|
|
|
|
| |||||||||||||
The current and noncurrent liabilities are presented in other accrued liabilities and other noncurrent liabilities, respectively, in the consolidated balance sheets.
F-61
The amounts recognized in accumulated other comprehensive income (loss), net of deferred taxes, as of December 31, 2013 and December 31, 2012 consists of:
| Pension Benefits | Other Benefits | Total | ||||||||||||||||||||||
| December 31, | December 31, | December 31, | ||||||||||||||||||||||
| 2013 | 2012 | 2013 | 2012 | 2013 | 2012 | |||||||||||||||||||
| (Amounts in thousands) | ||||||||||||||||||||||||
Net actuarial gain (loss) | $ | (79,959 | ) | $ | (113,697 | ) | $ | 50 | $ | 2,589 | $ | (79,909 | ) | $ | (111,108 | ) | ||||||||
Prior service credit | 16,092 | 17,009 | 55 | 7,941 | 16,147 | 24,950 | ||||||||||||||||||
|
|
|
|
|
|
|
|
|
|
|
| |||||||||||||
Accumulated other comprehensive income (loss) | $ | (63,867 | ) | $ | (96,688 | ) | $ | 105 | $ | 10,530 | $ | (63,762 | ) | $ | (86,158 | ) | ||||||||
|
|
|
|
|
|
|
|
|
|
|
| |||||||||||||
The discount rate used in the measurement of our benefit obligations as of December 31, 2013 and December 31, 2012 is as follows:
| Pension Benefits December 31, | Other Benefits December 31, | |||||||||||||||
| 2013 | 2012 | 2013 | 2012 | |||||||||||||
Weighted-average discount rate | 5.10 | % | 4.19 | % | 0.55 | % | 2.07 | % | ||||||||
Due to the freeze of pension benefit accruals under the LPP as of December 31, 2005, no assumption for future rate of compensation increase is necessary.
The following table provides the components of net periodic benefit costs associated with our pension and other postretirement benefit plans for the years ended December 31, 2013, 2012 and 2011:
| Year Ended December 31, | ||||||||||||
Pension Benefits | 2013 | 2012 | 2011 | |||||||||
| (Amounts in thousands) | ||||||||||||
Interest cost | $ | 17,930 | $ | 19,744 | $ | 20,447 | ||||||
Expected return on plan assets | (23,635 | ) | (24,323 | ) | (23,820 | ) | ||||||
Amortization of prior service credit | (1,432 | ) | (1,432 | ) | (1,432 | ) | ||||||
Amortization of actuarial loss | 7,383 | 4,269 | 2,195 | |||||||||
|
|
|
|
|
| |||||||
Net benefit | $ | 246 | $ | (1,742 | ) | $ | (2,610 | ) | ||||
|
|
|
|
|
| |||||||
| Year Ended December 31, | ||||||||||||
Other Benefits | 2013 | 2012 | 2011 | |||||||||
| (Amounts in thousands) | ||||||||||||
Service cost | $ | — | $ | — | $ | 1 | ||||||
Interest cost | 42 | 91 | 176 | |||||||||
Amortization of prior service credit | (12,348 | ) | (11,397 | ) | (11,397 | ) | ||||||
Amortization of actuarial gain | (3,932 | ) | (1,929 | ) | (745 | ) | ||||||
|
|
|
|
|
| |||||||
Net benefit | $ | (16,238 | ) | $ | (13,235 | ) | $ | (11,965 | ) | |||
|
|
|
|
|
| |||||||
Other Comprehensive Income Net actuarial (gain) loss Amortization of actuarial gain (loss) Amortization of prior service credit Total recognized in other comprehensive income Total recognized in net periodic benefit cost and other comprehensive incomeObligations Recognized in Pension Benefits Other Benefits Year Ended December 31, Year Ended December 31, 2013 2012 2013 2012 (Amounts in thousands) $ (43,787 ) $ 42,614 $ (42 ) $ 187 (7,383 ) (4,269 ) 3,932 1,929 1,432 1,432 12,348 11,397 $ (49,738 ) $ 39,777 $ 16,238 $ 13,513 $ (49,492 ) $ 38,035 $ — $ 278
F-62
Obligations Recognized in Other Comprehensive Income | Pension Benefits | Other Benefits | ||||||||||||||
| Year Ended December 31, | Year Ended December 31, | |||||||||||||||
| 2013 | 2012 | 2013 | 2012 | |||||||||||||
| (Amounts in thousands) | ||||||||||||||||
Net actuarial (gain) loss | $ | (43,787 | ) | $ | 42,614 | $ | (42 | ) | $ | 187 | ||||||
Amortization of actuarial gain (loss) | (7,383 | ) | (4,269 | ) | 3,932 | 1,929 | ||||||||||
Amortization of prior service credit | 1,432 | 1,432 | 12,348 | 11,397 | ||||||||||||
|
|
|
|
|
|
|
| |||||||||
Total recognized in other comprehensive income | $ | (49,738 | ) | $ | 39,777 | $ | 16,238 | $ | 13,513 | |||||||
|
|
|
|
|
|
|
| |||||||||
Total recognized in net periodic benefit cost and other comprehensive income | $ | (49,492 | ) | $ | 38,035 | $ | — | $ | 278 | |||||||
We estimate that $3 million of prior service credit and actuarial loss for the defined benefit pension plans will be amortized from accumulated other comprehensive income (loss) into net periodic benefit cost in 2014.
Income related to pensions and other postretirement benefits totaled approximately $16 million for the year ended December 31, 2013, and $15 million for each of the years ended December 31, 2012 and 2011.
The principal assumptions used in the measurement of our net benefit costs for the three years ended December 31, 2013, 2012 and 2011 are as follows:
| Pension Benefits | Other Benefits | |||||||||||||||||||||||
| 2013 | 2012 | 2011 | 2013 | 2012 | 2011 | |||||||||||||||||||
Discount rate | 4.19 | % | 5.32 | % | 5.88 | % | 1.16 | % | 2.32 | % | 2.69 | % | ||||||||||||
Expected return on plan assets | 7.75 | % | 7.75 | % | 7.75 | % | — | — | — | |||||||||||||||
Due to a cap on our retiree medical plan cost, aone-percentage point change in the assumed health care cost trend rates would not have a significant impact on service and interest cost or on our postretirement benefit obligation as of December 31, 2013 and 2012.
Our overall investment strategy for the LPP is to provide and maintain sufficient assets to meet pension obligations both as an ongoing business, as well as in the event of termination, at the lowest cost consistent with prudent investment management, actuarial circumstances, and economic risk, while minimizing the earnings impact. Diversification is provided by using an asset allocation primarily between equity and debt securities in proportions expected to provide opportunities for reasonablelong-term returns with acceptable levels of investment risk. Fair values of the applicable assets are determined as follows:
Mutual Fund—The fair value of our mutual funds are estimated by using market quotes as of the last day of the period.
Common Collective Trusts—The fair value of our common collective trusts are estimated by using market quotes as of the last day of the period, quoted prices for similar securities and quoted prices innon-active markets.
Real Estate—The fair value of our real estate funds are derived from the fair value of the underlying real estate assets held by the funds. These assets are initially valued at cost and are reviewed periodically utilizing available market data to determine if the assets held should be adjusted.
The basis for the selected target asset allocation included consideration of the demographic profile of plan participants, expected future benefit obligations and payments, projected funded status of the plan and other factors. The target allocations for LPP assets are 25% U.S. equities, 25%non-U.S. equities, 43% long duration
F-63
fixed income, 5% real estate and 2% cash equivalents. It is recognized that the investment management of the LPP assets has a direct effect on the achievement of its goal. As defined in Note 13, Fair Value Measurements, the following tables present the fair value of the LPP assets as of December 31, 2013 and 2012:
| Fair Value Measurements at December 31, 2013 | ||||||||||||||||
| Quoted Prices in Active Markets for Identical Assets (Level 1) | Significant Observable Inputs (Level 2) | Significant Unobservable Inputs (Level 3) | Total | |||||||||||||
| (Amounts in thousands) | ||||||||||||||||
Mutual funds: | ||||||||||||||||
Foreign large value | $ | 42,635 | $ | — | $ | — | $ | 42,635 | ||||||||
Large blend | 43,222 | — | — | 43,222 | ||||||||||||
Large growth | 21,433 | — | — | 21,433 | ||||||||||||
Money market | 6,437 | — | — | 6,437 | ||||||||||||
Common collective trusts: | ||||||||||||||||
Fixed income securities | — | 142,289 | — | 142,289 | ||||||||||||
Foreign equity securities | — | 43,107 | — | 43,107 | ||||||||||||
U.S. equity securities | — | 21,645 | — | 21,645 | ||||||||||||
Real estate | — | — | 21,714 | 21,714 | ||||||||||||
|
|
|
|
|
|
|
| |||||||||
Total assets at fair value | $ | 113,727 | $ | 207,041 | $ | 21,714 | $ | 342,482 | ||||||||
|
|
|
|
|
|
|
| |||||||||
| Fair Value Measurements at December 31, 2012 | ||||||||||||||||
| Quoted Prices in Active Markets for Identical Assets (Level 1) | Significant Observable Inputs (Level 2) | Significant Unobservable Inputs (Level 3) | Total | |||||||||||||
| (Amounts in thousands) | ||||||||||||||||
Mutual funds: | ||||||||||||||||
Foreign large value | $ | 43,183 | $ | — | $ | ��� | $ | 43,183 | ||||||||
Large blend | 40,944 | — | — | 40,944 | ||||||||||||
Large growth | 20,790 | — | — | 20,790 | ||||||||||||
Money market | 4,474 | — | — | 4,474 | ||||||||||||
Common collective trusts: | ||||||||||||||||
Fixed income securities | — | 142,186 | — | 142,186 | ||||||||||||
Foreign equity securities | — | 43,429 | — | 43,429 | ||||||||||||
U.S. equity securities | — | 20,207 | — | 20,207 | ||||||||||||
Real estate | — | — | 19,488 | 19,488 | ||||||||||||
|
|
|
|
|
|
|
| |||||||||
Total assets at fair value | $ | 109,391 | $ | 205,822 | $ | 19,488 | $ | 334,701 | ||||||||
|
|
|
|
|
|
|
| |||||||||
F-64
The following table provides a rollforward of plan assets valued using significant unobservable inputs (level 3), in thousands:
| Real Estate | ||||
Beginning balance at December 31, 2011 | $ | 17,755 | ||
Contributions | 265 | |||
Net distributions | (265 | ) | ||
Advisory fee | (200 | ) | ||
Net investment income | 961 | |||
Change in unrealized gain (loss) | 936 | |||
Net realized gain (loss) | 36 | |||
|
| |||
Ending balance at December 31, 2012 | 19,488 | |||
Contributions | 282 | |||
Net distributions | (282 | ) | ||
Advisory fee | (220 | ) | ||
Net investment income | 1,045 | |||
Change in unrealized gain (loss) | 1,382 | |||
Net realized gain (loss) | 19 | |||
|
| |||
Ending balance at December 31, 2013 | $ | 21,714 | ||
|
| |||
We contributed $3 million, $20 million and $9 million to fund the LPP during the years ended December 31, 2013, 2012 and 2011, respectively. Annual contributions to our defined benefit pension plans in the United States and Canada are based on several factors that may vary from year to year. Our funding practice with respect to the LPP is to contribute the minimum required contribution as defined by law while also maintaining an 80% funded status as defined by the Pension Protection Act of 2006. Thus, past contributions are not always indicative of future contributions. Based on current assumptions, we expect to make $11 million in contributions to our defined benefit pension plans in 2014.
The expectedlong-term rate of return on plan assets for each measurement date was selected after giving consideration to historical returns on plan assets, assessments of expectedlong-term inflation and market returns for each asset class and the target asset allocation strategy. We do not anticipate the return of any plan assets to us in 2014.
We expect to make the following estimated future benefit payments under the plans as follows (in thousands):
| Pension | Other Benefits | |||||||
2014 | $ | 25,000 | $ | 1,000 | ||||
2015 | 26,000 | — | ||||||
2016 | 27,000 | — | ||||||
2017 | 27,000 | — | ||||||
2018 | 28,000 | — | ||||||
2019-2023 | 147,000 | — | ||||||
F-65
10. Income Taxes
The components ofpre-tax income, generally based on the jurisdiction of the legal entity, were as follows:
| Year Ended December 31, | Year Ended December 31, | |||||||||||||||||||||||
| 2013 | 2012 | 2011 | 2013 | 2012 | 2011 | |||||||||||||||||||
| (Amounts in thousands) | (Amounts in thousands) | |||||||||||||||||||||||
Components of pre-tax income | ||||||||||||||||||||||||
Domestic | $ | (185,391 | ) | $ | (1,077,917 | ) | $ | (42,530 | ) | $ | (185,391 | ) | $ | (1,077,917 | ) | $ | (42,530 | ) | ||||||
Foreign | 80,907 | 261,120 | 21,042 | 80,907 | 261,120 | 21,042 | ||||||||||||||||||
|
|
|
|
|
| |||||||||||||||||||
| $ | (104,484 | ) | $ | (816,797 | ) | $ | (21,488 | ) | $ | (104,484 | ) | $ | (816,797 | ) | $ | (21,488 | ) | |||||||
|
|
|
|
|
| |||||||||||||||||||
The Company’s domesticpre-tax loss of $1,078 million in 2012 was due to thepre-tax impact of the litigation settlement with AMR (see Note 20, Commitments and Contingencies), impairment charges (see Note 7, Goodwill and Intangible Assets) and thewrite-off of intercompany debt. The Company’s foreignpre-tax income of $261 million in 2012 was driven by thepre-tax impact of cancellation of intercompany debt income, partially offset by impairment charges.
The provision for income taxes relating to continuing operations consists of the following:
| Year Ended December 31, | Year Ended December 31, | |||||||||||||||||||||||
| 2013 | 2012 | 2011 | 2013 | 2012 | 2011 | |||||||||||||||||||
| (Amounts in thousands) | (Amounts in thousands) | |||||||||||||||||||||||
Current portion: | ||||||||||||||||||||||||
Federal | $ | 19,822 | $ | 7,383 | $ | 1,812 | $ | 19,822 | $ | 7,383 | $ | 1,812 | ||||||||||||
State and Local | 10,902 | 6,757 | 2,772 | 10,902 | 6,757 | 2,772 | ||||||||||||||||||
Non U.S. | 19,937 | 23,062 | 18,813 | 19,937 | 23,062 | 18,813 | ||||||||||||||||||
|
|
|
|
|
| |||||||||||||||||||
Total current | 50,661 | 37,202 | 23,397 | 50,661 | 37,202 | 23,397 | ||||||||||||||||||
|
|
|
|
|
| |||||||||||||||||||
Deferred portion: | ||||||||||||||||||||||||
Federal | (62,557 | ) | (224,424 | ) | 30,780 | (62,557 | ) | (224,424 | ) | 30,780 | ||||||||||||||
State and Local | (2,772 | ) | (10,364 | ) | 889 | (2,772 | ) | (10,364 | ) | 889 | ||||||||||||||
Non U.S. | 639 | 2,515 | 2,740 | 639 | 2,515 | 2,740 | ||||||||||||||||||
|
|
|
|
|
| |||||||||||||||||||
Total deferred | (64,690 | ) | (232,273 | ) | 34,409 | (64,690 | ) | (232,273 | ) | 34,409 | ||||||||||||||
|
|
|
|
|
| |||||||||||||||||||
Total provision (benefit) for income taxes | $ | (14,029 | ) | $ | (195,071 | ) | $ | 57,806 | ||||||||||||||||
Total (benefit) provision for income taxes | $ | (14,029 | ) | $ | (195,071 | ) | $ | 57,806 | ||||||||||||||||
|
|
|
|
|
| |||||||||||||||||||
The provision for income taxes relating to continuing operations differs from amounts computed at the statutory federal income tax rate as follows:
| Year Ended December 31, | ||||||||||||
| 2013 | 2012 | 2011 | ||||||||||
| (Amounts in thousands) | ||||||||||||
Income tax provision at statutory federal income tax rate | $ | (36,569 | ) | $ | (285,879 | ) | $ | (7,521 | ) | |||
State income taxes, net of federal benefit | 5,340 | (246 | ) | 2,445 | ||||||||
Impact of non U.S. taxing jurisdictions, net | 5,565 | (119 | ) | (2,690 | ) | |||||||
Goodwill impairment | 33,454 | 28,630 | 64,203 | |||||||||
Impact of sale of business | (11,798 | ) | (15,209 | ) | — | |||||||
Write off of Intercompany Debt | — | (16,315 | ) | — | ||||||||
Tax loss attributable to non controlling interest | — | 19,694 | 2,570 | |||||||||
Excise tax penalties | 4,333 | — | — | |||||||||
Valuation allowance | (16,010 | ) | 72,261 | — | ||||||||
Other, net | 1,656 | 2,112 | (1,201 | ) | ||||||||
|
|
|
|
|
| |||||||
Total (benefit) provision for income taxes | $ | (14,029 | ) | $ | (195,071 | ) | $ | 57,806 | ||||
|
|
|
|
|
| |||||||
F-66
The components of our deferred tax assets and liabilities are presented in the table below. Certain deferred tax balances as of December 31, 2012 have been revised to reflect actual amounts included in our return; such revisions were not material.
| As of December 31, | ||||||||
| 2013 | 2012 | |||||||
| (Amounts in thousands) | ||||||||
Deferred tax assets: | ||||||||
Accrued expenses | $ | 34,686 | $ | 97,743 | ||||
Employee benefits other than pension | 23,932 | 10,496 | ||||||
Deferred revenue | 67,601 | 69,991 | ||||||
Pension obligations | 18,613 | 39,720 | ||||||
Tax loss carryforwards | 376,427 | 714,175 | ||||||
Non U.S. operations | 33,315 | 10,236 | ||||||
Unrealized gains and losses | (6,794 | ) | 8,408 | |||||
Incentive consideration | (1,101 | ) | (791 | ) | ||||
Tax credit carryforwards | 29,312 | 8,341 | ||||||
TVL Common suspended loss | 24,718 | 24,400 | ||||||
Other | 14,531 | 15,277 | ||||||
|
|
|
| |||||
Total deferred tax assets | 615,240 | 997,996 | ||||||
Deferred tax liabilities: | ||||||||
Depreciation and amortization | (7,844 | ) | (4,901 | ) | ||||
Software developed for internal use | (190,362 | ) | (149,242 | ) | ||||
Intangible assets | (89,895 | ) | (119,585 | ) | ||||
Write off of Intercompany Debt | — | (410,289 | ) | |||||
Currency translation adjustment | (8,085 | ) | (9,243 | ) | ||||
|
|
|
| |||||
Total deferred tax liabilities | (296,186 | ) | (693,260 | ) | ||||
Valuation allowance | (253,082 | ) | (282,091 | ) | ||||
|
|
|
| |||||
Net deferred tax asset | $ | 65,972 | $ | 22,645 | ||||
|
|
|
| |||||
We pay United States (“U.S.”) income taxes on the earnings ofnon-U.S. subsidiaries unless the subsidiaries’ earnings are considered permanently reinvested outside the United States. To the extent that thenon-U.S. earnings previously treated as permanently reinvested are repatriated, the related U.S. tax liability may be reduced by anynon-U.S. income taxes paid on these earnings. As of December 31, 2013, no provision has been made for the United States federal and state income taxes on certain outside basis differences, which primarily relate to accumulatedun-repatriated foreign earnings of approximately $157 million. It is not practical to estimate the unrecognized deferred tax liability for these earnings, as this liability is dependent upon future tax planning strategies.
As of December 31, 2013, we had U.S. federal net operating loss carryforwards (“NOLs”) of approximately $632 million, which will expire between 2021 and 2032 and research tax credit carryforwards of approximately $15 million, which will expire between 2019 and 2032. Additionally, we have a $20 million Alternative Minimum Tax (“AMT”) credit carryforwardcarry forward that does not expire. Approximately $17 million of NOLs and $1 million of research tax credit carryforwards are subject to an annual limitation on their ability to be utilized under Section 382 of the Code. We fully expect that Section 382 will not limit our ability to fully realize the benefit. We had $167 million of deferred tax assets for NOL carryforwards related to certainnon-U.S. taxing jurisdictions that are primarily from countries with indefinite carryforward periods.
We regularly review our deferred tax assets for recoverability and a valuation allowance is provided when it is more likely than not that some portion or all of a deferred tax asset will not be realized. The ultimate
realization of deferred tax assets is dependent upon future taxable income during the periods in which those
F-67
temporary differences become deductible. In assessing the need for a valuation allowance for our deferred tax assets, we considered all available positive and negative evidence, including our ability to carry back operating losses to prior periods, the reversal of deferred tax liabilities, tax planning strategies and projected future taxable income. In assessing the need for a valuation allowance against our U.S. deferred tax assets, we also gave specific consideration to goodwill and intangible impairment charges recorded in the last three years (see Note 7, Goodwill and Intangible Assets) and the charges for the settlement of the litigation with AMR (see Note 20, Commitments and Contingencies). Considering these factors, we established a valuation allowance of approximately $86 million against our U.S. deferred tax assets as of December 31, 2013. In addition, we have an allowance on the U.S. deferred tax assets of TVL Common, Inc. that was merged into our capital structure on December 31, 2012 of $5 million at December 31, 2013 on thenon-U.S. deferred tax assets of our lastminute.com subsidiaries of $163 million and $177 million as of December 31, 2013 and 2012, respectively. We reassess these assumptions regularly which could cause an increase or decrease to the valuation allowance resulting in an increase or decrease in the effective tax rate, and could materially impact our results of operations.
It is our policy to recognize penalties and interest accrued related to income taxes as a component of the provision (benefit) for income taxes. During the years ended December 31, 2013 and 2011, we recognized an expense of $1 million and a benefit of $1 million, respectively. During the year ended December 31, 2012, amounts recognized for penalties and interest were not material to our results of operations. As of December 31, 2013 and 2012, we had cumulative accrued interest and penalties of approximately $5 million and $1 million, respectively.
A reconciliation of the beginning and ending amount of unrecognized tax benefits, excluding interest and penalties, is as follows:
| Year Ended December 31, | Year Ended December 31, | |||||||||||||||||||||||
| 2013 | 2012 | 2011 | 2013 | 2012 | 2011 | |||||||||||||||||||
| (Amounts in thousands) | (Amounts in thousands) | |||||||||||||||||||||||
Balance at beginning of year | $ | 54,016 | $ | 39,080 | $ | 38,072 | $ | 54,016 | $ | 39,080 | $ | 38,072 | ||||||||||||
Additions for tax positions taken in the current year | 10,874 | 16,367 | 3,016 | 10,874 | 16,367 | 3,016 | ||||||||||||||||||
Additons for tax positions of prior years | 5,572 | 3,584 | 1,050 | |||||||||||||||||||||
Additions for tax positions of prior years | 5,572 | 3,584 | 1,050 | |||||||||||||||||||||
Reductions for tax positions of prior years | (196 | ) | (3,113 | ) | (1,691 | ) | (196 | ) | (3,113 | ) | (1,691 | ) | ||||||||||||
Reductions for tax positions of expired statute of limitations | (3,573 | ) | (1,902 | ) | (1,367 | ) | (3,573 | ) | (1,902 | ) | (1,367 | ) | ||||||||||||
Settlements | (5,452 | ) | — | — | (5,452 | ) | — | — | ||||||||||||||||
|
|
|
|
|
| |||||||||||||||||||
Balance at end of year | $ | 61,241 | $ | 54,016 | $ | 39,080 | $ | 61,241 | $ | 54,016 | $ | 39,080 | ||||||||||||
|
|
|
|
|
| |||||||||||||||||||
As of December 31, 2013, 2012 and 2011, the amount of unrecognized tax benefits that, if recognized, would impact the effective tax rate was $58 million, $54 million and $39 million, respectively.
We are subject to U.S. federal income tax as well as income tax of multiple state, local, andnon-U.S. jurisdictions. In the normal course of business, we are subject to examination by taxing authorities throughout the world. In February of 2014, the Internal Revenue Service notified us that they would soon begin examination of our federal income tax returns for the 2011 and 2012 tax years. We do not expect that the results of this examination will have a material effect on our financial condition or results of operations. The U.S. federal statute of limitations is closed for years prior to 2007. With few exceptions, we are no longer subject to state, local, ornon-U.S. tax examinations by tax authorities for years prior to 2008.
The Company believes that it is reasonably possible that $9 million in unrecognized tax benefits may be resolved in the next twelve months.
F-68
11. Debt
The following table sets forth our outstanding debt:
| December 31, | December 31, | |||||||||||||||||||||||||||
| Rate | Maturity | 2013 | 2012 | Rate | Maturity | 2013 | 2012 | |||||||||||||||||||||
| (Amounts in thousands) | (Amounts in thousands) | |||||||||||||||||||||||||||
Senior secured credit facilities: | �� | |||||||||||||||||||||||||||
Term Loan B | L+4.00 | % | February 2019 | $ | 1,747,378 | $ | — | L+4.00 | % | February 2019 | $ | 1,747,378 | $ | — | ||||||||||||||
Incremental term loan facility | L+3.50 | % | February 2019 | 349,125 | — | L+3.50 | % | February 2019 | 349,125 | — | ||||||||||||||||||
Term Loan C | L+3.00 | % | December 2017 | 360,477 | — | L+3.00 | % | December 2017 | 360,477 | — | ||||||||||||||||||
Revolving credit facility | L+3.75 | % | February 2018 | — | — | L+3.75 | % | February 2018 | — | — | ||||||||||||||||||
Initial term loan facility | L+2.00 | % | September 2014 | — | 238,335 | L+2.00 | % | September 2014 | — | 238,335 | ||||||||||||||||||
First extended term loan facility | L+5.75 | % | September 2017 | — | 1,162,622 | L+5.75 | % | September 2017 | — | 1,162,622 | ||||||||||||||||||
Second extended term loan facility | L+5.75 | % | December 2017 | — | 401,515 | L+5.75 | % | December 2017 | — | 401,515 | ||||||||||||||||||
Incremental term loan facility | L+6.00 | % | December 2017 | — | 370,536 | L+6.00 | % | December 2017 | — | 370,536 | ||||||||||||||||||
Senior unsecured notes due 2016 | 8.350 | % | March 2016 | 389,321 | 385,099 | 8.350 | % | March 2016 | 389,321 | 385,099 | ||||||||||||||||||
Senior secured notes due 2019 | 8.500 | % | May 2019 | 799,823 | 801,712 | 8.500 | % | May 2019 | 799,823 | 801,712 | ||||||||||||||||||
Mortgage facility | 5.800 | % | March 2017 | 83,541 | 84,340 | 5.800 | % | March 2017 | 83,541 | 84,340 | ||||||||||||||||||
|
|
|
| |||||||||||||||||||||||||
Total debt | $ | 3,729,665 | $ | 3,444,159 | $ | 3,729,665 | $ | 3,444,159 | ||||||||||||||||||||
|
|
|
| |||||||||||||||||||||||||
Current portion of debt | 86,117 | 23,232 | 86,117 | 23,232 | ||||||||||||||||||||||||
Long-term debt | 3,643,548 | 3,420,927 | 3,643,548 | 3,420,927 | ||||||||||||||||||||||||
|
|
|
| |||||||||||||||||||||||||
Total debt | $ | 3,729,665 | $ | 3,444,159 | $ | 3,729,665 | $ | 3,444,159 | ||||||||||||||||||||
|
|
|
| |||||||||||||||||||||||||
Amended and Restated Senior Secured Credit Facilities
On February 19, 2013, Sabre GLBL Inc. amended and restated the previous credit agreement with a new agreement (the “Amended and Restated Credit Agreement”). The new agreement replaced (i) the existing initial term loans with new classes of term loans of $1,775 million (the “Term Loan B”) and $425 million (the “Term Loan C”) and (ii) the existing revolver with a new revolver of $352 million (the “Revolver”). We used $14 million of term loan proceeds and $2 million of cash on hand to pay debt issuance andthird-party debt modification costs resulting from this transaction.
The Amended and Restated Credit Agreement includes provisions that require us to pay a 1% fee (the “Repricing Premium”) to the respective lenders if we pay off or refinance all or a portion of the Term Loan B within one year –and the Term Loan C within six months– of February 19, 2013. This Repricing Premium is applicable only to the portion paid off or refinanced and does not apply to the scheduled quarterly amortization payments.
On September 30, 2013, we entered into an agreement for an incremental term loan facility to Term Loan B (the “Incremental Term Loan Facility”), having a face value of $350 million and providing total net proceeds of $350 million. We have used a portion, and intend to use the remainder, of the proceeds of the Incremental Term Loan Facility for working capital andone-time costs associated with the Expedia SMA and sale of TPN, including the payment of travel suppliers for travel consumed that originated on our technology platforms, and for general corporate purposes and ongoing and future strategic actions related to Travelocity.purposes. The Incremental Term Loan Facility matures on February 19, 2019 and includes a 1% Repricing Premium if we pay off or refinance all or a portion of the loan with incurrence of long term bank debt before February 19, 2014. This loan currently bears interest at a rate equal to the LIBOR rate, subject to a 1.00% floor, plus 3.50% per annum. It includes a provision for increases in interest rates to maintain a difference of not more than 50 basis points relative to future term loan extensions or refinancing of amounts under the Amended and Restated Credit Agreement.
F-69
Sabre GLBL Inc.’s obligations under the Amended and Restated Credit Agreement are guaranteed by Sabre Holdings and each of Sabre GLBL Inc.’swholly-owned material domestic subsidiaries, except unrestricted
subsidiaries. We refer to these guarantors together with Sabre GLBL Inc., as the Loan Parties. The Amended and Restated Credit Agreement is secured by (i) a first priority security interest on the equity interests in Sabre GLBL Inc. and each other Loan Party that is a direct subsidiary of Sabre GLBL Inc. or another Loan Party, (ii) 65% of the issued and outstanding voting (and 100% of thenon-voting) equity interests of eachwholly-owned material foreign subsidiary of Sabre GLBL Inc. that is a direct subsidiary of Sabre GLBL Inc. or another Loan Party, and (iii) a blanket lien on substantially all of the tangible and intangible assets of the Loan Parties.
Under the Amended and Restated Credit Agreement, the loan parties are subject to certain customarynon-financial covenants, as well as a maximum Senior Secured Leverage Ratio, which applies if our Revolver utilization exceeds certain thresholds and is calculated as Senior Secured Debt (net of cash) to EBITDA, as defined by the agreement. This ratio was 5.5 to 1.0 for 2013 and is 5.0 to 1.0 for 2014. The definition of EBITDA is based on a trailing twelve months EBITDA adjusted for certain items includingnon-recurring expenses and the pro forma impact of cost saving initiatives. As of December 31, 2013, we are in compliance with all covenants under the Amended and Restated Agreement.
As of December 31, 2013 and 2012, we had no outstanding balance on the revolving credit facilities. As of December 31, 2013, we had outstanding letters of credit totaling $67 million, of which $66 million reduces our overall credit capacity under the Revolver and $1 million is collateralized with restricted cash. As of December 31, 2012, we had outstanding letters of credit totaling $114 million of which $112 million reduces our overall credit capacity under the revolver and $2 million is collateralized with restricted cash.
Principal Payments
Term Loan B and the Incremental Term Loan Facility mature on February 19, 2019, and require principal payments in equal quarterly installments of 0.25%. Term Loan C matures on December 31, 2017 and requires principal payments in equal quarterly installments of 3.75% in 2014, increasing to 4.375%, 5.625% and 7.5% in 2015, 2016 and 2017, respectively. The Revolver matures on February 19, 2018. For the year ended December 31, 2013, we made $82 million of scheduled quarterly principal payments. We are scheduled to make $85 million in principal payments over the next twelve months.
We are also required to pay down the term loans by an amount equal to 50% of excess cash flow, as determined by leverage ratios in our Amended and Restated Credit Agreement, each fiscal year end after our annual consolidated financial statements are delivered. This percentage requirement may decrease or be eliminated if certain leverage ratios are achieved. As a result of the Amended and Restated Credit Agreement, no excess cash flow payment was required in 2013 with respect to our results for the year ended December 31, 2012. Additionally, based on our results for the year ended December 31, 2013, we are not required to make an excess cash flow payment in 2014. In the event of certain asset sales or borrowings, the Amended and Restated Credit Agreement requires that we pay down the term loan with the resulting proceeds. Subject to the Repricing Premium discussed above, we may repay the indebtedness at any time prior to the maturity dates without penalty.
Interest
Through February 27, 2012 our initial term loan facility bore interest at London Interbank Offered Rate (“LIBOR”) plus an applicable margin of 2%. After this date and until February 18, 2013, the applicable margin on the first extended portion of our initial term loan facility increased to 5.75% in connection with an amendment and restatement of our previous credit agreement completed on February 28, 2012. On May 9, 2012, we amended and restated the previous credit agreement for a second extended portion of our initial term loan facility to increase the applicable margin on those borrowings to 5.75% which we retained until February 18, 2013. The $371 million of our incremental term loan entered into on August 15, 2012 bore interest at a rate equal to LIBOR, subject to a 1.25% floor, plus 6.00% per annum. The remaining $238 million of our initial term loan
F-70
facility outstanding at December 31, 2012 continued with a 2.00% applicable margin until February 18, 2013. We elected theone-month LIBOR as the floating interest rate on all $2,173 million of our initial term loan
facility outstanding at December 31, 2012, and interest payments were due on the last day of each month. Interest on the outstanding loan was subject to interest rate swaps in a cash flow hedging relationship (see Note 12, Derivatives).
Beginning February 19, 2013, borrowings under the term loan agreement bear interest at a rate equal to either, at our option: (i) the Eurocurrency rate plus an applicable margin for Eurocurrency borrowings as set forth below, or (ii) a base rate determined by the highest of (1) the prime rate of Bank of America, (2) the federal funds effective rate plus 1/2% or (3) a LIBOR rate plus 1.00%, plus an applicable margin for base rate borrowings as set forth below. The Eurocurrency rate is based on LIBOR for all U.S. dollar borrowings and has a floor.
| Eurocurrency borrowings | Base rate borrowings | Eurocurrency borrowings | Base rate borrowings | |||||||||||||||||||||||||||||
| Applicable Margin | Floor | Applicable Margin | Floor | Applicable Margin | Floor | Applicable Margin | Floor | |||||||||||||||||||||||||
Term Loan B | 4.00 | % | 1.25 | % | 3.00 | % | 2.25 | % | 4.00 | % | 1.25 | % | 3.00 | % | 2.25 | % | ||||||||||||||||
Incremental term loan facility | 3.50 | % | 1.00 | % | 2.50 | % | 2.00 | % | 3.50 | % | 1.00 | % | 2.50 | % | 2.00 | % | ||||||||||||||||
Term Loan C | 3.00 | % | 1.00 | % | 2.00 | % | 2.00 | % | 3.00 | % | 1.00 | % | 2.00 | % | 2.00 | % | ||||||||||||||||
Revolving credit facility | 3.75 | % | N/A | 2.75 | % | N/A | 3.75 | % | N/A | 2.75 | % | N/A | ||||||||||||||||||||
Applicable margins step down by 50 basis points for any quarter if the Senior Secured Leverage Ratio is less than or equal to 3.0 to 1.0. Applicable margins increase to maintain a difference of not more than 50 basis points relative to future term loan extensions or refinancings. In addition, we are required to pay a quarterly commitment fee of 0.375% per annum for unused revolving commitments. The commitment fee may increase to 0.500% per annum if the Senior Secured Leverage Ratio is greater than 4.0 to 1.0.
We have elected thethree-month LIBOR as the floating interest rate on all $2,457 million of our outstanding term loans. As of December 31, 2013, the interest rate on these borrowings is 5.25% including an applicable margin of 4.00% for $1,747 million; 4.50% including an applicable margin of 3.50% for $349 million; and 4.00% including an applicable margin of 3.00% for $360 million of our outstanding term loans. Interest payments are due on the last day of each quarter. Interest on a portion of the outstanding loan is hedged with interest rate swaps (see Note 12, Derivatives).
In 2013, we incurred costs totaling $19 million associated with the Amended and Restated Credit Agreement and the Incremental Term Loan Facility of which $14 million was charged to interest expense during the year ended December 31, 2013 and $5 million was capitalized as debt issuance costs. We also recognized a loss on extinguishment of debt of $12 million as a result of the Amended and Restated Credit Agreement. In 2012, we incurred costs totaling $38 million associated with the amendment and extension of certain facilities under our previous credit agreement of which $8 million was charged to interest expense during the year ended December 31, 2012 and $30 million was capitalized as debt issuance costs. In addition, as a result of prepayments under our previous credit agreement, we recognized a charge of $10 million to interest expense related to accelerated amortization of debt issuance costs during the year ended December 31, 2012. As of December 31, 2013, we had $31 million of unamortized debt issuance costs included in other assets in our consolidated balance sheet associated with all debt transactions under the Amended and Restated Credit Agreement and the previous credit agreement. These costs are being amortized to interest expense over the maturity period of the Amended and Restated Credit AgreementAgreement.
Our effective interest rates for the years ended December 31, 2013, 2012 and 2011, inclusive of the accelerated amortization described above, are as follows:
| Year Ended December 31, | Year Ended December 31, | |||||||||||||||||||||||
| 2013 | 2012 | 2011 | 2013 | 2012 | 2011 | |||||||||||||||||||
Including the impact of interest rate swaps | 6.86 | % | 6.53 | % | 4.31 | % | 6.86 | % | 6.53 | % | 4.31 | % | ||||||||||||
Excluding the impact of interest rate swaps | 6.21 | % | 5.65 | % | 2.72 | % | 6.21 | % | 5.65 | % | 2.72 | % | ||||||||||||
F-71
On February 20, 2014, we modified our Amended and Restated Credit Agreement to reduce Term Loan B’s applicable margin for both Eurocurrency and Base rate borrowings, including the related floors. The modification also provides for an incremental revolving commitment of $53 million due February 19, 2019 and extends the maturity date of $317 million of the Revolver to the same date with a provision for earlier maturity on November 19, 2018 if certain conditions are met. See Note 22, Subsequent Events.
Publicly Issued Senior Unsecured Notes
In March 2006, Sabre Holdings issued $400 million in 2016 Notes, bearing interest at a rate of 6.35% and maturing March 15, 2016, in an underwritten public offering resulting in net cash proceeds after expenses of approximately $397 million. The 2016 Notes include certainnon-financial covenants, including restrictions on incurring certain types of debt or entering into certain sale and leaseback transactions. We used all of the net proceeds plus available cash and cash equivalents and marketable securities to prepay $400 million of a bridge facility used to finance the acquisition of our subsidiary lastminute.com. Under the terms of the 2016 Notes, we paid $29 million in interest charges in 2007 and are obligated to pay $34 million per year afterwards until 2016. Interest payments are due in March and September each year. The interest rate payable on the 2016 Notes increased to 8.35% effective March 16, 2007 due to a credit rating decline resulting from the acquisition of Sabre Holdings. As of December 31, 2013, we are in compliance with all covenants under the indenture for the 2016 Notes.
In August 2001, Sabre Holdings issued $400 million in 2011 Notes, bearing interest at a rate of 7.35% and maturing August 1, 2011, in an underwritten public offering resulting in net cash proceeds to us of approximately $397 million. The interest payments were due in February and August each year. The 2011 Notes included certainnon-financial covenants, including restrictions on incurring certain types of debt or entering into certain sale and leaseback transactions. In April 2009, we reduced our debt obligations by $76 million for the 2011 Notes. During the quarter ended September 30, 2011, we paid down the remaining $324 million of principal and $12 million of accrued interest on our unsecured notes which matured on August 1, 2011.
On March 30, 2007, in connection with the acquisition of Sabre Holdings by Sabre Corporation, Sabre Holdings filed Form 15 with the Securities and Exchange Commission and terminated its reporting obligations with respect to its common stock, the 2011 Notes and the 2016 Notes under the Securities Exchange Act of 1934, as amended. In connection with the acquisition of Sabre Holdings, we also amended and restated the guarantee by Sabre GLBL of the 2011 Notes and the 2016 Notes in response to a request from the rating agencies so that the 2011 Notes and the 2016 Notes would not be structurally subordinated to Sabre GLBL’s obligations under its senior secured credit facilities. Sabre Corporation has not assumed this guarantee and is not otherwise guaranteeing the 2011 Notes, which have since been repaid, or the 2016 Notes.
Senior Secured Notes
On May 9 and September 20, 2012, Sabre GLBL Inc. issued a total of $800 million in senior secured notes ($400 million each) bearing interest at a rate of 8.50% and maturing on May 15, 2019, pursuant to Rule 144A under the Securities Act of 1933, as amended, (“Securities Act”), resulting in net proceeds of approximately $796 million after capitalized expenses of $5 million. The May 9 and September 20, 2012 offerings (collectively “2019 Notes”) include certainnon-financial covenants, including restrictions on incurring certain types of indebtedness, creation of liens on certain assets, making of certain investments, and payment of dividends. These covenants are similar in nature to those existing on the senior secured credit facilities. The 2019 Notes have not and will not be registered under the Securities Act. We used $679 million of the net proceeds to pay off certain lenders under our previous senior secured credit facilities, and retained the remainder for general corporate purposes. A portion of the retained funds was subsequently used for funding the acquisition of PRISM (See Note 3, Acquisitions).
Interest is calculated from the date of the original issuance, or May 9, 2012, on the 2019 Notes. We are obligated to pay $68 million in interest per year until 2019. Payments are due in May and November each year. Additionally, capitalized costs related to these transactions are being amortized to interest expense over the 2019 Notes maturity period.
F-72
The indenture to the senior secured notes allows the Company, at its option, to redeem up to 40% of the principal amount of the notes outstanding in the event of an equity offering, such as an initial public offering, until May 15, 2015. The contingent call option is at a price of 108.50%, plus accrued and unpaid interest, if any, to the date of redemption. In order to exercise the contingent call option, at least 50% of the aggregate principal originally issued must remain outstanding after the option is exercised, and the redemption must occur within 120 days of the equity offering closing date. The fair value of the contingent call option that met the definition of an embedded derivative was a gain of $2 million at December 31, 2013, and was not material as of December 31, 2012. The call option is recorded as a component of long term debt, with an offsetting unrealized gain in other, net. See Note 12, Derivatives and Note 13, Fair Value Measurements.
Mortgage Facility
On March 29, 2007, we purchased the buildings, land and furniture and fixtures located at our headquarter facilities in Southlake, Texas, which were previously financed under a capital lease facility. The total purchase price of the assets was $104 million. The purchase was financed through $85 million raised by a mortgage facility that we entered into and $19 million from cash on hand. The $85 million mortgage facility carries an interest rate of 5.8% and is secured by the headquarters building which had a net book value of $83 million as of December 31, 2013. Payments made through March 1, 2012 were applied to accrued interest only. Subsequent to that date, payments are also applied to the principal balance of the facility. Payments are due on the first business day of each month. The facility matures on March 1, 2017 and all unpaid principal will be due at that time. As of December 31, 2013 we are in compliance with all covenants set forth in the facility agreement.
Note Payable to a Joint Venture Partner
On March 31, 2002 we entered into a promissory note with one of our joint venture partners. The note carried an interest rate of 8.0% and matured on March 31, 2012, having a zero balance as of December 31, 2013 and 2012.
12. Derivatives
Hedging Objectives—We are exposed to certain risks relating to ongoing business operations. The primary risks managed by using derivative instruments are foreign currency exchange rate risk and interest rate risk. Forward contracts on various foreign currencies are entered into to manage the foreign currency exchange rate risk on operational exposure denominated in foreign currencies. Interest rate swaps are entered into to manage interest rate risk associated with ourfloating-rate borrowings. In accordance with authoritative guidance on accounting for derivatives and hedging, we designate foreign currency forward contracts as cash flow hedges on operational exposure and interest rate swaps as cash flow hedges offloating-rate borrowings.
Cash Flow Hedging Strategy—For derivative instruments that are designated and qualify as cash flow hedges, the effective portion of the gain or loss on the derivative instrument is reported as a component of other comprehensive income (loss) and reclassified into earnings in the same line item associated with the forecasted transaction and in the same period or periods during which the hedged transaction affects earnings. The remaining gain or loss on the derivative instrument in excess of the cumulative change in the present value of future cash flows of the hedged item, if any (ineffective portion) or hedge components excluded from the assessment of effectiveness, are recognized in the consolidated statements of operations during the current period.
To protect against the reduction in value of forecasted foreign currency cash flows resulting from export sales over the next year, we have instituted a foreign currency cash flow hedging program. We hedge portions of our expenses denominated in foreign currencies with forward contracts. When the dollar strengthens significantly against the foreign currencies, the decline in present value of future foreign currency revenue is offset by gains in the fair value of the forward contracts designated as hedges. Conversely, when the dollar weakens, the increase in the present value of future foreign currency cash flows is offset by losses in the fair value of the forward contracts.
F-73
We have entered into interest rate swap agreements to manage interest rate risk exposure. The interest rate swap agreements utilized effectively modify our exposure to interest rate risk by convertingfloating-rate debt to a fixed rate basis, thus reducing the impact of interest rate changes on future interest expense and net earnings. These agreements involve the receipt of floating rate amounts in exchange for fixed rate interest payments over the life of the agreements without an exchange of the underlying principal amount.
Our interest rate swaps are not designated in a cash flow hedging relationship because we no longer qualified for hedge accounting treatment following the amendment and restatement of our Senior Secured Credit Facility in February of 2013 (see Note 11, Debt). Derivatives not designated as hedging instruments are carried at fair value with changes in fair value reflected in the consolidated statement of operations.
Forward Contracts—In order to hedge our operational exposure to foreign currency movements, we are a party to certain foreign currency forward contracts that extend until December 1, 2014. We have designated these instruments as cash flow hedges. No hedging ineffectiveness was recorded in earnings relating to the forwards during the years ended December 31, 2013, 2012, or 2011. As the outstanding contracts settle, it is estimated that $5 million in gains will be reclassified from other comprehensive income (loss) to earnings. We have also entered intoshort-term forward contracts to hedge a portion of our foreign currency exposure related to travel supplier liability payments. As part of our risk management strategy, these derivatives were not designated for hedge accounting at inception; therefore, the change in fair value of these contracts is recorded in our consolidated statements of operations.
As of December 31, 2013 and 2012, we had the following unsettled purchased foreign currency forward contracts that were entered into to hedge our operational exposure to foreign currency movements:
December 31, 2013 Outstanding Notional Amount | ||||||||||||||
Buy Currency | Sell Currency | Foreign Amount | USD Amount | Average Contract Rate | ||||||||||
| (Amounts in thousands, excluding average contract rates) | ||||||||||||||
US Dollar | Australian Dollar | 5,625 | $ | 5,041 | 0.8962 | |||||||||
Australian Dollar | US Dollar | 975 | 996 | 1.0215 | ||||||||||
Euro | US Dollar | 12,800 | 16,624 | 1.2988 | ||||||||||
British Pound Sterling | US Dollar | 18,450 | 28,908 | 1.5668 | ||||||||||
Indian Rupee | US Dollar | 1,174,000 | 18,593 | 0.0158 | ||||||||||
Polish Zloty | US Dollar | 170,400 | 52,748 | 0.3096 | ||||||||||
December 31, 2012 Outstanding Notional Amount | ||||||||||||||
Buy Currency | Sell Currency | Foreign Amount | USD Amount | Average Contract Rate | ||||||||||
| (Amounts in thousands, excluding average contract rates) | ||||||||||||||
Australian Dollar | US Dollar | 4,400 | $ | 4,433 | 1.0074 | |||||||||
Euro | US Dollar | 20,005 | 26,168 | 1.3081 | ||||||||||
British Pound Sterling | US Dollar | 15,850 | 25,418 | 1.6036 | ||||||||||
Indian Rupee | US Dollar | 1,236,000 | 21,899 | 0.0177 | ||||||||||
Polish Zloty | US Dollar | 158,450 | 48,503 | 0.3061 | ||||||||||
December 31, 2013 Outstanding Notional Amount Buy Currency US Dollar Australian Dollar Euro British Pound Sterling Indian Rupee Polish Zloty December 31, 2012 Outstanding Notional Amount Buy Currency Australian Dollar Euro British Pound Sterling Indian Rupee Polish Zloty Sell Currency Foreign
Amount USD
Amount Average Contract
Rate (Amounts in thousands, excluding average contract rates) Australian Dollar 5,625 $ 5,041 0.8962 US Dollar 975 996 1.0215 US Dollar 12,800 16,624 1.2988 US Dollar 18,450 28,908 1.5668 US Dollar 1,174,000 18,593 0.0158 US Dollar 170,400 52,748 0.3096 Sell Currency Foreign
Amount USD
Amount Average Contract
Rate (Amounts in thousands, excluding average contract rates) US Dollar 4,400 $ 4,433 1.0074 US Dollar 20,005 26,168 1.3081 US Dollar 15,850 25,418 1.6036 US Dollar 1,236,000 21,899 0.0177 US Dollar 158,450 48,503 0.3061
Interest Rate Swap Contracts—During April 2007, in connection with our senior secured credit facilities (see Note 11, Debt) with athree-month LIBOR as the floating interest rate, we entered into six interest rate swaps. Under the terms of the swaps, the interest rate payments and receipts are quarterly on the last day of January, April, July and October. The reset dates on the swaps are also the last day of January, April, July and October each year until maturity.
F-74
The table below includes the outstanding and matured interest rate swaps relevant to the years ended December 31, 2013, 2012 and 2011:
| Notional Amount | Interest Rate Received | Interest Rate Paid | Effective Date | Maturity Date | ||||||||||||||
Outstanding: | $ | 400 million | 1 month LIBOR | 2.03 | % | July 29, 2011 | September 30, 2014 | |||||||||||
| $ | 350 million | 1 month LIBOR | 2.51 | % | April 30, 2012 | September 30, 2014 | ||||||||||||
|
| |||||||||||||||||
| $ | 750 million | |||||||||||||||||
|
| |||||||||||||||||
Matured: | $ | 800 million | 3 month LIBOR | 5.04 | % | April 30, 2007 | April 30, 2012 | |||||||||||
| $ | 350 million | 3 month LIBOR | 4.99 | % | April 30, 2007 | April 30, 2011 | ||||||||||||
| $ | 125 million | 3 month LIBOR | 5.04 | % | April 30, 2007 | April 28, 2011 | ||||||||||||
| $ | 125 million | 3 month LIBOR | 5.03 | % | April 30, 2007 | April 28, 2011 | ||||||||||||
|
| |||||||||||||||||
| $ | 1,400 million | |||||||||||||||||
|
| |||||||||||||||||
The objective of the swaps is to hedge the interest payments associated withfloating-rate liabilities on the notional amounts of our Senior Secured Debt as summarized above. The effectiveness of the swaps is periodically assessed throughout the life of the swaps using the “hypothetical derivative method.” The hypothetical swap has terms that identically match the terms of the floating rate liability, and is therefore presumed to perfectly offset the hedged cash flows. We review the critical terms of the swaps and the hedged instrument quarterly to validate that the terms continue to match and that there has been no deterioration in the creditworthiness of the counterparties. Hedge ineffectiveness is calculated quarterly based upon the excess of the cumulative change in the fair value of the actual swap over the cumulative change in the fair value of the “perfect” hypothetical swap. The amount of ineffectiveness, if any, is recorded in earnings. For the years ended December 31, 2012 and 2011, no hedge ineffectiveness has been incurred.
The estimated fair values of our derivatives designated as hedging instruments as of December 31, 2013 and 2012 are provided below:
| Derivative Assets (Liabilities) | Derivative Assets (Liabilities) | |||||||||||||||||||
Derivatives designated as | Balance Sheet Location | Fair Value as of December 31, | Balance Sheet Location | Fair Value as of December 31, | ||||||||||||||||
| 2013 | 2012 | 2013 | 2012 | |||||||||||||||||
| (Amounts in thousands) | (Amounts in thousands) | |||||||||||||||||||
Foreign exchange contracts | Prepaid expenses | $ | 5,374 | $ | 2,568 | Prepaid expenses | $ | 5,374 | $ | 2,568 | ||||||||||
Interest rate swaps | Other accrued liabilities | — | (15,111 | ) | Other accrued liabilities | — | (15,111 | ) | ||||||||||||
| Other noncurrent liabilities | — | (10,461 | ) | Other noncurrent liabilities | — | (10,461 | ) | |||||||||||||
|
|
|
| |||||||||||||||||
Total | $ | 5,374 | $ | (23,004 | ) | $ | 5,374 | $ | (23,004 | ) | ||||||||||
|
|
|
| |||||||||||||||||
F-75
The effects of derivative instruments, net of taxes, on other comprehensive income (loss) (“OCI”) for the years ended December 31, 2013, 2012 and 2011 are provided below:
| Amount of Gain (Loss) Recognized in OCI on Derivative (Effective Portion) | Amount of Gain (Loss) Recognized in OCI on Derivative (Effective Portion) | ||||||||||||||||||||||||||||
Derivatives in Cash Flow | Year Ended December 31, | Year Ended December 31, | ||||||||||||||||||||||||||||
| 2013 | 2012 | 2011 | 2013 | 2012 | 2011 | |||||||||||||||||||||||||
| (Amounts in thousands) | (Amounts in thousands) | |||||||||||||||||||||||||||||
Foreign exchange contracts | $ | 2,999 | $ | 4,593 | $ | (577 | ) | $ | 2,999 | $ | 4,593 | $ | (577 | ) | ||||||||||||||||
Interest rate swaps | — | (3,924 | ) | (24,092 | ) | — | (3,924 | ) | (24,092 | ) | ||||||||||||||||||||
|
|
|
|
|
| |||||||||||||||||||||||||
Total | $ | 2,999 | $ | 669 | $ | (24,669 | ) | $ | 2,999 | $ | 669 | $ | (24,669 | ) | ||||||||||||||||
|
|
|
|
|
| |||||||||||||||||||||||||
| Amount of Gain (Loss) Reclassified from Accumulated OCI into Income (Effective Portion) | Amount of Gain (Loss) Reclassified from Accumulated OCI into Income (Effective Portion) | |||||||||||||||||||||||||||||
Derivatives in Cash Flow | Location | Year Ended December 31, | Year Ended December 31, | |||||||||||||||||||||||||||
| 2013 | 2012 | 2011 | Location | 2013 | 2012 | 2011 | ||||||||||||||||||||||||
| (Amounts in thousands) | (Amounts in thousands) | |||||||||||||||||||||||||||||
Foreign exchange contracts | Cost of revenue | $ | 915 | $ | (2,890 | ) | $ | 8,508 | Cost of revenue | $ | 915 | $ | (2,890 | ) | $ | 8,508 | ||||||||||||||
Interest rate swaps | Interest expense | — | (15,906 | ) | (29,250 | ) | Interest expense | — | (15,906 | ) | (29,250 | ) | ||||||||||||||||||
|
|
|
|
|
| |||||||||||||||||||||||||
Total | $ | 915 | $ | (18,796 | ) | $ | (20,742 | ) | $ | 915 | $ | (18,796 | ) | $ | (20,742 | ) | ||||||||||||||
|
|
|
|
|
| |||||||||||||||||||||||||
As described in Note 11, Debt, on February 19, 2013 we entered into an agreement that amended and restated our existing senior secured credit facilities. As a result, a critical term of the interest rate swap agreements no longer matched the senior secured debt, and we no longer qualified for hedge accounting as of January 1, 2013. For the year ended December 31, 2013, we reclassified $15 million, or $9 million, net of tax, from OCI to interest expense related to the derivatives that no longer qualify for hedge accounting. As of December 31, 2013, the estimated fair value of interest rate swaps not designated as hedging instruments was a $12 million liability and included in other accrued liabilities in our consolidated balance sheet. The accumulated unrealized loss related to these derivatives was $11 million at December 31, 2013 and will be amortized from other comprehensive income (loss) into interest expense through the maturity date of the respective swap agreements. The adjustment to fair value of these interest rate swap agreements for the year ended December 31, 2013 was not material to our results of operations. We had no other derivatives not designated as hedging instruments as of December 31, 2013 and 2012. See “—Forward Contracts” for additional information on our purpose for entering into derivatives not designated as hedging instruments and our overall risk management strategies.
Embedded Derivative Related to Senior Secured Notes—Notes—On May 9, 2012 Sabre GLBL Inc. issued $400 million in senior secured notes which included a contingent call option to redeem up to 40% of the notes in the event of an equity offering at a rate of 108.50%, until May 15, 2015. This contingent call option is not clearly and closely related to the hybrid indenture and therefore requires separate accounting. We recognized a change in the fair value of the option as a gain of $2 million in other, net in our results of operations for the year ended December 31, 2013. The change in fair value of the option was not material for the year ended December 31, 2012.
F-76
13. Fair Value Measurements
Fair value is defined as the price that would be received to sell an asset or paid to transfer a liability in an orderly transaction between market participants at the measurement date in the principal or most advantageous
market for that asset or liability. Guidance on fair value measurements and disclosures establishes a valuation hierarchy for disclosure of inputs used in measuring fair value defined as follows:
Level 1—Inputs are unadjusted quoted prices that are available in active markets for identical assets or liabilities.
Level 2—Inputs include quoted prices for similar assets and liabilities in active markets and quoted prices innon-active markets, inputs other than quoted prices that are observable, and inputs that are not directly observable, but are corroborated by observable market data.
Level 3—Inputs that are unobservable and are supported by little or no market activity and reflect the use of significant management judgment.
A financial asset’s or liability’s classification within the hierarchy is determined based on the least reliable level of input that is significant to the fair value measurement. In determining fair value, we utilize valuation techniques that maximize the use of observable inputs and minimize the use of unobservable inputs to the extent possible. We also consider the counterparty and our ownnon-performance risk in our assessment of fair value.
Fair values of applicable assets and liabilities are estimated as follows:
Foreign Currency Forward Contracts—The fair value of the foreign currency forward contracts were estimated based upon pricing models that use inputs derived from or corroborated by observable market data such as currency spot and forward rates.
Interest Rate Swaps—Swaps—The fair value of our interest rate swaps were estimated using a combined income andmarket-based valuation methodology based upon credit ratings and forward interest rate yield curves obtained from independent pricing services reflecting broker market quotes.
Contingent Consideration—On August 1, 2012, we acquired all of the outstanding stock and ownership interest of PRISM (see Note 3, Acquisitions). Included in the purchase price is contingent consideration, based on management’s best estimate of fair value and future performance results on the acquisition date and is to be paid in 24 months following the acquisition date. Fair value of this payment was estimated considering the timing of the payments and discounted at 4.75%, representing ourshort-term borrowing rate based on our revolving credit facility at the time of the acquisition. For the year ended December 31, 2013, we recognized $1 million in expense related to the change in fair value of the contingent consideration. The expense recognized during the year ended December 31, 2012 related to the change in fair value was not material. A 1% increase or decrease in our discount rate will result in a 1.4% change in fair value.
Embedded Derivative—On May 15, 2012, we acquired a contingent call option to redeem a portion of our senior secured notes in the event of an equity offering (see Note 11, Debt). We modeled the fair value of this call option by evaluating the difference in fair value of the hybrid instrument with and without the call option requiring separate accounting. We calculated the fair value using Level 3 unobservable inputs such as management’s estimate of the probability of an equity offering, credit spreads and the expected future volatility of interest rates based on historical trends. When other inputs are held constant, the higher our expectation of future interest rate volatility, the lower the fair value of the call option. Changes to the unobservable inputs could result in a significantly higher or lower fair value measurement.
F-77
Assets and Liabilities Measured at Fair Value on a Recurring Basis—Basis—The following tables present the fair value of our assets (liabilities) that are required to be measured at fair value on a recurring basis as of December 31, 2013 and 2012:
| Fair Value at Reporting Date Using | Fair Value at Reporting Date Using | |||||||||||||||||||||||||||||||
| December 31, 2013 | Level 1 | Level 2 | Level 3 | December 31, 2013 | Level 1 | Level 2 | Level 3 | |||||||||||||||||||||||||
| (Amounts in thousands) | (Amounts in thousands) | |||||||||||||||||||||||||||||||
Contingent consideration | $ | (26,303 | ) | $ | — | $ | — | $ | (26,303 | ) | $ | (26,303 | ) | $ | — | $ | — | $ | (26,303 | ) | ||||||||||||
Derivatives | ||||||||||||||||||||||||||||||||
Foreign currency forward contracts (see Note 12) | 5,374 | — | 5,374 | — | 5,374 | — | 5,374 | — | ||||||||||||||||||||||||
Interest rate swap contracts (see Note 12) | (11,533 | ) | — | (11,533 | ) | — | (11,533 | ) | — | (11,533 | ) | — | ||||||||||||||||||||
Contingent call option, 2019 Notes (see Note 11) | 1,657 | — | — | 1,657 | 1,657 | — | — | 1,657 | ||||||||||||||||||||||||
|
|
|
|
|
|
|
| |||||||||||||||||||||||||
Total derivatives | (4,502 | ) | — | (6,159 | ) | 1,657 | (4,502 | ) | — | (6,159 | ) | 1,657 | ||||||||||||||||||||
|
|
|
|
|
|
|
| |||||||||||||||||||||||||
Total | $ | (30,805 | ) | $ | — | $ | (6,159 | ) | $ | (24,646 | ) | $ | (30,805 | ) | $ | — | $ | (6,159 | ) | $ | (24,646 | ) | ||||||||||
|
|
|
|
|
|
|
| |||||||||||||||||||||||||
| Fair Value at Reporting Date Using | Fair Value at Reporting Date Using | |||||||||||||||||||||||||||||||
| December 31, 2012 | Level 1 | Level 2 | Level 3 | December 31, 2012 | Level 1 | Level 2 | Level 3 | |||||||||||||||||||||||||
| (Amounts in thousands) | (Amounts in thousands) | |||||||||||||||||||||||||||||||
Contingent consideration | $ | (25,193 | ) | $ | — | $ | — | (25,193 | ) | $ | (25,193 | ) | $ | — | $ | — | (25,193 | ) | ||||||||||||||
Derivatives | ||||||||||||||||||||||||||||||||
Foreign currency forward contracts (see Note 12) | 2,568 | — | 2,568 | — | 2,568 | — | 2,568 | — | ||||||||||||||||||||||||
Interest rate swap contracts (see Note 12) | (25,572 | ) | — | (25,572 | ) | — | (25,572 | ) | — | (25,572 | ) | — | ||||||||||||||||||||
|
|
|
|
|
|
|
| |||||||||||||||||||||||||
Total derivatives | (23,004 | ) | — | (23,004 | ) | — | (23,004 | ) | — | (23,004 | ) | — | ||||||||||||||||||||
|
|
|
|
|
|
|
| |||||||||||||||||||||||||
Total | $ | (48,197 | ) | $ | — | $ | (23,004 | ) | $ | (25,193 | ) | $ | (48,197 | ) | $ | — | $ | (23,004 | ) | $ | (25,193 | ) | ||||||||||
|
|
|
|
|
|
|
| |||||||||||||||||||||||||
Assets and Liabilities Measured at Fair Value on a Nonrecurring Basis—Fair values of applicable assets and liabilities which arere-measured on a nonrecurring basis are estimated as follows:
Goodwill and Intangible Assets—As described in Note 2, Summary of Significant Accounting Policies, our assessment ofnon-financial assets that are required to be measured at fair value on anon-recurring basis is performed annually, as of October 1, or more frequently if events and circumstances indicate that impairment may have occurred. As of June 2013, we initiated an impairment analysis on the Travelocity North America and Europe reporting units following the allocation of goodwill to TBiz and Holiday Autos. The fair values of these reporting units’ goodwill and intangible assets were estimated using discounted future cash flow projections in 2013, a Level 3 input. Based on the results of the analysis, the goodwill for Travelocity—North America was written down by $96 million and the goodwill for Travelocity—Europe was written down by $40 million. As of June 30, 2013, Travelocity had no goodwill remaining. During the three months ended September 30, 2013, we impaired software developed for internal use for Travelocity—Europe by $2 million. Certain other definite lived intangible assets were impaired by $1 million to a fair value of zero. Our Travelocity—Europe trade name was not impaired as a result of this assessment. Additionally, we measured the goodwill associated with our remaining operating units: Travel Network, Airline Solutions and Hospitality Solutions, as of October 1, 2013 in connection with the annual impairment tests, which did not lead to an impairment charge in 2013.
In 2012, certain competitors of Travelocity announced plans to move towards offering hotel customers a choice of payment options which could adversely affect margins earned on hotel room sales over time. Travelocity’s move to this new revenue model could additionally impact its working capital as it would collect less cash up front, reducing the size of existing supplier liability over time. We also saw continued weakness in
F-78
the business performance of Travelocity in the fourth quarter of 2012. We therefore completed multiple impairment analyses of goodwill andlong-lived assets in 2012. The fair value of our Travelocity reporting units’ goodwill and long lived assets were estimated using discounted future cash flow projections, a Level 3 input. The goodwill for Travelocity—North America was written down by $58 million to its implied fair value of $105 million, andlong-lived assets, including definite lived intangible assets, software developed for internal use, computer equipment and capitalized implementation costs, were written down by $281 million to $87 million. In 2012, the goodwill for Travelocity—Europe was written down by $70 million to its implied fair value of $76 million and long lived assets, including definite lived intangible assets, software developed for internal use and computer equipment, were written down by $154 million to their fair value of $16 million.
In 2011, goodwill for Travelocity—North America was written down by $173 million to its implied fair value of $163 million based on an analysis performed in June 30, 2011 as a result of triggering events that led to an interim assessment. Additionally, we measured the goodwill associated with Travelocity—North America and Europe as of October 1, 2011 in connection with the annual impairment tests we performed on our goodwill. As a result of the annual testing performed, goodwill for our Travelocity—Europe reporting unit was written down by $12 million to its implied fair value of $151 million. The fair values of the reporting units’ goodwill andlong-lived assets were estimated using discounted future cash flow projections in 2011, a Level 3 input.
Litigation Settlement Payable—On October 30, 2012, we reached a settlement agreement with AMR with respect to breach of contract and antitrust claims brought against us in 2011. We denied AMR’s allegations and aggressively defended against these claims and pursued our own legal rights as warranted. The settlement liability is considered amultiple-element arrangement and the components included in the settlement have been recorded at fair value. The net charge recorded in 2012 consists of several elements, including cash and future cash to be paid directly to AMR, payment credits to pay for future technology services that we provide (as defined in the agreements), and an estimate of the fair value of other agreements entered into concurrently with the settlement agreement, Level 3 inputs. See Note 20, Commitments and Contingencies—Legal Proceedings for additional information on the litigation charges. As of December 31, 2013 and 2012 the remaining obligations were $39 million and $118 million, in litigation settlement liability and related deferred revenue and $98 million and $127 million in other noncurrent liabilities, respectively, on our consolidated balance sheets.
Notes Payable—Payable—The fair value of our 2016 Notes, 2019 Notes and term loan are determined based on quoted market prices for the identical liability when traded as an asset in an active market, a Level 1 input. The outstanding principal balance of our mortgage facility approximated its fair value as of December 31, 2013 and 2012. The fair values of the mortgage facility were determined based on estimates of current interest rates for similar debt, a Level 2 input.
The following table presents the fair value and carrying value of our 2016 Notes, 2019 Notes and term loans as of December 31, 2013 and 2012:
Financial Instrument | Fair Value at December 31, 2013 | Carrying Value at December 31, 2013 | ||
$400 million 2016 notes | $448 million | $389 million | ||
$800 million 2019 notes | $886 million | $800 million | ||
$1,775 million Term Loan B | $1,777 million | $1,747 million | ||
$350 million Incremental Term Facility | $349 million | $349 million | ||
$425 million Term Loan C | $363 million | $360 million |
Financial Instrument | Fair Value at December 31, 2012 | Carrying Value at December 31, 2012 | ||||||||
$400 million 2016 notes | $ | 429 million | $ | 385 million | ||||||
$800 million 2019 notes | $ | 854 million | $ | 802 million | ||||||
$1,802 million Term Loan B | $ | 1,812 million | $ | 1,802 million | ||||||
$375 million incremental term loan
| $ | 380 million | $ | 371 million | ||||||
F-79
14. Comprehensive Income (Loss)
At December 31, 2013 and 2012, the components of accumulated other comprehensive income (loss), net of related deferred income taxes were as follows:
| December 31, | December 31, | |||||||||||||||
| 2013 | 2012 | 2013 | 2012 | |||||||||||||
| (Amounts in thousands) | (Amounts in thousands) | |||||||||||||||
Defined benefit pension & other post retirement benefit plans | $ | (63,762 | ) | $ | (86,158 | ) | $ | (63,762 | ) | $ | (86,158 | ) | ||||
Unrealized loss on foreign currency forward contracts and interest rate swaps | (2,684 | ) | (14,222 | ) | (2,684 | ) | (14,222 | ) | ||||||||
Unrealized foreign currency translation gain | 15,050 | 1,934 | 15,050 | 1,934 | ||||||||||||
Other (1) | 1,501 | 2,916 | 1,501 | 2,916 | ||||||||||||
|
|
|
| |||||||||||||
Total accumulated other comprehensive loss, net of tax | $ | (49,895 | ) | $ | (95,530 | ) | $ | (49,895 | ) | $ | (95,530 | ) | ||||
|
|
|
| |||||||||||||
| (1) | Primarily relates to our share of Abacus’ accumulated other comprehensive income. See Note 6, Equity Method Investments. |
The change in defined benefit pension and other postretirement benefit plans is net of deferred tax effects of approximately $12 million, $19 million, and $16 million for the years ended December 31, 2013, 2012, and 2011 respectively.
The change in unrealized gain (loss) on foreign currency forward contracts and interest rate swaps is net of deferred tax effects of approximately $6 million, $9 million and $1 million for the years ended December 31, 2013, 2012, and 2011, respectively.
The change in unrealized foreign currency translation gain (loss) is net of deferred tax effects of approximately $3 million for the year ended December 31, 2013 and $1 million for each of the years ended December 31, 2012 and 2011.
The tax effects allocated to the other components of accumulated other comprehensive income during the years ended December 31, 2013, 2012, and 2011 were not material.
Reclassification adjustments, net of tax, for (gains) losses included in net income were as follows:
| Year Ended December 31, | Year Ended December 31, | |||||||||||||||||||||||
| 2013 | 2012 | 2011 | 2013 | 2012 | 2011 | |||||||||||||||||||
| (Amounts in thousands) | (Amounts in thousands) | |||||||||||||||||||||||
Foreign currency translation (1) | $ | 8,162 | $ | 888 | $ | — | $ | 8,162 | $ | 888 | $ | — | ||||||||||||
Foreign exchange contracts | (915 | ) | 2,890 | (8,508 | ) | (915 | ) | 2,890 | (8,508 | ) | ||||||||||||||
Interest rate swaps | 9,453 | 15,906 | 29,250 | 9,453 | 15,906 | 29,250 | ||||||||||||||||||
Prior service costs and actuarial gains | (5,409 | ) | (6,716 | ) | (7,285 | ) | (5,409 | ) | (6,716 | ) | (7,285 | ) | ||||||||||||
|
|
|
|
|
| |||||||||||||||||||
Total | $ | 11,291 | $ | 12,968 | $ | 13,457 | $ | 11,291 | $ | 12,968 | $ | 13,457 | ||||||||||||
|
|
|
|
|
| |||||||||||||||||||
| (1) | Relates to the dispositions of Zuji in 2013 and TravelGuru and Sabre Pacific in 2012. See Note 4, Discontinued Operations and Dispositions. |
15. Redeemable Preferred Stock
Our authorized preferred stock consists of 225 million shares with a par value of $0.01 per share of which 87.5 million shares of preferred stock have been designated as Series A Preferred Stock with a stated value of $5.75$5.7468681218772 per share. As of December 31, 2013, and 2012, there were 87,229,703 preferred shares issued and 87,184,178 preferred shares outstanding, all of which were Series A Preferred Stock.
F-80
Voting
Holders of the Series A Preferred Stock have no voting rights except with respect to the creation of any class or series of capital stock having any preference or priority over Series A Preferred Stock or the amendment or repeal of any provision of the constituent documents of the Company that adversely changes the powers, preferences or special rights of the Series A Preferred Stock.
Dividends
Each share of Series A Preferred Stock accumulates dividends at an annual rate of 6%. Accumulated but unpaid dividends totaled $134 million and $97 million at December 31, 2013 and 2012, respectively. The Series A Preferred Shares were recorded at fair value at the date of issuance and have been adjusted each period to the current redemption value which includes accumulated but unpaid dividends. On December 31, 2009, we declared and paid a $90 millionin-kind dividend through the conversion of ourwholly-owned subsidiary Travelocity.com Inc. into Travelocity.com LLC (see Note 2, Summary of Significant Accounting Policies). No cash dividends have been paid since the inception of the Series A Preferred Shares.
Liquidation
The holders of the Series A Preferred Stock have the right to require us to repurchase their shares in the form of cash in the amount of the stated value per share plus accrued and unpaid dividends upon the occurrence of a liquidation event as described in the Certificate of Correction of the Second Amended and Restated Certificate of Incorporation of Sabre Corporation (“Liquidation Events”). Liquidation Events are: (a) a consolidation or merger in which the Company is not the surviving entity to the extent that holders of common stock of the Company receive cash, indebtedness, or preferred stock of the surviving entity and holders of Series A Preferred Stock do not receive preferred stock of the surviving entity with rights, powers, and preferences equal to or more favorable than those of the Series A Preferred Stock; (b) a disposition of all or substantially all of the assets of the Company; (c) any person or group of persons acquiring beneficial ownership of more than 50% of the total voting power or equity interest in the Company; (d) the first underwritten public offering and sale of the equity securities of the Company for cash; or (e) the 30th anniversary of the date of issuance of the Series A Preferred Stock. At the time of repurchase, the Series A Preferred Stock must be presented in units, each of which is to consist of two restricted shares of currently outstanding common stock and five shares of Series A Preferred Stock. For each unit presented for repurchase, the holders will receive back two unrestricted shares of common stock in addition to the cash in the amount of the stated value per share of Series A Preferred Stock plus accrued and unpaid dividends.
Redemption
The Series A Preferred Stock are redeemable for cash in the amount of the stated value per share plus accrued and unpaid dividends. At our option, we may redeem all or part of the Series A Preferred Stock at any time. The majority holders of the Series A Preferred Stock are TPG and Silver Lake which have the right to elect the board of directors in their capacity as owners. Therefore, the Series A Preferred Shares are also redeemable at the option of the holders of the Preferred Stock. As such, the Series A Preferred Stock is presented outside of permanent equity as temporary equity in our consolidated balance sheet. At the time of redemption, the Series A Preferred Stock must be presented in units, each of which is to consist of two restricted shares of currently
outstanding common stock and five shares of Series A Preferred Stock. For each unit presented for redemption, the holders will receive back two unrestricted shares of common stock in addition to the cash in the amount of the stated value per share of Series A Preferred Stock plus accrued and unpaid dividends.
16. Stockholders’ Equity
Common Stock—Our authorized common stock consists of 450 million shares with a par value of $0.01 per share. As of December 31, 2013 and 2012, there were 178,633,408 and 177,911,922 shares issued, respectively,
F-81
and 178,491,568 and 177,789,402 shares outstanding, respectively. No dividend or distribution can be declared or paid with respect of the common stock, and we cannot redeem, purchase, acquire, or retire for value the common stock, unless and until the full amount of unpaid dividends accrued on the Series A Preferred Stock has been paid.
17. Options and OtherEquity-Based Awards
As of December 31, 2013, our outstanding equity based compensation plans and agreements include:
Under these plans, the Company has granted stock options, stock appreciation rights, restricted stock and restricted stock units. Sabre Corporation was formerly Sovereign Holdings, Inc.
Our Plans
Sovereign Holdings, Inc. Management Equity Incentive Plan—Under the Sovereign Holdings, Inc. Management Equity Incentive Plan (“Sovereign MEIP”), adopted June 11, 2007, as amended in April 22, 2010, key employees and, in certain circumstances, the directors, service providers and consultants, of the Company and its affiliates may be granted stock options. Under the Sovereign MEIP:
generally, a liquidity event is defined as the occurrence of (i) a transaction or series of transactions that results, directly or indirectly, in the sale, transfer or other disposition of (a) the shares of common stock
of Sabre Corporation or TVL Common, Inc. held by TPG or Silver Lake (the “the Majority Stockholder”), or (b) the assets of Sabre Corporation or TVL Common, Inc. or (ii) any other transaction or series of transactions determined by the Board, in its sole discretion, to constitute a liquidity event.
|
Effective September 14, 2012, all shares available for future grants were transferred to the Sovereign Holdings, Inc. 2012 Management Equity Incentive Plan. Additionally, shares that were covered by prior awards of stock options granted under the Sovereign MEIP that were forfeited or otherwise expire unexercised or
F-82
without the issuance of shares of Sabre Corporation common stock are also transferred to the Sovereign Holdings, Inc. 2012 Management Equity Incentive Plan. Therefore, as of December 31, 2013, no shares remained available for future grants under the Sovereign MEIP.
TVL Common, Inc. Restricted Stock Grant Agreement—In 2010, we adopted the TVL Common, Inc. Restricted Stock Grant Agreement (“TVL Common RSA”). Under the TVL Common RSA, any employee who had an outstanding grant of stock options under the Sovereign MEIP as of December 31, 2009 received a grant of restricted shares under the TVL Common RSA. Under the TVL Common RSA:
In connection with the dividend of the noncontrolling interest in Travelocity.com LLC (see Note 2, Summary of Significant Accounting Policies) in December 2009, each holder of outstandingtime-based andperformance-based options under the Sovereign MEIP was granted restricted shares in TVL Common, Inc. in 2010.
Effective December 31, 2012, our majority shareholders approved a merger transaction in which all available and outstanding shares under the TVL Common RSA were cancelled. Therefore, as of December 31, 2012, no shares were outstanding or remained available for future grants under the TVL Common RSA.
Travelocity.com LLC Stock Option Grant Agreement—In 2010, pursuant to the terms of the Travelocity.com LLC limited liability company agreement (“TVL.com LLC Agreement”), we issued stock options using the Travelocity.com LLC Stock Option Grant Agreement (“TVL.com SOA”). Pursuant to the TVL.com LLC Agreement, key employees and, in certain circumstances, the directors, service providers and consultants, of the Company and its affiliates could be granted stock options to purchase common units of Travelocity.com LLC. Under the terms of the TVL.com LLC Agreement, as set forth in the TVL.com SOA:
At December 31, 2013, 2,801,888 options remained available for future grants pursuant to the TVL.com LLC Agreement, using the TVL.com SOA.
Sovereign Holdings, Inc. Restricted Stock Grant Agreement—Agreement—In 2011, we granted 354,191 shares of Sabre Corporation restricted common stock as an employment inducement award, and not under any equity incentive
plan adopted by the Company. The shares of Sabre Corporation restricted common stock vest ratably over three years from the date of grant,one-third on each anniversary of the grant date.
Sovereign Holdings, Inc. Stock Incentive Plan for Travelocity’s CEO Stock Settled SARs With Respect to Travelocity Equity; and Sovereign Holdings, Inc. Stock Incentive Plan—Stock Settled SARs with Respect to Travelocity Equity—In 2011, we adopted the Sovereign Holdings, Inc. Stock Incentive Plan for Travelocity’s CEO Stock Settled SARs With Respect to Travelocity Equity (“Travelocity Equity 2011”) and in 2012, we adopted the Sovereign Holdings, Inc. Stock IncentivePlan—Stock-Settled SARs with Respect to Travelocity
F-83
Equity (“Travelocity Equity 2012”). Under the Travelocity Equity 2011 plan, Travelocity’s CEO was grantedstock-settled SARs relating to Travelocity Holdings, Inc. (“THI”) common stock and Travelocity.com LLC common units. Under the Travelocity Equity 2012 plan, key employees and, in certain circumstances, directors, service providers and consultants, of the Company and its affiliates may be grantedstock-settled SARs relating to THI common stock and Travelocity.com LLC common units. Under the terms of these plans:
In 2012, the Travelocity Equity 2011 plan was amended and any outstanding Tandem SARs were cancelled and a new award of Tandem SARs was issued under the amended plan with an exercise price equal to the fair market value of THI common stock and THI common units on the date of grant. The terms of this amended plan and the vesting schedule of the new award of Tandem SARs were consistent with the original plan and the initial grant of Tandem SARs. The new award of Tandem SARs vests 25% after the first anniversary of the grant date and the remainder vests quarterly thereafter. The grant of tandem SARs is accounted for as a modification and resulted in $1 million of additional expense for the year ended December 31, 2012.
The total number of SARs reserved and available for issuance under the Travelocity Equity 2012 plan is limited to an aggregate of 16,565,408 shares of THI common stock and 16,565,408 Travelocity.com LLC common units.
At December 31, 2013, a total of 7,505,466 shares of THI common stock and 7,505,466 Travelocity.com LLC common units remained available for future grants under both plans.
Sovereign Holdings, Inc. Restricted Stock Unit Grant Agreement—Agreement—In 2012, we granted an award oftime-based RSUs to the Chief Executive Officer of Travelocity that, due to the nature of these RSUs, are accounted for as liability awards and have an aggregate fixed value of $3 million using the Sovereign Holdings, Inc. Restricted Stock Unit Grant Agreement (the Sovereign RSU Agreement”) and not under any equity incentive plan adopted by the Company. The Sovereign RSU Agreement vests as to certain fixed dollar amounts ratably each six months starting on December 15, 2012 through June 15, 2015 and is settled in shares of Sabre Corporation common stock or the prescribed cash amount. The number of shares of Sabre Corporation common stock to be delivered at
each vesting date is determined by dividing these prescribed amounts by the current fair market value of Sabre Corporation common stock on each vesting date, with any residual value to be delivered in cash. As a condition to settlement of the Sovereign RSU Agreement, the Chief Executive Officer of Travelocity would forfeit up to 30% of the shares of THI and common units of Travelocity.com LLC underlying his Tandem SAR award under the Travelocity Equity 2011 plan on certain specified dates.
Sovereign Holdings, Inc. 2012 Management Equity Incentive Plan—Plan—Under the Sovereign Holdings, Inc. 2012 Management Equity Incentive Plan (“Sovereign 2012 MEIP”), adopted September 14, 2012, key
F-84
employees and, in certain circumstances, the directors, service providers and consultants, of the Company and its affiliates may be granted stock options, restricted shares, RSUs,performance-based awards and otherstock-based awards. Under the Sovereign 2012 MEIP:
At December 31, 2013, 2,384,558 shares remained available for future grants of equity awards under the Sovereign 2012 MEIP.
Grants ofEquity-Based Awards
All grants of stock options have an exercise price equal to the estimated fair market value of our common stock on the date of grant. Because we are privately held and there is no public market for our common stock, the fair market value of our common stock is determined utilizing factors such as our actual and projected financial results, valuations of the Company performed by third parties and other information obtained from public, financial and industry sources.
Performance-Based Stock Options—In 2008, we issuedperformance-based stock options under the Sovereign MEIP. The granted options shall vest and become exercisable upon the occurrence of a liquidity event which triggers certain performance measures. Because the performance condition is contingent on a liquidity event, no expense will be recognized in connection with these options until such an event is probable.
The fair value of theperformance-based stock options granted was estimated at the date of grant using theBlack-Scholes option pricing model with the followingweighted-average assumptions:
| Year Ended December 31, 2008 | Year Ended December 31, 2008 | |||||||
Exercise price | $ | 5.00 | $ | 5.00 | ||||
Average risk-free interest rate | 4.15 | % | 4.15 | % | ||||
Expected life (in years) | 6.85 | 6.85 | ||||||
Implied volatility | 36.40 | % | 36.40 | % | ||||
Weighted-average fair value | $ | 1.81 | $ | 1.81 | ||||
F-85
As of December 31, 2013, there was approximately $2 million unrecognized compensation expense that will be recognized at the time the criteria for recognition are met.Performance-based share activities for the year ended December 31, 2013 were as follows:
Sovereign MEIP Performance-based Stock Options | Options | Weighted-Average Exercise Price | Options | Weighted-Average Exercise Price | ||||||||||||
Outstanding and Nonvested at December 31, 2012 | 776,037 | $ | 5.00 | 776,037 | $ | 5.00 | ||||||||||
Granted | — | — | — | — | ||||||||||||
Cancelled | — | — | — | — | ||||||||||||
|
|
| ||||||||||||||
Outstanding and Nonvested at December 31, 2013 | 776,037 | $ | 5.00 | 776,037 | $ | 5.00 | ||||||||||
|
|
| ||||||||||||||
Time-Based Equity Awards—We issue, or have issued,time-based equity awards in the form of SARs and stock options under the Sovereign MEIP, TVL.com SOA, Travelocity Equity 2011, Travelocity Equity 2012, and the Sovereign 2012 MEIP. Generally, these awards vest over five years, or immediately upon a liquidity event, and are not exercisable more than ten years after the date of grant.
The fair value of the stock options granted was estimated at the date of grant using theBlack-Scholes option pricing model with the followingweighted-average assumptions:
| Year Ended December 31, 2013 | Year Ended December 31, 2013 | |||||||
| Sovereign 2012 MEIP | Sovereign 2012 MEIP | |||||||
Exercise price | $ | 11.91 | $ | 11.91 | ||||
Average risk-free interest rate | 1.53 | % | 1.53 | % | ||||
Expected life (in years) | 6.11 | 6.11 | ||||||
Implied volatility | 30.75 | % | 30.75 | % | ||||
Weighted-average estimated fair value | $ | 3.89 | $ | 3.89 | ||||
| Year Ended December 31, 2012 | Year Ended December 31, 2012 | |||||||||||||||||||||||||||||||
| Sovereign 2012 MEIP | TVL.com SOA | Tandem SARs (1) | Sovereign MEIP | Sovereign 2012 MEIP | TVL.com SOA | Tandem SARs(1) | Sovereign MEIP | |||||||||||||||||||||||||
Exercise price | $ | 9.96 | $ | 0.12 | $ | 1.45 | $ | 8.41 | $ | 9.96 | $ | 0.12 | $ | 1.45 | $ | 8.41 | ||||||||||||||||
Average risk-free interest rate | 0.93 | % | 1.53 | % | 1.02 | % | 1.41 | % | 0.93 | % | 1.53 | % | 1.02 | % | 1.41 | % | ||||||||||||||||
Expected life (in years) | 6.44 | 6.44 | 6.11 | 6.44 | 6.44 | 6.44 | 6.11 | 6.44 | ||||||||||||||||||||||||
Implied volatility | 31.42 | % | 45.00 | % | 45.02 | % | 35.45 | % | 31.42 | % | 45.00 | % | 45.02 | % | 35.45 | % | ||||||||||||||||
Weighted-average estimated fair value | $ | 3.29 | $ | 0.04 | $ | 0.64 | $ | 3.17 | $ | 3.29 | $ | 0.04 | $ | 0.64 | $ | 3.17 | ||||||||||||||||
| Year Ended December 31, 2011 | Year Ended December 31, 2011 | |||||||||||||||||||||||
| TVL.com SOA | Tandem SARs (1) | Sovereign MEIP | TVL.com SOA | Tandem SARs(1) | Sovereign MEIP | |||||||||||||||||||
Exercise price | $ | 0.16 | $ | 1.74 | $ | 8.59 | $ | 0.16 | $ | 1.74 | $ | 8.59 | ||||||||||||
Average risk-free interest rate | 2.07 | % | 2.57 | % | 1.88 | % | 2.07 | % | 2.57 | % | 1.88 | % | ||||||||||||
Expected life (in years) | 6.44 | 6.44 | 6.44 | 6.44 | 6.44 | 6.44 | ||||||||||||||||||
Implied volatility | 42.82 | % | 42.50 | % | 35.90 | % | 42.82 | % | 42.50 | % | 35.90 | % | ||||||||||||
Weighted-average estimated fair value | $ | 0.06 | $ | 0.61 | $ | 3.36 | $ | 0.06 | $ | 0.61 | $ | 3.36 | ||||||||||||
| (1) | Represents the weighted average of Tandem SARs granted under the Travelocity Equity 2011 and Travelocity Equity 2012 plans. |
F-86
We expensed $4 million in the year ended December 31, 2013 and $7 million in each of the years ended December 31, 2012 and 2011 related totime-based stock options. As of December 31, 2013, we have
approximately $21 million in unrecognized compensation expense that will be recognized over the associated vesting periods. aweighted-average period of 2.0 years.Time-based share activities for the year ended December 31, 2013 were as follows:
| Sovereign MEIP Stock Options | Sovereign 2012 MEIP Stock Options | Sovereign MEIP Stock Options | Sovereign 2012 MEIP Stock Options | |||||||||||||||||||||||||||||||||||||||||||||
| Weighted-Average | Weighted-Average | Weighted-Average | Weighted-Average | |||||||||||||||||||||||||||||||||||||||||||||
| Quantity | Exercise Price | Remaining Contractual Term (years) | Quantity | Exercise Price | Remaining Contractual Term (years) | Quantity | Exercise Price | Remaining Contractual Term (years) | Quantity | Exercise Price | Remaining Contractual Term (years) | |||||||||||||||||||||||||||||||||||||
Outstanding at December 31, 2012 | 17,235,250 | $ | 4.84 | 5.68 | 1,505,225 | $ | 9.96 | 8.92 | 17,235,250 | $ | 4.84 | 5.68 | 1,505,225 | $ | 9.96 | 8.92 | ||||||||||||||||||||||||||||||||
Granted | — | — | — | 2,910,621 | 11.91 | — | — | — | — | 2,910,621 | 11.91 | — | ||||||||||||||||||||||||||||||||||||
Exercised | (596,285 | ) | 4.92 | — | — | — | — | (596,285 | ) | 4.92 | — | — | — | — | ||||||||||||||||||||||||||||||||||
Cancelled | (987,896 | ) | 5.14 | — | (153,500 | ) | 10.18 | — | (987,896 | ) | 5.14 | — | (153,500 | ) | 10.18 | — | ||||||||||||||||||||||||||||||||
|
| |||||||||||||||||||||||||||||||||||||||||||||||
Outstanding at December 31, 2013 | 15,651,069 | 4.81 | 4.66 | 4,262,346 | 11.62 | 8.18 | 15,651,069 | 4.81 | 4.66 | 4,262,346 | 11.29 | 8.18 | ||||||||||||||||||||||||||||||||||||
|
|
|
| |||||||||||||||||||||||||||||||||||||||||||||
Vested and exercisable at December 31, 2013 | 14,170,926 | $ | 4.59 | 4.63 | 485,546 | $ | 10.98 | 9.14 | 14,170,926 | $ | 4.59 | 4.63 | 485,546 | $ | 10.98 | 9.14 | ||||||||||||||||||||||||||||||||
|
| |||||||||||||||||||||||||||||||||||||||||||||||
| TVL.com SOA Time-based Stock Options | Travelocity Equity 2012 Tandem SARs | |||||||||||||||||||||||
| Weighted-Average | Weighted-Average | |||||||||||||||||||||||
| Quantity | Exercise Price | Remaining Contractual Term (years) | Quantity | Exercise Price | Remaining Contractual Term (years) | |||||||||||||||||||
Outstanding at December 31, 2012 | 1,960,231 | $ | 0.43 | 7.59 | 21,607,122 | $ | 1.45 | 7.38 | ||||||||||||||||
Cancelled | (475,701 | ) | 0.48 | — | (3,487,238 | ) | 1.45 | — | ||||||||||||||||
|
|
|
| |||||||||||||||||||||
Outstanding at December 31, 2013 | 1,484,530 | 0.41 | 6.66 | 18,119,884 | 1.45 | 6.38 | ||||||||||||||||||
|
|
|
| |||||||||||||||||||||
Vested and exercisable at December 31, 2013 | 1,009,904 | $ | 0.52 | 6.56 | — | $ | — | — | ||||||||||||||||
The total intrinsic value of stock options exercised was $5 million, $4 million and $1 million for the years ended December 31, 2013, 2012 and 2011, respectively. As of December 31, 2013, the aggregate intrinsic value for outstanding options under the Sovereign MEIP and Sovereign 2012 MEIP plans totaled $232 million and $34 million, respectively; and the aggregate intrinsic value for vested and exercisable options under the Sovereign MEIP and Sovereign 2012 MEIP plans totaled $213 million and $4 million, respectively.
In 2013 and in 2012, the Board of Directors approved modifications of Sovereign MEIP stock options held by six employees by extending the exercise period following their termination. This change was accounted for as a modification and resulted in less than $1 million of stock compensation expense in each of the years ended December 31, 2013 and 2012. There were no modifications during the year ended December 31, 2011.
Restricted Stock—In 2011, we issuedgranted restricted shares of Sabre Corporation’s common stock which vest ratably over three years. In the event of a dissolution or liquidation of Sabre Corporation, sale of all or substantially all of Sabre Corporation’s assets, or merger of Sabre Corporation, the Board may exchange the restricted shares of Sabre Corporation’s common stock for restricted shares of common stock in the new or surviving entity or settle in cash.
Restricted stock is measured based on the fair market value of the underlying stock on the date of the grant. Shares of Sabre Corporation common stock are delivered on the vesting dates with the applicable statutory tax withholding requirements to be satisfied per the terms of the Sovereign Holdings, Inc. Restricted Stock Grant Agreement.
F-87
For the year ended December 31, 2013, we recorded approximately $1 million in compensation expense related to the issuancegrant of restricted stock. As of December 31, 2013, we have a negligible amount in unrecognized compensation expense that will be recognized over the associated vesting periods. As of December 31, 2013, all restricted stocks granted are non-vested.
Restricted stock activities for the year ended December 31, 2013 were as follows:
Sabre Corporation Restricted Stock | Quantity | Weighted-Average Fair Value Per Award | ||||||
Restricted stock, beginning of year | 236,127 | $ | 8.47 | |||||
Granted | — | — | ||||||
Vested | (118,063 | ) | 8.47 | |||||
|
|
|
| |||||
Restricted stock, end of year | 118,064 | $ | 8.47 | |||||
|
|
|
| |||||
Restricted Stock Units—In November 2012, the Board approved a grant oftime-based RSUs with an aggregate fixed value of $3 million. The RSUs are able to be settled at the Board’s discretion in shares of our common stock or cash and are accounted for as liability awards. Expense associated with this grant of RSUs is being recognized over the associated vesting period as stock compensation expense. As of December 31, 2013, we have a negligible amount recorded in other noncurrent liabilities on our consolidated balance sheets related to these RSUs.
Ourperformance-based RSUs vest evenly over a four year period dependent upon certaincompany-based performance measures being achieved. On the date of grant, we determine the fair value of theperformance-based awards, taking into account the probability of achieving the performance measures. Each reporting period, were-assess the probability assumption and, if there is an adjustment, record the cumulative effect of the adjustment in the current reporting period. For the year ended December 31, 2013 we expensed $4 million in stock compensation expense related to 1,304,063performance-based RSUs.
18. Earnings Per Share
The following table reconciles the numerators and denominators used in the computations of basic and diluted earnings per share:
| Year Ended December 31, | Year Ended December 31, | |||||||||||||||||||||||
| 2013 | 2012 | 2011 | 2013 | 2012 | 2011 | |||||||||||||||||||
| (Amounts in thousands, except per share data) | (Amounts in thousands, except per share data) | |||||||||||||||||||||||
Net loss from continuing operations | $ | (90,455 | ) | $ | (621,726 | ) | $ | (79,294 | ) | $ | (90,455 | ) | $ | (621,726 | ) | $ | (79,294 | ) | ||||||
Net income (loss) attributable to noncontrolling interests | 2,863 | (59,317 | ) | (36,681 | ) | 2,863 | (59,317 | ) | (36,681 | ) | ||||||||||||||
Preferred stock dividends | 36,704 | 34,583 | 32,579 | 36,704 | 34,583 | 32,579 | ||||||||||||||||||
|
|
|
|
|
| |||||||||||||||||||
Net loss from continuing operations available to common shareholders | $ | (130,022 | ) | $ | (596,992 | ) | $ | (75,192 | ) | $ | (130,022 | ) | $ | (596,992 | ) | $ | (75,192 | ) | ||||||
|
|
|
|
|
| |||||||||||||||||||
Basic and diluted weighted-average number of shares outstanding | 178,125 | 177,206 | 176,703 | 178,125 | 177,206 | 176,703 | ||||||||||||||||||
Basic and diluted loss per share available to common shareholders | $ | (0.73 | ) | $ | (3.37 | ) | $ | (0.43 | ) | $ | (0.73 | ) | $ | (3.37 | ) | $ | (0.43 | ) | ||||||
Basic earnings per share are based on the weighted average number of common shares outstanding during each period. Diluted earnings per share are based on the weighted average number of common shares outstanding and the effect of all dilutive common stock equivalents during each period. For the years ended December 31, 2013, 2012 and 2011, we had 22 million, 20 million and 21 million common stock equivalents, respectively,
F-88
primarily associated with ourstock-options. As we recorded net losses for each period presented, all common stock equivalents were excluded from the calculation of diluted earnings per share as its inclusion would have been antidilutive. As a result, basic and diluted earnings per share are equal for each period.
Tandem SARs issued with respect to the Travelocity Equity 2012 plan may be settled in shares of the underlying stock and units, interests in Sabre Corporation or any successor to Sabre Corporation, THI or Travelocity.com LLC, or in cash. If we elect to settle in shares of Sabre Corporation, the quantity issued is based on the intrinsic value of the Tandem SARs at the time of settlement and the fair value of Sabre Corporation shares at the time of settlement. For the years ended December 31, 2013, 2012 and 2011, no shares were issuable under this calculation and therefore there were no common stock equivalents associated with the Tandem SARs.
19. Related Party Transactions
On March 30, 2007, we entered into a Management Services Agreement (the “MSA”) with affiliates of TPG and Silver Lake to provide us with management services. Pursuant to the agreement, we are required to pay monitoring fees of $5 million to $7 million each year which are dependent on consolidated earnings before
interest, taxes, depreciation and amortization for these services. We recognized $7 million in expense related to the annual monitoring fee for each of the years ended December 31, 2013, 2012 and 2011, respectively, in our consolidated statements of income. Additionally, we reimburse affiliates of TPG and Silver Lake forout-of-pocket expenses incurred by them or their affiliates in connection with services provided pursuant to the MSA. For the year ended December 31, 2013, these expenses were $1 million. For the years ended December 31, 2012 and 2011, these expenses were not material. In connection with the completion of an offering or sale of the company, we will be required to pay to TPG and Silver Lake, in the aggregate, a $21 million fee pursuant to the MSA and the MSA will be terminated.
For related party transactions with Abacus, an equity method investment, refer to Note 6, Equity Method Investments.
20. Commitments and Contingencies
Future Minimum Payments under Contractual Obligations
At December 31, 2013, future minimum payments required under the Amended and Restated Credit Agreement, 2016 Notes and 2019 Notes, the mortgage facility, operating lease agreements with terms in excess of one year for facilities, equipment and software licenses and other significant contractual cash obligations were as follows:
| Payments Due by Period | ||||||||||||||||||||||||||||
Contractual Obligations | 2014 | 2015 | 2016 | 2017 | 2018 | Thereafter | Total | |||||||||||||||||||||
| (Amounts in thousands) | ||||||||||||||||||||||||||||
Total debt (1) | $ | 320,662 | $ | 315,929 | $ | 726,845 | $ | 360,459 | $ | 244,391 | $ | 2,855,934 | $ | 4,824,220 | ||||||||||||||
Headquarters mortgage (2) | 5,984 | 5,984 | 5,984 | 80,895 | — | — | 98,847 | |||||||||||||||||||||
Operating lease obligations(3) | 31,450 | 27,217 | 23,363 | 15,435 | 9,668 | 25,789 | 132,922 | |||||||||||||||||||||
IT outsourcing agreement(4) | 165,983 | 156,492 | 135,307 | 99,305 | — | — | 557,087 | |||||||||||||||||||||
Purchase orders (5) | 137,456 | 2,146 | 1,565 | — | — | — | 141,167 | |||||||||||||||||||||
Letters of credit (6) | 65,238 | 128 | 1,621 | — | — | 151 | 67,138 | |||||||||||||||||||||
WNS agreement(7) | 23,777 | 24,910 | — | — | — | — | 48,687 | |||||||||||||||||||||
Other purchase obligations (8) | 39,175 | — | — | — | — | — | 39,175 | |||||||||||||||||||||
Unrecognized tax benefits (9) | — | — | — | — | — | — | 66,620 | |||||||||||||||||||||
|
|
|
|
|
|
|
|
|
|
|
|
|
| |||||||||||||||
Total contractual cash obligations (10) | $ | 789,725 | $ | 532,806 | $ | 894,685 | $ | 556,094 | $ | 254,059 | $ | 2,881,874 | $ | 5,975,863 | ||||||||||||||
|
|
|
|
|
|
|
|
|
|
|
|
|
| |||||||||||||||
| Payments Due by Period | ||||||||||||||||||||||||||||
Contractual Obligations | 2014 | 2015 | 2016 | 2017 | 2018 | Thereafter | Total | |||||||||||||||||||||
| (Amounts in thousands) | ||||||||||||||||||||||||||||
Total debt(1) | $ | 320,662 | $ | 315,929 | $ | 726,845 | $ | 360,459 | $ | 244,391 | $ | 2,855,934 | $ | 4,824,220 | ||||||||||||||
Headquarters mortgage(2) | 5,984 | 5,984 | 5,984 | 80,895 | — | — | 98,847 | |||||||||||||||||||||
Operating lease obligations(3) | 31,450 | 27,217 | 23,363 | 15,435 | 9,668 | 25,789 | 132,922 | |||||||||||||||||||||
IT outsourcing agreement(4) | 165,983 | 156,492 | 135,307 | 99,305 | — | — | 557,087 | |||||||||||||||||||||
Purchase orders(5) | 137,456 | 2,146 | 1,565 | — | — | — | 141,167 | |||||||||||||||||||||
Letters of credit(6) | 65,238 | 128 | 1,621 | — | — | 151 | 67,138 | |||||||||||||||||||||
WNS agreement(7) | 23,777 | 24,910 | — | — | — | — | 48,687 | |||||||||||||||||||||
Other purchase obligations(8) | 39,175 | — | — | — | — | — | 39,175 | |||||||||||||||||||||
Unrecognized tax benefits(9) | — | — | — | — | — | — | 66,620 | |||||||||||||||||||||
|
|
|
|
|
|
|
|
|
|
|
|
|
| |||||||||||||||
Total contractual cash obligations(10) | $ | 789,725 | $ | 532,806 | $ | 894,685 | $ | 556,094 | $ | 254,059 | $ | 2,881,874 | $ | 5,975,863 | ||||||||||||||
|
|
|
|
|
|
|
|
|
|
|
|
|
| |||||||||||||||
| (1) | Includes all interest and principal related to the 2016 Notes and 2019 Notes. Also includes all interest and principal related to borrowings under the Amended and Restated Credit Agreement, which will mature in |
F-89
| 2017 and 2019 and the Incremental Term Facility, which will mature in 2017. We are required to pay a percentage of the excess cash flow generated each year to our lenders which is not reflected in the table above. Interest on the term loan is based on the LIBOR rate plus a base margin and includes the effect of interest rate swaps. For purposes of this table, we have used projected LIBOR rates for all future periods (see Note 11, Debt). |
| (2) | Includes all interest and principal related to $85 million mortgage facility, which matures on March 1, 2017 (see Note 11, Debt). |
| (3) | We lease approximately two million square feet of office space in 97 locations in 48 countries. Lease payment escalations are based on fixed annual increases, local consumer price index changes or market rental reviews. We have renewal options of various term lengths at 65 locations, and we have no purchase options and no restrictions imposed by our leases concerning dividends or additional debt. |
| (4) | Represents minimum amounts due toHewlett-Packard under the terms of an outsourcing agreement through which HP manages a significant portion of our information technology systems. |
| (5) | Purchase obligations represent an estimate of all open purchase orders and contractual obligations in the ordinary course of business for which we have not received the goods or services as of December 31, 2013. |
| Although open purchase orders are considered enforceable and legally binding, the terms generally allow us the option to cancel, reschedule and adjust our requirements based on our business needs prior to the delivery of goods or performance of services. |
| (6) | Our letters of credit consist ofstand-by letters of credit, underwritten by a group of lenders, which we primarily issue for certain regulatory purposes as well as to certain hotel properties to secure our payment for hotel room transactions. The contractual expiration dates of these letters of credit are shown in the table above. There were no claims made against anystand-by letters of credit during the years ended December 31, 2013, 2012 and 2011. |
| (7) | Represents expected payments to WNS Global Services, an entity to which we outsource a portion of our Travelocity contact center operations andback-office fulfillment though 2015. The expected payments are based upon current and historical transactions. |
| (8) | Consists primarily of minimum payments due under various marketing agreements, management services monitoring fees and media strategy, planning and placement agreements. |
| (9) | Unrecognized tax benefits include associated interest and penalties. The timing of related cash payments for substantially all of these liabilities is inherently uncertain because the ultimate amount and timing of such liabilities is affected by factors which are variable and outside our control. |
| (10) | Excludes pension obligations; see Note 9, Pension and Other Postretirement Benefit Plans. |
The following table presents rent expense for continuing operations for each of the three years ended December 31, 2013, 2012, and 2011:
| Year Ended December 31, | ||||||||||||
| 2013 | 2012 | 2011 | ||||||||||
| (Amounts in thousands) | ||||||||||||
Rent expense | $ | 40,474 | $ | 36,385 | $ | 39,846 | ||||||
Less: | ||||||||||||
Sublease rent | — | — | (3,574 | ) | ||||||||
|
|
|
|
|
| |||||||
Total rent expense | $ | 40,474 | $ | 36,385 | $ | 36,272 | ||||||
|
|
|
|
|
| |||||||
Value Added Tax Receivables—We generate Value Added Tax (“VAT”) refund claims, recorded as receivables, in multiple jurisdictions through the normal course of our business. Audits related to these claims are in various stages of investigation. If the results of certain audits or litigation were to become unfavorable or if some of the countries owing a VAT refund default on their obligation due to deterioration in their credit, the uncollectible amounts could be material to our results of operations. In previous years, the right to recover certain VAT receivables associated with our European businesses has been questioned by tax authorities. We believe that our claims are valid under applicable law and as such we will continue to pursue collection, possibly through litigation. Other receivables in our consolidated balance sheets include net VAT receivables totaling $23 million
F-90
and $19 million as of December 31, 2013 and December 31, 2012, respectively. Although we believe these amounts are collectable, several European countries have recently experienced significantly weakening credit which could impact our future collections from these countries. We continue to assess VAT receivables for collectability and may be required to record reserves in the future.
In addition to the normal course of business receivables, substantial sums of VAT are due in respect of cross border supplies of rental cars by Holiday Autos, a discontinued operation (see Note 4, Discontinued Operations and Dispositions), from the period 2004 to 2009. A number of European Community countries challenged these claims and litigation has been ongoing for several years. Due to significant delays and other factors impacting our settlement of these claims, we have recorded an allowance for losses relating to such events in assets of discontinued operations in the consolidated balance sheets. The allowances recorded as of December 31, 2013 and December 31, 2012 were $4 million and $37 million, respectively. In December 2013, we received payment of approximately $12 million in respect to claims from Italy related to Holiday Autos VAT, enabling an equivalent amount of the allowance to be reversed at that time. The Central Economic Administrative Tribunal in Spain ruled in our favor in January 2013 on claims for 2008 and 2009 of $6 million and in September 2013 on
claims for 2004 through 2007 of $15 million. The funds were received and an equivalent amount of allowance was reversed to net loss from discontinued operations in our consolidated results of operations for the year ended December 31, 2013. Separately, on June 18, 2013, the Court of Appeal in France ruled against us in respect of outstanding VAT refund claims of $4 million made for the periods 2007 through 2009. We believe the merits of our VAT claims are valid and have appealed the decision to the Supreme Court. These amounts are included in the allowance for VAT receivables above.
Legal Proceedings—
While certain legal proceedings and related indemnification obligations to which we are a party specify the amounts claimed, such claims may not represent reasonably possible losses. Given the inherent uncertainties of litigation, the ultimate outcome of these matters cannot be predicted at this time, nor can the amount of possible loss or range of loss, if any, be reasonably estimated, except in circumstances where an aggregate litigation accrual has been recorded for probable and reasonably estimable loss contingencies. A determination of the amount of accrual required, if any, for these contingencies is made after careful analysis of each matter. The required accrual may change in the future due to new information or developments in each matter or changes in approach such as a change in settlement strategy in dealing with these matters.
Litigation and Administrative Audit Proceedings Relating to Hotel Occupancy Taxes
Over the past nine years, various state and local governments in the United States have filed approximately 70 lawsuits against us and other OTAs pertaining primarily to whether Travelocity and other OTAs owe sales or occupancy taxes on some or all of the revenues they earn from facilitating hotel reservations using the merchant revenue model. In the merchant revenue model, the customer pays us an amount at the time of booking that includes (i) service fees, which we collect, and (ii) the price of the hotel room and amounts for occupancy or other local taxes, which we pass along to the hotel supplier. The complaints generally allege, among other things, that the defendants failed to pay to the relevant taxing authority hotel accommodations taxes on the service fees. Courts have dismissed approximately 30 of these lawsuits, some for failure to exhaust administrative remedies and some on the basis that we are not subject to the sales or occupancy tax at issue based on the construction of the language in the ordinance. The Fourth, Sixth and Eleventh Circuits of the United States Courts of Appeals each have ruled in our favor on the merits, as have state appellate courts in Missouri, Alabama, Texas, California, Kentucky, Florida and Pennsylvania, and a number of state and federal trial courts. The remaining lawsuits are in various stages of litigation. We have also settled some cases individually for nuisance value and, with respect to such settlements, have reserved our rights to challenge any effort by the applicable tax authority to impose occupancy taxes in the future.
Among the recent favorable decisions, on January 23, 2013, the California Supreme Court declined to hear the appeals of the City of Anaheim and the City of Santa Monica from lower court decisions in favor of
F-91
Travelocity and other OTAs on the issue of whether local occupancy taxes apply to the merchant revenue model. We and other OTAs have also prevailed on summary judgment motions in San Francisco and Los Angeles. We believe these decisions should be helpful in resolving any other California cases, which are either currently pending or subsequently brought, in our favor.
Similarly, on January 23, 2013, the Missouri Court of Appeals upheld a lower court decision in favor of Travelocity and other OTAs on the issue of whether local occupancy taxes in the City of Branson apply to the merchant revenue model. On February 28, 2013, the First District Court of Appeals in Florida affirmed a summary judgment ruling in favor of Travelocity and other OTAs on the issue of whether local accommodation taxes levied by Leon County and 18 other counties in Florida apply to the merchant revenue model. The Florida Supreme Court is currently reviewing this decision. Likewise, on March 29, 2013, a federal district court in New Mexico granted summary judgment, ruling that OTAs are not vendors subject to hotel occupancy tax in New Mexico. On December 13, 2013, the Eleventh Circuit Court of Appeals affirmed summary judgment in our favor in a case that had been pending in Rome, Georgia, finding there was no evidence that we collected but failed to
remit tax that the counties could not recover on their common law claims, and that there is no basis in Georgia law (statutory or otherwise) for an award of back taxes. On March 5, 2014, the California Court of Appeals affirmed the trial court’s grant of summary judgment in our favor in the hotel occupancy tax litigation brought against us by the City of San Diego. On March 7, 2014, the trial court in our lawsuit with the Montana Department of Revenue granted our (and the other OTA defendants’) motion for summary judgment.
Although we have prevailed in the majority of these lawsuits and proceedings, there have been several adverse judgments or decisions on the merits some of which are subject to appeal.
Among the recent adverse decisions, on June 21, 2013, a state trial court in Cook County, Illinois granted summary judgment in favor of the City of Chicago and against Travelocity and other OTAs, ruling that the City’s hotel tax applies to the fees retained by the OTAs because, according to the trial court, OTAs act as hotel “managers” when facilitating hotel reservations. The court did not address damages. After final judgment is entered, Travelocity intends to appeal the court’s decision on the basis that we do not believe that we manage hotels.
On November 21, 2013, the New York State Court of Appeals ruled against Travelocity and other OTAs, holding that New York City’s hotel occupancy tax, which was amended in 2009 to capture revenue from fees charged to customers bythird-party travel companies, is constitutional because such fees constitute rent as they are a condition of occupancy. We have been collecting and remitting taxes under the statute, so the ruling does not have any impact on our financial results in that regard.
On April 4, 2013, the United States District Court for the Western District of Texas (“W.D.T.”) entered a final judgment against Travelocity and other OTAs in a class action lawsuit filed by the City of San Antonio. The final judgment was based on a jury verdict from October 30, 2009 that the OTAs “control” hotels for purposes of city hotel occupancy taxes. Following that jury verdict, on July 1, 2011, the W.D.T. concluded that fees charged by the OTAs are subject to city hotel occupancy taxes and that the OTAs have a duty to assess, collect and remit these taxes. We disagree with the jury’s finding that we “control” hotels, and with the W.D.T.’s conclusions based on the jury finding, and intend to appeal the final judgment to the United States Court of Appeals for the Fifth Circuit.
We believe the Fifth Circuit’s resolution of the San Antonio appeal may be affected by a separate Texas state appellate court decision in our favor. On October 26, 2011, the Fourteenth Court of Appeals of Texas affirmed a trial court’s summary judgment ruling in favor of the OTAs in a case brought by the City of Houston and the HarrisCounty-Houston Sports Authority on a similarly worded tax ordinance as the one at issue in the San Antonio case. The Texas Supreme Court denied the City of Houston’s petition to review the case. We believe this decision should provide persuasive authority to the Fifth Circuit in its review of the San Antonio case.
F-92
On September 24, 2012, a trial court in Washington D.C. granted summary judgment in favor of the District of Columbia on its claim that the OTAs are subject to hotel occupancy tax. The court has not yet addressed any questions related to damages, but is expected to do so during the first quarter of 2014. After final judgment is entered, Travelocity intends to appeal the court’s decision.
In late 2012, the Tax Appeal Court of the State of Hawaii granted summary judgment in favor of Travelocity and other OTAs on the issue of whether Hawaii’s hotel occupancy tax applies to the merchant revenue model. However, in January 2013, the same court granted summary judgment in favor of the State of Hawaii and against Travelocity and other OTAs on the issue of whether the state’s general excise tax, which is assessed on all business activity in the state, applies to the merchant revenue model for the period from 2002 to 2011.
We expensed $19 million and $25 million in cost of revenue for the years ended December 31, 2013 and 2012, respectively, which represents the amount we would owe to the State of Hawaii, prior to appealing the Tax
Appeal Court’s ruling, in back excise taxes, penalties and interest based on the court’s interpretation of the statute. In 2013, we made payments totaling $35 million and maintained an accrued liability of $9 million as of December 31, 2013. Payment of such amount is not an admission that we believe we are subject to the taxes in question.
Travelocity has appealed the Tax Appeal Court’s determination that we are subject to general excise tax, as we believe the decision is incorrect and inconsistent with the same court’s prior rulings. If any such taxes are in fact owed (which we dispute), we believe the correct amount would be under $10 million. The ultimate resolution of these contingencies may differ from the liabilities recorded. To the extent our appeal is successful in reducing or eliminating the assessed amounts, the State of Hawaii would be required to refund such amounts, plus interest. On May 20, 2013, the State of Hawaii issued an additional general excise tax assessment for the calendar year 2012. Travelocity has appealed this recent assessment to the Tax Appeal Court, and this assessment has been stayed pending a final appellate decision on the original assessment.
On December 9, 2013, the State of Hawaii also issued assessments of general excise tax for merchant rental car bookings facilitated by Travelocity and other OTAs for the period 2001 to 2012 for which we recorded a $2 million reserve in the fourth quarter of 2013. Travelocity intends to appeal the assessment to the Tax Appeal Court and does not believe the excise tax is applicable.
The aggregate impact to our results of operations for all litigation and administrative proceedings relating to hotel sales, occupancy or excise taxes for the years ended December 31, 2013, 2012 and 2011 was $27 million, $25 million, and $2 million, respectively, which include all amounts expensed related to the State of Hawaii during those periods. As of December 31, 2013, we have a remaining reserve of $18 million, included in other accrued liabilities in the consolidated balance sheet, for the potential resolution of issues identified related to litigation involving hotel sales, occupancy or excise taxes, which includes the $9 million liability for the remaining payments to the State of Hawaii. As of December 31, 2012, the reserve for litigation involving hotel sales, occupancy or excise taxes was $28 million. Our estimated liability is based on our current best estimate but the ultimate resolution of these issues may be greater or less than the amount recorded and, if greater, could adversely affect our results of operations.
In addition to the actions by the tax authorities, four consumer class action lawsuits have been filed against us and other OTAs in which the plaintiffs allege that we made misrepresentations concerning the description of the fees received in relation to facilitating hotel reservations. Generally, the consumer claims relate to whether Travelocity and the other OTAs provided adequate notice to consumers regarding the nature of our fees and the amount of taxes charged or collected. One of these lawsuits was dismissed by the Texas Supreme Court and such dismissal was subsequently affirmed; one was voluntarily dismissed by the plaintiffs; one is pending in Texas state court, where the court is currently considering the plaintiffs’ motion to certify a class action; and the last is pending in federal court, but has been stayed pending the outcome of the Texas state court action. We believe the notice we provided was appropriate.
F-93
In addition to the lawsuits, a number of state and local governments have initiated inquiries, audits and other administrative proceedings that could result in an assessment of sales or occupancy taxes on fees. If we do not to prevail at the administrative level, those cases could lead to formal litigation proceedings.
Pursuant to our Expedia SMA, we will continue to be liable for fees, charges, costs and settlements relating to litigation arising from hotels booked on the Travelocity platform prior to the Expedia SMA. However, fees, charges, costs and settlements relating to litigation from hotels booked subsequent to the Expedia SMA will be shared with Expedia according to the terms of the Expedia SMA. Under the Expedia SMA, we are also required to guarantee Travelocity’s indemnification obligations to Expedia for any liabilities arising out of historical claims with respect to this type of litigation.
Airline Antitrust Litigation, US Airways Antitrust Litigation, and DoJ Investigation
American Airlines Litigation (state and federal court claims)—In October 2012 we settled two outstanding state and federal lawsuits with American Airlines (“American”) relating to American’s participation in the Sabre GDS. The litigation, primarily involving breach of contract and antitrust claims, arose in January 2011 after American undertook certain marketing activities relating to its “Direct Connect” program (a method of providing its information and booking services directly to travel agents without using a GDS), and wede-preferenced American’s flight information on the GDS and modified certain fees for booking American flights in a manner we believe was permitted under the terms of our distribution and services agreement with American.
American alleged that we had taken anticompetitive actions and claimed over $1 billion in actual damages and injunctive relief against us. We denied American’s allegations and aggressively defended against these claims and pursued our own legal rights as warranted.
On October 30, 2012, we agreed to settlement terms in the state and federal lawsuits with American and, as a result of the terms of the settlement, renewed our distribution agreement with American for several years. We also entered into renewal agreements with American for Travelocity. Terms of the settlement and distribution agreements were approved by the court presiding over the restructuring procedures for AMR, American’s parent company, pursuant to an order made final on December 20, 2012. The settlement agreement contains mutual releases of all claims by each party and neither party admits any wrong doing on their part. In January 2014, we reached along-term agreement with American to be the provider of the reservation system for thepost-merged American and US Airways.
We determined that the settlement agreement constitutes amultiple-element arrangement and recognized a settlement charge of $222 million, net of tax, into our results of operations, representing the estimate of the fair value of the settlement components. This included $64 million on an after tax basis for a $100 million payment made to AMR on December 21, 2012, and a $60 million on an after tax basis that represented the fair value of a second $100 million payment made to AMR in December 2013. The current portion of the settlement liability is reflected in litigation settlement payable and thenon-current portion is included in other noncurrent liabilities in the consolidated balance sheets. Fair value of these fixed payment settlement components were estimated using our best estimates of the timing with the resulting values discounted using a discount rate ranging from 6% to 11.5%, depending on the timing of the payment and considering an adjustment for nonperformance risk that represents our own credit risk. The fair value of the settlement amounts associated with the new commercial agreements entered into with American was estimated using the differential cash flow method, by comparing the pricing under the new contracts with American to similar contracts with other customers to determine a differential. This pricing differential was applied to future estimated volumes and discounted using a discount rate of 11.5%. We believe that the timing, discount rates and probabilities used in these estimates reflect appropriate market participant assumptions.
Because the settlement liability is considered amultiple-element arrangement and recorded at fair value, the net charge recorded in 2012 consisted of several elements, including cash and future cash to be paid directly to
F-94
American, payment credits to pay for future technology services that we provided as defined in the agreements and an estimate of the fair value of other agreements entered into concurrently with the settlement agreement.
Amounts shown are net of tax utilizing our combined federal and state marginal tax rate of approximately 36%. The associated tax benefits are expected to be realized over the next one to four years and payment credits are expected to be used by American from 2014 through 2017, depending on the level of services we provide.
US Airways Antitrust Litigation
In April 2011, US Airways sued us in federal court in the Southern District of New York, alleging violations of the Sherman Act Section 1(anticompetitive agreements) and Section 2 (monopolization). The complaint was
filed two months after we entered into a new distribution agreement with US Airways. In September 2011, the court dismissed all claims relating to Section 2. The claims that were not dismissed are claims brought under Section 1 of the Sherman Act that relate to our contracts with airlines, especially US Airways itself, which US Airways says contain anticompetitivecontent-related provisions, and an alleged conspiracy with the other GDSs, allegedly to maintain the industry structure and not to implement US Airways’ preferred system of distributing its Choice Seats product. We strongly deny all of the allegations made by US Airways. In September 2013, US Airways issued a report in which it purported to quantify its damages at either $281 million or $425 million (before trebling), depending on certain assumptions. We believe both estimates are based on faulty assumptions and analysis and therefore are highly overstated. In the event US Airways were to prevail on the merits of its claim, we believe any monetary damages awarded (before trebling) would be significantly less than either of US Airways’ proposed damage amounts.
Document discovery and fact witness discovery are complete. We are now in the process of completing expert witness discovery. We expect to complete expert depositions in March 2014. Summary judgment motions are scheduled to be filed in April 2014, with full briefing of those motions expected to be completed in May 2014. All court settings are subject to change. No trial date has been set and we anticipate the most likely trial date would be in September or October 2014, assuming no delays with the court’s schedule and that we do not prevail completely with our summary judgment motions.
We have and will incur significant fees, costs and expenses for as long as the litigation is ongoing. In addition, litigation by its nature is highly uncertain and fraught with risk, and it is therefore difficult to predict the outcome of any particular matter. If favorable resolution of the matter is not reached, any monetary damages are subject to trebling under the antitrust laws and US Airways would be eligible to be reimbursed by us for its costs and attorneys’ fees. Depending on the amount of any such judgment, if we do not have sufficient cash on hand, we may be required to seek financing through the issuance of additional equity or from private or public financing. Additionally, US Airways can and has sought injunctive relief, though we believe injunctive relief for US Airways is precluded by the settlement agreement we reached with American Airlines in 2012, which covers affiliates, including through merger, of American Airlines. If injunctive relief were granted, depending on its scope, it could affect the manner in which our airline distribution business is operated and potentially force changes to the existing airline distribution business model. Any of these consequences could have a material adverse effect on our business, financial condition and results of operations.
Department of Justice Investigation
On May 19, 2011, we received a civil investigative demand (“CID”) from the U.S. Department of Justice (“DOJ”) investigating alleged anticompetitive acts related to the airline distribution component of our business. We are fully cooperating with the DOJ investigation and are unable to make any prediction regarding its outcome. The DOJ is also investigating other companies that own GDSs, and has sent CIDs to other companies in the travel industry. Based on its findings in the investigation, the DOJ may (i) close the file, (ii) seek a consent decree to remedy issues it believes violate the antitrust laws, or (iii) file suit against us for violating the antitrust laws, seeking injunctive relief. If injunctive relief were granted, depending on its scope, it could affect the
F-95
manner in which our airline distribution business is operated and potentially force changes to the existing airline distribution business model. Any of these consequences would have a material adverse effect on our business, financial condition and results of operations.
Insurance Carriers
We have disputes against two of our insurance carriers for failing to reimburse defense costs incurred in the American Airlines antitrust litigation, which we settled in October 2012. Both carriers admitted there is coverage, but reserved their rights not to pay should we be found liable for certain of American Airlines’ allegations. Despite their admission of coverage, the insurers have only reimbursed us for a small portion of our significant defense costs. We filed suit against the entities in New York state court alleging breach of contract and a
statutory cause of action for failure to promptly pay claims. If we prevail, we may recover some or all amounts already tendered to the insurance companies for payment within the limits of the policies and would be entitled to 18% interest on such amounts. To date, settlement discussions have been unsuccessful. The court has not scheduled a trial date though we anticipate trial to begin in the latter part of 2014.
Hotel Related Antitrust Proceedings
On August 20, 2012, two individuals alleging to represent a putative class of bookers of online hotel reservations filed a complaint against Sabre Holdings, Travelocity.com LP, and several other online travel companies and hotel chains in the U.S. District Court for the Northern District of California, alleging federal and state antitrust and related claims. The complaint alleges generally that the defendants conspired to enter into illegal agreements relating to the price of hotel rooms. Over 30 copycat suits were filed in various courts in the United States. In December 2012, the Judicial Panel onMulti-District Litigation centralized these cases in the U.S. District Court in the Northern District of Texas, which subsequently consolidated them. The proposed class period is January 1, 2003 through May 1, 2013. On June 15, 2013, the court granted Travelocity’s motion to compel arbitration of claims involving Travelocity bookings made on or after February 4, 2010. While all claims from February 4, 2010 through May 1, 2013 are now excluded from the lawsuit and must be arbitrated if pursued at all, the lawsuit still covers claims from January 1, 2003 through February 3, 2010. Together with the other defendants, Travelocity and Sabre filed a motion to dismiss. On February 18, 2014, the court granted the motion and dismissed the plaintiff’s claims without prejudice. The court gave the plaintiffs 30 days from the date of its February 18, 2014 order to seek leave to file an amended complaint. We deny any conspiracy or anyanti-competitive actions and we intend to aggressively defend against the claims.
Even if we are ultimately successful in defending ourselves in this matter, we are likely to incur significant fees, costs and expenses for as long as it is ongoing. In addition, litigation by its nature is highly uncertain and fraught with risk, and it is difficult to predict the outcome of any particular matter. If favorable resolution of the matter is not reached, we could be subject to monetary damages, including treble damages under the antitrust laws, as well as injunctive relief. If injunctive relief were granted, depending on its scope, it could affect the manner in which our Travelocity business is operated and potentially force changes to the existing business model. Any of these consequences could have a material adverse effect on our business, financial condition and results of operations.
Litigation Relating to Value Added Tax Receivables
In the United Kingdom, the Commissioners for Her Majesty’s Revenue & Customs (“HMRC”) have asserted that our subsidiary, Secret Hotels2 Limited (formerly Med Hotels Limited), failed to account for United Kingdom Value Added Tax (“VAT”) on margins earned from hotels located within the European Union (“EU”). This business was sold in February 2009 to athird-party and we account for it as a discontinued operation. Because the sale was structured as an asset sale and we retained the company (Secret Hotels2 Limited) with all potential tax liabilities in respect of the same. HMRC issued assessments of tax totaling approximately $11 million for the period October 1, 2004 to September 30, 2007. We appealed the assessments and in March 2010 the VAT and Duties Tribunal (“First Tribunal”) denied the appeal. We then appealed to the Upper
F-96
Tribunal (Finance and Tax Chamber) and in July 2011 were successful overturning HMRC’s original assessment. HMRC appealed this decision to the Court of Appeal who on December 3, 2012 found against Secret Hotels2 Limited upholding the decision of the First Tribunal in favor of HMRC. Based upon this Court of Appeal judgment and the limited ability to obtain leave to appeal, we accrued $17 million of expense in discontinued operations during the year ended December 31, 2012, included in liabilities of discontinued operations in the consolidated balance sheet as of December 31, 2012. Secret Hotels2 Limited successfully obtained leave to appeal the Court of Appeal decision to the Supreme Court in 2013, which is the final court of appeal in the United Kingdom, and on March 5, 2014 judgment was given in favor of Secret Hotels2 Limited. We therefore reversed our reserve in 2013 in discontinued operations. Any further opportunities to appeal this decision through the European courts are considered remote.
Additionally, HMRC has begun a review of other parts of our lastminute.com business in the United Kingdom. We believe that we have paid the correct amount of VAT on all relevant transactions as now reinforced by the outcome of Secret Hotels 2 case with the Supreme Court and will vigorously defend our position with HMRC or through the courts if necessary.
Litigation Relating to Patent Infringement
In April 2010, CEATS, Inc. (“CEATS”) filed a patent infringement lawsuit against several ticketing companies and airlines, including JetBlue, in the Eastern District of Texas. CEATS alleged that themouse-over seat map that appears on the defendants’ websites infringes certain of its patents. JetBlue’s website is provided by our Airline Solutions business under the SabreSonic Web service. On June 11, 2010, JetBlue requested that we indemnify and defend it for and against the CEATS lawsuit based on the indemnification provision in our agreement with JetBlue, and we agreed to a conditional indemnification. CEATS claimed damages of $0.30 per segment sold on JetBlue’s website during the relevant time period totaling $10 million. A jury trial began on March 12, 2012, which resulted in a jury verdict invalidating the plaintiff’s patents. Final judgment was entered and the plaintiff appealed. The Federal Circuit affirmed the jury’s decision in our favor on April 26, 2013. CEATS did not appeal the Federal Circuit’s decision, and its deadline to do so has passed. On June 28, 2013, the Eastern District denied CEATS’ previously filed motion to vacate the judgment based on an alleged conflict of interest with a mediator. CEATS has appealed that decision.
Indian Income Tax Litigation
We are currently a defendant in income tax litigation brought by the Indian Director of Income Tax (“DIT”) in the Supreme Court of India. The dispute arose in 1999 when the DIT asserted that we have a permanent establishment within the meaning of the Income Tax Treaty between the United States and the Republic of India and accordingly issued tax assessments for assessment years ending March 1998 and March 1999, and later issued further tax assessments for assessment years ending March 2000 through March 2006. We appealed the tax assessments and the Indian Commissioner of Income Tax Appeals returned a mixed verdict. We filed further appeals with the Income Tax Appellate Tribunal, or the ITAT. The ITAT ruled in our favor on June 19, 2009 and July 10, 2009, stating that no income would be chargeable to tax for assessment years ending March 1998 and March 1999, and from March 2000 through March 2006. The DIT appealed those decisions to the Delhi High Court, which found in our favor on July 19, 2010. The DIT has appealed the decision to the Supreme Court of India and no trial date has been set.
We intend to continue to aggressively defend against these claims. Although we do not believe that the outcome of the proceedings will result in a material impact on our business or financial condition, litigation is by its nature uncertain. If the DIT were to fully prevail on every claim, we could be subject to taxes, interest and penalties of approximately $25 million, which could have a material adverse effect on our business, financial condition and results of operations. We do not believe this outcome is probable and therefore have not made any provisions or recorded any liability for the potential resolution of this matter.
F-97
Litigation Relating to Routine Proceedings
We are also engaged from time to time in other routine legal and tax proceedings incidental to our business. We do not believe that any of these routine proceedings will have a material impact on the business or our financial condition.
21. Segment Information
Our reportable segments are based upon: our internal organizational structure; the manner in which our operations are managed; the criteria used by our Chief Executive Officer, who is our Chief Operating Decision
Maker (“CODM”), to evaluate segment performance; the availability of separate financial information; and overall materiality considerations.
Our business has three reportable segments: Travel Network, Airline and Hospitality Solutions, and Travelocity. Airline and Hospitality Solutions aggregates the Airline Solutions and Hospitality Solutions operating segments as these operating segments have similar economic characteristics, generate revenues ontransaction-based fees, incur the same types of expenses and use our SaaS based and hosted applications and platforms to market to the travel industry.
Our CODM utilizes Adjusted Gross Margin and Adjusted EBITDA as the measures of profitability to evaluate performance of our segments and allocate resources. Segment results do not include unallocated expenses or interest expenses which are centrally managed costs. Benefits expense, including pension expense, postretirement benefits, medical insurance and workers’ compensation are allocated to the segments based on headcount. Depreciation expense on the corporate headquarters building and related facilities costs are allocated to the segments through a facility fee based on headcount. Corporate includes certain shared expenses such as accounting, human resources, legal, corporate systems, and other shared technology costs. Corporate also includes all amortization of intangible assets and any related impairments that originate from purchase accounting, as well as stock based compensation expense, restructuring charges, legal reserves, occupancy taxes and other items not identifiable with one of our segments.
We account for significant intersegment transactions as if the transactions were with third parties, that is, at estimated current market prices. The majority of the intersegment revenues and cost of revenues are between Travelocity and Travel Network, consisting mainly of incentive consideration provided, net of data processing fees incurred, by Travel Network to Travelocity for transactions processed through the Sabre GDS, transaction fees paid by Travelocity to Travel Network for transactions facilitated through the Sabre GDS in which the travel supplier pays Travelocity directly, and fees paid by Travel Network to Travelocity for corporate trips booked through the Travelocity online booking technology. In addition, Airline and Hospitality Solutions pay fees to Travelocity for airline trips booked through the Travelocity online booking technology.
Our CODM does not review total assets by segment as operating evaluations and resource allocation decisions are not made on the basis of total assets by segment.
The performance of our segments is evaluated primarily on Adjusted Gross Margin and Adjusted EBITDA which are not recognized terms under GAAP. Our uses of Adjusted Gross Margin and Adjusted EBITDA have limitations as analytical tools, and should not be considered in isolation or as a substitute for analysis of our results as reported under GAAP.
We define Adjusted Gross Margin as gross marginoperating income (loss) adjusted for selling, general and administrative expenses, impairments, depreciation and amortization, amortization of upfront incentive consideration, restructuring and depreciationother costs, litigation and amortization. taxes, including penalties, and stock-based compensation. In 2014, we revised the definition of Adjusted Gross Margin to adjust for restructuring and other costs, litigation and taxes, including penalties and stock-based compensation included in cost of revenue which
F-98
differs from Adjusted Gross Margin as previously defined and presented in our financial statements for the periods ended December 31, 2013, 2012 and 2011 included in the prospectus filed with the SEC pursuant to Rule 424(b) under the Securities Act on April 17, 2014. Adjusted Gross Margin for all periods presented has been recast to the revised definition:
| Year Ended December 31, 2013 | Year Ended December 31, 2012 | Year Ended December 31, 2011 | ||||||||||||||||||||||
| Previously Reported | As Revised | Previously Reported | As Revised | Previously Reported | As Revised | |||||||||||||||||||
| (Amounts in thousands) | ||||||||||||||||||||||||
Adjusted Gross Margin | ||||||||||||||||||||||||
Travel Network | $ | 860,793 | $ | 860,793 | $ | 843,863 | $ | 843,863 | $ | 772,753 | $ | 772,753 | ||||||||||||
Airline and Hospitality Solutions | 262,386 | 262,386 | 218,421 | 218,421 | 185,147 | 185,147 | ||||||||||||||||||
Travelocity | 353,489 | 353,489 | 413,802 | 413,802 | 447,790 | 447,790 | ||||||||||||||||||
Eliminations | (717 | ) | (717 | ) | (1,010 | ) | (1,010 | ) | (1,083 | ) | (1,083 | ) | ||||||||||||
Corporate | (92,142 | ) | (56,904 | ) | (85,214 | ) | (56,787 | ) | (74,093 | ) | (70,853 | ) | ||||||||||||
|
|
|
|
|
|
|
|
|
|
|
| |||||||||||||
Total | $ | 1,383,809 | $ | 1,419,047 | $ | 1,389,862 | $ | 1,418,289 | $ | 1,330,514 | $ | 1,333,754 | ||||||||||||
|
|
|
|
|
|
|
|
|
|
|
| |||||||||||||
We define Adjusted EBITDA as income (loss) from continuing operations adjusted for impairment, acquisition related amortization expense, gain (loss) on sale of business and assets, gain (loss) on extinguishment of debt, other, net, restructuring and other costs, litigation and taxes including penalties, stock-based compensation, management fees, depreciation of fixed assets, non-acquisition related amortization, amortization of upfront incentive consideration, interest expense, and income taxes.
F-99
Segment information for the year ended December 31, 2013, 2012 and 2011 is as follows:
| Year Ended December 31, | Year Ended December 31, | |||||||||||||||||||||||
| 2013 | 2012 | 2011 | 2013 | 2012 | 2011 | |||||||||||||||||||
| (Amounts in thousands) | (Amounts in thousands) | |||||||||||||||||||||||
Revenue | ||||||||||||||||||||||||
Travel Network | $ | 1,821,498 | $ | 1,795,127 | $ | 1,740,007 | $ | 1,821,498 | $ | 1,795,127 | $ | 1,740,007 | ||||||||||||
Airline and Hospitality Solutions | 711,745 | 597,649 | 522,692 | 711,745 | 597,649 | 522,692 | ||||||||||||||||||
Travelocity | 585,989 | 659,472 | 699,604 | 585,989 | 659,472 | 699,604 | ||||||||||||||||||
|
|
|
|
|
| |||||||||||||||||||
Total segments | 3,119,232 | 3,052,248 | 2,962,303 | 3,119,232 | 3,052,248 | 2,962,303 | ||||||||||||||||||
Eliminations | (69,707 | ) | (77,884 | ) | (106,342 | ) | (69,707 | ) | (77,884 | ) | (106,342 | ) | ||||||||||||
|
|
|
|
|
| |||||||||||||||||||
Total revenue | $ | 3,049,525 | $ | 2,974,364 | $ | 2,855,961 | $ | 3,049,525 | $ | 2,974,364 | $ | 2,855,961 | ||||||||||||
|
|
|
|
|
| |||||||||||||||||||
Adjusted gross margin | ||||||||||||||||||||||||
Travel Network | $ | 860,793 | $ | 843,863 | $ | 772,753 | $ | 860,793 | $ | 843,863 | $ | 772,753 | ||||||||||||
Airline and Hospitality Solutions | 262,386 | 218,421 | 185,147 | 262,386 | 218,421 | 185,147 | ||||||||||||||||||
Travelocity | 353,489 | 413,802 | 447,790 | 353,489 | 413,802 | 447,790 | ||||||||||||||||||
Eliminations | (717 | ) | (1,010 | ) | (1,083 | ) | (717 | ) | (1,010 | ) | (1,083 | ) | ||||||||||||
Corporate | (92,142 | ) | (85,214 | ) | (74,093 | ) | (56,904 | ) | (56,787 | ) | (70,853 | ) | ||||||||||||
|
|
|
|
|
| |||||||||||||||||||
Total adjusted gross margin | 1,383,809 | 1,389,862 | 1,330,514 | $ | 1,419,047 | $ | 1,418,289 | $ | 1,333,754 | |||||||||||||||
Depreciation and amortization (included in cost of revenue) | (202,485 | ) | (198,206 | ) | (172,846 | ) | ||||||||||||||||||
Amortization of upfront incentive consideration | (36,649 | ) | (36,527 | ) | (37,748 | ) | ||||||||||||||||||
|
|
|
|
|
| |||||||||||||||||||
Total gross margin | $ | 1,144,675 | $ | 1,155,129 | $ | 1,119,920 | ||||||||||||||||||
|
|
| ||||||||||||||||||||||
Adjusted EBITDA (a) | ||||||||||||||||||||||||
Adjusted EBITDA(b) | ||||||||||||||||||||||||
Travel Network | $ | 772,208 | $ | 768,452 | $ | 692,571 | $ | 772,208 | $ | 768,452 | $ | 692,571 | ||||||||||||
Airline and Hospitality Solutions | 213,075 | 166,282 | 135,184 | 213,075 | 166,282 | 135,184 | ||||||||||||||||||
Travelocity | 22,852 | 61,119 | 76,469 | 22,852 | 61,119 | 76,469 | ||||||||||||||||||
|
|
|
|
|
| |||||||||||||||||||
Total segments | 1,008,135 | 995,853 | 904,224 | 1,008,135 | 995,853 | 904,224 | ||||||||||||||||||
Corporate | (216,812 | ) | (209,224 | ) | (184,061 | ) | (216,812 | ) | (209,224 | ) | (184,061 | ) | ||||||||||||
|
|
|
|
|
| |||||||||||||||||||
Total | $ | 791,323 | $ | 786,629 | $ | 720,163 | $ | 791,323 | $ | 786,629 | $ | 720,163 | ||||||||||||
|
|
|
|
|
| |||||||||||||||||||
Depreciation and amortization | ||||||||||||||||||||||||
Travel Network | $ | 52,507 | $ | 36,659 | $ | 33,705 | $ | 52,507 | $ | 36,659 | $ | 33,705 | ||||||||||||
Airline and Hospitality Solutions | 77,320 | 52,010 | 31,930 | 77,320 | 52,010 | 31,930 | ||||||||||||||||||
Travelocity | 8,712 | 39,892 | 43,498 | 8,712 | 39,892 | 43,498 | ||||||||||||||||||
|
|
|
|
|
| |||||||||||||||||||
Total segments | 138,539 | 128,561 | 109,133 | 138,539 | 128,561 | 109,133 | ||||||||||||||||||
Corporate | 169,056 | 187,172 | 183,984 | 169,056 | 187,172 | 183,984 | ||||||||||||||||||
|
|
|
|
|
| |||||||||||||||||||
Total | $ | 307,595 | $ | 315,733 | $ | 293,117 | $ | 307,595 | $ | 315,733 | $ | 293,117 | ||||||||||||
|
|
|
|
|
| |||||||||||||||||||
Adjusted capital expenditures (b) | ||||||||||||||||||||||||
Adjusted capital expenditures(c) | ||||||||||||||||||||||||
Travel Network | $ | 69,357 | $ | 45,262 | $ | 54,451 | $ | 69,357 | $ | 45,262 | $ | 54,451 | ||||||||||||
Airline and Hospitality Solutions | 170,860 | 163,754 | 96,751 | 170,860 | 163,754 | 96,751 | ||||||||||||||||||
Travelocity | 16,861 | 26,085 | 44,026 | 16,861 | 26,085 | 44,026 | ||||||||||||||||||
|
|
|
|
|
| |||||||||||||||||||
Total segments | 257,078 | 235,101 | 195,228 | 257,078 | 235,101 | 195,228 | ||||||||||||||||||
Corporate | 27,762 | 36,704 | 28,519 | 27,762 | 36,704 | 28,519 | ||||||||||||||||||
|
|
|
|
|
| |||||||||||||||||||
Total | $ | 284,840 | $ | 271,805 | $ | 223,747 | $ | 284,840 | $ | 271,805 | $ | 223,747 | ||||||||||||
|
|
|
|
|
| |||||||||||||||||||
F-100
| (a) | The following table sets forth the reconciliation of Adjusted Gross Margin to operating income (loss) in our statement of operations: |
| Year Ended December 31, | ||||||||||||
| 2013 | 2012 | 2011 | ||||||||||
| (Amounts in thousands) | ||||||||||||
Adjusted Gross Margin | $ | 1,419,047 | $ | 1,418,289 | $ | 1,333,754 | ||||||
Less Adjustments: | ||||||||||||
Selling, general and administrative | 792,929 | 1,188,248 | 806,435 | |||||||||
Impairment | 138,435 | 573,180 | 185,240 | |||||||||
Restructuring charges | 36,551 | — | — | |||||||||
Cost of revenue adjustments: | ||||||||||||
Depreciation and amortization(1) | 202,485 | 198,206 | 172,846 | |||||||||
Amortization of upfront incentive consideration(2) | 36,649 | 36,527 | 37,748 | |||||||||
Restructuring and other costs(5) | 12,615 | 4,525 | 1,786 | |||||||||
Litigation and taxes, including penalties(6) | 20,921 | 22,187 | — | |||||||||
Stock-based compensation | 1,702 | 1,715 | 1,454 | |||||||||
|
|
|
|
|
| |||||||
Operating income (loss) | $ | 176,760 | $ | (606,299 | ) | $ | 128,245 | |||||
|
|
|
|
|
| |||||||
| (b) | The following tables set forth the reconciliation of Adjusted EBITDA to loss from continuing operations in our statement of operations: |
| Year Ended December 31, | Year Ended December 31, | |||||||||||||||||||||||
| 2013 | 2012 | 2011 | 2013 | 2012 | 2011 | |||||||||||||||||||
| (Amounts in thousands) | (Amounts in thousands) | |||||||||||||||||||||||
Adjusted EBITDA | $ | 791,323 | $ | 786,629 | $ | 720,163 | $ | 791,323 | $ | 786,629 | $ | 720,163 | ||||||||||||
Less Adjustments: | ||||||||||||||||||||||||
Depreciation and amortization of property and equipment (1a) | 131,483 | 135,561 | 122,640 | 131,483 | 135,561 | 122,640 | ||||||||||||||||||
Amortization of capitalized implementation costs (1b) | 35,551 | 20,855 | 11,365 | 35,551 | 20,855 | 11,365 | ||||||||||||||||||
Amortization of upfront incentive consideration (2) | 36,649 | 36,527 | 37,748 | 36,649 | 36,527 | 37,748 | ||||||||||||||||||
Interest expense, net | 274,689 | 232,450 | 174,390 | 274,689 | 232,450 | 174,390 | ||||||||||||||||||
Impairment (3) | 138,435 | 596,980 | 185,240 | 138,435 | 596,980 | 185,240 | ||||||||||||||||||
Acquisition related amortization (1c) | 143,765 | 162,517 | 162,312 | 143,765 | 162,517 | 162,312 | ||||||||||||||||||
Gain on sale of business and assets | — | (25,850 | ) | — | — | (25,850 | ) | — | ||||||||||||||||
Loss on extinguishment of debt | 12,181 | — | — | 12,181 | — | — | ||||||||||||||||||
Other, net(4) | 6,724 | 1,385 | (1,156 | ) | 6,724 | 1,385 | (1,156 | ) | ||||||||||||||||
Restructuring and other costs (5) | 59,052 | 6,776 | 12,986 | 59,052 | 6,776 | 12,986 | ||||||||||||||||||
Litigation and taxes, including penalties (6) | 39,431 | 418,622 | 21,601 | 39,431 | 418,622 | 21,601 | ||||||||||||||||||
Stock-based compensation | 9,086 | 9,834 | 7,334 | 9,086 | 9,834 | 7,334 | ||||||||||||||||||
Management fees (7) | 8,761 | 7,769 | 7,191 | 8,761 | 7,769 | 7,191 | ||||||||||||||||||
(Benefit) provision for income taxes | (14,029 | ) | (195,071 | ) | 57,806 | (14,029 | ) | (195,071 | ) | 57,806 | ||||||||||||||
|
|
|
|
|
| |||||||||||||||||||
Loss from continuing operations | $ | (90,455 | ) | $ | (621,726 | ) | $ | (79,294 | ) | $ | (90,455 | ) | $ | (621,726 | ) | $ | (79,294 | ) | ||||||
|
|
|
|
|
| |||||||||||||||||||
| (1) | Depreciation and amortization expenses (see Note 2, Summary of Significant Accounting Policies for associated asset lives): |
| a. | Depreciation and amortization of property and equipment represents depreciation of property and equipment, including software developed for internal use. |
| b. | Amortization of capitalized implementation costs represents amortization ofup-front costs to implement new customer contracts under our SaaS and hosted revenue model. |
F-101
| c. | Acquisition related amortization represents amortization of intangible assets from thetake-private transaction in 2007 as well as intangibles associated with acquisitions since that date and amortization of the excess basis in our underlying equity in joint ventures. |
| (2) | Our Travel Network business at times provides upfront incentive consideration to travel agency subscribers at the inception or modification of a service contract, which are capitalized and amortized to cost of revenue over an average expected life of the service contract, generally over three to five years. Such consideration is made with the objective of increasing the number of clients or to ensure or improve customer loyalty. Such service contract terms are established such that the supplier and other fees generated over the life of the contract will exceed the cost of the incentive consideration provided up front. Such service contracts with travel agency subscribers require that the customer commit to achieving certain economic objectives and generally have terms requiring repayment of the upfront incentive consideration if those objectives are not met. |
| (3) | Represents impairment charges to assets (see Note 8, Goodwill and Intangible Assets) as well as $24 million in 2012, representing our share of impairment charges recorded by one of our equity method investments, Abacus. |
| (4) | Other, net primarily represents foreign exchange gains and losses related to the remeasurement of foreign currency denominated balances included in our consolidated balance sheets into the relevant functional currency. |
| (5) | Restructuring and other costs represents charges associated with business restructuring and associated changes implemented which resulted in severance benefits related to employee terminations, integration and facility opening or closing costs and other business reorganization costs. |
| (6) | Litigation and taxes, including penalties represents charges or settlements associated with airline antitrust litigation as well as payments or reserves taken in relation to certain retroactive hotel occupancy and excise tax disputes (see Note 20, Commitments and Contingencies). |
| (7) | We have been paying an annual management fee to TPG and Silver Lake in an amount equal to the lesser of (i) 1% of our Adjusted EBITDA and (ii) $7 million. This also includes reimbursement of certain costs incurred by TPG and Silver Lake. |
| Includes capital expenditures and capitalized implementation costs as summarized below: |
| Year Ended December 31, | ||||||||||||
| 2013 | 2012 | 2011 | ||||||||||
| (Amounts in thousands) | ||||||||||||
Additions to property and equipment | $ | 226,026 | $ | 193,262 | $ | 164,638 | ||||||
Capitalized implementation costs | 58,814 | 78,543 | 59,109 | |||||||||
|
|
|
|
|
| |||||||
Adjusted capital expenditures | $ | 284,840 | $ | 271,805 | $ | 223,747 | ||||||
|
|
|
|
|
| |||||||
Transaction-based revenue accounted for approximately 89%, 90% and 93% of our Travel Network revenue for the years ended December 31, 2013, 2012 and 2011, respectively.Transaction-based revenue accounted for approximately 70%, 67% and 66% of our Airline and Hospitality Solutions revenue for the years ended December 31, 2013, 2012 and 2011, respectively.Transaction-based revenue accounted for approximately 87%, 88% and 87% of our Travelocity revenue for the years ended December 31, 2013, 2012 and 2011, respectively.
All joint venture equity income and expenses relate to Travel Network.
F-102
We have operations with foreign revenue andlong-lived assets in approximately 128 countries. Our revenues andlong-lived assets, excluding goodwill and intangible assets, by geographic region are summarized below. Revenues are attributed to countries based on the location of the customer.
| Year Ended December 31, | ||||||||||||
| 2013 | 2012 | 2011 | ||||||||||
| (Amounts in thousands) | ||||||||||||
Revenue | ||||||||||||
United States | $ | 1,765,699 | $ | 1,857,771 | $ | 1,754,830 | ||||||
Europe | 501,953 | 470,112 | 451,734 | |||||||||
All other | 781,873 | 646,481 | 649,397 | |||||||||
|
|
|
|
|
| |||||||
Total | $ | 3,049,525 | $ | 2,974,364 | $ | 2,855,961 | ||||||
|
|
|
|
|
| |||||||
| As of December 31, | ||||||||
| 2013 | 2012 | |||||||
| (Amounts in thousands) | ||||||||
Long-lived assets | ||||||||
United States | $ | 472,517 | $ | 394,625 | ||||
Europe | 10,269 | 7,909 | ||||||
All other | 15,737 | 5,862 | ||||||
|
|
|
| |||||
Total | $ | 498,523 | $ | 408,396 | ||||
|
|
|
| |||||
22. Subsequent Events
We have evaluated subsequent events through March 10, 2014, the issuance date of our consolidated financial statements.
Modification to our Amended and Restated Credit Agreement—On February 20, 2014, we entered into an agreement to modify our Amended and Restated Credit Agreement. The modification reduces the Term Loan B’s applicable margin for Eurocurrency and Base rate borrowings to 3.25% and 2.25%, respectively, with a step down to 3.00% and 2.00%, respectively, if the Senior Secured Leverage Ratio is less than or equal to 3.25 to 1.00. It also reduces the Eurocurrency rate floor to 1.00% and the Base rate floor to 2.00%. The repriced Term Loan B includes a 1% Repricing Premium if we pay off or refinance all or a portion of the Term Loan B within six months of February 20, 2014.
In addition to repricing Term Loan B, the agreement provides for an incremental revolving commitment due February 19, 2019 of $53 million, increasing the Revolver from $352 million to $405 million. In addition, we extended the maturity date of $317 million of the Revolver to February 19, 2019. The commitments maturing February 19, 2019 include an accelerated maturity date of November 19, 2018 if, as of that date, borrowings under the Term Loan B (or permitted refinancings) remain outstanding and mature before February 18, 2020.
Disposition of Certain Assets of Travelocity—In February 2014, as a further step in our restructuring plans for Travelocity, we completed a sale of assets associated with TPN, abusiness-to-business private white label website offering. Under the agreement, certain portions of the sales proceeds received and to be received throughearn-out provisions are contingent upon certain events occurring, and therefore will not be recognized in our results of operations until those contingencies have been realized. In addition, Travelocity has entered into a Transition Services Agreement with the acquirer and will be providing services to maintain the websites and certain technical and administrative functions for the acquirer until a complete transition occurs. The proceeds to be received under the sale agreement and the transition services agreement will be allocated across these multiple agreements based on a relative fair value allocation. We currently do not estimate the amount of proceeds to be recognized at the time of sale to be significant. Assets held and no longer used or assets sold to the buyer as a result of the disposition will be written off against the sales proceeds, recognized as a part of operating income, the amounts of which are not expected to be material.
F-103
Expedia SMA—On March 6, 2014, we amended and restated the Expedia SMA to reflect changes in certain commercial terms. As part of our negotiations to amend and restate the Expedia SMA, we also agreed to a separate Expedia Put/Call agreement that supersedes the previous put/call arrangement, whereby Expedia may acquire, or we may sell to Expedia, certain assets relating to the Travelocity business. Our put right may be exercised during the first 24 months of the Expedia Put/Call only upon the occurrence of certain triggering events primarily relating to implementation, which are outside of our control. The occurrence of such events is not considered probable. During this period, the amount of the put right is fixed. After the 24 month period, the put right is only exercisable for a limited period of time in 2016 and 2017 at a discount to fair market value. The call right held by Expedia is exercisable at any time during the term of the Expedia Put/Call. If the call right is exercised, although we expect the amount paid will be fair value, the call right provides for a floor for a limited time that may be higher than fair value and a ceiling for the duration of the Expedia Put/Call that may be lower than fair value.
The term of the amended and restated Expedia SMA is nine years and automatically renews under certain conditions.
F-104
SABRE CORPORATION
SCHEDULE II — VALUATION AND QUALIFYING ACCOUNTS
DECEMBER 31, 2013, 2012 AND 2011
(In Millions)
| Balance at Beginning of Period | Charged to Expense or Other Accounts | Write-offs and Other Adjustments | Balance at End of Period | Balance at Beginning of Period | Charged to Expense or Other Accounts | Write-offs and Other Adjustments | Balance at End of Period | |||||||||||||||||||||||||
Allowance for Doubtful Accounts | ||||||||||||||||||||||||||||||||
Year ended December 31, 2013 | $ | 31.4 | $ | 7.1 | $ | (12.6 | ) | $ | 25.9 | $ | 31.4 | $ | 7.1 | $ | (12.6 | ) | $ | 25.9 | ||||||||||||||
Year ended December 31, 2012 | $ | 36.5 | $ | 4.8 | $ | (9.9 | ) | $ | 31.4 | $ | 36.5 | $ | 4.8 | $ | (9.9 | ) | $ | 31.4 | ||||||||||||||
Year ended December 31, 2011 | $ | 37.1 | $ | 8.7 | $ | (9.3 | ) | $ | 36.5 | $ | 37.1 | $ | 8.7 | $ | (9.3 | ) | $ | 36.5 | ||||||||||||||
Valuation Allowance for Deferred Tax Assets | ||||||||||||||||||||||||||||||||
Year ended December 31, 2013 | $ | 282.1 | $ | (32.6 | ) | $ | 3.6 | $ | 253.1 | $ | 282.1 | $ | (32.6 | ) | $ | 3.6 | $ | 253.1 | ||||||||||||||
Year ended December 31, 2012 | $ | 227.4 | $ | 65.1 | $ | (10.4 | ) | $ | 282.1 | $ | 227.4 | $ | 65.1 | $ | (10.4 | ) | $ | 282.1 | ||||||||||||||
Year ended December 31, 2011 | $ | 236.4 | $ | (6.5 | ) | $ | (2.5 | ) | $ | 227.4 | $ | 236.4 | $ | (6.5 | ) | $ | (2.5 | ) | $ | 227.4 | ||||||||||||
Reserve for Value-Added Tax Receivables | ||||||||||||||||||||||||||||||||
Year ended December 31, 2013 | $ | 36.7 | $ | (32.6 | ) | $ | (0.2 | ) | $ | 3.9 | $ | 36.7 | $ | (32.6 | ) | $ | (0.2 | ) | $ | 3.9 | ||||||||||||
Year ended December 31, 2012 | $ | 40.4 | $ | (3.3 | ) | $ | (0.4 | ) | $ | 36.7 | $ | 40.4 | $ | (3.3 | ) | $ | (0.4 | ) | $ | 36.7 | ||||||||||||
Year ended December 31, 2011 | $ | 43.2 | $ | (1.3 | ) | $ | (1.5 | ) | $ | 40.4 | $ | 43.2 | $ | (1.3 | ) | $ | (1.5 | ) | $ | 40.4 | ||||||||||||
F-105
Board of Director and Stockholder/Member
PRISM Group, Inc. and Affiliate
We have audited the accompanying combined balance sheets of PRISM Group, Inc. (a Maryland Corporation) and Affiliate (collectively the “Company”), as of December 31, 2011 and 2010, and the related combined statements of income, changes in stockholder’s/member’s equity, and cash flows for the years then ended. These combined financial statements are the responsibility of the Company’s management. Our responsibility is to express an opinion on these combined financial statements based on our audits.
We conducted our audits in accordance with auditing standards generally accepted in the United States of America. Those standards require that we plan and perform the audit to obtain reasonable assurance about whether the combined financial statements are free of material misstatement. An audit includes examining, on a test basis, evidence supporting the amounts and disclosures in the combined financial statements. An audit also includes assessing the accounting principles used and significant estimates made by management, as well as evaluating the overall combined financial statement presentation. We believe that our audits provide a reasonable basis for our opinion.
In our opinion, the combined financial statements referred to above present fairly, in all material respects, the financial position of PRISM Group, Inc. and its Affiliate as of December 31, 2011 and 2010, and the results of their operations and their cash flows for the years then ended in conformity with accounting principles generally accepted in the United States of America.
As discussed in Note 7 to the combined financial statements, certain errors resulting in an overstatement of previously reported revenues, compensation expense and compensation accrual with a corresponding understatement of deferred revenue as of December 31, 2010, were discovered by management of the Company during the current year. Accordingly, the 2010 combined financial statements have been restated to correct the error.
As discussed in Note 2 to the combined financial statements, on August 1, 2012, the Company entered into an equity purchase agreement whereby Sabre, Inc., a Delaware corporation, acquired all of the outstanding stock and ownership interests of the Company.
/s/ REDW LLC
Albuquerque, New Mexico
February 28, 2014
F-106
PRISM Group, Inc. and Affiliate
Combined Balance Sheets
December 31,
| 2011 | 2010 | |||||||
Assets | ||||||||
Current assets | ||||||||
Cash and cash equivalents | $ | 5,392,368 | $ | 2,816,908 | ||||
Trade accounts receivable, net | 10,586,246 | 7,989,552 | ||||||
Prepaid expenses | 258,385 | 337,663 | ||||||
|
|
|
| |||||
Total current assets | 16,236,999 | 11,144,123 | ||||||
Property and equipment, net | 1,831,409 | 1,715,835 | ||||||
Other assets, net | 17,223 | 17,223 | ||||||
|
|
|
| |||||
Total assets | $ | 18,085,631 | $ | 12,877,181 | ||||
|
|
|
| |||||
Liabilities and Stockholder’s/Member’s Equity | ||||||||
Current liabilities | ||||||||
Trade accounts payable | $ | 31,586 | $ | 21,074 | ||||
Compensation accrual, as restated | 615,434 | 611,275 | ||||||
Sales tax payable | 210,800 | 9,182 | ||||||
Deferred revenue, as restated | 1,017,023 | 1,295,314 | ||||||
|
|
|
| |||||
Total current liabilities | 1,874,843 | 1,936,845 | ||||||
|
|
|
| |||||
Stockholder’s/Member’s Equity | ||||||||
Common stock, $1 par value, 1,000 shares authorized, issued and outstanding | 1,000 | 1,000 | ||||||
Affiliated member’s equity, as restated | 340,888 | 988,029 | ||||||
Retained earnings, as restated | 15,868,900 | 9,951,307 | ||||||
|
|
|
| |||||
Total stockholder’s/member’s equity, as restated | 16,210,788 | 10,940,336 | ||||||
|
|
|
| |||||
Total liabilities and stockholder’s/member’s equity, as restated | $ | 18,085,631 | $ | 12,877,181 | ||||
|
|
|
| |||||
The accompanying notes are an integral part of these combined financial statements.
F-107
PRISM Group, Inc. and Affiliate
Combined Statements of Income
For the Years Ended December 31,
| 2011 | 2010 | |||||||
Revenue | ||||||||
System software-airlines, as restated | $ | 26,007,806 | $ | 22,451,033 | ||||
System software-global corporations | 1,495,546 | 1,355,902 | ||||||
System installation and programming | 143,450 | 63,450 | ||||||
Co-location fees | 64,845 | 57,683 | ||||||
|
|
|
| |||||
Total revenue, as restated | 27,711,647 | 23,928,068 | ||||||
|
|
|
| |||||
Operating Expenses | ||||||||
Compensation, as restated | 7,767,961 | 7,450,364 | ||||||
Depreciation and amortization | 825,180 | 1,305,168 | ||||||
Equipment, repairs and maintenance | 503,899 | 323,995 | ||||||
Operating, other | 301,413 | 312,980 | ||||||
Selling, general and administrative | 546,079 | 233,685 | ||||||
Taxes | 88,162 | 156,757 | ||||||
Legal and professional | 236,234 | 108,699 | ||||||
|
|
|
| |||||
Total operating expenses, as restated | 10,268,928 | 9,891,648 | ||||||
|
|
|
| |||||
Operating income, as restated | 17,442,719 | 14,036,420 | ||||||
|
|
|
| |||||
Other Income (Expense) | ||||||||
Interest income | — | 6,040 | ||||||
Loss on sale of assets, net | (184 | ) | (303,584 | ) | ||||
Other income | — | 1,701 | ||||||
|
|
|
| |||||
Total other expense | (184 | ) | (295,843 | ) | ||||
|
|
|
| |||||
Net Income, as Restated | $ | 17,442,535 | $ | 13,740,577 | ||||
|
|
|
| |||||
The accompanying notes are an integral part of these combined financial statements.
F-108
PRISM Group, Inc. and Affiliate
Combined Statements of Changes in Stockholder’s/Member’s Equity
For the Years Ended December 31,
| Common Stock | Affiliate Member’s Equity | Retained Earnings | Stockholder’s/ Member’s Equity | |||||||||||||
Balance at December 31, 2009, as restated | $ | 1,000 | $ | 1,823,234 | $ | 8,992,706 | $ | 10,816,940 | ||||||||
Net (loss) income, as restated | — | (2,635,205 | ) | 16,375,782 | 13,740,577 | |||||||||||
Capital contribution (distributions) | — | 1,800,000 | (15,417,181 | ) | (13,617,181 | ) | ||||||||||
|
|
|
|
|
|
|
| |||||||||
Balance at December 31, 2010, as restated | 1,000 | 988,029 | 9,951,307 | 10,940,336 | ||||||||||||
Net (loss) income | — | (2,026,708 | ) | 19,469,243 | 17,442,535 | |||||||||||
Capital contribution (distributions) | — | 1,379,567 | (13,551,650 | ) | (12,172,083 | ) | ||||||||||
|
|
|
|
|
|
|
| |||||||||
Balance at December 31, 2011 | $ | 1,000 | $ | 340,888 | $ | 15,868,900 | $ | 16,210,788 | ||||||||
|
|
|
|
|
|
|
| |||||||||
The accompanying notes are an integral part of these combined financial statements.
F-109
PRISM Group, Inc. and Affiliate
Combined Statements of Cash Flows
For the Years Ended December 31,
| 2011 | 2010 | |||||||
Cash flows from operating activities | ||||||||
Net income, as restated | $ | 17,442,535 | $ | 13,740,577 | ||||
Adjustments to reconcile net income to net cash provided by operating activities | ||||||||
Depreciation and amortization | 825,180 | 1,305,168 | ||||||
Allowance for doubtful accounts | 335,003 | — | ||||||
Loss on sale of assets, net | 184 | 303,584 | ||||||
Changes in assets and liabilities | ||||||||
Trade accounts receivable | (2,931,697 | ) | (1,858,821 | ) | ||||
Prepaid expenses | 79,278 | (337,663 | ) | |||||
Trade accounts payable | 10,512 | 6,668 | ||||||
Compensation accrual, as restated | 4,159 | 51,236 | ||||||
Sales tax payable | 201,618 | (204,580 | ) | |||||
Deferred revenue, as restated | (278,291 | ) | 922,725 | |||||
|
|
|
| |||||
Total adjustments, as restated | (1,754,054 | ) | 188,317 | |||||
|
|
|
| |||||
Net cash provided by operating activities | 15,688,481 | 13,928,894 | ||||||
|
|
|
| |||||
Cash flows from investing activities | ||||||||
Purchases of property and equipment | (948,426 | ) | (1,318,395 | ) | ||||
Proceeds from sale of property and equipment | 7,488 | 1,220 | ||||||
|
|
|
| |||||
Net cash used in investing activities | (940,938 | ) | (1,317,175 | ) | ||||
|
|
|
| |||||
Cash flows from financing activities | ||||||||
Capital contributions | 1,379,567 | 1,800,000 | ||||||
Capital distributions | (13,551,650 | ) | (15,417,181 | ) | ||||
|
|
|
| |||||
Net cash used in financing activities | (12,172,083 | ) | (13,617,181 | ) | ||||
|
|
|
| |||||
Net increase (decrease) in cash and cash equivalents | 2,575,460 | (1,005,462 | ) | |||||
Cash and cash equivalents, beginning of year | 2,816,908 | 3,822,370 | ||||||
|
|
|
| |||||
Cash and cash equivalents, end of year | $ | 5,392,368 | $ | 2,816,908 | ||||
|
|
|
| |||||
Noncash investing activity | ||||||||
Computers and equipment trade-in value | $ | — | $ | 150,000 | ||||
|
|
|
| |||||
The accompanying notes are an integral part of these combined financial statements.
F-110
PRISM Group, Inc. and Affiliate
Notes to Combined Financial Statements
December 31, 2011 and 2010
| Organization and Nature of Operations |
PRISM Group, Inc. and affiliate (collectively the “Company”) are located in Albuquerque, New Mexico. PRISM Group, Inc. (PRISM Group), a Maryland close corporation, specializes in the development of travel information systems for airlines and global corporations and provides initial custom configuration, consulting, training and technical support to its customers. PRISM Technologies, LLC (PRISM Technologies), a New Mexico Limited Liability Company (LLC), offers equipment storage space (co-location) to its customers, the largest of which is PRISM Group. PRISM Technologies is solely owned by PRISM Group’s sole stockholder. Accordingly, the accompanying combined financial statements have been prepared to reflect the combined financial position, results of operations and cash flows of PRISM Group and PRISM Technologies.
| Summary of Significant Accounting |
Combined Financial Statements
The combined financial statements include the accounts of PRISM Group and PRISM Technologies. All significant intercompany balances and transactions have been eliminated.
Cash and Cash Equivalents
The Company considers all highly liquid investments with original maturities of three months or less to be cash equivalents. Cash and cash equivalents are comprised of deposits with financial institutions, all available on demand, which at times may exceed federally insured limits. The Company has not experienced any losses in such accounts and believes it is not exposed to any significant credit risk on its cash balances.
Use of Estimates
The preparation of financial statements in conformity with accounting principles generally accepted in the United States of America requires management to make estimates and assumptions that affect the reported amounts of assets and liabilities, the disclosure of contingent liabilities at the date of the combined financial statements and the reported amounts of revenues and expenses during the reporting period. Significant estimates include determination of revenue, allowance for doubtful accounts and impairment of long-lived assets. Actual results may differ from those estimates.
Financial Instruments
The carrying amounts of cash, receivables, and payables represent financial instruments whose recorded amounts approximate fair value due to the short maturity periods of these instruments.
Trade Accounts Receivable
Accounts receivable are recorded at the invoiced amount and are non-interest bearing. Management reviews the collectability of its receivables and, when appropriate, records an allowance for its estimate of uncollectible accounts. Accounts receivables are stated at amounts due from customers net of allowance for doubtful accounts based on the Company’s review of current status of existing receivables, subsequent collections and ongoing dialog with customers. At December 31, 2011, the allowance for doubtful accounts
F-111
PRISM Group, Inc. and Affiliate
Notes to Combined Financial Statements
December 31, 2011 and 2010
was $335,003. There was no allowance for doubtful accounts at December 31, 2010. Management believes the allowance for doubtful accounts is adequate to cover any uncollectible accounts at December 31, 2011 and 2010; however, the actual collections may ultimately differ from such estimates. Bad debt expense for the years ended December 31, 2011 and 2010 was $335,003 and $3,056, respectively.
The Company bills customers on a quarterly basis. Prior to 2011, the Company mailed the invoices on the following fiscal year. As a result, at December 31, 2010, included in trade accounts receivable was $7,868,438, of unbilled receivables representing revenues recognized in 2010 but not billed until 2011.
Starting in 2011, the Company mailed the quarter invoices on the last day of each quarter. As a result, there were no unbilled receivables at December 31, 2011.
Prepaid Expenses
Prepaid expenses consist of prepaid support and maintenance related to the purchase of equipment and software, which is expensed over the life of the contract using the straight-line method. Amortization expense for the years ended December 31, 2011 and 2010 was $467,035 and $270,399, respectively, and is included in equipment, repairs and maintenance in the accompanying combined statements of income.
Property and Equipment
Property and equipment consist of items purchased at a cost of $1,000 or more. Depreciation is recorded over the estimated useful lives of the assets using the straight-line method. The useful lives of computers and equipment, software, furniture and fixtures and vehicles range from three to seven years. Amortization of leasehold improvements is recorded over the shorter of the term of the lease or estimated useful lives of five years using the straight-line method.
Depreciation and amortization expense for property and equipment in 2011 and 2010 was $825,180 and $1,301,771, respectively.
Management reviews property and equipment for impairment whenever events or changes in circumstances have indicated that the carrying amount of assets may not be recoverable. No impairments have occurred in 2011 nor 2010.
Research and Development
Development costs incurred before technological feasibility is established are expensed. Costs incurred after technological feasibility is established are capitalized and amortized at the greater of the amount computed on a straight-line basis over the estimated useful life of the product. Development expenses are primarily included in compensation expense in the accompanying combined statements of income. No amounts were capitalized or amortized in 2011 nor 2010.
Patents and Trademarks
The Company uses intellectual property owned by its stockholder, royalty free. The Company expenses legal and other costs incurred to maintain the intellectual property. Expenses related to intellectual property for 2011 and 2010 were $68,703 and $13,008, respectively, and are included in legal and professional expense in the accompanying combined statements of income.
F-112
PRISM Group, Inc. and Affiliate
Notes to Combined Financial Statements
December 31, 2011 and 2010
Revenue and Deferred Revenue
The Company licenses software and provides data analysis to airlines and global corporations for a specified period with automatic or optional renewals at specified dollar amounts and provides equipment storage space to other corporations. The total consideration stated in the contract is for the system software license pass-through data and installation and programming costs together with special analyses, maintenance, support, and data updates delivered over the term of the license. Customer acceptance of software and related initial deliverables is deemed to occur upon delivery unless the agreement specifies an acceptance process or requires the passage of a specified period of time before acceptance is deemed to occur. Revenue from data analysis is recognized provided that all of the following conditions are met: an agreement has been signed; services have been performed; collection of the resulting receivable is deemed probable; and no other significant vendor obligations exist.
Revenues from equipment storage space, maintenance, support, and training are recognized as the respective services are performed.
Included in revenue are refunds and credits issued to various customers. During the years ended December 31, 2011 and 2010, the total amount of refunds and credits was $96,823 and $68,000, respectively.
The Company also has an agreement with one of its major customers where the billable data will not exceed a set amount in any contract year, which is defined as October 1 through September 30. This agreement results in deferral of revenue on a fiscal year basis. The amount of deferred revenue was $1,017,023 and $1,295,314 at December 31, 2011 and 2010, respectively.
Advertising and Marketing
Advertising and marketing costs are expensed as incurred. In 2011 and 2010, advertising and marketing expense, included in selling, general and administrative expenses in the accompanying combined statements of income, was $15,483 and $8,882, respectively.
Income Taxes
PRISM Group, with the consent of its stockholder, has elected to be an “S” corporation under the Internal Revenue Code and similar state law. Similarly, PRISM Technologies is a tax pass through entity. Instead of paying income taxes, the stockholder/member reports the impact of the Company’s operating results on a personal tax return. Therefore, there is no provision or liability for federal or state income taxes in the accompanying combined financial statements.
The accounting standard on accounting for uncertainty in income taxes addresses the determination of whether tax benefits claimed or expected to be claimed on a tax return should be recorded in the combined financial statements. Under that guidance, the Company may recognize the tax benefit from an uncertain tax position only if it is more likely than not that the tax position will be sustained on examination by taxing authorities based on the technical merits of the position. Tax positions include the tax-exempt status of the Company. The Company believes that it has appropriate support for any tax positions taken, and as such, does not have any uncertain tax positions that are material to the accompanying combined financial statements.
As of December 31, 2011, for federal tax purposes, the Company’s 2009 through 2011 tax years remain open for examination by the tax authorities under the normal three-year statute of limitations.
F-113
PRISM Group, Inc. and Affiliate
Notes to Combined Financial Statements
December 31, 2011 and 2010
Sales Tax Payable
Taxes, if any, assessed by various governmental authorities on sales or licensing transactions are recorded as a liability, and reported on the accompanying combined balance sheets, until remitted to the applicable authorities. Such taxes are not included in revenues or expenses. As of December 31, 2011 and 2010, sales tax payable was $210,800 and $9,182, respectively.
Major Customers
The Company derived approximately 67% of its revenues from five customers in 2011 and 68% from four customers in 2010. As of December 31, 2011 and 2010, three customers constituted approximately 62% and 59% of trade accounts receivables, respectively.
Sale of Company
On August 1, 2012, the Company entered into an equity purchase agreement, whereby Sabre Inc., a Delaware corporation, acquired all of the outstanding stock and ownership interests of the Company. The total purchase price was approximately $120 million.
Subsequent Events
Subsequent events have been evaluated through February 28, 2014, the date which the combined financial statements were available to be issued. Any subsequent events requiring recognition or disclosure as of December 31, 2011, have been incorporated into the combined financial statements herein.
| Property and Equipment |
Property and equipment consist of the following at December 31:
| 2011 | 2010 | |||||||
Computers and equipment | $ | 3,328,129 | $ | 2,997,295 | ||||
Software | 2,495,640 | 1,879,632 | ||||||
Leasehold improvements | 153,550 | 153,550 | ||||||
Furniture and fixtures | 34,451 | 34,451 | ||||||
Vehicles | — | 37,310 | ||||||
|
|
|
| |||||
| 6,011,770 | 5,102,238 | |||||||
Less accumulated depreciation and amortization | 4,180,361 | 3,386,403 | ||||||
|
|
|
| |||||
Total property and equipment, net | $ | 1,831,409 | $ | 1,715,835 | ||||
|
|
|
| |||||
During 2011, the Company sold equipment with an original cost basis of $38,894 and a net book value of $7,672 for $7,488. During 2010, the Company sold fully depreciated equipment for $1,220. Also, in 2010, computers and equipment with an original cost basis of $4,093,241 and a net book value of $454,804 were traded-in for similar equipment. The trade-in value was $150,000, which resulted in a loss of $304,804.
F-114
PRISM Group, Inc. and Affiliate
Notes to Combined Financial Statements
December 31, 2011 and 2010
| Commitments and Contingencies |
Leases
The Company leases its server facility under an operating lease, amended in December 2010 to expire in November 2015, with monthly minimum rental payments of $4,664. The Company may extend the lease for an additional five years. Future minimum lease commitments are as follows:
Year ending December 31, | ||||
2012 | $ | 55,968 | ||
2013 | 55,968 | |||
2014 | 55,968 | |||
2015 | 51,304 | |||
|
| |||
Total minimum payments | $ | 219,208 | ||
|
|
Rent expense for the years ended December 31, 2011 and 2010, including common area maintenance and additional rent for space in 2010 no longer leased, was $55,968 and $85,056, respectively.
Contingencies
The Company is subject to various claims that arise in the ordinary course of business. Commercial insurance coverage is purchased to mitigate exposure to certain claims arising from such matters. In the opinion of management, the amount of the ultimate uninsured liability with respect to these actions will not materially affect the financial position, results of operations, or liquidity of the Company.
| Employee Benefit Plan |
The Company has a 401(k) defined contribution plan. Full-time employees are eligible to participate and the Company, at their discretion, may match a percentage of the participant’s contribution. For the years ended December 31, 2011 and 2010, the Company’s matching contribution to the plan was $155,000 and $156,611, respectively.
| Member’s Equity |
PRISM Technologies is a single member LLC. Under the terms of the Operating Agreement, the term of PRISM Technologies is indefinite. Member’s equity includes the sole member’s original investment and contributions, distributions to the sole member, and as well as PRISM Technologies’ accumulated loss.
F-115
PRISM Group, Inc. and Affiliate
Notes to Combined Financial Statements
December 31, 2011 and 2010
| Restatements |
The accompanying combined financial statements as of and for the years ended December 31, 2010 and 2009 have been restated to reflect adjustments made to the Company’s previously issued 2010 combined financial statements. The following tables summarize the impact of the restatements on balances previously reported:
As of and for year ended December 31, 2010: | ||||||||||||||||||||||||
| As Reported | Increase (Decrease) | As Restated | As Reported | Increase (Decrease) | As Restated | |||||||||||||||||||
Balance sheet | ||||||||||||||||||||||||
Current liabilities: | ||||||||||||||||||||||||
Deferred revenue (a) | $ | — | $ | 1,295,314 | $ | 1,295,314 | $ | — | $ | 1,295,314 | $ | 1,295,314 | ||||||||||||
Compensation accrual (b) | 954,873 | (343,598 | ) | 611,275 | 954,873 | (343,598 | ) | 611,275 | ||||||||||||||||
Total current liabilities | 985,129 | 951,716 | 1,936,845 | 985,129 | 951,716 | 1,936,845 | ||||||||||||||||||
Stockholder’s/member’s equity: | ||||||||||||||||||||||||
Affiliated member’s equity | 924,995 | 63,034 | 988,029 | 924,995 | 63,034 | 988,029 | ||||||||||||||||||
Retained earnings | 10,966,057 | (1,014,750 | ) | 9,951,307 | 10,966,057 | (1,014,750 | ) | 9,951,307 | ||||||||||||||||
Total stockholder’s/member’s equity | 11,892,052 | (951,716 | ) | 10,940,336 | 11,892,052 | (951,716 | ) | 10,940,336 | ||||||||||||||||
Statement of income | ||||||||||||||||||||||||
Revenue: | ||||||||||||||||||||||||
System software-airlines (a) | 23,373,758 | (922,725 | ) | 22,451,033 | 23,373,758 | (922,725 | ) | 22,451,033 | ||||||||||||||||
Expenses: | ||||||||||||||||||||||||
Compensation (b) | 7,493,786 | (43,422 | ) | 7,450,364 | 7,493,786 | (43,422 | ) | 7,450,364 | ||||||||||||||||
Net income | 14,619,880 | (879,303 | ) | 13,740,577 | 14,619,880 | (879,303 | ) | 13,740,577 | ||||||||||||||||
Statement of cash flows | ||||||||||||||||||||||||
Cash flows from operating activities: | ||||||||||||||||||||||||
Net income | 14,619,880 | (879,303 | ) | 13,740,577 | 14,619,880 | (879,303 | ) | 13,740,577 | ||||||||||||||||
Adjustments to reconcile net income to net cash provided by operating activities | ||||||||||||||||||||||||
Changes in assets and liabilities: | ||||||||||||||||||||||||
Deferred revenue (a) | — | 922,725 | 922,725 | — | 922,725 | 922,725 | ||||||||||||||||||
Compensation accrual (b) | 94,658 | (43,422 | ) | 51,236 | 94,658 | (43,422 | ) | 51,236 | ||||||||||||||||
An explanation of the adjustments is as follows:
| (a) | Adjustment to reduce previously reported revenue |
| (b) | Adjustment to adjust over accrual of compensation and related compensation expense |
As of and for year ended December 31, 2009: | ||||||||||||
| As Reported | Increase (Decrease) | As Restated | ||||||||||
Balance sheet | ||||||||||||
Stockholder’s/member’s equity: | ||||||||||||
Affiliated member’s equity | 1,792,703 | 30,531 | 1,823,234 | |||||||||
Retained earnings | 9,095,650 | (102,944 | ) | 8,992,706 | ||||||||
Total stockholder’s/member’s equity | 10,889,353 | (72,413 | ) | 10,816,940 | ||||||||
F-116
Sabre Corporation
Until , 2014 (25 days after the date of this offering), all dealers that effect transactions in these securities, whether or not participating in this offering, may be required to deliver a prospectus. This is in addition to the dealer’s obligation to deliver a prospectus when acting as an underwriter and with respect to unsold allotments or subscriptions.
PART II
INFORMATION NOT REQUIRED IN PROSPECTUS
Item 13. Other Expenses of Issuance and Distribution.
Estimated expenses (except for the SEC registration fee and FINRA filing fee and NASDAQ listing fee) payable in connection with the sale of the common stock in this offering are as follows:
SEC registration fee | $ | 12,880 | ||
FINRA filing fee | 15,500 | |||
NASDAQ listing fee | * | |||
Printing and engraving expenses | * | |||
Legal fees and expenses | * | |||
Accounting fees and expenses | * | |||
Transfer agent and registrar fees and expenses | * | |||
Blue Sky fees and expenses | * | |||
Miscellaneous | * | |||
|
| |||
Total | $ | * | ||
|
|
SEC registration fee | $ | 46,480 | ||
FINRA filing fee | 60,500 | |||
Printing and engraving expenses | ||||
Legal fees and expenses | ||||
Accounting fees and expenses | ||||
Transfer agent and registrar fees and expenses | ||||
Blue Sky fees and expenses | ||||
Miscellaneous | ||||
|
| |||
Total | $ | |||
|
|
We will bear all of the expenses shown above.
Item 14. Indemnification of Directors and Officers.
Section 102 of the Delaware General Corporation Law, as amended (“DGCL”) allows a corporation to eliminate or limit the personal liability of directors to a corporation or its stockholders for monetary damages for breach of fiduciary duty as a director, except where the director breached his duty of loyalty, failed to act in good faith, engaged in intentional misconduct or knowingly violated a law, authorized the payment of a dividend or approved a stock repurchase or redemption in violation of Delaware corporate law or engaged in a transaction from which the director obtained an improper personal benefit.
Section 145 of the DGCL provides, among other things, that a corporation may indemnify any person who was or is a party or is threatened to be made a party to any threatened, pending or completed action, suit or proceeding (other than an action by or in the right of the corporation) by reason of the fact that the person is or was a director, officer, employee or agent of the corporation, or is or was serving at the corporation’s request as a director, officer, employee or agent of another corporation, partnership, joint venture, trust or other enterprise, against expenses (including attorneys’ fees), judgments, fines and amounts paid in settlement actually and reasonably incurred by the person in connection with the action, suit or proceeding. The power to indemnify applies if (i) such person acted in good faith and in a manner he or she reasonably believed to be in or not opposed to the best interests of the corporation, and with respect to any criminal action or proceeding, had no reasonable cause to believe his conduct was unlawful or, (ii) to the extent that such person is a present or former director or officer of a corporation, such person is successful on the merits or otherwise in defense of any action, suit or proceeding. The power to indemnify applies to actions brought by or in the right of the corporation as well, but only to the extent of defense expenses (including attorneys’ fees but excluding amounts paid in settlement) actually and reasonably incurred and not to any satisfaction of judgment or settlement of the claim itself, and with the further limitation that in such actions no indemnification shall be made in the event such person is adjusted to be liable to the corporation, unless a court determines that in light of all the circumstances indemnification should apply.
Section 174 of the DGCL provides, among other things, that a director who willfully and negligently approves of an unlawful payment of dividends or an unlawful stock purchase or redemption may be held liable
II-1
for such actions to the full amount of the dividend unlawfully paid or the purchase or redemption of the corporation’s stock, with interest from the time such liability accrued. A director who was either absent when the
II-1
unlawful actions were approved or dissented at the time may avoid liability by causing his or her dissent to such actions to be entered on the books containing the minutes of the meetings of the board of directors at the time the action occurred or immediately after the absent director receives notice of the unlawful acts.
Our Certificate of Incorporation provides that no director shall be personally liable to us or any of our stockholders for monetary damages for breach of fiduciary duty as a director, except to the extent such exemption from liability or limitation thereof is not permitted under the DGCL.
Our Bylaws provide that we will indemnify, to the fullest extent permitted by the DGCL, any person made or threatened to be made a party to any action or is involved in a proceeding by reason of the fact that the person is or was our director or officer, or servesour director or served asofficer who, while a director or officer, is or was serving at the request of anythe company as a director, officer, employee, agent or manager of another corporation, partnership, limited liability company, joint venture, trust or other enterprise at our request.ornon-profit entity, including service with respect to an employee benefit plan. Expenses incurred by a director or officer in defending against such legal proceedings are payable before the final disposition of the action, provided that the director or officer undertakes to repay us if it is later determined that he or she is not entitled to indemnification. Our Bylaws also provide that, subject to applicable law, the company may, by action of its board of directors, grant rights to indemnification and advancement of expenses to persons other than its directors and officers with such scope and effect as the board of directors may then determine.
We intend to enterhave entered into separatecustomary indemnification agreements with each of our directors and officers. Eachthat provide them, in general, with customary indemnification agreement will provide, among other things, for indemnification to the fullest extent permitted by law and under our Certificate of Incorporation and Bylaws against any and all expenses, judgments, fines, penalties and amounts paid in settlement of any claim. The indemnification agreements will provide for the advancement or payment of all expenses to the indemnitee and for reimbursementconnection with their service to us if it is found that such indemnitee is not entitled to such indemnification under applicable law,or on our Certificate of Incorporation or Bylaws.behalf.
Insofar as indemnification for liabilities arising under the Securities Act may be permitted to directors, officers or persons controlling us pursuant to the foregoing provisions, we have been informed that, in the opinion of the SEC, such indemnification is against public policy as expressed in the Securities Act and is therefore unenforceable.
We maintain standard policies of insurance under which coverage is provided (a) to our directors and officers against loss rising from claims made by reason of breach of duty or other wrongful act, and (b) to us with respect to payments which we may make to such officers and directors pursuant to the above indemnification provision or otherwise as a matter of law for a privately held company. We will be modifying our coverage to address public company specific exposures in connection with the completion of this offering.
The underwriting agreement, to be filed as Exhibit 1.1 to this registration statement, will provide for indemnification, under certain circumstances, by the underwriters of us and our officers and directors for certain liabilities arising under the Securities Act or otherwise.
Item 15. Recent Sales of Unregistered Securities.
Since January 1, 2011, the company has issued and sold the following securities without registration under the Securities Act.
2019 Notes Issuance
On May 9, 2012, Sabre GLBL issued $400 million aggregate principal amount of the Initial 2019 Notes, bearing interest at a rate of 8.5% per annum to Morgan Stanley & Co. LLC, Goldman, Sachs & Co., Merrill, Lynch, Pierce, Fenner & Smith Incorporated, Deutsche Bank Securities Inc., Barclays Capital Inc., Natixis Securities Americas LLC and Mizuho Securities USA Inc. (collectively, the “Initial Purchasers”) for aggregate consideration of $393 million representing an aggregate underwriting discount of $7 million from the aggregate
II-2
offering price of $400 million at which the Initial Purchasers subsequently resold the Initial 2019 Notes to investors.
On September 27, 2012, Sabre GLBL issued an additional $400 million aggregate principal amount of senior secured notes due 2019, bearing interest at a rate of 8.5% per annum to the Initial Purchasers at an issue price of
II-2
103.5%, plus accrued and unpaid interest from May 9, 2012 (the “Add-On“Add-On 2019 Notes”), for aggregate consideration of $408.5 million with respect to such $400 million of senior secured notes due 2019 representing an aggregate underwriting discount of $5.5 million from the aggregate offering price of $414 million at which the Initial Purchasers subsequently resold theAdd-On 2019 Notes to investors.
For each of the offerings, the sale to the Initial Purchasers was made in reliance on the exemption from registration set forth in Section 4(2)4(a)(2) of the Securities Act. The Initial Purchasers resold the notes (i) to qualified institutional buyers in compliance with Rule 144A under the Securities Act and (ii) outside the United States tonon-U.S. persons in offshore transactions in compliance with Regulation S under the Securities Act.
Option, Restricted Stock and RSU Issuances
Since January 1, 2011, we granted options to purchase an aggregate of 6,500,846 shares of our common stock under our equity compensation plans at exercise prices ranging from approximately $8.18 to $14.01 per share.
Since January 1, 2011, we granted 354,191 shares of restricted stock and 1,520,938 restricted stock units to be settled in shares of our common stock under our equity compensation plans. In addition, during the year ended December 31, 2013 and 2012, we issued 40,12067,543 and 67,54340,120 restricted stock units, respectively, pursuant to a restricted stock unit agreement.
During the year ended December 31, 2011, we issued 255,686 shares of our common stock upon exercise of vested options for aggregate consideration of $1,200,620 under our equity compensation plans.
During the year ended December 31, 2012, we issued 718,006 shares of our common stock upon exercise of vested options for aggregate consideration of $2,696,019 under our equity compensation plans.
During the year ended December 31, 2013, we issued 596,285 shares of our common stock upon exercise of vested options for aggregate consideration of $2,933,089 under our equity compensation plans.
During the year ended December 31, 2014, we issued 3,453,509 shares of our common stock upon exercise of vested options for aggregate consideration of $16,658,901.90 under our equity compensation plans.
We deemed the grants of stock options, restricted stock and RSUs prior to our initial public offering and the issuances of shares of common stock upon the exercise of stock options prior to our initial public offering described above as exempt from registration pursuant to Section 4(a)(2) of the Securities Act or in reliance on Rule 701 of the Securities Act as offers and sales of securities under compensatory benefit plans and contracts relating to compensation in compliance with Rule 701. Each of the recipients of securities in any transaction exempt from registration either received or had adequate access, through employment, business or other relationships, to information about us. For each of the transactions listed above, stock certificates were not issued, but appropriate legends were included at each issuance under the Management Stockholders’ Agreement. There were no underwriters employed in connection with any of the transactions set forth above. We filed a registration statement on Form S-8 under the Securities Act covering all shares of common stock subject to outstanding awards or issuable pursuant to our equity compensation plans on May 16, 2014.
Redemption of Series A Preferred Stock
Prior to the closing of our initial public offering, we amended our Certificate of Incorporation and exercised our right to redeem all of our Series A Cumulative Preferred Stock. The amendment to our Certificate of Incorporation modified the redemption feature of the Series A Cumulative Preferred Stock to allow for settlement using cash, shares of our common stock or a mix of cash and shares of our common stock. On April 23, 2014, we redeemed all of our outstanding shares of Series A Cumulative Preferred Stock in exchange for 40,343,529 shares of our common stock, which were delivered pro rata to the holders thereof concurrently with the closing of our initial public offering.
II-3
Item 16. Exhibits and Financial Statement Schedules.
(a) Exhibits: The list of exhibits is set forth beginning on pageII-7 of this Registration Statement and is incorporated herein by reference.
(b) Financial Statement Schedules: The following Financial Statement Schedule is included herein: Schedule II—Valuation and Qualifying Accounts, startingbeginning on page F-70.F-104.
II-3
Item 17. Undertakings.
* (f) The undersigned registrant hereby undertakes to provide to the underwriters at the closing specified in the underwriting agreement, certificates in such denominations and registered in such names as required by the underwriters to permit prompt delivery to each purchaser.
* (h) Insofar as indemnification for liabilities arising under the Securities Act of 1933 may be permitted to directors, officers, and controlling persons of the registrant pursuant to the foregoing provisions, or otherwise, the registrant has been advised that in the opinion of the Securities and Exchange Commission such indemnification is against public policy as expressed in the Securities Act and is, therefore, unenforceable. In the event that a claim for indemnification against such liabilities (other than the payment by the registrant of expenses incurred or paid by a director, officer, or controlling person of the registrant in the successful defense of any action, suit or proceeding) is asserted by such director, officer, or controlling person in connection with the securities being registered, the registrant will, unless in the opinion of its counsel the matter has been settled by controlling precedent, submit to a court of appropriate jurisdiction the question whether such indemnification by it is against public policy as expressed in the Act and will be governed by the final adjudication of such issue.
* (i) The undersigned registrant hereby undertakes that:
| * | Paragraph references correspond to those of RegulationS-K, Item 512. |
II-4
SIGNATURES
Pursuant to the requirements of the Securities Act of 1933, the registrant has duly caused this registration statement to be signed on its behalf by the undersigned, thereunto duly authorized, in the city of Southlake, State of Texas on March 10, 2014.January 26, 2015
| SABRE CORPORATION | ||
/s/ Thomas Klein | ||
By: | Thomas Klein | |
| Title: | President and Chief Executive Officer | |
II-5
POWER OF ATTORNEY
KNOW ALL MEN BY THESE PRESENTS, that each officer and director of Sabre Corporation whose signature appears below constitutes and appoints Richard A. Simonson, Rachel A. Gonzalez and Chris Nester, his or her true and lawful attorney-in-fact and agent, with full power of substitution and revocation, for him or her and in his or her name, place and stead, in any and all capacities, to execute any or all amendments including any post-effective amendments and supplements to this Registration Statement, and any additional Registration Statement filed pursuant to Rule 462(b), and to file the same, with all exhibits thereto, and other documents in connection therewith, with the Securities and Exchange Commission, granting unto said attorney-in-fact and agent full power and authority to do and perform each and every act and thing requisite and necessary to be done, as fully to all intents and purposes as he or she might or could do in person, hereby ratifying and confirming all that said attorney-in-fact and agent, or his or her substitute or substitutes, may lawfully do or cause to be done by virtue hereof.
Pursuant to the requirements of the Securities Act of 1933, as amended, this registration statement has been signed below by the following persons in the capacities and on the dates indicated.
Name | Title | Date | ||
/s/ Thomas Klein Thomas Klein | President, Chief Executive Officer and Director (principal executive officer) | |||
/s/ Richard A. Simonson Richard A. Simonson | Executive Vice President and Chief Financial Officer (principal financial | |||
Jami Kindle | Vice President of Global Accounting (principal accounting officer) | January 26, 2015 | ||
/s/ Lawrence W. Kellner Lawrence W. Kellner | Chairman and Director | |||
/s/ George R. Bravante, Jr.
| Director | January 26, 2015 | ||
| ||||
Gary Kusin | Director | |||
Greg Mondre | Director | |||
Judy Odom | Director | January 26, 2015 | ||
/s/ Joseph Osnoss Joseph Osnoss | Director | |||
Karl Peterson | Director | |||
| ||
II-6
EXHIBIT INDEX
Exhibit | Description of Exhibits | |
| | Form of Underwriting | |
| 2.1† | Put-Call Acquisition Agreement, dated as of March 6, 2014 by and among Expedia, Inc., and Travelocity.com LP and Sabre GLBL Inc. (incorporated by reference to Exhibit 2.1 of Sabre Corporation’s Amendment No. 1 to the Registration Statement on Form S-1 filed with the Securities and Exchange Commission on March 10, 2014). | |
| | Asset Purchase Agreement, dated as of January 23, 2015 by and among Expedia Inc., Sabre GLBL Inc., Travelocity.com LP and certain affiliates of Sabre GLBL Inc. and Travelocity.com LP (incorporated by reference to Exhibit 2.1 of Sabre Corporation’s Current Report on Form 8-K filed with the Securities and Exchange Commission on January 26, 2015). | |
| 3.1 | Third Amended and Restated Certificate of Incorporation of Sabre | |
| | Second Amended and Restated Bylaws of Sabre | |
| | Amended and Restated Registration Rights Agreement, dated as of April 23, 2014 by and among Sabre Corporation and the stockholders party thereto (incorporated by reference to Exhibit 4.1 of Sabre’s Corporation Current Report on Form | |
| 4.2 | Indenture, dated as of August 7, 2001, between Sabre Holdings Corporation and SunTrust Bank, as | |
| | Second Supplemental Indenture, dated as of March 13, 2006, between Sabre Holdings Corporation and SunTrust Bank, as | |
| | Form of Senior Note due 2016 of Sabre Holdings Corporation (included in Exhibit 4.3). | |
| | Indenture, dated as of May 9, 2012, among Sabre Inc., Sabre Holdings Corporation, the subsidiary guarantors party thereto and Wells Fargo Bank, National Association, as trustee and collateral agent with respect to the 8.500% Senior Secured Notes due | |
| | Form of 8.500% Senior Secured Note due 2019 of Sabre Inc. (included in Exhibit 4.5). | |
| | First Supplemental Indenture, dated as of December 31, 2012, among Sabre Inc., TVL Common, Inc., as subsidiary guarantor, the subsidiary guarantors party thereto and Wells Fargo Bank, National Association, as | |
| | Form of Amended and Restated Registration Rights Agreement by and among Sabre Corporation and certain | |
II-7
Exhibit | Description of Exhibits | |
| 5.1* | Opinion of | |
| Loan Agreement, dated March 29, 2007, between Sabre Headquarters, LLC, as borrower, and JPMorgan Chase Bank, N.A., as | ||
| 10.2 | Amendment and Restatement Agreement, dated as of February 19, 2013, among Sabre Inc., Sabre Holdings Corporation, the subsidiary guarantors party thereto, the lenders party thereto, Deutsche Bank AG New York Branch, as administrative agent and Bank of America, N.A. as successor administrative | |
| Amended and Restated Guaranty, dated as of February 19, 2013, among Sabre Holdings Corporation, certain subsidiaries of Sabre Inc. from time to time party thereto and Bank of America, N.A., as administrative | ||
| Amended and Restated Pledge and Security Agreement, dated as of February 19, 2013, among Sabre Holdings Corporation, Sabre Inc., certain subsidiaries of Sabre Inc. from time to time party thereto and Bank of America, N.A., as administrative agent for the secured | ||
| First-Lien Intercreditor Agreement, dated as of May 9, 2012, among Sabre Inc., Sabre Holdings Corporation, the other grantors party thereto, Deutsche Bank AG New York Branch, as administrative agent and authorized representative for the Credit Agreement secured parties, Wells Fargo Bank, National Association, as the InitialFirst-Lien Collateral Agent and initial additional authorized representative, each AdditionalFirst-Lien Collateral Agent and each additional Authorized | ||
| Pledge and Security Agreement, dated as of May 9, 2012, among Sabre Inc., Sabre Holdings Corporation, the subsidiary guarantors party thereto, and Wells Fargo Bank, National Association, as collateral | ||
II-7
agent (incorporated by reference to Exhibit |
| |
| First Incremental Term Facility Amendment to Amended and Restated Credit Agreement, dated as of September 30, 2013, among Sabre Inc., Sabre Holdings Corporation, the subsidiary guarantors party thereto, and Bank of America, N.A., as incremental term lender and administrative | ||
| 10.8+ | Sovereign Holdings, Inc. Management Equity Incentive Plan adopted June 11, 2007, as amended April 22, | |
| 10.9+ | Form ofNon-Qualified Stock Option Grant Agreement under Sovereign Holdings, Inc. Management Equity Incentive Plan adopted June 11, 2007, as amended April 22, | |
II-8
Exhibit | Description of Exhibits | |
| 10.10+ | Form of Travelocity.com LLC Stock Option Grant | |
| 10.11+ | Restricted Stock Grant Agreement, dated April 25, 2011, between Sovereign Holdings, Inc. and Carl | |
| 10.12+ | Sovereign Holdings, Inc. Stock Incentive PlanStock-Settled SARs with Respect to Travelocity Equity, adopted April 5, | |
| 10.13+ | Form of Stock Appreciation Rights Grant Agreement under the Sovereign Holdings, Inc. Stock Incentive PlanStock-Settled SARs with Respect to Travelocity | |
| 10.14+ | Amended and Restated Sovereign Holdings, Inc. Stock Incentive Plan for Travelocity’s CEOStock-Settled SARs with Respect to Travelocity Equity, adopted March 15, 2011, as amended and restated May 3, | |
| 10.15+ | Amended and Restated Stock Appreciation Rights Grant Agreement, dated May 15, 2012 between Sovereign Holdings, Inc. and Carl Sparks under the Amended and Restated Sovereign Holdings, Inc. Stock Incentive Plan for Travelocity’s CEOStock-Settled SARs with Respect to Travelocity | |
| 10.16+ | Sovereign Holdings, Inc. 2012 Management Equity Incentive Plan adopted September 14, | |
| 10.17+ | Form ofNon-Qualified Stock Option Grant Agreement under the Sovereign Holdings, Inc. 2012 Management Equity Incentive | |
| 10.18+ | Form of Restricted Stock Unit Grant Agreement under the Sovereign Holdings, Inc. 2012 Management Equity Incentive | |
| 10.19+ | Restricted Stock Unit Grant Agreement, dated November 1, 2012, between Sovereign Holdings, Inc. and Carl | |
| 10.20+ | Form of Restricted Stock Unit Grant Agreement forNon-Employee Directors under the Sovereign Holdings, Inc. 2012 Management Equity Incentive | |
| 10.21+ | Form ofNon-Qualified Stock Option Grant Agreement forNon-Employee Directors under the Sovereign Holdings, Inc. 2012 Management Equity Incentive | |
II-9
Exhibit | Description of Exhibits | |
| 10.22+ | Employment Agreement by and among Sabre Holdings Corporation, Sabre Inc., Sovereign Holdings, Inc. and Thomas Klein, dated August 14, | |
| 10.23+ | Employment Agreement by and among Sovereign Holdings, Inc., Travelocity.com, L.P. and Carl Sparks, dated March 22, | |
| 10.24+ | Employment Agreement by and between Sovereign Holdings, Inc. and William Robinson, dated December 5, | |
| 10.25+ | Employment Agreement by and between Sovereign Holdings, Inc. and Michael S. Gilliland, dated June 11, | |
| 10.26+ | Amendment No. 1 to Employment Agreement by and between Sovereign Holdings, Inc. and Michael S. Gilliland, dated December 31, | |
II-8
2008 (incorporated by reference to Exhibit |
| |
| 10.27+ | Amendment No. 2 to Employment Agreement by and between Sovereign Holdings, Inc. and Michael S. Gilliland, dated June 26, | |
| 10.28+ | Amendment No. 3 to Employment Agreement by and between Sovereign Holdings, Inc. and Michael S. Gilliland, dated June 30, | |
| 10.29+ | Revision to Amendment No. 3 to Employment Agreement by and between Sovereign Holdings, Inc. and Michael S. Gilliland, dated January 9, | |
| 10.30+ | Employment Agreement by and between Sovereign Holdings, Inc. and Mark Miller, dated July 31, | |
| 10.31+ | Letter Agreement by and among Sovereign Holdings, Inc., TVL Common, Inc. and Mark Miller, dated April 12, | |
| 10.32+ | Employment Agreement by and between Sovereign Holdings, Inc. and Deborah Kerr, dated March 7, | |
| 10.33+ | Employment Agreement by and between Sovereign Holdings, Inc. and Rick Simonson, dated March 5, | |
| 10.34+ | Letter Agreement by and between Sovereign Holdings, Inc., and Michael Gilliland, dated September 18, | |
II-10
Exhibit | Description of Exhibits | |
| 10.35+ | Employment Agreement by and between Sovereign Holdings, Inc. and Sterling Miller, dated July 31, | |
| 10.36+ | Employment Agreement by and between Sovereign Holdings, Inc. and Hugh Jones, dated July 29, | |
| 10.37+ | Employment Agreement by and between Sovereign Holdings, Inc. and Greg Webb, dated February 2, | |
| 10.38 | Amendment No. 1 to Amended and Restated Credit Agreement, dated as of February 20, 2014, among Sabre GLBL Inc., Sabre Holdings Corporation, each of the other Loan Parties, Bank of America, N.A., as administrative agent and the Lenders | |
| 10.39 | First Revolver Extension Amendment to Amended and Restated Credit Agreement, dated as of February 20, 2014, among Sabre GLBL Inc., Sabre Holdings Corporation, each of the other Loan Parties, Bank of America, N.A., as administrative agent and the Revolving Credit Lenders | |
| 10.40 | First Incremental Revolving Credit Facility Amendment to Amended and Restated Credit Agreement, dated as of February 20, 2014, among Sabre GLBL Inc., Sabre Holdings Corporation, each of the other Loan Parties, Bank of America, N.A., as administrative agent and the Revolving Credit Lenders | |
| 10.41† | Second Amended and Restated Information Technology Services Agreement, dated as of January 31, 2012, between HP Enterprise Services, LLC, as provider, and Sabre Inc. (incorporated by reference to Exhibit 10.41 of Sabre Corporation’s Amendment No. 1 to the Registration Statement on Form S-1 filed with the Securities and Exchange Commission on March 10, 2014). | |
| 10.42† | Amendment Number One to Second Amended and Restated Information Technology Services Agreement, dated as of September 14, 2012, between HP Enterprise Services, LLC, as provider, and Sabre Inc. (incorporated by reference to Exhibit 10.42 of Sabre Corporation’s Amendment No. 1 to the Registration Statement on Form S-1 filed with the Securities and Exchange Commission on March 10, 2014). | |
| 10.43† | Amendment Number Two to Second Amended and Restated Information Technology Services Agreement, dated as of July 15, 2013, between HP Enterprise Services, LLC, as provider, and Sabre Inc. (incorporated by reference to Exhibit 10.43 of Sabre Corporation’s Amendment No. 1 to the Registration Statement on Form S-1 filed with the Securities and Exchange Commission on March 10, 2014). | |
II-9II-11
Exhibit | Description of Exhibits | |
| 10.45 | Amended and Restated Stockholders’ Agreement dated as of April 23, 2014 by and among Sabre Corporation and the stockholders party thereto (incorporated by reference to Exhibit 10.2 of Sabre’s Corporation Current Report on Form 8-K filed with the Securities and Exchange Commission on April 23, 2014). | |
| 10.46+ | Form of Director and Officer Indemnification Agreement (incorporated by reference to Exhibit 10.46 of Sabre Corporation’s Amendment No. 6 to the Registration Statement on Form S-1 filed with the Securities and Exchange Commission on April 4, 2014). | |
| 10.47+ | Letter by and between Sovereign Holdings, Inc., Sabre Holdings Corporation and Sabre Inc. and Lawrence W. Kellner, dated August 30, 2013 (incorporated by reference to Exhibit 10.47 of Sabre Corporation’s Amendment No. 3 to the Registration Statement on Form S-1 filed with the Securities and Exchange Commission on March 26, 2014). | |
| 10.48+ | Sabre Corporation 2014 Omnibus Incentive Compensation Plan (incorporated by reference to Exhibit 10.48 of Sabre Corporation’s Amendment No. 3 to the Registration Statement onForm S-1 filed with the Securities and Exchange Commission on March 26, 2014). | |
| 10.49+ | Form of Restricted Stock Unit Grant Agreement under the Sabre Corporation 2014 Omnibus Incentive Compensation Plan (incorporated by reference to Exhibit 10.49 of Sabre Corporation’s Amendment No. 3 to the Registration Statement on Form S-1 filed with the Securities and Exchange Commission on March 26, 2014). | |
| 10.50+ | Form ofNon-Qualified Stock Option Grant Agreement under the Sabre Corporation 2014 Omnibus Incentive Compensation Plan (incorporated by reference to Exhibit 10.50 of Sabre Corporation’s Amendment No. 3 to the Registration Statement on Form S-1 filed with the Securities and Exchange Commission on March 26, 2014). | |
| 10.51+ | Form of Restricted Stock Unit Annual Grant Agreement forNon-Employee Directors under the Sabre Corporation 2014 Omnibus Incentive Compensation Plan (incorporated by reference to Exhibit 10.51 of Sabre Corporation’s Amendment No. 3 to the Registration Statement onForm S-1 filed with the Securities and Exchange Commission on March 26, 2014). | |
| 10.52+ | Form of Restricted Stock Unit Initial Grant Agreement forNon-Employee Directors under the Sabre Corporation 2014 Omnibus Incentive Compensation Plan (incorporated by reference to Exhibit 10.52 of Sabre Corporation’s Amendment No. 3 to the Registration Statement onForm S-1 filed with the Securities and Exchange Commission on March 26, 2014). | |
| 10.53 | Supplement No. 1, dated as of December 31, 2012, to the Pledge and Security Agreement dated as of May 9, 2012, among Sabre Holdings Corporation, Sabre Inc., the subsidiary guarantors and Wells Fargo Bank, National Association, as collateral agent for the secured parties (incorporated by reference to Exhibit 10.53 of Sabre Corporation’s Amendment No. 4 to the Registration Statement on Form S-1 filed with the Securities and Exchange Commission on March 31, 2014). | |
| 10.54+ | Letter Agreement by and between Sabre and Carl Sparks dated April 21, 2014 (incorporated by reference to Exhibit 10.54+ of Sabre Corporation’s Current Report on Form 10-Q filed with the Securities and Exchange Commission on November 12, 2014). | |
| 10.55+ | Employment Agreement by and between Sabre Corporation and Rachel Gonzalez dated September 2, 2014 (incorporated by reference to Exhibit 10.55+ of Sabre’s Corporation Current Report on Form 10-Q filed with the Securities and Exchange Commission on November 12, 2014). | |
| 10.56+* | Letter Agreement by and between Sabre Corporation and Sterling Miller dated October 20, 2014. | |
| 10.57+* | Sabre Corporation Non-Employee Directors Compensation Deferral Plan dated October 29, 2014. | |
| 21.1 | List of Subsidiaries (incorporated by reference to Exhibit 21.1 of Sabre Corporation’s Amendment No. 6 to the Registration Statement on Form S-1 filed with the Securities and Exchange Commission on April 4, 2014). | |
II-12
Exhibit | Description of Exhibits | |
| 23.1* | Consent of | |
| Consent of Ernst & Young LLP. | ||
| Consent of REDW LLC. | ||
| 24.1* | Powers of Attorney (included on signature page). | |
| 101.INS* | XBRL Instance Document | |
| 101.SCH* | XBRL Taxonomy Extension Schema | |
| 101.CAL* | XBRL Taxonomy Extension Calculation Linkbase | |
| 101.DEF* | XBRL Taxonomy Extension Definition Linkbase | |
| 101.LAB* | XBRL Taxonomy Extension Label Linkbase | |
| 101.PRE* | XBRL Taxonomy Extension Presentation Linkbase | |
| + | Indicates management contract or compensatory plan or arrangement. |
| † | Confidential treatment |
| * | Filed herewith. |
II-10II-13