

As filed with the Securities and Exchange Commission on July 11, 2016.May 8, 2017.
Registration No. 333-212093333-217415
UNITED STATES
SECURITIES AND EXCHANGE COMMISSION
Washington, D.C. 20549
Amendment No. 12
to
FORM S-1
REGISTRATION STATEMENT
UNDER
THE SECURITIES ACT OF 1933
TPI Composites, Inc.
(Exact name of registrant as specified in its charter)
| Delaware | 3511 | 20-1590775 | ||
| (State or other jurisdiction of incorporation or organization) | (Primary Standard Industrial Classification Code Number) | (I.R.S. Employer Identification No.) |
TPI Composites, Inc.
8501 N. Scottsdale Rd.
Gainey Center II, Suite 100
Scottsdale, AZ 85253
(480) 305-8910
(Address, including zip code, and telephone number,
including area code, of registrant’s principal executive offices)
Steven C. Lockard
Chief Executive Officer
TPI Composites, Inc.
8501 N. Scottsdale Rd.
Gainey Center II, Suite 100
Scottsdale, AZ 85253
(480) 305-8910
(Name, address, including zip code, and telephone number, including area code, of agent for service)
Copies to:
H. David Henken, Esq. Bradley C. Weber, Esq.
Goodwin Procter LLP
Boston, MA (617) 570-1000 | William E. Siwek Chief Financial Officer Steven Fishbach, Esq. General Counsel TPI Composites, Inc. 8501 N. Scottsdale Rd. Gainey Center II, Suite 100 Scottsdale, AZ 85253 (480) 305-8910 | Sandra L. Flow, Esq. Cleary Gottlieb Steen & Hamilton LLP One Liberty Plaza New York, NY 10006 (212) 225-2000 |
Approximate date of commencement of proposed sale to public: As soon as practicable after this Registration Statement is declared effective.
If any of the securities being registered on this form are to be offered on a delayed or continuous basis pursuant to Rule 415 under the Securities Act of 1933, check the following box. ¨☐
If this Form is filed to register additional securities for an offering pursuant to Rule 462(b) under the Securities Act, check the following box and list the Securities Act registration statement number of the earlier effective registration statement for the same offering. ¨☐
If this Form is a post-effective amendment filed pursuant to Rule 462(c) under the Securities Act, check the following box and list the Securities Act registration statement number of the earlier registration statement for the same offering. ¨☐
If this Form is a post-effective amendment filed pursuant to Rule 462(d) under the Securities Act, check the following box and list the Securities Act registration statement number of the earlier registration statement for the same offering. ¨☐
Indicate by check mark whether the registrant is a large accelerated filer, an accelerated filer, a non-accelerated filer, or a smaller reporting company or an emerging growth company. See the definitions of “large accelerated filer,” “accelerated filer”filer,” “smaller reporting company” and “smaller reporting“emerging growth company” in Rule 12b-2 of the Exchange Act. (Check one):
| Large accelerated filer | Accelerated filer | Non-accelerated filer | Smaller reporting company | |||
| Emerging growth company ☒ | ||||||
If an emerging growth company, indicate by check mark if the registrant has elected not to use the extended transition period for complying with any new or revised financial accounting standards provided pursuant to Section 7(a)(2)(B) of the Securities Act. ☒
CALCULATION OF REGISTRATION FEE
| ||||||||
Title of Each Class of Securities to be Registered | Amount to be Registered(1) | Proposed Maximum | Proposed Maximum Aggregate Offering Price(2) | Amount of Registration Fee(3) | ||||
Common Stock, par value $0.01 | 8,337,500 | $17.00 | $141,737,500 | $14,272.97 | ||||
| ||||||||
| ||||||||
| ||||||||
Title of Each Class of Securities To Be Registered | Amount to be Registered(1) | Proposed Maximum Price Per Share(2) | Proposed Maximum Offering Price(2) | Amount of Registration Fee(3) | ||||
Common Stock, $0.01 par value per share | 5,175,000 | $19.46 | $100,705,500 | $11,671.77 | ||||
| ||||||||
| ||||||||
| (1) | Includes |
| (2) | Estimated solely for the purpose of |
| (3) | The |
The Registrant hereby amends this Registration Statement on such date or dates as may be necessary to delay its effective date until the Registrant shall file a further amendment which specifically states that this Registration Statement shall thereafter become effective in accordance with Section 8(a) of the Securities Act of 1933 or until the Registration Statement shall become effective on such date as the Commission, acting pursuant to Section 8(a), may determine.
The information in this preliminary prospectus is not complete and may be changed. These securitiesThe selling stockholders may not be soldsell these securities until the registration statement filed with the Securities and Exchange Commission is effective. This preliminary prospectus is not an offer to sell nor does it seekthese securities and the selling stockholders are not soliciting an offer to buy these securities in any jurisdiction where the offer or sale is not permitted.
Subject to Completion, dated July 11, 2016May 8, 2017
PRELIMINARY PROSPECTUS
7,250,0004,500,000 Shares
Common Stock
This is the initial public offeringThe selling stockholders identified in this prospectus, which include certain of TPI Composites, Inc. Weour executive officers, are selling 7,250,000 shares of our common stock.
stock in this offering. We expectwill not receive any proceeds from the public offering pricesale of shares to be between $15.00 and $17.00 per share. Currently, no public market exists foroffered by the shares. After pricing of the offering, we expect that the shares will tradeselling stockholders.
Our common stock is listed on The NASDAQ Global Market under the symbol “TPIC”.“TPIC.” On May 5, 2017, the last reported sale price of our common stock on The NASDAQ Global Market was $17.97 per share.
We are an “emerging growth company” under federal securities laws and, as such, will beare subject to reduced public company disclosure standards. See “Prospectus Summary—Implications of Being an Emerging Growth Company.”
Investing in our common stock involves risks that are described in the “Risk Factors” section beginning on page 2118 of this prospectus.
Per Share | Total | |||||||
Public offering price | ||||||||
Underwriting discount(1) | ||||||||
Proceeds, before expenses, to | ||||||||
| (1) | See “Underwriting” beginning on page |
The underwriters may also exercise their option to purchase up to an additional 1,087,500675,000 shares from usthe selling stockholders at the public offering price, less the underwriting discount, for 30 days after the date of this prospectus.
Neither the Securities and Exchange Commission nor any state securities commission has approved or disapproved of these securities or determined if this prospectus is truthful or complete. Any representation to the contrary is a criminal offense.
The shares will be ready for delivery on or about , 2016.2017.
| J.P. Morgan | Morgan Stanley |
Cowen and Company | Raymond James | Canaccord Genuity | ||||
The date of this prospectus is , 2016.2017.
Page | ||||
| 1 | ||||
| 50 | ||||
Management’s Discussion and Analysis of Financial Condition and Results of Operations | ||||
| 91 | ||||
Certain Material U.S. Federal Income and Estate Tax Considerations to Non-U.S. Holders | ||||
| F-1 | ||||
We, the selling stockholders and the underwriters have not authorized anyone to provide any information other than that contained in this prospectus or any free writing prospectus prepared by us or on our behalf. We, the selling stockholders and the underwriters are not making an offer to sell these securities in any jurisdiction where the offer or sale is not permitted. The information contained in this prospectus is accurate only as of the date on the front cover of this prospectus regardless of the time of delivery of this prospectus or of any sale of our common stock.
INDUSTRY AND MARKET DATA
This prospectus contains statistical data, estimates and forecasts that are based on independent industry publications, such as those published by the American Wind Energy Association or AWEA,(AWEA), Bloomberg New Energy Finance or BNEF,(BNEF), International Energy Agency or IEA,(IEA), MAKE Consulting or MAKE,(MAKE), Energy Information Administration or EIA,(EIA), Lazard Ltd or Lazard,(Lazard), the International Renewable Energy Agency (IRENA), Wind Energy Foundation (WEF), Global Wind Energy Council (GWEC), or other publicly available information, as well as other information based on our internal sources. Although we believe that the third-party sources referred to in this prospectus are reliable, neither we nor the underwriters have independently verified the information provided by these third parties. While we are not aware of any misstatements regarding any third-party information presented in this prospectus, their estimates, in particular as they relate to projections, involve numerous assumptions, are subject to risks and uncertainties, and are subject to change based on various factors, including those discussed under the section titled “Risk Factors” and elsewhere in this prospectus.
i
This summary highlights information contained elsewhere in this prospectus and does not contain all of the information that you should consider in making your investment decision. Before investing in our common stock, you should carefully read this entire prospectus, including our consolidated financial statements and the related notes included elsewhere in this prospectus. You should consider, among other things, the matters described in “Risk Factors” and “Management’s Discussion and Analysis of Financial Condition and Results of Operations,” in each case included elsewhere in this prospectus. Unless the context otherwise requires, we use the terms “TPI Composites,” “TPI,” “we,” “us” and “our” in this prospectus to refer to TPI Composites, Inc. and its consolidated subsidiaries.
TPI Composites, Inc.
Company Overview
We are the largest U.S.-based independent manufacturer of composite wind blades. We enable many of the industry’s leading wind turbine original equipment manufacturers or OEMs,(OEMs), who have historically relied on in-house production, to outsource the manufacturing of some of their wind blades through our global footprint of advanced manufacturing facilities strategically located to serve large and growing wind markets in a cost-effective manner. Given the importance of wind energy capture, turbine reliability and cost to power producers, the size, quality and performance of wind blades have become highly strategic to our OEM customers. As a result, we have become a key supplier to our OEM customers in the manufacture of wind blades and related precision molding and assembly systems. We have entered into long-term supply agreements pursuant to which we dedicate capacity at our facilities to our customers in exchange for their commitment to purchase minimum annual volumes of wind blade sets, which consist of three wind blades. As of March 31, 2016,April 28, 2017, our long-term supply agreements provide for estimated minimum aggregate volume commitments from our customers of $1.5approximately $2.7 billion and encourage our customers to purchase additional volume up to, in the aggregate, an estimated total contract value of over $3.0approximately $4.2 billion through the end of 2021.2023. This collaborative dedicated supplier model provides us with contracted volumes that generate significant revenue visibility, drive capital efficiency and allow us to produce wind blades at a lower total delivered cost, while ensuring critical dedicated capacity for our customers.
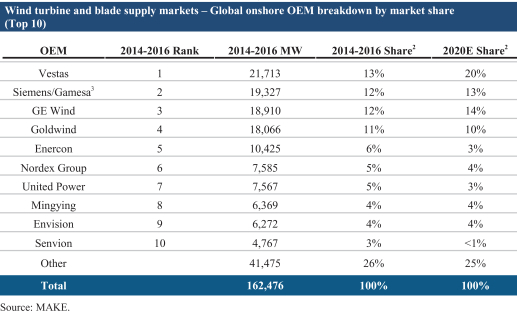
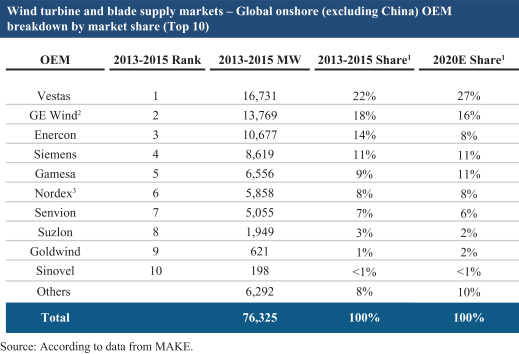
Our OEM customers include General Electric International, Inc. and its affiliates (GE Wind), Vestas Wind Systems A/S (Vestas), Gamesa Wind US LLC (Gamesa)(or Gamesa, which, on April 3, 2017, was merged along with its parent company, Gamesa Corporatión Tecnológica, with Siemens Wind Power) and Nordex SE (or Nordex, which, in April 2016, acquired Acciona Windpower, S.A., or Acciona, (Acciona) for whom we also manufacture wind blades). Prior to 2013, we had one OEM customer that, according to data from MAKE, represented approximately 10% of the global wind energy market based on megawatts or MWs,(MWs) of energy capacity installed. Although we do not supply all of their wind blade volume, according to data from MAKE our OEM customers collectively accounted for approximately 32%42% of the global onshore wind energy market and approximately 56%63% of that market excluding China over the three years ended December 31, 2015,2016, based on MWs of energy capacity installed. The wind power generation industry is experiencing significant growth in countries belonging to the Organization for Economic Cooperation and Development or OECD,(OECD) as well as in emerging growth markets. To meet this growth in demand reliably in a capital-efficient and cost-effective manner, many OEMs are shifting from manufacturing wind blades themselves to the outsourced manufacture of their wind blades. Our collaborative approach, advanced composite technology and global manufacturing footprint have allowed us to capitalize on this trend by replacing or augmenting the in-house capabilities of our customers and efficiently delivering wind blades when and where required. Our facilities in the United States, China, Mexico and Turkey create a geographically-diverse, global production platform to meet our customers’ needs in key large and growing wind markets. We intend to continue expanding in certain existing markets and in new locations that
represent growth opportunities for the wind energy market and our customers. We believe our geographic and customer diversification, together with our long-term
agreements, allow us to take advantage of growth trends and help to insulate us from potential short-term fluctuations or legislative changes in any one market.
Our wind blade and precision molding and assembly systems manufacturing businesses accounted for over 99%, over 99%, 99%, and 97% of our total net sales in the three months ended March 31, 2016 and in the years ended December 31, 2015, 2014 and 2013, respectively. We also leverage our advanced composite technology and the expertise gained from our history of innovation to supply high strength, lightweight and durable composite solutions for the transportation market.
Global Wind Energy Market
The wind power generation industry has grown rapidly and expanded worldwide in recent years to meet high global demand for clean electricity. According to BNEF, from 2000 to 2015,2016, the cumulative global power generating capacity in gigawatts or GWs,(GWs) grew at an average annual rate of 25%24%. Cumulative installed capacity is led by China (approximately 139162 GWs), the United States (approximately 7482 GWs) and Germany (approximately 4550 GWs). In addition, from 2008 to 2015,2016, the cumulative global power generating capacity of wind turbine installations in GWs increased by more than three and a halffour times. WindAccording to GWEC, wind energy is now used in over 8090 countries, 2429 of which have more than 1 GW installed. The rapid growth in the wind power generation industry has been driven by population growth and the associated increase in electricity demand, widespread emphasis on expanded use of renewable energy, the increasing effectiveness and cost-competitiveness of wind energy and accelerated urbanization in developing countries, among other factors. We believe that recent U.S. and global policy initiatives aimed at reducing fossil fuel consumption through the expansion of renewable energy, coupled with corporate commitments to cost-effective environmentally and socially responsible electricity consumption, will drive additional growth. In 2015,2016, U.S. corporate, non-profit and government entities procured an aggregate of 2.41.6 GWs of wind capacity via power purchase agreements, which represents an increaserepresented 39% of 12 times since 2008,the total capacity contracted in 2016 according to BNEF.AWEA. The Paris Agreement achieved at the 21st Conference of Parties or COP21,(COP21) of the United Nations Framework Convention on Climate Change the U.S. Environmental Protection Agency’s, or EPA’s, Clean Power Plan and the long-term extension of the Production Tax Credit for Renewable Energy or PTC,(PTC) are all recent examples of policies that promote the growth of renewable energy. Overall, renewable technologies, including hydroelectric, are projected to increase their share of global electricity generation from 24% in 2015 to 45% by 2040 according to BNEF. Additionally, according to BNEF, onshore wind is expected to experience the largest increase in global market share over the same period, growing from 4% to 13% of the market.

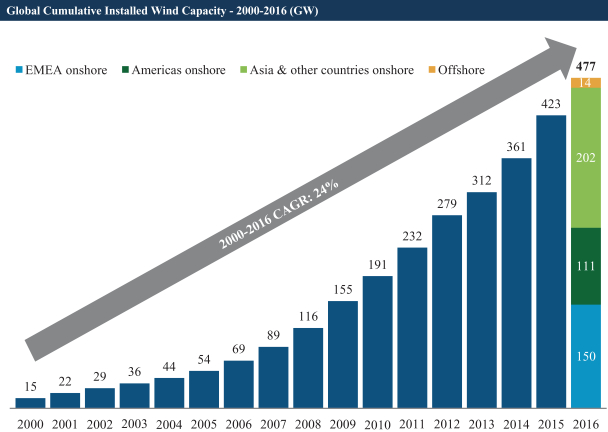
Source: Bloomberg New Energy Finance. Regional onshore and worldwide offshore figures presented for 20152016 only.
In 2015,2016, the wind industry added approximately 6254 GWs of generation capacity. According to BNEF, market diversification increased as a result of demand from newer markets in Asia, Latin America and non-EU Europe, which collectively represented 45.2%approximately 47% of capacity in 2015,2016, as compared to 42.7%approximately 45% in 2014.2015. Although Europe and the United States led early wind development, since 2010, the majority of wind turbines have been installed in non-OECD countries, particularly in Asia and Latin America, where wind generation capacity is growing. For example, cumulative wind generation capacity from 2013 to 20152016 grew by 75.0%approximately 105% to 2.83.3 GWs in Mexico and by 64.1%approximately 115% to 4.55.9 GWs in Turkey, underpinned by strong wind resources, high electricity prices, robust energy demand and key regulatory policies tailored to incentivize usage, among other factors.
Onshore wind LCOE—which reflects the levelized cost of energy per megawatt hour of a generation project over its lifetime—is already on par with new combined cycle gas turbines and substantially below solar photovoltaic, according to Lazard. The advancement of wind turbine technology, including larger rotor diameters and higher hub heights, has increased energy capture, thus reducing LCOE for onshore wind. For a further discussion of LCOE, see “Our Industry—Global Wind Energy Market.” The proliferation of cost-effective wind generation enhances energy resource diversity and mitigates the price volatility associated with fossil fuels, thereby helping to stabilize overall electricity costs in the long term. Wind energy projects do not require any fuel, such as natural gas or coal, during operation, and we believe that they are generally constructed within a substantially shorter period of time relative to conventional generation resources. According to Lazard, the cost of onshore wind has declined by over 61%66% in the last sixseven years. Costs are expected to continue to decline an
additional 15%26% by 20212025 according to MAKEIRENA1, due to progress in reducing the costs of wind turbines, improving capacity factors and lower operating and maintenance costs.
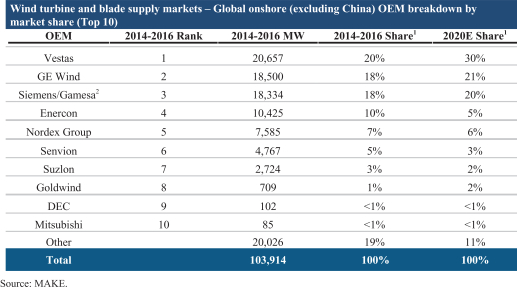
The wind turbine industry, which constitutes our direct customer base, is concentrated among a fewlimited number of established players, with the top ten OEMs accounting for approximately 69%74% of the total global onshore market for the three years ended December 31, 20152016 based on MWs installed, according to data from MAKE. We believe MWs installed is the most widely followed measure of market share in the wind turbine industry and also reflects the OEMs’ demand for wind blades. We currently have long-term supply agreements with four of these top ten OEMs and are developing new relationships with additional OEMs to grow our business. In addition, we expect growth in the industry itself – by the end of 2020, cumulative global installed wind capacity is projected to be over 750727 GWs, with China accounting for approximately 35% of this capacity, according to BNEF. This represents a five-year compounded annual growth rate of approximately 12% for the global wind market including China, and a similar growth rate of approximately 11% for the global wind market excluding China.
1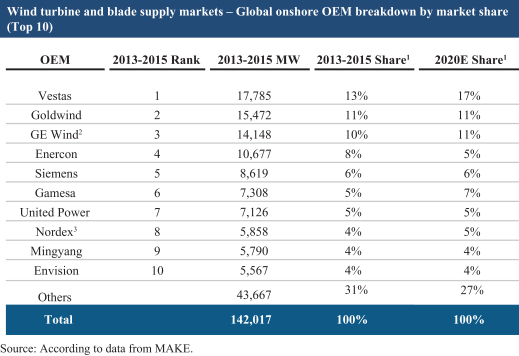
| 1 | © 2016 IRENA,The Power to Change: Solar and Wind Cost Potential to 2025. |
| 2 | Figures are rounded to nearest whole percent. |
| Figures for |
Historically, many wind turbine OEMs manufactured their own wind blades in-house to ensure a high level of quality and dedicated capacity, reflecting the importance of the wind blade supply to turbine production, concerns over protecting their proprietary wind blade designs and the scarcity of independent wind blade suppliers with sufficient manufacturing expertise and capacity. During 2007 and 2008, the U.S. and China markets grew at a rapid pace, which created additional demand in the wind turbine manufacturing supply chain. To balance supply and demand, many leading wind turbine OEMs established a production footprint inhigh-growth regions.
The current globalization of the wind industry presents a new set of challenges and opportunities for wind turbine OEMs. As opposed to establishing a manufacturing presence in each new core growth market, wind turbine OEMs are now focusing on supply chain efficiencies and their core competencies in the design, marketing and sale of wind turbines. In doing so, many wind turbine OEMs are increasingly outsourcing the production of key components, such as wind blades, to select manufacturers to remain competitive, address growth markets and manage global talent constraints. Despite this ongoing trend of outsourcing of wind blade production by wind turbine OEMs, General Electric Company (GE), the parent company of GE Wind, completed its acquisition of LM Wind Power (LM), our largest competitor. We expect that GE Wind will utilize LM for a substantial percentage of its wind blade production in the future.
This outsourcing approach enables wind turbine OEMs to lower their capital costs and shift the production components to manufacturers that possess highly specialized expertise in advanced composite, production and process technology. From a product perspective, wind turbine OEMs have adopted a variety of strategies, including the introduction of new turbine models with improved technology, warranty terms, more stringent performance guarantees, and tailor-made turbines for specific countries or regions. During the past three years, all of the top ten wind turbine suppliers in the world have introduced wind turbines with longer wind blade lengths and taller towers designed to capture more energy at the lower end of the wind speed scale. We believe that installation of wind turbines in regions with lower wind speeds is encouraged due to proximity to energy
| 1 | Figures are rounded to nearest whole percent. |
| 2 | Figures for |
proximity to energy demand centers, thereby reducing the amount of transmission infrastructure required. We expect this trend of expansion to regions not traditionally classified as high wind resource regions to continue, which we believe will help us continue to expand our global footprint.
According to BNEF, the total wind blade industry generated $11.9 billion in revenues in 2014 and is projected to grow to $19.7 billion by 2040. We believe our addressable market will continue to expand, as outsourced wind blade manufacturing is expected to rise from 52% in 2013 to 59% in 2017, according to data from MAKE. As the wind energy market continues to expand globally and wind turbine OEMs continue to shift towards increased outsourcing of wind blade manufacturing, we believe we are well-positioned to continue the expansion of our global footprint.
Competitive Strengths
Our long-term success will be driven by our competitive strengths. The key elements of our competitive strengths are as follows:
| • | Wind industry leader with cost-effective, global footprint. We are the largest U.S.-based independent manufacturer of composite wind blades and have developed a global footprint to serve the growing wind energy market worldwide. We currently have |
| • | Positioned to capitalize on significant growth trends in the wind energy market. We believe that our reputation as a reliable, global wind blade manufacturer and our focus on developing replicable and scalable manufacturing facilities and processes positions us to continue to capture opportunities in large and growing wind energy markets. Our ability to capitalize on recent growth trends in the wind energy market and OEM outsourcing has allowed us to grow our revenue |
| • | Advanced composite technology and production expertise.Our significant expertise in advanced composite technology and production enables us to manufacture lightweight and durable wind blades with near-aerospace grade precision at an industrial cost. We have developed and usehigh-performance composite materials, precision molding and assembly systems, including modular tooling techniques, and advanced process technology, as well as sophisticated measurement, inspection, testing and quality assurance tools, which, as of March 31, 2017, have allowed us to produce |
innovation and a collaborative “design for manufacturability” approach, we continue to address increasing physical |
dimensions and the need for rapid model changes, demanding technical specifications and strict quality control requirements for wind blades, which today are generally 50 to 60 meters or more in length. We also invest in ongoing simplification and selective automation of production processes for increased efficiency and precision. We have partnered with the U.S. Department of Energy, government laboratories, universities and our customers to innovate through cost sharing Advanced Manufacturing Innovation |
| • | Collaborative dedicated supplier model. Our deeply collaborative dedicated supplier model engenders stable, long-term relationships with customers, driving capital efficiency and helping to insulate us from potential short-term fluctuations or legislative changes in any one market. Our collaborative approach to manufacturing wind blades to meet our customers’ unique specifications, coupled with their investment in model-specific tooling in our facilities, promotes significant customer loyalty and creates higher switching costs. Our focused factory model, in which we contractually dedicate production lines to a specific customer in exchange for their commitment to purchase minimum annual volumes, also serves to protect the confidentiality of our customers’ proprietary wind blade and turbine designs. Our ability to manufacture the model-specific tooling for our customers further strengthens our role as a “one stop shop” for our customers, provides an efficient solution to their wind blade supply needs and allows us to produce high-quality wind blades at a lower total delivered cost. We work to continue to drive down the cost of materials and production through innovation and global sourcing, the benefit of which we share with our customers contractually in a manner that reduces LCOE for the customer and improves our margins, further strengthening our deep customer relationships. We manufacture wind blades for four of the largest global wind turbine suppliers: GE Wind, Vestas, Gamesa and |
| • | Long-term supply agreements provide significant revenue visibility.In our collaborative dedicated supplier model, we enter into long-term supply agreements that provide significant incentives for our customers to maximize the volume of wind blades purchased, through increased pricing at lower volumes that contribute to profitability at minimum volume levels. As of |
short-term fluctuations or legislative changes in any one market due in part to the annual minimum purchase commitments of our customers contained in those agreements. These annual minimum purchase commitments generally require our customers to |
purchase a negotiated percentage of the manufacturing capacity that we have agreed to dedicate to them. Generally, this percentage begins at 100% and declines after the first few years pursuant to the terms of the supply agreement, but generally remains above 50%. It is our experience that our customers will generally order wind blades from us in a volume that exceeds |
| • | Compelling |
| • | Experienced management team with a strong track record of delivering growth. Our senior management team has significant experience managing high growth, international operations. Over the course of the past decade, the team has successfully positioned us as the largest independent U.S.-based manufacturer of wind blades and has developed and deepened customer relationships with leading OEMs in the global wind energy market. At the same time, our team has built a global manufacturing network with |
Business Strategy
Our long-term success will also be driven by our competitive strengths and business strategy. The key elements of our business strategy are as follows:
| • | Grow our existing relationships and develop new relationships with leading industry OEMs.We plan to continue growing and expanding our relationships with existing customers who, according to data from MAKE, represented approximately |
Wind and entered into a new supply agreement with |
existing Turkey supply agreement with Nordex and |
| • | Expand our footprint in large and growing wind markets, capitalize on the continuing outsourcing trend and evaluate strategic acquisitions.As the wind energy market continues to expand globally and many wind turbine OEMs continue to shift towards increased outsourcing of wind blade manufacturing, we believe we are well-positioned to continue the expansion of our global footprint. We utilize our strengths in composites technology and manufacturing, combined with our collaborative dedicated supplier model to provide our customers with an efficient solution for their expansion in large and growing wind markets. Our quality, reliability and total delivered cost reduce sourcing risk for our customers. In addition, our demonstrated ability to expand into new markets and the strength of our manufacturing capabilities afford us the optionality either to build new factories or grow through strategic acquisitions. |
| • | Focus on continuing innovation.We have a history of innovation in advanced composite technologies and production techniques and use several proprietary technologies related to wind blade manufacturing. With this culture of innovation and a collaborative “design for manufacturability” approach, we continue to address increasing physical dimensions, demanding technical specifications and strict quality control requirements for our customers’ most advanced wind blades. We also invest in ongoing simplification and selective automation of production processes for increased efficiency and precision. In addition, we plan to leverage our history of composite industry-first innovations to grow our business in the transportation market, in which we believe there is a demand for high precision, structural composites manufacturing. |
| • | Continue to drive down costs of wind |
Recent Developments
Set forth below are selected preliminary estimated unaudited financial results as of and for the three months ended June 30, 2016. These financial results are unaudited and shouldIn April 2017, we entered into a multiyear supply agreement with Vestas to supply wind blades from two manufacturing lines at a new manufacturing facility that will be considered preliminary and subjectconstructed in Matamoros, Mexico. We also granted Vestas an option to change. We have provided ranges, rather than specific amounts, for the preliminary results described below as our final results remain subjectadd additional manufacturing lines to the completionscope of our closing procedures, final adjustments, developmentsthe supply agreement. We expect that may arise between nowthe manufacturing facility will open for production in the first half of 2018 and that the time the financial results are finalized,wind blades produced at this manufacturing facility will primarily serve wind markets in Mexico, Central America and management’s andSouth America.
the audit committee’s final reviews. Accordingly, you should not place undue reliance on this preliminary data, which may differ materially from our final results. Please see “Risk Factors,” “Special Note Regarding Forward-Looking Statements” and “Management’s Discussion and Analysis of Financial Condition and Results of Operations” for a discussion of certain factors that could result in differences between the preliminary financial data reported below and the final results. These preliminary estimates should not be viewed as a substitute for our full unaudited condensed consolidated financial statements prepared in accordance with accounting principles generally accepted in the United States. In addition, they are not necessarily indicative of the results to be achieved in any future period.
These estimates have been prepared by and are the responsibility of management. Our independent registered public accounting firm has not audited, compiled, performed any procedures on or reviewed the preliminary financial data, and accordingly does not express an opinion or any other form of assurance with respect to the preliminary financial data.
The following are the selected preliminary estimated unaudited financial results as of and for the three months ended June 30, 2016, as well as a comparison to our unaudited financial results as of and for the three months ended June 30, 2015:
| Three months ended June 30, 2015 | Three months ended June 30, 2016 | |||||||||||||
| Actual | Low End of Range | High End of Range | ||||||||||||
| (in thousands) | ||||||||||||||
Other Financial Information: | ||||||||||||||
Net sales | $ | 149,739 | $ | 193,500 | to | $ | 194,500 | |||||||
Total billings(1) | $ | 139,601 | $ | 195,000 | to | $ | 196,600 | |||||||
Gross profit | $ | 12,150 | $ | 22,000 | to | $ | 23,000 | |||||||
Net income | $ | 4,090 | $ | 11,000 | to | $ | 12,000 | |||||||
EBITDA(1) | $ | 11,868 | $ | 19,900 | to | $ | 21,250 | |||||||
Adjusted EBITDA(1) | $ | 12,301 | $ | 19,900 | to | $ | 21,350 | |||||||
| Three months ended June 30, | ||||||||||||||
| 2015 | 2016 | |||||||||||||
Other Operating Information: | ||||||||||||||
Sets(2) | 346 | 551 | ||||||||||||
Estimated megawatts(3) | 772 | 1,252 | ||||||||||||
Total manufacturing line capacity(4) | 30 | 32 | ||||||||||||
Dedicated manufacturing lines(5) | 29 | 38 | ||||||||||||
Manufacturing lines in startup(6) | 7 | 0 | ||||||||||||
Manufacturing lines in transition(7) | 10 | 3 | ||||||||||||
For the three months ended June 30, 2016, we expect to report net sales of between $193.5 million and $194.5 million and total billings of between $195.0 million and $196.6 million. This compares to net sales and total billings of $149.7 million and $139.6 million, respectively, for the three months ended June 30, 2015. The increase is primarily due to an increase in wind blade sets produced across all of our plants.
We expect to report net income of between $11.0 million and $12.0 million for the three months ended June 30, 2016, as compared to net income of $4.1 million for the three months ended June 30, 2015. The increase is due to the increased net sales above as well as improved operating efficiency.
For the three months ended June 30, 2016, we expect to report EBITDA of between $19.9 million and $21.3 million and adjusted EBITDA of between $19.9 million and $21.4 million. This compares to EBITDA of $11.9 million and adjusted EBITDA of $12.3 million for the three months ended June 30, 2015. The increase is due to the factors described above.
We expect to report cash and cash equivalents as of June 30, 2016 of approximately $31.3 million and an aggregate principal amount of total indebtedness as of June 30, 2016 of approximately $124.0 million. During the three months ended June 30, 2016, we repaid approximately $7.2 million of outstanding long-term indebtedness.
The following table presents reconciliations of estimated total billings to our preliminary estimated low end and high end ranges for our estimated net sales as well as estimated EBITDA and adjusted EBITDA to our preliminary estimated low end and high end ranges for our estimated net income, each for the three months ended June 30, 2016. See Management’s Discussion and Analysis of Financial Condition and Results of Operations” for a reconciliation of total billings to net sales and EBITDA and adjusted EBITDA to net income for the prior periods.
| Three months ended June 30, 2015 | Three months ended June 30, 2016 | |||||||||||||||
| Actual | Low End of Range | High End of Range | ||||||||||||||
(in thousands) | ||||||||||||||||
Net sales | $ | 149,739 | $ | 193,500 | to | $ | 194,500 | |||||||||
|
|
|
|
|
| |||||||||||
Change in deferred revenue: | ||||||||||||||||
Blade-related deferred revenue at beginning of period | (76,534 | ) | (65,000 | ) | to | (65,000 | ) | |||||||||
Blade-related deferred revenue at end of period | 68,226 | 66,000 | to | 66,100 | ||||||||||||
Foreign exchange impact(1) | (1,830 | ) | 500 | to | 1,000 | |||||||||||
|
|
|
|
|
| |||||||||||
Change in deferred revenue | (10,138 | ) | 1,500 | to | 2,100 | |||||||||||
|
|
|
|
|
| |||||||||||
Total billings | $ | 139,601 | $ | 195,000 | to | $ | 196,600 | |||||||||
|
|
|
|
|
| |||||||||||
Net income | $ | 4,090 | $ | 11,000 | to | $ | 12,000 | |||||||||
Adjustments: | ||||||||||||||||
Depreciation and amortization | 2,910 | 3,100 | to | 3,200 | ||||||||||||
Interest expense (net of interest income) | 3,644 | 4,100 | to | 4,150 | ||||||||||||
Income tax provision | 1,224 | 1,700 | to | 1,900 | ||||||||||||
|
|
|
|
|
| |||||||||||
EBITDA | 11,868 | 19,900 | to | 21,250 | ||||||||||||
Realized loss on foreign currency remeasurement | 433 | — | to | 100 | ||||||||||||
|
|
|
|
|
| |||||||||||
Adjusted EBITDA | $ | 12,301 | $ | 19,900 | to | $ | 21,350 | |||||||||
|
|
|
|
|
| |||||||||||
Risks Related to Our Business
Our business is subject to many risks and uncertainties of which you should be aware before you decide to invest in our common stock. These risks are discussed more fully under “Risk Factors” in this prospectus. Some of these risks include, but are not limited to, the following:
We have experienced and could in the future experience quality or operational issues in connection with plant construction or expansion, wind blade model transition and wind blade manufacturing,
which could result in losses and cause delays in our ability to complete our projects and may therefore materially harm our business, financial condition and results of operations.
|
Implications of Being an Emerging Growth Company
We qualify as an “emerging growth company” as defined in the Jumpstart Our Business Startups Act of 2012 or the(the JOBS Act.Act). As an emerging growth company, we may take advantage of specified reduced disclosure and other requirements that are otherwise applicable generally to public companies. These provisions include:
We may take advantage of these exemptions for up to five years or such earlier time that we are no longer an emerging growth company. We would cease to be an emerging growth company on the date that is the earliest of (i) the last day of the fiscal year in which we have total annual gross revenues of $1.0$1.07 billion or more; (ii) the last day of our fiscal year following the fifth anniversary of the date of the completion of this offering;our initial public offering (IPO); (iii) the date on which we have issued more than $1.0 billion in nonconvertible debt during the previous three years; or (iv) the date on which we are deemed to be a large accelerated filer under the rules of the Securities and Exchange Commission or the SEC.(SEC). We may choose to take advantage of some but not all of these exemptions. We have taken advantage of reduced reporting requirements in this prospectus. Accordingly, the information contained herein may be different from the information you receive from other public companies in which you hold stock. We have irrevocably elected to “opt out” of the exemption for the delayed adoption of certain accounting standards and, therefore, will be subject to the same new or revised accounting standards as other public companies that are not emerging growth companies.
Company and Other Information
We were founded in 1968 and have been providing composite wind blades for 15 years.since 2001. Our knowledge and experience of composite materials and manufacturing originates with our predecessor company, Tillotson Pearson Inc., a leading manufacturer of high-performance sail and powerboats along with a wide range of composite structures used in other industrial applications. Following the separation from our boat building business in 2004, we reorganized in Delaware as LCSI Holding, Inc. Weand then changed our corporate name to TPI Composites, Inc. in 2008. Today, we are headquartered in Scottsdale, Arizona, and we have expanded our global footprint to include domestic facilities in Newton, Iowa; Fall River, Massachusetts; Warren, Rhode Island; and Santa Teresa, New Mexico and international facilities in Dafeng, China; Taicang Port, China; Taicang City, China; Juarez,Juárez, Mexico; and Izmir, Turkey. Together, as of June 30, 2016,March 31, 2017, we have approximately 3.5 million square feet of manufacturing space and over 6,000nearly 8,000 employees, including materials and process engineers, manufacturing process engineers, quality assurance personnel and production workers.
Our wind blade and precision molding and assembly systems manufacturing businesses accounted for over 99% of our total net sales for the three months ended March 31, 2017 and for each of the years ended December 31, 2016, 2015 and 2014. We also leverage our advanced composite technology and history of innovation to supply high strength, lightweight and durable composite products to the transportation market. For a further discussion regarding our wind blade and precision molding and assembly system businesses, refer to the discussion in “Management’s Discussion and Analysis of Financial Condition and Results of Operations—Results of Operations” included elsewhere in this prospectus.
In July 2016, we completed an initial public offering of 7,187,500 shares of our common stock at a price of $11.00 per share, which included 937,500 shares issued pursuant to the underwriters’ exercise of their option to purchase additional shares. Certain of our existing shareholders, a non-employee director and executive officers purchased an aggregate of 1,250,000 shares of common stock in the IPO included in the total issuance above. The net proceeds from the IPO were $67.2 million after deducting underwriting discounts and offering expenses. Immediately prior to the closing of the IPO, all shares of the then-outstanding redeemable preferred shares converted into an aggregate of 21,110,204 shares of common stock and the redeemable preferred share
warrants converted on a net issuance basis into 120,923 shares of common stock. In addition, concurrent with the closing of the IPO, certain subordinated convertible promissory notes in the aggregate principal and interest amount of $11.9 million were converted into 1,079,749 shares of common stock at the public offering price of $11.00 per share.
Prior to the IPO, in July 2016 we amended our amended and restated certificate of incorporation to effect a 360-for-1 forward stock split of our common stock. As a result of the stock split, we have adjusted the share amounts authorized and issuable under our share-based compensation plans. All share and per share common stock information (including those related to our share-based compensation plans) referenced throughout the consolidated financial statements and notes thereto have been retroactively adjusted to reflect this stock split. The stock split did not cause an adjustment to the par value of the authorized shares of common stock.
Our principal executive offices are located at 8501 North Scottsdale Road, Gainey Center II, Suite 100, Scottsdale, Arizona 85253 and our telephone number is (480) 305-8910. Our website address iswww.tpicomposites.com. The information contained on our website or that can be accessed through our website is not part of this prospectus, and investors should not rely on any such information in deciding whether to purchase our common stock.
This prospectus contains references to our trademarks. This prospectus contains additional trade names, trademarks and service marks of other companies. Those other trade names, trademarks and service marks are the property of their respective owners. We do not intend our use or display of other companies’ trade names, trademarks or service marks to imply a relationship with, or endorsement or sponsorship of us by, these other companies. Solely for convenience, the trademarks and trade names in this prospectus are referred to without the® and ™ symbols, but such references should not be construed as any indicator that their respective owners will not assert, to the fullest extent under applicable law, their rights thereto.
THE OFFERING
Common stock offered by |
Common stock to be outstanding immediately after this offering |
Option to purchase additional shares from |
Use of proceeds |
| offering. We |
Concentration of Ownership | Upon the completion of this offering, our executive officers and directors and stockholders holding more than 5% of our capital stock, and their affiliates, will beneficially own, in the aggregate, approximately |
Dividend Policy | We currently intend to retain earnings, if any, to finance the development and growth of our business and do not anticipate paying cash dividends on the common stock in the future. |
|
Risk factors | You should read “Risk Factors” beginning on page |
The number of shares of common stock to be outstanding after this offering is based on 25,531,26333,736,863 shares of common stock outstanding as of March 31, 20162017 and excludes:
Except as otherwise indicated, all information in this prospectus:
SUMMARY CONSOLIDATED FINANCIAL AND OTHER DATA
We have derived the summary consolidated statements of operations data for the three months ended March 31, 20162017 and 20152016 and the consolidated balance sheet data as of March 31, 20162017 from our unaudited interim condensed consolidated financial statements included elsewhere in this prospectus. The unaudited interim condensed consolidated financial statements were prepared on a basis consistent with our audited financial statements and include, in the opinion of management, all adjustments, consisting only of a normal recurring nature, that are necessary for a fair presentation of the financial information set forth in those statements. We have derived the summary consolidated statements of operations data for the years ended December 31, 2016, 2015 and 2014 and 2013the summary consolidated balance sheet data as of December 31, 2016 from our audited consolidated financial statements included elsewhere in this prospectus. Our historical results are not necessarily indicative of the results that may be expected in the future and the results in the three months ended March 31, 2016 are not necessarily indicative of the results that may be expected for the full year or any other period.future. The following summary consolidated financial and other data should be read in conjunction with “Management’s Discussion and Analysis of Financial Condition and Results of Operations” and our consolidated financial statements and related notes included elsewhere in this prospectus.
Three Months Ended | Year Ended December 31, | |||||||||||||||||||||||||||||||||||||||
Three Months Ended | Year Ended December 31, | 2017 | 2016 | 2016 | 2015 | 2014 | ||||||||||||||||||||||||||||||||||
2016 | 2015 | 2015 | 2014 | 2013 | (unaudited) | |||||||||||||||||||||||||||||||||||
| (in thousands, except per share data) | (in thousands, except per share data) | |||||||||||||||||||||||||||||||||||||||
Consolidated Statements of Operations Data: | ||||||||||||||||||||||||||||||||||||||||
Net sales | $ | 176,110 | $ | 95,589 | $ | 585,852 | $ | 320,747 | $ | 215,054 | $ | 191,602 | $ | 176,110 | $ | 754,877 | $ | 585,852 | $ | 320,747 | ||||||||||||||||||||
|
|
|
|
|
|
|
|
|
| |||||||||||||||||||||||||||||||
Cost of sales | 159,866 | 90,884 | 528,247 | 289,528 | 200,182 | 167,423 | 159,866 | 659,745 | 528,247 | 289,528 | ||||||||||||||||||||||||||||||
Startup and transition costs | 3,306 | 4,154 | 15,860 | 16,567 | 6,607 | 6,159 | 3,306 | 18,127 | 15,860 | 16,567 | ||||||||||||||||||||||||||||||
|
|
|
|
|
|
|
|
|
| |||||||||||||||||||||||||||||||
Total cost of goods sold | 163,172 | 95,038 | 544,107 | 306,095 | 206,789 | 173,582 | 163,172 | 677,872 | 544,107 | 306,095 | ||||||||||||||||||||||||||||||
|
|
|
|
|
|
|
|
|
| |||||||||||||||||||||||||||||||
Gross profit | 12,938 | 551 | 41,745 | 14,652 | 8,265 | 18,020 | 12,938 | 77,005 | 41,745 | 14,652 | ||||||||||||||||||||||||||||||
General and administrative expenses | 4,749 | 3,208 | 14,126 | 9,175 | 7,566 | 8,306 | 4,749 | 33,892 | 14,126 | 9,175 | ||||||||||||||||||||||||||||||
|
|
|
|
|
|
|
|
|
| |||||||||||||||||||||||||||||||
Income (loss) from operations | 8,189 | (2,657 | ) | 27,619 | 5,477 | 699 | ||||||||||||||||||||||||||||||||||
Income from operations | 9,714 | 8,189 | 43,113 | 27,619 | 5,477 | |||||||||||||||||||||||||||||||||||
|
|
|
|
|
|
|
|
|
| |||||||||||||||||||||||||||||||
Other income (expense): | ||||||||||||||||||||||||||||||||||||||||
Interest income | 21 | 59 | 161 | 186 | 155 | 19 | 21 | 344 | 161 | 186 | ||||||||||||||||||||||||||||||
Interest expense | (3,912 | ) | (3,551 | ) | (14,565 | ) | (7,236 | ) | (3,474 | ) | (3,026 | ) | (3,912 | ) | (17,614 | ) | (14,565 | ) | (7,236 | ) | ||||||||||||||||||||
Loss on extinguishment of debt | — | — | — | (2,946 | ) | — | — | — | (4,487 | ) | — | (2,946 | ) | |||||||||||||||||||||||||||
Realized gain (loss) on foreign currency remeasurement | (439 | ) | 163 | (1,802 | ) | (1,743 | ) | (1,892 | ) | |||||||||||||||||||||||||||||||
Realized loss on foreign currency remeasurement | (1,381 | ) | (439 | ) | (757 | ) | (1,802 | ) | (1,743 | ) | ||||||||||||||||||||||||||||||
Miscellaneous income | 190 | 129 | 246 | 539 | 140 | 320 | 190 | 238 | 246 | 539 | ||||||||||||||||||||||||||||||
|
|
|
|
|
|
|
|
|
| |||||||||||||||||||||||||||||||
Total other expense | (4,140 | ) | (3,200 | ) | (15,960 | ) | (11,200 | ) | (5,071 | ) | (4,068 | ) | (4,140 | ) | (22,276 | ) | (15,960 | ) | (11,200 | ) | ||||||||||||||||||||
|
|
|
|
|
|
|
|
|
| |||||||||||||||||||||||||||||||
Income (loss) before income taxes | 4,049 | (5,857 | ) | 11,659 | (5,723 | ) | (4,372 | ) | 5,646 | 4,049 | 20,837 | 11,659 | (5,723 | ) | ||||||||||||||||||||||||||
Income tax benefit (provision) | (2,303 | ) | 120 | (3,977 | ) | (925 | ) | 3,346 | ||||||||||||||||||||||||||||||||
|
|
|
|
| ||||||||||||||||||||||||||||||||||||
Net income (loss) before noncontrolling interest | 1,746 | (5,737 | ) | 7,682 | (6,648 | ) | (1,026 | ) | ||||||||||||||||||||||||||||||||
Net loss attributable to noncontrolling interest(1) | — | — | — | — | 2,305 | |||||||||||||||||||||||||||||||||||
Income tax provision | (2,101 | ) | (2,303 | ) | (6,995 | ) | (3,977 | ) | (925 | ) | ||||||||||||||||||||||||||||||
|
|
|
|
|
|
|
|
|
| |||||||||||||||||||||||||||||||
Net income (loss) | 1,746 | (5,737 | ) | 7,682 | (6,648 | ) | 1,279 | 3,545 | 1,746 | 13,842 | 7,682 | (6,648 | ) | |||||||||||||||||||||||||||
Net income attributable to preferred shareholders(2) | 2,437 | 2,356 | 9,423 | 13,930 | 14,149 | |||||||||||||||||||||||||||||||||||
Net income attributable to preferred shareholders(1) | — | 2,437 | 5,471 | 9,423 | 13,930 | |||||||||||||||||||||||||||||||||||
|
|
|
|
|
|
|
|
|
| |||||||||||||||||||||||||||||||
Net loss attributable to common shareholders | $ | (691 | ) | $ | (8,093 | ) | $ | (1,741 | ) | $ | (20,578 | ) | $ | (12,870 | ) | |||||||||||||||||||||||||
Net income (loss) attributable to common shareholders | $ | 3,545 | $ | (691 | ) | $ | 8,371 | $ | (1,741 | ) | $ | (20,578 | ) | |||||||||||||||||||||||||||
|
|
|
|
|
|
|
|
|
| |||||||||||||||||||||||||||||||
Weighted-average common shares outstanding, basic and diluted(3) | 4,238 | 4,238 | 4,238 | 4,238 | 4,238 | |||||||||||||||||||||||||||||||||||
|
|
|
|
| ||||||||||||||||||||||||||||||||||||
Net loss per common share, basic and diluted(3) | $ | (0.16 | ) | $ | (1.91 | ) | $ | (0.41 | ) | $ | (4.86 | ) | $ | (3.04 | ) | |||||||||||||||||||||||||
|
|
|
|
| ||||||||||||||||||||||||||||||||||||
Pro forma net income attributable to common shareholders | $ | 1,746 | $ | 7,682 | ||||||||||||||||||||||||||||||||||||
|
| |||||||||||||||||||||||||||||||||||||||
Pro forma weighted-average common shares outstanding (unaudited) | ||||||||||||||||||||||||||||||||||||||||
Basic(3) | 25,531 | 25,531 | ||||||||||||||||||||||||||||||||||||||
|
| |||||||||||||||||||||||||||||||||||||||
Diluted(3) | 25,553 | 25,553 | ||||||||||||||||||||||||||||||||||||||
|
| |||||||||||||||||||||||||||||||||||||||
Pro forma net income per common share (unaudited) | ||||||||||||||||||||||||||||||||||||||||
Weighted-average common shares outstanding: | ||||||||||||||||||||||||||||||||||||||||
Basic(2) | 33,737 | 4,238 | 17,530 | 4,238 | 4,238 | |||||||||||||||||||||||||||||||||||
Diluted(2) | 33,827 | 4,238 | 17,616 | 4,238 | 4,238 | |||||||||||||||||||||||||||||||||||
Net income (loss) per common share: | ||||||||||||||||||||||||||||||||||||||||
Basic | $ | 0.07 | $ | 0.30 | $ | 0.11 | $ | (0.16 | ) | $ | 0.48 | $ | (0.41 | ) | $ | (4.86 | ) | |||||||||||||||||||||||
|
| |||||||||||||||||||||||||||||||||||||||
Diluted | $ | 0.07 | $ | 0.30 | $ | 0.10 | $ | (0.16 | ) | $ | 0.48 | $ | (0.41 | ) | $ | (4.86 | ) | |||||||||||||||||||||||
|
| |||||||||||||||||||||||||||||||||||||||
Three Months Ended | Year Ended December 31, | |||||||||||||||||||
2016 | 2015 | 2015 | 2014 | 2013 | ||||||||||||||||
| (in thousands, except other operating information) | ||||||||||||||||||||
Other Financial Information: | ||||||||||||||||||||
Total billings(4) | $ | 174,538 | $ | 117,090 | $ | 600,107 | $ | 362,749 | $ | 221,057 | ||||||||||
EBITDA(4) | $ | 10,951 | $ | 36 | $ | 37,479 | $ | 8,768 | $ | 6,502 | ||||||||||
Adjusted EBITDA(4) | $ | 11,390 | $ | (127 | ) | $ | 39,281 | $ | 13,457 | $ | 8,430 | |||||||||
Capital expenditures | $ | 10,888 | $ | 10,605 | $ | 26,361 | $ | 18,924 | $ | 7,065 | ||||||||||
Total debt, net of debt issuance costs and discount | $ | 131,163 | $ | 115,287 | $ | 129,346 | $ | 120,849 | $ | 36,562 | ||||||||||
Net debt(4) | $ | 101,392 | $ | 98,070 | $ | 90,667 | $ | 87,547 | $ | 26,590 | ||||||||||
Other Operating Information: | ||||||||||||||||||||
Sets(5) | 486 | 303 | | 1,609 | | 966 | 648 | |||||||||||||
Estimated megawatts(6) | 1,113 | 645 | 3,595 | 2,029 | 1,173 | |||||||||||||||
Total manufacturing line capacity(7) | 32 | 30 | 32 | 30 | 16 | |||||||||||||||
Dedicated manufacturing lines(8) | 38 | 29 | 34 | 29 | 16 | |||||||||||||||
Manufacturing lines in startup(9) | 0 | 8 | 10 | 9 | 2 | |||||||||||||||
Manufacturing lines in transition(10) | 3 | 4 | 11 | 8 | 2 | |||||||||||||||
Three Months Ended | Year Ended December 31, | |||||||||||||||||||
2017 | 2016 | 2016 | 2015 | 2014 | ||||||||||||||||
| (unaudited) | ||||||||||||||||||||
| (in thousands, except other operating information) | ||||||||||||||||||||
Other Financial Information: | ||||||||||||||||||||
Total billings(3) | $ | 211,360 | $ | 174,538 | $ | 764,424 | $ | 600,107 | $ | 362,749 | ||||||||||
EBITDA(3) | $ | 12,482 | $ | 10,951 | $ | 55,491 | $ | 37,479 | $ | 11,714 | ||||||||||
Adjusted EBITDA(3) | $ | 15,570 | $ | 11,390 | $ | 66,150 | $ | 39,281 | $ | 13,457 | ||||||||||
Capital expenditures | $ | 16,922 | $ | 10,888 | $ | 30,507 | $ | 26,361 | $ | 18,924 | ||||||||||
Total debt, net of debt issuance costs and discount | $ | 120,489 | $ | 131,163 | $ | 123,155 | $ | 129,346 | $ | 120,849 | ||||||||||
Net debt(3) | $ | 7,095 | $ | 101,392 | $ | 6,379 | $ | 90,667 | $ | 87,547 | ||||||||||
Other Operating Information: | ||||||||||||||||||||
Sets(4) | 636 | 486 | 2,154 | 1,609 | 966 | |||||||||||||||
Estimated megawatts(5) | 1,460 | 1,113 | 4,920 | 3,595 | 2,029 | |||||||||||||||
Dedicated manufacturing lines(6) | 44 | 38 | 44 | 34 | 29 | |||||||||||||||
Total manufacturing lines installed(7) | 39 | 32 | 33 | 30 | 22 | |||||||||||||||
Manufacturing lines in startup(8) | 9 | — | 3 | 10 | 9 | |||||||||||||||
Manufacturing lines in transition(9) | — | 3 | 3 | 11 | 8 | |||||||||||||||
| (1) |
| Represents the annual accrual of dividends on our convertible and senior redeemable preferred shares, the accretion to redemption amounts on our convertible preferred shares and warrant fair value adjustments. Immediately prior to the closing of the IPO, all preferred shares were converted into shares of our common stock and as a result, the accrual of dividends ceased. |
| For the |
| See “Non-GAAP Financial Measures” below for more information. |
| Number of wind blade sets (which consist of three wind blades) invoiced |
| Estimated megawatts of energy capacity to be generated by wind blade sets invoiced in the period. See “Management’s Discussion and Analysis of Financial Condition and Results of Operations—Key Metrics Used By Management to Measure Performance” for more information. |
| Number of manufacturing lines |
| Number of manufacturing lines installed and either in |
| Number of manufacturing lines in a startup phase during the pre-production and production ramp-up periods. See “Management’s Discussion and Analysis of Financial Condition and Results of Operations—Key Metrics Used By Management to Measure Performance” for more information. |
| (9) | Number of manufacturing lines that were being transitioned to a new wind blade model during the period. See “Management’s Discussion and Analysis of Financial Condition and Results of Operations—Key Metrics Used By Management to Measure Performance” for more information. |
As of | ||||||||||||
Actual | Pro Forma(1) | Pro Forma As Adjusted(2)(3) | ||||||||||
| (in thousands) | ||||||||||||
Consolidated Balance Sheet Data | ||||||||||||
Cash and cash equivalents | $ | 35,842 | $ | 35,842 | $ | 125,222 | ||||||
Total assets | 358,462 | 358,462 | 447,842 | |||||||||
Total debt, net of debt issuance costs and discount | 131,163 | 131,163 | 123,188 | |||||||||
Total liabilities | 348,640 | 348,640 | 337,165 | |||||||||
Total convertible and senior redeemable preferred shares and warrants | 201,282 | — | — | |||||||||
Total shareholders’ equity (deficit) | (191,460 | ) | 9,822 | 110,677 | ||||||||
| March 31, 2017 | ||||
(unaudited) | ||||
| (in thousands) | ||||
Consolidated Balance Sheet Data | ||||
Cash and cash equivalents | $ | 115,541 | ||
Total assets | 477,941 | |||
Total debt, net of debt issuance costs and discount | 120,489 | |||
Total liabilities | 365,875 | |||
Total shareholders’ equity | 112,066 | |||
Non-GAAP Financial Measures
In addition to providing results that are determined in accordance with GAAP, we have provided certain financial measures that are not in accordance with GAAP. Total billings, EBITDA, adjusted EBITDA and net debt are non-GAAP financial measures. We define total billings as the total amounts we have invoiced our customers for products and services for which we are entitled to payment under the terms of our long-term supply agreements or other contractual agreements. Under GAAP, we do not recognize revenue on our wind blade sales until the wind bladesthey have been delivered to our customers. In many cases, customers request us to store their wind blades for a
period of time after we have invoiced them. The revenues associated with these transactions are deferred and recognized upon delivery but we are contractually entitled to payment for those wind blades and, accordingly, invoice them when the blades are placed in storage.
We define EBITDA as net income (loss) attributable to the Company plus interest expense (net(including losses on the extinguishment of debt and net of interest income), income taxes and depreciation and amortization.
We define adjusted EBITDA as EBITDA plus any share-based compensation expense, plus or minus any realized gains or losses from foreign currency remeasurement plus any loss on extinguishment of debt. EBITDA and adjusted EBITDA are calculated differently from EBITDA as used in our Credit Facility (as defined below).remeasurement.
We define net debt as the total principal amount of debt outstanding less unrestricted cash and cash equivalents. The total principal amount of debt outstanding is comprised of the long-term debt and current maturities of long-term debt as presented in our consolidated balance sheets adjusting for any debt issuance costs and discount.
Our use of total billings, EBITDA, adjusted EBITDA and net debt have limitations, and you should not consider total billings, EBITDA, adjusted EBITDA or net debt in isolation from or as a substitute for measures such as net sales, net income (loss) or total debt, net of debt issuance costs and discount reported under GAAP. See the “Management’s Discussion and Analysis of Financial Condition and Results of Operations—Key Metrics Used by Management to Measure Performance” for the related reconciliations of total billings, EBITDA, adjusted EBITDA and net debt.
An investment in our common stock involves a high degree of risk. You should consider carefully the following risks and other information contained in this prospectus, including our consolidated financial statements and related notes, before you decide whether to buy our common stock. If any of the events contemplated by the following discussion of risks should occur, our business, results of operations, financial condition and growth prospects could suffer significantly. As a result, the market price of our common stock could decline, and you may lose all or part of the money you paid to buy our common stock. The risks below are not the only ones we face. Additional risks that we currently do not know about or that we currently believe to be immaterial may also impair our business. Certain statements below are forward-looking statements. See “Special Note Regarding Forward-Looking Statements” in this prospectus.
Risks Related to Our Wind Blade Business
GE’s acquisition of LM Wind Power, our largest competitor, may materially harm our business, financial condition and results of operations and may cause the price of our common stock to decline.
In April 2017, GE completed its acquisition of LM Wind Power, our largest competitor. We currently have entered into five supply agreements with GE Wind providing for the supply of wind blades from our Iowa facility; two Juárez, Mexico facilities; our original Turkey facility; and our Taicang Port, China facility. In October 2016, we entered into (i) an amended and restated supply agreement for the continued supply of wind blades from our Iowa facility through December 31, 2020, (ii) an amendment to our existing supply agreement for the continued supply of wind blades from our original Juárez, Mexico facility through December 31, 2020 and (iii) a new supply agreement with GE Wind for the supply of incremental wind blades from our second manufacturing facility in Juárez, Mexico through December 31, 2020. Although we recently extended and expanded certain of our supply agreements, GE Wind may decide to utilize LM for more of its wind blade production as a result of the acquisition of LM. As such, GE Wind may not continue to purchase wind blades from us at similar volumes or on as favorable terms in the future. In addition, our current supply agreements with GE Wind for the supply of wind blades from our Turkey and Taicang, China facilities expire on December 31, 2017. In March 2017, the Company announced that it does not intend to renew the Turkey supply agreement with GE Wind, and GE Wind or the Company may elect not to renew the China supply agreement. GE Wind also may elect to terminate our Iowa supply agreement at the end of 2018 or 2019 by providing us with 12 months’ advance notice and paying us a specified termination fee. GE Wind may also elect to terminate our two Mexico supply agreements with 15 days’ notice and pay us a termination fee. If GE Wind elects to utilize LM for more of its wind blade production, reduce the volumes of wind blades it purchases from us or terminates any of our supply agreements, it may materially harm our business, financial condition and results of operations.
In addition, GE Ventures Limited (GE Ventures), a GE affiliated company, owns 8.4% of our outstanding common stock as of March 31, 2017. GE Ventures’ lock-up agreement with our IPO underwriters expired on January 17, 2017 and as a result of GE’s recent acquisition of LM, GE Ventures may be more inclined to sell all or a portion of its shares of our common stock. If GE Ventures sells all or a portion of its holdings of our common stock pursuant to Rule 144 or otherwise, it may cause the price of our common stock to decline.
The results of the 2016 United States presidential and congressional elections has created regulatory uncertainty for our business and the wind energy sector and may materially harm our business, financial condition and results of operations.
U.S. President Trump, certain members of the U.S. Congress, and key U.S. administrative officials and policy makers have suggested renegotiation of The North American Free Trade Agreement and the implementation of tariffs, duties, border taxes or other similar assessments that could impact the level of trade between the U.S. and Mexico. President Trump also has publicly stated that he may seek to impose tariffs, duties,
border taxes or other similar assessments on products imported from China. A substantial amount of the wind blades that we manufacture in our Mexico and China facilities are imported into the United States. If any such tariffs, duties, border taxes or other assessments are imposed on our wind blades that are imported into the United States, it would increase the total cost of our wind blades and may decrease demand for our wind blades. In addition, we may not be able to fully pass on the added cost of such tariffs, taxes, duties or assessments to our customers and may materially harm our business, financial condition and results of operations.
President Trump also has made comments during his presidency and the presidential campaign suggesting that he is not supportive of various clean energy programs and initiatives designed to curtail global warming. In March 2017, President Trump signed an executive order that requires, among other things, that the EPA withdraw the Clean Power Plan and draft new regulations to replace it. It remains unclear what impact, if any, this executive order will have on the demand for wind energy domestically and internationally. In addition, it remains unclear what specifically President Trump would or would not do with respect to these programs and initiatives, and what support he would have for any potential changes to such legislative programs and initiatives in the Unites States Congress, even though both the House of Representatives and Senate are controlled by the Republican Party. If President Trump and/or the United States Congress take action or publicly speak out about the need to eliminate, modify or further reduce the PTC, the Clean Power Plan or other legislation, regulations and incentives supporting wind energy, such actions may result in a decrease in demand for wind energy in the United States and other geographical markets and may materially harm our business, financial condition and results of operations.
A significant portion of our business is derived from a small number of customers, and one wind blade customer in particular, therefore any loss of or reduction in purchase orders, failure of these customers to fulfill their obligations or our failure to secure long-term supply agreement renewals from these customers would materially harm our business.
Substantially all of our revenues are derived from four wind blade customers. One customer, GE Wind, accounted for 54.6%44.3%, 50.3%, 53.3%, and 73.2% and 91.2% of our total net sales for the three months ended March 31, 20162017 and for the years ended December 31, 2016, 2015 2014 and 2013,2014, respectively. In addition, three customers, Vestas, Nordex and Gamesa accounted for 17.0%23.2%, 11.1%17.5% and 10.3%13.7% of our net sales for the three months ended March 31, 2016,2017, respectively, and three customers, Nordex, Acciona (which was acquired by Nordex in April 2016)20.1%, 17.5% and Gamesa accounted for 15.7%, 10.8% and 10.3% of our net sales for the year ended December 31, 2016, respectively. During the year ended December 31, 2015, two customers, Nordex and Gamesa, accounted for 26.5% and 10.3% of our net sales, respectively. Accordingly, we are substantially dependent on continued business from our current wind blade customers, and GE Wind in particular. GE Wind and other customers may not continue to purchase wind blades from us at similar volumes or on as favorable terms in the future. For example, GESee “GE’s acquisition of LM Wind has inPower, our largest competitor, may materially harm our business, financial condition and results of operations and may cause the past informed usprice of their intentionour common stock to terminate a supply agreement. However, in that case, the agreement was not terminated but was instead renegotiated.decline.” If GE Wind or one or more of our other wind blade customers were to reduce or delay wind blade orders, fail to pay amounts due or satisfactorily perform their respective contractual obligations with us or otherwise terminate or fail to renew their long-term supply agreements with us, our business, financial condition and results of operations could be materially harmed.
Defects in materials and workmanship or wind blade failures could harm our reputation, expose us to product warranty or other liability claims, decrease demand for our wind blades, or materially harm existing or prospective customer relationships.
Defects in our wind blades, whether caused by a design, engineering, materials, manufacturing or component failure or deficiencies in our manufacturing processes, are unpredictable and an inherent risk in manufacturing technically advanced products. We have, in the past, experienced wind blade testing failures and defects at some of our facilities during the startup manufacturing phase of new products, and we may experience failures or defects in the future. For instance, customer qualification of our Iowa facility was delayed due to some wind blade testing failures in 2010, resulting in corresponding delays in our wind blade production at that facility. We have also experienced wind blade failures in the field. For example, in April 2015, a wind blade we manufactured failed in Finland. Any such customer qualification and wind blade testing failures or other product defects in the future could materially harm our existing and prospective customer relationships. Specifically, negative publicity about the quality of our wind
blades or defects in the wind blades supplied to our customers could result in a reduction in wind blade orders, increased warranty claims, product liability claims and other damages or termination of our long-term supply agreements or business relationships with current or new customers. In addition, we have recently started wind blade production at new facilities in Turkey and Mexico which may expose us to greater risk of warranty claims as these facilities ramp up to serial production levels.
We may determine that resolving potential warranty claims through a negotiated settlement may be in the best interest of the business and long-term customer relationships. For example, in June 2016, we entered into
a settlement agreement and release with one of our customers, Nordex relating to the April 2015 wind blade failure referenced above.failure. See “Management’s Discussion and Analysis of Financial Condition and Results of Operations—Other Contingencies” for more information. Wind blades may also fail due to lightning strikes andor other extreme weather, which could also result in negative publicity regarding our wind blades and wind energy in general. In addition, product defects may require costly repairs or replacement components, a change in our manufacturing processes or recall of previously manufactured wind blades, which could result in significant expense and materially harm our existing or prospective customer relationships. Further, defects or product liability claims, with or without merit, may result in negative publicity that could harm our future sales and our reputation in the industry. Any of the foregoing could materially harm our business, operating results and financial condition.
We have experienced, and could in the future experience, quality or operational issues in connection with plant construction or expansion, wind blade model transitions and wind blade manufacturing, which could result in losses and cause delays in our ability to complete our projects and may therefore materially harm our business, financial condition and results of operations.
We dedicate most of the capacity of our current wind blade manufacturing facilities to existing customers and, as a result, we may need to build additional manufacturing capacity or facilities to serve the needs of new customers or expanded needs of existing customers. We haverecently entered into lease agreements with third parties to lease new manufacturing facilities in Mexico and Turkey, and we expect to commencecommenced operations at these new facilities in the second halfthird quarter of 2016. We have also entered into a new lease with a third party for a third manufacturing facility in Juárez, Mexico, and we expect to commencecommenced operations at this facility in the first half ofJanuary 2017. The construction of new plants and the expansion of existing plants involves significant time, cost and other risks. We expect our plants to generate losses in their first 12 to 24 months of operations related to production startup expenses.costs. Additionally, numerous factors can contribute, and have in the past contributed, to delays or difficulties in the startup of, or the adoption of our manufacturing lines to produce larger wind blade models, which we refer to as model transitions, in our manufacturing facilities, including permitting, construction or renovation delays, the engineering and fabrication of specialized equipment, the modification of our general production know-how and customer-specific manufacturing processes to address the specific wind blades to be tested and built, changing and evolving customer specifications and expectations and the hiring and training of plant personnel. If our production or the delivery by any third-party suppliers of any custom equipment is delayed, the construction or renovation of the facility, or the addition of the production line would be delayed. Any delays or difficulties in plant startup or expansion may result in cost overruns, production delays, contractual penalties, loss of revenues and impairment of customer relationships, which could materially harm our business, financial condition and results of operations.
Our long-term supply agreements with our customers are subject to termination on short notice and our failure to perform our obligations under these agreements or the termination of agreements would materially harm our business.
Our current long-term supply agreements expire between the end of 2017 and the end of 2021.2023. Some of our long-term supply agreements contain provisions that allow for the termination of those agreements upon the customer providing us with 92 to 365 days’ advance written notice or, in one instance,two instances, upon no advance notice, or upon a material breach that goes uncured for up to 15 to 30 days. Additionally, our long-term supply agreements contain provisions allowing our customers to terminate these agreements upon our failure to deliver
the contracted wind blade volumes or our failure to meet certain mutually agreed upon cost reductions. Our customers may not continue to maintain long-term supply agreements with us in the future. If one or more of our customers terminate or fail to renew their long-term supply agreements with us, it would materially harm our business, financial condition and results of operations.
We operate in an industry characterized by changing customer demands and associated transition costs, which could materially harm our business.
The wind energy industry is competitive and is characterized by evolving customer demands. As a result, we must adapt quickly to customer requests for changes to wind blade specifications, which increases our
costs and can provide periods of reduced revenue and margins. For instance, in 2015 in order to satisfy GE Wind’s need for bigger wind turbines with larger wind blades, we recently agreed, at GE Wind’s request, to implementwe implemented model transitions at our U.S., China, Mexico and Turkey facilities, resulting in unplanned delays in wind blade production and associated transition costs at each of these facilities. We expect to have five to six lines in transition during 2017. We are generally able to share transition costs with the customer in connection with these changing customer demands, but any sharing is the subject of negotiation and the amount is not always contractually defined. If we do not receive transition payments from our customers sufficient to cover our transition costs or lost margins, our business, financial condition and results of operations could be materially harmed.
The concentration of customers in our wind business could enable one or more of our customers to attempt to substantially influence our policies, business and affairs going forward.
Our dependence on four wind blade customers, and GE Wind in particular, for substantially all of our revenues could encourage GE Wind or these customers to attempt to impose new or additional requirements on us that reduce the profitability of our long-term supply agreements with them or otherwise influence our policies, choice of and arrangements with raw material suppliers and other aspects of our business. Our customers could also attempt to influence the outcome of a corporate transaction if the transaction benefits a customer’s competitor or is otherwise perceived as not advantageous to a customer, which could have the effect of delaying, deterring, or preventing a transaction that could benefit us. In addition, consolidation of some of our customers may result in increased customer concentration and the potential loss of customers. For example, GE Wind acquired Alstom S.A.’s power business in 2015, Nordex completed its acquisition of Acciona in April 2016 and in June 2016 Siemens A.G. (Siemens) and Gamesa announced a plannedcompleted the merger of Siemens’ wind businessSiemens Wind Power with Gamesa.Gamesa in April 2017. Although we are not constrained by any exclusivity agreements with any of our existing wind blade customers, they may resist our development of new customer relationships, which could affect our relationships with them or our ability to secure new customers.
Demand for our wind blades may fluctuate for a variety of reasons, including the growth of the wind industry, and decreases in demand could materially harm our business and may not be sufficient to support our growth strategy.
Our revenues, business prospects and growth strategy heavily depend on the continued growth of the wind industry and our customers’ continuing demand for our wind blades. Customer demand could decrease from anticipated levels due to numerous factors outside of our control that may affect the development of the wind energy market generally, portions of the market or individual wind project developments, including:
In addition to factors affecting the wind energy market generally, our customers’ demand may also fluctuate based on other factors beyond our control. Any decline in customer demand below anticipated levels could materially harm our revenues and operating results and could delay or impede our growth strategy.
Changes in customers’ business focus and strategy could materially harm our business and results of operations.
Changes in our customers’ business focus could significantly reduce their demand for wind blades. For instance, General Electric,GE, the parent corporation of GE Wind, is a highly diversified company that operates in a number of different industries and could decide to devote more resources to operations outside of wind energy or cease selling wind turbines altogether. In addition, we expect that GE Wind will utilize LM for a substantial percentage of its wind blade production in the future. If any of our customers change their business focus, including a strategic shift to insource a material portion of its wind blade production requirements, it could materially harm our business and results of operations.
We have experienced in the past, and our future wind blade production could be affected by, operating problems at our facilities, which may materially harm our operating results and financial condition.
Our wind blade manufacturing processes and production capacity have in the past been, and could in the future be, disrupted by a variety of issues, including:
The cost of repeated or prolonged interruptions, reductions in production capacity, or the repair or replacement of complex and sophisticated tooling and equipment may be considerable and could result in damages under or the termination of our long-term supply agreements or penalties for regulatory non-compliance, any of which could materially harm our business, operating results and financial condition.
We operate a substantial portion of our business in international markets and we may be unable to effectively manage a variety of currency, legal, regulatory, economic, social and political risks associated with our global operations and those in developing markets.
We currently operate manufacturing facilities in the United States, China, Mexico and Turkey, and we intend to further expand our operations worldwide to meet customer demand. We haverecently entered into lease agreements with third parties to lease new manufacturing facilities in Mexico and Turkey, and we expect to commencecommenced operations at these new facilities in the second halfthird quarter of 2016. We have also entered into a new lease with a third party for a third manufacturing facility in Juárez, Mexico, and we expect to commencecommenced operations at this facility in the first half ofJanuary 2017. For the three months ended March 31, 20162017 and for the years ended December 31, 2016, 2015 and 2014, 71%76%, 75%, 74% and 55%, respectively, of our net sales were derived from our international operations and we expect that a substantial portion of our projected revenue growth will be derived from those operations. Our overall success depends, in part, upon our ability to succeed in differing legal, regulatory, economic, social and political conditions. The global nature of our operations is subject to a variety of risks, including:
In particular, our operations in China are subject to a variety of specific risks, which may adversely affect our business, including:
We also operate in developing markets, which have, in the past, experienced, and may in the future experience, social and political unrest. For example, Turkey has experienced problems with domestic terrorist and ethnic separatist groups.groups and attempted military coups. The issue of civil rights for Kurdish citizens remains a potential source of political instability, which may be exacerbated by continuing instability in the Middle East.
In addition, Juarez,Juárez, Mexico, the location of our three Mexico manufacturing facility,facilities, has in the past been subject to violence related to drug trafficking, including kidnappings and killings. This could negatively impact our ability to hire and retain personnel, especially senior U.S. managers, to continue to work at the facility,these facilities, or disrupt our operation in other ways, which could materially harm our business.
As we continue to operate our business globally, our success will depend, in part, on our ability to anticipate and effectively manage these and other related risks. We may be unsuccessful in developing and implementing policies and strategies that will be effective in managing these risks in each country where we do business or conduct operations. Our failure to manage these risks successfully could materially harm our business, operating results and financial condition.
Although a majority of our manufacturing facilities are located outside the United States, our business is still heavily dependent upon the demand for wind energy in the United States and any downturn in demand for wind energy in the United States could materially harm our business.
We have developed a global footprint to serve the growing wind energy market worldwide and have wind blade manufacturing facilities in the United States, China, Mexico and Turkey. Although a majority of our manufacturing facilities are located outside of the United States, we believe that historically more than half of the wind blades that we produced were deployed in wind farms located within the United States. Our Iowa and Mexico manufacturing facilities manufacture wind blades that are generally deployed within the United States. In
addition, we export wind blades from our China manufacturing facility to the United States. Demand for wind energy and our wind blades in the United States could be adversely affected by a variety of reasons and factors, and any downturn in demand for wind energy and our wind blades in the United States could materially harm our business.
Our focus on wind energy markets in a limited number of geographic areas could result in a material harm to our business, financial condition and results of operations.
The wind energy industry continues to be dependent on developments within a relatively small number of markets and we have developed our global manufacturing footprint and long-term growth strategy to serve these markets. We cannot assure you that these wind energy markets will continue to demand increasing amounts of wind energy going forward. For example, the connection or access of wind turbines to a power grid is very important when locating wind turbines. In each of these markets, there are various laws, rules or regulations that govern the connection or access of wind turbines to the power grid. If the customers of our customers fail to obtain a connection or access to power grids on a timely basis and on economically reasonable terms and enter agreements to sell the electrical energy generated or the number of MW hours that any of these markets consumes declines, our business, financial condition and results of operations could be materially harmed. In addition, if one of those markets does not develop in line with our expectations, our business, financial condition and results of operations could be materially harmed.
We may not achieve the long-term growth we anticipate if wind turbine OEMs do not continue to shift from in-house production of wind blades to outsourced wind blade suppliers and if we do not expand our customer relationships and add new customers.
Many wind turbine OEMs rely on in-house production of wind blades for some or all of their wind turbines. Our growth strategy depends in large part on the continued expansion of our relationships with our current wind blade customers, and the addition of new key customers. SomeThe majority of our customers possess the financial, engineering and technical capabilities to produce their own wind blades and many source wind blades from multiple suppliers. Our existing customers may not expand their wind energy operations or, if they do, they may not choose us to supply them with new or additional quantities of wind blades. Our collaborative dedicated supplier model for the manufacture of wind blades is a significant departure from traditional vertically integrated methods. As is typical for rapidly evolving industries, customer demand for new business models is highly uncertain. For instance, although we have entered into long-term supply agreements with three customers, Vestas, Gamesa (which, in June 2016 announced a planned mergerApril 2017, merged with Siemens’ wind business)Siemens Wind Power) and Nordex, (which acquired Acciona in April 2016), that also produce wind blades for their wind turbines in-house, we may not be able to maintain these customer relationships or enter into similar arrangements with new customers that produce wind blades in-house in the future. In addition, although GE Wind has historically outsourced all of their wind blade production requirements, we expect that GE Wind will utilize LM for a substantial percentage of its wind blade production in the future. Our business and growth strategies depend in large part on the continuation of a currentthe trend toward outsourcing manufacturing. If that trend does not continue or we are unsuccessful in persuading wind turbine OEMs to shift from in-house production to the outsourcing of their wind blade manufacturing, we may not achieve the long-term growth we anticipate and our market share could be limited.
A drop in the price of energy sources other than wind energy, or our inability to deliver wind blades that compete with the price of other energy sources, may materially harm our business, financial condition and results of operations.
We believe that a customer’s decision to purchase wind blades is to a significant degree driven by the relative cost of electricity generated by wind turbines compared to the applicable price of electricity from the utility grid and the cost of traditional and other renewable energy sources. Decreases in the prices of electricity from the relevant utility grid or from renewable energy sources other than wind energy would harm the market for wind blades. In particular, a drop in natural gas prices could lessen the appeal of wind-generated electricity.
Technological advancements or the construction of a significant number of power generation plants, including nuclear, coal, natural gas or power plants utilizing other renewable energy technologies, government support for other forms of renewable energy or construction of additional electric transmission and distribution lines could reduce the price of electricity produced by competing methods, thereby making the purchase of wind blades less attractive to customers economically. For example, in March 2017, President Trump signed an executive order that is intended to promote the domestic coal industry, which may make the cost of electricity generated from coal more cost competitive. The ability of energy conservation technologies, public initiatives and government incentives to reduce electricity consumption or support other forms of renewable energy could also lead to a reduction in the price of electricity, which would undermine the attractiveness of wind turbines, and, in turn, our wind blades. If prices for electricity generated by wind turbines are not competitive, our business, financial condition and results of operations may be materially harmed.
If any precision molding and assembly systems needed for our manufacturing process contains a defect or is not fabricated and delivered in a timely manner, our ongoing manufacturing operations, business, financial condition and results of operation may be materially harmed.
We custom fabricate many of the precision molding and assembly systems used in our facilities. Our customers also have the option of using third-party manufacturers to produce their custom tooling. If any piece of equipment fails, is determined to produce nonconforming or defective products or is not fabricated and delivered in a timely manner, whether produced by us or a third party, our wind blade production could be interrupted and we could be subject to contractual penalties, warranty claims, loss of revenues and damage to our customer relationships, among other consequences.
Our long-term supply agreements and our backlog are subject to reduction within contractual parameters and we may not realize all of the expected revenue.
Our current long-term wind blade supply agreements generally establish annual purchase requirements on which we rely for our future production and financial forecasts. However, the timing and volume of purchases, within certain parameters, may be subject to change by our customers. In some instances, our customers have the contractual right to require us to reduce the number of manufacturing lines committed to them and correspondingly reduce their minimum annual purchase requirements. Additionally, our minimum annual purchase commitments could potentially understate the actual net sales that we are likely to generate in a given period or periods if all of our long-term supply agreements remain in place and pricing remains materially unchanged. Such minimum annual purchase requirements could also potentially overstate the actual net sales that we are likely to generate in a given period or periods if one or more of our long-term supply agreements were to be terminated by our customers for any reason. As a result, we may not realize the revenue we expect under our long-term supply agreements or pursuant to our backlog, which we define as the value of purchase orders received less the revenue recognized to date on those purchase orders. In addition, fulfillment of our backlog may not result in profits.
The long sales cycle involved in attracting new customers may make the timing of our revenue difficult to predict and may cause our operating results to fluctuate.
The complexity, expense and long-term nature of our supply agreements generally require a lengthy customer education, evaluation and approval process. It can take us from several months to years to identify and attract new customers, if we are successful at all. This long sales cycle for attracting and retaining new customers subjects us to a number of significant risks that may materially harm our business, results of operation and financial condition over which we have limited control, including fluctuations in our quarterly operating results. In addition, we may incur substantial expenses and devote significant management effort to develop potential relationships that do not result in agreements or revenue and may prevent us from pursuing other opportunities.
We encounter intense competition for limited customers from other wind blade manufacturers, as well as in-house production by wind turbine OEMs, which may make it difficult to enter into long-term supply agreements, keep existing customers and potentially get new customers.
We face significant competition from other wind blade manufacturers, and this competition may intensify in the future. The wind turbine market is characterized by a relatively small number of large OEMs. In addition, a significant percentage of wind turbine OEMs, including fourmost of our current customers, produce some of their own wind blades in-house. As a result, we compete for business from a limited number of customers that outsource the production of wind blades. We also compete with a number of wind blade manufacturers in China, who are growing in terms of their technical capability and aspire to expand outside of China. Many of our competitors have more experience in the wind energy industry, as well as much greater financial, technical or human resources than we do, which may limit our ability to compete effectively with them and maintain or improve our market share. Additionally, our long-term supply agreements dedicate capacity at our facilities to our customers, which may also limit our ability to compete if our facilities cannot accommodate additional capacity. If we are unable to compete effectively for the limited number of customers that outsource production of wind blades, our ability to enter into long-term supply agreements with potential new and existing customers may be materially harmed.
We could be affected by increasing competition from new and existing industry participants and industry consolidation.
The markets in which we operate are increasingly competitive and any failure on our part to compete effectively on an ongoing basis could materially harm our business, results of operations or financial condition. The key factors affecting competition in the wind energy industry are the capacity and quality of products, technology, price, the ability to fulfill local market requirements and the scope, cost and quality of maintenance services, training and support.
Competition in the wind energy industry has intensified in recent years as a result of a number of factors, including international expansion by existing industry participants exploiting new markets, particularly as political will around the issues of global warming and the environment become more prominent to the political agenda in those new markets. There has also been increasing pressure from Asian manufacturers rapidly improving the quality and reliability of their technologies, and considering moving out of their local markets and into international cross border transactions. Market entry by certain large industrial groups, including those previously unconnected to the wind energy market, through acquisitions and license agreements and numerous greenfield establishments in certain markets, also poses a competition risk.
The competitive environment in the wind energy industry may become more challenging in the years ahead, particularly in the event of greater consolidation in the industry, leading to greater market power and “economies of scale” by such market players which translate into being able to offer greater “cost of energy” savings to wind power plant customers. For example, GE Windcompleted its acquisition of LM in April 2017 and also acquired Alstom S.A.’s power business in 2015,2015; Nordex recently completed its acquisition of Acciona and in June 2016, and Gamesa announced a planned mergermerged with Siemens’ wind business.Siemens Wind Power in April 2017. These transactions or further consolidation in the wind energy industry may have an adverse impact on our business in the future, including, without limitation, reduced demand for our products and services, product innovation, changes in pricing and similar factors, including any competitor’s attempt to duplicate our collaborative dedicated supplier model. Such events could materially harm our business, results of operations, financial condition or prospects.
Significant increases in the prices of raw materials or components that cannot be reflected in the price of our products could negatively affect our operating margins.
The prices of our raw materials and components are subject to price fluctuations resulting from volatility of supply and demand in world markets. Under our long-term supply agreements, our customers generally commit to purchase minimum annual volumes and prices for wind blades are generally set as of the
date of our supply agreements and adjusted annually, or in some cases more frequently, for the cost of raw material and our operating expenses in certain cases. As a result, the competitive nature of the wind blade market and our long-term supply agreements with our customers may delay or prevent us from passing cost increases in raw materials and components on to our customers. Significant increases in the price of raw materials or components used in our manufactured wind blades that cannot be reflected in the price of our products, could negatively affect our operating margins and materially harm our business, operating results or financial condition.
We could experience shortages of raw materials or components critical to our manufacturing needs, which may hinder our ability to perform under our supply agreements.
We rely upon third parties for raw materials, such as fiberglass, carbon, resins, foam core and balsa wood, and various components for the manufacture of our wind blades. Some of these raw materials and components may only be purchased from a limited number of suppliers. For example, balsa wood is only grown and produced in a limited number of geographies and is only available from a limited number of suppliers. Additionally, our ability to purchase the appropriate quantities of raw materials is constrained by our customers’ transitioning wind blade designs and specifications. As a result, we maintain relatively low inventory and acquire raw materials and components as needed. Due to significant international demand for these raw materials from many industries, we may be unable to acquire sufficient quantities or secure a stable supply for our manufacturing needs. If shortages or delays occur, we may be unable to provide our products to our customers on time, or at all. In addition, a disruption in any aspect of our global supply chain caused by transportation delays, customs delays, cost issues or other factors could result in a shortage of raw materials or components critical to our manufacturing needs. Any supply shortages, delays in the shipment of materials or components from third party suppliers, or changes in the terms on which they are available could disrupt or materially harm our business, operating results and financial condition.
Certain of our long-term supply agreements are highly dependent upon a limited number of suppliers of raw materials.
Our ability to perform under certain of our long-term supply agreements is currently, and may continue to be in the future, highly dependent on a limited number of suppliers of raw materials. For instance, our agreements with certain customers require us or our customers to purchase raw materials from a single supplier unless additional suppliers are evaluated and found to satisfy the requirements set out in those agreements. In 2015, for example, our ability to supply wind blades to one of our customers was constrained because our customer, who under our agreement was required to procure a sufficient supply of a specific type of material, was unable to procure the material from a single source supplier. Should any of these suppliers of raw materials experience production delays or shortages, have their operations interrupted or otherwise cease or curtail their operations, this may disrupt or materially harm our business, operating results and financial condition.
Significant increases in the cost of transporting our wind blades could negatively affect the demand for our products.
A significant portion of our customers’ costs are transportation costs related to the transport of our manufactured wind blades to their customers’ wind farms. Demand for our products could be negatively affected if the costs our customers bear to transport our wind blades increase.
The nature of our manufacturing processes and unanticipated changes to those processes could significantly reduce our manufacturing yields and product reliability, which could materially harm our business, operating results and financial condition.
The manufacture of our wind blades involves highly complex and precise processes which may be dictated by our customers’ requests requiring production in highly controlled environments. Changes in our
manufacturing processes or that are required by our customers could affect product reliability. Furthermore, many of our processes are manual to facilitate production flexibility and compliance with customer requirements. A manually dependent manufacturing process can limit capacity and increase production costs. In some cases, existing manufacturing techniques may be insufficient to achieve the volume or cost targets of our customers. For example, our manufacturing processes may at times require a quantity of raw materials greater than the quantity for which we have contracted, making it difficult for us to achieve the targeted cost levels negotiated with our customers. In order to achieve targeted volume and cost levels, we may need to increase the quantity of raw materials for which we contract or develop new manufacturing processes and techniques. While we continue to devote substantial efforts to the improvement of our manufacturing techniques and processes, we may not achieve manufacturing volumes and cost levels in our manufacturing activities that will fully satisfy customer demands, which could materially harm our business, operating results and financial condition.
Our reserves for warranty expenses might not be sufficient to cover all future costs.
We provide warranties for all of our products, including parts and labor, for periods that typically range from two to five years depending on the product sold. If a wind blade is found to be defective during the warranty period as a result of a defect in workmanship or materials, or if we are required to cover remediation expenses or other potential remedies, in addition to our regular warranty coverage we may need to repair or replace the wind blade (which could include significant transportation, installation and erection costs) at our sole expense. Our estimate of warranty expense requires us to make assumptions about matters that are highly uncertain, including future rates of product failure, repair costs, shipping and handling and de-installation and re-installation costs at customers’ sites. Our assumptions could be materially different from the actual performance of our products and these remediation expenses in the future. The expenses associated with wind blade repair and remediation activities can be substantial and may include changes to our manufacturing processes. If our estimates prove materially incorrect, we could incur warranty expenses that exceed our reserves and be required to make material unplanned cash expenditures, which could materially harm our business, operating results and financial condition.
We may not be able to meet our customers’ future wind blade supply demands, which may hinder our customer relationships and reputation.
Historically, our existing customers’ demand and MW capacity goals have mirrored the anticipated growth of the wind energy industry. Given the importance of wind energy capture, turbine reliability and cost to power producers, the size, quality and performance of wind blades have become highly strategic to our OEM customers. If we are unable to maintain future manufacturing capacity at levels that meet our customers’ increasing demands, including with respect to volume, technical specifications, or commercial terms, our existing customers may seek relationships with, or give priority to, other wind blade manufacturers or may use or develop their own internal manufacturing capabilities to meet their increased demand, which could materially harm our business, operating results and financial condition. In addition, our reputation could be materially harmed if we are unable to satisfy the requirements of our customers.
We rely on our research and development efforts to remain competitive, and we may fail to develop on a timely basis new wind blade manufacturing technologies that are commercially attractive or permit us to keep up with customer demands.
The market for wind blades is subject to evolving customer needs and expectations. Our research and development is invested in developing faster and more efficient manufacturing processes in order to build the new wind blades designed by our customers that more effectively capture wind energy and are adaptable to new growth segments of the wind energy market. Research and development activities are inherently uncertain and the results of our in-house research and development may not be successful. In addition, our competition may adopt more advanced technologies or develop wind blades that are more effective or commercially attractive. We believe that our future success will depend in large part upon our ability to be at the forefront of technological
innovation in the wind energy industry and to rapidly and cost-effectively adapt our wind blade manufacturing processes to keep pace with changing technologies, new wind blade design and changing customer needs. If we are unable to do so, our business, operating results, financial condition and reputation could be materially harmed.
Many of our long-term supply agreements contain liquidated damages provisions, which may require us to make unanticipated payments to our customers.
Many of our long-term supply agreements contain liquidated damages provisions in the event that we fail to perform our obligations thereunder in a timely manner or in accordance with the agreed terms, conditions and standards. Our liquidated damages provisions generally require us to make a payment to the customer if we fail to deliver a product or service on time. We generally try to limit our exposure under any individual long-term supply agreement to a maximum penalty. Nevertheless, if we incur liquidated damages, they may materially harm our business, operating results and financial condition. For example, the supply agreements with respect to our China, Mexico and Iowa facilities provide that each party will bear its own costs except that the prevailing party in a legal action arising thereunder is entitled to its reasonable costs and expenses, including reasonable attorneys’ fees.
We depend on third parties for certain construction, maintenance, engineering, transportation, warehousing and logistics services, and failures of those third parties to perform their obligations may in turn impede our ability to perform our obligations.
We contract with third parties for certain services relating to the design, construction and maintenance of various components of our production facilities and other systems. If these third parties fail to comply with their obligations:
Any of these events could have a material adverse effect on our business, operating results or financial condition. Our customers also contract with third parties for the transportation of the products we manufacture. In particular, a significant portion of the goods we manufacture are transported to different countries, which requires sophisticated warehousing, logistics and other resources. If our customers fail to contract with third parties for certain construction, maintenance, engineering, transportation, warehousing and logistics services, or there are any disruptions, delays or failures in these services, this could have a material adverse effect on our business, operating results or financial condition.
Various legislation, regulations and incentives that are expected to support the growth of wind energy in the United States and around the world may not be extended or may be discontinued, phased out or changed, or may not be successfully implemented, which could materially harm wind energy programs and materially decrease demand for our wind blades.
The U.S. wind energy industry is dependent in part upon governmental support through certain incentives including federal tax incentives and renewable portfolio standard or RPS,(RPS) programs and may not be economically viable absent such incentives. Government-sponsored tax incentive programs including the Production Tax Credit for Renewable Energy, or PTC, and to a lesser extent, the Investment Tax Credit, or ITC, are expected to support the U.S. growth of wind energy. The PTC provided the owner of a wind turbine placed in operation before January 1, 2015 with a ten year credit against its U.S. federal income tax obligations based on the amount of electricity generated by the wind turbine.
Although the PTC was extended in December 2015 for wind power projects through December 31, 2019, as currently contemplated, the PTC rate is being phased out over the term of the PTC extension. Specifically, as currently contemplated, the PTC will remain at the same rate in effect at the end of 2014 for wind power projects that commence construction by the end of 2016, and thereafter will be reduced by 20% per year in 2017, 2018 and 2019, respectively.
TheIn 2015, the EPA recently enacted the Clean Power Plan, which is also intended to promote the growth of renewable energy. However, in February 2016, the United States Supreme Court issued a stay of the EPA’s implementation of the Clean Power Plan until the D.C. Circuit of the United States Court of Appeals reviews the merits of multiple lawsuits challenging the legality of the Clean Power Plan. If the Clean Power Plan is not successfully implemented, demand for our wind blades may be materially decreased. In addition, in March 2017, President Trump signed an executive order that requires, among other things, that the EPA review the Clean Power Plan and publish a rule to either suspend, revise or rescind it.
In addition, many state governments have adopted measures designed to promote wind energy. For example, according to AWEA, at the state level, as of December 31, 2016, 29 states, as well as the District of Columbia, have implemented RPS programs that mandate that a specific percentage of electricity sales in a state come from renewable energy within a specified period. However, RPS programs have been challenged lately and they may not continue going forward. These programs have spurred significant growth in the wind energy industry in the United States and a corresponding increase in the demand for our manufactured wind blades. However, although the U.S. government and several state governments have adopted these various programs that are expected to drive the growth of wind energy, they may approve new or additional programs that might hinder the wind energy industry and therefore negatively impact our business, operating results or financial condition. See “Risk Factors—Risks Related to Our Wind Blade Business—The results of the 2016 United States presidential and congressional elections has created regulatory uncertainty for our business and the wind energy sector and may materially harm our business, financial condition and results of operations.”
China is currently implementing a five-year planits 13th 5-Year Plan with a goal of 15% energy from non-fossil fuel sources and targeting 250210 GWs of grid-connected wind capacity by 2020, according to its National Development and Reform Commission, and employs preferential feed-in tariff schemes, in addition to local tax-based incentives. Mexico has established strict targets, aiming for 35% renewable energy by 2024 and 50% by 2050, according to MAKE, which it is facilitating through tax incentives. Large European Union members have renewable energy targets for 2020 of between 13% and 49% of all energy use derived from renewable energy sources, according to MAKE. Turkey enacted Law No. 5346 in 2005 to promote renewable-based electricity generation within its
domestic electricity market by introducing tariffs and purchase obligations for distribution companies requiring purchases from certified renewable energy producers. The World Bank also provided to Turkey an aggregate of $600 million of loan proceeds to encourage investors to construct generation plants with renewable energy resources. These programs have spurred significant growth in the wind energy industry internationally and a corresponding increase in the demand for our manufactured wind blades. However, although foreign governments have adopted various programs that are expected to drive the growth of wind energy, they may approve new or additional programs going forward that might hinder the wind energy industry and therefore negatively impact our business as a result. For example, foreign governments may decide to reduce or eliminate these economic incentives for political, financial or other reasons. They may also favor other forms of energy, including current and new sources of energy such as solar, nuclear and hydropower.
Because of the long lead times necessary to develop wind energy projects, any uncertainty or delay in adopting, extending or renewing these incentives beyond their current or future expiration dates could negatively impact potential wind energy installations and result in industry volatility. There can be no assurance that the PTC, the Clean Power Plan or other governmental programs or subsidies for renewable energy will remain in effect in their present form or at all, and the elimination, reduction, or modification of these programs or subsidies could materially harm wind energy programs in the United States and international markets and materially decrease demand for our wind blades and, in turn, materially harm our business, operating results and financial condition.
We may not be able to obtain, or agree on acceptable terms and conditions for, government tax credits, grants, loans and other incentives for which we have in the past applied or may in the future apply, which may materially harm our business, operating results and financial condition.
We have in the past and may in the future rely, in part, on tax credits, grants, loans and other incentives under U.S. and foreign governmental programs to support the construction of new plants and expansion of existing manufacturing facilities. We may not be successful in obtaining these tax credits, grants, loans and other incentives, and the tax and other incentives that have already been approved may not be continued in the future. Our ability to obtain funds or incentives from government sources is subject to the availability of funds under applicable governmental programs and approval of our applications to participate in these programs. The application process for these funds and other incentives is and will be highly competitive. We may not be able to satisfy the requirements and milestones imposed by the granting authority as conditions to receipt of the funds or other incentives, the timing of the receipt of the funds may not meet our needs, and, even if obtained, we may be unable to successfully execute on our business plan. Moreover, not all of the terms and conditions associated with these incentive funds have been disclosed to us, and once disclosed, there may be terms and conditions with which we are unable to comply or that are commercially unacceptable to us. Further, participation in certain programs may require us to notify the federal government of certain intellectual property we develop and comply with applicable regulations in order to protect our interests in that intellectual property. In addition, these federal governmental programs may require us to spend a portion of our own funds for every incentive dollar we receive or are permitted to borrow from the government and may impose time limits during which we must use the funds awarded to us that we may be unable to achieve. If we are unable to obtain or comply with the terms of these tax credits, grants, loans or other incentives, our business, operating results and financial condition may be harmed.
Adverse weather conditions could impact the wind energy industry in some regions and could materially harm our business, operating results and financial condition.
Our business may be subject to fluctuations in sales volumes due to adverse weather conditions that could delay the erection of wind turbines, the installation of wind blades and the ability of wind turbines to generate electricity efficiently. Moreover, any remediation efforts we could be required to undertake pursuant to wind blade warranties could be delayed or otherwise adversely impacted by poor weather. Although our customer base and geographicalmanufacturing footprint is geographically diversified, enduring weather patterns or seasonal variations may impact the expansion of the wind energy industry in certain regions. A resulting reduction or delay in demand for the wind blades we manufacture for our customers could materially harm our business, operating results and financial condition.
In mid-2015, our Audit Committee conducted an internal investigation into allegations of improper business dealings in China. While the investigation did not substantiate the allegations, we ultimately terminated our former Senior Vice President—Asia, then serving as a consultant to the Company, in January 2016 for material violations of his agreements with us and of Company policies, which came to light subsequent to the completion of the internal investigation. Any misconduct that the initial investigation or our subsequent review of the activities of our former Senior Vice President—Asia failed to uncover could have a material adverse effect on our operations generally.
In June 2015, our Audit Committee was notified of allegations that, among other things, our former Senior Vice President—Asia requested personal compensation from suppliers in return for doing business with the Company in China and made excessive payments for capital expenditures. The Audit Committee directed a U.S.-based law firm, assisted by a forensic accounting firm and a law firm with local resources in China, to initiate an investigation into the conduct of the former Senior Vice President—Asia. Although the investigation did not uncover any illegal conduct, the investigation did not disprove the allegations. We subsequently accelerated the implementation of enhanced operational procedures, processes and controls relating to our China operations pursuant to recommendations arising out of the internal investigation and our review of our China operations. This process is currently ongoing.
Although the results of the internal investigation were inconclusive regarding the allegations relating to our former Senior Vice President—Asia, in early August 2015, we entered into a transition agreement with our former Senior Vice President—Asia pursuant to which he transitioned out of his role as Senior Vice President—Asia at the end of 2015. Pursuant to the transition agreement, he was to serve in a consulting capacity to facilitate an orderly transition of operations in China through 2016 and 2017. In January 2016, we subsequently determined that our former Senior Vice President—Asia, then serving as a consultant to the Company, had materially violated the terms of the transition agreement, including the non-compete provisions, and had materially violated Company policies. Following our discovery of these violations, we terminated his consultancy for cause in January 2016 pursuant to the terms of the transition agreement and he is no longer associated with the Company. Subsequent to his termination, we found further evidence that our former Senior Vice President—Asia and three of his subordinates in China, who we also terminated in January 2016, likely engaged in improper conduct involving the misuse of funds in violation of Company policies.
Additional facts or allegations may exist that the internal investigation or our subsequent review did not uncover. The persons that our investigative teams interviewed may have omitted facts or may have been untruthful, and the investigative teams may not have had access to all relevant documents or persons relating to the subject of the investigation. If new evidence concerning the allegations is found in the future, or if new allegations are made or other similar issues arise or are uncovered, our Chinese operations could be materially disrupted, our suppliers and customers may cease to do business with us, our reputation in the marketplace may be materially harmed, we may be required to terminate additional key employees, and we may need to incur substantial legal and accounting costs in investigating and resolving these matters. If any of these risks materialize, we could be subject to fines, penalties, prosecution or other impacts, which could result in a decline in our stock price or materially and adversely affect our business, operating results, liquidity and financial condition.
Our long-term growth and success is dependent upon retaining our senior management and attracting and retaining qualified personnel, and we may be negatively impacted by the transition and subsequent termination of our former Senior Vice President—Asia.personnel.
Our growth and success depends to a significant extent on our ability to attract and retain highly qualified research and development, management, manufacturing, marketing and other key personnel including engineers in our various locations. In addition, we rely heavily on our management team, including Steven C. Lockard, our Chief Executive Officer,Officer; Mark R. McFeely, our Chief Operating Officer, Wayne G. Monie, our Chief Manufacturing Technology Officer,Officer; William E. Siwek, our Chief Financial Officer,Officer; and other senior management. The inability to
recruit and retain key personnel or the unexpected loss of key personnel may materially harm our business, operating results and financial condition. Hiring those persons may be especially difficult because of the specialized nature of our business and our international operations. If we cannot attract and retain qualified personnel, or if we lose the services of Messrs. Lockard, McFeely Monie or Siwek, other key members of senior management or other key personnel, our ability to successfully execute our business plan, market and develop our products and serve our customers could be materially and adversely affected. In addition, because of our reliance on our management team, our future success depends, in part, on its ability to identify and develop talent to succeed its senior management. The retention of key personnel and appropriate senior management succession planning will continue to be critical to the successful implementation of our future strategies.
In addition, in August 2015, we entered into a transition agreement with our former Senior Vice President—Asia pursuant to which he transitioned out of this role at the end of 2015. Although our former Senior Vice President—Asia was to serve in a consulting capacity with the Company in 2016 and 2017, following our discovery that he had materially violated the terms of the transition agreement, including the non-compete provisions, and materially violated Company policies, we terminated his consultancy for cause in January 2016 pursuant to the terms of the transition agreement and he is no longer associated with the Company. We have also terminated three other senior managers in China, who were his subordinates, for related offenses. Some of our key management, technical and engineering personnel in China may decide to leave the Company following our recent management transition in China, and the transition may be disruptive to our China operations generally. Our former Senior Vice President – Asia has filed an arbitration claim challenging our termination of the transition agreement for cause and the three subordinates may also challenge our termination of their employment. See “Business—Legal Proceedings” for more information. We may need to incur material legal and other costs in resolving these matters under Chinese labor and employment laws and regulations, which are complex, and the ultimate outcome is difficult to predict in China. We have incurred and may incur substantial additional costs in managing our Chinese business in the future, and our U.S.-based management team may continue to be required to dedicate a significant amount of time and attention to managing the Chinese operations until China-based management can operate independently. For example, Mr. Monie functioned as our Asia CEO from August 2015 through March 2016. If any of these risks materialize, it could have a material adverse effect on our business, operating results or financial condition.
Risks Related to Our Business as a Whole
We may not be able to manage our future growth effectively, which may materially harm our business, operating results and financial condition.
We expect to continue to expand our business significantly to meet our current and expected future contractual obligations and to satisfy anticipated increased demand for our products. To manage our anticipated expansion, we believe we must scale our internal infrastructure, including establishing additional facilities, improve our operational systems and procedures and manufacturing capabilities, continue to enhance our
compliance and quality assurance systems, train and manage our growing employee base, and retain and add to our current executives and management personnel. Rapid expansion of our operations could place a significant strain on our senior management team, support teams, manufacturing lines, information technology platforms and other resources. Difficulties in effectively managing the budgeting, forecasting and other process control issues presented by any rapid expansion could materially harm our business, prospects, results of operations or financial condition. Our inability to implement operational improvements, generate and sustain increased revenue and manage and control our cost of goods sold and operating expenses could impede our future growth and materially harm our business, operating results and financial condition.
We have a history of net losses and may not achieve or maintain profitability in the future.
We have a history of significant net operating losses, including a net loss of $6.6 million for the year ended December 31, 2014. InFor the three months ended March 31, 20162017 and infor the years ended December 31, 2015
2016 and 2013,2015, we had net income of $1.7$3.5 million, $7.7$13.8 million and $1.3$7.7 million, respectively. As a result of thesepast operating losses, and the effect of redeemable preferred share cumulative dividends earned and the accretion to redemption amounts, we had an accumulated deficit of $191.9$180.0 million as of March 31, 2016.2017. Although we were profitable for the three months ended March 31, 2016,2017, we may not be able to achieve profitability for the current or any future fiscal year. In addition, we expect our operating expenses to increase as we continue to seek new customer relationships and expand our operations. Our ability to achieve and maintain profitability depends on a number of factors, including the growth rate of the wind energy industry, the competitiveness of our wind blades and our ability to successfully build new and expand existing manufacturing facilities and increase production capacity at existing plants. We may incur significant losses in the future for a number of reasons, including due to the other risks described elsewhere in this prospectus, and we may encounter unforeseen expenses, difficulties, complications and delays and other unknown events. In addition, as a public company, we will incur additional significant legal, accounting and other expenses that we did not incur as a private company. As a result, our operations may not achieve profitability in the future and, even if we do achieve profitability, we may not be able to maintain or increase it.
Our financial position, revenue, operating results and profitability are difficult to predict and may vary from quarter to quarter, which could cause our share price to decline significantly.
Our quarterly revenue, operating results and profitability have varied in the past and are likely to vary significantly from quarter to quarter in the future. For example, our quarterly results have ranged from an operating profit of $16.6$17.5 million for the three months ended December 31, 2015June 30, 2016 to an operating loss of $2.7 million for the three months ended March 31, 2015. The factors that are likely to cause these variations include:
As a result, our revenue, operating results and profitability for a particular period are difficult to predict and may decline in comparison to corresponding prior periods regardless of the strength of our business. It is also possible that in some future periods our revenue, operating results and profitability may not meet the expectations of securities analysts or investors. If this occurs, the trading price of our common stock could fall substantially, either suddenly or over time, and our business, operating results and financial condition would be materially harmed.
The fluctuation of foreign currency exchange rates could materially harm our financial results.
Since we conduct a significant portion of our operations internationally, our business is subject to foreign currency risks, including currency exchange rate fluctuations. The exchange rates are affected by, among other things, changes in political and economic conditions. For example, an increase in our Turkey sales and operations will result in a larger portion of our net sales and expenditures being denominated in the Euro and Turkish Lira, or TRY.Lira. Significant fluctuations in the exchange rate between TRYthe Turkish Lira and the U.S. dollar, TRYthe Turkish Lira and the Euro or the Euro and the U.S. dollar may adversely affect our revenue, expenses, as well as the value of our assets and liabilities. Similarly, an increase in our China sales and operations will result in a larger portion of our net sales and expenditures being denominated in Chinese Renminbi, or RMB.Renminbi. The Chinese government controls the procedures by which RMBthe Chinese Renminbi is converted into other currencies, and conversion of RMBthe Chinese Renminbi generally requires government consent. As a result, RMBthe Chinese Renminbi may not be freely convertible into other currencies at all times. If the Chinese government institutes changes in currency conversion procedures, or imposes restrictions on currency conversion, those actions may materially harm our business, liquidity, financial condition and operating results. In addition, significant fluctuations in the exchange rate between RMBthe Chinese Renminbi and U.S. dollars may adversely affect our expenses as well as the value of our assets and liabilities. To the extent our future revenues are generated outside of the United States in currencies other than the U.S. dollar, including the Euro, TRY, RMBthe Turkish Lira, the Chinese Renminbi or Mexican Peso, among others, we will be subject to increased risks relating to foreign currency exchange rate fluctuations which could materially harm our business, financial condition and operating results.
The outcome of the United Kingdom’s referendum on membership in the European Union could have a material impact on global financial markets and on the European economy, and could result in material fluctuations in foreign currency exchange rates, any or all of which could have a material adverse effect on us.
In June 2016, a referendum was held on the United Kingdom’s membership in the European Union, resulting in a vote in favor of leaving the European Union. The vote creates an uncertain political and economic environment in the United Kingdom and potentially across other European Union member states, which may last for a number of months or years. Article 50 of the Treaty of the European Union, or Article 50, allows a member state to decide to withdraw from the European Union in accordance with its own constitutional requirements. The formal process for leaving the European Union will be triggered only when the United Kingdom delivers an Article 50 notice to the European Council, although informal negotiations around the terms of any exit may be held before such notice is given. Delivery of the Article 50 notice will start a two-year period for the United Kingdom to exit from the European Union, although this period can be extended with the unanimous agreement of the European Council. Without any such extension (and assuming that the terms of withdrawal have not already been agreed), the United Kingdom’s membership in the European Union would end automatically on the expiration of that two-year period.
The result of the referendum means that the long-term relationship of the United Kingdom with the European Union is unclear and that there is considerable uncertainty as to when any changes to such relationship will be agreed and implemented. There is also considerable uncertainty as to whether, following any Article 50 notice being given, the arrangements for the United Kingdom to leave the European Union will be agreed upon within the two-year period and, if not, whether an extension of that time period would be agreed upon. It is also possible that the European Union will pressure the United Kingdom to exit prior to the end of the two-year period or that the United Kingdom’s exit from the European Union will be effected without mutually acceptable terms being agreed upon.
The political and economic instability created by the United Kingdom’s vote to leave the European Union has caused and may continue to cause significant volatility in global financial markets and the relative value of global currencies, including the Euro in particular, which may adversely affect our revenue, expenses, as well as the value of our assets and liabilities. Depending on the terms reached regarding any exit from the European Union, it is possible that there may be other adverse practical and/or operational implications on our business and for our customers doing business in Europe. Consequently, no assurance can be given as to the
impact of the referendum outcome and, in particular, no assurance can be given that our operating results, financial condition and prospects would not be adversely impacted by the result.
Our manufacturing operations and future growth are dependent upon the availability of capital, which may be insufficient to support our capital expenditures.
Our current wind blade manufacturing activities and future growth will require substantial capital investment. For the years ended December 31, 20152016 and 2014,2015, our capital expenditures were $31.4$40.5 million and $26.3$31.4 million, respectively, including assets acquired under capital lease in 2016 and 2015 and 2014 of $5.0$10.0 million and $7.4$5.0 million, respectively. We have recently entered into lease agreements with third parties to lease new manufacturing facilities in China, Mexico and Turkey, and we expect to commence operations at these new facilities in the second half of 2016. We have also entered into a new lease with a third party for a third manufacturing facility in Juárez, Mexico, and we expect to commence operations at this facility in the first half of 2017.Turkey. Major projects expected to be undertaken include purchasing equipment for and the expansion of our Dafeng, China; MexicoChina and TurkeyTaicang China facilities and new facilities in Mexico and Turkey. Our ability to grow our business is predicated upon us making significant additional capital investments to expand our existing manufacturing facilities and build and operate new manufacturing facilities in existing and new markets. We generally estimate that the startup of a new six line manufacturing facility requires cash for net operating expenses and working capital of between $15 million to $25 million and additional capital expenditures for machinery and equipment of between $15 million to $25 million. In addition, we estimate our annual maintenance capital expenditures to be $500,000between $1.5 million to $1$2.0 million per facility. We may not have the capital to undertake these capital investments. In addition, our capital expenditures may be significantly higher if our estimates of future capital investments are incorrect and may increase substantially if we are required to undertake actions to comply with new regulatory requirements or compete with new
technologies. The cost of some projects may also be affected by foreign exchange rates if any raw materials or other goods must be paid for in foreign currency. We cannot assure you that we will be able to raise funds on favorable terms, if at all, or that future financings would not be dilutive to holders of our capital stock. We also cannot assure you that completed capital expenditures will yield the anticipated results. If we raise additional funds by obtaining loans from third parties, the terms of those financing arrangements may include negative covenants, or other restrictions on our business that could impair our operational flexibility, and would require us to fund additional interest expense. If we are unable to obtain sufficient capital at a reasonable cost or at all, we may not be able to expand production sufficiently to take advantage of changes in the marketplace or may be required to delay, reduce or eliminate some or all of our current operations, which could materially harm our business, operating results and financial condition.
As a U.S. corporation with international operations, we are subject to the U.S. Foreign Corrupt Practices Act of 1977, which could impact our ability to compete in certain jurisdictions.
As a U.S. corporation, we and our subsidiaries are subject to the U.S. Foreign Corrupt Practices Act or FCPA,of 1977 (FCPA), which generally prohibits U.S. companies and their intermediaries from making improper payments to foreign officials for the purpose of obtaining or keeping business. We have manufacturing facilities in China, Mexico and Turkey, countries with a fairly high risk of corruption. Those facilities are subject to routine government oversight. In addition, a small number of our raw materials and components suppliers are state-owned in China. Moreover, due to our need to import raw materials across international borders, we also routinely have interactions, directly or indirectly, with customs officials. In many foreign countries, under local custom, businesses engage in practices that may be prohibited by the FCPA or other similar laws and regulations. Additionally, we continue to hire employees around the world as we continue to expand. Although we have recently implemented certain procedures designed to ensure compliance with the FCPA and similar laws, there can be no guarantee that all of our employees and agents, as well as those companies to which we outsource certain of our business operations, have not taken and will not take actions that violate our policies and the FCPA, which could subject us to fines, penalties, disgorgement, and loss of business, harm our reputation and impact our ability to compete in certain jurisdictions. In addition, these laws are complex and far-reaching in nature, and, as a result, we may be required in the future to alter one or more of our practices to be in compliance
with these laws or any changes in these laws or the interpretation thereof. Moreover, our competitors may not be subject to the FCPA or comparable legislation, which could provide them with a competitive advantage in some jurisdictions.
We may have difficulty making distributions and repatriating earnings from our Chinese manufacturing operations, which may also occur in some of our other locations.
A material portion of our business is conducted in China. As of March 31, 2016,2017, our China operations had unrestricted cash of $7.9$14.8 million, most of which iswill be used to fund our future operations in China. Our ability to repatriate funds from China to the United States is subject to a number of restrictions imposed by the Chinese government. We repatriate funds through a Technology License Contract, a Services AgreementContracts and dividends. Under the Technology License Contract, TPI Composites (Taicang) Co, Ltd., or TPI Taicang, is required to pay TPI Technology, Inc., our wholly-owned subsidiary, 4.9% of its net sales for the use of an exclusive and non-transferable license to use Technical Information, as defined in the Technology License Contract, to produce products at its facilities. Under the Services Agreement, we provide (i) accounting and financial advisory services, (ii) environmental and EHS programs, (iii) information technology and data services, (iv) global sourcing and procurement services and (v) engineering and development services to TPI Taicang.corporate/administrative Service Agreements. We are compensated quarterly based on agreed upon hourlyroyalty rates for such intellectual property licenses and quarterly fees for those services. Certain of our subsidiaries are limited in their ability to declare dividends without first meeting statutory restrictions of the People’s Republic of China, including retained earnings as determined under Chinese-statutory accounting requirements. Additionally, under the terms of our credit agreement with one of our Chinese lenders, we are required to obtain its approval to pay dividends and have a current ratio of not less than one. Until 50% ($5.2 million) of registered capital is contributed to a surplus reserve, our Chinese operations can only pay dividends equal to 90% of after-tax profits (10% must be contributed to the surplus reserve). Once the surplus reserve fund requirement is met, we can pay dividends equal to 100% of after-tax profit assuming other conditions are met. AtAs of December 31, 2015,2016, the amount of the surplus reserve fund was $2.9$4.4 million. Any inability to make distributions, repatriate earnings or otherwise access funds from our manufacturing operations in China, if and when needed for use outside of China, could materially harm our liquidity and our business.
Effective internal controls are necessary for us to provide reliable financial reports and effectively prevent fraud.address fraud risks.
We maintain a system of internal controls to provide reasonable assurance regarding the reliability of financial reporting and the preparation of financial statements for external purposes in accordance with GAAP. The process of designing and implementing effective internal controls is a continuous effort that requires us to anticipate and react to changes in our business and the economic and regulatory environments and to expend significant resources to establish and maintain a system of internal controls that will be adequate to satisfy the reporting obligations of a public company. The effectiveness of our internal controls depends in part on the cooperation of senior managers worldwide. See “Risks“Risk Factors—Risks Related to Our Wind Blade Business—In mid-2015, our Audit Committee conducted an internal investigation into allegations of improper business dealings in China. While the investigation did not substantiate the allegations, we ultimately terminated our former Senior Vice President—Asia, then serving as a consultant to the Company, in January 2016 for material violations of his agreements with us and with Company policies that came to light subsequent to the completion of the internal investigation. Any misconduct that the investigation or our subsequent review of the activities of our former Senior Vice President—Asia failed to uncover could have a material adverse effect on our operations generally.”
Any system of controls, however well designed and operated, can provide only reasonable, and not absolute, assurance that the objectives of the system are met. Any failure to maintain that system, or consequent inability to produce accurate financial statements on a timely basis, could increase our operating costs and harm our business, and lead to our becoming subject to litigation, sanctions or investigations by The NASDAQ Global Market (NASDAQ), the SEC or other regulatory governmental agencies and bodies. Furthermore, investors’ perceptions that our internal controls are inadequate or that we are unable to produce accurate financial statements on a timely basis may harm our stock price.
We have in the past experienced material weaknesses. While we have successfully remediated those material weaknesses, we could experience control deficiencies in the future or identify areas requiring improvement in our internal control over financial reporting.
The state of financial markets and the economy may materially harm our sources of liquidity and capital.
There has been significant recent turmoil and volatility in worldwide financial markets. These conditions have resulted in a disruption in the liquidity of financial markets, and could directly impact us to the extent we need to access capital markets to raise funds to support our business and overall liquidity position. This situation could affect the cost of such funds or our ability to raise such funds. If we were unable to access any of these funding sources when needed, it could materially harm our business, operating results and financial condition.
Our ability to use our net operating loss carry forwards may be subject to limitation and may result in increased future tax liability.
Sections 382 and 383 of the Internal Revenue Code of 1986, as amended or the Code,(the Code), contain rules that limit the ability of a company that undergoes an “ownership change” to utilize its net operating loss (NOL) and tax credit carry forwards and certain built-in losses recognized in years after the ownership change. An “ownership change” is generally defined as any change in ownership of more than 50% of a corporation’s stock over a rolling three-year period by stockholders that own (directly or indirectly) 5% or more of the stock of a corporation, or arising from a new issuance of stock by a corporation. If an ownership change occurs, Section 382 generally imposes an annual limitation on the use of pre-ownership change net operating losses, or NOLs, credits and certain other tax attributes to offset taxable income earned after the ownership change. The annual limitation is equal to the product of the applicable long-term tax exempt rate and the value of the company’s stock immediately before the ownership change. This annual limitation may be adjusted to reflect any unused annual limitation for prior
years and certain recognized built-in gains and losses for the year. In addition, Section 383 generally limits the amount of tax liability in any post-ownership change year that can be reduced by pre-ownership change tax credit carryforwards. This could result in increased U.S. federal income tax liability for us if we generate taxable income in a future period. Limitations on the use of NOLs and other tax attributes could also increase our state tax liability. The use of our tax attributes will also be limited to the extent that we do not generate positive taxable income in future tax periods. As a result of these limitations, we may be unable to offset future taxable income (if any) with losses, or our tax liability with credits, before such losses and credits expire. Accordingly, these limitations may increase our federal income tax liability.
Although we dohave not expect to incurexperienced an ownership change as a result of the transactions described in this offering,since 2008, it is possible that the transactions described in this offering, when combined with past and future transactions willmay cause us to undergo one or more ownership changes. As of December 31, 2015,2016, we have U.S. federal NOLs of approximately $78.1$57.5 million, state NOLs of approximately $61.1$77.2 million, foreign NOLstax credits of approximately $3.2$2.6 million and foreignTurkey investment tax credits of approximately $0.3 million available to offset future taxable income. At the end ofIn 2008, we had an “ownership change” and the pre-ownership change NOLs existing at the date of change of $25.6 million arewere subject to an annual limitation of $4.3 million. As of December 31, 2015,2016, the remaining pre-ownership change net operating losses of approximately $20.5 millionNOLs are no longer limited. Certain of these NOLs may be at risk of limitation in the event of a future ownership change.
We have U.S. federal U.S.and state and foreign NOLs. In general, NOLs in one country cannot be used to offset income in any other country and NOLs in one state cannot be used to offset income in any other state. Accordingly, we may be subject to tax in certain jurisdictions even if we have unused NOLs in other jurisdictions. Also, each jurisdiction in which we operate may have its own limitations on our ability to utilize NOLs or tax credit carryovers generated in that jurisdiction. These limitations may increase our federal, state, and/or foreign income tax liability.
Our current credit facility with Highbridge Principal StrategiesHPS Investment Partners, LLC and Capital One, N.A. contains, and any future loan agreements we may enter into may contain, operating and financial covenants that may restrict our business and financing activities.
We have a $100.0 million amended and restated credit facility or the(the Restated Credit Facility,Facility) with Highbridge Principal Strategies,HPS Investment Partners, LLC or Highbridge, $74.4and Capital One, N.A., consisting of a $75.0 million term loan and a $25.0 million revolving credit facility, which includes a $15.0 million letter of which was outstanding ascredit sub-facility (increased to $20.0 million in April 2017). As of March 31, 2016.2017, the aggregate outstanding balance under the Restated Credit Facility was $76.9 million. The Restated Credit Facility is secured by substantially all of our assets. In addition, from time to time, we enter into various loan, working capital and accounts receivable financing facilities to finance the construction and ongoing operations of our advanced manufacturing facilities and other capital expenditures. The Restated Credit Facility contains various financial covenants and restrictions on our and our operating subsidiaries’ excess cash flows and ability to make capital expenditures, incur additional indebtedness and pay dividends or make distributions on, or repurchase, our stock. The operating and financial restrictions and covenants of the Restated Credit Facility, as well as our other existing and any future financing agreements that we may enter into, may restrict our ability to finance our operations, engage in business activities or expand or fully pursue our business strategies. Our ability to comply with these covenants may be affected by events beyond our control, and we may not be able to maintain appropriate minimum EBITDA (as defined in the Credit Facility), leverage ratio and fixed charge coverage ratio requirements in the future. A breach of any of these covenants could result in a default under the applicable loan facility, which could cause all of the outstanding indebtedness under such facility to become immediately due and payable by us and/or enable the lender to terminate all commitments to extend further credit. In addition, if we were unable to repay the outstanding indebtedness upon a default, the lenderour lenders could proceed against the assets pledged as collateral to secure that indebtedness.
Our indebtedness may adversely affect our business, results of operations and financial condition.
Our substantial indebtedness could adversely affect our business, results of operations and financial condition by, among other things:
In addition, we may not be able to generate sufficient cash flow from our operations to repay our outstanding indebtedness when it becomes due and to meet our other cash needs or to comply with the financial covenants set forth therein. If we are not able to pay our debts as they become due, we could be in default under our loan agreement with Highbridgeof the Restated Credit Facility or other indebtedness. We might also be required to pursue one or more
alternative strategies to repay indebtedness, such as selling assets, refinancing or restructuring our indebtedness or selling additional debt or equity securities. We may not be able to refinance our debt or sell additional debt or equity securities or our assets on favorable terms, if at all, and if we must sell assets, it may negatively affect our ability to generate revenues.
Much of our intellectual property consists of trade secrets and know-how that is very difficult to protect. If we experience loss of protection for our trade secrets or know-how, our business would be substantially harmed.
We have a variety of intellectual property rights, including patents, trademarks and copyrights, but much of our most important intellectual property rights consists of trade secrets and know-how and effective intellectual property protection may be unavailable, limited or outside the scope of the intellectual property rights we pursue in the United States and in foreign countries such as China where we operate. Although we strive to protect our intellectual property rights, there is always a risk that our trade secrets or know-how will be compromised or that a competitor could lawfully reverse-engineer our technology or independently develop similar or more efficient technology. We have confidentiality agreements with each of our customers, suppliers, key employees and independent contractors in place to protect our intellectual property rights, but it is possible that a customer, supplier, employee or contractor might breach the agreement, intentionally or unintentionally. For example, we believe a key former employee may have shared some of our intellectual property with a competitor in China and this former employee or the competitor may use this intellectual property to compete with us in the future. It is also possible that our confidentiality agreements with customers, suppliers, employees and contractors will not be effective in preserving the confidential nature of our intellectual property rights. The patents we own could be challenged, invalidated, narrowed or circumvented by others and may not be of
sufficient scope or strength to provide us with any meaningful protection or commercial advantage. Once our patents expire, or if they are invalidated, narrowed or circumvented, our competitors may be able to utilize the inventions protected by our patents. Additionally, the existence of our intellectual property rights does not guarantee that we will be successful in any attempt to enforce these rights against third parties in the event of infringement, misappropriation or other misuse, which may materially and adversely affect our business. Because our ability to effectively compete in our industry depends upon our ability to protect our proprietary technology, we might lose business to competitors and our business, revenue, operating results and prospects could be materially harmed if we suffer loss of trade secret and know-how protection or breach of our confidentiality agreements.
If the transfer pricing arrangements we have among our subsidiaries are determined to be inappropriate in one or more jurisdictions, our tax liability may increase.
In many countries, including the United States, we are subject to transfer pricing and other tax regulations designed to ensure that appropriate levels of income are reported as earned in each jurisdiction in which we operate. These regulations require that any international transaction involving associated enterprises be on substantially the same basis as a transaction between unrelated companies dealing at arms’ length and that contemporaneous documentation be maintained to support the transfer prices. We have transfer pricing arrangements among our subsidiaries in relation to various aspects of our business. We consider the transactions among our subsidiaries to be substantially on arm’s-length terms. If, however, a tax authority in any jurisdiction reviews any of our tax returns and determines that the transfer prices and terms we have applied are not appropriate, or that other income of our affiliates should be taxed in that jurisdiction, we may incur increased tax liability, including accrued interest and penalties, which would cause our tax provision to increase, possibly materially. In addition, if the countryjurisdiction from which the income is reallocated does not agree with the reallocation, both countriesjurisdictions could tax the same income, resulting in double taxation. If tax authorities were to allocate income to a higher tax jurisdiction, subject our income to double taxation, or assess interest and penalties, it would increase our consolidated tax liability, which could materially harm our business, operating results and financial condition.
Our insurance coverage may not cover all risks we face and insurance premiums may increase, which may hinder our ability to maintain sufficient coverage to cover losses we may incur.
We are exposed to risks inherent in the manufacturing of wind blades and other composite structures as well as the construction of our facilities, such as natural disasters, breakdowns and manufacturing defects that could harm persons and damage property. We maintain insurance coverage with licensed insurance carriers that limits our aggregate exposure to certain types of catastrophic losses. In addition, we self-insure for a portion of our claims exposure resulting from workers’ compensation and certain events of general liability. We accrue currently for estimated incurred losses and expenses, and periodically evaluate and adjust our claims accrued liability amount to reflect our experience. However, our insurance coverage may not be sufficient to cover the full amount of potential losses. In addition, there are some types of losses such as from warranty, hurricanes, terrorism, wars, or earthquakes where insurance is limited and/or not economically justifiable. If we were to sustain a serious uninsured loss or a loss exceeding the limits of our insurance policies, the resulting costs could have a material adverse effect on our business prospects, results of operations and financial condition. Further, our insurance policies provide for our premiums to be adjusted annually. If the premiums we pay for our policies increase significantly, we may be unable to maintain the same level of coverage we currently carry, or we will incur significantly greater costs to maintain the same level of coverage, including through higher deductibles.
We may be subject to significant liabilities and costs relating to environmental and health and safety requirements.
We are subject to various environmental, health and safety laws, regulations and permit requirements in the jurisdictions in which we operate governing, among other things, health, safety, pollution and protection of
the environment and natural resources, the handling and use of hazardous substances, the generation, storage, treatment and disposal of wastes, and the cleanup of any contaminated sites. We have incurred, and expect to continue to incur, capital and operating expenditures to comply with such laws, regulations and permit requirements. While we believe that we currently are in material compliance with all such laws, regulations and permit requirements, any noncompliance may subject us to a range of enforcement measures, including the imposition of monetary fines and penalties, other civil or criminal sanctions, remedial obligations, and the issuance of compliance requirements restricting our operations. In addition, the future adoption of more stringent laws, regulations and permit requirements may require us to make additional capital and operating expenditures. Under certain environmental laws and regulations, liabilities also can be imposed for cleanup of currently and formerly owned, leased or operated properties, or properties to which we sent hazardous substances or wastes, regardless of whether we directly caused the contamination or violated any law. For example, we could have future liability relating to any contamination that remains from historic industrial operations by others at our properties. Additionally, some of our facilities have a long history of industrial operations and, in the past, contaminants have been detected and remediated at our Turkey facility.
There can be no assurance that we will not in the future become subject to compliance requirements, obligations to undertake cleanup or related activities, or claims or proceedings relating to environmental, health or safety matters, hazardous substances or wastes, contaminated sites, or other environmental or natural resource damages, that could impose significant liabilities and costs on us and materially harm our business, operating results or financial condition.
Claims that we infringe, misappropriate or otherwise misuse the intellectual property rights of others could subject us to significant liability and disrupt our business.
Our competitors and third party suppliers of components and raw materials used in our products protect their intellectual property rights by means such as trade secrets and patents. In the future we may be sued for violations of other parties’ intellectual property rights, and the risk of this type of lawsuit will likely increase as our size, geographic presence and market share expand and as the number of competitors in our market increases. Any such claims or litigation, whether meritorious or not, could:
Any of the foregoing could disrupt our business and materially harm our operating results and financial condition. In addition, intellectual property disputes have in the past arisen between our customers which negatively affected such customers’ demand for wind blades manufactured by us. If such intellectual property disputes involving, or between, one or more of our customers should arise in the future, our business could be materially harmed.
We may form joint ventures, or acquire businesses or assets, in the future, and we may not realize the benefits of those transactions.
We have, in the past, entered into joint ventures with third parties for the manufacture of wind blades. For example, we entered into joint ventures with third parties in both our Mexico and Turkey locations. We may create new or additional joint ventures with third parties, or acquire businesses or assets, in the future that we believe will complement or augment our existing business. We cannot assure you that, following any such joint venture or acquisition, we will achieve the expected synergies to justify the transaction. We may encounter numerous difficulties in manufacturing any new products resulting from a joint venture or acquisition that delay or prevent us from realizing their expected benefits or enhancing our business. If we enter into joint ventures or acquire businesses or assets with respect to promising markets, we may not be able to realize the benefit of those joint ventures or acquired businesses assets if we are unable to successfully integrate them with our existing operations and company culture.
Work disruptions resulting from our collective bargaining agreements could result in increased operating costs and materially harm our business, operating results and financial condition.
OurCertain of our employees in Turkey, which represented approximately 24%15% of our workforce as of June 30, 2016,March 31, 2017, are covered by collective bargaining arrangements, which expired on December 31, 2015. In May 2016, we entered into in May 2016 and have a new three-year collective bargainingterm. This agreement with our Turkish employees. We expect that the new agreement will resultresulted in an average increase in pay of approximately 20% for employees covered by the agreement. In addition, beginning on July 1, 2017, these collective bargaining arrangements will also cover similarly situated employees at our second Turkey facility, which represented approximately 7% of our workforce as of March 31, 2017, at which we recently commenced production. Additionally, our other employees working at other manufacturing facilities may vote to be represented by a labor union in the future. For example, our employees in Iowa attempted unsuccessfully to unionize in December 2013. There can be no assurance that we will not experience labor disruptions such as work stoppages or other slowdowns by workers at any of our facilities. Should significant industrial action, threats of strikes or related disturbances occur, we could experience a disruption of operations and increased labor costs in Turkey or other locations, which could materially harm our business, operating results or financial condition. Any such work stoppage or slow-down at any of our facilities could also result in additional expenses and possible loss of revenue for us.
Our information technology infrastructure could experience serious failures or disruptions, the failure of which could materially harm our business, operating results and financial condition.
Information technology is part of our business strategy and operations. It enables us to streamline operation processes, facilitating the collection and reporting of business data, in addition to internal and external communications. There are risks that information technology system failures, network disruptions and breaches of data security could disrupt our operations. Any significant disruption or breach may materially harm our business, operating results or financial condition.
We will incur significant increased costs as a result of operating as a public company, and our management will be required to devote substantial time to compliance initiatives.
As a public company, we will incur significant legal, accounting and other expenses that we did not incur as a private company. In addition, the Sarbanes-Oxley Act, as well as rules subsequently implemented by the SEC and The NASDAQ, Global Market, impose various requirements on public companies, including requiring establishment and maintenance of effective disclosure controls and internal control over financial reporting and changes in corporate governance practices. Our management and other personnel will need to devote a substantial amount of time to these compliance initiatives. Moreover, these rules and regulations will increase our legal and financial compliance costs and will make some activities more time-consuming and costly. For example, we expect these
rules and regulations to make it more difficult and more expensive for us to obtain director and officer liability insurance. We estimate that we will incur approximately $2.5 million to $3.0 million in expenses annually in response to these requirements.
Section 404(a) of the Sarbanes-Oxley Act requires annual management assessments of the effectiveness of our internal control over financial reporting, starting with the second annual report that we file with the SEC. However, as long as we remain an “emerging growth company,” as defined in the JOBS Act, we intend to take advantage of certain exemptions from various reporting requirements that are applicable to other public companies that are not “emergingemerging growth companies”companies including, but not limited to, not being required to comply with the auditor attestation requirements of Section 404(b) of the Sarbanes-Oxley Act. We will take advantage of these reporting exemptions until we are no longer an “emergingemerging growth company” and will incur additional expense and time related to these efforts at that time. We will remain an “emergingemerging growth company”company until the earliest of (i) the last day of the fiscal year in which we have total annual gross revenues of $1.0 billion or more; (ii) the last day of our fiscal year following the fifth anniversary of the date of the completion of this offering;our IPO; (iii) the date on which we have issued more than $1.0 billion in nonconvertible debt during the previous three years; or (iv) the date on which we are deemed to be a large“large accelerated filerfiler” under SEC rules.
Our testing, or the subsequent testing by our independent registered public accounting firm, may reveal deficiencies in our internal control over financial reporting that are deemed to be material weaknesses. Our management and other personnel will need to devote a substantial amount of time to these compliance initiatives, diverting their attention away from the day-to-day management of our business, and we may not successfully or efficiently manage our transition into a public company. We will also need to upgrade our systems, implement additional financial and management controls, reporting systems and procedures, hire an internal audit group and additional accounting, auditing and financial staff with appropriate public company experience and technical accounting knowledge. We have significant operations in China, Mexico and Turkey and may have difficulty hiring and retaining employees in these countries who have the experience necessary to implement the kind of management and financial controls that are expected of a U.S. public company. In this regard, for example, China has only recently begun to adopt management and financial reporting concepts and practices like those in the United States. If we are not able to comply with these requirements in a timely manner or if we or our independent registered public accounting firm identify deficiencies in our internal control over financial reporting that are deemed to be material weaknesses, the market price of our stock could decline, and we could be subject to sanctions or investigations by The NASDAQ, Global Market, the SEC or other regulatory authorities, which would require additional financial and management resources.
We are faced with increasingly complex tax issues in many jurisdictions, and we could be obligated to pay additional taxes in various jurisdictions.
We may be subject to taxation in many jurisdictions in the United States and around the world with increasingly complex tax laws, the application of which can be uncertain. The amount of taxes we pay in these jurisdictions could increase substantially as a result of changes in the applicable tax laws, including increased tax rates or revised interpretations of existing tax laws and precedents, which could harm our liquidity and operating results. In addition, the taxing authorities in these jurisdictions could review our tax returns, or authorities in jurisdictions in which we do not file tax returns could assert that we are subject to tax in those jurisdictions, and in either case could impose additional tax, interest and penalties. Further, the authorities could claim that various withholding requirements apply to us or our subsidiaries or assert that benefits of tax treaties are not available to us or our subsidiaries, any of which could have a material adverse impact on us and the results of our operations.
The current U.S. presidential administration has made public statements indicating that it has made international tax reform a priority, and key members of the U.S. Congress have conducted hearings and proposed a wide variety of potential changes. Certain changes to U.S. tax laws, including border adjustable tax provisions as well as limitations on the ability to defer U.S. taxation on earnings outside of the United States until those earnings are repatriated to the United States, could affect the tax treatment of our foreign earnings, as well as cash and cash equivalent balances we currently maintain outside of the United States.
Risks Related to thisThis Offering and Ownership of Our Common Stock
There has been no public market for our common stock, and an active, liquid trading market may not develop.
Before this offering, there was no public market for shares of our common stock. An active and liquid trading market may not develop following this offering or, if developed, may not be sustained. The lack of an active and liquid market may impair your ability to sell your shares of common stock at the time you wish to sell them or at a price that you consider reasonable. The lack of an active and liquid market may also reduce the market value and increase the volatility of your shares of common stock. In addition, an inactive and illiquid market may impair our ability to raise capital by selling shares of common stock and may impair our ability to acquire other business or assets by using shares of our common stock as consideration.
The price of our common stock may fluctuate substantially and your investment may decline in value.
The initial public offering price for the shares of our common stock to be sold in this offering was determined by negotiation between the representatives of the underwriters and us based upon a number of factors, including the history of, and the prospects for, our company and our industry, and may not be indicative of prices that will prevail following this offering. In addition, the market price of our common stock is likely to be highly volatile and may fluctuate substantially due to many factors, including:
In addition, the stock market in general, and Theincluding NASDAQ, Global Market, as well as the market for broader energy and renewable energy companies in particular, have experienced extreme price and volume fluctuations that have often been unrelated or disproportionate to the operating performance of particular companies affected. These broad market and industry factors may materially harm the market price of our common stock, regardless of our operating performance. In the past, securities class-action litigation has often been instituted against a company following periods of volatility in the market price of that company’s securities. Securities class-action litigation, if instituted against us, could result in substantial costs or damages and a diversion of management’s attention and resources, which could materially harm our business and operating results.
A significant portion of our total outstanding shares may be sold into the public market in future sales, which could cause the market price of our common stock to drop significantly, even if our business is doing well.
Sales of a substantial number of shares of our common stock in the public market could occur at any time after the expiration of the lock-up agreements described in the section entitled “Underwriting.” These sales, or the market perception that the holders of a large number of shares intend to sell shares, could reduce the
market price of our common stock. After the closeAs of this offering,March 31, 2017, we will have 32,781,263had 33,736,863 shares of common stock outstanding, assuming the underwriters do not exercise their option to purchase additional shares. This includes the 7,250,000outstanding. All shares that we are selling in this offering, which may be resold in the public market immediately. The remaining 25,531,263 shares will be able tocan now be sold, subject to any applicable volume limitations under federal securities laws, upon expiration of the lock-up agreements with the underwriters of this offering.laws.
In addition, as of March 31, 2016,2017 there are 61,720were: (i) 160,424 shares subject to outstanding Common Warrants,common stock warrants, or 0.2%approximately 0.5% of our outstanding shares after this offering, 3,348,628shares; (ii) 3,309,818 shares subject to outstanding options, or 10.2%approximately 9.8% of our outstanding shares after this offering, 654,120shares; (iii) 636,120 restricted stock units, or 2.0%approximately 1.9% of our outstanding shares; and (iv) 4,958,767 shares after this offering and 3,382,936 shares,reserved for future issuance, or 10.3%approximately 14.7% of our outstanding shares after this offering, reserved for future issuance under the 2015 Plan that will become eligible for sale in the public market to the extent permitted by any applicable vesting requirements the lock-up agreements and Rules 144 and 701 under the Securities Act. Moreover, after this offering, holders of an aggregate of approximately 25,008,03827,247,725 shares of our common stock, will have rights, subject to some conditions, to require us to file registration statements covering their shares or to include their shares in registration statements that we may file for ourselves or other stockholders. We also intend to registerhave registered all shares of common stock that we may issue under our employee equity incentive plans. Once we register theseThese shares they can be freely sold in the public market upon issuance and subject to the lock-up agreements and the restrictions imposed on our affiliates under Rule 144.
In the future, we may also issue our securities in connection with investments or acquisitions. The amount of shares of our common stock issued in connection with an investment or acquisition could constitute a material portion of our then-outstanding shares of our common stock. Any issuance of additional securities in connection with investments or acquisitions may result in additional dilution to you and may cause the market price of our common stock to drop significantly.
None of the proceeds from the sale of shares of common stock by the selling stockholders in this offering will be available to fund our operations.
We will not receive any proceeds from the sale of shares of our common stock by the selling stockholders in this offering. The selling stockholders, which include certain of our executive officers, will receive all proceeds from the sale of shares. Consequently, none of the proceeds from such sale will be available to fund our operations, capital expenditures or acquisition opportunities. See “Use of Proceeds” and “Principal and Selling Stockholders.”
The exercise of options and warrants and other issuances of shares of common stock or securities convertible into common stock under our equity compensation plans will dilute your interest.
Under our existing equity compensation plans, as of March 31, 2016,2017, we havehad outstanding options to purchase 3,348,6283,309,818 shares of our common stock and 654,120636,120 restricted stock units to our employees and non-employee directors. From time to time, we expect to grant additional options and other stock awards in accordance with the 2015 Plan. The exercise of options and warrants at prices below the market price of our common stock could adversely affect the price of shares of our common stock. Additionally, any issuance of our common stock that is not made solely to then-existing stockholders proportionate to their interests, such as in the case of a stock dividend or stock split, will result in dilution to each stockholder by reducing their percentage ownership of the total outstanding shares. If we issue options or warrants to purchase our common stock in the future and those options or warrants are exercised or we issue stock, stockholders may experience further dilution. In addition, as of March 31, 2017, there were 160,424 shares of our common stock subject to outstanding common stock warrants which could result in further dilution to the stockholders.
Our executive officers, directors and their affiliated entities will continue to have substantial control over us and could limit the ability of other stockholders to influence the outcome of key transactions, including changes of control.
Our executive officers, directors and their affiliated entities, will, in the aggregate, beneficially own approximately 77%74% of the outstanding common stock, or approximately 60% after this offering, excluding any exercise by the underwriters of their option to purchase additional shares, based on 32,781,26333,736,863 shares of common stock outstanding after this offering.as of March 31, 2017. Our executive officers, directors and their affiliated entities, if acting
together, will be able to control or significantly influence all matters requiring approval by our stockholders, including the election of directors and the approval of mergers or other significant corporate transactions. In addition, certain of our stockholders are affiliated with certain of our customers. These stockholders might have interests that differ from yours, and they might vote in a way with which you disagree and that could be adverse to your interests. The concentration of common stock ownership could have the effect of delaying, preventing, or deterring a change of control of our company, could deprive our stockholders of an opportunity to receive a premium for their common stock as part of a sale of our company, and could negatively affect the market price of the common stock.
As a new investor, you will experience immediate and substantial dilution in net tangible book value of your shares of common stock.
If you purchase common stock in this offering, you will pay more for your shares than the amounts paid by existing stockholders for their shares. As a result, you will experience immediate and substantial dilution of approximately $12.66 per share, representing the difference between the initial public offering price for our shares in this offering and our pro forma net tangible book value per share after giving effect to this offering at an assumed public offering price of $16.00, the mid-point of the range on the cover page of this prospectus. If the holders of outstanding options to purchase our common stock exercise these options in the future pursuant to our current or future stock option plans, you will incur further dilution. If we raise additional equity by issuing equity securities or convertible debt, or if we acquire other companies or technologies by issuing equity, the newly issued shares will further dilute your percentage ownership and may reduce the value of your investment.
If equity research analysts do not publish research or reports about our business or if they issue unfavorable commentary or downgrade our common stock, the price of our common stock could decline.
The trading market for our common stock will relyrelies in part on the research and reports that equity research analysts publish about us and our business. We do not control the work performed by these analysts. If
no securities or industry analysts commence coverage of our company, the trading price of our common stock would suffer. In the event we obtain securities or industry analyst coverage,The demand for our common stock could decline if one or more equity analysts downgrade our stock or if those analysts issue unfavorable or inaccurate commentary. If such analysts cease publishing reports about us or our business, we could lose visibility in the market, which in turn could cause our share price and trading volume to decline.
We do not currently intend to pay dividends on the common stock, which may hinder your ability to achieve a return on your investment.
We have never declared or paid any cash dividends on our common stock. The continued operation and expansion of our business will require substantial funding and thus we currently intend to retain any future earnings and do not expect to pay any dividends in the foreseeable future. Accordingly, you are not likely to receive any dividends on common stock in the foreseeable future, and your ability to achieve a return on your investment will therefore depend on appreciation in the price of the common stock.
Our management will have broad discretion over the use of the proceeds we receive in this offering and might not apply the proceeds in ways that increase the value of your investment.
Currently, we anticipate using the net proceeds to us from this offering for general corporate purposes, including funding the costs of our corporate, operating and expansion activities. Accordingly, our management will have broad discretion over the use of our net proceeds of this offering. You will be relying on their judgment regarding the application of those net proceeds. While our management intends to use our net proceeds in a manner that is in the best interests of our company and our stockholders, they might not apply the net proceeds in ways that increase the value of your investment. The market price of the common stock could fall if the market does not view our use of our net proceeds favorably.
Provisions of Delaware law or our charter documents could delay or prevent an acquisition of our company, even if the acquisition would be beneficial to our stockholders, and could make it more difficult for you to change management.
Provisions of Delaware law and our amended and restated certificate of incorporation and amended and restated by-laws which will be effective upon the completion of this offering, may discourage, delay or prevent a merger, acquisition or other change in control that stockholders may consider favorable, including transactions in which stockholders might otherwise receive a premium for their shares. These provisions may also prevent or delay attempts by stockholders to replace or remove our current management or members of our board of directors. These provisions include:
The affirmative vote of the holders of at least 75% of our shares of capital stock entitled to vote, and not less than 75% of the outstanding shares of each class entitled to vote thereon as a class, is necessary to amend or repeal the above provisions that are contained in our amended and restated certificate of incorporation. In
addition, absent approval of our board of directors, our amended and restated by-laws may only be amended or repealed by the affirmative vote of the holders of at least 75% of our shares of capital stock entitled to vote.
In addition, upon the closing of this offering, we will beare subject to the provisions of Section 203 of the Delaware General Corporation Law, which limits business combination transactions with stockholders of 15% or more of our outstanding voting stock that our board of directors has not approved. These provisions and other similar provisions make it more difficult for stockholders or potential acquirers to acquire us without negotiation. These provisions may apply even if some stockholders may consider the transaction beneficial to them.
As a result, these provisions could limit the price that investors are willing to pay in the future for shares of our common stock. These provisions might also discourage a potential acquisition proposal or tender offer, even if the acquisition proposal or tender offer is at a premium over the then current market price for our common stock.
We are an “emerging growth company” and will be able to avail ourselves of reduced disclosure requirements applicable to emerging growth companies, which could make our common stock less attractive to investors.
We are an “emerging growth company,” as defined in the JOBS Act, and we intend to take advantage of certain exemptions from various reporting requirements that are applicable to other public companies that are not “emergingemerging growth companies”companies including not being required to comply with the auditor attestation requirements of Section 404(b) of the Sarbanes-Oxley Act, reduced disclosure obligations regarding executive compensation in our periodic reports and proxy statements, and exemptions from the requirements of holding a nonbinding advisory vote on executive compensation and shareholder approval of any golden parachute payments not previously approved. We cannot predict whether investors will find our common stock less attractive because we may rely on these exemptions. If they do, there may be a less active trading market for our common stock and our stock price may be more volatile. We may take advantage of these reporting exemptions until we are no longer an “emergingemerging growth company.” We will remain an “emergingemerging growth company”company until the earliest of (i) the last day of the fiscal year in which we have total annual gross revenues of $1.0 billion or more; (ii) the last day of our fiscal year following the fifth anniversary of the date of the completion of this offering;our IPO; (iii) the date on which we have issued more than $1.0 billion in nonconvertible debt during the previous three years; or (iv) the date on which we are deemed to be a large“large accelerated filerfiler” under the rules of the SEC.
Under the JOBS Act, emerging growth companies can also delay adopting new or revised accounting standards until such time as those standards apply to private companies. We have irrevocably elected not to avail ourselves of this exemption from new or revised accounting standards and, therefore, will bewe are subject to the same new or revised accounting standards as other public companies that are not emerging growth companies.
SPECIAL NOTE REGARDING FORWARD-LOOKING STATEMENTS
This prospectus contains forward-looking statements. All statements other than statements of historical facts contained in this prospectus, including statements regarding our future results of operations and financial position, business strategy and plans and objectives of management for future operations, are forward-looking statements. In many cases, you can identify forward-looking statements by terms such as “may,” “should,” “expects,” “plans,” “anticipates,” “could,” “intends,” “target,” “projects,” “contemplates,” “believes,” “estimates,” “predicts,” “potential” or “continue” or the negative of these terms or other similar words. Forward-looking statements contained in this prospectus include, but are not limited to, statements about:
These forward-looking statements are only predictions. These statements relate to future events or our future financial performance and involve known and unknown risks, uncertainties and other important factors that may cause our actual results, levels of activity, performance or achievements to materially differ from any future results, levels of activity, performance or achievements expressed or implied by these forward-looking statements. We have described in the “Risk Factors” section and elsewhere in this prospectus the principal risks and uncertainties that we believe could cause actual results to differ from these forward-looking statements. Because forward-looking statements are inherently subject to risks and uncertainties, some of which cannot be predicted or quantified, you should not rely on these forward-looking statements as guarantees of future events.
The forward-looking statements in this prospectus represent our views as of the date of this prospectus. We anticipate that subsequent events and developments will cause our views to change. However, while we may elect to update these forward-looking statements at some point in the future, we undertake no obligation to update any forward-looking statement to reflect events or developments after the date on which the statement is made or to reflect the occurrence of unanticipated events except to the extent required by applicable law. You should, therefore, not rely on these forward-looking statements as representing our views as of any date after the date of this prospectus. Our forward-looking statements do not reflect the potential impact of any future acquisitions, mergers, dispositions, joint ventures, or investments we may make.
We estimate that the net proceeds fromThe selling stockholders, which include certain of our saleexecutive officers, are selling shares of 7,250,000 shares ofour common stock in this offering, willincluding any shares that may be $102.9 million, assuming an initial public offering pricesold in connection with the exercise of $16.00 per share, which is the midpoint of the estimated offering price range set forth on the cover page of this prospectus, and after deducting estimated underwriting discounts and commissions and estimated offering expenses payable by us. If the underwriters’ option to purchase additional sharesshares. See “Principal and Selling Stockholders.” Accordingly, we will not receive any proceeds from us is exercised in full, we estimate that our net proceeds would be approximately $119.1 million, after deducting estimated underwriting discounts and commissions and estimated offering expenses payable by us.
A $1.00 increase or decrease in the assumed initial public offering price would increase or decrease the net proceeds to us from this offering by approximately $6.7 million, assuming the number of shares offered, as set forth on the cover page of this prospectus, remains the same and after deducting estimated underwriting discounts and commissions and estimated offering expenses payable by us. Similarly, each increase or decrease of one million in the numbersale of shares of our common stock offered by us would increase or decrease the net proceeds that we receive fromin this offering. We will bear all costs, fees and expenses in connection with this offering, by approximately $14.9 million, assumingwhich are estimated to be $850,000, except that the assumed initial public offering price remains the same and after deducting the estimatedselling stockholders will pay all underwriting discounts and commissions and estimated offering expenses payablediscounts. See “Description of Capital Stock—Registration Rights” and “Underwriting.”
Our common stock has been listed on The NASDAQ Global Market under the symbol “TPIC” since July 22, 2016. Prior to that date, there was no public trading market for our common stock. The following table sets forth for the periods indicated the high and low intra-day per share sale prices for our common stock as reported on The NASDAQ Global Market:
| High | Low | |||||||
Year Ended December 31, 2016 | ||||||||
Third quarter (from July 22, 2016) | $ | 22.72 | $ | 11.31 | ||||
Fourth quarter | $ | 23.30 | $ | 13.27 | ||||
Year Ending December 31, 2017 | ||||||||
First quarter | $ | 20.99 | $ | 15.31 | ||||
Second quarter (through May 5, 2017) | $ | 20.85 | $ | 17.50 | ||||
On May 5, 2017, the last reported sale price of our common stock on The NASDAQ Global Market was $17.97 per share. As of March 31, 2017, we had 13 stockholders of record of our common stock. The actual number of stockholders is greater than this number of stockholders of record, and includes stockholders who are beneficial owners, but whose shares are held in street name by us.
We intend to use the net proceeds to us from this offering for working capitalbrokers, trusts and other general corporate purposes, including the financing of our existing manufacturing operations and the expansion in existing and new geographies as well as approximately $13.8 million to finance the repayment of certain indebtedness, as described below. However, these potential alternatives for the use of proceeds could change significantly depending upon the amount of cash generated by our operations, competitive and industry developments, market opportunities, the rate of growth, if any, of our business, and a variety of other factors. Although we currently have no agreements or commitments for any specific acquisitions, we may also use a portion of the net proceeds to us to expand our current business through strategic alliances or acquisitions of other businesses, products or technologies.
We intend to use the net proceeds from this offering to pay off approximately $10.0 million of indebtedness plus accrued interest of approximately $1.8 million issued pursuant to our outstanding Subordinated Convertible Promissory Notes. The Subordinated Convertible Promissory Notes bear interest at a rate of 12% per annum and will automatically mature and be due and payable on the earlier of the completion of any change of control or qualified initial public offering, or at the election of the holders of the notes at any time after the occurrence of an event of default. We have previously used the proceeds from this indebtedness for working capital purposes. We also intend to use the net proceeds from this offering to repay a $2.0 million advance from GE Wind. See “Certain Relationships and Related Party Transactions—GE Wind Customer Advance” for additional information.
Although we currently anticipate that we will use the net proceeds from this offering as described above, there may be circumstances where a reallocation of funds is necessary. The amounts and timing of our actual expenditures will depend upon numerous factors, including our sales and marketing efforts, demand for our products, our operating costs and the other factors described under “Risk Factors” in this prospectus. Accordingly, our management will have flexibility in applying the net proceeds from this offering. An investor will not have the opportunity to evaluate the economic, financial or other information on which we base our decisions on how to use the proceeds. Pending the application of our net proceeds, we intend to invest our net proceeds in U.S. government securities and other short-term, investment-grade, interest-bearing instruments.nominees.
We have never declared or paid any cash dividends on shares of our capital stock. We currently intend to retain earnings, if any, to finance the development and growth of our business and do not anticipate paying cash dividends on the common stock in the future. Any payment of any future dividends will be at the discretion of the board of directors, subject to compliance with certain covenants in our loan agreements, after taking into account various factors, including our financial condition, operating results, capital requirements, restrictions contained in any future financing instruments, growth plans and other factors the board deems relevant.
The following table describes our cash and cash equivalents, as well as our capitalization, as of March 31, 2016 on:
The pro forma as adjusted information set forth in the table below is illustrative only and will be adjusted based on the actual initial public offering price and other final terms of this offering.2017. You should read this table together with the consolidated financial statements and related notes included elsewhere in this prospectus, as well as the sections titled “Selected Consolidated Financial and Other Data” and “Management’s Discussion and Analysis of Financial Condition and Results of Operations” that are included elsewhere in this prospectus.
As of March 31, 2016 | ||||||||||||
Actual | Pro Forma | Pro Forma As | ||||||||||
(In thousands, except share and per share data) (Unaudited) | ||||||||||||
Cash and cash equivalents | $ | 35,842 | $ | 35,842 | $ | 125,222 | ||||||
|
|
|
|
|
| |||||||
Debt: | ||||||||||||
Current maturities of long-term debt | $ | 53,637 | $ | 53,637 | $ | 53,637 | ||||||
Long-term debt, net of debt issuance costs, discount and current maturities | 77,526 | 77,526 | 69,551 | |||||||||
|
|
|
|
|
| |||||||
Total debt | 131,163 | 131,163 | 123,188 | |||||||||
|
|
|
|
|
| |||||||
Convertible and Senior Redeemable Preferred Shares and Warrants: | ||||||||||||
Series A convertible preferred shares, $0.01 par value; liquidation preference equal to $51,342; 3,551 shares authorized; 3,551 shares issued and outstanding | 51,342 | — | — | |||||||||
Series B convertible preferred shares, $0.01 par value; liquidation preference equal to $41,600; 2,813 shares authorized; 2,287 shares issued and outstanding | 41,600 | — | — | |||||||||
Series B-1 convertible preferred shares, $0.01 par value; liquidation preference equal to $53,030; 2,972 shares authorized; 2,972 shares issued and outstanding | 53,030 | — | — | |||||||||
Series C convertible preferred shares, $0.01 par value; liquidation preference equal to $17,670; 2,944 shares authorized; 2,944 shares issued and outstanding | 17,670 | — | — | |||||||||
Senior redeemable preferred shares, $0.01 par value; liquidation preference equal to $65,415; 740 shares authorized; 740 shares issued and outstanding | 28,278 | — | — | |||||||||
Super senior redeemable preferred shares, $0.01 par value; liquidation preference equal to $22,345; 1,024 shares authorized; 280 shares issued and outstanding | 8,278 | — | — | |||||||||
Redeemable preferred share warrants, 248 warrants issued and outstanding | 1,084 | — | — | |||||||||
|
|
|
|
|
| |||||||
Total convertible and senior redeemable preferred shares and warrants: | 201,282 | — | — | |||||||||
|
|
|
|
|
| |||||||
Shareholders’ Equity (Deficit): | ||||||||||||
Common shares, $0.01 par value, 100,000,000 shares authorized and 4,238,487 shares issued and outstanding, actual; 100,000,000 shares authorized and 25,531,263 shares issued and outstanding, pro forma; 100,000,000 shares authorized and 32,781,263 shares issued and outstanding, pro forma as adjusted | — | 255 | 328 | |||||||||
Paid-in capital | — | 201,027 | 303,834 | |||||||||
Accumulated other comprehensive income | 403 | 403 | 403 | |||||||||
Accumulated deficit | (191,863 | ) | (191,863 | ) | (193,888 | ) | ||||||
|
|
|
|
|
| |||||||
Total shareholders’ equity (deficit) | (191,460 | ) | 9,822 | 110,677 | ||||||||
|
|
|
|
|
| |||||||
Total capitalization | $ | 140,985 | $ | 140,985 | $ | 233,865 | ||||||
|
|
|
|
|
| |||||||
If the underwriters’ option to purchase additional shares from us were exercised in full, pro forma as adjusted cash and cash equivalents, paid-in capital, total shareholders’ equity (deficit) and shares issued and outstanding as of March 31, 2016 would be $141.4 million, $320.0 million, $126.9 million and 33,868,763 shares, respectively.
March 31, 2017 | ||||
(unaudited) | ||||
(in thousands, except par value data) | ||||
Cash and cash equivalents | $ | 115,541 | ||
|
| |||
Debt: | ||||
Current maturities of long-term debt | $ | 32,474 | ||
Long-term debt, net of debt issuance costs, discount and current maturities | 88,015 | |||
|
| |||
Total debt | 120,489 | |||
|
| |||
Shareholders’ Equity: | ||||
Common shares, $0.01 par value, 100,000 shares authorized and 33,737 shares issued and outstanding | 337 | |||
Paid-in capital | 294,570 | |||
Accumulated other comprehensive loss | (3,585 | ) | ||
Accumulated deficit | (179,256 | ) | ||
|
| |||
Total shareholders’ equity | 112,066 | |||
|
| |||
Total capitalization | $ | 232,555 | ||
|
| |||
The pro forma and pro forma as adjusted columns in the table above excludeexcludes the following:
If you invest in our common stock in this offering, your ownership interest will be diluted to the extent of the difference between the initial public offering price per share of our common stock and the pro forma as adjusted net tangible book value per share of our common stock immediately after this offering. Net tangible book value dilution per share to new investors represents the difference between the amount per share paid by purchasers of shares of common stock in this offering and the pro forma as adjusted net tangible book value per share of common stock immediately after completion of this offering.
Net tangible book value per share is determined by dividing our total tangible assets less our total liabilities by the number of shares of common stock outstanding. Our historical net tangible book value as of March 31, 2016 was $(194.6) million, or $(45.92) per share. Our pro forma net tangible book value as of March 31, 2016 was $6.6 million, or $0.26 per share, based on the total number of shares of our common stock outstanding as of March 31, 2016, after giving effect to the automatic conversion of all outstanding shares of our convertible preferred stock as of March 31, 2016 into an aggregate of 21,110,204 shares of common stock and the conversion of our Series B warrants into an aggregate of 182,572 shares of common stock, which conversion will occur immediately prior to the completion of this offering.
After giving effect to the sale by us of 7,250,000 shares of common stock in this offering at the assumed initial public offering price of $16.00 per share, which is the midpoint of the estimated offering price range set forth on the cover page of this prospectus, and after deducting estimated underwriting discounts and commissions and estimated offering expenses payable by us, our pro forma as adjusted net tangible book value as of March 31, 2016 would have been $109.5 million, or $3.34 per share. This represents an immediate increase in pro forma net tangible book value of $3.08 per share to our existing stockholders and an immediate dilution in pro forma net tangible book value of $12.66 per share to investors purchasing shares of common stock in this offering at the assumed initial public offering price. The following table illustrates this dilution:
Assumed initial public offering price per share | $ | 16.00 | ||||||
Pro forma net tangible book value per share as of March 31, 2016 | $ | 0.26 | ||||||
Increase in pro forma as adjusted net tangible book value per share attributable to new investors in this offering | 3.08 | |||||||
|
| |||||||
Pro forma as adjusted net tangible book value per share immediately after this offering | 3.34 | |||||||
|
| |||||||
Dilution in pro forma net tangible book value per share to new investors in this offering | $ | 12.66 | ||||||
|
|
Each $1.00 increase or decrease in the assumed initial public offering price of $16.00 per share, which is the midpoint of the estimated offering price range set forth on the cover page of this prospectus, would increase or decrease, as applicable, our pro forma as adjusted net tangible book value per share by $0.21, and would increase or decrease, as applicable, dilution per share to new investors in this offering by $0.93, assuming that the number of shares offered by us, as set forth on the cover page of this prospectus, remains the same and after deducting estimated underwriting discounts and commissions and estimated offering expenses payable by us. An increase of 1.0 million shares in the number of shares offered by us would increase our pro forma as adjusted net tangible book value per share by $0.34, and would increase our dilution per share to new investors in this offering by $0.08, after deducting estimated underwriting discounts and commissions and estimated offering expenses payable by us. A decrease of 1.0 million shares in the number of shares offered by us would decrease our pro forma as adjusted net tangible book value per share by $0.36, and would decrease our dilution per share to new investors in this offering by $0.11, after deducting estimated underwriting discounts and commissions and estimated offering expenses payable by us. In addition, to the extent any outstanding options to purchase common stock are exercised, new investors would experience further dilution. If the underwriters exercise their option to purchase additional shares from us in full, the pro forma as adjusted net tangible book value per share of our common stock immediately after this offering would be $3.71 per share, and the dilution in pro forma net tangible book value per share to new investors in this offering would be $12.29 per share.
The following table presents, on a pro forma as adjusted basis as of March 31, 2016, after giving effect to the conversion of all outstanding shares of convertible preferred stock into common stock and the conversion of our Series B warrants immediately prior to the completion of this offering, the differences between the existing stockholders and the new investors purchasing shares of our common stock in this offering with respect to the number of shares purchased from us, the total consideration paid or to be paid to us, which includes net proceeds received from the issuance of common stock and convertible preferred stock, and the average price per share paid or to be paid to us at an assumed offering price of $16.00 per share, which is the midpoint of the estimated offering price range set forth on the cover page of this prospectus, before deducting estimated underwriting discounts and commissions and estimated offering expenses payable by us:
Shares Purchased | Total Consideration | Average Price per Share | ||||||||||||||||||
Number | Percent | Amount | Percent | |||||||||||||||||
Existing stockholders | 25,531,263 | 77.9 | % | $ | 108,747,579 | 48.4 | % | $ | 4.26 | |||||||||||
New investors | 7,250,000 | 22.1 | 116,000,000 | 51.6 | 16.00 | |||||||||||||||
|
|
|
|
|
|
|
|
|
| |||||||||||
Totals | 32,781,263 | 100.0 | % | $ | 224,747,579 | 100.0 | % | $ | 6.86 | |||||||||||
|
|
|
|
|
|
|
|
|
| |||||||||||
Each $1.00 increase or decrease in the assumed initial public offering price of $16.00 per share, which is the midpoint of the estimated offering price range set forth on the cover page of this prospectus, would increase or decrease, as applicable, the total consideration paid by new investors and total consideration paid by all stockholders by approximately $6.7 million, assuming that the number of shares offered by us, as set forth on the cover page of this prospectus, remains the same and after deducting estimated underwriting discounts and commissions payable by us. An increase or decrease of 1.0 million shares in the number of shares offered by us would increase or decrease, as applicable, the total consideration paid by new investors and total consideration paid by all stockholders by approximately $14.9 million, assuming that the number of shares offered by us, as set forth on the cover page of this prospectus, remains the same and after deducting estimated underwriting discounts and commissions payable by us. In addition, to the extent any outstanding options to purchase common stock are exercised, new investors will experience further dilution.
Except as otherwise indicated, the above discussion and tables assume no exercise of the underwriters’ option to purchase additional shares. If the underwriters exercise their option to purchase additional shares from us in full, the total consideration paid by new investors and total consideration paid by all stockholders would increase, as applicable, by approximately $17.4 million, and our existing stockholders would own 75.4% and our new investors would own 24.6% of the total number of shares of our common stock outstanding upon the completion of this offering.
The number of shares of our common stock to be outstanding after this offering is based on the number of shares of our common stock outstanding as of March 31, 2016 and excludes:
SELECTED CONSOLIDATED FINANCIAL AND OTHER DATA
The following selected consolidated statements of operations data for the three months ended March 31, 20162017 and 20152016 and the consolidated balance sheet data as of March 31, 20162017 have been derived from our unaudited interim condensed consolidated financial statements included elsewhere in this prospectus. In our opinion, these unaudited interim condensed consolidated financial statements have been prepared on a basis consistent with our audited financial statements and contain all adjustments, consisting only of a normal recurring nature, that are necessary for a fair presentation of such consolidated financial data. The consolidated statements of operations data for the years ended December 31, 2016, 2015 2014 and 20132014 and the consolidated balance sheet data as of December 31, 20152016 and 20142015 have been derived from our audited consolidated financial statements included elsewhere in this prospectus. The consolidated statements of operations data for the year ended December 31, 2013 and the consolidated balance sheet data as of December 31, 2014 have been derived from our audited consolidated financial statements included in our final prospectus filed with the SEC on July 22, 2016. Our historical results are not necessarily indicative of the results that may be expected in the future and the results in the three months ended March 31, 2016 are not necessarily indicative of results to be expected for the full year or any other period.future. The selected consolidated financial and other data in this section are not intended to replace the consolidated financial statements and are qualified in their entirety by the consolidated financial statements and related notes included elsewhere in this prospectus and in our final prospectus filed with the SEC on July 22, 2016 and should be read in conjunction with “Management’s Discussion and Analysis of Financial Condition and Results of Operations” and the consolidated financial statements, related notes and other financial information included elsewhere in this prospectus.prospectus and in our final prospectus filed with the SEC on July 22, 2016.
| Three Months Ended March 31, | Year Ended December 31, | |||||||||||||||||||||||||||||||||||||||||||
Three Months Ended | Year Ended December 31, | 2017 | 2016 | 2016 | 2015 | 2014 | 2013 | |||||||||||||||||||||||||||||||||||||
2016 | 2015 | 2015 | 2014 | 2013 | (unaudited) | |||||||||||||||||||||||||||||||||||||||
(in thousands, except per share data) | (in thousands, except per share data) | |||||||||||||||||||||||||||||||||||||||||||
Consolidated Statements of Operations Data: | ||||||||||||||||||||||||||||||||||||||||||||
Net sales | $ | 176,110 | $ | 95,589 | $ | 585,852 | $ | 320,747 | $ | 215,054 | $ | 191,602 | $ | 176,110 | $ | 754,877 | $ | 585,852 | $ | 320,747 | $ | 215,054 | ||||||||||||||||||||||
|
|
|
|
|
|
|
|
|
|
| ||||||||||||||||||||||||||||||||||
Cost of sales | 159,866 | 90,884 | 528,247 | 289,528 | 200,182 | 167,423 | 159,866 | 659,745 | 528,247 | 289,528 | 200,182 | |||||||||||||||||||||||||||||||||
Startup and transition costs | 3,306 | 4,154 | 15,860 | 16,567 | 6,607 | 6,159 | 3,306 | 18,127 | 15,860 | 16,567 | 6,607 | |||||||||||||||||||||||||||||||||
|
|
|
|
|
|
|
|
|
|
| ||||||||||||||||||||||||||||||||||
Total cost of goods sold | 163,172 | 95,038 | 544,107 | 306,095 | 206,789 | 173,582 | 163,172 | 677,872 | 544,107 | 306,095 | 206,789 | |||||||||||||||||||||||||||||||||
|
|
|
|
|
|
|
|
|
|
| ||||||||||||||||||||||||||||||||||
Gross profit | 12,938 | 551 | 41,745 | 14,652 | 8,265 | 18,020 | 12,938 | 77,005 | 41,745 | 14,652 | 8,265 | |||||||||||||||||||||||||||||||||
General and administrative expenses | 4,749 | 3,208 | 14,126 | 9,175 | 7,566 | 8,306 | 4,749 | 33,892 | 14,126 | 9,175 | 7,566 | |||||||||||||||||||||||||||||||||
|
|
|
|
|
|
|
|
|
|
| ||||||||||||||||||||||||||||||||||
Income (loss) from operations | 8,189 | (2,657 | ) | 27,619 | 5,477 | 699 | ||||||||||||||||||||||||||||||||||||||
Income from operations | 9,714 | 8,189 | 43,113 | 27,619 | 5,477 | 699 | ||||||||||||||||||||||||||||||||||||||
|
|
|
|
|
|
|
|
|
|
| ||||||||||||||||||||||||||||||||||
Other income (expense): | ||||||||||||||||||||||||||||||||||||||||||||
Interest income | 21 | 59 | 161 | 186 | 155 | 19 | 21 | 344 | 161 | 186 | 155 | |||||||||||||||||||||||||||||||||
Interest expense | (3,912 | ) | (3,551 | ) | (14,565 | ) | (7,236 | ) | (3,474 | ) | (3,026 | ) | (3,912 | ) | (17,614 | ) | (14,565 | ) | (7,236 | ) | (3,474 | ) | ||||||||||||||||||||||
Loss on extinguishment of debt | — | — | — | (2,946 | ) | — | — | — | (4,487 | ) | — | (2,946 | ) | — | ||||||||||||||||||||||||||||||
Realized gain (loss) on foreign currency remeasurement | (439 | ) | 163 | (1,802 | ) | (1,743 | ) | (1,892 | ) | |||||||||||||||||||||||||||||||||||
Realized loss on foreign currency remeasurement | (1,381 | ) | (439 | ) | (757 | ) | (1,802 | ) | (1,743 | ) | (1,892 | ) | ||||||||||||||||||||||||||||||||
Miscellaneous income | 190 | 129 | 246 | 539 | 140 | 320 | 190 | 238 | 246 | 539 | 140 | |||||||||||||||||||||||||||||||||
|
|
|
|
|
|
|
|
|
|
| ||||||||||||||||||||||||||||||||||
Total other expense | (4,140 | ) | (3,200 | ) | (15,960 | ) | (11,200 | ) | (5,071 | ) | (4,068 | ) | (4,140 | ) | (22,276 | ) | (15,960 | ) | (11,200 | ) | (5,071 | ) | ||||||||||||||||||||||
|
|
|
|
|
|
|
|
|
|
| ||||||||||||||||||||||||||||||||||
Income (loss) before income taxes | 4,049 | (5,857 | ) | 11,659 | (5,723 | ) | (4,372 | ) | 5,646 | 4,049 | 20,837 | 11,659 | (5,723 | ) | (4,372 | ) | ||||||||||||||||||||||||||||
Income tax benefit (provision) | (2,303 | ) | 120 | (3,977 | ) | (925 | ) | 3,346 | (2,101 | ) | (2,303 | ) | (6,995 | ) | (3,977 | ) | (925 | ) | 3,346 | |||||||||||||||||||||||||
|
|
|
|
|
|
|
|
|
|
| ||||||||||||||||||||||||||||||||||
Net income (loss) before noncontrolling interest | 1,746 | (5,737 | ) | 7,682 | (6,648 | ) | (1,026 | ) | — | — | 13,842 | 7,682 | (6,648 | ) | (1,026 | ) | ||||||||||||||||||||||||||||
Net loss attributable to noncontrolling interest(1) | — | — | — | — | 2,305 | — | — | — | — | — | 2,305 | |||||||||||||||||||||||||||||||||
|
|
|
|
|
|
|
|
|
|
| ||||||||||||||||||||||||||||||||||
Net income (loss) | 1,746 | (5,737 | ) | 7,682 | (6,648 | ) | 1,279 | 3,545 | 1,746 | 13,842 | 7,682 | (6,648 | ) | 1,279 | ||||||||||||||||||||||||||||||
Net income attributable to preferred shareholders(2) | 2,437 | 2,356 | 9,423 | 13,930 | 14,149 | — | 2,437 | 5,471 | 9,423 | 13,930 | 14,149 | |||||||||||||||||||||||||||||||||
|
|
|
|
|
|
|
|
|
|
| ||||||||||||||||||||||||||||||||||
Net loss attributable to common shareholders | $ | (691 | ) | $ | (8,093 | ) | $ | (1,741 | ) | $ | (20,578 | ) | $ | (12,870 | ) | |||||||||||||||||||||||||||||
Net income (loss) attributable to common shareholders | $ | 3,545 | $ | (691 | ) | $ | 8,371 | $ | (1,741 | ) | $ | (20,578 | ) | $ | (12,870 | ) | ||||||||||||||||||||||||||||
|
|
|
|
|
|
|
|
|
|
| ||||||||||||||||||||||||||||||||||
Weighted-average common shares outstanding, basic and diluted(3) | 4,238 | 4,238 | 4,238 | 4,238 | 4,238 | |||||||||||||||||||||||||||||||||||||||
|
|
|
|
| ||||||||||||||||||||||||||||||||||||||||
Net loss per common share, basic and diluted(3) | $ | (0.16 | ) | $ | (1.91 | ) | $ | (0.41 | ) | $ | (4.86 | ) | $ | (3.04 | ) | |||||||||||||||||||||||||||||
|
|
|
|
| ||||||||||||||||||||||||||||||||||||||||
Pro forma net income attributable to common shareholders | $ | 1,746 | $ | 7,682 | ||||||||||||||||||||||||||||||||||||||||
|
| |||||||||||||||||||||||||||||||||||||||||||
Pro forma weighted-average common shares outstanding (unaudited) | ||||||||||||||||||||||||||||||||||||||||||||
Weighted-average common shares outstanding: | ||||||||||||||||||||||||||||||||||||||||||||
Basic(3) | 25,531 | 25,531 | 33,737 | 4,238 | 17,530 | 4,238 | 4,238 | 4,238 | ||||||||||||||||||||||||||||||||||||
|
| |||||||||||||||||||||||||||||||||||||||||||
Diluted(3) | 25,553 | 25,553 | 33,827 | 4,238 | 17,616 | 4,238 | 4,238 | 4,238 | ||||||||||||||||||||||||||||||||||||
|
| |||||||||||||||||||||||||||||||||||||||||||
Pro forma net loss per common share (unaudited) | ||||||||||||||||||||||||||||||||||||||||||||
Net income (loss) per common share: | ||||||||||||||||||||||||||||||||||||||||||||
Basic | $ | 0.07 | $ | 0.30 | $ | 0.11 | $ | (0.16 | ) | $ | 0.48 | $ | (0.41 | ) | $ | (4.86 | ) | $ | (3.04 | ) | ||||||||||||||||||||||||
|
| |||||||||||||||||||||||||||||||||||||||||||
Diluted | $ | 0.07 | $ | 0.30 | $ | 0.10 | $ | (0.16 | ) | $ | 0.48 | $ | (0.41 | ) | $ | (4.86 | ) | $ | (3.04 | ) | ||||||||||||||||||||||||
|
| |||||||||||||||||||||||||||||||||||||||||||
| Three Months Ended March 31, | Year Ended December 31, | |||||||||||||||||||||||||||||||||||||||||||
Three Months Ended | Year Ended December 31, | 2017 | 2016 | 2016 | 2015 | 2014 | 2013 | |||||||||||||||||||||||||||||||||||||
2016 | 2015 | 2015 | 2014 | 2013 | (unaudited) | |||||||||||||||||||||||||||||||||||||||
(in thousands, except other operating information) | (in thousands, except other operating information) | |||||||||||||||||||||||||||||||||||||||||||
Other Financial Information: | ||||||||||||||||||||||||||||||||||||||||||||
Total billings(4) | $ | 174,538 | $ | 117,090 | $ | 600,107 | $ | 362,749 | $ | 221,057 | $ | 211,360 | $ | 174,538 | $ | 764,424 | $ | 600,107 | $ | 362,749 | $ | 221,057 | ||||||||||||||||||||||
EBITDA(4) | $ | 10,951 | $ | 36 | $ | 37,479 | $ | 8,768 | $ | 6,502 | $ | 12,482 | $ | 10,951 | $ | 55,491 | $ | 37,479 | $ | 11,714 | $ | 6,502 | ||||||||||||||||||||||
Adjusted EBITDA(4) | $ | 11,390 | $ | (127 | ) | $ | 39,281 | $ | 13,457 | $ | 8,430 | $ | 15,570 | $ | 11,390 | $ | 66,150 | $ | 39,281 | $ | 13,457 | $ | 8,430 | |||||||||||||||||||||
Capital expenditures | $ | 10,888 | $ | 10,605 | $ | 26,361 | $ | 18,924 | $ | 7,065 | $ | 16,922 | $ | 10,888 | $ | 30,507 | $ | 26,361 | $ | 18,924 | $ | 7,065 | ||||||||||||||||||||||
Total debt, net of debt issuance costs and discount | $ | 131,163 | $ | 115,287 | $ | 129,346 | $ | 120,849 | $ | 36,562 | $ | 120,489 | $ | 131,163 | $ | 123,155 | $ | 129,346 | $ | 120,849 | $ | 36,562 | ||||||||||||||||||||||
Net debt(4) | $ | 101,392 | $ | 98,070 | $ | 90,667 | $ | 87,547 | $ | 26,590 | $ | 7,095 | $ | 101,392 | $ | 6,379 | $ | 90,667 | $ | 87,547 | $ | 26,590 | ||||||||||||||||||||||
Other Operating Information: | ||||||||||||||||||||||||||||||||||||||||||||
Sets(5) | 486 | 303 | 1,609 | 966 | 648 | 636 | 486 | 2,154 | 1,609 | 966 | 648 | |||||||||||||||||||||||||||||||||
Estimated megawatts(6) | 1,113 | 645 | 3,595 | 2,029 | 1,173 | 1,460 | 1,113 | 4,920 | 3,595 | 2,029 | 1,173 | |||||||||||||||||||||||||||||||||
Total manufacturing line capacity(7) | 32 | 30 | 32 | 30 | 16 | |||||||||||||||||||||||||||||||||||||||
Dedicated manufacturing lines | 38 | 29 | 34 | 29 | 16 | 44 | 38 | 44 | 34 | 29 | 16 | |||||||||||||||||||||||||||||||||
Total manufacturing lines installed(8) | 39 | 32 | 33 | 30 | 22 | 14 | ||||||||||||||||||||||||||||||||||||||
Manufacturing lines in startup(9) | 0 | 8 | 10 | 9 | 2 | 9 | — | 3 | 10 | 9 | 2 | |||||||||||||||||||||||||||||||||
Manufacturing lines in transition(10) | 3 | 4 | 11 | 8 | 2 | — | 3 | 3 | 11 | 8 | 2 | |||||||||||||||||||||||||||||||||
| (1) |
| (2) | Represents the annual accrual of dividends on our convertible and senior redeemable preferred shares, the accretion to redemption amounts on our convertible preferred shares and warrant fair value adjustments. Immediately prior to the closing of the IPO, all preferred shares were converted into shares of our common stock and as a result, the accrual of dividends ceased. |
| (3) | For the |
| (4) | See |
| (5) | Number of wind blade sets (which consist of three wind blades) invoiced |
| (6) | Estimated megawatts of energy capacity to be generated by wind blade sets invoiced in the period. See “Management’s Discussion and Analysis of Financial Condition and Results of Operations—Key Metrics Used By Management to Measure Performance” for more information. |
| (7) | Number of manufacturing lines |
| Number of manufacturing lines installed and either in |
| (9) | Number of manufacturing lines in a startup phase during the pre-production and production ramp-up periods. See “Management’s Discussion and Analysis of Financial Condition and Results of Operations—Key Metrics Used By Management to Measure Performance” for more information. |
| (10) | Number of manufacturing lines that were being transitioned to a new wind blade model during the period. See “Management’s Discussion and Analysis of Financial Condition and Results of Operations—Key Metrics Used By Management to Measure Performance” for more information. |
| March 31, 2016 | December 31, | |||||||||||
| 2015 | 2014 | |||||||||||
(in thousands) | ||||||||||||
Consolidated Balance Sheet Data: | ||||||||||||
Cash and cash equivalents | $ | 35,842 | $ | 45,917 | $ | 43,592 | ||||||
Total assets | | 358,462 | | 329,920 | (11) | 277,960 | ||||||
Total debt | 131,163 | 129,346 | (11) | 125,105 | ||||||||
Total liabilities | 348,640 | 322,287 | (11) | 275,704 | ||||||||
Total convertible and senior redeemable preferred shares and warrants |
| 201,282 |
| 198,830 | 189,349 | |||||||
Total shareholders’ deficit | (191,460 | ) | (191,197 | ) | (187,093 | ) | ||||||
| March 31, 2017 | December 31, | |||||||||||||||
| 2016 | 2015 | 2014 | ||||||||||||||
(unaudited) | (in thousands) | |||||||||||||||
Consolidated Balance Sheet Data: | ||||||||||||||||
Cash and cash equivalents | $115,541 | $ | 119,066 | $ | 45,917 | $ | 43,592 | |||||||||
Total assets | $477,941 | 437,206 | 329,920 | 273,704 | ||||||||||||
Total debt | $120,489 | 123,155 | 129,346 | 120,849 | ||||||||||||
Total liabilities | $365,875 | 330,699 | 322,287 | 271,448 | ||||||||||||
Total convertible and senior redeemable preferred shares and warrants | — | — | 198,830 | 189,349 | ||||||||||||
Total shareholders’ equity (deficit) | $112,066 | 106,507 | (191,197 | ) | (187,093 | ) | ||||||||||
MANAGEMENT’S DISCUSSION AND ANALYSIS OF
FINANCIAL CONDITION AND RESULTS OF OPERATIONS
You should read the following discussion and analysis of our financial condition and results of operations together with our consolidated financial statements and the related notes and other financial information appearing elsewhere in this prospectus. Some of the information contained in this discussion and analysis or set forth elsewhere in this prospectus, including information with respect to plans and strategy for our business and related financing, includes forward-looking statements that involve risks and uncertainties. Our actual results could differ materially from those described in or implied by these forward-looking statements as a result of various factors, including those discussed below and elsewhere in this prospectus, particularly those under “Risk Factors.” Dollars in tabular format are presented in thousands, except as otherwise indicated.
OVERVIEW
Our Company
We are the largest U.S.-based independent manufacturer of composite wind blades. We enable many of the industry’s leading wind turbine OEMs, who have historically relied on in-house production, to outsource the manufacturing of some of their wind blades through our global footprint of advanced manufacturing facilities strategically located to serve large and growing wind markets in a cost-effective manner. Given the importance of wind energy capture, turbine reliability and cost to power producers, the size, quality and performance of wind blades have become highly strategic to our OEM customers. As a result, we have become a key supplier to our OEM customers in the manufacture of wind blades and related precision molding and assembly systems. We have entered into long-term supply agreements pursuant to which we dedicate capacity at our facilities to our customers in exchange for their commitment to purchase minimum annual volumes of wind blade sets, which consist of three wind blades. As of March 31, 2016,April 28, 2017, our long-term supply agreements provide for minimum aggregate volume commitments from our customers of $1.5approximately $2.7 billion and encourage our customers to purchase additional volume up to, in the aggregate, a total contract value of over $3.0approximately $4.2 billion through the end of 2021.2023. This collaborative dedicated supplier model provides us with contracted volumes that generate significant revenue visibility, drive capital efficiency and allow us to produce wind blades at a lower total delivered cost, while ensuring critical dedicated capacity for our customers. Our wind blade and precision molding and assembly systems manufacturing businesses accounted for over 99%, over 99%, 99% and 97% of our total net sales infor the three months ended March 31, 20162017 and infor each of the years ended December 31, 2016, 2015 2014 and 2013, respectively.2014. In recent years, we have experienced significant growth in our OEM customer base, as according to data from MAKE, our OEM customers collectively accounted for approximately 32%42% of the global onshore wind energy market and approximately 56%63% of that market excluding China over the three years ended December 31, 2015,2016, based on MWs of energy capacity installed. Additionally, our customers represented 82%99.8% of the U.S. onshore wind turbine market over the three years ended December 31, 2015,2016, based on MWs of energy capacity installed. We believe this figure demonstrates the leading position of our existing OEM customers, as well as our opportunity to develop relationships with new OEM customers as additional OEMs seek to capitalize on the benefits of outsourced wind blade manufacturing while maintaining high quality customization and dedicated capacity. We believe that these trends will help us to strengthen our current customer base, grow our business worldwide, increase our revenue and improve our business prospects.
We divide our business operations into four geographic operating segments—the United States, Asia, Mexico and Europe, the Middle East and Africa or EMEA,(EMEA) as follows:
Key Trends Affecting our Business
We have identified the following material trends affecting our business:
We expect that a substantial portion of our future revenue growth will be derived from our international operations. We have expanded our manufacturing facilities internationally over the last several years, including opening facilities in China, Mexico and Turkey, to meet the needs of our customers. We haverecently entered into lease agreements with third parties to lease new manufacturing facilities in Mexico and Turkey, and we expect to commencecommenced operations at these new facilities in the third quarter of 2016. We have also entered into a new lease with a third party for a third manufacturing facility in Juárez, Mexico, and we commenced operations at this facility in January 2017. The portion of our net sales that were derived from our international operations increased to
|
We expect our new manufacturing facilities to generate operating losses in their first 12 to 24 months of operations due to startup costs and expenses as they initially operate far below capacity during the pre-production and production ramp up periods. As a result, this generally has a negative impact on our results of operations during these ramp-up periods. These losses include initial operating losses and pre-production expenses such as the selection of the plant site, infrastructure investment, build-out cost, customer qualification and associated legal, regulatory and personnel costs. In addition, construction of new facilities and expansion of existing facilities, including the fabrication of precision molding and assembly systems to outfit those facilities, is complex and
|
COMPONENTS OF RESULTS OF OPERATIONS
Net Sales
Net sales reflect sales of our products, including wind blades, precision molding and assembly systems and transportation products, as well as transition revenue received. Several factors affect net sales in any period, including customer demand, wind blade model transitions, general economic conditions and weather conditions. We currently derive an immaterial amount of net sales from our transportation business. Under GAAP, we do not recognize revenue on our wind blade sales until the wind blades have been delivered to our customers. Under our long-term supply agreements with our customers, we invoice our customers for wind blades once the blades pass certain acceptance procedures and title passes to our customers. Our customers generally pay us for the wind
blades between 15 to 65 days after receipt of the invoice based on negotiated payment terms. However, in many cases, our customers request that we store their wind blades until they are ready to assemble wind turbines at a particular wind farm project. We have no control over when our customers decide to ship wind blades from our storage sites, and in some cases, our customers have stored large numbers of their wind blades at our sites for six months or more. Even if the customer has paid us for the wind blades and title has passed to the customer, we do not recognize revenue for these wind blades until the wind blades are delivered. Instead, these transactions are recorded as deferred revenue in our consolidated financial statements.
Cost of Goods Sold
Cost of goods sold includes the costs associated with products invoiced during the period as well as unallocated manufacturing overhead costs associated with startup and transition costs. Cost of sales includes all costs incurred at our production facilities to make products saleable, such as raw materials, direct labor and indirect labor and facilities costs, including purchasing and receiving costs, plant management, inspection costs, product engineering and internal transfer costs. In addition, all depreciation associated with assets used to produce composite products and make them saleable is included in cost of sales. Direct labor costs consist of salaries, benefits, share-based compensation and other personnel related costs for employees engaged in the manufacture of our products.
Startup costs represent the unallocated overhead related to both new manufacturing facilities as well as new lines in existing manufacturing facilities. Transition costs represent the unallocated overhead related to the transition of wind blade models at the request of our customers. The startup and transition costs are primarily fixed overhead costs incurred during the period production facilities are under-utilized while transitioning wind blade models and ramping up manufacturing, thatwhich are not allocated to products and are expensed as incurred. The cost of sales for the initial wind blades from a new model manufacturing line is generally higher than when the line is operating at optimal production volume levels due to inefficiencies during ramp-up related to labor hours per blade, cycle times per blade and raw material usage. Additionally, manufacturing overhead as a percentage of net sales is generally higher during the period in which a facility is ramping up to full production capacity due to underutilization of the facility. Manufacturing overhead at each of our facilities includes virtually all indirect costs (including share-based compensation costs) incurred at the plants, including engineering, finance, information technology, human resources and plant management.
General and Administrative Expenses
General and administrative expenses are primarily incurred at our corporate headquarters and our research facilities and include salaries, benefits and other personnel related costs for employees engaged in research and development, engineering, finance, information technology, human resources, marketingbusiness development, global operational excellence, global supply chain, in-house legal and executive management. Other costs include outside legal and accounting fees, risk management (insurance), global operational excellence, global supply chain, in-house legal, share-based compensation and certain other administrative and global resources costs.
For the three months ended March 31, 20162017 and 20152016 and for the years ended December 31, 2016, 2015 2014 and 2013,2014, our research and development expenses (included in general and administrative expenses) totaled $0.3 million, $0.2$0.3 million, $1.5 million, $0.9 million $0.8 million and $0.6$0.8 million, respectively.
Other Income (Expense)
Other income (expense) consists primarily of interest expense on our credit facilities and the amortization of deferred financing costs and beneficial conversion features related to debt borrowings. Other income (expense) also includes realized gains and losses on foreign currency remeasurement, interest income and miscellaneous income and expense. During the year ended December 31, 2016, we expensed $2.4 million of deferred financing costs and $2.1 million of prepayment penalties related to the refinancing of our previous credit facility. During the year ended December 31, 2014, we incurred a $2.9 million loss on the extinguishment of our senior term loan. This loss included prepayment penalties, an end of term fee and the write off of the remaining debt issuance costs under our previous senior term loan.
Income Tax Benefit (Provision)
Income tax benefit (provision) consists of federal, state, provincial, local and foreign taxes based on income in jurisdictions in which we operate, including in the United States, China, Mexico and Turkey. The
composite income tax rate, tax provisions, deferred tax assets and deferred tax liabilities vary according to the jurisdiction in which the income (loss) arises. Tax laws are complex and subject to different interpretations by management and the respective governmental taxing authorities and require us to exercise judgment in determining our income tax provision, our deferred tax assets and liabilities and the valuation allowance recorded against our net deferred tax assets.
Net Loss Attributable to Noncontrolling Interest
From the time we began operations in Turkey in March 2012 through December 2013, we had minority shareholders who owned 25% of TPI Turkey. We purchased that 25% ownership interest in December 2013 and now own 100% of TPI Turkey. Net loss attributable to noncontrolling interest reflects the portion of our overall net income or loss that is attributable to this noncontrolling interest through the date we acquired 100% of the Turkey operation. The remaining balance equates to the net income or loss.
Net Income Attributable to Preferred Shareholders
Net income attributable to preferred shareholders relates to the annual accrual of dividends on our convertible and senior redeemable preferred shares, and the accretion to redemption amounts on our convertible preferred shares and warrant fair value adjustment. Effective uponImmediately prior to the closing of this offering, our IPO, all preferred shares will bewere converted into shares of our common stock and as a result, the accrual of dividends on our preferred shares will cease.ceased.
KEY METRICS USED BY MANAGEMENT TO MEASURE PERFORMANCE
In addition to measures of financial performance presented in our consolidated financial statements in accordance with GAAP, we use certain other financial measures and operating metrics to analyze the performance of our company. The “non-GAAP” financial measures consist of total billings, EBITDA, adjusted EBITDA and net debt, which help us evaluate growth trends, establish budgets, assess operational efficiencies, oversee our overall liquidity, and evaluate our overall financial performance. The key operating metrics consist of wind blade sets invoiced, estimated MWs of energy capacity for wind blades invoiced, total manufacturing line capacity, manufacturing lines dedicated to customers under long-term supply agreements, total manufacturing lines installed, manufacturing lines in startup and manufacturing lines in transition, which help us evaluate our operational performance. We believe that these measures are useful to investors in evaluating our performance.
Key Financial Measures
| Three Months Ended March 31, | Year Ended December 31, | |||||||||||||||||||
(in thousands) | 2016 | 2015 | 2015 | 2014 | 2013 | |||||||||||||||
Net sales | $ | 176,110 | $ | 95,589 | $ | 585,852 | $ | 320,747 | $ | 215,054 | ||||||||||
Total billings(1) | $ | 174,538 | $ | 117,090 | $ | 600,107 | $ | 362,749 | $ | 221,057 | ||||||||||
Net income (loss) | $ | 1,746 | $ | (5,737 | ) | $ | 7,682 | $ | (6,648 | ) | $ | 1,279 | ||||||||
EBITDA(1) | $ | 10,951 | $ | 36 | $ | 37,479 | $ | 8,768 | $ | 6,502 | ||||||||||
Adjusted EBITDA(1) | $ | 11,390 | $ | (127 | ) | $ | 39,281 | $ | 13,457 | $ | 8,430 | |||||||||
Capital expenditures | $ | 10,888 | $ | 10,605 | $ | 26,361 | $ | 18,924 | $ | 7,065 | ||||||||||
Total debt, net of debt issuance costs and discount | $ | 131,163 | $ | 115,287 | $ | 129,346 | $ | 120,849 | $ | 36,562 | ||||||||||
Net debt(1) | $ | 101,392 | $ | 98,070 | $ | 90,667 | $ | 87,547 | $ | 26,590 | ||||||||||
(unaudited) Net sales Total billings(1) Net income (loss) EBITDA(1) Adjusted EBITDA(1) Capital expenditures Total debt, net of debt issuance costs and discount Net debt(1) Three Months Ended
March 31, Year Ended December 31, 2017 2016 2016 2015 2014 (in thousands) $ 191,602 $ 176,110 $ 754,877 $ 585,852 $ 320,747 $ 211,360 $ 174,538 $ 764,424 $ 600,107 $ 362,749 $ 3,545 $ 1,746 $ 13,842 $ 7,682 $ (6,648 ) $ 12,482 $ 10,951 $ 55,491 $ 37,479 $ 11,714 $ 15,570 $ 11,390 $ 66,150 $ 39,281 $ 13,457 $ 16,922 $ 10,888 $ 30,507 $ 26,361 $ 18,924 $ 120,489 $ 131,163 $ 123,155 $ 129,346 $ 120,849 $ 7,095 $ 101,392 $ 6,379 $ 90,667 $ 87,547
Key Operating Metrics
| Three Months Ended March 31, | Year Ended December 31, | Three Months Ended March 31, | Year Ended December 31, | |||||||||||||||||||||||||||||||||||||
| 2016 | 2015 | 2015 | 2014 | 2013 | 2017 | 2016 | 2016 | 2015 | 2014 | |||||||||||||||||||||||||||||||
Sets(2) | 486 | 303 | 1,609 | 966 | 648 | 636 | 486 | 2,154 | 1,609 | 966 | ||||||||||||||||||||||||||||||
Estimated megawatts(3) | 1,113 | 645 | 3,595 | 2,029 | 1,173 | 1,460 | 1,113 | 4,920 | 3,595 | 2,029 | ||||||||||||||||||||||||||||||
Total manufacturing line capacity(4) | 32 | 30 | 32 | 30 | 16 | |||||||||||||||||||||||||||||||||||
Dedicated manufacturing lines(5) | 38 | 29 | 34 | 29 | 16 | |||||||||||||||||||||||||||||||||||
Dedicated manufacturing lines(4) | 44 | 38 | 44 | 34 | 29 | |||||||||||||||||||||||||||||||||||
Total manufacturing lines installed(5) | 39 | 32 | 33 | 30 | 22 | |||||||||||||||||||||||||||||||||||
Manufacturing lines in startup(6) | 0 | 8 | 10 | 9 | 2 | 9 | — | 3 | 10 | 9 | ||||||||||||||||||||||||||||||
Manufacturing lines in transition(7) | 3 | 4 | 11 | 8 | 2 | — | 3 | 3 | 11 | 8 | ||||||||||||||||||||||||||||||
| (1) | See below for more information and a reconciliation of total billings, EBITDA, adjusted EBITDA and net debt to net sales, net income (loss), net income (loss) and total debt, net of debt issuance costs and discount, respectively, the most directly comparable financial measures calculated and presented in accordance with GAAP. |
| (2) | Number of wind blade sets (which consist of three wind blades) invoiced |
| (3) | Estimated megawatts of energy capacity to be generated by wind blade sets invoiced in the period. |
| (4) |
| Number of manufacturing lines that are dedicated to our customers under long-term supply agreements. Dedicated manufacturing lines may be greater than total manufacturing line capacity in instances where we have signed new supply agreements for manufacturing facilities that are under construction or have not yet been built. In April 2017, we entered into a multiyear supply agreement with Vestas to supply wind blades from two manufacturing lines in a new manufacturing facility in Matamoros, Mexico. See “Prospectus Summary—Recent Developments.” |
| (5) | Number of manufacturing lines installed and either in operation, startup or transition. |
| (6) | Number of manufacturing lines in a startup phase during the |
| (7) | Number of manufacturing lines that were being transitioned to a new wind blade model during the period. |
Net sales and total billings
We define total billings, a non-GAAP financial measure, as the total amounts we have invoiced our customers for products and services for which we are entitled to payment under the terms of our long-term supply agreements or other contractual agreements. We monitor total billings, and believe it is useful to present to investors as a supplement to our GAAP measures, because we believe it more directly correlates to sales activity and operations based on the timing of actual transactions with our customers, which facilitates comparison of our performance between periods and provides a more timely indication of trends in sales. Under GAAP, we do not recognize revenue on our wind blade sales until the wind bladesthey have been delivered to our customers. Under our long-term supply agreements with our customers, we invoice our customers for wind blades once the bladesthey pass certain acceptance procedures and title passes to our customers. Our customers generally pay us for the wind blades between 15 to 65 days after receipt of the invoice based on negotiated payment terms. However, in many cases, our customers request that we store their wind blades until they are ready to assemble wind turbines at a particular wind farm project. We have no control over when our customers decide towill ship wind blades from our storage sites, and in some cases, our customers have stored large numbers of their wind blades onat our sites for six months or more. Even if the customer has paid us for the wind blades and title has passed to the customer, we do not recognize revenue for these wind blades until the wind blades are delivered. Instead, these transactions are recorded as deferred revenue in our consolidated financial statements. However, we are contractually entitled to payment for those wind blades and, accordingly, invoice them when the blades are placed in storage.
Our use of total billings has limitations as an analytical tool, and you should not consider it in isolation or as a substitute for analysis of our results as reported under GAAP. Some of these limitations are:
EBITDA and Adjustedadjusted EBITDA
We define EBITDA, a non-GAAP financial measure, as net income or loss plus interest expense (net(including losses on the extinguishment of debt and net of interest income), income taxes and depreciation and amortization. We define adjusted EBITDA as EBITDA plus any share-based compensation expense, plus or minus any realized gains or losses from foreign currency remeasurement plus any losses on extinguishment of debt.remeasurement. Adjusted EBITDA is the primary metric used by our management and our board of directors to establish budgets and operational goals for managing our
business and evaluating our performance. In addition, our Credit Facility containsprevious credit facility contained minimum EBITDA (as defined in the Credit Facility)previous credit facility) covenants with which we mustwere required to comply. We monitor adjusted EBITDA as a supplement to our GAAP measures and believe it is useful to present to investors because we believe that it facilitates evaluation of our period-to-period operating performance by eliminating items that are not operational in nature, allowing comparison of our recurring core business operating results over multiple periods unaffected by differences in capital structure, capital investment cycles and fixed asset base. In addition, we believe adjusted EBITDA and similar measures are widely used by investors, securities analysts, ratings agencies, and other parties in evaluating companies in our industry as a measure of financial performance and debt-service capabilities.
Our use of adjusted EBITDA has limitations as an analytical tool and you should not consider it in isolation or as a substitute for analysis of our results as reported under GAAP. Some of these limitations are:
In evaluating EBITDA and adjusted EBITDA, you should be aware that in the future, we will incur expenses similar to the adjustments in this presentation. Our presentations of EBITDA and adjusted EBITDA should not be construed as suggesting that our future results will be unaffected by these expenses or any unusual or non-recurring items. When evaluating our performance, you should consider EBITDA and adjusted EBITDA alongside other financial performance measures, including our net income (loss) and other GAAP measures.
Net debt
We define net debt as the total principal amount of debt outstanding less unrestricted cash and cash equivalents. The total principal amount of debt outstanding is comprised of the long-term debt and current maturities of long-term debt as presented in our consolidated balance sheets adjusting for any debt issuance costs and discount. We believe that the presentation of net debt provides useful information to investors because our
management reviews net debt as part of our oversight of overall liquidity, financial flexibility and leverage. Net debt is important when we consider opening new plants and expanding existing plants, as well as for capital expenditure requirements.
The following table reconciles our non-GAAP key financial measures to the most directly comparable GAAP measures:
| Three Months Ended March 31, | Year Ended December 31, | |||||||||||||||||||
| 2016 | 2015 | 2015 | 2014 | 2013 | ||||||||||||||||
| (in thousands) | ||||||||||||||||||||
Net sales | $ | 176,110 | $ | 95,589 | $ | 585,852 | $ | 320,747 | $ | 215,054 | ||||||||||
|
|
|
|
|
|
|
|
|
| |||||||||||
Change in deferred revenue: | ||||||||||||||||||||
Blade-related deferred revenue at beginning of period(1) | (65,520 | ) | (59,476 | ) | (59,476 | ) | (20,646 | ) | (16,730 | ) | ||||||||||
Blade-related deferred revenue at end of period(1) | 65,027 | 76,534 | 65,520 | 59,476 | 20,646 | |||||||||||||||
Foreign exchange impact(2) | (1,079 | ) | 4,443 | 8,211 | 3,172 | 2,087 | ||||||||||||||
|
|
|
|
|
|
|
|
|
| |||||||||||
Change in deferred revenue | (1,572 | ) | 21,501 | 14,255 | 42,002 | 6,003 | ||||||||||||||
|
|
|
|
|
|
|
|
|
| |||||||||||
Total billings | $ | 174,538 | $ | 117,090 | $ | 600,107 | $ | 362,749 | $ | 221,057 | ||||||||||
|
|
|
|
|
|
|
|
|
| |||||||||||
Netincome (loss) | $ | 1,746 | $ | (5,737 | ) | $ | 7,682 | $ | (6,648 | ) | $ | 1,279 | ||||||||
Adjustments: | ||||||||||||||||||||
Depreciation and amortization | 3,011 | 2,401 | 11,416 | 7,441 | 5,250 | |||||||||||||||
Interest expense (net of interest income) | 3,891 | 3,492 | 14,404 | 7,050 | 3,319 | |||||||||||||||
Income tax provision (benefit) | 2,303 | (120 | ) | 3,977 | 925 | (3,346 | ) | |||||||||||||
|
|
|
|
|
|
|
|
|
| |||||||||||
EBITDA | 10,951 | 36 | 37,479 | 8,768 | 6,502 | |||||||||||||||
Realized loss (gain) on foreign currency remeasurement | 439 | (163 | ) | 1,802 | 1,743 | 1,892 | ||||||||||||||
Share-based compensation expense | — | — | — | — | 36 | |||||||||||||||
Loss on extinguishment of debt | — | — | — | 2,946 | — | |||||||||||||||
|
|
|
|
|
|
|
|
|
| |||||||||||
Adjusted EBITDA | $ | 11,390 | $ | (127 | ) | $ | 39,281 | $ | 13,457 | $ | 8,430 | |||||||||
|
|
|
|
|
|
|
|
|
| |||||||||||
(unaudited) Net sales Change in deferred revenue: Blade-related deferred revenue at beginning of period(1) Blade-related deferred revenue at end of period(1) Foreign exchange impact(2) Change in deferred revenue Total billings Net income (loss) Adjustments: Depreciation and amortization Interest expense (net of interest income) Loss on extinguishment of debt Income tax provision EBITDA Realized loss on foreign currency remeasurement Share-based compensation expense Adjusted EBITDA Three Months Ended
March 31, Year Ended December 31, 2017 2016 2016 2015 2014 (in thousands) $ 191,602 $ 176,110 $ 754,877 $ 585,852 $ 320,747 (69,568 ) (65,520 ) (65,520 ) (59,476 ) (20,646 ) 89,319 65,027 69,568 65,520 59,476 7 (1,079 ) 5,499 8,211 3,172 19,758 (1,572 ) 9,547 14,255 42,002 $ 211,360 $ 174,538 $ 764,424 $ 600,107 $ 362,749 $ 3,545 $ 1,746 $ 13,842 $ 7,682 $ (6,648 ) 3,829 3,011 12,897 11,416 7,441 3,007 3,891 17,270 14,404 7,050 — — 4,487 — 2,946 2,101 2,303 6,995 3,977 925 12,482 10,951 55,491 37,479 11,714 1,381 439 757 1,802 1,743 1,707 — 9,902 — — $ 15,570 $ 11,390 $ 66,150 $ 39,281 $ 13,457
| (1) | Total billings is reconciled using the blade-related deferred revenue amounts at the beginning and the end of the period as follows: |
| Three Months Ended March 31, | Year ended December 31, | Three Months Ended March 31, | Year Ended December 31, | |||||||||||||||||||||||||||||||||||||
| 2016 | 2015 | 2015 | 2014 | 2013 | 2017 | 2016 | 2016 | 2015 | 2014 | |||||||||||||||||||||||||||||||
(in thousands) | (unaudited) | (in thousands) | ||||||||||||||||||||||||||||||||||||||
Blade-related deferred revenue at beginning of period | $ | 65,520 | $ | 59,476 | $ | 59,476 | $ | 20,646 | $ | 16,730 | $ | 69,568 | $ | 65,520 | $ | 65,520 | $ | 59,476 | $ | 20,646 | ||||||||||||||||||||
Non-blade related deferred revenue at beginning of period | — | — | — | 757 | 1,512 | — | — | — | — | 757 | ||||||||||||||||||||||||||||||
|
|
|
|
|
|
|
|
|
| |||||||||||||||||||||||||||||||
Total current and noncurrent deferred revenue at beginning of period | $ | 65,520 | $ | 59,476 | $ | 59,476 | $ | 21,403 | $ | 18,242 | $ | 69,568 | $ | 65,520 | $ | 65,520 | $ | 59,476 | $ | 21,403 | ||||||||||||||||||||
|
|
|
|
|
|
|
|
|
| |||||||||||||||||||||||||||||||
Blade-related deferred revenue at end of period | $ | 65,027 | $ | 76,534 | $ | 65,520 | $ | 59,476 | $ | 20,646 | $ | 89,319 | $ | 65,027 | $ | 69,568 | $ | 65,520 | $ | 59,476 | ||||||||||||||||||||
Non-blade related deferred revenue at end of period | — | 3,351 | — | — | 757 | — | — | — | — | — | ||||||||||||||||||||||||||||||
|
|
|
|
|
|
|
|
|
| |||||||||||||||||||||||||||||||
Total current and noncurrent deferred revenue at end of period | $ | 65,027 | $ | 79,885 | $ | 65,520 | $ | 59,476 | $ | 21,403 | $ | 89,319 | $ | 65,027 | $ | 69,568 | $ | 65,520 | $ | 59,476 | ||||||||||||||||||||
|
|
|
|
|
|
|
|
|
| |||||||||||||||||||||||||||||||
| (2) | Represents the effect of the difference between the exchange rate used by our various foreign subsidiaries on the invoice date versus the exchange rate used at the period-end balance sheet date. |
Net debt is reconciled as follows:
| March 31, | December 31, | |||||||||||||||||||||||||||||||||||||||
| March 31, | December 31, | 2017 | 2016 | 2016 | 2015 | 2014 | ||||||||||||||||||||||||||||||||||
| 2016 | 2015 | 2015 | 2014 | 2013 | (unaudited) | (in thousands) | ||||||||||||||||||||||||||||||||||
Total debt, net of debt issuance costs and discount | $ | 131,163 | $ | 115,287 | $ | 129,346 | $ | 120,849 | $ | 36,562 | $ | 120,489 | $ | 131,163 | $ | 123,155 | $ | 129,346 | $ | 120,849 | ||||||||||||||||||||
Add debt issuance costs | 3,808 | 3,995 | 4,220 | 4,256 | 1,425 | 2,147 | 3,808 | 2,290 | 4,220 | 4,256 | ||||||||||||||||||||||||||||||
Add discount on debt | 2,263 | 5,350 | 3,018 | 6,034 | 358 | — | 2,263 | — | 3,018 | 6,034 | ||||||||||||||||||||||||||||||
Less cash and cash equivalents | (35,842 | ) | (26,562 | ) | (45,917 | ) | (43,592 | ) | (11,755 | ) | (115,541 | ) | (35,842 | ) | (119,066 | ) | (45,917 | ) | (43,592 | ) | ||||||||||||||||||||
|
|
|
|
|
|
|
|
|
| |||||||||||||||||||||||||||||||
Net debt | $ | 101,392 | $ | 98,070 | $ | 90,667 | $ | 87,547 | $ | 26,590 | $ | 7,095 | $ | 101,392 | $ | 6,379 | $ | 90,667 | $ | 87,547 | ||||||||||||||||||||
|
|
|
|
|
|
|
|
|
| |||||||||||||||||||||||||||||||
Key Operating Metrics
Key operating metrics consist of sets invoiced, estimated megawatts of energy capacity for wind blade sets invoiced, total manufacturing line capacity, dedicated manufacturing lines, total manufacturing lines installed, manufacturing lines in startup and manufacturing lines in transition. Sets represents the number of wind blade sets, consisting of three wind blades each that we invoiced worldwide during the period. We monitor sets and believe that presenting sets to investors is helpful because we believe that it is the most direct measurement of our manufacturing output during the period. Sets primarily impact net sales and total billings. Estimated megawatts are the energy capacity to be generated by wind blade sets sold in the period. Our estimate is based solely on name-plate capacity of the wind turbine on which our wind blades are expected to be installed. We monitor estimated megawatts and believe that presenting estimated megawatts to investors is helpful because we believe that it is a commonly followed measurement of energy capacity across our industry and provides an indication of our share of the overall wind blade market. Total manufacturing line capacity is the number of manufacturing lines our facilities can accommodate (but that may not yet have been installed). Dedicated manufacturing lines are the number of manufacturing lines that we have dedicated to our customers pursuant to our long-term supply agreements. Total manufacturing lines installed represents the number of manufacturing lines installed and either in operation, startup or transition. We monitor total manufacturing line capacity and dedicated manufacturing lines and total manufacturing lines installed and believe that presenting both of these metrics to investors is helpful because we believe that the number of dedicated manufacturing lines is the best indicator of demand for our wind blades from customers under our long-term supply agreements in any
given period. Dedicated manufacturing lines primarily impacts our net sales and total billings. We also believe that total manufacturing line capacity together with dedicated manufacturing lines provide an understanding of additional capacity within an existing facility.facility and that total manufacturing lines installed provides an understanding of the number of manufacturing lines installed and either in operation, startup or transition. Manufacturing lines in startup is the number of dedicated manufacturing lines that were in a startup phase during the pre-production and production ramp up period, pursuant to the opening of a new manufacturing facility, the expansion of an existing manufacturing facility or the addition of new manufacturing lines in an existing manufacturing facility. We monitor and present this metric because we believe it helps investors to better understand the impact of the startup phase of our new manufacturing facilities on our gross profit (loss) and net income (loss). Manufacturing lines in transition is the number of dedicated manufacturing lines that were being transitioned to a new wind blade model during the period. We monitor and present this metric because we believe it helps investors to better understand the impact of these transitions on our gross profit (loss) and net income (loss).
RESULTS OF OPERATIONS
Three Months Ended March 31, 2016 Compared to Three Months Ended March 31, 2015
The following table summarizes certain information relating to our operating results for the three months ended March 31, 2016 and 2015 that has been derived from our unaudited condensed consolidated financial statements.
| Three Months Ended March 31, | ||||||||
(in thousands) | 2016 | 2015 | ||||||
Net sales | $ | 176,110 | $ | 95,589 | ||||
|
|
|
| |||||
Cost of sales | 159,866 | 90,884 | ||||||
Startup and transition costs | 3,306 | 4,154 | ||||||
|
|
|
| |||||
Total cost of goods sold | 163,172 | 95,038 | ||||||
|
|
|
| |||||
Gross profit | 12,938 | 551 | ||||||
General and administrative expenses | 4,749 | 3,208 | ||||||
|
|
|
| |||||
Income (loss) from operations | 8,189 | (2,657 | ) | |||||
Other expense | (4,140 | ) | (3,200 | ) | ||||
|
|
|
| |||||
Income (loss) before income taxes | 4,049 | (5,857 | ) | |||||
Income tax benefit (provision) | (2,303 | ) | 120 | |||||
|
|
|
| |||||
Net income (loss) | 1,746 | (5,737 | ) | |||||
Net income attributable to preferred shareholders | 2,437 | 2,356 | ||||||
|
|
|
| |||||
Net loss attributable to common shareholders | $ | (691 | ) | $ | (8,093 | ) | ||
|
|
|
| |||||
The following table summarizes certain information relating to our operating results as a percentage of total net sales.
| Three Months Ended March 31, | ||||||||
| 2016 | 2015 | |||||||
Net sales | 100.0 | % | 100.0 | % | ||||
|
|
|
| |||||
Cost of sales | 90.8 | 95.1 | ||||||
Startup and transition costs | 1.9 | 4.3 | ||||||
|
|
|
| |||||
Total cost of goods sold | 92.7 | 99.4 | ||||||
|
|
|
| |||||
Gross profit | 7.3 | 0.6 | ||||||
General and administrative expenses | 2.7 | 3.4 | ||||||
|
|
|
| |||||
Income (loss) from operations | 4.6 | -2.8 | ||||||
Other expense | -2.3 | -3.3 | ||||||
|
|
|
| |||||
Income (loss) before income taxes | 2.3 | -6.1 | ||||||
Income tax benefit (provision) | -1.3 | 0.1 | ||||||
|
|
|
| |||||
Net income (loss) | 1.0 | -6.0 | ||||||
Net income attributable to preferred shareholders | 1.4 | 2.5 | ||||||
|
|
|
| |||||
Net loss attributable to common shareholders | -0.4 | % | -8.5 | % | ||||
|
|
|
| |||||
Net sales for the three months ended March 31, 2016 increased by $80.5 million or 84% to $176.1 million compared to $95.6 million in the same period in 2015. This was primarily driven by a 141% increase in the number of wind blades delivered in the three months ended March 31, 2016 compared to the same period in 2015. Net sales of wind blades were $164.7 million for the three months ended March 31, 2016 as compared to $78.6 million in the same period in 2015. These increases were primarily the result of additional wind blade volume in our plants in Mexico, China, Turkey and the U.S. Net sales from the manufacturing of precision molding and assembly systems during the three months ended March 31, 2016 decreased to $9.9 million from $17.0 million in the same period in 2015. This decrease was primarily the result of our customers not requiring precision molding and assembly systems from our China facility during the three months ended March 31, 2016. Total billings for the three months ended March 31, 2016 increased by $57.4 million or 49% to $174.5 million compared to $117.1 million in the same period in 2015. The impact of the strengthening of the U.S. dollar against the Euro at our Turkey operation on consolidated net sales and total billings for the three months ended March 31, 2016 was not significant compared to reductions of 4.2% and 4.4%, respectively, for the same period in 2015.
Total cost of goods sold for the three months ended March 31, 2016 was $163.2 million and included aggregate costs of $3.3 million related to startup costs in our new plants in Mexico and Turkey as well as the transition of wind blade models in our original plant in Mexico. This compares to total cost of goods sold for the three months ended March 31, 2015 of $95.0 million, including aggregate costs of $4.2 million related to the transition of wind blades in our U.S. plant and startup costs in Mexico and Dafeng, China. Cost of goods sold as a percentage of net sales of wind blades decreased by 9.9% in the three months ended March 31, 2016 as compared to the same period in 2015, driven by improved operating efficiency in China, Mexico and the U.S., which was partially offset by higher operating costs in our Turkey plant due to increased warranty costs. Cost of goods sold as a percentage of net sales from the manufacturing of precision molding and assembly systems increased by 6.5% during the three months ended March 31, 2016 as compared to the same period in 2015. The impact of the strengthening of the U.S. dollar against the Euro at our Turkey operation reduced consolidated cost of goods sold by 1.9% for three months ended March 31, 2016, compared to a 3.1% reduction for the same period in 2015.
General and administrative expenses for the three months ended March 31, 2016 totaled $4.7 million as compared to $3.2 million for the same period in 2015. As a percentage of net sales, general and administrative expenses were 2.7% for the three months ended March 31, 2016, down from 3.4% in the same period in 2015. The increased expenditures for general and administrative expenses were driven by the costs of enhancing our corporate support functions during this period of growth.
We granted awards of stock options and RSUs during 2015 and the three months ended March 31, 2016 to certain employees and non-employee directors. These awards include a performance condition requiring the completion of our initial public offering (IPO) and have a required vesting period of one to four years commencing upon achievement of the performance condition. We will begin recording compensation expense for these awards when the IPO is considered probable of achievement, which will not be deemed to occur until the consummation of the IPO, and therefore no compensation cost will be recognized until this offering occurs. If we consummate this offering, compensation expense will be recorded in the third quarter of 2016 for the requisite service period from the grant date through the offering date, with the balance of the share-based compensation expensed over the remaining vesting period. The compensation expense will be calculated based on the actual price per share at which shares of common stock are sold in this offering. The expected share-based compensation to be recorded in the third quarter of 2016 (based on an assumed price per share in this offering equal to the midpoint of the estimated offering price range set forth on the cover page of this prospectus) is approximately $13.9 million. The remaining unamortized amount of the share-based compensation expense for these awards will be amortized over the remaining individual service periods, which range from 12 to 48 months.
Other expense increased to $4.1 million for the three months ended March 31, 2016 from $3.2 million for the same period in 2015. This was driven by higher interest expense from additional borrowings under our credit facilities to fund our growth initiatives, most notably our expansions and ramp-ups in Dafeng, China, Mexico and Turkey.
Income tax provision increased to $2.3 million for the three months ended March 31, 2016 from a benefit of $0.1 million for the same period in 2015. The increase was primarily due to the operating results in China and Mexico.
Net income for the three months ended March 31, 2016 was $1.7 million, as compared to a net loss of $5.7 million in the same period in 2015. The increase was primarily due to the reasons set forth above.
Net income attributable to preferred shareholders was $2.4 million during both the three months ended March 31, 2016 and 2015.
Net loss attributable to common shareholders was $0.7 million during the three months ended March 31, 2016, versus a loss of $8.1 million in the same period in 2015. This was primarily due to the increase in net income (loss) discussed above.
Segment Discussion
The following table summarizes our net sales and income (loss) from operations by our four geographic operating segments:
Net Sales | Three Months Ended March 31, | |||||||
(in thousands) | 2016 | 2015 | ||||||
U.S. | $ | 51,761 | $ | 37,376 | ||||
Asia | 64,352 | 28,005 | ||||||
Mexico | 25,540 | 12,676 | ||||||
EMEA | 34,457 | 17,532 | ||||||
|
|
|
| |||||
Total net sales | $ | 176,110 | $ | 95,589 | ||||
|
|
|
| |||||
Income (Loss) from Operations | Three Months Ended March 31, | |||||||
(in thousands) | 2016 | 2015 | ||||||
U.S. | $ | (661 | ) | $ | (2,222 | ) | ||
Asia | 15,542 | 2,520 | ||||||
Mexico | 967 | (1,328 | ) | |||||
EMEA | (7,659 | ) | (1,627 | ) | ||||
|
|
|
| |||||
Income (loss) from operations | $ | 8,189 | $ | (2,657 | ) | |||
|
|
|
| |||||
U.S. Segment
Net sales in the three months ended March 31, 2016 were $51.8 million, up from $37.4 million in the same period in 2015. Net sales of wind blades were $40.3 million during the three months ended March 31, 2016 as compared to $29.0 million in the same period of 2015. The increase was driven by an increase in the number of wind blades delivered in the three months ended March 31, 2016 compared to the same period in 2015 due to the transition in 2015 to the production of larger wind blade models at our customer’s request. Net sales from the manufacturing of precision molding and assembly systems during the three months ended March 31, 2016 were $9.9 million compared to $8.4 million during the same period in 2015. This increase was primarily the result of model-specific tooling equipment manufactured in our Rhode Island facility as required by our customers due to the transition to larger wind blade models for use in our Mexico plant as well as for use at the plants of another U.S. wind blade manufacturer.
The loss from operations for the three months ended March 31, 2016 was $0.7 million as compared to a loss of $2.2 million in the same period in 2015, primarily driven by increased wind blade and precision molding volume discussed above.
Asia Segment
Net sales in the three months ended March 31, 2016 were $64.4 million, up from $28.0 million in the same period in 2015. Net sales of wind blades were $64.4 million in the three months ended March 31, 2016 as compared to $19.4 million in the same period in 2015. The increase was the result of a 328% increase in the number of wind blades delivered during the three months ended March 31, 2016 compared to the same period in 2015, along with a change in the mix of wind blade models sold. This was primarily the result of the start of production for a new customer in our Dafeng facility during the latter half of 2015 as well as the addition of one manufacturing line for an existing customer. There were no net sales from the manufacturing of precision molding and assembly systems during the three months ended March 31, 2016 compared to $8.6 million in the same period in 2015. The 2015 sales were driven by demand from our customers for precision molding in the United States, China and Turkey that we manufactured in our Taicang City facility.
Income from operations in the Asia segment for the three months ended March 31, 2016 was $15.5 million as compared to $2.5 million in the same period in 2015. In addition to the factors noted above, this increase reflected continued increasing operational efficiencies and other improvements in our Taicang Port and Dafeng wind blade facilities relative to the same period in 2015.
Mexico Segment
The Mexico segment had net sales of $25.5 million in the three months ended March 31, 2016 as compared to $12.7 million in the same period in 2015, reflecting a 123% increase in wind blade volume, notwithstanding the transition to the production of a larger wind blade model at our customer’s request during the period. Net sales of wind blades represents the entirety of net sales in the Mexico segment in the 2016 and 2015 periods.
Income from operations in the Mexico segment for the three months ended March 31, 2016 was $1.0 million as compared to a loss of $1.3 million in the same period in 2015. The improvement was due to the increase in wind blade volume in 2016 compared to the same period in 2015, partially offset by costs to transition to a larger wind blade model as described above.
EMEA Segment
Net sales during the three months ended March 31, 2016 were $34.5 million, up from $17.5 million in the same period in 2015. The increase was driven by a 121% increase in wind blade volume and changes in our wind blade mix. Net sales of wind blades represents the entirety of net sales in the EMEA segment in 2016 and 2015.
The loss from operations in the EMEA segment for the three months ended March 31, 2016 was $7.7 million as compared to a loss of $1.6 million in the same period in 2015. The decline was driven by an increase in the warranty reserve. This was partially offset by the higher wind blade volume noted above and improved operating performance. The impact of the strengthening U.S. dollar against the Euro and Turkish Lira reduced net sales and costs of goods sold in the three months ended March 31, 2016 by 1.7% and 10.8%, respectively. This compares to a 23.6% and 15.5% impact on net sales and cost of goods sold, respectively, for the comparable 2015 period.
Year Ended December 31, 2015 Compared to Year Ended December 31, 2014
The following table summarizes certain information relating to our operating results for the years ended December 31, 2015 and 2014 that has been derived from our consolidated financial statements.
Year Ended December 31, | ||||||||
(in thousands) | 2015 | 2014 | ||||||
Net sales | $ | 585,852 | $ | 320,747 | ||||
|
|
|
| |||||
Cost of sales | 528,247 | 289,528 | ||||||
Startup and transition costs | 15,860 | 16,567 | ||||||
|
|
|
| |||||
Total cost of goods sold | 544,107 | 306,095 | ||||||
|
|
|
| |||||
Gross profit | 41,745 | 14,652 | ||||||
General and administrative expenses | 14,126 | 9,175 | ||||||
|
|
|
| |||||
Income from operations | 27,619 | 5,477 | ||||||
Other expense | (15,960 | ) | (11,200 | ) | ||||
|
|
|
| |||||
Income (loss) before income taxes | 11,659 | (5,723 | ) | |||||
Income tax provision | (3,977 | ) | (925 | ) | ||||
|
|
|
| |||||
Net income (loss) | 7,682 | (6,648 | ) | |||||
Net income attributable to preferred shareholders | 9,423 | 13,930 | ||||||
|
|
|
| |||||
Net loss attributable to common shareholders | $ | (1,741 | ) | $ | (20,578 | ) | ||
|
|
|
| |||||
The following table summarizes certain information relating to our operating results as a percentage of total net sales.
| Year Ended December 31, | ||||||||
| 2015 | 2014 | |||||||
Net sales | 100.0 | % | 100.0 | % | ||||
|
|
|
| |||||
Cost of sales | 90.2 | 90.2 | ||||||
Startup and transition costs | 2.7 | 5.2 | ||||||
|
|
|
| |||||
Total cost of goods sold | 92.9 | 95.4 | ||||||
|
|
|
| |||||
Gross profit | 7.1 | 4.6 | ||||||
General and administrative expenses | 2.4 | 2.9 | ||||||
|
|
|
| |||||
Income from operations | 4.7 | 1.7 | ||||||
Other expense | -2.7 | -3.5 | ||||||
|
|
|
| |||||
Income (loss) before income taxes | 2.0 | -1.8 | ||||||
Income tax provision | -0.7 | -0.3 | ||||||
|
|
|
| |||||
Net income (loss) | 1.3 | -2.1 | ||||||
Net income attributable to preferred shareholders | 1.6 | 4.3 | ||||||
|
|
|
| |||||
Net loss attributable to common shareholders | -0.3 | % | -6.4 | % | ||||
|
|
|
| |||||
Net sales for the year ended December 31, 2015 increased by $265.2 million or 83% to $585.9 million compared to $320.7 million in the same period in 2014. This was primarily driven by a 91% increase in the number of wind blades delivered in the year ended December 31, 2015 compared to the same period in 2014. Net sales of wind blades were $535.2 million for the year ended December 31, 2015 as compared to $293.0 million in the same period in 2014. These increases were primarily the result of additional wind blade volume in our plants in Mexico, China and Turkey, partially offset by lower volume in the U.S. Net sales from the manufacturing of precision molding and assembly systems during the year ended December 31, 2015 increased to $47.3 million from $25.8 million in the same period in 2014. This increase was a result of precision molding and assembly systems manufactured in the United States and Asia for use in our U.S., China and Mexico facilities. Total billings for the year ended December 31, 2015 increased by $237.3 million or 65% to $600.1 million compared to total billings of $362.8 million in the same period in 2014. The impact of the strengthening of the U.S. dollar against the Euro at our Turkey operation on consolidated net sales and total billings were reductions of 4.8% and 4.1%, respectively, for the year ended December 31, 2015, with no material impact in the same period in 2014.
Total cost of goods sold for the year ended December 31, 2015 was $544.1 million and included aggregate costs of $15.9 million related to startup costs in our Mexico and Dafeng, China plants as well as the transition of wind blade models across all of our plants. This compares to total cost of goods sold for the year ended December 31, 2014 of $306.1 million, including aggregate costs of $16.6 million related to the transition of wind blades in our U.S. plant and startup costs in Mexico, Turkey and Dafeng, China. Cost of goods sold as a percentage of net sales of wind blades decreased by 3% in the year ended December 31, 2015 as compared to the same period in 2014 driven by improved operating efficiency in Mexico and Turkey, which was partially offset by higher operating costs in our U.S. and China plants due to the transition to the production of larger wind blade models at our customer’s request. Cost of goods sold as a percentage of net sales from the manufacturing of precision molding and assembly systems decreased by 1% during the year ended December 31, 2015 as compared to the same period in 2014. Similar to the impact to net sales above, the impact of the strengthening of the U.S. dollar against the Euro reduced consolidated cost of goods sold at our Turkey operation by 4.7% for year ended December 31, 2015, compared to 1.8% in the same period in 2014.
General and administrative expenses for the year ended December 31, 2015 totaled $14.1 million as compared to $9.2 million for the same period in 2014. As a percentage of net sales, general and administrative expenses were 2.4% for the year ended December31, 2015, down from 2.9% in the same period in 2014. The increased expenditures for general and administrative expenses were driven by the costs of enhancing our corporate support functions during this period of growth.
Other expense increased to $16.0 million for the year ended December31, 2015 from $11.2 million for the same period in 2014. This was driven by higher interest expense from additional borrowings under our credit facilities to fund our growth initiatives, most notably our expansions and ramp-ups in Dafeng, China and Turkey. The increase also related to the amortization of the beneficial conversion feature on our Subordinated Convertible Promissory Notes during 2015.
Income tax provision increased to $4.0 million for the year ended December31, 2015 from $0.9 million for the same period in 2014. The increase was primarily due to the operating results in China and Mexico.
Net income for the year ended December31, 2015 was $7.7 million, as compared to a net loss of $6.6 million in the same period in 2014. The increase was primarily due to the reasons set forth above.
Net income attributable to preferred shareholders decreased to $9.4 million during the year ended December31, 2015 from $13.9 million during the same period in 2014. This decrease was primarily due to the Series B, B-1 and C convertible preferred shares being fully accreted to their respective redemption amounts in 2014, partially offset by the normal period-over-period increase in the ongoing accrual of dividends.
Net loss attributable to common shareholders decreased to $1.7 million during the year ended December31, 2015 from a loss of $20.6 million in the same period in 2014. This decrease was primarily due to the decrease in the net income attributable to preferred shareholders and net income (loss) discussed above.
Segment Discussion
The following table summarizes our net sales and income from operations by our four geographic operating segments:
Net Sales | Year Ended December 31, | |||||||
(in thousands) | 2015 | 2014 | ||||||
U.S. | $ | 149,614 | $ | 145,691 | ||||
Asia | 206,779 | 79,325 | ||||||
Mexico | 97,912 | 28,725 | ||||||
EMEA | 131,547 | 67,006 | ||||||
|
|
|
| |||||
Total net sales | $ | 585,852 | $ | 320,747 | ||||
|
|
|
| |||||
Income (Loss) from Operations | Year Ended December 31, | |||||||
(in thousands) | 2015 | 2014 | ||||||
U.S. | $ | (13,405 | ) | $ | (1,199 | ) | ||
Asia | 34,998 | 14,771 | ||||||
Mexico | 7,531 | (6,567 | ) | |||||
EMEA | (1,505 | ) | (1,528 | ) | ||||
|
|
|
| |||||
Income from operations | $ | 27,619 | $ | 5,477 | ||||
|
|
|
| |||||
U.S. Segment
Net sales in the year ended December 31, 2015 were $149.6 million, up from $145.7 million in the same period in 2014. Net sales of wind blades were $122.4 million during the year ended December 31, 2015 as compared to $128.5 million in the same period of 2014. The decrease was driven by a reduction in the number of wind blades delivered in the year ended December 31, 2015 compared to the same period in 2014 due to the transition to the production of larger wind blade models at our customer’s request. Net sales from the manufacturing of precision molding and assembly systems during the year ended December 31, 2015 were $23.9 million compared to $15.3 million during the same period in 2014. This increase was primarily the result of model-specific tooling equipment manufactured in our Rhode Island facility as required by our customers due to the transition to larger wind blade models for use in the U.S. and Mexico facilities.
The loss from operations for the year ended December 31, 2015 was $13.4 million as compared to the loss from operations of $1.2 million in the same period in 2014, primarily driven by reduced wind blade volume discussed above as well as higher general and administrative expenses in the U.S., including at our headquarters, required to facilitate our growth worldwide.
Asia Segment
Net sales in the year ended December 31, 2015 were $206.8 million, up from $79.3 million in the same period in 2014. Net sales of wind blades were $183.4 million in the year ended December 31, 2015 as compared to $68.8 million in the same period in 2014. The increase was the result of a 160% increase in the number of wind blades delivered during the year ended December 31, 2015 compared to the same period in 2014, along with a change in the mix of wind blade models sold. This was primarily the result of the start of production for a new customer in our Dafeng facility during 2015 as well as the addition of one manufacturing line for an existing customer for a portion of the year. Net sales from the manufacturing of precision molding and assembly systems were $23.4 million during the year ended December 31, 2015 compared to $10.5 million in the same period in 2014. These sales were driven by demand from our customers for precision molding and assembly systems in the United States, China and Turkey that we manufactured in our Taicang City facility.
Income from operations in the Asia segment for the year ended December 31, 2015 was $35.0 million as compared to $14.8 million in the same period in 2014. In addition to the factors noted above, this increase reflected continued increasing operational efficiencies and other improvements in our Taicang Port and Dafeng facilities relative to the prior period and the start of production for a new customer in our Dafeng facility.
Mexico Segment
The Mexico segment had net sales of $97.9 million in the year ended December 31, 2015 as compared to $28.7 million in the same period in 2014. This increase reflects the ramp-up of production in Mexico. Net sales of wind blades represents the entirety of net sales in the Mexico segment in 2015 and 2014.
Income from operations in the Mexico segment for the year ended December 31, 2015 was $7.5 million as compared to a loss of $6.6 million in the same period in 2014. The improvement was due to the increased production levels during the year ended December 31, 2015 approaching a normalized capacity, compared to the ramp up of production in the same period in 2014.
EMEA Segment
Net sales during the year ended December 31, 2015 were $131.5 million, up from $67.0 million in the same period in 2014. The increase was driven by a 105% increase in wind blade volume and changes in our wind blade mix, which resulted in a higher average sale price. Net sales of wind blades represents the entirety of net sales in the EMEA segment in 2015 and 2014.
The loss from operations in the EMEA segment for the years ended December 31, 2015 and 2014 were each $1.5 million. The higher wind blade volume and improved operating performance was more than offset by the impact of the strengthening of the U.S. dollar against the Euro and Turkish Lira in 2015. The impact of the strengthening U.S. dollar reduced net sales by 21.4% and cost of goods sold by 19.7%. The impact of the U.S. dollar against the Euro and Turkish Lira reduced net sales and cost of goods sold by 2.2% and 8.2%, respectively, in the comparable year ended December 31, 2014.
RESULTS OF OPERATIONS
YearThree Months Ended DecemberMarch 31, 20142017 Compared to YearThree Months Ended DecemberMarch 31, 20132016
The following table summarizes certain information relating to our operating results and related percentage of net sales for the yearthree months ended DecemberMarch 31, 20142017 and 20132016 that has been derived from our unaudited condensed consolidated financial statements.
Year Ended December 31, | Three Months Ended | |||||||||||||||||||||||
(in thousands) | 2014 | 2013 | ||||||||||||||||||||||
| March 31, | ||||||||||||||||||||||||
| 2017 | 2016 | |||||||||||||||||||||||
| (unaudited) | ||||||||||||||||||||||||
| (in thousands) | ||||||||||||||||||||||||
Net sales | $ | 320,747 | $ | 215,054 | $ | 191,602 | 100.0 | % | $ | 176,110 | 100.0 | % | ||||||||||||
|
|
|
|
|
| |||||||||||||||||||
Cost of sales | 289,528 | 200,182 | 167,423 | 87.4 | 159,866 | 90.8 | ||||||||||||||||||
Startup and transition costs | 16,567 | 6,607 | 6,159 | 3.2 | 3,306 | 1.9 | ||||||||||||||||||
|
|
|
|
|
| |||||||||||||||||||
Total cost of goods sold | 306,095 | 206,789 | 173,582 | 90.6 | 163,172 | 92.7 | ||||||||||||||||||
|
|
|
|
|
| |||||||||||||||||||
Gross profit | 14,652 | 8,265 | 18,020 | 9.4 | 12,938 | 7.3 | ||||||||||||||||||
General and administrative expenses | 9,175 | 7,566 | 8,306 | 4.3 | 4,749 | 2.7 | ||||||||||||||||||
|
|
|
|
|
| |||||||||||||||||||
Income from operations | 5,477 | 699 | 9,714 | 5.1 | 8,189 | 4.6 | ||||||||||||||||||
Other expense | (11,200 | ) | (5,071 | ) | (4,068 | ) | (2.1 | ) | (4,140 | ) | (2.3 | ) | ||||||||||||
|
|
|
|
|
| |||||||||||||||||||
Loss before income taxes | (5,723 | ) | (4,372 | ) | ||||||||||||||||||||
Income tax benefit (provision) | (925 | ) | 3,346 | |||||||||||||||||||||
Income before income taxes | 5,646 | 3.0 | 4,049 | 2.3 | ||||||||||||||||||||
Income tax provision | (2,101 | ) | (1.1 | ) | (2,303 | ) | (1.3 | ) | ||||||||||||||||
|
|
|
|
|
| |||||||||||||||||||
Net loss before noncontrolling interest | (6,648 | ) | (1,026 | ) | ||||||||||||||||||||
Net loss attributable to noncontrolling interest | — | 2,305 | ||||||||||||||||||||||
|
| |||||||||||||||||||||||
Net income (loss) | (6,648 | ) | 1,279 | |||||||||||||||||||||
Net income | 3,545 | 1.9 | 1,746 | 1.0 | ||||||||||||||||||||
Net income attributable to preferred shareholders | 13,930 | 14,149 | — | — | 2,437 | 1.4 | ||||||||||||||||||
|
|
|
|
|
| |||||||||||||||||||
Net loss attributable to common shareholders | $ | (20,578 | ) | $ | (12,870 | ) | ||||||||||||||||||
Net income (loss) attributable to common shareholders | $ | 3,545 | 1.9 | % | $ | (691 | ) | (0.4 | )% | |||||||||||||||
|
|
|
|
|
| |||||||||||||||||||
Net sales for the three months ended March 31, 2017 increased by $15.5 million or 8.8% to $191.6 million compared to $176.1 million in the same period in 2016. Net sales of wind blades increased by 11.9% to $184.3 million for the three months ended March 31, 2017 as compared to $164.7 million in the same period in 2016. The increase was primarily driven by a 15% increase in the number of wind blades delivered during the three months ended March 31, 2017 compared to the same period in 2016 primarily from our Mexico and China plants, partially offset by a decline in the average sales prices of the same blade models delivered in both periods as a result of savings in raw material costs, a portion of which we share with our customers, slightly lower wind blade volume in Turkey and foreign currency fluctuations in Turkey and China. Net sales from the manufacturing of precision molding and assembly systems during the three months ended March 31, 2017 decreased to $4.6 million from $9.9 million in the same period in 2016. This decrease was primarily the result of our customers requiring less precision molding and assembly systems from our Rhode Island facility during the three months ended March 31, 2017. Total billings for the three months ended March 31, 2017 increased by $36.8 million or 21.1% to $211.4 million compared to $174.5 million in the same period in 2016. The impact of the strengthening of the U.S. dollar against the Euro at our Turkey operations and the Chinese Renminbi at our China operations on consolidated net sales and total billings were reductions of 0.9% and 1.3%, respectively. The impact of the strengthening of the U.S. dollar against the Euro and the Chinese Renminbi on consolidated net sales and total billings for the three months ended March 31, 2016 was not significant.
Total cost of goods sold for the three months ended March 31, 2017 was $173.6 million and included aggregate costs of $6.2 million related to startup costs in our new plants in Mexico and Turkey. This compares to total cost of goods sold for the three months ended March 31, 2016 of $163.2 million, including aggregate costs of $3.3 million related to the transition of wind blade models in our original plant in Mexico. Cost of goods sold
as a percentage of net sales of wind blades decreased by three percentage points during the three months ended March 31, 2017 as compared to the same period in 2016, driven by improved operating efficiencies, the impact of savings in raw material costs and foreign currency fluctuations. Similar to the impact to net sales above, the impact of the strengthening of the U.S. dollar against the Euro, Turkish Lira, Chinese Renminbi and Mexican Peso reduced consolidated cost of goods sold by 3.2% for three months ended March 31, 2017, compared to a reduction of 1.9% in the same period in 2016.
General and administrative expenses for the three months ended March 31, 2017 totaled $8.3 million as compared to $4.7 million for the same period in 2016. As a percentage of net sales, general and administrative expenses were 4.3% for the three months ended March 31, 2017, up from 2.7% in the same period in 2016. The increase was primarily driven by share-based compensation costs of $1.5 million recorded in the 2017 period (none was recorded in the 2016 period prior to our IPO in July 2016) as well as additional costs incurred to enhance our corporate support functions to support our growth and public company governance.
Net income for the three months ended March 31, 2017 was $3.5 million, as compared to $1.7 million in the same period in 2016. The increase was primarily due to the reasons set forth above.
Net income attributable to preferred shareholders was $2.4 million for the three months ended March 31, 2016 and there was none in the 2017 period as following our IPO in July 2016, all of our preferred shares were converted to common shares.
Net income attributable to common shareholders was $3.5 million during the three months ended March 31, 2017, compared to a loss of $0.7 million in the same period in 2016. This was primarily due to the improved operating results discussed above. Diluted earnings per share was $0.10 for the three months ended March 31, 2017, compared to a loss of $0.16 for the three months ended March 31, 2016.
Segment Discussion
The following table summarizes our net sales and income (loss) from operations by our four geographic operating segments:
| Three Months Ended March 31, | ||||||||
| 2017 | 2016 | |||||||
| (unaudited) | ||||||||
| (in thousands) | ||||||||
Net Sales | ||||||||
U.S. | $ | 46,540 | $ | 51,761 | ||||
Asia | 66,732 | 64,352 | ||||||
Mexico | 46,931 | 25,540 | ||||||
EMEA | 31,399 | 34,457 | ||||||
|
|
|
| |||||
Total net sales | $ | 191,602 | $ | 176,110 | ||||
|
|
|
| |||||
Income (Loss) from Operations U.S.(1) Asia Mexico EMEA Total income from operations Three Months Ended
March 31, 2017 2016 (unaudited) (in thousands) $ (10,111 ) $ (661 ) 14,704 15,542 1,947 967 3,174 (7,659 ) $ 9,714 $ 8,189
| (1) | Includes the costs of our corporate headquarters totaling $8.3 million and $4.7 million for the three months ended March 31, 2017 and 2016, respectively. |
U.S. Segment
Net sales in the three months ended March 31, 2017 decreased by $5.2 million or 10.2% to $46.5 million compared to $51.8 million in the same period in 2016. Net sales of wind blades were $40.2 million during the three months ended March 31, 2017 as compared to $40.3 million in the same period of 2016 on a comparable number of wind blades delivered in the two periods. Net sales from the manufacturing of precision molding and assembly systems during the three months ended March 31, 2017 were $3.7 million compared to $9.9 million during the same period in 2016. This decrease was primarily the result of model-specific tooling equipment manufactured in our Rhode Island facility in the 2016 period as required by our customers due to the transition to larger wind blade models for use in our Mexico plant as well as for use at the plants of another U.S. wind blade manufacturer.
The loss from operations for the three months ended March 31, 2017 was $10.1 million as compared to a loss of $0.7 million in the same period in 2016. These amounts include corporate general and administrative costs of $8.3 million and $4.7 million for the three months ended March 31, 2017 and 2016, respectively, with 2017 including $1.5 million of share-based compensation costs as described above. Notwithstanding these costs, the operating results were negatively impacted by the lower precision molding volume discussed above as well as lower gross profit on wind blades delivered during the three months ended March 31, 2017 as compared to the 2016 period.
Asia Segment
Net sales in the three months ended March 31, 2017 increased by $2.4 million or 3.7% to $66.7 million compared to $64.4 million in the same period in 2016. Net sales of wind blades were $65.8 million in the three months ended March 31, 2017 as compared to $64.4 million in the same period of 2016. The increase was the result of a 5% increase in the number of wind blades delivered during the three months ended March 31, 2017 compared to the same period in 2016. These increases were partially offset by a change in the mix of wind blade models sold, lower average sales prices of blades due to savings in raw material costs, a portion of which we share with our customers and the unfavorable impact of the fluctuation of the U.S. dollar relative to the Chinese Renminbi of 1.1%. Net sales from the manufacturing of precision molding and assembly systems totaled $1.0 million during the three months ended March 31, 2017 compared to no sales during the three months ended March 31, 2016.
Income from operations in the Asia segment for the three months ended March 31, 2017 was $14.7 million as compared to $15.5 million in the same period in 2016. In addition to the factors noted above, the decrease reflect higher overhead costs in the 2017 period as compared to 2016 partially offset by the favorable impact of the fluctuation of the U.S. dollar relative to the Chinese Renminbi of 4.8%.
Mexico Segment
Net sales in the three months ended March 31, 2017 increased by $21.4 million or 83.8% to $46.9 million compared to $25.5 million in the same period in 2016, reflecting a 68% increase in wind blade volume at our first Mexico plant and the beginning of wind blade production in our second plant, partially offset by lower average sales prices of blades. Net sales of wind blades represents the entirety of net sales in the Mexico segment in the 2017 and 2016 periods.
Income from operations in the Mexico segment for the three months ended March 31, 2017 was $1.9 million as compared to $1.0 million in the same period in 2016. The improvement in income from operations was due to the increase in wind blade volume in the 2017 period as compared to 2016, savings in raw material costs and the favorable impact of the fluctuation of the U.S. dollar relative to the Mexican Peso of 2.2%. This was largely offset by the startup losses incurred at our two new Mexico facilities.
EMEA Segment
Net sales during the three months ended March 31, 2017 decreased by $3.1 million or 8.9% to $31.4 million compared to $34.5 million in the same period in 2016. The decrease was driven by a 17% decrease in wind blade volume at our first Turkey plant, the mix of blades as well as overall lower average sales prices of blades due to savings in raw material costs, a portion of which we share with our customers, notwithstanding the unfavorable impact of the fluctuation of the U.S. dollar relative to the Euro of 3.1%. The decrease in sales volume was partially offset by the beginning of wind blade production in our second plant. Net sales of wind blades represents the entirety of net sales in the EMEA segment in 2017 and 2016.
Income from operations in the EMEA segment for the three months ended March 31, 2017 was $3.2 million as compared to a loss of $7.7 million in the same period in 2016. The increase was primarily driven by a large warranty reserve accrual in the 2016 period and the favorable impact of the fluctuation of the U.S. dollar relative to the Turkish Lira and Euro of 7.7%.
Year Ended December 31, 2016 Compared to Year Ended December 31, 2015
The following table summarizes certain information relating to our operating results as aand related percentage of total net sales.sales for the years ended December 31, 2016 and 2015 that has been derived from our consolidated financial statements.
| Year Ended December 31, | ||||||||||||||||||||||||
Year Ended December 31, | 2016 | 2015 | ||||||||||||||||||||||
| 2014 | 2013 | (in thousands) | ||||||||||||||||||||||
Net sales | 100.0 | % | 100.0 | % | $ | 754,877 | 100.0 | % | $ | 585,852 | 100.0 | % | ||||||||||||
|
|
|
|
|
| |||||||||||||||||||
Cost of sales | 90.2 | 93.1 | 659,745 | 87.4 | 528,247 | 90.2 | ||||||||||||||||||
Startup and transition costs | 5.2 | 3.0 | 18,127 | 2.4 | 15,860 | 2.7 | ||||||||||||||||||
|
|
|
|
|
| |||||||||||||||||||
Total cost of goods sold | 95.4 | 96.1 | 677,872 | 89.8 | 544,107 | 92.9 | ||||||||||||||||||
|
|
|
|
|
| |||||||||||||||||||
Gross profit | 4.6 | 3.9 | 77,005 | 10.2 | 41,745 | 7.1 | ||||||||||||||||||
General and administrative expenses | 2.9 | 3.5 | 33,892 | 4.5 | 14,126 | 2.4 | ||||||||||||||||||
|
|
|
|
|
| |||||||||||||||||||
Income from operations | 1.7 | 0.4 | 43,113 | 5.7 | 27,619 | 4.7 | ||||||||||||||||||
Other expense | -3.5 | -2.4 | (22,276 | ) | (3.0 | ) | (15,960 | ) | (2.7 | ) | ||||||||||||||
|
|
|
|
|
| |||||||||||||||||||
Loss before income taxes | -1.8 | -2.0 | ||||||||||||||||||||||
Income tax benefit (provision) | -0.3 | 1.5 | ||||||||||||||||||||||
Income before income taxes | 20,837 | 2.7 | 11,659 | 2.0 | ||||||||||||||||||||
Income tax provision | (6,995 | ) | (0.9 | ) | (3,977 | ) | (0.7 | ) | ||||||||||||||||
|
|
|
|
|
| |||||||||||||||||||
Net loss before noncontrolling interest | -2.1 | -0.5 | ||||||||||||||||||||||
Net loss attributable to noncontrolling interest | — | 1.1 | ||||||||||||||||||||||
|
| |||||||||||||||||||||||
Net income (loss) | -2.1 | 0.6 | ||||||||||||||||||||||
Net income | 13,842 | 1.8 | 7,682 | 1.3 | ||||||||||||||||||||
Net income attributable to preferred shareholders | 4.3 | 6.6 | 5,471 | 0.7 | 9,423 | 1.6 | ||||||||||||||||||
|
|
|
|
|
| |||||||||||||||||||
Net loss attributable to common shareholders | -6.4 | % | -6.0 | % | ||||||||||||||||||||
Net income (loss) attributable to common shareholders | $ | 8,371 | 1.1 | % | $ | (1,741 | ) | (0.3 | )% | |||||||||||||||
|
|
|
|
|
| |||||||||||||||||||
Net sales for the year ended December 31, 20142016 increased by $105.7$169.0 million or 49%28.9% to $320.8$754.9 million compared to $215.1$585.9 million in 2013. Thisthe same period in 2015. The increase was primarily driven by a result of a 31%38% increase in the number of wind blades delivered in 2014during 2016 as compared to 2013.2015, partially offset by a reduction in net sales from the manufacturing of prevision molding and assembly systems. Net sales of wind blades were $293.0$706.8 million for the year ended December 31, 20142016 as compared to $195.2$535.2 million in 2013.the same period in 2015. These increases were primarily the result of additional wind blade volume inat each of our plants impacted by lower average sales price due to geographic mix, blade mix and the result of savings in China, Mexicoraw material costs, a portion of which we share with our customers, partially offset by foreign currency fluctuations in Turkey and Turkey.China. Net sales from the manufacturing of precision molding and assembly systems during the year ended December 31, 2014 increased2016 decreased to $25.8$39.1 million from $14.1$47.3 million in the same period in 2013.2015. This decrease was primarily the result of reduced demand from our customers for precision molding and assembly systems from our China facility. Total billings for the year ended December 31, 2016 increased by $164.3 million or 27.4% to $764.4 million compared to $600.1 million in the same period in 2015. The impact of the strengthening of the U.S. dollar against the Euro at our Turkey operations and the Chinese Renminbi at our China operations on consolidated net sales and total billings were reductions of 1.1% and 1.0%, respectively, for the year ended December 31, 2016, with reductions of 4.8% and 4.1%, respectively, in the same period in 2015. Similar to the impact to net sales above, the impact of the strengthening of the U.S. dollar against the Euro, Turkish Lira, Mexican Peso and Chinese Renminbi reduced consolidated cost of goods sold by 3.5% for year ended December 31, 2016, compared to 4.7% in the same period in 2015.
Total cost of goods sold for the year ended December 31, 2016 was $677.9 million and included aggregate costs of $18.1 million related to startup costs in our new plants in Mexico and Turkey. This compares to total cost of goods sold for the year ended December 31, 2015 of $544.1 million which included aggregate costs of $15.9 million related to startup costs in our Mexico and Dafeng, China plants as well as the transition of wind blade models across all of our plants. Cost of goods sold as a percentage of net sales of wind blades decreased by 4.3% in the year ended December 31, 2016 as compared to the same period in 2015 driven by improved operating efficiency in China and the U.S., which was partially offset by higher operating costs in our Turkey and Mexico plants due to the startup costs incurred with the opening of new plants in both those segments. Cost of goods sold as a percentage of net sales from the manufacturing of precision molding and assembly systems increased slightly during the year ended December 31, 2016 as compared to the same period in 2015.
General and administrative expenses for the year ended December 31, 2016 totaled $33.9 million as compared to $14.1 million for the same period in 2015. As a percentage of net sales, general and administrative expenses were 4.5% for the year ended December 31, 2016, up from 2.4% in the same period in 2015. The increased expenditures for general and administrative expenses were driven primarily by share-based compensation costs of $8.4 million recorded in 2016 as well as the costs of enhancing our corporate support functions during this period of growth.
Other expense increased to $22.3 million for the year ended December 31, 2016 from $16.0 million for the same period in 2015. The increase was primarily due to the expensing of $4.5 million of deferred financing costs and prepayment penalties related to the refinancing of our previous credit facility in 2016.
Income tax provision increased to $7.0 million for the year ended December 31, 2016 from $4.0 million for the same period in 2015. The increase was primarily due to the improved operating results in China and Mexico and an increase in China’s statutory rate.
Net income for the year ended December 31, 2016 was $13.8 million, as compared to $7.7 million in the same period in 2015. The increase was primarily due to the reasons set forth above.
Net income attributable to preferred shareholders decreased to $5.5 million during the year ended December 31, 2016 from $9.4 million during the same period in 2015. This decrease was primarily due to the fact that immediately prior to the closing of the IPO in July 2016, all shares of the then-outstanding redeemable preferred shares converted into an aggregate of 21,110,204 shares of common stock.
Net income attributable to common shareholders increased to $8.4 million during the year ended December 31, 2016 from a loss of $1.7 million in the same period in 2015. This increase was primarily due to the improved operating results discussed above as well as the decrease in the net income attributable to preferred shareholders. Diluted earnings per share for the year ended December 31, 2016 was $0.48 compared to a loss of $0.41 for the year ended December 31, 2015.
Segment Discussion
The following table summarizes our net sales and income (loss) from operations by our four geographic operating segments:
| Year Ended December 31, | ||||||||
| 2016 | 2015 | |||||||
| (in thousands) | ||||||||
Net Sales: | ||||||||
U.S. | $ | 190,092 | $ | 149,614 | ||||
Asia | 301,893 | 206,779 | ||||||
Mexico | 129,756 | 97,912 | ||||||
EMEA | 133,136 | 131,547 | ||||||
|
|
|
| |||||
Total net sales | $ | 754,877 | $ | 585,852 | ||||
|
|
|
| |||||
| Year Ended December 31, | ||||||||
| 2016 | 2015 | |||||||
| (in thousands) | ||||||||
Income (Loss) from Operations: | ||||||||
U.S. | $ | (25,099 | ) | $ | (13,405 | ) | ||
Asia | 64,393 | 34,998 | ||||||
Mexico | 9,546 | 7,531 | ||||||
EMEA | (5,727 | ) | (1,505 | ) | ||||
|
|
|
| |||||
Income from operations | $ | 43,113 | $ | 27,619 | ||||
|
|
|
| |||||
U.S. Segment
Net sales in the year ended December 31, 2016 increased by $40.5 million or 27.1% to $190.1 million compared to $149.6 million in the same period in 2015. Net sales of wind blades were $160.0 million during the year ended December 31, 2016 as compared to $122.4 million in the same period of 2015. The increase was driven by an increase in the number of wind blades delivered in the year ended December 31, 2016 compared to the same period in 2015 due to the transition in 2015 to the production of larger wind blade models at our customer’s request, partially offset by lower pricing due to savings in raw material costs, a portion of which we share with our customers. Net sales from the manufacturing of precision molding and assembly systems during the year ended December 31, 2016 were $21.1 million compared to $23.9 million during the same period in 2015.
The loss from operations for the year ended December 31, 2016 was $25.1 million as compared to $13.4 million in the same period in 2015. These amounts include corporate general and administrative costs of $33.9 million and $14.2 million for the years ended December 31, 2016 and 2015, respectively, with 2016 including $8.4 million of share-based compensation costs as described above. Notwithstanding these costs, the operating results were driven by increased wind blade volume, the impact of savings in raw material costs and improved operating efficiency.
Asia Segment
Net sales in the year ended December 31, 2016 increased by $95.1 million or 46.0% to $301.9 million compared to $206.8 million in the same period in 2015. Net sales of wind blades were $283.9 million in the year ended December 31, 2016 as compared to $183.4 million in the same period in 2015. The increase was the result of a 68% increase in the number of wind blades delivered during the year ended December 31, 2016 compared to the same period in 2015, which was primarily the result of the start of production for a new customer in our Dafeng facility during the latter half of 2015 as well as the addition of one manufacturing line for an existing customer, along with a change in the mix of wind blade models sold. These increases were partially offset by lower pricing due to savings in raw material costs, a portion of which we share with our customers and the unfavorable impact of the fluctuation of the U.S. dollar relative to the Chinese Renminbi of 2.7%. Net sales from the manufacturing of precision molding and assembly systems during the year ended December 31, 2016 were $18.0 million compared to $23.4 million during the same period in 2015. The decrease in sales was driven by the abnormally high demand from our customers for precision molding in the United States, China and Turkey in 2015 due to the transition to the production of large wind blade models at our customer’s request.
Income from operations in the Asia segment for the year ended December 31, 2016 was $64.4 million as compared to $35.0 million in the same period in 2015. In addition to the factors noted above, this increase reflects the impact of savings in raw material costs, continued increasing operational efficiencies and other improvements in our Taicang Port and Dafeng wind blade facilities relative to the same period in 2015 and the favorable impact of the fluctuation of the U.S. dollar relative to the Chinese Renminbi of 6.7%.
Mexico Segment
Net sales in the year ended December 31, 2016 increased by $31.8 million or 32.5% to $129.8 million compared to $97.9 million in the same period in 2015, reflecting a 23% increase in wind blade volume, notwithstanding the transition to the production of a larger wind blade model at our customer’s request during the period, the mix of blades and lower average sales prices on certain blades related to savings in raw material costs, a portion of which we share with our customers. Net sales of wind blades represents the entirety of net sales in the Mexico segment in the 2016 and 2015 periods.
Income from operations in the Mexico segment for the year ended December 31, 2016 was $9.5 million as compared to $7.5 million in the same period in 2015. The improvement in income from operations was due to the increase in wind blade volume in 2016 compared to the same period in 2015 and savings in raw material costs and the favorable impact of the fluctuation of the U.S. dollar relative to the Mexican Peso of 2.3%, partially offset by costs to transition to a larger wind blade model as described above.
EMEA Segment
Net sales during the year ended December 31, 2016 increased $1.6 million or 1.2% to $133.1 million compared to $131.5 million in the same period in 2015. The increase in net sales was driven by a 3% increase in wind blade volume and changes in our wind blade mix, partially offset by lower sales prices related to savings in raw material costs, a portion of which we share with our customers. Net sales of wind blades represents the entirety of net sales in the EMEA segment in 2016 and 2015.
The loss from operations in the EMEA segment for the year ended December 31, 2016 was $5.7 million as compared to a loss of $1.5 million in the same period in 2015. The increase in the loss from operations was driven by an increase in the warranty reserve in 2016 which was partially offset by the higher wind blade volume noted above, improved operating performance and savings in raw material costs and the net favorable impact of the fluctuation of the U.S. dollar relative to the Turkish Lira and Euro of 4.8%.
Year Ended December 31, 2015 Compared to Year Ended December 31, 2014
The following table summarizes certain information relating to our operating results and related percentage of net sales for the years ended December 31, 2015 and 2014 that has been derived from our consolidated financial statements.
Year Ended December 31, | ||||||||||||||||
| 2015 | 2014 | |||||||||||||||
| (in thousands) | ||||||||||||||||
Net sales | $ | 585,852 | 100.0 | % | $ | 320,747 | 100.0 | % | ||||||||
|
|
|
|
|
|
|
| |||||||||
Cost of sales | 528,247 | 90.2 | 289,528 | 90.2 | ||||||||||||
Startup and transition costs | 15,860 | 2.7 | 16,567 | 5.2 | ||||||||||||
|
|
|
|
|
|
|
| |||||||||
Total cost of goods sold | 544,107 | 92.9 | 306,095 | 95.4 | ||||||||||||
|
|
|
|
|
|
|
| |||||||||
Gross profit | 41,745 | 7.1 | 14,652 | 4.6 | ||||||||||||
General and administrative expenses | 14,126 | 2.4 | 9,175 | 2.9 | ||||||||||||
|
|
|
|
|
|
|
| |||||||||
Income from operations | 27,619 | 4.7 | 5,477 | 1.7 | ||||||||||||
Other expense | (15,960 | ) | (2.7 | ) | (11,200 | ) | (3.5 | ) | ||||||||
|
|
|
|
|
|
|
| |||||||||
Income (loss) before income taxes | 11,659 | 2.0 | (5,723 | ) | (1.8 | ) | ||||||||||
Income tax provision | (3,977 | ) | (0.7 | ) | (925 | ) | (0.3 | ) | ||||||||
|
|
|
|
|
|
|
| |||||||||
Net income (loss) | 7,682 | 1.3 | (6,648 | ) | (2.1 | ) | ||||||||||
Net income attributable to preferred shareholders | 9,423 | 1.6 | 13,930 | 4.3 | ||||||||||||
|
|
|
|
|
|
|
| |||||||||
Net loss attributable to common shareholders | $ | (1,741 | ) | (0.3 | )% | $ | (20,578 | ) | (6.4 | )% | ||||||
|
|
|
|
|
|
|
| |||||||||
Net sales for the year ended December 31, 2015 increased by $265.2 million or 83% to $585.9 million compared to $320.7 million in the same period in 2014. This was primarily driven by a 91% increase in the number of wind blades delivered in the year ended December 31, 2015 compared to the same period in 2014. Net sales of wind blades were $535.2 million for the year ended December 31, 2015 as compared to $293.0 million in the same period in 2014. These increases were primarily the result of additional wind blade volume in our plants in Mexico, China and Turkey, partially offset by lower volume in the U.S. Net sales from the manufacturing of precision molding and assembly systems during the year ended December 31, 2015 increased to $47.3 million from $25.8 million in the same period in 2014. This increase was a result of precision molding and assembly systems manufactured in the United States and Asia for use in our Iowa, Dafeng,U.S., China Mexico and TurkeyMexico facilities. Total billings for the year ended December 31, 20142015 increased by $141.7$237.3 million or 64%65% to $362.8$600.1 million compared to total billings of $221.1$362.8 million in 2013.the same period in 2014. The impact of the strengthening of the U.S. dollar against the Euro inat our Turkey facilityoperation on consolidated net sales and total billings did not have awere reductions of 4.8% and 4.1%, respectively, for the year ended December 31, 2015, with no material impact in the 2014 or 2013 period.same period in 2014.
Total cost of goods sold for the year ended December 31, 2015 was $544.1 million and included aggregate costs of $15.9 million related to startup costs in our Mexico and Dafeng, China plants as well as the transition of wind blade models across all of our plants. This compares to total cost of goods sold for the year ended December 31, 2014 wasof $306.1 million, and includedincluding aggregate costs of $16.6 million related to the transition of wind blade modelsblades in our Iowa, Mexico and Turkey plants and startup costs related to our manufacturing facilities in Turkey, Mexico and Dafeng, China for the manufacturing of wind blades. This compares to total cost of goods sold in 2013 of $206.8 million including the transition of wind blades in Taicang Port, ChinaU.S. plant and startup costs in Mexico, Turkey and Turkey of $6.6 million.Dafeng, China. Cost of goods sold as a percentage of net sales of wind blades decreased by less than 1%3% in the year ended December 31, 20142015 as compared to the same period in 20132014 driven by improved operating efficiency in TurkeyMexico and Taicang Port, China,Turkey, which was partially offset by higher operating costs in our U.S. and China plants due to the transition to the production of larger wind blade models at our customer’s request as well as from the startup costs related to our new plants in Dafeng, China and Mexico and our plant expansion in Turkey.request. Cost of goods sold as a percentage of net sales from the manufacturing of precision molding and assembly systems increaseddecreased by 3%1% during the year ended December 31, 20142015 as compared to the 2013 period. Thesame period in 2014. Similar to the impact to net sales above, the impact of the strengthening of the U.S. dollar against the Euro onreduced consolidated cost of goods sold was a reduction of 1.8%at our Turkey operation by 4.7% for the year ended December 31, 2014 with no material impact2015, compared to 1.8% in the 2013 period.same period in 2014.
General and administrative expenses for the year ended December 31, 20142015 totaled $9.2$14.1 million as compared to $7.6$9.2 million for the same period in 2013.2014. As a percentage of net sales, general and administrative expenses were 2.9% in 2014,2.4% for the year ended December 31, 2015, down from 3.5%2.9% in the same period in 2013.2014. The increased expenditures for general and administrative expenses in absolute dollars were driven by the costs of enhancing our corporate support functions during this period of growth.
Other expense increased to $16.0 million for the year ended December 31, 2015 from $11.2 million for the same period in 2014 from $5.1 million in 2013.2014. This increase was largely the result of the refinancing of a significant portion of our debt in the third quarter of 2014, for which we incurred prepayment penalties and an end of term fee and wrote off the remaining debt issuance costs that had been capitalized in connection with the refinanced debt. These amounts aggregated to $2.9 million. In addition, we incurreddriven by higher interest expense from additional borrowings under our credit facilities to fund our growth initiatives, most notably our expansions and ramp-ups in Dafeng, China Mexico and Turkey. The increase also related to the amortization of the beneficial conversion feature on our Subordinated Convertible Promissory Notes during 2015.
Income tax provision increased to $4.0 million for the year ended December 31, 2014 was2015 from $0.9 million compared to an income tax benefit of $3.3 million for the same period in 2013. These amounts reflect substantial net2014. The increase was primarily due to the operating losses, resultingresults in relatively low income tax provisions in the United States.China and Mexico.
Net loss attributable to noncontrolling interestincome for the year ended December 31, 20132015 was $2.3 million with no comparable amount in 2014 as we purchased the minority interest in our Turkey operation in December 2013.
Net loss for 2014 was $6.6$7.7 million, as compared to a net incomeloss of $1.3$6.6 million in the comparablesame period of 2013.in 2014. The decreaseincrease was primarily due to the reasons set forth above.
Net income attributable to preferred shareholders decreased to $13.9$9.4 million during the year ended December 31, 20142015 from $14.1$13.9 million during 2013.the same period in 2014. This decrease was primarily due to the Series B, B-1 and C
convertible preferred shares being fully accreted to their respective redemption amounts in 2014, mostlypartially offset by the normal period-over-period increase in the ongoing accrual of ongoing dividends.
Net loss attributable to common shareholders increaseddecreased to $20.6$1.7 million during the year ended December 31, 20142015 from $12.9a loss of $20.6 million in 2013.the same period in 2014. This increasedecrease was primarily due to the increasedecrease in the net lossincome attributable to preferred shareholders and net income (loss) discussed above.
Segment Discussion
The following table summarizes our net sales and income (loss) from operations by our four geographic operating segments:
Net Sales | Year Ended December 31, | |||||||||||||||
(in thousands) | 2014 | 2013 | ||||||||||||||
| Year Ended December 31, | ||||||||||||||||
| 2015 | 2014 | |||||||||||||||
| (in thousands) | ||||||||||||||||
Net Sales: | ||||||||||||||||
U.S. | $ | 145,691 | $ | 160,600 | $ | 149,614 | $ | 145,691 | ||||||||
Asia | 79,325 | 37,045 | 206,779 | 79,325 | ||||||||||||
Mexico | 28,725 | — | 97,912 | 28,725 | ||||||||||||
EMEA | 67,006 | 17,409 | 131,547 | 67,006 | ||||||||||||
|
|
|
| |||||||||||||
Total net sales | $ | 320,747 | $ | 215,054 | $ | 585,852 | $ | 320,747 | ||||||||
|
|
|
| |||||||||||||
| Year Ended December 31, | ||||||||||||||||
| 2015 | 2014 | |||||||||||||||
| (in thousands) | ||||||||||||||||
Income (Loss) from Operations: | ||||||||||||||||
U.S. | $ | (13,405 | ) | $ | (1,199 | ) | ||||||||||
Asia | 34,998 | 14,771 | ||||||||||||||
Mexico | 7,531 | (6,567 | ) | |||||||||||||
EMEA | (1,505 | ) | (1,528 | ) | ||||||||||||
|
| |||||||||||||||
Income from operations | $ | 27,619 | $ | 5,477 | ||||||||||||
|
| |||||||||||||||
Income (Loss) from Operations | Year Ended December 31, | |||||||
(in thousands) | 2014 | 2013 | ||||||
U.S. | $ | (1,199 | ) | $ | 8,381 | |||
Asia | 14,771 | 3,807 | ||||||
Mexico | (6,567 | ) | (2,870 | ) | ||||
EMEA | (1,528 | ) | (8,619 | ) | ||||
|
|
|
| |||||
Income from operations | $ | 5,477 | $ | 699 | ||||
|
|
|
| |||||
U.S. Segment
Net sales in the year ended December 31, 20142015 were $145.7$149.6 million, downup from $160.6$145.7 million in the same period in 2013.2014. Net sales of wind blades were $128.5$122.4 million during the year ended December 31, 20142015 as compared to $143.4$128.5 million in the same period of 2013.2014. The decrease was driven by a reduction in the number of wind blades delivered in 2014the year ended December 31, 2015 compared to 2013the same period in 2014 due to the transition to the production of larger wind blade models at our customer’s request. Net sales from the manufacturing of precision molding and assembly systems during the year ended December 31, 2014 was $15.32015 were $23.9 million compared to $11.4$15.3 million during the same period of 2013.in 2014. This increase was primarily the result of model-specific tooling equipment required by our customers for use in EMEA and Mexico that was manufactured in our Rhode Island facility.facility as required by our customers due to the transition to larger wind blade models for use in the U.S. and Mexico facilities.
The loss from operations for the year ended December 31, 20142015 was $1.2$13.4 million as compared to incomethe loss from operations of $8.4$1.2 million in the 2013 period. The decrease wassame period in 2014, primarily the result of thedriven by reduced productionwind blade volume mentioneddiscussed above as well as higher consulting costs and increased general and administrative expenses in the U.S., including at our headquarters, required to facilitate our growth worldwide.
Asia Segment
Net sales in the year ended December 31, 20142015 were $79.3$206.8 million, up from $37.0$79.3 million in the same period in 2013.2014. Net sales of wind blades were $183.4 million in the year ended December 31, 2015 as compared to $68.8 million in 2014 as compared to $34.3 millionthe same period in 2013.2014. The increase was the result of a 61%160% increase in the number of wind blades delivered during 2014the year ended December 31, 2015 compared to 2013,
the same period in 2014, along with a change in the mix of wind blade models sold. The increaseThis was primarily the result of the start of production for a new customer in our Dafeng facility in December 2013, which led toduring 2015 as well as the addition of one manufacturing line for an existing customer for a larger volumeportion of wind blades being delivered in 2014.the year. Net sales from the manufacturing of precision molding and assembly systems were $10.5$23.4 million during the year ended December 31, 2014 as2015 compared to $2.7$10.5 million in 2013.the same period in 2014. These sales were driven by demand from our customers for precision molding and assembly systems in the United States, China Mexico and Turkey that we manufactured in our Taicang City facility.
Income from operations in the Asia segment for the year ended December 31, 20142015 was $14.8$35.0 million as compared to $3.8$14.8 million in the 2013 period.same period in 2014. In addition to the factors noted above, this increase reflected the continued increasing operational efficiencies and other improvements in our Taicang Port facility and an efficientDafeng facilities relative to the prior period and the start of production offor a new customer in our Dafeng facility.
Mexico Segment
The Mexico segment had net sales of $28.7$97.9 million in the year ended December 31, 2014 with no comparable net sales2015 as compared to $28.7 million in the 2013same period asin 2014. This increase reflects the Juárez, Mexico facility openedramp-up of production in late 2013.Mexico. Net sales of wind blades representedrepresents the entirety of net sales in the Mexico segment in 2015 and 2014.
The lossIncome from operations in the Mexico segment for the year ended December 31, 20142015 was $6.6$7.5 million as compared to a loss of $2.9$6.6 million in the 2013 period.same period in 2014. The increaseimprovement was primarily the result of higher year-over-year personnel and training costs, raw material usage during the startup of operations along with higher manufacturing overhead as a percentage of net sales due to the underutilizationincreased production levels during the year ended December 31, 2015 approaching a normalized capacity, compared to the ramp up of production in the facility while the manufacturing lines operate at less than full volume production levels.same period in 2014.
EMEA Segment
Net sales during the year ended December 31, 20142015 were $67.0$131.5 million, up from $17.4$67.0 million in the same period in 2013.2014. The increase was driven by a 109%105% increase in wind blade volume and changes in our wind blade mix, whereby we produced a greater proportion of wind blades atwhich resulted in a higher average sale price.
The Net sales of wind blades represents the entirety of net sales in the EMEA segment incurred ain 2015 and 2014.
The loss from operations of $1.5 million in the yearEMEA segment for the years ended December 31, 2015 and 2014 compared to a loss of $8.6 million in the same period in 2013. This was a result ofwere each $1.5 million. The higher wind blade volume and improved operating performance on our manufacturing lineswas more than offset by the additional costs related to the start of production for one customer and the startup of new production lines for our other customer in Turkey. The impact of the strengthening of the U.S. dollar against the Euro and Turkish Lira on net sales and operating results was a reduction of 2.2% and 8.2%, respectively, for the year ended December 31, 2014.in 2015. The impact of the strengthening U.S. dollar reduced net sales by 21.4% and cost of goods sold by 19.7%. The impact of the U.S. dollar against the Euro and Turkish Lira onreduced net sales and operating results was a reductioncost of 3.0%goods sold by 2.2% and 0.7%8.2%, respectively, forin the comparable year ended December 31, 2013.2014.
LIQUIDITY AND CAPITAL RESOURCES
Our primary needs for liquidity have been, and in the future will continue to be, capital expenditures, new facility startup costs, working capital and debt service costs. Our capital expenditures have been primarily related to machinery and equipment for new facilities or facility expansions. Historically, we have funded our working capital needs through cash flows from operations, andthe proceeds received from our credit facilities and our preferredfrom proceeds received from the issuance of stock. As discussed below, during 2016 we completed an initial public offering of common stock offerings, includingfor which we received net proceeds of $67.2 million and in 2014 we received $6.8 million of net proceeds from preferred stock offerings (no common or preferred shares were offered during 2015 or the three months ended March 31, 2017). We had net repayments on financing arrangements of $2.8 million for the three months ended March 31, 2017 as compared to net borrowings of $2.7 million in the year ended December 31, 2014 (no preferred stock was offered during the years ended December 31, 2015 or 2013).comparable period of 2016. We received net proceeds from financing arrangements and customer advances of $2.7 million for the three months ended March 31, 2016 as well as $1.6 million $81.7 million and $15.4$81.7 million during the years ended December 31, 2015 2014 and 2013,2014, respectively. During the three monthsyear ended MarchDecember 31, 2015,2016, we had net repayments of debtfinancing arrangements and customer advances of $5.9$15.4 million. As of March 31, 20162017 and December 31, 2015,2016, we had $137.2$122.6 million and $136.6$125.4 million in outstanding indebtedness, respectively, excluding debt issuance costs and debt discount. Additionally, as of March 31, 2016, we had a customer advance of $2.0 million outstanding, none of which was
outstanding as of December 31, 2015.costs. As of March 31, 2016,2017, we had an aggregate of $30.5$73.9 million of remaining capacity and $27.3$33.8 million of availability under our various credit facilities. Working capital requirements have increased as a result of our overall growth and the need to fund higher accounts receivable and inventory levels as our business volumes have increased. Based upon current and anticipated levels of operations, we believe that cash on hand, available credit facilities and cash flow from operations will be adequate to fund our working capital and capital expenditure requirements and to make required payments of principal and interest on our indebtedness over the next twelve months.
In July 2016, we completed an IPO of 7,187,500 shares of our common stock at a public offering price of $11.00 per share, which included 937,500 shares issued pursuant to the underwriters’ exercise of their option to purchase additional shares. We received $67.2 million in proceeds, net of underwriting discounts and offering expenses and intend to use the net proceeds from the public offering for our working capital and other general corporate purposes, including financing existing manufacturing operations, expansion in existing and new geographies and repayment of a customer advance. Immediately prior to the closing of the IPO, all shares of the then-outstanding redeemable preferred shares converted into an aggregate of 21,110,204 shares of common stock and the redeemable preferred share warrants were converted on a net issuance basis into 120,923 shares of common stock. In addition, concurrent with the closing of the IPO, the Subordinated Convertible Promissory Notes in the aggregate principal and interest amount of $11.9 million were converted into an aggregate of 1,079,749 shares of common stock at the public offering price of $11.00 per share. Prior to the IPO, in July 2016 we also consummated a 360-for-1 forward stock split of our common stock.
We anticipate that any new facilities and future facility expansions will be funded through cash flows from operations, the proceeds of this offering,our IPO, the incurrence of other indebtedness and other potential sources of liquidity.
At March 31, 20162017 and December 31, 2015,2016, we had unrestricted cash, cash equivalents and short-term investments totaling $35.8$115.5 million and $45.9$119.1 million, respectively. The March 31, 2016 balances included $9.12017 balance includes $17.7 million of cash located outside of the United States, including $7.9$14.8 million in China, $0.8$1.9 million in Turkey and $0.4$1.0 million in Mexico. The December 31, 2015 balances included $12.72016 balance includes $15.7 million of cash located outside of the United States, including $5.3$12.3 million in China, $7.2$2.5 million in Turkey and $0.2$0.9 million in Mexico. Our ability
to repatriate funds from China to the United States is subject to a number of restrictions imposed by the Chinese government. We repatriate funds through a Technology License Contract, a Services Agreementseveral technology license and dividends. Under the Technology License Contract, TPI Composites (Taicang) Co, Ltd., or TPI Taicang, is required to pay TPI Technology, Inc., our wholly-owned subsidiary, 4.9% of its net sales for the use of an exclusive and non-transferable license to use Technical Information, as defined in the Technology License Contract, to produce products at its facilities. Under the Services Agreement, we provide (i) accounting and financial advisory services, (ii) environmental and EHS programs, (iii) information technology and data services, (iv) global sourcing and procurement services and (v) engineering and development services to TPI Taicang.corporate/administrative service agreements. We are compensated quarterly based on agreed upon hourlyroyalty rates for such intellectual property licenses and quarterly fees for those services. Certain of our subsidiaries are limited in their ability to declare dividends without first meeting statutory restrictions of the People’s Republic of China, including retained earnings as determined under Chinese-statutory accounting requirements. Additionally, under the terms of our credit agreement with the Bank of China, we are required to obtain its approval to pay dividends and have a current ratio of not less than one. Until 50% ($5.2 million) of registered capital is contributed to a surplus reserve, our Chinese operations can only pay dividends equal to 90% of after-tax profits (10% must be contributed to the surplus reserve). Once the surplus reserve fund requirement is met, weour Chinese operations can pay dividends equal to 100% of after-tax profit assuming other conditions are met. At December 31, 2015,2016, the amount of the surplus reserve fund was $2.9$4.4 million.
Operating Cash Flows
| Three Months Ended March 31, | Year Ended December 31, | Three Months Ended | Year Ended December 31, | |||||||||||||||||||||||||||||||||||||
| (in thousands) | 2016 | 2015 | 2015 | 2014 | 2013 | |||||||||||||||||||||||||||||||||||
| 2017 | 2016 | 2016 | 2015 | 2014 | ||||||||||||||||||||||||||||||||||||
(unaudited) | (in thousands) | |||||||||||||||||||||||||||||||||||||||
Net income (loss) | $ | 1,746 | $ | (5,737 | ) | $ | 7,682 | $ | (6,648 | ) | $ | (1,026 | ) | $ | 3,545 | $ | 1,746 | $ | 13,842 | $ | 7,682 | $ | (6,648 | ) | ||||||||||||||||
Depreciation and amortization | 3,011 | 2,401 | 11,416 | 7,441 | 5,250 | 3,829 | 3,011 | 12,897 | 11,416 | 7,441 | ||||||||||||||||||||||||||||||
Share-based compensation expense | 1,707 | — | 9,902 | — | — | |||||||||||||||||||||||||||||||||||
Other non-cash items | 1,167 | 996 | 3,741 | 2,995 | 2,122 | 143 | 1,167 | 6,388 | 3,741 | 2,995 | ||||||||||||||||||||||||||||||
Changes in assets and liabilities | (7,063 | ) | 3,169 | 8,454 | (37,005 | ) | (4,719 | ) | 6,714 | (7,063 | ) | 10,812 | 8,454 | (37,005 | ) | |||||||||||||||||||||||||
|
|
|
|
|
|
|
|
|
| |||||||||||||||||||||||||||||||
Net cash provided by (used in) operating activities | $ | (1,139 | ) | $ | 829 | $ | 31,293 | $ | (33,217 | ) | $ | 1,627 | $ | 15,938 | $ | (1,139 | ) | $ | 53,841 | $ | 31,293 | $ | (33,217 | ) | ||||||||||||||||
|
|
|
|
|
|
|
|
|
| |||||||||||||||||||||||||||||||
Net cash provided by operating activities totaled $15.9 million for the three months ended March 31, 2017 and was primarily the result of net income for the period of $3.5 million, depreciation and amortization of $3.8 million, share-based compensation costs of $1.7 million and net changes in working capital. The key components of the $6.7 million increase in working capital include a $19.8 million increase in deferred revenue, a $11.2 million increase in accounts payable and accrued expenses, a $6.8 million decrease in prepaid expenses and other current assets, a $4.8 million increase in customer deposits, a $5.9 million decrease in other noncurrent assets and a $2.0 million increase in accrued warranty. This was partially offset by an increase in accounts receivable of $28.7 million and a $15.2 million increase in inventory. The working capital changes in accounts receivable, inventory, accounts payable and accrued expenses and deferred revenue are primarily the result of the material increase in and the timing of sales in the three months ended March 31, 2017.
Net cash used in operating activities totaled $1.1 million for the three months ended March 31, 2016 and was primarily the result of net changes in working capital, mostly offset by net income for the period of $1.7 million and non-cash depreciation and amortization of $3.0 million. The key components of the $7.1 million decrease in working capital include a $14.1 million increase in accounts receivable, an $8.3 million increase in prepaid expenses and other current assets, a $5.3 million increase in inventory and a $3.0 million increase in other noncurrent assets. This was partially offset by a $14.3 million increase in accrued warranty, a $6.8 million increase in accounts payable and accrued expenses, and a $2.5 million increase in customer deposits. The
working capital changes in accounts receivable, inventory, accounts payable and accrued expenses and deferred revenue are primarily the result of the material increase in and the timing of sales in the three months ended March 31, 2016.
Net cash provided by operating activities totaled $0.8$53.8 million for the three monthsyear ended MarchDecember 31, 20152016 and was primarily the result of net changes in working capital and the net loss for the periodincome of $5.7$13.8 million, partly offset by non-cash depreciation and amortization charges totaling $2.4 million.$12.9 million, share-based compensation costs of $9.9 million and other non-cash items of $6.4 million, as well as net changes in working capital. The key components of the $3.2$10.8 million increase in working capital includeincludes a $20.4 million increase in deferred revenue and a $10.2$15.0 million increase in accounts payable and accrued expenses, offset by a $13.5$6.3 million increase in inventory,accrued warranty, a $5.3$5.1 million decrease in accounts receivable and a $4.0 million increase in prepaid expenses anddeferred revenue. This
was partially offset by an $8.3 million increase in other currentnoncurrent assets, a $4.1$7.5 million decreaseincrease in customer deposits and a $3.8$5.0 million increase in accounts receivable.inventory. The working capital changes in accounts receivable, inventory, accounts payable and accrued expenses, accrued warranty and deferred revenue are primarily the result of the material increase in and the timing of sales in the three monthsyear ended MarchDecember 31, 2015.2016.
Net cash provided by operating activities totaled $31.3 million for the year ended December 31, 2015 and was primarily the result of non-cash depreciation and amortization charges totaling $11.4 million and other non-cash items of $3.7 million, as well as net income of $7.7 million and net changes in working capital. The key components of the $8.5 million increase in working capital includes a $34.4 million increase in accounts payable and accrued expenses, a $7.7 million increase in accrued warranty, a $6.0 million increase in deferred revenue and a $4.2 million decrease in other noncurrent assets. This was partially offset by a $29.7 million increase in accounts receivable, an $11.0 million increase in prepaid expenses and other current assets and a $3.2 million decrease in customer deposits. The working capital changes in accounts receivable, inventory, accounts payable, accrued warranty and accrued expenses and deferred revenue are primarily the result of the material increase in and the timing of sales in the year ended December 31, 2015.
Net cash used in operating activities totaled $33.2 million for the year ended December 31, 2014. This cash usage was primarily the result of net changes in working capital and the net loss for the year ended December 31, 2014 of $6.6 million, partly offset by non-cash depreciation and amortization of $7.4 million. The key components of the working capital changes include a $60.3 million increase in inventory, a $31.7 million increase in accounts receivable and a $9.2 million increase in prepaid expenses and other current assets, partially reduced by $38.3 million increase in deferred revenue and a $26.1 million increase in accounts payable and accrued expenses. The working capital changes in accounts receivable, inventory, accounts payable and accrued expenses and deferred revenue are primarily the result of the material increase in and the timing of sales in the year ended December 31, 2014.
Net cash provided by operating activities totaled $1.6 million in the year ended December 31, 2013. This cash inflow was primarily the result of non-cash depreciation and amortization charges of $5.3 million, mostly offset by net unfavorable changes in working capital and a net loss for the year ended December 31, 2013 of $1.0 million. The key components of the working capital change included a $9.8 million increase in inventory, a $6.4 million increase in accounts receivable and a $6.1 million increase in prepaid expenses and other current assets, partially offset by a $10.8 million increase in accounts payable and accrued expenses and a $9.3 million increase in customer deposits. The working capital changes in accounts receivable, inventory and accounts payable and accrued expenses are primarily the result of the material increase in and the timing of sales in the year ended December 31, 2013.
Investing Cash Flows
| Three Months Ended March 31, | Year Ended December 31, | Three Months Ended | Year Ended December 31, | |||||||||||||||||||||||||||||||||||||
| (in thousands) | 2016 | 2015 | 2015 | 2014 | 2013 | |||||||||||||||||||||||||||||||||||
| 2017 | 2016 | 2016 | 2015 | 2014 | ||||||||||||||||||||||||||||||||||||
(unaudited) | (in thousands) | |||||||||||||||||||||||||||||||||||||||
Purchase of property and equipment | $ | (10,888 | ) | $ | (10,605 | ) | $ | (26,361 | ) | $ | (18,924 | ) | $ | (7,065 | ) | $ | (16,922 | ) | $ | (10,888 | ) | $ | (30,507 | ) | $ | (26,361 | ) | $ | (18,924 | ) | ||||||||||
Contribution to joint venture | — | — | — | — | (84 | ) | ||||||||||||||||||||||||||||||||||
Proceeds from sale of assets | — | — | 146 | — | — | — | — | — | 146 | — | ||||||||||||||||||||||||||||||
|
|
|
|
|
|
|
|
|
| |||||||||||||||||||||||||||||||
Net cash used in investing activities | $ | (10,888 | ) | $ | (10,605 | ) | $ | (26,215 | ) | $ | (18,924 | ) | $ | (7,149 | ) | $ | (16,922 | ) | $ | (10,888 | ) | $ | (30,507 | ) | $ | (26,215 | ) | $ | (18,924 | ) | ||||||||||
|
|
|
|
|
|
|
|
|
| |||||||||||||||||||||||||||||||
Net cash flows used in investing activities totaled $10.9$16.9 million and $10.6$10.9 million for the three months ended March 31, 20162017 and 2015, respectively, as well as $26.2 million, $18.9 million and $7.1 million in the years ended December 31, 2015, 2014 and 2013,2016, respectively, driven primarily by capital expenditures for new facilities and expansion or improvements at existing facilities. The capital expenditures for the three months ended March 31, 2017 primarily related to our second wind blade plants in Mexico and Turkey as well as the expansion of our wind blade facility in Dafeng, China. The capital expenditures for the three months ended March 31, 2016 primarily related to the construction of our second wind blade plants in Mexico and Turkey as well as the expansion of our original wind blade facilities in Mexico and Turkey.
Net cash flows used in investing activities totaled $30.5 million, $26.2 million and $18.9 million in the years ended December 31, 2016, 2015 and 2014, respectively, driven primarily by capital expenditures for new facilities and expansion or improvements at existing facilities. The capital expenditures for the three monthsyear ended MarchDecember 31, 20152016 primarily related to the expansionplant build outs of our China and Iowathree new wind blade facilities.facilities, two in Mexico and one in Turkey. The capital expenditures for the year ended December 31, 2015 primarily related to the expansion of our China and Iowa wind blade facilities. For the yearsyear ended December 31, 2014, and 2013, the capital expenditures were primarily for the Turkey, Mexico and China plant build outs.
We anticipate fiscal year 20162017 capital expenditures of approximately $60between $75 million to $85 million. We estimate that the cost after March 31, 20162017 that we will incur to complete our current projects in process is approximately $9.1$13.9 million. We have used and will continue to use proceeds obtained prior to this offeringcash flow from operations and debt for major projects currently being undertaken, which include the new manufacturing facilities in Mexico and Turkey discussed above as well as our continued investment in our existing China and Turkey wind blade facilities.
Financing Cash Flows
| Three Months Ended March 31, | Year Ended December 31, | Three Months Ended March 31, | Year Ended December 31, | |||||||||||||||||||||||||||||||||||||
(in thousands) | 2016 | 2015 | 2015 | 2014 | 2013 | |||||||||||||||||||||||||||||||||||
Net proceeds from term loans | $ | — | $ | — | $ | 19,375 | $ | 23,901 | $ | 14,797 | ||||||||||||||||||||||||||||||
| 2017 | 2016 | 2016 | 2015 | 2014 | ||||||||||||||||||||||||||||||||||||
(unaudited) | (in thousands) | |||||||||||||||||||||||||||||||||||||||
Proceeds from issuance of common stock sold in initial public offering, net of underwriting discount and offering costs | $ | — | $ | — | $ | 67,199 | $ | — | $ | — | ||||||||||||||||||||||||||||||
Net proceeds from (repayment of) term loans | (938 | ) | — | (930 | ) | 19,375 | 23,901 | |||||||||||||||||||||||||||||||||
Net proceeds from (repayments of) accounts receivable financing |
| 6,800 |
| (6,144 | ) | (2,472 | ) | 34,450 | 2,183 | (1,233 | ) | 6,800 | (5,385 | ) | (2,472 | ) | 34,450 | |||||||||||||||||||||||
Net proceeds from (repayments of) working capital loans | (4,958 | ) | (71 | ) | (12,572 | ) | 5,999 | 3,393 | 517 | (4,958 | ) | (4,290 | ) | (12,572 | ) | 5,999 | ||||||||||||||||||||||||
Proceeds from subordinated debt arrangements | — | — | — | 15,000 | — | — | — | — | — | 15,000 | ||||||||||||||||||||||||||||||
Net proceeds from (repayments of) other debt | (1,192 | ) | 348 | (2,777 | ) | (2,130 | ) | 40 | ||||||||||||||||||||||||||||||||
Net proceeds from (repayments of) customer advances | 2,000 | — | — | 4,500 | (5,007 | ) | ||||||||||||||||||||||||||||||||||
Net repayments of other debt | (1,155 | ) | (1,192 | ) | (4,765 | ) | (2,777 | ) | (2,130 | ) | ||||||||||||||||||||||||||||||
Net proceeds from customer advances | — | 2,000 | — | — | 4,500 | |||||||||||||||||||||||||||||||||||
Proceeds from issuance of preferred stock | — | — | — | 6,846 | — | — | — | — | — | 6,846 | ||||||||||||||||||||||||||||||
Debt issuance costs | — | — | (1,113 | ) | (4,818 | ) | (1,154 | ) | — | — | — | (1,113 | ) | (4,818 | ) | |||||||||||||||||||||||||
Restricted cash and other | (647 | ) | (1,301 | ) | (2,864 | ) | 273 | (1,304 | ) | 331 | (647 | ) | (499 | ) | (2,864 | ) | 273 | |||||||||||||||||||||||
|
|
|
|
|
|
|
|
|
| |||||||||||||||||||||||||||||||
Net cash provided by (used in) financing activities | $ | 2,003 | (7,168 | ) | $ | (2,423 | ) | $ | 84,021 | $ | 12,948 | $ | (2,478 | ) | $ | 2,003 | $ | 51,330 | $ | (2,423 | ) | $ | 84,021 | |||||||||||||||||
|
|
|
|
|
|
|
|
|
| |||||||||||||||||||||||||||||||
The net cash flows used in financing activities totaled $2.5 million for the three months ended March 31, 2017, compared to net cash flows provided by financing activities of $2.0 million in the comparable period of 2016. The net cash flows provided by financing activities totaled $2.0 million for the three months ended March 31, 2016 and $84.0$51.3 million and $12.9$84.0 million for the years ended December 31, 20142016 and 2013,2014, respectively. Net cash flows used in financing activities for the year ended December 31, 2015 andtotaled $2.4 million. Net cash flows used in financing activities for the three months ended March 31, 2015 totaled $2.4 million2017 primarily reflects the net repayments of accounts receivable loans, the term loan and $7.2 million, respectively. The netother debt. Net cash flows provided by financing activities of $2.0 million for the three months ended March 31, 2016 primarily related toreflects the net proceeds
received from accounts receivable loans and customer advances less the net repayments of a customer advance. The networking capital loans and other debt. Net cash flows used inprovided by financing activities of $7.2 million for the three monthsyear ended MarchDecember 31, 2015 was2016 primarily reflects the resultnet proceeds received from our initial public offering, partially offset by repayments of the repayment ofworking capital loans and accounts receivable loans. Net cash flows used in financing activities for the year ended December 31, 2015 primarily reflects the net repayments of working capital loans and accounts receivable loans as well as payments related to the acquisition of noncontrolling interest of our Turkey operation in 2013 and additions to restricted cash. This was partially offset by additional net proceeds from term loans. The net cash flows from financing activities for the yearsyear ended December 31, 2014 and 2013 werewas primarily comprised of additional indebtedness provided by our senior lenders, accounts receivable financings, working capital loans and subordinated debt. During 2014, we also received $6.8 milliondebt as well as from proceeds of preferred stock offerings. The net cash provided by financing activities in the years ended December 31, 2014 and 2013 was primarily used for capital expenditures for the Dafeng, China, Mexico and Turkey facility startups and production ramp-ups, working capital and operating loss funding for Dafeng, China, Mexico and Turkey and the startup costs of manufacturing for a new customer in Turkey.
Description of Our Indebtedness
Senior Term Loan:Financing Agreements (U.S.):We entered into a senior term loan in 2013 to fund working capital and our continued startup of manufacturing lines in Turkey and new startup of manufacturing lines in Mexico. In February 2014, we drew an additional $5.0 million under this facility. The loan bore interest at 11.25%. In connection with our credit facility described below, the senior term loan was repaid in full in August 2014.
Subordinated ConvertiblePromissoryNotes:In February 2014, we entered into a note purchase agreement with two of our investors for the purchase of $5.0 million of subordinated convertible promissory notes. These notes bore interest at a rate of 12.0%, payable quarterly, starting April 1, 2014. We had the right to prepayment without the consent of the note holders. The note holders held conversion rights upon our future financing into new equity financing, convertible note financing or senior redeemable preferred stock. In connection with our credit facility described below, these notes were paid in full in August 2014.
Senior Financing Agreement:In August 2014, we entered into an agreement to borrow up to $75.0 million through a credit facility or the(the Credit Facility,Facility) in order to refinance existing indebtedness as well as to fund current operations and future growth opportunities. The initial amount drawn on the closing date was $50.0 million and an additional $5.0
$5.0 million was drawn in December 2014. In December 2014, in connection with the additional $5.0 million draw, on our Credit Facility, we amended the Credit Facility with the lender.was amended. In December 2015, we further amended the Credit Facility was further amended to increase the total available principal amount under the Credit Facility from $75.0 million to $100.0 million. The borrowing hasCredit Facility had an initial term of four years and matureswas to mature in 2018, providesprovided for various financial covenants and bearsbore interest at the London Interbank Offered Rate or LIBOR,(LIBOR) with a 1.0% floor, plus 8.0%. The Credit Facility containscontained various affirmative and negative covenants, that are customary for facilities of this type, including EBITDA (as defined in the Credit Facility) minimum covenants, a leverage ratio and a fixed-charge coverage ratio. The Credit Facility limitslimited annual capital expenditures based on budgets submitted to and agreed to with the lender and there iswas also an annual excess cash flow sweep requirement. In connection with the December 2015 amendment, all financial covenants were revised and the measurement period changed from monthly to quarterly. Concurrent with the December 2015 amendment, we borrowed an additional $20.0 million under the Credit Facility to fund our future growth and expansion. In addition, there were debt issuance costs of $4.7 million which were being amortized to interest expense over a period of 48 months using the effective interest method. As of both March 31, 2016 and December 31, 2015, the outstanding balancebalances under the Credit Facility was $74.4 million. We cannot assure you that
In connection with the initial draw on the Credit Facility in August 2014, we will be ablerepaid our previously outstanding senior term loan of $20.0 million plus accrued interest, a prepayment penalty and a termination fee. The prepayment penalty and termination fee amounted to maintain appropriate minimum EBITDA (as defined$1.6 million and are included within the caption Loss on extinguishment of debt in the Credit Facility), leverage or fixed-charge coverage ratio requirementsaccompanying consolidated statements of operations. In addition, we also expensed the remaining $1.3 million of debt discount and deferred financing costs associated with the senior term loan within the caption Loss on extinguishment of debt in the future.accompanying consolidated statements of operations. We also repaid $5.0 million of previously outstanding subordinated convertible promissory notes plus accrued interest as well as $5.7 million of customer advances outstanding at the time of the refinancing.
In December 2016, we amended and restated the Credit Facility. The previous $100.0 million of available principal under the Credit Facility as amended,was replaced with a $75.0 million term loan and a $25.0 million revolving credit facility, which includes a $15.0 million letter of credit sub-facility (increased to $20.0 million in April 2017). The borrowings under the Restated Credit Facility bear interest at a variable rate through maturity at LIBOR, with a 1.0% floor, plus 5.75%. The Restated Credit Facility requires us to make quarterly principal payments in the amount of 1.25%$0.9 million of the then outstanding principal loan balance each quartercommencing in March 2017, with the remaining outstanding balance to be repaid on or before December 30, 2020. The Restated Credit Facility contains customary affirmative covenants, negative covenants and deferred any further principal payments until September 2016. events of default, including covenants and restrictions that, among other things, require us and our subsidiaries to satisfy certain capital expenditure and other financial covenants, and restricts the ability of us and our subsidiaries to incur liens, incur additional indebtedness, enter into joint ventures or partnerships, engage in mergers and acquisitions, engage in asset sales and declare dividends on its capital stock without the prior written consent of the lenders. The obligations under the Restated Credit Facility are secured by a lien on substantially all tangible and intangible property of us and our domestic subsidiaries and by a pledge by us and our domestic subsidiaries of 65% of the equity of their direct foreign subsidiaries, subject to customary exceptions and exclusions from collateral.
If we prepay any of the outstanding principal loan balance prior to December 8, 2016,30, 2017, we are required to pay Highbridgethe lenders a premium in an amount equal to the amount of interest that otherwise would have been payable from the date of prepayment until December 8, 201630, 2017 plus 3.0% of the amount of the principal loan balance that was prepaid. We are not required to pay such a premium if we prepay the outstanding principal loan balance
under the Credit Facility with proceeds from this offering and we refinance the Credit Facility with the lender or its affiliates. If we prepay any of the outstanding principal loan balance after December 8, 201630, 2017 through December 8, 2017,30, 2018, we are required to pay the lender 3.0%lenders 2.0% of the principal loan balance that was prepaid, and if we prepay any of the outstanding loan balance after December 8, 201730, 2018 through August 18, 2018,December 30, 2019, we are required to pay a premium of 1.5% of the amount of the principal loan balance that was prepaid.
In connection with the Restated Credit Facility, we repaid the outstanding Credit Facility balance of $74.4 million, plus accrued interest, closing fees, a prepayment penalty and the reimbursement of certain lenders expenses incurred. The deferred financing fees totaled $2.2 million and are being amortized to interest expense over a period of 48 months using the effective interest method. In addition, we also expensed $2.4 million of the
remaining deferred financing costs associated with the Credit Facility and $2.1 million of the prepayment penalty within the caption Loss on extinguishment of debt in the accompanying consolidated statements of operations. As of March 31, 2017 and December 31, 2016, the aggregate outstanding balance under the Restated Credit Facility was $76.9 million and $77.8 million, respectively. We cannot assure you that we will be able to maintain appropriate minimum leverage or fixed-charge coverage ratio requirements in the future.
Subordinated Convertible Promissory Notes Agreement (U.S.):
In conjunction with the additional $5.0 million borrowingfunding under the Credit Facility in December 2014, discussed above, we entered into a note purchase agreement with five of our current investors for the purchase of $10.0 million of Subordinated Convertible Promissory Notes, or the Subordinated Convertible Promissory Notes. The Subordinated Convertible Promissory Notes bearnotes bore interest at a rate of 12.0% per annum and willwould automatically mature and be due and payable on the earlier of the completion of any change of control aor qualified initial public offering, or at the election of the note holders of the notes at any time after the occurrence of an event of default. Any amount outstanding on the Subordinated Convertible Promissory Notes on December 31, 2016 will automatically convert into shares of Super Senior Redeemable preferred stock. We havehad the right to prepay the Subordinated Convertible Promissory Notesprepayment without the consent of the note holders and the note holders holdheld conversion rights that would be triggered in connection with aupon future financing into new equity financing or convertible note financing, other than a qualified IPO (as defined in the Subordinated Convertible Promissory Notes). The amount outstanding under the Subordinated Convertible Promissory Notes was $10.0 million at both March 31, 2016 and December 31, 2015. Thefinancing. This note purchase agreement containscontained a beneficial conversion feature thatwhich was originally valued at $5.2 million andbased on the difference between the fair value of our stock as of the commitment date as compared to the most favorable conversion rate that would have been available to the investor during the term of the loan. This amount was accounted for as a debt discount and an increase in shareholders’ equity. The debt discount iswas being accreted to interest expense ratably over the expected term of the Subordinated Convertible Promissory Notes. The amountnotes. In addition, there were debt issuance costs of $0.2 million which were being amortized to interest expense over the estimated term of the unamortized debt discount at March 31, 2016 and December 31, 2015 was $2.3 million and $3.0 million, respectively.
Working Capital Agreements:The Asia segment has entered into several working capital financing agreements with Chinese financial institutions and as of March 31, 2016 and December 31, 2015, we had $5.4 million and $9.5 million outstanding, respectively, underloan using the agreements. These loans beareffective interest at rates ranging from 5.6% to 6.9% annually, and interest is payable monthly. The principal on these loans is scheduled to be paid from between 3 to 12 months from each loan origination date but have been, and we anticipate will continue to be, renewed at their maturities. Under certain of these agreements, we are required to obtain lender consent in order to repatriate dividends.
In connection with the December 2015 amendment to the Credit Facility noted above, we have agreed to repay all but $2.1 million of the outstanding indebtedness incurred in connection with our working capital financing agreements with our lenders in China by June 30, 2016 and any remaining amount by September 30, 2016, or sooner if we are not in compliance with the financial covenants in the Credit Facility.
In June 2013, our EMEA segment entered into a loan in the amount of $3.0 million, which accrued interest annually at a rate of LIBOR plus 2.2%, with a financial institution in Poland. The loan was collateralized by a $3.5 million deposit made by our Asia segment. This facility was used to fund machinery, equipment and building improvements at the facility in Turkey.method. As of December 31, 2014, there2015, the outstanding balance under the note purchase agreement was $3.0$10.0 million.
Concurrent with the closing of our IPO, the principal and accrued interest on the outstanding Subordinated Convertible Promissory Notes were converted into an aggregate of 1,079,749 shares of common stock at the public offering price of $11.00 per share. In connection with this conversion, the remaining beneficial conversion feature, debt discount and debt issuance costs totaling $1.3 million outstanding. The loan was paid off upon maturitywere fully expensed as interest expense in June 2015 and the related $3.5 million deposit was returned.accompanying consolidated statements of operations.
Accounts Receivable, Secured and Unsecured Financing: In March
EMEA:During 2014, our EMEA segment entered intowe renewed a general credit agreement with a Turkish financial institution in Turkey to provide up to $12.0 million, which was increased to $20.0 million in August 2014,(later updated to 21.0 million Euro, or approximately $22.5 million as of March 31, 2017) of short-term collateralized financing secured byon invoiced accounts receivable of one of the EMEA segment’sTurkey’s customers. Interest accrues annually at the Euro Interbank Offered Rate, or EURIBOR, plus 0.2%a variable rate (currently 5.75%) for Euro denominated debt and is paid quarterly. In December 2014, we obtained an additional $7.0 million (later decreased to $5.0 million) of unsecured financing in Turkey under the credit agreement, increasing the total facility. All credit agreement terms remained the same. The credit agreement does not have a maturity date, however the limits are reviewed in September of each year. InAmounts outstanding under this agreement as of March 31, 2017 and December 2014, our EMEA segment obtained an additional $7.031, 2016 include $6.2 million and $15.1 million of accounts receivable financing and $2.7 million and $4.6 million of unsecured financing, under a general credit agreement with the same Turkish financial institution. This increased the facility total to $27.0 million. All credit agreement terms remained the same. As of March 31, 2016 and December 31, 2015, there was $24.1 million and $22.8 million outstanding under this agreement, respectively.
In December 2014, our EMEA segmentwe entered into a credit agreement with a Turkish financial institution to provide up to $16.0 million of short-term financing of which $10.0 million is collateralized financing secured byon invoiced accounts receivable of one of the EMEA segment’sour customers and the remaining $6.0in Turkey, $5.0 million is unsecured.unsecured financing and $1.0 million is related to letters of guarantee. Interest accrues at an averagea variable rate of 6.25%(currently 6.5%). The credit agreement does not have a maturity date, however the limits are reviewed in September of each year. The amountsAmounts outstanding under this agreement were $11.4 million and $6.3 million as of March 31, 20162017 include $2.5 million of unsecured financing and no amounts under the account receivable financing. No amounts were outstanding under this agreement as of December 31, 2015, respectively. This credit agreement replaced the credit agreement described below.2016.
During 2013, our EMEA segmentIn March 2016, we entered into a general credit agreement with a Turkish financial institution to provide up to $10.033.5 million Euro (later increased to 36.0 million Euro, or approximately $38.7 million as of March 31, 2017) of short-term financing of which 20.0 million Euro (approximately $21.5 million as of March 31, 2017) is
collateralized financing secured bybased on invoiced accounts receivable of one of the EMEA segment’s customers. This credit agreement was replaced in 2014 bycustomers, 12.5 million Euro (later increased to 15.0 million Euro, or approximately $16.1 million as of March 31, 2017) for the $16.0collateralized financing of capital expenditures and 1.0 million agreement noted above and had a revolving 12 month term and was renewedEuro (approximately $1.1 million as of March 31, 2017) related to letters of guarantee. Interest on the anniversarycollateralized financing based on invoiced accounts receivable accrues at the three month EURIBOR plus 5.75% (currently 5.75%) and is paid quarterly with a maturity date equal to four months from the applicable invoice date. Interest on the collateralized capital expenditures financing accrues at the one month EURIBOR, plus 6.75% (currently 6.75%) with monthly principal repayments beginning in January each year.October 2017 with a final maturity date of December 2021. Interest accruedon the letters of guarantee accrues at an average rate2.00% annually with a final maturity date of 5.35% annuallyMarch 2017. As of March 31, 2017 and December 31, 2016, there was paid monthly.$16.1 million and $15.8 million outstanding under the collateralized financing of capital expenditures line, respectively. Additionally, as of March 31, 2017, there was $7.7 million outstanding under the collateralized financing based on invoiced accounts receivables, with no corresponding amounts outstanding as of December 31, 2016.
Asia:During 2014, our Asia segmentwe entered into several accounts receivable financing agreementsloans with a Chinese financial institution secured by invoiced accounts receivableinstitution. Amounts outstanding as of certain of the Asia segment’s customers. Interest accruesDecember 31, 2015 were $6.6 million and interest accrued at 6.6% annually and isannually. All interest was payable monthly.quarterly. The principal on these loans iswas scheduled to be paid from between one12 to six36 months from each loan origination date but havehad been, and we anticipate willwere anticipated to continue to be, renewed at their maturities. As of December 31, 2016, all amounts outstanding under these accounts receivable financing loans were fully repaid.
In January 2016, we entered into a credit agreement with a Chinese financial institution to provide up to 95.0 million Renminbi (approximately $13.6 million as of December 31, 2016) of short-term financing of which 85.0 million Renminbi (approximately $12.2 million as of December 31, 2016) is collateralized financing based on invoiced accounts receivables of one of our Asia segment’s customers and 10.0 million Renminbi (approximately $1.4 million as of December 31, 2016) of working capital loans collateralized by one of our Asia segment location’s machinery and equipment. Interest on the collateralized financing and the collateralized working capital loan accrues at a specified LIBOR rate plus an applicable margin and can be paid monthly, quarterly or at the time of the debt’s final maturity (January 12, 2017). As of December 31, 2016, there were no amounts outstanding under these accounts receivable financing and working capital loans. This credit agreement matured in January 2017.
In February 2017, we entered into a credit agreement with a Chinese financial institution to provide an unsecured credit line of up to 150.0 million Renminbi (approximately $21.8 million as of March 31, 20162017) which can be used for the purpose of domestic and foreign currency loans, issuing letters of guarantee or other transactions approved by the lender. Interest on the credit line accrues at the LIBOR rate plus an applicable margin and can be paid monthly, quarterly or at the time of the debt’s maturity in February 2018. No amounts were outstanding under this agreement as of March 31, 2017.
Working Capital Agreements (Asia):
During 2014, we entered into several working capital loans with various financial institutions. Amounts outstanding as of December 31, 2015 there was $6.2were $9.5 million and $6.6 million outstanding underinterest accrued at between 5.6% and 6.9% annually. All interest was payable quarterly. The principal on these agreements, respectively.
loans was scheduled to be paid from between 3 to 12 months from each loan origination date. As collateral for the above working capital loans, the financial institution received a security interest in China’s buildings and land use rights. In connection with the December 2015 amendment to the Credit Facility noted above, we have agreed to repay all but $2.1 million ofrepaid the outstanding indebtedness incurred in connection with our working capital financing agreementsloans with our lenders in China by June 30, 2016 and any remaining amount by September 30, 2016, or sooner if we are not in compliance with the financial covenants of the Credit Facility.2016.
Equipment Lease and Other Arrangements:We have entered into certain capital lease and construction loan arrangements in the United States, Mexico and EMEA for equipment used in our operations as well as for office use. These leases bear interest at rates ranging from 4.0% to 9.0% annually, and principal and interest are
payable monthly. As of March 31, 20162017 and December 31, 2015,2016, there was $5.8$10.6 million and $7.0$12.1 million outstanding under these arrangements, respectively.
Customer AdvancesAdvances:: As of December 31, 2014, we had an outstanding non-interest bearing customer advance totaling $1.2 million, which was discounted using an imputed interest rate of 7.0%, which approximated the rate that we would have received on this financing in the open market. These customer advances were paid back in full during the year ended December 31, 2015. In January 2016, we entered into an agreement with GE Wind and received an advance of $2.0 million, all of which was outstanding as of March 31, 2016.million. These funds will bewere used to expand the existing Mexico manufacturing facility to accommodate larger wind blade models. We arewere obligated to repay the advance, without interest, by providing future credits against a specified number of wind blade sets sold to GE Wind. If the Mexico operation failsfailed to supply those wind blade sets by December 31, 2016, the then outstanding balance of the advance will bewould have been immediately due and payable. The advance willwould have also bebeen immediately due in full upon a change of control of the Company or within 30 days after the effective date of an initial public offering of our common stock. In August 2016, the customer advance was repaid in full.
Operating LeasesLeases:: We lease various facilities and equipment under non-cancelable operating lease agreements. As of June 30, 2016,March 31, 2017, we leased a total of approximately 3.8 million square feet in Dafeng, China; Izmir, Turkey; Newton, Iowa; Juárez, Mexico; Santa Teresa, New Mexico; Taicang City, China; Taicang Port, China; Warren, Rhode Island; and Fall River, Massachusetts, as well as our corporate office in Scottsdale, Arizona. The terms of these leases range from 12 months to 120 months with annual payments approximating $10.6$16 million for the full year 2016.2017.
Other Contingencies
Other than as noted in “Business—Legal Proceedings”“Legal Proceedings,” as of March 31, 2016,2017 and December 31, 2015 and 2014,2016, we were not involved in any material litigation. In the future, however, we may become involved in various claims and legal actions arising in the ordinary course of business which may have a material adverse effect on our consolidated financial position, results of operations or liquidity.
Our wind blades and other composite structures are subject to warranties against defects in workmanship and materials, generally for a period of two to five years. We are not responsible for the fitness for use of the wind blade or the overall wind turbine system. If a wind blade is found to be defective during the warranty period as a result of a defect in workmanship or materials, among other potential remedies, we may need to repair or replace the wind blade (which could include significant transportation and installation costs) at our sole expense.
In June 2016, we entered into a settlement agreement and release with one of our customers, Nordex providing for the full and final settlement of any potential claims arising from a wind blade failure that occurred in April 2015 and certain alleged defects with respect to that blade and certain other wind blades that were primarily manufactured in 2014 according to Nordex’s specifications. We expressly stated in the settlement agreement and release that we deny any and all liability related to such potential claims and Nordex acknowledged our denial of liability in the settlement agreement and release. Notwithstanding our denial of liability, we concluded that reaching an agreement with Nordex to resolve the matter was in our best interest. The settlement agreement and release providesprovided that Nordex willwould release us from any and all possible claims arising out of or relating to the identified issues with the wind blades in question and any and all liabilities associated therewith. Nordex hashad also agreed to indemnify us against any third party claims relating to the identified issues with the wind blades in question, including without limitation, from Nordex’s customers or insurance carriers. In consideration for these releases and indemnification, we have agreed to makeand made a one-time cash payment to Nordex equal to Euro 8.0 million no later thanEuro in November 30, 2016. If we fail to make the payment by the deadline, the settlement agreement and release will no longer be effective. Pursuant to the settlement agreement and release, we will replacereplaced four sets of wind blades, makeand are in the process of making certain field repairs to 42 wind blades and retrofitretrofitting an additional 70 wind blades at our Turkey facility. In addition, the parties have agreed to use commercially reasonable best efforts to (1) extend the term of our existing long-term supply agreement from 2018 through 2020, increase the dedicated manufacturing capacity for each year of the agreement, increase the minimum annual volume commitments of Nordex under the agreement, provide for margin concessions on the incremental volume in 2016 and 2017, and make certain cost adjustments and (2) enter into long-term supply agreements relating to four additional wind blade manufacturing lines. We have agreed that we will grant Nordex a one-time margin concession on new wind blade molds relating to these four additional wind blade manufacturing lines. The expectedmost probable aggregate cost to us of fulfilling our obligations under the settlement agreement and release is estimatedwas determined to be approximately $15.0 million, all of which has beenwas accrued by us as of
March 31, 2016 and a substantial portion of which was paid prior to December 31, 2016. We caution you thatAfter the foregoing discussion describes our settlement agreement and releasewas executed with Nordex, andwe subsequently extended the described changes to our supply relationships with Nordex are subject to the negotiation and executionterm of an amendment to our existing supply agreement with Nordex from 2018 to 2020 and entered into a new long-term supply agreement with Nordex for the executionsupply of newwind turbines from two manufacturing lines at our second manufacturing facility in Turkey. We have yet to sign an additional supply agreementsagreement with Nordex.Nordex for the remaining two additional manufacturing lines contemplated by the Nordex settlement agreement. There can be no assurance that we will be able to enter into an amendment to our existinga new supply agreement or new supply agreements with Nordex for the remaining two lines, or if we do, that the final definitive agreements will contain terms as described above.
At March 31, 20162017 and December 31, 2015,2016, we had accrued warranty reserves totaling $27.9$21.9 million and $13.6$19.9 million, respectively.
We had no material operating expenditures for environmental matters, including government imposed remedial or corrective actions, during the three months ended March 31, 20162017 or the years ended December 31, 2016, 2015 2014 and 2013.2014.
Off-Balance Sheet Transactions
We are not presently involved in any off-balance sheet arrangements, including transactions with unconsolidated special-purpose or other entities that would materially affect our financial position, results of operations, liquidity or capital resources, other than operating lease arrangements and the accounts receivable assignment agreement described below. Furthermore, we do not have any relationships with special-purpose or other entities that provide off-balance sheet financing; liquidity, market risk or credit risk support; or engage in leasing or other services that may expose us to liability or risks of loss that are not reflected in consolidated financial statements and related notes.
In July 2014, our Mexico segment entered into an accounts receivable assignment agreement with a financial institution. Under this agreement, the financial institution buys, on a non-recourse basis, the accounts receivable amounts related to one of our Mexico segment’s customers at a discount calculated based on an effective annual rate of LIBOR plus 2.75%. As these receivables are purchased by the financial institution, they are removed from the Mexico segment’s balance sheet. During the three months ended March 31, 2017 and the year ended December 31, 2016, $18.1$26.3 million and $74.4 million, respectively, of receivables were sold to the financial institution.
Contractual Obligations
The following table summarizes certain of our contractual obligations as of December 31, 2015:2016:
Payments Due by Period | Payments Due by Period | |||||||||||||||||||||||||||||||||||||||
(in thousands) | Less than 1 | 1-3 years | 3-5 years | More than 5 | Total | Less than 1 year | 1-3 years | 3-5 years | More than 5 years | Total | ||||||||||||||||||||||||||||||
Long-term debt obligations(1) | $ | 52,065 | $ | 84,519 | $ | — | $ | — | $ | 136,584 | $ | 33,403 | $ | 20,850 | $ | 71,192 | $ | — | $ | 125,445 | ||||||||||||||||||||
Operating lease obligations(2) | 10,622 | 25,781 | 18,808 | 36,492 | 91,703 | 16,434 | 27,665 | 21,980 | 41,271 | 107,350 | ||||||||||||||||||||||||||||||
Purchase obligations | 616 | 1,343 | — | — | 1,959 | 1,157 | 953 | 733 | — | 2,843 | ||||||||||||||||||||||||||||||
Estimated interest payments | 4,190 | 6,801 | — | — | 10,991 | 7,998 | 10,884 | 4,776 | — | 23,658 | ||||||||||||||||||||||||||||||
|
|
|
|
|
|
|
|
|
| |||||||||||||||||||||||||||||||
Total contractual obligations | $ | 67,493 | $ | 118,444 | $ | 18,808 | $ | 36,492 | $ | 241,237 | $ | 58,992 | $ | 60,352 | $ | 98,681 | $ | 41,271 | $ | 259,296 | ||||||||||||||||||||
|
|
|
|
|
|
|
|
|
| |||||||||||||||||||||||||||||||
| (1) | See “—Description of Our Indebtedness” above. |
| (2) | Our operating lease obligations represent the contractual payments due for the lease of our corporate office in Scottsdale, Arizona in addition to facilities in Iowa, Massachusetts, Rhode Island, New Mexico, China, Mexico and Turkey. |
| (3) | Includes interest on variable rate debt based on interest rates as of December 31, 2016. |
CRITICAL ACCOUNTING POLICIES AND ESTIMATES
Our discussion and analysis of our financial condition and results of operations are based upon our consolidated financial statements, which have been prepared in accordance with GAAP. The preparation of these consolidated financial statements requires us to make estimates and judgments that affect the reported amount of our assets, liabilities, revenue and expenses and related disclosure of contingent assets and liabilities. We evaluate our estimates on an ongoing basis, including those related to revenue recognition, income taxes, share-based compensation, warranty expense and goodwill and intangibles. We base our estimates on our historical experience and on various other assumptions that we believe to be reasonable under the circumstances, the results of which form the basis for making the judgments we make about the carrying values of our assets and liabilities that are not readily apparent from other sources. Because these estimates can vary depending on the situation, actual results may differ from the estimates.
We believe the following critical accounting policies affect our more significant judgments used in the preparation of our consolidated financial statements.
Revenue Recognition. We record all sales of goods when a firm sales agreement is in place, when delivery has occurred (as defined by the sales contract), and collectability of the fixed or determinable sales price
is reasonably assured. The basic criteria necessary for revenue recognition are: (1) evidence that a sales arrangement exists, (2) title and risk of loss have passed to the customer, (3) delivery of goods has occurred, (4) the seller’s price to the buyer is fixed or determinable and (5) collectability is reasonably assured. We recognize revenue at the time of delivery to customers.
For multiple deliverable revenue arrangements, we allocate revenue to each element based on a selling price hierarchy. The selling price for a deliverable is based on its vendor specific objective evidence (VSOE) if available, third party evidence (TPE) if VSOE is not available, or best estimated selling price (BESP) if neither VSOE nor TPE is available. We generally allocate revenue for each of the deliverables within multiple element arrangements through BESP using cost plus margin estimates prepared during contract negotiations, agreed upon sales price or VSOE for sales of similar items outside of multiple element arrangements. The precision molding and assembly systems provided for in each customer’s contract are based upon the specific engineering requirements and design of the customer relative to the wind blade design and function desired. From the customer’s engineering specifications, a job cost estimate is developed along with a production plan, and margin is applied based on the customer and complexity of the work to be performed. Precision molding and assembly systems are built to produce wind blades which are manufactured in production runs specified in the customer contract. To determine the appropriate accounting for recognition of revenue, we consider whether the deliverables specified in the multiple element arrangement should be treated as separate units of accounting, and, if so, how the price should be allocated among the elements, when to recognize revenue for each element, and the period over which revenue should be recognized. We also evaluate whether a delivered item has value on a stand-alone basis prior to delivery of the remaining items by determining whether we have made separate sales of such items or whether the undelivered items are essential to the functionality of the delivered items. Further, we assess whether we know the fair value of the undelivered items, determined by reference to stand-alone sales of such items, if available, or BESP. As each of these items has stand-alone value to the customer, revenue from sales of wind blades and precision molding and assembly systems used in the production of composite products are recognized when those specific items are accepted by the customer as meeting the contractual technical specifications and delivered to the customer. Delivery of wind blades and precision molding and assembly systems generally takes place as defined in the contract at the facility where the precision molding and assembly systems are produced at which point the precision molding and assembly systems become exclusive property of the customer. The customer is generally then responsible for transportation to their own or our wind blade production sites where the precision molding and assembly systems are placed into service. Revenue related to engineering and freight services provided under customer contracts is recognized upon completion of the services being provided. Customers usually pay directly to the carrier the cost of shipping associated with items produced, but if paid by us, that cost is included in cost of goods sold and amounts invoiced for shipping and handling are included in revenue.
Our customers may request, in situations where they do not have space available to receive products or do not want to immediately take possession of products for other reasons, that their finished composite products be stored by us in one of our facilities. We will bill for the components as allowed by the contract; however, revenue is deferred for financial reporting purposes until we deliver the finished composite product and all of the other requirements for revenue recognition have been met. Composite products that have been billed by us and continue to be stored by us at one of our facilities are included at net realizable value in inventory held for customer orders included on the consolidated balance sheets. Inventory held for customer orders is physically segregated from finished goods and is accounted for separately within our accounting records.
Wind blade pricing is based on annual commitments of volume as established in the customer’s contract with orders less than committed volume resulting in additional costs per wind blade to customers; however, orders in excess of annual commitments do not result in discounts to customers from the contracted price for the committed volume. Customers may utilize early payment discounts which are reported as a reduction of revenue at the time the discount is taken.
Income Taxes. In connection with preparing our consolidated financial statements, we are required to estimate our income taxes in each of the jurisdictions in which we operate. This process involves our assessment
of any net operating loss carryforwards, as well as estimating our actual current tax liability together with assessing temporary differences resulting from differing treatment of items, such as reserves and accrued liabilities, for tax and accounting purposes. We also have to assess whether any portion of our earnings generated in one taxing jurisdiction might be claimed as earned by income tax authorities in a differing tax jurisdiction. Significant judgment is required in determining our annual tax rate, the allocation of earnings to various jurisdictions and in the evaluation of our tax positions.
Additionally, we record the estimated future tax effects of temporary differences between the tax basis of assets and liabilities and amounts reported in the accompanying consolidated balance sheets, as well as operating loss and tax credit carryforwards. We then assess the likelihood that our deferred income tax assets will be realized or recovered from our future taxable income.by evaluating all available positive and negative evidence in order to determine if it is more-likely-than-not that the deferred tax assets will be realized. To the extent we believe that recoverabilitythe realization of our deferred tax assets is not likely,more-likely-than-not, we are required to establish a valuation allowance. GAAP requires us to weigh both positive and negative evidence in determining the need for a valuation allowance for deferred tax assets. In doing so we considered our recent operating history, taxpaying history and future reversals of deferred tax liabilities based upon future operating projections. As a result of cumulative net operating losses in the United States, we have determined that a valuation allowance for all of our U.S. deferred tax assets was appropriate. We periodically evaluate all available positive and negative evidence regarding the future recoverability of our deferred tax assets and, when we determine that the recoverability of deferred tax assets meets the criteria of more-likely-than-not, we reduce the valuation allowance against our deferred tax assets. The effect of a change in judgment concerning the realizability of deferred tax assets would be included in provision for income taxes. As of December 31, 2015,2016, we have U.S. federal net operating lossesNOLs of approximately $78.1$57.5 million, state net operating lossesNOLs of approximately $61.1 million, foreign net operating losses of approximately $3.2$77.2 million and foreign tax credits of approximately $0.3$2.6 million available to offset future taxable income.
IncomeFederal U.S. income taxes have not been provided on $22.3$42.0 million of undistributed earnings at December 31, 20152016 of foreign subsidiaries over which we have sufficient influence to control the distribution of such earnings, and we have determined that such earnings have been reinvested indefinitely. Should we elect in the future to repatriate a portion of the foreign earnings so invested, we could incur income tax expense on such repatriation, net of any available deductions and foreign tax credits. This would result in additional income tax expense beyond the computed expected provision in such periods. The amount of unrecognized deferred tax liability for temporary differences related to investments in foreign subsidiaries and foreign corporate joint ventures that are essentially permanent in duration is not easily determinable.
Sections 382 and 383 of the Code, contain rules that limit the ability of a company that undergoes an “ownership change” to utilize its net operating loss and tax credit carry forwards and certain built-in losses recognized in years after the ownership change. An “ownership change”ownership change is generally defined as any change in ownership of more than 50% of a corporation’s stock over a rolling three-year period by stockholders that own (directly
(directly or indirectly) 5% or more of the stock of a corporation, or arising from a new issuance of stock by a corporation. If an ownership change occurs, Section 382 generally imposes an annual limitation on the use of pre-ownership change net operating lossesNOLs, credits and certain other tax attributes to offset taxable income earned after the ownership change. The annual limitation is equal to the product of the applicable long-term tax exempt rate and the value of the company’s stock immediately before the ownership change. This annual limitation may be adjusted to reflect any unused annual limitation for prior years and certain recognized built-in gains and losses for the year. In addition, Section 383 generally limits the amount of tax liability in any post-ownership change year that can be reduced by pre-ownership change tax credit carryforwards. At the end ofIn 2008, we had an “ownership change”ownership change and the pre-ownership change net operating lossesNOLs existing at the date of change of $25.6 million arewere subject to an annual limitation of $4.3 million. As of December 31, 2015,2016, the remaining pre-ownership change net operating losses of approximately $20.5 millionNOLs are no longer limited. Certain of these net operating lossesNOLs may be at risk of limitation in the event of a future ownership change.
Share-Based Compensation. We have granted to our directors and senior management a combination of stock options, restricted stock units (RSUs), stock appreciation rights (SARs) and unit appreciation rights. We
intend to continue to make share-based compensation awards from time to time to our directors and senior management. Historically, our equity awards, as well as any equity awards we may make in the future, will carry a compensation charge. We measure the fair value of stock options and SARs at grant date using the Black-Scholes valuation model. Share-based compensation expense is recognized over the related service period of the options or SARs. The Black-Scholes model requires the input of subjective assumptions including the expected volatility based on comparable companies, the period of time the stock option is expected to remain outstanding and the fair value of the underlying common stock on the date of grant, the expected dividend yield (if any) and the risk-free interest rate. The use of different assumptions in the Black-Scholes pricing model would result in different amounts of share-based compensation expense. Furthermore, if different assumptions are used in future periods, share-based compensation expense could be materially impacted in the future.
DueWe measure and recognize compensation expense for share-based payment awards made to employees, consultants and directors based the absencefair value of an active marketshare-based awards on the date of grant for employees and directors and the fair value of share-based awards to consultants on the date of vesting. We use the Black-Scholes option pricing model to estimate the fair value of our options as of the grant date using the following assumptions:
Expected Volatility. As our common stock our boardhad not been publicly traded prior to July 2016, the expected volatility assumption reflects an average of directors,volatilities of publicly traded peer group companies with a period equal to the assistanceexpected life of the options.
Expected Life (years).We use the simplified method to estimate the expected term of stock options. The simplified method for estimating expected term is to use the mid-point between the vesting term and upon the recommendationcontractual term of management, has periodically determined the fair market value ofoption. We elected to use the simplified method because we did not have historical exercise data to estimate the expected term due to the limited time period our common stock at various dates after considering numerous factors, including our operating and financial performance, our estimates of future revenues and earnings, and risks to our business that could affect our estimates; industry information suchhad been publicly traded.
Risk-Free Interest Rate.The risk-free interest rate assumption is based upon the U.S. constant maturity treasury rates as market growth and volume and the performance of similarly situated companies in our industry,risk-free rate interpolated between the lack of an active public market for our common and preferred stock,years commensurate with the likelihood of and potential timing for a liquidity event for the shares of our common stock underlying the stock options and RSUs, such as an initial public offering, and the effect such a liquidity event would have on the rights and preferences of our preferred stock, given that the liquidation preferences disappear upon an initial public offering, the prices at which we have sold our convertible preferred stock to outside investors in arms-length transactions, a comparisonexpected life of the rights, preferencesoptions.
Dividend Yield. The dividend yield assumption is zero since we do not expect to declare or pay dividends in the foreseeable future.
Forfeitures.Forfeitures are estimated at the time of grant and privileges of our convertible preferred stock torevised in subsequent periods if actual forfeitures differ from those of our common stock and contemporaneous independent third-party valuations consistent withestimates.
Expected Vesting Period. We amortize the AICPA Practice Aid on“Valuation of Privately-Held Company Equity Securities Issued as Compensation.” These valuations usedshare-based compensation expense over the income approach method, which involves applying appropriate risk-adjusted discount rates to estimated debt-free cash flows, based on forecasted revenues and costs and the market approach method to determine the enterprise value, as well as the options pricing model to value the common stock that took into account the significant liquidation preferences of our preferred stock.requisite service period.
We granted awards of stock options and RSUs during 20152016 and the three months ended March 31, 20162015 to certain employees and non-employee directors. These awards include a performance condition requiring the completion of our initial public offering (IPO)IPO and have a required vesting period of one to four years commencing upon achievement of the performance condition. We will beginAs the IPO was consummated in July 2016, we began recording compensation expense for these awards when the IPO is considered probable of achievement, which will not be deemed to occur until the consummation of the IPO, and therefore no compensation cost will be recognized until this offering occurs. If we consummate this offering, compensation expense will be recorded in the third quarter ofJuly 2016 for the requisite service period from the grant date through the offeringIPO date with the balance of the share-based compensation to be expensed over the remaining vesting period. TheTotal share-based compensation expense will be calculated based onrecognized during the actual price per share atthree months ended March 31, 2017 was $1.7 million, of which shares$0.2 million is included in cost of commongoods sold and the remaining $1.5 million is included in general and administrative expenses. The amount related to restricted stock areunits was $0.5 million while $1.2 million related to stock options. Total share-based compensation expense recognized during the year ended December 31, 2016 was $9.9 million, of which $1.5 million is included in cost of goods sold and the remaining $8.4 million is included in this offering.general and administrative expenses. The amount recorded related to restricted stock units was $3.5 million while $6.4 million related to stock options. Approximately $3.6 million of the total share-based compensation expense recorded during the year ended December 31, 2016 related to the service period from the grant date through December 31, 2015. No share-based compensation costs were capitalized during the three months ended March 31, 2017 or the year ended December 31, 2016.
There were no share-based compensation equity awards granted during fiscalthe year ended December 31, 2014 or 2013. We recognized share-based compensation expense of $36,000 in 2013, all related to awards granted in prior years. Weand we did not recognize any share-based compensation expense during the three months ended March 31, 2016 or 2015, or the years ended December 31, 2015 and 2014.
Warranty Expense.As discussed above, our wind blades are subject to warranties against defects in workmanship and materials, generally for a period of two to five years. We are not responsible for the fitness for use of the wind blade in the overall wind turbine system. If a wind blade is found to be defective during the warranty period as a result of a defect in workmanship or materials, among other potential remedies, we may need to repair or replace the wind blade at our sole expense. We provide warranties for all of our products with terms and conditions that vary depending on the product sold. We record warranty expense based upon our estimate of future repairs using a probability-based methodology.
Our estimate of warranty expense requires us to make assumptions about matters that are highly uncertain, including future rates of product failure, repair costs, including availability of materials, shipping and handling, and de-installation and re-installation costs at customers’ sites, among others. When a potential or actual warranty claim arises, we will accrue additional warranty reserves for the estimated cost of remediation or proposed settlement. From 2010 through 2012, our U.S. wind blade plant incurred cumulative warranty costs of $3.5 million to inspect and when required, correct wind blades that may not have met the customer’s specifications. We accrued $15.0 million during 2016 to cover the aggregate costs associated with the agreement that we entered into with Nordex to settle potential claims relating to a wind blade failure that occurred in April 2015 and certain alleged defects with respect to that wind blade and certain other wind blades that were primarily manufactured in 2014. See the additional discussion“Management’s Discussion and Analysis of warranty matters under “OtherFinancial Condition and Results of Operations—Other Contingencies.” Except for these costs, we have not experienced no other material warranty expenses beyond the provision described above in the three months ended March 31, 2016 and in the years ended December 31, 2016, 2015 2014 and 2013.2014. However, changes in warranty reserves could have a material effect on our consolidated financial statements.
Inventory. Inventories are stated at the lower of cost or net realizable value. Net realizable value is estimated sales price less estimated completion and transportation costs, if applicable and is compared to the carrying cost of the inventory to determine if a write-down is necessary. Cost is determined using the first-in, first-out method for raw materials and specific identification for work in process and finished goods inventories. Actual cost includes the cost of materials, direct labor, and applied manufacturing overhead. Write-downs to reduce the carrying cost of obsolete, slow-moving, and unusable inventory to market value are recognized in cost of goods sold. The effect of these write-downs is to establish a new cost basis in the related inventory, which is not subsequently written up. Inventory designated for customer orders under storage arrangements is physically segregated from finished goods and is accounted for separately.
Recent Accounting Pronouncements
For a discussion of recent accounting pronouncements, see Note 1 to our consolidated financial statements for both the interim and annual periods.included elsewhere in this prospectus.
Quantitative and Qualitative Disclosures About Market Risk
We are exposed to market risk in the ordinary course of our business. These market risks are principally limited to changes in foreign currency exchange rates and commodity prices. We currently do not hedge our exposure to these risks.
Foreign Currency Risk. We conduct international operations in China, Mexico and Turkey. Our results of operations are subject to both currency transaction risk and currency translation risk. We incur currency transaction risk whenever we enter into either a purchase or sale transaction using a currency other than the local currency of the transacting entity. With respect to currency translation risk, our financial condition and results of operations are measured and recorded in the relevant domestic currency and then translated into U.S. dollars for inclusion in our historical consolidated financial statements. In recent years, exchange rates between these foreign currencies and the U.S. dollarsdollar have fluctuated significantly and may do so in the future. A hypothetical change of 10% in the exchange rates for the countries above would have resulted in a change to income from operations of approximately $2.4$3.8 million and $6.2$12.5 million for the three months ended March 31, 20162017 and for the year ended December 31, 2015,2016, respectively.
Commodity Price Risk. We are subject to commodity price risk under agreements for the supply of our raw materials. We have not hedged, nor do we intend to hedge, our commodity price exposure. We generally lock in pricing for our key raw materials for 12 months which protects us from price increases within that period. Additionally, the arrangements we have with our customers limit the impact of any price or cost increases. Finally, since many of our raw material supply agreements have meet or release clauses, if raw materials prices go down, we can also benefit from the reductions in price. We believe that this adequately protects us from increases in raw material prices but also enables us to take full advantage of decreases. We believe that a 10% change in the price of resin and resin systems, the commodities for which we do not have fixed pricing, would have had an impact to income from operations of approximately $3.0$3.3 million and $10.0$9.8 million for the three months ended March 31, 20162017 and for the year ended December 31, 2015,2016, respectively.
Interest Rate Risk.Risk During 2015 and 2014,. As of March 31, 2017, we borrowedhave an aggregate $75.0of $76.9 million outstanding under a term loanthe Restated Credit Facility that is tied to LIBOR to refinance existing indebtedness, fund future growth opportunities and current operations. During 2014, our Turkey operation entered intoan aggregate of $23.8 million outstanding under a general credit agreement with a Turkish financial institution to provide up to $12.0 million, which was increased to $20.0 million, of short-term collateralized financing on invoiced accounts receivable of one of its customers and unsecured financing that is tied to EURIBOR. During 2013, our Turkey operation had entered into a $3.0 million loan with a financial institution in Poland to fund machinery, equipment and building improvements at the facility in Turkey that is also tied to LIBOR. This loan was repaid during June 2015. The $74.4 million outstanding term loanRestated Credit Facility and the Turkey short-term collateralized financing on invoiced accounts receivable and unsecured financingsTurkish general credit agreement are the only variable rate debt that we heldoutstanding as of March 31, 20162017 and December 31, 20152016 as all remaining working capital loans,unsecured financing, accounts receivable financing and capital lease obligations are fixed rate instruments and are not subject to fluctuations in interest rates. Due to the relatively low LIBOR and EURIBOR rates in effect as of March 31, 2016,2017, a 10% change in the LIBOR or EURIBOR rate would not have a material impact on our future earnings, fair values or cash flows.
Jumpstart Our Business Startups Act of 2012
On April 5, 2012, the JOBS Act was enacted. Section 107 of the JOBS Act provides that an “emerging growth company” can take advantage of the extended transition period provided in Section 7(a)(2)(B) of the Securities Act for complying with new or revised accounting standards. We intend to take advantage of certain exemptions from various reporting requirements that are applicable to other public companies that are not “emergingemerging growth companies”companies including not being required to comply with the auditor attestation requirements of Section 404(b) of the Sarbanes-Oxley Act, reduced disclosure obligations regarding executive compensation in our periodic reports and proxy statements, and exemptions from the requirements of holding a nonbinding advisory vote on executive compensation and shareholder approval of any golden parachute payments not previously approved. We may take advantage of these reporting exemptions until we are no longer an “emerging emerging
growth company.” We will remain an “emergingemerging growth company”company until the earliest of (i) the last day of the fiscal year in which we have total annual gross revenues of $1.0 billion or more; (ii) the last day of our fiscal year following the fifth anniversary of the date of the completion of this offering;our IPO; (iii) the date on which we have issued more than $1.0 billion in nonconvertible debt during the previous three years;years or (iv) the date on which we are deemed to be a large“large accelerated filerfiler” under the rules of the SEC.
Under the JOBS Act, emerging growth companies can also delay adopting new or revised accounting standards until such time as those standards apply to private companies. We have irrevocably elected not to avail ourselves of this exemption from new or revised accounting standards and, therefore, will be subject to the same new or revised accounting standards as other public companies that are not emerging growth companies.
Global Wind Energy Market
The wind power generation industry has grown rapidly and expanded worldwide in recent years to meet high global demand for clean electricity. According to BNEF, from 2000 to 2015,2016, the cumulative global power generating capacity in GWs grew at an average annual rate of 25%24%. Cumulative installed capacity is led by China (approximately 139162 GWs), the United States (approximately 7482 GWs) and Germany (approximately 4550 GWs). In addition, from 2008 to 2015,2016, the cumulative global power generating capacity of wind turbine installations in GWs increased by more than three and a halffour times. WindAccording to GWEC, wind energy is now used in over 8090 countries, 2429 of which have more than 1 GW installed. The rapid growth in the wind power generation industry has been driven by population growth and the associated increase in electricity demand, widespread emphasis on the expanded use of renewable energy, the increasing effectiveness andcost-competitiveness of wind energy and accelerated urbanization in developing countries, among other factors. We believe that recent U.S. and global policy initiatives aimed at reducing fossil fuel consumption through the expansion of renewable energy, coupled with corporate commitments to cost-effective environmentally and socially responsible electricity consumption, will drive additional growth. In 2015,2016, U.S. corporate, non-profit and government entities procured an aggregate of 2.41.6 GWs of wind capacity via power purchase agreements, which represents an increaserepresented 39% of 12 times since 2008,the total capacity contracted in 2016 according to BNEF.MAKE. The Paris Agreement achieved at COP21 of the United Nations Framework Convention on Climate Change the EPA’s Clean Power Plan and the long-term extension of the PTC are all recent examples of policies that promote the growth of renewable energy. Overall, renewable technologies, including hydroelectric, are projected to increase their share of global electricity generation from 24% in 2015 to 45% by 2040 according to BNEF. Additionally, according to BNEF, onshore wind is expected to experience the largest increase in global market share over the same period, growing from 4% to 13% of the market.
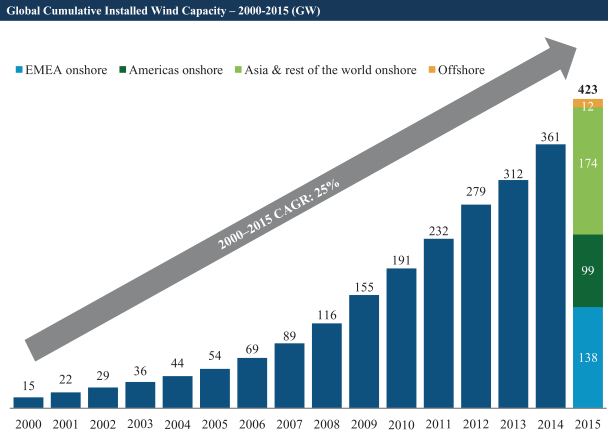
Source: Bloomberg New Energy Finance. Regional onshore and worldwide offshore figures presented for 20152016 only.
In 2015,2016, the wind industry added approximately 6254 GWs of generation capacity. According to BNEF, market diversification increased as a result of demand from newer markets in Asia, Latin America and non-EU Europe, which collectively represented 45.2%46.7% of capacity in 2015,2016, as compared to 42.7%45.2% in 2014.2015. Although Europe and the United States led early wind development, since 2010, the majority of wind turbines have been installed in non-OECD countries, particularly in Asia and Latin America, where wind generation capacity is growing. For example, cumulative wind generation capacity from 2013 to 20152016 grew by 75.0%105.1% to 2.83.3 GWs in Mexico and by 64.1%114.7% to 4.55.9 GWs in Turkey, underpinned by strong wind resources, high electricity prices, robust energy demand and key regulatory policies tailored to incentivize usage, among other factors.
According to BNEF, cumulative global installed wind capacity is projected to be approximately 754727 GWs by the end of 2020, representing a 2015-2020 compounded annual growth rate of approximately 12%15%. Greater growth over the same period is expected in China (14%(16%), Mexico (21%(33%) and Turkey (13%(22%) according to BNEF. Approximately 4637 GWs of new installations are expected in the United States between 20162017 and 20202021 due to the long-term extension of wind energy tax credits, state-mandated renewable energy portfolio requirements, the cost competiveness of wind energy, fuel diversification strategies and “green” credentials sought by corporations and utilities.
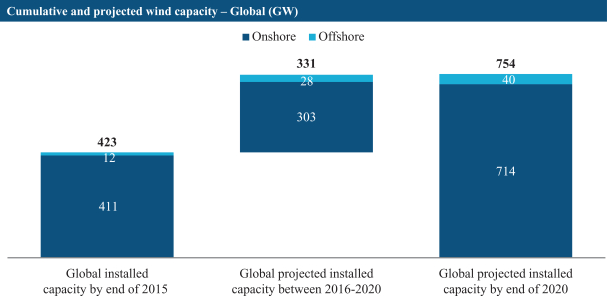
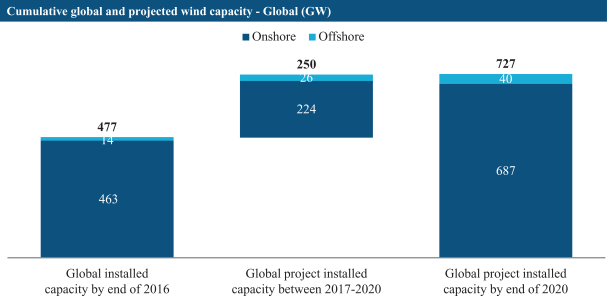
Source: Bloomberg New Energy Finance.
As a result of the strong demand from non-OECD markets in Asia and Latin America, the geographical distribution of wind energy deployment is rapidly changing. According to MAKE and BNEF, annual installed wind capacity growth is expected to be driven by developing wind markets, which are projected to grow at an 8.8% compounded annual growth rate from 2016 through 2026, as compared to 0.4% for mature wind markets. The adoption of wind energy across the globe relative to other power generation technologies is expected to be driven by its cost-competitiveness; broad resource availability; non-reliance on water; clean, mature and efficient technology; energy security concerns; and ancillary societal benefits, such as job creation and energy security. According to BNEF, EMEA, the Americas and Asia and other countries are projected to represent 27.7%approximately 29%, 25.2%25% and 47.1%45%, respectively, of global installed onshore wind power capacity by 2020. The chart below is a breakdown of the growth forecast in GWgigawatts by region for the worldwide wind energy market from 20162017 through 2020.
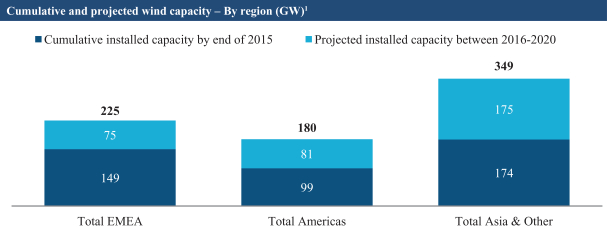
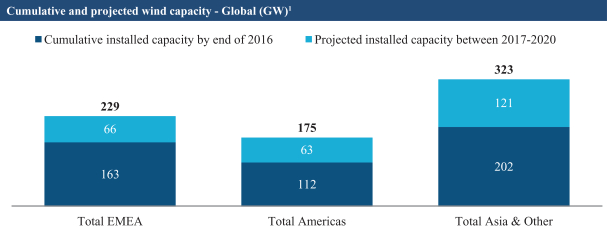
Source: Bloomberg New Energy Finance.
| 1 | Figures are rounded to the nearest whole number. |
While the majority of the intermediate-term increase in cumulative global wind generation capacity is expected to be driven by demand in non-OECD countries, the United States has adopted new legislation that is expected to support continued domestic wind capacity installation. For example, onin December 22, 2015, former President Obama signed into law the Military Construction and Veterans Affairs and Related Agencies Appropriations Act, which included an extension of the wind PTC through 2019, with a phase-down beginning for projects that commence construction after December 31, 2016. Specifically, the PTC will remain at the same rate in effect at the end of 2014 for wind power projects that commence construction by the end of 2016, and thereafter will be reduced by 20% per year in 2017, 2018 and 2019, respectively. On May 5, 2016, the IRSInternal Revenue Service (IRS) issued clarifications that expand PTC eligibility.eligibility and provided guidance on the repowering of existing assets, commonly known as the 80-20 provision. The clarification gives developers more time to build projects that will qualify for the full value of the PTC and provides more lenient commissioning deadlines for delayed projects. Following this clarification, BNEF increased its U.S. cumulative wind capacity installation projections from 44 GW under the initial PTC framework to 51 GW for the 2016 to 2021 period, with a peak in 2020 rather than 2018. Furthermore, MAKE now projects an average annual installation of 9.7 GW from 2016 to 2020. In addition, the legislation provides for increased long-term policy certainty to developers, manufacturers and investors.
Additionally, the EPA recently enacted the Clean Power Plan, which is also expected to promote renewable energy generation capacity installation over the course of the next 15 years. The Clean Power Plan mandates the reduction of carbon dioxide emissions from electrical power generation by 32% relative to 2005 benchmark levels by 2030. The EPA estimates the Clean Power Plan will help drive renewable energy sources to comprise 20% of the United States’ total power generation capacity by 2030, up from approximately 13% in 2014. The Supreme Court’s decision on February 9, 2016 to grant a stay on the roll-out of the Clean Power Plan is not expected to jeopardize the long-term decarbonization of the U.S. power sector. According to BNEF, the PTC extension and state-mandated renewable energy portfolio standards will be stronger drivers of short-term renewable development.
The international community also recently made continued commitments to further reduce fossil fuel consumption when 195 nations participating in the COP21 climate talks in Paris, France adopted a new global agreement, the Paris Agreement, on the reduction of climate change. The Paris Agreement consists of two elements: (1) a legally binding commitment by each participating country to set an emissions reduction target, referred to as “nationally determined contributions” or NDCs,(NDCs) with a review of the NDCs that could lead to updates and enhancements every five years beginning in 2023, and (2) a transparency commitment requiring participating countries to disclose their progress. The Paris Agreement will become effective in 2020, once it has been ratified by 55 countries representing at least 55% of global greenhouse gas emissions. Although the Paris Agreement does not impose penalties on countries that fail to comply with the agreement, once ratified, the terms of the Paris Agreement
and individual countries’ NDCs will encourage the further curtailment of the market share of fossil fuel generation over the long term and promote clean energy resources such as wind energy.
Onshore wind LCOE—which reflects the levelized cost of energy per megawatt hour of a generation project over its lifetime—is already on par with new combined cycle gas turbines and substantially below solar photovoltaic, according to Lazard. The advancement of wind turbine technology, including larger rotor diameters and higher hub heights, has increased energy capture, thus reducing LCOE for onshore wind. The proliferation of cost-effective wind generation enhances energy resource diversity and mitigates the price volatility associated with
fossil fuels, thereby helping to stabilize overall electricity costs in the long term. Wind energy projects do not require any fuel, such as natural gas or coal, during operation, and we believe that they are generally constructed within a substantially shorter period of time relative to conventional generation resources. According to Lazard, the cost of onshore wind has declined by over 61%66% in the last sixseven years. Costs are expected to continue to decline an additional 15%26% by 20212025 according to MAKEIRENA1 due to progress in reducing the costs of wind turbines, improving capacity factors and lower operating and maintenance costs.cost.
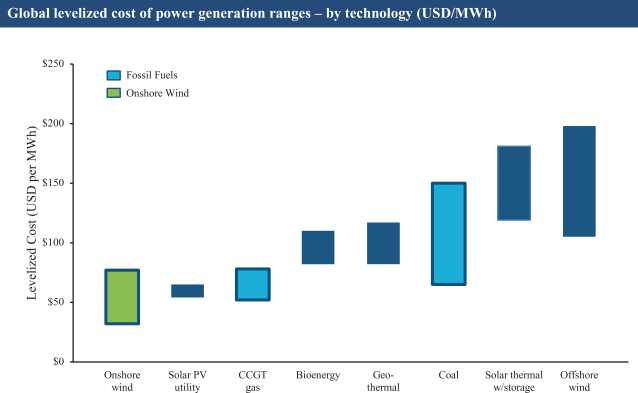
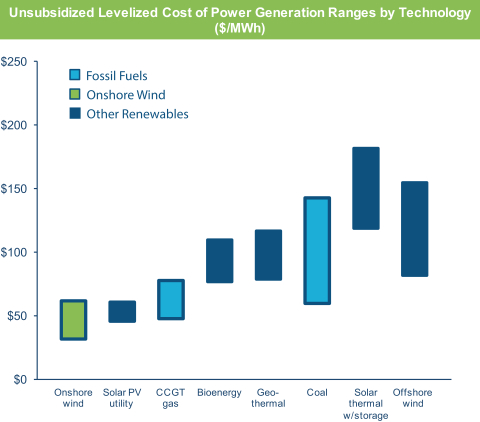
Source: Lazard Levelized Cost of Energy Analysis (version 9.0)10.0). Costs are on an unsubsidized basis. Ranges reflect differences in resources, geography, fuel costs and cost of capital, among other factors.
The data presented above involves a number of assumptions, including but not limited to construction time, the economic lifetime of power generation projects and typical system costs associated with construction, maintenance and operations. The results are subject to country-specific market conditions such as state and local incentive programs. Additionally, measuring renewable energy may present challenges due to inconsistent government reporting of generated energy and difficulties both identifying the renewable portion from multi-fuel applications and tracking energy generation in less transparent markets. However, we believe that LCOE comparisons of renewable energy sources remain a useful metric for analyzing technology cost movements over time.
As a result of the global commitment to reduce fossil fuel consumption and the increased cost competitiveness of renewable technologies, BNEF projects that renewable technologies will increase their share of the world power
generation mix from 24% in 2015 to 45% in 2040, with onshore wind expected to experience the largest increase over the same period from 4% to 13%. By 2040, overall global power generation is also
| 1 | © 2016 IRENA,The Power to Change: Solar and Wind Cost Reduction Potential to 2025 |
forecasted to expand by 53% to 35,651 terawatt hours, or TWh.hours. This growth is expected to be driven by an estimated $11.4 trillion investment in power generating capacity, approximately 70% of which is expected to flow to renewable technologies, which are forecasted to realize an average annual investment of $311 billion. China is forecast to lead onshore wind investments with an expected $1 trillion in investments from 2016 to 2040. Strong growth in the renewables sector is expected to cause the market share of fossil fuel generation to fall from 65% to 44% from 2015 to 2040, and increasingly strict regulations across the globe, including in China, the United States and Europe, is expected to cut coal’s share of the power generation market from 39% to 27% over the same period. Oil will remain a very small piece of the generation mix and thus is unlikely to have a material influence on average power prices or the competitiveness of renewable technologies. The chart below shows the global power generation outlook by fuel type through 2040, which demonstrates growth in renewable sources such as onshore wind.
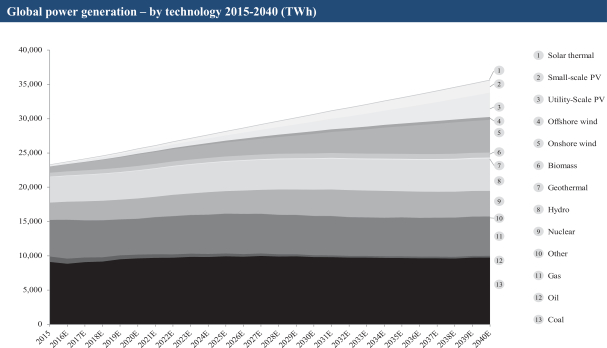
Source: Bloomberg New Finance Energy.
Wind Turbine and Wind Blade Fundamentals
Wind turbines function by turning kinetic energy from the rotation of the wind blades into electricity. Typical wind turbines consist of many components, the most important being the wind blades, gear box, electric generator and towers. When the wind blows, the combination of the lift and drag of the air pressure on the blades rotate the wind blades and rotor, which drives the gear box and generator to create electricity.
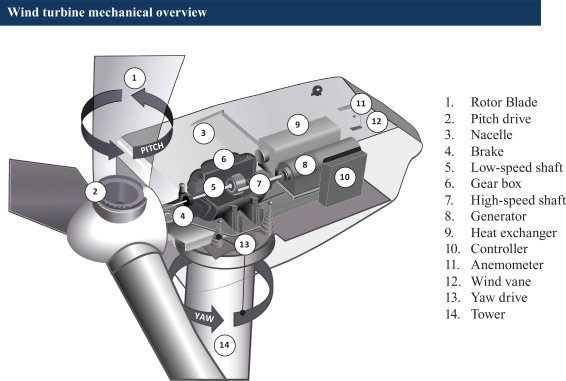
Source: American Wind Energy Association.
Wind turbines are often grouped together in wind farms. The connection or access of wind turbines to a power grid is of the utmost importance when locating wind turbines. Electricity from each wind turbine travels down a cable inside its tower to a collection point in the wind farm and is transmitted to a substation for voltage step-up and delivery into the electric utility transmission network, or grid. Electricity generation is most commonly measured in kWh. According to the Energy Information Administration the average U.S. household uses over 10,800 kWh of electricity each year. According to NREL,the Wind Energy Foundation, a 1.52.0 MW wind turbine can generate over 3 million kWh ofenough wind energy annually representing about as much electricity as 275-300to power 600 U.S. households use in one year.
The configuration of a wind turbine, including its wind blade design, is intended to optimize electricity generation and minimize down time in specific wind conditions, or “wind classes.” Key characteristics of wind blades include:
Wind blade length is expected to increase globally as wind turbine OEMs develop increased rotor diameters and wind blades as a primary driver for market differentiation and cost competitiveness. While the global mainstream wind blade length has been 40-45 meters, according to MAKE, by 2020 wind blades greater than 50 meters in length are expected to become the global norm. The trend toward larger wind blades indicates the potential phase out of smaller wind blades, as larger blades have the greatest impact on energy efficiency and LCOE reduction across all global regions. The below schematic identifies projected trends in relative blade lengths through 2020.
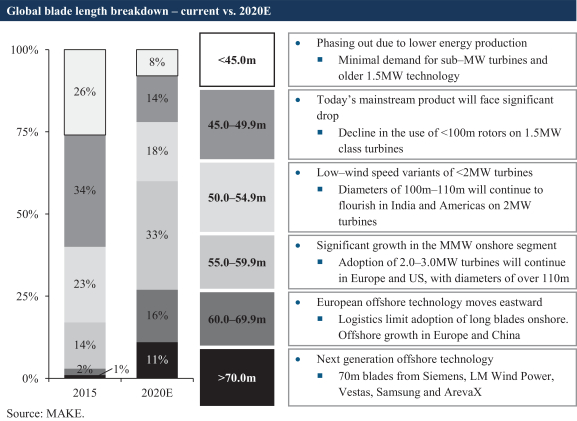
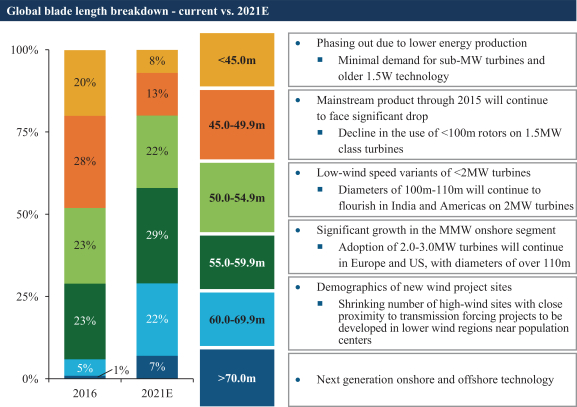
To putThe following graphic depicts the approximate scale of wind bladesthe longest blade we currently manufacture in perspective, a single wind blade can be as long or longer thanrelation to the60-meter wing span size of a 787 aircraft, as depicted below.soccer pitch:
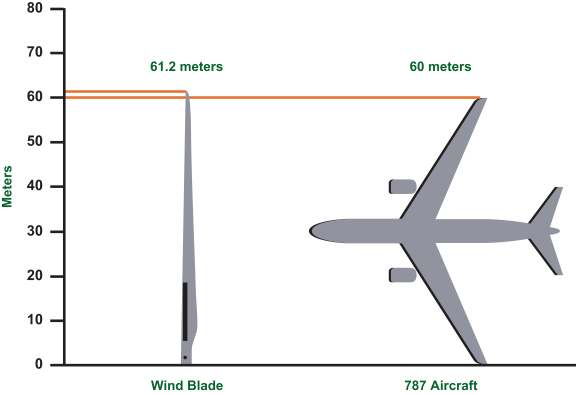
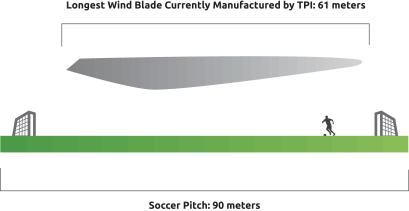
The development of larger wind turbines and recent improvements in wind blade design, materials and manufacturing technology have significantly increased the power generating capacity of wind turbines. Today, wind blades are generally composed of advanced, high-strength, lightweight and durable composite materials. In addition, longer wind blades, which allow for a larger area of wind to be swept by the wind blades, coupled with taller towers, results in greater energy capture and reduces the overall cost of wind energy. The evolution of the wind turbine has resulted in improved energy output, including in areas of low wind speed. The capacity factor of a wind turbine—which measures actual energy output as a percentage of potential capacity—has increased considerably under more recent designs for the same wind speed. These improvements in wind blade design have made wind energy a highly cost-competitive source of electricity.
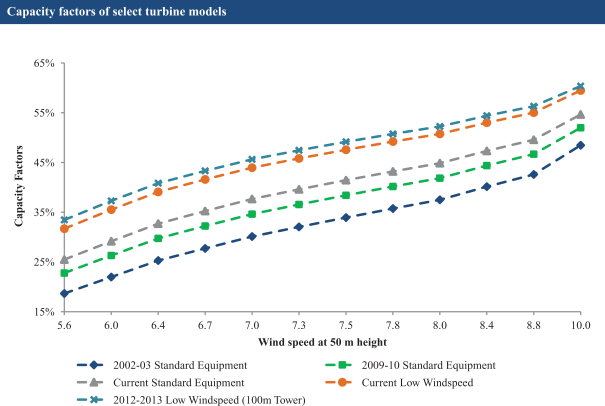
Source: International Energy Agency (2015).
A growing trend is the emergence of wind turbines designed specifically for regions with lower wind speeds. These regions have not traditionally been regarded as cost-effective locations for wind generation. However, during the past three years, all of the top ten wind turbine suppliers in the world have introduced wind turbines with longer wind blade lengths and taller towers designed to capture more energy at the lower end of the wind speed scale. Most single wind turbine platforms can now support multiple wind blade lengths, and today’s wind turbines can efficiently generate electricity when the wind speed is anywhere between 7 and 56 mph, speeds that are in abundance around the globe. We believe that installation of wind turbines in regions with lower wind speeds is encouraged due to proximity to energy demand centers, thereby reducing the amount of transmission infrastructure required. We expect this trend of expansion to regions not traditionally classified as high wind resource regions to continue.
As the location of wind turbine installations diversify to areas with varying wind classes, emphasis in the wind blade production process has shifted towards demonstrating the flexibility to supply a broader range of wind blade models designed for varying wind conditions. The trend towards multiple wind blade models requires
advanced composite and production expertise, sophisticated process technologies and modular megawatt-size precision molding and assembly systems. Given this required level of sophistication, wind blades now represent approximately 15%22% of the cost of a wind turbine, the second largest cost component, as depicted below. We believe that OEMs that keep pace with these technological advancements while controlling costs will enjoy a significant competitive advantage. Wind blades and pitch systems remain the most important elements to reduce LCOE, driven by ongoing improvement in aerodynamic efficiency, load controls and cost reduction.
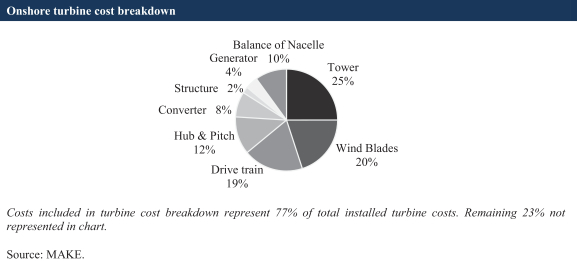

Wind Turbine and Wind Blade Supply Markets
The wind turbine industry, which constitutes our direct customer base, is concentrated among a fewlimited number of established players, with the top ten OEMs accounting for approximately 69%74% of the total global onshore market for the three years ended December 31, 20152016 based on MWs installed, according to data from MAKE. We believe MWs installed is the most widely followed measure of market share in the wind turbine industry and also reflects the OEMs’ demand for wind blades. We currently have long-term supply agreements with four of these top ten OEMs and are developing new relationships with additional OEMs to grow our business. In addition, we expect growth in the industry itself – by the end of 2020,2021, cumulative global installed wind capacity is projected to be over 750727 GWs with China accounting for approximately 35% of this capacity, according to BNEF. This represents a five-year compounded annual growth rate of approximately 12% for the global wind market including China, and a similar growth rate of approximately 11% for the global wind market excluding China.
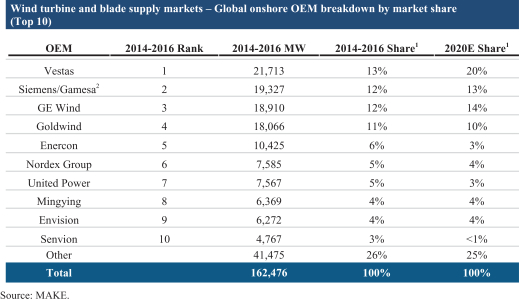
| 1 | Figures are rounded to nearest whole percent. |
| 2 | Figures for |

Historically, many wind turbine OEMs manufactured their own wind blades in-house to ensure a high level of quality and dedicated capacity, reflecting the importance of the wind blade supply to turbine production, concerns over protecting their proprietary wind blade designs and the scarcity of independent wind blade suppliers with sufficient manufacturing expertise and capacity. During 2007 and 2008, the U.S. and China markets grew at a rapid pace, which created additional demand in the wind turbine manufacturing supply chain. To balance supply and demand, many leading wind turbine OEMs established a production footprint in high-growth regions.
The current globalization of the wind industry presents a new set of challenges and opportunities for wind turbine OEMs. As opposed to establishing a manufacturing presence in each new core growth market, wind turbine OEMs are now focusing on supply chain efficiencies and their core competencies in the design, marketing and sale of wind turbines. In doing so, many wind turbine OEMs are increasingly outsourcing the production of key components, such as wind blades, to select manufacturers to remain competitive, address growth markets and manage global talent constraints. Despite this ongoing trend of outsourcing of wind blade production by wind turbine OEMs, General Electric International, Inc., the parent company of GE Wind, our largest customer, completed its acquisition of LM Wind Power, our largest competitor, in April 2017. We expect that GE Wind will utilize LM for a substantial percentage of its wind blade production in the future.
This outsourcing approach enables wind turbine OEMs to lower their capital costs and shift the production components to manufacturers that possess highly specialized expertise in advanced composite, production and process technology.
From a product perspective, wind turbine OEMs have adopted a variety of strategies, including the introduction of new turbine models with improved technology, warranty terms, more stringent performance guarantees, and tailor-made turbines for specific countries or regions. During the past three years, all of the top ten wind turbine suppliers in the world have introduced wind turbines with longer wind blade lengths and taller towers designed to capture more energy at the lower end of the wind speed scale. We believe that installation of wind turbines in regions with lower wind speeds is encouraged due to proximity to energy demand centers,
thereby reducing the amount of transmission infrastructure required. We expect this trend of expansion to regions not traditionally classified as high wind resource regions to continue, which we believe will help us continue to expand our global footprint.
| 1 | Figures are rounded to nearest whole percent. |
| 2 | Figures for Siemens/Gamesa are pro forma for the April 2017 merger of Gamesa Corporatión Tecnológica and Siemens Wind Power. |
According to BNEF, the total wind blade industry generated $11.9 billion in revenues in 2014 and is projected to grow to $19.7 billion by 2040. We believe our addressable market will continue to expand, as outsourced wind blade manufacturing is expected to rise from 52% in 2013continue to 59% in 2017, accordingexpand to data from MAKE.meet emerging market demand and accommodate new blade lengths. As the wind energy market continues to expand globally and wind turbine OEMs continue to shift towards increased outsourcing of wind blade manufacturing, we believe we are well-positioned to continue the expansion of our global footprint.
Overview
We are the largest U.S.-based independent manufacturer of composite wind blades. We enable many of the industry’s leading wind turbine OEMs who have historically relied on in-house production, to outsource the manufacturing of some of their wind blades through our global footprint of advanced manufacturing facilities strategically located to serve large and growing wind markets in a cost-effective manner. Given the importance of wind energy capture, turbine reliability and cost to power producers, the size, quality and performance of wind blades have become highly strategic to our OEM customers. As a result, we have become a key supplier to our OEM customers in the manufacture of wind blades and related precision molding and assembly systems. We have entered into long-term supply agreements pursuant to which we dedicate capacity at our facilities to our customers in exchange for their commitment to purchase minimum annual volumes of wind blade sets, which consist of three wind blades. As of March 31, 2016,April 28, 2017, our long-term supply agreements provide for estimated minimum aggregate volume commitments from our customers of $1.5approximately $2.7 billion and encourage our customers to purchase additional volume up to, in the aggregate, an estimated total contract value of over $3.0approximately $4.2 billion through the end of 2021.2023. This collaborative dedicated supplier model provides us with contracted volumes that generate significant revenue visibility, drive capital efficiency and allow us to produce wind blades at a lower total delivered cost, while ensuring critical dedicated capacity for our customers.
Our OEM customers include GE Wind, Vestas, Gamesa and Nordex (which acquired Acciona in April 2016).Nordex. Prior to 2013, we had one OEM customer that, according to data from MAKE, represented approximately 10% of the global wind energy market based on MWs of energy capacity installed. Although we do not supply all of their wind blade volume, according to data from MAKE, our OEM customers collectively accounted for approximately 32%42% of the global onshore wind energy market and approximately 56%63% of that market excluding China over the three years ended December 31, 2015, based on MWs of energy capacity installed. Additionally, our customers represented 82%99.8% of the U.S. onshore wind turbine market over the three years ended December 31, 2015,2016, based on MWs of energy capacity installed. The wind power generation industry is experiencing significant growth in countries belonging to the OECD, as well as in emerging growth markets. To meet this growth in demand reliably in a capital-efficient and cost-effective manner, many OEMs are shifting from manufacturing wind blades themselves to the outsourced manufacture of their wind blades. Our collaborative approach, advanced composite technology and global manufacturing footprint have allowed us to capitalize on this trend by replacing or augmenting the in-house capabilities of our customers and efficiently delivering wind blades when and where required. Our facilities in the United States, China, Mexico and Turkey create a geographically-diverse, global production platform to meet our customers’ needs in key large and growing wind markets. We intend to continue expanding in certain existing markets and in new locations that represent growth opportunities for the wind energy market and our customers. We believe our geographic and customer diversification, together with our long-term agreements, allow us to take advantage of growth trends and help to insulate us from potential short-term fluctuations or legislative changes in any one market.
Our wind blade and precision molding and assembly systems manufacturing businesses accounted for over 99%, over 99%, 99%, and 97% of our total net sales in the three months ended March 31, 20162017 and in the years ended December 31, 2016, 2015 2014 and 2013, respectively.2014. We also leverage our advanced composite technology and history of innovation to supply high strength, lightweight and durable composite products to the transportation market. In the three months ended March 31, 20162017 and 20152016 and in the years ended December 31, 2016, 2015 2014 and 2013,2014, we generated $191.6 million, $176.1 million, $95.6$754.9 million, $585.9 million $320.7 million and $215.1$320.7 million of net sales and $211.4 million, $174.5 million, $117.1$764.4 million, $600.1 million $362.7 million and $221.1$362.7 million of total billings, respectively. We generated net income of $3.5 million, $1.7 million, a net loss of $5.7 million, net income of $7.7 million, a net loss of $6.6$13.8 million and net income of $1.3$7.7 million in the three months ended March 31, 20162017 and 20152016 and in the years ended December 31, 2016 and 2015, 2014respectively, and 2013, respectively.a net loss of $6.6 million in the year ended December 31, 2014. We also generated $12.5 million, $11.0 million, $36,000,$55.5 million, $37.5 million $8.8 million and $6.5$11.7 million of EBITDA in the three months ended March 31, 20162017 and 20152016 and in the years ended December 31, 2016, 2015 2014 and 2013,2014, respectively. Adjusted
EBITDA in the three months
ended March 31, 20162017 and 20152016 and in the years ended December 31, 2016, 2015 and 2014 and 2013 was $15.6 million, $11.4 million, a loss of $0.1$66.2 million, $39.3 million $13.5 million and $8.4$13.5 million, respectively. For an explanation of the components of total billings, EBITDA and adjusted EBITDA, refer to the discussion in “Management’s Discussion and Analysis of Financial Condition and Results of Operations—Key Metrics Used by Management to Measure Performance.”
We were founded in 1968 and have been providing composite wind blades for 15 years.since 2001. Our knowledge and experience of composite materials and manufacturing originates with our predecessor company, Tillotson Pearson Inc., a leading manufacturer of high-performance sail and powerboats along with a wide range of composite structures used in other industrial applications. Following the separation from our boat building business in 2004, we reorganized in Delaware as LCSI Holding, Inc. Weand then changed our corporate name to TPI Composites, Inc. in 2008. Today, we are headquartered in Scottsdale, Arizona, and we have expanded our global footprint to include domestic facilities in Newton, Iowa; Fall River, Massachusetts; Warren, Rhode Island; and Santa Teresa, New Mexico and international facilities in Dafeng, China; Taicang Port, China; Taicang City, China; Juarez, MexicoJuárez, Mexico; and Izmir, Turkey. Together, as of June 30, 2016,March 31, 2017, we have approximately 3.5 million square feet of manufacturing space and over 6,000nearly 8,000 employees, including materials and process engineers, manufacturing process engineers, quality assurance personnel and production workers.
We divide our business operations into four geographic operating segments—the United States, Asia, Mexico and EMEA, as follows:
For additional information regarding our operating segments, see Note 2019 to our consolidated financial statements.
Competitive Strengths
Our long-term success will be driven by our competitive strengths. The key elements of our competitive strengths are as follows:
| • | Wind industry leader with cost-effective, global footprint. We are the largest U.S.-based independent manufacturer of composite wind blades and have developed a global footprint to serve the growing wind energy market worldwide. We currently have |
locations in the United States, China, Mexico and |
|
| • | Positioned to capitalize on significant growth trends in the wind energy market. We believe that our reputation as a reliable, global wind blade manufacturer and our focus on developing replicable and scalable manufacturing facilities and processes positions us to continue to capture opportunities in large and growing wind energy markets. Our ability to capitalize on recent growth trends in the wind energy market and OEM outsourcing has allowed us to grow our revenue |
| • | Advanced composite technology and production expertise.Our significant expertise in advanced composite technology and production enables us to manufacture lightweight and durable wind blades with near-aerospace grade precision at an industrial cost. We have developed and use high-performance composite materials, precision molding and assembly systems, including modular tooling techniques, and advanced process technology, as well as sophisticated measurement, inspection, testing and quality assurance tools, which, as of March 31, 2017, have allowed us to produce |
| • | Collaborative dedicated supplier model. Our deeply collaborative dedicated supplier model engenders stable, long-term relationships with customers, driving capital efficiency and helping to insulate us from potential short-term fluctuations or legislative changes in any one market. Our collaborative |
approach to manufacturing wind blades to meet our customers’ unique specifications, coupled with their investment in model-specific tooling in our facilities, promotes significant customer loyalty and creates higher switching costs. Our focused factory model, in which we contractually dedicate |
production lines to a specific customer in exchange for their commitment to purchase minimum annual volumes, also serves to protect the confidentiality of our customers’ proprietary wind blade and turbine designs. Our ability to manufacture the model-specific tooling for our customers further strengthens our role as a “one stop shop” for our customers, provides an efficient solution to their wind blade supply needs and allows us to produce high-quality wind blades at a lower total delivered cost. We work to continue to drive down the cost of materials and production through innovation and global sourcing, the benefit of which we share with our customers contractually in a manner that reduces LCOE for the customer and improves our margins, further strengthening our deep customer relationships. We manufacture wind blades for four of the largest global wind turbine suppliers: GE Wind, Vestas, Gamesa and |
| • | Long-term supply agreements provide significant revenue visibility.In our collaborative dedicated supplier model, we enter into long-term supply agreements that provide significant incentives for our customers to maximize the volume of wind blades purchased, through increased pricing at lower volumes that contribute to profitability at minimum volume levels. As of |
| • | Compelling |
| • | Experienced management team with a strong track record of delivering growth. Our senior management team has significant experience managing high growth, international operations. Over the course of the past decade, the team has successfully positioned us as the largest independentU.S.-based manufacturer of wind blades and has developed and deepened customer relationships |
with leading OEMs in the global wind energy market. At the same time, our team has built a global manufacturing network with |
Business Strategy
Our long-term success will also be driven by our competitive strengths and business strategy. The key elements of our business strategy are as follows:
| • | Grow our existing relationships and develop new relationships with leading industry OEMs.We plan to continue growing and expanding our relationships with existing customers who, according to data from MAKE, represented approximately |
| • | Expand our footprint in large and growing wind markets, capitalize on the continuing outsourcing trend and evaluate strategic acquisitions.As the wind energy market continues to expand globally and many wind turbine OEMs continue to shift towards increased outsourcing of wind blade manufacturing, we believe we are well-positioned to continue the expansion of our global footprint. We utilize our strengths in composites technology and manufacturing, combined with our collaborative dedicated supplier model to provide our customers with an efficient solution |
for their expansion in large and growing wind markets. Our quality, reliability and total delivered cost reduce sourcing risk for our customers. In addition, our demonstrated ability to expand into new markets and the strength of our manufacturing capabilities afford us the optionality either to build new factories or grow through strategic acquisitions. |
| • | Focus on continuing innovation.We have a history of innovation in advanced composite technologies and production techniques and use several proprietary technologies related to wind blade manufacturing. With this culture of innovation and a collaborative “design for manufacturability” approach, we continue to address increasing physical dimensions, demanding technical specifications and strict quality control requirements for our customers’ most advanced wind blades. We also invest in ongoing simplification and selective automation of production processes for increased efficiency and precision. In addition, we plan to leverage our history of composite industry-first innovations to grow our business in the transportation market, in which we believe there is a demand for high precision, structural composites manufacturing. |
| • | Continue to drive down costs of wind |
Manufacturing Facilities
We have developed a global footprint to serve the high-growth wind energy market worldwide. We currently have sixnine advanced wind blade manufacturing facilities: one in the United States, three in China, onethree in Mexico, and onetwo in Turkey. We have entered into lease agreements with third parties to lease new manufacturing facilities in Mexico and Turkey, and we expect to commence operations at these new facilities in the second half of 2016. We have also entered into a new lease with a third party for a third manufacturing facility in Juárez, Mexico, and we expect to commence operations at this facility in the first half of 2017. Our manufacturing facilities are strategically located in geographic regions that enable us to cost-effectively serve large and growing wind markets around the world. To provide a complete end-to-end manufacturing solution for our customers, we also manufacture precision molding and assembly systems at our production facilities in Warren, Rhode Island and in Taicang City, China. All of our advanced wind blade manufacturing facilities are outfitted with precision molding and assembly systems to manufacture wind blades for our customers’ unique design specifications and demanding standards. In addition, we implement and integrate our rigorous quality assurance systems with those of our customers, and all of our manufacturing facilities operate under strict quality control standards and have received or applied for International Organization for Standardization or ISO,(ISO) certification. We believe that our manufacturing facilities employ some of the most advanced manufacturing processes in the wind blade industry.
Our manufacturing operations are currently organized around four geographic regions in the United States, China, Mexico and Turkey. We believe our expertise in developing and managing manufacturing facilities worldwide positions us well to continue to capture opportunities in large and growing wind markets.
United States.Included in our U.S. operations is the manufacturing of wind blades at our Newton, Iowa plant, the manufacturing of precision molding and assembly systems used for the manufacture of wind blades in our facilities in Warren, Rhode Island and Fall River, Massachusetts and the manufacturing of composite solutions for the transportation industry, which we also conduct in our Rhode Island and Massachusetts facilities. Since 2007, our Iowa facility has been dedicated to manufacturing wind blades exclusively for GE Wind pursuant to a supply agreement that expires in 2018.2020. While capable of cost-effectively delivering precision molding and assembly
systems across all of our facilities, our U.S. production facilities primarily serve the North American market. Virtually all of the wind blades that we manufacture in our Iowa facility are deployed in wind farms located within the United States, with a substantial majority being deployed in the Midwest region of the United States.
Asia. InSince 2013, our operations in China expanded from a single location in Taicang Port, China dedicated to manufacturing wind blades for GE Wind to a three plant operation with the opening of a new facility in Dafeng, China for advanced wind blade manufacturing for Vestas and Acciona (which was acquired by Nordex in April 2016) and the addition of a facility in Taicang City, China that manufactures precision molding and assembly systems for the production of wind blades across all of our facilities. In 2014, we opened a second facility in Taicang Port, China that manufactures components. In addition, in 2015 we opened a second facility in Dafeng, China for wind blade manufacturing. Our China facilities are capable of cost-effectively delivering wind blades across the Asia Pacific region and anywhere in the world that is in close proximity to a significant port, including Europe and the United States. We export a majority of the wind blades that we manufacture in our China manufacturing facilities to countries outside of China.
Mexico. Since January 2014, we have manufactured wind blades for GE Wind in our Juárez, Mexico facility. Prior to this, the Juarez,Juárez, Mexico facility was operated as a joint venture where we manufactured wind blades for Mitsubishi Heavy Industries until 2012. In March 2014, we also began manufacturing wind blades for Gamesa at this facility. Our Mexico facility is capable of cost-effectively delivering wind blades primarily to the U.S. and Mexican markets. In addition, we have entered into two new lease agreements with a third party for two additional manufacturing facilities in Juárez, Mexico and we expect to commencecommenced operations at thesea new facilitiesfacility in the second half of 2016 and then commenced operations at a third facility in the first half ofJanuary 2017. We export a majority of the wind blades that we manufacture in our Mexico manufacturing facility to the United States.
EMEA.We commenced operations as a 75% owner in TPI Turkey in Turkey in October 2012 by way of a joint venture with ALKE to produce wind blades for GE Wind. We obtained sole control of TPI Turkey in December 2013 and also expanded our Turkey manufacturing capacity to produce wind blades for an additional customer, Nordex. We commenced operations at a second facility in Izmir, Turkey in the second half of 2016. Our Turkey operations are capable of cost-effectively delivering wind blades primarily to the European, Middle Eastern and African markets. In addition, we have entered into a new lease agreement with a third party for a second manufacturing facility in Izmir, Turkey and we expect to commence operations at this new facility in the second half of 2016. We export a majority of the wind blades that we manufacture in our Turkey manufacturing facility to Europe.
Wind Blade Manufacturing Operations and Process
We have developed significant expertise in advanced composite technology and use high performance composite materials, precision molding and assembly systems including modular tooling, and advanced process technology, as well as sophisticated measurement, inspection, testing and quality assurance tools, allowing us to produce over 26,000approximately 32,000 wind blades since 2001 with an excellent field performance record in a market where reliability is critical to our customers’ success. We manufacture or have manufactured wind blades ranging from 30 meters to over 60 meters across our global facilities, and have the capability to manufacture wind blades of greater lengths at all of our advanced manufacturing facilities as required by existing or new customers. In combination with our state-of-the-artadvanced technologies, we seek to create manufacturing processes that are replicable and scalable in our advanced manufacturing facilities located worldwide, regardless of cultural or language barriers. Our integrated manufacturing process allows us to customize each manufacturing step, from raw materials to finished products. It also allows us to systematically design for the entire manufacturing process so that we can achieve better quality control and increase production efficiencies. We believe that our focus on simplifying and, where feasible, automating production processes is critical to manufacturing high-precision, lightweight and durable products at a reasonable cost to our customers. We produce high unit volumes of near-aerospace grade products at industrial costs.
Raw Materials
The key raw materials for our wind blades include highly advanced fiberglass fabrics, select carbon reinforcements, foam, balsa wood, resin, adhesives for assembly of molded components, gel coat or paint for preparation of cosmetic surfaces and attachment hardware including steel components. Most of these materials are available in multiple geographic regions and in reasonably close proximity to our manufacturing facilities.
Our agreements for the supply of raw materials are designed to guarantee volumes that we believe will be required to fulfill our customers’ wind blade commitments. A portion of our raw materials are subject to price volatility, such as the resins used in our manufacturing processes. Although the majority of materials incorporated into our products are available from a number of sources, certain materials are available only from a relatively limited number of suppliers. We seek multiple suppliers for our raw materials and continually evaluate potential new supplier relationships.
Precision Molding and Assembly Systems
Over the last decade, we have produced hundreds of precision molding and assembly systems, ranging from 30 meters to over 60 meters in length, to support our global operations. We began these operations in our tooling
technology center in Warren, Rhode Island. In 2013, we expanded our precision molding and assembly system production capabilities to a facility in Taicang City, China, which serves customers around the globe. While capable of cost-effectively delivering precision molding and assembly systems across all of our facilities, our Rhode Island tooling technology center primarily serves the North American market. Our precision molding and assembly systems have been used to build tens of thousands of wind blades worldwide.
Our tooling solutions include precision wind blade patterns, precision molding and assembly systems, including modular tooling techniques. We believe that our technological and production expertise are key factors in our continued competitiveness, as we address continually increasing physical dimensions, demanding technical specifications, and strict quality control requirements for wind blades.
Wind Blade Production Process
Production of our wind blades requires adherence to the unique specifications of our customers, who design their wind turbines and wind blades to optimize performance, reliability and total delivered cost. With our culture of innovation and a collaborative “design for manufacturability” approach, we have the capability and expertise to manufacture wind blades of any design,different designs, utilizing fiberglass, carbon or other advanced composite materials to meet unique customer specifications. We also have the flexibility to quickly transition our manufacturing capabilities to produce different wind blade models and sizes using our precision molding and assembly systems, including modular tooling techniques.
We have developed a highly dependable method for making high-quality wind blades. We design our proprietary manufacturing processes to be replicable, scalable and transferable to each of our advanced manufacturing facilities worldwide. As a result, we can repeatedly move a product from its design phase to volume production while maintaining quality, even in developing regions of the world. Similarly, we have developed the manual portions of our manufacturing processes based on proven technologies and production methods that can be learned and implemented rapidly by line personnel. We focus on consistency and quality control across our facilities, using hands-on training methods and employing repeatable manufacturing processes.
We use an advanced form of vacuum-assisted resin transfer tooling process to pull liquid resin into a dry lay-up, resulting in light, strong, and reliable composite structures. In our manufacturing process, fiber reinforcements and core materials are laid up in a tool while dry, followed by a vacuum bag that is placed over the layup and sealed to the mold. The wind blade component is then placed under vacuum. The resin is introduced into the wind blade component via resin inlet ports and then distributed through the reinforcement and core materials via a flow medium and a series of channels, saturating the wind blade component. The vacuum removes air and gassesgases during processing, thereby eliminating voids. Pressure differentials drive resin uniformly throughout the wind blade component, providing a consistent laminate. By using a variety of reinforcement and core materials, the structural characteristics of the wind blade can be highly engineered to suit the custom specifications of our customers. Although only occasionally required by our customers, we are also capable of employing additional composite fabrication processes, such as pre-impregnated laminates, in addition to our vacuum infusion process.
Quality Control
We employ a range of measurement, inspection and testing technologies to ensure adherence to precise tolerances and strict quality standards throughout our production process. These technologies include three dimensional laser scanning and thermographic imaging of our precision molding and assembly systems. We apply advanced ultrasonic inspection technologies to ensure quality of critical adhesive joints. We conduct static and fatigue load tests on full wind blades to ensure their strength and quality. These technologies are particularly important to maintain tight dimensional tolerances within millimeters over 50 to 60 meters, to provide maximum product integrity and performance, and to contribute to our ongoing process improvement efforts.
Product Warranties
Our wind blades are subject to warranties against defects in workmanship and materials, generally for a period of two to five years. We are not responsible for the fitness for use of the wind blade in the overall wind turbine system. We also are not responsible for failure of wind blades due to acts of god, including lightning strikes and other extreme weather. From time to time, we receive notice from our customers that one of our wind blades has failed in the field or otherwise may need service. When this occurs, we work with our customer to determine the root cause of the failure before determining if we are responsible for any remediation. If a wind blade is found to be defective during the warranty period as a result of a defect in workmanship or materials, we may need to repair or replace the wind blade (which could include significant transportation and installation costs) at our sole expense, among other potential remedies. We are also generally responsible for any claim of infringement arising out of any manufacturing process technology that we own and use to produce wind blades, wind blade tooling and other products. We are not responsible for any third party intellectual property infringement claims based on the wind blade designs specified by our customers.
Wind Blade Long-Term Supply Agreements
Our current wind blade customers, which include GE Wind, Vestas, Gamesa and Nordex are some of the world’s largest wind turbine manufacturers. According to data from MAKE, our customers represented approximately 32%42% of the global onshore wind energy market, approximately 56%63% of that market excluding China, and over 82%99.8 % of the U.S. onshore wind turbine market over the three years ended December 31, 2015,2016, based on MWs of energy capacity installed. In our collaborative dedicated supplier model, our customers are incentivized to maximize the volume of wind blades purchased through increasedlower pricing at lowerhigher purchase volumes. As of March 31, 2016,April 28, 2017, our existing wind blade supply agreements provide for estimated minimum aggregate volume commitments of $1.5approximately $2.7 billion and encourages customers to, in the aggregate, purchase additional volume up to an estimated total contract value of over $3.0approximately $4.2 billion through the end of 2021,2023, which we believe provides us with significant future revenue visibility and helps to insulate us from potential short-term fluctuations or legislative changes in any one market. Although in some instances our supply agreements contain liquidated damages provisions in the event of late delivery, we generally do not bear the responsibility for transportation and delivery costs in connection with the delivery of our wind blades.
GE Wind
In January 2007, we entered into a supply agreement to build a facility and manufacture wind blades for GE Wind in Taicang Port, China. Shortly thereafterLater in September 2007, we entered into a similar agreement to build a facility and manufacture wind blades for GE Wind in Newton, Iowa. Based on the success of these manufacturing arrangements, we were able to expand our customer relationship with GE Wind through additional supply agreements for our manufacturing facility in Turkey and two of our manufacturing facilities in Turkey and Mexico in December 2011, 2013 and October 2013,2016, respectively. Subject to certain exceptions on a plant-by-plant basis, eachEach of our supply agreements with GE Wind provide for a minimum number of wind blade sets to be purchased by GE Wind each year during the term, the schedule for which is established at the outset of the agreement. In return, we commit to dedicate a specific number of manufacturing lines to GE Wind for each of the years 20152017 through 2018.2020. Additionally, we create model-specific tooling for GE Wind. For
the three months ended March 31, 20162017 and for the years ended December 31, 2016, 2015 2014 and 2013,2014, we recorded related-party sales under these supply agreements with GE Wind of $96.2$84.9 million, $379.9 million, $312.5 million and $234.8 million, and $196.1 million, respectively. In March 2017, the Company announced that it does not intend to renew the Turkey supply agreement with GE Wind, which expires on December 31, 2017. Unless otherwise terminated or renewed, our supply agreements with GE Wind are in effect until the end of 2017 for our Turkey and China facilitiesfacility and the end of 20182020 for our Iowa and two Mexico and Iowa facilities. With respect to the GE China supply agreement, we expect to reach agreement in the second quarter of 2017 to either extend the supply agreement or if necessary backfill the four mold slots from our demand pipeline in China. In some cases,the other supply agreements with GE Wind, they may terminate its supplythese agreements early upon providing us with 123 to 360365 days’ advance written notice and in one instance,the case of the Iowa supply agreement, or with no advance notice with respect to our Mexico supply agreements, and paying us termination fees as set forth in the applicable agreement. In addition, either party may terminate these supply agreements upon a material breach ofby the other party which goes uncured for 30 days after written notice has been provided. The
In April 2017, GE completed its acquisition of LM Wind Power. Although we recently extended and expanded certain of our supply agreements with respectGE Wind, we expect that GE Wind will utilize LM for a substantial percentage of its wind blade production in the future, reduce the volumes of wind blades it purchases from us or terminate any of our supply agreements, which may materially harm our relationship, business, financial condition and results of operations. In March 2017, we announced that we do not intend to our China, Mexico and Iowa facilities provide that each party will bear its own costs except thatrenew the prevailing party in a legal action arising thereunder is entitled to its reasonable costs and expenses, including reasonable attorneys’ fees.
Our IowaTurkey supply agreement with GE Wind. See “Risk Factors—Risks Related to Our Wind provides that GEBlade Business—GE’s acquisition of LM Wind Power, our largest competitor, may request that we manufacture certain wind blade models in a country where we currently do not have manufacturing capabilities. If we elect not to manufacture these wind blade models for GE Wind in such country, we have agreed to licensematerially harm our work instructions for our manufacturing processes to GE Wind for these wind blade models in such country for a license fee that will be negotiated on a case-by-case basis. This license also includesbusiness, financial condition and results of operations and may cause the right to sublicense our work instructions to a third party manufacturer in such country except for certain designated, third party wind blade manufacturers.
In January 2016, we entered into an agreement with GE Wind and received an advance of $2.0 million. These funds will be used to expand the existing Mexico manufacturing facility to accommodate larger wind blade models. We are obligated to repay the advance, without interest, by providing future credits against a specified number of wind blade sets sold to GE Wind. If the Mexico operation fails to supply those wind blade sets by December 31, 2016, the then outstanding balance of the advance will be immediately due and payable. The advance will also be immediately due in full upon a change of control of the Company or within 30 days after the effective date of an initial public offeringprice of our common stock. stock to decline.”
See “Certain Relationships andNote 3 – Related Party Transactions”Transactions of the Notes to Consolidated Financial Statements for additional information regarding our supply agreementrelated party transactions with GE Wind.
Other Long-Term Supply Agreements
We have entered into other long-term supply agreements in China, Mexico and Turkey. Under eachall but one of these agreements, we agree to dedicate capacity for a set number of wind blades for each calendar year during the term of the agreement in exchange for commitments to purchase minimum annual volumes of wind blade sets. Unless otherwise terminated, these supply agreements generally remain in effect for a period of fiveup to six years and either party may terminate their respective supply agreements upon a material breach ofby the other party which goes uncured. Some of these supply agreements contain provisions that allow for termination by the customer upon notice for reasons such as our failure to deliver the contracted wind blade volumes or our failure to meet certain mutually agreed upon cost reduction targets. See “Risk Factors—Risks Related to Our Wind Blade Business—Our long-term supply agreements with our customers are subject to termination on short notice and our failure to perform our obligations under such agreements, and termination of a significant number of these agreements would materially harm our business.”
Research and Development
We have a long history of what we believe are first-of-its-kind innovations indeveloping composite products as well as the development of new and advanced materials, tooling, manufacturing processes and inspection methods. Our knowledge and experience of composite materials and manufacturing originates with our predecessor company, Tillotson Pearson Inc., a leading manufacturer of high-performance recreational sail and powerboats along with a wide range of composite structures used in other industrial applications. Leveraging our knowledge and experience, we realized the opportunity to specialize in other industrial end-markets where there was a demand for high precision composite manufacturing capabilities.
We conduct extensive research and development in close collaboration with our customers on the design, development and deployment of innovative manufacturing processes, including automation, advanced
materials and sophisticated product quality inspection tools. We partnered with the U.S. Department of Energy, government laboratories, universities and our customers to innovate through cost sharing AMIIAdvanced Manufacturing Innovation Initiative programs. In 2015, we received an award of $3.0 million from the U.S. Department of Energy’s Office of Energy Efficiency & Renewable Energy to lead a team of industry and academic participants to design, develop and demonstrate an ultra-light composite vehicle door for high volume manufacturing production in conjunction with other industry and university participants. We employ a highly experienced workforce of engineers in various facets of our business, from discrete research and development projects, to the ongoing, real-time development and implementation of incremental manufacturing and material improvements. Our research and development effort places a priority on improving quality through process and procedure improvement, in addition to reducing cost
through specification changes and sourcing of more cost-effective suppliers. Other areas of emphasis include composite design, in-house fabrication of precision molding and assembly systems, prototyping, testing, optimization and volume production capabilities. We also encourage our employees to invent and develop new technologies to maintain our competitiveness in the marketplace. We operate a Wind Blade Innovation Center in Fall River, Massachusetts, which enhances our development activities and enables designated plant personnel to build prototypes and pilot production volumes of the wind blades scheduled to be manufactured at planned new facilities. Our Wind Blade Innovation Center can also be used to facilitate plant expansions, as well as to provide research and development on advanced composite technology. In addition to our internal research and development activities, from time to time, we also conduct research and development activities pursuant to funded development arrangements with our customers and other third parties, and intend to continue to seek opportunities for product development programs that could create recurring revenue and increase our overall profitability over the long term.
For financial statement purposes, research and development is reflected in general and administrative expenses. For the three months ended March 31, 20162017 and 20152016 and for the years ended December 31, 2016, 2015 2014 and 2013,2014, our research and development expenses were $0.3 million, $0.2$0.3 million, $1.5 million, $0.9 million $0.8 million and $0.6$0.8 million, respectively.
Competition
The wind blade market is highly concentrated, competitive and subject to evolving customer needs and expectations. In April 2017, GE, our largest customer, completed its acquisition of LM, our largest competitor. We also compete primarily with other independent wind blade manufacturers, such as LM Wind Power, Tecsis GmbH, Sinoma Science & Technology Co. Ltd. and ZhongFu Lianzhong Composites Group Co., Ltd., as well as regional wind blade suppliers in geographic areas where our current or prospective manufacturing facilities are located.
We also compete with, and in a number of cases supplement, vertically integrated wind turbine OEMs that manufacture their wind blades. We believe that a number of other established companies are manufacturing wind blades that will compete directly with our offerings, and some of our competitors, including LM, Wind Power, Tecsis andGmbH, Sinoma Science & Technology Co. Ltd. and ZhongFu Lianzhong Composites Group Co., Ltd. may have significant financial and institutional resources.
The principal competitive factors in the wind blade market include reliability, total delivered cost, manufacturing capability, product quality, engineering capability and timely completion of wind blades. We believe we compete favorably with our competitors on the basis of the foregoing factors. From 2013 to 2015, we have grown our market share from approximately 3% to 6% based on our estimated MWs and MAKE’s total global onshore wind market MWs. Conversely, LM Wind Power’s market share has declined from 14% to 11% over the same period per market share figures disclosed in its annual reports. Our ability to remain competitive will depend to a great extent upon our ongoing performance in the areas of manufacturing capability, timely completion and product quality.
Transportation Products
We seek to create additional recurring revenue opportunities through the supply of other composite structures outside the wind energy market. We believe larger scale and higher volume transportation products, including buses, trucks, electric vehicles and high performance automotive products, are ideally suited for our advanced composite technology because of the benefits derived from weight reduction, corrosion resistance, strength and durability. These benefits should allow us to develop structural composite solutions to assist our customers in developing buses with clean propulsion systems or in meeting new and developing fuel economy standards including the 2025 U.S. Government CAFÉCorporate Average Fuel Economy standards that are pushing
automakers to develop lighter, more fuel efficient vehicles with lower emissions. President Trump, however, issued an executive order in March 2017 requiring the EPA to review the implementation timing and mileage targets of these standards. In 2015, we received an award ofa $3.0 million award from the U.S. Department of Energy’s Office of Energy Efficiency & Renewable Energy to design, develop and demonstrate an ultra-light composite vehicle door for high volume manufacturing production in conjunction with various other industry and university participants.
In addition, by producing a range of composite structures, we are able to leverage the materials and manufacturing process technology and expertise developed through one project to maximize production quality, improve performance and minimize costs across our other manufacturing efforts, including our wind blade business. Our projects for customers in the transportation market have historically generated project-related revenues for a specific duration. We intend to seek collaborations with additional customers in these markets that will provide recurring project revenue and business opportunities for us, in addition to the opportunities provided by our existing customers and relationships, and increase our overall profitability over the long term. In 2017, we entered into a supply agreement with Proterra Inc. to supply them with composite bus bodies for their Catalyst zero-emission battery-electric buses from our New England manufacturing facilities.
Our facility in Warren, Rhode Island manufactures products for customers in the transportation market using the same proprietary and replicable manufacturing processes that we use to produce our wind blades. Our projects for customers in the transportation market include or have included the supply of all-composite bodies for electric buses and automated people mover systems for airports. We have also developed a number of first-of-its-kind innovations in the transportation space including an all-composite bodied HUMVEE, an all-composite HEMMT military truck cab and an all-composite transit bus body that demonstrated that such full vehicle bodies can be made with structural composites in a manner that meets the U.S. transit authority’s and U.S. Army’s reliability and durability standards, while also saving hundreds to thousands of pounds compared to steel and aluminum.
Our current principal competitors in the transportation market include suppliers of conventional steel and aluminum products and non-structural automotive fiberglass and other advanced composites-based manufacturers for transportation applications.
Intellectual Property
We have a variety of intellectual property rights, including patents (filed and applied-for in a number of jurisdictions, including the United States, the European Union and more recently, China), trademarks and copyrights, but we believe that our continued success and competitive position depend, in large part, on our proprietary materials, tooling, process and inspection technologies and our ability to innovate. Accordingly, we take measures to protect the confidentiality and control the disclosure of our proprietary technology. We rely primarily on a combination of know-how and trade secrets to establish and protect our proprietary rights and preserve our competitive position. Trade secrets, however, are difficult to protect. We also seek to protect our proprietary technology, in part, by confidentiality agreements with our customers, employees, consultants and other contractors. Trade secrets, however, are difficult to protect. These agreements may be breached, and we may not have adequate remedies for any breach. In addition, our trade secrets may otherwise become known or be independently discovered by competitors. To the extent that our customers, employees, consultants or contractors use intellectual property owned by others in their work for us, disputes may arise as to the rights in related or resulting know-how and inventions.
Backlog
As of March 31, 20162017 and 2015,December 31, 2016, the backlog for our wind blades and related products totaled $464.0$566.5 million and $365.8$567.3 million, respectively. Our backlog includes purchase orders signed in connection with our long-term supply agreements. We generally record a purchase order into backlog when the following requirements have been met: a signed long-term supply agreement has been executed with our customer, a purchase order has been made by our customer and we expect to ship wind blades to such customer in satisfaction of any purchase order within 12 months. Backlog as of any particular date should not be relied upon as indicative of our revenue for any future period. Although in certain circumstances projects may be delayed, in these circumstances the long-term supply agreement generally rolls forward and the revenue remains on the backlog until the project commences.
Regulation
Our operations are subject to various foreign, federal, state and local regulations related to environmental protection, health and safety, labor relationships, general business practices and other matters. These regulations are administered by various foreign, federal, state and local environmental agencies and
authorities, including the U.S. Environmental Protection Agency,EPA, the Occupational Safety and Health Administration of the U.S. Department of Labor and comparable agencies in China, Mexico and Turkey. In addition, our manufacturing operations in China, Mexico and Turkey are subject to those countries’ wage and price controls, currency exchange control regulations, investment and tax laws, laws restricting our ability to repatriate profits, trade restrictions and laws that may restrict foreign investment in certain industries. Some of these laws have only been recently adopted or are subject to further rulemaking or interpretation, and their impact on our operations, including the cost of complying with these laws, is uncertain. We maintain a policy of adhering to the laws of the United States or the country in which our manufacturing facility is located, whichever is stricter, and believe that our operations currently comply, in all material respects, with applicable laws and regulations. Further, as a U.S. corporation, we and our subsidiaries are subject to the Foreign Corrupt Practices Act,FCPA, which generally prohibits U.S. companies and their intermediaries from making improper payments to foreign officials for the purpose of obtaining or keeping business.
In addition, our business has been and will continue to be affected by subsidization of the wind turbine industry with its influence declining over time as wind energy reaches grid parity with traditional sources of energy. In the United States, the federal government has encouraged capital investment in renewable energy primarily through tax incentives. PTCsProduction tax credits for new renewable energy projects were first established in 1992. The Production Tax Credit for Renewable Energy or PTC, provided the owner of a wind turbine placed in operation before January 1, 2015 with a ten year10-year credit against its U.S. federal income tax obligations based on the amount of electricity generated by the wind turbine.
The PTC was extended in December 2015 for wind power projects through December 31, 2019, and is currently contemplated to be phased down over the term of the PTC extension. Specifically, the PTC will be kept at the same rate in effect at the end of 2014 for wind power projects that commenceeither commenced construction or met certain safe harbor requirements by the end of 2016, and thereafter will be reduced by 20% per year in 2017, 2018 and 2019, respectively.
In August 2015, the U.S. Environmental Protection AgencyEPA announced a final rule adopted pursuant to the Clean Air Act, known as the Clean Power Plan, which establishes national standards for states to reduce carbon emissions from power plants. Specifically, the Clean Power Plan requires states to reduce carbon emissions from power plants 32% below 2005 levels by 2030. The Clean Power Plan also provides for interim state-level compliance reduction targets beginning in 2022 through 2030 based on individualized targets for each of the states utilizing 2012 historical carbon emissions data and three building blocks for emissions reduction including: increasing generation from new zero-emitting renewable energy sources such as wind. In February 2016, the United States Supreme Court issued a stay of the EPA’s implementation of the Clean Power Plan until the D.C. Circuit of the United States Court of Appeals reviewsdecides upon the merits of multiple lawsuits challenging the legality of the Clean Power Plan. In March 2017, President Trump signed an executive order that requires, among other things, that the EPA review the Clean Power Plan and publish a rule to either suspend, revise or rescind it.
At the state level, as of December 31, 2016, 29 states and the District of Columbia have implemented RPSrenewable portfolio standard (RPS) programs that generally require that, by a specified date, a certain percentage of a utility’s electricity supplied to consumers within such state is to be from renewable sources (generally between 15% and 25%(ranging from 8% to 100% by 2020 or 2025)2017 to 2045).
In addition, there are also increasing regulatory efforts to promote renewable power. China is currently implementing a 5-year planits 13th 5-Year Plan with a goal of 15% total primary energy from non-fossil fuel sources and targeting 250210 GWs ofgrid-connected wind capacity by 2020 according to its National Development and Reform Commission,
and employs preferential feed-in tariff schemes, in addition to local tax-based incentives. Mexico has established strict targets, aiming for 35% renewable energy by 2024 and 50% by 2050, according to MAKE, which it is facilitating through tax incentives. Large European Union members have renewable energy targets for 2020 of between 13% and 49% of all energy use derived from renewable energy sources, according to MAKE. Additionally, Turkey enacted Law No. 5346 in 2005 to promote renewable-based electricity generation within their domestic electricity market by introducing tariffs and purchase obligations for distribution companies requiring purchases from certified renewable energy producers. The World Bank also provided to Turkey with an aggregate of $600 million of loan proceeds to encourage investors to construct generation plants with renewable energy resources.
To incentivize target compliance, most member states adhere to a tariff scheme, which accelerates investment in renewable energy technologies by offeringlong-term supply agreements to renewable energy producers, or a cap and trade program. Wind power producers are generally awarded a higher per MW price under this policy mechanism.
Properties
Our headquarters is located in Scottsdale, Arizona, and we own or lease various other facilities in the United States, China, Mexico and Turkey. We believe that our properties are generally in good condition, are well maintained and are generally suitable and adequate to carry out our business at expected capacity for the foreseeable future. The table below lists the locations and square footage for our facilities as of June 30, 2016:March 31, 2017:
Location | Year | Leased or | Approximate | Description of Use | Year | Leased or | Approximate | Description of Use | ||||||||||||||||
Newton, IA, United States | 2008 | Leased | 337,922 | Wind Blade Manufacturing Facility | 2008 | Leased | 337,922 | Wind Blade Manufacturing Facility | ||||||||||||||||
Dafeng, China | 2013 | Leased | 392,000 | Wind Blade Manufacturing Facility | 2013 | Leased | 392,000 | Wind Blade Manufacturing Facility | ||||||||||||||||
Dafeng, China (1) | 2015 | Leased | 446,034 | Wind Blade Manufacturing Facility | ||||||||||||||||||||
Dafeng, China | 2015 | Leased | 446,034 | Wind Blade Manufacturing Facility | ||||||||||||||||||||
Taicang Port, China | 2007 | Owned | 226,542 | Wind Blade Manufacturing Facility | 2007 | Owned | 226,542 | Wind Blade Manufacturing Facility | ||||||||||||||||
Juarez, Mexico | 2013 | Leased | 345,984 | Wind Blade Manufacturing Facility | ||||||||||||||||||||
Juarez, Mexico (2) | 2016 | Leased | 358,796 | Wind Blade Manufacturing Facility | ||||||||||||||||||||
Juarez, Mexico (3) | 2017 | Leased | 339,386 | Wind Blade Manufacturing Facility | ||||||||||||||||||||
Juárez, Mexico | 2013 | Leased | 345,984 | Wind Blade Manufacturing Facility | ||||||||||||||||||||
Juárez, Mexico | 2016 | Leased | 358,796 | Wind Blade Manufacturing Facility | ||||||||||||||||||||
Juárez, Mexico | 2017 | Leased | 339,386 | Wind Blade Manufacturing Facility | ||||||||||||||||||||
Izmir, Turkey | 2012 | Leased | 343,000 | Wind Blade Manufacturing Facility | 2012 | Leased | 343,000 | Wind Blade Manufacturing Facility | ||||||||||||||||
Izmir, Turkey (2) | 2015 | Leased | 397,931 | Wind Blade Manufacturing Facility | ||||||||||||||||||||
Izmir, Turkey | 2015 | Leased | 397,931 | Wind Blade Manufacturing Facility | ||||||||||||||||||||
Fall River, MA, United States | 2008 | Leased | 70,000 | Composite Solution Manufacturing and Research and Development Facility | 2008 | Leased | 70,000 | Composite Solution Manufacturing and Research and Development Facility | ||||||||||||||||
Warren, RI, United States | 2004 | Leased | 91,387 | Precision Molding Development and Manufacturing and Research and Development Facility | 2004 | Leased | 91,387 | Precision Molding Development and Manufacturing and Research and Development Facility | ||||||||||||||||
Santa Teresa, NM, United States | 2014 | Leased | 503,710 | Wind Blade Storage Facility | 2014 | Leased | 503,710 | Wind Blade Storage Facility | ||||||||||||||||
Scottsdale, AZ, United States | 2015 | Leased | 13,285 | Corporate Headquarters | 2015 | Leased | 20,964 | Corporate Headquarters | ||||||||||||||||
Taicang Port, China | 2014 | Leased | 80,730 | Component Manufacturing Facility | 2014 | Leased | 80,730 | Component Manufacturing Facility | ||||||||||||||||
Taicang City, China | 2013 | Leased | 69,750 | Precision Molding Manufacturing Facility | 2013 | Leased | 69,750 | Precision Molding Manufacturing Facility | ||||||||||||||||
In April 2017, we entered into a letter of intent with a third party for the construction and lease of a new wind turbine blade manufacturing facility of approximately 523,514 square feet in Matamoros, Mexico. We expect that we will enter into a definitive lease agreement for this wind turbine blade manufacturing facility in the second quarter of 2017 and will commence operations in the first half of 2018.
Employees
As of June 30, 2016,March 31, 2017, we employed over 6,000nearly 8,000 full-time employees, approximately 1,280 of whom approximately 1,100 arewere located in the United States, 1,8902,080 in China, 1,5602,870 in Mexico and 1,4501,750 in Turkey. OurCertain of our employees in Turkey are represented by a labor union. We believe that our relations with our employees are good.
Legal Proceedings
From time to time, we may be involved in disputes or litigation relating to claims arising out of our operations.
In March 2015, a complaint was filed against the Company in the Superior Court of the State of Arizona (Maricopa County) by a former employee of the Company, alleging that the Company had agreed to make certain cash payments to such employee upon any future sale of the Company. We filed a motion to dismiss the
complaint in April 2015, which was denied. We subsequently filed an answer to the complaint in July 2015 denying the substantive allegations of the complaint. We filed a motion for summary judgment to dismiss the complaint in April 2016 and our motion remains pending. The parties completed court-ordered mediation in December 2015 but were not able to reach a settlement. We filed a motion for summary judgment to dismiss the complaint in April 2016 and the court denied our motion in August 2016. The court set a trial date for September 2017. We continue to deny the substantive allegations of the complaint and we intend to vigorously defend this lawsuit; however, we are currently unable to determine the ultimate outcome of this case.
In August 2015, we entered into a transition agreement with our former Senior Vice President – Asia, pursuant to which he transitioned out of this role at the end of 2015 and was to serve in a consulting capacity in 2016 and 2017. In January 2016, following our discovery that he had materially violated the terms of his transition agreement, we terminated his consultancy for cause. In April 2016, he filed an arbitration claim in China with the Taicang Labor and Personnel Dispute Arbitration Committee alleging that we improperly terminated his transition agreement. He is demanding that we continue to honor the terms of the transition agreement and pay him compensation and fees owed to him under the transition agreement, which in the aggregate total approximately $2.6 million. In addition, he is also challenging the validity of our termination of his option to purchase 164,880 shares of our common stock and 77,760 restricted stock units under the 2015 Plan, which were canceled in January 2016 when we terminated his consultancy. We believe that our termination of his transition agreement was valid and we intend to vigorously defend this matter.
Executive Officers and Directors
The following table sets forth information regarding our executive officers and directors including their ages as of June 30, 2016:March 31, 2017:
Name | Age | Position | ||
Steven C. Lockard | 55 | President, Chief Executive Officer and Director | ||
Mark R. McFeely | Chief Operating Officer | |||
Wayne G. Monie | Chief Manufacturing Technology Officer | |||
William E. Siwek | Chief Financial Officer | |||
Lars Moller | Executive Vice President—Business Development and Strategy | |||
Thomas J. Castle | Senior Vice President—North American Wind Operations and Global Operational Excellence | |||
Steven G. Fishbach | General Counsel and Secretary | |||
| ||||
| ||||
| ||||
Paul G. Giovacchini | 59 | Director and Chairman of the Board | ||
Stephen B. Bransfield | 72 | Director | ||
Michael L. DeRosa | 45 | Director | ||
Philip J. Deutch | 52 | Director | ||
Jack A. Henry | Director | |||
James A. Hughes | ||||
| Director | |||
Daniel G. Weiss | Director |
Steven C. Lockard. Mr. Lockard became our President and Chief Executive Officer in 2004 and has served as a member of our board of directors since 2004. Prior to joining us in 1999, Mr. Lockard was Vice President of Satloc, Inc., a supplier of precision GPS equipment, from 1997 to 1999. Prior to that, Mr. Lockard was Vice President of marketing and business development and a founding officer of ADFlex Solutions, Inc., a NASDAQ-listed international manufacturer of interconnect products for the electronics industry, from 1993 to 1997. Prior to that, Mr. Lockard held several marketing and management positions including Business Unit Manager, Corporate Market Development Manager and Marketing/Applications Engineer at Rogers Corporation from 1982 to 1993. Mr. Lockard serves on the board of and is co-chair of the policy committee for the American Wind Energy Association and also serves on the board of Fluidic Energy. Mr. Lockard holds a B.S. degree in Electrical Engineering from Arizona State University.
We believe that Mr. Lockard is qualified to serve as a member of our board of directors based on his deep knowledge of our company gained from his positions as our President and Chief Executive Officer, as well as his experience in the wind energy industry and in high-growth global manufacturing companies.
Mark R. McFeely.Mr. McFeely joined us in November 2015 as our Chief Operating Officer. Prior to joining us, Mr. McFeely served as Senior Vice President and Chief Operations Officer of Remy International, Inc., an OEM and aftermarket supplier of heavy duty and light duty automotive components, from 2012 to 2015. Prior to that, Mr. McFeely was Vice President, Operations of Meggitt Safety Systems Inc. from 2011 to 2012. From 2005 to 2011, Mr. McFeely held several operations and leadership positions within divisions of Danaher Corporation, including General Manager/Plant Manager of Pacific Scientific, General Manager and Vice President, Global Operations of Kollmorgen Vehicle Systems, and General Manager/Director Operations of Jacobs Vehicle System Asia. Prior to 2005, Mr. McFeely held several operations and business development leadership positions at Honeywell International Inc. and the Federal Emergency Management Agency. He received a bachelor’s degree from Colorado State University and an M.B.A. from Pennsylvania State University.
Wayne G. Monie.Mr. Monie has served as our Chief Manufacturing Technology Officer since December 2015, our Asia CEO from August 2015 through March 31, 2016, and has previously served as a member of our board of directors since 2004.from 2004 to 2016. Mr. Monie previously served as our Chief Operating
Officer from 2004 to 2015
and as our Vice President—Operations from 2002 to 2004. Prior to joining us, Mr. Monie was Vice President, Manufacturing for First Solar, Inc., a solar company, from 2001 to 2002. Prior to that, Mr. Monie was Vice President and General Manager of Satloc, Inc., a supplier of precision GPS equipment, from 1998 to 2001. Prior to that, Mr. Monie was with Rogers Corporation from 1983 to 1998 reaching the position of General Manager of the Power Distribution Division, a manufacturer of power distribution systems for mainframe computers and large telecom switches. Prior to that, Mr. Monie was Executive Vice President of Glen-Mar Door Manufacturing Company, a manufacturer of residential and architectural doors from 1980 to 1983. Prior to that, Mr. Monie was Production Manager for Sperry Flight Systems from 1978 to 1980. Prior to that, Mr. Monie started his career with the Delco Moraine Division of General Motors in various process and industrial engineering positions, holding several supervisory engineering positions and General Foreman over a three shift manufacturing department. He was with General Motors from 1970 to 1978. Mr. Monie holds a B.S. degree in Industrial Engineering from Virginia Polytechnic Institute and State University and an M.S. degree in Engineering Management from the University of Dayton.
We believe that Mr. Monie is qualified to serve as a member of our board of directors based on his deep knowledge of our company gained from his positions as our Chief Operating Officer and Asia CEO, as well as his experience in the wind energy industry.
We currently expect that Mr. Monie will resign from our board of directors prior to the effectiveness of the registration statement of which this prospectus is a part.
William E. Siwek. Mr. Siwek joined us as our Chief Financial Officer in 2013. Prior to joining us, Mr. Siwek previously served as the Chief Financial Officer for T.W. Lewis Company, an Arizona-based real estate investment company, from September 2012 to September 2013. From May 2010 until September 2012, he was an independent consultant assisting companies in the real estate, construction, insurance and renewable energy industries. Prior to that, Mr. Siwek was Executive Vice President and Chief Financial Officer of Talisker Mountain, Inc., from January 2009 to April 2010. Prior to that, he was President and Chief Financial Officer of the Lyle Anderson Company from December 2002 to December 2008. Prior to that, Mr. Siwek spent 18 years, from September 1984 to May 2002, with Arthur Andersen where he became a Partner in both Audit and Business Consulting Divisions. Mr. Siwek holds B.S. degrees in Accounting and Economics from University of Redlands and is a Certified Public Accountant.
Lars Moller. Mr. Moller has served as our Executive Vice President—Business Development and Strategy since April 2016. Prior to that he served as our Senior Vice President—EMEA and Global Supply Chain since September 2015 and prior to that he was our Senior Vice President—EMEA since July 2014. Before joining us, Mr. Moller served as CEO of North American Operations for Global Energy Services from 2013 to 2014. From 2010 to 2012, Mr. Moller served as Group Senior Vice President for Vestas Wind Systems. From 2007 to 2010, Mr. Moller served as Executive Vice President and COOChief Operating Officer for Broadwind Energy and from 2003 to 2007, Mr. Moller served as President of DMI Industries.
Thomas J. Castle. Mr. Castle joined us in November 2015 as our Senior Vice President—North American Wind Operations and Global Operational Excellence. Prior to joining us, Mr. Castle was with Honeywell Aerospace from 2007 to 2015. Mr. Castle served as the Vice President of Integrated Supply Chain, Americas Electronics Operations Center from 2014 to 2015. From 2012 to 2014, he was the Global Vice President of the Honeywell Operating System for Aerospace. Prior to that, Mr. Castle held various positions at the Americas Services Organization from 2007 to 2012. From 1996 to 2007, Mr. Castle was with GE Aviation in roles of increasing responsibility, most recently as the Managing Director of a manufacturing facility in Thailand from 2005 to 2007. Mr. Castle holds a B.S. degree in Aeronautics from St. Louis University.
Steven G. Fishbach.Fishbach.Mr. Fishbach has served as our General Counsel since January 2015. Prior to joining us, Mr. Fishbach served as Deputy General Counsel of Global Cash Access Holdings, Inc. from 2011 to 2015 and Associate General Counsel from 2009 to 2011. Prior to that, Mr. Fishbach served in various senior roles in the legal department of Fidelity National Information Services, Inc./eFunds Corporation from 2005 to
2008. Mr. Fishbach also practiced corporate and securities law at Squire Sanders (now Squire Patton Boggs) from 2000 to 2005. Mr. Fishbach holds a B.A. degree in American Studies from Georgetown University and a juris doctorJ.D. degree from William & Mary Law School.
Paul G. Giovacchini. Mr. Giovacchini has served as Chairman of our board of directors since 2006. Mr. Giovacchini is currently an independent consulting advisor to Landmark Partners, Inc. Prior to 2014 he had
been a Principal of Landmark Partners, Inc. since 2005. Mr. Giovacchini has been investing in privately held companies on behalf of institutional limited partnerships since 1987. Mr. Giovacchini holds an A.B. in Economics from Stanford University and an M.B.A. from Harvard University.
We believe that Mr. Giovacchini is qualified to serve as a member of our board of directors because of his experience investing in growth companies and serving on their boards of directors, and his experience with debt securities. His long history with us serves as an asset to us as we transition from a private company to a public company.
Stephen B. Bransfield. Mr. Bransfield has served as a member of our board of directors since 2010. From 1993 to 2005, Mr. Bransfield was Vice President—GE Energy Global Supply Chain at General Electric. Prior to that, from 1988 to 1993, Mr. Bransfield held various General Manager positions at General Electric, where he began working in 1967. Mr. Bransfield currently serves on the board of directors of Package One Industries. Mr. Bransfield holds a B.S. in Operations from Boston College and an M.B.A. from Suffolk University.
We believe that Mr. Bransfield is qualified to serve as a member of our board of directors because of his substantial experience in the wind energy industry, global supply chain, quality and operations leadership.
Michael L. DeRosa. Mr. DeRosa has served as a member of our board of directors since 2009. Since 2006, Mr. DeRosa has been Managing Director at Element Partners, a private equity firm focused on energy and industrial technology. Prior to that, Mr. DeRosa was a Partner at Cordova Ventures from 2004 to 2006. From 2000 to 2004, Mr. DeRosa served as a Principal of EnerTech Capital, a venture capital firm that invests in energy technology. Mr. DeRosa currently serves on the board of directors of Agility Fuel Systems, AMP Electrical Distribution Services, Inc., Detechtion Technologies, Ecore International and TAS Energy. Mr. DeRosa previously served as a director of Advantage IQ, Arbinet-thexchange, Inc., Aspex Corporation, Axonn, EcoSMART, Energex and International Fiber. Mr. DeRosa holds a Bachelors degreeB.S. in Electrical Engineering from Georgia Tech and an M.B.A. from the Wharton School of the University of Pennsylvania.
We believe that Mr. DeRosa is qualified to serve as a member of our board of directors because of his substantial experience in the clean technology industry and his long history of investing in renewable and alternate energy, energy technology, the industrial internet, materials and chemicals, and recycling technology.
Philip J. Deutch. Mr. Deutch has served as a member of our board of directors since 2007. Since 2005, Mr. Deutch has been the Managing Partner of NGP Energy Technology Partners, L.P. (NGP ETP), a private equity fund that invests in companies that provide products and services to the oil and gas, power, environmental, energy efficiency and alternative energy sectors. PriorSince 2016, Mr. Deutch has been a Partner at Social Capital, a partnership of philanthropists, technologists and capitalists utilizing venture capital as a force to joining NGP ETP, from 1997-2005,create value and change on a global scale. From 1997 to 2005, Mr. Deutch served as a Managing Director and Member of the Executive Committee of Perseus, LLC, a private equity fund management firm, where he co-led the Firm’s investments in energy.firm. Prior to joining Perseus, Mr. Deutch was an attorney at Williams & Connolly LLP from 1991 to 1997 and worked in the Mergers and Acquisitions Department of Morgan Stanley & Co. from 1986 to 1988. Mr. Deutch currently serves on the board of directors of Catapult Energy Services, LLC, Oilfield Water Logistics, LLC, groSolar,Community Energy Solar, LLC, Waste Resource Management, Inc., and LED Engin, Inc.Data Coral and previously served on the board of directors of American Wind Capital Company, Satcon Technology Corporation, Evergreen Solar and Beacon Power. Mr. Deutch holds a B.A. in Economics from Amherst College where he was elected a member of Phi Beta Kappa and a J.D. with distinction from Stanford Law School. Mr. Deutch currently servesis on the External Advisory CommitteeBoard of the MIT Solar StudyFolger Shakespeare Library and previously served on the Advisory Committee for the 2005 and 2006 Energy Venture Fairs and the Selection Committees for the 2005 Cleantech Venture Forum and 2006 NREL Industry Growth Forums.iMentor (Bay Area).
We believe that Mr. Deutch is qualified to serve as a member of our board of directors because of his substantial experience investing in energy companies in the areas of renewable and alternative energy, energy efficiency, power and oil & gas and serving on the board of directors of both public and private companies.
Paul G. Giovacchini. Mr. Giovacchini has served as Chairman of our board of directors since 2006. Mr. Giovacchini is currently an independent consulting advisor to Landmark Partners, Inc. Prior to 2014 he had been a Principal of Landmark Partners, Inc. since 2005. Mr. Giovacchini has been investing in privately held companies on behalf of institutional limited partnerships since 1987. Mr. Giovacchini holds an A.B. in Economics from Stanford University and an M.B.A. from Harvard University.
We believe that Mr. Giovacchini is qualified to serve as a member of our board of directors because of his experience investing in growth companies and serving on their boards of directors, and his experience with debt securities. His long history with us serves as an asset to us as we transition from a private company to a public company.
Jack A. Henry. Mr. Henry has served as a member of our board of directors since 2008. Since 2000, Mr. Henry has served as the Managing Director of Sierra Blanca Ventures, LLC, a private investment and advisory firm. From 1966 to 2000, Mr. Henry worked as a certified public accountant for Arthur Andersen, a national accounting firm, retiring in 2000 as the Managing Partner of the Phoenix, Arizona office. Mr. Henry currently serves on the board of directors and chairs the audit committee of Grand Canyon Education and the boards of directors and audit committees of several private companies and is President of the Arizona Chapter of the National Association of Corporate Directors. Mr. Henry received a Bachelor of Business Administration degree and a Master of Business Administration degree from the University of Michigan.
We believe that Mr. Henry is qualified to serve as a member of our board of directors because his substantial experience in serving as a director of numerous private and public companies, as well as his prior employment as an accountant, make him well suited to assist us as a director and in our transition from a private company to a public company.
James A. Hughes. Mr. Hughes has served on our board of directors since October 2015. Since 2012,Effective June 30, 2016, Mr. Hughes has servedstepped down from his role as the Chief Executive Officer of First Solar, Inc., and served as a member of First Solar’s BoardSolar, Inc.’s board of Directors. Mr. Hughes recently announced that he would be stepping downdirectors from his roleMay 2012 until September 2016. Prior to serving as the Chief Executive Officer effective June 30, 2016, but will continue to serve as a member of First Solar’s board of directors. Prior to that,Solar, Inc., he served as itsthe company’s Chief Commercial Officer from March 2012 to May 2012. Prior to joining First Solar, Inc., Mr. Hughes served as Chief Executive Officer and Director of AEI Services LLC from October 2007 until April 2011. From 2004 to 2007, Mr. Hughes engaged in principal investing with aprivately-held company based in Houston, Texas that focused on micro-cap investing in North American distressed manufacturing assets. Prior to that, he served as President and Chief Operating Officer of Prisma Energy International from 2002 to 2004. Since November 2016, Mr. Hughes ishas served as a director of Alcoa Corporation, a New York Stock Exchange-listed producer of bauxite, alumina and aluminum products. Mr. Hughes also served as a Non-Executive Director from 2012 to 2016 of APR Energy plc, a London Stock Exchange-listed energy company participating in the global market for gas and diesel fired temporary power plants. HeMr. Hughes is Chairman of the board of directors of the Los Angeles branch of the Federal Reserve Bank of San Francisco. Mr. Hughes holds a juris doctor degreeJ.D. from the University of Texas at Austin School of Law, a Certificate of Completion in international business law from Queen Mary’s College, University of London and a bachelor’sBachelor’s degree in business administrationBusiness Administration from Southern Methodist University.
We believe that Mr. Hughes is qualified to serve as a member of our board of directors because of his many years of experience in various sectors of the energy industry, including renewable energy, as well as his experience serving as the CEO and in other high level executive roles at publicly-traded energy companies.
Scott N. Humber. Mr. Humber has served as a member of our board of directors since 2004. Mr. Humber has served as a Managing Director of Landmark Partners, Inc. since 2003. Prior to joining Landmark Partners, Mr. Humber was a principal at Boston Capital Private Equity Partners from 2000 to 2002. From 1998 to 2000, Mr. Humber was an associate at Triumph Capital Group and an Investment Banking Analyst at Salomon Smith Barney from 1996 to 1998. Mr. Humber holds a B.A. in International Commerce and Organizational Behavior and Management from Brown University.
We believe that Mr. Humber is qualified to serve as a member of our board of directors because his extensive experience as an investor in a variety of industries, as well as his long history of serving on our board of directors make him a valuable addition to the board of directors, especially as we transition from a private company to a public company.
We currently expect that Mr. Humber will resign from our board of directors prior to the effectiveness of the registration statement of which this prospectus is a part.
Daniel G. Weiss. Mr. Weiss has served as a member of our board of directors since 2009. Mr. Weiss is a co-founder and Managing Partner of Angeleno Group, a Los Angeles-based private equity firm with a global platform focused on high growth investments in alternative energy and natural resource-related companies. Founded in 2001, Angeleno Group invests broadly across the energy and natural resource industry to support innovative, well managed, rapidly growing businesses. Mr. Weiss has been with the Angeleno Group since 2001. In addition to his firm management responsibilities, Mr. Weiss leads investments and serves on boards of multiple Angeleno Group private portfolio companies. Prior to joining Angeleno Group, Mr. Weiss was an attorney at O’Melveny & Myers from 1998-1999.1998 to 1999. Mr. Weiss currently and previously has served on boards or public commissions for a number of non-profit and government organizations including the World Resources Institute, the Stanford Law School Board of Visitors, the City of Los Angeles Redistricting Commission and the UCLA Institute on the Environment and Sustainability. Mr. Weiss holds a B.A. in History with High Honors from the University of California, Berkeley, an M.A. in Latin American Studies from Stanford University and a J.D. from Stanford Law School.
We believe that Mr. Weiss is qualified to serve as a member of our board of directors because he has substantial experience as an investor and director for energy and energy related technology companies.
Board Composition
Our board of directors is currently composed of ten members. Our certificate of incorporation and bylaws to be effective upon the closing of this offering provide that the number of our directors shall be fixed from time to time by a resolution of the majority of our board of directors. Upon completion of this offering, ourOur board of directors will beis divided into three staggered classes of directors. At each annual meeting of stockholders, a class of directors will be elected for a three-year term to succeed the same class of directors whose terms are then expiring. The terms of the directors will expire upon the election and qualification of successor directors at the annual meeting of stockholders to be held during 2017 for the Class I directors, 2018 for the Class II directors and 2019 for the Class III directors.
Any increase or decrease in the number of directors will be distributed among the three classes so that, as nearly as possible, each class will consist of one-third of the directors.
The division of our board of directors into three classes with staggered three-year terms may delay or prevent a change of our management or a change of control. See the section of this prospectus captionedtitled “Description of Capital Stock—Anti-Takeover Effects of Delaware Law and Provisions of Our Certificate of Incorporation and Bylaws” for a discussion of other anti-takeover provisions found in our certificate of incorporation and bylaws to be effective upon the closing of this offering.bylaws.
Director Independence
Under the rules of The NASDAQ Global Market, independent directors must comprise a majority of a listed company’s board of directors within a specified period of the completion of its offering. In addition, the rules of The NASDAQ Global Market require that, subject to specified exceptions, each member of a listed company’s audit, compensation and nominating and corporate governance committees be independent. Under the rules of The NASDAQ Global Market, a director will only qualify as an “independent director” if, in the opinion of that company’s board of directors, that person does not have a relationship that would interfere with the exercise of independent judgment in carrying out the responsibilities of a director.
Audit committee members must also satisfy the independence criteria set forth in Rule 10A-3 under the Securities Exchange Act of 1934, as amended. In order to be considered independent for purposes of Rule 10A-3, a member of an audit committee of a listed company may not, other than in his or her capacity as a member of the audit committee, the board of directors or any other board committee: (1) accept, directly or indirectly, any consulting, advisory or other compensatory fee from the listed company or any of its subsidiaries or (2) be an affiliated person of the listed company or any of its subsidiaries.
In April 2016,March 2017, our board of directors undertook a review of its composition, the composition of its committees and the independence of each director. Based upon information requested from and provided by each director concerning his background, employment and affiliations, our board of directors has determined that, none of the members of the board of directors, except for Messrs. Lockard and Monie, has a relationship that would interfere with the exercise of independent judgment in carrying out the responsibilities of a director and that each of these directors is “independent” as that term is defined under the rules of The NASDAQ Global Market. Our board of directors also determined that Messrs. Jack Henry, Stephen Bransfield and James Hughes, who will comprise our audit committee upon completion of this offering;committee; Messrs. Paul Giovacchini, Michael DeRosa, Jack Henry and Philip Deutch, who will comprise our compensation committee upon completion of this offering;committee; and Messrs. Philip Deutch, Stephen Bransfield and Daniel Weiss, who will comprise our nominating and corporate governance committee, upon completion of this offering, satisfy the independence standards for those committees established by applicable SEC rules and the rules of The NASDAQ Global Market. In making this
determination, our board of directors considered the relationships that each non-employee director has with our company and all other facts and circumstances our board of directors deemed relevant in determining their independence, including the beneficial ownership of our capital stock by each non-employee director.
Board Leadership Structure and Role of the Board in Risk Oversight
The positions of chairman of the board and chief executive officer are presently separated and have historically been separated at TPI. Separating these positions allows our Chief Executive Officer to focus on our day-to-day business, while allowing the Chairman of the Board to lead the board of directors in its fundamental role of providing advice to and independent oversight of management. Our board of directors recognizes the time, effort, and energy that the Chief Executive Officer is required to devote to his position in the current business environment, as well as the commitment required to serve as our Chairman, particularly as the board of directors’ oversight responsibilities continue to grow. Our board of directors also believes that this structure ensures a greater role for the independent directors in the oversight of our company and active participation of the independent directors in setting agendas and establishing priorities and procedures for the work of our board of directors. This leadership structure also is preferred by a significant number of our stockholders. Our board of directors believes its administration of its risk oversight function has not affected its leadership structure.
While our bylaws and corporate governance guidelines do not require that our Chairman and Chief Executive Officer positions be separate, our board of directors believes that having separate positions and having an independent outside director serve as chairman is the appropriate leadership structure for us at this time and demonstrates our commitment to good corporate governance.
One of the key functions of our board of directors is informed oversight of our risk management process. Our board of directors does not have a standing risk management committee, but rather administers this oversight function directly through the board of directors as a whole, as well as through its standing committees that address risks inherent in their respective areas of oversight. In particular, our board of directors is responsible for monitoring and assessing strategic risk exposure. Our audit committee is responsible for reviewing and discussing our major financial risk exposures and the steps our management has taken to monitor and control these exposures, including guidelines and policies with respect to risk assessment and risk management. Our audit committee also monitors compliance with legal and regulatory requirements, in addition to oversight of the performance of our external audit function. Our nominating and corporate governance committee monitors the effectiveness of our corporate governance guidelines. Our compensation committee reviews and discusses the risks arising from our compensation philosophy and practices applicable to all employees that are reasonably likely to have a materially adverse effect on us.
Board Committees
Our board of directors has an audit committee, a compensation committee and a nominating and corporate governance committee, each of which has the composition and responsibilities described below. The audit committee, compensation committee and nominating and corporate governance committee all operate under charters approved by our board of directors, which will be available on our website upon the closing of this offering.
Audit Committee
Our audit committee oversees our corporate accounting and financial reporting process and assists the board of directors in monitoring our financial systems and our legal and regulatory compliance. Our audit committee will also:
The members of our audit committee upon completion of this offering will beare Messrs. Jack Henry, Stephen Bransfield and James Hughes. Mr. Henry is our audit committee chairman. Our board of directors has concluded that the composition of our audit committee meets the requirements for independence under, and the functioning of our audit committee complies with, the current requirements of and SEC rules and regulations, and is an audit committee financial expert as defined under SEC rules and regulations.
Compensation Committee
Our compensation committee oversees our corporate compensation programs. The compensation committee also:
The members of our compensation committee upon completion of this offering will beare Messrs. Paul Giovacchini, Michael DeRosa, Jack Henry and Philip Deutch. Mr. Giovacchini is the chairman of our compensation committee. Our board of directors has determined that each of the four members noted above is “independent” for compensation committee purposes as that term is defined under the applicable rules, and before the expiration of the phase-in period applicable to initial public offerings under the applicable rules, all members of our compensation committee will beare “independent” for compensation committee purposes.
Nominating and Corporate Governance Committee
Our nominating and corporate governance committee oversees and assists our board of directors in reviewing and recommending corporate governance policies and nominees for election to our board of directors. The nominating and corporate governance committee will also:
The members of our nominating and corporate governance committee upon completion of this offering will beare Messrs. Philip Deutch, Stephen Bransfield and Daniel Weiss. Mr. Deutch will beis the chairman of our nominating and corporate governance committee upon completion of this offering.committee. Our board of directors has determined that each member of our nominating and corporate governance committee is independent under the applicable rules of The NASDAQ Global Market.
Our board of directors may from time to time establish other committees.
Compensation Committee Interlocks and Insider Participation
DuringOur compensation committee was comprised of Messrs. Paul Giovacchini, Philip Deutch, Daniel Weiss and Michael DeRosa during the years ended December 31, 2015, 2014, 2013 and 2013,from January 2016 until the effective date of our IPO in July 2016. Since the effective date of our IPO, our compensation committee washas been comprised of Messrs. Paul Giovacchini, Philip Deutch, Daniel Weiss, Michael DeRosa and Paul Giovacchini.Jack Henry. None of the members of our compensation committee is an officer or employee of our company. None of our executive officers currently serves, or in the past year has served, as a member of the board of directors or compensation committee of any entity that has one or more executive officers serving on our board of directors or compensation committee.
In March 2012, we sold an aggregate of 240 shares of our Senior Redeemable preferred stock at a purchase price of $25,000 per share. As part of this offering, we sold an aggregate of 6 shares of our Senior Redeemable preferred stock for an aggregate purchase price of $0.15 million to an entity affiliated with Energy Technology Partners, L.L.C., of which Mr. Deutch is the manager. We also sold an aggregate of 60 shares of our Senior Redeemable preferred stock for an aggregate purchase price of $1.5 million to an entity affiliated with Angeleno Group, of which Mr. Weiss is a co-founder and managing partner. We also sold an aggregate of 174 shares of our Senior Redeemable preferred stock for an aggregate purchase price of $4.35 million to entities affiliated with Element Partners, of which Mr. DeRosa is a managing director.
In May 2014, we sold an aggregate of 120 shares of our Super Senior Redeemable preferred stock at a purchase price of $25,000 per share. As part of this offering, we sold an aggregate of 10 shares of our Super Senior Redeemable preferred stock for an aggregate purchase price of $0.25 million to an entity affiliated with Angeleno Group, of which Mr. Weiss is a co-founder and managing partner. We also sold an aggregate of 110 shares of our Super Senior Redeemable preferred stock for an aggregate purchase price of $2.75 million to entities affiliated with Element Partners, of which Mr. DeRosa is a managing director.
In June 2014, we sold an aggregate of 160 shares of our Super Senior Redeemable preferred stock at a purchase price of $25,000 per share. As part of this offering, we also sold an aggregate of 75 shares of our Super Senior Redeemable preferred stock for an aggregate purchase price of $1.875 million to an entity affiliated with Angeleno Group, of which Mr. Weiss is a co-founder and managing partner. We also sold an aggregate of 75 shares of our Super Senior Redeemable preferred stock for an aggregate purchase price of $1.875 million to entities affiliated with Element Partners, of which Mr. DeRosa is a managing director.
For more information regarding sales of our preferred stock, see “Certain Relationships and Related Party Transactions—Private Placements of Securities.”
Certain of our existing stockholders, consisting of entities associated with Element Partners, Angeleno Group and Landmark Partners, each of which is an affiliate of a member of our board of directors, as well as certain of our executive officers, purchased shares of common stock in our IPO.
Code of Business Conduct and Ethics
We have adopted a code of business conduct and ethics that is applicable to all of our employees, officers and directors including our chief executive officer and senior financial officers, which will be available on our website upon the closing of this offering.
Director Compensation
BasedPrior to our IPO, we adopted a non-employee director compensation policy, based on the recommendations of our compensation committee, we have adopted a non-employee director compensation policy to provide compensation that enables us to attract and retain high caliber directors who are not our employees or officers and who are not affiliated with holders of our preferred stock. Because directors that are affiliated with our investors have historically declined to receive board meeting compensation, our non-employee director compensation policy does not apply to these individuals. Under the non-employee director compensation policy, unaffiliated non-employee directors arewere entitled to cash compensation which consistsconsisted of a quarterly retainer of $13,750. During the year ended December 31, 2015, we also granted restricted stock units and stock options to our non-employee directors.
We also reimburse$13,750 as well as reimbursement for all non-employee directors for their reasonable out-of-pocket expenses incurred in attending meetings of our board of directorsthe Board or any committees thereof.
We do not pay any compensation to any employee directors for servingIn connection with our IPO, based on our board of directors. Accordingly, Messrs. Lockard and Monie did not receive additional compensation for their services as membersthe recommendation of our boardcompensation committee, we adopted a new non-employee director compensation policy. Under the new non-employee director compensation policy, each of directors. See the section titled “Executive Compensation—Summary Compensation Table” below for additional information regarding the compensation paid to Messrs. Lockard and Monie for the year ended December 31, 2015.
The following table sets forth a summary of the compensation we paid to our non-employee directors during the year ended December 31, 2015.
Non-Employee Director Compensation Table
Name(1) | Fees Earned or | Stock Awards ($)(3) | Option Awards ($)(4) | Total ($) | ||||||||||||
Stephen Bransfield | 55,000 | 195,700 | 148,307 | 399,007 | ||||||||||||
Michael DeRosa | — | 31,312 | 82,393 | 113,705 | ||||||||||||
Philip Deutch | — | 31,312 | 82,393 | 113,705 | ||||||||||||
Paul Giovacchini | — | 31,312 | 82,393 | 113,705 | ||||||||||||
Jack Henry | 55,000 | 195,700 | 148,307 | 399,007 | ||||||||||||
James Hughes(5) | 13,750 | 47,616 | 125,294 | 186,660 | ||||||||||||
Scott Humber | — | — | — | — | ||||||||||||
Daniel Weiss | — | 31,312 | 82,393 | 113,705 | ||||||||||||
Upon the effective date of our initial public offering, we intend to implement a new compensation program for our non-employee directors. Under this program, all non-employee directors will receive an annual cash fee of $50,000. The Chairperson of the Board will receive an additional annual fee of $25,000 and athe lead director, (ifif we were to have a lead director and the lead director iswho was not the Chairperson of the Board)Board, will receive an additional annual fee of $15,000. In addition, members of our committees of the Board are entitled to receive additional compensation as follows: (i) each member of the Company’s Audit Committee, Compensation Committeeaudit committee (other than the chairperson thereof) is entitled to receive an annual fee of $10,000 and Nominating and Corporate Governance Committee willthe chairperson of the audit committee is entitled to receive an additional annual cashfee $15,000, (ii) each member of the compensation committee (other than the chairperson thereof) is entitled to receive an annual fee of $10,000, $7,500 and $5,000, respectively. Thethe chairperson of each suchthe compensation committee willis entitled to receive an additional annual cash fee of $15,000, $12,500 and $10,000, respectively.(iii) each member of the nominating and corporate governance committee (other than the chairperson thereof) is entitled to receive an annual fee of $5,000 and the chairperson of the nominating and corporate governance committee is entitled to receive an additional annual fee of $10,000.
Board of Directors Annual Retainer All non-employee members Additional Annual Chairperson of the board of directors Lead director Audit committee chairperson Audit committee member Compensation committee chairperson Compensation committee member Nominating and corporate governance committee chairperson Nominating and corporate governance committee member $ 50,000
Retainers $ 25,000 $ 15,000 $ 15,000 $ 10,000 $ 12,500 $ 7,500 $ 10,000 $ 5,000
In addition, upon initial appointment to the Board, each non-employee director will receive an option award with a grant date fair value of approximately $200,000, which award will vest over four years (25% on the first anniversary of the grant date and 6.25% each quarter thereafter), subject to the director
continuing to be a service provider to us through each applicable vesting date. Each non-employee director will also be entitled to receive an annual restricted stock unit award with a grant date fair value of approximately $60,000, which award will vest in full on the first anniversary of the grant date, subject to the director continuing to be a service provider to us through the vesting date.date; however, we did not grant any restricted stock unit awards to directors during the year ended December 31, 2016.
In the event of a “Sale Event” (as defined in our Amended and Restatedthe 2015 Stock Option and Incentive Plan), the then-outstanding and unvested equity awards held by the non-employee directors that were granted pursuant to this non-employee director compensation programpolicy will become 100% vested. An initial public offering of our common stock would not constitute a Sale Event under this plan.
We will reimburse all reasonable out-of-pocket expenses incurred by non-employee directors for their attendance atin attending meetings of the Board or any committee thereof.
Director Compensation Table
The following table presents the total compensation for each person who served as a member of our Board during the fiscal year ended December 31, 2016. Steven C. Lockard, who is our Chief Executive Officer, and Wayne G. Monie, who is our Chief Manufacturing Technology Officer, were employees during the fiscal year ended December 31, 2016 and received no additional compensation for their service as members of our Board. The compensation received by Messrs. Lockard and Monie, as Named Executive Officers of the Company, are presented below in “Executive Compensation—Summary Compensation Table.”
Name(1) | Fees Earned or | Stock Awards ($)(2) | Option Awards ($)(2) | Total ($) | ||||||||||||
Stephen Bransfield | 60,000 | — | — | 60,000 | ||||||||||||
Michael DeRosa | 28,750 | — | — | 28,750 | ||||||||||||
Philip Deutch | 36,250 | — | — | 36,250 | ||||||||||||
Paul Giovacchini | 47,500 | — | — | 47,500 | ||||||||||||
Jack Henry | 68,750 | — | — | 68,750 | ||||||||||||
James Hughes | 57,500 | — | — | 57,500 | ||||||||||||
Scott Humber(3) | — | — | — | — | ||||||||||||
Daniel Weiss | 27,500 | — | — | 27,500 | ||||||||||||
| (1) | As of December 31, 2016, Messrs. Bransfield and Henry each had options to purchase 38,731 shares of our common stock outstanding and Messrs. DeRosa, Deutch, Giovacchini, Hughes and Weiss each had options to purchase 18,000 shares of our common stock outstanding. In addition, as of December 31, 2016, |
| Messrs. Bransfield and Henry each had 18,000 restricted stock units outstanding and Messrs. DeRosa, Deutch, Giovacchini, Hughes and Weiss each had 2,880 restricted stock units outstanding. |
| (2) | We did not grant any stock option or restricted stock unit awards to our directors during the fiscal year ended December 31, 2016. |
| (3) | Mr. Humber resigned from the Board in July 2016 prior to the consummation of our IPO. |
Executive Compensation Overview
Historically,Our compensation programs are designed to:
Our compensation committee is primarily responsible for developing and implementing our compensation policies and establishing and approving the compensation for all of our executive officers. The compensation program has reflectedcommittee oversees our growthcompensation and development-oriented corporate culture. To date,benefit plans and policies, administers our equity incentive plans and reviews and approves annually all compensation decisions relating to our Chief Executive Officer. The compensation committee considers recommendations from our Chief Executive Officer regarding the compensation of our Chief Financial Officer, Chief Operating Officer and other executive officers (other than himself). Our compensation committee has consistedthe authority under its charter to delegate to a subcommittee the authority to approve grants of equity awards to certain individuals, subject to certain limitations including the amount of awards that can be granted pursuant to such delegated authority. To date, our compensation committee has only delegated such authority to a subcommittee consisting of two non-employee directors who are independent and qualify as “non-employee directors” under Section 16b-3(b)(3) of the Securities Exchange Act of 1934, as amended, as well as “outside directors” for purposes of Section 162(m) of the Code. Our compensation committee also has the authority under its charter to engage the services of a combinationconsulting firm or other outside advisor to assist it in designing our compensation programs and in making compensation decisions. In 2016, the compensation committee retained Pearl Meyer & Partners, LLC as its independent compensation consultant. We do not believe the retention of, and the work performed by, Pearl Meyer & Partners, LLC creates any conflict of interest.
Executive Compensation Components
Our executive compensation consists of base salary, cash incentive bonuses, long-term incentive compensation, and annual performance-basedbroad-based benefits programs. We have not adopted any formal guidelines for allocating total compensation between long-term and short-term compensation, cash compensation and non-cash compensation, or among different forms of non-cash compensation. As we transition fromThe compensation committee considers a private company to a publicly-traded company, we have engagednumber of factors in setting compensation for our executive officers, including Company performance, as well as the services of an independent executive compensation consulting firm to review our current compensation plans and procedures and to provide additional information about comparative compensation offered by peer companies, market survey information and information about trends in executive compensation. At a minimum, we expect to review executive compensation annually with periodic input from a compensation consultant. As part of this review process, we expect the board of directorsexecutive’s performance, experience, responsibilities and the compensation committee to apply our values and philosophy, while considering the compensation levels needed to ensure that ourof executive compensation program remains competitive. We will also review whether we are meeting our employee retention objectives.officers in similar positions at comparable companies.
Summary Compensation Table
The following table presents information regarding the compensation awarded to, earned by, orand paid to each individual who served as our chiefprincipal executive officer and the two most highly compensatedhighly-compensated executive officers other(other than our chiefthe principal executive officer, or our named executive officers, duringofficer) as of the yearslast day of the fiscal year ended December 31, 20152016 (such individuals collectively referred to as our “Named Executive Officers”). The following table also presents information regarding the compensation awarded to, earned by, and 2014.paid to each of our Named Executive Officers during the fiscal year ended December 31, 2015.
SUMMARY COMPENSATION TABLE
Name and Principal Position | Year | Salary | Stock | Option | Non-Equity | All Other | Total ($) | Year | Salary | Bonus | Stock | Option ($)(3) | Non-Equity | All Other | Total ($) | |||||||||||||||||||||||||||||||||||||||||||||
Steven C. Lockard | 2015 | 352,875 | (1) | 3,005,952 | 3,793,351 | 250,000 | 3,101 | 7,405,279 | 2016 | 430,327 | 230,000 | — | — | 500,000 | 3,428 | 1,163,755 | ||||||||||||||||||||||||||||||||||||||||||||
President and Chief Executive Officer | 2014 | 348,774 | — | — | 242,500 | 2,861 | 594,135 | |||||||||||||||||||||||||||||||||||||||||||||||||||||
Chief Executive Officer | 2015 | 352,875 | — | 3,005,952 | 3,793,351 | 250,000 | 3,101 | 7,405,279 | ||||||||||||||||||||||||||||||||||||||||||||||||||||
Wayne G. Monie | 2015 | 296,563 | (1) | 1,115,490 | 1,408,912 | 106,000 | 6,446 | 2,933,411 | 2016 | 306,971 | 170,000 | — | — | 155,000 | 6,453 | 638,424 | ||||||||||||||||||||||||||||||||||||||||||||
Chief Manufacturing Technology Officer | 2014 | 293,272 | — | — | 102,500 | 6,063 | 401,835 | 2015 | 296,563 | — | 1,115,490 | 1,408,912 | 106,000 | 6,446 | 2,933,411 | |||||||||||||||||||||||||||||||||||||||||||||
William E. Siwek | 2015 | 270,625 | (1) | 861,080 | 1,087,581 | 110,000 | 4,670 | 2,333,956 | ||||||||||||||||||||||||||||||||||||||||||||||||||||
Chief Financial Officer | ||||||||||||||||||||||||||||||||||||||||||||||||||||||||||||
Mark R. McFeely (6) | 2016 | 335,577 | — | — | — | 210,000 | 89,529 | 635,106 | ||||||||||||||||||||||||||||||||||||||||||||||||||||
Chief Operating Officer | ||||||||||||||||||||||||||||||||||||||||||||||||||||||||||||
| (1) | The base salary for Mr. |
| (2) |
| (3) | The amounts reported represent the grant date fair value of the stock options and restricted stock units, as applicable, awarded to the |
| and restricted stock units, as applicable, reported in this column are set forth in the Notes to Consolidated Financial Statements |
| (4) | Amounts for the fiscal years ended December 31, |
| (5) | Represents for Mr. Lockard, |
| (6) | Mr. McFeely was not a Named Executive Officer for |
Perquisites, Health, Welfare
Base Salaries
For the year ended December 31, 2016, the annual base salaries for each of Messrs. Lockard, Monie and Retirement PlansMcFeely prior to April 1, 2016 were $355,500, $298,750 and Benefits$325,000, respectively. Effective April 1, 2016, the annual base salaries for each of Messrs. Lockard and Monie were increased to $400,000 and $310,000, respectively. In addition, effective August 1, 2016, the annual base salaries for each of Messrs. Lockard and McFeely were increased to $500,000 and $350,000, respectively.
Bonuses
During the fiscal year ended December 31, 2016, we maintained a bonus plan, pursuant to which each of our Named Executive Officers was eligible to earn an annual bonus based on the Company’s and the Named Executive Officer’s achievement of certain performance goals. For fiscal 2016, the target annual bonuses for Messrs. Lockard, Monie and McFeely were equal to 100%, 50% and 60%, respectively, of the applicable Named Executive Officer’s base salary. Based on the Company’s achievement of the relevant performance goals under the bonus plan, as well as each Named Executive Officer’s achievement of the relevant personal performance goals under the bonus plan, our compensation committee determined that the bonuses would be paid at 100% of target for each Named Executive Officer.
In connection with the Company’s successful IPO in July 2016, Messrs. Lockard and Monie were also awarded special bonus payments of $230,000 and $170,000, respectively.
Equity Compensation
We did not grant any of our Named Executive Officers any equity awards during the fiscal year ended December 31, 2016.
Health and Welfare Benefits
Our named executive officers are eligible to participate in all of our employee benefit plans, including our medical, dental, life and disability insurance plans, in each case on the same basis as other employees of the same status.
401(k) Plan
We maintain a tax-qualified retirement plan that provides all regular employees with an opportunity to save for retirement on a tax-advantaged basis. Under our 401(k) plan, participants may elect to defer a portion of their compensation on a pre-tax basis and have it contributed to the plan subject to the applicable annual Internal Revenue Code limits.limits of the Code. Pre-tax contributions are allocated to each participant’s individual account and are then invested in selected investment alternatives according to the participants’ directions. Employee elective deferrals are 100% vested at all times. The 401(k) plan allows for matching contributions to be made by us. Currently, we match up to 25% of the first 8% of deferred compensation. As a tax-qualified retirement plan, contributions to the 401(k) plan and earnings on those contributions are not taxable to the employees until distributed from the 401(k) plan and all contributions are deductible by us when made.
Perquisites and Personal Benefits
We generally do not provide perquisites or personal benefits to our named executive officers.
Employment Agreements
We have employment agreements or offer letters with our executive officers. We intend to replace these existing employment agreements and offer letters with new executive officer employment agreementsNamed Executive Officers other than in connection with this offering. These new executive officer employment agreements will set forth the terms and conditions of employment of each such executive officer, including base salary, target annual bonus opportunity and standard benefit plan participation. These agreements will also contain provisions that provide for certain payments and benefits in the eventrelocation of a termination of employment under certain circumstances. Set forth below are descriptions of the current employment agreementsNamed Executive Officer. We did, however, in 2016, reimburse Mr. McFeely $61,204 for costs he incurred, as well as a tax gross up equal to $27,497, in connection with his relocation to our named executive officers. We intend that these agreements (and the description of the terms thereof in this prospectus) will be replaced with our new executive officer employment agreements (and descriptions thereof) prior to the consummation of this offering.Scottsdale, Arizona corporate office.
New Employment Agreements for Messrs. Lockard, Monie and SiwekMcFeely
We will enterIn 2016, we entered into new employment agreements with each of Messrs. Lockard, Monie and Siwek,McFeely, effective as of the completion of this offering,our IPO, pursuant to which theythe executives will continue to serve as our President and Chief Executive Officer, Chief Manufacturing Technology Officer and Chief FinancialOperating Officer, respectively. The terms of the new employment agreements are substantially similar to each other and provide for at-will employment. The agreements also set forth initial base salaries, of $500,000, $310,000 and $325,000 for Messrs. Lockard, Monie and Siwek, respectively,initial annual target bonuses of 100%, 50% and 50% of baseeligibility to participate in our benefit plans, generally. The current salaries for Messrs. Lockard, Monie and Siwek,McFeely are $500,000, $310,000 and $350,000, respectively, and eligibilitythe current annual target bonuses for Messrs. Lockard, Monie and McFeely are equal to participate in benefit plans generally.100%, 50% and 60% of their base salaries, respectively.
Pursuant to the employment agreements, each of Messrs. Lockard, Monie and McFeely will be subject to standard confidentiality and nondisclosure, assignment of intellectual property work product and post-termination noncompetition and non-solicitation of employees, consultants and customers covenants.
Involuntary Termination of Employment Not in Connection with a Change in Control
Pursuant to the new employment agreements, in the event the applicable executiveNamed Executive Officer is terminated by us without “cause” (as defined in the executive’s agreement) or he resigns for “good reason” (as defined in the executive’s agreement), in each case subject to the delivery of a fully effective release of claims and continued compliance with applicable restrictive covenants, the executiveNamed Executive Officer will be entitled to (i) a cash severance equal to 150%, 50% and 100% of the base salaries of Messrs. Lockard, Monie and Siwek,McFeely, respectively (payable in 18, 6 and 12 monthly installments for Messrs. Lockard, Monie and Siwek,McFeely, respectively) and (ii) up to 18, 6 and 12 monthly cash payments equal to our monthly contribution for health insurance for Messrs. Lockard, Monie and Siwek,McFeely, respectively.
Involuntary Termination of Employment in Connection with a Change in Control
In the event an executivea Named Executive Officer is terminated by us without cause or he resigns for good reason, in each case within 12 months following a change in control (as defined in the executive’s agreement), subject to the delivery of a fully effective release of claims and continued compliance with applicable restrictive covenants, the executiveNamed Executive Officer will not be entitled to the severance benefits described above, but will instead be entitled to the following: (i) a lump sum cash severance payment equal to 150%, 100% and 100% of the base salaries of Messrs. Lockard, Monie and Siwek,McFeely, respectively, and 150%, 100% and 100% of the annual target bonuses of Messrs. Lockard, Monie and Siwek,McFeely, respectively, (ii) up to 18, 12 and 12 monthly cash payments for Messrs. Lockard, Monie and Siwek,McFeely, respectively, equal to our monthly contribution for health insurance for the executive,Named Executive Officer, (iii) for all outstanding and unvested equity awards of the Company subject to time-based vesting held by the executives,Named Executive Officer, full accelerated vesting of such awards, with a post-termination exercise period, if applicable, of one year and (iv) for all outstanding and unvested equity awards of the Company subject to performance-based vesting held by the executives,Named Executive Officer, fully accelerated vesting of such awards to the extent the applicable performance goals have been met at such time.
The Company may terminate each executive’sNamed Executive Officer’s employment for cause by a vote of the board of directorsBoard at a meeting of the board of directorsBoard called and held for such purpose.
The payments and benefits provided under the new employment agreements in connection with a change in control may not be eligible for federal income tax deduction for the Company pursuant to Section 280G of the Internal Revenue Code. These payments and benefits may also be subject to an excise tax under Section 4999 of the Internal Revenue Code. If the payments or benefits payable to each executiveNamed Executive Officer in connection with a change in control would be subject to the excise tax imposed under Section 4999 of the Internal Revenue Code, then those payments or benefits will be reduced if such reduction would result in a higher net after-tax benefit to him.
Pursuant to the new employment agreements, each of Messrs. Lockard, Monie and Siwek will be subject to standard confidentiality and nondisclosure, assignment of intellectual property work product and post-termination noncompetition and non-solicitation of employees, consultants and customers covenants.
Prior Agreements
Messrs. Lockard and Monie
On September 30, 2004, we entered into employment agreements with each of Mr. Lockard, our President and Chief Executive Officer, and Mr. Monie, currently our Chief Manufacturing Technology Officer and Asia CEO. The employment agreements, as amended on December 24, 2010 for Mr. Lockard and on December 28, 2010 for Mr. Monie, set forth the terms and conditions of each executive’s employment, and provided for an initial term of three years with automatic one-year renewals unless terminated earlier by us or the applicable executive. Each of these agreements automatically terminates upon a change of control. In addition, the agreements set forth each executive’s initial annual base salary and pursuant to the agreements, each executive is eligible to earn an annual target bonus equal to 100% of his base salary for Mr. Lockard and 50% of his base salary for Mr. Monie, based on his achievement of performance metrics established by our board of directors upon consultation with the executives. Upon consummation of this offering, these agreements will be superceded by the new employment agreements described above.
In the event that Mr. Lockard or Mr. Monie is terminated by us without cause (as defined in his applicable agreement), subject to the executive’s execution of an irrevocable release and compliance with restrictive covenants, each executive will be entitled to receive the following: (i) continuation of his then-current annual base salary for 12 months (the “Benefits Continuation Period”) and (ii) Company-subsidized health benefits continuation for the Benefits Continuation Period; provided, that if such executive continues to receive cash compensation from us following such termination in any other capacity, or commences employment or self-employment during the Benefits Continuation Period, such continuation of health benefits will immediately terminate as of the date of such employment or self-employment and such salary continuation will be reduced by the amount of any payments made to the executive in connection with such employment or self-employment. In the event that Mr. Lockard’s or Mr. Monie’s employment with us is terminated due to disability, subject to the executive’s compliance with applicable restrictive covenants, each executive will be entitled to receive continuation of his then-current annual base salary, less any disability pay or sick pay benefits, for a period of time equal to the lesser of (A) six months or (B) the remainder of the executive’s applicable term.
Pursuant to the agreements, each executive is subject to a perpetual confidentiality covenant as well as post-termination noncompetition and non-solicitation of employees, customers or suppliers covenants for five years. The post-termination noncompetition covenant is for three years in the case of a termination of employment by us without cause.
For purposes of the agreements, “cause” is generally defined as (1) the executive indictment for a crime which constitutes a felony or a plea of guilty or nolo contendere; (2) the commission by the executive of any dishonest or wrongful act or the gross negligence of the executive involving fraud, misrepresentation or act of moral turpitude causing damage or potential damage to us or any of our clients, or any act or omission by the executive that is materially injurious to our business or reputation; (3) any act or omission which constitutes a material breach of the agreement or the failure or the willful refusal of the executive to perform any of his duties after a 10-day opportunity to cure; (4) any violation of the executive’s restrictive covenants; or (5) a reasonable determination by a licensed medical professional selected by us that the executive is dependent upon a controlled substance.
Mr. Siwek
On July 30, 2013, we entered into an offer letter with Mr. Siwek, our Chief Financial Officer. The offer letter provides Mr. Siwek with general employment terms, including an initial annual base salary, an opportunity to earn a target bonus equal to 40% of his base salary, based on the Company’s achievement of performance metrics established by our board of directors, as well as Mr. Siwek’s individual performance, and his eligibility to participate in the Company’s equity plan and other benefit programs. Mr. Siwek’s target bonus percentage was
subsequently increased to 50% of his base salary. Mr. Siwek is subject to the Company’s standard non-competition and confidentiality agreement. Upon consummation of this offering, this letter will be superceded by the new employment agreement described above.
Outstanding Equity Awards at Fiscal Year EndYear-End Table
The following table provides information regardingsummarizes, for each of the Named Executive Officers, the outstanding equity awards held by our named executive officers atthe Named Executive Officer as of December 31, 2015:2016:
Name | Option Awards(1) | Stock Awards(1) | ||||||||||||||||||||||||||||||||||||||||||||||||||||||||||
Option Awards(1) | Stock Awards(1) | |||||||||||||||||||||||||||||||||||||||||||||||||||||||||||
Name | Number of Securities (#) | Number of Options Unexercisable (#) | Equity (#) | Option Price ($) | Option Expiration Date | Number of (#) | Market Value ($) | Equity Incentive (#) | Equity Incentive ($)(4) | Number of Exercisable | Number of Unexercisable (2) | Option ($) | Option | Number of | Market Value | |||||||||||||||||||||||||||||||||||||||||||||
| — | — | 828,720 | (2) | 10.87 | 5/29/2025 | — | — | 276,480 | (3) | 4,423,680 | — | 828,720 | 10.87 | 5/29/2025 | 276,480 | 4,434,739 | ||||||||||||||||||||||||||||||||||||||||||||
Wayne G. Monie | — | — | 307,800 | (2) | 10.87 | 5/29/2025 | — | — | 102,600 | (3) | 1,641,600 | — | 307,800 | 10.87 | 5/29/2025 | 102,600 | 1,645,704 | |||||||||||||||||||||||||||||||||||||||||||
William E. Siwek | — | — | 237,600 | (2) | 10.87 | 5/29/2025 | — | — | 79,200 | (3) | 1,267,200 | |||||||||||||||||||||||||||||||||||||||||||||||||
Mark R. McFeely | — | 288,000 | 16.53 | 12/23/2025 | — | — | ||||||||||||||||||||||||||||||||||||||||||||||||||||||
| (1) | Each option and restricted stock unit was granted pursuant to the 2015 |
| (2) | Approximately 25% of the shares subject to the option vest on the first anniversary of the effective date of |
| (3) | Approximately one-third of the restricted stock units vest on each of the first, second and third anniversaries of the effective date of |
| (4) |
Equity Incentive Plans and Bonus Plan
Amended and Restated 2015 Stock Option and Incentive Plan
Our 2015 Stock Option and Incentive Plan was initially adopted by our board of directorsBoard and approved by our stockholders in May 2015 and was subsequently amended and restated in June 2016. The Amended and Restated 2015 Stock Option and Incentive Plan, or the 2015 Plan replaced the 2008 Plan (as defined below), as our board of directorsBoard has determined not to make additional awards under the 2008 Plan upon adoption of the 2015 Stock Option and Incentive Plan. The 2015 Plan allows the compensation committee to make equity-based incentive awards to our officers, employees, directors and consultants.
We have initially reserved 6,317,031 shares of our common stock for the issuance of awards under the 2015 Plan, plus the 1,032,950 shares of common stock remaining available for issuance under our 2008 Plan. The 2015 Plan provides that the number of shares reserved and available for issuance under the plan will automatically increase each January 1 by 4% of the outstanding number of shares of our common stock on the immediately preceding December 31 (the “annual increase”) or such lesser number of shares as determined by our compensation committee. This number is subject to adjustment in the event of a stock split, stock dividend or other change in our capitalization.
The shares we issue under the 2015 Plan will be authorized but unissued shares or shares that we reacquire. The shares of common stock underlying any awards that are forfeited, cancelled, held back upon
exercise or settlement of an award to satisfy the exercise price or tax withholding, reacquired by us prior to vesting, satisfied without the issuance of stock, expire or are otherwise terminated (other than by exercise) under the 2015 Plan and the 2008 Plan will be added back to the shares of common stock available for issuance under the 2015 Plan.
Stock options and stock appreciation rights with respect to no more than 1,800,000 shares of common stock may be granted to any one individual in any one calendar year and the maximum “performance-based award” payable to any one “covered employee” during a performance cycle under the 2015 Plan is 1,800,000 shares of stock or $10,000,000 in the case of cash-based performance awards. The maximum number of shares that may be issued as incentive stock options may not exceed 6,317,031, provided that such maximum amount may be cumulatively increased each January 1 by the lesser of the annual increase for such year or 3,600,000 shares. The value of all awards under the 2015 Plan and all other cash compensation paid by the Company to any non-employee director in any calendar year cannot exceed $750,000.
The 2015 Plan will be administered by our compensation committee. Our compensation committee has full power to select, from among the individuals eligible for awards, the individuals to whom awards will be granted, to make any combination of awards to participants, and to determine the specific terms and conditions of each award, subject to the provisions of the 2015 Plan. Persons eligible to participate in the 2015 Plan will be those full or part-time officers, employees, non-employee directors and consultants as selected from time to time by our compensation committee in its discretion.
The 2015 Plan permits the granting of both (1) options to purchase common stock intended to qualify as incentive stock options under Section 422 of the Code and (2) options that do not so qualify. The option exercise price of each option will be determined by our compensation committee but may not be less than 100% of the fair market value of our common stock on the date of grant. In the event of an incentive stock option that is granted to an employee who owns or is deemed to own more than 10% of the combined voting power of all classes of stock of the Company or any parent or subsidiary corporation, or a 10% owner, the option exercise price of such option may not be less than 110% of the fair market value of our common stock on the date of grant. The term of each option will be fixed by our compensation committee and may not exceed ten years from the date of grant (five years in the case of an incentive stock option held by a 10% owner). Our compensation committee will determine at what time or times each option may be exercised. To the extent required for incentive stock option treatment under Section 422 of the Code, the aggregate fair market value (determined as of the time of grant) of the shares of stock with respect to which incentive stock options become exercisable for the first time by an optionee during any calendar year must not exceed $100,000. To the extent that any stock option exceeds this limit, it will constitute a nonqualified stock option.
Our compensation committee may award stock appreciation rights subject to such conditions and restrictions as it may determine. Stock appreciation rights entitle the recipient to shares of common stock, or cash, equal to the value of the appreciation in our stock price over the exercise price. The exercise price may not be less than 100% of fair market value of the common stock on the date of grant. The term of a stock appreciation right may not exceed ten years.
Our compensation committee may award restricted shares of common stock and restricted stock units to participants subject to such conditions and restrictions as it may determine. These conditions and restrictions may include the achievement of certain performance goals and/or continued employment with us through a specified vesting period. Our compensation committee may also grant shares of common stock that are free from any restrictions under the 2015 Plan. Unrestricted common stock may be granted to participants in recognition of past services or for other valid consideration and may be issued in lieu of cash compensation due to such participant.
Our compensation committee may grant performance share awards to participants that entitle the recipient to receive awards of common stock upon the achievement of certain performance goals and such other conditions as our compensation committee shall determine. Our compensation committee may grant dividend
equivalent rights to participants that entitle the recipient to receive credits for dividends that would be paid if the recipient had held a specified number of shares of common stock.
Our compensation committee may grant cash bonuses under the 2015 Plan to participants, subject to the achievement of certain performance goals.
Our compensation committee may grant awards of restricted stock, restricted stock units, performance shares or cash-based awards under the 2015 Plan that are intended to qualify as “performance-based compensation” under Section 162(m) of the Code. Such awards will only vest or become payable upon the attainment of performance goals that are established by our compensation committee and related to one or more performance criteria. The performance criteria that could be used with respect to any such awards include: total shareholder return, earnings before interest, taxes, depreciation and amortization, net income (loss) (either before or after interest, taxes, depreciation and/or amortization), changes in the market price of the Company’s common stock, economic value-added, funds from operations or similar measure, sales or revenue, corporate revenue, net annual recurring revenue, acquisitions or strategic transactions, operating income (loss), cash flow (including, but not limited to, operating cash flow and free cash flow), return on capital, assets, equity, or investment, shareholder returns, return on sales, gross or net profit levels, productivity, expense, margins, operating efficiency, customer satisfaction, working capital, earnings (loss) per share of the Company’s common stock, sales or market shares, bookings, new bookings or renewals, number of customers, number of new customers or customer references, manufacturing plant metrics commonly used by senior management of the Company to monitor the performance of its manufacturing plants such as number of sets produced, cycle times, quality criteria and indicators, reportable safety incidents, and material cost out activities, any of which may be measured either in absolute terms or as compared to any incremental increase or as compared to the results of a peer group.
The 2015 Plan provides that upon the effectiveness of a Sale Event, as defined in the 2015 Plan, an acquirer or successor entity may assume, continue or substitute for the outstanding awards under the 2015 Plan. To the extent that awards granted under the 2015 Plan are not assumed or continued or substituted by the successor entity, all outstanding awards granted under the 2015 Plan shall terminate. In the event of such termination, individuals holding options and stock appreciation rights will be permitted to exercise such options and stock appreciation rights (to the extent exercisable) prior to the Sale Event. In addition, in connection with the termination of the 2015 Plan upon a Sale Event, we may make or provide for a cash payment to participants holding vested and exercisable options and stock appreciation rights equal to the difference between the per share cash consideration payable to stockholders in the Sale Event and the exercise price of the options or stock appreciation rights. We also have the option (in our sole discretion) to make or provide for a payment, in cash or in kind, to the individuals holding other awards in an amount equal to the Sale Price (as defined in the 2015 Plan) multiplied by the number of vested shares of stock under such awards. An initial public offering of our common stock would not constitute a Sale Event under the 2015 Plan.
Our board of directors may amend or discontinue the 2015 Plan and our compensation committee may amend or cancel outstanding awards for purposes of satisfying changes in law or any other lawful purpose, but no such action may adversely affect rights under an award without the holder’s consent. Certain amendments to the 2015 Plan require the approval of our stockholders. The administrator of the 2015 Plan is specifically authorized to exercise its discretion to reduce the exercise price of outstanding stock options or stock appreciation rights or effect the repricing of such awards through cancellation and re-grants.
No awards may be granted under the 2015 Plan after the date that is ten years from the date of stockholder approval of the 2015 Plan.
We granted aggregate awards of 3,542,7603,763,150 stock options and 731,880 restricted stock units during 2015 and the three months ended March 31, 2016 to certain employees and non-employee directors. These awards include a performance condition that relates to the completion of an initial public offering (IPO) by the Companyour IPO and have a required time-based vesting period of one to four years commencing upon achievement of the performance condition.
2008 Stock Option and Grant Plan
Our 2008 Stock Option and Grant Plan or the(the 2008 Plan,Plan) was approved in April 2008 and an aggregate of 1,068,656 shares of common stock were authorized for issuance. Upon adoption of the 2015 Plan, the 1,032,950 shares still available for future grant under the 2008 Plan became available for future grant under the
2015 Plan. As of MarchDecember 31, 2016, options to purchase 25,828 shares of our common stock were outstanding under the 2008 Plan. In the event that any outstanding awards under the 2008 Plan are cancelled, forfeited, withheld upon exercise or settlement to satisfy tax withholding, reacquired by the Company prior to vesting, satisfied without the issuance of stock or otherwise terminated without being exercised, the number of shares underlying such award becomes available for grant under the 2015 Plan. Options granted under the 2008 Plan generally expire 10 years after the date of grant. Our board of directors has determined not to grant any further awards under the 2008 Plan upon adoption of the 2015 Plan, and thus, we will make future awards under the 2015 Plan.
Our employees, officers, directors and consultants or those of our subsidiaries were eligible to participate in the 2008 Plan. However, only employees and officers were granted “incentive stock options.”
Our compensation committee administered the 2008 Plan. The compensation committee had the ability to select award recipients, determine the size, types and terms of awards, interpret the plan and prescribe, amend and rescind rules and make all other determinations necessary or desirable for the administration of the 2008 Plan.
Options granted under the 2008 Plan were either “incentive stock options,” which are intended to qualify for certain U.S. federal income tax benefits under Section 422 of the Code, or “non-qualified stock options.” The per share exercise price of the incentive stock options awarded under the 2008 Plan must be at least equal to the fair market value of a share of our common stock on the date of grant. The holder of an option granted under the 2008 Plan will be entitled to purchase a number of shares of our common stock at a specified exercise price during a specified time period, as determined by our compensation committee. Options granted under the 2008 Plan may become exercisable based on the recipient’s continued employment or service or the achievement of performance or other goals and objectives. Options may be exercised only to the extent that they have vested. The exercise price for an option may be paid in cash, in shares of our common stock valued at fair market value on the exercise date, by delivery of a full-recourse, interest-bearing promissory note, or by such other method as the compensation committee may establish.
No shares of restricted common stock or other awards have been granted or are outstanding under the 2008 Plan.
In the event of certain corporate transactions, such as a merger or consolidation in which we are not the surviving entity or a sale of all or substantially all of our assets, the 2008 Plan provides that it and each outstanding option shall terminate on the effective date of such transaction unless the parties to the transaction agree that each outstanding option will be assumed or substituted with a comparable option by our successor company or its parent. In the event that the 2008 Plan and outstanding awards terminate in connection with a transaction, the compensation committee, in its discretion, may provide each recipient with a cash payment with a fair market value equal to the amount that would have been received upon the exercise of the option had the option been exercised immediately prior to such transaction. Awards may provide for the acceleration of the exercise schedule or vesting schedule in the event of the involuntary dismissal of a recipient within a specified period of time following a change in control. Our award agreements for our executives under the 2008 Plan generally provide for 50% accelerated vesting of any unvested shares if (i) such equity awards are not assumed, or otherwise substituted, in connection with a change of control, or (ii) if assumed or substituted in connection with a change of control, such executive’s employment is terminated without cause or for good reason within 12 months of such change in control.
Options granted under the 2008 Plan generally may be transferred only by will or by the laws of descent and distribution.
Our compensation committee may exercise its discretion to reduce the exercise price of outstanding stock options or stock appreciation rights or effect repricing through cancellation of outstanding awards and by granting such holders new awards in replacement of the cancelled awards.
The 2008 Plan was replaced in May 2015 following the Company’s adoption of the 2015 Stock Option and Incentive Plan. The 2008 Plan will continue to govern outstanding awards granted thereunder.
Senior Executive Cash Incentive Bonus Plan
Our board of directors, upon the recommendation of our compensation committee, is expected to adoptadopted the Senior Executive Cash Incentive Bonus Plan or the(the Bonus Plan,Plan), which will governgoverns the cash incentive bonuses for certain of our eligible executives, including our named executive officers. The Bonus Plan will provideprovides for bonus payments based upon the attainment of performance targets or the(the Performance Goals,Goals) established by the compensation committee and related to financial and operational measures or objectives with respect to the company, as well as individual performance objectives.
The Performance Goals from which the compensation committee may select include the following: total shareholder return, earnings before interest, taxes, depreciation and amortization, net income (loss) (either before or after interest, taxes, depreciation and/or amortization), changes in the market price of the Company’s common stock, economic value-added, funds from operations or similar measure, sales or revenue, corporate revenue, net annual recurring revenue, acquisitions or strategic transactions, operating income (loss), cash flow (including, but not limited to, operating cash flow and free cash flow), return on capital, assets, equity, or investment, shareholder returns, return on sales, gross or net profit levels, productivity, expense, margins, operating efficiency, customer satisfaction, working capital, earnings (loss) per share of the Company’s common stock, sales or market shares, bookings, new bookings or renewals, number of customers, number of new customers or customer references, manufacturing plant metrics commonly used by senior management of the Company to monitor the performance of its manufacturing plants such as number of sets produced, cycle times, quality criteria and indicators, reportable safety incidents, and material cost out activities, any of which may be measured in absolute terms or compared to any incremental increase, measured in terms of growth, compared to another company or companies or to results of a peer group, measured against the market as a whole or as compared to applicable market indices, measured on a pre-tax or post-tax basis or applied to the performance of a business unit, segment, product line, or specific market, or the entire company).
Each executive officer who is selected to participate in the Bonus Plan will have a target bonus opportunity set for each performance period. The bonus formulas will be adopted in each performance period by the compensation committee and communicated to each executive. The Performance Goals will be measured at the end of each performance period after our financial reports have been published or such other appropriate time as the compensation committee determines. If the Performance Goals and individual performance objectives are met, payments will be made as soon as practicable following the end of each performance period. Subject to the rights contained in any agreement between the executive officer and us, an executive officer must be employed by us on the bonus payment date to be eligible to receive a bonus payment. The Bonus Plan also permits the compensation committee to approve additional bonuses to executive officers in its sole discretion and to adjust bonuses (by increasing or decreasing the amount payable) based on an executive officer’s attainment of individual performance objectives.
Indemnification of Officers and Directors
We have agreed to indemnify our directors and officers in certain circumstances. See “Certain Relationships and Related Party Transactions—Limitation of Liability and Indemnification of Officers and Directors.”
Compensation Risk Assessment
We believe that although a portion of the compensation provided to our executive officers and other employees is performance-based, our executive compensation program does not encourage excessive or unnecessary risk taking. This is primarily due to the fact that our compensation programs are designed to encourage our executive officers and other employees to remain focused on both short-term and long-term strategic goals, in particular in connection with our pay-for-performance compensation philosophy. As a result, we do not believe that our compensation programs are reasonably likely to have a material adverse effect on us.
CERTAIN RELATIONSHIPS AND RELATED PARTY TRANSACTIONS
Other than compensation agreements, the supply agreements described in the “Business—GE Wind” section of this prospectus, other arrangements which are described in the “Risk Factors” and “Executive Compensation” sections of this prospectus and the transactions described below, since January 2013,2014, there has not been and there is not currently proposed, any transaction or series of similar transactions to which we were or will be a party in which the amount involved exceeded or will exceed $120,000 and in which any director, executive officer, holder of 5% or more of any class of our capital stock or any member of their immediate family had or will have a direct or indirect material interest.
We believe that we have executed all of the transactions set forth below and as described in the “Business—GE Wind” section on terms no less favorable to us than we could have obtained from unaffiliated third parties. All of the transactions set forth below and as described in the “Business—GE Wind” section were approved or ratified by a majority of our board of directors. We plan to adoptadopted an updated written policy, effective upon the completion of this offering,our IPO, that requires all future transactions between us and any related persons (as defined in Item 404 of Regulation S-K) or their affiliates, in which the amount involved is equal to or greater than $120,000, be approved in advance by our audit committee. Any request for such a transaction must first be presented to our audit committee for review, consideration and approval. In approving or rejecting any such proposal, our audit committee may consider, among other factors it deems appropriate, the facts and circumstances available and deemed relevant to the audit committee, including, but not limited to, the extent of the related party’s interest in the transaction, and whether the transaction is on terms no less favorable to us than terms we could have generally obtained from an unaffiliated third party under the same or similar circumstances.
GE Wind Customer Advance
In January 2016, we entered into an agreement with GE Wind pursuant to which GE Wind agreed to pay us an advance of $2.0 million. As of MarchDecember 31, 2016, the entire $2.0 million advance is outstanding.has been repaid. We intend to use these funds to expand our existing Mexico manufacturing facility to accommodate larger wind blade models. We are obligated to repay the advance without interest by providing a credit of a mutually agreed amount towards GE Wind’s purchase of a mutually agreed number of wind blade sets supplied to GE Wind after we achieve certain qualification testing procedures and meet certain other criteria. If we failhad failed to supply those wind blade sets by December 31, 2016, then the outstanding balance of the advance willwould have become immediately be due and payable. The advance willwas also be immediately due in full upon a change of control of our company or within 30 days after the effective date of this offering of our common stock.IPO.
Non-Exclusive License to GE Wind
In January 2016, we granted GE Wind a non-exclusive license to use certain of our work instructions relating to our manufacturing processes for one of their wind blade models. The scope of this license is limited to manufacturing the wind blade model exclusively in a country in which we do not currently have manufacturing operations, and also includes a limited right to sublicense to a designated, independent third party wind manufacturer. This license remains in effect so long as the designated, independent manufacturer continues to manufacture, sell and service the wind blade model covered by the license for GE Wind and otherwise complies with the terms of the license. In exchange for granting this license, we received a license fee from GE Wind.
Private Placements of Securities
Bridge Financings
In February 2014, we issued an aggregate of $5.0 million of bridge notes and related warrants to purchase shares of the Company’s capital stock. All of the bridge notes were repaid in August 2014. The warrants arewere exercisable for 40.01 shares of the Company’s Series B preferred stock at an exercise price of
$8,748.81 per share, which we refer to as our Related Party Series B Warrants herein. Upon the consummation of this offering,the IPO, the Related Party Series B Warrants will bewere exercised for a net issuance of 29,44619,503 shares of Common Stock.common stock. The table below sets forth the number of bridge warrant shares sold in connection with this financing to our directors, executive officers or owners of more than 5% of a class of our capital stock, or an affiliate or immediate family member thereof:
Purchaser(1) | Number of Common Stock | |||
Angeleno Investors II, LP(2) | ||||
Element Partners(3) | ||||
| (1) | See “Principal Stockholders” for more detail on shares held by these purchasers. |
| (2) | Daniel G. Weiss, who is one of our directors, is a co-founder and managing partner of Angeleno Group. |
| (3) | Element Partners II GP, LP is the general partner of Element Partners II, L.P. and Element Partners II Intrafund, L.P. Michael L. DeRosa, who is one of our directors, is a managing director of Element Partners. |
In December 2014, we issued an aggregate of $10.0 million of Subordinated Convertible Promissory Notes and related warrants to purchase shares of the Company’s capital stock. All of the Subordinated Convertible Promissory Notes will be repaid uponwere converted into shares of common stock immediately prior to the consummationclosing of this offering.the IPO at a conversion price equal to the public offering price per share. The holders of all of our outstanding Subordinated Convertible Promissory Notes amended the notes so that all of the approximately $10.0 million of outstanding principal and approximately $1.9 million of accrued interest on the notes shall convert into shares of our common stock immediately prior to the completion of the IPO at a conversion price equal to the public offering price per share in the IPO. The aggregate warrant coverage amount is $1.5 million and the warrants are exercisable for the Company’s common stock at an exercise price that will be the lesser of $24.30 per share or 85% of initial public offering price$9.35 per share, which we refer to as our Common Warrants herein. The table below sets forth the number of Common Warrant shares sold in connection with this financing to our directors, executive officers or owners of more than 5% of a class of our capital stock, or an affiliate or immediate family member thereof:
Purchaser(1) | Number of Common Stock | |||
Angeleno Investors II, LP(2) | ||||
Element Partners II Intrafund, L.P.(3) | ||||
Element Partners II, L.P.(3) | ||||
Landmark IAM Growth Capital, L.P.(4) | ||||
Landmark Growth Capital Partners L.P.(4) | ||||
| (1) | See “Principal Stockholders” for more detail on shares held by these purchasers. |
| (2) | Daniel G. Weiss, who is one of our directors, is a co-founder and managing partner of Angeleno Group. |
| (3) | Element Partners II GP, LP is the general partner of Element Partners II, L.P. and Element Partners II Intrafund, L.P. Michael L. DeRosa, who is one of our directors, is a managing director of Element Partners. |
| (4) | Landmark Partners includes Landmark Growth Capital Partners, L.P. and Landmark IAM Growth Capital, L.P. Paul Giovacchini |
Issuances of Preferred Stock and Warrants
Since January 2013, we have engaged in transactions regarding sales of our preferred stock to certain of our stockholders that beneficially own at least 5% of our voting securities and are affiliated with certain of our directors. In May 2014, we sold an aggregate of 120 shares of our Super Senior Redeemablesuper senior redeemable preferred stock at a purchase price of $25,000 per share. In June 2014, we sold an aggregate of 160 shares of our Super Senior Redeemablesuper senior redeemable preferred stock at a purchase price of $25,000 per share. In connection with such sales of Super Senior Redeemablesuper senior redeemable preferred stock, we issued warrants to purchase an aggregate of 48.007 shares of our Series B
preferred stock at a price per share of $8,748.81, which we refer to as our Super Warrants herein. Upon the consummation of this offering,the IPO, the Super Warrants will bewere exercisable for a net issuance of 35,33623,402 shares of Common Stock.common stock.
The following table summarizes the shares of our preferred stock purchased in these transactions by our 5% stockholders and entities affiliated with our directors.
Purchaser(1) | Super Senior | Total Common | Aggregate | Number of Common | Super Senior | Total Common | Aggregate | Number of Common | ||||||||||||||||||||||||
Angeleno Investors II, LP(2) | 85 | 404,565 | $ | 2,125,000 | 10,727 | 85 | 404,565 | $ | 2,125,000 | 7,104 | ||||||||||||||||||||||
GE Ventures Limited | 10 | 47,595 | $ | 250,000 | 1,262 | 10 | 47,595 | $ | 250,000 | 835 | ||||||||||||||||||||||
Element Partners II Intrafund, L.P.(3) | 2.77 | 13,207 | $ | 69,375 | 350 | 2.77 | 13,207 | $ | 69,375 | 231 | ||||||||||||||||||||||
Element Partners II, L.P.(3) | 182.23 | 867,317 | $ | 4,555,625 | 22,997 | 182.23 | 867,317 | $ | 4,555,625 | 15,232 | ||||||||||||||||||||||
| (1) | See “Principal Stockholders” for more detail on shares held by these purchasers. |
| (2) | Daniel G. Weiss, who is one of our directors, is a co-founder and managing partner of Angeleno Group. |
| (3) | Element Partners II GP, LP is the general partner of Element Partners II, L.P. and Element Partners II Intrafund, L.P. Michael L. DeRosa, who is one of our directors, is a managing director of Element Partners. |
Employment Agreements
We currently have employment agreements or offer letters with our Named Executive Officers. For more information regarding these agreements, see the section titled “Executive Compensation”Compensation – Employment Agreements for Messrs. Lockard, Monie and see the respective employment agreements which are attached as exhibits to the registration statementMcFeely.”
Participation in our Initial Public Offering
Certain of our existing stockholders, consisting of entities associated with Element Partners, Angeleno Group and Landmark Partners, each of which is an affiliate of a member of our board of directors, as well as certain of our executive officers, purchased approximately 1,250,000 shares of our common stock in our IPO at the initial public offering price. The underwriters did not receive any underwriting discount or commission from the shares of our common stock purchased by such stockholders and executive officers in the IPO.
Participation in this prospectusOffering
Certain of our existing shareholders, including Steven Lockard, our Chief Executive Officer, and Wayne Monie, our Chief Manufacturing Technology Officer, are selling shares of common stock in this offering. The total number of shares being sold by Mr. Lockard and Mr. Monie in this offering, represent approximately 9% and 3%, respectively, of each of their total shares held directly plus shares subject to each of their stock option and restricted stock unit awards. Mr. Lockard and Mr. Monie are participating in this offering because the board of directors has concluded that it is in the best interest of the Company to permit their participation even though those holders do not have a part.contractual right to do so.
Limitation of Liability and Indemnification of Officers and Directors
Prior to the completion of this offering, we expect to adoptWe have adopted an amended and restated certificate of incorporation, which will become effective immediately prior to the completion of this offering, and which will containcontains provisions that limit the liability of our directors for monetary damages to the fullest extent permitted by Delaware law. Consequently, our directors will not be personally liable to us or our stockholders for monetary damages for any breach of fiduciary duties as directors, except liability for the following:
Any amendment to, or repeal of, these provisions will not eliminate or reduce the effect of these provisions in respect of any act, omission or claim that occurred or arose prior to that amendment or repeal. If the Delaware General Corporation Law is amended to provide for further limitations on the personal liability of directors of corporations, then the personal liability of our directors will be further limited to the greatest extent permitted by the Delaware General Corporation Law.
In addition, prior to the completion of this offering, we expect to adopthave adopted amended and restated bylaws which will provide that we will indemnify, to the fullest extent permitted by law, any person who is or was a
party or is threatened to be made a party to any action, suit or proceeding by reason of the fact that he or she is or was one of our directors or officers or is or was serving at our request as a director or officer of another corporation, partnership, joint venture, trust, or other enterprise. Our amended and restated bylaws are expected to provide that we may indemnify to the fullest extent permitted by law any person who is or was a party or is threatened to be made a party to any action, suit, or proceeding by reason of the fact that he or she is or was one of our employees or agents or is or was serving at our request as an employee or agent of another corporation, partnership, joint venture, trust, or other enterprise. Our amended and restated bylaws will also provide that we must advance expenses incurred by or on behalf of a director or officer in advance of the final disposition of any action or proceeding, subject to very limited exceptions.
Further, prior to the completion of this offering, we expect to enterWe have entered into indemnification agreements with each of our directors and executive officers that may be broader than the specific indemnification provisions contained in the Delaware General Corporation Law. These indemnification agreements will require us, among other things, to indemnify our directors and executive officers against liabilities that may arise by reason of their status or service. These indemnification agreements will also require us to advance all expenses incurred by the directors and executive officers in investigating or defending any such action, suit, or proceeding. We believe that these agreements are necessary to attract and retain qualified individuals to serve as directors and executive officers.
The limitation of liability and indemnification provisions that are expected to be included in our amended and restated certificate of incorporation, amended and restated bylaws, and in indemnification agreements that we enter into with our directors and executive officers may discourage stockholders from bringing a lawsuit against our directors and executive officers for breach of their fiduciary duties. They may also reduce the likelihood of derivative litigation against our directors and executive officers, even though an action, if successful, might benefit us and other stockholders. Further, a stockholder’s investment may be harmed to the extent that we pay the costs of settlement and damage awards against directors and executive officers as required by these indemnification provisions. At present, we are not aware of any pending litigation or proceeding involving any person who is or was one of our directors, officers, employees or other agents or is or was serving at our request as a director, officer, employee or agent of another corporation, partnership, joint venture, trust or other enterprise, for which indemnification is sought, and we are not aware of any threatened litigation that may result in claims for indemnification.
We have obtained insurance policies under which, subject to the limitations of the policies, coverage is provided to our directors and executive officers against loss arising from claims made by reason of breach of fiduciary duty or other wrongful acts as a director or executive officer, including claims relating to public securities matters, and to us with respect to payments that may be made by us to these directors and executive officers pursuant to our indemnification obligations or otherwise as a matter of law.
Certain of our non-employee directors may, through their relationships with their employers or affiliated entities, be insured or indemnified against certain liabilities incurred in their capacity as members of our board of directors. In our indemnification agreements with these non-employee directors, we have agreed that our indemnification obligations will be primary to any such other indemnification arrangements.
The underwriting agreement provides for indemnification by the underwriters of us and our officers, directors and employees for certain liabilities arising under the Securities Act, or otherwise.
Insofar as indemnification for liabilities arising under the Securities Act may be permitted to directors, officers or persons controlling our company pursuant to the foregoing provisions, we have been informed that, in the opinion of the SEC, such indemnification is against public policy as expressed in the Securities Act and is therefore unenforceable.
Policies and Procedures for Related Party Transactions
Following the closing of this offering,the IPO, the audit committee of our board of directors will havehas the primary responsibility for reviewing and approving or disapproving “related party transactions,” which are transactions between us and related persons in which the aggregate amount involved exceeds or may be expected to exceed $120,000 and in which a related person has or will have a direct or indirect material interest. For purposes of this policy, a related person will beis defined as a director, executive officer, nominee for director or greater than 5% beneficial owner of our common stock, in each case since the beginning of the most recently completed year, and their immediate family members. Our audit committee charter will provideprovides that the audit committee shall review and approve or disapprove any related party transactions.
All of the transactions described above were entered into prior to the adoption of this policy. Accordingly, each was approved by disinterested members of our board of directors after making a determination that the transaction was executed on terms no less favorable than those that could have been obtained from an unrelated third party.
PRINCIPAL AND SELLING STOCKHOLDERS
The following table provides information concerning beneficial ownership of our capital stock as of March 31, 2016,2017, and as adjusted to reflect the sale of shares of common stock in this offering, by:
The following table lists the number of shares and percentage of shares beneficially owned based on 25,531,26333,923,115 shares of common stock outstanding as of March 31, 2016 and 32,781,263 shares of common stock outstanding upon the completion of this offering, which each include the conversion of all outstanding shares of preferred stock into an aggregate of 21,110,204 shares of common stock.2017.
Beneficial ownership is determined in accordance with the rules of the SEC, and generally includes voting power and/or investment power with respect to the securities held. Shares of common stock subject to options or other awards that are currently exercisable or exercisable within 60 days of March 31, 20162017 are deemed outstanding and beneficially owned by the person holding those options or other awards for purposes of computing the number of shares and percentage of shares beneficially owned by that person, but are not deemed outstanding for purposes of computing the percentage beneficially owned by any other person. Except as indicated in the footnotes to this table, and subject to applicable community property laws, the persons or entities named have sole voting and investment power with respect to all shares of our common stock shown as beneficially owned by them.
Unless otherwise indicated in the footnotes, the principal address of each of the stockholders below is c/o TPI Composites, Inc., 8501 North Scottsdale Road, Gainey Center II, Suite 100, Scottsdale, Arizona 85253.
Name | Shares Beneficially Owned | |||||||||||
Percent | ||||||||||||
Number | Before | After | ||||||||||
5% Stockholders | ||||||||||||
Landmark Partners(1) | 5,383,908 | 20.9 | % | 16.4 | % | |||||||
NGP Energy Technology Partners, L.P.(2) | 3,800,316 | 14.8 | 11.6 | |||||||||
Angeleno Investors II, L.P.(3) | 4,757,787 | 18.5 | 14.5 | |||||||||
GE Ventures Limited | 2,844,091 | 11.0 | 8.7 | |||||||||
Element Partners(4) | 8,263,366 | 32.2 | 25.1 | |||||||||
Directors and Named Executive Officers | ||||||||||||
Steven C. Lockard(5) | 268,167 | 1.0 | * | |||||||||
Wayne G. Monie(6) | 95,774 | * | * | |||||||||
William E. Siwek | — | * | * | |||||||||
Stephen B. Bransfield(7) | 6,331 | * | * | |||||||||
Michael L. DeRosa(8) | 8,263,366 | 32.2 | 25.1 | |||||||||
Philip J. Deutch(9) | 3,800,316 | 14.8 | 11.6 | |||||||||
Paul G. Giovacchini(10) | 5,383,908 | 20.9 | 16.4 | |||||||||
Jack A. Henry(11) | 6,331 | * | * | |||||||||
James A. Hughes | — | * | * | |||||||||
Scott N. Humber(12) | 5,383,908 | 20.9 | 16.4 | |||||||||
Daniel G. Weiss(13) | 4,757,787 | 18.5 | 14.5 | |||||||||
|
|
|
|
|
| |||||||
All current directors and executive officers as a group(14) (15 persons) | 25,426,071 | 98.9 | % | 77.4 | % | |||||||
|
|
|
|
|
| |||||||
Shares Offered Hereby | Shares Beneficially Owned After The Offering | |||||||||||||||||||||||||||||||
Shares Beneficially Owned | Assuming No | Assuming | Assuming No Exercise | Assuming Full Exercise | ||||||||||||||||||||||||||||
| Number | Percent | Number | Number | Number | Percent | Number | Percent | |||||||||||||||||||||||||
Directors and Named Executive Officers | ||||||||||||||||||||||||||||||||
Steven C. Lockard | 290,894 | (1) | * | 120,000 | 138,000 | 170,894 | * | 152,894 | * | |||||||||||||||||||||||
Wayne G. Monie | 109,410 | (2) | * | 13,000 | 14,950 | 96,410 | * | 94,460 | * | |||||||||||||||||||||||
William E. Siwek | 9,091 | (3) | * | — | — | 9,091 | * | 9,091 | * | |||||||||||||||||||||||
Paul G. Giovacchini | 6,096,030 | (4) | 18.0 | % | 1,104,250 | 1,269,887 | 4,991,780 | 14.7 | % | 4,826,143 | 14.2 | % | ||||||||||||||||||||
Jack A. Henry | 6,331 | (5) | * | — | — | 6,331 | * | 6,331 | * | |||||||||||||||||||||||
James A. Hughes | 13,636 | (6) | * | — | — | 13,636 | * | 13,636 | * | |||||||||||||||||||||||
Philip J. Deutch | 3,800,316 | (7) | 11.2 | % | 1,204,250 | 1,384,887 | 2,596,066 | 7.7 | % | 2,415,429 | 7.1 | % | ||||||||||||||||||||
Daniel G. Weiss | 5,144,239 | (8) | 15.2 | % | 1,054,250 | 1,212,388 | 4,089,989 | 12.1 | % | 3,931,851 | 11.6 | % | ||||||||||||||||||||
Stephen B. Bransfield | 6,331 | (9) | * | — | — | 6,331 | * | 6,331 | * | |||||||||||||||||||||||
Michael L. DeRosa | 9,503,611 | (10) | 28.0 | % | 1,004,250 | 1,154,888 | 8,499,361 | 25.1 | % | 8,348,723 | 24.6 | % | ||||||||||||||||||||
Steven G. Fishbach | 4,546 | (11) | * | — | — | 4,546 | * | 4,546 | * | |||||||||||||||||||||||
Mark R. McFeely | 4,546 | (12) | * | — | — | 4,546 | * | 4,546 | * | |||||||||||||||||||||||
|
|
|
|
|
|
|
|
|
| |||||||||||||||||||||||
All current directors and executive officers as a group (12 persons) | 24,988,981 | (13) | 73.7 | % | 4,500,000 | 5,175,000 | 20,488,981 | 60.4 | % | 19,813,981 | 58.4 | % | ||||||||||||||||||||
|
|
|
|
|
|
|
|
|
| |||||||||||||||||||||||
5% Stockholders | ||||||||||||||||||||||||||||||||
Investment funds and entities affiliated with: | ||||||||||||||||||||||||||||||||
Element Partners | 9,503,611 | (14) | 28.0 | % | 1,004,250 | 1,154,888 | 8,499,361 | 25.1 | % | 8,348,723 | 24.6 | % | ||||||||||||||||||||
Landmark Partners | 6,096,030 | (15) | 18.0 | % | 1,104,250 | 1,269,887 | 4,991,780 | 14.7 | % | 4,826,143 | 14.2 | % | ||||||||||||||||||||
Angeleno Investors II, L.P. | 5,144,239 | (16) | 15.2 | % | 1,054,250 | 1,212,388 | 4,089,989 | 12.1 | % | 3,931,851 | 11.6 | % | ||||||||||||||||||||
NGP Energy Technology Partners, L.P. | 3,800,316 | (17) | 11.2 | % | 1,204,250 | 1,384,887 | 2,596,066 | 7.7 | % | 2,415,429 | 7.1 | % | ||||||||||||||||||||
GE Ventures Limited | 2,843,664 | (18) | 8.4 | % | — | — | 2,843,664 | 8.4 | % | 2,843,664 | 8.4 | % | ||||||||||||||||||||
| * | Less than |
| (1) | Consists of |
| (2) | Consists of 109,410 shares of common stock. Mr. Monie also holds stock options to purchase 307,800 shares of our common stock at an exercise price of $10.87 per share and restricted stock units with respect to 102,600 shares of our common stock. These awards are not exercisable within 60 days of March 31, 2017. See “Executive Compensation—Outstanding Equity Awards at Fiscal Year-End Table.” |
| (3) | Consists of 9,091 shares of common stock. |
| (4) | Consists of (a)(i) 4,080,572 shares of common stock and (ii) a warrant to purchase 48,904 shares of common stock held by Landmark Growth Capital Partners, L.P. and |
| (5) | Consists of an option to purchase 6,331 shares of common stock. |
| Consists of 13,636 shares of common stock. |
| (7) | Consists of 3,800,316 shares of common stock held by NGP Energy Technology Partners, L.P. NGP ETP, L.L.C. is the general partner of NGP Energy Technology Partners, L.P. Energy Technology Partners, L.L.C. is the manager of NGP ETP, L.L.C. Philip J. Deutch |
| Consists of |
| Consists of |
| (10) | Consists of (a)(i) 9,289,957 shares of common stock and (ii) a warrant to purchase 71,109 shares of common stock held by Element Partners II, L.P. and |
| Consists of |
| Consists of |
| Consists of |
| Consists of |
| Consists of |
| Consists of |
| (18) | Consists of 2,843,664 shares of common stock. |
General
The following description summarizes the most important terms of our capital stock, as they are expected to be in effect upon the closing of this offering.stock. We have adopted an amended and restated certificate of incorporation and amended and restated bylaws each of which will be effective upon the closing of this offering,in connection with our IPO, and this description summarizes the provisions that are expected to be included in such documents. Because it is only a summary, it does not contain all the information that may be important to you. For a complete description of the matters set forth in “Description of Capital Stock,” you should refer to our amended and restated certificate of incorporation and amended and restated bylaws, which have been filed with the SEC and are included as exhibits toincorporated by reference into the registration statement of which this prospectus forms a part, and to the applicable provisions of Delaware law. Immediately following the closing of this offering, ourOur authorized capital stock will consist of 100,000,000 shares of common stock, $0.01 par value per share, and 5,500,000 shares of undesignated preferred stock, $0.01 par value per share.
Assuming the conversion of all outstanding shares of our convertible preferred stock into shares of our common stock, which will occur upon the closing of this offering, asAs of March 31, 2016,2017, there were 25,531,26333,736,863 shares of our common stock outstanding, held by 1613 stockholders of record, and no shares of our convertible preferred stock outstanding.record. Our board of directors is authorized, without stockholder approval except as required by the listing standards of The NASDAQ Global Market to issue additional shares of our capital stock.
Common Stock
The holders of our common stock are entitled to one vote per share on all matters to be voted on by our stockholders. Subject to preferences that may be applicable to any outstanding shares of preferred stock, holders of common stock are entitled to receive ratably such dividends as may be declared by our board of directors out of funds legally available for that purpose. In the event of our liquidation, dissolution or winding up, the holders of common stock are entitled to share ratably in all assets remaining after the payment of liabilities, subject to the prior distribution rights of preferred stock then outstanding. Holders of common stock have no preemptive, conversion or subscription rights. There are no redemption or sinking fund provisions applicable to the common stock.
Preferred Stock
Upon the closing of this offering,our IPO, all currently outstanding shares of preferred stock will convertconverted into shares of our common stock, and there will beare currently no shares of preferred stock outstanding.
Though we currently have no plans to issue any shares of preferred stock, upon the closing of this offering and the filing of our certificate of incorporation, ourOur board of directors will havehas the authority, without further action by our stockholders, to designate and issue up to 5,500,000 shares of preferred stock in one or more series. Our board of directors may also designate the rights, preferences and privileges of the holders of each such series of preferred stock, any or all of which may be greater than or senior to those granted to the holders of common stock. Though the actual effect of any such issuance on the rights of the holders of common stock will not be known until such time as our board of directors determines the specific rights of the holders of preferred stock, the potential effects of such an issuance include:
Warrants and Stock Options
As of March 31, 2016,2017, we had outstanding warrants to purchase 248.03 shares of our Series B preferred stock, with a weighted-average exercise price of $8,748.81 per share, and warrants to purchase 61,720160,424 shares of our common stock, with a weighted-averagean exercise price of the lesser of $24.30$9.35 per share or 85% of the initial public offering price per share. Other than the Common Warrants, these warrants will terminate in connection with the completion of this offering, if not automatically exercised by the holders thereof prior to the completion of this offering. The Common Warrants are exercisable at any time until the earlier of (i) December 29, 2022, (ii) two (2) years following the effective date of this initial public offering,our IPO, or (iii) the date of a merger event, as defined therein.
In addition, as of March 31, 2016,2017, we had outstanding options to purchase 25,828 shares of our common stock under our 2008 Plan and outstanding options to purchase 3,322,8003,283,990 shares of our common stock and 654,120636,120 outstanding restricted stock units issued under our 2015 Plan.
Registration Rights
Investor Rights Agreement
We entered into a Third Amended and Restated Investor Rights Agreement, dated as of June 17, 2010, with certain of our preferred stockholders, as amended on June 30, 2014. Under our investor rights agreement, the parties have certain “demand” registration rights, “piggyback” registration rights (meaning holders may request that their shares be covered by a registration statement that we are otherwise filing) and S-3 registration rights. All of these registration rights are subject to certain conditions and limitations, including those relating to offerings of our securities, including this offering. Our obligations pursuant to the investor rights agreement terminate on the earlier of (1) ten years after the closing of this offeringour IPO or (2) with respect to any holder of securities subject to registration under the terms of the investor rights agreement, at such time as all registrable securities of the holder may be sold pursuant to Rule 144 promulgated under the Securities Act of 1933, but in no event prior to the third anniversary of the closing of this offering.our IPO.
Demand registration rights. At any time which is six months after this initial public offering of shares of our common stock,IPO, subject to certain exceptions, the holders of (a) not less than thirty percent (30%) of the shares of common stock issued or issuable upon conversion of the Series A Preferred Stock (other than registrable securities held by Landmark Partners) then outstanding, (b) not less than fifty percent (50%) of the registrable securities held by Landmark Partners, (c) not less than fifty percent (50%) of the shares of common stock issued or issuable upon conversion of the Series B Preferred Stock (other than registrable securities held by Landmark Partners) then outstanding or (d) not less than fifty percent (50%) of the shares of common stock issued or issuable upon conversion of the Series B-1 Preferred Stock (other than registrable securities held by Landmark Partners) have the right to demand that we file a registration statement, at our expense, covering the offer and sale of all or part of the registrable securities then outstanding. We are required to use commercially reasonable efforts to effect any such registration.
Piggyback registration rights. If after this offering, we propose to register any of our securities for our own account or the account of any other holder, the holders of approximately 25,008,038certain shares of common stock after this offering, are entitled to notice of such registration and are entitled to include shares of their common stock in such registration.
S-3 registration rights. The holders of approximately 25,008,038certain shares of our common stock after this offering, are entitled to demand registration rights pursuant to which they may require us to file a registration statement on Form S-3 with respect to their shares of common stock. We are not obligated to effect any such registration if (a) Form S-3 is not available for such offering, (b) the aggregate proceeds from the sale of such securities will not exceed $2,000,000, (c) if we have already effected more than four registrations of registrable securities onForm S-3 in any 12-month period, (d) if we intend to make a public offering within ninety (90) days of a request for such registration and (e) if our board of directors deems it advisable to delay such filing.
We will pay all registration expenses, other than underwriting discounts and commissions, related to any demand, piggyback or S-3 registration. The investor rights agreement contains customary cross-indemnification provisions, pursuant to which we are obligated to indemnify the selling stockholders in the event of material misstatements or omissions in the registration statement attributable to us and they are obligated to indemnify us for material misstatements or omissions attributable to them.
Anti-Takeover Effects of Delaware Law and Provisions of Our Certificate of Incorporation and Bylaws
Upon the closing of this offering, ourOur certificate of incorporation and by-laws will include a number of provisions that may have the effect of delaying, deferring or preventing another party from acquiring control of us and encouraging persons considering unsolicited tender offers or other unilateral takeover proposals to negotiate with our board of directors rather than pursue non-negotiated takeover attempts. These provisions include the items described below.
Board composition and filling vacancies. In accordance with our certificate of incorporation, our board of directors is divided into three classes serving staggered three-year terms, with one class being elected each year. As a result, approximately one-third of the board of directors is elected each year. Our certificate of incorporation also provides that directors may be removed only for cause and then only by the affirmative vote of the holders of 75% or more of the shares then entitled to vote at an election of directors. Furthermore, any vacancy on our board of directors, however occurring, including a vacancy resulting from an increase in the size of our board of directors, may only be filled by the affirmative vote of a majority of our directors then in office even if less than a quorum. These provisions may deter a stockholder from removing incumbent directors and simultaneously gaining control of the board of directors by filling the vacancies created by such removal with its own nominees.
No written consent of stockholders.Our certificate of incorporation provides that all stockholder actions are required to be taken by a vote of the stockholders at an annual or special meeting and that stockholders may not take any action by written consent in lieu of a meeting. This limit may lengthen the amount of time required to take stockholder actions and would prevent the amendment of our by-laws or removal of directors by our stockholders without holding a meeting of stockholders.
Meetings of stockholders. Our certificate of incorporation and by-laws provide that only a majority of the members of our board of directors then in office may call special meetings of stockholders and only those matters set forth in the notice of the special meeting may be considered or acted upon at a special meeting of stockholders. Our by-laws limit the business that may be conducted at an annual meeting of stockholders to those matters properly brought before the meeting.
Advance notice requirements.Our by-laws establish advance notice procedures with regard to stockholder proposals relating to the nomination of candidates for election as directors or new business to be brought before meetings of our stockholders. These procedures provide that notice of stockholder proposals must be timely given in writing to our corporate secretary prior to the meeting at which the action is to be taken. Generally, to be timely, notice must be received at our principal executive offices not less than 90 days and not more than 120 days prior to the first anniversary date of the annual meeting for the preceding year. The notice must contain certain information specified in the by-laws.
Amendment to certificate of incorporation and by-laws. As required by the Delaware General Corporation Law, any amendment of our certificate of incorporation must first be adopted by a majority of our board of directors and must thereafter be approved by a majority of the outstanding shares entitled to vote on the amendment and a majority of the outstanding shares of each class entitled to vote thereon as a class, except that the amendment of the provisions relating to stockholder action, board composition, limitation of liability and the amendment of our certificate of incorporation must be approved by not less than 75% of the outstanding shares entitled to vote on the amendment and not less than 75% of the outstanding shares of each class entitled to votethereonvote thereon as a class. Our by-laws may be amended by the affirmative vote of a majority of the directors then in
office, subject to any limitations set forth in the by-laws, and may also be amended by the affirmative vote of at least 75% of the outstanding shares entitled to vote on the amendment, or, if our board of directors recommends that the stockholders approve the amendment, by the affirmative vote of the majority of the outstanding shares entitled to vote on the amendment, in each case voting together as a single class.
Undesignated preferred stock. Our certificate of incorporation provides for 5,500,000 authorized shares of preferred stock. The existence of authorized but unissued shares of preferred stock may enable our board of
directors to render more difficult or to discourage an attempt to obtain control of us by means of a merger, tender offer, proxy contest or otherwise. For example, if in the due exercise of its fiduciary obligations, our board of directors were to determine that a takeover proposal is not in the best interests of our stockholders, our board of directors could cause shares of preferred stock to be issued without stockholder approval in one or more private offerings or other transactions that might dilute the voting or other rights of the proposed acquirer or insurgent stockholder or stockholder group. In this regard, our certificate of incorporation grants our board of directors broad power to establish the rights and preferences of authorized and unissued shares of preferred stock. The issuance of shares of preferred stock could decrease the amount of earnings and assets available for distribution to holders of shares of common stock. The issuance may also adversely affect the rights and powers, including voting rights, of these holders and may have the effect of delaying, deterring or preventing a change in control of us.
Section 203 of the Delaware General Corporation Law
Upon completion of this offering, we will beWe are subject to the provisions of Section 203 of the Delaware General Corporation Law. In general, Section 203 prohibits a publicly held Delaware corporation from engaging in a “business combination” with an “interested stockholder” for a three-year period following the time that this stockholder becomes an interested stockholder, unless the business combination is approved in a prescribed manner. A “business combination” includes, among other things, a merger, asset or stock sale or other transaction resulting in a financial benefit to the interested stockholder. An “interested stockholder” is a person who, together with affiliates and associates, owns, or did own within three years prior to the determination of interested stockholder status, 15% or more of the corporation’s voting stock. Under Section 203, a business combination between a corporation and an interested stockholder is prohibited unless it satisfies one of the following conditions:
Market Listing
We intend to apply for the listing of ourOur common stock is listed on The NASDAQ Global Market under the symbol “TPIC”.“TPIC.”
Transfer Agent and Registrar
We intend to engageThe transfer agent and registrar for our common stock is American Stock Transfer & Trust Company, LLC or AST, to serve as the transfer agent and registrar for our common stock. Itswhose address is 6201 15th Avenue, Brooklyn, NY 11219 and itswhose telephone number is (800) 937-5449.
SHARES ELIGIBLE FOR FUTURE SALE
Prior to this offering, there has been no public market for our common stock, and we cannot predict the effect, if any, that market sales of shares of our common stock or the availability of shares of our common stock for sale will have on the market price of our common stock prevailing from time to time. Future sales of our common stock in the public market or the availability of such shares for sale in the public market, could adversely affect market prices prevailing from time to time. As described below, only a limited number of shares will be available for sale shortly after this offering due to contractual and legal restrictions on resale. Nevertheless, sales of our common stock in the public market after such restrictions lapse, or the perception that those sales may occur, could adversely affect the prevailing market price at such time and our ability to raise equity capital in the future.
Following the completion of this offering, based on the number of shares of our capital stock outstanding as of March 31, 2016,2017, we will have a total of 32,781,26333,736,863 shares of our common stock outstanding. Of these outstanding shares, all of the 7,250,000 shares of common stock sold in this offering will be freely tradable, except that any shares purchased in this offering by our affiliates, as that term is defined in Rule 144 under the Securities Act, would only be able to be sold in compliance with the Rule 144 limitations described below.
The remaining outstanding shares of our common stock will beare deemed “restricted securities” as defined in Rule 144. Restricted securities may be sold in the public market only if they are registered or if they qualify for an exemption from registration under Rule 144 or Rule 701 under the Securities Act, which rules are summarized below. In addition, all of our executive officers, directors, and holders of substantially all of our common stock and securities convertible into or exchangeable for our common stockthe selling stockholders have entered into market standoff agreements with us or lock-up agreements with the underwriters under which they have agreed, subject to specific exceptions, not to sell any of our stock for at least 18090 days following the date of this prospectus. As a result of these agreements and the provisions of our investor rights agreement described above under the section titled “Description of Capital Stock—Registration Rights,” subject to the provisions of Rule 144 or Rule 701, based on an assumed offering date of March 31, 2016,2017, shares will be available for sale in the public market as follows:
Lock-Up Agreements
We, our executive officers, directors, and certain holders of substantially all of our common stock and securities convertible into or exchangeable for our common stock, have agreed or will agree that, subject to certain exceptions, for a period of 18090 days from the date of this prospectus, we and they will not, without the prior written consent of J.P. Morgan Securities LLC and Morgan Stanley & Co. LLC, dispose of or hedge any shares or any securities convertible into or exchangeable for shares of our capital stock. J.P. Morgan Securities LLC and Morgan Stanley & Co. LLC may, in its discretion, and with the Company’s consent, release any of the securities subject to these lock-up agreements at any time. Any shares purchased by certain stockholders and executive officers will be subject to the lock-up restrictions.
Rule 144
In general, under Rule 144 as currently in effect, once we have been subject to the public company reporting requirements of Section 13 or Section 15(d) of the Exchange Act for at least 90 days, a person who is not deemed to have been one of our affiliates for purposes of the Securities Act at any time during the 90 days preceding a sale and who has beneficially owned the shares proposed to be sold for at least six months, including the holding period of any prior owner other than our affiliates, is entitled to sell those shares without complying with the manner of sale, volume limitation or notice provisions of Rule 144, subject to compliance with the public information
requirements of Rule 144. If such a person has beneficially owned the shares proposed to be sold for at least one year, including the holding period of any prior owner other than our affiliates, then that person would be entitled to sell those shares without complying with any of the requirements of Rule 144.
In general, under Rule 144, as currently in effect, our affiliates or persons selling shares on behalf of our affiliates are entitled to sell upon expiration of the lock-up agreements described above, within any three-month period, a number of shares that does not exceed the greater of:
Sales under Rule 144 by our affiliates or persons selling shares on behalf of our affiliates are also subject to certain manner of sale provisions and notice requirements and to the availability of current public information about us.
Rule 701
Rule 701 generally allows a stockholder who purchased shares of our common stock pursuant to a written compensatory plan or contract and who is not deemed to have been an affiliate of our company during the immediately preceding 90 days to sell these shares in reliance upon Rule 144, but without being required to comply with the public information, holding period, volume limitation or notice provisions of Rule 144. Rule 701 also permits affiliates of our company to sell their Rule 701 shares under Rule 144 without complying with the holding period requirements of Rule 144. All holders of Rule 701 shares, however, are required by that rule to wait until 90 days after the date of this prospectus before selling those shares pursuant to Rule 701.
Registration Rights
Pursuant to an investor rights agreement, the holders of up to 25,008,038certain shares of our common stock, including shares issuable upon the conversion of our outstanding convertible preferred stock immediately prior to the completion of this offering, or their transferees, will beare entitled to certain rights with respect to the registration of the offer and sale of those shares under the Securities Act. See the section titled “Description of Capital Stock—Registration Rights” for a description of these registration rights. If the offer and sale of these shares is registered, the shares will be freely tradable without restriction under the Securities Act, and a large number of shares may be sold into the public market.
Registration Statement on Form S-8
We intend to file a registration statement on Form S-8 under the Securities Act to register all of the shares of common stock issued or reserved for issuance under our 2008 Plan and our 2015 Plan. We expect to file this registration statement as promptly as possible after the completion of this offering. Shares covered by this registration statement will be eligible for sale in the public market, subject to the Rule 144 limitations applicable to affiliates, vesting restrictions and any applicable lock-up agreements and market standoff agreements.
Equity Awards
As of March 31, 2016,2017, options to purchase 25,828 shares of common stock pursuant to our 2008 Plan were outstanding, all of which were exercisable, and options to purchase 3,322,8003,283,990 shares of our common stock and 654,120636,120 restricted stock units were outstanding, but not exercisable, under our 2015 Plan. We intend to filehave filed a registration statement on Form S-8 under the Securities Act as promptly as possible after the completion of this offeringour IPO to register shares that may be issued pursuant to our 2008 Plan and our 2015 Plan. The registration statement on Form S-8 is expected to becomebecame effective immediately upon filing, and shares covered by the registration statement will then becomebecame eligible for sale in the public market, subject to the Rule 144 limitations applicable to affiliates, vesting restrictions and any applicable lock-up agreements and market standoff agreements. See the section titled “Executive Compensation—Employee Benefit and Stock Plans” for a description of our equity incentive plans.
Warrants
As of March 31, 2016,2017, we had outstanding warrants to purchase up to 248.03 shares of our Series B preferred stock, with a weighted-average exercise price of $8,748.81 per share and warrants to purchase 61,720160,424 shares of our common stock, with a weighted-averagean exercise price of the lesser of $24.30$9.35 per share or 85% of the initial public offering price per share. Except for the Common Warrants, these warrants will terminate in connection with the completion of this offering, if not automatically converted or exercised by the holders thereof prior to the completion of this offering. The Common Warrants are exercisable at any time until the earlier of (i) December 29, 2022, (ii) two (2) years following the effective date of this initial public offering,our IPO, or (iii) the date of a merger event, as defined therein.
CERTAIN MATERIAL U.S. FEDERAL INCOME AND ESTATE
TAX CONSIDERATIONS TO NON-U.S. HOLDERS
The following is a summary of material U.S. federal income tax considerations to non-U.S. holders (as defined below) relating to the acquisition, ownership and disposition of common stock pursuant to this offering. This summary deals only with common stock held as a capital asset (within the meaning of Section 1221 of the Code) by a holder and does not discuss the U.S. federal income tax considerations applicable to a holder that is subject to special treatment under U.S. federal income tax laws, including, but not limited to: a foreign government or governmental entity; a dealer in securities or currencies; a financial institution; a regulated investment company; a real estate investment trust; a tax-exempt organization; an insurance company; a person holding common stock as part of a hedging, integrated, conversion or straddle transaction or a person deemed to sell common stock under the constructive sale provisions of the Code; a trader in securities that has elected the mark-to-market method of accounting; an entity or arrangement that is treated as a partnership for U.S. federal income tax purposes or owners of such entity or arrangement; a person that received such common stock in connection with the performance of services; a pension fund or retirement account; a “controlled foreign corporation;” a “passive foreign investment company;” a corporation that accumulates earnings to avoid U.S. federal income tax; a person that owns or is deemed to own more than 5% of our common stock; or a former citizen or long-term resident of the United States.
This summary is based upon provisions of the Code, applicable U.S. Treasury regulations promulgated thereunder, published rulings and judicial decisions, all as in effect as of the date hereof. Those authorities may be changed, perhaps retroactively, or may be subject to differing interpretations, which could result in U.S. federal income tax consequences different from those discussed below. This summary does not address all aspects of U.S. federal income tax, does not deal with all tax considerations that may be relevant to stockholders in light of their personal circumstances and does not address the Medicare tax imposed on certain investment income or any state, local, foreign, gift, estate or alternative minimum tax considerations.
For purposes of this discussion a “U.S.“non-U.S. holder” is a beneficial owner of common stock that is neither a U.S. person nor a partnership (or any other entity or arrangement that is treated as a partnership) for U.S. federal income tax purposes. A “U.S. person” is a person that is: an individual citizen or resident of the United States; a corporation (or any other entity treated as a corporation for U.S. federal income tax purposes) created or organized in or under the laws of the United States, any state thereof or the District of Columbia; an estate the income of which is subject to U.S. federal income taxation regardless of its source; or a trust if it (1) is subject to the primary supervision of a court within the United States and one or more U.S. persons have the authority to control all substantial decisions of the trust or (2) has a valid election in effect under applicable U.S. Treasury regulations to be treated as a U.S. person.
For purposes of this discussion a “non-U.S. holder” is a beneficial owner of common stock that is neither a U.S. holder nor a partnership (or any other entity or arrangement that is treated as a partnership) for U.S. federal income tax purposes. If a partnership (or an entity or arrangement that is treated as a partnership for U.S. federal income tax purposes) holds common stock, the tax treatment of a partner will generally depend upon the status of the partner and the activities of the partnership. A partner of a partnership holding common stock is urged to consult its own tax advisors.
PROSPECTIVE INVESTORS ARE URGED TO CONSULT THEIR OWN TAX ADVISORS CONCERNING THEIR PARTICULAR U.S. FEDERAL INCOME TAX CONSEQUENCES IN LIGHT OF THEIR SPECIFIC SITUATIONS, AS WELL AS THE TAX CONSEQUENCES ARISING UNDER ANY STATE, LOCAL OR NON-U.S. TAX LAWS AND ANY OTHER U.S. FEDERAL TAX LAWS (INCLUDING THE U.S. FEDERAL ESTATE AND GIFT TAX LAWS).
Distributions on our Common Stock
Distributions with respect to common stock, if any, generally will constitute dividends for U.S. federal income tax purposes to the extent paid out of current or accumulated earnings and profits, as determined for U.S. federal income tax purposes. Any portion of a distribution in excess of current or accumulated earnings and
profits will be treated as a return of capital and will first be applied to reduce the holder’s tax basis in its common stock, but not below zero. Any remaining amount will then be treated as gain from the sale or exchange of the common stock and will be treated as described under the section titled “—Disposition of our Common Stock” below.
Distributions treated as dividends, if any, that are paid to a non-U.S. holder with respect to shares of our common stock will be subject to U.S. federal withholding tax at a rate of 30% (or lower applicable income tax treaty rate) of the gross amount of the dividends unless the dividends are effectively connected with the non-U.S. holder’s conduct of a trade or business in the United States. If a non-U.S. holder is engaged in a trade or business in the United States and dividends with respect to the common stock are effectively connected with the conduct of that trade or business, then the non-U.S. holder will generally be exempt from the 30% U.S. federal withholding tax, provided certain certification requirements are satisfied. To claim the exemption from withholding with respect to any such effectively connected income, the non-U.S. holder must generally furnish to us or our paying agent a properly executed IRS Form W-8ECI (or applicable successor form). However, in this case the non-U.S. holder will be subject to U.S. federal income tax on those dividends on a net income basis at regular graduated U.S. federal income tax rates in the same manner as if such holder were a resident of the United States (except to the extent provided in an applicable income tax treaty, which may require that such dividends be attributable to a U.S. permanent establishment or fixed base in order to be subject to tax as described herein). Any such effectively connected income received by a foreign corporation may, under certain circumstances, be subject to an additional branch profits tax equal to 30% (or lower applicable income tax treaty rate) of its effectively connected earnings and profits for the taxable year, as adjusted under the Code. A non-U.S. holder of shares of common stock who wishes to claim the benefit of an exemption or reduced rate of withholding tax under an applicable treaty must furnish to us or our paying agent a valid IRS Form W-8BEN or IRS Form W-8BEN-E (or applicable successor form) certifying such holder’s qualification for the exemption or reduced rate. If a non-U.S. holder is eligible for a reduced rate of U.S. withholding tax pursuant to an income tax treaty, it may obtain a refund of any excess amounts withheld by filing an appropriate claim for refund with the Internal Revenue Service, or IRS. Non-U.S. holders are urged to consult their tax advisors regarding their entitlement to benefits under a relevant income tax treaty.
Disposition of our Common Stock
Non-U.S. holders may recognize gain upon the sale, exchange, or other taxable disposition of our common stock. Such gain generally will not be subject to U.S. federal income tax unless: (i) the gain is effectively connected with the non-U.S. holder’s conduct of a trade or business in the United States (and, if required by an applicable income tax treaty, is attributable to a U.S. permanent establishment or fixed base maintained by the non-U.S. holder); (ii) the non-U.S. holder is an individual who is present in the United States for 183 days or more in the taxable year of the disposition, and certain other conditions are met; or (iii) we are or have been a “U.S. real property holding corporation” for U.S. federal income tax purposes at any time during the shorter of the five-year period preceding the date of disposition or the holder’s holding period for our common stock. Notwithstanding the foregoing, Non-U.S. holders would not be subject to U.S. federal income tax on the disposition of our common stock unlessdescribed in clause (iii) of the preceding sentence if our common stock is regularly traded on an established securities market and the non-U.S. holder held no more than 5% of our outstanding common stock, directly or indirectly, during the shorter of the five year period ending on the date of the disposition or the period that the non-U.S. holder held our common stock. We believe that we are not and we do not anticipate becoming a “U.S. real property holding corporation” for U.S. federal income tax purposes. NoHowever, because the determination of whether we are a U.S. real property holding corporation depends on the fair market value of our U.S. real property relative to the fair market value of our other real property and business assets, there can be no assurance that we will not become a U.S. real property holding corporation in the future. Furthermore, no assurance can be provided that our common stock will remain regularly traded on an established securities market for purposes of the rules described above.
If a non-U.S. holder is an individual described in clause (i) of the preceding paragraph, the non-U.S. holder will generally be subject to tax on a net income basis at the regular graduated U.S. federal individual income tax rates in the same manner as if such holder were a resident of the United States, unless an applicable income tax treaty provides otherwise. If the non-U.S. holder is an individual described in clause (ii) of the preceding paragraph, the non-U.S. holder will generally be subject to a flat 30% tax on the gain, which may be offset by U.S. source capital losses even though the non-U.S. holder is not considered a resident of the United
States, provided that the non-U.S. holder has timely filed U.S. federal income tax returns with respect to such losses. If a non-U.S. holder is a foreign corporation that falls under clause (i) of the preceding paragraph, it will be subject to tax on a net income basis at the regular graduated U.S. federal corporate income tax rates in the same manner as if it were a resident of the United States and, in addition, the non-U.S. holder may be subject to the branch profits tax at a rate equal to 30% (or lower applicable income tax treaty rate) of its effectively connected earnings and profits.
Information Reporting and Backup Withholding Tax
We must generally report to our non-U.S. holders and the IRS the amount of dividends paid during each calendar year and the amount of any tax withheld. All distributions to holders of common stock are subject to any applicable withholding. Information reporting requirements may apply even if no withholding was required because the distributions were effectively connected with the non-U.S. holder’s conduct of a United States trade or business or withholding was reduced or eliminated by an applicable income tax treaty. This information also may be made available under a specific treaty or agreement with the tax authorities in the country in which the non-U.S. holder resides or is established. Under U.S. federal income tax law, interest, dividends and other reportable payments may, under certain circumstances, be subject to “backup withholding” at the then applicable rate. Backup withholding, however, generally will not apply to distributions to a non-U.S. holder of our common stock, provided the non-U.S. holder furnishes to us or our paying agent the required certification as to its non-U.S. status, such as by providing a valid IRS Form W-8BEN, IRS Form W-8BEN-E, or IRS Form W-8ECI, or certain other requirements are met. Notwithstanding the foregoing, backup withholding may apply if either we or our paying agent has actual knowledge, or reason to know, that the holder is a U.S. person that is not an exempt recipient. Backup withholding is not an additional tax but can be credited against a non-U.S. holder’s federal income tax, and may be refunded to the extent it results in an overpayment of tax and the appropriate information is timely supplied to the IRS.
Foreign Account Tax Compliance Act
The Foreign Account Tax Compliance Act or FATCA,(FATCA) imposes withholding taxes on certain types of payments made to “foreign financial institutions” (as specially defined under these rules to include many entities that may not typically be thought of as financial institutions) and certain other non-U.S. entities if certification, information reporting and other specified requirements are not met. FATCA imposes a 30% withholding tax on “withholdable payments” if they are paid to a foreign financial institution or to a foreign non-financial entity, unless (i) the foreign financial institution undertakes certain diligence and reporting obligations and other specified requirements are satisfied or (ii) the foreign non-financial entity either certifies it does not have any substantial U.S. owners or furnishes identifying information regarding each substantial U.S. owner and other specified requirements are satisfied. “Withholdable payments” will include dividends on our common stock and any gross proceeds from the sale or other disposition of our common stock. If the payee is a foreign financial institution, it generally must enter into an agreement with the U.S. Treasury requiring, among other things, that it undertake to identify accounts held by certain U.S. persons or U.S.-owned foreign entities, annually report certain information about such accounts and withhold 30% on payments to account holders whose actions prevent it from complying with these reporting and other requirements. Under final U.S. Treasury Regulations and current IRS guidance, any withholding on payments of gross proceeds from the sale or disposition of our common stock will only apply to payments made on or after January 1, 2019. An intergovernmental agreement between the United States and an applicable foreign country may modify the requirements described in this paragraph. Prospective investors should consult their own tax advisors regarding this legislation.
Federal Estate Taxes
Common Stock owned or treated as being owned by a non-U.S. holder at the time of death will be included in such holder’s gross estate for U.S. federal estate tax purposes, unless an applicable estate tax treaty provides otherwise. Non-U.S. holders should consult their own tax advisors regarding the application of the U.S. federal estate tax to their particular circumstances.
J.P. Morgan Securities LLC and Morgan Stanley & Co. LLC are acting as representatives (the “Representatives”)Representatives) of each of the underwriters named below. Subject to the terms and conditions set forth in an underwriting agreement among us, the selling stockholders and the underwriters, wethe selling stockholders have agreed to sell to the underwriters, and each of the underwriters has agreed, severally and not jointly, to purchase from us,the selling stockholders, the number of shares of common stock set forth opposite its name below.
| Underwriter | Number of | |||
J.P. Morgan Securities LLC | ||||
Morgan Stanley & Co. LLC | ||||
Cowen and Company, LLC | ||||
Raymond James & Associates, | ||||
Canaccord Genuity Inc. | ||||
|
| |||
Total | ||||
|
| |||
Subject to the terms and conditions set forth in the underwriting agreement, the underwriters have agreed, severally and not jointly, to purchase all of the shares sold under the underwriting agreement if any of these shares are purchased. If an underwriter defaults, the underwriting agreement provides that the purchase commitments of the nondefaulting underwriters may be increased or the underwriting agreement may be terminated.
We have agreed to indemnify the underwriters against certain liabilities, including liabilities under the Securities Act, or to contribute to payments the underwriters may be required to make in respect of those liabilities.
The underwriters are offering the shares, subject to prior sale, when, as and if issued to and accepted by them, subject to approval of legal matters by their counsel, including the validity of the shares, and other conditions contained in the underwriting agreement, such as the receipt by the underwriters of officer’s certificates and legal opinions. The underwriters reserve the right to withdraw, cancel or modify offers to the public and to reject orders in whole or in part.
Commissions and Discounts
The Representatives have advised us that the underwriters propose initially to offer the shares to the public at the public offering price set forth on the cover page of this prospectus and to dealers at that price less a concession not in excess of $ per share. After the initial offering, the public offering price, concession or any other term of the offering may be changed.
The following table shows the public offering price, underwriting discount and proceeds before expenses to us.the selling stockholders. The information assumes either no exercise or full exercise by the underwriters of their option to purchase additional shares.
Per Share | Without Option | With Option | ||||||||||
Public offering price | $ | $ | $ | |||||||||
Underwriting discount | $ | $ | $ | |||||||||
Proceeds, before expenses, to | $ | $ | $ | |||||||||
TheWe and the selling stockholders estimate that the expenses of the offering, not including the underwriting discount, are estimated at $discounts and arecommissions, will be approximately $850,000. We will pay all such expenses on behalf of the Company and the selling stockholders, other than any transfer taxes payable by us.the selling stockholders. In addition, we have agreed to reimburse the underwriters up to $50,000 for certain fees and expenses of counsel to the underwriters.underwriters and the underwriters have agreed to reimburse certain of our expenses.
Option to Purchase Additional Shares
WeThe selling stockholders have granted an option to the underwriters, exercisable for 30 days after the date of this prospectus, to purchase up to 1,087,500675,000 additional shares at the public offering price, less the underwriting discount. If the underwriters exercise this option, each will be obligated, subject to conditions contained in the underwriting agreement, to purchase a number of additional shares proportionate to that underwriter’s initial amount reflected in the above table.
No Sales of Similar Securities
We, the selling stockholders and our executive officers and directors, and our other existing security holders have agreed not to sell or transfer any common stock or securities convertible into, exchangeable for, exercisable for, or repayable with common stock, for 18090 days after the date of this prospectus without first obtaining the written consent of the Representatives. Specifically, we and these other persons have agreed, with certain limited exceptions, not to directly or indirectly:
This lock-up provision applies to common stock and to securities convertible into or exchangeable or exercisable for or repayable with common stock. It also applies to common stock owned now or acquired later (but prior to this offering) by the person executing the agreement or for which the person executing the agreement later acquires the power of disposition.
Listing
We expect theOur shares to be approved for listingare listed on The NASDAQ Global Market under the symbol “TPIC”.“TPIC.”
Before this offering, there has been no public market for our common stock. The initial public offering price will be determined through negotiations between us and the Representatives. In addition to prevailing market conditions, the factors to be considered in determining the initial public offering price areare:
An active trading market for the shares may not develop. It is also possible that after the offering the shares will not trade in the public market at or above the initial public offering price.
The underwriters do not expect to sell more than 5% of the shares in the aggregate to accounts over which they exercise discretionary authority.
Price Stabilization, Short Positions and Penalty Bids
Until the distribution of the shares is completed, SEC rules may limit underwriters and selling group members from bidding for and purchasing our common stock. However, the Representatives may engage in transactions that stabilize the price of the common stock, such as bids or purchases to peg, fix or maintain that price.
In connection with the offering, the underwriters may purchase and sell our common stock in the open market. These transactions may include short sales, purchases on the open market to cover positions created by short sales and stabilizing transactions. Short sales involve the sale by the underwriters of a greater number of shares than they are required to purchase in the offering. “Covered” short sales are sales made in an amount not greater than the underwriters’ option to purchase additional shares described above. The underwriters may close out any covered short position by either exercising their option to purchase additional shares or purchasing shares in the open market. In determining the source of shares to close out the covered short position, the underwriters will consider, among other things, the price of shares available for purchase in the open market as compared to the price at which they may purchase shares through the option granted to them. “Naked” short sales are sales in excess of such option. The underwriters must close out any naked short position by purchasing shares in the open market. A naked short position is more likely to be created if the underwriters are concerned that there may be downward pressure on the price of our common stock in the open market after pricing that could adversely affect investors who purchase in the offering. Stabilizing transactions consist of various bids for or purchases of shares of common stock made by the underwriters in the open market prior to the completion of the offering.
The underwriters may also impose a penalty bid. This occurs when a particular underwriter repays to the underwriters a portion of the underwriting discount received by it because the Representatives have repurchased shares sold by or for the account of such underwriter in stabilizing or short covering transactions.
Similar to other purchase transactions, the underwriters’ purchases to cover the syndicate short sales may have the effect of raising or maintaining the market price of our common stock or preventing or retarding a decline in the market price of our common stock. As a result, the price of our common stock may be higher than the price that might otherwise exist in the open market. The underwriters may conduct these transactions on The NASDAQ Global Market, in the over-the-counter market or otherwise.
Neither we nor any of the underwriters make any representation or prediction as to the direction or magnitude of any effect that the transactions described above may have on the price of our common stock. In addition, neither we nor any of the underwriters make any representation that the Representatives will engage in these transactions or that these transactions, once commenced, will not be discontinued without notice.
Electronic Distribution
In connection with the offering, certain of the underwriters or securities dealers may distribute prospectuses by electronic means, such as e-mail.
Other Relationships
Some of the underwriters and their affiliates have engaged in, and may in the future engage in, investment banking and other commercial dealings in the ordinary course of business with us or our affiliates. They have received, or may in the future receive, customary fees and commissions for these transactions.
In addition, in the ordinary course of their business activities, the underwriters and their affiliates may make or hold a broad array of investments and actively trade debt and equity securities (or related derivative securities) and financial instruments (including bank loans) for their own account and for the accounts of their customers. Such investments and securities activities may involve securities and/or instruments of ours or our affiliates. The underwriters and their affiliates may also make investment recommendations and/or publish or express independent research views in respect of such securities or financial instruments and may hold, or recommend to clients that they acquire, long and/or short positions in such securities and instruments.
Notice to Prospective Investors in Canada
The shares may be sold only to purchasers purchasing, or deemed to be purchasing, as principal, that are accredited investors, as defined in National Instrument 45-106Prospectus Exemptionsor subsection 73.3(1) of theSecurities Act (Ontario), and are permitted clients, as defined in National Instrument 31-103Registration Requirements, Exemptions and Ongoing Registrant Obligations.Any resale of the shares must be made in accordance with an exemption from, or in a transaction not subject to, the prospectus requirements of applicable securities laws.
Securities legislation in certain provinces or territories of Canada may provide a purchaser with remedies for rescission or damages if this prospectus (including any amendment thereto) contains a misrepresentation, provided that the remedies for rescission or damages are exercised by the purchaser within the time limit prescribed by the securities legislation of the purchaser’s province or territory. The purchaser should refer to any applicable provisions of the securities legislation of the purchaser’s province or territory for particulars of these rights or consult with a legal advisor.
Pursuant to section 3A.3 of National Instrument 33-105Underwriting Conflicts(“NI 33-105”)33-105), the underwriters are not required to comply with the disclosure requirements of NI 33-105 regarding underwriter conflicts of interest in connection with this offering.
Notice to Prospective Investors in the European Economic Area
In relation to each Member State of the European Economic Area (each, a “RelevantRelevant Member State”)State), no offer of shares may be made to the public in that Relevant Member State other than:
| A. | to any legal entity which is a qualified investor as defined in the Prospectus Directive: |
| B. | to fewer than 150 natural or legal persons (other than qualified investors as defined in the Prospectus Directive), as permitted under the Prospectus Directive, subject to obtaining the prior consent of the Representatives for any such offer; or |
| C. | in any other circumstances falling within Article 3(2) of the Prospectus Directive, |
provided that no such offer of shares shall require the Company or the Representatives to publish a prospectus pursuant to Article 3 of the Prospectus Directive or supplement a prospectus pursuant to Article 16 of the Prospectus Directive.
Each person in a Relevant Member State who initially acquires any shares or to whom any offer is made will be deemed to have represented, acknowledged and agreed that it is a “qualified investor” within the meaning of the law in that Relevant Member State implementing Article 2(1)(e) of the Prospectus Directive. In the case of any shares being offered to a financial intermediary as that term is used in Article 3(2) of the Prospectus Directive, each such financial intermediary will be deemed to have represented, acknowledged and agreed (i) that the shares acquired by it in the offer have not been acquired on a non-discretionary basis on behalf of, nor have they been acquired with a view to their offer or resale to, persons in circumstances which may give rise to an offer of any shares to the public other than their offer or resale in a Relevant Member State toother than qualified investors, as sothat term is defined in the Prospectus Directive, or in circumstances in which the prior consent of the Representatives has been obtainedgiven to each such proposedthe offer or resale.resale; or (ii) where shares have been acquired by it on behalf of persons in any Relevant Member State other than qualified investors, the offer of those shares to it is not treated under the Prospectus Directive as having been made to such persons.
The Company, the Representatives and their affiliates will rely upon the truth and accuracy of the foregoing representations, acknowledgements and agreements.
This prospectus has been prepared on the basis that any offer of shares in any Relevant Member State will be made pursuant to an exemption under the Prospectus Directive from the requirement to publish a prospectus for offers of shares. Accordingly any person making or intending to make an offer in that Relevant Member State of shares which are the subject of the offering contemplated in this prospectus may only do so in circumstances in which no obligation arises for the Company or any of the underwriters to publish a prospectus pursuant to Article 3 of the Prospectus Directive in relation to such offer. Neither the Company nor the underwriters have authorized, nor do they authorize, the making of any offer of shares in circumstances in which an obligation arises for the Company or the underwriters to publish a prospectus for such offer.
For the purpose of the above provisions, the expression “an offer to the public” in relation to any shares in any Relevant Member State means the communication in any form and by any means of sufficient information on the terms of the offer and the shares to be offered so as to enable an investor to decide to purchase or subscribe the shares, as the same may be varied in the Relevant Member State by any measure implementing the Prospectus Directive in the Relevant Member State and the expression “Prospectus Directive” means Directive 2003/71/EC (as amended, including by Directive 2010/73/EU) and includes any relevant implementing measure in the Relevant Member State.
Notice to Prospective Investors in the United Kingdom
In addition, in the United Kingdom, this document is being distributed only to, and is directed only at, and any offer subsequently made may only be directed at persons who are “qualified investors” (as defined in the Prospectus Directive), that is, (i) investment professionals falling within Article 19(5) of the Financial Services and Markets Act 2000 (Financial Promotion) Order 2005, as amended (the “Order”) and/or (ii) who are high net worth companies (or persons to whom it may otherwise be lawfully communicated) falling within Article 49(2)(a) to (d) of the Order (all such persons together being referred to as “relevant persons”). This document must not be acted on or relied on in the United Kingdom by persons who are not relevant persons. In the United Kingdom, any investment or investment activity to which this document relates is only available to, and will be engaged in with, relevant persons.
Notice to Prospective Investors in Switzerland
The shares may not be publicly offered in Switzerland and will not be listed on the SIX Swiss Exchange (“SIX”)(SIX) or on any other stock exchange or regulated trading facility in Switzerland. This document has been prepared without regard to the disclosure standards for issuance prospectuses under art. 652a or art. 1156 of the
Swiss Code of Obligations or the disclosure standards for listing prospectuses under art. 27 ff. of the SIX Listing Rules or the listing rules of any other stock exchange or regulated trading facility in Switzerland. Neither this document nor any other offering or marketing material relating to the shares or the offering may be publicly distributed or otherwise made publicly available in Switzerland.
Neither this document nor any other offering or marketing material relating to the offering, the Company, the shares have been or will be filed with or approved by any Swiss regulatory authority. In particular, this document will not be filed with, and the offer of shares will not be supervised by, the Swiss Financial Market Supervisory Authority FINMA (FINMA), and the offer of shares has not been and will not be authorized under the Swiss Federal Act on Collective Investment Schemes (“CISA”)(CISA). The investor protection afforded to acquirers of interests in collective investment schemes under the CISA does not extend to acquirers of shares.
Notice to Prospective Investors in the Dubai International Financial Centre
This prospectus relates to an Exempt Offer in accordance with the Offered Securities Rules of the Dubai Financial Services Authority (“DFSA”)(DFSA). This prospectus is intended for distribution only to persons of a type specified in the Offered Securities Rules of the DFSA. It must not be delivered to, or relied on by, any other person. The DFSA has no responsibility for reviewing or verifying any documents in connection with Exempt Offers. The DFSA has not approved this prospectus nor taken steps to verify the information set forth herein and has no responsibility for the prospectus. The shares to which this prospectus relates may be illiquid and/or subject to restrictions on their resale. Prospective purchasers of the shares offered should conduct their own due diligence on the shares. If you do not understand the contents of this prospectus you should consult an authorized financial advisor.
Notice to Prospective Investors in Australia
No placement document, prospectus, product disclosure statement or other disclosure document has been lodged with the Australian Securities and Investments Commission (“ASIC”)(ASIC), in relation to the offering. This prospectus does not constitute a prospectus, product disclosure statement or other disclosure document under the Corporations Act 2001 (the “Corporations Act”)Corporations Act), and does not purport to include the information required for a prospectus, product disclosure statement or other disclosure document under the Corporations Act.
Any offer in Australia of the shares may only be made to persons (the “Exempt Investors”)Exempt Investors) who are “sophisticated investors” (within the meaning of section 708(8) of the Corporations Act), “professional investors” (within the meaning of section 708(11) of the Corporations Act) or otherwise pursuant to one or more exemptions contained in section 708 of the Corporations Act so that it is lawful to offer the shares without disclosure to investors under Chapter 6D of the Corporations Act.
The shares applied for by Exempt Investors in Australia must not be offered for sale in Australia in the period of 12 months after the date of allotment under the offering, except in circumstances where disclosure to investors under Chapter 6D of the Corporations Act would not be required pursuant to an exemption under section 708 of the Corporations Act or otherwise or where the offer is pursuant to a disclosure document which complies with Chapter 6D of the Corporations Act. Any person acquiring shares must observe such Australian on-sale restrictions.
This prospectus contains general information only and does not take account of the investment objectives, financial situation or particular needs of any particular person. It does not contain any securities recommendations or financial product advice. Before making an investment decision, investors need to consider whether the information in this prospectus is appropriate to their needs, objectives and circumstances, and, if necessary, seek expert advice on those matters.
Notice to Prospective Investors in Hong Kong
The shares have not been offered or sold and will not be offered or sold in Hong Kong, by means of any document, other than (a) to “professional investors” as defined in the Securities and Futures Ordinance (Cap. 571) of Hong Kong and any rules made under that Ordinance; or (b) in other circumstances which do not result in the document being a “prospectus” as defined in the Companies (Winding Up and Miscellaneous Provisions) Ordinance (Cap. 32) of Hong Kong or which
do not constitute an offer to the public within the meaning of that Ordinance. No advertisement, invitation or document relating to the shares has been or may be issued or has been or may be in the possession of any person for the purposes of issue, whether in Hong Kong or elsewhere, which is directed at, or the contents of which are likely to be accessed or read by, the public of Hong Kong (except if permitted to do so under the securities laws of Hong Kong) other than with respect to shares which are or are intended to be disposed of only to persons outside Hong Kong or only to “professional investors” as defined in the Securities and Futures Ordinance and any rules made under that Ordinance.
Notice to Prospective Investors in Japan
The shares have not been and will not be registered under the Financial Instruments and Exchange Law of Japan (Law No. 25 of 1948, as amended) (the FIEA) and, accordingly, will not be offered or sold, directly or indirectly, in Japan, or for the benefit of any Japanese Person or to others for re-offering or resale, directly or indirectly, in Japan or to any Japanese Person, except pursuant to any exemption from the registration requirements of, and otherwise in compliance with, allthe FIEA and other applicable laws, regulations and ministerial guidelines promulgated by relevant Japanese governmental or regulatory authorities in effect at the relevant time.of Japan. For the purposes of this paragraph, “Japanese Person” shall mean any person resident in Japan, including any corporation or other entity organized under the laws of Japan.
Notice to Prospective Investors in Singapore
This prospectus has not been registered as a prospectus with the Monetary Authority of Singapore. Accordingly, this prospectus and any other document or material in connection with the offer or sale, or invitation for subscription or purchase, of the shares may not be circulated or distributed, nor may the shares be offered or sold, or be made the subject of an invitation for subscription or purchase, whether directly or indirectly, to persons in Singapore other than (i) to an institutional investor under Section 274 of the Securities and Futures Act, Chapter 289 of Singapore (the “SFA”)SFA), (ii) to a relevant person pursuant to Section 275(1), or any person pursuant to Section 275(1A), and in accordance with the conditions specified in Section 275, of the SFA, or (iii) otherwise pursuant to, and in accordance with the conditions of, any other applicable provision of the SFA.
Where the shares are subscribed or purchased under Section 275 of the SFA by a relevant person which is:
| (a) | a corporation (which is not an accredited investor (as defined in Section 4A of the SFA)) the sole business of which is to hold investments and the entire share capital of which is owned by one or more individuals, each of whom is an accredited investor; |
| (b) | a trust (where the trustee is not an accredited investor) whose sole purpose is to hold investments and each beneficiary of the trust is an individual who is an accredited |
| (c) | securities (as defined in Section 239(1) of the SFA) of that corporation or the beneficiaries’ rights and interest (howsoever described) in that trust shall not be transferred within six months after that corporation or that trust has acquired the shares pursuant to an offer made under Section 275 of the SFA except: |
| to an institutional investor or to a relevant person defined in Section 275(2) of the SFA, or to any person arising from an offer referred to in Section 275(1A) or Section 276(4)(i)(B) of the SFA; |
| where no consideration is or will be given for the transfer; |
| where the transfer is by operation of law; |
| as specified in Section 276(7) of the SFA; or |
| as specified in Regulation 32 of the Securities and Futures (Offers of Investments) (Shares and Debentures) Regulations 2005 of Singapore. |
The validity of the shares of common stock offered by this prospectus will be passed upon for us by Goodwin Procter LLP, Boston, Massachusetts. Legal matters relating to this offering will be passed upon for the underwriters by Cleary Gottlieb Steen & Hamilton LLP, New York, New York.
The consolidated financial statements and schedule of TPI Composites, Inc. as of December 31, 20152016 and 2014,2015, and for each of the years in the three-year period ended December 31, 2015,2016, have been included herein and in the registration statement in reliance upon the report of KPMG LLP, independent registered public accounting firm, appearing elsewhere herein, and upon the authority of said firm as experts in accounting and auditing.
WHERE YOU CAN FIND MORE INFORMATION
We have filed with the SEC a registration statement on Form S-1 under the Securities Act with respect to the shares of common stock offered by this prospectus. This prospectus, which constitutes a part of the registration statement, does not contain all of the information set forth in the registration statement, some of which is contained in exhibits to the registration statement as permitted by the rules and regulations of the SEC. For further information with respect to us and our common stock, we refer you to the registration statement, including the exhibits filed as a part of the registration statement. Statements contained in this prospectus concerning the contents of any contract or any other document is not necessarily complete. If a contract or document has been filed as an exhibit to the registration statement, please see the copy of the contract or document that has been filed. Each statement isin this prospectus relating to a contract or document filed as an exhibit is qualified in all respects by the filed exhibit. You may obtain copies of this information by mail from the Public Reference Section of the SEC, 100 F Street, N.E., Room 1580, Washington, D.C. 20549, at prescribed rates. You may obtain information on the operation of the public reference rooms by calling the SEC at 1-800-SEC-0330. The SEC also maintains an Internet website that contains reports, proxy statements and other information about issuers, like us, that file electronically with the SEC. The address of that website iswww.sec.gov.
As a result of this offering, we will becomeWe are subject to the information and reporting requirements of the Exchange Act, and, in accordance with this law, willare required to file periodic reports, proxy statements and other information with the SEC. These periodic reports, proxy statements and other information will be available for inspection and copying at the SEC’s public reference facilities and the website of the SEC referred to above. We also maintain a website atwww.tpicomposites.com.www.tpicomposites.com. Upon completion of this offering, you may access these materials free of charge as soon as reasonably practicable after they are electronically filed with, or furnished to, the SEC. Information contained on our website is not a part of this prospectus and the inclusion of our website address in this prospectus is an inactive textual reference only.
TPI COMPOSITES, INC. AND SUBSIDIARIES
INDEX TO CONSOLIDATED FINANCIAL STATEMENTS
Page | ||||
Unaudited interim condensed consolidated financial statements | ||||
Condensed Consolidated Balance Sheets as of March 31, | F-2 | |||
| F-3 | ||||
| F-4 | ||||
| F-5 | ||||
Notes to Unaudited Condensed Consolidated Financial Statements | F-6 | |||
Audited annual consolidated financial statements | ||||
| F-18 | ||||
Consolidated Balance Sheets as of December 31, | F-19 | |||
Consolidated Statements of Operations for the years ended December 31, 2016, 2015 | F-20 | |||
| F-21 | ||||
| F-22 | ||||
Consolidated Statements of Cash Flows for the years ended December 31, 2016, 2015 | F-23 | |||
| F-24 | ||||
TPI COMPOSITES, INC. AND SUBSIDIARIES
Condensed Consolidated Balance Sheets
(In thousands, except sharepar value data)
Pro Forma | March 31, | December 31, | March 31, 2017 | December 31, 2016 | ||||||||||||||||
| (unaudited) | (Unaudited) | (Unaudited) | ||||||||||||||||||
Assets | ||||||||||||||||||||
Current assets: | ||||||||||||||||||||
Cash and cash equivalents | $ | 35,842 | $ | 35,842 | $ | 45,917 | $ | 115,541 | $ | 119,066 | ||||||||||
Restricted cash | 2,407 | 2,407 | 1,760 | 1,928 | 2,259 | |||||||||||||||
Accounts receivable | 87,032 | 87,032 | 72,913 | |||||||||||||||||
Accounts receivable (Note 3) | 96,564 | 67,842 | ||||||||||||||||||
Inventories | 54,836 | 54,836 | 50,841 | 51,947 | 53,095 | |||||||||||||||
Inventory held for customer orders | 50,873 | 50,873 | 49,594 | |||||||||||||||||
Inventories held for customer orders | 68,675 | 52,308 | ||||||||||||||||||
Prepaid expenses and other current assets | 39,684 | 39,684 | 31,337 | 23,839 | 30,657 | |||||||||||||||
|
|
|
|
| ||||||||||||||||
Total current assets | 270,674 | 270,674 | 252,362 | 358,494 | 325,227 | |||||||||||||||
Property, plant, and equipment, net | 74,943 | 74,943 | 67,732 | 103,486 | 91,166 | |||||||||||||||
Other noncurrent assets | 12,845 | 12,845 | 9,826 | 15,961 | 20,813 | |||||||||||||||
|
|
|
|
| ||||||||||||||||
Total assets | $ | 358,462 | $ | 358,462 | $ | 329,920 | $ | 477,941 | $ | 437,206 | ||||||||||
|
|
|
|
| ||||||||||||||||
Liabilities and Shareholders’ Deficit | ||||||||||||||||||||
Liabilities and Shareholders’ Equity | ||||||||||||||||||||
Current liabilities: | ||||||||||||||||||||
Accounts payable and accrued expenses | $ | 106,809 | $ | 106,809 | $ | 101,108 | $ | 123,390 | $ | 112,281 | ||||||||||
Accrued warranty | 27,935 | 27,935 | 13,596 | 21,895 | 19,912 | |||||||||||||||
Deferred revenue | 65,027 | 65,027 | 65,520 | |||||||||||||||||
Deferred revenue (Note 3) | 89,319 | 69,568 | ||||||||||||||||||
Customer deposits and customer advances | 13,447 | 13,447 | 8,905 | 6,217 | 1,390 | |||||||||||||||
Current maturities of long-term debt | 53,637 | 53,637 | 52,065 | 32,474 | 33,403 | |||||||||||||||
|
|
|
|
| ||||||||||||||||
Total current liabilities | 266,855 | 266,855 | 241,194 | 273,295 | 236,554 | |||||||||||||||
Long-term debt, net of debt issuance costs, discount and current maturities | 77,526 | 77,526 | 77,281 | |||||||||||||||||
Long-term debt, net of debt issuance costs and current maturities | 88,015 | 89,752 | ||||||||||||||||||
Other noncurrent liabilities | 4,259 | 4,259 | 3,812 | 4,565 | 4,393 | |||||||||||||||
|
|
|
|
| ||||||||||||||||
Total liabilities | 348,640 | 348,640 | 322,287 | 365,875 | 330,699 | |||||||||||||||
|
|
|
|
| ||||||||||||||||
Commitments and contingencies (Note 11) | ||||||||||||||||||||
Convertible and senior redeemable preferred shares and warrants | — | 201,282 | 198,830 | |||||||||||||||||
|
|
| ||||||||||||||||||
Shareholders’ equity (deficit): | ||||||||||||||||||||
Preferred shares, $0.01 par value, no shares issued, outstanding or authorized at March 31, 2016 and December 31, 2015; 5,500,000 shares authorized, no shares issued and outstanding pro forma (unaudited) | — | — | — | |||||||||||||||||
Common shares, $0.01 par value, 31,104,000 shares authorized and 4,238,487 shares issued and outstanding at March 31, 2016 and December 31, 2015; 100,000,000 shares authorized and 25,531,263 shares issued and outstanding pro forma (unaudited) | 255 | — | — | |||||||||||||||||
Commitments and contingencies (Note 10) | ||||||||||||||||||||
Shareholders’ equity: (Note 3) | ||||||||||||||||||||
Preferred shares, $0.01 par value, 5,500 shares authorized, no shares issued or outstanding at March 31, 2017 and December 31, 2016 | — | — | ||||||||||||||||||
Common shares, $0.01 par value, 100,000 shares authorized and 33,737 shares issued and outstanding at March 31, 2017 and December 31, 2016 | 337 | 337 | ||||||||||||||||||
Paid-in capital | 201,027 | — | — | 295,292 | 292,833 | |||||||||||||||
Accumulated other comprehensive income (loss) | 403 | 403 | (25 | ) | ||||||||||||||||
Accumulated other comprehensive loss | (3,585 | ) | (3,862 | ) | ||||||||||||||||
Accumulated deficit | (191,863 | ) | (191,863 | ) | (191,172 | ) | (179,978 | ) | (182,801 | ) | ||||||||||
|
|
|
|
| ||||||||||||||||
Total shareholders’ equity (deficit) | 9,822 | (191,460 | ) | (191,197 | ) | |||||||||||||||
Total shareholders’ equity | 112,066 | 106,507 | ||||||||||||||||||
|
|
|
|
| ||||||||||||||||
Total liabilities and shareholders’ equity (deficit) | $ | 358,462 | $ | 358,462 | $ | 329,920 | ||||||||||||||
Total liabilities and shareholders’ equity | $ | 477,941 | $ | 437,206 | ||||||||||||||||
|
|
|
|
| ||||||||||||||||
See accompanying notes to unaudited condensed consolidated financial statements.
TPI COMPOSITES, INC. AND SUBSIDIARIES
Condensed Consolidated Statements of Operations
(In thousands, except per share data)
Pro Forma | Three Months Ended | Three Months Ended March 31, | ||||||||||||||||||
2016 | 2016 | 2015 | 2017 | 2016 | ||||||||||||||||
(Unaudited) | (Unaudited) | |||||||||||||||||||
Net sales | $ | 176,110 | $ | 176,110 | $ | 95,589 | ||||||||||||||
Net sales (Note 3) | $ | 191,602 | $ | 176,110 | ||||||||||||||||
|
|
|
|
| ||||||||||||||||
Cost of sales | 159,866 | 159,866 | 90,884 | 167,423 | 159,866 | |||||||||||||||
Startup and transition costs | 3,306 | 3,306 | 4,154 | 6,159 | 3,306 | |||||||||||||||
|
|
|
|
| ||||||||||||||||
Total cost of goods sold | 163,172 | 163,172 | 95,038 | 173,582 | 163,172 | |||||||||||||||
|
|
|
|
| ||||||||||||||||
Gross profit | | 12,938 | | 12,938 | 551 | 18,020 | 12,938 | |||||||||||||
General and administrative expenses | 4,749 | 4,749 | 3,208 | 8,306 | 4,749 | |||||||||||||||
|
|
|
|
| ||||||||||||||||
Income (loss) from operations | 8,189 | 8,189 | (2,657 | ) | ||||||||||||||||
Income from operations | 9,714 | 8,189 | ||||||||||||||||||
|
|
|
|
| ||||||||||||||||
Other income (expenses): | ||||||||||||||||||||
Other income (expense): | ||||||||||||||||||||
Interest income | 21 | 21 | 59 | 19 | 21 | |||||||||||||||
Interest expense | (3,912 | ) | (3,912 | ) | (3,551 | ) | (3,026 | ) | (3,912 | ) | ||||||||||
Realized gain (loss) on foreign currency remeasurement | (439 | ) | (439 | ) | 163 | |||||||||||||||
Realized loss on foreign currency remeasurement | (1,381 | ) | (439 | ) | ||||||||||||||||
Miscellaneous income | 190 | 190 | 129 | 320 | 190 | |||||||||||||||
|
|
|
|
| ||||||||||||||||
Total other expense | (4,140 | ) | (4,140 | ) | (3,200 | ) | (4,068 | ) | (4,140 | ) | ||||||||||
|
|
|
|
| ||||||||||||||||
Income (loss) before income taxes | 4,049 | 4,049 | (5,857 | ) | ||||||||||||||||
Income tax benefit (provision) | (2,303 | ) | (2,303 | ) | 120 | |||||||||||||||
Income before income taxes | 5,646 | 4,049 | ||||||||||||||||||
Income tax provision | (2,101 | ) | (2,303 | ) | ||||||||||||||||
|
|
|
|
| ||||||||||||||||
Net income (loss) | 1,746 | 1,746 | (5,737 | ) | ||||||||||||||||
Net income | 3,545 | 1,746 | ||||||||||||||||||
Net income attributable to preferred shareholders | — | 2,437 | 2,356 | — | 2,437 | |||||||||||||||
|
|
|
|
| ||||||||||||||||
Net income (loss) attributable to common shareholders | $ | 1,746 | $ | (691 | ) | $ | (8,093 | ) | $ | 3,545 | $ | (691 | ) | |||||||
|
|
|
|
| ||||||||||||||||
Weighted-average common shares outstanding | ||||||||||||||||||||
Basic and diluted | 4,238 | 4,238 | ||||||||||||||||||
Net loss per common share | ||||||||||||||||||||
Basic and diluted | $ | (0.16 | ) | $ | (1.91 | ) | ||||||||||||||
Pro forma weighted-average common shares outstanding (unaudited) | ||||||||||||||||||||
Weighted-average common shares outstanding: | ||||||||||||||||||||
Basic | 25,531 | 33,737 | 4,238 | |||||||||||||||||
Diluted | 25,553 | 33,827 | 4,238 | |||||||||||||||||
Pro forma net income per common share (unaudited) | ||||||||||||||||||||
Net income (loss) per common share: | ||||||||||||||||||||
Basic | $ | 0.07 | $ | 0.11 | $ | (0.16 | ) | |||||||||||||
Diluted | $ | 0.07 | $ | 0.10 | $ | (0.16 | ) | |||||||||||||
See accompanying notes to unaudited condensed consolidated financial statements.
TPI COMPOSITES, INC. AND SUBSIDIARIES
Condensed Consolidated Statements of Comprehensive Income (Loss)
(In thousands)
Three Months Ended | ||||||||
2016 | 2015 | |||||||
| (Unaudited) | ||||||||
Net income (loss) | $ | 1,746 | $ | (5,737 | ) | |||
Other comprehensive income (loss): | ||||||||
Foreign currency translation adjustments | 428 | (1,328 | ) | |||||
|
|
|
| |||||
Comprehensive income (loss) | $ | 2,174 | $ | (7,065 | ) | |||
|
|
|
| |||||
| Three Months Ended March 31, | ||||||||
| 2017 | 2016 | |||||||
| (Unaudited) | ||||||||
Net income | $ | 3,545 | $ | 1,746 | ||||
Other comprehensive income: | ||||||||
Foreign currency translation adjustments | 277 | 428 | ||||||
|
|
|
| |||||
Comprehensive income | $ | 3,822 | $ | 2,174 | ||||
|
|
|
| |||||
See accompanying notes to unaudited condensed consolidated financial statements.
TPI COMPOSITES, INC. AND SUBSIDIARIES
Condensed Consolidated Statements of Cash Flows
(In thousands)
Three Months Ended | Three Months Ended March 31, | |||||||||||||||
2016 | 2015 | 2017 | 2016 | |||||||||||||
| (Unaudited) | (Unaudited) | |||||||||||||||
Cash flows from operating activities: | ||||||||||||||||
Net income (loss) | $ | 1,746 | $ | (5,737 | ) | |||||||||||
Adjustments to reconcile net income (loss) to net cash provided by (used in) operating activities: | ||||||||||||||||
Net income | $ | 3,545 | $ | 1,746 | ||||||||||||
Adjustments to reconcile net income to net cash provided by (used in) operating activities: | ||||||||||||||||
Depreciation and amortization | 3,011 | 2,401 | 3,829 | 3,011 | ||||||||||||
Share-based compensation expense | 1,707 | — | ||||||||||||||
Amortization of debt issuance costs | 143 | 412 | ||||||||||||||
Amortization of debt discount | 755 | 684 | — | 755 | ||||||||||||
Amortization of debt issuance costs | 412 | 312 | ||||||||||||||
Changes in assets and liabilities: | ||||||||||||||||
Accounts receivable | (14,119 | ) | (3,802 | ) | (28,722 | ) | (14,119 | ) | ||||||||
Inventories | (5,274 | ) | (13,478 | ) | (15,220 | ) | (5,274 | ) | ||||||||
Prepaid expenses and other current assets | (8,346 | ) | (5,310 | ) | 6,816 | (8,346 | ) | |||||||||
Other noncurrent assets | (2,959 | ) | (835 | ) | 5,871 | (2,959 | ) | |||||||||
Accounts payable and accrued expenses | 6,801 | 10,232 | 11,211 | 6,801 | ||||||||||||
Accrued warranty | 14,339 | (40 | ) | 1,983 | 14,339 | |||||||||||
Customer deposits | 2,542 | (4,068 | ) | 4,827 | 2,542 | |||||||||||
Deferred revenue | (493 | ) | 20,409 | 19,751 | (493 | ) | ||||||||||
Other noncurrent liabilities | 446 | 61 | 197 | 446 | ||||||||||||
|
|
|
| |||||||||||||
Net cash provided by (used in) operating activities | (1,139 | ) | 829 | 15,938 | (1,139 | ) | ||||||||||
|
|
|
| |||||||||||||
Cash flows from investing activities: | ||||||||||||||||
Purchase of property and equipment | (10,888 | ) | (10,605 | ) | (16,922 | ) | (10,888 | ) | ||||||||
|
|
|
| |||||||||||||
Net cash used in investing activities | (10,888 | ) | (10,605 | ) | (16,922 | ) | (10,888 | ) | ||||||||
|
|
|
| |||||||||||||
Cash flows from financing activities: | ||||||||||||||||
Repayment of term loan | (938 | ) | — | |||||||||||||
Net proceeds from (repayments of) accounts receivable financing | 6,800 | (6,144 | ) | (1,233 | ) | 6,800 | ||||||||||
Proceeds from working capital loans | — | 5,540 | ||||||||||||||
Repayments of working capital loans | (4,958 | ) | (5,611 | ) | ||||||||||||
Proceeds from (repayments of) other debt | (1,192 | ) | 348 | |||||||||||||
Payment on acquisition of noncontrolling interest | — | (625 | ) | |||||||||||||
Net proceeds from (repayments of) working capital loans | 517 | (4,958 | ) | |||||||||||||
Net repayments of other debt | (1,155 | ) | (1,192 | ) | ||||||||||||
Proceeds from customer advances | 2,000 | — | — | 2,000 | ||||||||||||
Restricted cash | (647 | ) | (676 | ) | 331 | (647 | ) | |||||||||
|
|
|
| |||||||||||||
Net cash provided by (used in) financing activities | 2,003 | (7,168 | ) | (2,478 | ) | 2,003 | ||||||||||
|
|
|
| |||||||||||||
Impact of foreign exchange rates on cash and cash equivalents | (51 | ) | (86 | ) | (63 | ) | (51 | ) | ||||||||
|
|
|
| |||||||||||||
Net change in cash and cash equivalents | (10,075 | ) | (17,030 | ) | (3,525 | ) | (10,075 | ) | ||||||||
Cash and cash equivalents, beginning of year | 45,917 | 43,592 | 119,066 | 45,917 | ||||||||||||
|
|
|
| |||||||||||||
Cash and cash equivalents, end of period | $ | 35,842 | $ | 26,562 | $ | 115,541 | $ | 35,842 | ||||||||
|
|
|
| |||||||||||||
Supplemental disclosures of cash flow information: | ||||||||||||||||
Cash paid for interest | $ | 2,565 | $ | 2,341 | $ | 2,899 | $ | 2,565 | ||||||||
Cash paid for income taxes, net | 1,426 | 607 | 4,146 | 1,426 | ||||||||||||
Supplemental disclosures of noncash investing and financing activities: | ||||||||||||||||
Accrued capital expenditures in accounts payable | 760 | 703 | 2,569 | 760 | ||||||||||||
See accompanying notes to unaudited condensed consolidated financial statements.
TPI COMPOSITES, INC. AND SUBSIDIARIES
Notes to Unaudited Condensed Consolidated Financial Statements
Note 1. Summary of Operations and Significant Accounting Policies
Description of Business and Basis of Presentation
TPI Composites, Inc. is the holding company that conducts substantially all of its business operations through its direct and indirect subsidiaries (collectively, the Company). The Company was founded in 1968 and has been providingproducing composite wind blades for 15 years.since 2001. The Company’s knowledge and experience of composite materials and manufacturing originates with its predecessor company, Tillotson Pearson Inc., a leading manufacturer of high-performance sail and powerboats along with a wide range of composite structures used in other industrial applications. Following the separation from the boat building business in 2004, the Company reorganized in Delaware as LCSI Holding, Inc. The Companyand then changed its corporate name to TPI Composites, Inc. in 2008. Today, the Company is headquartered in Scottsdale, Arizona and has expanded its global footprint to include domestic facilities in Newton, Iowa; Fall River, Massachusetts; Warren, Rhode Island and Santa Teresa, New Mexico and international facilities in Dafeng, China; Taicang Port, China; Taicang City, China; Juarez,Juárez, Mexico and Izmir, Turkey. In April 2017, the Company entered into a multiyear supply agreement with Vestas Wind Systems A/S (Vestas) to supply wind blades from two manufacturing lines at a new manufacturing facility that will be constructed in Matamoros, Mexico. The Company expects this new manufacturing facility will commence operations in the first half of 2018.
Initial Public Offering and Stock Split
In July 2016, the Company completed an initial public offering (IPO) of 7,187,500 shares of the Company’s common stock at a price of $11.00 per share, which included 937,500 shares issued pursuant to the underwriters’ over-allotment option. Certain of the Company’s existing shareholders, a director and executive officers purchased an aggregate of 1,250,000 shares of common stock in the IPO included in the total issuance above. The net proceeds from the IPO were $67.2 million after deducting underwriting discounts and offering expenses. Immediately prior to the closing of the IPO, all shares of the then-outstanding redeemable preferred shares converted into an aggregate of 21,110,204 shares of common stock and the redeemable preferred share warrants converted on a net issuance basis into 120,923 shares of common stock. In addition, concurrent with the closing of the IPO, certain subordinated convertible promissory notes in the aggregate principal and interest amount of $11.9 million were converted into 1,079,749 shares of common stock at the public offering price of $11.00 per share.
Prior to the IPO, in July 2016 the Company amended its amended and restated certificate of incorporation to effect a360-for-1 forward stock split of its common stock. As a result of the stock split, the Company has adjusted the share amounts authorized and issuable under the share-based compensation plans. All share and per share common stock information (including the share-based compensation plans) referenced throughout the unaudited condensed consolidated financial statements and notes thereto have been retroactively adjusted to reflect this stock split. The stock split did not cause an adjustment to the par value of the authorized shares of common stock.
Basis of Presentation
The Company divides its business operations into four geographic operating segments—the United States, Asia, Mexico and EMEA,the Middle East and Africa (EMEA), as follows:
The U.S. segment includes (1) the manufacturing of wind blades at the Newton, Iowa plant, (2) the manufacturing of precision molding and assembly systems used for the manufacture of wind blades in the Warren, Rhode Island facility, (3) the manufacturing of composite solutions for the transportation industry, which the Company also conducts in its Rhode Island and Massachusetts facilities and (4) corporate headquarters, the costs of which are included in general and administrative expenses.
TPI COMPOSITES, INC. AND SUBSIDIARIES
Notes to Unaudited Condensed Consolidated Financial Statements
in the Warren, Rhode Island facility, (3) the manufacturing of composite solutions for the transportation industry, which the Company also conducts in its Rhode Island and Massachusetts facilities and (4) its corporate headquarters, the costs of which are included in general and administrative expenses. |
The Company has an accumulated deficit of $191.9 million as of March 31, 2016 resulting from recurring losses from operations and the accretion to the redemption value and cumulative dividends associated with redeemable preferred shares. The Company has funded operations primarily with cash flows from operations and debt and equity financings from investors. The accompanying consolidated financial statements include the accounts of TPI Composites, Inc. and all majority owned subsidiaries. All significant intercompany transactions and balances have been eliminated.
TPI COMPOSITES, INC. AND SUBSIDIARIES
Notes to Unaudited Condensed Consolidated Financial Statements
The condensed consolidated financial statements included herein have been prepared by the Company without audit, pursuant to the rules and regulations of the United States Securities and Exchange Commission (SEC) and should be read in conjunction with the audited consolidated financial statements for the year ended December 31, 2015.2016 included in the Company’s Annual Report onForm 10-K. Certain information and footnote disclosures normally included in financial statements prepared in accordance with accounting principles generally accepted in the United States (GAAP) have been condensed or omitted, as permitted by the SEC, although the Company believes the disclosures that are made are adequate to make the information presented herein not misleading. The accompanying condensed consolidated financial statements reflect, in the opinion of management, all normal recurring adjustments necessary to present fairly the Company’s financial position at March 31, 2016,2017, and the results of the Company’s operations, comprehensive lossincome and cash flows for the periods presented. The Company derived the December 31, 20152016 condensed consolidated balance sheet data from audited financial statements, but does not include all disclosures required by GAAP. Interim results for the three months ended March 31, 20162017 and 20152016 are not necessarily indicative of the results to be expected for the full year.years.
Warranty Expense
The Company provides a limited warranty for its precision molding and assembly systemsmold and wind blade products, including parts and labor, with terms and conditions that vary depending on the product sold, for periods that range from two to five years. Warranty expense is recorded based upon estimates of future repairs using a probability-based methodology. Once the warranty period has expired, any remaining unused warranty accrual for the specific products is reversed against the current year warranty expense amount.
TPI COMPOSITES, INC. AND SUBSIDIARIES
Notes to Unaudited Condensed Consolidated Financial Statements
Warranty accrual at March 31 consisted of the following (in thousands):
| 2017 | ||||||||
Warranty accrual at beginning of year | $ | 13,596 | $ | 19,912 | ||||
Accrual during the period | 14,885 | 3,447 | ||||||
Cost of warranty services provided during the period and reduction of reserves | (546 | ) | ||||||
Cost of warranty services provided during the period | (196 | ) | ||||||
Reversal of reserves upon warranty expiration | (1,268 | ) | ||||||
|
| |||||||
Warranty accrual at end of period | $ | 27,935 | ||||||
Warranty accrual at end of the period | $ | 21,895 | ||||||
|
| |||||||
Net Income (Loss)Attributable to Preferred Shareholders
Net income attributable to preferred shareholders related to the accrual of dividends on our convertible and senior redeemable preferred shares, the accretion to redemption amounts on our convertible preferred shares and warrant fair value adjustment. Immediately prior to the closing of our IPO, all preferred shares were converted into shares of our common stock and as a result, the accrual of dividends ceased.
Net Income Per Share Calculation
The basic net income (loss) per common share is computed by dividing the net income (loss) by the weighted-average number of common shares outstanding during a period. Diluted net income per common share is computed by dividing the net income, adjusted on anas-if-converted basis, by the weighted-average number of common shares outstanding plus potentially dilutive securities. The table below reflects the calculation of the weighted-average number of common shares outstanding, on an as if converted basis, used in computing basic and diluted earnings per common share (in thousands):
| Three Months Ended March 31, | ||||||||
| 2017 | 2016 | |||||||
Basic weighted-average shares outstanding | 33,737 | 4,238 | ||||||
Effect of dilutive stock options and warrants | 90 | — | ||||||
|
|
|
| |||||
Diluted weighted-average shares outstanding | 33,827 | 4,238 | ||||||
|
|
|
| |||||
The Company has otherdid not have any potentially dilutive securities outstanding that are not shownincluded in athe diluted net income per share calculation for the quarter ended March 31, 2017. The Company had 6,000 potentially dilutive securities outstanding during the three months ended March 31, 2016 that are not included in the diluted net loss per share calculation in 2015 because their effect would be anti-dilutive. TheseThe potentially dilutive securities excluded from the calculation include common shares issued upon conversion or exercise of convertible and redeemable preferred shares, options and warrants. At
Assuming that the IPO had occurred on January 1, 2016, diluted earnings per share would have been a loss of $0.02 for the three months ended March 31, 2016, assuming an event other than a qualified initial public offering,2016.
Use of Estimates
The preparation of these securities included convertible preferred sharescondensed consolidated financial statements in conformity with GAAP requires management to make estimates and assumptions that affect the reported amounts of 4,477,240, warrantsassets and liabilities and disclosure of 119,784contingent assets and stock optionsliabilities at the date of 25,828 for a totalthe condensed consolidated financial statements and the reported amounts of 4,622,852 dilutive securities. At March 31, 2015, assuming an event other than a qualified initial public offering, these securities included convertible preferred shares of 4,477,240, warrants of 119,784revenues and stock options of 35,703 for a total of 4,632,727 dilutive securities.expenses during the reporting period. Actual results could differ from those estimates.
TPI COMPOSITES, INC. AND SUBSIDIARIES
Notes to Unaudited Condensed Consolidated Financial Statements
Unaudited Pro Forma Shareholders’ Equity (Deficit)
Immediately prior to the closing of a qualifying initial public offering, all of the outstanding shares of convertible preferred shares will automatically convert into shares of common stock. In addition, the outstanding redeemable preferred share warrants will be converted into common stock upon effectiveness of a qualifying initial public offering. The unaudited pro forma shareholders’ equity information, as set forth in the accompanying condensed consolidated balance sheets, gives effect to the automatic conversion of all outstanding shares of convertible preferred share and preferred share warrants as of March 31, 2016. The shares of common stock issuable and the proceeds expected to be received in a qualified initial public offering are excluded from such pro forma information.
Recently Issued Accounting Pronouncements
Simplifying the Presentation of Debt Issuance CostsAccounting Pronouncements Adopted in 2017
In April 2015,March 2016, the Financial Accounting Standards Board (FASB) issued Accounting Standards Update (ASU) 2015-03,2016-09,SimplifyingCompensation – Stock Compensation: Improvement to Employee Share-Based Payment Accounting, to simplify certain aspects of the Presentationaccounting for share-based payment transactions to employees. The new standard requires excess tax benefits and tax deficiencies to be recorded in the consolidated statements of Debt Issuance Costs. ASU 2015-03 required that debt issuance costsoperations as a component of the provision for income taxes when stock awards vest or options are exercised. In addition, it eliminates the requirement to reclassify cash flows related to excess tax benefits from operating activities to financing activities on the consolidated statements of cash flows. Further, the standard provides an accounting policy election to account for forfeitures as they occur, allows us to withhold more of an employee’s vesting shares for tax withholding purposes without triggering liability accounting, and clarifies that all cash payments made to tax authorities on an employee’s behalf for withheld shares should be presented as a recognized debt liability befinancing activity on the Company’s consolidated statements of cash flows.
The Company adopted ASU 2016-09 in the first quarter of 2017 using the modified retrospective transition method through a cumulative effect adjustment to equity as of January 1, 2017. Upon adoption, the Company elected to eliminate application of a forfeiture assumption to share based compensation expense and account for forfeitures as they occur over the vesting period. The cumulative effect of this change increased additional paid-in capital and decreased retained earnings as of January 1, 2017 by $0.7 million, net of tax. The Company did not have any previously unrecognized excess tax effects that had not been recorded as a reduction to the tax liability.
The Company did not have any vesting of restricted stock units or stock option exercises during the periods presented in the balance sheet as a direct deduction fromaccompanying financial statements; therefore, the carrying amountprovisions of that debt liability, consistent with debt discounts. ASU 2015-03 was effectivethe standard relating to the cash flow presentation and income taxes did not impact the statements of cash flows nor the income tax provision for the first interim period for fiscal years beginning after December 15, 2015. Consequently, during the three months ended March 31, 2016, the Company adopted ASU 2015-03 on2017. The inclusion of excess tax benefits and deficiencies as a retrospective basis, which resulted in the reclassificationcomponent of the noncurrent debt issuance cost assetCompany’s income tax expense in future periods will increase volatility within the provision for income taxes as the amount of excess tax benefits or deficiencies from share-based compensation awards are dependent on the December 31, 2015 consolidated balance sheet, which decreased total assets by $4.2 million and decreased total liabilities from $326.5 million to $322.3 million, to conform toCompany’s stock price at the current presentation. The adoption of this guidance did not have a material impactdate the restricted awards vest, the stock price on the financial condition, resultsdate an option is exercised, and the quantity of operations or disclosures of the Company. See Note 7,Long Term Debt, Net of Debt Issuance Costs and Discount.options exercised.
Revenue from Contracts with Customers
In May 2014, the FASB issued ASU2014-09,Revenue from Contracts with Customers, (Topic 606), which provides new recognition and disclosure requirements for revenue from contracts with customers that supersedes the existing revenue recognition guidance. The new recognition requirements focus on when the customer obtains control of the goods or services, rather than the current risks and rewards model of recognition. The core principle of the new standard is that an entity will recognize revenue when it transfers goods or services to its customers in an amount that reflects the consideration an entity expects to be entitled to for those goods or services. The new disclosure requirements will include information intended to communicate the nature, amount, timing and any uncertainty of revenue and cash flows from the applicable contracts, including any significant judgments and changes in judgments and assets recognized from the costs to obtain or fulfill a contract. Entities will generally be required to make more estimates and use more judgment under the new standard.
The new requirements are effective for the Company beginning January 1, 2018, and may be implemented either retrospectively for all periods presented, or as a cumulative-effect adjustment as of the date of adoption. Early adoption as of January 1, 2017 is permitted.
TPI COMPOSITES, INC. AND SUBSIDIARIES
Notes to Unaudited Condensed Consolidated Financial Statements
The Company expects to adopt Topic 606 as of January 1, 20172018 with retrospective application to January 1, 2015.2016 through December 31, 2017. Based on the Company’s preliminary evaluation of the new standard, revenue recognition in accordance with Topic 606 differs from the current guidance provided by GAAP as outlined in the SEC’s Staff Accounting Bulletin 104, which requires the Company to defer recognition of revenue until the risk of loss has
TPI COMPOSITES, INC. AND SUBSIDIARIES
Notes to Unaudited Condensed Consolidated Financial Statements
passed to the customer and delivery has been made or a fixed delivery schedule has been provided by the customer. Since the Company’s products have no alternative use to the Company due to contractual restrictions placed by each customer on the technical specifications and design of the products, the Company’s initialpreliminary assessment is that revenue upon adoption of Topic 606 will likely be recognized over time during the course of the production process and before the product is delivered. Accordingly,delivered to the customer.
The Company expects that the adoption of Topic 606 will have a material impact on the amount of net sales, cost of goods sold and income from operations reported in the consolidated statements of operations in future periods. In accordance with Topic 606, revenues will be recognized over the time period of the production process, whereas currently it is recognized upon delivery to the client. Further, since revenue will be recognized over time for manufacturing contracts, future net sales will include amounts related to products that are in production as of the period end. Finally, the gross margin realized in the period may be impacted by the changes related to the timing and amount of revenue recognized for products in the production process.
The changes noted above involving the timing of revenue recognition underwill materially impact the amount of reported assets and liabilities associated with our manufacturing contracts. Upon adoption of Topic 606, maythe Company will include amounts recognized in revenue for products in production in contract assets, which differs from the current practice of including the balances in inventory and will include an amount for the margin recognized to date. The Company believes that it will no longer require the Company to record deferred revenue andreport inventory held for customer orders for products awaiting deliverysince revenue will be recognized over time during the course of the production process and before the product is delivered to the customer. The Company expects that contract liabilities will be reported for amounts collected from customers in advance of the production of products. The Company also expects that the amount of deferred revenue will be substantially reduced as revenue for products will be recognized over time.
The Company does not anticipate a change in the timing of cash receipts and payments from customers as customers will continue to be able to quantifyinvoiced as products are completed; however, the impact to the amounts reported in the consolidated statements of cash flows operating activities upon application of Topic 606 is expected to be material.
The Company has a project plan in place for the transition to revenue recognition in accordance with Topic 606 including necessary changes to accounting processes and procedures, the chart of accounts, the system of internal control and retrospective application of the standard to periods beginning January 1, 2016 through December 31, 2017. The Company expects to complete the plan in time to report in accordance with Topic 606 for the first quarterly filing on Form10-Q for the period ended March 31, 2018.
Cash Flow Presentation
In August 2016, the FASB issued ASU2016-15,Classification of Certain Cash Receipts and Cash Payments, that clarifies how certain cash receipts and cash payments are presented and classified in the consolidated statement of cash flows. In addition, in November 2016, the FASB issued ASU2016-18,Restricted Cash, that requires restricted cash and cash equivalents to be included with the amount of cash and cash equivalents that are reconciled to on the consolidated statement of cash flows. These ASUs are effective for annual and interim periods beginning after December 15, 2017. Early adoption is permitted. The Company does not believe that the adoption of Topic 606ASU2016-15 and2016-18 on January 1, 2018 will have a material effect on the Company’s financial position or results of operationsoperations.
TPI COMPOSITES, INC. AND SUBSIDIARIES
Notes to Unaudited Condensed Consolidated Financial Statements
Leases
In February 2016, the FASB issued ASU2016-02,Leases. ASU2016-02 is a comprehensive new recognition model for leases requiring a lessee to recognize the asset and liability that arise from leases. For public companies, the amendment is effective for financial statements issued for annual periods beginning after December 16, 2018. Entities may elect to early adopt the lease standard in 2016. In adopting ASU2016-02, entities are required to recognize and measure leases at the beginning of the earliest period presented using a modified retrospective approach. The modified retrospective approach includes a number of optional practical expedients that entities may elect to apply. Management is evaluating the provisions of ASU2016-02 and has not yet selected a transition method nor determined what impact the adoption of ASU2016-02 will have on the Company’s financial position or results of operations.
Financial Instruments
In June 2016, the FASB issued ASU2016-13,Financial Instruments – Credit Losses: Measurement of Credit Losses on Financial Instruments. ASU2016-13 revises the accounting requirements related to the measurement of credit losses on financial instruments and the amountstiming of when such losses are recorded. ASU2016-13 is effective for fiscal years, and disclosures included ininterim periods within those years, beginning after December 15, 2019. Early adoption is permitted for fiscal years and interim periods within those years, beginning after December 15, 2018. Accordingly, ASU2016-13 is effective for the Company on January 1, 2020 using a modified retrospective approach, and the Company is currently evaluating the impact that the standard will have on the Company’s financial statements in the second quarterposition and results of 2016.
There have been no other recent accounting pronouncements or changes in accounting pronouncements during the current year that are of significance, or potential significance, to the Company.operations.
Note 2. Significant Risks and Uncertainties
The Company’s revenues and receivables are from a small number of customers. As such, the Company’s production levels are dependent on these customers’ orders. See note 12,11,Concentration of CustomersCustomers..
The Company maintains its U.S. cash in bank deposit accounts that, at times, exceed U.S. federally insured limits. U.S. bank accounts are guaranteed by the Federal Deposit Insurance Corporation (FDIC) in an amount up to $250,000 during 20162017 and 2015.2016. At March 31, 20162017 and December 31, 2015,2016, the Company had $26.7$97.8 million and $33.2$103.4 million, respectively, of cash in deposit accounts in high quality U.S. banks, which was in excess of FDIC limits. The Company has not experienced losses in any such accounts.
The Company also maintains cash in bank deposit accounts outside the U.S. with no deposit insurance. This includes $0.8$14.8 million in China, $1.9 million in Turkey $7.9 million in China and $0.4$1.0 million in Mexico as of March 31, 2016.2017. The Company has not experienced losses in these accounts. The Company also has long-term depositsaccounts in interest bearing accounts of $5.1 million in Mexico as of March 31, 2016.the past.
Note 3. Related-Party Transactions
Related party transactions include transactions between the Company and certain of its affiliates. The following transactions were in the normal course of operations and were measured at the exchange amount, which is the amount of consideration established and agreed to by the parties.
The Company has entered into several agreements with subsidiaries of General Electric Company and its consolidated affiliates (GE) relating to the operation of its business. As a result of these agreements, GE ishas been a debtor, creditor, and holder of preferred shares asand currently is a holder of March 31, 2016 and December 31, 2015.common shares.
As disclosed at note 12,Concentration of Customers, for the three months ended March 31, 2016 and 2015, the Company recorded related-party sales with GE of $96.2 million and $50.8 million, respectively.
TPI COMPOSITES, INC. AND SUBSIDIARIES
Notes to Unaudited Condensed Consolidated Financial Statements
The Company has entered into fourfive separate supply agreements with GE to manufacture wind blades in Newton, Iowa; Taicang Port, China; Juárez, Mexico (2) and Izmir, Turkey. As a result of the supply agreements, GE is the Company’s largest customer. As disclosed at note 11,Concentration of Customers, for the three months ended March 31, 2017 and 2016, the Company recorded related-party sales with GE of $84.9 million and $96.2 million, respectively. As of March 31, 20162017 and December 31, 2015,2016, the Company had accounts receivables related to sales to GE of approximately $23.2$25.1 million and $19.0$16.6 million, respectively.
Since 2007, the Company has issued threemultiple series of preferred shares. In connection with theshares, including several preferred share issuances to GE. Immediately prior to the closing of the IPO, all shares of the then-outstanding preferred shares were converted into shares of common stock. As a result of these transactions, GE owned 8.4% of the Company’s outstanding common stock as of March 31, 2017.
In January 2016, the Company sold Series B, Series B-1,entered into an agreement with GE and senior redeemable preferredreceived an advance of $2.0 million, which the Company repaid in full in August 2016.
Certain of the Company’s existing stockholders, consisting of entities associated with Element Partners, Angeleno Group and Landmark Partners, each of which is an affiliate of a member of the board of directors, as well as certain executive officers and a director, purchased an aggregate of 1,250,000 shares to GE. As aof common stock in the IPO. In addition, all outstanding obligations and accrued interest under the Company’s subordinated convertible promissory notes held by certain existing stockholders, including Element Partners, Angeleno Group and Landmark Partners, were converted into an aggregate of 1,079,749 shares of common stock concurrent with the closing of the IPO at the public offering price of $11.00 per share.
Note 4. Accounts Receivable
Accounts receivable consisted of the following (in thousands):
| March 31, 2017 | December 31, 2016 | |||||||
Trade accounts receivable | $ | 93,979 | $ | 66,612 | ||||
Other accounts receivable | 2,585 | 1,230 | ||||||
|
|
|
| |||||
Total accounts receivable | $ | 96,564 | $ | 67,842 | ||||
|
|
|
| |||||
Note 5. Inventories
Inventories consisted of the following (in thousands):
| March 31, 2017 | December 31, 2016 | |||||||
Raw materials | $ | 26,551 | $ | 29,278 | ||||
Work in process | 23,915 | 21,169 | ||||||
Finished goods | 1,481 | 2,648 | ||||||
|
|
|
| |||||
Total inventories | $ | 51,947 | $ | 53,095 | ||||
|
|
|
| |||||
TPI COMPOSITES, INC. AND SUBSIDIARIES
Notes to Unaudited Condensed Consolidated Financial Statements
result of these transactions, GE beneficially owns approximately 1,956 preferred shares of the Company as of March 31, 2016. Upon conversion to common shares concurrent with an initial public offering, GE will own 2,842,829 common shares or 11.2% of the Company’s common stock expected to be outstanding at the time of an initial public offering. See note 8,Convertible and Senior Redeemable Preferred Shares and Warrants.
Note 4. Accounts Receivable
Accounts receivable consisted of the following (in thousands):
March 31, | December 31, | |||||||
Trade accounts receivable | $ | 84,766 | $ | 71,588 | ||||
Other accounts receivable | 2,266 | 1,325 | ||||||
|
|
|
| |||||
Total accounts receivable | $ | 87,032 | $ | 72,913 | ||||
|
|
|
| |||||
Note 5. Inventories
Inventories consisted of the following (in thousands):
March 31, | December 31, | |||||||
Raw materials | $ | 29,245 | $ | 29,022 | ||||
Work in process | 22,742 | 16,630 | ||||||
Finished goods | 2,849 | 5,189 | ||||||
|
|
|
| |||||
Total Inventories | $ | 54,836 | $ | 50,841 | ||||
|
|
|
| |||||
Note 6. Property, Plant, and Equipment, Net
Property, plant and equipment, net consisted of the following (in thousands):
March 31, | December 31, | March 31, 2017 | December 31, 2016 | |||||||||||||
Machinery and equipment | $ | 50,276 | $ | 49,078 | $ | 77,330 | $ | 70,481 | ||||||||
Buildings | 13,590 | 13,449 | ||||||||||||||
Leasehold improvements | 17,994 | 16,818 | ||||||||||||||
Office equipment and software | 8,945 | 6,403 | ||||||||||||||
Furniture | 15,442 | 15,140 | 16,412 | 15,883 | ||||||||||||
Leasehold improvements | 14,789 | 14,259 | ||||||||||||||
Buildings | 14,332 | 14,047 | ||||||||||||||
Office equipment and software | 3,818 | 3,691 | ||||||||||||||
Vehicles | 278 | 279 | 348 | 342 | ||||||||||||
Construction in progress | 12,629 | 4,660 | 16,349 | 11,592 | ||||||||||||
|
|
|
| |||||||||||||
Total | 111,564 | 101,154 | 150,968 | 134,968 | ||||||||||||
Accumulated depreciation | (36,621 | ) | (33,422 | ) | ||||||||||||
Accumulated depreciation and amortization | (47,482 | ) | (43,802 | ) | ||||||||||||
|
|
|
| |||||||||||||
Property, plant and equipment, net | $ | 74,943 | $ | 67,732 | $ | 103,486 | $ | 91,166 | ||||||||
|
|
|
| |||||||||||||
Total depreciation and amortization expense for the three months ended March 31, 2017 and 2016 was $3.8 million and 2015 was $3.0 million, respectively.
Note 7. Long-Term Debt, Net of Debt Issuance Costs and $2.2 million, respectively.Current Maturities
Long-term debt, net of debt issuance costs and current maturities, consisted of the following (in thousands):
| March 31, 2017 | December 31, 2016 | |||||||
Senior term loan—U.S. | $ | 74,063 | $ | 75,000 | ||||
Senior revolving loan—U.S. | 2,820 | 2,820 | ||||||
Accounts receivable financing—EMEA | 13,887 | 15,120 | ||||||
Unsecured financing—EMEA | 5,155 | 4,638 | ||||||
Equipment financing—EMEA | 16,112 | 15,813 | ||||||
Equipment capital lease—U.S. | 1,431 | 2,016 | ||||||
Equipment capital lease—EMEA | 1,499 | 1,898 | ||||||
Equipment capital lease—Mexico | 7,580 | 8,037 | ||||||
Equipment loan—Mexico | 89 | 103 | ||||||
|
|
|
| |||||
Total long-term debt | 122,636 | 125,445 | ||||||
Less: Debt issuance costs | (2,147 | ) | (2,290 | ) | ||||
|
|
|
| |||||
Total long-term debt, net of debt issuance costs | 120,489 | 123,155 | ||||||
Less: Current maturities of long-term debt | (32,474 | ) | (33,403 | ) | ||||
|
|
|
| |||||
Long-term debt, net of debt issuance costs and current maturities | $ | 88,015 | $ | 89,752 | ||||
|
|
|
| |||||
Note 8. Share-Based Compensation Plans
The Company has granted stock option awards to certain employees andnon-employee directors under the Amended and Restated 2015 Stock Option and Incentive Plan (the 2015 Plan). Each award granted prior to
TPI COMPOSITES, INC. AND SUBSIDIARIES
Notes to Unaudited Condensed Consolidated Financial Statements
Note 7. Long-Term Debt, Net of Debt Issuance Costs and Discount
Long-term debt, net of debt issuance costs and discount, consistedthe consummation of the following (in thousands):
March 31, | December 31, | |||||||
Senior term loan—U.S. | $ | 74,375 | $ | 74,375 | ||||
Subordinated convertible promissory notes—U.S. | 10,000 | 10,000 | ||||||
Equipment capital lease—U.S. | 2,296 | 2,678 | ||||||
Working capital loans—China | 5,417 | 9,548 | ||||||
Accounts receivable financing—China | 6,191 | 6,622 | ||||||
Accounts receivable financing—Turkey | 27,736 | 20,505 | ||||||
Unsecured financing—Turkey | 7,745 | 8,572 | ||||||
Equipment capital lease—Turkey | 2,509 | 2,879 | ||||||
Equipment loan—Mexico | 150 | 164 | ||||||
Construction financing—Mexico | 789 | 1,204 | ||||||
Equipment capital lease—Mexico | 26 | 37 | ||||||
|
|
|
| |||||
Total long-term debt | 137,234 | 136,584 | ||||||
Less: Debt issuance costs | (3,808 | ) | (4,220 | ) | ||||
Less: Discount on debt | (2,263 | ) | (3,018 | ) | ||||
|
|
|
| |||||
Total long-term debt, net of debt issuance costs and discount | 131,163 | 129,346 | ||||||
Less: Current maturities of long-term debt | (53,637 | ) | (52,065 | ) | ||||
|
|
|
| |||||
Long-term debt, net of debt issuance costs, discount and current maturities | $ | 77,526 | $ | 77,281 | ||||
|
|
|
| |||||
Due to the short-term nature of the working capital loans in China, the Company estimates that fair-value approximates the face value of the notes.
TPI COMPOSITES, INC. AND SUBSIDIARIES
Notes to Unaudited Condensed Consolidated Financial Statements
Note 8. Convertible and Senior Redeemable Preferred Shares and Warrants
Convertible and senior redeemable preferred shares, which are convertible at the discretion of the holder or will automatically convert at the closing of an initial public offering, and warrants consisted of the following (in thousands, except share and par value data):
March 31, | December 31, | |||||||
Series A convertible preferred shares (convertible at 1 share to 3.4974 shares of common stock), $0.01 par value; liquidation preference equal to $51,342; 3,551 shares authorized; 3,551 issued and outstanding at March 31, 2016 and December 31, 2015 | $ | 51,342 | $ | 50,901 | ||||
Series B convertible preferred shares (convertible at 1 share to 3.5636 shares of common stock), $0.01 par value; liquidation preference equal to $41,600; 2,813 shares authorized; 2,287 issued and outstanding at March 31, 2016 and December 31, 2015 | 41,600 | 41,200 | ||||||
Series B-1 convertible preferred shares (convertible at 1 share to 5.0243 shares of common stock), $0.01 par value; liquidation preference equal to $53,030; 2,972 shares authorized; 2,972 shares issued and outstanding at March 31, 2016 and December 31, 2015 | 53,030 | 52,510 | ||||||
Series C convertible preferred shares (convertible at 1 share to 3.2817 shares of common stock), $0.01 par value; liquidation preference equal to $17,670; 2,944 shares authorized; 2,944 shares issued and outstanding at March 31, 2016 and December 31, 2015 | 17,670 | 17,490 | ||||||
Senior redeemable preferred shares (convertible at 1 share to 13.2211 shares of common stock), $0.01 par value; liquidation preference equal to $65,415; 740 shares authorized; 740 shares issued and outstanding at March 31, 2016 and December 31, 2015 | 28,278 | 27,585 | ||||||
Super senior redeemable preferred shares (convertible at 1 share to 13.2211 shares of common stock), $0.01 par value; liquidation preference equal to $22,345; 1,024 shares authorized; 280 shares issued and outstanding at March 31, 2016 and December 31, 2015 | 8,278 | 8,060 | ||||||
Redeemable preferred share warrants; 248 warrants issued and outstanding at March 31, 2016 and December 31, 2015 | 1,084 | 1,084 | ||||||
|
|
|
| |||||
Convertible and senior redeemable preferred shares and warrants: | $ | 201,282 | $ | 198,830 | ||||
|
|
|
| |||||
Cumulative dividends on convertible and senior redeemable preferred shares areIPO included in the liquidation preference amounts noted in the above table. For financial statement presentation purposes, the Company has accreted the preferred share balances to the redemption amount as of the first date redemption can take place using the effective interest method. In addition, the preferred share balance includes cumulative preferred share dividends as required by the preferred share agreements. No accretion has been recorded for preferred shares that are not redeemable for cash on or after a specified date. The amount of the accretion and deemed dividends is included in the net income attributable to preferred shareholders in the condensed consolidated statements of operations.
The Company recorded the warrants noted above at their fair value upon issuance, and will amortize the value of the warrants as interest expense over the term of the preferred share agreement.
TPI COMPOSITES, INC. AND SUBSIDIARIES
Notes to Unaudited Condensed Consolidated Financial Statements
Redeemable Preferred Share Warrants
The details of the warrant activity for the three months ended March 31, 2016 is as follows:
Number of | Weighted-Average | |||||||
Outstanding as of December 31, 2015 | 248 | $ | 8,749 | |||||
2016 grants | — | — | ||||||
2016 exercises | — | — | ||||||
2016 forfeitures | — | — | ||||||
2016 cancellations | — | — | ||||||
2016 expirations | — | — | ||||||
|
| |||||||
Outstanding as of March 31, 2016 | 248 | $ | 8,749 | |||||
|
| |||||||
The warrants are reported at fair value in the accompanying financial statements based on the value of the Series B Preferred Shares that may be purchased.
Common Stock Warrants
In connection with the note purchase agreement dated December 29, 2014 for the purchase of $10.0 million of subordinated convertible promissory notes, 61,720 warrants were issued to purchase common stock with an exercise price equal to the lesser of 85% of the price per share in an initial public offering or $24.30, subject to adjustment. The warrants are immediately exercisable and expire no later than eight years from the date of issuance. The fair value of the warrants was estimated on the date of grant using the Black-Scholes option pricing model assuming a common stock price of $11.03 per share, an exercise price of $9.38 per share, expected stock price volatility of 80 percent and a risk-free interest rate estimate of 0.71 percent.
Note 9. Share-Based Compensation Plans
The Company granted stock option awards during the three months ended March 31, 2016 to certain employees under the 2015 Stock Option and Incentive Plan (the 2015 Plan). Each award includes a performance condition that requiresrequired the completion of an initial public offering (IPO) by the Company and a required vesting period of one to four years commencing upon achievement of the performance condition. TheAs the IPO was consummated in July 2016, the Company will beginbegan recording share-based compensation expense for these awards (as well as those awarded during the year ended December 31, 2015) when the IPO is considered probable of achievement, which will not be deemed to occur until the consummation of the IPO, and therefore no compensation cost will be recognized until the IPO occurs. If an IPO is consummated by the Company, compensation expense will be recordedin July 2016 for the requisite service period from the grant date through the IPO date with the balance of the share-based compensation to be expensed over the remaining vesting period.
TPI COMPOSITES, INC. AND SUBSIDIARIES
NotesAs of March 31, 2017, the unamortized cost of the outstanding restricted stock units was $2.3 million, which the Company expects to Unaudited Condensed Consolidated Financial Statements
recognize in the consolidated financial statements over a weighted-average period of approximately 1.7 years. The total unrecognized cost related tonon-vested stock option awards was $6.0 million as of March 31, 2017. The Company expects to recognize such costs in the consolidated financial statements over a weighted-average period of approximately 2.0 years.
The following table summarizes the activity of the stock options and restricted stock units (RSU) under the Company’s incentive plans between January 1, 2016 and March 31, 2016:plans:
| Stock Options | RSUs | |||||||||||||||||||||||
Shares | Shares | Weighted-Average | Options | Shares | Weighted-Average | |||||||||||||||||||
Balance as of December 31, 2015 | 3,392,141 | 3,261,663 | $ | 11.90 | 35,703 | 731,880 | $ | 10.89 | ||||||||||||||||
Granted | (273,600 | ) | 273,600 | 21.36 | — | — | ||||||||||||||||||
Exercised | — | — | — | — | — | |||||||||||||||||||
Forfeited/cancelled | 264,395 | (186,635 | ) | 10.75 | (77,760 | ) | 10.87 | |||||||||||||||||
|
|
|
|
|
| |||||||||||||||||||
Balance as of March 31, 2016 | 3,382,936 | 3,348,628 | 12.73 | 25,828 | 654,120 | 10.90 | ||||||||||||||||||
|
|
|
|
|
| |||||||||||||||||||
| Stock Options | RSUs | |||||||||||||||||||||||
| Shares Available for Grant | Shares | Weighted- Average Exercise Price | Options Exercisable | Units | Weighted- Average Grant Date Fair Value | |||||||||||||||||||
Balance as of December 31, 2016 | 3,587,692 | 3,331,418 | $ | 12.72 | 25,828 | 636,120 | $ | 10.90 | ||||||||||||||||
Increase in shares authorized | 1,349,475 | — | — | — | — | |||||||||||||||||||
Forfeited/cancelled | 21,600 | (21,600 | ) | 16.53 | — | — | ||||||||||||||||||
|
|
|
|
|
| |||||||||||||||||||
Balance as of March 31, 2017 | 4,958,767 | 3,309,818 | 12.70 | 25,828 | 636,120 | 10.90 | ||||||||||||||||||
|
|
|
|
|
| |||||||||||||||||||
The following table summarizes the outstanding and exercisable stock option awards as of March 31, 2016:2017:
| Options Outstanding | Options Exercisable | Options Outstanding | Options Exercisable | |||||||||||||||||||||||||||||||||||||
Range of Exercise Prices: | Shares | Weighted-Average | Weighted-Average | Shares | Weighted-Average | Shares | Weighted- Average Remaining Contractual Life (in years) | Weighted- Average Exercise Price | Shares | Weighted- Average Exercise Price | ||||||||||||||||||||||||||||||
$8.49 | 25,828 | 3.8 | $ | 8.49 | 25,828 | $ | 8.49 | 25,828 | 2.8 | $ | 8.49 | 25,828 | $ | 8.49 | ||||||||||||||||||||||||||
$10.87 | 2,444,400 | 9.2 | 10.87 | — | — | 2,278,800 | 8.2 | 10.87 | — | — | ||||||||||||||||||||||||||||||
$11.00 - $14.31 | 79,200 | 9.3 | 12.50 | — | — | |||||||||||||||||||||||||||||||||||
$16.53 | 676,800 | 9.7 | 16.53 | — | — | 583,200 | 8.7 | 16.53 | — | — | ||||||||||||||||||||||||||||||
$23.09 | 201,600 | 10.0 | 23.09 | — | — | |||||||||||||||||||||||||||||||||||
$17.68 - $18.70 | 342,790 | 9.2 | 18.68 | — | — | |||||||||||||||||||||||||||||||||||
|
|
|
| |||||||||||||||||||||||||||||||||||||
$8.49 to $23.09 | 3,348,628 | 9.3 | 12.73 | 25,828 | 8.49 | |||||||||||||||||||||||||||||||||||
$8.49 to $18.70 | 3,309,818 | 8.4 | 12.70 | 25,828 | 8.49 | |||||||||||||||||||||||||||||||||||
|
|
|
| |||||||||||||||||||||||||||||||||||||
TPI COMPOSITES, INC. AND SUBSIDIARIES
Notes to Unaudited Condensed Consolidated Financial Statements
Note 10.9. Income Taxes
The incomeIncome tax provision of $2.3expense was $2.1 million and the income tax benefit of $0.1$2.3 million in the three months ended March 31, 2017 and 2016, and 2015, respectively, are consistent with the year end tax provision calculations and arerespectively. Tax expense was primarily due to the operating results in China and Mexico. The United States and Turkey operations have not had a significant change to the full valuation allowances recorded against their net operating loss carryforwardsdeferred tax assets as of year end.December 31, 2016. No changes in tax law since December 31, 20152016 have had a material impact on the Company’s income tax provision.
Note 11.10. Commitments and Contingencies
Legal Proceedings
The Company is involved in various claims and legal actions arising in the ordinary course of business. In the opinion of management, the ultimate disposition of these matters will not have a material adverse effect on the Company’s consolidated financial position, results of operations or liquidity.
In August 2015, a former consultant filed an arbitration claim in China that we improperly terminated his consulting agreement and is demanding that we reinstate his agreement. We believe that our termination of his agreement was valid and we intend to vigorously defend this matter.
TPI COMPOSITES, INC. AND SUBSIDIARIES
Notes to Unaudited Condensed Consolidated Financial Statements
In March 2015, a complaint was filed against the Company by a former employee alleging that the Company had agreed to make certain cash payments to such employee upon any future sale of the Company. The parties completed court-ordered mediation in December 2015 but were not able to reach a settlement. We continue to deny the substantive allegations of the complaint and we intend to vigorously defend this lawsuit; however, we are currently unable to determine the ultimate outcome of this case.
Note 12.11. Concentration of Customers
Revenues from certain customers in excess of 10 percent of total consolidated Company revenues (in thousands) for the three months ended March 31 are as follows:
2016 | 2015 | |||||||||||||||
Customer | Revenues | % of Total | Revenues | % of Total | ||||||||||||
Customer 1 | $ | 96,151 | 54.6 | % | $ | 50,822 | 53.2 | % | ||||||||
Customer 2 | 29,941 | 17.0 | 4,091 | 4.3 | ||||||||||||
Customer 3 | 19,523 | 11.1 | 15,336 | 16.0 | ||||||||||||
Customer 4 | 18,137 | 10.3 | 10,784 | 11.3 | ||||||||||||
Customer 5 | 10,141 | 5.8 | 14,273 | 14.9 | ||||||||||||
Other | 2,217 | 1.2 | 283 | 0.3 | ||||||||||||
|
|
|
|
|
|
|
| |||||||||
Total | $ | 176,110 | 100.0 | % | $ | 95,589 | 100.0 | % | ||||||||
|
|
|
|
|
|
|
| |||||||||
| Three Months Ended March 31, | ||||||||||||||||
| 2017 | 2016 | |||||||||||||||
Customer | Revenues | % of Total | Revenues | % of Total | ||||||||||||
GE | $ | 84,910 | 44.3 | % | $ | 96,151 | 54.6 | % | ||||||||
Vestas | 44,322 | 23.2 | 29,941 | 17.0 | ||||||||||||
Nordex Group | 33,559 | 17.5 | 29,664 | 16.8 | ||||||||||||
Gamesa | 26,262 | 13.7 | 18,137 | 10.3 | ||||||||||||
Other | 2,549 | 1.3 | 2,217 | 1.3 | ||||||||||||
|
|
|
|
|
|
|
| |||||||||
Total | $ | 191,602 | 100.0 | % | $ | 176,110 | 100.0 | % | ||||||||
|
|
|
|
|
|
|
| |||||||||
Trade accounts receivable from certain customers in excess of 10 percent of total consolidated Company trade accounts receivable are as follows:
March 31, | December 31, | |||||||
Customer | % of Total | % of Total | ||||||
Customer 1 | 27.3 | % | 26.5 | % | ||||
Customer 2 | 25.3 | % | 27.9 | % | ||||
Customer 3 | 31.2 | % | 24.4 | % | ||||
Customer 5 | 7.6 | % | 14.9 | % | ||||
| March 31, 2017 | December 31, 2016 | |||||||
Customer | % of Total | % of Total | ||||||
GE | 26.7 | % | 24.9 | % | ||||
Vestas | 36.1 | % | 26.2 | % | ||||
Nordex Group | 30.1 | % | 26.8 | % | ||||
Gamesa | 4.6 | % | 16.2 | % | ||||
Note 13.12. Segment Reporting
FASB ASC Topic 280,Segment Reporting, establishes standards for the manner in which companies report financial information about operating segments, products, services, geographic areas and major customers. In managing the Company’s business, management focuses on growing its revenues and earnings in select geographic areas serving primarily the wind energy market. The Company has operations in the United States, China, Turkey and Mexico. The Company’s operating segments are defined geographically as the United States, Asia, EMEA (Europe, the Middle EastMexico and Africa) and Mexico.EMEA. Financial results are aggregated into four reportable segments based on quantitative thresholds. All of the Company’s segments operate in their local currency except for the MexicoChina and ChinaMexico segments, which both include a U.S. parent company.
TPI COMPOSITES, INC. AND SUBSIDIARIES
Notes to Unaudited Condensed Consolidated Financial Statements
The following tables set forth certain information (in thousands) regarding each of the Company’s segments as of and for the three months ended March 31 (in thousands):segments:
| Three Months Ended March 31, | ||||||||||||||||
2016 | 2015 | 2017 | 2016 | |||||||||||||
Revenues by segment: | ||||||||||||||||
U.S. | $ | 51,761 | $ | 37,376 | $ | 46,540 | $ | 51,761 | ||||||||
Asia | 64,352 | 28,005 | 66,732 | 64,352 | ||||||||||||
Mexico | 46,931 | 25,540 | ||||||||||||||
EMEA | 34,457 | 17,532 | 31,399 | 34,457 | ||||||||||||
Mexico | 25,540 | 12,676 | ||||||||||||||
|
|
|
| |||||||||||||
Total revenues | $ | 176,110 | $ | 95,589 | $ | 191,602 | $ | 176,110 | ||||||||
|
|
|
| |||||||||||||
Revenues by geographic location (1): | ||||||||||||||||
U.S. | $ | 51,761 | $ | 37,376 | $ | 46,540 | $ | 51,761 | ||||||||
China | 64,352 | 28,005 | 66,732 | 64,352 | ||||||||||||
Mexico | 46,931 | 25,540 | ||||||||||||||
Turkey | 34,457 | 17,532 | 31,399 | 34,457 | ||||||||||||
Mexico | 25,540 | 12,676 | ||||||||||||||
|
|
|
| |||||||||||||
Total revenues | $ | 176,110 | $ | 95,589 | $ | 191,602 | $ | 176,110 | ||||||||
|
|
|
| |||||||||||||
Income (loss) from operations: | ||||||||||||||||
U.S. | $ | (661 | ) | $ | (2,222 | ) | ||||||||||
U.S. (2) | $ | (10,111 | ) | $ | (661 | ) | ||||||||||
Asia | 15,542 | 2,520 | 14,704 | 15,542 | ||||||||||||
Mexico | 1,947 | 967 | ||||||||||||||
EMEA | (7,659 | ) | (1,627 | ) | 3,174 | (7,659 | ) | |||||||||
Mexico | 967 | (1,328 | ) | |||||||||||||
|
|
|
| |||||||||||||
Total income (loss) from operations | $ | 8,189 | $ | (2,657 | ) | |||||||||||
Total income from operations | $ | 9,714 | $ | 8,189 | ||||||||||||
|
|
|
| |||||||||||||
March 31, | December 31, | |||||||||||||||
Tangible long-lived assets: | ||||||||||||||||
U.S. | $ | 13,785 | $ | 13,805 | ||||||||||||
Asia (China) | 29,185 | 29,957 | ||||||||||||||
EMEA (Turkey) | 17,530 | 11,370 | ||||||||||||||
Mexico | 14,443 | 12,600 | ||||||||||||||
|
| |||||||||||||||
Total tangible long-lived assets | $ | 74,943 | $ | 67,732 | ||||||||||||
|
| |||||||||||||||
| March 31, 2017 | December 31, 2016 | |||||||
Property, plant and equipment, net: | ||||||||
U.S. | $ | 17,450 | $ | 16,740 | ||||
Asia (China) | 27,462 | 26,341 | ||||||
Mexico | 35,634 | 24,842 | ||||||
EMEA (Turkey) | 22,940 | 23,243 | ||||||
|
|
|
| |||||
Total property, plant and equipment, net | $ | 103,486 | $ | 91,166 | ||||
|
|
|
| |||||
| (1) | Revenues are attributable to countries based on the location where the product is manufactured or the services are performed. |
| (2) | The losses from operations in the U.S. segment includes corporate general and administrative costs of $8.3 million and $4.7 million for the three months ended March 31, 2017 and 2016, respectively. |
Note 14.13. Subsequent Events
In May 2016,April 2017, the Company entered into a new three-year collective bargainingmultiyear supply agreement with Vestas to supply wind blades from two manufacturing lines at a new manufacturing facility that will be constructed in Matamoros, Mexico. The Company also granted Vestas an option to add additional manufacturing lines to the employees atscope of the Company’s Turkey facility.supply agreement. The Company expects this new manufacturing facility will commence operations in the first half of 2018 and that the new agreement will result in an average increase in pay of approximately 20% for employees covered by the agreement.
In June 2016, the Company entered into a settlement agreement and release with one of its customers to resolve a potential warranty claim related to wind blades produced at this manufacturing facility will primarily manufacturedserve wind markets in 2014 in the Company’s Turkey facility. The settlement agreementMexico, Central America and release requires the Company to make a cash payment to the customer, replace or repair a specified number of wind blades and provide margin concessions on certain products to be produced by the Company. The expected aggregate cost to the Company of fulfilling its obligations under the settlement agreement and release is estimated to be $15.0 million, all of which has been accrued as of March 31, 2016.South America.
TPI COMPOSITES, INC. AND SUBSIDIARIES
Notes to Unaudited Condensed Consolidated Financial Statements
In June 2016, the Company entered into a ten year lease agreement for a third wind blade manufacturing facility in Juárez, Mexico. The new facility will provide approximately 340,000 square feet of manufacturing space when completed. The lease commences in MarchApril 2017, and the base rent will approximate $191,500 per month.
On July 6, 2016, the Company amended its amended and restated certificateRestated Credit Facility to increase the letter of incorporationcreditsub-facility from $15.0 million to effect a 360-for-1 stock split of its common stock. The stock split did not cause an adjustment to the par value of the authorized shares of common stock. As a result of the stock split, the Company has adjusted the share amounts authorized and issuable under the share-based compensation plans. All of the share and per share information for common stock (and the share-based compensation plans) referenced throughout the unaudited condensed consolidated financial statements and notes thereto have been retroactively adjusted to reflect this stock split.$20.0 million.
REPORT OF INDEPENDENT REGISTERED PUBLIC ACCOUNTING FIRMReport of Independent Registered Public Accounting Firm
The Board of Directors and ShareholdersStockholders
TPI Composites, Inc. and Subsidiaries::
We have audited the accompanying consolidated balance sheets of TPI Composites, Inc. and subsidiaries (the Company)(“Company”) as of December 31, 20152016 and 2014,2015, and the related consolidated statements of operations, comprehensive income (loss), shareholders’ deficit,equity (deficit), and cash flows for each of the years in thethree-year period ended December 31, 2015. In connection with our audits of the consolidated financial statements, we also have audited financial statement schedule I.2016. These consolidated financial statements and financial statement schedule are the responsibility of the Company’s management. Our responsibility is to express an opinion on these consolidated financial statements and financial statement schedule based on our audits.
We conducted our audits in accordance with the standards of the Public Company Accounting Oversight Board (United States). Those standards require that we plan and perform the audit to obtain reasonable assurance about whether the consolidated financial statements are free of material misstatement. An audit includes examining, on a test basis, evidence supporting the amounts and disclosures in the consolidated financial statements. An audit also includes assessing the accounting principles used and significant estimates made by management, as well as evaluating the overall financial statement presentation. We believe that our audits provide a reasonable basis for our opinion.
In our opinion, the consolidated financial statements referred to above present fairly, in all material respects, the financial position of TPI Composites, Inc. and subsidiaries as of December 31, 20152016 and 2014,2015, and the results of their operations and their cash flows for each of the years in thethree-year period ended December 31, 2015,2016, in conformity with U.S. generally accepted accounting principles. Also in our opinion, the related financial statement schedule, when considered in relation to the basic consolidated financial statements taken as a whole, presents fairly, in all material respects, the information set forth therein.
/s/ KPMG LLP
Phoenix, Arizona
April 8, 2016, except for Note 21(b) which is as of July 8, 2016March 17, 2017
TPI COMPOSITES, INC. AND SUBSIDIARIES
(In thousands, except sharepar value data)
December 31, | December 31, | |||||||||||||||
2015 | 2014 | 2016 | 2015 | |||||||||||||
Assets | ||||||||||||||||
Current assets: | ||||||||||||||||
Cash and cash equivalents | $ | 45,917 | $ | 43,592 | $ | 119,066 | $ | 45,917 | ||||||||
Restricted cash | 1,760 | 771 | 2,259 | 1,760 | ||||||||||||
Accounts receivable | 72,913 | 44,432 | ||||||||||||||
Accounts receivable (Note 3) | 67,842 | 72,913 | ||||||||||||||
Inventories | 50,841 | 44,017 | 53,095 | 50,841 | ||||||||||||
Inventories held for customer orders | 49,594 | 55,794 | 52,308 | 49,594 | ||||||||||||
Prepaid expenses and other current assets | 31,337 | 20,360 | 30,657 | 31,337 | ||||||||||||
|
|
|
| |||||||||||||
Total current assets | 252,362 | 208,966 | 325,227 | 252,362 | ||||||||||||
Property, plant, and equipment, net | 67,732 | 51,799 | 91,166 | 67,732 | ||||||||||||
Goodwill | 2,807 | 2,807 | 2,807 | 2,807 | ||||||||||||
Intangible assets, net | 419 | 1,187 | 265 | 419 | ||||||||||||
Other noncurrent assets | 10,820 | 13,201 | 17,741 | 6,600 | ||||||||||||
|
|
|
| |||||||||||||
Total assets | $ | 334,140 | $ | 277,960 | $ | 437,206 | $ | 329,920 | ||||||||
|
|
|
| |||||||||||||
Liabilities and Shareholders’ Deficit | ||||||||||||||||
Liabilities and Shareholders’ Equity (Deficit) | ||||||||||||||||
Current liabilities: | ||||||||||||||||
Accounts payable and accrued expenses | $ | 101,108 | $ | 66,805 | $ | 112,281 | $ | 101,108 | ||||||||
Accrued warranty | 13,596 | 5,916 | 19,912 | 13,596 | ||||||||||||
Notes payable | — | 1,875 | ||||||||||||||
Deferred revenue | 65,520 | 59,476 | ||||||||||||||
Deferred revenue (Note 3) | 69,568 | 65,520 | ||||||||||||||
Customer deposits and customer advances | 8,905 | 13,267 | 1,390 | 8,905 | ||||||||||||
Current maturities of long-term debt, net of discount | 52,065 | 62,385 | ||||||||||||||
Current maturities of long-term debt | 33,403 | 52,065 | ||||||||||||||
|
|
|
| |||||||||||||
Total current liabilities | 241,194 | 209,724 | 236,554 | 241,194 | ||||||||||||
Long-term debt, net of discount and current maturities | 81,501 | 62,720 | ||||||||||||||
Long-term debt, net of debt issuance costs, discount and current maturities | 89,752 | 77,281 | ||||||||||||||
Other noncurrent liabilities | 3,812 | 3,260 | 4,393 | 3,812 | ||||||||||||
|
|
|
| |||||||||||||
Total liabilities | 326,507 | 275,704 | 330,699 | 322,287 | ||||||||||||
|
|
|
| |||||||||||||
Commitments and contingencies (Note 16) | ||||||||||||||||
Convertible and senior redeemable preferred shares and warrants | 198,830 | 189,349 | ||||||||||||||
Commitments and contingencies (Note 15) | ||||||||||||||||
Convertible and senior redeemable preferred shares and warrants (Note 3) | — | 198,830 | ||||||||||||||
|
|
|
| |||||||||||||
Shareholders’ deficit: | ||||||||||||||||
Preferred shares, $0.01 par value, no shares issued, outstanding or authorized at December 31, 2015 and 2014 | — | — | ||||||||||||||
Common shares, $0.01 par value, 31,104,000 shares authorized and 4,238,487 shares issued and outstanding at December 31, 2015 and 2014 | — | — | ||||||||||||||
Shareholders’ equity (deficit): (Note 3) | ||||||||||||||||
Preferred shares, $0.01 par value, 5,500 shares authorized, no shares issued or outstanding at December 31, 2016; no shares authorized, issued or outstanding at December 31, 2015 | — | — | ||||||||||||||
Common shares, $0.01 par value, 100,000 shares authorized and 33,737 shares issued and outstanding at December 31, 2016; 31,104 shares authorized and 4,238 shares issued and outstanding at December 31, 2015 | 337 | — | ||||||||||||||
Paid-in capital | — | — | 292,833 | — | ||||||||||||
Accumulated other comprehensive income (loss) | (25 | ) | 2,338 | |||||||||||||
Accumulated other comprehensive loss | (3,862 | ) | (25 | ) | ||||||||||||
Accumulated deficit | (191,172 | ) | (189,431 | ) | (182,801 | ) | (191,172 | ) | ||||||||
|
|
|
| |||||||||||||
Total shareholders’ deficit | (191,197 | ) | (187,093 | ) | ||||||||||||
Total shareholders’ equity (deficit) | 106,507 | (191,197 | ) | |||||||||||||
|
|
|
| |||||||||||||
Total liabilities and shareholders’ deficit | $ | 334,140 | $ | 277,960 | ||||||||||||
Total liabilities and shareholders’ equity (deficit) | $ | 437,206 | $ | 329,920 | ||||||||||||
|
|
|
| |||||||||||||
See accompanying notes to consolidated financial statements.
TPI COMPOSITES, INC. AND SUBSIDIARIES
Consolidated Statements of Operations
(In thousands, except per share data)
Year ended December 31, | Year Ended December 31, | |||||||||||||||||||||||
2015 | 2014 | 2013 | 2016 | 2015 | 2014 | |||||||||||||||||||
Net sales | $ | 585,852 | $ | 320,747 | $ | 215,054 | ||||||||||||||||||
Net sales (Note 3) | $ | 754,877 | $ | 585,852 | $ | 320,747 | ||||||||||||||||||
|
|
|
|
|
| |||||||||||||||||||
Cost of sales | 528,247 | 289,528 | 200,182 | 659,745 | 528,247 | 289,528 | ||||||||||||||||||
Startup and transition costs | 15,860 | 16,567 | 6,607 | 18,127 | 15,860 | 16,567 | ||||||||||||||||||
|
|
|
|
|
| |||||||||||||||||||
Total cost of goods sold | 544,107 | 306,095 | 206,789 | 677,872 | 544,107 | 306,095 | ||||||||||||||||||
|
|
|
|
|
| |||||||||||||||||||
Gross profit | 41,745 | 14,652 | 8,265 | 77,005 | 41,745 | 14,652 | ||||||||||||||||||
General and administrative expenses | 14,126 | 9,175 | 7,566 | 33,892 | 14,126 | 9,175 | ||||||||||||||||||
|
|
|
|
|
| |||||||||||||||||||
Income from operations | 27,619 | 5,477 | 699 | 43,113 | 27,619 | 5,477 | ||||||||||||||||||
|
|
|
|
|
| |||||||||||||||||||
Other income (expense): | ||||||||||||||||||||||||
Interest income | 161 | 186 | 155 | 344 | 161 | 186 | ||||||||||||||||||
Interest expense | (14,565 | ) | (7,236 | ) | (3,474 | ) | (17,614 | ) | (14,565 | ) | (7,236 | ) | ||||||||||||
Loss on extinguishment of debt | — | (2,946 | ) | — | (4,487 | ) | — | (2,946 | ) | |||||||||||||||
Realized loss on foreign currency remeasurement | (1,802 | ) | (1,743 | ) | (1,892 | ) | (757 | ) | (1,802 | ) | (1,743 | ) | ||||||||||||
Miscellaneous income | 246 | 539 | 140 | 238 | 246 | 539 | ||||||||||||||||||
|
|
|
|
|
| |||||||||||||||||||
Total other expense | (15,960 | ) | (11,200 | ) | (5,071 | ) | (22,276 | ) | (15,960 | ) | (11,200 | ) | ||||||||||||
|
|
|
|
|
| |||||||||||||||||||
Income (loss) before income taxes | 11,659 | (5,723 | ) | (4,372 | ) | 20,837 | 11,659 | (5,723 | ) | |||||||||||||||
Income tax benefit (provision) | (3,977 | ) | (925 | ) | 3,346 | |||||||||||||||||||
|
|
| ||||||||||||||||||||||
Net income (loss) before noncontrolling interest | 7,682 | (6,648 | ) | (1,026 | ) | |||||||||||||||||||
Net loss attributable to noncontrolling interest | — | — | 2,305 | |||||||||||||||||||||
Income tax provision | (6,995 | ) | (3,977 | ) | (925 | ) | ||||||||||||||||||
|
|
|
|
|
| |||||||||||||||||||
Net income (loss) | 7,682 | (6,648 | ) | 1,279 | 13,842 | 7,682 | (6,648 | ) | ||||||||||||||||
Net income attributable to preferred shareholders | 9,423 | 13,930 | 14,149 | 5,471 | 9,423 | 13,930 | ||||||||||||||||||
|
|
|
|
|
| |||||||||||||||||||
Net loss attributable to common shareholders | $ | (1,741 | ) | $ | (20,578 | ) | $ | (12,870 | ) | |||||||||||||||
Net income (loss) attributable to common shareholders | $ | 8,371 | $ | (1,741 | ) | $ | (20,578 | ) | ||||||||||||||||
|
|
|
|
|
| |||||||||||||||||||
Weighted average common shares outstanding | ||||||||||||||||||||||||
Basic and diluted | 4,238 | 4,238 | 4,238 | |||||||||||||||||||||
Net loss per common share | ||||||||||||||||||||||||
Basic and diluted | $ | (0.41 | ) | $ | (4.86 | ) | $ | (3.04 | ) | |||||||||||||||
Weighted-average common shares outstanding: | ||||||||||||||||||||||||
Basic | 17,530 | 4,238 | 4,238 | |||||||||||||||||||||
Diluted | 17,616 | 4,238 | 4,238 | |||||||||||||||||||||
Net income (loss) per common share: | ||||||||||||||||||||||||
Basic | $ | 0.48 | $ | (0.41 | ) | $ | (4.86 | ) | ||||||||||||||||
Diluted | $ | 0.48 | $ | (0.41 | ) | $ | (4.86 | ) | ||||||||||||||||
See accompanying notes to consolidated financial statements.
TPI COMPOSITES, INC. AND SUBSIDIARIES
Consolidated Statements of Comprehensive Income (Loss)
(In thousands)
Year ended December 31, | Year Ended December 31, | |||||||||||||||||||||||
2015 | 2014 | 2013 | 2016 | 2015 | 2014 | |||||||||||||||||||
Net income (loss) | $ | 7,682 | $ | (6,648 | ) | $ | (1,026 | ) | $ | 13,842 | $ | 7,682 | $ | (6,648 | ) | |||||||||
Other comprehensive income (loss): | ||||||||||||||||||||||||
Other comprehensive loss: | ||||||||||||||||||||||||
Foreign currency translation adjustments | (2,363 | ) | (124 | ) | 720 | (3,837 | ) | (2,363 | ) | (124 | ) | |||||||||||||
|
|
|
|
|
| |||||||||||||||||||
Comprehensive income (loss) | 5,319 | (6,772 | ) | (306 | ) | $ | 10,005 | $ | 5,319 | $ | (6,772 | ) | ||||||||||||
Comprehensive loss attributable to noncontrolling interest | — | — | 2,415 | |||||||||||||||||||||
|
|
|
|
|
| |||||||||||||||||||
Comprehensive income (loss) attributable to TPI Composites, Inc. and subsidiaries | $ | 5,319 | $ | (6,772 | ) | $ | 2,109 | |||||||||||||||||
|
|
| ||||||||||||||||||||||
See accompanying notes to consolidated financial statements.
TPI COMPOSITES, INC. AND SUBSIDIARIES
Consolidated Statements of Changes in Shareholders’ DeficitEquity (Deficit)
(In thousands, except share data)thousands)
Common | Paid-in capital | Accumulated income | Accumulated deficit | Total —TPI and subsidiaries | Noncontrolling interest | Total | Common | Paid-in capital | Accumulated income (loss) | Accumulated deficit | Total (deficit) | |||||||||||||||||||||||||||||||||||||||||||||
Shares | Amount | Shares | Amount | |||||||||||||||||||||||||||||||||||||||||||||||||||||
Balance at December 31, 2012 | 4,238,487 | $ | — | $ | — | $ | 1,757 | $ | (149,565 | ) | $ | (147,808 | ) | $ | (2,113 | ) | $ | (149,921 | ) | |||||||||||||||||||||||||||||||||||||
Net income (loss) | — | — | — | — | 1,279 | 1,279 | (2,305 | ) | (1,026 | ) | ||||||||||||||||||||||||||||||||||||||||||||||
Other comprehensive income | — | — | — | 830 | — | 830 | (110 | ) | 720 | |||||||||||||||||||||||||||||||||||||||||||||||
Acquisition and tax impact of noncontrolling interest | — | — | — | (125 | ) | (13,248 | ) | (13,373 | ) | 4,528 | (8,845 | ) | ||||||||||||||||||||||||||||||||||||||||||||
Share based compensation expense | — | — | 36 | — | — | 36 | — | 36 | ||||||||||||||||||||||||||||||||||||||||||||||||
Redeemable preferred shares fair value adjustment | — | (36 | ) | — | (14,113 | ) | (14,149 | ) | — | (14,149 | ) | |||||||||||||||||||||||||||||||||||||||||||||
|
|
|
|
|
|
|
| |||||||||||||||||||||||||||||||||||||||||||||||||
Balance at December 31, 2013 | 4,238,487 | — | — | 2,462 | (175,647 | ) | (173,185 | ) | — | (173,185 | ) | |||||||||||||||||||||||||||||||||||||||||||||
Balance at January 1, 2014 | 4,238 | $ | — | $ | — | $ | 2,462 | $ | (175,647 | ) | $ | (173,185 | ) | |||||||||||||||||||||||||||||||||||||||||||
Net loss | — | — | — | — | (6,648 | ) | (6,648 | ) | — | (6,648 | ) | — | — | — | — | (6,648 | ) | (6,648 | ) | |||||||||||||||||||||||||||||||||||||
Other comprehensive loss | — | — | — | (124 | ) | — | (124 | ) | — | (124 | ) | — | — | — | (124 | ) | — | (124 | ) | |||||||||||||||||||||||||||||||||||||
Common stock warrants | — | — | — | — | 845 | 845 | — | 845 | — | — | — | — | 845 | 845 | ||||||||||||||||||||||||||||||||||||||||||
Acquisition and tax impact of noncontrolling interest | — | — | — | — | 760 | 760 | — | 760 | — | — | — | — | 760 | 760 | ||||||||||||||||||||||||||||||||||||||||||
Beneficial conversion feature in subordinated debt agreement | — | — | — | — | 5,189 | 5,189 | — | 5,189 | — | — | — | — | 5,189 | 5,189 | ||||||||||||||||||||||||||||||||||||||||||
Redeemable preferred shares fair value adjustment | — | — | — | — | (13,930 | ) | (13,930 | ) | — | (13,930 | ) | — | — | — | — | (13,930 | ) | (13,930 | ) | |||||||||||||||||||||||||||||||||||||
|
|
|
|
|
|
|
|
|
|
|
|
|
| |||||||||||||||||||||||||||||||||||||||||||
Balance at December 31, 2014 | 4,238,487 | — | — | 2,338 | (189,431 | ) | (187,093 | ) | — | (187,093 | ) | 4,238 | — | — | 2,338 | (189,431 | ) | (187,093 | ) | |||||||||||||||||||||||||||||||||||||
Net income | — | — | — | — | 7,682 | 7,682 | — | 7,682 | — | — | — | — | 7,682 | 7,682 | ||||||||||||||||||||||||||||||||||||||||||
Other comprehensive loss | — | — | — | (2,363 | ) | — | (2,363 | ) | — | (2,363 | ) | — | — | — | (2,363 | ) | — | (2,363 | ) | |||||||||||||||||||||||||||||||||||||
Redeemable preferred shares fair value adjustment | — | — | — | — | (9,423 | ) | (9,423 | ) | — | (9,423 | ) | — | — | — | — | (9,423 | ) | (9,423 | ) | |||||||||||||||||||||||||||||||||||||
|
|
|
|
|
|
|
|
|
|
|
|
|
| |||||||||||||||||||||||||||||||||||||||||||
Balance at December 31, 2015 | 4,238,487 | $ | — | $ | — | $ | (25 | ) | $ | (191,172 | ) | $ | (191,197 | ) | $ | — | $ | (191,197 | ) | 4,238 | — | — | (25 | ) | (191,172 | ) | (191,197 | ) | ||||||||||||||||||||||||||||
Net income | — | — | — | — | 13,842 | 13,842 | ||||||||||||||||||||||||||||||||||||||||||||||||||
Other comprehensive loss | — | — | — | (3,837 | ) | — | (3,837 | ) | ||||||||||||||||||||||||||||||||||||||||||||||||
Redeemable preferred shares fair value adjustment | — | — | — | — | (5,471 | ) | (5,471 | ) | ||||||||||||||||||||||||||||||||||||||||||||||||
Issuance of common stock sold in initial public offering (IPO), net of under- writers discount and offering costs | 7,188 | 72 | 67,127 | — | — | 67,199 | ||||||||||||||||||||||||||||||||||||||||||||||||||
Conversion of convertible preferred shares into common stock upon consummation of IPO | 21,110 | 253 | 202,993 | — | — | 203,246 | ||||||||||||||||||||||||||||||||||||||||||||||||||
Conversion of subordinated convertible promissory notes into common stock upon consummation of IPO | 1,080 | 11 | 11,866 | — | — | 11,877 | ||||||||||||||||||||||||||||||||||||||||||||||||||
Conversion of redeemable preferred share warrants into common stock upon consummation of IPO | 121 | 1 | 1,083 | — | — | 1,084 | ||||||||||||||||||||||||||||||||||||||||||||||||||
Share-based compensation expense | — | — | 9,764 | — | — | 9,764 | ||||||||||||||||||||||||||||||||||||||||||||||||||
|
|
|
|
|
|
|
|
|
|
|
|
|
| |||||||||||||||||||||||||||||||||||||||||||
Balance at December 31, 2016 | 33,737 | $ | 337 | $ | 292,833 | $ | (3,862 | ) | $ | (182,801 | ) | $ | 106,507 | |||||||||||||||||||||||||||||||||||||||||||
|
|
|
|
|
| |||||||||||||||||||||||||||||||||||||||||||||||||||
See accompanying notes to consolidated financial statements.
TPI COMPOSITES, INC. AND SUBSIDIARIES
Consolidated Statements of Cash Flows
(In thousands)
Year ended December 31, | Year Ended December 31, | |||||||||||||||||||||||
2015 | 2014 | 2013 | 2016 | 2015 | 2014 | |||||||||||||||||||
Cash flows from operating activities: | ||||||||||||||||||||||||
Net income (loss) | $ | 7,682 | $ | (6,648 | ) | $ | (1,026 | ) | $ | 13,842 | $ | 7,682 | $ | (6,648 | ) | |||||||||
Adjustments to reconcile net income (loss) to net cash provided by (used in) operating activities: | ||||||||||||||||||||||||
Provision for doubtful accounts | — | — | 28 | |||||||||||||||||||||
Loss on disposal of property and equipment | 185 | 128 | 93 | — | 185 | 128 | ||||||||||||||||||
Depreciation and amortization | 11,416 | 7,441 | 5,250 | 12,897 | 11,416 | 7,441 | ||||||||||||||||||
Amortization of debt discount | 3,016 | — | — | 3,018 | 3,016 | — | ||||||||||||||||||
Amortization of debt issuance costs | 1,303 | 715 | 238 | 1,663 | 1,303 | 715 | ||||||||||||||||||
Loss on extinguishment of debt | — | 2,946 | — | 4,487 | — | 2,946 | ||||||||||||||||||
Share-based compensation expense | — | — | 36 | 9,902 | — | — | ||||||||||||||||||
Loss on investment in joint venture | 2 | 6 | 5 | 2 | 2 | 6 | ||||||||||||||||||
Amortization of discount on customer advances | — | 218 | 627 | — | — | 218 | ||||||||||||||||||
Deferred income taxes | (765 | ) | (1,018 | ) | 1,095 | (2,782 | ) | (765 | ) | (1,018 | ) | |||||||||||||
Changes in assets and liabilities: | ||||||||||||||||||||||||
Accounts receivable | (29,652 | ) | (31,677 | ) | (6,434 | ) | 5,071 | (29,652 | ) | (31,677 | ) | |||||||||||||
Inventories | (626 | ) | (60,320 | ) | (9,752 | ) | (4,967 | ) | (626 | ) | (60,320 | ) | ||||||||||||
Prepaid expenses and other current assets | (10,978 | ) | (9,225 | ) | (6,103 | ) | 681 | (10,978 | ) | (9,225 | ) | |||||||||||||
Other noncurrent assets | 4,204 | 2,021 | (3,694 | ) | (8,291 | ) | 4,204 | 2,021 | ||||||||||||||||
Accounts payable and accrued expenses | 34,423 | 26,050 | 10,831 | 14,959 | 34,423 | 26,050 | ||||||||||||||||||
Accrued warranty | 7,680 | 2,180 | (330 | ) | 6,316 | 7,680 | 2,180 | |||||||||||||||||
Customer deposits | (3,193 | ) | 1,047 | 9,336 | (7,515 | ) | (3,193 | ) | 1,047 | |||||||||||||||
Deferred revenue | 6,044 | 38,322 | 3,161 | 4,048 | 6,044 | 38,322 | ||||||||||||||||||
Other noncurrent liabilities | 552 | (5,403 | ) | (1,734 | ) | 510 | 552 | (5,403 | ) | |||||||||||||||
|
|
|
|
|
| |||||||||||||||||||
Net cash provided by (used in) operating activities | 31,293 | (33,217 | ) | 1,627 | 53,841 | 31,293 | (33,217 | ) | ||||||||||||||||
|
|
|
|
|
| |||||||||||||||||||
Cash flows from investing activities: | ||||||||||||||||||||||||
Purchases of property and equipment | (26,361 | ) | (18,924 | ) | (7,065 | ) | (30,507 | ) | (26,361 | ) | (18,924 | ) | ||||||||||||
Proceeds from sale of assets | 146 | — | — | — | 146 | — | ||||||||||||||||||
Contribution to joint venture | — | — | (84 | ) | ||||||||||||||||||||
|
|
|
|
|
| |||||||||||||||||||
Net cash used in investing activities | (26,215 | ) | (18,924 | ) | (7,149 | ) | (30,507 | ) | (26,215 | ) | (18,924 | ) | ||||||||||||
|
|
|
|
|
| |||||||||||||||||||
Cash flows from financing activities: | ||||||||||||||||||||||||
Proceeds from issuance of common stock sold in initial public offering, net of underwriters discount and offering costs | 67,199 | — | — | |||||||||||||||||||||
Proceeds from issuance of preferred stock | — | — | 6,846 | |||||||||||||||||||||
Proceeds from term loans | 20,000 | 23,901 | 14,797 | — | 20,000 | 23,901 | ||||||||||||||||||
Repayments of term loans | (625 | ) | — | — | (930 | ) | (625 | ) | — | |||||||||||||||
Net proceeds from (repayments of) accounts receivable financing | (2,472 | ) | 34,450 | 2,183 | (5,385 | ) | (2,472 | ) | 34,450 | |||||||||||||||
Proceeds from working capital loans | 11,690 | 19,120 | 3,393 | 15,813 | 11,690 | 19,120 | ||||||||||||||||||
Repayments of working capital loans | (24,262 | ) | (13,121 | ) | — | (20,103 | ) | (24,262 | ) | (13,121 | ) | |||||||||||||
Proceeds from subordinated debt arrangements | — | 15,000 | — | — | — | 15,000 | ||||||||||||||||||
Proceeds from (repayments of) other financing arrangements | (2,777 | ) | (2,130 | ) | 40 | |||||||||||||||||||
Net repayments of other financing arrangements | (4,765 | ) | (2,777 | ) | (2,130 | ) | ||||||||||||||||||
Proceeds from customer advances | 2,000 | — | 4,500 | |||||||||||||||||||||
Repayments of customer advances | (2,000 | ) | — | — | ||||||||||||||||||||
Debt issuance costs | (1,113 | ) | (4,818 | ) | (1,154 | ) | — | (1,113 | ) | (4,818 | ) | |||||||||||||
Payment on acquisition of noncontrolling interest | (1,875 | ) | (1,625 | ) | (500 | ) | — | (1,875 | ) | (1,625 | ) | |||||||||||||
Proceeds from customer advances | — | 4,500 | — | |||||||||||||||||||||
Repayments of customer advances | — | — | (5,007 | ) | ||||||||||||||||||||
Proceeds from issuance of preferred stock | — | 6,846 | — | |||||||||||||||||||||
Restricted cash | (989 | ) | 1,898 | (804 | ) | (499 | ) | (989 | ) | 1,898 | ||||||||||||||
|
|
|
|
|
| |||||||||||||||||||
Net cash provided by (used in) financing activities | (2,423 | ) | 84,021 | 12,948 | 51,330 | (2,423 | ) | 84,021 | ||||||||||||||||
|
|
|
|
|
| |||||||||||||||||||
Impact of foreign exchange rates on cash and cash equivalents | (330 | ) | (43 | ) | 720 | (1,515 | ) | (330 | ) | (43 | ) | |||||||||||||
|
|
|
|
|
| |||||||||||||||||||
Net change in cash and cash equivalents | 2,325 | 31,837 | 8,146 | 73,149 | 2,325 | 31,837 | ||||||||||||||||||
Cash and cash equivalents, beginning of year | 43,592 | 11,755 | 3,609 | 45,917 | 43,592 | 11,755 | ||||||||||||||||||
|
|
|
|
|
| |||||||||||||||||||
Cash and cash equivalents, end of year | $ | 45,917 | $ | 43,592 | $ | 11,755 | $ | 119,066 | $ | 45,917 | $ | 43,592 | ||||||||||||
|
|
|
|
|
| |||||||||||||||||||
Supplemental disclosures of cash flow information: | ||||||||||||||||||||||||
Cash paid for interest | $ | 9,439 | $ | 6,343 | $ | 2,545 | $ | 11,126 | $ | 9,439 | $ | 6,343 | ||||||||||||
Cash paid for income taxes, net | 3,087 | 547 | 222 | 8,506 | 3,087 | 547 | ||||||||||||||||||
Supplemental disclosures of noncash investing and financing activities: | ||||||||||||||||||||||||
Conversion of subordinated convertible promissory notes into common stock | 11,877 | — | — | |||||||||||||||||||||
Accrued capital expenditures in accounts payable | 1,860 | 1,980 | 3,607 | 2,664 | 1,860 | 1,980 | ||||||||||||||||||
Equipment acquired through capital lease and financing obligations | 5,004 | 7,381 | 3,591 | 10,011 | 5,004 | 7,381 | ||||||||||||||||||
Note payable issued for the acquisition of noncontrolling interest | — | — | 3,500 | |||||||||||||||||||||
Customer advances applied to accounts receivable | 1,171 | 2,753 | — | — | 1,171 | 2,753 | ||||||||||||||||||
Debt refinance and related fees | — | 36,099 | — | 2,163 | — | 36,099 | ||||||||||||||||||
See accompanying notes to consolidated financial statements.
TPI COMPOSITES, INC. AND SUBSIDIARIES
Notes to Consolidated Financial Statements
Note 1. Summary of Operations and Significant Accounting Policies
(a) Description of Business and Basis of Presentation
TPI Composites, Inc. is the holding company that conducts substantially all of its business operations through its direct and indirect subsidiaries (collectively, the Company). The Company was founded in 1968 and has been providing composite wind blades for 15 years.since 2001. The Company’s knowledge and experience of composite materials and manufacturing originates with its predecessor company, Tillotson Pearson Inc., a leading manufacturer of high-performance sail and powerboats along with a wide range of composite structures used in other industrial applications. Following the separation from the boat building business in 2004, the Company reorganized in Delaware as LCSI Holding, Inc. The Company changed its corporate name to TPI Composites, Inc. in 2008. Today, the Company is headquartered in Scottsdale, Arizona and has expanded its global footprint to include domestic facilities in Newton, Iowa; Fall River, Massachusetts; Warren, Rhode Island and Santa Teresa, New Mexico and international facilities in Dafeng, China; Taicang Port, China; Taicang City, China; Juarez,Juárez, Mexico and Izmir, Turkey.
The Company divides its business operations into four geographic operating segments—the United States, Asia, Mexico and EMEA,Europe, the Middle East and Africa (EMEA), as follows:
The Company has an accumulated deficit of $191.2 million as of December 31, 2015 resulting from recurring losses from operations and the accretion to the redemption value and cumulative dividends associated with redeemable preferred shares. The Company has funded operations primarily with cash flows from operations and debt and equity financings from investors. The accompanying consolidated financial statements include the accounts of TPI Composites, Inc. and all majority owned subsidiaries. All significant intercompany transactions and balances have been eliminated.
(b) Initial Public Offering and Stock Split
In July 2016, the Company completed an initial public offering (IPO) of 7,187,500 shares of its common stock at a price of $11.00 per share, which included 937,500 shares issued pursuant to the underwriters’ exercise
TPI COMPOSITES, INC. AND SUBSIDIARIES
Notes to Consolidated Financial Statements
of their option to purchase additional shares. Certain of the Company’s existing shareholders, a director and executive officers purchased an aggregate of 1,250,000 shares of common stock in the IPO included in the total issuance above. The net proceeds from the IPO were $67.2 million after deducting underwriting discounts and offering expenses. Immediately prior to the closing of the IPO, all shares of the then-outstanding redeemable preferred shares converted into an aggregate of 21,110,204 shares of common stock and the redeemable preferred share warrants converted on a net issuance basis into 120,923 shares of common stock. In addition, concurrent with the closing of the IPO, certain subordinated convertible promissory notes in the aggregate principal and interest amount of $11.9 million were converted into 1,079,749 shares of common stock at the public offering price of $11.00 per share.
Prior to the IPO, in July 2016 the Company amended its amended and restated certificate of incorporation to effect a 360-for-1 forward stock split of its common stock. As a result of the stock split, the Company has adjusted the share amounts authorized and issuable under the share-based compensation plans. All share and per share common stock information (including the share-based compensation plans) referenced throughout the consolidated financial statements and notes thereto have been retroactively adjusted to reflect this stock split. The stock split did not cause an adjustment to the par value of the authorized shares of common stock.
(b)(c) Revenue Recognition
The Company records all sales of goods when a firm sales agreement is in place, delivery has occurred as defined by the sales contract, and collectability of the fixed or determinable sales price is reasonably assured. The basic criteria necessary for revenue recognition are: (1) evidence that a sales arrangement exists, (2) title and risk of loss have passed to the customer, (3) delivery of goods has occurred, (4) the seller’s price to the buyer is fixed or determinable and (5) collectability is reasonably assured. The Company recognizes revenue at the time of delivery to customers as all criteria necessary for revenue recognition have occurred at this point.
For multiple deliverable revenue arrangements, the Company allocates revenue to each element based on a selling price hierarchy. The selling price for a deliverable is based on its vendor specific objective evidence (VSOE) if available, third partythird-party evidence (TPE) if VSOE is not available, or best estimated selling price (BESP) if neither VSOE nor TPE is available. The Company generally allocates revenue for each of the deliverables within multiple element arrangements through BESP using cost plus margin estimates prepared during contract negotiations and agreed upon sales price or VSOE for sales of similar items outside of multiple element arrangements.price. The precision molding and assembly systems provided for in each customer’s contract are based upon the specific engineering requirements and design of the customer relative to the wind blade design and function desired. From the customer’s engineering specifications, a job cost estimate is developed along with a production plan, and margin is applied based on the location the work is to be performed, customer and complexity of the work to be performed.customer’s design. Precision molding and assembly systems are built to produce wind blades which are manufactured in production runs specified in the customer contract. To determine the appropriate accounting for recognition of revenue, the Company considers whether the deliverables specified in the multiple element arrangement should be treated as separate units of accounting, and, if so, how the price should be allocated among the elements, when to recognize revenue for each element, and the period over which revenue should be recognized. The Company also evaluates whether a delivered item has value on a stand-alone basis prior to delivery of the remaining items by determining whether the Company has made separate sales of such items or whether the undelivered items are essential to the functionality of the delivered items. Further, the Company assesses whether the fair value of the undelivered items is known, determined by reference to stand-alone sales of such items, if available, or BESP. As each of these items has stand-alone value to the customer, revenue from sales of wind blades and precision molding and assembly systems used in the production of composite products are recognized when those specific items are accepted by the customer as meeting the contractual technical specifications and delivered to the customer. Delivery of wind blades and precision molding
TPI COMPOSITES, INC. AND SUBSIDIARIES
Notes to Consolidated Financial Statements
and assembly systems generally takes place as defined in the contract at the facility where the precision molding and assembly systems are produced at which point the precision molding and assembly systems become exclusive property of the customer. The customer is generally then responsible for transportation and may transport the composite mold to its own or the Company’s wind blade production facility. Revenue related to engineering and freight services provided under customer contracts is recognized upon completion of the services being provided. Customers usually pay the cost of shipping associated with items produced directly to the carrier, but if paid by the Company, that cost is included in cost of goods sold and amounts invoiced for shipping and handling are included in revenue.
The Company’s customers may request, in situations where they do not have space available to receive products or do not want to take possession of products immediately for other reasons, that their finished composite products be stored by the Company in one of its facilities. The Company will bill for the components as allowed by the contract; however, revenue is deferred for financial reporting purposes until the Company delivers the finished composite product and all of the other requirements for revenue recognition have been met. Composite products that have been billed by the Company and continue to be stored by the Company at one of its facilities are included at net realizable value in inventory held for customer orders included on the consolidated balance sheets. Inventory held for customer orders is physically segregated from finished goods and is accounted for separately within the Company’s accounting records.
TPI COMPOSITES, INC. AND SUBSIDIARIES
Notes to Consolidated Financial Statements
Wind blade pricing is based on annual commitments of volume as established in the customer’s contract with orders less than committed volume resulting in additional costs per wind blade to customers; however, orders in excess of annual commitments may, but generally do not, result in discounts to customers from the contracted price for the committed volume. Customers may utilize early payment discounts which are reported as a reduction of revenue at the time the discount is taken.
(c)(d) Cost of Goods Sold
Cost of goods sold includes the costs associated with products invoiced during the period as well as unallocated manufacturing overhead costs associated with startup and transition costs. Cost of sales includes all costs incurred at the Company’s production facilities to make products saleable, such as raw materials, direct labor and indirect labor and facilities costs including purchasing and receiving costs, plant management, inspection costs, product engineering and internal transfer costs. In addition, all depreciation associated with assets used to produce composite products and make them saleable is included in cost of sales. Direct labor costs consist of salaries, benefits and other personnel related costs for employees engaged in the manufacture of the Company’s products.
Startup and transition costs represent the unallocated factory overhead relating to the transition of wind blade models at the request of the Company’s customers and startup costs related to new manufacturing facilities. The startup and transition costs are primarily fixed overhead costs, incurred during the period production facilities are under-utilized while transitioning wind blade models and ramping up manufacturing that are not allocated to products and are expensed as incurred. The cost of sales for the initial wind blades from a new model manufacturing line is generally higher than when the line is operating at optimal production volume levels due to inefficiencies during ramp-up related to labor hours per blade, cycle times per blade and raw material usage. Additionally, manufacturing overhead as a percentage of net sales is generally higher during the period in which a facility is ramping up to full production capacity due to underutilization of the facility. Manufacturing overhead at each of the Company’s facilities includes virtually all indirect costs incurred at the plants, including engineering, finance, information technology, human resources and plant management.
TPI COMPOSITES, INC. AND SUBSIDIARIES
Notes to Consolidated Financial Statements
(d)(e) General and Administrative Expense
General and administrative expenses are primarily incurred at the Company’s corporate headquarters and research facilities and include salaries, benefits and other personnel related costs for employees engaged in research and development, engineering, finance, information technology, human resources, marketingbusiness development, global operational excellence, global supply chain, in-house legal and executive management. Other costs include outside legal and accounting fees, risk management (insurance), global operational excellence, global supply chain, in-house legal, share-based compensation and certain other administrative and global resources costs. For the years ended December 31, 2016, 2015 2014 and 2013,2014, total research and development expenses (included in general and administrative expenses) totaled $1.5 million, $0.9 million $0.8 million and $0.6$0.8 million, respectively.
(e)(f) Cash and Cash Equivalents and Restricted Cash
Cash and cash equivalents include highly liquid investments that are readily convertible to known amounts of cash with original maturities of three months or less. The carrying value of cash and cash equivalents approximates fair value.
As of December 31, 20152016 and 2014,2015, the Taicang plants had unrestricted cash of $5.1$8.3 million and $12.3$5.1 million, respectively, in bank accounts in China. As of December 31, 20152016 and 2014,2015, the Dafeng plantsplant had unrestricted cash of $0.2$4.0 million and $4.4$0.2 million, respectively, in bank accounts in China. The Chinese government imposes certain restrictions on transferring cash out of China. The local governments in Turkey and
TPI COMPOSITES, INC. AND SUBSIDIARIES
Notes to Consolidated Financial Statements
Mexico impose no such restrictions on transferring cash out of the respective country. Also, as of December 31, 2015 and 2014, the Company maintained long-term deposits in interest bearing accounts in Mexico totaling $2.1 million and $1.9 million, respectively, and $3.5 million in China as of December 31, 2014. The Company has also provided a fully cash-collateralized letter of credit in connection with an equipment lessor in Iowa totaling $0.4 million as of December 31, 2015. See note 10,Other Noncurrent Assets.
The Company has provided fully cash-collateralized letters of credit in connection with thecertain facility leases for the operations in Warren, Rhode Island and Izmir, Turkey, and with one of the Company’s workers’ compensation providers which commenced in January 2015. Cash related to the facility leases being held in restricted bank accounts totaled $0.7totaling $2.3 million and $0.8$1.8 million, respectively. These amounts are reported as restricted cash in the Company’s consolidated balance sheets. Also, as of December 31, 2016 and 2015, and 2014, respectively, and will remain until the expiration of theCompany maintained long-term deposits in interest bearing accounts, related to fully cash-collateralized letters of credit. The amount held related tocredit in connection with the workers’ compensation provider totaled $1.1facility leases at our Mexico locations and an equipment lessor in Iowa, totaling $8.5 million as of December 31, 2015.and $2.5 million, respectively. See Note 9,Other Noncurrent Assets.
(f)(g) Accounts Receivable
Trade accounts receivable are recorded at the invoiced amount and generally do not bear interest. The Company follows the allowance method of recognizing uncollectible accounts receivable, which recognizes bad debt expense based on a review of the individual accounts outstanding and prior history of uncollectible accounts receivable. Credit is extended based on evaluation of each customer’s financial condition and is generally unsecured. Accounts receivable are generally due within 30 days and are stated net of an allowance for doubtful accounts in the consolidated balance sheets. Accounts are considered past due if outstanding longer than contractual payment terms. The Company records an allowance based on consideration of a number of factors, including the length of time trade accounts are past due, previous loss history, the credit-worthiness of individual customers, economic conditions affecting specific customer industries, and economic conditions in general. The Company charges-off accounts receivable after all reasonable collection efforts have been exhausted. The Company credits payments subsequently received on such receivables to bad debt expense in the period payment is received. The Company records delinquent finance charges on outstanding accounts receivables only if they are collected. The Company wrote off $0.5 million during 2016 and did not write off any material amounts due during 2015 2014 or 2013,2014, and does not have any off-balance-sheet credit exposure related to its customers. See note 5,Note 4,Accounts Receivable.
TPI COMPOSITES, INC. AND SUBSIDIARIES
Notes to Consolidated Financial Statements
(g)(h) Inventories
In July 2015, the Financial Accounting Standards Board (FASB) issued Accounting Standards Update (ASU)2015-11, Inventory Topic 330:Simplifying the Measurement of Inventory (ASU 2015-11). UnderASU 2015-11, inventory is measured at the “lowerlower of cost andor net realizable value” and options that currently exist for “market value” were eliminated. ASU 2015-11 defines netvalue. Net realizable value is defined as the “estimatedestimated selling prices in the ordinary course of business, less reasonably predictable costs of completion, disposal, and transportation.” The new standard applies only to inventory for which cost is determined by methods other than last-in, first-out and the retail inventory method, which includes inventory that is measured using first-in, first-out or average cost. No other changes were made to the current guidance on inventory measurement. ASU 2015-11 is effective for interim and annual periods beginning after December 15, 2016. Early application is permitted and should be applied prospectively. The Company adopted ASU 2015-11 as of December 31, 2015 with no significant impact on the Company’s financial position or results of operations.
As of December 31, 2014, inventories are stated at the lower of cost or market. Market value is determined by the current replacement cost and is compared to the carrying cost of the inventory to determine if a write-down is necessary. Cost is determined using the first-in, first-out method for raw materials and specific identification for work in process and finished goods inventories. Actual cost includes the cost of materials, direct labor, and applied manufacturing overhead. Write-downs to reduce the carrying cost of obsolete, slow-moving, and unusable inventory
TPI COMPOSITES, INC. AND SUBSIDIARIES
Notes to Consolidated Financial Statements
to net realizable value are recognized in cost of goods sold. The effect of these write-downs is to establishestablishes a new cost basis in the related inventory, which is not subsequently written up. See note 6,Note 5,Inventories, for the break out of inventory between raw materials, work in process and finished goods as of December 31, 2015 and 2014..
(h)(i) Property, Plant, and Equipment
Property, plant, and equipment are stated at cost. Depreciation and amortization of property, plant, and equipment is calculated on the straight-line method over the estimated useful lives of the assets. See note 8,Note 7,Property, Plant and Equipment, Net.
Estimated useful lives | ||
Machinery and equipment | 7–10 years | |
Buildings | 20 years | |
Leasehold improvements | 5 to 10 years, or the term of the
| |
Office equipment and software | 3 to 5 years | |
Furniture | 5 years | |
Vehicles | 5 years |
(i)(j) Recoverability of Long-Lived Assets
The Company reviews property, plant and equipment and other long-lived assets in order to assess recoverability based on expected future undiscounted cash flows whenever events or circumstances indicate that the carrying value may not be recoverable. If the sum of the expected future net cash flows is less than the carrying value, an impairment loss is recognized. The impairment loss is measured as the amount by which the carrying value exceeds the fair value of the asset.
(j)(k) Goodwill and Intangible Assets
Goodwill represents the excess of the acquisition cost of an acquired companyComposite Solutions, Inc. from True North Partners, LLC in 2004 over the estimated fair value of identifiable assets acquired and liabilities assumed. Goodwill, which is entirely in the U.S. segment, is evaluated for impairment annually on October 31 and whenever events or circumstances make it likely that impairment may have occurred. In determining whether impairment has occurred, the Company uses a two-step approach. Step one compares the fair value of the related reporting unit (calculated using the discounted cash flow method) to its carrying value. If the carrying value exceeds the fair value, there is a potential impairment and step two must be performed. Step two compares the carrying value of the reporting unit’s goodwill to its implied fair value (i.e., fair value of reporting unit less the fair value of the unit’s assets and liabilities, including identifiable intangible assets). If the implied fair value of goodwill is less than the carrying amount of goodwill, impairment is recognized for that difference. Goodwill represents the excess of the acquisition cost of Composite Solutions, Inc. from True North Partners, LLC in 2004 over the fair value of identifiable assets acquired and liabilities assumed. The FASB has issued guidance that permits a company toCompany may first assess qualitative factors to determine whether it is necessary to perform the two-step quantitative goodwill
TPI COMPOSITES, INC. AND SUBSIDIARIES
Notes to Consolidated Financial Statements
impairment test. The Company performed its annual goodwill impairment test during 20152016 and has determined that it is more likely than notmore-likely-than-not that its fair value exceeds its carrying amount.
Intangible assets were acquired in a business acquisition and provide contractual or legal rights, or other future benefits that could be separately identified. The Company’s valuation of identified intangible assets was based upon discounted cash flow estimates that require significant management judgment with respect to revenue
TPI COMPOSITES, INC. AND SUBSIDIARIES
Notes to Consolidated Financial Statements
and expense growth rates, changes in working capital, and the selection and use of the appropriate discount rate. The intangible assets are amortized over their estimated useful life. Intangible assets with indefinite lives are evaluated at least annually for impairment annually andor whenever events or circumstances make it likely that impairment may have occurred. See note 9,Note 8,Intangible Assets, Net.
(k)(l) Warranty Expense
The Company provides a limited warranty for its mold and wind blade products, including parts and labor, with terms and conditions that vary depending on the product sold, for periods that range from two to five years. Warranty expense is recorded based upon estimates of future repairs using a probability-based methodology. Once the warranty period has expired, any remaining unused warranty accrual for the specific products is reversed against the current year warranty expense amount. See note 11,Note 10,Accrued Warranty.
(l)(m) Foreign Currency Translation Adjustments
The reporting currency of the Company is the U.S. dollar. However, the Company has non-U.S. operating segments in Mexico, Turkey and China.
Foreign currency-denominated assets and liabilities are translated into U.S. dollars at exchange rates existing at the respective balance sheet dates. Results of operations of foreign subsidiaries are translated at the average exchange rates during the respective periods. Foreign currency transaction gains and losses are reported in realized gain (loss) on foreign currency remeasurement in the Company’s consolidated statements of operations. Translation adjustments are reported in accumulated other comprehensive income (loss) in the Company’s consolidated balance sheets. Currency translation adjustments for the years ended December 31, 2016, 2015 and 2014 amounted to losses of $3.8 million, $2.4 million and $0.1 million, respectively, and a gain of $0.7 million for the year ended December 31, 2013.respectively.
(m)(n) Share-Based Compensation
The Company maintains two active incentive compensation plans: the 2008 Stock Option and Grant Plan and the Amended and Restated 2015 Stock Option and Incentive Plan (the 2015 Plan). In May 2015, the
TPI COMPOSITES, INC. AND SUBSIDIARIES
Notes to Consolidated Financial Statements
Company’s board of directors and shareholders adopted and approved the 2015 Plan, which provides for the issuance of incentive stock options, non-qualified stock options, stock appreciation rights, restricted stock units, restricted stock awards, unrestricted stock awards, cash-based awards, performance share awards and dividend equivalent rights to certain employees, non-employee directors and consultants. The term of stock options issued under the 2015
TPI COMPOSITES, INC. AND SUBSIDIARIES
Notes to Consolidated Financial Statements
Plan may not exceed ten years from the date of grant. Under the 2015 Plan, incentive stock options and non-qualified stock options are granted at an exercise price that is not to be less than 100% of the fair market value of the common stock of the Company on the date of grant, as determined by the Compensation Committee of the board of directors. Stock options become vested and exercisable at such times and under such conditions as determined by the Compensation Committee on the date of grant. Upon approval of the 2015 Plan, no future grants will be made from the 2008 Stock Option and Grant Plan.
The Company measures share-based compensation expense for stock options using the estimated fair value of the related award on the date of grant using the Black-Scholes valuation model. These estimates are considered highly complex and subjective. The Company assumes an expected dividend yieldmodel as of zero and uses share volatility of comparable companies within its industrythe grant date using the following assumptions:
Expected Volatility. As the Company’s common stock had not been publicly traded prior to determineJuly 2016, the expected volatility assumption reflects an average of volatilities of publicly traded peer group companies with a period equal to the expected life of the Company’s shares in determiningoptions.
Expected Life (years). The Company uses the fair valuesimplified method to estimate the expected term of stock options. The simplified method for estimating expected term is to use the mid-point between the vesting term and the contractual term of the option. The Company elected to use the simplified method because it did not have historical exercise data to estimate the expected term due to the limited time period its common stock options.had been publicly traded.
Risk-Free Interest Rate. The risk-free interest rate assumption is based onupon the U.S. Treasury yield in effect atconstant maturity treasury rates as the time of grantrisk-free rate interpolated between the years commensurate with the expected life of the options.
Dividend Yield. The expected life ofdividend yield assumption is zero since the options representsCompany does not expect to declare or pay dividends in the estimated length of time the options are expected to remain outstanding, utilizing the simplified method as prescribed by authoritative guidance.foreseeable future.
Expected Vesting Period. The Company has elected to useamortizes the simplified method due toshare-based compensation expense over the insufficient history of its equity instruments. Forfeitures are estimated at the time of grant based on historical retention of employees. If necessary, management estimates are adjusted at the end of each reporting period if actual forfeitures differ from those estimates.requisite service period.
Share-based compensation expense related to restricted stock units is expensed over the vesting period using the straight-line method for Company employees and the Company’s board of directors, net of estimated forfeitures.directors. The restricted stock units do not have voting rights. The Company calculates the fair value of share-based awards on the date of grant for employees and directors. The Company calculates the fair value of share-based awards to consultants on the date of vesting. Forfeitures are estimated at the time of grant and revised in subsequent periods if actual forfeitures differ from those estimates.
(n)(o) Leases
Leases are classified as either operating leases or capital leases. Assets acquired under capital leases are amortized on the same basis as similar property, plant and equipment. Rental payments, including rent holidays, leasehold incentives, and scheduled rent increases are expensed on a straight-line basis. Leasehold improvements are amortized over the shorter of the depreciable lives of the corresponding fixed assets or the lease term including any applicable renewals.
TPI COMPOSITES, INC. AND SUBSIDIARIES
Notes to Consolidated Financial Statements
(o)(p) Debt Issuance Costs and Discount
Costs associated with the issuance of debt are included in other noncurrent assets and are amortized over the term of the related debt using the effective interest rate method. Debt issuance discounts are presented net of the related debt and are amortized over the term of the debt.debt using the effective interest rate method. See Note 1,Summary of Operations and Significant Accounting Policies – (u) Recently Issued Accounting Pronouncements for more details.
(p)(q) Income Taxes
Income taxes are accounted for under the asset and liability method in accordance with FASBFinancial Accounting Standards Board (FASB) Accounting Standard Codification (ASC) Topic 740,Income Taxes. Deferred tax assets and liabilities are measured using enacted tax rates expected to apply to taxable income in the years in which those differences are projected to be recovered or settled. Realization of deferred tax assets is dependent on the Company’s ability to generate sufficient taxable income of an appropriate character in future periods. A valuation allowance is established if it is determined to be more likely than notmore-likely-than-not that a deferred tax asset will not be realized. Interest and penalties related to unrecognized tax benefits are reported in income tax expense, See note 18,Note 17,Income Taxes.
TPI COMPOSITES, INC. AND SUBSIDIARIES
Notes to Consolidated Financial Statements
(q)(r) Net LossIncome Per Share Calculation
The basic net lossincome per common share is computed by dividing the net lossincome by the weighted-average number of common shares outstanding during a period. Diluted net income per common share is computed by dividing the net income, adjusted on an as-if-converted basis, by the weighted-average number of common shares outstanding plus potentially dilutive securities. The table below reflects the calculation of the weighted-average number of common shares outstanding, on an as if converted basis, used in computing basic and diluted earnings per common share for the years ended December 31 (in thousands):
2016 | 2015 | 2014 | ||||||||||
Basic weighted-average shares outstanding | 17,530 | 4,238 | 4,238 | |||||||||
Effect of dilutive stock options and warrants | 86 | — | — | |||||||||
|
|
|
|
|
| |||||||
Diluted weighted-average shares outstanding | 17,616 | 4,238 | 4,238 | |||||||||
|
|
|
|
|
| |||||||
The Company has other potentiallydid not have potential dilutive securities outstanding that are not shown in athe diluted net income per share calculation for the year ended December 31, 2016. The Company had potentially dilutive securities of 4,571,007 outstanding for each of the years ended December 31, 2015 and 2014 that are not shown in the diluted net loss per share calculation because their effect in 2015, 2014 and 2013 would be anti-dilutive. TheseThe potentially dilutive securities excluded from the calculation include common shares issued upon conversion or exercise of convertible and redeemable preferred shares, options and warrants. At both
Assuming that the IPO had occurred on January 1, 2014, diluted earnings per share would have been $0.41, $0.23 and a loss of $0.20 for the years ended December 31, 2016, 2015 and 2014, assuming an event other than a qualified initial public offering, these securities included convertible preferred shares of 4,477,240, warrants of 58,064 and stock options of 35,703 for a total of 4,571,007 dilutive securities. At December 31, 2013, assuming an event other than a qualified initial public offering, these securities included convertible preferred shares of 4,477,240, warrants of 28,096 and stock options of 34,560 for a total of 4,539,896 dilutive securities.respectively.
(r)(s) Use of Estimates
The preparation of consolidated financial statements in conformity with U.S. generally accepted accounting principles (GAAP) requires management to make estimates and assumptions that affect the reported amounts of assets and liabilities and disclosure of contingent assets and liabilities at the date of the consolidated financial statements and the reported amounts of revenues and expenses during the reporting period. Actual
TPI COMPOSITES, INC. AND SUBSIDIARIES
Notes to Consolidated Financial Statements
results could differ from those estimates. Significant items subject to such estimates and assumptions include the useful lives of property, plant, and equipment, realizability of intangible assets and deferred tax assets, inventory valuation, relative selling prices for revenue recognition, fair value of stock options and warrants, warranty reserves and other contingencies.
(s)(t) Fair Value of Financial Instruments
FASB ASC Topic 820,Fair Value Measurements, defines fair value as the price that would be received to sell an asset or paid to transfer a liability in an orderly transaction between market participants at the measurement date. Topic 820 also specifies a fair value hierarchy that requires an entity to maximize the use of observable inputs and minimize the use of unobservable inputs when measuring fair value. The standard describes three levels of inputs that may be used to measure fair value is follows:
Level 1: Quoted prices in active markets for identical assets or liabilities;
Level 2: Observable inputs other than Level 1 prices, such as quoted prices for similar assets or liabilities; quoted prices in markets that are not active; or other inputs that are observable or can be corroborated by observable market data for substantially the full term of the assets or liabilities; and
Level 3: Valuation is generated from model-based techniques that use significant assumptions not observable in the market. These unobservable assumptions reflect the Company’s own estimate of assumptions that market participants would use in pricing the asset or liability.
The carrying amounts of cash and cash equivalents, trade accounts receivable, income taxes receivable, accounts payable and accrued expenses and income taxes payable approximate fair value because of the short-term nature of these financial instruments. The carrying amount of working capital loans approximates fair value due to their short term nature and the loans carry a current market rate of interest, a level 2 input. The carrying value of long-term debt approximates fair value based on its variable rate index or based upon market interest rates available to the Company for debt of similar risk and maturities, both of which are level 2 inputs.
TPI COMPOSITES, INC. AND SUBSIDIARIES
Notes to Consolidated Financial Statements
(t)(u) Recently Issued Accounting Pronouncements
Revenue from Contracts with Customers
In May 2014, the FASB issued ASU 2014-09,Revenue from Contracts with Customers, (Topic 606). ASU 2014-09 is a comprehensive new revenue recognition model requiring a company to recognize revenue to depict the transfer of goods or services to a customer at an amount reflecting the consideration it expects to receive in exchange for those goods or services. On July 9, 2015, the FASB voted to approve a one year deferral of the effective date of ASU 2014-09. As a result, the Company expects that it will apply the new revenue standard to annual and interim reporting periods beginning after December 15, 2017. In adopting ASU 2014-09, companies may use either a full retrospective or a modified retrospective approach. Management is evaluating the provisions of ASU 2014-09 and has not yet selected a transition method nor determined what impact the adoption of ASU 2014-09 will have on the Company’s financial position or results of operations.
Share-Based Payments with Performance Conditions
In June 2014, the FASB issued ASU 2014-12,Accounting for Share-Based Payments When the Terms of an Award Provide That a Performance Target Could Be Achieved after the Requisite Service Period.ASU 2014-12 requires that a performance target that affects vesting and that could be achieved after the requisite service period be treated as a performance condition of the award. A reporting entity should apply existing guidance in Accounting Standards Codification (ASC) Topic 718, “Compensation-Stock Compensation”, as it relates to such awards. ASU 2014-12 is effective for fiscal years beginning after December 15, 2015, and may be applied prospectively or retrospectively. Early adoption is permitted. The Company has adopted the provisions of ASU 2014-12 effective December 31, 2015 and has determined that the adoption of ASU 2014-12 did not have a material effect on the Company’s financial position or results of operations.
Going Concern
In August 2014, the FASB issued ASU 2014-15,Presentation of Financial Statements – Going Concern (Subtopic 205-40): Disclosure of Uncertainties about an Entity’s Ability to Continue as a Going Concern. ASU 2014-15 requires an entity to evaluate whether there are conditions or events, in the aggregate, that raise substantial doubt about the entity’s ability to continue as a going concern within one year after the date that the financial statements are issued (or within one year after the financial statements are available to be issued when applicable) and to provide related footnote disclosures in certain circumstances. ASU 2014-15 is effective for the annual period ending after December 15, 2016, and for annual and interim periods thereafter. Early application is permitted. Management does not expect the adoption of ASU 2014-15 to have any effect on the Company’s financial position, results of operations, or related disclosures.
Simplifying the Presentation of Debt Issuance Costs
In April 2015, the FASB issued ASUAccounting Standards Update (ASU) 2015-03,Simplifying the Presentation of Debt Issuance Costs. ASU 2015-03 requiresrequired that debt issuance costs related to a recognized debt liability be presented in the balance sheet as a direct deduction from the carrying amount of that debt liability, consistent with debt discounts. ASU 2015-03 iswas effective for the first interim period for fiscal years beginning after December 15, 2015. Consequently, during the three months ended March 31, 2016, the Company adopted ASU 2015-03 on a retrospective basis, which resulted in the reclassification of the noncurrent debt issuance cost asset on the December 31, 2015 with early adoption permitted for financial statements that have not been previously issued. Management does not expectconsolidated balance sheet, which decreased total assets by $4.2 million and decreased total liabilities from $326.5 million to $322.3 million, to conform to the current presentation. The adoption of ASU 2015-03 tothis guidance did not have any effecta material impact on the Company’s financial position orcondition, results of operations.operations or disclosures of the Company. See Note 13,Long Term Debt, Net of Debt Issuance Costs and Discount.
Revenue from Contracts with Customers
In May 2014, the FASB issued Accounting Standards Update (ASU) 2014-09,Revenue from Contracts with Customers, (Topic 606), which provides new recognition and disclosure requirements for revenue from
TPI COMPOSITES, INC. AND SUBSIDIARIES
Notes to Consolidated Financial Statements
Presentationcontracts with customers that supersedes the existing revenue recognition guidance. The new recognition requirements focus on when the customer obtains control of the goods or services, rather than the current risks and Subsequent Measurementrewards model of Debt Issuance Costs Associationrecognition. The core principle of the new standard is that an entity will recognize revenue when it transfers goods or services to its customers in an amount that reflects the consideration an entity expects to be entitled to for those goods or services. The new disclosure requirements will include information intended to communicate the nature, amount, timing and any uncertainty of revenue and cash flows from the applicable contracts, including any significant judgments and changes in judgments and assets recognized from the costs to obtain or fulfill a contract. Entities will generally be required to make more estimates and use more judgment under the new standard.
The new requirements are effective for the Company beginning January 1, 2018, and may be implemented either retrospectively for all periods presented, or as a cumulative-effect adjustment as of the date of adoption.
The Company expects to adopt Topic 606 as of January 1, 2018 with Lineretrospective application to January 1, 2016 through December 31, 2017. Based on the Company’s preliminary evaluation of Credit Arrangementsthe new standard, revenue recognition in accordance with Topic 606 differs from the current guidance provided by GAAP as outlined in the SEC’s Staff Accounting Bulletin 104, which requires the Company to defer recognition of revenue until the risk of loss has passed to the customer and delivery has been made or a fixed delivery schedule has been provided by the customer. Since the Company’s products have no alternative use to the Company due to contractual restrictions placed by each customer on the technical specifications and design of the products, the Company’s preliminary assessment is that revenue upon adoption of Topic 606 will likely be recognized over time during the course of the production process and before the product is delivered to the customer.
The Company expects that the adoption of Topic 606 will have a material impact on the amount of net sales, cost of goods sold and income from operations reported in the Consolidated Statements of Operations in future periods. In accordance with Topic 606, revenues will be recognized over the time period of the production process, whereas currently it is recognized upon delivery to the client. Further, since revenue will be recognized over time for manufacturing contracts, future net sales will include amounts related to products that are in production as of the period end. Finally, the gross margin realized in the period may be impacted by the changes related to the timing and amount of revenue recognized for products in the production process.
The changes noted above involving the timing of revenue recognition will materially impact the amount of reported assets and liabilities associated with our manufacturing contracts. Upon adoption of Topic 606, the Company will include amounts recognized in revenue for products in production in contract assets, which differs from the current practice of including the balances in inventory and will include an amount for the margin recognized to date. The Company believes that it will no longer report inventory held for customer orders since revenue will be recognized over time during the course of the production process and before the product is delivered to the customer. Contract liabilities will be reported for amounts collected from customers in advance of the production of products. The amount of deferred revenue will be substantially reduced as revenue for products will be recognized over time.
The Company does not anticipate a change in the timing of cash receipts and payments from customers as customers will continue to be invoiced as products are completed; however, the impact to the amounts reported in the statements of cash flows operating activities upon application of Topic 606 is expected to be material.
The Company has a project plan in place for the transition to revenue recognition in accordance with Topic 606 including necessary changes to accounting processes and procedures, the chart of accounts, the system
TPI COMPOSITES, INC. AND SUBSIDIARIES
Notes to Consolidated Financial Statements
of internal control and retrospective application of the standard to periods beginning January 1, 2016 through December 31, 2017. The Company expects to complete the plan in time to report in accordance with Topic 606 for the first quarterly filing on Form 10-Q for the period ended March 31, 2018.
Share-Based Compensation
In August 2015,March 2016, the FASB issued ASU 2015-15,2016-09,Presentation and Subsequent Measurement of Debt Issuance Costs Association with Line of Credit ArrangementsCompensation – Stock Compensation (Topic 718) – Improvements to Employee Share-Based Payment Accounting. ASU 2015-15 indicates that2016-09 is intended to simplify several areas of accounting for share-based compensation arrangements, including the guidance in ASU 2015-03 did not address the presentation or subsequent measurement of debt issuance costs related to line of credit arrangements. Given the absence of authoritative guidance within ASU 2015-03, the SEC staff has indicated that they would not object to an entity deferring and presenting debt issuance costs ratably over the term of a line of credit arrangement, regardless of whether there are any outstanding borrowingsincome tax impact, classification on the linestatement of credit arrangement. Management does not expect thecash flows and forfeitures. This standard is effective for annual and interim periods beginning after December 15, 2016. Early adoption is permitted. The adoption of ASU 2015-15 to2016-09 on January 1, 2017 will not have anya material effect on the Company’s financial positionpositions or results of operations.
Income Taxes (Topic 740) Balance Sheet Classification of Deferred Taxes
In November 2015, the FASB issued ASU 2015-17,Income Taxes (Topic 740): Balance Sheet Classification of Deferred Taxes, which changes how deferred taxes are classified on an entity’s balance sheet. The ASU eliminates the current requirement for organizations to present deferred tax liabilities and assets as current and noncurrent in a classified balance sheet. Instead, organizations will be required to classify all deferred tax assets and liabilities as noncurrent. The amendment applies to all entities that present a classified balance sheet. For public companies, the amendment is effective for financial statements issued for annual periods beginning after December 16, 2016, and interim periods within those annual periods. Early adoption is permitted, which the Company has elected effective December 31, 2015. The result of the application of this guidance was a reclassification of the current deferred tax assets and liabilities to long-term deferred tax assets and liabilities in the consolidated balance sheets.
Leases
In February 2016, the FASB issued ASU 2016-02,Leases, (Topic 842). ASU 2016-02 is a comprehensive new recognition model for leases requiring a lessee to recognize the asset and liability that arise from leases. For public companies, the amendment is effective for financial statements issued for annual periods beginning after December 16, 2018. Entities may elect to early adopt the lease standard in 2016. In adopting ASU 2016-02, entities are required to recognize and measure leases at the beginning of the earliest period presented using a modified retrospective approach. The modified retrospective approach includes a number of optional practical expedients that entities may elect to apply. Management is evaluating the provisions of ASU 2016-02 and has not yet selected a transition method nor determined what impact the adoption of ASU 2016-02 will have on the Company’s financial position or results of operations.
Financial Instruments
In June 2016, the FASB issued ASU 2016-13,Financial Instruments – Credit Losses: Measurement of Credit Losses on Financial Instruments. ASU 2016-13 revises the accounting requirements related to the measurement of credit losses on financial instruments and the timing of when such losses are recorded. ASU 2016-13 is effective for fiscal years, and interim periods within those years, beginning after December 15, 2019. Early adoption is permitted for fiscal years and interim periods within those years, beginning after December 15, 2018. Accordingly, ASU 2016-13 is effective for the Company on January 1, 2020 using a modified retrospective approach, and the Company is currently evaluating the impact that the standard will have on the Company’s financial positions and results of operations.
There have been no other recent accounting pronouncements or changes in accounting pronouncements during the current year that are of significance, or potential significance, to the Company.
Note 2. Significant Risks and Uncertainties
The Company’s revenues and receivables are from a small number of customers. As such, the Company’s production levels are dependent on these customers’ orders. See note 19,Note 18,Concentration of Customers.
The Company maintains its U.S. cash in bank deposit accounts that, at times, exceed U.S. federally insured limits. U.S. bank accounts are guaranteed by the Federal Deposit Insurance Corporation (FDIC) in an amount up to $250,000 during 20152016 and 2014.2015. At December 31, 20152016 and 2014,2015, the Company had $33.2$103.4 million and $26.0$33.2 million, respectively, of cash in deposit accounts in high quality U.S. banks, which was in excess of FDIC limits. The Company has not experienced losses in any such accounts.
TPI COMPOSITES, INC. AND SUBSIDIARIES
Notes to Consolidated Financial Statements
The Company also maintains cash in bank deposit accounts outside the U.S. with no insurance. ThisAt December 31, 2016, this includes $7.2$2.5 million in Turkey, $5.3$12.3 million in China and $0.2$0.9 million in Mexico. The Company has not experienced losses in these accounts. The Company also has long-term deposits in interest bearing accounts of $2.1$8.1 million in Mexico. See note 10,Note 9,Other Noncurrent Assets.
Note 3. Investments in Joint Venture and Noncontrolling Interest
In 2012, the Company entered into a wind blade manufacturing plant joint venture in Izmir, Turkey with ALKE by purchasing 75 percent of the registered shares of TPI Kompozit Kanat Sanayi Ve Ticaret A.S. Of the total consideration of $6.1 million, $2.3 million was allocated to a customer agreement, which is included in intangible assets on the consolidated balance sheets. See note 9,Intangible Assets, Net. The customer agreement is being amortized over the life of the related agreement of 45 months.
The Company entered into a supply agreement with a customer in 2011 to manufacture wind blades in Izmir, Turkey. The supply agreement, as amended in 2012, also contained terms for secured zero-interest customer advances totaling approximately $5.0 million. The advances were repaid as inventory was sold to the customer through a reduction in the receivable from the customer. The advance was paid in full in April 2014. See note 11,Customer Deposits and Customer Advances.
In December 2013, the Company acquired the remaining 25 percent interest in the Turkey operation for $0.5 million in cash and $3.5 million in notes payable, making the Turkey operation a wholly-owned subsidiary of the Company. The notes payable were paid in full as of December 31, 2015.
The noncontrolling interest’s share of the net loss for 2013 through the date of the acquisition was $2.3 million. The loss from the noncontrolling interest was tax-effected at the statutory rate in Turkey of 20 percent adjusting for deferred tax treatment and permanent differences with a net tax benefit allocation of $0.5 million.
Note 4. Related-Party Transactions
Related party transactions include transactions between the Company and certain of its affiliates. The following transactions were in the normal course of operations and were measured at the exchange amount, which is the amount of consideration established and agreed to by the parties.
The Company has historically entered into several agreements with subsidiaries of General Electric Company and its consolidated affiliates (GE) relating to the operation of its business. As a result of these agreements, GE ishas been a debtor, creditor, and holder of preferred shares asand now a holder of December 31, 2015 and 2014.common shares.
As disclosed at note 19,Concentration of Customers, for the years ended December 31, 2015, 2014 and 2013, the Company recorded related-party sales with GE of $312.5 million, $234.8 million and $196.1 million, respectively. The Company has entered into fourfive separate supply agreements with GE to manufacture wind blades in Newton, Iowa; Taicang Port, China; Juárez, Mexico (2) and Izmir, Turkey. As a result of the supply agreements, GE is the Company’s largest customer. As disclosed at note 18,Concentration of Customers, for the years ended December 31, 2016, 2015 and 2014, the Company recorded related-party sales with GE of $379.9 million, $312.5 million and $234.8 million, respectively. As of December 31, 20152016 and 2014,2015, the Company had accounts receivables related to sales to GE of approximately $16.6 million and $19.0 million, and $14.1 million, respectively. In connection with three of the supply agreements with GE, the Company secured zero-interest customer advances of $8.0 million (China), $6.5 million (Iowa), and $5.0 million (Turkey) to be provided over the startup period of each facility. In July 2014, Iowa received an advance payment from GE in the amount of $2.5 million. The outstanding balances were paid in full in connection with the new credit facility obtained in August 2014 (Note 14). See note 12,Customer Deposits and Customer Advances.
TPI COMPOSITES, INC. AND SUBSIDIARIES
Notes to Consolidated Financial Statements
Since 2007, the Company hashad issued threemultiple series of preferred shares. In connection with theshares, including several preferred share issuances to GE. Immediately prior to the Company sold Series B, Series B-1, and senior redeemableclosing of the IPO, all shares of the then-outstanding preferred shares to GE.were converted into shares of common stock. As a result of these transactions, GE beneficially owns approximately 11.2%8.4% of the CompanyCompany’s outstanding common stock as of December 31, 2015.2016. See note 15,Note 14,Convertible and Senior Redeemable Preferred Shares and Warrants.
In January 2016, the Company entered into an agreement with GE and received an advance of $2.0 million, which the Company repaid in full in August 2016. See Note 5.11,Customer Deposits and Customer Advances.
Certain of the Company’s existing stockholders, consisting of entities associated with Element Partners, Angeleno Group and Landmark Partners, each of which is an affiliate of a member of the board of directors, as well as certain executive officers and a director, purchased an aggregate of 1,250,000 shares of common stock in the IPO. In addition, all outstanding obligations under the Company’s subordinated convertible promissory notes, including accrued interest, held by certain existing stockholders, including Element Partners, Angeleno Group and Landmark Partners, were converted into an aggregate of 1,079,749 shares of common stock concurrent with the closing of the IPO at the public offering price of $11.00 per share.
Note 4. Accounts Receivable
Accounts receivable at December 31 consisted of the following (in thousands):
2015 | 2014 | 2016 | 2015 | |||||||||||||
Trade accounts receivable | $ | 71,588 | $ | 42,394 | $ | 66,612 | $ | 71,588 | ||||||||
Other accounts receivable | 1,325 | 2,038 | 1,230 | 1,325 | ||||||||||||
|
|
|
| |||||||||||||
Total accounts receivable | $ | 72,913 | $ | 44,432 | $ | 67,842 | $ | 72,913 | ||||||||
|
|
|
| |||||||||||||
TPI COMPOSITES, INC. AND SUBSIDIARIES
Notes to Consolidated Financial Statements
Note 6.5. Inventories
Inventories at December 31 consisted of the following (in thousands):
2015 | 2014 | 2016 | 2015 | |||||||||||||
Raw materials | $ | 29,022 | $ | 20,431 | $ | 29,278 | $ | 29,022 | ||||||||
Work in process | 16,630 | 15,452 | 21,169 | 16,630 | ||||||||||||
Finished goods | 5,189 | 8,134 | 2,648 | 5,189 | ||||||||||||
|
|
|
| |||||||||||||
Total Inventories | $ | 50,841 | $ | 44,017 | ||||||||||||
Total inventories | $ | 53,095 | $ | 50,841 | ||||||||||||
|
|
|
| |||||||||||||
Note 7.6. Prepaid Expenses and Other Current Assets
Prepaid expenses and other current assets at December 31 consisted of the following (in thousands):
2015 | 2014 | |||||||
Refundable value-added tax | $ | 12,052 | $ | 11,060 | ||||
Prepaid customs and duty charges | 5,891 | — | ||||||
Deposits | 3,140 | 5,502 | ||||||
Deferred expenses | 2,807 | — | ||||||
Prepaid rebates | 523 | 494 | ||||||
Deferred tax assets | — | 590 | ||||||
Other prepaid expenses | 5,531 | 1,460 | ||||||
Other current assets | 1,393 | 1,254 | ||||||
|
|
|
| |||||
Total prepaid expenses and other current assets | $ | 31,337 | $ | 20,360 | ||||
|
|
|
| |||||
TPI COMPOSITES, INC. AND SUBSIDIARIES
Notes to Consolidated Financial Statements
2016 | 2015 | |||||||
Refundable value-added tax | $ | 5,229 | $ | 12,052 | ||||
Prepaid customs and duty charges | 8,289 | 5,891 | ||||||
Deposits | 8,135 | 3,140 | ||||||
Deferred expenses | — | 2,807 | ||||||
Prepaid rebates | 519 | 523 | ||||||
Other prepaid expenses | 8,130 | 5,531 | ||||||
Other current assets | 355 | 1,393 | ||||||
|
|
|
| |||||
Total prepaid expenses and other current assets | $ | 30,657 | $ | 31,337 | ||||
|
|
|
| |||||
Note 8.7. Property, Plant, and Equipment, Net
Property, plant, and equipment, net at December 31 consisted of the following (in thousands):
2015 | 2014 | 2016 | 2015 | |||||||||||||
Machinery and equipment | $ | 49,078 | $ | 39,050 | $ | 70,481 | $ | 49,078 | ||||||||
Buildings | 14,047 | 10,787 | 13,449 | 14,047 | ||||||||||||
Leasehold improvements | 14,259 | 8,114 | 16,818 | 14,259 | ||||||||||||
Office equipment and software | 3,691 | 3,137 | 6,403 | 3,691 | ||||||||||||
Furniture | 15,140 | 6,330 | 15,883 | 15,140 | ||||||||||||
Vehicles | 279 | 255 | 342 | 279 | ||||||||||||
Construction in progress | 4,660 | 10,196 | 11,592 | 4,660 | ||||||||||||
|
|
|
| |||||||||||||
Total | 101,154 | 77,869 | 134,968 | 101,154 | ||||||||||||
Accumulated depreciation | (33,422 | ) | (26,070 | ) | (43,802 | ) | (33,422 | ) | ||||||||
|
|
|
| |||||||||||||
Property, plant and equipment, net | $ | 67,732 | $ | 51,799 | $ | 91,166 | $ | 67,732 | ||||||||
|
|
|
| |||||||||||||
As of December 31, 2015,2016, the Company had undertaken projects including the expansionsconstruction and outfitting of its second and facility improvements to thethird wind blade production facilities in Taicang and Dafeng, China; Juárez, Mexico, and Izmir, Turkey,facility improvements to certain of our wind blade production facilities, as well as the purchase of equipment and machinery across all plantsfacilities and the Corporate office.
TPI COMPOSITES, INC. AND SUBSIDIARIES
Notes to Consolidated Financial Statements
Total depreciation for the years ended December 31, 2016, 2015 and 2014 and 2013 was $12.7 million, $10.6 million $6.7 million, and $4.5$6.7 million, respectively.
As of December 31, 2016, the cost and accumulated depreciation of property, plant and equipment that the Company is leasing under capital lease arrangements is $23.4 million and $4.4 million, respectively. As of December 31, 2015, the cost and accumulated depreciation of property, plant and equipment that the Company is leasing under capital lease arrangements is $13.8 million and $2.4 million, respectively. As
Note 8. Intangible Assets, Net
Carrying values and estimated useful lives of intangible assets as of December 31, 2014,2016, consisted of the cost and accumulated depreciation of property, plant and equipment that the Company is leasing under capital lease arrangements is $9.4 million and $0.7 million, respectively.following (in thousands):
Note 9. Intangible Assets, Net
Estimated Useful Life | Cost | Accumulated Amortization | Net | |||||||||||||
Patents | 13 years | $ | 2,000 | $ | (1,885 | ) | $ | 115 | ||||||||
Trademarks | Indefinite | 150 | — | 150 | ||||||||||||
|
|
|
|
|
| |||||||||||
| $ | 2,150 | $ | (1,885 | ) | $ | 265 | ||||||||||
|
|
|
|
|
| |||||||||||
Carrying values and estimated useful lives of intangible assets as of December 31, 2015, consisted of the following (in thousands):
Estimated Useful Life | Cost | Accumulated | Net | |||||||||||
Patents | 13 years | $ | 2,000 | $ | (1,731 | ) | $ | 269 | ||||||
Customer agreements | 3 years 9 months | 2,328 | (2,328 | ) | — | |||||||||
Trademarks | Indefinite | 150 | — | 150 | ||||||||||
|
|
|
|
|
| |||||||||
| $ | 4,478 | $ | (4,059 | ) | $ | 419 | ||||||||
|
|
|
|
|
| |||||||||
Carrying values and estimated useful lives of intangible assets as of December 31, 2014, consisted of the following (in thousands):
Estimated Useful Life | Cost | Accumulated | Net | |||||||||||
Patents | 13 years | $ | 2,000 | $ | (1,577 | ) | $ | 423 | ||||||
Customer agreements | 3 years 9 months | 2,328 | (1,714 | ) | 614 | |||||||||
Trademarks | Indefinite | 150 | — | 150 | ||||||||||
|
|
|
|
|
| |||||||||
| $ | 4,478 | $ | (3,291 | ) | $ | 1,187 | ||||||||
|
|
|
|
|
| |||||||||
TPI COMPOSITES, INC. AND SUBSIDIARIES
Notes to Consolidated Financial Statements
Estimated Useful Life | Cost | Accumulated Amortization | Net | |||||||||||||
Patents | 13 years | $ | 2,000 | $ | (1,731 | ) | $ | 269 | ||||||||
Customer agreements | 3 years 9 months | 2,328 | (2,328 | ) | — | |||||||||||
Trademarks | Indefinite | 150 | — | 150 | ||||||||||||
|
|
|
|
|
| |||||||||||
| $ | 4,478 | $ | (4,059 | ) | $ | 419 | ||||||||||
|
|
|
|
|
| |||||||||||
The weighted-average remaining amortization period for the Company’s amortizable intangible assets is approximately 1.7 years.0.7 years and thus the amortizable intangible assets will be fully-amortized by December 31, 2017. During the years ended December 31, 2016, 2015 2014 and 2013,2014, the Company recorded amortization expense of $0.2 million, $0.8 million in each year.and $0.8 million, respectively.
Estimated amortization of the amortizable intangible assets for each of the years ending December 31 is expected to be (in thousands):
2016 | $ | 154 | ||
2017 | 115 | |||
|
| |||
| $ | 269 | |||
|
|
Note 10.9. Other Noncurrent Assets
Other noncurrent assets at December 31 consisted of the following (in thousands):
2015 | 2014 | 2016 | 2015 | |||||||||||||
Deferred financing fees | $ | 4,220 | $ | 4,256 | ||||||||||||
Restricted cash | 2,537 | 5,430 | $ | 8,538 | $ | 2,537 | ||||||||||
Deferred tax assets | 1,661 | 355 | 5,131 | 1,661 | ||||||||||||
Land use right | 1,796 | 1,951 | 1,648 | 1,796 | ||||||||||||
Deposits | 486 | 479 | 2,422 | 486 | ||||||||||||
Other | 120 | 730 | 2 | 120 | ||||||||||||
|
|
|
| |||||||||||||
Total other noncurrent assets | $ | 10,820 | $ | 13,201 | $ | 17,741 | $ | 6,600 | ||||||||
|
|
|
| |||||||||||||
As of December 31, 2016 and 2015, the Company maintained long-term deposits in interest bearing accounts, related to fully cash-collateralized letters of credit in connection with the facility leases at its Mexico
TPI COMPOSITES, INC. AND SUBSIDIARIES
Notes to Consolidated Financial Statements
locations, totaling $8.1 million and $2.1 million, respectively. The Company has also provided a fully cash-collateralized letter of credit in connection with an equipment lessor in Iowa totaling $0.4 million as of December 31, 2016 and 2015.
As a result of the refinancing of our previous credit facility, in the first quarter of 2017 $8.1 million of long-term deposits in interest bearing accounts, related to fully cash-collateralized letters of credit, were returned to the Company and applied against its letter of credit sub-facility under the Amended Credit Facility.
The land use right was purchased during 2007 and permits the Company to use the land where itsthe Taicang Port, China facility, owned by the Company, is situated. The Company is amortizing the land use right on a straight-line basis over its 50 year life. Amortization of the land use right began upon the opening of the plant in 2008.
Note 11.10. Accrued Warranty
Warranty accrual at December 31 consisted of the following (in thousands):
2015 | 2014 | 2013 | 2016 | 2015 | 2014 | |||||||||||||||||||
Warranty accrual at beginning of year | $ | 5,916 | $ | 3,748 | $ | 4,078 | $ | 13,596 | $ | 5,916 | $ | 3,748 | ||||||||||||
Accrual during the year | 10,653 | 3,211 | 619 | 18,886 | 10,653 | 3,211 | ||||||||||||||||||
Cost of warranty services provided during the year and reduction of reserves | (2,973 | ) | (1,043 | ) | (949 | ) | ||||||||||||||||||
Cost of warranty services provided during the year(1) | (10,808 | ) | (1,349 | ) | (548 | ) | ||||||||||||||||||
Reduction of reserves | (1,762 | ) | (1,624 | ) | (495 | ) | ||||||||||||||||||
|
|
|
|
|
| |||||||||||||||||||
Warranty accrual at end of year | $ | 13,596 | $ | 5,916 | $ | 3,748 | $ | 19,912 | $ | 13,596 | $ | 5,916 | ||||||||||||
|
|
|
|
|
| |||||||||||||||||||
| (1) | The 2016 amount includes an 8.0 million Euro ($8.5 million) payment related to the Nordex settlement agreement. |
Note 12.11. Customer Deposits and Customer Advances
The Company regularly enters into contracts for the production of composite structures that require the purchase of raw materials specific to the customers’ orders. As such, the Company may require that customers pay a deposit prior to the beginning of production. The customer deposits are recorded as current liabilities in the consolidated balance sheets and are reduced as the Company invoices its customers for work performed or the products are delivered. As of December 31, 20152016 and 2014,2015, the Company had customer deposits of $1.4 million and $8.9 million, and $12.1 million, respectively.
TPI COMPOSITES, INC. AND SUBSIDIARIES
Notes to Consolidated Financial Statements
The Company may receive customers advances used to assist with the cash required for the transition and startup of operations at facilities. Interest on these advances is imputed and a discount is recorded on the customer advances. The rate used approximates that which the Company estimates it could have received if financed from third parties. The discount is recorded as deferred revenue and recognized as net sales on a straight-line basis over the term of the supply agreements with the customer.
Customer advances received from GE through July 2014 included $9.0 million for the Newton, Iowa plant; $8.0 million for the plant in Taicang Port, China and $5.0 million for the plant in Turkey. In connection with the debt refinancing in August 2014 as detailed in note 14,Long-Term Debt,Net of Discount, the remaining advance payments were paid off in full.
In March 2014, the Company’s Mexico segment received aggregate advance payments of $2.0 million as well as manufacturing equipment valued at $0.8 million from one of its customers to help fund the startup of the plant in Mexico. The agreement, as amended later in May 2014, required the Company to repay the advance payments and equipment cost without interest, through future credits against a specified number of products sold to the customer. Duringcustomer during 2014 and 2015. For the yearsyear ended December 31, 2015, and 2014,the remaining balance of $1.2 million and $1.6 million was repaid through credits, respectively. Customer advances at December 31 consisted of the following (in thousands):credits.
TPI COMPOSITES, INC. AND SUBSIDIARIES
Notes to Consolidated Financial Statements
2015 | 2014 | |||||||
Customer advances, beginning of year | $ | 1,171 | $ | 4,149 | ||||
Customer advances received | — | 5,280 | ||||||
Less: Repayments | (1,171 | ) | (8,258 | ) | ||||
|
|
|
| |||||
Total customer advances, end of year | — | 1,171 | ||||||
Less: Current portion of customer advances | — | 1,171 | ||||||
|
|
|
| |||||
Customer advances, net of current portion | $ | — | $ | — | ||||
|
|
|
| |||||
In January 2016, the Company entered into an agreement with GE and received an advance of $2.0 million, which the Company repaid in full in August 2016. See Note 3,Related-Party Transactions.
Note 13.12. Share-Based Compensation
The Company maintains two active incentive compensation plans: the 2008 Stock Option and Grant Plan and the 2015 Stock Option and Incentive Plan. The Company granted 10-year term stock options to employees and directors during 2010 under the 2008 Stock Option and Grant Plan, which vested over a 4- or 5-year period. The 2,869 shares available for grant under the 2008 Stock Option and Grant Plan have been added to the shares available under the 2015 Plan.
The Companyhas granted awards of stock options and restricted stock units (RSUs) duringin 2016 and 2015 to certain employees and non-employee directors under the Amended and Restated 2015 Stock Option and Incentive Plan. Each award includesgranted prior to the consummation of the Company’s IPO included a performance condition that requiresrequired the completion of an initial public offering (IPO) by the Company and a required vesting period of one to four years commencing upon achievement of the performance condition. TheAs the IPO was consummated in July 2016, the Company will beginbegan recording share-based compensation expense for the 2015 awards when the IPO is considered probable. The performance requirement has not been deemed to be probable of achievement until the consummation of the IPO, and therefore no compensation cost will be recognized until the IPO occurs. If an IPO is consummated by the Company, compensation expense will be recordedin July 2016 for the requisite service period from the grant date through the IPO date with the balance of the stock basedshare-based compensation to be expensed over the remaining vesting period. No share-based compensation awards were granted in 2014.
Total share-based compensation expense recognized during the year ended December 31, 2016 was $9.9 million. Upon completion of the IPO and the achievement of the performance condition, the Company was required to record share-based compensation expense for the requisite service period from the grant date which included approximately $3.6 million related to the portion of the service period from the grant date through December 31, 2015. Of the $9.9 million expense, $1.5 million is included in cost of goods sold and the remaining $8.4 million included in general and administrative expenses. The amount recorded related to RSUs was $3.5 million while $6.4 million related to stock options. No share-based compensation expense was recorded during the years ended December 31, 2015 or 2014 and no share-based compensation costs were capitalized during 2016, 2015 or 2013.
TPI COMPOSITES, INC. AND SUBSIDIARIES
Notes to Consolidated Financial Statements
2014.
The summary of activity for the Company’s incentive plans is as follows:
| Stock Options | RSUs | Stock Options | RSUs | |||||||||||||||||||||||||||||||||||||||||||||
| Shares Available for Grant | Shares | Weighted- Average Exercise Price | Options Exercisable | Shares | Weighted- Average Grant Date Fair Value | |||||||||||||||||||||||||||||||||||||||||||
Balance as of December 31, 2012 | 1,537,733 | 48,960 | $ | 8.49 | 39,960 | — | $ | — | ||||||||||||||||||||||||||||||||||||||||
Granted | — | — | — | — | — | |||||||||||||||||||||||||||||||||||||||||||
Exercised | — | — | — | — | — | |||||||||||||||||||||||||||||||||||||||||||
Forfeited/cancelled | 13,257 | (13,257 | ) | 8.49 | — | — | ||||||||||||||||||||||||||||||||||||||||||
|
|
| Shares Available for Grant | Shares | Weighted- Average Exercise Price | Options Exercisable | Shares | Weighted- Average Grant Date Fair Value | ||||||||||||||||||||||||||||||||||||||||
Balance as of December 31, 2013 | 1,550,990 | 35,703 | 8.49 | 34,560 | — | — | 1,550,990 | 35,703 | $ | 8.49 | 34,560 | — | $ | — | ||||||||||||||||||||||||||||||||||
Granted | — | — | — | — | — | — | — | — | — | — | ||||||||||||||||||||||||||||||||||||||
Exercised | — | — | — | — | — | — | — | — | — | — | ||||||||||||||||||||||||||||||||||||||
Forfeited/cancelled (1) | (518,040 | ) | — | — | — | — | (518,040 | ) | — | — | — | — | ||||||||||||||||||||||||||||||||||||
|
|
|
|
|
| |||||||||||||||||||||||||||||||||||||||||||
Balance as of December 31, 2014 | 1,032,950 | 35,703 | 8.49 | 35,703 | — | — | 1,032,950 | 35,703 | 8.49 | 35,703 | — | — | ||||||||||||||||||||||||||||||||||||
Increase in shares authorized | 6,317,031 | — | — | — | — | 6,317,031 | — | — | — | — | ||||||||||||||||||||||||||||||||||||||
Granted | (4,001,040 | ) | 3,269,160 | 11.92 | 731,880 | 10.89 | (4,001,040 | ) | 3,269,160 | 11.92 | 731,880 | 10.89 | ||||||||||||||||||||||||||||||||||||
Exercised/vested | — | — | — | — | — | — | — | — | — | — | ||||||||||||||||||||||||||||||||||||||
Forfeited/cancelled | 43,200 | (43,200 | ) | 10.87 | — | — | 43,200 | (43,200 | ) | 10.87 | — | — | ||||||||||||||||||||||||||||||||||||
|
|
|
|
|
| |||||||||||||||||||||||||||||||||||||||||||
Balance as of December 31, 2015 | 3,392,141 | 3,261,663 | 11.90 | 35,703 | 731,880 | 10.89 | 3,392,141 | 3,261,663 | 11.90 | 35,703 | 731,880 | 10.89 | ||||||||||||||||||||||||||||||||||||
Increase in shares authorized | 169,546 | — | — | — | — | |||||||||||||||||||||||||||||||||||||||||||
Granted | (493,990 | ) | 493,990 | 17.37 | — | — | ||||||||||||||||||||||||||||||||||||||||||
Exercised/vested | — | — | — | — | — | |||||||||||||||||||||||||||||||||||||||||||
Forfeited/cancelled | 519,995 | (424,235 | ) | 11.78 | (95,760 | ) | 10.87 | |||||||||||||||||||||||||||||||||||||||||
|
|
|
|
|
| |||||||||||||||||||||||||||||||||||||||||||
Balance as of December 31, 2016 | 3,587,692 | 3,331,418 | 12.72 | 25,828 | 636,120 | 10.90 | ||||||||||||||||||||||||||||||||||||||||||
|
|
| ||||||||||||||||||||||||||||||||||||||||||||||
| (1) | Relates to shares previously available under the 2004 Long-Term Incentive Plan, which expired in September 2014. |
TPI COMPOSITES, INC. AND SUBSIDIARIES
Notes to Consolidated Financial Statements
The following table summarizes the outstanding and exercisable stock option awards as of December 31, 2015:2016:
| Options Outstanding | Options Exercisable | Options Outstanding | Options Exercisable | |||||||||||||||||||||||||||||||||||||
Range of Exercise Prices: | Shares | Weighted- (in years) | Weighted- | Shares | Weighted- | Shares | Weighted- (in years) | Weighted- Average Exercise Price | Shares | Weighted- Average Exercise Price | ||||||||||||||||||||||||||||||
$8.49 | 35,703 | 3.9 | $ | 8.49 | 35,703 | $ | 8.49 | 25,828 | 3.0 | $ | 8.49 | 25,828 | $ | 8.49 | ||||||||||||||||||||||||||
$10.87 | 2,621,160 | 9.4 | 10.87 | — | — | 2,278,800 | 8.4 | 10.87 | — | — | ||||||||||||||||||||||||||||||
$11.00 to $14.31 | 79,200 | 9.6 | 12.50 | — | — | |||||||||||||||||||||||||||||||||||
$16.53 | 604,800 | 9.6 | 16.53 | — | — | 604,800 | 9.0 | 16.53 | — | — | ||||||||||||||||||||||||||||||
$17.68 to $18.70 | 342,790 | 9.4 | 18.68 | — | — | |||||||||||||||||||||||||||||||||||
|
|
|
| |||||||||||||||||||||||||||||||||||||
$8.49 to $16.53 | 3,261,663 | 9.4 | 11.90 | 35,703 | 8.49 | |||||||||||||||||||||||||||||||||||
$8.49 to $18.70 | 3,331,418 | 8.6 | 12.72 | 25,828 | 8.49 | |||||||||||||||||||||||||||||||||||
|
|
|
| |||||||||||||||||||||||||||||||||||||
AdditionalThe following table contains additional information pertaining to stock options for the years ended December 31 is provided(in thousands):
| 2016 | 2015 | 2014 | ||||||||||
Total intrinsic value of stock options outstanding | $ | 12,251 | $ | 34,388 | $ | 330 | ||||||
Total intrinsic value of stock options exercisable | 195 | 498 | 330 | |||||||||
Fair value of stock options vested | — | — | 10 | |||||||||
As of December 31, 2016, the unamortized cost of the outstanding RSUs was $2.8 million, which the Company expects to recognize in the table below (in thousands);
| 2015 | 2014 | 2013 | ||||||||||
Total intrinsic value of stock options outstanding | $ | 34,388 | $ | 330 | $ | 330 | ||||||
Total intrinsic value of stock options exercisable | 498 | 330 | 320 | |||||||||
Fair value of stock options vested | — | 10 | 45 | |||||||||
consolidated financial statements over a weighted-average period of approximately 1.8 years. The total unrecognized cost related to non-vested stock option awards was $7.3 million as of December 31, 2016. The Company expects to recognize such costs in the consolidated financial statements over a weighted-average period of approximately 2.1 years. As of December 31, 2015, there were no unrecognized costs related to unvested stock options granted prior to 2015. There
The fair value of the stock options granted during the years ended December 31 were also no unrecognized costs related to unvested RSUs or stockcalculated using the Black-Scholes option awards granted inpricing model with the following assumptions:
| 2016 | 2015 | |||
Weighted-average fair value | $5.14 | $5.02 | ||
Expected volatility | 45.2% | 42.7% | ||
Expected life | 6.3 years | 6.3 years | ||
Risk-free interest rate | 0.9% | 0.7% | ||
Dividend yield | 0.0% | 0.0% |
TPI COMPOSITES, INC. AND SUBSIDIARIES
Notes to Consolidated Financial Statements
2015 due to the performance condition noted above, which has not been deemed to be probable of achievement. The weighted-average vesting period of such options and RSUs can also not be determined until the performance condition has been met.
The fair value of the stock options granted during the year ended December 31, 2015 were calculated using the Black-scholes option pricing model with the following assumptions:
| ||
| ||
| ||
| ||
|
During the year ended December 31, 2013, the Company recorded in general and administrative expenses, share-based compensation expense of $36,000 in connection with the stock options listed above. No share-based compensation expense was recorded during the years ended December 31, 2015 or 2014.
Note 14.13. Long-Term Debt, Net of Debt Issuance Costs and Discount
Long-term debt, net of debt issuance costs and discount, as of December 31 consisted of the following (in thousands):
2015 | 2014 | 2016 | 2015 | |||||||||||||
Senior term loan—U.S. | $ | 74,375 | $ | 55,000 | $ | 75,000 | $ | 74,375 | ||||||||
Senior revolving loan—US | 2,820 | — | ||||||||||||||
Subordinated convertible promissory notes—U.S. | 10,000 | 10,000 | — | 10,000 | ||||||||||||
Accounts receivable financing—EMEA | 15,120 | 20,505 | ||||||||||||||
Unsecured financing—EMEA | 4,638 | 8,572 | ||||||||||||||
Equipment financing—EMEA | 15,813 | — | ||||||||||||||
Accounts receivable financing—Asia | — | 6,622 | ||||||||||||||
Working capital loans—Asia | — | 9,548 | ||||||||||||||
Equipment capital lease—U.S. | 2,678 | 2,181 | 2,016 | 2,678 | ||||||||||||
Working capital loans—China | 9,548 | 19,120 | ||||||||||||||
Accounts receivable financing—China | 6,622 | 5,393 | ||||||||||||||
Accounts receivable financing—Turkey | 20,505 | 24,206 | ||||||||||||||
Unsecured financing—Turkey | 8,572 | 7,034 | ||||||||||||||
Equipment capital lease—Turkey | 2,879 | 4,296 | ||||||||||||||
Working capital loan—Turkey | — | 3,000 | ||||||||||||||
Equipment loan—Mexico | 164 | — | ||||||||||||||
Equipment capital lease—EMEA | 1,898 | 2,879 | ||||||||||||||
Construction financing—Mexico | 1,204 | 844 | — | 1,204 | ||||||||||||
Equipment capital lease—Mexico | 37 | 65 | 8,037 | 37 | ||||||||||||
Equipment loan—Mexico | 103 | 164 | ||||||||||||||
|
|
|
| |||||||||||||
Total long-term debt | 136,584 | 131,139 | 125,445 | 136,584 | ||||||||||||
Less: Debt issuance costs | (2,290 | ) | (4,220 | ) | ||||||||||||
Less: Discount on debt | (3,018 | ) | (6,034 | ) | — | (3,018 | ) | |||||||||
|
|
|
| |||||||||||||
Total long-term debt, net of discount | 133,566 | 125,105 | ||||||||||||||
Total long-term debt, net of debt issuance costs and | 123,155 | 129,346 | ||||||||||||||
Less: Current maturities of long-term debt | (52,065 | ) | (62,385 | ) | (33,403 | ) | (52,065 | ) | ||||||||
|
|
|
| |||||||||||||
Long-term debt, net of discount and current maturities | $ | 81,501 | $ | 62,720 | ||||||||||||
Long-term debt, net of debt issuance costs, discount and current maturities | $ | 89,752 | $ | 77,281 | ||||||||||||
|
|
|
| |||||||||||||
U.S.Senior Financing Agreements (U.S.):In February 2014, the Company entered into an agreement to borrow $5.0 million through an existing term loan with a financial institution. The borrowing provided for additional financial covenants on the entire $20.0 million borrowed from the lender. The Company granted the lender warrants for the right to purchase up to 40 shares of preferred stock of the Company. The warrants expire seven years after the effective date of the loan. The Company recorded these warrants at their fair value upon issuance of $0.1 million in accordance with FASB ASC Topic 480,Distinguishing Liabilities from Equity. This amount was accounted for as a debt discount and an increase in redeemable preferred share warrants. The Company has amortized the value of the debt discount as interest expense over the term of the loan. The loan’s interest only period was through June 1, 2014. The loan bore interest at 11.25% and was to mature on June 1, 2016. In connection with a new credit facility in 2014 as detailed below, the term loan was repaid in full and the remaining debt discount of $1.3 million was fully expensed within the caption “Loss on extinguishment of debt” in the accompanying consolidated statements of operations.
TPI COMPOSITES, INC. AND SUBSIDIARIES
Notes to Consolidated Financial Statements
In February 2014, the Company entered into a note purchase agreement with two of its current investors for the purchase of $5.0 million of subordinated convertible promissory notes of the Company. The promissory notes bore interest at a rate of 12.0% per annum, payable quarterly, starting April 1, 2014. In connection with the agreement, the Company granted the holders of the notes warrants for the right to purchase up to 40 shares of preferred stock of the Company. The warrants were earned monthly over 12 months, and expire seven years after the effective date of the loan. The Company recorded the warrants issued at their fair value upon issuance of $0.1 million in accordance with FASB ASC Topic 480. This amount was accounted for as a debt discount and an increase in redeemable preferred share warrants. The Company has amortized the value of the debt discount as interest expense over the term of the notes. In connection with the new credit facility in 2014 as detailed below, the promissory notes were paid in full and the remaining debt discount of $1.6 million was fully expensed within the caption “Loss on extinguishment of debt” in the accompanying consolidated statements of operations.
In March 2014, the Company entered into a lease agreement with a leasing company for the initial lease of up to $2.2 million of machinery and equipment at its Iowa facility. The lease agreement was subsequently amended and the amount of machinery and equipment available for lease was increased to $5.4 million. The lease includes an implied effective interest rate of 4.3% annually and requires monthly payments during each 24 month term.
In August 2014, the Company entered into an agreement to borrow up to $75.0 million through a credit facility (the Credit Facility) in order to refinance existing indebtedness as well as to fund current operations and future growth opportunities. The initial amount drawn on the closing date was $50.0 million and an additional $5.0 million was drawn in December 2014. In December 2014, in connection with the additional $5.0 million draw, the Credit Facility was amended. In December 2015, the Credit Facility was further amended to increase the total available principal amount from $75.0 million to $100.0 million. The borrowing hasCredit Facility had an initial term of four years and matureswas to mature in 2018, providesprovided for various financial covenants and bearsbore interest at the London Interbank Offered Rate or LIBOR,(LIBOR) with a 1.0% floor, plus 8.0%. The Credit Facility containscontained various affirmative and negative covenants, including EBITDA (as defined in the Credit Facility) minimum covenants, a leverage ratio and a fixed-charge coverage ratio. The Credit Facility limitslimited annual capital expenditures based on budgets submitted to and agreed to with the lender and there is also an annual excess cash flow sweep requirement. In connection with the December 2015 amendment, all financial covenants were revised and the measurement period changed from monthly to quarterly. Concurrent with the December 2015 amendment, the Company borrowed an additional $20.0 million under the Credit Facility to fund future growth and expansion. In addition, there were debt issuance costs of $4.7 million which were being amortized to interest expense over a period of 48 months using the effective interest method. As of December 31, 2015, and 2014, the outstanding balances under the Credit Facility werewas $74.4 million and $55.0 million, respectively.
The Credit Facility, as amended, requires principal payments of 1.25% of the then outstanding principal loan balance each quarter and deferred any further principal payments until September 2016. If the Company were to prepay any of the outstanding principal loan balance prior to December 8, 2016, it is required to pay the lender a premium in an amount equal to the amount of interest that otherwise would have been payable from the date of prepayment until December 8, 2016 plus 3.0% of the amount of the principal loan balance that was prepaid. The Company is not required to pay such a premium if it prepays the outstanding principal loan balance under the Credit Facility with proceeds from this offering and the Credit Facility is refinanced with the lender or an affiliate. If the Company prepays any of the outstanding principal loan balance after December 8, 2016 through December 8, 2017, it is required to pay the lender 3.0% of the principal loan balance that was prepaid, and if it prepays any of the outstanding loan balance after December 8, 2017 through August 18, 2018, it is required to pay a premium of 1.5% of the amount of the principal loan balance that was prepaid.million.
In connection with the initial draw on the Credit Facility in August 2014, the Company repaid theits previously outstanding senior term loan of $20.0 million (referenced above) plus accrued interest, a prepayment penalty and a termination fee. The prepayment penalty and termination fee amounted to $1.6 million and are included within the caption “Loss on extinguishment of debt” in the accompanying consolidated statements of operations. The Company also repaid $5.0 million ofIn
TPI COMPOSITES, INC. AND SUBSIDIARIES
Notes to Consolidated Financial Statements
addition, the Company also expensed the remaining $1.3 million of debt discounts and deferred financing costs associated with the senior term loan within the caption “Loss on extinguishment of debt” in the accompanying consolidated statements of operations. The Company also repaid $5.0 million of previously outstanding subordinated convertible promissory notes (referenced above) plus accrued interest as well as $5.7 million of customer advances outstanding at the time of the refinancing.
In addition, there were debt issuance costsDecember 2016, the Company amended and restated the Credit Facility (the Amended Credit Facility). The previous $100.0 million of $4.7available principal was replaced with a $75.0 million term loan and a $25.0 million revolving credit facility, which includes a $15.0 million letter of credit sub-facility. The borrowings under the Amended Credit Facility bear interest at a variable rate through maturity at LIBOR, with a 1.0% floor, plus 5.75%. The Amended Credit Facility requires us to make quarterly principal payments in the amount of $0.9 million of the outstanding principal loan balance commencing in March 2017, with the remaining outstanding balance to be repaid on or before December 30, 2020. The Amended Credit Facility contains customary affirmative covenants, negative covenants and events of default, including covenants and restrictions that, among other things, require the Company and its subsidiaries to satisfy certain capital expenditure and other financial covenants, and restricts the ability of the Company and its subsidiaries to incur liens, incur additional indebtedness, enter into joint ventures or partnerships, engage in mergers and acquisitions, engage in asset sales and declare dividends on its capital stock without the prior written consent of the Lenders. The obligations under the Amended Credit Facility are secured by a lien on substantially all tangible and intangible property of the Company and its domestic subsidiaries and by a pledge by the Company and its domestic subsidiaries of 65% of the equity of their direct foreign subsidiaries, subject to customary exceptions and exclusions from collateral.
If the Company prepays any of the outstanding principal loan balance prior to December 30, 2017, the Company is required to pay the lenders a premium in an amount equal to the amount of interest that otherwise would have been payable from the date of prepayment until December 30, 2017 plus 3.0% of the amount of the principal loan balance that was prepaid. If the Company prepays any of the outstanding principal loan balance after December 30, 2017 through December 30, 2018, the Company is required to pay the lenders 2.0% of the principal loan balance that was prepaid, and if the Company prepays any of the outstanding loan balance after December 30, 2018 through December 30, 2019, the Company is required to pay a premium of 1.5% of the amount of the principal loan balance that was prepaid.
In connection with the Amended Credit Facility, the Company repaid the outstanding Credit Facility balance of $74.4 million, plus accrued interest, closing fees, a prepayment penalty and the reimbursement of certain lenders expenses incurred. The deferred financing fees totaled $2.2 million and are being amortized to interest expense over a period of 48 months using the effective interest method. In addition, the Company also expensed $2.4 million of the remaining deferred financing costs associated with the Credit Facility and $2.1 million of the prepayment penalty within the caption “Loss on extinguishment of debt” in the accompanying consolidated statements of operations. As of December 31, 2016, the aggregate outstanding balance under the Amended Credit Facility was $77.8 million. The Company cannot assure you that they will be able to maintain appropriate minimum leverage or fixed-charge coverage ratio requirements in the future.
Subordinated Convertible Promissory Notes Agreement (U.S.):
In conjunction with the additional funding under the Credit Facility discussed above, in December 2014, the Company entered into a note purchase agreement with five of the Company’s current investors for the purchase of $10.0 million of subordinated convertible promissory notes. The notes bearbore interest at a rate of 12.0% per annum and willwould automatically mature and be due and payable on the earlier of the completion of any change of control or qualified initial public offering, or at the election of the holders of the notes at any time after the occurrence of
TPI COMPOSITES, INC. AND SUBSIDIARIES
Notes to Consolidated Financial Statements
an event of default. The Company hashad the right to prepayment without the consent of the note holders and the note holders holdheld conversion rights upon future financing into new equity financing or convertible note financing. This note purchase agreement containscontained a beneficial conversion feature which was valued at $5.2 million based on the difference between the fair value of the Company’s stock as of the commitment date as compared to the most favorable conversion rate that will bewould have been available to the investor during the term of the loan. This amount was accounted for as a debt discount and an increase in shareholders’ equity. The debt discount iswas being accreted to interest expense ratably over the expected term of the notes. In addition, there were debt issuance costs of $0.2 million which were being amortized to interest expense over the estimated term of the loan using the effective interest method. As of December 31, 2015, the outstanding balance under the note purchase agreement was $10.0 million.
As discussed in Note 1, concurrent with the closing of the Company’s IPO, the principal and accrued interest on the outstanding subordinated convertible promissory notes were converted into an aggregate of 1,079,749 shares of common stock at the public offering price of $11.00 per share. In connection with this conversion, the remaining beneficial conversion feature, debt discount and debt issuance costs totaling $1.3 million were fully expensed as interest expense in the accompanying consolidated statements of operations.
Accounts Receivable, Secured and Unsecured Financing:
TurkeyEMEA:During 2014, the Company renewed a general credit agreement with a financial institution in Turkey to provide up to $20.0 million (later changed to 20.0 million Euro, or approximately $21.1 million as of December 31, 2016) of short-term collateralized financing on invoiced accounts receivable of one of Turkey’s customers. Interest accrues annually at the Euro Interbank Offered Rate (EURIBOR) plus 0.2% (currently 5.75%) and is paid monthly. In December 2014, Turkey obtained an additional $7.0 million of unsecured financing under the credit agreement, and increasedincreasing the facility total to $27.0 million.facility. All credit agreement terms remained the same. The credit agreement does not have a maturity date, however the limits are reviewed in September of each year. Amounts outstanding under this agreement as of December 31, 2016 and 2015 and 2014 include $18.7$15.1 million and $17.8$18.7 million of accounts receivable financing and $4.1$4.6 million and $2.1$4.1 million of unsecured financing, respectively.
In December 2014, the Company entered into a credit agreement with a Turkish financial institution to provide up to $16.0 million short-term financing of which $10.0 million is collateralized financing on invoiced accounts receivable of one of Turkey’s customers and the remaining $6.0 million is unsecured. Interest accrues at an average rate of 6.25%. The credit agreement does not have a maturity date, however the limits are reviewed in September of each year. No amounts were outstanding under this agreement as of December 31, 2016. Amounts outstanding under this agreement as of December 31, 2015 and 2014 include $1.8 million and $6.4 million of accounts receivable financing and $4.5 million and $4.9 million of unsecured financing, respectively.financing.
China:During 2014,In March 2016, the Company entered into several working capital loansa general credit agreement with variousa Turkish financial institutions. Amounts outstandinginstitution to provide up to 33.5 million Euro (later increased to 36.0 million Euro, or approximately $37.9 million as of December 31, 20152016) of short-term financing of which 20.0 million Euro (approximately $21.1 million as of December 31, 2016) is collateralized financing based on invoiced accounts receivable of one of the EMEA segment’s customers, 12.5 million Euro (later increased to 15.0 million Euro, or approximately $15.8 million as of December 31, 2016) for the collateralized financing of capital expenditures and 2014 were $9.51.0 million and $19.1Euro (approximately $1.0 million respectively, and interestas of December 31, 2016) related to letters of guarantee. Interest on the collateralized financing based on invoiced accounts receivable accrues at between 5.6%the three month EURIBOR plus 5.75% and 6.9% annually. is paid quarterly with a maturity date equal to four months from the applicable invoice date. Interest on the collateralized capital expenditures financing accrues at the one month EURIBOR, plus 6.75% (currently 6.75%)
TPI COMPOSITES, INC. AND SUBSIDIARIES
Notes to Consolidated Financial Statements
with monthly principal repayments beginning in October 2017 with a final maturity date of December 2021. Interest on the letters of guarantee accrues at 2.00% annually with a final maturity date of March 2017. As of December 31, 2016, there was $15.8 million outstanding under the collateralized financing of capital expenditures line.
Asia:During 2014, the Company also entered into accounts receivable financing loans with a financial institution. Amounts outstanding as of December 31, 2015 and 2014 were $6.6 million and $5.4 million, respectively, and interest accruesaccrued at 6.6% annually. All interest iswas payable quarterly. The principal on these loans iswas scheduled to be paid from between 12 to 36 months from each loan origination date but havehad been, and arewere anticipated to continue to be, renewed at their maturities. As of December 31, 2016, all amounts outstanding under these accounts receivable financing loans were fully repaid.
In January 2016, the Company entered into a credit agreement with a Chinese financial institution to provide up to 95.0 million Renminbi (approximately $13.6 million as of December 31, 2016) of short-term financing of which 85.0 million Renminbi (approximately $12.2 million as of December 31, 2016) is collateralized financing based on invoiced accounts receivables of one of its Asia segment’s customers and 10.0 million Renminbi (approximately $1.4 million as of December 31, 2016) of working capital loans collateralized by one of its Asia segment location’s machinery and equipment. Interest on the collateralized financing based on invoiced accounts receivable and the collateralized working capital loan accrues at a specified LIBOR rate plus an applicable margin and can be paid monthly, quarterly or at the time of the debt’s final maturity (January 12, 2017). As of December 31, 2016, there were no amounts outstanding under these accounts receivable financing and working capital loans.
Working Capital Agreements (Asia):
During 2014, the Company entered into several working capital loans with various financial institutions. Amounts outstanding as of December 31, 2015 were $9.5 million and interest accrued at between 5.6% and 6.9% annually. All interest was payable quarterly. The principal on these loans was scheduled to be paid from between 3 to 12 months from each loan origination date. As collateral for the above working capital loans, the financial institution received a security interest in China’s buildings and land use rights (Note 10)9).
In connection with the December 2015 amendment to the Credit Facility noted above, the Company repaid the outstanding indebtedness incurred in connection with its working capital loans with its lenders in China in 2016.
Equipment Lease and Other Arrangements:
MexicoU.S.:In JulyMarch 2014, the Company entered into a construction financinglease agreement related to a building with a total valueleasing company for the initial lease of $1.6up to $2.2 million of machinery and equipment at its Iowa facility. The lease agreement was subsequently amended and the amount of machinery and equipment available for lease was increased to $5.4 million. Interest accrues at 7.0%The lease includes an implied effective interest rate of 4.3% annually and is paid monthly. The agreement requires monthly payments between August 2014during each 24 month term. As of December 31, 2016 and September 2015. The amount2015, there was $2.0 million and $2.7 million outstanding under this agreement.
EMEA: In 2013, the Company entered into a finance lease agreement with a financial institution in Turkey for $4.9 million of machinery, equipment and building improvements at its Turkey facility. The term of the lease was for four years at an effective interest rate of 6.0%. The loan is to be repaid in monthly installments through 2017. The balance outstanding as of December 31, 20142016 and 2015 was $0.8 million.$1.9 million and $2.9 million, respectively.
TPI COMPOSITES, INC. AND SUBSIDIARIES
Notes to Consolidated Financial Statements
Mexico:In October 2015, the Company entered into a construction financing agreement related to the expansion of a building with a total value of $1.8 million. Interest accruesaccrued at 7.0% annually and iswas paid monthly. The agreement requiresrequired monthly payments between October 2015 and October 2016. No amounts were outstanding under this agreement as of December 31, 2016. The amount outstanding under this agreement as of December 31, 2015 was $1.2 million.
In January 2016, the Company entered into a lease agreement with a leasing company for the initial lease of up to $9.5 million (subsequently amended to $10.0 million) of machinery and equipment at its second Mexico facility. The lease includes an implied effective interest rate of 4.3% annually and requires monthly payments during each 24 month term. The amount outstanding under this agreement as of December 31, 2016 was $8.0 million.
Due to the short-term nature of the working capital loans (China and Turkey),unsecured financing in Turkey, the Company estimates that fair-value approximates the face value of the notes.
For the years ended December 31, 2016, 2015 and 2014, and 2013,$1.7 million, $1.3 million and $0.7 million and $0.2 millionof debt issuance costs were amortized to interest expense in the Company’s consolidated statements of operations.
The average interest rate on the Company’s short-term borrowings as of December 31, 20152016 and 20142015 was approximately 6.1%5.8% and 6.4%6.1%, respectively.
The aggregate amount ofannual maturities of debt at December 31, 2015, is2016 are as follows (in thousands):
2016 | $ | 52,065 | ||
2017 | 15,551 | |||
2018 | 68,968 | |||
|
| |||
Total | $ | 136,584 | ||
|
|
Note 15. Convertible and Senior Redeemable Preferred Shares and Warrants
Convertible and senior redeemable preferred shares, which are convertible at the discretion of the holder or will automatically convert at the closing of an initial public offering, and warrants at December 31 consisted of the following (in thousands):
2015 | 2014 | |||||||
Series A convertible preferred shares (convertible at 1 share to 3.4974 shares of common stock), $0.01 par value; liquidation preference equal to $50,901; 3,551 shares authorized; 3,551 issued and outstanding at December 31, 2015 and 2014 | $ | 50,901 | $ | 49,138 | ||||
Series B convertible preferred shares (convertible at 1 share to 3.5636 shares of common stock), $0.01 par value; liquidation preference equal to $41,200; 2,813 shares authorized; 2,287 issued and outstanding at December 31, 2015 and 2014 | 41,200 | 39,600 | ||||||
Series B-1 convertible preferred shares (convertible at 1 share to 5.0243 shares of common stock), $0.01 par value; liquidation preference equal to $52,510; 2,972 shares authorized; 2,972 shares issued and outstanding at December 31, 2015 and 2014 | 52,510 | 50,430 | ||||||
Series C convertible preferred shares (convertible at 1 share to 3.2817 shares of common stock), $0.01 par value; liquidation preference equal to $17,490; 2,944 shares authorized; 2,944 shares issued and outstanding at December 31, 2015 and 2014 | 17,490 | 16,770 | ||||||
Senior redeemable preferred shares (convertible at 1 share to 13.2211 shares of common stock), $0.01 par value; liquidation preference equal to $64,722; 740 shares authorized; 740 shares issued and outstanding at December 31, 2015 and 2014 | 27,585 | 25,065 | ||||||
Super senior redeemable preferred shares (convertible at 1 share to 13.2211 shares of common stock), $0.01 par value; liquidation preference equal to $22,141; 1,024 shares authorized; 280 shares issued and outstanding at December 31, 2015 and 2014 | 8,060 | 7,262 | ||||||
Redeemable preferred share warrants; 248 warrants issued and outstanding at December 31, 2015 and 2014 | 1,084 | 1,084 | ||||||
|
|
|
| |||||
Convertible and senior redeemable preferred shares and warrants: | $ | 198,830 | $ | 189,349 | ||||
|
|
|
| |||||
2017 | $ | 33,403 | ||
2018 | 13,379 | |||
2019 | 7,471 | |||
2020 | 67,471 | |||
2021 | 3,721 | |||
|
| |||
Total | $ | 125,445 | ||
|
|
TPI COMPOSITES, INC. AND SUBSIDIARIES
Notes to Consolidated Financial Statements
The Company has issued six series of preferred shares ($0.01 par value) as follows:
|
|
|
| |||||||
| ||||||||||
| ||||||||||
| ||||||||||
| ||||||||||
| ||||||||||
| ||||||||||
| ||||||||||
| ||||||||||
| ||||||||||
| ||||||||||
| ||||||||||
| ||||||||||
In May 2014, the Company raised $3.0 million through the issuance of 120 shares of Super Senior Redeemable Preferred Stock (SSRPS)Shares and Warrants
The convertible and senior redeemable preferred shares and warrants outstanding as of December 31, 2015 automatically converted to a groupcommon shares immediately prior to the closing of its current investors. Thethe IPO, consisted of the following (in thousands, except share and par value data):
Series A convertible preferred shares (convertible at 1 share to 3.4974 shares of common stock), $0.01 par value; liquidation preference equal to $50,901; 3,551 shares authorized; 3,551 shares issued and outstanding at December 31, 2015 | $ | 50,901 | ||
Series B convertible preferred shares (convertible at 1 share to 3.5636 shares of common stock), $0.01 par value; liquidation preference equal to $41,200; 2,813 shares authorized; 2,287 shares issued and outstanding at December 31, 2015 | 41,200 | |||
Series B-1 convertible preferred shares (convertible at 1 share to 5.0243 shares of common stock), $0.01 par value; liquidation preference equal to $52,510; 2,972 shares authorized; 2,972 shares issued and outstanding at December 31, 2015 | 52,510 | |||
Series C convertible preferred shares (convertible at 1 share to 3.2817 shares of common stock), $0.01 par value; liquidation preference equal to $17,490; 2,944 shares authorized; 2,944 shares issued and outstanding at December 31, 2015 | 17,490 | |||
Senior redeemable preferred shares (convertible at 1 share to 13.2211 shares of common stock), $0.01 par value; liquidation preference equal to $64,722; 740 shares authorized; 740 shares issued and outstanding December 31, 2015 | 27,585 | |||
Super senior redeemable preferred shares (convertible at 1 share to 13.2211 shares of common stock), $0.01 par value; liquidation preference equal to $22,141; 1,024 shares authorized; 280 shares issued and outstanding at December 31, 2015 | 8,060 | |||
Redeemable preferred share warrants; 248 warrants issued and outstanding at December 31, 2015 | 1,084 | |||
|
| |||
Convertible and senior redeemable preferred shares and warrants | $ | 198,830 | ||
|
|
As discussed in Note 1, immediately prior to the closing of the IPO, all of the outstanding redeemable preferred shares were converted into an aggregate of 21,110,204 shares of common stock. Prior to conversion, the Company granted the investors warrantshad recorded dividends totaling $5.5 million for the right to purchase up to 21 shares of preferred stockperiod January 1, 2016 through July 22, 2016 (the date of the Company. On June 30, 2014, the Company raised an additional $3.9 million through the issuance of 160 shares of SSRPS to a group of its current investors. The Company granted the investors warrants for the right to purchase up to 27 shares of preferred stock of the Company. The warrantsCompany’s IPO) which are exercisable for a period up to seven years.
SSRPS provides for a base price of $25,000 per share, and ranks senior to any share of senior preferred stock, preferred stock, common stock, and any other equity securities of the Company. SSRPS holders receive dividend rights equal to 10 percent of the SSRPS base price per annum. Dividends will accrue from the date of issuance, and are cumulative and compounded annually. SSRPS is redeemable, in the event of a liquidation event at three times the SSRPS base price, or $75,000 per share. In the event the Company cannot satisfy the redemption, SSRPS stock outstanding will receive a liquidation premium amount for each share in connection with a liquidation event or qualified initial public offering. SSRPS stock also includes a redemption trigger, such that SSRPS stock is senior to the exercisable redemption rights of all other equity securities.
The preferred share balances have been accreted to the redemption amount as of the first date redemption can take place using the effective interest method. In addition, the preferred share balance includes cumulative preferred share dividends as required by the preferred share agreements. No accretion has been recorded for preferred shares that are not redeemable for cash on or after a specified date. The amount of the accretion and deemed dividends is included in the net income attributable to preferred shareholders in the accompanying consolidated statements of operations.
The Company recorded the warrants noted above at their fair value upon issuance of $0.2 million of redeemable preferred share warrants in the “mezzanine” section of the consolidated balance sheets.
TPI COMPOSITES, INC. AND SUBSIDIARIES
Notes to Consolidated Financial Statements
Redeemable Preferred Share Warrants
The detailsAs discussed in Note 1, immediately prior to the closing of the warrant activity forIPO, the years ended December 31, 2015 and 2014 is as follows:
Number of | Weighted-Average | |||||||
Outstanding as of December 31, 2013 | 120 | $ | 8,749 | |||||
2014 grants | 128 | 8,749 | ||||||
2014 exercises | — | — | ||||||
2014 forfeitures | — | — | ||||||
2014 cancellations | — | — | ||||||
2014 expirations | — | — | ||||||
|
| |||||||
Outstanding as of December 31, 2014 | 248 | 8,749 | ||||||
2015 grants | — | — | ||||||
2015 exercises | — | — | ||||||
2015 forfeitures | — | — | ||||||
2015 cancellations | — | — | ||||||
2015 expirations | — | — | ||||||
|
| |||||||
Outstanding as of December 31, 2015 | 248 | 8,749 | ||||||
|
| |||||||
The warrants are reported at fair value in the accompanying financial statements based on the value of the248 outstanding redeemable Series B Preferred Shares that may be purchased.preferred share warrants were converted on a net issuance basis into an aggregate of 120,923 shares of common stock.
Common Stock Warrants
In connection with the note purchase agreement indated December 29, 2014, for the purchase of $10.0 million of subordinated convertible promissory notes, 61,720a minimum of 160,424 warrants were issued to purchase common stock with an exercise price equal to the lesser of $24.30 or 85% of the IPO price of $11.00 per share, in an initial public offering or $24.30, subject to adjustment.accordingly, after the IPO, the exercise price is $9.35. The warrants are immediately exercisable and expire no later than eight years from the date of issuance. The unamortized fair value of the warrants was estimated onexpensed upon conversion of the dateconvertible promissory notes concurrent with the IPO. These warrants all remain outstanding as of grant using the Black-Scholes option pricing model assuming a common stock price of $11.03 per share, an exercise price of $9.38 per share, expected stock price volatility of 80 percent and a risk-free interest rate estimate of 0.71 percent.December 31, 2016.
TPI COMPOSITES, INC. AND SUBSIDIARIES
Notes to Consolidated Financial Statements
Note 16.15. Commitments and Contingencies
(a) Operating Leases
The Company leases various facilities and equipment under noncancelable operating leases with terms ranging from 12 months to 120 months. Scheduled rent increases are recorded on a straight-line basis over the entire term of the lease.
Rental expense charged under all operating leases (including leases with terms of less than one year) was $11.5 million, $8.4 million $7.1 million and $3.9$7.1 million for the years ended December 31, 2016, 2015 2014 and 2013,2014, respectively. Future minimum lease payments under noncancelable operating leases with terms of one year or more as of December 31, 20152016 are as follows (in thousands):
2016 | $ | 10,622 | ||||||
2017 | 13,509 | $ | 16,434 | |||||
2018 | 12,272 | 14,726 | ||||||
2019 | 9,624 | 12,939 | ||||||
2020 | 9,184 | 12,560 | ||||||
2021 | 9,420 | |||||||
Thereafter | 36,492 | 41,271 | ||||||
|
| |||||||
Total | $ | 91,703 | $ | 107,350 | ||||
|
| |||||||
(b) Legal Proceedings
TheFrom time to time, the Company is involved inparty to various lawsuits, claims, and other legal actions arisingproceedings that arise in the ordinary course of business. Inbusiness, some of which are covered by insurance. When the opinionCompany is aware of management,a claim or potential claim, it assesses the likelihood of any loss or exposure. If it is probable that a loss will result and the amount of the loss can be reasonably estimated, the Company records a liability for the loss. If the loss is not probable or the amount of the loss cannot be reasonably estimated, the Company discloses the nature of the specific claim if the likelihood of a potential loss is reasonably possible and the amount involved is material. With respect to the majority of pending litigation matters, the Company’s ultimate dispositionlegal and financial responsibility, if any, cannot be estimated with certainty and, in most cases, any potential losses related to those matters are not considered probable.
Upon resolution of theseany pending legal matters, willthe Company may incur charges in excess of presently established reserves. Management does not believe that any such charges would, individually or in the aggregate, have a material adverse effect on the Company’s consolidated financial position,condition, results of operations or liquidity.cash flows.
(c) Insurance/Self-Insurance
The Company uses a combination of insurance and self-insurance for a number of risks, including claims related to employee health care, workers’ compensation and general liability. Liabilities associated with these risks are estimated based on, among other things, historical claims experience, severity factors, and other actuarial assumptions. The Company’s loss exposure related to self-insurance is limited by stop loss coverage on a per occurrence and aggregate basis. The Company regularly analyzes its reserves for incurred but not reported claims, and for reported but not paid claims related to self-funded insurance programs. While the Company believes reserves are adequate, significant judgment is involved in assessing these reserves such as assessing historical paid claims, average lags between the claims’ incurred date, reported dates and paid dates, and the frequency and severity of claims. There may be differences between actual settlement amounts and recorded reserves and any resulting adjustments are included in expense once a probable amount is known.
TPI COMPOSITES, INC. AND SUBSIDIARIES
Notes to Consolidated Financial Statements
(d) Dividend Restrictions
Certain subsidiaries of the Company are limited in their ability to declare dividends without first meeting statutory restrictions of the People’s Republic of China, including retained earnings as determined under Chinese-statutory accounting requirements and the approval of one of the Company’s Chinese lenders.requirements. Until 50% ($5.2 million) of registered capital is contributed to a surplus reserve, the Company’s Chinese operations can only pay dividends equal to 90% of after-tax profits (10% must be contributed to the surplus reserve). Once the surplus reserve fund requirement is met, the Company can pay dividends equal to 100% of after-tax profit assuming other conditions are met. At December 31, 2015,2016, the amount of the surplus reserve fund was $2.9$4.4 million.
(d)(e) Collective Bargaining Agreement
TheIn May 2016, the Company is in the process of negotiatingentered into a new three-year collective bargaining agreement which expires on December 31, 2015, with certain of its Turkish employees. The new agreement will result in an average increase in pay of approximately 20% for employees for an expected term of three years, and there may be a retrospective application of its terms forcovered by the period between January 1, 2016 and the effective date of such new agreement. Currently, there are no other employees covered by collective bargaining agreements. The Company believes that its relations with employees are good, and there have been no major work stoppages in recent years.
TPI COMPOSITES, INC. AND SUBSIDIARIES
Notes to Consolidated Financial Statements
Note 17.16. Defined Contribution Plan
The Company maintains a 401(k) plan for all of its U.S. employees. Under the 401(k) plan, eligible employees may contribute, subject to statutory limitations, a percentage of their salaries. The Company currently matches 25 percent of the participants’ contributions up to 8 percent of eligible compensation.
Participant vesting occurs in the Company matching contributions according to the schedule below:
Years of service | Vesting Percentage | |||
Less than 2 years | 0 | % | ||
2-year anniversary | 20 | % | ||
3-year anniversary | 40 | % | ||
4-year anniversary | 60 | % | ||
5-year anniversary | 80 | % | ||
6-year anniversary | 100 | % | ||
The Company’s matching contributions to the 401(k) plan were $0.3 million, $0.2 million and $0.2 million for each of the years ended December 31, 2016, 2015 and 2014, and 2013.respectively. The Company’s matching contributions are accrued and recorded as expense during each payroll period. Effective January 1, 2017, the Company changed the 401(k) plan to include an auto enrollment feature, increased the Company match from 25% of the first 8% to 50% of the first 8% and reduced the vesting period from six years to three years.
In Mexico, the Company maintains an annual savings fund, which matches the employee contribution each week, based on the Mexican statutory maximum of 13% of actual minimum salary rates. The savings fund period runs from November to October each year, and is distributed to employees in full, during the first week of November each year. For the years ended December 31, 20152016 and 2014,2015, the Company incurred matched savings expense of $0.6 million and $0.5 million, and $0.3 million, respectively.
TPI COMPOSITES, INC. AND SUBSIDIARIES
Notes to Consolidated Financial Statements
In Turkey, the Company maintains a retirement fund that is based on a formula of annual salary multiplied by the number of years of service for the Company. The Company accrues a retirement fund liability for this each month. As of December 31, 20152016 and 2014,2015, the Company had accrued $0.6$1.0 million and $0.3$0.6 million, respectively, based on the service periods of eligible employees greater than one year.
Note 18.17. Income Taxes
Geographic sources of net income (loss) before income taxes are as follows for the years ended December 31 (in thousands):
2015 | 2014 | 2013 | ||||||||||
United States | $ | (3,165 | ) | $ | (7,733 | ) | $ | 4,231 | ||||
China | 18,420 | 5,832 | 2,238 | |||||||||
Turkey | (4,552 | ) | (3,962 | ) | (10,835 | ) | ||||||
Mexico | 956 | 140 | (6 | ) | ||||||||
|
|
|
|
|
| |||||||
Total | $ | 11,659 | $ | (5,723 | ) | $ | (4,372 | ) | ||||
|
|
|
|
|
| |||||||
TPI COMPOSITES, INC. AND SUBSIDIARIES
Notes to Consolidated Financial Statements
2016 | 2015 | 2014 | ||||||||||
United States | $ | 5,406 | $ | (3,165 | ) | $ | (7,733 | ) | ||||
China | 22,826 | 18,420 | 5,832 | |||||||||
Turkey | (8,564 | ) | (4,552 | ) | (3,962 | ) | ||||||
Mexico | 1,169 | 956 | 140 | |||||||||
|
|
|
|
|
| |||||||
Total | $ | 20,837 | $ | 11,659 | $ | (5,723 | ) | |||||
|
|
|
|
|
| |||||||
The income tax provision includes U.S. federal, state, and local taxes, Turkey, China and Mexico taxes currently payable and those deferred because of temporary differences between the financial statement and the tax bases of assets and liabilities. The components of the provision for income taxes are as follows for the years ended December 31 are as follows (in thousands):
2015 | 2014 | 2013 | 2016 | 2015 | 2014 | |||||||||||||||||||
Current: | ||||||||||||||||||||||||
U.S. federal | $ | (51 | ) | $ | 80 | $ | (5 | ) | $ | — | $ | (51 | ) | $ | 80 | |||||||||
U.S. state and local taxes | 55 | 282 | 3 | (196 | ) | 55 | 282 | |||||||||||||||||
Foreign | 4,738 | 1,581 | 168 | 9,973 | 4,738 | 1,581 | ||||||||||||||||||
|
|
|
|
|
| |||||||||||||||||||
Total current | 4,742 | 1,943 | 166 | 9,777 | 4,742 | 1,943 | ||||||||||||||||||
|
|
|
|
|
| |||||||||||||||||||
Deferred: | ||||||||||||||||||||||||
U.S. federal | — | — | — | 51 | — | — | ||||||||||||||||||
U.S. state and local taxes | — | — | — | — | — | — | ||||||||||||||||||
Foreign | (765 | ) | (1,018 | ) | (3,512 | ) | (2,833 | ) | (765 | ) | (1,018 | ) | ||||||||||||
|
|
|
|
|
| |||||||||||||||||||
Total deferred | (765 | ) | (1,018 | ) | (3,512 | ) | (2,782 | ) | (765 | ) | (1,018 | ) | ||||||||||||
|
|
|
|
|
| |||||||||||||||||||
Total provision (benefit) | $ | 3,977 | $ | 925 | $ | (3,346 | ) | |||||||||||||||||
Total provision | $ | 6,995 | $ | 3,977 | $ | 925 | ||||||||||||||||||
|
|
|
|
|
| |||||||||||||||||||
TPI COMPOSITES, INC. AND SUBSIDIARIES
Notes to Consolidated Financial Statements
The following is a reconciliation between the U.S. statutory income tax rate and the Company’s income tax provision is as follows for the years ended December 31:
2015 | 2014 | 2013 | ||||||||||
United States statutory income tax rate (benefit) | 34.0 | % | (34.0 | )% | (34.0 | )% | ||||||
Noncontrolling interest | 0.0 | 0.0 | (9.0 | ) | ||||||||
Foreign rate differential | (23.9 | ) | (8.8 | ) | 25.1 | |||||||
Foreign permanent differences | 4.1 | 0.0 | 0.0 | |||||||||
Withholding taxes | 3.4 | 6.8 | 3.3 | |||||||||
Valuation allowance | 17.3 | 64.8 | (61.4 | ) | ||||||||
State taxes | 0.5 | 3.6 | 0.0 | |||||||||
Deferred tax adjustments | 2.3 | (13.3 | ) | (5.4 | ) | |||||||
Research and development | (3.0 | ) | (2.2 | ) | (4.1 | ) | ||||||
Other (1) | (0.6 | ) | (0.7 | ) | 8.9 | |||||||
|
|
|
|
|
| |||||||
Total expense (benefit) | 34.1 | % | 16.2 | % | (76.6 | )% | ||||||
|
|
|
|
|
| |||||||
2016 | 2015 | 2014 | ||||||||||
United States statutory income tax rate (benefit) | 34.0 | % | 34.0 | % | (34.0 | )% | ||||||
Foreign rate differential | 5.3 | (23.9 | ) | (8.8 | ) | |||||||
Foreign permanent differences | 2.4 | 4.1 | 0.0 | |||||||||
China rate change | (4.8 | ) | 0.0 | 0.0 | ||||||||
Withholding taxes | 6.8 | 3.4 | 6.8 | |||||||||
Foreign tax credits | (7.9 | ) | 0.0 | 0.0 | ||||||||
Valuation allowance | (14.3 | ) | 17.3 | 64.8 | ||||||||
State taxes | (0.6 | ) | 0.5 | 3.6 | ||||||||
Deferred tax adjustments | (0.1 | ) | 2.3 | (13.3 | ) | |||||||
Research and development | (3.0 | ) | (3.0 | ) | (2.2 | ) | ||||||
U.S. foreign income inclusions | 2.0 | — | — | |||||||||
Nondeductible interest expense | 11.5 | — | — | |||||||||
Other | 2.3 | (0.6 | ) | (0.7 | ) | |||||||
|
|
|
|
|
| |||||||
Total expense | 33.6 | % | 34.1 | % | 16.2 | % | ||||||
|
|
|
|
|
| |||||||
U.S. income taxes have not been provided on $22.3$42.0 million of undistributed earnings as of December 31, 20152016 of foreign subsidiaries over which the Company has sufficient influence to control the distribution of such earnings, and has determined that such earnings have been reinvested indefinitely. Should the Company elect in the future to repatriate a portion of the foreign earnings so invested, the Company could incur income tax expense on such repatriation, net of any available deductions and foreign tax credits. This would result in additional income tax expense beyond the computed expected provision in such periods. In addition, the Company’s ability to repatriate funds from China to the United States is subject to a number of restrictions imposed by the Chinese government. The amount of unrecognized deferred tax liability for temporary differences related to investments in foreign subsidiaries and foreign corporate joint ventures that are essentially permanent in duration is not easily determinable.
TPI COMPOSITES, INC. AND SUBSIDIARIES
Notes to Consolidated Financial Statements
The following is a summary of the components of deferred tax assets and liabilities at December 31 (in thousands):
2015 | 2014 | 2013 | 2016 | 2015 | 2014 | |||||||||||||||||||
Deferred tax assets: | ||||||||||||||||||||||||
Net operating loss and credit carry forwards | $ | 32,294 | $ | 34,961 | $ | 37,396 | $ | 25,354 | $ | 32,294 | $ | 34,961 | ||||||||||||
Deferred revenue | 6,563 | 5,084 | — | 5,373 | 6,563 | 5,084 | ||||||||||||||||||
Non-deductible accruals | 4,825 | 3,028 | 1,986 | 8,316 | 4,825 | 3,028 | ||||||||||||||||||
Equity compensation | 3,503 | — | — | |||||||||||||||||||||
Equity investment | 653 | 692 | 639 | 633 | 653 | 692 | ||||||||||||||||||
Amortization of intangible assets | 720 | 656 | 484 | 472 | 720 | 656 | ||||||||||||||||||
Tax credits | 384 | 120 | 39 | 2,914 | 384 | 120 | ||||||||||||||||||
Other | 1,671 | 657 | 37 | 1,248 | 1,671 | 657 | ||||||||||||||||||
|
|
|
|
|
| |||||||||||||||||||
Total deferred tax assets | 47,110 | 45,198 | 40,581 | 47,813 | 47,110 | 45,198 | ||||||||||||||||||
Valuation allowance | (41,216 | ) | (39,347 | ) | (35,208 | ) | (40,596 | ) | (41,216 | ) | (39,347 | ) | ||||||||||||
|
|
|
|
|
| |||||||||||||||||||
Net deferred tax assets | 5,894 | 5,851 | 5,373 | 7,217 | 5,894 | 5,851 | ||||||||||||||||||
|
|
|
|
|
| |||||||||||||||||||
Deferred tax liabilities: | ||||||||||||||||||||||||
Deferred revenue | (615 | ) | (3,497 | ) | (3,730 | ) | ||||||||||||||||||
Depreciation | (1,831 | ) | (1,368 | ) | (2,008 | ) | ||||||||||||||||||
Other | (1,787 | ) | (41 | ) | (519 | ) | ||||||||||||||||||
|
|
| ||||||||||||||||||||||
Total deferred tax liabilities | (4,233 | ) | (4,906 | ) | (6,257 | ) | ||||||||||||||||||
|
|
| ||||||||||||||||||||||
Net deferred tax assets (liabilities) | $ | 1,661 | $ | 945 | $ | (884 | ) | |||||||||||||||||
|
|
| ||||||||||||||||||||||
TPI COMPOSITES, INC. AND SUBSIDIARIES
Notes to Consolidated Financial Statements
2016 | 2015 | 2014 | ||||||||||
Deferred tax liabilities: | ||||||||||||
Deferred revenue | — | (615 | ) | (3,497 | ) | |||||||
Depreciation | (1,714 | ) | (1,831 | ) | (1,368 | ) | ||||||
Other | (423 | ) | (1,787 | ) | (41 | ) | ||||||
|
|
|
|
|
| |||||||
Total deferred tax liabilities | (2,137 | ) | (4,233 | ) | (4,906 | ) | ||||||
|
|
|
|
|
| |||||||
Net deferred tax assets | $ | 5,080 | $ | 1,661 | $ | 945 | ||||||
|
|
|
|
|
| |||||||
The deferred tax valuation allowance at December 31 consisted of the following (in thousands):
2015 | 2014 | 2013 | 2016 | 2015 | 2014 | |||||||||||||||||||
Allowance at beginning of year | $ | (39,347 | ) | $ | (35,208 | ) | $ | (40,464 | ) | $ | (41,216 | ) | $ | (39,347 | ) | $ | (35,208 | ) | ||||||
Expenses incurred | (1,869 | ) | (4,139 | ) | — | |||||||||||||||||||
Benefits obtained (expenses incurred) | 620 | (1,869 | ) | (4,139 | ) | |||||||||||||||||||
Adjustment | — | — | 5,256 | — | — | — | ||||||||||||||||||
|
|
|
|
|
| |||||||||||||||||||
Allowance at end of year | $ | (41,216 | ) | $ | (39,347 | ) | $ | (35,208 | ) | $ | (40,596 | ) | $ | (41,216 | ) | $ | (39,347 | ) | ||||||
|
|
|
|
|
| |||||||||||||||||||
The valuation allowance relates to deferred taxes that the Company believes do not meet the more-likely than-notmore-likely-than-not criteria for recording the related benefits.
The Company has U.S. federal net operating losses (NOLs) of approximately $78.1$57.5 million, state net operating lossesNOLs of approximately $61.1$77.2 million and foreign net operating lossestax credits of approximately $3.2$2.6 million available to offset future U.S. taxable income. The federal and state net operating loss carryforwards expire in varying amounts through 2035. The Company’s2036 and the foreign net operating loss carryforwardstax credits expire in varying amounts through 2020.between 2024 and 2026. The Company also has foreignTurkey investment tax credits of approximately $0.3 million that expire in 2024.do not expire.
Sections 382 and 383 of the Internal Revenue Code of 1986, contain rules that limit the ability of a company that undergoes an “ownership change” to utilize its net operating loss and tax credit carry forwards and certain built-in losses recognized in years after the ownership change. An “ownership change” is generally defined as any change in ownership of more than 50% of a corporation’s stock over a rolling three-year period by
TPI COMPOSITES, INC. AND SUBSIDIARIES
Notes to Consolidated Financial Statements
stockholders that own (directly or indirectly) 5% or more of the stock of a corporation, or arising from a new issuance of stock by a corporation. If an ownership change occurs, Section 382 generally imposes an annual limitation on the use of pre-ownership change net operating lossesNOLs to offset taxable income earned after the ownership change. The annual limitation is equal to the product of the applicable long-term tax exempt rate and the value of the company’s stock immediately before the ownership change. This annual limitation may be adjusted to reflect any unused annual limitation for prior years and certain recognized built-in gains and losses for the year. In addition, Section 383 generally limits the amount of tax liability in any post-ownership change year that can be reduced by pre-ownership change tax credit carryforwards. At the end ofIn 2008, the Company had an “ownership change” and thepre-ownership change net operating lossesNOLs existing at the date of change of $25.6 million arewere subject to an annual limitation of $4.3 million. As of December 31, 2015,2016, the remaining pre-ownership change net operating losses of approximately $20.5 millionNOLs are no longer limited. Certain of these net operating lossesNOLs may be at risk of limitation in the event of a future ownership change.
The Company recognizes the impact of a tax position in its financial statements if that position is more-likely-than-not to be sustained on audit, based on the technical merits of the position. The Company discloses all unrecognized tax benefits, which includes the reserves recorded for uncertain tax positions on filed tax returns and the unrecognized portion of affirmative claims. The Company’s policy regarding uncertain tax positions is to recognize potential accrued interest and penalties related to unrecognized tax benefits as a component of income tax expense. As of December 31, 2015,2016, the Company has not identified any uncertainunrecognized tax positions.benefits.
TPI COMPOSITES, INC. AND SUBSIDIARIES
Notes to Consolidated Financial Statements
The Company operates in and files income tax returns in various jurisdictions in China, Mexico, Turkey and the U.S., which are subject to examination by tax authorities. With few exceptions, the Company is no longer subject to income tax examinations for years before 2010.
Note 19.18. Concentration of Customers
Revenues from certain customers in excess of 10 percent of total consolidated Company revenues for the years ended December 31 are as follows (in thousands):
2015 | 2014 | 2013 | ||||||||||||||||||||||
Customer | Revenues | % of Total | Revenues | % of Total | Revenues | % of Total | ||||||||||||||||||
Customer 1 | $ | 312,495 | 53.3 | % | $ | 234,795 | 73.2 | % | $ | 196,141 | 91.2 | % | ||||||||||||
Customer 2 | 91,903 | 15.7 | 42,956 | 13.4 | 8,825 | 4.1 | ||||||||||||||||||
Customer 3 | 63,024 | 10.8 | 26,427 | 8.2 | — | — | ||||||||||||||||||
Customer 4 | 60,544 | 10.3 | 13,501 | 4.2 | — | — | ||||||||||||||||||
Other | 57,886 | 9.9 | 3,068 | 1.0 | 10,088 | 4.7 | ||||||||||||||||||
|
|
|
|
|
|
|
|
|
|
|
| |||||||||||||
Total | $ | 585,852 | 100.0 | % | $ | 320,747 | 100.0 | % | $ | 215,054 | 100.0 | % | ||||||||||||
|
|
|
|
|
|
|
|
|
|
|
| |||||||||||||
2016 | 2015 | 2014 | ||||||||||||||||||||||
Customer | Revenues | % of Total | Revenues | % of Total | Revenues | % of Total | ||||||||||||||||||
Customer 1 - GE | $ | 379,941 | 50.3 | % | $ | 312,495 | 53.3 | % | $ | 234,795 | 73.2 | % | ||||||||||||
Customer 2 - Vestas | 152,106 | 20.1 | 50,031 | 8.5 | — | — | ||||||||||||||||||
Customer 3 - Nordex/Acciona | 131,775 | 17.5 | 154,927 | 26.5 | 69,383 | �� | 21.6 | |||||||||||||||||
Customer 4 - Gamesa | 81,463 | 10.8 | 60,544 | 10.3 | 13,501 | 4.2 | ||||||||||||||||||
Other | 9,592 | 1.3 | 7,855 | 1.4 | 3,068 | 1.0 | ||||||||||||||||||
|
|
|
|
|
|
|
|
|
|
|
| |||||||||||||
Total | $ | 754,877 | 100.0 | % | $ | 585,852 | 100.0 | % | $ | 320,747 | 100.0 | % | ||||||||||||
|
|
|
|
|
|
|
|
|
|
|
| |||||||||||||
Trade accounts receivable from certain customers in excess of 10 percent of total consolidated Company trade accounts receivable at December 31 are as follows:
| 2015 | 2014 | |||||||
Customer | % of Total | % of Total | ||||||
Customer 1 | 26.5% | 33.2% | ||||||
Customer 2 | 24.4% | 43.9% | ||||||
Customer 3 | 14.9% | 15.8% | ||||||
Customer 5 | 27.9% | 0.0% | ||||||
TPI COMPOSITES, INC. AND SUBSIDIARIES
Notes to Consolidated Financial Statements
| 2016 | 2015 | |||||||
Customer | % of Total | % of Total | ||||||
Customer 1 - GE | 24.9% | 26.5% | ||||||
Customer 2 - Vestas | 26.2% | 27.9% | ||||||
Customer 3 - Nordex/Acciona | 26.8% | 39.3% | ||||||
Customer 4 - Gamesa | 16.2% | 4.1% | ||||||
Note 20.19. Segment Reporting
FASB ASC Topic 280,Segment Reporting, establishes standards for the manner in which companies report financial information about operating segments, products, services, geographic areas and major customers. In managing the Company’s business, management focuses on growing its revenues and earnings in select geographic areas serving primarily the wind energy market. The Company has operations in the United States, China, Turkey and Mexico. The Company’s operating segments are defined geographically as the United States, Asia, EMEA (Europe, the Middle East and Africa) and Mexico. Financial results are aggregated into four reportable segments based on quantitative thresholds. All of the Company’s segments operate in their local currency except for the Mexico and Asia segments, which both include a U.S. parent company.
TPI COMPOSITES, INC. AND SUBSIDIARIES
Notes to Consolidated Financial Statements
The following tables set forth certain information regarding each of the Company’s segments for the years ended December 31 (in thousands):
2015 | 2014 | 2013 | ||||||||||
Revenues by Segment: | ||||||||||||
U.S. | $ | 149,614 | $ | 145,691 | $ | 160,600 | ||||||
Asia | 206,779 | 79,325 | 37,045 | |||||||||
EMEA | 131,547 | 67,006 | 17,409 | |||||||||
Mexico | 97,912 | 28,725 | — | |||||||||
|
|
|
|
|
| |||||||
Total Revenues | $ | 585,852 | $ | 320,747 | $ | 215,054 | ||||||
|
|
|
|
|
| |||||||
Revenues by Geographic Location (1): | ||||||||||||
United States | $ | 149,614 | $ | 145,691 | $ | 160,600 | ||||||
China | 206,779 | 79,325 | 37,045 | |||||||||
Turkey | 131,547 | 67,006 | 17,409 | |||||||||
Mexico | 97,912 | 28,725 | — | |||||||||
|
|
|
|
|
| |||||||
Total Revenues | $ | 585,852 | $ | 320,747 | $ | 215,054 | ||||||
|
|
|
|
|
| |||||||
Depreciation and amortization: | ||||||||||||
U.S. | $ | 3,477 | $ | 3,342 | $ | 3,333 | ||||||
Asia | 4,181 | 1,899 | 1,380 | |||||||||
EMEA | 2,225 | 1,683 | 537 | |||||||||
Mexico | 1,533 | 517 | — | |||||||||
|
|
|
|
|
| |||||||
Total depreciation and amortization | $ | 11,416 | $ | 7,441 | $ | 5,250 | ||||||
|
|
|
|
|
| |||||||
Capital Expenditures | ||||||||||||
U.S. | $ | 5,379 | $ | 808 | $ | 737 | ||||||
Asia | 15,632 | 8,903 | 1,119 | |||||||||
EMEA | 2,453 | 4,789 | 3,187 | |||||||||
Mexico | 2,897 | 4,424 | 2,022 | |||||||||
|
|
|
|
|
| |||||||
Total capital expenditures | $ | 26,361 | $ | 18,924 | $ | 7,065 | ||||||
|
|
|
|
|
| |||||||
Income (loss) from operations: | ||||||||||||
U.S. | $ | (13,405 | ) | $ | (1,199 | ) | $ | 8,381 | ||||
Asia | 34,998 | 14,771 | 3,807 | |||||||||
EMEA | (1,505 | ) | (1,528 | ) | (8,619 | ) | ||||||
Mexico | 7,531 | (6,567 | ) | (2,870 | ) | |||||||
|
|
|
|
|
| |||||||
Total income from operations | $ | 27,619 | $ | 5,477 | $ | 699 | ||||||
|
|
|
|
|
| |||||||
TPI COMPOSITES, INC. AND SUBSIDIARIES
Notes to Consolidated Financial Statements
2016 | 2015 | 2014 | ||||||||||||||||||||
Net sales by segment: | ||||||||||||||||||||||
U.S. | $ | 190,092 | $ | 149,614 | $ | 145,691 | ||||||||||||||||
Asia | 301,893 | 206,779 | 79,325 | |||||||||||||||||||
Mexico | 129,756 | 97,912 | 28,725 | |||||||||||||||||||
EMEA | 133,136 | 131,547 | 67,006 | |||||||||||||||||||
|
|
| ||||||||||||||||||||
Total net sales | $ | 754,877 | $ | 585,852 | $ | 320,747 | ||||||||||||||||
|
|
| ||||||||||||||||||||
Net sales by geographic location (1): | ||||||||||||||||||||||
United States | $ | 190,092 | $ | 149,614 | $ | 145,691 | ||||||||||||||||
China | 301,893 | 206,779 | 79,325 | |||||||||||||||||||
Mexico | 129,756 | 97,912 | 28,725 | |||||||||||||||||||
Turkey | 133,136 | 131,547 | 67,006 | |||||||||||||||||||
|
|
| ||||||||||||||||||||
Total net sales | $ | 754,877 | $ | 585,852 | $ | 320,747 | ||||||||||||||||
|
|
| ||||||||||||||||||||
Depreciation and amortization: | ||||||||||||||||||||||
U.S. | $ | 3,336 | $ | 3,477 | $ | 3,342 | ||||||||||||||||
Asia | 4,534 | 4,181 | 1,899 | |||||||||||||||||||
Mexico | 2,328 | 1,533 | 517 | |||||||||||||||||||
EMEA | 2,699 | 2,225 | 1,683 | |||||||||||||||||||
|
|
| ||||||||||||||||||||
Total depreciation and amortization | $ | 12,897 | $ | 11,416 | �� | $ | 7,441 | |||||||||||||||
|
|
| ||||||||||||||||||||
Capital expenditures: | ||||||||||||||||||||||
U.S. | $ | 4,056 | $ | 5,379 | $ | 808 | ||||||||||||||||
Asia | 3,287 | 15,632 | 8,903 | |||||||||||||||||||
Mexico | 5,565 | 2,897 | 4,424 | |||||||||||||||||||
EMEA | 17,599 | 2,453 | 4,789 | |||||||||||||||||||
|
|
| ||||||||||||||||||||
Total capital expenditures | $ | 30,507 | $ | 26,361 | $ | 18,924 | ||||||||||||||||
|
|
| ||||||||||||||||||||
Income (loss) from operations: | ||||||||||||||||||||||
U.S. | $ | (25,099 | ) | $ | (13,405 | ) | $ | (1,199 | ) | |||||||||||||
Asia | 64,393 | 34,998 | 14,771 | |||||||||||||||||||
Mexico | 9,546 | 7,531 | (6,567 | ) | ||||||||||||||||||
EMEA | (5,727 | ) | (1,505 | ) | (1,528 | ) | ||||||||||||||||
|
|
| ||||||||||||||||||||
Total income from operations | $ | 43,113 | $ | 27,619 | $ | 5,477 | ||||||||||||||||
2015 | 2014 |
|
|
|
| |||||||||||||||||
Tangible long-lived assets: | ||||||||||||||||||||||
U.S. | $ | 13,805 | $ | 9,039 | $ | 16,740 | $ | 13,805 | ||||||||||||||
Asia (China) | 29,957 | 19,490 | 26,341 | 29,957 | ||||||||||||||||||
Mexico | 24,842 | 12,600 | ||||||||||||||||||||
EMEA (Turkey) | 11,370 | 13,569 | 23,243 | 11,370 | ||||||||||||||||||
Mexico | 12,600 | 9,701 | ||||||||||||||||||||
|
|
|
| |||||||||||||||||||
Total tangible long-lived assets | $ | 67,732 | $ | 51,799 | $ | 91,166 | $ | 67,732 | ||||||||||||||
|
|
|
| |||||||||||||||||||
Total assets: | ||||||||||||||||||||||
U.S. | $ | 121,113 | $ | 61,386 | $ | 115,213 | $ | 116,893 | ||||||||||||||
Asia | 92,804 | 98,666 | 172,315 | 92,804 | ||||||||||||||||||
Mexico | 68,231 | 48,002 | ||||||||||||||||||||
EMEA | 72,221 | 93,810 | 81,447 | 72,221 | ||||||||||||||||||
Mexico | 48,002 | 24,098 | ||||||||||||||||||||
|
|
|
|
| ||||||||||||||||||
Total assets | $ | 334,140 | $ | 277,960 | $ | 437,206 | $ | 329,920 | ||||||||||||||
|
|
|
|
| ||||||||||||||||||
| (1) |
TPI COMPOSITES, INC. AND SUBSIDIARIES
Notes to Consolidated Financial Statements
Note 20. Selected Quarterly Financial Data (Unaudited)
The following tables set forth certain unaudited financial information for each quarter of 2016 and 2015. The unaudited quarterly information includes all normal recurring adjustments that, in the opinion of management, are necessary for the fair presentation of the information for the periods presented. The operating results for any quarter are not necessarily indicative of the results for any future period. The unaudited quarterly results are as follows (in thousands, except per share data):
2016 | ||||||||||||||||
First Quarter | Second Quarter | Third Quarter | Fourth Quarter | |||||||||||||
Net sales | $ | 176,110 | $ | 194,255 | $ | 198,938 | $ | 185,574 | ||||||||
Income from operations | 8,189 | 17,478 | 8,137 | 9,309 | ||||||||||||
Net income (loss) | 1,746 | 11,555 | 2,797 | (2,256 | ) | |||||||||||
Net income (loss) attributable to common shareholders | (691 | ) | 9,117 | 2,201 | (2,256 | ) | ||||||||||
Net income (loss) per common share: | ||||||||||||||||
Basic | $ | (0.16 | ) | $ | 2.15 | $ | 0.08 | $ | (0.07 | ) | ||||||
Diluted | $ | (0.16 | ) | $ | 2.15 | $ | 0.08 | $ | (0.07 | ) | ||||||
2015 | ||||||||||||||||
First Quarter | Second Quarter | Third Quarter | Fourth Quarter | |||||||||||||
Net sales | $ | 95,589 | $ | 149,739 | $ | 161,578 | $ | 178,946 | ||||||||
Income (loss) from operations | (2,657 | ) | 9,251 | 4,412 | 16,613 | |||||||||||
Net income (loss) | (5,737 | ) | 4,090 | (2,147 | ) | 11,476 | ||||||||||
Net income (loss) attributable to common shareholders | (8,093 | ) | 1,734 | (4,502 | ) | 9,120 | ||||||||||
Net income (loss) per common share: | ||||||||||||||||
Basic | $ | (1.91 | ) | $ | 0.41 | $ | (1.06 | ) | $ | 2.15 | ||||||
Diluted | $ | (1.91 | ) | $ | 0.41 | $ | (1.06 | ) | $ | 2.15 | ||||||
Note 21. Subsequent Events
(a) Customer Advance
In January 2016,February 2017, the Company’s Mexico segmentCompany entered into ana credit agreement with GE, a related party, and receivedChinese financial institution to provide an advanceunsecured credit line of $2.0 million. These funds will be usedup to expand the existing Mexico manufacturing facility to accommodate larger wind blade models. The Mexico segment is obligated to repay the advance, without interest, by providing future credits against a specified number of wind blade sets sold to GE. If the Mexico segment fails to supply those wind blade sets by December 31, 2016, the then outstanding balance of the advance will be immediately due and payable. The advance will also be immediately due in full upon a change of control of the Company or within 30 days after the effective date of an initial public offering of the Company’s common stock.
(b) Stock Split
On July 6, 2016, the Company amended its amended and restated certificate of incorporation to effect a 360-for-1 stock split of its common stock. The stock split did not cause an adjustment to the par value of the authorized shares of common stock. As a result of the stock split, the Company has adjusted the share amounts authorized and issuable under the share-based compensation plans. All of the share and per share information for common stock (and the share-based compensation plans) referenced throughout the consolidated financial statements and notes thereto have been retroactively adjusted to reflect this stock split.
SCHEDULE I—CONDENSED FINANCIAL INFORMATION OF THE REGISTRANT
TPI COMPOSITES, INC.
PARENT COMPANY BALANCE SHEETS
(In thousands, except share data)
December 31, | ||||||||
2015 | 2014 | |||||||
Assets | ||||||||
Current assets: | ||||||||
Cash and cash equivalents | $ | 18,222 | $ | 16,227 | ||||
Prepaid expenses and other current assets | 3,673 | 580 | ||||||
|
|
|
| |||||
Total current assets | 21,895 | 16,807 | ||||||
Accounts receivable—intercompany | 146,681 | 138,451 | ||||||
Investments in subsidiaries | (70,870 | ) | (88,017 | ) | ||||
Other noncurrent assets | 4,220 | 4,256 | ||||||
|
|
|
| |||||
Total assets | $ | 101,926 | $ | 71,497 | ||||
|
|
|
| |||||
Liabilities and Shareholders’ Deficit | ||||||||
Current liabilities: | ||||||||
Accounts payable—intercompany | $ | 10,806 | $ | 9,090 | ||||
Current maturities of long-term debt, net of discount | 1,848 | 940 | ||||||
Other current liabilities | 2,129 | 1,184 | ||||||
|
|
|
| |||||
Total current liabilities | 14,783 | 11,214 | ||||||
Long-term debt, net of discount and current maturities | 79,510 | 58,027 | ||||||
|
|
|
| |||||
Total liabilities | 94,293 | 69,241 | ||||||
|
|
|
| |||||
Series A convertible preferred shares | 50,901 | 49,138 | ||||||
Series B convertible preferred shares | 41,200 | 39,600 | ||||||
Series B-1 convertible preferred shares | 52,510 | 50,430 | ||||||
Series C convertible preferred shares | 17,490 | 16,770 | ||||||
Senior redeemable preferred shares | 27,585 | 25,065 | ||||||
Super senior redeemable preferred shares | 8,060 | 7,262 | ||||||
Redeemable preferred share warrants | 1,084 | 1,084 | ||||||
|
|
|
| |||||
Total convertible and senior preferred shares and warrants | 198,830 | 189,349 | ||||||
|
|
|
| |||||
Shareholders’ deficit: | ||||||||
Accumulated other comprehensive income (loss) | (25 | ) | 2,338 | |||||
Accumulated deficit | (191,172 | ) | (189,431 | ) | ||||
|
|
|
| |||||
Total shareholders’ deficit | (191,197 | ) | (187,093 | ) | ||||
|
|
|
| |||||
Total liabilities and shareholders’ deficit | $ | 101,926 | $ | 71,497 | ||||
|
|
|
| |||||
See accompanying notes to condensed financial statements.
TPI COMPOSITES, INC.
PARENT COMPANY STATEMENTS OF OPERATIONS
(In thousands)
Year ended | ||||||||
2015 | 2014 | |||||||
Net sales | $ | — | $ | — | ||||
Total cost of goods sold | — | — | ||||||
|
|
|
| |||||
Gross profit | — | — | ||||||
General and administrative expenses | 203 | 167 | ||||||
|
|
|
| |||||
Loss from operations | (203 | ) | (167 | ) | ||||
|
|
|
| |||||
Other income (expense): | ||||||||
Equity in earnings of subsidiaries, net of tax | 18,422 | 872 | ||||||
Interest expense, net of interest income | (10,533 | ) | (7,075 | ) | ||||
|
|
|
| |||||
Total other income (expense) | 7,889 | (6,203 | ) | |||||
|
|
|
| |||||
Income (loss) before income taxes | 7,686 | (6,370 | ) | |||||
Income tax provision | (4 | ) | (278 | ) | ||||
|
|
|
| |||||
Net income (loss) | 7,682 | (6,648 | ) | |||||
Net income attributable to preferred shareholders | 9,423 | 13,930 | ||||||
|
|
|
| |||||
Net loss attributable to common shareholders | $ | (1,741 | ) | $ | (20,578 | ) | ||
|
|
|
| |||||
See accompanying notes to condensed financial statements.
TPI COMPOSITES, INC.
PARENT COMPANY STATEMENTS OF COMPREHENSIVE INCOME (LOSS)
(In thousands)
Year ended | ||||||||
2015 | 2014 | |||||||
Net income (loss) | $ | 7,682 | $ | (6,648 | ) | |||
Other comprehensive loss: | ||||||||
Subsidiaries’ other comprehensive loss | (2,363 | ) | (249 | ) | ||||
|
|
|
| |||||
Comprehensive income (loss) | $ | 5,319 | $ | (6,897 | ) | |||
|
|
|
| |||||
See accompanying notes to condensed financial statements.
TPI COMPOSITES, INC.
PARENT COMPANY STATEMENTS OF CASH FLOWS
(In thousands)
Year ended | ||||||||
2015 | 2014 | |||||||
Net cash used in operating activities | $ | (12,140 | ) | $ | (9,672 | ) | ||
|
|
|
| |||||
Net cash used in investing activities | (5,240 | ) | (32,103 | ) | ||||
|
|
|
| |||||
Cash flows from financing activities: | ||||||||
Net proceeds from term loans | 19,375 | 50,000 | ||||||
Proceeds from issuance of preferred stock | — | 6,846 | ||||||
|
|
|
| |||||
Net cash provided by financing activities | 19,375 | 56,846 | ||||||
|
|
|
| |||||
Net change in cash and cash equivalents | 1,995 | 15,071 | ||||||
Cash and cash equivalents, beginning of year | 16,227 | 1,156 | ||||||
|
|
|
| |||||
Cash and cash equivalents, end of year | $ | 18,222 | $ | 16,227 | ||||
|
|
|
| |||||
See accompanying notes to condensed financial statements.
TPI COMPOSITES, INC.
NOTES TO PARENT COMPANY FINANCIAL STATEMENTS
Note 1. Description of Business and Basis of Presentation
TPI Composites, Inc., or TPI, is the holding company that conducts substantially all of its business operations through its direct and indirect subsidiaries. During the years ended December 31, 2015 and 2014, TPI did not receive any cash dividends from its subsidiaries in China. Accordingly, these condensed financial statements have been prepared on a “parent-only” basis. Under a parent-only presentation, TPI’s investments in its consolidated subsidiaries are presented under the equity method of accounting. These parent-only financial statements should be read in conjunction with TPI Composites, Inc. and Subsidiaries audited consolidated financial statements and related notes included elsewhere in this prospectus. There are material restrictions on TPI’s ability to obtain funds from its indirect subsidiaries in China through dividends, loans or advances.
Note 2. Debt
As150.0 million Renminbi (approximately $21.6 million as of December 31, 2015, TPI had $81.4 million2016), which can be used for the purpose of debt outstanding. For more detailsdomestic and foreign currency loans, issuing letters of guarantee or other transactions approved by the lender. Interest on the compositioncredit line accrues at the LIBOR rate plus an applicable margin and can be paid monthly, quarterly or at the time of the balance and various debt transactions which took place during the year, see note 14 to the consolidated financial statements included elsewhere in this prospectus.
Note 3. Preferred Shares and Warrants
Since October 2007, TPI has issued preferred shares to investors and since June 2013 has issued warrants for the purchase of preferred shares in connection with certain debt and preferred share issuances. See note 15 to the consolidated financial statements included elsewhere in this prospectus for more details.
Note 4. Commitments and Contingencies
In addition to the debt amounts noted above, TPI has guaranteed the performance under certain agreements of its direct or indirect subsidiaries. See note 16 to the consolidated financial statements included elsewhere in this prospectus for more details.debt’s maturity (February 23, 2018).
7,250,0004,500,000 Shares

Common Stock
PROSPECTUS
J.P. Morgan | Morgan Stanley |
| Cowen and Company | Raymond James | Canaccord Genuity |
Through and including , 2016 (the 25th day after the date of this prospectus), all dealers effecting transactions in these securities, whether or not participating in this offering, may be required to deliver a prospectus. This is in addition to the dealers’ obligation to deliver a prospectus when acting as an underwriter and with respect to an unsold allotment or subscription.
Part II
INFORMATION NOT REQUIRED IN PROSPECTUS
Item 13. Other Expenses of Issuance and Distribution.
The expenses (other than underwriting discounts and commissions) payable by us in connection with this offering are as follows:
Amount | Amount | |||||||
Securities and Exchange Commission registration fee | $ | 15,105 | $ | 11,672 | ||||
Financial Industry Regulatory Authority filing fee | 15,500 | 15,500 | ||||||
The NASDAQ Global Market listing fee | 25,000 | |||||||
Accountants’ fees and expenses | 1,900,000 | 175,000 | ||||||
Legal fees and expenses | 2,000,000 | 400,000 | ||||||
Transfer Agent’s fees and expenses | 4,000 | 5,000 | ||||||
Printing and engraving expenses | 1,000,000 | 225,000 | ||||||
Miscellaneous | 40,395 | 17,828 | ||||||
|
| |||||||
Total Expenses | $ | 5,000,000 | $ | 850,000 | ||||
|
| |||||||
All expenses are estimated except for the Securities and Exchange Commission registration fee and the Financial Industry Regulatory Authority filing fee and the NASDAQ Global Market listing fee.
Item 14. Indemnification of Directors and Officers.
Section 145(a) of the Delaware General Corporation Law provides, in general, that a corporation may indemnify any person who was or is a party or is threatened to be made a party to any threatened, pending or completed action, suit or proceeding, whether civil, criminal, administrative or investigative (other than an action by or in the right of the corporation), because he or she is or was a director, officer, employee or agent of the corporation, or is or was serving at the request of the corporation as a director, officer, employee or agent of another corporation, partnership, joint venture, trust or other enterprise, against expenses (including attorneys’ fees), judgments, fines and amounts paid in settlement actually and reasonably incurred by the person in connection with such action, suit or proceeding, if he or she acted in good faith and in a manner he or she reasonably believed to be in or not opposed to the best interests of the corporation and, with respect to any criminal action or proceeding, had no reasonable cause to believe his or her conduct was unlawful.
Section 145(b) of the Delaware General Corporation Law provides, in general, that a corporation may indemnify any person who was or is a party or is threatened to be made a party to any threatened, pending or completed action or suit by or in the right of the corporation to procure a judgment in its favor because the person is or was a director, officer, employee or agent of the corporation, or is or was serving at the request of the corporation as a director, officer, employee or agent of another corporation, partnership, joint venture, trust or other enterprise, against expenses (including attorneys’ fees) actually and reasonably incurred by the person in connection with the defense or settlement of such action or suit if he or she acted in good faith and in a manner he or she reasonably believed to be in or not opposed to the best interests of the corporation, except that no indemnification shall be made with respect to any claim, issue or matter as to which he or she shall have been adjudged to be liable to the corporation unless and only to the extent that the Court of Chancery or other adjudicating court determines that, despite the adjudication of liability but in view of all of the circumstances of the case, he or she is fairly and reasonably entitled to indemnity for such expenses which the Court of Chancery or other adjudicating court shall deem proper.
II-1
Section 145(g) of the Delaware General Corporation Law provides, in general, that a corporation may purchase and maintain insurance on behalf of any person who is or was a director, officer, employee or agent of the corporation, or is or was serving at the request of the corporation as a director, officer, employee or agent of another corporation, partnership, joint venture, trust or other enterprise against any liability asserted against such person and incurred by such person in any such capacity, or arising out of his or her status as such, whether or not the corporation would have the power to indemnify the person against such liability under Section 145 of the Delaware General Corporation Law.
Article VII of our certificate of incorporation, provides that no director of our company shall be personally liable to us or our stockholders for monetary damages for any breach of fiduciary duty as a director, except for liability (1) for any breach of the director’s duty of loyalty to us or our stockholders, (2) for acts or omissions not in good faith or which involve intentional misconduct or a knowing violation of law, (3) in respect of unlawful dividend payments or stock redemptions or repurchases, or (4) for any transaction from which the director derived an improper personal benefit. In addition, our certificate of incorporation provides that if the Delaware General Corporation Law is amended to authorize the further elimination or limitation of the liability of directors, then the liability of a director of our company shall be eliminated or limited to the fullest extent permitted by the Delaware General Corporation Law, as so amended.
Article VII of the certificate of incorporation further provides that any repeal or modification of such article by our stockholders or an amendment to the Delaware General Corporation Law will not adversely affect any right or protection existing at the time of such repeal or modification with respect to any acts or omissions occurring before such repeal or modification of a director serving at the time of such repeal or modification.
Article V of our by-laws provides that we will indemnify each of our directors and officers and, in the discretion of our board of directors, certain employees, to the fullest extent permitted by the Delaware General Corporation Law as the same may be amended (except that in the case of an amendment, only to the extent that the amendment permits us to provide broader indemnification rights than the Delaware General Corporation Law permitted us to provide prior to such amendment) against any and all expenses, judgments, penalties, fines and amounts reasonably paid in settlement that are incurred by the director, officer or such employee or on the director’s, officer’s or employee’s behalf in connection with any threatened, pending or completed proceeding or any claim, issue or matter therein, to which he or she is or is threatened to be made a party because he or she is or was serving as a director, officer or employee of our company, or at our request as a director, partner, trustee, officer, employee or agent of another corporation, partnership, joint venture, trust, employee benefit plan or other enterprise, if he or she acted in good faith and in a manner he or she reasonably believed to be in or not opposed to the best interests of our company and, with respect to any criminal proceeding, had no reasonable cause to believe his or her conduct was unlawful. Article V of the by-laws further provides for the advancement of expenses to each of our directors and, in the discretion of the board of directors, to certain officers and employees.
In addition, Article V of the by-laws provides that the right of each of our directors and officers to indemnification and advancement of expenses shall be a contract right and shall not be exclusive of any other right now possessed or hereafter acquired under any statute, provision of the certificate of incorporation or by-laws, agreement, vote of stockholders or otherwise. Furthermore, Article V of the by-laws authorizes us to provide insurance for our directors, officers and employees, against any liability, whether or not we would have the power to indemnify such person against such liability under the Delaware General Corporation Law or the provisions of Article V of the by-laws.
We have entered into indemnification agreements with each of our directors and our executive officers. These agreements provide that we will indemnify each of our directors and such officers to the fullest extent permitted by law and the certificate of incorporation and by-laws.
II-2
We also maintain a general liability insurance policy that covers certain liabilities of directors and officers of our company arising out of claims based on acts or omissions in their capacities as directors or officers.
II-2
In any underwriting agreement we enter into in connection with the sale of common stock being registered hereby, the underwriters will agree to indemnify, under certain conditions, us, the selling stockholders, our directors, our officers and persons who control us within the meaning of the Securities Act against certain liabilities arising out of any alleged untrue statements or omissions in any information relating to, and furnished by, the underwriters in writing to us for use in this registration statement or any prospectus for this offering.
Item 15. Recent Sales of Unregistered Securities.
During the last three years, we sold the following securities on an unregistered basis:
(1) In June 2013, we issued a warrant to purchase 120.016 shares of our Series B preferred stock at a price per share of $8,748.81.
(2) In February 2014, we issued a warrant to purchase 40.005 shares of our Series B preferred stock at a price per share of $8,748.81.
(3)(2) In February 2014, we issued an aggregate of $5.0 million of bridge notes and related warrants to purchase an aggregate of 40.005 shares of our Series B preferred stock at a price per share of $8,748.81.
(4)(3) In May 2014, we sold an aggregate of 120 shares of our Super Senior Redeemable preferred stock at a purchase price of $25,000 per share. In connection with such issuances, we issued warrants to purchase an aggregate of 20.574 shares of our Series B preferred stock at a price per share of $8,748.81.
(5)(4) In June 2014, we sold an aggregate of 160 shares of our Super Senior Redeemable preferred stock at a purchase price of $25,000 per share. In connection with such issuances, we issued warrants to purchase an aggregate of 27.432 shares of our Series B preferred stock at a price per share of $8,748.81.
(6)(5) In December 2014, we issued an aggregate of $10.0 million of Subordinated Convertible Promissory Notes and related warrants to purchase an aggregate of 61,720 shares of the Company’s capital stock at a price per share of the lesser of $24.30 per share or 85% of the initial public offering price per share.
(7)(6) In May 2015, we granted awards of 2,664,360 stock options and 703,080 restricted stock units to certain employees and non-employee directors pursuant to our 2015 Plan.
(8)(7) In August 2015, we granted an award of 25,920 restricted stock units to an employee pursuant to our 2015 Plan.
(9)(8) In December 2015, we granted awards of 604,800 stock options and 2,880 restricted stock units to certain employees and non-employee directors pursuant to our 2015 plan.
(10)(9) In January 2016, we granted an award of 72,000 stock options to an employee pursuant to our 2015 Plan.
(11)(10) In March 2016, we granted awards of 201,600 stock options to certain employees pursuant to our 2015 Plan.
No underwriters were involved in the foregoing sales of securities. The securities described in paragraphs (1) through (6) of this Item 15 were issued to U.S. investors in reliance upon the exemption from the registration requirements of the Securities Act, as set forth in Section 4(a)(2) under the Securities Act and
II-3
Rule 506 of Regulation D promulgated thereunder relative to sales by an issuer not involving any public offering,
II-3
to the extent an exemption from such registration was required. We deemed the grants of awards described in paragraphs (7) through (11)(10) as exempt from registration under the Securities Act in reliance on Rule 701 of the Securities Act as offers and sales of securities under compensatory benefit plans and contracts relating to compensation in compliance with Rule 701. Each of the recipients of securities in any transaction exempt from registration either received or had adequate access, through employment, business or other relationships, to information about us.
Item 16. Exhibits and Financial Statement Schedules.
(a) Exhibits.
The exhibits to the registration statement are listed in the Exhibit Index to this registration statement and are incorporated herein by reference.
(b) Financial Statement Schedules.
Schedule I—Condensed Financial Information of the Registrant
Schedules not listed above have been omitted because the information required to be set forth therein is not applicable or is shown in the financial statements or notes thereto.
Item 17. Undertakings.
(a) The undersigned registrant hereby undertakes to provide to the underwriter at the closing specified in the underwriting agreements, certificates in such denominations and registered in such names as required by the underwriter to permit prompt delivery to each purchaser.
(b) Insofar as indemnification for liabilities arising under the Securities Act of 1933 may be permitted to directors, officers and controlling persons of the registrant pursuant to the foregoing provisions, or otherwise, the registrant has been advised that in the opinion of the Securities and Exchange Commission such indemnification is against public policy as expressed in the Act and is, therefore, unenforceable. In the event that a claim for indemnification against such liabilities (other than the payment by the registrant of expenses incurred or paid by a director, officer or controlling person of the registrant in the successful defense of any action, suit or proceeding) is asserted by such director, officer or controlling person in connection with the securities being registered, the registrant will, unless in the opinion of its counsel the matter has been settled by controlling precedent, submit to a court of appropriate jurisdiction the question whether such indemnification by it is against public policy as expressed in the Act and will be governed by the final adjudication of such issue.
(c) The undersigned registrant hereby undertakes that:
(i) For purposes of determining any liability under the Securities Act of 1933, the information omitted from the form of prospectus filed as part of this registration statement in reliance upon Rule 430A and contained in a form of prospectus filed by the registrant pursuant to Rule 424(b)(1) or (4) or 497(h) under the Securities Act of 1933 shall be deemed to be part of this registration statement as of the time it was declared effective.
(ii) For the purpose of determining any liability under the Securities Act of 1933, eachpost-effective amendment that contains a form of prospectus shall be deemed to be a new registration statement relating to the securities offered therein, and the offering of such securities at that time shall be deemed to be the initialbona fideoffering thereof.
II-4
SIGNATURES
Pursuant to the requirements of the Securities Act of 1933, the registrant has duly caused this registration statement to be signed on its behalf by the undersigned, thereunto duly authorized, in the city of Scottsdale, State of Arizona, on this 11th8th day of July, 2016.May, 2017.
| TPI Composites, Inc. | ||
| By: | /s/ Steven C. Lockard Steven C. Lockard, Chief Executive Officer | |
Pursuant to the requirements of the Securities Act of 1933, this Registration Statement has been signed by the following persons in the capacities indicated below on the 11th8th day of July, 2016.May, 2017.
Signature | Title | Date | ||
/s/ Steven C. Lockard Steven C. Lockard | President, Chief Executive Officer and Director (Principal Executive Officer) | |||
| ||||
/s/ William E. Siwek William E. Siwek | Chief Financial Officer (Principal Financial and Accounting Officer) | |||
* Stephen B. Bransfield | Director | |||
* Michael L. DeRosa | Director | |||
* Philip J. Deutch | Director | |||
* Paul G. Giovacchini | Director and Chairman of the Board | |||
* Jack A. Henry | Director | |||
* James A. Hughes | Director | |||
| ||||
II-5
|
|
| ||
* Daniel G. Weiss | Director | |||
* Pursuant to Power of Attorney | ||
| By: | /s/ Steven C. Lockard | |
Steven C. Lockard | ||
II-6II-5
Exhibit Index
Number | Description | |
| 1.1** | Form of Underwriting Agreement | |
| | ||
| | ||
| Second Amended and Restated By-laws of the Registrant, as currently in effect (incorporated by reference to Exhibit 3.4 to the Registrant’s Registration Statement on Form S-1 (File No. 333-212093) filed on July 11, 2016) | ||
| | Specimen Stock Certificate (incorporated by reference to Exhibit 4.1 to the Registrant’s Registration Statement on Form | |
| | ||
| Third Amended and Restated Investor Rights Agreement by and among the Registrant and the investors named therein, dated June 17, 2010, as amended (incorporated by reference to Exhibit 4.2 to the Registrant’s Registration Statement on Form S-1 (FileNo. 333-212093) filed on June 17, 2016) | ||
| | ||
| Form of Common Warrant (incorporated by reference to Exhibit 4.5 to the Registrant’s Registration Statement on Form S-1 (File No. 333-212093) filed on June 17, 2016) | ||
| 5.1** | Opinion of Goodwin Procter LLP | |
| 2008 Stock Option and Grant Plan, as amended by Amendment No. 1, dated August 14, 2008 and Amendment No. 2, dated December 30, 2008, and forms of award agreements thereunder (incorporated by reference to Exhibit 10.1 to the Registrant’s Registration Statement onForm S-1 (File No. 333-212093) filed on June 17, 2016) | ||
| Amended and Restated 2015 Stock Option and Incentive Plan and forms of award agreements thereunder (incorporated by reference to Exhibit 10.2 to the Registrant’s Registration Statement on Form S-1 (File No. 333-212093) filed on June 17, 2016) | ||
| Amendment No. 5 to Financing Agreement between the Registrant, | ||
| Supply Agreement between General Electric International, Inc. and TPI Kompozit Kanat Sanayi ve Ticaret A.S., entered into as of December 21, 2011, as amended (incorporated by reference to Exhibit 10.7 to the Registrant’s Registration Statement onForm S-1 (FileNo. 333-212093) filed on June 17, 2016) | ||
| Amended and Restated Supply Agreement between General Electric International, Inc. and TPI Iowa, LLC, entered into as of | ||
II-6
Number | Description | |
| Supply Agreement between General Electric International, Inc. and TPI China, LLC, entered into as of January 1, 2007, as amended (incorporated by reference to Exhibit 10.9 to the Registrant’s Registration Statement on Form S-1 (File No. 333-212093) filed on June 17, 2016) | ||
| Supply Agreement between General Electric International, Inc. and TPI Mexico, LLC, entered into as of October 18, 2013, as amended (incorporated by reference to Exhibit 10.10 to the Registrant’s Registration Statement on Form S-1 (File No. 333-212093) filed on June 17, 2016) | ||
| First Amendment to Supply Agreement between General Electric International, Inc. and TPI Mexico, LLC, entered into as of October 4, 2016 (incorporated by reference to Exhibit 10.2 of the Registrant’s Current Report on Form 8-K/A (File No. 001-37839) filed on April 20, 2017) | ||
| 10.11 | Lease between TPI Iowa, LLC and Opus Northwest L.L.C., dated November 13, 2007, as amended (incorporated by reference to Exhibit 10.11 to the Registrant’s Registration Statement on Form S-1 (File No. 333-212093) filed on June 17, 2016) | |
| Commencement Date Memorandum between TPI Iowa LLC and Opus Northwest, L.L.C., entered into as of July 25, 2008 (incorporated by reference to Exhibit 10.12 to the Registrant’s Registration Statement on Form S-1 (File No. 333-212093) filed on June 17, 2016) | ||
| Lease between TPI Kompozit Kanat Sanayi ve Ticaret A.S. and Med Union Containers A.S., dated March 16, 2012 | ||
II-7
|
| |
| Lease between TPI Wind Blade Dafeng Company Limited and Jiangsu Erhuajie Energy Equipment Co., Ltd, dated November 27, 2013, as amended (incorporated by reference to Exhibit 10.14 to the Registrant’s Registration Statement on Form S-1 (FileNo. 333-212093) filed on June 17, 2016) | ||
| Lease between the Registrant (f/k/a LCSI Holding, Inc.) and Gainey Center II LLC, dated June 12, 2007, as amended (incorporated by reference to Exhibit 10.15 to the Registrant’s Registration Statement on Form S-1 (File No. 333-212093) filed on June 17, 2016) | ||
| Lease between TPI, Inc. (f/k/a TPI Composites, Inc.) and Borden & Remington Fall River LLC, dated as of December 1, 2008, as superseded by Standard Industrial Lease between TPI, Inc. and Borden & Remington Fall River LLC, dated June 28, 2010, as amended (incorporated by reference to Exhibit 10.16 to the Registrant’s Registration Statement on Form S-1 (File No. 333-212093) filed on June 17, 2016) | ||
| Lease between Composite Solutions, Inc. and TN Realty, LLC, dated September 30, 2004, as amended (incorporated by reference to Exhibit 10.17 to the Registrant’s Registration Statement on Form S-1 (File No. 333-212093) filed on June 17, 2016) | ||
| Lease between TPI-Composites S. de R.L. de C.V. and Deutsche Bank México, S.A. Institución de Banca Múltiple, Division Fiduciaria, as Trustee of Trust F/1638, dated April 15, 2013, as amended (incorporated by reference to Exhibit 10.18 to the Registrant’s Registration Statement on Form S-1 (File No. 333-212093) filed on June 17, 2016) | ||
| Lease between TPI-Composites S. de R.L. de C.V. and The Bank of New York Mellon, S.A., as Trustee in the Trust F/00335, dated September 25, 2013 (incorporated by reference to Exhibit 10.19 to the Registrant’s Registration Statement on Form S-1 (FileNo. 333-212093) filed on June 17, 2016) | ||
II-7
Number | Description | |
| Lease between TPI Mexico, LLC and Trailer Transfer, Inc., dated October 16, 2013 (incorporated by reference to Exhibit 10.20 to the Registrant’s Registration Statement on Form S-1 (File No. 333-212093) filed on June 17, 2016) | ||
| Lease between TPI Mexico, LLC and Lanestone 1, LLC, dated April 14, 2014 (incorporated by reference to Exhibit 10.21 to the Registrant’s Registration Statement on Form S-1 (File No. 333-212093) filed on June 17, 2016) | ||
| Plant and Equipment Lease between TPI Composites (Taicang) Co., Ltd. and Suzhou Tianneng Power Wind Mold Co., Ltd, dated May 1, 2014 (incorporated by reference to Exhibit 10.22 to the Registrant’s Registration Statement on Form S-1 (File No. 333-212093) filed on June 17, 2016) | ||
| Form of Employment Agreement between the Registrant and each of its executive officers (incorporated by reference to Exhibit 10.23 to the Registrant’s Registration Statement on Form S-1 (File No. 333-212093) filed on June 17, 2016) | ||
| Form of Indemnification Agreement (incorporated by reference to Exhibit 10.24 to the Registrant’s Registration Statement on Form S-1 (File No. 333-212093) filed on June 17, 2016) | ||
| Contract between TPI Composites (Taicang) Co. Ltd. and Mr. Jun Ji, dated August 4, 2015 (incorporated by reference to Exhibit 10.25 to the Registrant’s Registration Statement on Form S-1 (File No. 333-212093) filed on June 17, 2016) | ||
| Lease between TPI Composites, S. de R.L. de C.V. and Vesta Baja California, S. de R.L. de C.V., dated November 20, 2015 (incorporated by reference to Exhibit 10.26 to the Registrant’s Registration Statement on Form S-1 (File No. 333-212093) filed on June 17, 2016) | ||
| Lease between TPI Turkey IZBAS, LLC and Dere Konstruksiyon Demir Celik Insaat Taahhut Muhendislik Musavirlik Sanayi ve Ticaret Anonim Sirketi, dated December 9, 2015 (incorporated by reference to Exhibit 10.27 to the Registrant’s Registration Statement on Form S-1 (File No. 333-212093) filed on June 17, 2016) | ||
| Lease between TPI Composites (Taicang) Co., Ltd. and Suzhou Suchen Chemical & Plastics Co., Ltd., dated August 5, 2014 (incorporated by reference to Exhibit 10.28 to the Registrant’s Registration Statement on Form S-1 (File No. 333-212093) filed on June 17, 2016) | ||
| Lease between TPI Wind Blade Dafeng Co., Ltd. and Jiangsu Jianhao Transmission Machinery Co., Ltd., commencing January 1, 2016 (incorporated by reference to Exhibit 10.29 to the Registrant’s Registration Statement on Form S-1 (File No. 333-212093) filed on June 17, 2016) | ||
| Lease between TPI Kompozit Kanat San. ve Tic. A.S. and BORO Insaat Yatirim Sanayi ve Ticaret A.S., dated October 16, 2015 (incorporated by reference to Exhibit 10.30 to the Registrant’s Registration Statement on Form S-1 (File No. 333-212093) filed on June 17, 2016) | ||
| Sublease between TPI Inc. and Nordex Energy GmbH, dated April 24, 2015 (incorporated by reference to Exhibit 10.31 to the Registrant’s Registration Statement on Form S-1 (File No. 333-212093) filed on June 17, 2016) | ||
| Settlement Agreement and Release between the Registrant and Nordex SE, dated June 3, 2016 (incorporated by reference to Exhibit 10.32 to the Registrant’s Registration Statement on Form S-1 (File No. 333-212093) filed on June 17, 2016) | ||
| Non-Employee Director Compensation Policy (incorporated by reference to Exhibit 10.33 to the Registrant’s Registration Statement on Form S-1 (File No. 333-212093) filed on July 11, 2016) | ||
II-8
Number | Description | |
| Senior Executive Cash Incentive Bonus Plan (incorporated by reference to Exhibit 10.34 to the Registrant’s Registration Statement on Form S-1 (File No. 333-212093) filed on July 11, 2016) | ||
| List of Subsidiaries (incorporated by reference to Exhibit 21.1 to the Registrant’s Registration Statement on Form S-1 (File No. 333-212093) filed on June 17, 2016) | ||
| 23.1* | Consent of KPMG LLP, Independent Registered Public Accounting Firm | |
| 23.2** | Consent of Goodwin Procter LLP (included in Exhibit 5.1) | |
| Power of Attorney (included | ||
| 101.INS* | XBRL Instance Document | |
| 101.SCH* | XBRL Taxonomy Extension Schema Document | |
| 101.CAL* | XBRL Taxonomy Extension Calculation Linkbase Document | |
| 101.DEF* | XBRL Taxonomy Extension Definition Linkbase Document | |
| 101.LAB* | XBRL Taxonomy Extension Label Linkbase Document | |
| 101.PRE* | XBRL Taxonomy Extension Presentation Linkbase Document | |
| * | Filed herewith. |
| ** | Previously filed. |
| † | Confidential treatment has been requested for certain provisions of this Exhibit pursuant to Rule 406 promulgated under the Securities Act of 1933. |
| ‡ | Indicates compensatory plan or |
II-8II-9