
| As filed with the Securities and Exchange Commission on January 22, 2018 |

Leslie Marlow, Esq. Hank Gracin, Esq. Patrick J. Egan, Esq. Gracin & Marlow, LLP The Chrysler Building 405 Lexington Avenue, 26th Floor New York, New York 10174 (212) 907-6457 | Louis Taubman, Esq. Hunter Taubman Fischer & LI LLC 1450 Broadway, 26th Floor New York, New York 1018 (917) 512-0827 |
| Large accelerated filer | Accelerated filer | ||
| Non-accelerated filer | Smaller reporting company | ||
| (Do not check if a smaller reporting company) | Emerging growth company | ☒ |
| Title of each class of securities to be registered | Proposed maximum aggregate offering price(1) | Amount of registration fee(2) |
| Series B Convertible Preferred Stock, par value $0.001 per share | $10,000,000 | $1,245 |
Common stock, par value $0.001 per share, issuable upon conversion of the Series B Convertible Preferred Stock(2)(3) | $— | $— |
Selling Agent’s Warrants(4) | $— | $— |
Shares of Common Stock underlying Selling Agent’s Warrants(2)(5) | $600,000 | $75 |
| Total | $10,600,000 | $1,320(6) |
Title of Each Class of Securities to be Registered | Amount to be Registered (1)(2) | Proposed Maximum Offering Price per Security (2) | Proposed Maximum Aggregate Offering Price (3) | Amount of Registration Fee (4) | ||||||||||
Common stock issuable upon conversion of notes, par value $0.001 per share | 20,535,714 | $ | 0.28 | $ | 5,750,000 | $ | 579.03 | |||||||
Common stock issuable upon exercise of warrants with an exercise price of $0.45 per share, par value $0.001 per share | 10,541,666 | $ | 0.28 | $ | 2,951,667 | $ | 297.23 | |||||||
Common stock issuable upon exercise of warrants with an exercise price of $0.35 per share, par value $0.001 per share | 2,053,571 | $ | 0.28 | $ | 575,000 | $ | 57.90 | |||||||
Total | 33,130,951 | $ | 0.28 | $ | 9,276,667 | $ | 934.16 | |||||||
(3) No fee pursuant to Rule 457(i) under the Securities Act. (4) No fee pursuant to Rule 457(g) under the Securities Act. (5) Estimated solely for the purpose of calculating the registration fee pursuant to Rule 457(g) under the Securities Act. The selling agent’s warrants are exercisable at a per share exercise price equal to 120% of the public offering price per share. As estimated solely for the purpose of calculating the registration fee pursuant to Rule 457(g) under the Securities Act, the proposed maximum aggregate offering price of the selling agent’s warrants is $600,000, which is equal to 120% of $500,000 (5% of $10,000,000). (6) Previously paid. |

Per Share | Total | |
| Public offering price | $ 9.50 | $ 10,000,000 |
Selling agent’s fee's (1) | $ 0.38 | $ 400,000 |
Proceeds, before expenses, to us (2)(3) | $ 9.12 | $9,600,000 |
| (1) | We have also agreed to reimburse the selling agent for certain expenses. In addition, we have agreed to issue to the selling agent warrants, to purchase up to 105,263 shares of our common stock equal to five percent (5.0%) of the shares of common stock underlying the Series B Convertible Preferred Stock that is sold in the offering at an exercise price of $5.70 per share of our common stock as additional compensation, see the “Plan of Distribution”. |
| (2) | We estimated that our total expenses for this offering including the 10% merchandise credit (which based on the average cost of sales of our products is estimated to be $350,000), excluding selling agent commissions, will be approximately $600,000. |
| (3) | Assumes that all of the securities offered are sold. |
Sole Book Running Manager  |


Page | |
| 1 | |
| 1 | |
| 2 | |
| 13 | |
| 32 | |
| 63 | |
| 65 | |
| II-1 |

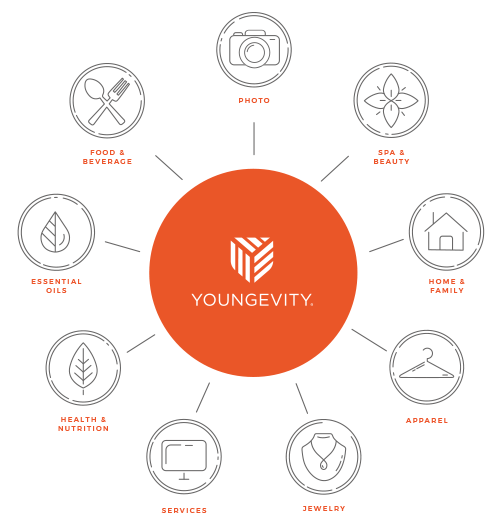
| ● | Nutritional | ● | Gourmet coffee |
| ● | ● | Skincare and cosmetics | |
| ● | Health and | ● | |
| ● | Lifestyle products (spa, bath, | ● | |
| ● | Digital products including | ● | |
| ● | Apparel and fashion accessories | ● | Business lending |
| Business | Date of Acquisition | Product Categories | |||
| BeautiControl, Inc. | December 13, 2017 | Cosmetic and Skin Care Products | |||
| Future Global Vision, Inc. | November 6, 2017 | Nutritional Supplements and Automotive Fuel Additive Products | |||
Sorvana International, LLC (FreeLife International, Inc.) | July 1, 2017 | Health and wellness products | |||
| Ricolife, LLC | March 1, 2017 | Teas | |||
| Bellavita Group, LLC | March 1, 2017 | Health and Beauty Products | |||
| Legacy for Life, LLC | September 1, 2016 | Nutritional Supplements | |||
| Nature’s Pearl Corporation | September 1, 2016 | Nutritional Supplements and Skin Care Products | |||
| Renew Interest, LLC (SOZO Global, Inc.) | July 29, 2016 | Nutritional Supplements and Skin Care Products | |||
| South Hill Designs Inc. | January 20, 2016 | Jewelry | |||
| PAWS Group, LLC | July 1, 2015 | Pet treats | |||
| Mialisia & Co., LLC | June 1, 2015 | Jewelry | |||
| JD Premium LLC | March 4, 2015 | Dietary Supplement Company | |||
| Sta-Natural, LLC | February 23, 2015 | Vitamins, Minerals and Supplements for families and their pets | |||
| Restart Your Life, LLC | October 1, 2014 | Dietary Supplements | |||
| Beyond Organics, LLC | May 1, 2014 | Organic Food and Beverages | |||
| Good Herbs, Inc. | April 28, 2014 | Herbal Supplements | |||
| Biometics International, Inc. | November 19, 2013 | Liquid Supplements | |||
| GoFoods Global, LLC | October 1, 2013 | Packaged Foods | |||
| Heritage Markers, LLC | August 14, 2013 | Digital Products | |||
| Livinity, Inc. | July 10, 2012 | Nutritional Products | |||
| GLIE, LLC (DBA True2Life) | March 20, 2012 | Nutritional Supplements |


| In March 2014, we expanded our coffee segment and started our new green coffee business with CLR’s acquisition of Siles Plantation Family Group, which is a wholly-owned subsidiary of CLR located in Matagalpa, Nicaragua. Siles Plantation Family Group includes “La Pita,” a dry-processing facility on approximately 26 acres of land and “El Paraiso,” a coffee plantation consisting of approximately 500 acres of land and thousands of coffee plants which produces 100 percent Arabica coffee beans that are shade grown, Organic, Rainforest Alliance Certified™ and Fair Trade Certified™. |  |
The plantation and |  |
 | Direct Selling Industry Direct selling is a business distribution model that allows a company to market its products directly to consumers by means of independent contractors and relationship referrals. Independent, unsalaried salespeople, referred to as distributors, represent us and are awarded a commission based upon the volume of product sold through each of their independent business operations. |
 | Youngevity International, Inc., formerly AL International, Inc., founded in 1996, operates through two segments including the following wholly-owned subsidiary: CLR Roasters, LLC (“CLR”) which operates our commercial coffee business, including the Siles Plantation Family Group S.A. located in Nicaragua. Our direct selling network includes the domestic operations of AL Global Corporation, 2400 Boswell LLC, MK Collaborative LLC, and Youngevity Global LLC. |

Effective July 23, 2013, we changed our name from AL International, Inc. to Youngevity International, Inc. On June 7, 2017, an amendment to our Certificate of Incorporation became effective which effectuated: (i) a 1-for-20 reverse stock split (the “Reverse Split”) of the issued and outstanding shares of Common Stock; (ii) a decrease in the number of shares of (a) Common Stock authorized from 600,000,000 to 50,000,000 and (b) preferred stock authorized from 100,000,000 to 5,000,000. |  |
| Issuer | Youngevity International, Inc. | |
| Securities offered | This prospectus covers the sale of up to $10,000,000 of is convertible (the “Offering”). | |
| Use of Proceeds | We | |
| Risk Factors | You should carefully read and consider the information set forth under “Risk Factors,” together with all of the other information set forth in this prospectus, before deciding to invest in shares of our | |
NASDAQ trading symbol | The Common Stock is | |
| Conversion Rights | Each outstanding share of Series B Convertible Preferred Stock is convertible at any time, in whole or in part, at the option of the holders initially into two shares of Common Stock and automatically converts to two shares of Common Stock on its two-year anniversary of issuance. The conversion price set forth in the certificate of designations of the preferred stock is subject to adjustment in the case of stock splits and stock dividends and other similar transactions. | |
| Dividends | Holders of the Series B Preferred Stock shall receive a quarterly cash dividend from the date of original issue at a rate of 5.0% per annum, payable quarterly in arrears on or about the last day of March, June, September and December of each year, beginning June 30, 2018. If the aggregate amount of dividends accrued and payable to a holder is less than $10.00, we may, at our option, retain and not make payment in the respect of such dividends until the aggregate number of dividends then accrued and payable to the holder is not less than $10.00. | |
| Liquidation | TheSeries B Convertible Preferred Stock will rank senior to our outstanding Series A Preferred Stock and our Common Stock with respect to dividend rights and rights upon our liquidation, dissolution or winding up. | |
| Merchandise Credit | Holders of the Series B Convertible Preferred Stock shall receive a credit towards our merchandise equal to ten percent (10%) of the amount of their investment up to a maximum credit of $1,000. | |
| Voting Rights | Holders of the Series B Convertible Preferred Stock shall have limited voting rights. | |
For the years ended December 31, | For the nine months ended September 30, | |||
2016 | 2015 | 2017 | 2016 | |
| ($000) | (Unaudited) | (Unaudited) | ||
Revenues | $162,667 | $156,597 | $124,655 | $124,264 |
Gross profit | $98,137 | $92,969 | $71,732 | $75,162 |
Total operating expenses | $95,622 | $87,563 | $76,625 | $71,899 |
Operating income (loss) | $2,515 | $5,406 | $(4,893) | $3,263 |
Net income (loss) available to common stockholders | $(410) | $(1,718) | $(5,866) | $100 |
Net (loss) income per share, basic (1) | $(0.02) | $(0.09) | $(0.30) | $0.00 |
Net (loss) income per share, diluted (1) | $(0.02) | $(0.09) | $(0.30) | $0.00 |
Weighted average shares outstanding, basic (1) | 19,632,086 | 19,603,780 | 19,655,312 | 19,631,195 |
Weighted average shares outstanding, diluted (1) | 19,632,086 | 19,603,780 | 19,655,312 | 20,005,758 |
December 31, 2016 | September 30, 2017 | |
| Balance Sheet Data ($000): | (Unaudited) | |
| Cash and Cash Equivalents | $869 | $1,373 |
| Total Current Assets | $27,908 | $29,664 |
| Total Assets | $66,008 | $73,997 |
| Total Current Liabilities | $25,310 | $31,820 |
| Total Liabilities | $47,010 | $59,377 |
| Total Stockholders’ Equity | $18,998 | $14,620 |
——————— | ||||
| ● | difficulties in assimilating acquired operations or products, including the loss of key employees from acquired businesses and disruption to our direct selling channel; | |||
| ● | diversion of management's attention from our core business; | |||
| ● | adverse effects on existing business relationships with suppliers and customers; and | |||
| ● | risks of entering markets in which we have limited or no prior experience. | |||
| ● | the possibility that local civil unrest, political instability or changes in diplomatic or trade relationships might disrupt our operations in an international market; |
| ● | the lack of well-established or reliable legal systems in certain areas; |
| ● | the presence of high inflation in the economies of international markets; |
| ● | the possibility that a foreign government authority might impose legal, tax or other financial burdens on us or our coffee operations, or sales force, due, for example, to the structure of our operations in various markets; |
| ● | the possibility that a government authority might challenge the status of our sales force as independent contractors or impose employment or social taxes on our sales force; and |
| ● | the possibility that governments may impose currency remittance restrictions limiting our ability to repatriate cash. |
| ● | General business and economic conditions; |
| ● | Adverse publicity or negative misinformation about us or our products; |
| ● | Public perceptions about network marketing programs; |
| ● | High-visibility investigations or legal proceedings against network marketing companies by federal or state authorities or private citizens; |
| ● | Public perceptions about the value and efficacy of nutritional, personal care, or weight management products generally; |
| ● | Other competing network marketing organizations entering into the marketplace that may recruit our existing distributors or reduce the potential pool of new distributors; and |
| ● | Changes to our compensation plan required by law or implemented for business reasons that make attracting and retaining distributors more difficult. |
| ● | variations in our quarterly operating results; |
| ● | announcements that our revenue or income/loss levels are below analysts’ expectations; |
| ● | general economic slowdowns; |
| ● | changes in market valuations of similar companies; |
| ● | announcements by us or our competitors of significant contracts; or |
| ● | acquisitions, strategic partnerships, joint ventures or capital commitments. |
| ● | authorize our board of directors to issue Preferred Stock, without further stockholder action and with voting liquidation, dividend and other rights superior to our Common Stock; and |
| ● | provide that vacancies on our board of directors may be filled only by the vote of a majority of directors then in office, even though less than a quorum. |
| ● | on an actual (unaudited) basis; |
| ● | on a pro forma basis to give effect to the conversion of the 2017 Notes into 1,577,033 shares of Common Stock upon the closing of the Offering, assuming gross proceeds from the Offering of $10,000,000; and |
| ● | on a pro forma adjusted basis to give effect to the proforma adjustment above and to give further effect to the Offering, assuming the sale of 1,052,631 shares of Series B Convertible Preferred Stock at an Offering price of $9.50 per share, and gross proceeds from the Offering of $10,000,000 and after deducting expenses related to the Offering payable by us estimated at approximately $1,000,000 including selling agent fees. |
| (in thousands) | As of September 30, 2017 | ||
Actual | Pro Forma | Pro Forma As Adjusted (1) | |
(unaudited) | (unaudited) | (unaudited) | |
| Cash and cash equivalents | $ 1,373 | $ 1,373 | $ 10,373 |
| Total liabilities | $ 59,377 | $ 54,216 | $ 54,216 |
| Shareholders’ Equity: | |||
| Preferred stock, $0.001 par value, 5,000,000 shares authorized: | |||
| Series A Convertible Preferred Stock, 161,135 shares issued and outstanding as of September 30, 2017 on an actual, pro forma and pro forma as adjusted basis. | - | - | - |
| Series B Convertible Preferred Stock, 0, 0 and 1,052,631 shares issued and outstanding as of September 30, 2017 on an actual, pro forma and pro forma as adjusted basis, respectively. | - | - | 1 |
| Common stock, $0.001 par value; 50,000,000 shares authorized: 19,723,285, 21,300,318 and 21,300,318 shares issued and outstanding as of September 30, 2017 on an actual, pro forma and proforma as adjusted basis, respectively. | 20 | 21 | 21 |
| Additional paid-in capital | 171,693 | 178,946 | 187,945 |
| Accumulated deficit | (156,873) | (158,966) | (158,966) |
| Accumulated other comprehensive loss | (220) | (220) | (220) |
| Total stockholders’ equity | 14,620 | 19,781 | 28,781 |
| Total capitalization | $ 14,620 | $ 19,781 | $ 28,781 |
| 2015 | 2014 | 2013 | ||||||||||||||||||||||
| High | Low | High | Low | High | Low | |||||||||||||||||||
| First Quarter | $ | 0.26 | 0.22 | $ | 0.25 | 0.16 | $ | 0.36 | $ | 0.15 | ||||||||||||||
| Second Quarter | $ | 0.40 | 0.24 | $ | 0.26 | 0.19 | $ | 0.35 | $ | 0.27 | ||||||||||||||
| Third Quarter | $ | 0.38 | 0.28 | $ | 0.31 | 0.25 | $ | 0.34 | $ | 0.23 | ||||||||||||||
| Fourth Quarter through December 18, 2015 | $ | 0.31 | 0.27 | $ | 0.28 | 0.18 | $ | 0.26 | $ | 0.18 | ||||||||||||||
2017 | 2016 | |||
High | Low | High | Low | |
| First Quarter | $5.96 | $5.00 | $6.60 | $4.40 |
| Second Quarter | $7.00 | $3.00 | $6.40 | $4.80 |
| Third Quarter | $6.75 | $4.28 | $6.40 | $4.60 |
| Fourth Quarter | $ 5.16 | $ 3.79 | $6.40 | $5.20 |
Three months ended | Nine months ended | |||
September 30, | September 30, | |||
2017 | 2016 | 2017 | 2016 | |
| Revenues | ||||
| Direct selling | $37,954 | $38,576 | $106,734 | $110,393 |
| As a % of Revenue | 85% | 89% | 86% | 89% |
| Commercial coffee | 6,441 | 4,986 | 17,921 | 13,871 |
| As a % of Revenue | 15% | 11% | 14% | 11% |
| Total revenues | $44,395 | $43,562 | $124,655 | $124,264 |
For the Three Months Ended September 30, | Percentage change | For the three months ended September 30, | Percentage | ||||||||||||
| Segment Revenues | 2015 | 2014 | 2017 | 2016 | change | ||||||||||
| Direct selling | $ | 37,056 | $ | 31,275 | 18.5 | % | $37,954 | $38,576 | (1.6)% | ||||||
| Commercial coffee | 4,270 | 6,344 | (32.7 | )% | 6,441 | 4,986 | 29.2% | ||||||||
| Total | $ | 41,326 | $ | 37,619 | 9.9 | % | $44,395 | $43,562 | 1.9% | ||||||
Gross Profit % For the Three Months Ended September 30, | ||||||||
| Segment Gross Profit | 2015 | 2014 | ||||||
| Direct selling | 68.5 | % | 66.8 | % | ||||
| Commercial coffee | (8.5 | )% | 1.2 | % | ||||
| Consolidated | 60.6 | % | 55.8 | % | ||||
For the three months ended September 30, | Percentage | ||
| Segment Gross Profit | 2017 | 2016 | change |
| Direct selling | $25,472 | $26,233 | (2.9)% |
| Gross Profit % of Revenues | 67.1% | 68.0% | (0.9)% |
| Commercial coffee | 292 | 135 | 116.3% |
| Gross Profit % of Revenues | 4.5% | 2.7% | 1.8% |
| Total | $25,764 | $26,368 | (2.3)% |
| Gross Profit % of Revenues | 58.0% | 60.5% | (2.5)% |
For the nine months ended September 30, | Percentage | ||
| Segment Revenues | 2017 | 2016 | change |
| Direct selling | $106,734 | $110,393 | (3.3)% |
| Commercial coffee | 17,921 | 13,871 | 29.2% |
| Total | $124,655 | $124,264 | 0.3% |
For the nine months ended September 30, | Percentage | ||
| Segment Gross Profit | 2017 | 2016 | change |
| Direct selling | $71,522 | $74,690 | (4.2)% |
| Gross Profit % of Revenues | 67.0% | 67.7% | (0.7)% |
| Commercial coffee | 210 | 472 | (55.5)% |
| Gross Profit % of Revenues | 1.2% | 3.4% | (2.2)% |
| Total | $71,732 | $75,162 | (4.6)% |
| Gross Profit % of Revenues | 57.5% | 60.5% | (3.0)% |
Three months ended | Nine months ended | |||
September 30, | September 30, | |||
2017 | 2016 | 2017 | 2016 | |
| Net (loss) income | $(1,068) | $67 | $(5,857) | $109 |
| Add/Subtract: | ||||
| Interest, net | 1,752 | 946 | 4,207 | 3,139 |
| Income taxes (benefit) provision | (1,290) | (68) | (2,763) | 550 |
| Depreciation | 419 | 341 | 1,183 | 1,119 |
| Amortization | 712 | 537 | 2,047 | 1,746 |
| EBITDA | 525 | 1,823 | (1,183) | 6,663 |
| Add/Subtract: | ||||
| Stock based compensation – options and warrant issuance | 327 | 166 | 812 | 292 |
| Change in the fair value of warrant derivative | (1,519) | (369) | (788) | (535) |
| Extinguishment loss on debt | 308 | - | 308 | - |
| Adjusted EBITDA | $(359) | $1,620 | $(851) | $6,420 |
For the years ended December 31, | Percentage | ||
| Segment Revenues | 2016 | 2015 | change |
| Direct selling | $145,418 | $138,927 | 4.7% |
| Commercial coffee | 17,249 | 17,670 | (2.4)% |
| Total | $162,667 | $156,597 | 3.9% |
For the years ended December 31, | Percentage | ||
| Segment Gross Profit (Loss) | 2016 | 2015 | change |
| Direct selling | $97,219 | $93,613 | 3.9% |
| Gross Profit % of Revenues | 66.9% | 67.4% | (0.5)% |
| Commercial coffee | 918 | (644) | 243.5% |
| Gross Profit % of Revenues | 5.3% | (3.6)% | 9.0% |
| Total | $98,137 | $92,969 | 5.6% |
| Gross Profit % of Revenues | 60.3% | 59.4% | 0.9% |
For the Nine Months Ended September 30, | Percentage change | |||||||||||
| Segment Revenues | 2015 | 2014 | ||||||||||
| Direct selling | $ | 103,206 | $ | 84,063 | 22.8 | % | ||||||
| Commercial coffee | 13,670 | 12,677 | 7.8 | % | ||||||||
| Total | $ | 116,876 | $ | 96,740 | 20.8 | % | ||||||
Gross Profit % For the Nine Months Ended September 30, | ||||||
| Segment Gross Profit | 2015 | 2014 | ||||
| Direct selling | 67.7 | % | 66.2 | % | ||
| Commercial coffee | (5.5 | )% | 0.6 | % | ||
| Consolidated | 59.1 | % | 57.6 | % | ||
For the years ended December 31, | Percentage change | |||||||||||
| Segment Revenues | 2014 | 2013 | ||||||||||
| Direct selling | $ | 116,365 | $ | 76,843 | 51.4 | % | ||||||
| Commercial coffee | 17,678 | 8,784 | 101.3 | % | ||||||||
| Total | $ | 134,043 | $ | 85,627 | 56.5 | % | ||||||
Gross Profit % For the years ended December 31, | ||||||||
| Segment Gross Profit | 2014 | 2013 | ||||||
| Direct selling | 65.8 | % | 65.7 | % | ||||
| Commercial coffee | (1.2) | % | 9.2 | % | ||||
| Consolidated | 56.9 | % | 59.9 | % | ||||
| Nine Months Ended | ||||||||
| September 30, | ||||||||
| 2015 | 2014 | |||||||
| Net (loss) | $ | (361 | ) | $ | 1,156 | |||
| Add | ||||||||
| Interest | 3,280 | 1,593 | ||||||
| Income taxes | (431 | ) | 416 | |||||
| Depreciation | 895 | 509 | ||||||
| Amortization | 1,578 | 1,439 | ||||||
| EBITDA | 4,961 | 5,113 | ||||||
| Add | ||||||||
| Stock based compensation | 436 | 387 | ||||||
| Change in the fair value of warrant derivative | 1,232 | 273 | ||||||
| Adjusted EBITDA | $ | 6,629 | $ | 5,773 | ||||
| Years ended | ||||||||
| December 31, | ||||||||
| 2014 | 2013 | |||||||
| Net Income | $ | 5,369,000 | $ | 2,651,000 | ||||
| Add | ||||||||
| Interest | 2,359,000 | 1,249,000 | ||||||
| Taxes | (4,371,000 | ) | 452,000 | |||||
| Depreciation | 753,000 | 464,000 | ||||||
| Amortization | 1,933,000 | 1,615,000 | ||||||
| EBITDA | 6,043,000 | 6,431,000 | ||||||
| Add | ||||||||
| Stock based compensation | 534,000 | 848,000 | ||||||
| Change in the fair value of warrant derivative | 15,000 | - | ||||||
| Adjusted EBITDA | $ | 6,592,000 | $ | 7,279,000 | ||||
Years Ended | ||
December 31, | ||
2016 | 2015 | |
| Net loss | $(398) | $(1,706) |
| Add | ||
| Interest, net | 4,474 | 4,491 |
| Income taxes | (190) | 1,384 |
| Depreciation | 1,518 | 1,242 |
| Amortization | 2,344 | 2,112 |
| EBITDA | 7,748 | 7,523 |
| Add | ||
| Stock based compensation | 395 | 455 |
| Change in the fair value of warrant derivative | (1,371) | 39 |
| Extinguishment loss on debt | - | 1,198 |
| Adjusted EBITDA | $6,772 | $9,215 |
Payments Due by Period | |||||||
Total | (3 months) 2017 | 2018 | 2019 | 2020 | 2021 | Thereafter | |
| Operating Leases | $4,109 | $314 | $1,066 | $742 | $628 | $587 | $772 |
| Capital Leases | 1,931 | 276 | 948 | 553 | 123 | 31 | - |
| Purchase Obligations | 2,740 | 2,740 | - | - | - | - | - |
| Convertible Notes Payable (*) | 15,004 | - | 3,000 | 4,750 | 7,254 | - | - |
| Notes Payable, Operating | 4,627 | 59 | 173 | 156 | 160 | 167 | 3,912 |
| Contingent Acquisition Debt | 11,827 | 119 | 408 | 547 | 820 | 480 | 9,453 |
| Total | $40,238 | $3,508 | $5,595 | $6,748 | $8,985 | $1,265 | $14,137 |
| Current | Long-Term | |||||||||||||||||||||||||||
| Contractual Obligations* | Total | (9 months) 2015-16 | (3 months) 2016 | 2017 | 2018 | 2019 | Thereafter | |||||||||||||||||||||
| Operating Leases | $ | 7,264 | $ | 1,068 | $ | 264 | $ | 856 | $ | 616 | $ | 571 | $ | 3,889 | ||||||||||||||
| Capital Leases | 149 | 43 | 7 | 27 | 27 | 27 | 18 | |||||||||||||||||||||
Notes Payable, “September 2014 Offering”(*) | 4,750 | - | - | - | - | 4,750 | - | |||||||||||||||||||||
| Notes Payable, January 2015 Offering | 250 | 250 | - | - | - | - | - | |||||||||||||||||||||
Notes Payable, “November Offering” (*) | 7,187 | - | - | - | 7,187 | - | - | |||||||||||||||||||||
| Notes Payable, Operating | 4,904 | 227 | 57 | 235 | 175 | 157 | 4,053 | |||||||||||||||||||||
| Contingent Acquisition Debt | 9,052 | 2,681 | 319 | 1,214 | 1,353 | 905 | 2,580 | |||||||||||||||||||||
| Total | $ | 33,556 | $ | 4,269 | $ | 647 | $ | 2,332 | $ | 9,358 | $ | 6,410 | $ | 10,540 | ||||||||||||||
| ● | Nutritional | ● | Gourmet coffee |
| ● | ● | Skincare and cosmetics | |
| ● | Health and | ● | |
| ● | Lifestyle products (spa, bath, | ● | |
| ● | Digital products including | ● | |
| ● | Apparel and fashion accessories | ● | Business lending |
| Business | Date of Acquisition | Products Categories | |||
BeautiControl, Inc. | December 13, 2017 | Cosmetic and Skin Care Products | |||
Future Global Vision, Inc. | November 6, 2017 | Nutritional Supplements and Automotive Fuel Additive Products | |||
Sorvana International, LLC (FreeLife International. Inc.) | July 1, 2017 | Nutritional Supplements and Skin Care Products | |||
| Ricolife, LLC | March 1, 2017 | Teas | |||
| Bellavita Group, LLC | March 1, 2017 | Health and Beauty Products | |||
| Legacy for Life, LLC | September 1, 2016 | Nutritional Supplements | |||
| Nature’s Pearl Corporation | September 1, 2016 | Nutritional Supplements and Skin Care Products | |||
| Renew Interest, LLC (SOZO Global, Inc.) | July 29, 2016 | Nutritional Supplements and Skin Care Products | |||
| South Hill Designs Inc. | January 20, 2016 | Jewelry | |||
| PAWS Group, LLC | July 1, 2015 | Pet treats | |||
| Mialisia & Co., LLC | June 1, 2015 | Jewelry | |||
| JD Premium LLC | March 4, 2015 | Dietary Supplement Company | |||
| Sta-Natural, LLC | February 23, 2015 | Vitamins Minerals and Supplements for families and their pets | |||
| Restart Your Life, LLC | October 1, 2014 | Dietary Supplements | |||
| Beyond Organics, LLC | May 1, 2014 | Organic Food and Beverages | |||
| Good Herbs, Inc. | April 28, 2014 | Herbal Supplements | |||
| Biometics International, Inc. | November 19, 2013 | Liquid Supplements | |||
| GoFoods Global, LLC | October 1, 2013 | Packaged Foods | |||
| Heritage Markers, LLC | August 14, 2013 | Digital Products | |||
| Livinity, Inc. | July 10, 2012 | Nutritional Products | |||
| GLIE, LLC (DBA True2Life) | March 20, 2012 | Nutritional Supplements |
Years Ended December 31, | ||||||||
| 2014 | 2013 | |||||||
| Product | ||||||||
| Beyond Tangy Tangerine(R) 2.0 | 17 | % | 7 | % | ||||
| Beyond Tangy Tangerine(R) | 11 | % | 17 | % | ||||
| Ultimate EFA Plus 90 Soft Gels | 7 | % | 5 | % | ||||
| Beyond Osteo FX Liquid | 6 | % | 7 | % | ||||
| Osteo FX Plus(TM) Powder | 6 | % | 2 | % | ||||
| ● | 100% Colombian Premium Blend; | ● | Italian Espresso; |
| ● | House Blend; | ● | Decaffeinated Coffee; |
| ● | Dark Roast; | ● | |
| ● | Donut Shop; | ● | Green |
| ● | Flavored Coffees; | ● | Organic Coffees; and |
| ● | Espresso; | ● | Select Water Decaffeinated. |
●www.youngevity.com | ● www.clrroasters.com |
●www.ygyi.com | ● www.cafelarica.com |
●www.youngofficial.com | ● www.javalution.com |
●www.heritagemakers.com | ● www.mialisia.com |
●www.mkcollab.com | |
● | |
| ● | liability for information retrieved from or transmitted over the Internet; |
| ● | online content regulation; |
| ● | commercial e-mail; |
| ● | visitor privacy; and |
| ● | taxation and quality of products and services. |
| ● | intellectual property ownership and infringement; |
| ● | consumer protection; |
| ● | obscenity; |
| ● | defamation; |
| ● | employment and labor; |
| ● | the protection of minors; |
| ● | health information; and |
| ● | personal privacy and the use of personally identifiable information. |
| Entity | Location | Approximate Square Footage of Facilities | Land in Acres | Own/Lease | Approximate Rent Expense $ | ||
| Youngevity | Chula Vista, CA | 59,000 | - | Own (1) | - | ||
| CLR | Miami, FL | 50,000 | - | Lease (2) | 414,000 | ||
| Siles Family Group | Matagalpa, Nicaragua | 200,000 | 500 | Own (3) | - | ||
| Heritage Makers | Orem, UT | 9,300 | - | Lease | 121,000 | ||
| Youngevity | Auckland, New Zealand | 3,570 | - | Lease (4) | 69,000 | ||
| Youngevity | Moscow, Russia | 1,550 | - | Lease | 125,000 | ||
| Youngevity | Singapore | 3,222 | - | Lease | 269,000 | ||
| Youngevity | Guadalajara, Mexico | 1,500 | - | Lease | 23,000 | ||
| Youngevity | Manila, Philippines | 4,473 | - | Lease | 6,000 | ||
| Legacy for Life | Lai Chi Kok Kin, Hong Kong | 1,296 | - | Lease | 17,000 | ||
| Legacy for Life | Taipei, Taiwan | 4,722 | - | Lease | 7,000 |
| Selling Stockholder | Shares Beneficially Owned Before the Sale of all Shares Covered by this Prospectus | Percentage of Beneficial Ownership Before the Sale of all Shares Covered by this Prospectus | Total Shares Offered By Selling Stockholder in the Offering Covered by this Prospectus | Shares Beneficially Owned After the Sale of all Shares Covered by this Prospectus(1) | Percentage of Beneficial Ownership After the Sale of all Shares Covered by this Prospectus | |||||||||||||||
Carl Grover | 43,001,690 | (2) | 9.9 | % | 29,333,333 | 37,394,842 | (2) | 8.8 | % | |||||||||||
Thomas G. Myers | 4,083,231 | (3) | 1.0 | % | 628,572 | 3,454,659 | * | |||||||||||||
Paul Sallwasser | 1,827,470 | (4) | 0.4 | % | 157,143 | 1,670,327 | * | |||||||||||||
TriPoint Global Equities, LLC | 2,127,387 | (5) | 0.5 | % | 783,095 | 1,344,292 | * | |||||||||||||
Brian Frank | 5,369,709 | (6) | 1.4 | % | 2,228,809 | 3,140,900 | * | |||||||||||||
| Name | Age | Director Since | Position | Age | Director Since | Position | |||||||
| Stephan Wallach | 48 | 2011* | Chairman and Chief Executive Officer | 51 | 2011* | Chairman and Chief Executive Officer | |||||||
| David Briskie | 54 | 2011 | President, Chief Financial Officer and Director | 57 | 2011 | President, Chief Financial Officer and Director | |||||||
| Michelle Wallach | 44 | 2011* | Chief Operating Officer and Director | 46 | 2011* | Chief Operating Officer and Director | |||||||
| Richard Renton | 59 | 2012 | Director | 62 | 2012 | Director | |||||||
| William Thompson | 54 | 2013 | Director | 57 | 2013 | Director | |||||||
| Paul Sallwasser | 63 | 2017 | Director | ||||||||||
| Kevin Allodi | 61 | 2017 | Director | ||||||||||
| Board Members | Audit Committee | Compensation Committee | Investment Committee | ||||||
| Stephan Wallach | - | Chairman | Member | ||||||
| David Briskie | - | Member | Chairman | ||||||
| Michelle Wallach | - | - | - | ||||||
| Richard Renton | - | - | - | ||||||
| William Thompson | Chairman | - | - | ||||||
| Paul Sallwasser | Member | - | - | ||||||
| Kevin Allodi | Member | - | - |
| Year | Salary ($) | Bonus ($) | Options Awarded(4) ($) | All Other Compensation(2)($) | Total ($) | Year | Salary ($) | Bonus ($) | Option Awards (2) ($) | Total ($) | ||||||||||||||||||||||||||||
Stephan Wallach (1) | 2015 | 271,519 | 89,000 | - | - | 360,519 | 2017 | 357,212 | - | - | 357,212 | |||||||||||||||||||||||||||
Chief Executive Officer | 2014 | 184,000 | 52,589 | - | - | 236,589 | 2016 | 282,500 | 179,730 | - | 462,230 | |||||||||||||||||||||||||||
William Andreoli (1) (2) (3) (4) | 2015 | 187,000 | - | - | 1,334,162 | 1,521,162 | ||||||||||||||||||||||||||||||||
Former President | 2014 | 170,000 | - | 882,500 | 920,790 | 1,973,290 | ||||||||||||||||||||||||||||||||
David Briskie (1) (4) | 2015 | 271,519 | 89,000 | - | - | 360,519 | ||||||||||||||||||||||||||||||||
| David Briskie (1)(2) | 2017 | 357,212 | - | 670,875 | 1,028,087 | |||||||||||||||||||||||||||||||||
President and Chief Financial Officer | 2014 | 216,308 | 52,589 | 282,400 | - | 551,297 | 2016 | 282,500 | 179,730 | 748,500 | 1,210,730 | |||||||||||||||||||||||||||
Michelle Wallach (1) | 2015 | 200,070 | 57,500 | - | - | 257,570 | 2017 | 192,660 | - | - | 192,660 | |||||||||||||||||||||||||||
Chief Operating Officer | 2014 | 168,720 | 52,589 | - | - | 221,309 | 2016 | 192,660 | 179,730 | - | 372,390 | |||||||||||||||||||||||||||
| (1) | Mr. Stephan Wallach, Mr. David Briskie, and Ms. Michelle Wallach have direct and or indirect (beneficially) distributor positions in our |
| (2) | |
We use a Black-Scholes option-pricing model (Black-Scholes model) to estimate the fair value of the stock option grant. Expected volatility is calculated based on the historical volatility of the Company’s stock. The risk-free interest rate is based on the U.S. Treasury yield for a term equal to the expected life of the options at the time of grant. The amounts do not represent the actual amounts paid to or released by any of the Named Executive Officers during the respective periods. |
| Option Awards | Stock Awards | |||||||||||||||||||||||
No. Of Securities Underlying Unexercised Options (#) Exercisable | No. Of Securities Underlying Unexercised Options (#) Unexercisable | Option Exercise Price ($) | Option Expiration Date | No. Of Shares or Units of Stock That Have Not Vested (#) | Market Value Of Shares or Units of Stock That Have Not Vested ($) | |||||||||||||||||||
| Stephan Wallach | 125,000 | (1) | - | $ | 4.40 | 5/31/2022 | ||||||||||||||||||
| David Briskie | 250,000 | (2) | - | $ | 4.40 | 5/31/2022 | ||||||||||||||||||
| 40,000 | (3) | 10,000 | $ | 3.60 | 10/31/2023 | |||||||||||||||||||
| 60,000 | (4) | 40,000 | $ | 3.80 | 10/30/2024 | |||||||||||||||||||
| 50,000 | (5) | 200,000 | $ | 5.40 | 12/27/2026 | 250,000 | (6) | $ | 1,032,500 | |||||||||||||||
| Michelle Wallach | 125,000 | (7) | - | $ | 4.40 | 5/31/2022 | ||||||||||||||||||
| (1) | 125,000 stock options granted on May 31, 2012, vested and exercisable. |
| (2) | 250,000 stock options granted on May 31, 2012, vested and exercisable. |
| (3) | 50,000 stock options granted on October 31, 2013, 40,000 stock options vested and are exercisable, with the remaining option shares vesting on October 31, 2018. |
| (4) | 100,000 stock options granted on October 30, 2014, 60,000 stock options vested and are exercisable, with the remaining option shares vesting in equal annual amounts over the next two years as of December 31, 2017. |
| (5) | 250,000 stock options granted on December 27, 2016, 50,000 stock options vested and are exercisable, with the remaining option shares vesting in equal annual amounts over the next four years as of December 31, 2017 . |
| (6) | 250,000 restricted stock units were granted on August 9, 2017, each unit representing contingent right to receive one share of Common Stock, vesting as follows: (i) Year 3 - 25,000 shares; (ii) Year 4 – 37,500 shares; (iii) Year 5 - 125,000 shares; and (iv) Year 6 – 62,500 shares; if Mr. Briskie continues to serve as an executive officer or otherwise is not terminated for cause prior to such dates. The market value of the restricted stock units was multiplied by the closing market price of our common stock at the end of the 2017 fiscal year, which was $4.13 on December 29, 2017 (the last business day of the 2017 fiscal year.) |
| (7) | 125,000 stock options granted on May 31, 2012, vested and exercisable. |
| Name | Grant Date | Number of Securities Underlying Unexercised Options Exercisable | Number of Securities Underlying Unexercised Options Unexercisable | Option Exercise Price ($) | Option Expiration Date | |||||||
Stephan Wallach | 5/31/2012 | 2,500,000 | - | $ | 0.22 | 5/31/2022 | ||||||
William Andreoli | 5/31/2012 | 400,000 | - | $ | 0.22 | 2/28/2016 | ||||||
10/31/2013 | 100,000 | - | $ | 0.18 | 2/28/2016 | |||||||
7/23/2014 | 750,000 | - | $ | 0.23 | 2/28/2016 | |||||||
David Briskie | 5/31/2012 | 5,000,000 | - | $ | 0.22 | 5/31/2022 | ||||||
10/31/2013 | 400,000 | 600,000 | $ | 0.18 | 10/31/2023 | |||||||
10/30/2014 | 400,000 | 1,600,000 | $ | 0.19 | 10/30/2024 | |||||||
Michelle Wallach | 5/31/2012 | 2,500,000 | - | $ | 0.22 | 5/31/2022 | ||||||
| Name | Fees Earned or Paid in Cash ($) | Option Awards ($)(1) | Other Compensation ($) | Total ($) | Fees Earned or Paid in Cash ($) | Option Awards ($)(1) | Other Compensation ($) | Total ($) | ||||||||||||
| Richard Renton | - | 2,738 | - | 2,738 | - | 20,437 | - | 20,437 | ||||||||||||
| William Thompson | - | 2,742 | - | 2,742 | - | 20,437 | - | 20,437 | ||||||||||||
| Paul Sallwasser | - | 14,708 | - | 14,708 | ||||||||||||||||
| Kevin Allodi | - | 14,708 | - | 14,708 | ||||||||||||||||
| (1) | The amounts in the “Option Awards” column reflect the dollar amounts recognized as compensation expense for the financial statement reporting purposes for stock options for the fiscal year ended December 31, |
Name | Aggregate Number of Option Awards | |||
| Richard Renton | 15,000 | |||
| William Thompson | 17,500 | |||
| Paul Sallwasser | 5,000 | |||
| Kevin Allodi | 5,000 | |||
| Plan category | Number of securities issued under equity compensation plan | Weighted-average exercise price of outstanding options | Number of securities remaining available for future issuance under equity compensation plans | Number of securities issued under equity compensation plan | Weighted-average exercise price of outstanding options | Number of securities remaining available for future issuance under equity compensation plans | ||||||
| Equity compensation plans approved by security holders | - | $ | - | - | - | $ - | - | |||||
| Equity compensation plans not approved by security holders | 23,521,600 | $ | 0.22 | 16,111,725 | 2,084,923 | 4.70 | 1,885,389 | |||||
| Total | 2,084,923 | $ 4.70 | 1,885,389 | |||||||||
| Name of Beneficial Owner | Number of Shares Beneficially Owned | Percentage Ownership | ||||||
Executive Officers & Directors (1) | ||||||||
Stephan Wallach, Chairman and Chief Executive Officer | 282,556,250 | (2) | 72.0 | % | ||||
William Andreoli, Former President | 2,057,500 | (3) | * | |||||
David Briskie, President, Chief Financial Officer and Director | 16,209,155 | (4) | 4.1 | % | ||||
Michelle Wallach, Chief Operating Officer and Director | 282,500,000 | (2) | 72.0 | % | ||||
Richard Renton, Director | 205,000 | (5) | * | |||||
William Thompson, Director | 80,000 | (6) | * | |||||
| All Executive Officers & Directors, as a group (6 persons) | 303,607,905 | 77.3 | % | |||||
| Stockholders owning 5% or more | ||||||||
| Carl Grover | 43,001,690 | (7) | 9.9 | % | ||||
| Name of Beneficial Owner | Number of Shares Beneficially Owned | Percentage Ownership | |
Executive Officers & Directors (1) | |||
Stephan Wallach, Chairman and Chief Executive Officer | 14,127,811 | (2) | 71.2% |
David Briskie, President, Chief Financial Officer and Director | 920,457 | (3) | 4.6% |
Michelle Wallach, Chief Operating Officer and Director | 14,125,000 | (2) | 71.2% |
Richard Renton, Director | 25,603 | (4) | * |
William Thompson, Director | 12,000 | (5) | * |
Paul Sallwasser, Director | 108,934 | (6) | * |
Kevin Allodi, Director | 31,490 | (7) | * |
| All Executive Officers & Directors, as a group (7 persons) | 15,351,295 | 75.1% | |
| Stockholders owning 5% or more | |||
| Carl Grover | 2,353,959 | (8) | 9.99% |
| we decide not to proceed with the Offering or withdraw any |
| Per Share | Total |
Public offering price | $ 9.50 | $ 10,000,000 |
Selling Agent fees | $ 0.38 | $ 400,000 |
Proceeds to us (before expenses) | $ 9.12 | $9,600,000 |
| ● | offer, pledge, sell, contract to sell, sell any option or contract to purchase, purchase any option or contract to sell, grant any option, right or warrant for the sale of, or otherwise dispose of or transfer any shares of the Common Stock or any securities convertible into or exchangeable or exercisable for the Common Stock, whether now owned or hereafter acquired by the undersigned or with respect to which the undersigned has or hereafter acquires the power of disposition; or | |
| ● | enter into any swap or any other agreement or any transaction that transfers, in whole or in part, the economic consequence of ownership of the Common Stock, whether any such swap or transaction is to be settled by delivery of the Common Stock or other securities, in cash or otherwise. |
| Options Outstanding |
| ● | provide the board of directors with the ability to alter the bylaws without stockholder approval; and |
| ● | provide that vacancies on the board of directors may be filled by a majority of directors in the office, although less than a quorum. |
| Page | |
September 30, 2016 (As restated) | |
as of September 30, 2017 and 2016 | F-5 |
| F-26 | |
| F-27 | |
| F-28 | |
| F-29 | |
| F-30 | |
| F-31 | |
| F-32 |
Youngevity International, Inc. and Subsidiaries | ||
Condensed Consolidated Balance Sheets | ||
(In thousands, except share amounts) | ||
As of | ||
September 30, 2017 | December 31, 2016 | |
| ASSETS | (Unaudited) | |
| Current Assets | ||
| Cash and cash equivalents | $1,373 | $869 |
| Accounts receivable, due from factoring company | 3,088 | 1,078 |
| Trade accounts receivable, net | 513 | 1,071 |
| Income tax receivable | 311 | 311 |
| Inventory | 21,052 | 21,492 |
| Prepaid expenses and other current assets | 3,327 | 3,087 |
| Total current assets | 29,664 | 27,908 |
| Property and equipment, net | 13,908 | 14,006 |
| Deferred tax assets | 5,703 | 2,857 |
| Intangible assets, net | 18,399 | 14,914 |
| Goodwill | 6,323 | 6,323 |
| Total assets | $73,997 | $66,008 |
| LIABILITIES AND STOCKHOLDERS' EQUITY | ||
| Current Liabilities | ||
| Accounts payable | $10,317 | $8,174 |
| Accrued distributor compensation | 4,678 | 4,163 |
| Accrued expenses | 5,452 | 3,701 |
| Deferred revenues | 1,999 | 1,870 |
| Other current liabilities | 3,652 | 2,389 |
| Capital lease payable, current portion | 997 | 821 |
| Notes payable, current portion | 175 | 219 |
| Warrant derivative liability | 4,128 | 3,345 |
| Contingent acquisition debt, current portion | 422 | 628 |
| Total current liabilities | 31,820 | 25,310 |
| Capital lease payable, net of current portion | 934 | 1,569 |
| Notes payable, net of current portion | 4,452 | 4,431 |
| Convertible notes payable (See Note 6) | 10,766 | 8,327 |
| Contingent acquisition debt, net of current portion | 11,405 | 7,373 |
| Total liabilities | 59,377 | 47,010 |
| Commitments and contingencies, Note 1 | ||
| Stockholders’ Equity | ||
| Convertible Preferred Stock, $0.001 par value: 5,000,000 shares authorized; 161,135 shares issued and outstanding at September 30, 2017 and December 31, 2016 | - | - |
Common Stock, $0.001 par value: 50,000,000 shares authorized; 19,723,285 and 19,634,345 shares issued and outstanding at September 30, 2017 and December 31, 2016, respectively (1) | 20 | 20 |
| Additional paid-in capital | 171,693 | 170,212 |
| Accumulated deficit | (156,873) | (151,016) |
| Accumulated other comprehensive loss | (220) | (218) |
| Total stockholders’ equity | 14,620 | 18,998 |
| Total Liabilities and Stockholders’ Equity | $73,997 | $66,008 |
| Youngevity International, Inc. and Subsidiaries | ||||||||
| Consolidated Balance Sheets | ||||||||
| (In thousands, except share amounts) | ||||||||
| As of December 31, | ||||||||
| 2014 | 2013 | |||||||
| ASSETS | ||||||||
| Current Assets: | ||||||||
Cash and cash equivalents | $ | 2,997 | $ | 4,320 | ||||
Accounts receivable, due from factoring company | 1,612 | 1,051 | ||||||
Accounts receivable, trade | 180 | 76 | ||||||
Income taxes receivable | 308 | - | ||||||
Inventory | 11,783 | 5,973 | ||||||
Deferred tax assets, net current | 801 | - | ||||||
Prepaid expenses and other current assets | 3,753 | 1,209 | ||||||
Total current assets | 21,434 | 12,629 | ||||||
Property and equipment, net | 10,319 | 4,669 | ||||||
Deferred tax assets, long-term | 3,140 | - | ||||||
Intangible assets, net | 14,516 | 11,532 | ||||||
Goodwill | 6,323 | 6,023 | ||||||
$ | 55,732 | $ | 34,853 | |||||
LIABILITIES AND STOCKHOLDERS' EQUITY | ||||||||
Current Liabilities: | ||||||||
Accounts payable | $ | 5,407 | $ | 2,764 | ||||
Accrued distributor compensation | 4,177 | 2,711 | ||||||
Accrued expenses | 2,332 | 1,238 | ||||||
Deferred revenues | 5,075 | 3,308 | ||||||
Other current liabilities | 477 | 148 | ||||||
Capital lease payable, current portion | 24 | 95 | ||||||
Notes payable, current portion | 228 | 245 | ||||||
Warrant derivative liability | 3,712 | - | ||||||
Contingent acquisition debt, current portion | 2,765 | 1,072 | ||||||
Total current liabilities | 24,197 | 11,581 | ||||||
Capital lease payable, net of current portion | 4 | 27 | ||||||
Deferred tax liability | - | 723 | ||||||
Notes payable, net of current portion | 4,839 | 5,015 | ||||||
Convertible notes payable, net of debt discount | 396 | - | ||||||
Contingent acquisition debt, net of current portion | 7,707 | 6,008 | ||||||
Total liabilities | 37,143 | 23,354 | ||||||
Commitments and contingencies (see Note 9) | ||||||||
Equity: | ||||||||
Youngevity International, Inc. stockholders' equity: | ||||||||
Convertible Preferred Stock, $0.001 par value: 100,000,000 shares authorized; 161,135 and 211,135 shares issued and outstanding at December 31, 2014 and December 31, 2013, respectively | - | - | ||||||
Common Stock, $0.001 par value: 600,000,000 shares authorized; 390,301,312 and 388,686,445 shares issued and outstanding at December 31, 2014 and December 31, 2013, respectively | 390 | 389 | ||||||
Additional paid-in capital | 167,386 | 165,759 | ||||||
Accumulated deficit | (148,912 | ) | (154,281 | ) | ||||
Accumulated other comprehensive loss | (275 | ) | (165 | ) | ||||
Total Youngevity International, Inc. stockholders' equity | 18,589 | 11,702 | ||||||
Noncontrolling interest | - | (203 | ) | |||||
Total equity | 18,589 | 11,499 | ||||||
$ | 55,732 | $ | 34,853 | |||||
| Years Ended December 31, | Three Months Ended September 30, | Nine Months Ended September 30, | ||||||||||
| 2014 | 2013 | 2017 | 2016 | 2017 | 2016 | |||||||
Revenues | $ | 134,043 | $ | 85,627 | $44,395 | $43,562 | $124,655 | $124,264 | ||||
Cost of revenues | 57,718 | 34,326 | 18,631 | 17,194 | 52,923 | 49,102 | ||||||
Gross profit | 76,325 | 51,301 | 25,764 | 26,368 | 71,732 | 75,162 | ||||||
Operating expenses | ||||||||||||
Distributor compensation | 52,646 | 32,985 | 17,391 | 18,101 | 49,496 | 50,871 | ||||||
Sales and marketing | 7,363 | 4,512 | 4,074 | 3,181 | 10,650 | 7,619 | ||||||
General and administrative | 12,947 | 9,452 | 6,116 | 4,510 | 16,479 | 13,409 | ||||||
Total operating expenses | 72,956 | 46,949 | 27,581 | 25,792 | 76,625 | 71,899 | ||||||
Operating income | 3,369 | 4,352 | ||||||||||
Other income | 3 | - | ||||||||||
| Operating (loss) income | (1,817) | 576 | (4,893) | 3,263 | ||||||||
Interest expense, net | (2,359 | ) | (1,249 | ) | (1,752) | (946) | (4,207) | (3,139) | ||||
Change in fair value of warrant derivative liability | (15 | ) | - | 1,519 | 369 | 788 | 535 | |||||
| Extinguishment loss on debt | (308) | - | (308) | - | ||||||||
Total other expense | (2,371 | ) | (1,249 | ) | (541) | (577) | (3,727) | (2,604) | ||||
Income before income taxes | 998 | 3,103 | ||||||||||
| (Loss) income before income taxes | (2,358) | (1) | (8,620) | 659 | ||||||||
Income tax (benefit) provision | (4,371 | ) | 452 | (1,290) | (68) | (2,763) | 550 | |||||
Net income | 5,369 | 2,651 | ||||||||||
Net loss attributable to noncontrolling interest | - | (119 | ) | |||||||||
Net income attributable to Youngevity | 5,369 | 2,770 | ||||||||||
| Net (loss) income | (1,068) | 67 | (5,857) | 109 | ||||||||
Preferred stock dividends | (15 | ) | (16 | ) | (3) | (9) | ||||||
Net income available to common stockholders | $ | 5,354 | $ | 2,754 | ||||||||
| Net (loss) income available to common stockholders | $(1,071) | $64 | $(5,866) | $100 | ||||||||
Net income per share, basic | $ | 0.01 | $ | 0.01 | ||||||||
Net income per share, diluted | $ | 0.01 | $ | 0.01 | ||||||||
Net loss per share, basic (1) | $(0.05) | $0.00 | $(0.30) | $0.00 | ||||||||
Net loss per share, diluted (1) | $(0.05) | $0.00 | $(0.30) | $0.00 | ||||||||
Weighted average shares outstanding, basic | 389,427,336 | 389,120,351 | ||||||||||
Weighted average shares outstanding, diluted | 389,795,108 | 391,953,473 | ||||||||||
Weighted average shares outstanding, basic (1) | 19,678,577 | 19,633,731 | 19,655,312 | 19,631,195 | ||||||||
Weighted average shares outstanding, diluted (1) | 19,678,577 | 20,026,001 | 19,655,312 | 20,005,758 | ||||||||
| Years Ended December 31, | Three Months Ended September 30, | Nine Months Ended September 30, | ||||||||||
| 2014 | 2013 | 2017 | 2016 | 2017 | 2016 | |||||||
Net income: | $ | 5,369 | $ | 2,651 | ||||||||
| Net (loss) income | $(1,068) | $67 | $(5,857) | $109 | ||||||||
Foreign currency translation | (110 | ) | (42 | ) | (16) | (28) | (2) | (174) | ||||
Total other comprehensive loss | (110 | ) | (42 | ) | (16) | (28) | (2) | (174) | ||||
Comprehensive income | $ | 5,259 | $ | 2,609 | ||||||||
| Comprehensive (loss) income | $(1,084) | $39 | $(5,859) | $(65) | ||||||||
| Note Receivable for Stock Purchase | Additional Paid-in Capital | Accumulated Other Compre- hensive Loss | Accum- ulated Deficit | Total Stock-holders' Equity | Non-controlling Interest | ||||||||||||||||||||||||||||
| Total Equity | |||||||||||||||||||||||||||||||||
| Preferred Stock | Common Stock | ||||||||||||||||||||||||||||||||
| Shares | Amount | Shares | Amount | ||||||||||||||||||||||||||||||
| Beginning Balance at December 31, 2012 | 211,135 | $ | - | 389,599,848 | $ | 389 | $ | (62 | ) | $ | 165,017 | $ | (123 | ) | $ | (155,266 | ) | $ | 9,955 | $ | (76 | ) | $ | 9,879 | |||||||||
| Net income | - | - | - | - | - | - | - | 2,770 | 2,770 | (119 | ) | 2,651 | |||||||||||||||||||||
Foreign currency translation adjustment | - | - | - | - | - | - | (42 | ) | - | (42 | ) | - | (42 | ) | |||||||||||||||||||
Noncontrolling interest in currency conversion | - | - | - | - | - | - | - | - | - | (8 | ) | (8 | ) | ||||||||||||||||||||
| Payment of note receivable on common stock | - | - | - | - | 62 | - | - | - | 62 | - | 62 | ||||||||||||||||||||||
| Issuance of common stock pursuant to the exercise of stock options | - | - | 28,000 | - | - | 6 | - | - | 6 | - | 6 | ||||||||||||||||||||||
| Repurchase of common stock | - | - | (941,403 | ) | - | - | (224 | ) | - | - | (224 | ) | - | (224 | ) | ||||||||||||||||||
| Dividends on preferred stock | - | - | - | - | - | (16 | ) | - | - | (16 | ) | - | (16 | ) | |||||||||||||||||||
| Stock based compensation expense | - | - | - | - | - | 848 | - | - | 848 | - | 848 | ||||||||||||||||||||||
| Warrant modification expense | - | - | - | - | - | 128 | - | - | 128 | - | 128 | ||||||||||||||||||||||
| Deemed dividend (Boswell acquisition) | - | - | - | - | - | - | - | (1,785 | ) | (1,785 | ) | - | (1,785 | ) | |||||||||||||||||||
| Balance at December 31, 2013 | 211,135 | $ | - | 388,686,445 | $ | 389 | $ | - | $ | 165,759 | $ | (165 | ) | $ | (154,281 | ) | $ | 11,702 | $ | (203 | ) | $ | 11,499 | ||||||||||
| Net income | - | - | - | - | - | - | - | 5,369 | 5,369 | 5,369 | |||||||||||||||||||||||
| Deconsolidation of non-controlling interest | - | - | - | - | - | - | - | - | - | 203 | 203 | ||||||||||||||||||||||
Foreign currency translation adjustment | - | - | - | - | - | - | (110 | ) | - | (110 | ) | - | (110 | ) | |||||||||||||||||||
Beneficial conversion feature of convertible notes payable | - | - | - | - | - | 1,053 | - | - | 1,053 | - | 1,053 | ||||||||||||||||||||||
| Issuance of common stock pursuant to the exercise of warrants | - | - | 2,750,000 | 1 | - | 369 | - | - | 370 | - | 370 | ||||||||||||||||||||||
| Issuance of common stock pursuant to the exercise of stock options | - | - | 10,250 | - | - | 5 | - | - | 5 | - | 5 | ||||||||||||||||||||||
| Issuance of common stock pursuant to the conversion of preferred stock and accrued dividends | (50,000 | ) | - | 300,164 | - | - | 25 | - | - | 25 | - | 25 | |||||||||||||||||||||
| Repurchase of common stock | - | - | (1,445,547 | ) | - | - | (344 | ) | - | - | (344 | ) | - | (344 | ) | ||||||||||||||||||
| Dividends on preferred stock | - | - | - | - | - | (15 | ) | - | - | (15 | ) | - | (15 | ) | |||||||||||||||||||
| Stock based compensation expense | - | - | - | - | - | 534 | - | - | 534 | - | 534 | ||||||||||||||||||||||
| Balance at December 31, 2014 | 161,135 | $ | - | 390,301,312 | $ | 390 | $ | - | $ | 167,386 | $ | (275 | ) | $ | (148,912 | ) | $ | 18,589 | $ | - | $ | 18,589 | |||||||||||
Nine Months Ended September 30, | ||
2017 | 2016 | |
| Cash Flows from Operating Activities: | (As Restated) | |
| Net (loss) income | $(5,857) | $109 |
| Adjustments to reconcile net (loss) income to net cash used in operating activities: | ||
| Depreciation and amortization | 3,230 | 2,865 |
| Stock based compensation expense | 471 | 292 |
| Amortization of deferred financing costs | 281 | 270 |
| Amortization of warrant issuance costs | 172 | 96 |
| Amortization of debt discount | 799 | 790 |
| Amortization of prepaid advisory fees | 42 | 46 |
| Stock issuance for services | 200 | 30 |
| Stock issuance related to debt financing | 106 | - |
Fair value of warrant issuance | 341 | - |
| Change in fair value of warrant derivative liability | (788) | (535) |
| Expenses allocated in profit sharing agreement | (195) | (557) |
| Change in fair value of contingent acquisition debt | (1,020) | (1,185) |
| Extinguishment loss on debt | 308 | - |
| Deferred income taxes | (2,846) | - |
| Changes in operating assets and liabilities, net of effect from business combinations: | ||
| Accounts receivable | (1,452) | (1,411) |
| Inventory | 440 | (1,925) |
| Income taxes receivable | - | 173 |
| Prepaid expenses and other current assets | (282) | (502) |
| Accounts payable | 2,143 | 293 |
| Accrued distributor compensation | 515 | 401 |
| Deferred revenues | 129 | (652) |
| Accrued expenses and other liabilities | 1,480 | 705 |
| Net Cash Used In Operating Activities | (1,783) | (697) |
| Cash Flows from Investing Activities: | ||
| Acquisitions, net | (175) | (88) |
| Purchases of property and equipment | (690) | (938) |
| Net Cash Used in Investing Activities | (865) | (1,026) |
| Cash Flows from Financing Activities: | ||
| Proceeds from the exercise of stock options and warrants, net | 28 | 39 |
| Proceeds from factoring company | 1,723 | 1,131 |
| Proceeds from issuance of convertible notes, net of offering cost | 2,720 | - |
| Payments of notes payable, net | (159) | (411) |
| Payments of contingent acquisition debt | (440) | (708) |
| Proceeds (payments) of capital leases | (718) | 19 |
| Repurchase of common stock | - | (36) |
| Net Cash Provided by Financing Activities | 3,154 | 34 |
| Foreign Currency Effect on Cash | (2) | (174) |
| Net increase (decrease) in cash and cash equivalents | 504 | (1,863) |
| Cash and Cash Equivalents, Beginning of Period | 869 | 3,875 |
| Cash and Cash Equivalents, End of Period | $1,373 | $2,012 |
| Supplemental Disclosures of Cash Flow Information | ||
| Cash paid during the period for: | ||
| Interest | $2,773 | $1,987 |
| Income taxes | $31 | $192 |
| Supplemental Disclosures of Noncash Investing and Financing Activities | ||
Purchases of property and equipment funded by capital leases | $398 | $1,416 |
| Acquisitions of net assets in exchange for contingent acquisition debt (see Note 4) | $5,920 | $4,876 |
| Fair value of the bifurcated embedded conversion option recorded as a derivative liability (see Notes 6 & 7) | $330 | $- |
Fair value of the warrants issued in connection with financing recorded as a derivative liability (see Notes 6 & 7) | $2,334 | $- |
| Years Ended December 31, | ||||||||
| 2014 | 2013 | |||||||
| Cash Flows from Operating Activities: | ||||||||
Net Income | $ | 5,369 | $ | 2,651 | ||||
Adjustments to reconcile net income to net cash provided by operating activities: | ||||||||
Depreciation and amortization | 2,686 | 2,079 | ||||||
Stock based compensation expense | 534 | 848 | ||||||
Warrant modification expense | - | 128 | ||||||
Amortization of deferred financing costs | 41 | - | ||||||
Change in fair value of warrant derivative liability | 15 | - | ||||||
Amortization of debt discount | 428 | 48 | ||||||
Change in fair value of contingent acquisition debt | 179 | 52 | ||||||
Expenses allocated to profit sharing agreement | (211 | ) | - | |||||
Gain on disposal of assets | (1 | ) | - | |||||
Interest income accrued on note receivable, related party | - | (3 | ) | |||||
| Deconsolidation of non-controlling interest | 203 | - | ||||||
| Deferred income taxes | (4,664 | ) | (19 | ) | ||||
Changes in operating assets and liabilities, net of effect from business combinations: | ||||||||
Accounts receivable | (665 | ) | (56 | ) | ||||
Inventory | (5,810 | ) | (1,055 | ) | ||||
Prepaid expenses and other current assets | (2,095 | ) | (650 | ) | ||||
Accounts payable | 2,643 | 306 | ||||||
Accrued distributor compensation | 1,466 | (354 | ) | |||||
Deferred revenues | 1,767 | 881 | ||||||
Accrued expenses and other liabilities | 325 | (785 | ) | |||||
Income taxes receivable | (308 | ) | - | |||||
Net Cash Provided by Operating Activities | 1,902 | 4,071 | ||||||
Cash Flows from Investing Activities: | ||||||||
Acquisitions, net of cash acquired | (2,100 | ) | 54 | |||||
Purchases of property and equipment | (3,037 | ) | (1,199 | ) | ||||
Net Cash Used in Investing Activities | (5,137 | ) | (1,145 | ) | ||||
Cash Flows from Financing Activities: | ||||||||
Proceeds from issuance of convertible notes payable, net | 4,260 | - | ||||||
Proceeds from the exercise of stock options and warrants, net | 375 | 6 | ||||||
Proceeds (payments) from factoring company, net | 538 | (215 | ) | |||||
Payments of notes payable, net | (225 | ) | (363 | ) | ||||
Proceeds for note receivable, related party, net | - | 62 | ||||||
Payments of contingent acquisition debt | (2,488 | ) | (805 | ) | ||||
Payments of capital leases | (94 | ) | (50 | ) | ||||
Repurchase of common stock | (344 | ) | (224 | ) | ||||
Net Cash Provided by (Used) in Financing Activities | 2,022 | (1,589 | ) | |||||
Foreign Currency Effect on Cash | (110 | ) | (42 | ) | ||||
Net (decrease) increase in cash and cash equivalents | (1,323 | ) | 1,295 | |||||
Cash and Cash Equivalents, Beginning of Year | 4,320 | 3,025 | ||||||
Cash and Cash Equivalents, End of Year | $ | 2,997 | $ | 4,320 | ||||
Supplemental Disclosures of Cash Flow Information | ||||||||
Cash paid during the year for: | ||||||||
Interest | $ | 2,387 | $ | 1,252 | ||||
Income taxes | $ | 698 | $ | 486 | ||||
Supplemental Disclosures of Non-cash Investing and Financing Activities | ||||||||
Acquisition of net assets in exchange for contingent acquisition debt (see Note 2 for non-cash activity) | $ | 5,912 | $ | 2,149 | ||||
| Common stock issued for the conversion of preferred stock and accrued dividends | $ | 25 | $ | - | ||||
| During 2014, the Company issued certain convertible notes payable that included warrants. The related beneficial conversion feature, valued at approximately $1,053,000 was classified as an equity instrument and recorded as a discount to the carrying value of the related debt. The warrants, valued at approximately $3,697,000, were recognized as a derivative liability. | ||||||||
| During 2013, the Company acquired 2400 Boswell, LLC (see Note 4 for non-cash activity). | ||||||||
| See accompanying notes. | ||||||||
| December 31, | ||||||||
| 2014 | 2013 | |||||||
Finished goods | $ | 7,817 | $ | 4,642 | ||||
Raw materials | 4,444 | 1,667 | ||||||
12,261 | 6,309 | |||||||
Reserve for excess and obsolete | (478 | ) | (336 | ) | ||||
Inventory, net | $ | 11,783 | $ | 5,973 | ||||
| 2014 | 2013 | |||||
Balance as of January 1, | $ | (336) | $ | (366) | ||
Addition to provision | (245) | (105) | ||||
Write-off of obsolete inventory | 103 | 135 | ||||
Balance as of December 31, | $ | (478) | $ | (336) | ||
| December 31, | ||||||||
| 2014 | 2013 | |||||||
Building | $ | 2,948 | $ | 1,959 | ||||
Leasehold improvements | 1,701 | 855 | ||||||
Land | 2,544 | 855 | ||||||
Land improvements | 255 | - | ||||||
Producing coffee trees | 553 | - | ||||||
Manufacturing equipment | 3,272 | 1,803 | ||||||
Furniture and other equipment | 1,080 | 876 | ||||||
Computer software | 901 | 678 | ||||||
Computer equipment | 378 | 273 | ||||||
Vehicles | 103 | 33 | ||||||
| 13,735 | 7,332 | |||||||
Accumulated depreciation | (3,416 | ) | (2,663 | ) | ||||
Total property and equipment | $ | 10,319 | $ | 4,669 | ||||
As of | ||
September 30, 2017 | December 31, 2016 | |
| Finished goods | $10,935 | $11,550 |
| Raw materials | 11,181 | 11,006 |
22,116 | 22,556 | |
| Reserve for excess and obsolete | (1,064) | (1,064) |
| Inventory, net | $21,052 | $21,492 |
| Distributor organization | $1,187 |
| Customer-related intangible | 1,300 |
| Trademarks and trade name | 1,000 |
| Total purchase price | $3,487 |
| Distributor organization | $810 |
| Customer-related intangible | 525 |
| Trademarks and trade name | 400 |
| Total purchase price | $1,735 |
| Distributor organization | $218 |
| Customer-related intangible | 280 |
| Trademarks and trade name | 200 |
| Total purchase price | $698 |
| Cash paid for the equity in Legacy for Life Taiwan and Legacy for Life Limited (Hong Kong) | $26 |
| Cash paid for inventory | 195 |
| Total cash consideration | 221 |
| Trademarks and trade name | 185 |
| Customer-related intangible | 250 |
| Distributor organization | 298 |
| Total intangible assets acquired, non-cash | 733 |
| Total purchase price | $954 |
| Distributor organization | $559 |
| Customer-related intangible | 400 |
| Trademarks and trade name | 250 |
| Total purchase price | $1,209 |
| Distributor organization | $170 |
| Customer-related intangible | 155 |
| Trademarks and trade name | 110 |
| Total purchase price | $435 |
| December 31, 2014 | December 31, 2013 | |||||||||||||||||||||||
| Cost | Accumulated Amortization | Net | Cost | Accumulated Amortization | Net | |||||||||||||||||||
Distributor organizations | $ | 10,475 | $ | 5,126 | $ | 5,349 | $ | 8,425 | $ | 4,169 | $ | 4,256 | ||||||||||||
Trademarks and trade names | 4,441 | 304 | 4,137 | 3,841 | 113 | 3,728 | ||||||||||||||||||
Customer relationships | 6,400 | 1,932 | 4,468 | 4,133 | 1,248 | 2,885 | ||||||||||||||||||
Internally developed software | 720 | 158 | 562 | 720 | 57 | 663 | ||||||||||||||||||
Intangible assets | $ | 22,036 | $ | 7,520 | $ | 14,516 | $ | 17,119 | $ | 5,587 | $ | 11,532 | ||||||||||||
As of | ||
September 30, 2017 | December 31, 2016 | |
| Finished goods | $10,935 | $11,550 |
| Raw materials | 11,181 | 11,006 |
22,116 | 22,556 | |
| Reserve for excess and obsolete | (1,064) | (1,064) |
| Inventory, net | $21,052 | $21,492 |
| Years ending December 31, | ||||
2015 | $ | 2,020 | ||
2016 | 2,020 | |||
2017 | 1,978 | |||
2018 | 1,621 | |||
2019 | 1,019 | |||
| Direct selling | Commercial coffee | Total | ||||||||
Balance at December 31, 2012 | $ | 1,840 | $ | 3,314 | $ | 5,154 | ||||
Goodwill recognized | 869 | - | 869 | |||||||
Goodwill impaired | - | - | - | |||||||
Balance at December 31, 2013 | $ | 2,709 | $ | 3,314 | $ | 6,023 | ||||
Goodwill recognized | 300 | - | 300 | |||||||
Goodwill impaired | - | - | - | |||||||
Balance at December 31, 2014 | $ | 3,009 | $ | 3,314 | $ | 6,323 | ||||
| Distributor organization | $1,187 |
| Customer-related intangible | 1,300 |
| Trademarks and trade name | 1,000 |
| Total purchase price | $3,487 |
| Distributor organization | $810 |
| Customer-related intangible | 525 |
| Trademarks and trade name | 400 |
| Total purchase price | $1,735 |
| Distributor organization | $218 |
| Customer-related intangible | 280 |
| Trademarks and trade name | 200 |
| Total purchase price | $698 |
| Cash paid for the equity in Legacy for Life Taiwan and Legacy for Life Limited (Hong Kong) | $26 |
| Cash paid for inventory | 195 |
| Total cash consideration | 221 |
| Trademarks and trade name | 185 |
| Customer-related intangible | 250 |
| Distributor organization | 298 |
| Total intangible assets acquired, non-cash | 733 |
| Total purchase price | $954 |
| Distributor organization | $559 |
| Customer-related intangible | 400 |
| Trademarks and trade name | 250 |
| Total purchase price | $1,209 |
| Distributor organization | $170 |
| Customer-related intangible | 155 |
| Trademarks and trade name | 110 |
| Total purchase price | $435 |
As of | ||
September 30, 2017 | December 31, 2016 | |
| Finished goods | $10,935 | $11,550 |
| Raw materials | 11,181 | 11,006 |
22,116 | 22,556 | |
| Reserve for excess and obsolete | (1,064) | (1,064) |
| Inventory, net | $21,052 | $21,492 |
Trademarks and trade name | $ | 150 | ||
Customer-related intangible | 350 | |||
Distributor organization | 400 | |||
Accrued expenses | (250 | ) | ||
Total purchase price | $ | 650 |
| Distributor organization | $1,187 |
| Customer-related intangible | 1,300 |
| Trademarks and trade name | 1,000 |
| Total purchase price | $3,487 |
Trademarks and trade name | $ | 150 | ||
Customer-related intangible | 250 | |||
Distributor organization | 250 | |||
Accrued expenses | (120 | ) | ||
Total purchase price | $ | 530 |
| Distributor organization | $810 |
| Customer-related intangible | 525 |
| Trademarks and trade name | 400 |
| Total purchase price | $1,735 |
Goodwill | $ | 300 | ||
Trademarks and trade name | 300 | |||
Customer-related intangible | 1,300 | |||
Distributor organization | 1,400 | |||
Accrued expenses | (200 | ) | ||
Total purchase price | $ | 3,100 |
| Distributor organization | $218 |
| Customer-related intangible | 280 |
| Trademarks and trade name | 200 |
| Total purchase price | $698 |
Buildings and structures | $ | 832 | ||
Machinery and equipment | 417 | |||
Customer relationships, intangible | 367 | |||
Land | 289 | |||
Total purchase price | $ | 1,905 |
Land | $ | 1,400 | ||
Total purchase price | $ | 1,400 |
| key ingredient in Legacy for Life products. Additionally, |
Inventory | $ | 8 | ||
Trademarks and trade name | 350 | |||
Customer-related intangible | 242 | |||
Distributor organization | 600 | |||
Accrued expenses | (200 | ) | ||
Total purchase price | $ | 1,000 |
| Cash paid for the equity in Legacy for Life Taiwan and Legacy for Life Limited (Hong Kong) | $26 |
| Cash paid for inventory | 195 |
| Total cash consideration | 221 |
| Trademarks and trade name | 185 |
| Customer-related intangible | 250 |
| Distributor organization | 298 |
| Total intangible assets acquired, non-cash | 733 |
| Total purchase price | $954 |
Cash | $ | 75 | ||
Inventory | 143 | |||
Trademarks and trade name | 350 | |||
Customer-related intangible | 91 | |||
Distributor organization | 300 | |||
Accounts payable | (258) | |||
Accrued expenses | (51) | |||
Total purchase price | $ | 650 |
| Distributor organization | $559 |
| Customer-related intangible | 400 |
| Trademarks and trade name | 250 |
| Total purchase price | $1,209 |
Cash paid | $ | 500 | ||
Estimated fair value of earn-out | 500 | |||
Aggregate purchase price | $ | 1,000 | ||
Purchase price allocation: | ||||
Cash | $ | 478 | ||
Accounts Receivable | 20 | |||
Inventory | 92 | |||
Prepaid expenses and other current assets | 147 | |||
Property, plant and equipment | 26 | |||
Trademarks and trade name | 400 | |||
Customer-related intangible | 300 | |||
Distribution network | 700 | |||
Internally developed software | 700 | |||
Goodwill | 869 | |||
Accounts payable | (56 | ) | ||
Accrued expenses | (249 | ) | ||
Deferred revenues | (2,427 | ) |
| Distributor organization | $170 |
| Customer-related intangible | 155 |
| Trademarks and trade name | 110 |
| Total purchase price | $435 |
September 30, 2017 | December 31, 2016 | |||||
Cost | Accumulated Amortization | Net | Cost | Accumulated Amortization | Net | |
| Distributor organizations | $14,757 | $8,059 | $6,698 | $12,930 | $7,162 | $5,768 |
| Trademarks and trade names | 6,994 | 1,109 | 5,885 | 5,394 | 815 | 4,579 |
| Customer relationships | 9,951 | 4,422 | 5,529 | 7,846 | 3,642 | 4,204 |
| Internally developed software | 720 | 433 | 287 | 720 | 357 | 363 |
| Intangible assets | $32,422 | $14,023 | $18,399 | $26,890 | $11,976 | $14,914 |
September 30, 2017 | December 31, 2016 | |
| Goodwill, commercial coffee | $3,314 | $3,314 |
| Goodwill, direct selling | 3,009 | 3,009 |
| Total goodwill | $6,323 | $6,323 |
September 30, 2017 | December 31, 2016 | |
| 8% Convertible Notes due July and August 2019 (2014 Notes) | $4,750 | $4,750 |
| Debt discount | (1,921) | (2,707) |
| Carrying value of 2014 Notes | 2,829 | 2,043 |
| 8% Convertible Notes due October and November 2018 (2015 Notes) | 3,000 | 7,188 |
| Debt discount | (224) | (904) |
| Carrying value of 2015 Notes | 2,776 | 6,284 |
| 8% Convertible Notes due July and August 2020 (2017 Notes) | 7,254 | - |
| Fair value of bifurcated embedded conversion option of 2017 Notes | 330 | - |
| Debt discount | (2,423) | - |
| Carrying value of 2017 Notes | 5,161 | - |
| Total long-term carrying value of convertible notes payable | $10,766 | $8,327 |
September 30, 2017 | December 31, 2016 | ||||||||
| Stock price volatility | 63.32 | % | 60% - 65 | % | |||||
| Risk-free interest rates | 1.38%-1.51 | % | 1.34%-1.70 | % | |||||
| Annual dividend yield | 0 | % | 0 | % | |||||
| Expected life | 1.7-3.0 years | 2.6-3.9 years | |||||||
| Stock price | $4.63 |
| Stock price volatility | 63.32% |
| Risk-free interest rate | 0.92% |
Balance at Issuance | Net unrealized (gain)/loss | Balance at September 30, 2017 |
$330,000 | $0.00 | $330,000 |
Fair Value at September 30, 2017 | ||||
Total | Level 1 | Level 2 | Level 3 | |
| Liabilities: | ||||
| Contingent acquisition debt, current portion | $422 | $- | $- | $422 |
| Contingent acquisition debt, less current portion | 11,405 | - | - | 11,405 |
| Warrant derivative liability | 4,128 | - | - | 4,128 |
| Embedded conversion option derivative | 330 | 330 | ||
| Total liabilities | $16,255 | $- | $- | $16,255 |
Fair Value at December 31, 2016 | ||||
Total | Level 1 | Level 2 | Level 3 | |
| Liabilities: | ||||
| Contingent acquisition debt, current portion | $628 | $- | $- | $628 |
| Contingent acquisition debt, less current portion | 7,373 | - | - | 7,373 |
| Warrant derivative liability | 3,345 | - | - | 3,345 |
| Total liabilities | $11,346 | $- | $- | $11,346 |
| Balance at December 31, 2016 | 1,899,385 |
| Issued | 1,262,212 |
| Expired / cancelled | (414,031) |
| Exercised | (37,500) |
| Balance at September 30, 2017 | 2,710,066 |
Number of Shares | Weighted Average Exercise Price | Aggregate Intrinsic Value (in thousands) | |
| Outstanding December 31, 2016 | 1,660,964 | $4.74 | $1,346 |
| Issued | 21,624 | 4.53 | |
| Canceled / expired | (79,711) | 4.35 | |
| Exercised | (6,885) | 4.28 | - |
| Outstanding September 30, 2017 | 1,595,932 | $4.76 | $503 |
| Exercisable September 30, 2017 | 878,657 | $4.55 | $339 |
Three months ended | Nine months ended | |||
September 30, | September 30, | |||
2017 | 2016 | 2017 | 2016 | |
| Revenues | ||||
| Direct selling | $37,954 | $38,576 | $106,734 | $110,393 |
| Commercial coffee | 6,441 | 4,986 | 17,921 | 13,871 |
| Total revenues | $44,395 | $43,562 | $124,655 | $124,264 |
| Gross profit | ||||
| Direct selling | $25,472 | $26,233 | $71,522 | $74,690 |
| Commercial coffee | 292 | 135 | 210 | 472 |
| Total gross profit | $25,764 | $26,368 | $71,732 | $75,162 |
| Operating income (loss) | ||||
| Direct selling | $(1,233) | $1,171 | $(2,392) | $4,903 |
| Commercial coffee | (584) | (595) | (2,501) | (1,640) |
| Total operating income | $(1,817) | $576 | $(4,893) | $3,263 |
| Net (loss) income | ||||
| Direct selling | $(1,311) | $822 | $(2,958) | $1,912 |
| Commercial coffee | 243 | (755) | (2,899) | (1,803) |
| Total net (loss) income | $(1,068) | $67 | $(5,857) | $109 |
| Capital expenditures | ||||
| Direct selling | $223 | $590 | $697 | $1,339 |
| Commercial coffee | 110 | 145 | 391 | 863 |
| Total capital expenditures | $333 | $735 | $1,088 | $2,202 |
As of | ||
September 30, 2017 | December 31, 2016 | |
| Total assets | ||
| Direct selling | $47,020 | $40,127 |
| Commercial coffee | 26,977 | 25,881 |
| Total assets | $73,997 | $66,008 |
Three months ended | Nine months ended | |||
September 30, | September 30, | |||
2017 | 2016 | 2017 | 2016 | |
| Revenues | ||||
| United States | $39,013 | $39,630 | $111,524 | $113,332 |
| International | 5,382 | 3,932 | 13,131 | 10,932 |
| Total revenues | $44,395 | $43,562 | $124,655 | $124,264 |
Youngevity International, Inc. and Subsidiaries | ||
Consolidated Balance Sheets | ||
(In thousands, except share amounts) | ||
As of | ||
December 31, 2016 | December 31, 2015 | |
| ASSETS | ||
| Current Assets | ||
| Cash and cash equivalents | $869 | $3,875 |
| Accounts receivable, due from factoring company | 1,078 | 556 |
| Trade accounts receivable, net | 1,071 | 1,068 |
| Income tax receivable | 311 | 173 |
| Deferred tax assets, net current | 565 | 711 |
| Inventory | 21,492 | 17,977 |
| Prepaid expenses and other current assets | 3,087 | 2,412 |
| Total current assets | 28,473 | 26,772 |
| Property and equipment, net | 14,006 | 12,699 |
| Deferred tax assets, long-term | 2,292 | 1,821 |
| Intangible assets, net | 14,914 | 13,714 |
| Goodwill | 6,323 | 6,323 |
| Total assets | $66,008 | $61,329 |
| LIABILITIES AND STOCKHOLDERS' EQUITY | ||
| Current Liabilities | ||
| Accounts payable | $8,174 | $7,015 |
| Accrued distributor compensation | 4,163 | 4,223 |
| Accrued expenses | 3,701 | 3,605 |
| Deferred revenues | 1,870 | 2,580 |
| Other current liabilities | 2,389 | 577 |
| Capital lease payable, current portion | 821 | 111 |
| Notes payable, current portion | 219 | 456 |
| Warrant derivative liability | 3,345 | 4,716 |
| Contingent acquisition debt, current portion | 628 | 264 |
| Total current liabilities | 25,310 | 23,547 |
| Capital lease payable, net of current portion | 1,569 | 294 |
| Notes payable, net of current portion | 4,431 | 4,647 |
| Convertible notes payable, net of debt discount | 8,327 | 6,786 |
| Contingent acquisition debt, net of current portion | 7,373 | 7,174 |
| Total liabilities | 47,010 | 42,448 |
| Commitments and contingencies, Note 9 | ||
| Stockholders’ Equity | ||
| Convertible Preferred Stock, $0.001 par value: 100,000,000 shares authorized; 161,135 shares issued and outstanding at December 31, 2016 and December 31, 2015 | - | - |
| Common Stock, $0.001 par value: 600,000,000 shares authorized; 392,698,557 and 392,583,015 shares issued and outstanding at December 31, 2016 and December 31, 2015, respectively | 393 | 393 |
| Additional paid-in capital | 169,839 | 169,432 |
| Accumulated deficit | (151,016) | (150,618) |
| Accumulated other comprehensive loss | (218) | (326) |
| Total stockholders’ equity | 18,998 | 18,881 |
Total Liabilities and Stockholders’ Equity | $66,008 | $61,329 |
Years Ended December 31, | ||
2016 | 2015 | |
| Revenues | $162,667 | $156,597 |
| Cost of revenues | 64,530 | 63,628 |
| Gross profit | 98,137 | 92,969 |
| Operating expenses | ||
| Distributor compensation | 67,148 | 63,276 |
| Sales and marketing | 10,413 | 8,212 |
| General and administrative | 18,061 | 16,075 |
| Total operating expenses | 95,622 | 87,563 |
| Operating income | 2,515 | 5,406 |
| Interest expense, net | (4,474) | (4,491) |
| Extinguishment loss on debt | - | (1,198) |
| Change in fair value of warrant derivative liability | 1,371 | (39) |
| Total other expense | (3,103) | (5,728) |
| Loss before income taxes | (588) | (322) |
| Income tax (benefit) provision | (190) | 1,384 |
| Net loss | (398) | (1,706) |
| Preferred stock dividends | (12) | (12) |
| Net loss available to common stockholders | $(410) | $(1,718) |
| Net loss per share, basic | $0.00 | $0.00 |
| Net loss per share, diluted | $0.00 | $0.00 |
| Weighted average shares outstanding, basic | 392,641,735 | 392,075,608 |
| Weighted average shares outstanding, diluted | 392,641,735 | 392,075,608 |
Years Ended December 31, | ||
2016 | 2015 | |
| Net loss | $(398) | $(1,706) |
| Foreign currency translation | 108 | (51) |
| Total other comprehensive income (loss) | 108 | (51) |
| Comprehensive loss | $(290) | $(1,757) |
Preferred Stock | Common Stock | Additional Paid-in | Accumulated Other Comprehensive | Accumulated | Total | |||
Shares | Amount | Shares | Amount | Capital | Income (loss) | Deficit | Equity | |
| Beginning Balance at December 31, 2014 | 161,135 | $- | 390,301,312 | $390 | $167,386 | $(275) | $(148,912) | $18,589 |
| Net loss | - | - | - | - | - | - | (1,706) | (1,706) |
| Foreign currency | ||||||||
| translation adjustment | - | - | - | - | - | (51) | - | (51) |
| Beneficial conversion feature of convertible notes payable, net of tax | - | - | - | - | 402 | - | - | 402 |
| Issuance of common stock pursuant to Notes Payable | - | - | 2,450,000 | 2 | 585 | - | - | 587 |
| Issuance of warrants pursuant to Convertible Notes Payable debt financing | - | - | - | - | 384 | - | - | 384 |
| Issuance of common stock pursuant to the exercise of warrants | - | - | 806,250 | 1 | 201 | - | - | 202 |
| Issuance of common stock pursuant to the exercise of stock options | - | - | 369,675 | - | 70 | - | - | 70 |
| Repurchase of common stock | - | - | (1,344,222) | - | (426) | - | - | (426) |
| Dividends on preferred stock | - | - | - | - | (12) | - | - | (12) |
| Warrant modification expense | - | - | - | - | 779 | - | - | 779 |
| Stock based compensation expense | - | - | - | - | 455 | - | - | 455 |
| Balance at December 31, 2015 | 161,135 | $- | 392,583,015 | $393 | $169,432 | $(326) | $(150,618) | $18,881 |
| Net loss | - | - | - | - | - | - | (398) | (398) |
Foreign currency translation adjustment | - | - | - | - | - | 108 | - | 108 |
| Issuance of common stock pursuant to the exercise of warrants | - | - | 39,250 | - | 10 | - | - | 10 |
| Issuance of common stock pursuant to the exercise of stock options | - | - | 102,000 | - | 20 | - | - | 20 |
| Issuance of common stock for services | - | - | 100,000 | - | 30 | - | - | 30 |
| Repurchase of common stock | - | - | (125,708) | - | (36) | - | - | (36) |
| Dividends on preferred stock | - | - | - | - | (12) | - | - | (12) |
| Stock based compensation expense | - | - | - | - | 395 | - | - | 395 |
| Balance at December 31, 2016 | 161,135 | $- | 392,698,557 | $393 | $169,839 | $(218) | $(151,016) | $18,998 |
Years Ended December 31, | ||
2016 | 2015 | |
| Cash Flows from Operating Activities: | (As Restated)* | |
| Net loss | $(398) | $(1,706) |
| Adjustments to reconcile net loss to net cash (used in) provided by operating activities: | ||
| Depreciation and amortization | 3,862 | 3,354 |
| Stock based compensation expense | 395 | 455 |
| Warrant modification expense | - | 253 |
| Amortization of deferred financing costs | 360 | 899 |
| Amortization of prepaid advisory fees | 58 | 20 |
| Stock issuance for services | 30 | - |
| Change in fair value of warrant derivative liability | (1,371) | 39 |
| Amortization of debt discount | 1,053 | 967 |
| Amortization of warrant issuance costs | 128 | 21 |
| Expenses allocated in profit sharing agreement | (698) | (528) |
| Change in fair value of contingent acquisition debt | (1,462) | (446) |
| Extinguishment loss on debt | - | 1,198 |
| Deferred income taxes | (325) | 1,409 |
| Changes in operating assets and liabilities, net of effect from business combinations: | ||
| Accounts receivable | (525) | 168 |
| Inventory | (3,515) | (6,194) |
| Prepaid expenses and other current assets | (733) | 885 |
| Accounts payable | 1,159 | 1,608 |
| Accrued distributor compensation | (60) | 46 |
| Deferred revenues | (710) | (2,495) |
| Accrued expenses and other liabilities | 1,063 | 1,278 |
| Income taxes receivable | (138) | 136 |
| Net Cash (Used In) Provided by Operating Activities | (1,827) | 1,367 |
| Cash Flows from Investing Activities: | ||
| Acquisitions, net of cash acquired | (48) | (32) |
| Purchases of property and equipment | (1,397) | (3,198) |
| Net Cash Used in Investing Activities | (1,445) | (3,230) |
| Cash Flows from Financing Activities: | ||
| Proceeds from issuance of secured promissory notes and common stock, net of offering costs | - | 5,080 |
| Proceeds from issuance of convertible notes payable, net | - | 2,383 |
| Proceeds from the exercise of stock options and warrants, net | 30 | 272 |
| Proceeds from factoring company | 833 | 82 |
| Payments of notes payable, net | (453) | (1,214) |
| Payments of contingent acquisition debt | (773) | (3,338) |
| Proceeds (payments) of capital leases | 557 | (47) |
| Repurchase of common stock | (36) | (426) |
| Net Cash Provided by Financing Activities | 158 | 2,792 |
| Foreign Currency Effect on Cash and Cash Equivalents | 108 | (51) |
| Net (decrease) increase in cash and cash equivalents | (3,006) | 878 |
| Cash and Cash Equivalents, Beginning of Period | 3,875 | 2,997 |
| Cash and Cash Equivalents, End of Period | $869 | $3,875 |
| Supplemental Disclosures of Cash Flow Information | ||
| Cash paid during the period for: | ||
| Interest | $2,966 | $2,127 |
| Income taxes | $181 | $- |
| Supplemental Disclosures of Noncash Investing and Financing Activities | ||
| Purchases of property and equipment funded by capital leases and accounts payable agreements | $1,582 | $429 |
| Common stock issued in connection with financing | $- | $587 |
| Acquisitions of net assets in exchange for contingent acquisition debt (see Note 2 for non-cash activity) | $3,604 | $1,136 |
December 31, | ||
2016 | 2015 | |
| Finished goods | $11,550 | $9,893 |
| Raw materials | 11,006 | 8,970 |
| Total inventory | 22,556 | 18,863 |
| Reserve for excess and obsolete | (1,064) | (886) |
| Inventory, net | $21,492 | $17,977 |
December 31, | ||
2016 | 2015 | |
| Balance as of December 31, 2015 | $(886) | $(478) |
| Addition to provision | (1,564) | (1,114) |
| Write-off of inventory | 1,386 | 706 |
| Balance as of December 31, 2016 | $(1,064) | $(886) |
December 31, | ||
2016 | 2015 | |
| Building | $3,873 | $2,930 |
| Leasehold improvements | 2,532 | 2,302 |
| Land | 2,544 | 2,544 |
| Land improvements | 602 | 602 |
| Producing coffee trees | 553 | 553 |
| Manufacturing equipment | 4,570 | 4,344 |
| Furniture and other equipment | 1,580 | 1,417 |
| Computer software | 1,236 | 1,100 |
| Computer equipment | 699 | 663 |
| Vehicles | 103 | 103 |
| Construction in process | 1,859 | 799 |
20,151 | 17,357 | |
| Accumulated depreciation | (6,145) | (4,658) |
| Total property and equipment | $14,006 | $12,699 |
December 31, 2016 | December 31, 2015 | |||||
Cost | Accumulated Amortization | Net | Cost | Accumulated Amortization | Net | |
| Distributor organizations | $12,930 | $7,162 | $5,768 | $11,173 | $6,086 | $5,087 |
| Trademarks and tradenames | 5,394 | 815 | 4,579 | 4,666 | 537 | 4,129 |
| Customer relationships | 7,846 | 3,642 | 4,204 | 6,787 | 2,751 | 4,036 |
| Internally developed software | 720 | 357 | 363 | 720 | 258 | 462 |
| Intangible assets | $26,890 | $11,976 | $14,914 | $23,346 | $9,632 | $13,714 |
| Years ending December 31, | ||||
| 2017 | $ | 2,471 | ||
| 2018 | 2,096 | |||
| 2019 | 1,502 | |||
| 2020 | 1,413 | |||
| 2021 | 1,336 | |||
Direct selling | Commercial coffee | Total | |
| Balance at December 31, 2014 | $3,009 | $3,314 | $6,323 |
| Goodwill recognized | - | - | - |
| Goodwill impaired | - | - | - |
| Balance at December 31, 2015 | $3,009 | $3,314 | $6,323 |
| Goodwill recognized | - | - | - |
| Goodwill impaired | - | - | - |
| Balance at December 31, 2016 | $3,009 | $3,314 | $6,323 |
| Cash paid for the equity in Legacy for Life Taiwan and Legacy for Life Limited (Hong Kong) | $26 |
| Cash paid for inventory | 195 |
| Total cash consideration | 221 |
| Trademarks and trade name | 185 |
| Customer-related intangible | 250 |
| Distributor organization | 390 |
| Total intangible assets acquired, non-cash | 825 |
| Total purchase price | $1,046 |
| Distributor organization | $825 |
| Customer-related intangible | 400 |
| Trademarks and trade name | 250 |
| Total purchase price | $1,475 |
| Distributor organization | $200 |
| Customer-related intangible | 155 |
| Trademarks and trade name | 110 |
| Total purchase price | $465 |
| December 31, 2013 | ||||
Revenues | $ | 88,596 | ||
Income before income taxes | $ | 2,532 | ||
| Distributor organization | $396 |
| Customer-related intangible | 285 |
| Trademarks and trade name | 158 |
| Total purchase price | $839 |
| Distributor organization | $296 |
| Customer-related intangible | 169 |
| Trademarks and trade name | 127 |
| Total purchase price | $592 |
| Distributor organization | $68 |
| Customer-related intangible | 52 |
| Total purchase price | $120 |
| Distributor organization | $140 |
| Customer-related intangible | 110 |
| Trademarks and trade name | 60 |
| Initial cash payment | (25) |
| Total purchase price | $285 |
| Years ended December 31, | ||||||||
| 2014 | 2013 | |||||||
Revenues | $ | - | $ | 24 | ||||
Operating loss, net | $ | (203 | ) | $ | (118) | |||
| Years ending December 31, | Years ending December 31, | ||||
2015 | $ | 228 | |||
2016 | 236 | ||||
2017 | 248 | $220 | |||
2018 | 189 | 7,349 | |||
2019 | 4,925 | 4,891 | |||
| 2020 | 143 | ||||
| 2021 | 108 | ||||
Thereafter | 3,991 | 3,877 | |||
Total | $ | 9,817 | $16,588 | ||
| Years ending December 31, | |
| 2017 | $984 |
| 2018 | 972 |
| 2019 | 604 |
| 2020 | 90 |
| 2021 | 28 |
| Total | 2,678 |
| Amount representing interest | (288) |
| Present value of minimum lease payments | 2,390 |
| Less current portion | (821) |
| Long term portion | $1,569 |
| Balance at December 31, 2016 | 1,899,385 |
| Issued | 1,262,212 |
| Expired / cancelled | (414,031) |
| Exercised | (37,500) |
| Balance at September 30, 2017 | 2,710,066 |
Number of Shares | Weighted Average Exercise Price | Aggregate Intrinsic Value (in thousands) | |
| Outstanding December 31, 2016 | 1,660,964 | $4.74 | $1,346 |
| Issued | 21,624 | 4.53 | |
| Canceled / expired | (79,711) | 4.35 | |
| Exercised | (6,885) | 4.28 | - |
| Outstanding September 30, 2017 | 1,595,932 | $4.76 | $503 |
| Exercisable September 30, 2017 | 878,657 | $4.55 | $339 |
Three months ended | Nine months ended | |||
September 30, | September 30, | |||
2017 | 2016 | 2017 | 2016 | |
| Revenues | ||||
| Direct selling | $37,954 | $38,576 | $106,734 | $110,393 |
| Commercial coffee | 6,441 | 4,986 | 17,921 | 13,871 |
| Total revenues | $44,395 | $43,562 | $124,655 | $124,264 |
| Gross profit | ||||
| Direct selling | $25,472 | $26,233 | $71,522 | $74,690 |
| Commercial coffee | 292 | 135 | 210 | 472 |
| Total gross profit | $25,764 | $26,368 | $71,732 | $75,162 |
| Operating income (loss) | ||||
| Direct selling | $(1,233) | $1,171 | $(2,392) | $4,903 |
| Commercial coffee | (584) | (595) | (2,501) | (1,640) |
| Total operating income | $(1,817) | $576 | $(4,893) | $3,263 |
| Net (loss) income | ||||
| Direct selling | $(1,311) | $822 | $(2,958) | $1,912 |
| Commercial coffee | 243 | (755) | (2,899) | (1,803) |
| Total net (loss) income | $(1,068) | $67 | $(5,857) | $109 |
| Capital expenditures | ||||
| Direct selling | $223 | $590 | $697 | $1,339 |
| Commercial coffee | 110 | 145 | 391 | 863 |
| Total capital expenditures | $333 | $735 | $1,088 | $2,202 |
As of | ||
September 30, 2017 | December 31, 2016 | |
| Total assets | ||
| Direct selling | $47,020 | $40,127 |
| Commercial coffee | 26,977 | 25,881 |
| Total assets | $73,997 | $66,008 |
Three months ended | Nine months ended | |||
September 30, | September 30, | |||
2017 | 2016 | 2017 | 2016 | |
| Revenues | ||||
| United States | $39,013 | $39,630 | $111,524 | $113,332 |
| International | 5,382 | 3,932 | 13,131 | 10,932 |
| Total revenues | $44,395 | $43,562 | $124,655 | $124,264 |
Youngevity International, Inc. and Subsidiaries | ||
Consolidated Balance Sheets | ||
(In thousands, except share amounts) | ||
As of | ||
December 31, 2016 | December 31, 2015 | |
| ASSETS | ||
| Current Assets | ||
| Cash and cash equivalents | $869 | $3,875 |
| Accounts receivable, due from factoring company | 1,078 | 556 |
| Trade accounts receivable, net | 1,071 | 1,068 |
| Income tax receivable | 311 | 173 |
| Deferred tax assets, net current | 565 | 711 |
| Inventory | 21,492 | 17,977 |
| Prepaid expenses and other current assets | 3,087 | 2,412 |
| Total current assets | 28,473 | 26,772 |
| Property and equipment, net | 14,006 | 12,699 |
| Deferred tax assets, long-term | 2,292 | 1,821 |
| Intangible assets, net | 14,914 | 13,714 |
| Goodwill | 6,323 | 6,323 |
| Total assets | $66,008 | $61,329 |
| LIABILITIES AND STOCKHOLDERS' EQUITY | ||
| Current Liabilities | ||
| Accounts payable | $8,174 | $7,015 |
| Accrued distributor compensation | 4,163 | 4,223 |
| Accrued expenses | 3,701 | 3,605 |
| Deferred revenues | 1,870 | 2,580 |
| Other current liabilities | 2,389 | 577 |
| Capital lease payable, current portion | 821 | 111 |
| Notes payable, current portion | 219 | 456 |
| Warrant derivative liability | 3,345 | 4,716 |
| Contingent acquisition debt, current portion | 628 | 264 |
| Total current liabilities | 25,310 | 23,547 |
| Capital lease payable, net of current portion | 1,569 | 294 |
| Notes payable, net of current portion | 4,431 | 4,647 |
| Convertible notes payable, net of debt discount | 8,327 | 6,786 |
| Contingent acquisition debt, net of current portion | 7,373 | 7,174 |
| Total liabilities | 47,010 | 42,448 |
| Commitments and contingencies, Note 9 | ||
| Stockholders’ Equity | ||
| Convertible Preferred Stock, $0.001 par value: 100,000,000 shares authorized; 161,135 shares issued and outstanding at December 31, 2016 and December 31, 2015 | - | - |
| Common Stock, $0.001 par value: 600,000,000 shares authorized; 392,698,557 and 392,583,015 shares issued and outstanding at December 31, 2016 and December 31, 2015, respectively | 393 | 393 |
| Additional paid-in capital | 169,839 | 169,432 |
| Accumulated deficit | (151,016) | (150,618) |
| Accumulated other comprehensive loss | (218) | (326) |
| Total stockholders’ equity | 18,998 | 18,881 |
Total Liabilities and Stockholders’ Equity | $66,008 | $61,329 |
Years Ended December 31, | ||
2016 | 2015 | |
| Revenues | $162,667 | $156,597 |
| Cost of revenues | 64,530 | 63,628 |
| Gross profit | 98,137 | 92,969 |
| Operating expenses | ||
| Distributor compensation | 67,148 | 63,276 |
| Sales and marketing | 10,413 | 8,212 |
| General and administrative | 18,061 | 16,075 |
| Total operating expenses | 95,622 | 87,563 |
| Operating income | 2,515 | 5,406 |
| Interest expense, net | (4,474) | (4,491) |
| Extinguishment loss on debt | - | (1,198) |
| Change in fair value of warrant derivative liability | 1,371 | (39) |
| Total other expense | (3,103) | (5,728) |
| Loss before income taxes | (588) | (322) |
| Income tax (benefit) provision | (190) | 1,384 |
| Net loss | (398) | (1,706) |
| Preferred stock dividends | (12) | (12) |
| Net loss available to common stockholders | $(410) | $(1,718) |
| Net loss per share, basic | $0.00 | $0.00 |
| Net loss per share, diluted | $0.00 | $0.00 |
| Weighted average shares outstanding, basic | 392,641,735 | 392,075,608 |
| Weighted average shares outstanding, diluted | 392,641,735 | 392,075,608 |
Years Ended December 31, | ||
2016 | 2015 | |
| Net loss | $(398) | $(1,706) |
| Foreign currency translation | 108 | (51) |
| Total other comprehensive income (loss) | 108 | (51) |
| Comprehensive loss | $(290) | $(1,757) |
Preferred Stock | Common Stock | Additional Paid-in | Accumulated Other Comprehensive | Accumulated | Total | |||
Shares | Amount | Shares | Amount | Capital | Income (loss) | Deficit | Equity | |
| Beginning Balance at December 31, 2014 | 161,135 | $- | 390,301,312 | $390 | $167,386 | $(275) | $(148,912) | $18,589 |
| Net loss | - | - | - | - | - | - | (1,706) | (1,706) |
| Foreign currency | ||||||||
| translation adjustment | - | - | - | - | - | (51) | - | (51) |
| Beneficial conversion feature of convertible notes payable, net of tax | - | - | - | - | 402 | - | - | 402 |
| Issuance of common stock pursuant to Notes Payable | - | - | 2,450,000 | 2 | 585 | - | - | 587 |
| Issuance of warrants pursuant to Convertible Notes Payable debt financing | - | - | - | - | 384 | - | - | 384 |
| Issuance of common stock pursuant to the exercise of warrants | - | - | 806,250 | 1 | 201 | - | - | 202 |
| Issuance of common stock pursuant to the exercise of stock options | - | - | 369,675 | - | 70 | - | - | 70 |
| Repurchase of common stock | - | - | (1,344,222) | - | (426) | - | - | (426) |
| Dividends on preferred stock | - | - | - | - | (12) | - | - | (12) |
| Warrant modification expense | - | - | - | - | 779 | - | - | 779 |
| Stock based compensation expense | - | - | - | - | 455 | - | - | 455 |
| Balance at December 31, 2015 | 161,135 | $- | 392,583,015 | $393 | $169,432 | $(326) | $(150,618) | $18,881 |
| Net loss | - | - | - | - | - | - | (398) | (398) |
Foreign currency translation adjustment | - | - | - | - | - | 108 | - | 108 |
| Issuance of common stock pursuant to the exercise of warrants | - | - | 39,250 | - | 10 | - | - | 10 |
| Issuance of common stock pursuant to the exercise of stock options | - | - | 102,000 | - | 20 | - | - | 20 |
| Issuance of common stock for services | - | - | 100,000 | - | 30 | - | - | 30 |
| Repurchase of common stock | - | - | (125,708) | - | (36) | - | - | (36) |
| Dividends on preferred stock | - | - | - | - | (12) | - | - | (12) |
| Stock based compensation expense | - | - | - | - | 395 | - | - | 395 |
| Balance at December 31, 2016 | 161,135 | $- | 392,698,557 | $393 | $169,839 | $(218) | $(151,016) | $18,998 |
Years Ended December 31, | ||
2016 | 2015 | |
| Cash Flows from Operating Activities: | (As Restated)* | |
| Net loss | $(398) | $(1,706) |
| Adjustments to reconcile net loss to net cash (used in) provided by operating activities: | ||
| Depreciation and amortization | 3,862 | 3,354 |
| Stock based compensation expense | 395 | 455 |
| Warrant modification expense | - | 253 |
| Amortization of deferred financing costs | 360 | 899 |
| Amortization of prepaid advisory fees | 58 | 20 |
| Stock issuance for services | 30 | - |
| Change in fair value of warrant derivative liability | (1,371) | 39 |
| Amortization of debt discount | 1,053 | 967 |
| Amortization of warrant issuance costs | 128 | 21 |
| Expenses allocated in profit sharing agreement | (698) | (528) |
| Change in fair value of contingent acquisition debt | (1,462) | (446) |
| Extinguishment loss on debt | - | 1,198 |
| Deferred income taxes | (325) | 1,409 |
| Changes in operating assets and liabilities, net of effect from business combinations: | ||
| Accounts receivable | (525) | 168 |
| Inventory | (3,515) | (6,194) |
| Prepaid expenses and other current assets | (733) | 885 |
| Accounts payable | 1,159 | 1,608 |
| Accrued distributor compensation | (60) | 46 |
| Deferred revenues | (710) | (2,495) |
| Accrued expenses and other liabilities | 1,063 | 1,278 |
| Income taxes receivable | (138) | 136 |
| Net Cash (Used In) Provided by Operating Activities | (1,827) | 1,367 |
| Cash Flows from Investing Activities: | ||
| Acquisitions, net of cash acquired | (48) | (32) |
| Purchases of property and equipment | (1,397) | (3,198) |
| Net Cash Used in Investing Activities | (1,445) | (3,230) |
| Cash Flows from Financing Activities: | ||
| Proceeds from issuance of secured promissory notes and common stock, net of offering costs | - | 5,080 |
| Proceeds from issuance of convertible notes payable, net | - | 2,383 |
| Proceeds from the exercise of stock options and warrants, net | 30 | 272 |
| Proceeds from factoring company | 833 | 82 |
| Payments of notes payable, net | (453) | (1,214) |
| Payments of contingent acquisition debt | (773) | (3,338) |
| Proceeds (payments) of capital leases | 557 | (47) |
| Repurchase of common stock | (36) | (426) |
| Net Cash Provided by Financing Activities | 158 | 2,792 |
| Foreign Currency Effect on Cash and Cash Equivalents | 108 | (51) |
| Net (decrease) increase in cash and cash equivalents | (3,006) | 878 |
| Cash and Cash Equivalents, Beginning of Period | 3,875 | 2,997 |
| Cash and Cash Equivalents, End of Period | $869 | $3,875 |
| Supplemental Disclosures of Cash Flow Information | ||
| Cash paid during the period for: | ||
| Interest | $2,966 | $2,127 |
| Income taxes | $181 | $- |
| Supplemental Disclosures of Noncash Investing and Financing Activities | ||
| Purchases of property and equipment funded by capital leases and accounts payable agreements | $1,582 | $429 |
| Common stock issued in connection with financing | $- | $587 |
| Acquisitions of net assets in exchange for contingent acquisition debt (see Note 2 for non-cash activity) | $3,604 | $1,136 |
December 31, | ||
2016 | 2015 | |
| Finished goods | $11,550 | $9,893 |
| Raw materials | 11,006 | 8,970 |
| Total inventory | 22,556 | 18,863 |
| Reserve for excess and obsolete | (1,064) | (886) |
| Inventory, net | $21,492 | $17,977 |
December 31, | ||
2016 | 2015 | |
| Balance as of December 31, 2015 | $(886) | $(478) |
| Addition to provision | (1,564) | (1,114) |
| Write-off of inventory | 1,386 | 706 |
| Balance as of December 31, 2016 | $(1,064) | $(886) |
December 31, | ||
2016 | 2015 | |
| Building | $3,873 | $2,930 |
| Leasehold improvements | 2,532 | 2,302 |
| Land | 2,544 | 2,544 |
| Land improvements | 602 | 602 |
| Producing coffee trees | 553 | 553 |
| Manufacturing equipment | 4,570 | 4,344 |
| Furniture and other equipment | 1,580 | 1,417 |
| Computer software | 1,236 | 1,100 |
| Computer equipment | 699 | 663 |
| Vehicles | 103 | 103 |
| Construction in process | 1,859 | 799 |
20,151 | 17,357 | |
| Accumulated depreciation | (6,145) | (4,658) |
| Total property and equipment | $14,006 | $12,699 |
December 31, 2016 | December 31, 2015 | |||||
Cost | Accumulated Amortization | Net | Cost | Accumulated Amortization | Net | |
| Distributor organizations | $12,930 | $7,162 | $5,768 | $11,173 | $6,086 | $5,087 |
| Trademarks and tradenames | 5,394 | 815 | 4,579 | 4,666 | 537 | 4,129 |
| Customer relationships | 7,846 | 3,642 | 4,204 | 6,787 | 2,751 | 4,036 |
| Internally developed software | 720 | 357 | 363 | 720 | 258 | 462 |
| Intangible assets | $26,890 | $11,976 | $14,914 | $23,346 | $9,632 | $13,714 |
| Years ending December 31, | ||||
| 2017 | $ | 2,471 | ||
| 2018 | 2,096 | |||
| 2019 | 1,502 | |||
| 2020 | 1,413 | |||
| 2021 | 1,336 | |||
Direct selling | Commercial coffee | Total | |
| Balance at December 31, 2014 | $3,009 | $3,314 | $6,323 |
| Goodwill recognized | - | - | - |
| Goodwill impaired | - | - | - |
| Balance at December 31, 2015 | $3,009 | $3,314 | $6,323 |
| Goodwill recognized | - | - | - |
| Goodwill impaired | - | - | - |
| Balance at December 31, 2016 | $3,009 | $3,314 | $6,323 |
| Cash paid for the equity in Legacy for Life Taiwan and Legacy for Life Limited (Hong Kong) | $26 |
| Cash paid for inventory | 195 |
| Total cash consideration | 221 |
| Trademarks and trade name | 185 |
| Customer-related intangible | 250 |
| Distributor organization | 390 |
| Total intangible assets acquired, non-cash | 825 |
| Total purchase price | $1,046 |
| Distributor organization | $825 |
| Customer-related intangible | 400 |
| Trademarks and trade name | 250 |
| Total purchase price | $1,475 |
| Distributor organization | $200 |
| Customer-related intangible | 155 |
| Trademarks and trade name | 110 |
| Total purchase price | $465 |
| Distributor organization | $396 |
| Customer-related intangible | 285 |
| Trademarks and trade name | 158 |
| Total purchase price | $839 |
| Distributor organization | $296 |
| Customer-related intangible | 169 |
| Trademarks and trade name | 127 |
| Total purchase price | $592 |
| Distributor organization | $68 |
| Customer-related intangible | 52 |
| Total purchase price | $120 |
| Distributor organization | $140 |
| Customer-related intangible | 110 |
| Trademarks and trade name | 60 |
| Initial cash payment | (25) |
| Total purchase price | $285 |
| December 31, 2014 | December 31, 2013 | |||||||
Convertible notes | $ | 4,750 | $ | - | ||||
Less: detachable warrants discount | (3,697 | ) | - | |||||
Less: conversion feature discount | (1,053 | ) | - | |||||
Amortization of debt discounts | 396 | - | ||||||
Convertible notes, net of discounts | $ | 396 | $ | - | ||||
| Years ending December 31, | |
| 2017 | $220 |
| 2018 | 7,349 |
| 2019 | 4,891 |
| 2020 | 143 |
| 2021 | 108 |
| Thereafter | 3,877 |
| Total | $16,588 |
| Years ending December 31, | |
| 2017 | $984 |
| 2018 | 972 |
| 2019 | 604 |
| 2020 | 90 |
| 2021 | 28 |
| Total | 2,678 |
| Amount representing interest | (288) |
| Present value of minimum lease payments | 2,390 |
| Less current portion | (821) |
| Long term portion | $1,569 |
| Closing Dates: | Issued Warrants | Estimated Fair Value Per Share as of December 31, 2014 | Estimated Total Fair Value in Aggregate $ as of December 31, 2014 | Estimated Total Fair Value in Aggregate $ as of issuance dates | ||||||||||||
July 31, 2014 Warrants | 19,966,768 | $ | 0.17 | $ | 3,398,000 | $ | 3,374,000 | |||||||||
August 14, 2014 Warrants | 1,721,273 | 0.17 | 294,000 | 300,000 | ||||||||||||
September 10, 2014 Warrants | 114,752 | 0.17 | 20,000 | 23,000 | ||||||||||||
21,802,793 | $ | 3,712,000 | $ | 3,697,000 | ||||||||||||
| December 31, 2014 | Issuance Dates | ||||
Stock price volatility | 90 | % | 90% | ||
Risk-free interest rates | 1.65 | % | 1.58% - 1.79% | ||
Annual dividend yield | 0 | % | 0% | ||
Expected life | 4.7 years | 5.0 years | |||
| Fair Value at December 31, 2014 | ||||||||||||||||
| Total | Level 1 | Level 2 | Level 3 | |||||||||||||
| Liabilities: | ||||||||||||||||
Contingent acquisition debt, current portion | $ | 2,765 | $ | - | $ | - | $ | 2,765 | ||||||||
Contingent acquisition debt, less current portion | 7,707 | - | - | 7,707 | ||||||||||||
Warrant derivative liability | 3,712 | - | - | 3,712 | ||||||||||||
Total liabilities | $ | 14,184 | $ | - | $ | - | $ | 14,184 | ||||||||
Fair Value at December 31, 2013 | ||||||||||||||||
Total | Level 1 | Level 2 | Level 3 | |||||||||||||
Liabilities: | ||||||||||||||||
Contingent acquisition debt, current portion | $ | 1,072 | $ | - | $ | - | $ | 1,072 | ||||||||
Contingent acquisition debt, less current portion | 6,008 | - | - | 6,008 | ||||||||||||
Warrant derivative liability | - | - | - | - | ||||||||||||
Total liabilities | $ | 7,080 | $ | - | $ | - | $ | 7,080 | ||||||||
| Warrant Derivative Liability | ||||
Balance at December 31, 2013 | $ | - | ||
Issuance | 3,697 | |||
Adjustments to estimated fair value | 15 | |||
Balance at December 31, 2014 | $ | 3,712 | ||
| Contingent Consideration | ||||
Balance at December 31, 2012 | $ | 5,684 | ||
Level 3 liabilities acquired | 2,149 | |||
Level 3 liabilities settled | (805 | ) | ||
Adjustments to liabilities included in earnings | 52 | |||
Balance at December 31, 2013 | 7,080 | |||
Level 3 liabilities acquired | 5,912 | |||
Level 3 liabilities settled | (2,488 | ) | ||
Adjustments to liabilities included in earnings | 179 | |||
Expenses allocated to profit sharing agreement | (211 | ) | ||
Balance at December 31, 2014 | $ | 10,472 | ||
| Balance at December 31, 2016 | 1,899,385 |
| Issued | 1,262,212 |
| Expired / cancelled | (414,031) |
| Exercised | (37,500) |
| Balance at September 30, 2017 | 2,710,066 |
Number of Shares | Weighted Average Exercise Price | Aggregate Intrinsic Value (in thousands) | |
| Outstanding December 31, 2016 | 1,660,964 | $4.74 | $1,346 |
| Issued | 21,624 | 4.53 | |
| Canceled / expired | (79,711) | 4.35 | |
| Exercised | (6,885) | 4.28 | - |
| Outstanding September 30, 2017 | 1,595,932 | $4.76 | $503 |
| Exercisable September 30, 2017 | 878,657 | $4.55 | $339 |
Three months ended | Nine months ended | |||
September 30, | September 30, | |||
2017 | 2016 | 2017 | 2016 | |
| Revenues | ||||
| Direct selling | $37,954 | $38,576 | $106,734 | $110,393 |
| Commercial coffee | 6,441 | 4,986 | 17,921 | 13,871 |
| Total revenues | $44,395 | $43,562 | $124,655 | $124,264 |
| Gross profit | ||||
| Direct selling | $25,472 | $26,233 | $71,522 | $74,690 |
| Commercial coffee | 292 | 135 | 210 | 472 |
| Total gross profit | $25,764 | $26,368 | $71,732 | $75,162 |
| Operating income (loss) | ||||
| Direct selling | $(1,233) | $1,171 | $(2,392) | $4,903 |
| Commercial coffee | (584) | (595) | (2,501) | (1,640) |
| Total operating income | $(1,817) | $576 | $(4,893) | $3,263 |
| Net (loss) income | ||||
| Direct selling | $(1,311) | $822 | $(2,958) | $1,912 |
| Commercial coffee | 243 | (755) | (2,899) | (1,803) |
| Total net (loss) income | $(1,068) | $67 | $(5,857) | $109 |
| Capital expenditures | ||||
| Direct selling | $223 | $590 | $697 | $1,339 |
| Commercial coffee | 110 | 145 | 391 | 863 |
| Total capital expenditures | $333 | $735 | $1,088 | $2,202 |
As of | ||
September 30, 2017 | December 31, 2016 | |
| Total assets | ||
| Direct selling | $47,020 | $40,127 |
| Commercial coffee | 26,977 | 25,881 |
| Total assets | $73,997 | $66,008 |
Three months ended | Nine months ended | |||
September 30, | September 30, | |||
2017 | 2016 | 2017 | 2016 | |
| Revenues | ||||
| United States | $39,013 | $39,630 | $111,524 | $113,332 |
| International | 5,382 | 3,932 | 13,131 | 10,932 |
| Total revenues | $44,395 | $43,562 | $124,655 | $124,264 |
Youngevity International, Inc. and Subsidiaries | ||
Consolidated Balance Sheets | ||
(In thousands, except share amounts) | ||
As of | ||
December 31, 2016 | December 31, 2015 | |
| ASSETS | ||
| Current Assets | ||
| Cash and cash equivalents | $869 | $3,875 |
| Accounts receivable, due from factoring company | 1,078 | 556 |
| Trade accounts receivable, net | 1,071 | 1,068 |
| Income tax receivable | 311 | 173 |
| Deferred tax assets, net current | 565 | 711 |
| Inventory | 21,492 | 17,977 |
| Prepaid expenses and other current assets | 3,087 | 2,412 |
| Total current assets | 28,473 | 26,772 |
| Property and equipment, net | 14,006 | 12,699 |
| Deferred tax assets, long-term | 2,292 | 1,821 |
| Intangible assets, net | 14,914 | 13,714 |
| Goodwill | 6,323 | 6,323 |
| Total assets | $66,008 | $61,329 |
| LIABILITIES AND STOCKHOLDERS' EQUITY | ||
| Current Liabilities | ||
| Accounts payable | $8,174 | $7,015 |
| Accrued distributor compensation | 4,163 | 4,223 |
| Accrued expenses | 3,701 | 3,605 |
| Deferred revenues | 1,870 | 2,580 |
| Other current liabilities | 2,389 | 577 |
| Capital lease payable, current portion | 821 | 111 |
| Notes payable, current portion | 219 | 456 |
| Warrant derivative liability | 3,345 | 4,716 |
| Contingent acquisition debt, current portion | 628 | 264 |
| Total current liabilities | 25,310 | 23,547 |
| Capital lease payable, net of current portion | 1,569 | 294 |
| Notes payable, net of current portion | 4,431 | 4,647 |
| Convertible notes payable, net of debt discount | 8,327 | 6,786 |
| Contingent acquisition debt, net of current portion | 7,373 | 7,174 |
| Total liabilities | 47,010 | 42,448 |
| Commitments and contingencies, Note 9 | ||
| Stockholders’ Equity | ||
| Convertible Preferred Stock, $0.001 par value: 100,000,000 shares authorized; 161,135 shares issued and outstanding at December 31, 2016 and December 31, 2015 | - | - |
| Common Stock, $0.001 par value: 600,000,000 shares authorized; 392,698,557 and 392,583,015 shares issued and outstanding at December 31, 2016 and December 31, 2015, respectively | 393 | 393 |
| Additional paid-in capital | 169,839 | 169,432 |
| Accumulated deficit | (151,016) | (150,618) |
| Accumulated other comprehensive loss | (218) | (326) |
| Total stockholders’ equity | 18,998 | 18,881 |
Total Liabilities and Stockholders’ Equity | $66,008 | $61,329 |
Years Ended December 31, | ||
2016 | 2015 | |
| Revenues | $162,667 | $156,597 |
| Cost of revenues | 64,530 | 63,628 |
| Gross profit | 98,137 | 92,969 |
| Operating expenses | ||
| Distributor compensation | 67,148 | 63,276 |
| Sales and marketing | 10,413 | 8,212 |
| General and administrative | 18,061 | 16,075 |
| Total operating expenses | 95,622 | 87,563 |
| Operating income | 2,515 | 5,406 |
| Interest expense, net | (4,474) | (4,491) |
| Extinguishment loss on debt | - | (1,198) |
| Change in fair value of warrant derivative liability | 1,371 | (39) |
| Total other expense | (3,103) | (5,728) |
| Loss before income taxes | (588) | (322) |
| Income tax (benefit) provision | (190) | 1,384 |
| Net loss | (398) | (1,706) |
| Preferred stock dividends | (12) | (12) |
| Net loss available to common stockholders | $(410) | $(1,718) |
| Net loss per share, basic | $0.00 | $0.00 |
| Net loss per share, diluted | $0.00 | $0.00 |
| Weighted average shares outstanding, basic | 392,641,735 | 392,075,608 |
| Weighted average shares outstanding, diluted | 392,641,735 | 392,075,608 |
Years Ended December 31, | ||
2016 | 2015 | |
| Net loss | $(398) | $(1,706) |
| Foreign currency translation | 108 | (51) |
| Total other comprehensive income (loss) | 108 | (51) |
| Comprehensive loss | $(290) | $(1,757) |
Preferred Stock | Common Stock | Additional Paid-in | Accumulated Other Comprehensive | Accumulated | Total | |||
Shares | Amount | Shares | Amount | Capital | Income (loss) | Deficit | Equity | |
| Beginning Balance at December 31, 2014 | 161,135 | $- | 390,301,312 | $390 | $167,386 | $(275) | $(148,912) | $18,589 |
| Net loss | - | - | - | - | - | - | (1,706) | (1,706) |
| Foreign currency | ||||||||
| translation adjustment | - | - | - | - | - | (51) | - | (51) |
| Beneficial conversion feature of convertible notes payable, net of tax | - | - | - | - | 402 | - | - | 402 |
| Issuance of common stock pursuant to Notes Payable | - | - | 2,450,000 | 2 | 585 | - | - | 587 |
| Issuance of warrants pursuant to Convertible Notes Payable debt financing | - | - | - | - | 384 | - | - | 384 |
| Issuance of common stock pursuant to the exercise of warrants | - | - | 806,250 | 1 | 201 | - | - | 202 |
| Issuance of common stock pursuant to the exercise of stock options | - | - | 369,675 | - | 70 | - | - | 70 |
| Repurchase of common stock | - | - | (1,344,222) | - | (426) | - | - | (426) |
| Dividends on preferred stock | - | - | - | - | (12) | - | - | (12) |
| Warrant modification expense | - | - | - | - | 779 | - | - | 779 |
| Stock based compensation expense | - | - | - | - | 455 | - | - | 455 |
| Balance at December 31, 2015 | 161,135 | $- | 392,583,015 | $393 | $169,432 | $(326) | $(150,618) | $18,881 |
| Net loss | - | - | - | - | - | - | (398) | (398) |
Foreign currency translation adjustment | - | - | - | - | - | 108 | - | 108 |
| Issuance of common stock pursuant to the exercise of warrants | - | - | 39,250 | - | 10 | - | - | 10 |
| Issuance of common stock pursuant to the exercise of stock options | - | - | 102,000 | - | 20 | - | - | 20 |
| Issuance of common stock for services | - | - | 100,000 | - | 30 | - | - | 30 |
| Repurchase of common stock | - | - | (125,708) | - | (36) | - | - | (36) |
| Dividends on preferred stock | - | - | - | - | (12) | - | - | (12) |
| Stock based compensation expense | - | - | - | - | 395 | - | - | 395 |
| Balance at December 31, 2016 | 161,135 | $- | 392,698,557 | $393 | $169,839 | $(218) | $(151,016) | $18,998 |
Years Ended December 31, | ||
2016 | 2015 | |
| Cash Flows from Operating Activities: | (As Restated)* | |
| Net loss | $(398) | $(1,706) |
| Adjustments to reconcile net loss to net cash (used in) provided by operating activities: | ||
| Depreciation and amortization | 3,862 | 3,354 |
| Stock based compensation expense | 395 | 455 |
| Warrant modification expense | - | 253 |
| Amortization of deferred financing costs | 360 | 899 |
| Amortization of prepaid advisory fees | 58 | 20 |
| Stock issuance for services | 30 | - |
| Change in fair value of warrant derivative liability | (1,371) | 39 |
| Amortization of debt discount | 1,053 | 967 |
| Amortization of warrant issuance costs | 128 | 21 |
| Expenses allocated in profit sharing agreement | (698) | (528) |
| Change in fair value of contingent acquisition debt | (1,462) | (446) |
| Extinguishment loss on debt | - | 1,198 |
| Deferred income taxes | (325) | 1,409 |
| Changes in operating assets and liabilities, net of effect from business combinations: | ||
| Accounts receivable | (525) | 168 |
| Inventory | (3,515) | (6,194) |
| Prepaid expenses and other current assets | (733) | 885 |
| Accounts payable | 1,159 | 1,608 |
| Accrued distributor compensation | (60) | 46 |
| Deferred revenues | (710) | (2,495) |
| Accrued expenses and other liabilities | 1,063 | 1,278 |
| Income taxes receivable | (138) | 136 |
| Net Cash (Used In) Provided by Operating Activities | (1,827) | 1,367 |
| Cash Flows from Investing Activities: | ||
| Acquisitions, net of cash acquired | (48) | (32) |
| Purchases of property and equipment | (1,397) | (3,198) |
| Net Cash Used in Investing Activities | (1,445) | (3,230) |
| Cash Flows from Financing Activities: | ||
| Proceeds from issuance of secured promissory notes and common stock, net of offering costs | - | 5,080 |
| Proceeds from issuance of convertible notes payable, net | - | 2,383 |
| Proceeds from the exercise of stock options and warrants, net | 30 | 272 |
| Proceeds from factoring company | 833 | 82 |
| Payments of notes payable, net | (453) | (1,214) |
| Payments of contingent acquisition debt | (773) | (3,338) |
| Proceeds (payments) of capital leases | 557 | (47) |
| Repurchase of common stock | (36) | (426) |
| Net Cash Provided by Financing Activities | 158 | 2,792 |
| Foreign Currency Effect on Cash and Cash Equivalents | 108 | (51) |
| Net (decrease) increase in cash and cash equivalents | (3,006) | 878 |
| Cash and Cash Equivalents, Beginning of Period | 3,875 | 2,997 |
| Cash and Cash Equivalents, End of Period | $869 | $3,875 |
| Supplemental Disclosures of Cash Flow Information | ||
| Cash paid during the period for: | ||
| Interest | $2,966 | $2,127 |
| Income taxes | $181 | $- |
| Supplemental Disclosures of Noncash Investing and Financing Activities | ||
| Purchases of property and equipment funded by capital leases and accounts payable agreements | $1,582 | $429 |
| Common stock issued in connection with financing | $- | $587 |
| Acquisitions of net assets in exchange for contingent acquisition debt (see Note 2 for non-cash activity) | $3,604 | $1,136 |
December 31, | ||
2016 | 2015 | |
| Finished goods | $11,550 | $9,893 |
| Raw materials | 11,006 | 8,970 |
| Total inventory | 22,556 | 18,863 |
| Reserve for excess and obsolete | (1,064) | (886) |
| Inventory, net | $21,492 | $17,977 |
December 31, | ||
2016 | 2015 | |
| Balance as of December 31, 2015 | $(886) | $(478) |
| Addition to provision | (1,564) | (1,114) |
| Write-off of inventory | 1,386 | 706 |
| Balance as of December 31, 2016 | $(1,064) | $(886) |
December 31, | ||
2016 | 2015 | |
| Building | $3,873 | $2,930 |
| Leasehold improvements | 2,532 | 2,302 |
| Land | 2,544 | 2,544 |
| Land improvements | 602 | 602 |
| Producing coffee trees | 553 | 553 |
| Manufacturing equipment | 4,570 | 4,344 |
| Furniture and other equipment | 1,580 | 1,417 |
| Computer software | 1,236 | 1,100 |
| Computer equipment | 699 | 663 |
| Vehicles | 103 | 103 |
| Construction in process | 1,859 | 799 |
20,151 | 17,357 | |
| Accumulated depreciation | (6,145) | (4,658) |
| Total property and equipment | $14,006 | $12,699 |
December 31, 2016 | December 31, 2015 | |||||
Cost | Accumulated Amortization | Net | Cost | Accumulated Amortization | Net | |
| Distributor organizations | $12,930 | $7,162 | $5,768 | $11,173 | $6,086 | $5,087 |
| Trademarks and tradenames | 5,394 | 815 | 4,579 | 4,666 | 537 | 4,129 |
| Customer relationships | 7,846 | 3,642 | 4,204 | 6,787 | 2,751 | 4,036 |
| Internally developed software | 720 | 357 | 363 | 720 | 258 | 462 |
| Intangible assets | $26,890 | $11,976 | $14,914 | $23,346 | $9,632 | $13,714 |
| Years ending December 31, | ||||
| 2017 | $ | 2,471 | ||
| 2018 | 2,096 | |||
| 2019 | 1,502 | |||
| 2020 | 1,413 | |||
| 2021 | 1,336 | |||
Direct selling | Commercial coffee | Total | |
| Balance at December 31, 2014 | $3,009 | $3,314 | $6,323 |
| Goodwill recognized | - | - | - |
| Goodwill impaired | - | - | - |
| Balance at December 31, 2015 | $3,009 | $3,314 | $6,323 |
| Goodwill recognized | - | - | - |
| Goodwill impaired | - | - | - |
| Balance at December 31, 2016 | $3,009 | $3,314 | $6,323 |
| Cash paid for the equity in Legacy for Life Taiwan and Legacy for Life Limited (Hong Kong) | $26 |
| Cash paid for inventory | 195 |
| Total cash consideration | 221 |
| Trademarks and trade name | 185 |
| Customer-related intangible | 250 |
| Distributor organization | 390 |
| Total intangible assets acquired, non-cash | 825 |
| Total purchase price | $1,046 |
| Distributor organization | $825 |
| Customer-related intangible | 400 |
| Trademarks and trade name | 250 |
| Total purchase price | $1,475 |
| Distributor organization | $200 |
| Customer-related intangible | 155 |
| Trademarks and trade name | 110 |
| Total purchase price | $465 |
| Distributor organization | $396 |
| Customer-related intangible | 285 |
| Trademarks and trade name | 158 |
| Total purchase price | $839 |
| Distributor organization | $296 |
| Customer-related intangible | 169 |
| Trademarks and trade name | 127 |
| Total purchase price | $592 |
| Distributor organization | $68 |
| Customer-related intangible | 52 |
| Total purchase price | $120 |
| Distributor organization | $140 |
| Customer-related intangible | 110 |
| Trademarks and trade name | 60 |
| Initial cash payment | (25) |
| Total purchase price | $285 |
| Years ending December 31, | |
| 2017 | $220 |
| 2018 | 7,349 |
| 2019 | 4,891 |
| 2020 | 143 |
| 2021 | 108 |
| Thereafter | 3,877 |
| Total | $16,588 |
| Years ending December 31, | |
| 2017 | $984 |
| 2018 | 972 |
| 2019 | 604 |
| 2020 | 90 |
| 2021 | 28 |
| Total | 2,678 |
| Amount representing interest | (288) |
| Present value of minimum lease payments | 2,390 |
| Less current portion | (821) |
| Long term portion | $1,569 |
December 31, 2016 | December 31, 2015 | |
| 8% Convertible Notes due July and August 2019 (July 2014 Private Placement) (1) | $2,296 | $1,346 |
| 8% Convertible Notes due October and November 2018 (November 2015 Private Placement) (2) | 6,999 | 6,896 |
| Net debt issuance costs (3) | (968) | (1,456) |
| Total convertible notes payable, net of debt discount (4) | $8,327 | $6,786 |
| (1) | Principal amount of $4,750,000 are net of unamortized debt discounts of $2,454,000 as of December 31, 2016 and $3,404,000 as of December 31, 2015. |
| (2) | Principal amount of approximately $7,188,000 are net of unamortized debt discounts of $189,000 as of December 31, 2016 and $292,000 as of December 31, 2015. |
| (3) | As of January 1, 2016, we adopted ASU 2015-03 with retrospective application. This resulted in a $1,456,000 reclassification from prepaid expenses and other current assets to convertible notes payable, net of debt discount, for unamortized debt issuance costs. |
| (4) | Principal amounts are net of unamortized discounts and issuance costs of $3,611,000 as of December 31, 2016 and $5,152,000 as of December 31, 2015. |
December 31, 2016 | December 31, 2015 | |
| Stock price volatility | 60%-65% | 70% |
| Risk-free interest rates | 1.34%-1.70% | 1.76% |
| Annual dividend yield | 0% | 0% |
| Expected life | 2.6-3.9 years | 3.6-4.9 years |
Fair Value at December 31, 2016 | ||||
Total | Level 1 | Level 2 | Level 3 | |
| Liabilities: | ||||
| Contingent acquisition debt, current portion | $628 | $- | $- | $628 |
| Contingent acquisition debt, less current portion | 7,373 | - | - | 7,373 |
| Warrant derivative liability | 3,345 | - | - | 3,345 |
| Total liabilities | $11,346 | $- | $- | $11,346 |
Fair Value at December 31, 2015 | ||||
Total | Level 1 | Level 2 | Level 3 | |
| Liabilities: | ||||
| Contingent acquisition debt, current portion | $264 | $- | $- | $264 |
| Contingent acquisition debt, less current portion | 7,174 | - | - | 7,174 |
| Warrant derivative liability | 4,716 | - | - | 4,716 |
| Total liabilities | $12,154 | $- | $- | $12,154 |
Warrant Derivative Liability | |
| Balance at December 31, 2014 | $3,712 |
| Issuance | 1,491 |
| Adjustments to estimated fair value | 39 |
| Warrant liability reclassified to equity | (526) |
| Balance at December 31, 2015 | 4,716 |
| Issuance | - |
| Adjustments to estimated fair value | (1,371) |
| Balance at December 31, 2016 | $3,345 |
Contingent Consideration | |
| Balance at December 31, 2014 | $10,472 |
| Level 3 liabilities acquired | 1,353 |
| Level 3 liabilities settled | (3,338) |
| Adjustments to liabilities included in earnings | (446) |
| Expenses allocated to profit sharing agreement | (528) |
| Adjustment to purchase price allocation | (75) |
| Balance at December 31, 2015 | 7,438 |
| Level 3 liabilities acquired | 3,604 |
| Level 3 liabilities settled | (773) |
| Adjustments to liabilities included in earnings | (1,462) |
| Expenses allocated to profit sharing agreement | (698) |
| Adjustment to purchase price allocation | (108) |
| Balance at December 31, 2016 | $8,001 |
Balance at December 31, 2014 | 35,221,630 | |||
| Granted | 12,595,237 | |||
| Expired / cancelled | (5,335,821) | |||
| Exercised | (806,250) | |||
| Balance at December 31, 2015 | 41,674,796 | |||
| Granted | - | |||
| Expired / cancelled | (3,645,516) | |||
| Exercised | (41,250) | |||
| Balance at December 31, 2016 | 37,988,030 |
Number of Shares | Weighted Average Exercise Price | Aggregate Intrinsic Value (in thousands) | |
| Outstanding December 31, 2014 | 28,918,500 | $0.21 | $786 |
| Issued | 1,124,250 | 0.31 | |
| Canceled/expired | (6,151,475) | 0.22 | |
| Exercised | (369,675) | 0.21 | - |
| Outstanding December 31, 2015 | 23,521,600 | 0.22 | 2,044 |
| Issued | 12,792,250 | 0.27 | |
| Canceled / expired | (2,981,350) | 0.24 | |
| Exercised | (102,500) | 0.21 | - |
| Outstanding December 31, 2016 | 33,230,000 | $0.24 | $1,346 |
| Exercisable December 31, 2016 | 18,830,000 | $0.23 | $993 |
Number of Shares | Weighted Average Exercise Price | Aggregate Intrinsic Value (in thousands) | ||||||||||
Outstanding December 31, 2012 | 13,728,000 | $ | 0.22 | $ | 5 | |||||||
Granted | 4,072,500 | 0.20 | ||||||||||
Canceled/expired | (200,000 | ) | 0.22 | |||||||||
Exercised | (28,000 | ) | 0.21 | - | ||||||||
Outstanding December 31, 2013 | 17,572,500 | 0.22 | 478 | |||||||||
Granted | 11,517,250 | 0.22 | ||||||||||
Canceled / expired | (161,000 | ) | 0.19 | |||||||||
Exercised | (10,250 | ) | 0.23 | - | ||||||||
Outstanding December 31, 2014 | 28,918,500 | $ | 0.21 | $ | 786 | |||||||
Exercisable December 31, 2014 | 15,497,600 | $ | 0.22 | $ | 336 | |||||||
| Weighted | Weighted | Weighted | Weighted | Weighted | Weighted | |||||||||||||
| Average | Average | Average | Average | Average | Average | |||||||||||||
| Exercise Price | Exercise Price | Options | Exercise Price | Remaining Life | Exercise Price | Options | Exercise Price | Remaining Life | ||||||||||
| Outstanding: | Outstanding: | |||||||||||||||||
$ | 0.16 - $0.21 | 8,549,500 | $ | 0.19 | 8.50 | $0.16 - 0.21 | 6,852,500 | $0.19 | 7.02 | |||||||||
$ | 0.21 - $0.23 | 12,903,750 | $ | 0.22 | 6.76 | $0.21 - 0.23 | 11,245,000 | $0.22 | 5.28 | |||||||||
$ | 0.23 - $0.33 | 7,465,250 | $ | 0.24 | 7.04 | $0.23 - 0.35 | 14,917,750 | $0.27 | 7.81 | |||||||||
$ | $0.35 - 0.40 | 214,750 | $0.38 | 1.44 | ||||||||||||||
Exercisable: | Exercisable: | Exercisable: | ||||||||||||||||
$ | 0.16 - $0.21 | 1,616,100 | $ | 0.18 | 4.19 | $0.16 - 0.21 | 3,452,250 | $0.19 | 6.48 | |||||||||
$ | 0.21 - $0.23 | 11,416,250 | $ | 0.22 | 6.67 | $0.21 - 0.23 | 11,245,000 | $0.22 | 5.28 | |||||||||
$ | 0.23 - $0.33 | 2,465,250 | $ | 0.25 | 1.91 | $0.23 - 0.35 | 3,917,750 | $0.27 | 1.68 | |||||||||
$ | $0.35 - 0.40 | 214,750 | $0.38 | 1.44 | ||||||||||||||
| Years ended December 31, | Years ended December 31, | |||||||||
| 2014 | 2013 | 2016 | 2015 | |||||||
Cost of revenues | $ | 14 | $ | 17 | $10 | $17 | ||||
Distributor compensation | 195 | 140 | 215 | 158 | ||||||
Sales and marketing | 21 | 22 | 10 | 28 | ||||||
General and administrative | 304 | 669 | 160 | 252 | ||||||
$ | 534 | $ | 848 | $395 | $455 | |||||
| Years ended December 31, | Years ended December 31, | ||||||
| 2014 | 2013 | 2016 | 2015 | ||||
Dividend yield | - | - | - | - | |||
Stock price volatility | 75% - 98 | % | 98% - 118% | 57%- 90% | 66% - 77% | ||
Risk-free interest rate | 0.33% - 2.12 | % | 0.22% - 0.39% | 0.71% - 2.25% | 0.56%- 1.06% | ||
Expected life of options | 3.0 - 7.0 years | 1.5 - 5.0 years | 2.6 - 6.5 years | 1.5 - 5.0 years | |||
2015 | $ | 882 | ||
2016 | 806 | |||
2017 | 742 | |||
2018 | 551 | |||
2019 | 562 | |||
Thereafter | 3,740 | |||
Total | $ | 7,283 |
| December 31, | ||||||||
| 2014 | 2013 | |||||||
| Current | ||||||||
Federal | $ | 84 | $ | 73 | ||||
State | 111 | 397 | ||||||
Foreign | 98 | - | ||||||
Total current | 293 | 470 | ||||||
Deferred | ||||||||
Federal | $ | (4,106 | ) | $ | (16 | ) | ||
State | (558 | ) | (2 | ) | ||||
Foreign | - | - | ||||||
Total deferred | (4,664 | ) | (18 | ) | ||||
Total | $ | (4,371 | ) | $ | 452 | |||
| December 31, | ||||||||
| 2014 | 2013 | |||||||
Federal statutory rate | $ | 350 | $ | 1,086 | ||||
Adjustments for tax effects of: | ||||||||
Foreign rate differential | (30 | ) | (2 | ) | ||||
State taxes, net | (267 | ) | 207 | |||||
Other nondeductible items | 222 | 241 | ||||||
Rate change | (21 | ) | 210 | |||||
Deferred tax asset adjustment | (412 | ) | 319 | |||||
Change in valuation allowance | (4,213 | ) | (1,609 | ) | ||||
$ | (4,371 | ) | $ | 452 | ||||
| December 31, | ||||||||
| 2014 | 2013 | |||||||
| Deferred tax assets: | ||||||||
Amortizable assets | $ | 1,640 | $ | 704 | ||||
Inventory | 493 | 270 | ||||||
Accruals and reserves | 499 | 180 | ||||||
Stock options | 167 | 82 | ||||||
Net operating loss carry-forward | 3,112 | 4,610 | ||||||
Credit carry-forward | 731 | 214 | ||||||
Total Deferred Tax Asset | 6,642 | 6,060 | ||||||
Deferred tax liabilities: | ||||||||
Indefinite lived intangibles | (753 | ) | (723 | ) | ||||
Prepaids | (190 | ) | - | |||||
Other | (397 | ) | - | |||||
Depreciable assets | 195 | (291 | ) | |||||
(1,145 | ) | (1,014 | ) | |||||
Net deferred tax asset | 5,497 | 5,046 | ||||||
Less valuation allowance | (1,556 | ) | (5,769 | ) | ||||
Net deferred tax liabilities | $ | 3,941 | $ | (723 | ) | |||
December 31, 2016 | December 31, 2015 | |
| 8% Convertible Notes due July and August 2019 (July 2014 Private Placement) (1) | $2,296 | $1,346 |
| 8% Convertible Notes due October and November 2018 (November 2015 Private Placement) (2) | 6,999 | 6,896 |
| Net debt issuance costs (3) | (968) | (1,456) |
| Total convertible notes payable, net of debt discount (4) | $8,327 | $6,786 |
| (1) | Principal amount of $4,750,000 are net of unamortized debt discounts of $2,454,000 as of December 31, 2016 and $3,404,000 as of December 31, 2015. |
| (2) | Principal amount of approximately $7,188,000 are net of unamortized debt discounts of $189,000 as of December 31, 2016 and $292,000 as of December 31, 2015. |
| (3) | As of January 1, 2016, we adopted ASU 2015-03 with retrospective application. This resulted in a $1,456,000 reclassification from prepaid expenses and other current assets to convertible notes payable, net of debt discount, for unamortized debt issuance costs. |
| (4) | Principal amounts are net of unamortized discounts and issuance costs of $3,611,000 as of December 31, 2016 and $5,152,000 as of December 31, 2015. |
| Years ended December 31, | ||||||||
| 2014 | 2013 | |||||||
| Revenues | ||||||||
Direct selling | $ | 116,365 | $ | 76,843 | ||||
Commercial coffee | 17,678 | 8,784 | ||||||
Total revenues | $ | 134,043 | $ | 85,627 | ||||
Gross profit | ||||||||
Direct selling | $ | 76,530 | $ | 50,494 | ||||
Commercial coffee | (205 | ) | 807 | |||||
Total gross profit | $ | 76,325 | $ | 51,301 | ||||
Net income (loss) | ||||||||
Direct selling | $ | 5,274 | $ | 3,494 | ||||
Commercial coffee | 95 | (843 | ) | |||||
Total net income | $ | 5,369 | $ | 2,651 | ||||
Capital expenditures | ||||||||
Direct selling | $ | 1,140 | $ | 2,918 | ||||
Commercial coffee | 5,263 | 873 | ||||||
Total capital expenditures | $ | 6,403 | $ | 3,791 | ||||
December 31, | ||||||||
2014 | 2013 | |||||||
Total assets | ||||||||
Direct selling | $ | 36,149 | $ | 24,887 | ||||
Commercial coffee | 19,583 | 9,966 | ||||||
Total assets | $ | 55,732 | $ | 34,853 | ||||
| Years ended December 31, | ||||||||
| 2014 | 2013 | |||||||
United States | $ | 125,638 | $ | 79,497 | ||||
International | 8,405 | 6,130 | ||||||
Total revenues | $ | 134,043 | $ | 85,627 | ||||
| Youngevity International, Inc. and Subsidiaries | ||||||||
| Condensed Consolidated Balance Sheets | ||||||||
| (In thousands, except share amounts) | ||||||||
| As of | ||||||||
September 30, 2015 | December 31, 2014 | |||||||
| ASSETS | (Unaudited) | |||||||
| Current Assets | ||||||||
Cash and cash equivalents | $ | 1,980 | $ | 2,997 | ||||
Accounts receivable, due from factoring company | 399 | 827 | ||||||
Accounts receivable, trade | 1,262 | 965 | ||||||
Income tax receivable | 586 | 308 | ||||||
Deferred tax assets, net current | 801 | 801 | ||||||
Inventory | 17,521 | 11,783 | ||||||
Prepaid expenses and other current assets | 4,534 | 3,753 | ||||||
Total current assets | 27,083 | 21,434 | ||||||
Property and equipment, net | 12,306 | 10,319 | ||||||
Deferred tax assets, long-term | 3,140 | 3,140 | ||||||
Intangible assets, net | 14,323 | 14,516 | ||||||
Goodwill | 6,323 | 6,323 | ||||||
Total assets | $ | 63,175 | $ | 55,732 | ||||
LIABILITIES AND STOCKHOLDERS' EQUITY | ||||||||
Current Liabilities | ||||||||
Accounts payable | $ | 6,725 | $ | 5,407 | ||||
Accrued distributor compensation | 4,369 | 4,177 | ||||||
Accrued expenses | 3,507 | 2,332 | ||||||
Deferred revenues | 3,528 | 5,075 | ||||||
Other current liabilities | 382 | 477 | ||||||
Capital lease payable, current portion | 43 | 24 | ||||||
Notes payable, current portion | 5,477 | 228 | ||||||
Warrant derivative liability | 4,944 | 3,712 | ||||||
Contingent acquisition debt, current portion | 2,681 | 2,765 | ||||||
Total current liabilities | 31,656 | 24,197 | ||||||
Capital lease payable, net of current portion | 106 | 4 | ||||||
Notes payable, net of current portion | 4,677 | 4,839 | ||||||
Convertible notes payable, net of debt discount | 1,108 | 396 | ||||||
Contingent acquisition debt, net of current portion | 6,370 | 7,707 | ||||||
Total liabilities | 43,917 | 37,143 | ||||||
Commitments and contingencies | ||||||||
Stockholders’ Equity | ||||||||
Convertible Preferred Stock, $0.001 par value: 100,000,000 shares authorized; 161,135 shares issued and outstanding at September 30, 2015 and December 31, 2014 | - | - | ||||||
Common Stock, $0.001 par value: 600,000,000 shares authorized; 392,631,528 and 390,301,312 shares issued and outstanding at September 30, 2015 and December 31, 2014, respectively | 393 | 390 | ||||||
Additional paid-in capital | 168,527 | 167,386 | ||||||
Accumulated deficit | (149,273 | ) | (148,912 | ) | ||||
Accumulated other comprehensive loss | (389 | ) | (275 | ) | ||||
Total stockholders’ equity | 19,258 | 18,589 | ||||||
Total Liabilities and Stockholders’ Equity | $ | 63,175 | $ | 55,732 | ||||
Three Months Ended September 30, | Nine Months Ended September 30, | |||||||||||||||
| 2015 | 2014 | 2015 | 2014 | |||||||||||||
Revenues | $ | 41,326 | $ | 37,619 | $ | 116,876 | $ | 96,740 | ||||||||
Cost of revenues | 16,293 | 16,641 | 47,752 | 40,984 | ||||||||||||
Gross profit | 25,033 | 20,978 | 69,124 | 55,756 | ||||||||||||
Operating expenses | ||||||||||||||||
Distributor compensation | 17,387 | 14,470 | 47,261 | 38,172 | ||||||||||||
Sales and marketing | 2,374 | 2,167 | 6,087 | 5,434 | ||||||||||||
General and administrative | 4,215 | 3,103 | 12,056 | 8,712 | ||||||||||||
Total operating expenses | 23,976 | 19,740 | 65,404 | 52,318 | ||||||||||||
Operating income | 1,057 | 1,238 | 3,720 | 3,438 | ||||||||||||
Interest expense, net | (1,101 | ) | (710 | ) | (3,280 | ) | (1,593 | ) | ||||||||
Change in fair value of warrant derivative liability | 1,069 | (273 | ) | (1,232 | ) | (273 | ) | |||||||||
Total other expense | (32 | ) | (983 | ) | (4,512 | ) | (1,866 | ) | ||||||||
Net income (loss) before income taxes | 1,025 | 255 | (792 | ) | 1,572 | |||||||||||
Income tax provision (benefit) | 609 | 70 | (431 | ) | 416 | |||||||||||
Net income (loss) | 416 | 185 | (361 | ) | 1,156 | |||||||||||
Preferred stock dividends | (3 | ) | (4 | ) | (9 | ) | (12 | ) | ||||||||
Net income (loss) available to common stockholders | $ | 413 | $ | 181 | $ | (370 | ) | $ | 1,144 | |||||||
Net income (loss) per share, basic | $ | 0.00 | $ | 0.00 | $ | 0.00 | $ | 0.00 | ||||||||
Net income (loss)per share, diluted | $ | 0.00 | $ | 0.00 | $ | 0.00 | $ | 0.00 | ||||||||
Weighted average shares outstanding, basic | 392,430,816 | 390,219,932 | 391,903,256 | 389,235,633 | ||||||||||||
Weighted average shares outstanding, diluted | 404,529,270 | 392,139,155 | 391,903,256 | 389,839,584 | ||||||||||||
Three Months Ended September 30, | Nine Months Ended September 30, | |||||||||||||||
| 2015 | 2014 | 2015 | 2014 | |||||||||||||
Net income (loss) | $ | 416 | $ | 185 | $ | (361 | ) | $ | 1,156 | |||||||
Foreign currency translation | (33 | ) | (3 | ) | (114 | ) | (52 | ) | ||||||||
Total other comprehensive loss | (33 | ) | (3 | ) | (114 | ) | (52 | ) | ||||||||
Comprehensive income (loss) | $ | 383 | $ | 182 | $ | (475 | ) | $ | 1,104 | |||||||
Nine Months Ended September 30, | ||||||||
| 2015 | 2014 | |||||||
| Cash Flows from Operating Activities: | ||||||||
Net (loss) income | $ | (361 | ) | $ | 1,156 | |||
Adjustments to reconcile net (loss) income to net cash (used in) provided by operating activities: | ||||||||
Depreciation and amortization | 2,473 | 1,948 | ||||||
Stock based compensation expense | 436 | 387 | ||||||
Warrant modification expense | 253 | - | ||||||
Amortization of deferred financing costs | 639 | 16 | ||||||
Amortization of prepaid advisory fees | 5 | - | ||||||
Change in fair value of warrant derivative liability | 1,232 | 273 | ||||||
Amortization of debt discount | 712 | 190 | ||||||
Expenses allocated in profit sharing agreement | (349 | ) | - | |||||
Change in fair value of contingent acquisition debt | 120 | (429 | ) | |||||
Gain on disposal of assets | - | (1 | ) | |||||
Changes in operating assets and liabilities, net of effect from business combinations: | ||||||||
Accounts receivable | 131 | (53 | ) | |||||
Inventory | (5,738 | ) | (5,329 | ) | ||||
Prepaid expenses and other current assets | (668 | ) | (1,772 | ) | ||||
Accounts payable | 907 | 3,513 | ||||||
Accrued distributor compensation | 192 | 1,146 | ||||||
Deferred revenues | (1,547 | ) | 1,872 | |||||
Accrued expenses and other liabilities | 1,285 | 49 | ||||||
Income taxes receivable | (278 | ) | - | |||||
Net Cash (Used in) Provided by Operating Activities | (556 | ) | 2,966 | |||||
Cash Flows from Investing Activities: | ||||||||
Acquisitions, net of cash acquired | (32 | ) | (2,100 | ) | ||||
Purchases of property and equipment | (2,307 | ) | (2,120 | ) | ||||
Net Cash Used in Investing Activities | (2,339 | ) | (4,220 | ) | ||||
Cash Flows from Financing Activities: | ||||||||
Proceeds from issuance of secured promissory notes and common stock, net of offering costs | 5,080 | - | ||||||
Proceeds from issuance of convertible notes payable, net | - | 4,260 | ||||||
Proceeds from the exercise of stock options and warrants, net | 259 | 352 | ||||||
Payments to factoring company, net | (214 | ) | 2 | |||||
Payments of notes payable, net | (163 | ) | (172 | ) | ||||
Payments of contingent acquisition debt | (2,545 | ) | (1,637 | ) | ||||
Payments of capital leases | (43 | ) | (70 | ) | ||||
Repurchase of common stock | (382 | ) | (314 | ) | ||||
Net Cash Provided by Financing Activities | 1,992 | 2,421 | ||||||
Foreign Currency Effect on Cash | (114 | ) | (112 | ) | ||||
Net (decrease) increase in cash and cash equivalents | (1,017 | ) | 1,055 | |||||
Cash and Cash Equivalents, Beginning of Period | 2,997 | 4,320 | ||||||
Cash and Cash Equivalents, End of Period | $ | 1,980 | $ | 5,375 | ||||
Supplemental Disclosures of Cash Flow Information | ||||||||
Cash paid during the period for: | ||||||||
Interest | $ | 1,748 | $ | 1,640 | ||||
Income taxes | $ | - | $ | 594 | ||||
Supplemental Disclosures of Noncash Investing and Financing Activities | ||||||||
Acquisitions of net assets in exchange for contingent acquisition debt (see Note 4 for non-cash activity) | $ | 1,211 | $ | 5,532 | ||||
Common stock issued in connection with financing | $ | 587 | $ | - | ||||
Capital lease and accounts payable agreements for manufacturing equipment | $ | 564 | $ | - | ||||
December 31, 2016 | December 31, 2015 | |
| Stock price volatility | 60%-65% | 70% |
| Risk-free interest rates | 1.34%-1.70% | 1.76% |
| Annual dividend yield | 0% | 0% |
| Expected life | 2.6-3.9 years | 3.6-4.9 years |
Fair Value at December 31, 2016 | ||||
Total | Level 1 | Level 2 | Level 3 | |
| Liabilities: | ||||
| Contingent acquisition debt, current portion | $628 | $- | $- | $628 |
| Contingent acquisition debt, less current portion | 7,373 | - | - | 7,373 |
| Warrant derivative liability | 3,345 | - | - | 3,345 |
| Total liabilities | $11,346 | $- | $- | $11,346 |
Fair Value at December 31, 2015 | ||||
Total | Level 1 | Level 2 | Level 3 | |
| Liabilities: | ||||
| Contingent acquisition debt, current portion | $264 | $- | $- | $264 |
| Contingent acquisition debt, less current portion | 7,174 | - | - | 7,174 |
| Warrant derivative liability | 4,716 | - | - | 4,716 |
| Total liabilities | $12,154 | $- | $- | $12,154 |
Warrant Derivative Liability | |
| Balance at December 31, 2014 | $3,712 |
| Issuance | 1,491 |
| Adjustments to estimated fair value | 39 |
| Warrant liability reclassified to equity | (526) |
| Balance at December 31, 2015 | 4,716 |
| Issuance | - |
| Adjustments to estimated fair value | (1,371) |
| Balance at December 31, 2016 | $3,345 |
Contingent Consideration | |
| Balance at December 31, 2014 | $10,472 |
| Level 3 liabilities acquired | 1,353 |
| Level 3 liabilities settled | (3,338) |
| Adjustments to liabilities included in earnings | (446) |
| Expenses allocated to profit sharing agreement | (528) |
| Adjustment to purchase price allocation | (75) |
| Balance at December 31, 2015 | 7,438 |
| Level 3 liabilities acquired | 3,604 |
| Level 3 liabilities settled | (773) |
| Adjustments to liabilities included in earnings | (1,462) |
| Expenses allocated to profit sharing agreement | (698) |
| Adjustment to purchase price allocation | (108) |
| Balance at December 31, 2016 | $8,001 |
| Balance at December 31, 2014 | 35,221,630 |
| Granted | 12,595,237 |
| Expired / cancelled | (5,335,821) |
| Exercised | (806,250) |
| Balance at December 31, 2015 | 41,674,796 |
| Granted | - |
| Expired / cancelled | (3,645,516) |
| Exercised | (41,250) |
| Balance at December 31, 2016 | 37,988,030 |
Number of Shares | Weighted Average Exercise Price | Aggregate Intrinsic Value (in thousands) | |
| Outstanding December 31, 2014 | 28,918,500 | $0.21 | $786 |
| Issued | 1,124,250 | 0.31 | |
| Canceled/expired | (6,151,475) | 0.22 | |
| Exercised | (369,675) | 0.21 | - |
| Outstanding December 31, 2015 | 23,521,600 | 0.22 | 2,044 |
| Issued | 12,792,250 | 0.27 | |
| Canceled / expired | (2,981,350) | 0.24 | |
| Exercised | (102,500) | 0.21 | - |
| Outstanding December 31, 2016 | 33,230,000 | $0.24 | $1,346 |
| Exercisable December 31, 2016 | 18,830,000 | $0.23 | $993 |
Weighted | Weighted | Weighted | ||
Average | Average | Average | ||
Exercise Price | Options | Exercise Price | Remaining Life | |
| Outstanding: | ||||
$ | $0.16 - 0.21 | 6,852,500 | $0.19 | 7.02 |
$ | $0.21 - 0.23 | 11,245,000 | $0.22 | 5.28 |
$ | $0.23 - 0.35 | 14,917,750 | $0.27 | 7.81 |
$ | $0.35 - 0.40 | 214,750 | $0.38 | 1.44 |
Exercisable: | ||||
$ | $0.16 - 0.21 | 3,452,250 | $0.19 | 6.48 |
$ | $0.21 - 0.23 | 11,245,000 | $0.22 | 5.28 |
$ | $0.23 - 0.35 | 3,917,750 | $0.27 | 1.68 |
$ | $0.35 - 0.40 | 214,750 | $0.38 | 1.44 |
Years ended December 31, | ||
2016 | 2015 | |
| Cost of revenues | $10 | $17 |
| Distributor compensation | 215 | 158 |
| Sales and marketing | 10 | 28 |
| General and administrative | 160 | 252 |
$395 | $455 | |
Years ended December 31, | ||
2016 | 2015 | |
| Dividend yield | - | - |
| Stock price volatility | 57%- 90% | 66% - 77% |
| Risk-free interest rate | 0.71% - 2.25% | 0.56%- 1.06% |
| Expected life of options | 2.6 - 6.5 years | 1.5 - 5.0 years |
| As of | ||||||||
September 30, 2015 | December 31, 2014 | |||||||
Finished goods | $ | 9,714 | $ | 7,817 | ||||
Raw materials | 8,406 | 4,444 | ||||||
18,120 | 12,261 | |||||||
Reserve for excess and obsolete | (599 | ) | (478 | ) | ||||
Inventory, net | $ | 17,521 | $ | 11,783 | ||||
Distributor organization | $ | 350 | ||
Customer-related intangible | 200 | |||
Trademarks and trade name | 150 | |||
Total purchase price | $ | 700 |
Distributor organization | $ | 140 | ||
Customer-related intangible | 110 | |||
Trademarks and trade name | 60 | |||
Initial cash payment | (25 | ) | ||
Total purchase price | $ | 285 |
Distributor organization | $ | 110 | ||
Customer-related intangible | 85 | |||
Total purchase price | $ | 195 |
| September 30, 2015 | December 31, 2014 | |||||||||||||||||||||||
| Cost | Accumulated Amortization | Net | Cost | Accumulated Amortization | Net | |||||||||||||||||||
Distributor organizations | $ | 11,215 | $ | 5,843 | $ | 5,372 | $ | 10,475 | $ | 5,126 | $ | 5,349 | ||||||||||||
Trademarks and trade names | 4,666 | 477 | 4,189 | 4,441 | 304 | 4,137 | ||||||||||||||||||
Customer relationships | 6,820 | 2,546 | 4,274 | 6,400 | 1,932 | 4,468 | ||||||||||||||||||
Internally developed software | 720 | 232 | 488 | 720 | 158 | 562 | ||||||||||||||||||
Intangible assets | $ | 23,421 | $ | 9,098 | $ | 14,323 | $ | 22,036 | $ | 7,520 | $ | 14,516 | ||||||||||||
December 31, 2016 | December 31, 2015 | |
| 8% Convertible Notes due July and August 2019 (July 2014 Private Placement) (1) | $2,296 | $1,346 |
| 8% Convertible Notes due October and November 2018 (November 2015 Private Placement) (2) | 6,999 | 6,896 |
| Net debt issuance costs (3) | (968) | (1,456) |
| Total convertible notes payable, net of debt discount (4) | $8,327 | $6,786 |
| (1) | Principal amount of $4,750,000 are net of unamortized debt discounts of $2,454,000 as of December 31, 2016 and $3,404,000 as of December 31, 2015. |
| (2) | Principal amount of approximately $7,188,000 are net of unamortized debt discounts of $189,000 as of December 31, 2016 and $292,000 as of December 31, 2015. |
| (3) | As of January 1, 2016, we adopted ASU 2015-03 with retrospective application. This resulted in a $1,456,000 reclassification from prepaid expenses and other current assets to convertible notes payable, net of debt discount, for unamortized debt issuance costs. |
| (4) | Principal amounts are net of unamortized discounts and issuance costs of $3,611,000 as of December 31, 2016 and $5,152,000 as of December 31, 2015. |
| September 30, 2015 | December 31, 2014 | |||||||
Convertible notes | $ | 4,750 | $ | 4,750 | ||||
Less: detachable warrants discount | (3,697 | ) | (3,697 | ) | ||||
Less: conversion feature discount | (1,053 | ) | (1,053 | ) | ||||
Amortization of debt discounts | 1,108 | 396 | ||||||
Convertible notes, net of discounts | $ | 1,108 | $ | 396 | ||||
| Closing Dates: | Issued Warrants | Estimated Total Fair Value in Aggregate $ as of September 30, 2015 | Estimated Total Fair Value in Aggregate $ as of December 31, 2014 | |||||||||
July 31, 2014 Warrants | 19,966,768 | $ | 4,527,000 | $ | 3,398,000 | |||||||
August 14, 2014 Warrants | 1,721,273 | 390,000 | 294,000 | |||||||||
September 10, 2014 Warrants | 114,752 | 27,000 | 20,000 | |||||||||
21,802,793 | $ | 4,944,000 | $ | 3,712,000 | ||||||||
September 30, 2015 | December 31, 2014 | December 31, 2016 | December 31, 2015 | |||||||
Stock price volatility | 86 | % | 90 | % | 60%-65% | 70% | ||||
Risk-free interest rates | 1.15 | % | 1.65 | % | 1.34%-1.70% | 1.76% | ||||
Annual dividend yield | 0 | % | 0 | % | 0% | |||||
Expected life | 3.7-3.8 years | 4.6-4.7 years | 2.6-3.9 years | 3.6-4.9 years | ||||||
| Fair Value at September 30, 2015 | Fair Value at December 31, 2016 | |||||||||||||||||||
| Total | Level 1 | Level 2 | Level 3 | Total | Level 1 | Level 2 | Level 3 | |||||||||||||
| Liabilities: | ||||||||||||||||||||
Contingent acquisition debt, current portion | $ | 2,681 | $ | - | $ | - | $ | 2,681 | $628 | $- | $628 | |||||||||
Contingent acquisition debt, less current portion | 6,370 | - | - | 6,370 | 7,373 | - | 7,373 | |||||||||||||
Warrant derivative liability | 4,944 | - | - | 4,494 | 3,345 | - | 3,345 | |||||||||||||
Total liabilities | $ | 13,995 | $ | - | $ | - | $ | 13,995 | $11,346 | $- | $11,346 | |||||||||
| Fair Value at December 31, 2014 | Fair Value at December 31, 2015 | |||||||||||||||||||
| Total | Level 1 | Level 2 | Level 3 | Total | Level 1 | Level 2 | Level 3 | |||||||||||||
| Liabilities: | ||||||||||||||||||||
Contingent acquisition debt, current portion | $ | 2,765 | $ | - | $ | - | $ | 2,765 | $264 | $- | $264 | |||||||||
Contingent acquisition debt, less current portion | 7,707 | - | - | 7,707 | 7,174 | - | 7,174 | |||||||||||||
Warrant derivative liability | 3,712 | - | - | 3,712 | 4,716 | - | 4,716 | |||||||||||||
Total liabilities | $ | 14,184 | $ | - | $ | - | $ | 14,184 | $12,154 | $- | $12,154 | |||||||||
Warrant Derivative Liability | |
| Balance at December 31, 2014 | $3,712 |
| Issuance | 1,491 |
| Adjustments to estimated fair value | 39 |
| Warrant liability reclassified to equity | (526) |
| Balance at December 31, 2015 | 4,716 |
| Issuance | - |
| Adjustments to estimated fair value | (1,371) |
| Balance at December 31, 2016 | $3,345 |
Contingent Consideration | |
| Balance at December 31, 2014 | $10,472 |
| Level 3 liabilities acquired | 1,353 |
| Level 3 liabilities settled | (3,338) |
| Adjustments to liabilities included in earnings | (446) |
| Expenses allocated to profit sharing agreement | (528) |
| Adjustment to purchase price allocation | (75) |
| Balance at December 31, 2015 | 7,438 |
| Level 3 liabilities acquired | 3,604 |
| Level 3 liabilities settled | (773) |
| Adjustments to liabilities included in earnings | (1,462) |
| Expenses allocated to profit sharing agreement | (698) |
| Adjustment to purchase price allocation | (108) |
| Balance at December 31, 2016 | $8,001 |
Number of Shares | Weighted Average Exercise Price | Aggregate Intrinsic Value (in thousands) | ||||||||||
Outstanding December 31, 2014 | 28,918,500 | $ | 0.21 | $ | 786 | |||||||
Granted | 917,500 | 0.31 | ||||||||||
Canceled/expired | (1,344,675 | ) | 0.22 | |||||||||
Exercised | (273,675 | ) | 0.21 | - | ||||||||
Outstanding September 30, 2015 | 28,217,650 | $ | 0.22 | $ | 3,199 | |||||||
Exercisable September 30, 2015 | 17,070,450 | $ | 0.23 | $ | 1,785 | |||||||
| Balance at December 31, 2014 | 35,221,630 |
| Granted | 12,595,237 |
| Expired / cancelled | (5,335,821) |
| Exercised | (806,250) |
| Balance at December 31, 2015 | 41,674,796 |
| Granted | - |
| Expired / cancelled | (3,645,516) |
| Exercised | (41,250) |
| Balance at December 31, 2016 | 37,988,030 |
Number of Shares | Weighted Average Exercise Price | Aggregate Intrinsic Value (in thousands) | |
| Outstanding December 31, 2014 | 28,918,500 | $0.21 | $786 |
| Issued | 1,124,250 | 0.31 | |
| Canceled/expired | (6,151,475) | 0.22 | |
| Exercised | (369,675) | 0.21 | - |
| Outstanding December 31, 2015 | 23,521,600 | 0.22 | 2,044 |
| Issued | 12,792,250 | 0.27 | |
| Canceled / expired | (2,981,350) | 0.24 | |
| Exercised | (102,500) | 0.21 | - |
| Outstanding December 31, 2016 | 33,230,000 | $0.24 | $1,346 |
| Exercisable December 31, 2016 | 18,830,000 | $0.23 | $993 |
Weighted | Weighted | Weighted | ||
Average | Average | Average | ||
Exercise Price | Options | Exercise Price | Remaining Life | |
| Outstanding: | ||||
$ | $0.16 - 0.21 | 6,852,500 | $0.19 | 7.02 |
$ | $0.21 - 0.23 | 11,245,000 | $0.22 | 5.28 |
$ | $0.23 - 0.35 | 14,917,750 | $0.27 | 7.81 |
$ | $0.35 - 0.40 | 214,750 | $0.38 | 1.44 |
Exercisable: | ||||
$ | $0.16 - 0.21 | 3,452,250 | $0.19 | 6.48 |
$ | $0.21 - 0.23 | 11,245,000 | $0.22 | 5.28 |
$ | $0.23 - 0.35 | 3,917,750 | $0.27 | 1.68 |
$ | $0.35 - 0.40 | 214,750 | $0.38 | 1.44 |
Years ended December 31, | ||
2016 | 2015 | |
| Cost of revenues | $10 | $17 |
| Distributor compensation | 215 | 158 |
| Sales and marketing | 10 | 28 |
| General and administrative | 160 | 252 |
$395 | $455 | |
Years ended December 31, | ||
2016 | 2015 | |
| Dividend yield | - | - |
| Stock price volatility | 57%- 90% | 66% - 77% |
| Risk-free interest rate | 0.71% - 2.25% | 0.56%- 1.06% |
| Expected life of options | 2.6 - 6.5 years | 1.5 - 5.0 years |
| 2017 | $1,138 |
| 2018 | 930 |
| 2019 | 634 |
| 2020 | 557 |
| 2021 | 571 |
| Thereafter | 748 |
| Total | $4,578 |
December 31, | ||
2016 | 2015 | |
| Current | ||
| Federal | $3 | $66 |
| State | (18) | (161) |
| Foreign | 150 | 76 |
| Total current | 135 | (19) |
| Deferred | ||
| Federal | $(304) | $1,307 |
| State | (21) | 96 |
| Foreign | - | - |
| Total deferred | (325) | 1,403 |
| Net income tax (benefit) expense | $(190) | $1,384 |
December 31, | ||
2016 | 2015 | |
| Federal statutory rate | $(206) | $(113) |
| Adjustments for tax effects of: | ||
| Foreign rate differential | (35) | 26 |
| State taxes, net | (112) | (241) |
| Other nondeductible items | (50) | 1,162 |
| Change in foreign entity tax status | (77) | - |
| Rate change | 6 | 91 |
| Deferred tax asset adjustment | (201) | 101 |
| Change in valuation allowance | 183 | 161 |
| Foreign tax credit | 275 | - |
| Undistributed foreign earnings | 17 | 197 |
| Other | 10 | - |
$(190) | $1,384 | |
December 31, | ||
2016 | 2015 | |
| Deferred tax assets: | ||
| Amortizable assets | $1,117 | $1,146 |
| Inventory | 726 | 608 |
| Accruals and reserves | 222 | 174 |
| Stock options | 285 | 217 |
| Net operating loss carry-forward | 3,554 | 2,387 |
| Credit carry-forward | 309 | 581 |
| Total deferred tax asset | 6,213 | 5,113 |
| Deferred tax liabilities: | ||
| Prepaids | (383) | (71) |
| Other | (608) | (521) |
| Depreciable assets | (464) | (270) |
| Total deferred tax liability | (1,455) | (862) |
| Net deferred tax asset | 4,758 | 4,250 |
| Less valuation allowance | (1,901) | (1,718) |
| Net deferred tax liabilities | $2,857 | $2,532 |
Years ended | ||
December 31, | ||
2016 | 2015 | |
| Revenues | ||
| Direct selling | $145,418 | $138,927 |
| Commercial coffee | 17,249 | 17,670 |
| Total revenues | $162,667 | $156,597 |
| Gross profit | ||
| Direct selling | $97,219 | $93,613 |
| Commercial coffee | 918 | (644) |
| Total gross profit | $98,137 | $92,969 |
| Operating income (loss) | ||
| Direct selling | $4,564 | $8,594 |
| Commercial coffee | (2,049) | (3,188) |
| Total operating income | $2,515 | $5,406 |
| Net income (loss) | ||
| Direct selling | $1,894 | $3,144 |
| Commercial coffee | (2,292) | (4,850) |
| Total net loss | $(398) | $(1,706) |
| Capital expenditures | ||
| Direct selling | $1,922 | $1,396 |
| Commercial coffee | 903 | 2,223 |
| Total capital expenditures | $2,825 | $3,619 |
December 31, | ||
2016 | 2015 | |
| Total assets | ||
| Direct selling | $40,127 | $36,907 |
| Commercial coffee | 25,881 | 24,422 |
| Total assets | $66,008 | $61,329 |
| Three months ended | Nine months ended | |||||||||||||||
| September 30, | September 30, | |||||||||||||||
| 2015 | 2014 | 2015 | 2014 | |||||||||||||
| Revenues | ||||||||||||||||
Direct selling | $ | 37,056 | $ | 31,275 | $ | 103,206 | $ | 84,063 | ||||||||
Commercial coffee | 4,270 | 6,344 | 13,670 | 12,677 | ||||||||||||
Total revenues | $ | 41,326 | $ | 37,619 | $ | 116,876 | $ | 96,740 | ||||||||
Gross profit | ||||||||||||||||
Direct selling | $ | 25,395 | $ | 20,899 | $ | 69,872 | $ | 55,674 | ||||||||
Commercial coffee | (362 | ) | 79 | (748 | ) | 82 | ||||||||||
Total gross margin | $ | 25,033 | $ | 20,978 | $ | 69,124 | $ | 55,756 | ||||||||
Net income (loss) | ||||||||||||||||
Direct selling | $ | 986 | $ | 668 | $ | 3,329 | $ | 2,740 | ||||||||
Commercial coffee | (570 | ) | (483 | ) | (3,690 | ) | (1,584 | ) | ||||||||
Total net income (loss) | $ | 416 | $ | 185 | $ | (361 | ) | $ | 1,156 | |||||||
Capital expenditures | ||||||||||||||||
Direct selling | $ | 477 | $ | 344 | $ | 1,326 | $ | 680 | ||||||||
Commercial coffee | 302 | 528 | 1,556 | 4,806 | ||||||||||||
Total capital expenditures | $ | 779 | $ | 872 | $ | 2,882 | $ | 5,486 | ||||||||
| As of | ||||||||
September 30, 2015 | December 31, 2014 | |||||||
| Total assets | ||||||||
Direct selling | $ | 40,354 | $ | 36,149 | ||||
Commercial coffee | 22,821 | 19,583 | ||||||
Total assets | $ | 63,175 | $ | 55,732 | ||||
| Three months ended | Nine months ended | Years ended | ||||||||||||||||
| September 30, | September 30, | December 31, | ||||||||||||||||
| 2015 | 2014 | 2015 | 2014 | 2016 | 2015 | |||||||||||||
| Revenues | ||||||||||||||||||
United States | $ | 38,351 | $ | 35,296 | $ | 108,306 | $ | 90,927 | $147,548 | $145,259 | ||||||||
International | 2,975 | 2,323 | 8,570 | 5,813 | 15,119 | 11,338 | ||||||||||||
Total revenues | $ | 41,326 | $ | 37,619 | $ | 116,876 | $ | 96,740 | $162,667 | $156,597 | ||||||||
Youngevity International, Inc. and Subsidiaries | ||||||
Consolidated Statement of Cash Flows | ||||||
| (In thousands) | ||||||
Year Ended December 31, 2016 | |||
Previously Reported | Adjustment | As Restated | |
Cash Flows from Operating Activities: | |||
Net Loss | $ (398) | $ - | $ (398) |
Adjustments to reconcile net loss to net cash used in operating activities: | |||
Depreciation and amortization | 3,862 | - | 3,862 |
Stock based compensation expense | 395 | - | 395 |
Amortization of deferred financing costs | 360 | - | 360 |
Amortization of prepaid advisory fees | 58 | - | 58 |
Stock issuance for services | 30 | - | 30 |
Change in fair value of warrant derivative liability | (1,371) | - | (1,371) |
Amortization of debt discount | 1,053 | - | 1,053 |
Amortization of warrant issuance costs | 128 | - | 128 |
Expenses allocated in profit sharing agreement | (698) | - | (698) |
Change in fair value of contingent acquisition debt | (1,462) | - | (1,462) |
Deferred income taxes | (325) | - | (325) |
Changes in operating assets and liabilities, net of effect from business combinations: | |||
Accounts receivable | (525) | - | (525) |
Inventory | (3,515) | - | (3,515) |
Prepaid expenses and other current assets | (733) | - | (733) |
Accounts payable | 1,159 | - | 1,159 |
Accrued distributor compensation | (60) | - | (60) |
Deferred revenues | (710) | - | (710) |
Accrued expenses and other liabilities | 2,729 | (1,666) | 1,063 |
Income taxes receivable | (138) | - | (138) |
Net Cash Used in Operating Activities | (161) | (1,666) | (1,827) |
Cash Flows from Investing Activities: | |||
Acquisitions, net of cash acquired | (48) | - | (48) |
Purchases of property and equipment | (1,397) | - | (1,397) |
Net Cash Used in Investing Activities | (1,445) | - | (1,445) |
Cash Flows from Financing Activities: | |||
Proceeds from the exercise of stock options and warrants, net | 30 | - | 30 |
Proceeds (Payments) from/to factoring company, net | (833) | 1,666 | 833 |
Payments of notes payable, net | (453) | - | (453) |
Payments of contingent acquisition debt | (773) | - | (773) |
Proceeds of capital leases | 557 | - | 557 |
Repurchase of common stock | (36) | - | (36) |
Net Cash (Used in) Provided by Financing Activities | (1,508) | 1,666 | 158 |
Foreign Currency Effect on Cash | 108 | - | 108 |
Net decrease in cash and cash equivalents | (3,006) | - | (3,006) |
Cash and Cash Equivalents, Beginning of Period | 3,875 | - | 3,875 |
Cash and Cash Equivalents, End of Period | $ 869 | $ - | $ 869 |
Youngevity International, Inc. and Subsidiaries | ||||||
Condensed Consolidated Statement of Cash Flows | ||||||
(In thousands) | ||||||
| (Unaudited) |
Three Months Ended March 31, 2016 | |||
Previously Reported | Adjustment | As Restated | |
| Cash Flows from Operating Activities: | |||
| Net income | $ 151 | $ - | $ 151 |
Adjustments to reconcile net income to net cash provided by operating activities: | |||
| Depreciation and amortization | 1,003 | - | 1,003 |
| Stock based compensation expense | 70 | - | 70 |
| Amortization of deferred financing costs | 90 | - | 90 |
| Amortization of prepaid advisory fees | 15 | - | 15 |
| Change in fair value of warrant derivative liability | (650) | - | (650) |
| Amortization of debt discount | 264 | - | 264 |
| Amortization of warrant issuance costs | 32 | - | 32 |
| Expenses allocated in profit sharing agreement | (147) | - | (147) |
| Change in fair value of contingent acquisition debt | (391) | - | (391) |
Changes in operating assets and liabilities, net of effect from business combinations: | - | ||
| Accounts receivable | 281 | - | 281 |
| Inventory | (1,997) | - | (1,997) |
| Prepaid expenses and other current assets | (835) | - | (835) |
| Accounts payable | 1,183 | - | 1,183 |
| Accrued distributor compensation | 704 | - | 704 |
| Deferred revenues | (155) | - | (155) |
| Accrued expenses and other liabilities | 250 | 420 | 670 |
Income taxes receivable | 173 | - | 173 |
| Net Cash Provided by Operating Activities | 41 | 420 | 461 |
| Cash Flows from Investing Activities: | |||
| Purchases of property and equipment | (611) | - | (611) |
| Net Cash Used in Investing Activities | (611) | (611) | |
| Cash Flows from Financing Activities: | |||
| Proceeds (Payments) from/to factoring company, net | 210 | (420) | (210) |
| Payments of notes payable, net | (306) | - | (306) |
| Payments of contingent acquisition debt | (328) | - | (328) |
| Payments of capital leases | (41) | - | (41) |
| Repurchase of common stock | (4) | - | (4) |
| Net Cash Used in Financing Activities | (469) | (420) | (889) |
| Foreign Currency Effect on Cash | (109) | - | (109) |
| Net decrease in cash and cash equivalents | (1,148) | - | (1,148) |
| Cash and Cash Equivalents, Beginning of Period | 3,875 | - | 3,875 |
| Cash and Cash Equivalents, End of Period | $ 2,727 | $- | $ 2,727 |
Youngevity International, Inc. and Subsidiaries | ||||||
Condensed Consolidated Statement of Cash Flows | ||||||
| (In thousands) | ||||||
| (Unaudited) |
Six Months Ended June 30, 2016 | |||
Previously Reported | Adjustment | As Restated | |
| Cash Flows from Operating Activities: | |||
| Net income | $ 42 | $ - | $ 42 |
Adjustments to reconcile net income to net cash provided by (used in) operating activities: | |||
| Depreciation and amortization | 1,987 | - | 1,987 |
| Stock based compensation expense | 126 | - | 126 |
| Amortization of deferred financing costs | 180 | - | 180 |
| Amortization of prepaid advisory fees | 31 | - | 31 |
| Stock issuance for services | 30 | - | 30 |
| Change in fair value of warrant derivative liability | (166) | - | (166) |
| Amortization of debt discount | 527 | - | 527 |
| Amortization of warrant issuance costs | 64 | - | 64 |
| Expenses allocated in profit sharing agreement | (382) | - | (382) |
| Change in fair value of contingent acquisition debt | (871) | - | (871) |
Changes in operating assets and liabilities, net of effect from business combinations: | - | ||
| Accounts receivable | (391) | (391) | |
| Inventory | (2,301) | - | (2,301) |
| Prepaid expenses and other current assets | (67) | - | (67) |
| Accounts payable | 458 | - | 458 |
| Accrued distributor compensation | 738 | - | 738 |
| Deferred revenues | (465) | - | (465) |
| Accrued expenses and other liabilities | 635 | (1,662) | (1,027) |
| Income taxes receivable | 173 | - | 173 |
| Net Cash Provided by (Used in) Operating Activities | 348 | (1,662 ) | (1,314) |
| Cash Flows from Investing Activities: | |||
| Purchases of property and equipment | (461) | - | (461) |
| Net Cash Used in Investing Activities | (461) | - | (461) |
| Cash Flows from Financing Activities: | |||
| Proceeds from the exercise of stock options and warrants, net | 12 | - | 12 |
| Proceeds (Payments) from/to factoring company, net | (831) | 1,662 | 831 |
| Payments of notes payable, net | (358) | - | (358) |
| Payments of contingent acquisition debt | (462) | - | (462) |
| Proceeds of capital leases | (132) | - | (132) |
Repurchase of common stock | (20) | - | (20) |
| Net Cash Used in Financing Activities | (1,791) | 1,662 | (129) |
| Foreign Currency Effect on Cash | (146) | - | (146) |
| Net decrease in cash and cash equivalents | (2,050) | - | (2,050) |
| Cash and Cash Equivalents, Beginning of Period | 3,875 | - | 3,875 |
| Cash and Cash Equivalents, End of Period | $ 1,825 | $- | $ 1,825 |
Youngevity International, Inc. and Subsidiaries | ||||||
Condensed Consolidated Statement of Cash Flows | ||||||
| (In thousands) | ||||||
| (Unaudited) |
Nine Months Ended September 30, 2016 | |||
Previously Reported | Adjustment | As Restated | |
| Cash Flows from Operating Activities: | |||
| Net income | $ 109 | $ - | $ 109 |
Adjustments to reconcile net income to net cash provided by (used in) operating activities: | |||
| Depreciation and amortization | 2,865 | - | 2,865 |
| Stock based compensation expense | 292 | - | 292 |
| Amortization of deferred financing costs | 270 | - | 270 |
| Amortization of prepaid advisory fees | 46 | - | 46 |
| Stock issuance for services | 30 | - | 30 |
| Change in fair value of warrant derivative liability | (535) | - | (535) |
| Amortization of debt discount | 790 | - | 790 |
| Amortization of warrant issuance costs | 96 | - | 96 |
| Expenses allocated in profit sharing agreement | (557) | - | (557) |
| Change in fair value of contingent acquisition debt | (1,185) | - | (1,185) |
Changes in operating assets and liabilities, net of effect from business combinations:- | - | ||
| Accounts receivable | (1,411) | - | (1,411) |
| Inventory | (1,925) | - | (1,925) |
| Prepaid expenses and other current assets | (502) | - | (502) |
| Accounts -payable | 293 | - | 293 |
| Accrued distributor compensation | 401 | - | 401 |
| Deferred revenues | (652) | - | (652) |
| Accrued expenses and other liabilities | 2,967 | (2,262) | 705 |
Income taxes receivable | 173 | - | 173 |
| Net Cash Provided by (Used in) Operating Activities | 1,565 | (2,262) | (697) |
| Cash Flows from Investing Activities: | |||
| Acquisitions, net of cash acquired | (88) | - | (88) |
| Purchases of property and equipment | (938) | - | (938) |
| Net Cash Used in Investing Activities | (1,026) | - | (1,026) |
| Cash Flows from Financing Activities: | |||
| Proceeds from the exercise of stock options and warrants, net | 39 | - | 39 |
| Proceeds (Payments) from/to factoring company, net | (1,131) | 2,262 | 1,131 |
| Payments of notes payable, net | (411) | - | (411) |
| Payments of contingent acquisition debt | (708) | - | (708) |
| Payments of capital leases | 19 | - | 19 |
| Repurchase of common stock | (36) | - | (36) |
| Net Cash (Used in) Provided by Financing Activities | (2,228) | 2,262 | 34 |
| Foreign Currency Effect on Cash | (174) | - | (174) |
| Net decrease in cash and cash equivalents | (1,863) | - | (1,863) |
| Cash and Cash Equivalents, Beginning of Period | 3,875 | - | 3,875 |
| Cash and Cash Equivalents, End of Period | $ 2,012 | $- | $ 2,012 |

| SEC registration fee | $1,320 |
| Accounting fees and expenses | 50,000 |
| Legal fees and expenses | 150,000 |
| Transfer agent fees and expenses | 5,000 |
| Miscellaneous including merchandise credit | 393,680 |
| Total | $600,000 |
SEC registration fee | $ | 934.16 | ||
Accounting fees and expenses | 5,000 | |||
Legal fees and expenses | 15,000 | |||
Transfer agent fees and expenses | 1,000 | |||
Miscellaneous | 565.84 | |||
Total | $ | 22,500 |
| Exhibit No. | Title of Document | |
| Form of Selling Agent Agreement* | ||
| Form of Selling Agent Agreement (Amendment)* | ||
| Certificate of Incorporation Dated July 15, | ||
| Certificate of Amendment to the Certificate of Incorporation dated June 5, 2017 (Incorporated by reference to the Company’s Form 8-K, File No. 000-54900, filed with the Securities and Exchange Commission on June 7, 2017) | ||
| Certificate of Designations for Series B Convertible Preferred Stock* | ||
| Specimen Common Stock certificate | ||
| Warrant for Common Stock issued to David | ||
| Stock Option issued to Stephan | ||
| Stock Option issued to Michelle | ||
| Stock Option issued to David | ||
| Stock Option issued to William | ||
| Stock Option issued to Richard | ||
Stock Option issued to John File No. 000-54900, Filed with the Securities and Exchange Commission on February 12, 2013) | ||
| Form of Purchase Note Agreement | ||
| Form of Secured Convertible Notes (Incorporated by reference to the Company’s 8-K, File No. 000-54900, filed with the Securities and Exchange Commission on August 5, 2014) | ||
| Form of Series A Warrants (Incorporated by reference to the Company’s 8-K, File No. 000-54900, filed with the Securities and Exchange Commission on August 5, 2014) | ||
| Form of Registration Rights Agreement (Incorporated by reference to the Company’s 8-K, File No. 000-54900, filed with the Securities and Exchange Commission on August 5, 2014) | ||
| Form of Note Purchase Agreement (Incorporated by reference to the Company’s 8-K, File No. 000-54900, filed with the Securities and Exchange Commission on January 7, 2015) | ||
| Form of Secured Note | ||
| Form of Purchase Note Agreement (Incorporated by reference to the Company’s 8-K, File No. 000-54900, filed with the Securities and Exchange Commission on October 16, 2015) | ||
| Form of Secured Note (Incorporated by reference to the Company’s 8-K, File No. 000-54900, filed with the Securities and Exchange Commission on October 16, 2015) | ||
| Form of Warrant | ||
| Form of Notice of Award of Restricted Stock Units (Incorporated by reference to the Company’s Form S-8 Registration Statement, File No. 333-219027 filed with the Securities and Exchange Commission on June 29, 2017) | ||
| Form of Restricted Stock Unit Award Agreement (Incorporated by reference to the Company’s Form S-8 Registration Statement, File No. 333-219027 filed with the Securities and Exchange Commission on June 29, 2017) | ||
| Form of Note Purchase Agreement (Incorporated by reference to the Company’s Current Report on Form 8-K, File No. 000-54900, filed with the Securities and Exchange Commission on August 3, 2017) | ||
| Form of Convertible Note (Incorporated by reference to the Company’s Current Report on Form 8-K, File No. 000-54900, filed with the Securities and Exchange Commission on August 3, 2017) | ||
| Form of Series D Warrant (Incorporated by reference to the Company’s Current Report on Form 8-K, File No. 000-54900, filed with the Securities and Exchange Commission on August 3, 2017) | ||
| Form of Selling Agent’s Warrant* | ||
| 4.24 | Form of First Amendment to Series D Warrant Agreement (Incorporated by reference to the Company’s Current Report on Form 8-K, File No. 000-54900, filed with the Securities and Exchange Commission on January 22, 2018) | |
| Legal |
| Purchase Agreement with M2C Global, Inc. dated March 9, | ||
| First Amendment to Purchase Agreement with M2C Global, Inc. dated September 7, | ||
| Asset Purchase Agreement with MLM Holdings, Inc. dated June 10, | ||
| Agreement of Purchase and Sale with Price Plus, Inc. dated September 21, | ||
| Amended and Restated Agreement and Plan of Reorganization Javalution Coffee Company, YGY Merge, Inc. dated July 11, | ||
| Asset Purchase Agreement with R-Garden Inc. dated July 1, | ||
| Re-Purchase Agreement with R-Garden dated September 12, | ||
| Agreement and Plan of Reorganization with Javalution dated July 18, | ||
| Asset Purchase Agreement with Adaptogenix, LLC dated August 22, | ||
| Amended Asset Purchase Agreement with Adaptogenix, LLC dated January 27, | ||
| Asset Purchase Agreement with Prosperity Group, Inc. dated October 10, | ||
| Amended and Restated Equity Purchase Agreement with Financial Destination, Inc., FDI Management Co, Inc., FDI Realty, LLC, and MoneyTRAX, LLC dated October 25, | ||
| Exclusive License/Marketing Agreement with GLIE, LLC dba True2Life dated March 20, | ||
| Bill of Sale with Livinity, Inc. dated July 10, | ||
| Consulting Agreement with Livinity, Inc. dated July 10, | ||
| Employment Agreement with William Andreoli dated October 25, | ||
| Promissory Note with 2400 Boswell LLC dated July 15, | ||
| Promissory Note with William Andreoli dated July 1, | ||
| 2012 Stock Option |
| Form of Stock | ||
| Lease with 2400 Boswell LLC dated May 1, | ||
| Lease with FDI Realty LLC dated July 29, |
| First Amendment to Lease with FDI Realty LLC dated October 25, | ||
| 2011(Incorporated by reference to the Company’s Form 10-12G, File No. 000-54900, filed with the Securities and Exchange Commission on February 12, |
| Lease with Perc Enterprises dated February 6, 2008 (Incorporated by reference to the Company’s Form | ||
| Lease with Perc Enterprises dated September 25, 2012 (Incorporated by reference to the Company’s Form 10-12G, File No. 000-54900, filed with the Securities and Exchange Commission on February 12, 2013) | ||
| Factoring Agreement with Crestmark Bank dated February 12, 2010 (Incorporated by reference to the Company’s Form 10-12G, File No. 000-54900, filed with the Securities and Exchange Commission on February 12, 2013) | ||
| First Amendment to Factoring Agreement with Crestmark Bank dated April 6, 2011(Incorporated by reference to the Company’s Form 10-12G, File No. 000-54900, filed with the Securities and Exchange Commission on February 12, 2013) | ||
| Second Amendment to Factoring Agreement with Crestmark Bank dated February 1, 2013(Incorporated by reference to the Company’s Form 10-12G, File No. 000-54900, filed with the Securities and Exchange Commission on February 12, 2013) | ||
| Lease with Perc Enterprises dated March |
| Purchase Agreement with Ma Lan Wallach dated March 15, 2013 (Incorporated by reference to the Company’s Form 10-12G, File No. 000-54900, filed with the Securities and Exchange Commission on February 12, 2013) | ||
| Promissory Note with Plaza Bank dated March 14, 2013 (Incorporated by reference to the Company’s Form 10-12G, File No. 000-54900, filed with the Securities and Exchange Commission on February 12, 2013) | ||
| Form of Security Agreement (Incorporated by reference to the Company’s 8-K, File No. 000-54900, filed with the Securities and Exchange Commission on August 5, |
| Guaranty Agreement made by Stephan Wallach (Incorporated by reference to the Company’s 8-K, File No. 000-54900, filed with the Securities and Exchange Commission on August 5, 2014) | ||
| Form of Security Agreement (Incorporated by reference to the Company’s 8-K, File No. 000-54900, filed with the Securities and Exchange Commission on January 7, | ||
| Guaranty Agreement made by Stephan Wallach (Incorporated by reference to the Company’s 8-K, File No. 000-54900, filed with the Securities and Exchange Commission on January 7, 2015) | ||
| Credit Agreement with Wells Fargo Bank, National Association dated October 10, 2014 (Incorporated by reference to the Company’s Form 10-K, File No. 000-54900, filed with the Securities and Exchange Commission on March 30, | ||
| Amended and Restated 2012 Stock Incentive Plan (Previously filed with the Company’s Current Report on Schedule 14C File No. 000-54900, filed with the Securities and Exchange Commission on March 21, 2017) | ||
| Form of Stock Option (Incorporated by reference to the Company’s Form 10-K, File No. 000-54900, filed with the Securities and Exchange Commission on March 30, 2017) | ||
| Third Amendment with Crestmark Bank dated May 1, 2016 (Incorporated by reference to the Company’s Form 10-K, File No. 000-54900, filed with the Securities and Exchange Commission on March 30, 2017) | ||
| Form of Subscription Agreement | ||
| Form of Registration Rights Agreement (incorporated by reference to the Company's Current Report on Form 8-K, File No. 000-54900, filed with the Securities and Exchange Commission on | ||
| Consent of Independent Registered Public Accounting Firm * | ||
| Consent of Gracin & Marlow, LLP (included in Exhibit 5.1)* | ||
| 24.1 | Power of Attorney (included on signature page) |
| (1) For purposes of determining any liability |
YOUNGEVITY INTERNATIONAL, INC. | ||||
| By: | /s/ Stephan Wallach | |||
| Stephan Wallach | ||||
| Chief Executive Officer and Chairman | ||||
| (Principal Executive Officer) | ||||
Date: | January 22, 2018 | |||
| By: | /s/ David Briskie | |||
| David Briskie | ||||
| President, Chief Financial Officer and Director | ||||
| (Principal Financial Officer and Accounting Officer) | ||||
Date: | January 22, 2018 | |||
| Signature | Title | Date | ||
| /s/ Stephan Wallach | Chief Executive Officer and Chairman of the Board (Principal Executive Officer) | January 22, 2018 | ||
| Stephan Wallach | ||||
| | ||||
| /s/ David Briskie | President, Chief Financial Officer and Director | January 22, 2018 | ||
| David Briskie | ||||
| Chief Operating Officer and Director | January 22, 2018 | |||
| Michelle Wallach | ||||
| Director | January 22, 2018 | |||
| Richard Renton | ||||
* | Director | January 22, 2018 | ||
| William Thompson | ||||
| * | Director | January 22, 2018 | ||
| Paul Sallwasser | ||||
| * | Director | January 22, 2018 | ||
| Kevin Allodi | ||||
| *By: | /s/ Stephan Wallach | |
| Stephan Wallach | ||
| Attorney-in-Fact |
