As filed with the Securities and Exchange Commission on January 17, 2013
Registration No.: 333-183276
UNITED STATES
SECURITIES AND EXCHANGE COMMISSION
Washington,WASHINGTON, D.C. 20549
Pre-Effective Amendment No. 3 to
FormFORM S-1
REGISTRATION STATEMENT UNDER THE SECURITIES ACT OF 1933
ATLAS FINANCIAL HOLDINGS, INC.
(Exact name of registrant as specified in its charter)
EXACT NAME OF REGISTRANT AS SPECIFIED IN ITS CHARTER)
|
| | | | | | |
Cayman Islands | | | CAYMAN ISLANDS | 6331 | | 27-5466079
|
(State or other jurisdiction of incorporation or organization)
| | | | (Primary Standard Industrial | (I.R.S. Employer |
| incorporation or organization) | Classification Code Number) | | (I.R.S. Employer
Identification Number) No.) |
150 NW Point Boulevard
Elk Grove Village, IL 60007
(847) 472-6700
(Address, including zip code, and telephone number, including
area code, of registrant’s principal executive offices)
Scott D. Wollney
President, Chief Executive Officer and Director
Atlas Financial Holdings, Inc.
150 NW Point Boulevard
Elk Grove Village, IL 60007
(847) 472-6700
(Name, address, including zip code, and telephone number, including
area code, of agent for service)
Copies to:
|
|
| 150 NW POINT BOULEVARD |
| Elk Grove Village, IL 60007 |
| (847) 472-6700 |
| (Address, including zip code, and telephone number, including |
| area code, of registrant's principal executive offices) |
|
Douglas S. Ellenoff, Esq. | | Brian J. Fahrney, Esq. |
Adam S. Mimeles, Esq. | | Sean M. Carney, Esq.Scott D. Wollney |
Ellenoff Grossman & Schole LLPPresident, Chief Executive Officer and Director |
| Sidley Austin LLPAtlas Financial Holdings, Inc. |
150 East 42nd Street | | One South Dearborn StreetNW POINT BOULEVARD |
New York, New York 10017 | | Chicago, Illinois 60603Elk Grove Village, IL 60007 |
(212) 370-1300 | | (312) 853-7000(847) 472-6700 |
(212) 370-7889 - Facsimile(Name, address, including zip code, and telephone number, including |
| area code, of agent for service) |
| |
|
|
| Copies to: |
| Gregory W. Hayes |
| DLA Piper LLP (US) |
| 203 North LaSalle Street, Suite 1900 |
| Chicago IL 60601 |
(312) 853-7036 - Facsimile368 4000
|
| (Name, address, including zip code, and telephone number, including |
| area code, of agent for service) |
|
Approximate date of commencement of proposed sale to the public:
As soon as practicable after the effective date of the registration statement.
If any of the securities being registered on this Form are to be offered on a delayed or continuous basis pursuant to Rule 415 under the Securities Act of 1933, check the following box: [ X ]
If this Form is filed to register additional securities for an offering pursuant to Rule 462(b) under the Securities Act, please check the following box and list the Securities Act registration statement number of the earlier effective registration statement for the same offering: [ ]
If this Form is a post-effective amendment filed pursuant to Rule 462(c) under the Securities Act, check the following box and list the Securities Act registration statement number of the earlier effective registration statement for the same offering: [ ]
If this Form is a post-effective amendment filed pursuant to Rule 462(d) under the Securities Act, check the following box and list the Securities Act registration statement number of the earlier effective registration statement for the same offering: [ ]
Indicate by check mark whether the registrant is a large accelerated filer, an accelerated filer, a non-accelerated filer, or a smaller reporting company.
Large Accelerated Filer ¨Accelerated Filer¨ |
| | | | | | |
Large accelerated filer [ ] | | Accelerated filer [ ] | | Non-accelerated filer [ ]
(Do not check if a smaller
reporting company)
| | Smaller reporting company [X] |
Non-Accelerated Filer ¨Smaller Reporting Company þ(do not check if a smaller reporting company)
CALCULATION OF REGISTRATION FEE
| | Title of Each Class of Securities to be Registered | Amount to be Registered | Proposed Maximum Offering Price per Ordinary Share | | Proposed Maximum Aggregate Offering Price | | Amount of Registration Fee (5) | Amount to be Registered (1) | Proposed Maximum Offering Price per Ordinary Share (1) | Proposed Maximum Aggregate Offering Price (1) | Amount of Registration Fee |
Ordinary shares, $.003 par value (1) (2) (3) (4) | 5,324,500 | | $ | 6.15 | | $ | 32,745,675 |
| $ | 4,466.51 |
| |
Ordinary shares, $.003 par value (2) (3) (4) | | 1,262,471 |
| $ | 9.82 |
| $ | 12,397,465 |
| $ | 1,691.01 |
|
|
| | |
| (1) | Estimated solely for the purpose of calculating the registration fee. |
| |
| (2) | Pursuant to Rule 416, there are also being registered an indeterminable number of additional securities as may be issued to prevent dilution resulting from stock splits, stock dividends or similar transactions. |
| | |
(2)(3) | | IncludesComprised of those shares being registered on behalf of Kingsway America Inc. |
| | |
(3) | (4) | The 3,130,0001,262,471 restricted voting shares sold by Kingsway America Inc. convert automatically into ordinary shares upon the sale contemplated by this registration statement. |
| | |
(4) | | Includes ordinary shares that the underwriter has the option to purchase to cover over-allotments, if any. |
| | |
(5) | | $4,604.78 previously paid. |
The registrant hereby amends this registration statement on such date or dates as may be necessary to delay its effective date until the registrant shall file a further amendment which specifically states that this registration statement shall thereafter become effective in accordance with Section 8(a) of the Securities Act of 1933 or until the registration statement shall become effective on such date as the Securities and Exchange Commission, acting pursuant to said Section 8(a), may determine.
The information in this prospectus is not complete and may be changed. We may not sell these securities until the registration statement filed withrelating to these securities has been declared effective by the Securities and Exchange Commission is effective.Commission. This prospectus is notneither an offer to sell these securities and it is not solicitingnor a solicitation of an offer to buy these securities in any jurisdiction where thesuch offer or sale is not permitted.unlawful.
Subject to Completion Preliminary Prospectus Dated January 17, 2013
4,630,000Dated September 19, 2013
PROSPECTUS
1,262,471 Ordinary Shares
This is the initial public offering in the United States of the ordinary shares of Atlas Financial Holdings, Inc.
An aggregateThis prospectus relates solely to the offer and sale from time to time of 4,630,000 shares are being offered in this prospectus. We are offering 1,500,000up to 1,262,471 of our ordinary shares andfor the account of the selling shareholder named in this prospectus is offering 3,130,000prospectus.
The selling shareholdermay, from time to time, sell, transfer or otherwise dispose of any or all of our ordinary shares. shares covered by this prospectus on any stock exchange, market or trading facility on which the shares are traded or in private transactions. These dispositions may be at fixed prices, at prevailing market prices at the time of sale, at prices relating to the prevailing market price, at varying prices determined at the time of sale or at negotiated prices. See “Plan of Distribution” for additional information.
We will not receive any proceeds from the sale of the ordinary shares being offered by the selling shareholder. To date, ourOur ordinary shares have been exclusively listed on the TSX Venture Exchange (“TSXV”) under the symbol “AFH.” We have applied to have our ordinary shares listed for trading on the Nasdaq Capital Market, or NASDAQ, under the symbol “AFH.“AFH,” since February 12, 2013.
As of January 17,September 18, 2013,, the last reported sale price of our ordinary shares on the TSXVNASDAQ was C$[•] (or $[•], based on assumed exchange rate of C$[•] per $1 U.S.).$9.83.
We are an “emerging growth company” under the federal securities laws and will be subject to reduced public company reporting requirements. Investing in our ordinary shares involves a high degree of risk. See “Risk Factors” beginning on page 108 of this prospectus for certain risk factors that you should consider before making a decision to invest in our ordinary shares.
|
| | | | | |
| | Per Share | | | Total |
Initial public offering price | $ | | | $ | |
Underwriting discounts, and commissions (1)
| $ | | | $ | |
Proceeds, before expenses, to Atlas Financial Holdings, Inc. | $ | | | $ | |
Proceeds, before expenses, to selling shareholder | $ | | | $ | |
| |
(1) | See “” beginning on page 91 for disclosure regarding the underwriting discounts and certain expenses payable to the underwriters by us. |
We have granted the underwriters a 30-day option to purchase up to an additional 694,500 ordinary shares from us at the public offering price, less the underwriting discount specified above, to cover over-allotments, if any.
Neither the Securities and Exchange Commission nor any state securities commission has approved or disapproved of these securities or determined whether this prospectus is truthful or complete. Any representation to the contrary is a criminal offense.
Sandler O’Neill + Partners, L.P., on behalf of the underwriters, expects to deliver the shares to purchasers against payment on or about , 2013
SANDLER O’NEILL + PARTNERS, L.P.
CANACCORD GENUITY
The date of this Prospectusprospectus is , 2013_______, 2013.
TABLE OF CONTENTS
|
| | |
| | Page |
| |
| The Offering | |
| |
| |
| |
| |
| |
| |
| Selling Shareholder | |
| |
| |
| |
| |
| |
| |
| |
| |
| Beneficial Ownership of Ordinary Shares and Selling Shareholder | |
| |
| |
| U.S. Tax Considerations | |
| Plan of Distribution | |
| |
| |
| |
| |
| |
You should rely only on the information contained in this prospectus. Neither we norNo dealer, salesperson or other individual has been authorized to give any information or to make any representations not contained or incorporated by reference in this prospectus in connection with the underwriters haveoffering covered by this prospectus. If given or made, such information or representations must not be relied upon as having been authorized any other person to provide you with different information. If anyone provides you with different or inconsistent information, you shouldby us. This prospectus does not rely on it. Neither we nor the underwriters are makingconstitute an offer to sell, these securitiesor a solicitation of an offer to buy, the common share, in any jurisdiction where, theor to any person to whom, it is unlawful to make any such offer or sale is not permitted.solicitation. You should assume that the information appearing in this prospectus is accurate only as of the date on the front cover of this prospectus. Our business, financial condition, results of operation and prospects may have changed since that date.
We use market data, demographic data, industry forecasts and projections throughout this prospectus. We have obtained certain market and industry data from publicly available industry publications. These sources generally state that the information they provide has been obtained from sources believed to be reliable, but that the accuracy and completeness of the information are not guaranteed. The forecasts and projections are based on historical market data, and there is no assurance that any of the projected amounts will be achieved. We believe that the market and industry research others have performed are reliable, but we have not independently verified this information.
PROSPECTUS SUMMARY
Our Business
We are a financial services holding company incorporated under the laws of the Cayman Islands. Our core business is the underwriting of commercial automobile insurance policies, focusing on the “light” commercial automobile sector, which is carried out through our insurance subsidiaries, American Country Insurance Company, or American Country, and American Service Insurance Company, Inc., or American Service, together with American Country, which weand Gateway Insurance Company, or Gateway. We refer to these three companies together as our “insurance subsidiaries”. This sector includes taxi cabs, non-emergency para-transit, limousine, livery and business auto. Our goal is to be the preferred specialty commercial transportation insurer in any geographic areas where our value proposition delivers benefit to all stakeholders.
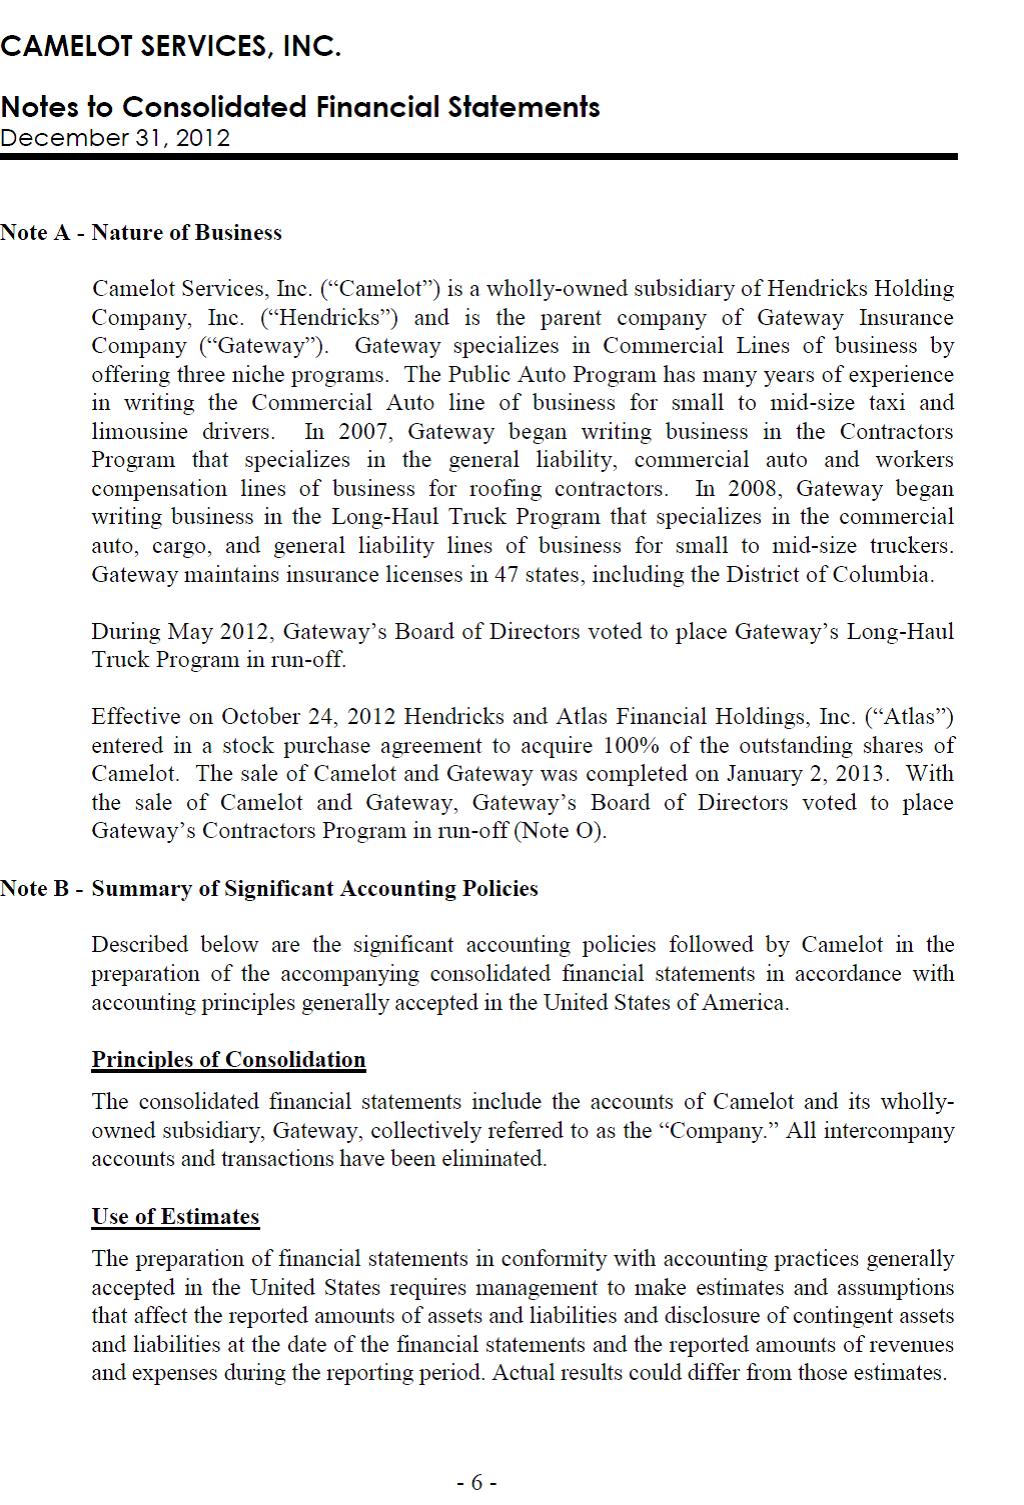
We were formed as JJR VI, a Canadian capital pool company, on December 21, 2009 under the laws of Ontario, Canada. On December 31, 2010, we completed a reverse merger wherein American Service and American Country were transferred to us by Kingsway America Inc., or KAI, a wholly owned subsidiary of Kingsway Financial Services Inc., or KFSI, a Canadian public company whose shares are traded on the Toronto and New York Stock Exchanges. Prior to the transaction, each of American Service and American Country were wholly owned subsidiaries of KAI. American Country commenced operations in 1979. With roots dating back to 1925 selling insurance for taxi cabs, American Country is one of the oldest insurers of U.S. taxi and livery business. In 1983, American Service began as a non-standard personal and commercial auto insurer writing business in the Chicago, Illinois area. On January 2, 2013 Atlas acquired Camelot Services, Inc., ("Camelot Services"), a privately owned insurance holding company, and its sole subsidiary, Gateway, from Hendricks Holding Company, Inc., ("Hendricks"), an unaffiliated third party. Gateway, our third insurance subsidiary, provides specialized commercial insurance products, including commercial automobile insurance to niche markets such as taxi, black car and sedan service owners and operators.
In connection with the acquisition of American Service and American Country, we streamlined the operations of the insurance subsidiaries to focus on the “light” commercial automobile lines of business we believe will produce favorable underwriting results. Over the past twothree years, we have disposed of non-core assets and placed into run-off certain non-core lines of business previously written by the insurance subsidiaries. Our focus going forward is the underwriting of commercial automobile insurance in the U.S.
Substantially all of our new premiums written are now in “light” commercial automobile lines of business. Our coreIn the three month period ended June 30, 2013, gross premium written from commercial automobile linewas $15.6 million. As a percentage of the overall book of business, accounted for 92.6%commercial auto gross premium written represented 94.5% of our gross premium written in the ninethree month period ended SeptemberJune 30, 2012,2013 compared with 44.0% of our gross premium written into 88.8% during the ninethree month period ended SeptemberJune 30, 2011. For2012 and 92.3% in the same period, the gross premium written from our core commercial automobile line of business increased by 183% relative to the ninethree month period ended September 30, 2011.March 31, 2013.
We are committed to the “light” commercial automobile lines of business. The insurance subsidiaries distribute their products through a network of independent retail agents, and actively wrotepremium related to core products was written in 39 states during the three month period ended June 30, 2013. The insurance in 31 states as of September 30, 2012. Together, American Country and American Servicesubsidiaries are currently licensed to write property and casualty, or P&C, insurance in 4749 states plus the District of Columbia in the United States. American Country and American Service actively wroteWe expect to write commercial automobile insurance in more states during 20122013 than in any prior year.
Market
Our core business is the underwriting of commercial automobile insurance policies, focusing on the “light” commercial automobile sector. The “light” commercial automobile policies we underwrite provide coverage for lightweight commercial vehicles typically with the minimum limits prescribed by statute, municipal or other regulatory requirements. The majority of our policyholders are individual owners or small fleet operators.
The “light” commercial automobile sector is a subset of the historically profitable commercial automobile insurance industry segment. Commercial automobile insurance has outperformed the overall P&C industry in each of the past ten years based on data compiled by A.M. Best & Company, or A.M. Best, an established credit rating organization exclusively serving the insurance industry. A recent survey by A.M. Best estimates the total market for commercial automobile liability insurance to be approximately $24 billion. The size of the commercial automobile insurance market can be affected significantly by many factors, such as the underwriting capacity and underwriting criteria of automobile insurance carriers and general economic conditions. Historically, the commercial automobile insurance market has been characterized by periods of price competition and excess capacity followed by periods of higher premium rates and shortages of underwriting capacity.
We believe there is a positive correlation between the economy and commercial automobile insurance in general. Operators of “light” commercial automobiles may be less likely than other business segments within the commercial automobile insurance market to take vehicles out of service as their businesses and business reputations rely heavily on availability. With respect to
certain business lines such as the taxi line, there are also other factors, such as the cost and limited supply of medallions, which may discourage a policyholder from taking vehicles out of service in the face of reduced demand for the use of the vehicle.
Competitive Strengths
Our value proposition is driven by our competitive strengths, which include the following:
Focus on niche commercial insurance business. We target niche markets that support adequate pricing and believe we are able to adapt to changing market needs ahead of our competitors through our strategic focus and increasing scale. We develop and deliver superior specialty commercial automobile insurance products priced to meet our customers’ needs and strive to generate consistent underwriting profit for our insurance subsidiaries. We have experienced a favorable trend in loss ratios in 2012 attributable to theThe increased compositionproportion of commercial auto claims throughout 2013, which historically have had more favorable overall underwriting results, has been the primary driver for loss ratio improvement in 2013. We believe that our extensive experience and expertise specific to underwriting and claims management in commercial lines will allow continued loss ratio improvement in the remainder of 2013 and going forward. The Company is committed to retaining this claim handling expertise as a percentagecore competency as the volume of the total written premium. We expect the loss ratio to continue decreasing as we complete the transition away from non-standard automobile insurance and other non-core lines of business.business increases.
Strong market presence with recognized brands and long-standing distribution relationships. American Country, and American Service and Gateway all have a long heritage as insurers of taxi, livery and para-transit businesses. Both of the insurance subsidiariesThey have strong brand recognition and long-standing distribution relationships in our target markets. Through regular interaction with our retail producers, we strive to thoroughly understand each of the markets we serve in order to deliver strategically priced products to the right market at the right time.
Sophisticated underwriting and claims handling expertise. Atlas has extensive experience and expertise with respect to underwriting and claims management in our specialty area of insurance. Our well-developed underwriting and claims infrastructure includes an extensive data repository, proprietary technologies, deep market knowledge and established market relationships. Analysis of the substantial data available through our operating companies drives our product and pricing decisions. We believe that our underwriting and claims handling expertise provides enhanced risk selection, high quality service to our customers and greater control over claims expenses. We are committed to maintaining this underwriting and claims handling expertise as a core competency as our volume of business increases.
Scalable operations positioned for growth. Significant progress has also been made in aligning our cost base to our expected revenue going forward. The other underwriting expense ratio was 17.3% in the three month period ended June 30, 2013 compared to 21.4% in the three month period ended June 30, 2012. For the six month period ended June 30, 2013, the ratio was 18.2% compared to 20.6% in the six month period ended June 30, 2012. The core functions of the insurance subsidiaries were integrated into a common operating platform. Consequently, we believe that boththe insurance subsidiaries are well positionedwell-positioned to begin returning to the volume of premium they wrote in the recent past with better than industry level profitability from the efficient operating infrastructure honed in 2011.
Experienced management team. We have a talented and experienced management team led by our President and Chief Executive Officer, Scott Wollney, who has more than 2122 years of experience in the property and casualty insurance industry. Our senior management team has worked in the property and casualty industry for an average of 2122 years and with the insurance subsidiaries, directly or indirectly, for an average of 1213 years.
Strategy
We seek to deploy our capital to maximize the return for our shareholders, either by investing in growing our operations or by pursuing other capital initiatives, depending upon insurance and capital market conditions. We focus on our key strengths and seek to expand our geographic footprint and products only to the extent these activities support our vision and mission. We will identify and prioritize market expansion opportunities based on the comparative strength of our value proposition relative to competitors, the market opportunity and the legal and regulatory environment.
We intend to continue to grow profitably by undertaking the following:
Re-establish legacy distribution relationships. We are focused on re-establishing relationships with independent agents that have been our distribution partners in the past. We seek to develop and maintain strategic distribution relationships with a relatively small number of independent agents with substantial market presence in each state in which we currently operate. We
expect to continue to increase the distribution of our core products in the states where we are actively writing insurance and re-capture insurance premium historically written by the insurance subsidiaries. We also intend to leverage the acquisition of Gateway to grow establish strong relationships with their independent agents in markets where we previously had little or no presence.
Expand our market presence. We are committed to continuing to diversify geographically by leveraging our experience, historical data and market research to expand our business in previously untapped geographic markets. Utilizing our established brands and market relationships, we have made significant inroads in new states where we previously had little to no presence in 2011.presence. We will
continue to expand into additional states where we are licensed, but not currently active, and states where we are not currently licensed to the extent that our market expansion criteria is met in a given state.
Acquire complementary books of business and insurance companies. We plan to opportunistically pursue acquisitions of complementary books of business and insurance companies provided market conditions support this activity. We will evaluate each acquisition opportunity based on its expected economic contribution to our results and support of our market expansion initiatives.
Our Challenges
As part of your evaluation of our business, you should take into account the challenges we face in implementing our strategies, including the following:
Estimating Our Loss Reserves. We maintain loss reserves to cover our estimated ultimate liability for unpaid losses and loss adjustment expenses for reported and unreported claims incurred as of the end of each accounting period. These reserves represent management’s estimates of what the ultimate settlement and administration of claims will cost. Pursuant to applicable insurance regulations, these reserves are reviewed by an independent actuary on an annual basis. Setting reserves is inherently uncertain and there can be no assurance that current or future reserves will prove adequate. If our loss reserves are inadequate, it will have an unfavorable impact on our results. A summary of the favorable and unfavorable developments in our loss reserves in the previous 10-year period is on page 57.51.
Reliance on Independent Agents. We rely on independent agents and other producers to bind insurance policies and collect premiums. We have very limited oversight over these agents and other producers, and in the event an independent agent exceeds their authority by binding us to a risk that does not comply with our underwriting guidelines or fails to collect or remit premiums to us, our results of operations could be adversely affected.
Maintaining Our Financial Strength Ratings. In January 2012,2013, A.M. Best affirmed the financial strength rating of “B” to our insurance subsidiaries.subsidiaries, and following the disclosure of our acquisition of Gateway, A.M. Best placed these ratings under review with negative implications. Upon the completion of our acquisition of Gateway, A.M. Best affirmed our rating to B “stable.” To maintain these ratings, our insurance company subsidiaries must maintain their capitalization and operating performance at a level consistent with projections provided to A.M. Best, as well as satisfy various other rating requirements. If A.M. Best downgrades our ratings, it is likely that we will not be able to compete as effectively and our ability to sell insurance policies could decline. As a result, our financial results would be adversely affected. A.M. Best reviews the rating of our insurance subsidiaries approximately once per year.
Attracting, Developing and Retaining Experienced Personnel. To sustain our growth as a property and casualty insurance company operating in specialty and niche markets, we must continue to attract, develop and retain management, marketing, distribution, underwriting, customer service and claims personnel with expertise in the products we offer. The loss of key personnel, or our inability to recruit, develop and retain additional qualified personnel, could materially and adversely affect our business, growth and profitability.
For further discussion of these and other challenges, see “Risk Factors.”
2012 Third2013 Second Quarter Financial Results
On NovemberAugust 12, 20122013 we announced our 2012 third2013 second quarter financial results. Our thirdIn the second quarter financial results reflectof 2013 Atlas continued steady growth in our strategic focus on specialty commercial automobile lines of insurancecore lines. We reported strong underwriting improvement, including considerable increases in premiums written, net premiums earned, and the winding down of certain non-core lines of business.net income.
Gross premium written related to our core commercial automobile line of business was $22.1 million inFor the three month period ended September 30, 2012, representing a 313.4% increase relative to the three month period ended September 30, 2011. The increase in our commercial auto gross premium written was a result of the strategic focus on these core lines of business coupled with our recent geographic expansion and positive response from new and existing agents. The increase was also the result of a new business arrangement in New York to provide excess coverage for taxis above the levels of risk retained by the insured that was implemented in the third quarter.
Our combined ratio for the three month period ended September 30, 2012 improved to 97.6%, compared to 119.7% for the three month period ended September 30, 2011 and 111.5% for the three month period ended June 30, 2012. The improvement2013, gross premium written was $16.6 million compared to $9.2 million in the combined ratio was attributable to reductions inthree month period ended June 30, 2012, representing a 79.2%increase. In the loss ratio, acquisition cost ratio and other underwriting expense ratio. These reductions were primarily due to the shift away from non-core lines of business and several recent cost saving initiatives.
three month period ended June 30, 2013, gross premium
Our basic andwritten from commercial automobile was $15.6 million, representing a 90.6%increase relative to the three month period ended June 30, 2012. Of the increase in commercial auto premium written, $2.7 million resulted from the Gateway acquisition, without which the growth would have been 58.1%.
The loss ratio relating to the claims incurred in the three month period ended June 30, 2013 was 64.6% compared to 71.6% in the three month period ended June 30, 2012. Atlas' combined ratio improved for the three month period ended June 30, 2013 to 95.0%, compared to 111.5% for the corresponding prior year period. The table below indicates the comparisons of each component of our combined ratio for the periods indicated:
|
| | | | | | | | |
| | Three Month Periods Ended | Six Month Periods Ended |
| | June 30, 2013 | June 30, 2012 | June 30, 2013 | June 30, 2012 |
| Loss ratio | 64.6 | % | 71.6 | % | 64.6 | % | 71.3 | % |
| Acquisition cost ratio | 13.1 | % | 18.5 | % | 13.7 | % | 17.5 | % |
| Other underwriting expense ratio | 17.3 | % | 21.4 | % | 18.2 | % | 20.6 | % |
| Combined ratio | 95.0 | % | 111.5 | % | 96.5 | % | 109.4 | % |
Atlas generated net income of $1.7 million, or $0.16 per diluted earningscommon share, for the three month period ended June 30, 2013. This compares to net income of $130,000 or a loss of $0.01 per diluted common share in the three month period ended SeptemberJune 30, 2012 was $0.24. Book value per basic and diluted common share at Septemberon June 30, 20122013 was $6.466.07, an increase ofcompared to $0.306.55 compared toat December 31, 2012 and $6.15 at June 30, 2012. This resulted in an annualized return on common equity of 15.0%11.8% for the three month period ended SeptemberJune 30, 2012.2013.
For further discussion of our 2012 third2013 second quarter financial results, see “Management’s Discussion and Analysis of Financial Condition and Results of Operations.”Operations”.
Recent Developments
Reverse Stock Split
Purchase and Cancellation of Preferred Shares
On DecemberJuly 7, 2012, we held2013, Atlas entered into a shareholder meeting where a one-for-three reverse stock split was unanimously approved. Whennon-binding letter of intent to purchase all outstanding preferred shares that are eligible for redemption (18 million shares), for 90% of liquidation value. Definitive agreements in connection with this transaction were executed on August 1, 2013 (collectively, "The Share Repurchase Agreement"). An initial amount of $8.3 million (which includes $800,000 received from the reverse stock split takes effect, it will decrease our authorized and outstanding ordinary shares and restricted voting shares at a ratioexercise of one-for-three. The primary objectivewarrants) of the reverse stock split is to increase the per share$16.2 million purchase price of our ordinary shares to meet certain listing requirementswas paid upon execution of the NASDAQ Capital Market. Unless otherwise noted, all share and per share valuesShare Repurchase Agreement, with the remaining amount to be paid no later than April 30, 2014, in this prospectus reflect the one-for-three reverse stock split.
Acquisition of Gateway Insurance Company
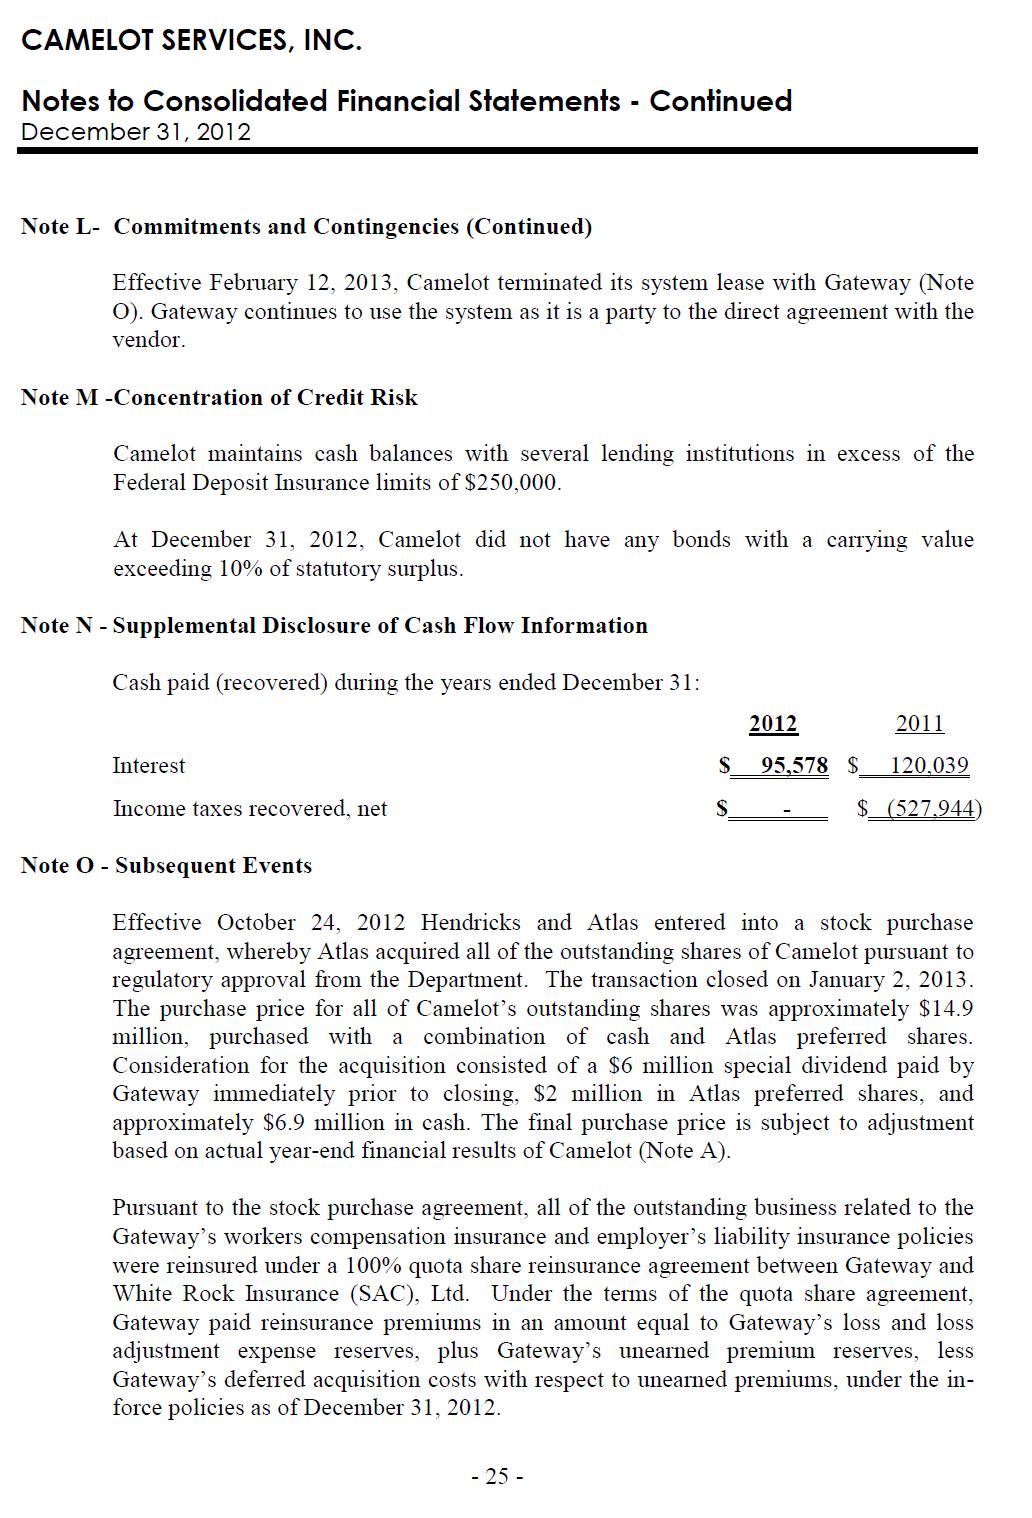
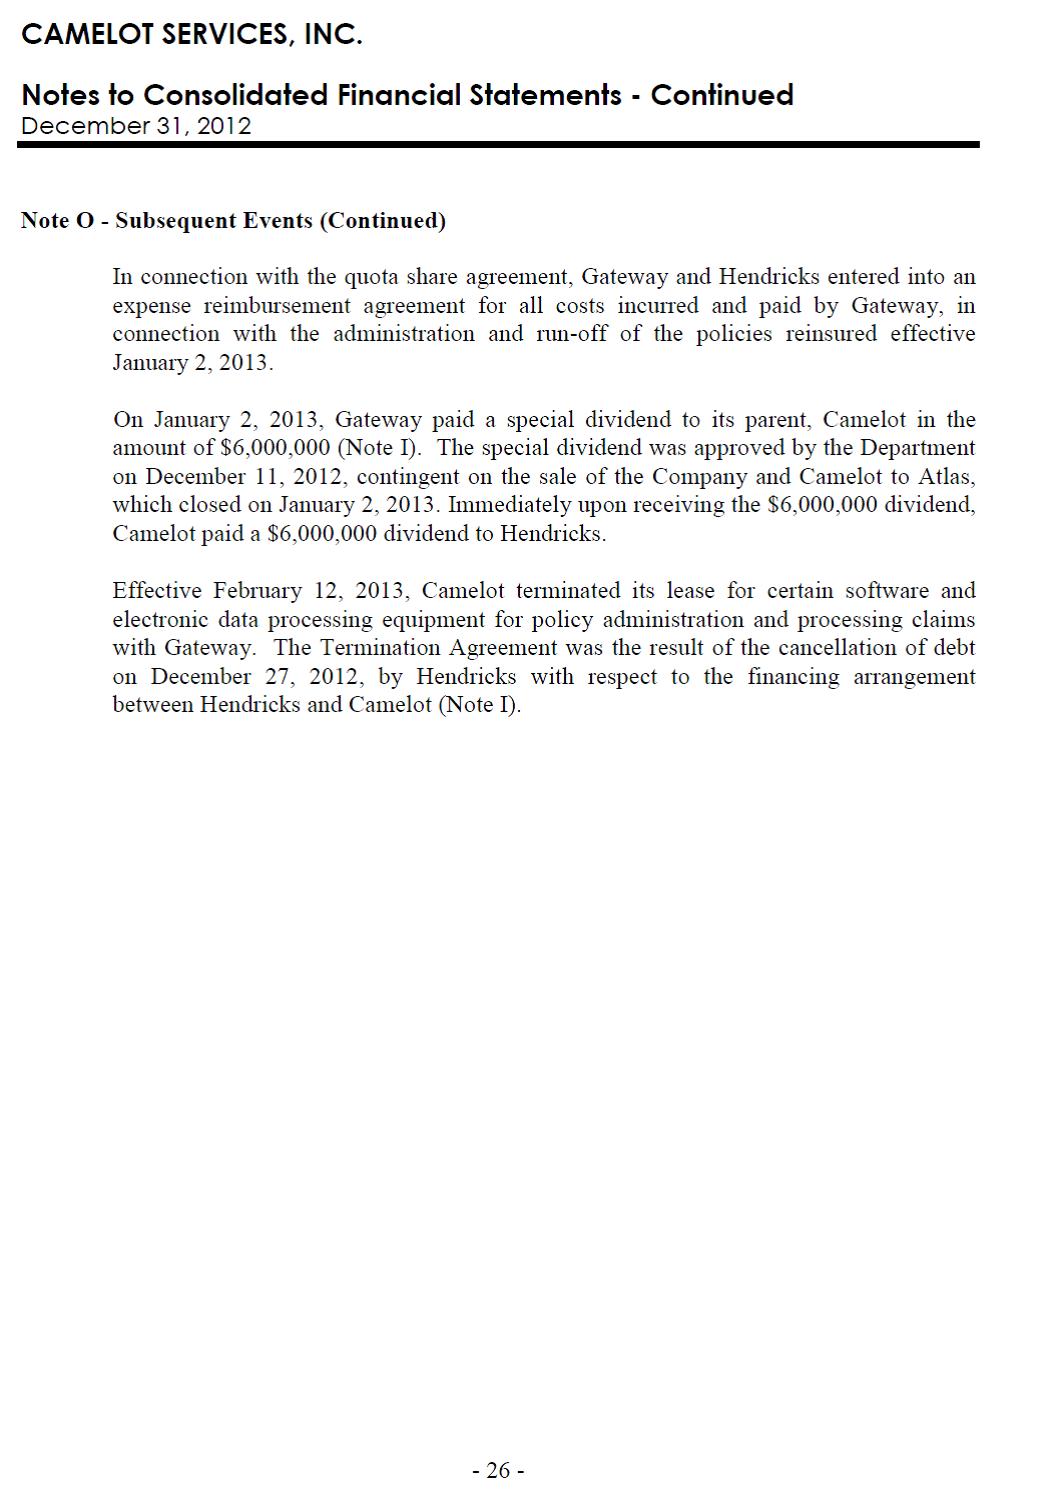
On January 2, 2013 we acquired Camelot Services, Inc., or Camelot Services, a privately owned insurance holding company, and its sole subsidiary, Gateway Insurance Company, or Gateway, from Hendricks Holding Company, Inc., or Hendricks, an unaffiliated third party. Gateway provides specialized commercial insurance products, including commercial automobile insurance to niche markets such as taxi, black car and sedan service owners and operators.
Gateway is a St. Louis, Missouri-based insurance company that currently underwrites approximately $10.0 million of annual taxi and limousine net written premium. Gateway is an admitted carrier in 46 states plus the District of Columbia. Our acquisition of Gateway expanded our core commercial automobile lines to a total of 39 states and the District of Columbia, including California, Hawaii, Montana, Nebraska, North Dakota, South Dakota, Washington and West Virginia.
Underaccordance with the terms of the stock purchase agreement, the purchase price equaled the tangible GAAP book valueShare Repurchase Agreement.
Section 382 Triggering Event
On July 22, 2013, as a result of Camelot Services at December 31, 2012, subject to certain pre and post-closing adjustments, including, among others, claim development between the signingshareholder activity, a "triggering event" as determined under Section 382 of the stock purchase agreement and December 31, 2012. Additional consideration may be paid toInternal Revenue Code of 1986 (“IRC Section 382”) was reached. As a result, under IRC Section 382, the seller, or returned to us by the seller, depending upon, among other things, the future development of Gateway’s actual loss reserves for certain lines of business and the utilization of certain deferred tax assets over time. Gateway also writes workers’ compensation insurance, which was terminated as partuse of the transaction. An indemnity reinsurance agreement was entered into pursuant toCompany's net operating loss and other carryforwards will be limited as a result of this "ownership change” for tax purposes, which 100%is defined as a cumulative change of Gateway’s workers’ compensation business was ceded to a third party captive reinsurer fundedmore than 50% during any three-year period by the seller as partshareholders of the transaction.Company's shares.
TheFollowing this triggering event, the Company estimates that it will retain total purchase price for all of Camelot’s outstanding shares was $14.9 million, consisting of a combination of cash and Atlas preferred shares. Consideration consisted of a $6.0 million dividend paid by Gateway immediately prior to the closing, $2.0 million of Atlas preferred shares (consisting of a total of 2 million shares) and $6.9 million in cash. Under the terms of the stock purchase agreement, the closing price was reduced due to reserve strengtheningtax effected federal net operating loss carryforwards of approximately $8.0$15.0 million that Camelot Services recognized prior to closing. Approximately $4.3versus $16.1 million of this reserve strengthening was related to commercial automobile reserves, a portion of which was related to the long-haul truck program that is currently in run off. The amount of pre-closing reserve strengthening was consistent with the conclusions of an independent actuarial analysis of the reserves of Gateway. In addition to this pre-closing reserve strengthening, we have contractual protections to offset up to $2.0 million of future reserve development. We have also agreed to provide the sellers up to $2.0 million in additional consideration in the event of favorable reserve development.
2012 Fourth Quarter Premium
We have not yet finalized our financial statement close process for the three month period ended December 31, 2012 and our independent auditors have not yet completed their year-end audit. The financial data for the three month period ended December 31, 2012 presented below are preliminary, based upon our estimates and subject to the completion of our financial statement close process and year-end audit. This summary is not a comprehensive statement of our financial results for this period. Important factors that could cause actual results to differ materially from our preliminary estimates are set forth under the headings “Risk Factors” and “Cautionary Note Regarding Forward-Looking Statements.” Our consolidated financial statements as of and for the year ended December 31, 2012 will not be available until after this offering is completed, and consequently, will not be available to you prior to investing in this offering.
Gross premium written for the three months ended December 31, 2012June 30, 2013. Book value per common share is expected to be approximately $10.7 million, representing a 17.8% increase relative tounaffected by this event as the three month period ended December 31, 2011. The expected increase in our gross premium written as compared to the prior year is primarily attributable to an increase in our commercial auto gross premium written as a resultamount of the strategic focus on these core lines of business, coupled with our recent geographic expansion and positive response from new and existing agents. Gross premium written related to our core commercial automobile line of business is expectedlost deferred tax assets are anticipated to be approximately $9.5 million forwell within the three month period ended December 31, 2012, representing a 121.7% increase relative toallowance which was already held against the three month period ended December 31, 2011. Gross premium written for the three months ended December 31, 2012 is expected to be 54.2% less than the prior quarter due to the seasonal naturemajority of our business.these assets.
Net premium earned for the three months ended December 31, 2012 is expected to be approximately $11.9 million, representing a 31.2% increase relative to the three month period ended December 31, 2011 and a 9.0% increase relative to the prior quarter. The expected increase in net premium earned is related primarily to the increase in commercial auto gross premium written during 2012.
For the full year, gross premium written is expected to be approximately $55.0 million, up from $42.0 million in 2011, and net premium earned is expected to be approximately $38.7 million, up from $35.7 million in 2011. We expect our core commercial automobile lines of business will account for 91.8% of gross premium written in 2012, compared to 44.7% of our gross premium written in 2011. In 2012, the gross premium written from our core commercial automobile lines is expected to increase by 169.0% relative to 2011.
Corporate Information
The address of our registered office is Cricket Square, Hutchins Drive, PO Box 2681, Grand Cayman, KY1-1111, Cayman Islands. Our operating headquarters are located at 150 Northwest Point Boulevard, Elk Grove Village, Illinois 60007, USA. We maintain a website at http://www.atlas-fin.com. Information on our website or any other website does not constitute a part of this prospectus.
The Offering
|
| |
Ordinary shares offered by Atlas | 1,500,000 shares |
| |
Ordinary shares offered by selling shareholder | 3,130,000 shares |
| |
Total offering | 4,630,0001,262,471 shares |
| | |
| Ordinary shares outstanding prior to this offering | 6,144,3908,233,321 shares(1)
|
| | |
| Ordinary shares outstanding after this offering | 7,644,3908,233,321 shares |
| | |
Over-allotment option | The underwriters have an option to purchase a maximum of 694,500 additional shares from us to cover over-allotments. The underwriters can exercise this option at any time within 30 days from the date of this prospectus. |
| | |
| Use of proceeds | We estimate that our net proceeds from the sale of the ordinary shares that we are offering will be approximately $[•] million, based on an assumed offering price of $[•] per share (the U.S. dollar equivalent of the last reported sale price of our ordinary shares on the TSXV based on an assumed exchange rate of C$[•] per $1 U.S.), after deducting underwriting discounts and commissions and estimated offering expenses payable by us.
We will not receive any proceeds from the sale of ordinary shares being offered by the selling shareholder. The principal purposes of our initial offering in the United States are to create a public market for our ordinary shares in the United States and thereby enable future access to the United States public equity markets by us and our shareholders, and to obtain additional capital. We intend to use the net proceeds to us from our offering for working capital, to acquire complementary businesses or other assets, to repurchase preferred shares, which accrue dividends on a cumulative basis at a rate of $0.045 per share per year (4.5%), or for other general corporate purposes; however we do not have any specific uses of the net proceeds planned.
See “Use of Proceeds”
|
| | |
| Dividend Policy | We did not declare or pay cash dividends on our capital stock during 2010, 2011, 2012 or to date in 2013. We currently intend to retain any future earnings for use in the operation of our business and do not intend to declare or pay any cash dividends in the foreseeable future. Any future determination to pay dividends on our capital stock will be at the discretion of our board of directors, subject to applicable laws, and will depend on our financial condition, results of operations, capital requirements, general business conditions, and other factors that our board of directors considers relevant. |
| | |
Proposed NASDAQ Trading Symbol | We have applied for listing of ourOur ordinary shares are listed on the NASDAQ Capital Market (“NASDAQ”) under the symbol “AFH.” |
| |
TSX Venture Exchange Symbol | “AFH” |
| | |
| Risk factors | Investing in our ordinary shares involves substantial risk. You should carefully consider all the information in this prospectus prior to making a decision to invest in our ordinary shares. In particular, we urge you to consider carefully the factors set forth in the section of this prospectus entitled “Risk Factors” beginning on page 10.8. |
| |
| (1) | Ordinary shares outstanding prior to this offering includes 3,887,4691,262,471 restricted voting shares owned by Kingsway America Inc. or theirits wholly owned subsidiaries, all of which will automatically convert into ordinary shares upon sale pursuant hereto. |
Unless otherwise indicated, all information in this prospectus relating to the number of ordinary shares to be outstanding immediately after the completion of this offering:
excludes 1,327,834excludes: 1,190,405 ordinary shares issuable pursuant to warrants, all of which are exercisable within sixty days of the date hereof,hereof; 225,617 options, 103,138 of which are exercisable within sixty days of the date hereof, and 2,540,000254,000 ordinary shares issuable upon conversion of 20,000,0002,000,000 non-voting preferred shares outstanding as of the date hereof (based upon a conversion rate of 0.1270 as of the date hereof);.
includes 757,469 restricted voting common shares that will remain issued and outstanding following completion of this offering, assuming the sale of all shares offered by the selling shareholder under this prospectus, which rank equally with the ordinary shares as to dividends;
assumes no exercise by the underwriter of its option to purchase up to 694,500 additional shares from us; and
reflects the one-for-three reverse stock split to be effected prior to the offering.
SUMMARY CONSOLIDATED FINANCIAL DATA
The following table summarizes our consolidated financial data. We have derived the unaudited quarterly results for the years 20102011 and 20112012 from our audited consolidated financial statements for those years included elsewhere in this prospectus. The consolidated statements of income data for the ninesix months ended SeptemberJune 30, 20122013 have been derived from our unaudited consolidated financial statements for that period appearing elsewhere in this prospectus. The data for the first and second quarters of 2012 were derived from our unaudited consolidated financial statements for those periods, which are not part of this prospectus. In our opinion, such financial statements include all adjustments, consisting only of normal recurring adjustments, that we consider necessary for a fair presentation of the financial information set forth in those statements. Our historical results are not necessarily indicative of our results in any future period. The summary of our consolidated financial data set forth below should be read together with our consolidated financial statements and the related notes, as well as the sectionsections entitled “Management’s Discussion and Analysis of Financial Condition and Results of Operations,” included elsewhere in this prospectus.
| | | (in ‘000s, except per share data) | (in ‘000s, except per share data) | | | | | (in ‘000s, except per share data) | | |
| | 2012 | | 2011 | | 2010 | 2013 | 2012 | | 2011 |
| | Q3 | Q2 | Q1 | | Q4 | Q3 | Q2 | Q1 | | Q4 | Q3 | Q2 | Q1 | Q2 | Q1 | Q4 | Q3 | Q2 | Q1 | | Q4 | Q3 | Q2 | Q1 |
| Gross Premium Written | $ | 23,353 |
| $ | 9,242 |
| $ | 11,754 |
| | $ | 9,081 |
| $ | 10,928 |
| $ | 7,856 |
| $ | 14,166 |
| | $ | 9,273 |
| $ | 10,163 |
| $ | 8,558 |
| $ | 18,704 |
| |
| Net Premium Earned | 10,934 |
| 7,552 |
| 8,310 |
| | 9,079 |
| 8,797 |
| 9,062 |
| 8,809 |
| | 11,595 |
| 10,192 |
| 12,515 |
| 19,301 |
| |
| Gross premium written | | $ | 16,562 |
| $ | 22,354 |
| $ | 10,701 |
| $ | 23,353 |
| $ | 9,242 |
| $ | 11,754 |
| | $ | 9,081 |
| $ | 10,928 |
| $ | 7,856 |
| $ | 14,166 |
|
| Net premium earned | | 16,968 |
| 15,888 |
| 11,914 |
| 10,934 |
| 7,552 |
| 8,310 |
| | 9,079 |
| 8,797 |
| 9,062 |
| 8,809 |
|
| Underwriting income/(loss) | 264 |
| (868 | ) | (617 | ) | | (6,325 | ) | (1,729 | ) | (1,278 | ) | (1,906 | ) | | (4,723 | ) | (2,393 | ) | (12,805 | ) | (4,061 | ) | 828 |
| 298 |
| 305 |
| 264 |
| (868 | ) | (617 | ) | | (6,325 | ) | (1,729 | ) | (1,278 | ) | (1,906 | ) |
| Net income/(loss) attributable to Atlas | 1,657 |
| 130 |
| 135 |
| | (3,024 | ) | 1,066 |
| 193 |
| (705 | ) | | (11,430 | ) | (664 | ) | (8,135 | ) | (1,583 | ) | 1,701 |
| 602 |
| 1,244 |
| 1,657 |
| 130 |
| 135 |
| | (3,024 | ) | 1,066 |
| 193 |
| (705 | ) |
Net income/(loss) attributable to common shareholders(1) | 1,455 |
| (72 | ) | (64 | ) | | (3,228 | ) | 862 |
| (9 | ) | (905 | ) | | (11,430 | ) | (664 | ) | (8,135 | ) | (1,583 | ) | 1,476 |
| 326 |
| 1,042 |
| 1,455 |
| (72 | ) | (64 | ) | | (3,228 | ) | 862 |
| (9 | ) | (905 | ) |
Basic earnings/(loss) per common share(1) | $ | 0.24 |
| $ | (0.01 | ) | $ | — |
| | $ | (0.53 | ) | $ | 0.14 |
| $ | — |
| $ | (0.15 | ) | | $ | (1.86 | ) | $ | (0.11 | ) | $ | (1.33 | ) | $ | (0.26 | ) | $ | 0.18 |
| $ | 0.05 |
| $ | 0.17 |
| $ | 0.24 |
| $ | (0.01 | ) | $ | — |
| | $ | (0.53 | ) | $ | 0.14 |
| $ | — |
| $ | (0.15 | ) |
Diluted earnings/(loss) per common share(1) | $ | 0.24 |
| $ | (0.01 | ) | $ | — |
| | $ | (0.53 | ) | $ | 0.14 |
| $ | — |
| $ | (0.15 | ) | | $ | (1.86 | ) | $ | (0.11 | ) | $ | (1.33 | ) | $ | (0.26 | ) | $ | 0.16 |
| $ | 0.04 |
| $ | 0.15 |
| $ | 0.24 |
| $ | (0.01 | ) | $ | — |
| | $ | (0.53 | ) | $ | 0.14 |
| $ | — |
| $ | (0.15 | ) |
| |
| (1) | References to “common shares” and “common shareholders” refer to both the ordinary shares and restricted voting common shares and the shareholders of each. The restricted voting common shares rank equally with the ordinary shares as to dividends. |
| | | | Nine Months Ended September 30, | Year Ended December 31, | Six Months Ended June 30, | Year Ended December 31, |
| | 2012 | 2011 | 2010 | 2013 | 2012 | 2013 | 2012 |
| Gross Premium Written | $ | 44,349 |
| $ | 32,951 |
| $ | 42,031 |
| $ | 46,698 |
| |
| Net Premium Earned | 26,795 |
| 26,668 |
| 35,747 |
| 53,603 |
| |
| Underwriting loss | (1,222 | ) | (4,913 | ) | (11,238 | ) | (23,984 | ) | |
| Gross premium written | | $ | 38,915 |
| $ | 20,996 |
| $ | 55,050 |
| $ | 42,031 |
|
| Net premium earned | | 32,856 |
| 15,861 |
| 38,710 |
| 35,747 |
|
| Underwriting income/(loss) | | 1,126 |
| (1,486 | ) | (916 | ) | (11,238 | ) |
| Net income/(loss) attributable to Atlas | 1,922 |
| 555 |
| (2,470 | ) | (21,812 | ) | 2,302 |
| 265 |
| 3,166 |
| (2,470 | ) |
Net income/(loss) attributable to common shareholders (1) | 1,316 |
| (51 | ) | (3,280 | ) | (21,812 | ) | 1,802 |
| (137 | ) | 2,356 |
| (3,280 | ) |
Basic earnings/(loss) per common share (1) | $ | 0.21 |
| $ | (0.01 | ) | $ | (0.54 | ) | $ | (3.56 | ) | $ | 0.24 |
| $ | (0.02 | ) | $ | 0.38 |
| $ | (0.54 | ) |
Diluted earnings/(loss) per common share (1) | 0.21 |
| (0.01 | ) | (0.54 | ) | (3.56 | ) | 0.22 |
| (0.02 | ) | 0.38 |
| (0.54 | ) |
| |
| (1) | References to “common shares” and “common shareholders” refer to both the ordinary shares and restricted voting common shares and the shareholders of each. The restricted voting common shares rank equally with the ordinary shares as to dividends. |
RISK FACTORS
Investing in our ordinary shares involves a high degree of risk. You should consider carefully the risks and uncertainties described below, together with all of the other information in this prospectus, including the financial statements and the related notes included elsewhere in this prospectus, before deciding whether to invest in our ordinary shares. The risks and uncertainties described below are not the only ones we face. Additional risks and uncertainties that we are unaware of, or that we currently believe are not material, may also become important factors that adversely affect our business. If any of the following risks actually occurs, our business, financial condition, results of operations, and future prospects could be materially and adversely affected. In that event, the market price of our ordinary shares could decline, and you could lose part or all of your investment.
The insurance subsidiaries’ provisions for unpaid claims may be inadequate, which would result in a reduction in our net income and might adversely affect our financial condition.
Our success depends upon our ability to accurately assess and price the risks covered by the insurance policies that we write. We establish reserves to cover our estimated liability for the payment of losses and expenses related to the administration of claims incurred on the insurance policies we write. Establishing an appropriate level of reserves is an inherently uncertain process. Our provisions for unpaid claims do not represent an exact calculation of actual liability, but are estimates involving actuarial and statistical projections at a given point in time of what we expect to be the cost of the ultimate settlement and administration of known and unknown claims. The process for establishing the provision for unpaid claims reflects the uncertainties and significant judgmental factors inherent in estimating future results of both known and unknown claims and as such, the process is inherently complex and imprecise. We utilize a third party actuarial firm to assist us in estimating the provision for unpaid claims. These estimates are based upon various factors, including:
actuarial and statistical projections of the cost of settlement and administration of claims reflecting facts and circumstances then known;
historical claims information;
assessments of currently available data;
estimates of future trends in claims severity and frequency;
judicial theories of liability;
economic factors such as inflation;
estimates and assumptions regarding judicial and legislative trends, and actions such as class action lawsuits and judicial interpretation of coverages or policy exclusions; and
the level of insurance fraud.
Most or all of these factors are not directly quantifiable, particularly on a prospective basis, and the effects of these and unforeseen factors could negatively impact our ability to accurately assess the risks of the policies that we write. In addition, there may be significant reporting lags between the occurrence of the insured event and the time it is actually reported to the insurer and additional lags between the time of reporting and final settlement of claims. Unfavorable development in any of these factors could cause the level of reserves to be inadequate. The following factors may have a substantial impact on future claims incurred:
the amounts of claims payments;
the expenses that the insurance subsidiaries incur in resolving claims;
legislative and judicial developments; and
changes in economic conditions, including inflation.
As time passes and more information about the claims becomes known, the estimates are adjusted upward or downward to reflect this additional information. Because of the elements of uncertainty encompassed in this estimation process, and the extended time it can take to settle many of the more substantial claims, several years of experience may be required before a meaningful comparison can be made between actual losses and the original provision for unpaid claims. The development of the provision for unpaid claims is shown by the difference between estimates of claims as of the initial year end and the re-estimated liability at each subsequent year end. Favorable development (reserve redundancy) means that the original claims estimates were higher than subsequently determined or re-estimated. Unfavorable development (reserve deficiency) means that the original claims estimates were lower than subsequently determined or re-estimated.
For example, at the end of 2010, a detailed review of claim payment and reserving practices was performed, which led to significant changes in both practices, increasing ultimate loss estimates and accelerating claim payments. Reserves wereWe recorded a total of
adjusted at that time by approximately $2.3$5.3 million in unfavorable reserve development in 2010 related to account for these changes, primarilyclaims incurred during the second and third quarters of 2010. Thisprior periods. Our review continued into 2011 and Atlas recorded a $1.8 million adjustment to further strengthen its reserves for claims related to policies issued while the insurance subsidiaries were under previous ownership in years preceding 2010. We cannot guarantee that we will not have additional unfavorable reserve developments in the future. In addition, we may in the future acquire other insurance companies. We cannot guarantee that the provisions for unpaid claims of the companies that we acquire are or will be adequate. Government regulators could require that we increase reserves if they determine that provisions for unpaid claims are understated. Increases to the provision for unpaid claims causes a reduction in our insurance subsidiaries’ surplus which could cause a downgrading of our insurance subsidiaries’ ratings. Any such downgrade could, in turn, adversely affect their ability to sell insurance policies.
In recent periods, Gateway has recorded material reserve deficiencies, and its reserves may be inadequate to pay claims, which could result in a reduction of our net income and might adversely affect our financial position.
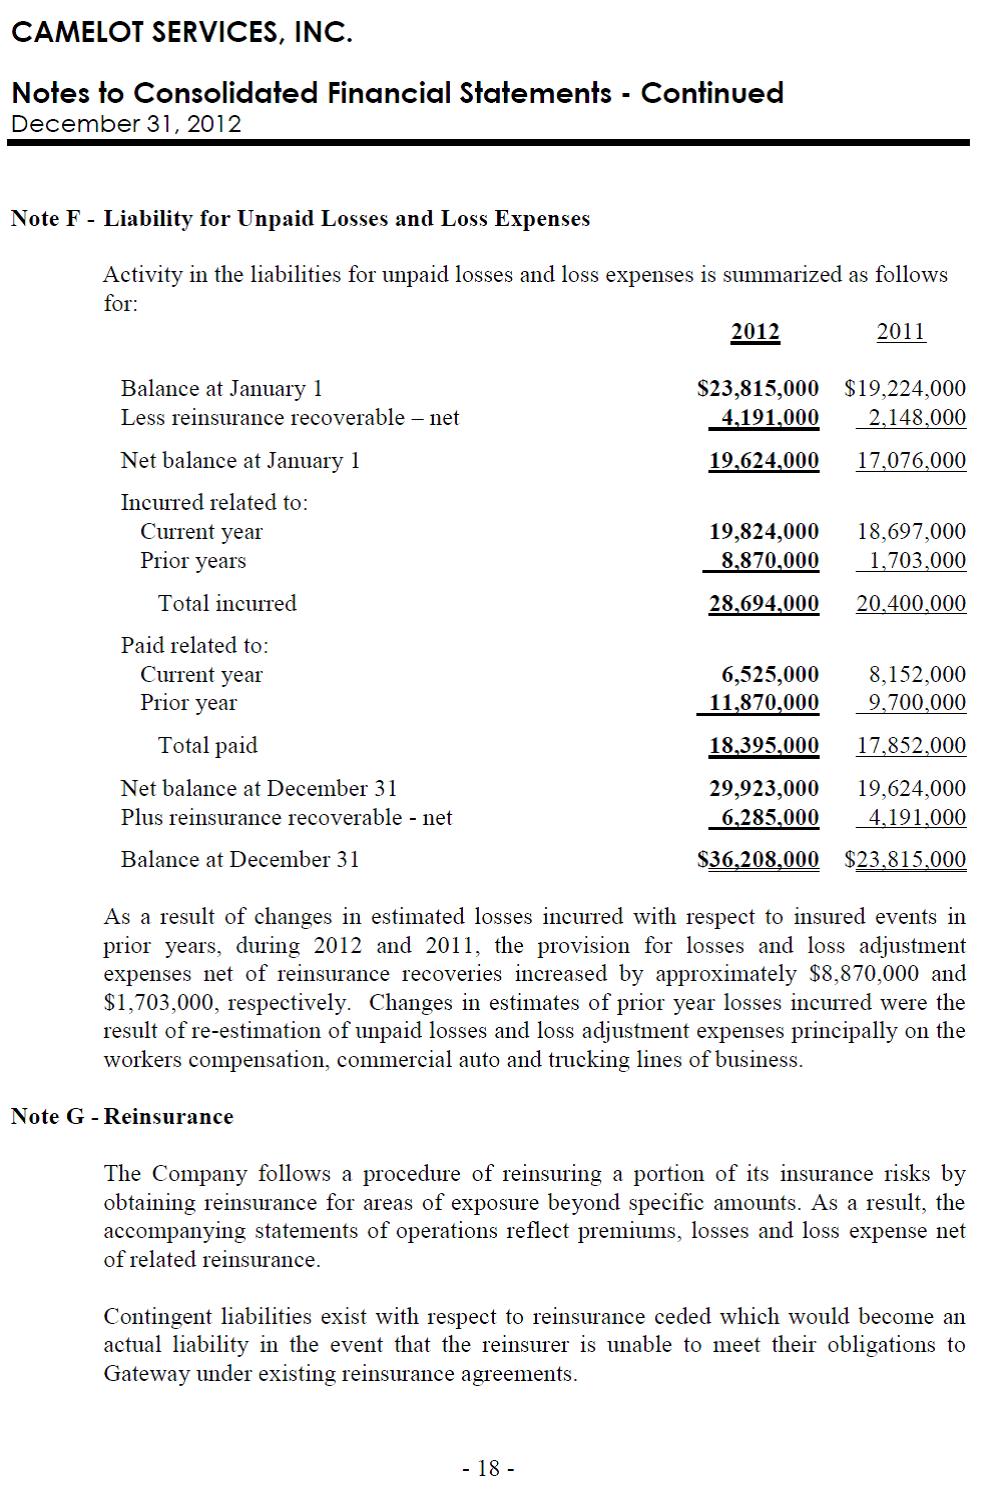
We became responsible for the historical loss reserves established by Gateway’s management upon completion of the Gateway acquisition. While the stock purchase agreement provides for certain protections in this regard, there can be no assurances they will be sufficient to offset any further adverse development to Gateway’s historical loss reserves. Gateway recognized approximately $8.0$6.4 million in reserve strengthening in the third and fourth quarterquarters of 2012. During the years ended 2011 and 2010, their provision for losses and loss adjustment expenses net of reinsurance recoveries increased by approximately $1.7 million and $2.4 million, respectively, as a result of changes in estimated losses incurred with respect to insured events in prior years. Any such further adverseunfavorable development in Gateway’s reserves would reduce our net income and have an adverse effect on our financial position.
Our success depends on our ability to accurately price the risks we underwrite.
Our results of operations and financial condition depend on our ability to underwrite and set premium rates accurately for a wide variety of risks. Adequate rates are necessary to generate premiums sufficient to pay losses, loss settlement expenses and underwriting expenses and to earn a profit. To price our products accurately, we must collect and properly analyze a substantial amount of data; develop, test and apply appropriate pricing techniques; closely monitor and timely recognize changes in trends; and project both severity and frequency of losses with reasonable accuracy. Our ability to undertake these efforts successfully, and as a result price our products accurately, is subject to a number of risks and uncertainties, some of which are outside our control, including:
the availability of sufficient reliable data and our ability to properly analyze available data;
the uncertainties that inherently characterize estimates and assumptions;
our selection and application of appropriate pricing techniques; and
changes in applicable legal liability standards and in the civil litigation system generally.
Consequently, we could under priceunderprice risks, which would adversely affect our profit margins, or we could overprice risks, which could reduce our sales volume and competitiveness. In either case, our profitability could be materially and adversely affected.
Our insurance subsidiaries rely on independent agents and other producers to bind insurance policies on and to collect premiums from our policyholders, which exposes us to risks that our producers fail meet their obligations to us.
Our insurance subsidiaries market and distribute automobile insurance products through a network of independent agents and other producers in the United States. Gateway also relies on independent agents to distribute its insurance products and we do not have existing relationships with many of Gateway’s independent agents. We rely, and will continue to rely, heavily on these producers to attract new business. Independent producers generally have the ability to bind insurance policies and collect premiums on our behalf, actions over which we have a limited ability to exercise preventative control. In the event that an independent agent exceeds their authority by binding us on a risk that does not comply with our underwriting guidelines, we may be at risk for that policy until we effect a cancellation. Any improper use of such authority may result in losses that could have a material adverse effect on our business, results of operations and financial condition. In addition, in accordance with industry practice, policyholders often pay the premiums for their policies to producers for payment to us. These premiums may be considered paid when received by the producer and thereafter the customer is no longer liable to us for those amounts, whether or not we have actually received these premium payments from the producer. Consequently, we assume a degree of risk associated with our reliance on independent agents in connection with the settlement of insurance premium balances.
Our insurance subsidiaries may be unable to mitigate their risk or increase their underwriting capacity through reinsurance arrangements, which could adversely affect our business, financial condition and results of operations. If reinsurance rates
rise significantly or reinsurance becomes unavailable or reinsurers are unable to pay our claims, we may be adversely affected.
In order to reduce underwriting risk and increase underwriting capacity, our insurance subsidiaries transfer portions of our insurance risk to other insurers through reinsurance contracts. We generally purchase reinsurance from third parties in order to reduce our liability on individual risks. Reinsurance does not relieve us of our primary liability to our insurance subsidiaries’ insureds. Through the ninesix month period ended SeptemberJune 30, 2012,2013, we had ceded premium written of $4.98.7 million to our reinsurers. The availability, cost and structure of reinsurance protection are subject to prevailing market conditions that are outside of our control and which may affect our level of business and profitability. Our company’s ability to provide insurance at competitive premium rates and coverage limits on a continuing basis depends in part upon the extent to which we can obtain adequate reinsurance in amounts and at rates that will not adversely affect our competitive position. There are no assurances that we will be able to maintain our current reinsurance facilities, which generally are subject to annual renewal. If we are unable to renew any of these facilities upon their expiration or to obtain other reinsurance facilities in adequate amounts and at favorable rates, we may need to modify our company’s underwriting practices or reduce our company’s underwriting commitments, which could adversely affect our results of operations.
Our insurance subsidiaries are subject to credit risk with respect to the obligations of reinsurers and certain of our insureds. The inability of our risk sharing partners to meet their obligations could adversely affect our profitability.
Although the reinsurers are liable to us to the extent of risk ceded to them, we remain ultimately liable to policyholders on all risks, even those reinsured. As a result, ceded reinsurance arrangements do not limit our ultimate obligations to policyholders to pay claims. We are subject to credit risks with respect to the financial strength of our reinsurers. We are also subject to the risk that their reinsurers may dispute their obligations to pay our claims. As a result, we may not recover sufficient amounts for claims that we submit to reinsurers, if at all. As of SeptemberAt June 30, 2012,2013, we had an aggregate of $7.023.8 million of unsecured reinsurance recoverables. In addition, our reinsurance agreements are subject to specified limits and we would not have reinsurance coverage to the extent that it exceeds those limits.
Effective immediately after the close of the Gateway transaction, we entered into a reinsurance agreement with a third party reinsurer, which covers all in-force premium and loss reserves for Gateway’s workers’ compensation program. Along with the reserves, any go-forward premium written for the workers’ compensation program will be ceded in its entirety to this third party reinsurer under the terms of this reinsurance agreement. While Gateway will remain liable to its insureds, we expect to have no net exposure to any losses related to this workers’ compensation business subsequent to the effective date of the acquisition, provided the reinsurer continues to make payments to us and otherwise complies with the terms of this reinsurance agreement, although no assurances thereof can be given.
With respect to insurance programs, the insurance subsidiaries are subject to credit risk with respect to the payment of claims and on the portion of risk exposure either ceded to captives established by their clients or deductibles retained by their clients. No assurance can be given regarding the future ability of these entities to meet their obligations. The inability of our risk sharing partners to meet their obligations could adversely affect our profitability.
The exclusions and limitations in our policies may not be enforceable.
Many of the policies we issue include exclusions or other conditions that define and limit coverage, which exclusions and conditions are designed to manage our exposure to certain types of risks and expanding theories of legal liability. In addition, many of our policies limit the period during which a policyholder may bring a claim under the policy, which period in many cases is shorter than the statutory period under which these claims can be brought by our policyholders. While these exclusions and limitations help us assess and control our loss exposure, it is possible that a court or regulatory authority could nullify or void an exclusion or limitation, or legislation could be enacted modifying or barring the use of these exclusions and limitations. This could result in higher than anticipated losses and claims handling expenses by extending coverage beyond our underwriting intent or increasing the number or size of claims, which could have a material adverse effect on our operating results. In some instances, these changes may not become apparent until some time after we have issued the insurance policies that are affected by the changes. As a result, the full extent of liability under our insurance contracts may not be known for many years after a policy is issued.
The occurrence of severe catastrophic events may have a material adverse effect on our financial results and financial condition.
Although our business strategy generally precludes us from writing significant amounts of catastrophe exposed business, most property and casualty insurance contains some exposure to catastrophic loss. We have only limited exposure to natural and
man-made disasters, such as hurricane, typhoon, windstorm, flood, earthquake, acts of war, acts of terrorism and political instability. While we carefully manage our aggregate exposure to catastrophes, modeling errors and the incidence and severity
of catastrophes, such as hurricanes, windstorms and large-scale terrorist attacks are inherently unpredictable, and our losses from catastrophes could be substantial. In addition, it is possible we may experience an unusual frequency of smaller losses in a particular period. In either case, the consequences could be substantial volatility in our financial condition or results of operations for any fiscal quarter or year, which could have a material adverse effect on our our ability to write new business. These losses could deplete our shareholders’ equity. Increases in the values and geographic concentrations of insured property and the effects of inflation have resulted in increased severity of industry losses from catastrophic events in recent years and we expect that those factors will increase the severity of catastrophe losses in the future. Though we built an expanded presence in New York during the third quarter of 2012, we do not believe our exposure in that state to Hurricane Sandy to be material.
The risk models we use to quantify catastrophe exposures and risk accumulations may prove inadequate in predicting all outcomes from potential catastrophe events.
We use widely accepted and industry-recognized catastrophe risk modeling programs to help us quantify our aggregate exposure to any one event. As with any model of physical systems, particularly those with low frequencies of occurrence and potentially high severity of outcomes, the accuracy of the model’s predictions is largely dependent on the accuracy and quality of the data provided in the underwriting process and the judgments of our employees and other industry professionals. These models do not anticipate all potential perils or events that could result in a catastrophic loss to us. Furthermore, it is often difficult for models to anticipate and incorporate events that have not been experienced during or as a result of prior catastrophes. Accordingly, it is possible for us to be subject to events or contingencies that have not been anticipated by our catastrophe risk models and which could have a material adverse effect on our reserves and results of operations.
Financial Risks
We are a holding company dependent on the results of operations of our subsidiaries and their ability to pay dividends and other distributions to us.
Atlas is a holding company with no significant operations of its own and a legal entity separate and distinct from our company’s insurance subsidiaries. As a result, our company’s only sources of income are dividends and other distributions from our insurance subsidiaries. We will be limited by the earnings of those subsidiaries, and the distribution or other payment of such earnings to it in the form of dividends, loans, advances or the reimbursement of expenses. The payment of dividends, the making of loans and advances or the reimbursement of expenses by our insurance subsidiaries is contingent upon the earnings of those subsidiaries and is subject to various business considerations and various statutory and regulatory restrictions imposed by the insurance laws of the domiciliary jurisdiction of such subsidiaries. In Illinois and Missouri, the states of domicile of American Service, American Country and Gateway, dividends may only be paid out of earned surplus and cannot be paid when the surplus of the company fails to meet minimum requirements or when payment of the dividend or distribution would reduce its surplus to less than the minimum amount. The state insurance regulator must be notified in advance of the payment of an extraordinary dividend and be given the opportunity to disapprove any such dividend. Our insurance subsidiaries cannot currently pay any dividends to Atlas without regulatory approval. In addition, prior to entering into any loan or certain other agreements between one or more of our insurance companies and Atlas or our other affiliates, advance notice must be provided to the state insurance regulator and the insurance regulator has the opportunity to disapprove such loan or agreement. Additionally, insurance regulators have broad powers to prevent reduction of statutory capital and surplus to inadequate levels and could refuse to permit the payment of dividends calculated under any applicable formula. As a result, we may not be able to receive dividends or other distributions from our insurance subsidiaries at times and in amounts necessary to meet our operating needs, to pay dividends to shareholders or to pay corporate expenses. The inability of our insurance subsidiaries to pay dividends or make other distributions could have a material adverse effect on our business and financial condition.
Our insurance subsidiaries are subject to minimum capital and surplus requirements. Failure to meet these requirements couldmay subject us to regulatory action.
Our insurance company subsidiaries are subject to minimum capital and surplus requirements imposed under the laws of Illinois and Missouri, as well as each state in which they issue policies. Any failure by one of our insurance subsidiaries to meet minimum capital and surplus requirements imposed by applicable state law willmay subject it to corrective action, which may include requiring adoption of a comprehensive financial plan, revocation of its license to sell insurance products or placing the subsidiary under state regulatory control. Any new minimum capital and surplus requirements adopted in the future may require us to increase the capital and surplus of our insurance company subsidiaries, which we may not be able to do. Upon the completion of the Gateway acquisition, we became subject to minimum capital and surplus requirements imposed under the laws of Missouri with regard to Gateway and the additional states where Gateway issues policies.
The pro forma financial statements included in this prospectus are presented for illustrative purposes only and may not be an indication of the combined company’s future financial condition or results of operations.
The pro forma financial statements contained in this prospectus, relating to the Gateway acquisition, are presented for illustrative purposes only and may not be an indication of the combined company’s future financial condition or results of operations for several reasons. For example, the pro forma financial statements have been derived from the historical financial statements of Atlas and Gateway and certain adjustments, estimates and assumptions have been made regarding the combined company after giving effect to the acquisition. The information upon which these adjustments and assumptions have been made is preliminary, and these kinds of adjustments and assumptions are difficult to make with accuracy. Moreover, the pro forma financial statements do not reflect all costs that are expected to be incurred by the combined company in connection with the acquisition. For example, the impact of any incremental costs incurred in integrating the businesses of the two companies is not reflected in the pro forma financial statements. As a result, the actual financial condition and results of operations of the combined company may not be consistent with, or evident from, these pro forma financial statements.
In addition, the assumptions used in preparing the pro forma financial data, as well as the 2012 Fourth Quarter Premium Written data, may not prove to be accurate, and other factors may affect the combined company’s financial condition or results of operations. Any potential decline in the combined company’s financial condition or results of operations may cause significant variations in the stock price of the combined company. See “Unaudited Pro Forma Condensed Combined Financial Data.”
We are subject to assessments and other surcharges from state guaranty funds, and mandatory reinsurance arrangements and state insurance facilities, which may reduce our profitability.
Virtually all states require insurers licensed to do business therein to bear a portion of contingent and incurred claim handling expenses and the unfunded amount of “covered” claim and unearned premium obligations of impaired or insolvent insurance companies.companies, either up to the policy's limit, the applicable guaranty fund covered claim obligation cap, or 100% of statutorily defined workers' compensation benefits, subject to applicable deductibles. These obligations are funded by assessments, made on a retrospective, prospective or prefunded basis, which are levied by guaranty associations within the state, up to prescribed limits (typically 2% of “net direct written premium”), on all member insurers in the state on the basis of the proportionate share of the premiums written by member insurers in thecertain covered lines of business in which the impaired, insolvent or failed insurer was engaged. Accordingly, the total amount of assessments levied on us by the states in which we are licensed to write insurance may increase as we increase our premiums written. In addition, as a condition to the ability to conduct business in certain states (and within the jurisdiction of some local governments), insurance companies are subject to or required to participate in various premium or loss based insurance-related assessments, including mandatory (a/k/a “involuntary”) insurance pools, underwriting associations, workers' compensation second-injury funds, reinsurance funds. Thefunds and other state insurance facilities. Although we may be entitled to take premium tax credit (or offsets), recover policy surcharges or include assessments in future premium rate structures for payments we make under these facilities, the effect of these assessments and mandatory reinsuranceinsurance-related arrangements, or changes in them, could reduce our profitability in any given period or limit our ability to grow our business.
Market fluctuations, changes in interest rates or a need to generate liquidity could have significant and negative effects on our investment portfolio. We may not be able to realize our investment objectives, which could significantly reduce our net income.
We depend on income from our securities portfolio for a substantial portion of our earnings. Investment returns are an important part of our overall profitability. A significant decline in investment yields in the securities portfolio or an impairment of securities owned could have a material adverse effect on our business, results of operations and financial condition. We currently maintain and intend to continue to maintain a securities portfolio comprised primarily of fixed income securities. As of SeptemberJune 30, 2012,2013, our investment portfolio was predominantly invested in fixed income securities. We cannot predict which industry sectors in which we maintain investments may suffer losses as a result of potential declines in commercial and economic activity, or how any such decline might impact the ability of companies within the affected industry sectors to pay interest or principal on their securities and cannot predict how or to what extent the value of any underlying collateral might be affected. Accordingly, adverse fluctuations in the fixed income or equity markets could adversely impact profitability, financial condition or cash flows. Historically, we have not had the need to sell our investments to generate liquidity. If we are forced to sell portfolio securities that have unrealized losses for liquidity purposes rather than holding them to maturity or recovery, we would recognize investment losses on those securities when that determination was made.
Our ability to achieve our investment objectives is affected by general economic conditions that are beyond our control. General economic conditions can adversely affect the markets for interest rate sensitive securities, including the extent and timing of investor participation in such markets, the level and volatility of interest rates and, consequently, the value of fixed maturity securities. U.S. and global markets have been experiencing volatility since mid-2007. Initiatives taken by the U.S. and foreign governments have helped to stabilize the financial markets and restore liquidity to the banking system and credit markets. In addition, markets in the United States and around the world experienced volatility in 2011 due, in part, to sovereign debt downgrades. Although economic conditions and financial markets have somewhat stabilized, if market conditions were to deteriorate, our investment portfolio could be adversely affected.
14At June 30, 2013, a portion of Atlas' portfolio was in an unrealized loss position. This was primarily driven by a rise in the 5-year US Treasury interest rate during the second quarter of 2013. All securities in an unrealized loss position as of June 30, 2013 and December 31, 2012 have been in said position for less than 12 months. The total fair value of the securities currently in an unrealized loss position is $89.2 million, with a current unrealized loss amount of $1.8 million. Atlas has the ability and intent to hold these securities until their fair value is recovered. While Atlas does not expect the near term change in market value of these securities to be realized, further adjustments to the US Treasury rates could result in realized losses on these investments.
Difficult conditions in the economy generally may materially and adversely affect our business, results of operations and statement of financial position and these conditions may not improve in the near future.
Current market conditions and the instability in the global financial markets present additional risks and uncertainties for our business. In particular, deterioration in the public debt markets could lead to additional investment losses and an erosion of capital as a result of a reduction in the fair value of investment securities. The severe downturn in the public debt and equity markets, reflecting uncertainties associated with the mortgage crisis, worsening economic conditions, widening of credit
spreads, bankruptcies and government intervention in large financial institutions, created significant unrealized losses in our securities portfolio at certain stages in 2009.
Economic uncertainty has recently been exacerbated by the increased potential for default by one or more European sovereign debt issuers, the potential partial or complete dissolution of the Eurozone and its common currency and the negative impact of such events on global financial institutions and capital markets generally. Actions or inactions of European governments may impact these actual or perceived risks. In the U.S. during 2011, one rating agency downgraded the U.S.’s long-term debt credit rating from AAA. Future actions or inactions of the United States government, including a shutdown of the federal government, could increase the actual or perceived risk that the U.S. may not ultimately pay its obligations when due and may disrupt financial markets.
Atlas’ portfolio is managed by Asset Allocation Management (“AAM”), an SEC registered investment advisor specializing in the management of insurance company portfolios. We and our investment manager consider these issues in connection with current asset allocation decisions with the object of avoiding them going forward. However, depending on market conditions going forward, we could again incur substantial realized and additional unrealized losses in future periods, which could have an adverse impact on the results of operations and financial condition. There can be no assurance that the current market conditions will improve in the near future. We could also experience a reduction in capital in the insurance subsidiaries below levels required by the regulators in the jurisdictions in which we operate. Certain trust accounts for the benefit of related companies and third parties have been established with collateral on deposit under the terms and conditions of the relevant trust agreements. The value of collateral could fall below the levels required under these agreements, putting the subsidiary or subsidiaries in breach of the agreement.
We may not have access to capital in the future.
We may need new or additional financing in the future to conduct our operations or expand our business. However, we may be unable to raise capital on favorable terms, or at all, including as a result of disruptions, uncertainty and volatility in the global credit markets, or due to any sustained weakness in the general economic conditions and/or financial markets in Canada, the United States or globally. From time-to-time,time to time, we may rely on access to financial markets as a source of liquidity for operations, acquisitions and general corporate purposes.
The limited public float and trading volume for our shares may have an adverse impact on the share price or make it difficult to liquidate.
Our securities are held by a relatively small number of shareholders. Future sales of substantial amounts of our shares in the public market, or the perception that these sales could occur, may adversely impact the market price of our shares and our shares could be difficult to liquidate.
Our ordinary shares will be listed on both the TSXV and the NASDAQ which may increase the volatility of our ordinary share price on both exchanges.
Upon completion of the offering, we expect our ordinary shares to be dual listed on NASDAQ and the TSX Venture Exchange. However, once our ordinary shares are dual listed, the trading volume of our ordinary shares on each particular exchange may decrease. As a result of this diminished trading volume, the stock price of our ordinary shares may be more volatile.
Our business depends upon key employees, and if we are unable to retain the services of these key employees or to attract and retain additional qualified personnel, our business may suffer.
Our operations depend, to a great extent, upon the ability of executive management and other key employees to implement our business strategy and our ability to attract and retain additional qualified personnel in the future. The loss of the services of any of our key employees, or the inability to identify, hire and retain other highly qualified personnel in the future could adversely affect the quality and profitability of our business operations. In addition, our companywe must forecast volume and other factors in changing business environments with reasonable accuracy and adjust our hiring and employment levels accordingly. Our
failure to recognize the need for such adjustments, or our failure or inability to react appropriately on a timely basis, could lead our company either to over-staffing (which could adversely affect our cost structure) or under-staffing (which could impair our ability to service current product lines and new lines of business). In either event, our financial results and customer relationships could be adversely affected.
Compliance Risks
We are subject to comprehensive regulation, and our results may be unfavorably impacted by these regulations.
As a holding company which owns insurance companies domiciled in the United States, we and our insurance subsidiaries are subject to comprehensive laws, regulations and regulations.rules. These laws, regulations and regulationsrules generally delegate regulatory, supervisory and administrative powers to state insurance regulators. Insurance regulations are generally designed to protect policyholders rather than shareholders, and are related to matters including:
rate setting;
the National Association of Insurance Commissioner’s Risk Based Capital (RBC) ratio and solvency standards, as adopted by the state insurance departments which regulate our subsidiaries;requirements;
restrictions on the amount, type, nature, quality and quantity of securities and other investments in which insurers may invest;
the maintenance of adequate reserves for unearned premiums and unpaid, and incurred but not reported, claims;
restrictions on the types of terms that can be included in insurance policies;
standards for accounting;
marketing practices;
claims settlement practices;
the examination of insurance companies by regulatory authorities, including periodic financial and market conduct examinations;
requirements to comply with medical privacy laws as a result of our administration of Gateway's run-off workers' compensation business;
the licensing of insurers and their agents;
limitations on dividends and transactions with affiliates;
approval of certain reinsurance transactions;
insolvency proceedings;
ability to enter and exit certain insurance markets, cancel policies or non-renew policies; and
insolvency proceedings.data privacy.
Such ruleslaws, regulations and regulations are expected torules increase our legal and financial compliance costs and to make some activities more time-consuming and costly. A significant amount of resources have been committedAny failure to monitor and address any internal control issues and failure to do so could adversely impact operating results. In addition, the Sarbanes-Oxley Act requires, among other things, that we maintain effective disclosure controls and procedures and internal control over financial reporting. A deficiency in internal control exists when the design or operation of a control does not allow management or employees, in the normal course of performing their assigned functions, to prevent or detect and correct misstatements on a timely basis. A significant deficiency is a deficiency, or combination of deficiencies, in internal control that is less severe than a material weakness, yet important enough to merit attention by those charged with governance. A material weakness is a deficiency, or combination of deficiencies, in internal control, such that there is a reasonable possibility that a material misstatement of the entity's financial statements will not be prevented, or detected and corrected on a timely basis.
State insurance departments also conduct periodic examinations of the affairs of insurance companies and require filing of annual and other reports relating to the financial condition of insurance companies, holding company issues and other matters. Our business depends on compliance with applicable laws, regulations and regulationsrules and our ability to maintain valid licenses and approvals for our operations. Regulatory authorities may deny or revoke licenses for various reasons, including violations of regulations.laws, regulations and rules. Changes in the level of regulation of the insurance industry or changes in laws, or regulations and rules themselves or interpretations thereof by regulatory authorities could have a material adverse affecteffect on our operations. Because we are subject to insurance laws, regulations and rules of many jurisdictions that are administered by different regulatory and governmental authorities, there is also a risk that one authority's interpretation of a legal or regulatory issue may conflict with another authority's interpretation of the same issue. Insurance companies are also subject to “desk drawer rules” of state insurance regulators, which are regulatory rules that have not been codified or formally adopted through regulatory proceedings. In addition, we could face individual, group and class-action lawsuits by our policyholders and others for alleged violations of certain state laws, regulations and regulations.rules. Each of these regulatory risks could have an adverse effect on our profitability.
As a result of our administration of Gateway's run-off workers' compensation business, we are required to comply with state and federal laws governing the collection, transmission, security and privacy of health information that require significant compliance costs, and any failure to comply with these laws could result in material criminal and civil penalties. These laws and rules are subject to administrative interpretation and many are derived from the privacy provisions in the Federal Gramm-Leach-Bliley Act of 2002. The Gramm-Leach-Bliley Act, which, among other things, protects consumers from the unauthorized dissemination of certain personal information, and various state laws and regulations addressing privacy issues, require us to maintain appropriate procedures for managing and protecting certain personal information of our customers and to fully disclose our privacy practices to our customers. Given the complexity of these privacy regulations, the possibility that the regulations may change, and the fact that the regulations are subject to changing and potentially conflicting interpretation, our ability to maintain compliance with the privacy requirements of state and federal law is uncertain and the costs of compliance are significant.
In addition, Gateway is exiting the workers' compensation line of business across the country and we plan to exit the Florida market completely. Most states have adopted either statutes or regulations or have issued bulletins or informal rules that regulate the anticipated withdrawal of a product, line or subline of insurance business from the insurance marketplace in their state. While what constitutes a “withdrawal” or its equivalent under each state's statutory or regulatory scheme varies, Gateway will be subject to regulatory requirements in connection with its withdrawal, including, but not limited to, making notice and/or plan filings with the applicable insurance regulator in certain states and possibly requiring the prior approval of the applicable state regulator. A failure by Gateway to comply with and satisfy these regulatory requirements in connection with its planned withdrawals could lead to regulatory fines, cause a distraction for management requiring us to continue to administer Gateway's workers' compensation business for longer than anticipated and could result in Gateway continuing to write undesirable commercial automobile business in Florida, which could have an adverse impact on our reserves, results of operations and financial condition.
It is not possible to predict the future impact of changing federal and state regulation on our operations, and there can be no assurance that laws and regulations enacted in the future will not be more restrictive than existing laws, regulations and regulations.rules. New or more restrictive laws, regulations and rules, including changes in current tax or other regulatory interpretations affecting an alternative risk transfer insurance model, could make it more expensive for our companyus to conduct our businesses, restrict or reduce the premiums our insurance subsidiaries are able to charge or otherwise change the way it doeswe do business. In addition, economic and financial market turmoil or other conditions, circumstances or events may result in U.S. federal oversight of the insurance industry in general.
Our business is subject to risks related to litigation and regulatory actions.
We may, from time-to-timetime to time, be subject to a variety of legal and regulatory actions relating to our current and past business operations, including, but not limited to:
disputes over coverage or claims adjudication, including claims alleging that we or our insurance subsidiaries have acted in bad faith in the administration of claims by our policyholders;
disputes regarding sales practices, disclosure, policy issuance and cancellation, premium refunds, licensing, regulatory compliance and compensation arrangements;
limitations on the conduct of our business;
disputes with our agents, producers or network providers over compensation andor the termination of our contracts and related claims;with such agents, producers or network providers, including any alleged claim that they may make against us in connection with a dispute whether in the scope of their agreements or otherwise;
disputes with taxing authorities regarding tax liabilities; and
disputes relating to certain businesses acquired or disposed of by us.
As insurance industry practices and regulatory, judicial and industry conditions change, unexpected and unintended issues related to pricing, claims, coverage and business practices may emerge. Plaintiffs often target P&C insurers in purported class action litigation relating to claims handling and insurance sales practices. The resolution and implications of new underwriting, claims and coverage issues could have a negative effect on our business by extending coverage beyond our underwriting intent, increasing the size of claims or otherwise requiring themus to change theirour practices. The effects of unforeseen emerging claim and coverage issues could negatively impact revenues, results of operations and reputation. Current and future court decisions and legislative activity may increase our exposure to these or other types of claims. Multi-party or class action claims may present additional exposure to substantial economic, non-economic or punitive damage awards. The loss ofAn unfavorable result with respect to even one of these claims, if it resulted in a significant damage award or a judicial ruling that was otherwise detrimental, could create a precedent in the industry that could have a material adverse effect on our results of operations and financial condition. This risk of potential liability may make reasonable settlements of claims more difficult to obtain. We cannot determine with any certainty what new theories of recovery may evolve or what their impact may be on our business.
We have been and may be subject to governmental or administrative investigations and proceedings in the context of our highly regulated sectors of activity. For example, ourproceedings. Our insurance subsidiaries have been subject to numerous inquiries related to the substantial ownership interest in us held by KAI.KAI in the past. We are currently subject to regulatory action, restrictions or heightened compliance or reporting requirements in a number of states, including Connecticut, Michigan, Ohio and Texas. Together, Michigan, Ohio and Texas account for a significant percentage of our total premiums (19.1% of our net premiums earned to date in 2013). Prior to Atlas' acquisition of American Country, the Connecticut insurance commissioner issued an order prohibiting American Country from writing new policies, limiting it to only renewing existing policies in that state. Currently, the insurance subsidiaries do not write any business in Connecticut, but we have requested removal of this restriction. In Michigan, we failed to meet certain rating requirements following our acquisition of the insurance subsidiaries which could have resulted in the loss of our certificates of authority in Michigan in 2011. However, following discussions with the applicable insurance regulator, the insurance subsidiaries were permitted to continue writing insurance business in Michigan subject to certain maximum premium levels. These restrictions have since
been lifted and there are no regulatory orders in place in Michigan limiting the insurance subsidiaries' ability to write business in that state. In Ohio, American Service’s certificate of authority was revoked due to non-compliance with certain financial requirements related to reserves. Following the reverse merger on December 31, 2010 wherein the insurance subsidiaries were transferred to us by KAI, American Service’s certificate of authority was reinstated subject to the company providing regular financial disclosure to the Ohio state insurance regulator for two years. Based on discussions with the applicable insurance regulator, we believe we may continue to be subject to these heightened reporting requirements as a result of our acquisition of Gateway. In 2009, the Texas Department of Insurance indicated to the insurance subsidiaries that it was considering revoking their certificates of authority to write insurance business in Texas. Following discussions with management of KFSI, the insurance subsidiaries were allowed to retain their licenses, in part, in anticipation of a planned spin-off of the insurance subsidiaries outside of KFSI and subject to their maintenance of a statutory deposit in Texas. If we are not able to successfully comply with or lift the heightened compliance or disclosure requirements applicable in one or more of these states or any new requirements that a state may impose in the future, we may not be able to expand our operations in such state in accordance with our growth strategy or we could be subject to additional regulatory requirements that could impose a material burden on our expansion strategy or limit or prohibit our ability to write new and renewal insurance policies in such state. Any such limitation or prohibition could have a material adverse effect on our results of operations and financial conditions and on our ability to execute our strategy in the future. The result of these inquiries could lead to additional requirements, restrictions or limitations being placed on us or our insurance subsidiaries, or other conditions, any of which could increase our costs of regulatory compliance and could have an adverse affecteffect on our ability to operate our business. As a general matter, we cannot predict the outcome of regulatory investigations, proceedings and reviews, and cannot guarantee that such investigations, proceedings or reviews or related litigation or changes in operating policies and practices would not materially and adversely affect our results of operations and financial condition. In addition, if we were to experiencehave experienced difficulties with our relationshiprelationships with a regulatory bodybodies in a given jurisdiction, itvarious jurisdictions, and if such difficulties arise in the future, they could have a material adverse effect on our ability to do business in that jurisdiction.
Our business could be adversely affected as a result of changing political, regulatory, economic or other influences.
The insurance industry is subject to changing political, economic and regulatory influences. These factorsinfluences affect the practices and operation of insurance and reinsurance organizations. Legislatures in the United States and other jurisdictions have periodically considered programs to reform or amend their respective insurance and reinsurance regulatory systems. Recently, the insurance and reinsurance regulatory framework has been subject to increased scrutiny in many jurisdictions. Changes in current insurance regulationlaws, regulations and rules may result in increased governmental involvement in or supervision of the insurance industry or may otherwise change the business and economic environment in which insurance industry participants operate. Historically, the automobile insurance industry has been under pressure from time to time from regulators, legislators or special interest groups to reduce, freeze or set rates at levels that are not necessarily related to underlying costs or risks, including initiatives to reduce automobile and other commercial line insurance rates. These changes may limit the ability of theour insurance subsidiaries to price automobile insurance adequately and could require us to discontinue unprofitable product lines, make unplanned modifications of our products and services, or result in delays or cancellations of sales of our products and services.
Strategic Risks
Our geographic concentration ties our performance to the business, economic, regulatory and other conditions of certain states.
Some jurisdictions (including, most notably New York, Illinois, Michigan and Louisiana)Minnesota) generate a more significant percentage of our total premiums than others. Our revenues and profitability are subject to the prevailing regulatory, legal, economic, political, demographic, competitive, weather and other conditions in the principal states in which we do business. Changes in any of these conditions could make it less attractive for us to do business in such states and would have a more pronounced effect on us compared to companies that are more geographically diversified. In addition, our exposure to severe losses from localized perils, such as earthquakes, hurricanes, tropical storms, tornadoes, wind, ice storms, hail, fires, terrorism, riots and explosions, is increased in those areas where we have written significant numbers of property/casualtyP&C insurance policies. Given our geographic concentration, negative publicity regarding our products and services could have a material adverse effect on our business and operations, as could other regional factors impacting the local economies in that market.
In order to operate in a profitable manner, we need to maintain our current level of premiums written. We may experience difficulty in managing historic and future growth, which could adversely affect our results of operations and financial condition.
We believe that, given our fixed costs associated with underwriting and administering our insurance operations, our insurance subsidiaries must maintain annual net writtenearned premiums in excess of approximately $50 million in order to achieve our targeted levels of profitability. In order to maintain and increase this level of premiums written, we intend to expand geographically and increase our market share via our expanded distribution network. Continued growth could impose significant demands on management, including the need to identify, recruit, maintain and integrate additional employees. Growth may also place a strain on management systems and operational and financial resources, and such systems, procedures and internal controls may not be adequate to support operations as they expand.
The integration and management of acquired books of business, acquired businesses and other growth initiatives involve numerous risks that could adversely affect our profitability, and are contingent on many factors, including:
expanding our financial, operational and management information systems;
managing our relationships with independent agents, brokers, and legacy program managers, including maintaining adequate controls;
expanding our executive management and the infrastructure required to effectively control our growth;
maintaining ratings for certain of our insurance subsidiaries;
increasing the statutory capital of our insurance subsidiaries to support growth in written premiums;
accurately setting claims provisions for new business where historical underwriting experience may not be available;
obtaining regulatory approval for appropriate premium rates where applicable; and
obtaining the required regulatory approvals to offer additional insurance products or to expand into additional states or other jurisdictions.
Our failure to grow our premiums written or to manage our growth effectively could have a material adverse effect on our business, financial condition or results of operations.
A significant portion of our products in the New York City market are distributed by a single agent, and any decrease in the amount of our products distributed by this agent, or underperformance of the book of business controlled by this agent, could adversely impact our business.
In the third quarter of 2012, we implemented our New York “excess taxi program” with a single agent writing business in the New York City market, which iswas a new business arrangement to provide excess coverage above the levels of risk retained by the insured. This arrangement was renewed in the third quarter of 2012. This agent has since become our most significant agent responsible for approximately 28% and 53%22.6% of our gross premium written for the nine month period ended September2012 year, and 19.1% of net premium earned year to date through June 30, 2012 and the three-month period ended September 30, 2012, respectively. This agent was not responsible for any written premium in the fourth quarter 2012.2013. We do not have an exclusive relationship with this agent, and there can be no assurance that this relationship will continue in the future. If this agent reduces its marketing of our products or moves some or all of its business to another carrier, then our business, financial condition and results of operations would be adversely affected. In addition, due in part to our limited experience with this program, and with the New York City market in general, it is uncertain whether policies issued pursuant to this program will be profitable. For example, if risks associated with these clients differ from those reflected in our underwriting policies, then our business, financial condition and results of operations would be adversely affected.
Engaging in acquisitions involves risks, and if we are unable to effectively manage these risks, our business may be materially harmed.
Acquisitions of similar insurance providers, such as Gateway, are expected to be a material component of our growth strategy, subject to availability of suitable opportunities and market conditions. From time to time, we may engage in discussions concerning acquisition opportunities and, as a result of such discussions, may enter into acquisition transactions. Upon the announcement of an acquisition, our share price may fall depending on numerous factors, including but not limited to, the intended target, the size of the acquisition, the purchase price and the potential dilution to existing shareholders. It is also possible that an acquisition could dilute earnings per share. Acquisitions entail numerous risks, including the following:
difficulties in the integration of the acquired business;
assumption of unknown material liabilities, including deficient provisions for unpaid claims;
diversion of management’s attention from other business concerns;
failure to achieve financial or operating objectives; and
potential loss of policyholders or key employees of acquired companies.
We may be unable to integrate or profitably operate any business, operations, personnel, services or products we may acquire in the future, which may result in our inability to realize expected revenue increases, cost savings, increases in geographic or product presence, and other projected benefits from the acquisition. Integration may result in the loss of key employees, disruption to our existing businesses or the business of the acquired company, or otherwise harm our ability to retain customers and employees or achieve the anticipated benefits of the acquisition. Time and resources spent on integration may also impair our ability to grow our existing businesses. Also, the negative effect of any financial commitments required by regulatory authorities or rating agencies in acquisitions or business combinations may be greater than expected.
Provisions in our organizational documents, corporate laws and the insurance laws of Illinois and other states could impede an attempt to replace or remove management or directors or prevent or delay a merger or sale, which could diminish the value of our shares.
Our Memorandum of Association, Articles of Association and Code of Regulations and the corporate laws and the insurance laws of various states contain provisions that could impede an attempt to replace or remove management or directors or prevent the sale of the insurance subsidiaries that shareholders might consider to be in their best interests. These provisions include, among others:
requiring a vote of holders of 5% of the ordinary shares to call a special meeting of shareholders;
requiring a two-thirds vote to amend the Articles of Association;
requiring the affirmative vote of a majority of the voting power of shares represented at a special meeting of shareholders; and
statutory requirements prohibiting a merger, consolidation, combination or majority share acquisition between insurance subsidiaries and an interested shareholder or an affiliate of an interested shareholder without regulatory approval.
These provisions may prevent shareholders from receiving the benefit of any premium over the market price of our shares offered by a bidder in a potential takeover, and may adversely affect the prevailing market price of our shares if they are viewed as discouraging takeover attempts.
In addition, insurance regulatory provisions may delay, defer or prevent a takeover attempt that shareholders may consider in their best interest. For example, under applicable state statutes, subject to limited exceptions, no person or entity may, directly or indirectly, acquire control of a domestic insurer without the prior approval of the state insurance regulator. Under the insurance laws, “control” (including the terms “controlling,” “controlled by” and “under common control with”) is generally defined to include acquisition of a certain percentage or more of an insurer’s voting securities (such as 10% or more under Illinois and Missouri law). These requirements would require a potential bidder to obtain prior approval from the insurance departments of the states in which the insurance subsidiaries are domiciled and commercially domiciled and may require pre-acquisition notification in other states. Obtaining these approvals could result in material delays or deter any such transaction. Regulatory requirements could make a potential acquisition of our company more difficult and may prevent shareholders from receiving the benefit from any premium over the market price of our shares offered by a bidder in a takeover context. Even in the absence of a takeover attempt, the existence of these provisions may adversely affect the prevailing market price of our shares if they are viewed as discouraging takeover attempts in the future.
Market and Competition Risks
Because the insurance subsidiaries are commercial automobile insurers, conditions in that industry could adversely affect their business.
The majority of the gross premiums written by our insurance subsidiaries are generated from commercial automobile insurance policies. Adverse developments in the market for commercial automobile insurance, including those which could result from potential declines in commercial and economic activity, could cause our results of operations to suffer. The commercial automobile insurance industry is cyclical. Historically, the industry has been characterized by periods of price competition and excess capacity followed by periods of higher premium rates and shortages of underwriting capacity. These fluctuations in the business cycle have negatively impacted and could continue to negatively impact the revenues of our company. The results of the insurance subsidiaries, and in turn, us, may also be affected by risks, to the extent they are covered by the insurance policies we issue, that impact the commercial automobile industry related to severe weather conditions, floods, hurricanes, tornadoes, earthquakes and tsunamis, as well as explosions, terrorist attacks and riots. The insurance subsidiaries’ commercial automobile
insurance business may also be affected by cost trends that negatively impact profitability, such as a continuing economic downturn, inflation in vehicle repair costs, vehicle replacement parts costs, used vehicle prices, fuel costs and medical care costs. Increased costs related to the handling and litigation of claims may also negatively impact profitability. Legacy business
previously written by us also includes private passenger auto, surety and other P&C insurance business. Adverse developments relative to previously written business could have a negative impact on our results.
The insurance and related businesses in which we operate may be subject to periodic negative publicity which may negatively impact our financial results.
The products and services of the insurance subsidiaries are ultimately distributed to individual and business customers. From time-to-time,time to time, consumer advocacy groups or the media may focus attention on insurance products and services, thereby subjecting the industry to periodic negative publicity. We also may be negatively impacted if participants in one or more of our markets engage in practices resulting in increased public attention to our business. Negative publicity may also result in increased regulation and legislative scrutiny of practices in the P&C insurance industry as well as increased litigation. These factors may further increase our costs of doing business and adversely affect our profitability by impeding our ability to market our products and services, requiring us to change our products or services or by increasing the regulatory burdens under which we operate.
The highly competitive environment in which we operate could have an adverse effect on our business, results of operations and financial condition.
The commercial automobile insurance business is highly competitive and, except for regulatory considerations, there are relatively few barriers to entry. Many of our competitors are substantially larger and may enjoy better name recognition, substantially greater financial resources, higher ratings by rating agencies, broader and more diversified product lines and more widespread agency relationships than us. Our underwriting profits could be adversely impacted if new entrants or existing competitors try to compete with our products, services and programs or offer similar or better products at or below our prices. Insurers in our markets generally compete on the basis of price, consumer recognition, coverages offered, claims handling, financial stability, customer service and geographic coverage. Although pricing is influenced to some degree by that of our competitors, it is not in our best interest to compete solely on price, and we may from time-to-timetime to time experience a loss of market share during periods of intense price competition. Our business could be adversely impacted by the loss of business to competitors offering competitive insurance products at lower prices. This competition could affect our ability to attract and retain profitable business. Pricing sophistication and related underwriting and marketing programs use a number of risk evaluation factors. For auto insurance, these factors can include but are not limited to vehicle make, model and year; driver age; territory; years licensed; loss history; years insured with prior carrier; prior liability limits; prior lapse in coverage; and insurance scoring based on credit report information. We believe our pricing model will generate future underwriting profits, however past performance is not a perfect indicator of future driver performance.
If we are not able to attract and retain independent agents and brokers, our revenues could be negatively affected.
We market and distribute our insurance programs exclusively through independent insurance agents and specialty insurance brokers. As a result, our business depends in large part on the marketing efforts of these agents and brokers and on our ability to offer insurance products and services that meet the requirements of the agents, the brokers and their customers. However, these agents and brokers are not obligated to sell or promote our products and many sell or promote competitors’ insurance products in addition to our products. Some of our competitors have higher financial strength ratings, offer a larger variety of products, set lower prices for insurance coverage and/or offer higher commissions than we do. Therefore, we may not be able to continue to attract and retain independent agents and brokers to sell our insurance products. The failure or inability of independent agents and brokers to market our insurance products successfully could have a material adverse impact on our business, financial condition and results of operations.
If we are unable to maintain our claims-paying ratings, our ability to write insurance and to compete with other insurance companies may be adversely impacted. A decline in rating could adversely affect our position in the insurance market, make it more difficult to market our insurance products and cause our premiums and earnings to decrease.
Financial ratings are an important factor influencing the competitive position of insurance companies. Third party rating agencies assess and rate the claims-paying ability of insurers and reinsurers based upon criteria that they have established. Periodically these rating agencies evaluate the business to confirm that it continues to meet the criteria of the ratings previously assigned. Financial strength ratings are an important factor in establishing the competitive position of insurance companies and may be expected to have an effect on an insurance company’s premiums. The insurance subsidiaries are rated by A.M. Best, which issues independent opinions of an insurer’s financial strength and its ability to meet policyholder obligations. A.M. Best
ratings range from “A++” (Superior) to “F” (In Liquidation), with a total of 16 separate rating categories. The objective of A.M. Best’s rating system is to provide potential policyholders and other interested parties an opinion of an insurer’s financial strength and ability to meet ongoing obligations, including paying claims.
On January 30, 2012,2013, A.M. Best affirmed the financial strength rating of American Country and American Service as “B” and the outlook assigned to all ratings is “Stable.” Upon the completion of our acquisition of Gateway, A.M. Best affirmed our rating to B “stable.”The review reflects the inherent risk associated with integrating Gateway’s ongoing business into the Company’s existing infrastructure, while overseeing the run-off of Gateway’s non-core lines, and the increase in financial leverage of Atlas as a result of funding the transaction, in part, with the issuance of preferred stock. There is a risk that A.M. Best will not maintain these ratings in the future. If the insurance subsidiaries’ ratings are reduced by A.M. Best, their competitive position in the insurance industry could suffer and it could be more difficult to market their insurance products. A downgrade could result in a significant reduction in the number of insurance contracts written by the subsidiaries and in a substantial loss of business to other competitors with higher ratings, causing premiums and earnings to decrease. Rating agencies evaluate insurance companies based on financial strength and the ability to pay claims, factors that may be more relevant to policyholders than to investors. Financial strength ratings by rating agencies are not ratings of securities or recommendations to buy, hold or sell any security and should not be relied upon as such.
As is customary upon the disclosure of a pending acquisition, in the fourth quarter 2012, A.M. Best placed Atlas and its subsidiaries under review. The review reflects the inherent risk associated with integrating Gateway’s ongoing business into the Company’s existing infrastructure, while overseeing the run off of Gateway’s non-core lines, and the increase in financial leverage of Atlas as a result of funding the transaction, in part, with the issuance of preferred stock. We expect the review to be complete in the first quarter 2013.
Our ability to generate written premiums is impacted by seasonality which may cause fluctuations in our operating results and to our stock price.
The P&C insurance business is seasonal in nature. While our net premiums earned are generally stable from quarter to quarter, our gross premiums written follow the common renewal dates for the “light” commercial risks that represent our core lines of business. For example, January 1st and March 1st are common taxi cab renewal dates in Illinois and New York, respectively. Additionally, we implemented our New York “excess taxi program” in the third quarter of 2012, which was renewed in the third quarter 2013. Net underwriting income is driven mainly by the timing and nature of claims, which can vary widely. Our ability to generate written premiums is also impacted by the timing of policy periods in the states in which we operate. As a result of this seasonality, investors may not be able to predict our annual operating results based on a quarter-to-quarter comparison of our operating results. Additionally, this seasonality may cause fluctuations in our stock price. We believe seasonality will have an ongoing impact on our business.
U.S. Tax Risks
If our company were not to be treated as a U.S. corporation for U.S. federal income tax purposes, certain tax inefficiencies would result and certain adverse tax rules would apply.
Pursuant to certain “expatriation” provisions of the U.S. Internal Revenue Code of 1986, as amended, the reverse merger agreement relating to the reverse merger transaction described below provides that the parties intend to treat our company as a U.S. corporation for U.S. federal income tax purposes. The expatriation provisions are complex, are largely unsettled and subject to differing interpretations, and are subject to change, perhaps retroactively. If our company were not to be treated as a U.S. corporation for U.S. federal income tax purposes, certain tax inefficiencies and adverse tax consequences and reporting requirements would result for both our company and the recipients and holders of stock in our company, including that dividend distributions from our insurance subsidiaries to us would be subject to 30% U.S. withholding tax, with no available reduction and that members of the consolidated group may not be permitted to file a consolidated U.S. tax return resulting in the acceleration of cash tax outflow and potential permanent loss of tax benefits associated with net operating loss carry-forwards that could have otherwise been utilized.
Our use of losses may be subject to limitations and the tax liability of our company may be increased.
Our ability to utilize the NOLs is subject to the rules of Section 382 of the Internal Revenue Code.Code (“IRC Section 382”). IRC Section 382 generally restricts the use of NOLs after an “ownership change.” An ownership change occurs if, among other things, the stockholders (or specified groups of stockholders) who own or have owned, directly or indirectly, five (5%) percent or more of our common stock or are otherwise treated as five (5%) percent stockholders under IRC Section 382 and the regulations promulgated thereunder increase their aggregate percentage ownership of our stock by more than 50 percentage points over the lowest percentage of the stock owned by these stockholders over a three-year rolling period. In the event of an ownership change, IRC Section 382 imposes an annual limitation on the amount of taxable income a corporation may offset with NOL carryforwards. This annual limitation is generally equal to the product of the value of our stock on the date of the ownership change, multiplied by the long-term tax-
exempttax-exempt rate published monthly by the Internal Revenue Service. Any unused annual limitation may be carried over to later years until the applicable expiration date for the respective NOL carryforwards.
The rules of Section 382 are complex and subject to varying interpretations. Because of our numerous equity issuances, which have included the issuance of various classes of convertible securities and warrants, uncertainty exists as to whether we may have undergone an ownership change in the past or will undergo oneOn July 22, 2013, as a result of shareholder activity, a "triggering event" as determined under IRC Section 382 was reached. Following this offering. Even iftriggering event, the Company estimates that it will retain total tax effected federal net operating loss carryforwards
of approximately $15.0 million versus $16.1 million as of June 30, 2013. Book value per common share is expected to be unaffected by this offering does not cause an ownership change, it may increaseevent as the likelihood that we may undergo an ownership change inamount of lost deferred tax assets are anticipated to be well within the future. Based on our recent stock prices, we believe any ownership change would limit our ability to utilizeallowance which was already held against the portionmajority of our NOLs that are currently not subject to limitation. Accordingly, no assurance can be given that our NOLs will be fully available. As a result, we could pay taxes earlier and in larger amounts than would be the case if the NOLs were available to reduce the federal income taxes without restriction. Future sales of stock by KAI, including sales in this offering, could conceivably trigger another ownership change according to Section 382.these assets.
Atlas has the following total net operating loss carry-forwards as of the period ended SeptemberJune 30, 2012.2013:
| Net Operating Loss Carry-Forward by Expiry (in ‘000s) | | | Year of Occurrence | Year of Expiration | Amount | Year of Expiration | Amount |
| 2001 | 2021 | $ | 14,750 |
| 2021 | $ | 12,563 |
|
| 2002 | 2022 | 4,317 |
| 2022 | 4,317 |
|
| 2004 | | 2024 | 125 |
|
| 2005 | | 2025 | 183 |
|
| 2006 | 2026 | 7,825 |
| 2026 | 7,825 |
|
| 2007 | 2027 | 5,131 |
| 2027 | 5,131 |
|
| 2008 | 2028 | 1,949 |
| 2028 | 1,949 |
|
| 2009 | 2029 | 1,949 |
| 2029 | 1,949 |
|
| 2010 | 2030 | 1,949 |
| 2030 | 2,442 |
|
| 2011 | 2031 | 7,762 |
| 2031 | 10,558 |
|
| 2012 | 2032 | 1,074 |
| 2032 | 322 |
|
| Total | | $ | 46,706 |
| | $ | 47,364 |
|
Further limitations on the utilization of losses may apply because of the “dual consolidated loss” rules, which will also require our company to recapture into income the amount of any such utilized losses in certain circumstances. As a result of the application of these rules, the future tax liability of our company and our insurance subsidiaries could be significantly increased. In addition, taxable income may also be recognized by our company or our insurance subsidiaries in connection with the 2010 reverse merger transaction.
Risks Related to this Offering
There has been no publicThe market in the United States for our ordinary shares prior to this offeringis relatively new, and an active trading market for our ordinary shares may not develop, continue or be liquid following this offering.
Prior to this offering, ourAtlas ordinary shares have been exclusivelybecame listed on the TSXV under the symbol “AFH”, and there has been no public market for them in the United States.NASDAQ stock exchange on February 12, 2013. There is a risk that nothe currently active trading market will develop,not continue or be liquid in the United States and that our ordinary shares will not be resold at or above our public offering price. Prior to the effective date of this offering, we have applied to have our ordinary shares listed on the NASDAQ Capital Market under the symbol “AFH.” The public offering price of our ordinary shares has been determinedpaid by agreement among us and the underwriters, but there is a risk that our ordinary shares will trade below the public offering price following the completion ofpurchaser in this offering. See “Underwriting.” The market value of our ordinary shares could be substantially affected by general market conditions, including the extent to which a secondarythe market develops for ourthe additional ordinary shares following the completion ofin this offering, the extent of institutional investor interest in us, our financial and operating performance and general stock and bond market conditions. In addition, we may not havecontinue to receive coverage by security analysts, which could serve to limit the distribution of news and limit investor interest in our shares.
Assuming an active market for our ordinary shares develops,continues, the market price and trading volume of our ordinary shares may be volatile following this offering.volatile.
Even if anthe currently active trading market develops for our ordinary shares theirfails to continue, the per share trading price may be volatile due in part to the limited public float and trading volume for our shares and the fact that our ordinary shares will be dual listed on NASDAQ and the TSX Venture Exchange.shares. In addition, the trading volume in our ordinary shares may fluctuate and cause significant price variations to occur. If the per share trading price of our ordinary shares declines significantly, you may be unable to resell your shares at or above the public offering price.price paid. There is a risk that the per share trading price of our ordinary shares will fluctuate or decline significantly in the future.
Some of the factors that could negatively affect our share price or result in fluctuations in the price or trading volume of our ordinary shares include:
actual or anticipated variations in our quarterly operating results;
changes in our cash flows from operations or earnings estimates;
publication of research reports about us or the insurance industry;
changes in market valuations of similar companies;
adverse market reaction to any additional debt we incur or equity we may issue in the future;
additions or departures of key management personnel;
actions by institutional shareholders;
speculation in the press or investment community;
our underlying asset value;
the extent of investor interest in our securities;
investor confidence in the stock and bond markets, generally;
changes in tax laws;
failure to meet earnings estimates;
changes in our claims-paying ratings;
general market and economic conditions; and
future sales of substantial amounts of our shares in the public market, or the perception that these sales could occur.
In the past, securities class action litigation has often been instituted against companies following periods of volatility in the price of their shares. This type of litigation could result in substantial costs and divert our management’s attention and resources, which could have an adverse effect on our financial condition, results of operations, cash flow and per share trading price of our ordinary shares.
We do not anticipate paying any cash dividends for the foreseeable future.
We currently intend to retain our future earnings, if any, for the foreseeable future, for working capital and other general corporate purposes. We do not intend to pay any dividends to holders of our ordinary shares. As a result, capital appreciation in the price of our ordinary shares, if any, will be your only source of gain on an investment in our ordinary shares. We did not declare or pay cash dividends on our capital stock during 2010, 20112012 or to date in 2012.2013. Any future determination to pay dividends on our capital stock will be at the discretion of our board of directors, subject to applicable laws, and will depend on our financial condition, results of operations, capital requirements, general business conditions, and other factors that our board of directors considers relevant. Holders of our preferred shares are entitled to dividends on a cumulative basis whether or not declared by our board of directors, at a rate of $0.045 per preferred share per year, which must be paid or declared and set apart before any dividend may be paid on our ordinary shares. In addition, the insurance laws and regulations governing our insurance company subsidiaries contain restrictions on the ability to pay dividends, or to make other distributions to us, which may limit our ability to pay dividends to our shareholders.
Purchasers in this offering can expect future dilution in the book value of their investment.
The exercise of outstanding warrants and options and the conversion of preferred shares will result in dilution of your investment at the time of such exercise or conversion. In addition, if we raise funds by issuing additional ordinary shares, such newly issued shares would dilute your ownership interest. Accordingly, investors in this offering can expect to own a smaller percentage of the company as we continue with our business and expand the scope of our operations.
The requirements of being a United States public company may strain our resources and divert management’s attention.
As a United States public company, we will be subject to the reporting requirements of the Securities Exchange Act of 1934, as amended (which we refer to herein as the Exchange Act), the Sarbanes-Oxley Act, the Dodd-Frank Act, the listing requirements of The NASDAQ Stock Market and other applicable securities rules and regulations. Compliance with these rules and regulations will increase our legal and financial compliance costs, make some activities more difficult, time-consuming or costly and increase demand on our systems and resources, particularly after we are no longer an “emerging growth company.” The Exchange Act requires, among other things, that we file annual, quarterly and current reports with respect to our business and operating results. The Sarbanes-Oxley Act requires, among other things, that we maintain effective disclosure controls and procedures and internal control over financial reporting. In order to maintain and, if required, improve our disclosure controls and procedures and internal control over financial reporting to meet this standard, significant resources and management oversight may be required. As a result, management’s attention may be diverted from other business concerns, which could
adversely affect our business and operating results. We may need to hire more employees in the future or engage outside consultants to comply with these requirements, which will increase our costs and expenses.
In addition, changing laws, regulations and standards in the United States relating to corporate governance and public disclosure are creating uncertainty for public companies, increasing legal and financial compliance costs and making some activities more time consuming. These laws, regulations and standards are subject to varying interpretations, in many cases due to their lack of specificity, and, as a result, their application in practice may evolve over time as new guidance is provided by regulatory and governing bodies. This could result in continuing uncertainty regarding compliance matters and higher costs necessitated by ongoing revisions to disclosure and governance practices. We intend to invest resources to comply with evolving laws, regulations and standards, and this investment may result in increased general and administrative expenses and a diversion of management’s time and attention from revenue-generating activities to compliance activities. If our efforts to comply with new laws, regulations and standards differ from the activities intended by regulatory or governing bodies due to ambiguities related to their application and practice, regulatory authorities may initiate legal proceedings against us and our business and operating results may be adversely affected.
For as long as we remain an “emerging growth company” as defined in the Jumpstart Our Business Startups Act of 2012 (which we refer to herein as the JOBS Act), we may take advantage of certain exemptions from various reporting requirements that are applicable to other public companies that are not “emerging growth companies,” including, but not limited to, not being required to comply with the auditor attestation requirements of Section 404 of the Sarbanes-Oxley Act, reduced disclosure obligations regarding executive compensation in our periodic reports and proxy statements, and exemptions from the requirements of holding a non-binding advisory vote on executive compensation and shareholder approval of any golden parachute payments not previously approved. We may take advantage of these reporting exemptions until we are no longer an “emerging growth company.”
We will remain an “emerging growth company” for up to five years, although if the market value of our ordinary shares that is held by non-affiliates exceeds $700 million as of any June 30th before that time, we would cease to be an “emerging growth company” as of the following December 31st.
As a result of disclosure of information in this prospectus and in filings required of a public company in the United States, our business, results of operations, cash flows and financial condition will become more visible, which may result in threatened or actual litigation, including by competitors and other third parties. If such claims are successful, our business and operating results could be adversely affected, and even if the claims do not result in litigation or are resolved in our favor, these claims, and the time and resources necessary to resolve them, could divert the resources of our management and adversely affect our business and operating results.
We are an “emerging growth company” and we cannot be certain if the reduced disclosure requirements applicable to emerging growth companies will make our ordinary shares less attractive to investors.
We are an “emerging growth company,” as defined in the Jumpstart Our Business Startups Act of 2012 (which we refer to herein as the JOBS Act, andAct). As such, we may take advantage of certain exemptions from various reporting requirements that are applicable to other public companies that are not “emerging growth companies”companies,” including, but not limited to, to:
not being required to comply with the auditor attestation requirements of section 404 of the Sarbanes-Oxley Act, Act;
reduced disclosure obligations regarding executive compensation in our periodic reports and proxy statements,statements; and
exemptions from the requirements of holding a non-binding advisory vote on executive compensation and shareholder approval of any golden parachute payments not previously approved.
We cannot predict if investors will find our ordinary shares less attractive because we may rely on these exemptions. If some investors find our ordinary shares less attractive as a result, there may be a less active trading market for these shares and our stock price may be more volatile.
Section 107 of the JOBS Act provides that an “emerging growth company” can take advantage of an extended transaction period for complying with new or revised accounting standards. However, we are choosing to “opt out” of such extended transition period, and as a result, we will comply with new or revised accounting standards on the relevant dates on which
adoption of such standards is required for non-emerging growth companies. Our decision to opt out of the extended transition period for complying with new or revised accounting standards is irrevocable.
CAUTIONARY NOTE REGARDING FORWARD-LOOKING STATEMENTS
This prospectus contains forward-looking statements. All statements contained in this prospectus other than statements of historical fact, including statements regarding our future results of operations and financial position, our business strategy and plans, and our objectives for future operations, are forward-looking statements. The words “believe,” “may,” “will,” “estimate,” “continue,” “anticipate,” “intend,” “expect,” and similar expressions are intended to identify forward-looking statements. We have based these forward-looking statements largely on our current expectations and projections about future events and trends that we believe may affect our financial condition, results of operations, business strategy, short-term and long-term business operations and objectives, and financial needs. These forward-looking statements are subject to a number of risks, uncertainties and assumptions, including those described in the “Risk Factors” section. Moreover, we operate in a very competitive and rapidly changing environment. New risks emerge from time to time. It is not possible for our management to predict all risks, nor can we assess the impact of all factors on our business or the extent to which any factor, or combination of factors, may cause actual results to differ materially from those contained in any forward-looking statements we may make. In light of these risks, uncertainties and assumptions, the future events and trends discussed in this prospectus may not occur and actual results could differ materially and adversely from those anticipated or implied in the forward-looking statements.
You should not rely upon forward-looking statements as predictions of future events. The events and circumstances reflected in the forward-looking statements may not be achieved or occur. Although we believe that the expectations reflected in the forward-looking statements are reasonable, we cannot guarantee future results, levels of activity, performance, or achievements. We are under no duty to update any of these forward-looking statements after the date of this prospectus or to conform these statements to actual results or revised expectations.
Important factors that could cause actual results to differ materially from those in the forward-looking statements include the matters described under “Risk Factors,” changes in local, regional, national or global political, economic, business, competitive, market (supply and demand) and regulatory conditions and the following:
expectations regarding our potential growth;
our inability to have our securities listed for trading on the NASDAQ Capital Market or another national securities exchange, or once initially listed, to maintain such listings;
our financial performance;
our competitive position;
the introduction and proliferation of competitive products;
an inability to achieve sustained profitability;
failure to implement our short- or long-term growth strategies;
operating and capital expenditures by us and the insurance and reinsurance industry;
the cost of retaining and recruiting our key personnel or the loss of such key personnel;
risks associated with the expansion of our business in size and geography;
we haverisks associated with our new “excess taxi” program written by a single agent in New York, on a non-exclusive basis, distributing a product which provides excess coverage above the levels of risk retained by otherwise self-insured taxi operators, who was responsible for approximately 28% of our gross premium written in the nine month period ended September 30, 2012;
York;operational risk;
risks associated with our integration of Gateway;
geopolitical events and regulatory changes;
changing interpretations of generally accepted accounting principles;
general economic conditions;
our ability to obtain additional financing, if necessary;
the adverse effect our the ordinary shares issued pursuant to this offering may have on the market price of our ordinary shares;
our business strategies;
compliance with applicable laws; and
our liquidity.
Any forward-looking statement made by us in this prospectus speaks only as of the date on which we make it, and is expressly qualified in its entirety by the foregoing cautionary statements. Factors or events that could cause our actual results to differ may emerge from time to time, and it is not possible for us to predict all of them. We undertake no obligation to publicly update any forward-looking statement, whether as a result of new information, future developments or otherwise.
USE OF PROCEEDS
We estimate that our net proceeds from the sale of the ordinary shares that we are offering will be approximately $[•] million, based on an assumed offering price of $[•] per share (the U.S. dollar equivalent of the last reported sale price of our ordinary shares on the TSXV based on an assumed exchange rate of C$[•] per $1 U.S.), after deducting underwriting discounts and commissions and estimated offering expenses payable by us. If the underwriters exercise their over-allotment option in full, we estimate that our net proceeds will be approximately $[•] million.
We will not receive any of the proceeds from the sale of the ordinary shares being offered by the selling shareholder.
The principal purposesselling shareholder will pay (either directly or by reimbursing us) all of our initial offeringthe costs and expenses incurred in connection with the United States are to create a public market for ourregistration of the ordinary shares under the Securities Act and thereby enable future access to the public equity markets by us and our shareholders, and to obtain additional capital. We intend to use the net proceeds to us from our offering for working capital, to acquire complementary businesses or other assets, to repurchase preferred shares, which accrue dividends on a cumulative basis at a rate of $0.045 per share per year (4.5%), or for other general corporate purposes; however we do not have any specific uses of the net proceeds planned.
Pending other uses, we intend to invest the proceeds to us in investment-grade, interest-bearing securities such as money market funds, certificates of deposit, or direct or guaranteed obligations of the U.S. government, or hold as cash. We cannot predict whether the proceeds invested will yield a favorable return. Our management will have broad discretion in the application of the net proceeds we receive from our offering, and investors will be relying on the judgment of our management regarding the application of the net proceeds.made hereby.
DIVIDEND POLICY
We did not declare or pay cash dividends on our capital stock during 2010, 2011, 2012 or to date in 2013. We currently intend to retain any future earnings for use in the operation of our business and do not intend to declare or pay any cash dividends in the foreseeable future. Any future determination to pay dividends on our capital stock will be at the discretion of our board of directors, subject to applicable laws, and will depend on our financial condition, results of operations, capital requirements, general business conditions, and other factors that our board of directors considers relevant. In addition, the insurance laws and regulations governing our insurance company subsidiaries contain restrictions on the ability to pay dividends, or to make other distributions to us, which may limit our ability to pay dividends to our shareholders.
Holders of our preferred shares are entitled to dividends on a cumulative basis whether or not declared by our board of directors, at a rate of $0.045 per preferred share per year, which must be paid or declared and set apart before any dividend may be paid on our ordinary shares. As of the date of this prospectus, there were 2,000,000 preferred shares outstanding. In addition, the insurance laws and regulations governing our insurance company subsidiaries contain restrictionssix month period ended June 30, 2013, we paid $2.1 million in dividends on the ability to pay dividends, or to make other distributions to us,preferred shares, of which may limit our ability to pay dividendsthere were 20,000,000 outstanding prior to our shareholders.August 1, 2013 repurchase of 18,000,000 of these shares.
DILUTION
If you invest in our ordinary shares, your ownership interest will experience immediate book value dilution to the extent of the difference between the initial public offering price per ordinary share and the net tangible book value per ordinary share after this offering. Dilution results from the fact that the initial public offering price per ordinary share is substantially in excess of the net tangible book value per ordinary share attributable to the existing shareholders for the presently outstanding ordinary shares. Net tangible book value per share represents the amount of our total tangible assets less our total liabilities, divided by the number of ordinary shares outstanding.
Our pro-forma net tangible book value as of September 30, 2012 was $39.7 million, or $6.46 per ordinary share. After giving effect to our sale of shares in this offering, assuming an initial public offering price of $[•] per ordinary share (the U.S. dollar equivalent of the last reported sale price of our ordinary shares on the TSXV as of January [•], 2013 based on an assumed exchange rate of C$[•] per $1 U.S.), and the application of the estimated net proceeds as described under “Use of Proceeds,” our as adjusted net tangible book value at September 30, 2012 would have been approximately $[•] million, or $[•] per ordinary share. This represents an immediate increase in net tangible book value per share of $[•] to existing shareholders and an immediate dilution of $[•] per share to new investors.
The following table illustrates this per share dilution (amounts in $000’s of U.S. dollars).
|
| |
Assumed initial public offering price per ordinary share | $ [•] |
Net tangible book value per share at September 30, 2012 | 6.46 |
Decrease per ordinary share attributable to new investors in the offering | [•] |
Pro forma net tangible book value per ordinary share after this offering | [•] |
Dilution per ordinary share to new investors | [•] |
If the underwriters were to fully exercise their option to purchase additional ordinary shares, the pro forma net tangible book value per ordinary share after giving effect to this offering would be $[•]. This represents an increase in net tangible book value of $[•] per ordinary share to existing stockholders and dilution of $[•] per ordinary share to new investors.
A $1.00 increase (decrease) in the assumed initial public offering price of $[•] per ordinary share would decrease (increase) our pro-forma net tangible book value deficiency after giving effect to the offering by $[•] million, or by $[•] per ordinary share, assuming no change to the number of ordinary shares offered by us as set forth on the cover page of this prospectus, and after deducting the estimated underwriting discounts and estimated expenses.
The following table sets forth on the pro forma basis described above, as of September 30, 2012, the number of ordinary shares purchased from us, the total consideration paid to us and the average price per share paid by existing shareholders and to be paid by new investors purchasing ordinary shares in this offering, before deducting underwriting discounts and commissions and estimated offering expenses.
|
| | | | | |
| | Shares Purchased | Total Consideration | |
| | Number | Percent | Amount (in thousands) | Percent | Average Price Per Share |
| Existing Shareholders | [•] | [•] | $[•] | [•] | $[•] |
| New investors | [•] | [•] | [•] | [•] | [•] |
| Total | [•] | 100% | $[•] | 100% | $[•] |
If the underwriters exercise their over-allotment option in full, the percentage of shares of common stock held by existing stockholders will decrease to approximately [•]% of the total number of shares of our common stock outstanding after this offering, and the number of shares held by new investors will be increased to [•], or approximately [•]% of the total number of shares of our common stock outstanding after this offering.
SELLING SHAREHOLDER
The following table sets forth information as of the date of this prospectus, to our knowledge, about the beneficial ownership of our ordinary shares by the selling shareholder, KAI, both before and immediately after the offering. We have entered into a registration rights agreement with KAI, as described under “Description of Securities - Registration Rights.”
We believe that the selling shareholder has sole voting and investment power with respect to all of the ordinary shares beneficially owned by it.
The percent of beneficial ownership for the selling shareholder is based on 3,887,4691,262,471 restricted voting shares outstanding as of the date of this prospectus. Pursuant to Rules 13d-3 and 13d-5 of the Securities Exchange Act 1934 (the “Exchange Act”), securities held by the selling shareholder that are currently exercisable or exercisable within 60 days of the date of this prospectus for ordinary shares are considered outstanding and beneficially owned by the selling shareholder for the purpose of computing its percentage ownership but are not treated as outstanding for the purpose of computing the percentage ownership of any other shareholder.
Information about the selling shareholder may change over time. Any changed information will be set forth in an amendment to the registration statement or supplement to this prospectus, to the extent required by law.
| | | | Restricted Voting Shares Beneficially Owned Prior to the Offering | | Restricted Voting Shares Beneficially Owned After the Offering(1) | Restricted Voting Shares Beneficially Owned Prior to the Offering | | Restricted Voting Shares Beneficially Owned After the Offering |
| Name of Selling Shareholder | Number(2) | Percent(2) | Ordinary Shares Offered by this Prospectus(3) | Number | Percent | Number(1) | Percent(1) | Ordinary Shares Offered by this Prospectus(2) | Number | Percent |
| Kingsway America Inc. 150 Pierce Road, Suite 600 Itasca, Illinois 60143 | 3,887,469 |
| 100.0% | 3,130,000 |
| 757,469 |
| 100% | 1,262,471 |
| 100.0% | 1,262,471 |
| 0 | 0% |
(1) Assumes the sale of all shares offered under this prospectus (shares issued under our stock option plan not included).
| |
(2)(1) | Includes 525,981 restricted voting shares owned by Mendota Insurance Company, a wholly owned subsidiary of KAI, and 627,122 restricted voting shares owned by Universal Casualty Company, both of which area wholly owned subsidiariessubsidiary of KAI.Mendota Insurance Company. |
| |
(3)(2) | Restricted voting shares offered by the selling shareholder are automatically converted into ordinary shares pursuant to this offering. |
MARKET FOR COMMON EQUITY AND RELATED SHAREHOLDER MATTERS
As of September 30, 2012,the date of this prospectus, there were 100657 shareholders of record of our ordinary shares, of which 1,542,7646,970,850 were issued and outstanding. Additionally, there were 4,601,6211,262,471 restricted voting shares outstanding, all of which convert to ordinary shares upon the sale of such shares by KAI or theirits subsidiaries.
Atlas ordinary shares became listed on the NASDAQ stock exchange on February 11, 2013, under the same symbol. Our ordinary shares have been exclusivelywere listed on the TSXV under the symbol “AFH” since January 6, 2011. There is currently no established public trading market for our ordinary shares in the United States.until June 4, 2013.
Set forth below are the high and low listingsales prices of the ordinary shares during 2011, 2012 and the first quarterthree quarters of 2013, through January 17,September 18, 2013. Prices in 2013 are shown in US dollars and are per the NASDAQ, whereas prices prior to 2013 are per the TSXV assumingand shown in Canadian dollars. All prices assume retroactive application of the one-for-three reverse stock split (in Canadian dollars):which was effective January 29, 2013.
|
| | |
Summary of Share Prices |
| High | Low |
2013 | | |
First Quarter (through January 17, 2013) | C$6.30 | C$6.30 |
2012 | | |
Fourth Quarter | C$6.75 | C$5.55 |
Third Quarter | C$6.00 | C$3.60 |
Second Quarter | C$5.55 | C$2.46 |
First Quarter | C$6.00 | C$3.75 |
2011 | | |
Fourth Quarter | C$6.00 | C$4.80 |
Third Quarter | C$6.00 | C$4.44 |
Second Quarter | C$5.58 | C$3.75 |
First Quarter | C$5.97 | C$3.30 |
|
| | |
| Summary of Share Prices |
| | High | Low |
| 2013 (per NASDAQ) | | |
| Third Quarter (Through September 18, 2013) | $10.41 | $8.61 |
| Second Quarter | $9.17 | $6.04 |
| First Quarter (Beginning February 11, 2013) | $6.40 | $6.00 |
| 2012 (per TSXV) | | |
| Fourth Quarter | C$6.75 | C$5.55 |
| Third Quarter | C$5.97 | C$3.60 |
| Second Quarter | C$5.55 | C$2.46 |
| First Quarter | C$6.00 | C$3.75 |
| 2011 (per TSXV) | | |
| Fourth Quarter | C$6.00 | C$4.80 |
| Third Quarter | C$6.00 | C$4.44 |
| Second Quarter | C$5.58 | C$3.75 |
| First Quarter | C$5.97 | C$3.30 |
During 2011, 2012 or to date in 2013, we did not repurchase any of our equity securities. We also did not pay any dividends during 2011, 2012 or to date in 2013 and have no current plans to pay dividends to our ordinary shareholders. TheDuring the six month period ended June 30, 2013, Atlas declared and paid $2.1 million in dividends earned through the preferred shares to Kingsway, the cumulative amount of dividends to which they were entitled through the preferred shareholdersend of June 30, 2013. Hendricks earned $45,000 in dividends during 2013, which are entitled upon liquidation (or sooner, if we declare dividends) is $1.42 millionunpaid as of SeptemberJune 30, 2012.2013. The 18,000,000 preferred shares previously owned by Kingsway were repurchased by Atlas on August 1, 2013.
For more information regarding dividends, refer to “Dividend Policy” section of this prospectus.
CAPITALIZATION
The following table sets forth a summary of our capitalization on an historical basis as of SeptemberJune 30, 2012,2013 and should be read in conjunction with our interim consolidated financial statements and notes included in this prospectus. The table also summarizes our capitalization on an as adjusted basis assuming: (1) the effectivenessrepurchase of the 1:3 share consolidation approved by shareholders18,000,000 preferred shares from KAI, which occurred on December 7, 2012;August 1, 2013; (2) the completion of this initial public offering at an assumed initial public offering price of $[•]$9.82 per ordinary share (the U.S. dollar equivalentshare.
We will not receive any of the last reportedproceeds from the sale price as of January [•], 2013 of ourthe ordinary shares onbeing offered by the TSXV based on an assumed exchange rate of C$[•] to $1 U.S.); (3) net proceeds to us from this initial public offering of $[•] after payment of estimated underwriting discounts, commissions and related expenses of $[•]; and (4) the intended applicationselling shareholder. The selling shareholder will pay (either directly or by reimbursing us) all of the net proceedscosts and expenses incurred in connection with the registration of this offering.the ordinary shares under the Securities Act and the offering made hereby.
| | | (in ‘000s, except share and per share data) | September 30, 2012 | June 30, 2013 |
| Shareholders’ Equity | Actual | Adjusted | Actual | Adjusted |
| Preferred shares, par value per share $0.001, 100,000,000 shares authorized, 18,000,000 shares issued and outstanding actual and as adjusted. Liquidation value $1.00 per share. | $ | 18,000 |
| $ | — |
| |
| Ordinary shares, par value per share $0.003, 266,666,667 shares authorized, 1,542,764 shares issued and outstanding actual, and [•] issued and outstanding as adjusted | 4 |
| | |
| Restricted voting common shares, par value per share $0.003, 33,333,334 shares authorized, 4,601,621 shares issued and outstanding actual, and [•] issued and outstanding as adjusted | 14 |
| | |
| Preferred shares, par value per share $0.001, 100,000,000 shares authorized, 20,000,000 shares issued and outstanding at June 30, 2013, 2,000,000 shares issued and outstanding as adjusted. Liquidation value $1.00 per share | | $ | 20,000 |
| $ | 2,000 |
|
| Ordinary shares, par value per share $0.003, 266,666,667 shares authorized, 6,904,420 shares issued and outstanding at June 30, 2013, and 8,166,891 shares issued and outstanding as adjusted | | 20 |
| 25 |
|
| Restricted voting common shares, par value per share $0.003, 33,333,334 shares authorized, 1,262,471 shares issued and outstanding at June 30, 2013 and zero shares issued and outstanding as adjusted | | 4 |
| — |
|
| Additional paid-in capital | 152,739 |
| | 160,973 |
| 162,773 |
|
| Retained deficit | (113,919 | ) | | (110,372 | ) | (110,372 | ) |
| Accumulated other comprehensive income, net of tax | 2,265 |
| | |
| Accumulated other comprehensive (loss)/income, net of tax | | (1,043 | ) | (1,043 | ) |
| Total Shareholders’ Equity | $ | 59,103 |
| $ | — |
| $ | 69,582 |
| $ | 53,383 |
|
UNAUDITED PRO FORMA CONSOLIDATED FINANCIAL DATA
The following unaudited condensed consolidated pro forma financial statements areconsolidated statement of comprehensive income is based on the historical financial statements of comprehensive income of Atlas Financial Holdings, Inc. and Camelot Services, Inc., after giving effect to the acquisition of Camelot Services, which was consummated on January 2, 2013. These estimates and assumptions are subject to change upon the finalization of valuations, which are contingent upon final appraisals, identifiable intangible assets and any other adjustments until the consummation of the acquisition. Revisionsadjustments. Subsequent revisions to the preliminary purchase price allocation could result in significant deviation from the accompanying pro forma information. Atlas’ management believes that its assumptions provide a reasonable basis for presenting all of the significant effects of the transactions contemplated and that the pro forma adjustments give appropriate effect to those assumptions and are properly applied in the unaudited condensed consolidated pro forma consolidated financial information.
The following unaudited pro forma condensed consolidated financial statements and explanatory notes present how the financial statementsconsolidated statement of comprehensive income of Atlas may have appeared had the acquisition occurred on January 1, 20112012 (with respect to the results of statements of comprehensive income) or as of September 30, 2012 (with respect to statement of financial position information). Certain amounts from Camelot Services’ historical financial statementsstatement of comprehensive income have been reclassified to conform to Atlas’ presentation.
TheseThis unaudited pro forma condensed consolidated financial statements havestatement of consolidated income has been derived from and should be read together with the historical financial statements and related notes of Atlas included in its annual report on Form 10-K for the year ended December 31, 2011 and its quarterly report on Form 10-Q for the nine month period ended September 30, 2012, both of which havehas been filed with the Securities and Exchange Commission.
The unaudited pro forma condensed consolidated financial informationstatement of comprehensive income has been prepared by management, areand is presented for illustrative purposes only, and doonly. It does not purport to represent what the results of operations or financial position of Atlas would have been had the acquisition actually occurred as of the dates indicated, nor is it indicative of future financial position or results of operations for any period.
UNAUDITED PRO FORMA CONSOLIDATED STATEMENTS OF FINANCIAL POSITION
|
| | | | | | | | | | | | | |
| | September 30, 2012 |
| (in ‘000s) | Historical | | Pro Forma | |
| Atlas | Camelot | Adjustments | Notes | Combined |
| Assets | | | | | |
| Investments, available for sale | | | | | |
| Fixed income securities, at fair value | $ | 109,555 |
| $ | 35,608 |
| $ | (11,946 | ) | 4.a. | $ | 133,217 |
|
| Equity securities, at fair value | — |
| 3,076 |
| — |
| | 3,076 |
|
| Cash and cash equivalents | 12,151 |
| 8,931 |
| (12,895 | ) | 3.a. | 8,187 |
|
| Accrued investment income | 807 |
| 228 |
| — |
| | 1,035 |
|
| Accounts receivable and other assets | 24,811 |
| 10,589 |
| — |
| | 35,400 |
|
| Reinsurance recoverables, net | 6,983 |
| 5,741 |
| 12,857 |
| 4.a. | 25,581 |
|
| Prepaid reinsurance premiums | 2,219 |
| — |
| — |
| | 2,219 |
|
| Deferred policy acquisition costs | 4,501 |
| 1,676 |
| (1,676 | ) | 2.b., 4.a | 4,501 |
|
| Deferred tax asset, net | 6,343 |
| — |
| 208 |
| 7.b. | 6,551 |
|
| Software and office equipment, net | 1,157 |
| 979 |
| (784 | ) | 2.c. | 1,352 |
|
| Assets held for sale | 166 |
| — |
| — |
| | 166 |
|
| Investment in investees | 1,250 |
| — |
| — |
| | 1,250 |
|
| Total Assets | $ | 169,943 |
| $ | 66,828 |
| $ | (14,236 | ) | | $ | 222,535 |
|
| | | | | | |
| Liabilities | | | | | |
| Claims liabilities | $ | 73,574 |
| $ | 30,871 |
| $ | — |
| | $ | 104,445 |
|
| Unearned premiums | 28,325 |
| 11,946 |
| — |
| | 40,271 |
|
| Due to reinsurers and other insurers | 4,658 |
| — |
| — |
| | 4,658 |
|
| Other liabilities and accrued expenses | 4,283 |
| 3,557 |
| — |
| | 7,840 |
|
| Notes Payable | — |
| 1,051 |
| (1,051 | ) | 2.a. | — |
|
| Total Liabilities | $ | 110,840 |
| $ | 47,425 |
| $ | (1,051 | ) | | $ | 157,214 |
|
| | | | | | |
| Shareholders’ Equity | | | | | |
| Preferred shares, par value per share $0.001, 100,000,000 shares authorized, 18,000,000 shares issued and outstanding at September 30, 2012 | $ | 18,000 |
| $ | — |
| $ | 2,000 |
| 3.b. | $ | 20,000 |
|
| Ordinary voting common shares, par value per share $0.003, 266,666,667 shares authorized, 1,542,764 shares issued and outstanding at September 30, 2012 | 4 |
| 1 |
| — |
| | 5 |
|
| Restricted voting common shares, par value per share $0.003, 33,333,334 shares authorized, 4,601,621 shares issued and outstanding at September 30, 2012 | 14 |
| — |
| — |
| | 14 |
|
| Additional paid-in capital | 152,739 |
| 30,928 |
| (14,895 | ) | 3.a, 3.b. | 168,772 |
|
| Retained deficit | (113,919 | ) | (13,491 | ) | 317 |
| 2.a.,2.b.,2.c., 7.b. | (127,093 | ) |
| Accumulated other comprehensive income, net of tax | 2,265 |
| 1,965 |
| (607 | ) | 4.b., 4.c. | 3,623 |
|
| Total Shareholders’ Equity | $ | 59,103 |
| $ | 19,403 |
| $ | (13,185 | ) | | $ | 65,321 |
|
| Total Liabilities and Shareholders’ Equity | $ | 169,943 |
| $ | 66,828 |
| $ | (14,236 | ) | | $ | 222,535 |
|
See accompanying notes to unaudited condensed consolidated pro forma financial statements.
UNAUDITED PRO FORMA CONSOLIDATED STATEMENTS OF COMPREHENSIVE INCOME | | | (in ‘000s, except per share data) | Nine Months Ended September 30, 2012 | Year Ended December 31, 2012 |
| | Historical | | Pro Forma | | Historical | | Pro Forma | |
| | Atlas | Camelot | Adjustments | Notes | Combined | Atlas | Camelot | Adjustments | Notes | Combined |
| Net premiums earned | $ | 26,795 |
| $ | 19,148 |
| $ | (11,260 | ) | 4.d., 5 | $ | 34,683 |
| $ | 38,709 |
| $ | 24,204 |
| $ | (14,659 | ) | 4.b., 5 | $ | 48,254 |
|
| Net investment income | 1,878 |
| 930 |
| (404 | ) | 4.b. | 2,404 |
| 2,453 |
| 1,188 |
| (1,174 | ) | 4.a.,4.b., 5. | 2,467 |
|
| Net investment gains (losses) | 1,098 |
| (90 | ) | 920 |
| 4.c. | 1,928 |
| 1,435 |
| 745 |
| 522 |
| 4.b., 5. | 2,702 |
|
| Other income | 169 |
| (200 | ) | 74 |
| 2.a. | 43 |
| 194 |
| (646 | ) | 737 |
| 3, 4.b., 5. | 285 |
|
| Total revenue | 29,940 |
| 19,788 |
| (10,670 | ) | | 39,058 |
| 42,791 |
| 25,491 |
| (14,574 | ) | | 53,708 |
|
| Net claims incurred | 18,477 |
| 19,109 |
| (14,269 | ) | 4.d., 5, 6.a. | 23,317 |
| 26,545 |
| 28,694 |
| (16,987 | ) | 4.b., 5, 6.a. | 38,252 |
|
| Other underwriting expenses | 9,541 |
| 7,496 |
| (5,809 | ) | 4.d., 5 | 11,228 |
| 13,080 |
| 9,425 |
| (5,703 | ) | 4.b., 5 | 16,802 |
|
| Total expenses | 28,018 |
| 26,605 |
| (20,078 | ) | | 34,545 |
| 39,625 |
| 38,119 |
| (22,690 | ) | | 55,054 |
|
| Income from operations before income tax (benefit)/expense | 1,922 |
| (6,817 | ) | 9,408 |
| | 4,513 |
| 3,166 |
| (12,628 | ) | 8,116 |
| | (1,346 | ) |
| Income tax expense | — |
| 2,641 |
| (2,641 | ) | 7.a., 7.b. | — |
| — |
| 2,922 |
| (2,922 | ) | 7.a. | — |
|
| Net income attributable to parent | 1,922 |
| (9,458 | ) | 12,049 |
| | 4,513 |
| 3,166 |
| (15,550 | ) | 11,038 |
| | (1,346 | ) |
| Less: Preferred share dividends | 606 |
| — |
| 68 |
| 8 | 674 |
| 810 |
| — |
| 90 |
| 8 | 900 |
|
| Net income/(loss) attributable to common shareholders | $ | 1,316 |
| $ | (9,458 | ) | $ | 11,981 |
| | $ | 3,839 |
| $ | 2,356 |
| $ | (15,550 | ) | $ | 10,948 |
| | $ | (2,246 | ) |
| | | | | | | |
| Other comprehensive income/(loss) related to Available for Sale Securities: | | | | |
| Consolidated Statements of Comprehensive Income | | Consolidated Statements of Comprehensive Income |
| | | |
| Net income attributable to parent | | $ | 3,166 |
| $ | (15,550 | ) | $ | 11,038 |
| | $ | (1,346 | ) |
| | | | | |
| Other comprehensive income/(loss) | | | | |
| Changes in net unrealized gains | $ | 1,899 |
| $ | 1,053 |
| $ | — |
| | $ | 2,952 |
| $ | 1,899 |
| $ | 800 |
| $ | — |
| | $ | 2,699 |
|
| Reclassification to income of net gains | (632 | ) | 136 |
| (920 | ) | | (1,416 | ) | (632 | ) | (745 | ) | (920 | ) | | (2,297 | ) |
| Effect of income tax | (427 | ) | (404 | ) | 313 |
| | (518 | ) | (427 | ) | (20 | ) | 313 |
| | (134 | ) |
| Other comprehensive income/(loss) for the period | 840 |
| 785 |
| (607 | ) | | 1,018 |
| 840 |
| 35 |
| (607 | ) | | 268 |
|
| Total comprehensive income/(loss) | $ | 2,762 |
| $ | (8,673 | ) | $ | 11,442 |
| | $ | 5,531 |
| $ | 4,006 |
| $ | (15,515 | ) | $ | 10,431 |
| | $ | (1,078 | ) |
| | | | | | | |
| | | | | | | |
| Basic weighted average common shares outstanding | 6,146,179 |
| |
| | 6,146,179 |
| 6,144,281 |
| | | 6,144,281 |
|
| Earnings/(loss) per common share, basic | $ | 0.21 |
| | | $ | 0.62 |
| $ | 0.38 |
| | | $ | (0.37 | ) |
| Diluted weighted average common shares outstanding | 6,150,585 |
| | | 6,150,585 |
| 8,434,948 |
| | | 6,144,281 |
|
| Earnings/(loss) per common share, diluted | $ | 0.21 |
| | | $ | 0.62 |
| $ | 0.38 |
| | | $ | (0.37 | ) |
See accompanying notes to unaudited condensed consolidated pro forma consolidated financial statements.
UNAUDITED PRO FORMA CONSOLIDATED STATEMENTS OF COMPREHENSIVE INCOME
|
| | | | | | | | | | | | | |
| (in ‘000s, except per share data) | Year Ended December 31, 2011 |
| | Historical | | Pro Forma | |
| | Atlas | Camelot | Adjustments | Notes | Combined |
| Net premiums earned | $ | 35,747 |
| $ | 23,989 |
| $ | (11,796 | ) | 4.d., 5 | $ | 47,940 |
|
| Net investment income | 3,280 |
| 1,231 |
| (470 | ) | 4.b. | 4,041 |
|
| Net investment gains | 4,201 |
| 227 |
| 553 |
| 4.c. | 4,981 |
|
| Other income | 124 |
| (188 | ) | 120 |
| 2.a. | 56 |
|
| Total revenue | 43,352 |
| 25,259 |
| (11,593 | ) | | 57,018 |
|
| Net claims incurred | 28,994 |
| 20,440 |
| (9,873 | ) | 4.d., 5, 6.b. | 39,561 |
|
| Other underwriting expenses | 17,991 |
| 9,520 |
| (6,103 | ) | 4.d., 5 | 21,408 |
|
| Total expenses | 46,985 |
| 29,960 |
| (15,976 | ) | | 60,969 |
|
| Income from operations before income tax (benefit)/expense | (3,633 | ) | (4,701 | ) | 4,383 |
| | (3,951 | ) |
| Income tax expense | (1,163 | ) | (1,570 | ) | 1,570 |
| 7.a., 7.b. | (1,163 | ) |
| Net income attributable to parent | (2,470 | ) | (3,131 | ) | 2,813 |
| | (2,788 | ) |
| Less: Preferred share dividends | 810 |
| | 90 |
| 8 | 900 |
|
| Net loss attributable to common shareholders | $ | (3,280 | ) | $ | (3,131 | ) | $ | 2,723 |
| | $ | (3,688 | ) |
| | | | | | |
| Other comprehensive income/(loss) related to: | | | | | |
| Changes in net unrealized gains | $ | 154 |
| $ | 1,667 |
| $ | — |
| | $ | 1,821 |
|
| Reclassification to income of net gains | (3,469 | ) | (344 | ) | (553 | ) | | (4,366 | ) |
| Settlement of pension plan | 2,473 |
| — |
| — |
| | 2,473 |
|
| Effect of income tax | (789 | ) | (450 | ) | 188 |
| | (1,051 | ) |
| Other comprehensive income/(loss) for the period | (1,631 | ) | 873 |
| (365 | ) | | (1,123 | ) |
| Total comprehensive income/(loss) | $ | (4,101 | ) | $ | (2,258 | ) | $ | 2,448 |
| | $ | (3,911 | ) |
| | | | | | |
| | | | | | |
| Basic weighted average common shares outstanding | 6,124,542 |
| | | | 6,124,542 |
|
| Earnings/(loss) per common share, basic | $ | (0.54 | ) | | | | $ | (0.60 | ) |
| Diluted weighted average common shares outstanding | 6,124,542 |
| | | | 6,124,542 |
|
| Earnings/(loss) per common share, diluted | $ | (0.54 | ) | | | | $ | (0.60 | ) |
Atlas Financial Holdings, Inc.
Notes to Unaudited Condensed Consolidated Pro Forma Financial StatementsConsolidated Statement of Comprehensive Income
Basis of Presentation
TheThis unaudited pro forma consolidated financial informationstatement of comprehensive income for the year ended December 31, 2012 gives effect to the acquisition of Camelot Services as if it had occurred (i) on September 30, 2012 for the purposes of the unaudited condensed consolidated pro forma statement of financial position and (ii) on January 1, 2011 for the purposes of the unaudited condensed consolidated pro forma statements of comprehensive income for the year ended December 31, 2011 and for the nine months ended September 30, 2012. The unaudited condensed consolidated pro forma financial informationconsolidated statement of comprehensive income has been prepared by Atlas’ management. Certain amounts from Camelot Services’ historical consolidated financial statementsstatement of consolidated income have been reclassified to conform to Atlas’ presentation.
General
ThisThe unaudited pro forma consolidated financial information has been prepared in conformity with generally accepted accounting principles in the United States (“GAAP”). The unaudited condensed consolidated pro forma statement of financial position as of September 30, 2012 and the unaudited condensed consolidated pro forma statements of comprehensive income for the year ended December 31, 2011 and the nine months ended September 30, 2012 have beenwas prepared using the following information:
Unaudited historical consolidated financial statements of Atlas as of September 30, 2012 and for the nine months ended September 30, 2012;
Unaudited historical consolidated financial statements of Camelot as of September 30, 2012 and for the nine months ended September 30, 2012;
Audited historical consolidated financial statements of Atlas for the year ended December 31, 2011;2012;
Audited historical consolidated financial statements of Camelot Services for the year ended December 31, 2011;2012; and
Such other supplementary information as considered necessary to reflect the proposed acquisition in the unaudited pro forma condensed consolidated financial information.
Purchase Price and Related Considerations
On October 25, 2012, Atlas announced it had entered into a stock purchase agreement for the acquisition of Camelot Services from Hendricks. Such agreement was entered into on October 24, 2012, by and among Atlas and Hendricks. The transaction closed on January 2, 2013.
The total purchase price for all of Camelot’sCamelot Services’ outstanding shares was $14.9$14.3 million, purchased with a combination of cash and Atlas preferred shares. Consideration consisted of a $6.0 million dividend paid by Gateway immediately prior to the closing, $2.0 million of Atlas preferred shares (consisting of a total of 2 million preferred shares) and $6.9$6.3 million in cash. Under the terms of the stock purchase agreement, the closing price was reduced due to reserve strengthening of approximately $8.0 million that Camelot Services recognized prior to closing. Approximately $4.3 million of this reserve strengthening was related to commercial automobile reserves, a portion of which was related to the long-haul truck program that is currently in run off. The amount of pre-closing reserve strengthening was consistent with the conclusions of an independent actuarial analysis of the reserves of Gateway. In addition to this pre-closing reserve strengthening, weWe have contractual protections to offset up to $2.0 million of future unfavorable reserve development. We have also agreed to provide the sellers up to $2.0 million in additional consideration in the event of favorable reserve development.
Gateway has historically underwritten other commercial insurance products that will not be underwritten by Atlas. Gateway previously wrote workers’ compensation insurance, which we did not acquire as part of the transaction. An indemnity reinsurance agreement was entered into pursuant to which 100% of Gateway’s workers’ compensation business was ceded to an affiliate of the seller as part of the transaction. Under the terms of the stock purchase agreement, certain other underwriting expenses associated with the workers’ compensation business were assumed by the seller. In May 2012, Gateway ceased underwriting commercial automobile liability insurance for long-haul truck operators.
Atlas began consolidating Camelot Services effective January 1, 2013. The purchase consideration is allocated to the assets acquired and liabilities assumed, including separately identified intangible assets, based on their fair values as of the close of the acquisition. Direct costs of the acquisition arewere accounted for separately from the business combination and are expensed as incurred. As the values of certain assets and liabilities are preliminary in nature, they are subject to adjustment as
additional information is obtained, including, but not limited to, valuation of separately identifiable intangibles, fixed assets, deferred taxes and loss reserves. The valuations willmust be finalized within six monthsone year of the close of the acquisition. When the valuations are finalized, any changes to the preliminary valuation of assets acquired or liabilities assumed may result in adjustments to separately identifiable intangible assets and goodwill.
| |
| 1. | For purposes of presentation in the unaudited condensed consolidated pro forma financial information, theThe allocation of the actual purchase consideration is as follows: |
|
| | | |
| Estimated Purchase Consideration (in ‘000s) | |
| Cash | $ | 12,895 |
|
| Preferred Stock | 2,000 |
|
| Total | $ | 14,895 |
|
| | |
| Pro Forma Preliminary Allocation of Purchase Price (in ‘000s) | |
| | |
| Cash and investments | $ | 46,700 |
|
| Other current assets | 16,886 |
|
| Property and equipment | 195 |
|
| Deferred policy acquisition costs | 674 |
|
| Total Assets | $ | 64,455 |
|
| | |
| Claims liabilities | $ | 36,879 |
|
| Unearned premiums | 9,357 |
|
| Accounts payable and other liabilities | 3,324 |
|
| Total Liabilities | $ | 49,560 |
|
The amounts outlined above are subject to change in accordance with the Stock Purchase Agreement dated October 25, 2012, such that the final purchase price will be determined based upon the audited financial statements of Camelot as of December 31, 2012. |
| | | |
| (in '000s) | |
| Purchase Consideration | |
| Cash | $ | 12,282 |
|
| Preferred stock | 2,000 |
|
| Total | $ | 14,282 |
|
| | |
| Allocation of Purchase Price | |
| | |
| Cash and investments | $ | 45,421 |
|
| Accounts receivable and other assets | 8,694 |
|
| Reinsurance recoverables | 6,352 |
|
| Intangible assets | 740 |
|
| Property and equipment | 923 |
|
| Value of business acquired | 1,233 |
|
| Total Assets | $ | 63,363 |
|
| | |
| Claims liabilities | $ | 36,209 |
|
| Unearned premiums | 9,601 |
|
| Due to reinsurers and other insurers | 286 |
|
| Accounts payable and other liabilities | 2,985 |
|
| Total Liabilities | $ | 49,081 |
|
| | |
| Net assets acquired | $ | 14,282 |
|
| |
| 2. | Adjustments to book value of the acquired assets and liabilities are as follows: |
| |
a. | Effective prior to the closing balance sheet, Hendricks forgave Camelot’s note related to a software purchase for its worker’s compensation business in the amount of $1.1 million. The related interest expense of $74,000 and $120,000 has been eliminated from the pro forma statements of comprehensive income for September 30, 2012 and December 31, 2011, respectively. |
| |
b. | Deferred acquisition costs of $765,000 related to the taxi and truck lines of business will be eliminated from Camelot’s book value according to the purchase price calculations of the stock purchase agreement. |
| |
c. | Software related to the workers’ compensation line of business of $784,000 will be eliminated from Camelot’s book value and is not being acquired under the terms of the stock purchase agreement. |
| |
d. | Gateway management incentives related to 2012 activities, including the successful sale of Gateway, are the sole responsibility of the seller, Hendricks, and have not been accounted for in these results. |
| |
3. | The total purchase consideration of $14.9$14.3 million consisted of cash, in the amount of $12.9$12.3 million, and Atlas preferred shares, in the estimated amount of $2.0 million. The details of this consideration are as follows: |
| |
| a. | Cash of $6.9$6.3 million was derived from an extraordinary dividend from Atlas’ insurance subsidiaries and cash of $6.0 million was derived from an extraordinary dividend from Gateway. These extraordinary dividends have received regulatory approval and have been paid. |
| |
| b. | $2.0 million of Atlas preferred shares, consisting of a total of 2 million preferred shares, were issued to Hendricks according to the terms of the stock purchase agreement. The preferred shares accrue dividends on a cumulative basis whether or not declared by the Board of Directors at the rate of $0.045 per share per year (4.5%) and may be paid in cash or in additional preferred shares at the option of Atlas. Upon liquidation, dissolution or winding-up of Atlas, holders of preferred shares receive the greater of $3.00$1.00 per share plus all declared and unpaid dividends or the amount they would receive in liquidation if the preferred shares had been converted to ordinary shares immediately prior to liquidation. Preferred shares are convertible into ordinary shares at the option of the holder at any date that is after the five year anniversary date of issuance at the rate of 0.1270 ordinary shares for each preferred share. The conversion rate is subject to change if the number of ordinary shares or restricted voting common shares changes. The preferred shares are redeemable at the option of Atlas at a price of $1.00 per share plus accrued and unpaid dividends commencing at two years from the issuance date. |
immediately prior to liquidation. Preferred shares are convertible into ordinary voting common shares at the option of the holder at any date that is after the five year anniversary date of issuance at the rate of 0.1270 ordinary voting common shares for each preferred share. The conversion rate is subject to change if the number of ordinary voting common shares or restricted voting common shares changes. The preferred shares are redeemable at the option of Atlas at a price of $3.00 per share plus accrued and unpaid dividends commencing at two years from the issuance date.
| |
| 3. | Effective prior to the closing balance sheet, Hendricks forgave Camelot Services’ note related to a software purchase for its worker’s compensation business in the amount of $1.0 million. The related interest expense of $120,000 has been eliminated from the pro forma statement of comprehensive income for the year ended December 31, 2012. |
| |
| 4. | Effective immediately after the close of the transaction, Gateway entered into a reinsurance agreement with a third party reinsurer. The reinsurance agreement covers all in-force premium and loss reserves for Gateway's workers' compensation program. Along with the reserves, any go-forward premium written for the workers' compensation program will be ceded in its entirety to this third party reinsurer under the terms of this reinsurance agreement. While Gateway remains liable to its insureds, Atlas does not expect to have any net exposure to losses related to this workers' compensation business. |
The effects of the reinsurance agreement on the statement of financial position and statements of comprehensive income are as follows:
| |
| a. | These balances were adjusted to reflect assets that will be ceded to the third party reinsurer as collateral for the net liabilities associated with the workers’ compensation premium, including loss reserves in the amount of $6.6 million, plus unearned premium reserves of $6.2 million, and less deferred policy acquisition costs of $911,000. The amount due from reinsurers and other insurers was increased by an equal amount to reflect the reinsurance recoverable from this third party reinsurer.
|
| |
b. | There will be a reduction in net investment income of $404,000 for the nine months ended September 30, 2012 and $470,000$540,000 for the year ended December 31, 20112012 to reflect the pro forma decrease in cash and cash equivalents by $12.9 million as a result of dividends paid from both Atlas and Camelot Services and the pro forma net reduction of Camelot Services’ invested assets by $11.9 million as a result of the workers’ compensation reinsurance agreement. |
Camelot Services and the pro forma net reduction of Camelot Services’ invested assets by $11.9 million as a result of the workers’ compensation reinsurance agreement.
| |
c.b. | Realization of gains of $920,000 for the nine months ended September 30, 2012 and $553,000 for the year ended December 31, 20112012 to reflect the net reduction of Camelot Services’ invested assets by $11.9 million in connection with the workers’ compensation reinsurance agreement. |
| |
d. | The following table identifies the adjustments to the statement of comprehensive income as a result of removing the impacts of the workers’ compensation lines of business as if the reinsurance transaction were in place as of January 1, 2011: |
The following table identifies adjustments to the statement of comprehensive income as a result of removing the impacts of the workers’ compensation lines of business as if the reinsurance transaction were in place as of January 1, 2012.
| | | | For the Nine Months Ended | For the Year Ended | For the Year Ended |
| (in ‘000s) | September 30, 2012 | December 31, 2011 | December 31, 2012 |
| Net premiums earned | $ | (7,173 | ) | $ | (7,133 | ) | $ | (9,648 | ) |
| Investment income | | (544 | ) |
| Realized (gains) losses | | (341 | ) |
| Other expense | | 575 |
|
| Net claims incurred | (5,781 | ) | (6,318 | ) | (8,902 | ) |
| Other underwriting expenses | (3,213 | ) | (3,500 | ) | (3,990 | ) |
| Total expenses | (8,994 | ) | (9,818 | ) | (12,892 | ) |
| Income from operations before income tax (benefit)/expense | $ | 1,821 |
| $ | 2,685 |
| $ | 2,934 |
|
| |
| 5. | During 2012, Gateway exited its truck line of business and placed into run-off claims related to this line of business. The following table identifies the adjustments to the statement of comprehensive income as a result of removing the impacts of the truck linesline of business as if these linesthis line were already in run-off as of January 1, 2011:2012. |
| | | | For the Nine Months Ended | For the Year Ended | For the Year Ended |
| (in ‘000s) | September 30, 2012 | December 31, 2011 | December 31, 2012 |
| Net premiums earned | $ | (4,087 | ) | $ | (4,663 | ) | $ | (5,011 | ) |
| Investment Income | | (90 | ) |
| Realized (gains) losses | | (57 | ) |
| Other expense | | 42 |
|
| Net claims incurred | (3,878 | ) | (5,357 | ) | (8,086 | ) |
| Other underwriting expenses | (2,596 | ) | (2,603 | ) | (1,713 | ) |
| Total expenses | (6,474 | ) | (7,960 | ) | (9,799 | ) |
| Income from operations before income tax (benefit)/expense | $ | 2,387 |
| $ | 3,297 |
| $ | 4,683 |
|
| |
| 6. | Camelot Services recorded loss and loss adjustment expense development of $4.8$8.9 million in its September 30,December 31, 2012 financial statement that related to periods prior to 2012. The table below indicatesOf that amount, $5.5 million related to lines of business which were eliminated, included in the amount of losstables above in Note 5 and loss adjustment expense development by$3.4 million relates to the taxi line of business: |
|
| | | | | | | | | |
| (in ‘000s) | 2011 | 2010 & Prior | Total |
| Taxi | $ | 1,801 |
| $ | 390 |
| $ | 2,191 |
|
| Truck | 1,429 |
| 103 |
| 1,532 |
|
| Contractors | 1,029 |
| 58 |
| 1,087 |
|
| Total | $ | 4,259 |
| $ | 551 |
| $ | 4,810 |
|
| |
a. | A reduction to net claims incurred equal to $4.8 million was recorded in the September 30, 2012 pro forma statement of comprehensive income to remove the loss and loss adjustment expensebusiness. The unfavorable prior year development related to periods of 2011 and prior fromtaxi has been included in the 2012 results. |
| |
b. | An adjustment equal to $1.8 million was made to increase thepro forma combined net claims incurred relating to the impact of 2011 taxi loss and loss adjustment expense development for year 2011. Since the workers’ compensation and the truck lines of business were eliminated in items 4 and 5 above, no further adjustments to the 2011 net claims incurred were necessary.income. |
| |
| 7. | Adjustments to income tax expense are as follows: |
| |
| a. | Camelot Services recorded tax expense of $2.6$2.9 million in its September 30,December 31, 2012 statement of comprehensive income. This adjustment was made to establish an allowance against its deferred tax assets as it relates to the balance as of December 31, 2011.assets. A reversal adjustment was made to the income tax line of the pro forma statement of comprehensive income for the nine monthsyear ended September 30,December 31, 2012 in the amount of $2.6$2.9 million to eliminate the impact of this adjustment. Also, an adjustment of $1.6 million was made to eliminate the income taxes in the December 31, 2011 statement of comprehensive income relating to the establishment of the deferred tax allowance as if it had occurred on January 1, 2011. |
| |
b. | Income tax adjustments related to the impact of adjustment 4.c. above of $28,000 and $180,000 for the nine months ended September 30, 2012 and the year ended December 31, 2012 were offset by decreases in the deferred tax allowance. |
| |
| 8. | Accrued dividends were adjusted by $67,500 for the nine months ended September 30, 2012 and by $90,000 for the year ended December 31, 20112012 to reflect the issuance of $2.0 million of Atlas preferred shares to Hendricks. |
MANAGEMENT’SMANAGEMENT'S DISCUSSION AND ANALYSIS OF FINANCIAL CONDITION AND RESULTS OF OPERATIONS (DECEMBER 31, 2012)
(All amounts in thousands of US dollars, except for amounts preceded by “C” as Canadian dollars, share and per share amounts)
The following discussion and analysis of our financial condition and results of operations should be read in conjunction with our consolidated financial statements and related notes that appear elsewhere in this prospectus.document. In addition to historical consolidated financial information, the following discussion contains forward-looking statements that may include, but are not limited to, statements with respect to estimates of future expenses, revenue and profitability; trends affecting financial condition, cash flows and results of operations; the availability and terms of additional capital; dependence on key suppliers and other strategic partners; industry trends and the competitive and regulatory environment; the successful integration of Gateway; the impact of losing one or more senior executives or failing to attract additional key personnel; and other factors referenced in this prospectus.document. Our actual results could differ materially from those discussed in the forward-looking statements. Forward-looking statements contained herein are made as of the date of this prospectusfiling and we disclaim any obligation to update any forward-looking statements, whether as a result of new information, future events or results, or otherwise. Factors that could cause or contribute to these differences include those discussed below and elsewhere, in this prospectus, particularly in “Risk Factors.” “We,” “our,” “Atlas,” or the “Company” refers to Atlas Financial Holdings, Inc and its consolidated subsidiaries.
In this discussion and analysis, the term “common share” refers to the summation of restricted voting shares and ordinary shares when used to describe loss or book value per common share.
Forward-looking statements
This report contains “forward-looking statements,” within the meaning of the Private Securities Litigation Reform Act of 1995, which may include, but are not limited to, statements with respect to estimates of future expenses, revenue and profitability; trends affecting financial condition and results of operations; the availability and terms of additional capital; dependence on key suppliers, and other strategic partners; industry trends and the competitive and regulatory environment; the impact of losing one or more senior executives or failing to attract additional key personnel; and other factors referenced in this report.
Often, but not always, forward-looking statements can be identified by the use of words such as “plans”, “expects”, “is expected”, “budget”, “scheduled”, “estimates”, “forecasts”, “intends”, “anticipates”, or “believes” or variations (including negative variations) of such words and phrases, or state that certain actions, events or results “may”, “could”, “would”, “might” or “will” be taken, occur or be achieved. Forward-looking statements involve known and unknown risks, uncertainties and other factors which may cause the actual results, performance or achievements of Atlas to be materially different from any future results, performance or achievements expressed or implied by the forward-looking statements. Such factors include, among others, general business, economic, competitive, political, regulatory and social uncertainties.
Although Atlas has attempted to identify important factors that could cause actual actions, events or results to differ materially from those described in forward-looking statements, there may be other factors that cause actions, events or results to differ from those anticipated, estimated or intended. Forward-looking statements contained herein are made as of the date of this report and Atlas disclaims any obligation to update any forward-looking statements, whether as a result of new information, future events or results, or otherwise. There can be no assurance that forward-looking statements will prove to be accurate, as actual results and future events could differ materially from those anticipated in such statements. Accordingly, readers should not place undue reliance on forward-looking statements due to the inherent uncertainty in them.
OverviewI. OVERVIEW
We are a financial services holding company incorporated under the laws of the Cayman Islands. Our core business is the underwriting of commercial automobile insurance policies, focusing on the “light” commercial automobile sector, which is carried out through our insurance subsidiaries, American Country Insurance Company, or American Country, and American Service Insurance Company, Inc., or American Service, together with American Country,and Gateway Insurance Company (as of January 2, 2013), or Gateway, which we collectively refer to as our “insurance subsidiaries”. This sector includes taxi cabs, non-emergency para-transit, limousine, livery and business auto. Our goal is to always be the preferred specialty commercial transportation insurer in any geographic areas where our value proposition delivers benefit to all stakeholders. We are licensed to write property and casualty, or P&C, insurance in 4746 states plus the District of Columbia in the United States. The insurance subsidiaries distribute their products through a network of independent retail agents, and actively wrote insurance in 31 states as of September 30, 2012.during 2012. Our acquisition of Gateway expanded the number of states in which we are actively writing our core commercial auto lines to 39 states and the District of Columbia.
Our core business is the underwriting of commercial automobile insurance policies, focusing on the “light” commercial automobile sector. Over the past two years, we have disposed of non-core assets and placed into run-off certain noncorenon-core lines of business previously written by the insurance subsidiaries. Our focus going forward is the underwriting of commercial
automobile insurance in the U.S. Substantially all of our new premiums written are in “light” commercial automobile lines of business.
Commercial Automobile
The Company’sOur primary target market is made up of small to mid-size taxi, limousine and non-emergency para-transit operators with one to ten units.operators. The “light” commercial automobile policies we underwrite provide coverage for light weightlightweight commercial vehicles typically with the minimum limits prescribed by statute, municipal or other regulatory requirements. The majority of our policyholders are individual owners or small fleet operators. In certain jurisdictions like Illinois and New York, we have also been successful working with larger operators who retain a meaningful amount of their own risk of loss through self-insurance or self-funded captive insurance entity arrangements. In these cases, we provide support in the areas of day to day policy administration and claims handling consistent with the value proposition we offer to all of our insureds, generally on a fee for service basis. We may also provide excess coverage above the levels of risk retained by the insureds where a better than average loss ratio is expected. Through these arrangements, we are able to effectively utilize the significant specialized operating infrastructure we maintain to generate revenue from business segments that may otherwise be more price sensitive in the current market environment.
The “light” commercial automobile sector is a subset of the historically profitable commercial automobile insurance industry segment. Commercial automobile insurance has outperformed the overall P&C industry in each of the past ten years based on data compiled by A.M. Best. A recent survey by A.M. Best estimates the total U.S. market for commercial automobile liability insurance to be approximately $24 billion. The size of the commercial automobile insurance market can be affected significantly by many factors, such as the underwriting capacity and underwriting criteria of automobile insurance carriers and general economic conditions. Historically, the commercial automobile insurance market has been characterized by periods of price competition and excess capacity followed by periods of higher premium rates and shortages of underwriting capacity.
We believe that there is a positive correlation between the economy and commercial automobile insurance in general. Operators of “light” commercial automobiles may be less likely than other business segments within the commercial automobile insurance market to take vehicles out of service as their businesses and business reputations rely heavily on availability. With respect to certain business lines such as the taxi line, there are also other factors such as the cost and limited supply of medallions which may discourage a policyholder from taking vehicles out of service in the face of reduced demand for the use of the vehicle.
Non-Standard Automobile
Non-standard automobile insurance is principally provided to individuals who do not qualify for standard automobile insurance coverage because of their payment history, driving record, place of residence, age, vehicle type or other factors. Such drivers typically represent higher than normal risks and pay higher insurance rates for comparable coverage.
Consistent with Atlas’ focus on commercial automobile insurance, Atlas has transitioned away from the non-standard auto line in 2012. Atlas ceased renewals ofnew and renewal policies of this type in 2011, allowing surplus and resources to be devoted to the expected growth of the commercial automobile business. The negative written premium within the non-standard auto line reflects policies canceled mid-term.
Other
This line of business is primarily comprised of Atlas’ surety business. Our surety program primarily consists of U.S. Customs bonds. We engage a former affiliate, Avalon Risk Management, to help coordinate marketing, customer service and claim handling for the surety bonds written. This non-core program is 100% reinsured to an unrelated third party.party and is being transitioned to another carrier.
Revenues
We derive our revenues primarily from premiums from our insurance policies and income from our investment portfolio. Our underwriting approach is to price our products to generate consistent underwriting profit for the insurance companies we own. As with all P&C insurance companies, the impact of price changes is reflected in our financial results over time. Price changes on our in-force policies occur as they are renewed, which generally takes twelve months for our entire book of business and up to an additional twelve months to earn a full year of premium at the renewal rate.
We approach investment and capital management with the intention of supporting insurance operations by providing a stable source of income to supplement underwriting income. The goals of our investment policy are to protect capital while optimizing investment income and capital appreciation and maintaining appropriate liquidity. We follow a formal investment policy and the Board reviews the portfolio performance at least quarterly for compliance with the established guidelines.
Expenses
Net claims incurred expenses are a function of the amount and type of insurance contracts we write and of the loss experience of the underlying risks. We record net claims incurred based on an actuarial analysis of the estimated losses we expect to be reported on contracts written. We seek to establish case reserves at the maximum probable exposure based on our historical claims experience. Our ability to estimate net claims incurred accurately at the time of pricing our contracts is a critical factor
in determining our profitability. The amount reported under net claims incurred in any period includes payments in the period net of the change in the value of the reserves for net claims incurred between the beginning and the end of the period.
Commissions and other underwriting expenses consist principally of brokerage and agent commissions and to a lesser extent premium taxes. The brokerage and agent commissions are reduced by ceding commissions received from assuming reinsurers that represent a percentage of the premiums on insurance policies and reinsurance contracts written and vary depending upon the amount and types of contracts written.
Other operating and general expenses consist primarily of personnel expenses (including salaries, benefits and certain costs associated with awards under our equity compensation plans, such as stock compensation expense) and other general operating expenses. Our personnel expenses are primarily fixed in nature and do not vary with the amount of premiums written.
In this discussion and analysis, the term “common share” refers to the summation of restricted voting shares and ordinary shares when used to describe loss or book value per common share.
Consolidated PerformanceII. 2012 CONSOLIDATED PERFORMANCE
Third Quarter 2012 HighlightsFinancial Performance Summary (comparisons are to third quarter 2011 unless otherwise noted):
Gross premium written increased by 113.7%31.0%, which included an increase of 313.4%169.0% in our core commercial auto business, with a significant portion from our excess taxi program without which growth would have been 80.9%.102.8%
We actively distributed our core products in 31 states during the three month periodyear ended September 30,December 31, 2012.
The combined ratio improved by 22.1%29 percentage points to 97.6%102.4%, which represents the first quarter under 100% since our inception.
Underwriting results improved by $2.010.3 million and we returned to underwriting profitability.
Net income for the three month periodyear ended September 30,December 31, 2012 was $1.73.2 million., compared to a loss of $2.5 million in the prior year
Basic and diluted earnings per ordinary common share was $0.240.38, net of accounting treatment for preferred shares.shares
Book value per diluted common share on September 30,December 31, 2012 was $6.466.55, compared to $6.166.09 at June 30, 2012December 31, 2011.
The following financial data is derived from Atlas’ unaudited condensed consolidated financial statements for the for the three and nine month periodsyears ended September 30,December 31, 2012 and, September 30,December 31, 2011.
| Selected Financial Information (in ‘000s) | |
| Selected financial information (in '000s) | | Selected financial information (in '000s) |
| | | Three Month Periods Ended | | Nine Month Periods Ended | Year Ended |
| | September 30, 2012 | September 30, 2011 | | September 30, 2012 | September 30, 2011 | December 31, 2012 | December 31, 2011 |
| Gross premium written | $ | 23,353 |
| $ | 10,928 |
| | $ | 44,349 |
| $ | 32,951 |
| $ | 55,050 |
| $ | 42,031 |
|
| Net premium earned | 10,934 |
| 8,797 |
| | 26,795 |
| 26,668 |
| 38,709 |
| 35,747 |
|
| Losses on claims | 7,165 |
| 6,984 |
| | 18,477 |
| 20,596 |
| 26,545 |
| 28,994 |
|
| Acquisition costs | 1,813 |
| 1,720 |
| | 4,582 |
| 5,343 |
| 6,471 |
| 7,294 |
|
| Other underwriting expenses | 1,692 |
| 1,822 |
| | 4,959 |
| 5,642 |
| 6,609 |
| 10,697 |
|
| Net underwriting income/(loss) | 264 |
| (1,729 | ) | | (1,222 | ) | (4,913 | ) | |
| Net underwriting loss | | (916 | ) | (11,238 | ) |
| Net investment and other income | 1,393 |
| 2,795 |
| | 3,144 |
| 5,468 |
| 4,082 |
| 7,605 |
|
| Net income before tax | 1,657 |
| 1,066 |
| | 1,922 |
| 555 |
| |
| Net income/(loss) before tax | | 3,166 |
| (3,633 | ) |
| Income tax expense | — |
| — |
| | — |
| — |
| — |
| (1,163 | ) |
| Net income | $ | 1,657 |
| $ | 1,066 |
| | $ | 1,922 |
| $ | 555 |
| |
| Net income/(loss) attributable to common shareholders | 1,455 |
| 864 |
| | 1,316 |
| (51 | ) | |
| Net income/(loss) | | $ | 3,166 |
| $ | (2,470 | ) |
| | | | | |
| Key Financial Ratios: | | | | |
| Loss ratio | 65.5 | % | 79.4 | % | | 69.0 | % | 77.2 | % | 68.6 | % | 81.1 | % |
| Acquisition cost ratio | 16.6 | % | 19.6 | % | | 17.1 | % | 20.0 | % | 16.7 | % | 20.4 | % |
| Other underwriting expense ratio | 15.5 | % | 20.7 | % | | 18.5 | % | 21.2 | % | 17.1 | % | 29.9 | % |
| Combined ratio | 97.6 | % | 119.7 | % | | 104.6 | % | 118.4 | % | 102.4 | % | 131.4 | % |
| Return on equity (annualized) | 11.4 | % | 7.2 | % | | 4.4 | % | 1.2 | % | |
| Return on common equity (annualized) | 15.0 | % | 8.6 | % | | 4.5 | % | (0.2 | )% | |
| Return on equity | | 5.5 | % | (4.2 | )% |
| Return on common equity | | 6.1 | % | (8.2 | )% |
| Earnings/(loss) per common share, basic and diluted | $ | 0.24 |
| $ | 0.14 |
| | $ | 0.21 |
| $ | (0.01 | ) | $ | 0.38 |
| $ | (0.54 | ) |
| Book value per common share, basic and diluted | $ | 6.46 |
| $ | 6.56 |
| | $ | 6.46 |
| $ | 6.56 |
| $ | 6.55 |
| $ | 6.09 |
|
Operating income is an internal performance measure used in the management of the Company's operations. It represents after-tax operational results excluding, as applicable, net realized gains or losses, net impairment charges recognized in earnings and other items. These amounts are more heavily influenced by market opportunities and other external factors. Operating income should not be viewed as a substitute for U.S. GAAP net income.
Third Quarter 2012
compared to 2011:
Atlas’ combined ratio for the three month periodyear ended September 30,December 31, 2012 was 97.6%102.4%, compared to 119.7%131.4% for the three month periodyear ended September 30,December 31, 2011 and 111.5% for the three month period ended June 30, 2012.
As planned, core commercial automobile lines continue to be the most significant component of Atlas’ gross premium written as a result of the strategic focus on these core lines of business coupled with positive response from new and existing agents. Gross premium written related to these core commercial lines increased by 313.4%169.0% for the three month periodyear ended September 30,December 31, 2012 as compared to the three month periodyear ended September 30,December 31, 2011. As a result, the overall loss ratio for the three month periodyear ended September 30,December 31, 2012 improved to 65.5%68.6% compared to 79.4%81.1% in the three month periodyear ended September 30,December 31, 2011 and 71.6% for the three month period ended June 30, 2012.
Net investment and other income generated $1.44.1 million of income for the three month periodyear ended September 30,December 31, 2012, of which $7791.4 million,000 are realized gains. This resulted in a 4.6%3.2% annualized yield for the three month periodyear ended September 30,December 31, 2012, compared to $2.0 million of realized gains and a 7.4% annualized yield for the three month period ended September 30, 2011.
Overall, Atlas generated net income of $1.73.2 million for the three month periodyear ended September 30,December 31, 2012. After taking the impact of the liquidation preference of the preferred shares into consideration, basic and diluted earnings per common share in the three month periodyear ended September 30,December 31, 2012 was $0.240.38. This compares to net incomelosses of $1.12.5 million or earnings of $0.14
per common share diluted in the three month period ended September 30, 2011 and income of $130,000 or a loss per share of $0.010.54 per common share diluted in the three month periodyear ended June 30, 2012.
Year to Date September 30, 2012
Atlas’ combined ratio for the nine month period ended September 30, 2012 was 104.6%, compared to 118.4% for the nine month period ended September 30, 2011. This improvement in the combined ratio was mostly attributable to the loss ratio reduction, from 77.2% to 69.0%, as a result of the exiting of the non-standard automobile lines. Our commercial automobile lines of business grew 183.0% during the nine month period ended September 30, 2012 versus the nine month period ended September 30,December 31, 2011.
Investment performance and other income generated $3.1 million of income for the nine month period ended September 30, 2012, of which $1.1 million are realized gains. This resulted in a 3.2% annualized yield for the nine month period ended September 30, 2012, compared to 4.7% in the nine month period ended September 30, 2011 when we realized $2.8 million in gains. Cash and invested assets were $121.7 millionas of the period ended September 30, 2012 and were $6.2 million lower than December 31, 2011, resulting primarily from the payment of claim settlements. This reduction in cash and invested assets is in line with expectations.37
Overall, Atlas generated net income of $1.9 million for the nine month period ended September 30, 2012. After taking the impact of the liquidation preference of the preferred shares into consideration, basic and diluted earnings per common share in the nine month period ended September 30, 2012 was $0.21. This compares to net income of $555,000 or a loss of $0.01 per common share diluted in the nine month period ended September 30, 2011.
Book value per common share diluted as of the period ended September 30, 2012 was $6.46, compared to $6.56as of the period ended September 30, 2011 and $6.16 as at the three month period ended June 30, 2012.
Application of Critical Accounting EstimatesIII. APPLICATION OF CRITICAL ACCOUNTING ESTIMATES
The preparation of financial statements in conformity with U.S. GAAP requires management to adopt accounting policies and make estimates and assumptions that affect amounts reported in the consolidated financial statements. The most critical estimates include those used in determining:
Fair value and impairment of financial assets;
Deferred policy acquisition costs recoverability;
Reserve for property-liability insurance claims and claims expense estimation; and
Deferred tax asset valuation.
| |
| ◦ | Fair value and impairment of financial assets; |
| |
| ◦ | Deferred policy acquisition costs recoverability; |
| |
| ◦ | Reserve for property-liability insurance claims and claims expense estimation; and |
| |
| ◦ | Deferred tax asset valuation. |
In making these determinations, management makes subjective and complex judgments that frequently require estimates about matters that are inherently uncertain. Many of these policies, estimates and related judgments are common in the insurance and financial services industries; others are specific to our businesses and operations. It is reasonably likely that changes in these items could occur from period to period and result in a material impact on our consolidated financial statements.
A brief summary of each of these critical accounting estimates follows. For a more detailed discussion of the effect of these estimates on our consolidated financial statements, and the judgments and assumptions related to these estimates, see the referenced sections of this document. For a complete summary of our significant accounting policies, see the notes to the consolidated financial statements.
Fair values of financial instruments - Atlas has used the following methods and assumptions in estimating its fair value disclosures:
Fair values for bonds and equity securities are based on quoted market prices, when available. If quoted market prices are not available, fair values are based on quoted market prices of comparable instruments or values obtained from independent pricing services through a bank trustee.
Atlas’Atlas' fixed income portfolio is managed by Asset Allocation Management (“AAM”), ana SEC registered investment advisor specializing in the management of insurance company portfolios. Management works directly with AAMthem to ensure that Atlas benefits from their expertise and also evaluates investments as well as specific positions independently using internal resources. AAMAtlas' investment advisor has a team of credit analysts for all investment grade fixed income sectors. The investment process begins with an independent analyst review of each security’ssecurity's credit worthiness using both quantitative tools and qualitative review. At the issuer level, this includes reviews of past financial data, trends in financial stability, projections for the future, reliability of the management team in place, market data (credit spread, equity prices, trends in this data for the issuer and the issuer’sissuer's industry). Reviews also consider industry trends and the macro-economic environment. This analysis is continuous, integrating new information as it becomes available. In short, Atlas does not rely on rating agency ratings to make investment decisions, but instead with the support of its independent investment advisors, doesperforms independent fundamental credit analysis to find the best securities possible. AAM hasTogether with its investment advisor, Atlas found that over time this process creates an ability to sell securities prior to rating agency
downgrades or to buy securities before upgrades. As of the period ended September 30,December 31, 2012, this process did not generate any significant difference in the rating assessment between Atlas’Atlas' review and the rating agencies.
Atlas employs specific control processes to determine the reasonableness of the fair value of its financial assets. These processes are designed to supplement those performed by AAM to ensure that the values received from them are accurately recorded and that the data inputs and the valuation techniques utilized are appropriate, consistently applied, and that the assumptions are reasonable and consistent with the objective of determining fair value. For example, on a continuing basis, Atlas assesses the reasonableness of individual security values which have stale prices or whose changes exceed certain thresholds as compared to previous values received from AAM or to expected prices. The portfolio is reviewed routinely for transaction volumes, new issuances, any changes in spreads, as well as the overall movement of interest rates along the yield curve to determine if sufficient activity and liquidity exists to provide a credible source for market valuations. When fair value determinations are expected to be more variable, they are validated through reviews by members of management or the Board of Directors who have relevant expertise and who are independent of those charged with executing investment transactions.
Impairment of financial assets - Atlas assesses, on a quarterly basis, whether there is objective evidence that a financial asset or group of financial assets is impaired. An investment is considered impaired when the fair value of the investment is less than its cost or amortized cost. When an investment is impaired, the Company must make a determination as to whether the impairment is other-than-temporary.
Under U.S. GAAP, with respect to an investment in an impaired debt security, other-than temporary impairment (OTTI) occurs if (a) there is intent to sell the debt security, (b) it is more likely than not it will be required to sell the debt security before its anticipated recovery, or (c) it is probable that all amounts due will be unable to be collected such that the entire cost basis of the security will not be recovered. If Atlas intends to sell the debt security, or will more likely than not be required to sell the debt security before the anticipated recovery, a loss in the entire amount of the impairment is reflected in net realized gains (losses) on
investments in the consolidated statements of comprehensive income. If Atlas determines that it is probable it will be unable to collect all amounts and Atlas has no intent to sell the debt security, a credit loss is recognized in net realized gains (losses) on investments in the consolidated statements of comprehensive income to the extent that the present value of expected cash flows is less than the amortized cost basis; any difference between fair value and the new amortized cost basis (net of the credit loss) is reflected in other comprehensive income (losses), net of applicable income taxes.
Deferred policy acquisition costs - Atlas defers brokers’ commissions, premium taxes and other underwriting and marketing costs directly relating to the successful acquisition of premiums written to the extent they are considered recoverable. These costs are then expensed as the related premiums are earned. The method followed in determining the deferred policy acquisition costs limits the deferral to its realizable value by giving consideration to estimated future claims and expenses to be incurred as premiums are earned. Changes in estimates, if any, are recorded in the accounting period in which they are determined. Anticipated investment income is included in determining the realizable value of the deferred policy acquisition costs. Atlas’ deferred policy acquisition costs are reported net of deferred ceding commissions.
Valuation of deferred tax assets - Deferred taxes are recognized using the asset and liability method of accounting. Under this method the future tax consequences attributable to temporary differences in the tax basis of assets, liabilities and items recognized directly in equity and the financial reporting basis of such items are recognized in the financial statements by recording deferred tax liabilities or deferred tax assets.
Deferred tax assets related to the carry-forward of unused tax losses and credits and those arising from temporary differences are recognized only to the extent that it is probable that future taxable income will be available against which they can be utilized. Deferred tax assets and liabilities are measured using enacted tax rates expected to apply to taxable income in the years in which those temporary differences are expected to be recovered or settled. The effect on future tax assets and liabilities of a change in tax rates is recognized in income in the period that includes the date of enactment or substantive enactment.
In assessing the need for a valuation allowance, Atlas considers both positive and negative evidence related to the likelihood of realization of the deferred tax assets. If, based on the weight of available evidence, it is more likely than not the deferred tax assets will not be realized or if it is deemed premature to conclude that these assets will be realized in the near future, a valuation allowance is recorded.
Claims liabilities - The provision for unpaid claims represent the estimated liabilities for reported claims, plus those incurred but not yet reported and the related estimated loss adjustment expenses. Unpaid claims expenses are determined using case-basis evaluations and statistical analyses, including insurance industry loss data, and represent estimates of the ultimate cost of all claims incurred. Although considerable variability is inherent in such estimates, management believes that the liability for unpaid claims is adequate. The estimates are continually reviewed and adjusted as necessary; such adjustments are included in current operations and are accounted for as changes in estimates.
Operating ResultsIV. 2012 OPERATING RESULTS
Year EndedDecember 31, 2012 compared to year endedDecember 31, 2011:
Gross Premium Written
The following table summarizes gross premium written by line of business.
| Gross Premium Written by Line of Business (in ‘000s) |
| | | | | | | | | | | | | | | | | |
| | Three Month Periods Ended | | Nine Month Periods Ended |
| | September 30, 2012 | September 30, 2011 | % Change | | September 30, 2012 | September 30, 2011 | % Change |
| Commercial automobile | $ | 22,119 |
| $ | 5,350 |
| 313.4 | % | | $ | 41,045 |
| $ | 14,504 |
| 183.0 | % |
| Non-standard automobile | (31 | ) | 4,342 |
| (100.7 | )% | | (540 | ) | 14,012 |
| (103.9 | )% |
| Other | 1,265 |
| 1,236 |
| 2.3 | % | | 3,843 |
| 4,435 |
| (13.3 | )% |
| Total | $ | 23,353 |
| $ | 10,928 |
| 113.7 | % | | $ | 44,348 |
| $ | 32,951 |
| 34.6 | % |
Third Quarter 2012
| Gross premium written by line of business (in '000s) |
| | | | | | | | |
| Year Ended December 31, | 2012 | 2011 | % Change |
| Commercial automobile | $ | 50,546 |
| $ | 18,790 |
| 169.0 | % |
| Non-standard automobile | (541 | ) | 17,412 |
| (103.1 | )% |
| Other | 5,045 |
| 5,829 |
| (13.4 | )% |
| | $ | 55,050 |
| $ | 42,031 |
| 31.0 | % |
For the three month periodyear ended September 30,December 31, 2012, gross premium written was $23.455.1 million compared to $10.942.0 million in the three month periodyear ended September 30,December 31, 2011, and $9.2 million in the three month period ended June 30, 2012, representing a 113.7%31.0% increase and 152.7%increase, respectively.. The increase relative to the three month periodyear ended September 30,December 31, 2011 is due primarily to the substantial growth of the core commercial auto business, which offset the exit of the non-standard auto line of business. In theDuring three month period ended September 30, 2012, we implemented a new business arrangement in New York to provide excess coverage above the levels of risk retained by the insured. Total premium related to this program, which was written exclusively in the third quarter of 2012, was $12.4 million in the three month periodyear ended September 30,December 31, 2012 and is included in the commercial automobile"commercial automobile" line of business. Below we will refer to the arrangement as the “excess"excess taxi program”program" where it is relevant to explain certain variances. The increase relative to the three month period ended June 30, 2012 is primarily the result of the excess taxi program.
In the three month periodyear ended September 30,December 31, 2012, gross premium written from commercial automobile was $22.150.5 million, representing a 313.4%169.0% increase relative to the three month periodyear ended September 30,December 31, 2011 and a 169.5%increase compared to the three month period ended June 30, 2012. This substantial increase is primarily the result of the excess taxi program but also the planned expansion of the commercial auto business. Removing the impact of the excess taxi program, our traditional commercial automobile premium written was $9.738.1 million, ana increase of 80.9%102.8% versus the three month periodyear ended September 30,December 31, 2011 and 17.9% relative to the three month period ended June 30, 2012. The cessation of non-standard auto written premium allowed Atlas to focus its resources on its core line of business. Our exit from the non-standard auto line of business had a lesser impact on total premium written as the year went forward. As a percentage of the insurance subsidiaries’ overall book of business, commercial auto gross premium written represented 94.7%91.8% of gross premium written in the three month periodyear ended September 30,December 31, 2012 compared to 49.0%44.7% during the three month periodyear ended September 30,December 31, 2011 and 88.8% in the three month period ended June 30, 2012.
Commercial automobile insurance has outperformed the overall P&C industry in each of the past ten years based on data compiled by A.M. Best.the NAIC. Each of the specialty business lines on which Atlas’ strategy is focused is a subset of this industry segment.
Year to Date September 30, 2012
For the nine month period ended September 30, 2012, gross premium written was $44.3 million compared to $33.0 million in the nine month period ended September 30, 2011, representing a 34.6%increase. This increase was attributable to significant gains in commercial automobile premium. Our exit from the non-standard auto line of business is having a lesser impact on total premium written as the year goes forward.
In the nine month period ended September 30, 2012, gross premium written from commercial automobile was $41.0 million, representing a 183.0%increase relative to the nine month period ended September 30, 2011. As a percentage of the insurance subsidiaries’ overall book of business, commercial auto gross premium written represented 92.6% of gross premium written in the nine month period ended September 30, 2012 compared to 44.0% during the nine month period ended September 30, 2011.
Geographic Concentration
| Gross Premium Written by State (in ‘000s) |
| | | | | | | | | | | | | | | | | | | | | | | |
| | Three Month Periods Ended | | Nine Month Periods Ended |
| | September 30, 2012 | | September 30, 2011 | | September 30, 2012 | | September 30, 2011 |
| New York | $ | 12,991 |
| 55.6 | % | | $ | 323 |
| 3.0 | % | | $ | 15,324 |
| 34.6 | % | | $ | 1,487 |
| 4.5 | % |
| Louisiana | 2,436 |
| 10.4 | % | | 1,388 |
| 12.7 | % | | 2,739 |
| 6.2 | % | | 1,391 |
| 4.2 | % |
| Michigan | 1,561 |
| 6.7 | % | | 930 |
| 8.5 | % | | 5,285 |
| 11.9 | % | | 2,648 |
| 8.0 | % |
| Illinois | 1,538 |
| 6.6 | % | | 5,303 |
| 48.5 | % | | 8,551 |
| 19.3 | % | | 20,618 |
| 62.6 | % |
| Minnesota | 566 |
| 2.4 | % | | 663 |
| 6.1 | % | | 2,160 |
| 4.9 | % | | 1,745 |
| 5.3 | % |
| Virginia | 482 |
| 2.1 | % | | 23 |
| 0.2 | % | | 1,143 |
| 2.6 | % | | 7 |
| — | % |
| Texas | 308 |
| 1.3 | % | | 95 |
| 0.9 | % | | 1,164 |
| 2.6 | % | | 435 |
| 1.3 | % |
| Indiana | 253 |
| 1.1 | % | | 710 |
| 6.5 | % | | 368 |
| 0.8 | % | | 2,330 |
| 7.1 | % |
| Georgia | 208 |
| 0.9 | % | | — |
| — | % | | 811 |
| 1.8 | % | | — |
| — | % |
| Other | 3,010 |
| 12.9 | % | | 1,493 |
| 13.6 | % | | 6,803 |
| 15.3 | % | | 2,290 |
| 7.0 | % |
| Total | $ | 23,353 |
| 100.0 | % | | $ | 10,928 |
| 100.0 | % | | $ | 44,348 |
| 100.0 | % | | $ | 32,951 |
| 100.0 | % |
Third Quarter 2012
| Gross premium written by state (in '000s) |
| | | | | | | | | | | |
| Year Ended December 31, | 2012 | | 2011 |
| New York | $ | 15,833 |
| 28.8 | % | | $ | 1,865 |
| 4.4 | % |
| Illinois | 9,880 |
| 17.9 | % | | 25,398 |
| 60.4 | % |
| Michigan | 7,087 |
| 12.9 | % | | 3,828 |
| 9.1 | % |
| Minnesota | 3,708 |
| 6.7 | % | | 2,555 |
| 6.1 | % |
| Louisiana | 3,426 |
| 6.2 | % | | 1,530 |
| 3.6 | % |
| Texas | 1,485 |
| 2.7 | % | | 531 |
| 1.3 | % |
| Virginia | 1,476 |
| 2.7 | % | | 64 |
| 0.2 | % |
| Missouri | 1,209 |
| 2.2 | % | | 660 |
| 1.6 | % |
| Wisconsin | 1,200 |
| 2.2 | % | | 758 |
| 1.8 | % |
| Georgia | 951 |
| 1.7 | % | | 27 |
| 0.1 | % |
| Indiana | 604 |
| 1.1 | % | | 2,687 |
| 6.4 | % |
| Other | 8,191 |
| 14.9 | % | | 2,128 |
| 5.0 | % |
| Total | $ | 55,050 |
| 100.0 | % | | $ | 42,031 |
| 100.0 | % |
As illustrated by the data in Table 3 above, 55.6%28.8% of Atlas’ gross premium written for the three month periodyear ended September 30,December 31, 2012 came from New York and 72.7%72.5% came from the threefive states currently producing the most premium volume, (New York, Louisiana and Michigan), as compared to 69.7%86.4% in the three month periodyear ended September 30,December 31, 2011 (Illinois, Michigan and Louisiana) and. Our commitment to expanding geographically resulted in 9 states with more than $1 million in written premium in 47.8% in the three month period ended June 30, 2012 (Illinois, Minnesota and Michigan)compared to only 6 in 2011. This is the first quarter where Atlas’ largest top three states by premium volume did not include Illinois, further highlighting the results of its commitment to diversifying geographically by expanding in new areas of the country, and leveraging experience, historical data and research. Our increase in New York is primarily due to the excess taxi program. The decline in Illinois is primarily attributable to Atlas’ exit from non-standard insurance lines as well as re-allocation of resources to pursuits in new markets.
Though we built an expanded presence in New York, we do notdon't believe there was materialour exposure to our business due tobe material in that state as a result of Hurricane Sandy.
Year to Date September 30, 2012
Atlas saw similar geographic diversification in the nine month period ended September 30, 2012 compared to the nine month period ended September 30, 2011. 65.8% of our premium volume came from the top three states (Michigan, Illinois and New York) in 2012, compared to 77.7% in 2011 (Illinois, Michigan and Indiana).
The decline of written premiums for the nine month period ended September 30, 2012 versus the nine month period ended September 30, 2011 in Illinois and Indiana is primarily attributable to Atlas’ exiting the non-standard automobile insurance lines as well as re-allocating resources to pursuits in new markets. The majority of the 2011 non-standard automobile written premiums came from those two states. This was mostly offset by gains in commercial auto premiums in other states, both in established markets such as Michigan and New York and new states.
Ceded Premium Written
Ceded premium written is equal to premium ceded under the terms of Atlas’ inforce reinsurance treaties. Ceded premium written increased 38.6%4.8% to $2.06.5 million for the three month periodyear ended September 30,December 31, 2012 compared with $1.46.2 million for the three month periodyear ended September 30,December 31, 2011, and increased37.7% from $1.4 million for the three month period ended June 30, 2012. This changeThe percentage of premium ceded is the result ofdriven by the business mix within our total premium base.
In the nine month period ended September 30, 2012, ceded premium written increased6.5% Our reinsurance partners have remained consistent compared to $4.9 million from $4.6 million for the nine month period ended September 30, 2011.2011.
Net Premium Written
Net premium written is equal to gross premium written less the ceded premium written under the terms of Atlas’ inforce reinsurance treaties. Net premium written increased 124.9%35.5% to $21.448.6 million for the three month periodyear ended September 30,December 31, 2012 compared with $9.535.9 million for the three month periodyear ended September 30,December 31, 2011 and increased173.7% versus the three month period ended June 30, 2012. These changes are attributed to the combined effects of the issues cited in the ‘Gross Premium Written’ and ‘Ceded Premium Written’ sections above.
The success of our focus on commercial auto insurance in 2012 is more pronounced when viewed in terms of net premium written. As a percentage of the total net premium written, commercial auto represented 100.1%100.7% for the three month period
year ended September 30,December 31, 2012 and 101.5% for the three month period ended June 30, 2012, versus only 53.3%50.4% in the three month periodyear ended September 30,December 31, 2011. Premium credits in the non-standard personal lines caused the percentage of core commercial auto premium to exceed 100% of the total net written premium for each of the last two three month periods.
Similarly, in the nine month period ended September 30, 2012, commercial auto insurance comprised 101.0% of the total net premium written versus just 49.5% in the nine month period ended September 30, 2011. As indicated above, premium credits in the non-standard personal lines caused the percentage of core commercial auto premium to exceed 100% of the total net written premium for the nine month period ended September 30, 2012.year.
Net Premium Earned
Premiums are earned ratably over the term of the underlying policy. Net premium earned was $10.938.7 million in the three month periodyear ended September 30,December 31, 2012, a 24.3%8.3% increase compared with $8.835.7 million in the three month periodyear ended September 30, 2011 and a 44.8%increase versus the three month period ended June 30, 2012.
In the nine month period ended September 30, 2012, net premium earned was $26.8 million, a 0.5%increase compared to $26.7 million for the nine month period ended September 30,December 31, 2011.
The increase in net premiums earned is attributable to the excess taxi program and strong growth in core commercial auto lines.lines, which offsets the 74.6% reduction of earned premiums related to non-core personal lines in 2012. Net earned premiums on our core lines were $10.533.6 million in the three month periodyear ended September 30,December 31, 2012, a 161.8%112.9% increase compared with $4,01315.8 million in the three month periodyear ended September 30, 2011 and a 68.8%increase versus the three month period ended June 30, 2012. Similarly, net earned premiums on our core lines for the nine month period ended September 30, 2012 were $21.9 million, a 91.7%increase compared to the nine month period ended September 30,December 31, 2011.
Claims Incurred
The loss ratio relating to the claims incurred in the three month periodyear ended September 30,December 31, 2012 was 65.5%68.6% compared to 79.4%81.1% in the three month periodyear ended September 30, 2011 and 71.6% for the three month period ended June 30, 2012.
For the nine month period ended September 30, 2012, the loss ratio was 69.0%, compared to 77.2% for the nine month period ended September 30,December 31, 2011.
Loss ratios improved in the three month periodyear ended September 30,December 31, 2012 relative to prior periods. This isperiods primarily attributabledue to the increased compositionpercentage of commercial auto, as a percentage of the total written premium, which has historically had a better overall underwriting result. Further,result, relative to total written premium. In 2011, the $1.8 million reserve strengthening adjustment made in the fourth quarter also unfavorably impacted that year's loss ratio by 5%. In 2012, the excess taxi program also contributed significantly to favorable loss results in the three month period ended September 30, 2012.year as we expect better than average claim experience from this program. We believe that our extensive experience and expertise with respect to underwriting and claims management in all our commercial lines will allow us to continue this decreasing trend since we expect 100% of net earned premium to be related to core lines of business in 2013. The Company is committed to retain this claim handling expertise as a core competency as the volume of business increases.
Acquisition Costs
Acquisition costs represent commissions and taxes incurred on net premium earned. Acquisition costs were $1.86.5 million in the three month periodyear ended September 30,December 31, 2012 or 16.6%16.7% of net premium earned, as compared to 19.6%20.4% in the three month periodyear ended September 30, 2011 and 18.5% in the three month period ended June 30, 2012.
For the nine month period ended September 30, 2012, the ratio was 17.1% as compared to 20.0% in the nine month period ended September 30,December 31, 2011.
The favorable trend in acquisition costs is primarily due to the shift away from non-standard automobile insurance which carries higher commission rates.
Other Underwriting Expenses
The other underwriting expense ratio was 15.5%17.1% in the three month periodyear ended September 30,December 31, 2012 compared to 20.7%29.9% in the three month periodyear ended September 30,December 31, 2011 and 21.4% in the three month period ended June 30, 2012. ThisWhile various cost-saving initiatives were realized in 2012, this decline is also attributable to a significantslight increase in premium earned in the three month periodyear ended September 30,December 31, 2012 as well as, a reduction in employee head count since 2011.
For2011, and a $2.5 million pre-tax charge resulting from the nine month period ended September 30, 2012, this ratio was 18.5%, as compared to 21.2% forsettlement of the nine month period ended September 30, 2011. However, 2011 includes $627,000American Country Pension Plan in non-recurring expenses (detailed below) which unfavorably impacted the year-to-date ratio by 2.4%. After adjustment for these non-recurring expenses, other underwriting expenses remained static year over year.fourth quarter of 2011.
| First Quarter 2011 Non-recurring Expenses (in ‘000s) |
| | | | |
| Expense Item | Description | Non-recurring Expense |
| Licenses, taxes and assessments | Amounts paid in Q1 2011 | $ | 198 |
|
| Professional fees | Legal and Accounting fees | 121 |
|
| Salary and benefits | Q1 staff reduction impacts | 174 |
|
| EDP expense | Decommissioning software expenses previously capitalized | 84 |
|
| Occupancy/Miscellaneous expense | Straight-line lease adjustment | 50 |
|
| Total non-recurring expenses | | $ | 627 |
|
Net Investment Income
| Investment Results (in ‘000s) |
| | | | | | | | | | | | | | | |
| | Three Month Periods Ended | | Nine Month Periods Ended |
| | September 30, 2012 | | September 30, 2011 | | September 30, 2012 | | September 30, 2011 |
Average securities at cost(1) | $ | 120,734 |
| | $ | 144,028 |
| | $ | 123,245 |
| | $ | 153,753 |
|
| Interest income after expenses | 613 |
| | 719 |
| | 1,878 |
| | 2,651 |
|
| Percent earned on average investments (annualized) | 2.0 | % | | 2.0 | % | | 2.0 | % | | 2.3 | % |
| Net realized gains | $ | 779 |
| | $ | 1,962 |
| | $ | 1,098 |
| | $ | 2,813 |
|
| Total investment income | 1,392 |
| | 2,681 |
| | 2,976 |
| | 5,464 |
|
| Total realized yield (annualized) | 4.6 | % | | 7.4 | % | | 3.2 | % | | 4.7 | % |
(1)Includes cash as well as the investment in Oak Street (see note 5 to condensed consolidated financial statements).| Investment Results (in '000s) |
| | | | | | | |
| Year Ended December 31, | 2012 | | 2011 |
| Average securities at cost | $ | 121,938 |
| | $ | 146,642 |
|
| Interest income after expenses | 2,453 |
| | 3,280 |
|
| Percent earned on average investments (annualized) | 2.0 | % | | 2.2 | % |
| Net realized gains | $ | 1,435 |
| | $ | 4,147 |
|
| Total investment income | 3,888 |
| | 7,427 |
|
| Total realized yield (annualized) | 3.2 | % | | 5.1 | % |
Investment income (excluding net realized gains) decreased by 14.7%25.2% to $6132.5 million,000 in the three month periodyear ended September 30,December 31, 2012, compared to $7193.3 million,000 in the three month periodyear ended September 30,December 31, 2011, and decreased by 6.8% from $657,000 for the three month period ended June 30, 2012. These amounts are primarily comprised of interest income. This decrease is attributable to the timing of asset disposals, decrease in average invested assets, and the mix of securities on hand. The annualized realized yield on invested assets (including net realized gains of $7791.4 million,000)) in the three month periodyear ended September 30,December 31, 2012 decreased to 4.6%3.2% as compared with 7.4%5.1% in the three month periodyear ended September 30,December 31, 2011 and increased compared to 3.2% for the three month period ended June 30, 2012. This is primarily due to the relative absence ofsignificant decline in realized gains during the three month period ended June 30, 2012 versus those periods.
On a year-to-date basis, interest income decreased by 29.2% to $1.9 million from $2.7 million for the nine month period ended September 30, 2011. This decrease correlates with a similar decline in the average securities held, which is consistent with our expectations for claim payout patterns. The annualized realized yield on invested assets (including realized gains) decreased to 3.2% from 4.7%, due primarily to a reduction in realized gains year over year.2011.
Net Realized Investment Gains (Losses)
Net realized investment gains in the three month periodyear ended September 30,December 31, 2012 were $7791.4 million,000 compared to $2.04.1 million in the three month periodyear ended September 30,December 31, 2011 and $291,000 during the three month period ended June 30, 2012. On a year-to-date basis, realized gains were $1.1 million in the nine month period ended September 30, 2011 compared to $2.8 million for the nine month period ended September 30, 2012. The difference is the result of management’smanagement's decision to sell certain securities consistent with the Company’sCompany's liquidity needs and expected duration of claim payment triangles during favorable market conditions.conditions that were evident in 2011.
Miscellaneous Income (Loss)
Atlas recorded miscellaneous income in the three month periodyear ended September 30,December 31, 2012 of $1194,000 compared to $113178,000 for the three month periodyear ended September 30,December 31, 2011 and $51,000 in the three month period ended June 30, 2012. Miscellaneous income prior to June 30, 2012 was primarily comprised of rental income from our corporate headquarters in Elk Grove Village, Illinois, which has subsequently been sold. We recognized only $26,000 in miscellaneous income during the fourth quarter of 2012.
Combined Ratio
Underwriting profitability, as opposed to overall profitability or net earnings, is measured by the combined ratio. The combined ratio is the sum of the loss and loss adjustment expense (LAE) expense ratio, the acquisition cost ratio and the underwriting expense ratio. Atlas’ combined ratio for the three month periodsyears ended September 30,December 31, 2012 and 2011 are summarized in the table below. The underwriting loss is attributable to the factors described in the ‘Claims Incurred’, ‘Acquisition Costs’, and ‘Other Underwriting Expenses’ sections above. This is the first quarter that we have achieved a combined ratio below 100% since our inception in December 2010.
| Combined Ratios (in ‘000s) |
| | | | | | | | | | | |
| Three Month Periods Ended | September 30, 2012 | | September 30, 2011 | | June 30, 2012 |
| Net premium earned | $ | 10,934 |
| | $ | 8,797 |
| | $ | 7,552 |
|
Underwriting expenses(1) | 10,670 |
| | 10,526 |
| | 8,420 |
|
| Combined ratio | 97.6 | % | | 119.7 | % | | 111.5 | % |
| Combined Ratios (in '000s) | | Combined Ratios (in '000s) |
| | | Nine Month Periods Ended | September 30, 2012 | | September 30, 2011 | |
| Year Ended December 31, | | 2012 | | 2011 |
| Net premium earned | $ | 26,795 |
| | $ | 26,669 |
| $ | 38,709 |
| | $ | 35,747 |
|
Underwriting expenses(1) | 28,018 |
| | 31,582 |
| |
Underwriting expenses 1 | | 39,626 |
| | 46,986 |
|
| Combined ratio | 104.6 | % | | 118.4 | % | 102.4 | % | | 131.4 | % |
(1)1 - Underwriting expenses are the combination of claims incurred, acquisition costs, and other underwriting expenses.expenses
2011 non-operating expenses totaled $5.0 million ($3.4 million net of tax) which includes a one-time $2.5 million ($1.8 million net of tax) non cash charge upon settlement of the American Country Pension Plan, a $1.8 million ($1.2 million net of tax) fourth quarter reserve strengthening charge related to pre-Atlas periods, and non-recurring expenses incurred in Q1 2011 of $627,000 ($414,000 net of tax) related to the reverse merger transaction costs and restructuring. Together, these non-operating expenses had an unfavorable impact of 13.9% on the Company's combined ratio in 2011.
Removing the impact of the above non-operating expenses, our combined ratio improved by 15.3%. Our combined ratio improvement in 2012 is attributed to the combined effects of the issues cited in the ‘Claims Incurred,’ and ‘Acquisition Costs,’ 'Other Underwriting Expenses' and 'Net Premium Earned' sections above.
Income/Loss before Income Taxes
Atlas generated pre-tax income of $1.73.2 million in the three month periodyear ended September 30,December 31, 2012, compared to pre-tax incomelosses of $1.13.6 million in the three month periodyear ended September 30, 2011 and pre-tax income of $130,000 in the three month period ended June 30, 2012.
In the nine month period ended September 30, 2012, Atlas generated pre-tax income of $1.9 million compared to income of $555,000 in the nine month period ended September 30,December 31, 2011.
Income Tax Benefit
Atlas recognized no tax expense in the three month periodyear ended September 30,December 31, 2012, nor duringhowever recognized a tax benefit of $1.2 million for the three month periodyear ended September 30,December 31, 2011 or the three month period ended June 30, 2012. The following table reconciles tax benefit from applying the statutory U.S. Federal tax rate of 34.0% to the actual percentage of pre-tax income provided for the three month periodsyears ended September 30,December 31, 2012 and 2011.:
| Tax Rate Reconciliation (in ‘000s) | |
| Tax Rate Reconciliation (in '000s) | | Tax Rate Reconciliation (in '000s) |
| | | Three Month Periods Ended | | Nine Month Periods Ended | |
| | September 30, 2012 | September 30, 2011 | | September 30, 2012 | | September 30, 2011 | |
| Year Ended December 31, | | | 2012 | | 2011 |
| | Amount | | % | | Amount | | % | | Amount | | % | | Amount | | % | | Amount | | % | | Amount | | % |
| Expected income tax benefit at statutory rate | $ | 563 |
| | 34.0 | % | | $ | 362 |
| | 34.0 | % | | $ | 653 |
| | 34.0 | % | | $ | (174 | ) | | 34.0 | % | | $ | 1,076 |
| | 34.0 | % | | $ | (1,235 | ) | | (34.0 | )% |
| Valuation allowance | (566 | ) | | (34.2 | )% | | (384 | ) | | (56.0 | )% | | (658 | ) | | (34.2 | )% | | 131 |
| | (25.6 | )% | | (1,119 | ) | | (35.3 | )% | | — |
| | — | % |
| Nondeductible expenses | 5 |
| | 0.3 | % | | 22 |
| | 22.0 | % | | 10 |
| | 0.5 | % | | 43 |
| | (8.4 | )% | | 48 |
| | 1.5 | % | | 5 |
| | 0.1 | % |
| Other | (2 | ) | | (0.1 | )% | |
| | — | % | | (5 | ) | | (0.3 | )% | |
| | — | % | | (5 | ) | | (0.2 | )% | | 67 |
| | 1.8 | % |
| Total | $ | — |
| | — | % | | $ | — |
| | — | % | | $ | — |
| | — | % | | $ | — |
| | — | % | | $ | — |
| | — | % | | $ | (1,163 | ) | | (32.0 | )% |
Upon the transaction forming Atlas on December 31, 2010, a yearly limitation as required by U.S. tax law Section 382 that applies to changes in ownership on the future utilization of Atlas’ net operating loss carry-forwards was calculated. The insurance subsidiaries’ prior parent retained those tax assets previously attributed to the insurance subsidiaries which could not be utilized by Atlas as a result of this limitation. As a result, Atlas’ ability to recognize future tax benefits associated with a portion of its deferred tax assets generated during prior years and the current year have been permanently limited to the amount determined under U.S. tax law Section 382. The result is a maximum expected net deferred tax asset, which Atlas has available after the merger which isand believed more-likely-than-not to be utilized in the future, after consideration of valuation allowance.
Net Income/(Loss)Loss and Earnings/(Loss)Loss per Common Share
Atlas earned $1.73.2 million during the three month periodyear ended September 30,December 31, 2012 versus incomelosses of $1.12.5 million during the three month periodyear ended September 30,December 31, 2011 and income of $130,000 for the three month period ended June 30, 2012. After taking the impact of the liquidation preference of the preferred shares into consideration, the basic and diluted earnings per common share in the three month periodyear ended September 30,December 31, 2012 was $0.240.38 versus a earnings#DIV/0! per common share of $0.140.54 in the three month periodyear ended September 30,December 31, 2011 and a loss per common share of $0.01 in the three month period ended June 30, 2012.
For the three month periodyear ended September 30,December 31, 2012, there were 6,144,3846,144,281 weighted average common shares outstanding used to compute basic earnings per share and 6,149,3018,434,948 used for diluted earnings per share. For the three month periodyear ended September 30,December 31, 2011, there were 6,124,9906,124,542 weighted average common shares outstanding used to compute basic earnings per share and 6,138,496 shares for diluted earnings per common share. Finally, there were 6,144,385 common shares used to compute basic and diluted loss#DIV/0! per commonshare.
Book Value per Ordinary Share
Book value per ordinary share for the three month period ended June 30, 2012.was as follows:
|
| | | | | | | |
| (in '000s, except for shares and per share data) | December 31, 2012 | December 31, 2011 |
| Shareholders' Equity | 59,864 |
| 56,254 |
|
| Preferred stock in equity | 18,000 |
| 18,000 |
|
| Accumulated dividends on preferred stock | 1,620 |
| 810 |
|
| Common equity | 40,244 |
| 37,444 |
|
| Shares outstanding | 6,144,392 |
| 6,143,463 |
|
| Book value per common share outstanding | $ | 6.55 |
| $ | 6.09 |
|
Atlas earned$1.9 million during the nine month period ended September 30,V. 2012 compared to income of $555,000 during the nine month period ended September 30, 2011. The basic and diluted earnings per common share in the nine month period ended September 30, 2012 was $0.21 compared to a loss of $0.01 in the nine month period ended September 30, 2011. FINANCIAL CONDITION
Book Value per Common Share
Book value per common share was as follows.
|
| | | | | | | | | | |
| (in ‘000s, except for shares and per share data) | September 30, 2012 | June 30, 2012 | September 30, 2011 |
| Shareholders' Equity | $ | 59,103 |
| $ | 57,031 |
| $ | 58,781 |
|
| Preferred stock in Equity | 18,000 |
| 18,000 |
| 18,000 |
|
| Accumulated dividends on preferred stock | 1,416 |
| 1,212 |
| 606 |
|
| Common Equity | 39,687 |
| 37,819 |
| 40,175 |
|
| Common shares outstanding | 6,144,385 |
| 6,144,385 |
| 6,125,629 |
|
| Book value per common share outstanding | $ | 6.46 |
| $ | 6.16 |
| $ | 6.56 |
|
| | | Consolidated Statements of Financial Condition | | | | | | |
| | | | | | | |
| (in ‘000s, except for shares and per share data) | | | | |
| | | |
| September 30, 2012
(unaudited) | | December 31,
2011 | |
| (in '000s, except for share and per share data) | | December 31,
2012 | | December 31,
2011 |
| Assets | | | | | | |
| Investments, available for sale | | | | | | |
| Fixed income securities, at fair value (Amortized cost $106,122 and $101,473) | $ | 109,555 |
| | $ | 103,491 |
| |
| Equity securities, at fair value (cost $0 and $994) | — |
| | 1,141 |
| |
| Fixed income securities, at fair value (Amortized cost $95,423 and $101,473) | | $ | 98,079 |
| | $ | 103,491 |
|
| Equity securities, at fair value (cost $1,563 and $994) | | 1,571 |
| | 1,141 |
|
| Other investments | | 1,262 |
| | — |
|
| Total Investments | 109,555 |
| | 104,632 |
| 100,912 |
| | 104,632 |
|
| Cash and cash equivalents | 12,151 |
| | 23,249 |
| 19,912 |
| | 23,249 |
|
| Accrued investment income | 807 |
| | 586 |
| 517 |
| | 586 |
|
| Accounts receivable and other assets (Net of allowance of $385 and $4,254) | 24,811 |
| | 9,579 |
| |
| Accounts receivable and other assets (Net of allowance of $484 and $4,254) | | 21,923 |
| | 9,579 |
|
| Reinsurance recoverables, net | 6,983 |
| | 8,044 |
| 6,020 |
| | 8,044 |
|
| Prepaid reinsurance premiums | 2,219 |
| | 2,214 |
| 2,111 |
| | 2,214 |
|
| Deferred policy acquisition costs | 4,501 |
| | 3,020 |
| 3,764 |
| | 3,020 |
|
| Deferred tax asset, net | 6,343 |
| | 6,775 |
| 6,605 |
| | 6,775 |
|
| Software and office equipment, net | 1,157 |
| | 440 |
| 1,137 |
| | 440 |
|
| Assets held for sale | 166 |
| | 13,634 |
| 166 |
| | 13,634 |
|
| Investment in investees | 1,250 |
| | — |
| |
| Total Assets | $ | 169,943 |
| | $ | 172,173 |
| $ | 163,067 |
| | $ | 172,173 |
|
| | | | | | | |
| Liabilities | | | | | | |
| Claims liabilities | $ | 73,574 |
| | $ | 91,643 |
| $ | 70,067 |
| | $ | 91,643 |
|
| Unearned premiums | 28,325 |
| | 15,691 |
| 25,457 |
| | 15,691 |
|
| Due to reinsurers and other insurers | 4,658 |
| | 5,701 |
| 3,803 |
| | 5,701 |
|
| Other liabilities and accrued expenses | 4,283 |
| | 2,884 |
| 3,876 |
| | 2,884 |
|
| Total Liabilities | $ | 110,840 |
| | $ | 115,919 |
| $ | 103,203 |
| | $ | 115,919 |
|
| | | | | | | |
| Shareholders’ Equity | | | | | | |
| Preferred shares, par value per share $0.001, 100,000,000 shares authorized, 18,000,000 shares issued and outstanding at September 30, 2012 and December 31, 2011. Liquidation value $1.00 per share | $ | 18,000 |
| | $ | 18,000 |
| |
| Ordinary voting common shares, par value per share $0.003, 266,666,667 shares authorized, 1,542,764 shares issued and outstanding at September 30, 2012 and 1,541,842 at December 31, 2011 | 4 |
| | 4 |
| |
| Restricted voting common shares, par value per share $0.003, 33,333,334 shares authorized, 4,601,621 shares issued and outstanding at September 30, 2012 and December 31, 2011 | 14 |
| | 14 |
| |
| Preferred shares, par value per share $0.001, 100,000,000 shares authorized, 18,000,000 shares issued and outstanding at December 31, 2012 and December 31, 2011. Liquidation value $1.00 per share | | $ | 18,000 |
| | $ | 18,000 |
|
| Ordinary shares, par value per share $0.003, 266,666,667 shares authorized, 2,256,921 shares issued and outstanding at December 31, 2012 and 1,541,842 at December 31, 2011 | | 4 |
| | 4 |
|
| Restricted voting common shares, par value per share $0.003, 33,333,334 shares authorized, 3,887,471 shares issued and outstanding at December 31, 2012 and 4,601,621 at December 31, 2011 | | 14 |
| | 14 |
|
| Additional paid-in capital | 152,739 |
| | 152,652 |
| 152,768 |
| | 152,652 |
|
| Retained deficit | (113,919 | ) | | (115,841 | ) | (112,675 | ) | | (115,841 | ) |
| Accumulated other comprehensive income, net of tax | 2,265 |
| | 1,425 |
| 1,753 |
| | 1,425 |
|
| Total Shareholders’ Equity | 59,103 |
| | 56,254 |
| $ | 59,864 |
| | $ | 56,254 |
|
| Total Liabilities and Shareholders’ Equity | $ | 169,943 |
| | $ | 172,173 |
| $ | 163,067 |
| | $ | 172,173 |
|
| | | | | | | |
Investments
Investments Overview and Strategy
Atlas aligns its securities portfolio to support the liabilities and operating cash needs of the insurance subsidiaries, to preserve capital and to generate investment returns. Atlas invests predominantly in corporate and government bonds with relatively short durations that correlate with the payout patterns of Atlas’ claims liabilities. A third-party investment management firm manages Atlas’ investment portfolio pursuant to the Company’s investment policies and guidelines as approved by its Board of Directors. Atlas monitors the third-party investment manager’s performance and its compliance with both its mandate and Atlas’ investment policies and guidelines.
Atlas’ investment guidelines stress the preservation of capital, market liquidity to support payment of liabilities and the diversification of risk. With respect to fixed income securities, Atlas generally purchases securities with the expectation of holding them to their maturities; however, the securities are available for sale if liquidity needs arise.
Portfolio Composition
Atlas held securities with a fair value of $109.6100.9 million as of the periodyear ended September 30,December 31, 2012, which was primarily comprised of fixed income securities. The securities held by the insurance subsidiaries must comply with applicable regulations that prescribe the type, quality and concentration of securities. These regulations in the various jurisdictions in which the insurance subsidiaries are domiciled permit investments in government, state, municipal and corporate bonds, preferred and common equities, and other high quality investments, within specified limits and subject to certain qualifications.
The following table summarizes theamortized cost, gross unrealized gains and losses and fair value of the securities portfolio, including cashfor Atlas’ investments in fixed maturities and cash equivalents,equity investments are as at the dates indicated.follows (all amounts in '000s):
| Fair Value of Securities Portfolio (in ‘000s) | |
| Fair value of securities portfolio (in '000s) | | Fair value of securities portfolio (in '000s) |
| | September 30, 2012 | Amortized Cost | Gross Unrealized Gains | Gross Unrealized Losses | Fair Value | |
| December 31, 2012 | | December 31, 2012 | Amortized Cost | Gross Unrealized Gains | Gross Unrealized Losses | Fair Value |
| Fixed Income: | | | | |
| U.S. | - Government | $ | 37,356 |
| $ | 1,099 |
| $ | — |
| $ | 38,456 |
| - Government | $ | 34,993 |
| $ | 879 |
| $ | 9 |
| $ | 35,863 |
|
| | - Corporate | 44,100 |
| 1,709 |
| — |
| 45,809 |
| - Corporate | 35,922 |
| 1,253 |
| 16 |
| 37,159 |
|
| | - Commercial mortgage backed | 20,372 |
| 490 |
| — |
| 20,862 |
| - Commercial mortgage backed | 20,387 |
| 433 |
| 7 |
| 20,813 |
|
| | - Other asset backed | 4,293 |
| 135 |
| — |
| 4,428 |
| - Other asset backed | 4,121 |
| 123 |
| — |
| 4,244 |
|
| Total Fixed Income | | $ | 106,121 |
| $ | 3,433 |
| $ | — |
| $ | 109,555 |
| | $ | 95,423 |
| $ | 2,688 |
| $ | 32 |
| $ | 98,079 |
|
| Equities | | | $ | 1,563 |
| $ | 8 |
| $ | — |
| $ | 1,571 |
|
| Totals | | | $ | 96,986 |
| $ | 2,696 |
| $ | 32 |
| $ | 99,650 |
|
| | | December 31, 2011 | December 31, 2011 | Amortized Cost | Gross Unrealized Gains | Gross Unrealized Losses | Fair Value | December 31, 2011 | Amortized Cost | Gross Unrealized Gains | Gross Unrealized Losses | Fair Value |
| Fixed Income: | | | | |
| U.S. | - Government | $ | 44,835 |
| $ | 911 |
| $ | — |
| $ | 45,746 |
| - Government | $ | 44,835 |
| $ | 911 |
| $ | — |
| $ | 45,746 |
|
| | - Corporate | 35,572 |
| 825 |
| 24 |
| 36,373 |
| - Corporate | 35,572 |
| 825 |
| 24 |
| 36,373 |
|
| | - Commercial mortgage backed | 17,493 |
| 208 |
| — |
| 17,701 |
| - Commercial mortgage backed | 17,493 |
| 208 |
| — |
| 17,701 |
|
| | - Other asset backed | 3,573 |
| 99 |
| 1 |
| 3,671 |
| - Other asset backed | 3,573 |
| 99 |
| 1 |
| 3,671 |
|
| Total Fixed Income | | $ | 101,473 |
| $ | 2,043 |
| $ | 25 |
| $ | 103,491 |
| | $ | 101,473 |
| $ | 2,043 |
| $ | 25 |
| $ | 103,491 |
|
| Equities | | 994 |
| 147 |
| — |
| 1,141 |
| | 994 |
| 147 |
| — |
| 1,141 |
|
| Total | | $ | 102,467 |
| $ | 2,190 |
| $ | 25 |
| $ | 104,632 |
| |
| Totals | | | $ | 102,467 |
| $ | 2,190 |
| $ | 25 |
| $ | 104,632 |
|
Gross unrealized gains and losses on fixed income securities by type and sector as of December 31, 2012 are provided in the table below.
|
| | | | | | | | | | | | | | |
| December 31, 2012 | Amortized Cost | Gross Unrealized Gains | Gross Unrealized Losses | Fair Value |
| Fixed Income: | | | | |
| U.S. | Government | $ | 34,993 |
| $ | 879 |
| $ | 9 |
| $ | 35,863 |
|
| | Corporate | | | | |
| | | Banking/Financial Services | 10,576 |
| 376 |
| 5 |
| 10,947 |
|
| | | Consumer Goods | 8,962 |
| 159 |
| 11 |
| 9,110 |
|
| | | Capital Goods | 8,134 |
| 412 |
| — |
| 8,546 |
|
| | | Energy | 4,208 |
| 159 |
| — |
| 4,367 |
|
| | | Telecommunications/Utilities | 2,314 |
| 110 |
| — |
| 2,424 |
|
| | | Health Care | 1,728 |
| 37 |
| — |
| 1,765 |
|
| | Total Corporate | 35,922 |
| 1,253 |
| 16 |
| 37,159 |
|
| | Commercial mortgage backed | 20,387 |
| 433 |
| 7 |
| 20,813 |
|
| | Other asset backed | 4,121 |
| 123 |
| — |
| 4,244 |
|
| Total Fixed Income | $ | 95,423 |
| $ | 2,688 |
| $ | 32 |
| $ | 98,079 |
|
| Equities | $ | 1,563 |
| $ | 8 |
| $ | — |
| $ | 1,571 |
|
| Totals | $ | 96,986 |
| $ | 2,696 |
| $ | 32 |
| $ | 99,650 |
|
Liquidity and Cash Flow Risk
The following table summarizes the fair value by contractual maturities of the fixed income securities portfolio, excluding cash and cash equivalents, at the dates indicated.
| Fair Value of Fixed Income Securities by Contractual Maturity Date (in ‘000s) | |
| Fair value of fixed income securities by contractual maturity date (in '000s) | | Fair value of fixed income securities by contractual maturity date (in '000s) |
| | As at: | September 30, 2012 | | December 31, 2011 | |
| As of December 31, | | 2012 | | 2011 |
| | Amount | % | | Amount | % | Amount | % | | Amount | % |
| Due in less than one year | $ | 18,085 |
| 16.5 | % | | $ | 29,407 |
| 28.4 | % | $ | 9,513 |
| 9.7 | % | | $ | 29,407 |
| 28.4 | % |
| Due in one through five years | 21,803 |
| 19.9 | % | | 27,317 |
| 26.4 | % | 23,124 |
| 23.6 | % | | 27,317 |
| 26.4 | % |
| Due after five through ten years | 21,806 |
| 19.9 | % | | 10,242 |
| 9.9 | % | 20,524 |
| 20.9 | % | | 10,242 |
| 9.9 | % |
| Due after ten years | 47,861 |
| 43.7 | % | | 36,525 |
| 35.3 | % | 44,918 |
| 45.8 | % | | 36,525 |
| 35.3 | % |
| Total | $ | 109,555 |
| 100.0 | % | | $ | 103,491 |
| 100.0 | % | $ | 98,079 |
| 100.0 | % | | $ | 103,491 |
| 100.0 | % |
As of the periodyear ended September 30,December 31, 2012, 36.4%33.3% of the fixed income securities, including treasury bills, bankers’ acceptances, government bonds and corporate bonds had contractual maturities of five years or less. Actual maturities may differ from contractual maturities because certain issuers have the right to call or prepay obligations with or without call or prepayment penalties. Atlas holds cash and high grade short-term assets which, along with fixed income security maturities, management believes are sufficient for the payment of claims on a timely basis. In the event that additional cash is required to meet obligations to policyholders, Atlas believes that high quality securities portfolio provides us with sufficient liquidity. With a weighted average duration of 3.53.6 years, changes in interest rates will have a modest market value impact on the Atlas
portfolio relative to longer duration portfolios. Atlas can and typically does hold bonds to maturity by matching duration with the anticipated liquidity needs.
Market Risk
Market risk is the risk that Atlas will incur losses due to adverse changes in interest rates, currency exchange rates or equity prices. Having disposed of a majority of its asset backed securities, its primary market risk exposure in the fixed income securities portfolio is to changes in interest rates. Because Atlas’ securities portfolio is comprised of primarily fixed income securities that are usually held to maturity, periodic changes in interest rate levels generally impact its financial results to the extent that the securities in its available for sale portfolio are recorded at market value. During periods of rising interest rates, the market value of the existing fixed income securities will generally decrease and realized gains on fixed income securities will likely be reduced. The reverse is true during periods of declining interest rates.
Credit Risk
Credit risk is defined as the risk of financial loss due to failure of the other party to a financial instrument to discharge an obligation. Atlas is exposed to credit risk principally through its investments and balances receivable from policyholders and reinsurers. It monitors concentration and credit quality risk through policies designed to limit and monitor its exposure to individual issuers or related groups (with the exception of U.S. government bonds) as well as through ongoing review of the credit ratings of issuers in the securities portfolio. Credit exposure to any one individual policyholder is not material. The Company’sCompany's policies, however, are distributed by agents who may manage cash collection on its behalf pursuant to the terms of their agency agreement. Atlas has policies to evaluate the financial condition of its reinsurers and monitors concentrations of credit risk arising from similar geographic regions, activities, or economic characteristics of the reinsurers to minimize its exposure to significant losses from reinsurers’ insolvency.
The following table summarizes the composition of the fair value of the fixed income securities portfolio (excluding the bond which has been classified in Level 3 within the fair value hierarchy), excluding cash and cash equivalents, as of the dates indicated, by ratings assigned by Fitch, S&P or Moody’s Investors Service. The fixed income securities portfolio consists of predominantly very high quality securities in corporate and government bonds with 91.3%88.1% rated ‘A’ or better as of the periodyear ended September 30,December 31, 2012 compared to 95.3% as of the year ended December 31, 2011.
| Credit Ratings of Fixed Income Securities Portfolio (in ‘000s) | |
| Credit ratings of fixed income securities portfolio (in '000s) | | Credit ratings of fixed income securities portfolio (in '000s) |
| | As at: | September 30, 2012 | | December 31, 2011 | |
| As of December 31, | | 2012 | | 2011 |
| | Amount | % of Total | | Amount | % of Total | Amount | % of Total | | Amount | % of Total |
| AAA/Aaa | $ | 58,613 |
| 53.6 | % | | $ | 54,717 |
| 52.9 | % | $ | 58,765 |
| 60.2 | % | | $ | 54,717 |
| 52.9 | % |
| AA/Aa | 14,775 |
| 13.5 | % | | 21,567 |
| 20.8 | % | 7,569 |
| 7.7 | % | | 21,567 |
| 20.8 | % |
| A/A | 26,477 |
| 24.2 | % | | 22,380 |
| 21.6 | % | 19,894 |
| 20.3 | % | | 22,380 |
| 21.6 | % |
| BBB/Baa | 9,690 |
| 8.8 | % | | 4,827 |
| 4.7 | % | 11,617 |
| 11.9 | % | | 4,827 |
| 4.7 | % |
| Total Securities | $ | 109,555 |
| 100.0 | % | | $ | 103,491 |
| 100.0 | % | $ | 97,845 |
| 100.0 | % | | $ | 103,491 |
| 100.0 | % |
Other-than-temporary impairment
Atlas recognizes losses on securities for which a decline in market value was deemed to be other-than-temporary. Management performs a quarterly analysis of the securities holdings to determine if declines in market value are other-than-temporary. Atlas did not recognize charges for securities impairments that were considered other-than-temporary for the three month periodyear ended September 30,December 31, 2012, the three month period ended September 30, 2011 or the three month periodyear ended June 30, 2012December 31, 2011.
The length of time securities may be held in an unrealized loss position may vary based on the opinion of the appointed investment manager and their respective analyses related to valuation and to the various credit risks that may prevent us from recapturing the principal investment. In cases of securities with a maturity date where the appointed investment manager determines that there is little or no risk of default prior to the maturity of a holding, Atlas would elect to hold the security in an unrealized loss position until the price recovers or the security matures. In situations where facts emerge that might increase the risk associated with recapture of principal, Atlas may elect to sell securities at a loss. Atlas had no material gross unrealized losses in its portfolio as of the periodyear ended September 30,December 31, 2012, as of the period ended September 30, 2011, or as of the year ended December 31, 2011.
Estimated impact of changes in interest rates and securities prices
For Atlas’ available-for-sale fixed income securities held as of the periodyear ended September 30,December 31, 2012, a 100 basis point increase in interest rates on such held fixed income securities would have increased net investment income and income before taxes by approximately $127.$141,000. Conversely, a 100 basis point decrease in interest rates on such held fixed income securities would decrease net investment income and income before taxes by $127.$141,000.
A 100 basis point increase would have also decreased other comprehensive income by approximately $4,106$3.9 million due to “mark-to-market” requirements; however, holding investments to maturity would mitigate this impact. Conversely, a 100 basis point
decrease would increase other comprehensive income by the same amount. The impacts described here are approximately linear to the change in interest rates.
Due from Reinsurers and Other Insurers
Atlas purchases reinsurance from third parties in order to reduce its liability on individual risks and its exposure to large losses. Reinsurance is coverage purchased by one insurance company from another for part of the risk originally underwritten by the purchasing (ceding) insurance company. The practice of ceding insurance to reinsurers allows an insurance company to reduce its exposure to loss by size, geographic area, and type of risk or on a particular policy. An effect of ceding insurance is to permit an insurance company to write additional insurance for risks in greater number or in larger amounts than it would otherwise insure independently, based on its statutory capital, risk tolerance and other factors.
Atlas generally purchases reinsurance to limit net exposure to a maximum amount on any one loss of $500,000 with respect to commercial automobile liability claims. Atlas also purchases reinsurance to protect against awards in excess of its policy limits. Atlas continually evaluates and adjusts its reinsurance needs based on business volume, mix, and supply levels.
Reinsurance ceded does not relieve Atlas of its ultimate liability to its insured in the event that any reinsurer is unable to meet their obligations under its reinsurance contracts. Therefore, Atlas enters into reinsurance contracts with only those reinsurers deemed to have sufficient financial resources to provide the requested coverage. Reinsurance treaties are generally subject to cancellation by the reinsurers or Atlas on the anniversary date and are subject to renegotiation annually. Atlas regularly evaluates the financial condition of its reinsurers and monitors the concentrations of credit risk to minimize its exposure to significant losses as a result of the insolvency of a reinsurer. Atlas believes that the amounts it has recorded as reinsurance recoverables are appropriately established. Estimating amounts of reinsurance recoverables, however, is subject to various uncertainties and the amounts ultimately recoverable may vary from amounts currently recorded. Atlas had $7.06.0 million recoverable from third party reinsurers (exclusive of amounts prepaid) and other insurers as of the periodyear ended September 30,December 31, 2012 as compared to $8.0 million as of the year ended December 31, 2011.
Estimating amounts of reinsurance recoverables is also impacted by the uncertainties involved in the establishment of provisions for unpaid claims. As underlying reserves potentially develop, the amounts ultimately recoverable may vary from amounts currently recorded. Atlas’ reinsurance recoverables are generally unsecured. Atlas regularly evaluates its reinsurers, and the respective amounts recoverable, and an allowance for uncollectible reinsurance is provided for, if needed.
Atlas’ largest reinsurance partners are Great American Insurance Company (“Great American”), a subsidiary of American Financial Group, Inc. and Gen Re, a subsidiary of Berkshire Hathaway, Inc. Great American has a financial strength rating of “A+”A+ from Standard & Poor’s, while Gen Re has a financial strength rating of “Aa1”Aa1 from Moody’s. Gateway’s largest reinsurance partner is Maiden Re, which has an “A-” ratingMoody’s, and A++ from A.M. Best.
Deferred Tax Asset
| Components of Deferred Tax (in ‘000s) | |
| Components of Deferred Tax (in '000s) | | Components of Deferred Tax (in '000s) |
| | As of: | September 30, 2012 | December 31, 2011 | |
| As of the year ended December 31, | | 2012 | 2011 |
| Deferred tax assets: | | |
| Unpaid claims and unearned premiums | $ | 3,471 |
| $ | 3,004 |
| $ | 3,144 |
| $ | 3,004 |
|
| Loss carry-forwards | 15,880 |
| 15,558 |
| 16,128 |
| 15,558 |
|
| Bad debts | 131 |
| 1,297 |
| 164 |
| 1,297 |
|
| Other | 1,456 |
| 1,338 |
| 907 |
| 1,338 |
|
| Valuation Allowance | (11,703 | ) | (12,361 | ) | (11,242 | ) | (12,361 | ) |
| Total gross deferred tax assets | $ | 9,235 |
| $ | 8,836 |
| $ | 9,101 |
| $ | 8,836 |
|
| | | |
| Deferred tax liabilities: | | |
| Investment securities | $ | 1,167 |
| $ | 740 |
| $ | 910 |
| $ | 740 |
|
| Deferred policy acquisition costs | 1,530 |
| 1,027 |
| 1,280 |
| 1,027 |
|
| Other | 195 |
| 294 |
| 306 |
| 294 |
|
| Total gross deferred tax liabilities | 2,892 |
| 2,061 |
| 2,496 |
| 2,061 |
|
| Net deferred tax assets | $ | 6,343 |
| $ | 6,775 |
| $ | 6,605 |
| $ | 6,775 |
|
Atlas established a valuation allowance of approximately $11.711.2 million and $12.4 million for its gross future deferred tax assets as of the periodyear ended September 30,December 31, 2012 and as of the year ended December 31, 2011, respectively.
Based on Atlas’ expectations of future taxable income, as well as the reversal of gross future deferred tax liabilities, management believes it is more likely than not that Atlas will fully realize the net future tax assets, with the exception of the aforementioned valuation allowance. Atlas has therefore established the valuation allowance as a result of the potential inability
to utilize a portion of its net operatingoperation losses in the U.S. which are subject to a yearly limitation. The uncertainty over the Company’s ability to utilize a portion of these losses over the short term has led to the recording of a valuation allowance.
Our ability to utilize the NOLs is subject to the rules of Section 382 of the Internal Revenue Code. For more information, see “Risk Factors - U.S. Tax Risks - Our use of losses may be subject to limitations and the tax liability of our company may be increased.”
Atlas has the following total net operating loss carry-forwards as of the periodyear ended September 30,December 31, 2012.:
| Net Operating Loss Carry-Forward by Expiry (in ‘000s) | |
| Net operating loss carry-forward by expiry (in '000s) | | Net operating loss carry-forward by expiry (in '000s) |
| | Year of Occurrence | Year of Expiration | Amount | Year of Expiration | Amount |
| 2001 | 2021 | $ | 14,750 |
| 2021 | $ | 14,750 |
|
| 2002 | 2022 | 4,317 |
| 2022 | 4,317 |
|
| 2006 | 2026 | 7,825 |
| 2026 | 7,825 |
|
| 2007 | 2027 | 5,131 |
| 2027 | 5,131 |
|
| 2008 | 2028 | 1,949 |
| 2028 | 1,949 |
|
| 2009 | 2029 | 1,949 |
| 2029 | 1,949 |
|
| 2010 | 2030 | 1,949 |
| 2030 | 1,949 |
|
| 2011 | 2031 | 7,762 |
| 2031 | 9,349 |
|
| 2012 | 2032 | 1,074 |
| 2032 | 216 |
|
| Total | | $ | 46,706 |
| | $ | 47,435 |
|
Assets Held for Sale
On May 22, 2012, Atlas closed the sale of the headquarters building to 150 Northwest Point, LLC, a Delaware limited liability company. As of the year ended December 31, 2011, the property was recorded as a component of assets held for sale on Atlas’Atlas' statement of financial position.
The total sales price of the property, which was paid in cash, amounted to $14.0 million, less closing costs and related expenses of approximately $633,000. In connection with the sale, the Company also wrote down an accrual of approximately $792,000 held for real estatereal-estate taxes. Approximately $830,000 of the sales price was held in escrow for real estatereal-estate taxes. Atlas recognized a gain on the sale of this property of $213,000, which will be deferred and recognized over the 5 year lease term. In the three month periodyear ended September 30,December 31, 2012, Atlas recognized $526,000 as income.an offset to rent expense. Total rental expense recognized on the headquarters building in the year ended December 31, 2012 was $357,000.
There are two properties located in Alabama which are still for sale. These properties are listed for sale for amounts greater than carried values. Both were assets of Southern United Fire Insurance Company, which was merged into American Service in February 2010.
Claims Liabilities
The table below shows the amounts of total case reserves and incurred but not reported (“IBNR”) claims provision as of the periodyear ended September 30,December 31, 2012 and as of the year ended December 31, 2011. The provision for unpaid claims decreased by 19.7%23.5% to
$73.670.1 million as of the periodyear ended September 30,December 31, 2012 compared to $91.6 million as of the year ended December 31, 2011. During the three month periodyear ended September 30,December 31, 2012, case reserves decreased by 11.2%15.5% compared to December 31, 2011, while IBNR reserves decreased by 39.6%42.5% generally due to the reporting of claims related to prior accident years and case reserve changes, which are consistent with management’s expectations.
| Provision for Unpaid Claims by Type - Gross (in ‘000s) | |
| Provision for unpaid claims by type - gross (in '000s) | | Provision for unpaid claims by type - gross (in '000s) |
| | As at: | September 30, 2012 | December 31, 2011 | YTD% Change | |
| As of the year ended December 31, | | 2012 | 2011 | YTD% Change |
| Case reserves | $ | 57,050 |
| $ | 64,276 |
| (11.2 | )% | $ | 54,321 |
| $ | 64,276 |
| (15.5 | )% |
| IBNR | 16,524 |
| 27,367 |
| (39.6 | )% | 15,746 |
| 27,367 |
| (42.5 | )% |
| Total | $ | 73,574 |
| $ | 91,643 |
| (19.7 | )% | $ | 70,067 |
| $ | 91,643 |
| (23.5 | )% |
| Provision for Unpaid Claims by Line of Business - Gross (in ‘000s) | |
| Provision for unpaid claims by line of business – gross (in '000s) | | Provision for unpaid claims by line of business – gross (in '000s) |
| | As at: | September 30, 2012 | December 31, 2011 | YTD% Change | |
| As of the year ended December 31, | | 2012 | 2011 | YTD% Change |
| Non-standard auto | $ | 12,472 |
| $ | 23,863 |
| (47.7 | )% | $ | 10,539 |
| $ | 23,863 |
| (55.8 | )% |
| Commercial auto | 55,025 |
| 58,700 |
| (6.3 | )% | 54,126 |
| 58,700 |
| (7.8 | )% |
| Other | 6,077 |
| 9,080 |
| (33.1 | )% | 5,402 |
| 9,080 |
| (40.5 | )% |
| Total | $ | 73,574 |
| $ | 91,643 |
| (19.7 | )% | $ | 70,067 |
| $ | 91,643 |
| (23.5 | )% |
| Provision for Unpaid Claims by Line of Business - Net of Reinsurance Recoverables (in ‘000s) | |
| Provision for unpaid claims by line of business - net of reinsurance recoverables (in '000s) | | Provision for unpaid claims by line of business - net of reinsurance recoverables (in '000s) |
| | As at: | September 30, 2012 | December 31, 2011 | YTD% Change | |
| As of the year ended December 31, | | 2012 | 2011 | YTD% Change |
| Non-standard Auto | $ | 10,091 |
| $ | 21,157 |
| (52.3 | )% | $ | 8,227 |
| $ | 21,157 |
| (61.1 | )% |
| Commercial Auto | 52,752 |
| 56,328 |
| (6.3 | )% | 52,538 |
| 56,328 |
| (6.7 | )% |
| Other | 4,134 |
| 6,332 |
| (34.7 | )% | 3,622 |
| 6,332 |
| (42.8 | )% |
| Total | $ | 66,977 |
| $ | 83,817 |
| (20.1 | )% | $ | 64,387 |
| $ | 83,817 |
| (23.2 | )% |
Claims liabilities - The changes in the provision for unpaid claims, net of amounts recoverable from reinsurers, for the three and nine month periodsyears ended September 30,December 31, 2012 and September 30,December 31, 2011 were as follows.follows:
| Claims Liabilities (in ‘000s) | |
|
| Three Month Periods Ended | Nine Month Periods Ended | | | | | |
| | September 30, 2012 | | September 30, 2011 | September 30, 2012 | | September 30, 2011 | |
| As of the year ended December 31, | | 2012 | | 2011 |
| Unpaid claims, beginning of period | $ | 77,350 |
| | $ | 112,011 |
| $ | 91,643 |
| | $ | 132,579 |
| $ | 91,643 |
| | $ | 132,579 |
|
| Less: reinsurance recoverable | 8,153 |
| | 1,968 |
| 7,825 |
| | 6,477 |
| 7,825 |
| | 6,477 |
|
| Net beginning unpaid claims reserves | 69,197 |
| | 104,043 |
| 83,818 |
| | 126,102 |
| 83,818 |
| | 126,102 |
|
| Incurred related to: | | | | | | | | |
| Current year | 6,976 |
| | 6,962 |
| 18,141 |
| | 20,600 |
| 26,329 |
| | 27,303 |
|
| Prior years | 190 |
| | 17 |
| 337 |
| | (4 | ) | 216 |
| | 1,691 |
|
| | 7,166 |
| | 6,979 |
| 18,478 |
| | 20,596 |
| 26,545 |
| | 28,994 |
|
| Paid related to: | | | | | | | | |
| Current year | 2,302 |
| | 4,279 |
| 6,224 |
| | 8,455 |
| 8,925 |
| | 12,715 |
|
| Prior years | 7,082 |
| | 14,660 |
| 29,093 |
| | 46,160 |
| 37,051 |
| | 58,563 |
|
| | 9,384 |
| | 18,939 |
| 35,317 |
| | 54,615 |
| 45,976 |
| | 71,278 |
|
| | | | | | | | | |
| Net unpaid claims, end of period | $ | 66,979 |
| | $ | 92,083 |
| $ | 66,979 |
| | $ | 92,083 |
| $ | 64,387 |
| | $ | 83,818 |
|
| Add: reinsurance recoverable | 6,595 |
| | 9,374 |
| 6,595 |
| | 9,374 |
| 5,680 |
| | 7,825 |
|
| Unpaid claims, end of period | $ | 73,574 |
| | $ | 101,457 |
| $ | 73,574 |
| | $ | 101,457 |
| $ | 70,067 |
| | $ | 91,643 |
|
The process of establishing the estimated provision for unpaid claims is complex and imprecise as it relies on the judgment and opinions of a large number of individuals, on historical precedent and trends, on prevailing legal, economic, social and regulatory trends and on expectations as to future developments. The process of determining the provision necessarily involves risks that the actual results will deviate, perhaps substantially, from the best estimates made.
The reduction of the provision for unpaid claims is consistent with the change in written premium in prior years. However, because the establishment of reserves is an inherently uncertain process involving estimates, current provisions may not be sufficient. Adjustments to reserves, both positive and negative, are reflected quarterly in the statement of income as estimates are updated.
The financial statements are presented on a calendar year basis for all data. Claims payments and changes in reserves, however, may be made on accidents that occurred in prior years, not on business that is currently insured. Calendar year losses consist of payments and reserve changes that have been recorded in the financial statements during the applicable reporting period, without regard to the period in which the accident occurred. Calendar year results do not change after the end of the applicable reporting period, even as new claim information develops. Accident year losses consist of payments and reserve changes that are assigned to the period in which the accident occurred. Accident year results will change over time as the estimates of losses change due to payments and reserve changes for all accidents that occurred during that period.
The table below summarizes the changes over time in the provision for unpaid loss and loss adjustment expenses. The first section of the table shows the provision for unpaid loss and loss adjustment expenses recorded at the balance sheet date for each of the indicated years. The original provision for each year is presented on a gross basis as well as net of estimated reinsurance recoverable on unpaid loss and loss adjustment expenses.The second section displays the cumulative amount of payments made through the end of each subsequent year with respect to each original provision. The third section presents the re-estimation over subsequent years of each year’s original net liability for unpaid loss and loss adjustment expenses as more information becomes known and trends become more apparent. The final section compares the latest re-estimation to the original estimate for each year presented in the table on both a gross and net basis.
The development of the provision for unpaid loss and loss adjustment expenses is shown by the difference between the original estimates and the re-estimated liabilities at each subsequent year-end. The re-estimated liabilities at each year-end are based on actual payments in full or partial settlement of claims plus re-estimates of the payments required for claims still open or IBNR claims. Favorable development (redundancy) means that the original estimated provision was higher than subsequently re-estimated. Unfavorable development (deficiency) means that the original estimated provision was lower than subsequently re-estimated. The cumulative development represents the aggregate change in the estimates over all prior years.
The data in this table is shown as of December 31, 2011, the last date on which it was fully compiled. It does not reflect any changes to claims, reserves or assumptions which may have occurred since that date.
| Provision for Unpaid Claims, Net of Recoveries from Reinsurers as of December 31, 2011 (in ‘000s) |
| | | | | | | | | | | | | | | | | | | | | | | | | | | | | | | | | |
| | 2011 | 2010 | 2009 | 2008 (1) |
| 2007 | 2006 | 2005 | 2004 | 2003 | 2002 | 2001 |
| Gross reserves for unpaid claims and claims expenses | | | | | |
| | $ | 91,643 |
| $ | 132,579 |
| $ | 179,054 |
| $ | 173,652 |
| $ | 183,649 |
| $ | 191,171 |
| $ | 202,677 |
| $ | 195,437 |
| $ | 189,262 |
| $ | 193,909 |
| $ | 175,104 |
|
| Less: Reinsurance recoverable on unpaid claims and claims expenses | | | | | | |
| | 7,825 |
| 6,477 |
| 5,196 |
| 103,612 |
| 107,837 |
| 111,911 |
| 95,215 |
| 90,596 |
| 91,079 |
| 94,510 |
| 38,779 |
|
| Reserve for unpaid claims and claims expenses, net | | | | | |
| | 83,818 |
| 126,102 |
| 173,858 |
| 70,040 |
| 75,812 |
| 79,260 |
| 107,462 |
| 104,841 |
| 98,183 |
| 99,399 |
| 136,325 |
|
| Cumulative paid on originally established reserve as of: | | | | | |
| One year later | $ | 58,562 |
| $ | 76,835 |
| $ | (38,449 | ) | $ | 29,811 |
| $ | 29,917 |
| $ | 30,637 |
| $ | 37,220 |
| $ | 41,426 |
| $ | 46,083 |
| $ | 51,260 |
|
| Two years later | | 125,455 |
| 13,573 |
| 2,812 |
| 49,804 |
| 52,182 |
| 56,126 |
| 66,428 |
| 75,709 |
| 84,175 |
|
| Three years later | | 43,671 |
| 38,650 |
| 33,742 |
| 66,806 |
| 69,801 |
| 77,919 |
| 91,773 |
| 104,423 |
|
| Four years later | | | | 59,370 |
| 57,853 |
| 60,877 |
| 78,028 |
| 85,576 |
| 97,764 |
| 114,623 |
|
| Five years later | | | | | 69,428 |
| 75,935 |
| 76,174 |
| 89,396 |
| 101,725 |
| 118,347 |
|
| Six years later | | | | | | 81,347 |
| 85,150 |
| 88,820 |
| 103,935 |
| 120,455 |
|
| Seven years later | | | | | | 88,755 |
| 93,142 |
| 104,484 |
| 121,990 |
|
| Eight years later | | | | | | | | 95,401 |
| 106,560 |
| 123,240 |
|
| Nine years later | | | | | | | | | 107,625 |
| 123,965 |
|
| Ten years later | | | | | | | | | | 124,707 |
|
| | | | | | | | | | | | |
| Unpaid claims as of: |
| One year later | $ | 69,230 |
| $ | 102,173 |
| $ | 114,284 |
| $ | 46,338 |
| $ | 50,772 |
| $ | 76,344 |
| $ | 62,895 |
| $ | 57,873 |
| $ | 61,668 |
| $ | 65,338 |
|
| Two years later | | 56,268 |
| 65,101 |
| 75,258 |
| 31,322 |
| 56,428 |
| 46,081 |
| 35,431 |
| 33,838 |
| 39,466 |
|
| Three years later | | 35,500 |
| 43,336 |
| 46,116 |
| 43,015 |
| 34,082 |
| 25,491 |
| 20,460 |
| 21,682 |
|
| Four years later | | | | 21,859 |
| 25,534 |
| 26,714 |
| 26,833 |
| 19,231 |
| 14,710 |
| 12,591 |
|
| Five years later | | | | | 11,061 |
| 15,329 |
| 14,797 |
| 16,245 |
| 12,300 |
| 9,269 |
|
| Six years later | | | | | | 6,712 |
| 9,359 |
| 8,674 |
| 10,780 |
| 9,515 |
|
| Seven years later | | | | | | 4,339 |
| 6,108 |
| 5,523 |
| 8,446 |
|
| Eight years later | | | | | | | | 3,300 |
| 4,105 |
| 3,624 |
|
| Nine years later | | | | | | | | | 2,539 |
| 3,275 |
|
| Ten years later | | | | | | | | | | 2,102 |
|
| | | | | | | | | | | | |
| Re-estimated liability as of: | | | | | | | | |
| One year later | $ | 127,792 |
| $ | 179,008 |
| $ | 75,835 |
| $ | 76,149 |
| $ | 80,689 |
| $ | 106,981 |
| $ | 100,115 |
| $ | 99,299 |
| $ | 107,751 |
| $ | 116,598 |
|
| Two years later | | 181,723 |
| 78,674 |
| 78,070 |
| 81,126 |
| 108,610 |
| 102,207 |
| 101,859 |
| 109,547 |
| 123,641 |
|
| Three years later | | 79,171 |
| 81,986 |
| 79,858 |
| 109,821 |
| 103,883 |
| 103,410 |
| 112,233 |
| 126,105 |
|
| Four years later | | | | 81,229 |
| 83,387 |
| 87,591 |
| 104,861 |
| 104,807 |
| 112,474 |
| 127,214 |
|
| Five years later | | | | | 80,489 |
| 91,264 |
| 90,971 |
| 105,641 |
| 114,025 |
| 127,616 |
|
| Six years later | | | | | | 88,059 |
| 94,509 |
| 97,494 |
| 114,715 |
| 129,970 |
|
| Seven years later | | | | | | 93,094 |
| 99,250 |
| 110,007 |
| 130,436 |
|
| Eight years later | | | | | | | | 98,701 |
| 110,665 |
| 126,864 |
|
| Nine years later | | | | | | | | | 110,164 |
| 127,240 |
|
| Ten years later | | | | | | | | | | 126,809 |
|
| | | | | | | | | | | | |
As of December 31, 2011: Cumulative (redundancy) deficiency | | | | | | | | | |
| | $ | 1,690 |
| $ | 7,865 |
| $ | 9,131 |
| $ | 5,417 |
| $ | 1,229 |
| $ | (19,403 | ) | $ | (11,747 | ) | $ | 518 |
| $ | 10,765 |
| $ | (9,516 | ) |
| Cumulative (redundancy) deficiency as a % of reserves originally established- net | | | | |
| | 1.3 | % | 4.5 | % | 13.0 | % | 7.1 | % | 1.6 | % | -18.1 | % | -11.2 | % | 0.5 | % | 10.8 | % | -7.0 | % |
| Re-estimated liability- gross | | | | | | | |
| | $ | 134,223 |
| $ | 187,715 |
| $ | 194,560 |
| $ | 196,966 |
| $ | 200,740 |
| $ | 212,901 |
| $ | 209,876 |
| $ | 211,744 |
| $ | 227,169 |
| $ | 235,021 |
|
| Less: Re-established reinsurance recoverable | | | | | | |
| | 6,431 |
| 5,992 |
| 115,389 |
| 115,737 |
| 120,251 |
| 124,842 |
| 116,782 |
| 113,043 |
| 117,005 |
| 108,212 |
|
| Re-estimated provision- net | | | | | | |
| | 127,792 |
| 181,723 |
| 79,171 |
| 81,229 |
| 80,489 |
| 88,059 |
| 93,094 |
| 98,701 |
| 110,164 |
| 126,809 |
|
| Cumulative deficiency– gross | | | | | | |
| | 1,645 |
| 8,661 |
| 20,908 |
| 13,317 |
| 9,569 |
| 10,224 |
| 14,439 |
| 22,482 |
| 33,260 |
| 59,917 |
|
| (1) Negative payment as of one year later results from the commutation of reinsured reserves by Kingsway Re. | | | |
Our claims reserving practices are designed to set reserves that in the aggregate are adequate to pay all claims at their ultimate settlement value. Thus, our reserves are not discounted for inflation or other factors. Also, our reserves are the same on both a U.S. GAAP and statutory basis of accounting.| Provision for Unpaid Claims, Net of Recoveries from Reinsurers as of December 31, 2012 (in ‘000s) |
| | | | | | | | | | | | | | | | | | | | | | | | | | | | | | | | | |
| | 2012 | 2011 | 2010 | 2009 | 2008 (1) |
| 2007 | 2006 | 2005 | 2004 | 2003 | 2002 |
| Gross reserves for unpaid claims and claims expenses | | | | | |
| | $ | 70,068 |
| $ | 91,643 |
| $ | 132,578 |
| $ | 179,054 |
| $ | 173,652 |
| $ | 183,649 |
| $ | 191,171 |
| $ | 202,677 |
| $ | 195,437 |
| $ | 189,262 |
| $ | 193,909 |
|
| Less: Reinsurance recoverable on unpaid claims and claims expenses | | | | | | |
| | 5,680 |
| 7,824 |
| 6,477 |
| 5,196 |
| 103,612 |
| 107,837 |
| 111,911 |
| 95,215 |
| 90,596 |
| 91,079 |
| 94,510 |
|
| Reserve for unpaid claims and claims expenses, net | | | | | |
| | 64,388 |
| 83,819 |
| 126,101 |
| 173,858 |
| 70,040 |
| 75,812 |
| 79,260 |
| 107,462 |
| 104,841 |
| 98,183 |
| 99,399 |
|
| Cumulative paid on originally established reserve as of: | | | | | |
| One year later | $ | 37,052 |
| $ | 58,562 |
| $ | 76,835 |
| $ | (38,449 | ) | $ | 29,811 |
| $ | 29,917 |
| $ | 30,637 |
| $ | 37,220 |
| $ | 41,426 |
| $ | 46,083 |
|
| Two years later | 87,803 |
| 125,455 |
| 13,573 |
| 2,812 |
| 49,804 |
| 52,182 |
| 56,126 |
| 66,428 |
| 75,709 |
|
| Three years later | 149,800 |
| 43,671 |
| 38,650 |
| 33,742 |
| 66,806 |
| 69,801 |
| 77,919 |
| 91,773 |
|
| Four years later | 59,181 |
| 59,370 |
| 57,853 |
| 60,877 |
| 78,028 |
| 85,576 |
| 97,764 |
|
| Five years later | 70,075 |
| 69,428 |
| 75,935 |
| 76,174 |
| 89,396 |
| 101,725 |
|
| Six years later | 73,803 |
| 81,347 |
| 85,150 |
| 88,820 |
| 103,935 |
|
| Seven years later | 83,175 |
| 88,755 |
| 93,142 |
| 104,484 |
|
| Eight years later | 89,698 |
| 95,401 |
| 106,560 |
|
| Nine years later | 95,848 |
| 107,625 |
|
| Ten years later | 107,856 |
|
| | | | | | | | | | | | |
| Unpaid claims as of: |
| One year later | $ | 46,983 |
| $ | 69,230 |
| $ | 102,173 |
| $ | 114,284 |
| $ | 46,338 |
| $ | 50,772 |
| $ | 76,344 |
| $ | 62,895 |
| $ | 57,873 |
| $ | 61,668 |
|
| Two years later | 35,206 |
| 56,268 |
| 65,101 |
| 75,258 |
| 31,322 |
| 56,428 |
| 46,081 |
| 35,431 |
| 33,838 |
|
| Three years later | 29,375 |
| 35,500 |
| 43,336 |
| 46,116 |
| 43,015 |
| 34,082 |
| 25,491 |
| 20,460 |
|
| Four years later | 17,139 |
| 21,859 |
| 25,534 |
| 26,714 |
| 26,833 |
| 19,231 |
| 14,710 |
|
| Five years later | 9,910 |
| 11,061 |
| 15,329 |
| 14,797 |
| 16,245 |
| 12,300 |
|
| Six years later | 5,523 |
| 6,712 |
| 9,359 |
| 8,674 |
| 10,780 |
|
| Seven years later | 3,948 |
| 4,339 |
| 6,108 |
| 5,523 |
|
| Eight years later | 2,751 |
| 3,300 |
| 4,105 |
|
| Nine years later | 1,998 |
| 2,539 |
|
| Ten years later | 1,485 |
|
| | | | | | | | | | | | |
| Re-estimated liability as of: | | | | | | | | |
| One year later | $ | 84,035 |
| $ | 127,792 |
| $ | 179,008 |
| $ | 75,835 |
| $ | 76,149 |
| $ | 80,689 |
| $ | 106,981 |
| $ | 100,115 |
| $ | 99,299 |
| $ | 107,751 |
|
| Two years later | 123,009 |
| 181,723 |
| 78,674 |
| 78,070 |
| 81,126 |
| 108,610 |
| 102,207 |
| 101,859 |
| 109,547 |
|
| Three years later | 179,175 |
| 79,171 |
| 81,986 |
| 79,858 |
| 109,821 |
| 103,883 |
| 103,410 |
| 112,233 |
|
| Four years later | 76,320 |
| 81,229 |
| 83,387 |
| 87,591 |
| 104,861 |
| 104,807 |
| 112,474 |
|
| Five years later | 79,985 |
| 80,489 |
| 91,264 |
| 90,971 |
| 105,641 |
| 114,025 |
|
| Six years later | 79,326 |
| 88,059 |
| 94,509 |
| 97,494 |
| 114,715 |
|
| Seven years later | 87,123 |
| 93,094 |
| 99,250 |
| 110,007 |
|
| Eight years later | 92,449 |
| 98,701 |
| 110,665 |
|
| Nine years later | 97,846 |
| 110,164 |
|
| Ten years later | 109,341 |
|
| | | | | | | | | | | | |
As of December 31, 2011: Cumulative (redundancy) deficiency | | | | | | | | | |
| | $ | 216 |
| $ | (3,092 | ) | $ | 5,317 |
| $ | 6,280 |
| $ | 4,173 |
| $ | 66 |
| $ | (20,339 | ) | $ | (12,392 | ) | $ | (337 | ) | $ | 9,942 |
|
| Cumulative (redundancy) deficiency as a % of reserves originally established- net | | | | |
| | 0.3 | % | -2.5 | % | 3.1 | % | 9.0 | % | 5.5 | % | 0.1 | % | -18.9 | % | -11.8 | % | -0.3 | % | 10.0 | % |
| Re-estimated liability- gross | | | | | | | |
| | $ | 92,160 |
| $ | 130,323 |
| $ | 185,283 |
| $ | 191,709 |
| $ | 195,722 |
| $ | 199,577 |
| $ | 211,965 |
| $ | 209,231 |
| $ | 210,889 |
| $ | 226,346 |
|
| Less: Re-established reinsurance recoverable | | | | | | |
| | 8,125 |
| 7,314 |
| 6,108 |
| 115,389 |
| 115,737 |
| 120,251 |
| 124,842 |
| 116,782 |
| 113,043 |
| 117,005 |
|
| Re-estimated provision- net | | | | | | |
| | 84,035 |
| 123,009 |
| 179,175 |
| 76,320 |
| 79,985 |
| 79,326 |
| 87,123 |
| 92,449 |
| 97,846 |
| 109,341 |
|
| Cumulative deficiency– gross | | | | | | |
| | 517 |
| (2,255 | ) | 6,229 |
| 18,057 |
| 12,073 |
| 8,406 |
| 9,288 |
| 13,794 |
| 21,627 |
| 32,437 |
|
| (1) Negative payment as of one year later results from the commutation of reinsured reserves by Kingsway Re. | | | |
Due to Reinsurers
The decrease in due to reinsurers is consistent with the payout patterns of the underlying claims liabilities.
Off-Balance Sheet ArrangementsOff-balance sheet arrangements
As of September 30,December 31, 2012, Atlas has the following cash obligations related to its operating leases. The remainder
| Operating Lease Commitments (in '000s) |
| | | | | | | | | | | | | | | | | | |
| Year | 2013 | 2014 | 2015 | 2016 | 2017 & Beyond | Total |
| Amount | $ | 776 |
| $ | 683 |
| $ | 693 |
| $ | 714 |
| $ | 281 |
| $ | 3,147 |
|
We assumed a lease for Gateway's headquarters in St. Louis, Missouri as part of 2012 is negative due to rent abatement receivedthe acquisition which took place on January 2, 2013. We have annual cash obligations of $336,000 through February 2017 which are not included in the lease of our headquarters building.
| Operating Lease Commitments (in ‘000s) |
| | | | | | |
| Year | 2012 | 2013 | 2014 | 2015 | 2016 and beyond | Total |
| Amount | $(6) | $776 | $683 | $693 | $995 | $3,141 |
Shareholders’ Equity
The table below identifies changes in shareholders’ equity for the nine month periodsyear ended September 30,December 31, 2012 and September 30,December 31, 2011.:
| Changes in Shareholders’ Equity (in ‘000s) | |
| Changes in Shareholders' Equity (in '000s) | | Changes in Shareholders' Equity (in '000s) |
| | | Preferred Shares | | Ordinary Voting Common Shares | | Restricted Voting Common Shares | | Additional Paid-in Capital | | Retained Deficit | | Accumulated Other Comprehensive Income (loss) | | Total | Preferred Shares | | Ordinary shares | | Restricted Voting Common Shares | | Additional Paid-in Capital | | Retained Deficit | | Accumulated Other Comprehensive Income (loss) | | Total |
| Balance December 31, 2011 | $ | 18,000 |
| | $ | 4 |
| | $ | 14 |
| | $ | 152,652 |
| | $ | (115,841 | ) | | $ | 1,425 |
| | $ | 56,254 |
| $ | 18,000 |
| | $ | 4 |
| | $ | 14 |
| | $ | 152,652 |
| | $ | (115,841 | ) | | $ | 1,425 |
| | $ | 56,254 |
|
Net income
| | | | | | | | | 1,922 |
| | | | 1,922 |
| | | | | | | | | 3,166 |
| | | | 3,166 |
|
| Other comprehensive income | | | | | | | | | | | 840 |
| | 840 |
| | | | | | | | | | | 328 |
| | 328 |
|
| Share-based compensation | | | | | | | 84 |
| | | | | | 84 |
| | | | | | | 113 |
| | | | | | 113 |
|
| Stock options exercised | | | | | | | 3 |
| | | | | | 3 |
| | | | | | | 3 |
| | | | | | 3 |
|
| Balance September 30, 2012 | $ | 18,000 |
| | $ | 4 |
| | $ | 14 |
| | $ | 152,739 |
| | $ | (113,919 | ) | | $ | 2,265 |
| | $ | 59,103 |
| |
| Balance December 31, 2012 | | $ | 18,000 |
| | $ | 4 |
| | $ | 14 |
| | $ | 152,768 |
| | $ | (112,675 | ) | | $ | 1,753 |
| | $ | 59,864 |
|
| | | | | | | | | | | | | | | | | | | | | | | | | | | |
| Balance December 31, 2010 | $ | 18,000 |
| | $ | 4 |
| | $ | 14 |
| | $ | 152,466 |
| | $ | (113,371 | ) | | $ | 3,056 |
| | $ | 60,169 |
| $ | 18,000 |
| | $ | 4 |
| | $ | 14 |
| | $ | 152,466 |
| | $ | (113,371 | ) | | $ | 3,056 |
| | $ | 60,169 |
|
| Net loss | | | | | | | | | 555 |
| | | | 555 |
| | | | | | | | | (2,470 | ) | | | | (2,470 | ) |
| Other comprehensive loss | | | | | | | | | | | (2,046 | ) | | (2,046 | ) | | | | | | | | | | | (3,315 | ) | | (3,315 | ) |
| Share-based compensation | | | | | | | 84 |
| | | | | | 84 |
| | | | | | | 113 |
| | | | | | 113 |
|
| Stock options exercised | | | | | | | 19 |
| | | | | | 19 |
| | | | | | | 73 |
| | | | | | 73 |
|
| Balance September 30, 2011 | $ | 18,000 |
| | $ | 4 |
| | $ | 14 |
| | $ | 152,569 |
| | $ | (112,816 | ) | | $ | 1,010 |
| | $ | 58,781 |
| |
| Settlement of Pension Plan | | | | | | | | | | | | $ | 1,684 |
| | $ | 1,684 |
|
| Balance December 31, 2011 | | $ | 18,000 |
| | $ | 4 |
| | $ | 14 |
| | $ | 152,652 |
| | $ | (115,841 | ) | | $ | 1,425 |
| | $ | 56,254 |
|
As of March 14, 2013, there were January 17, 20136,833,421, there are 2,256,921 ordinary voting common shares 3,887,469outstanding and 1,262,471 restricted voting common shares outstanding, and 20,000,000 preferred shares issued and outstanding.
The holders of restricted voting shares are entitled to vote at all meetings of shareholders, except at meetings of holders of a specific class that are entitled to vote separately as a class. The restricted voting common shares as a class shall not carry more than 30% of the aggregate votes eligible to be voted at a general meeting of common shareholders.
All of the issued and outstanding restricted voting common shares are beneficially owned or controlled by Kingsway,KAI, or its affiliated entities. The restricted voting common shares will convert to ordinary voting common shares in the event that these KingswayKAI owned shares are sold to non-affiliates of the Company.KAI.
Preferred shares are not entitled to vote andvote. We issued 2 million preferred shares to Hendricks in connection with the acquisition of Gateway. 18,000,000 are beneficially owned or controlled by KingswayKAI and 2,000,000 are beneficially owned and controlled by Hendricks.Hendricks as of the date of this prospectus. They accrue dividends on a cumulative basis whether or not declared by the Board of Directors at the rate of $0.045 per share per year (4.5%) and may be paid in cash or in additional preferred shares at the option of Atlas. Upon liquidation, dissolution or winding-up of Atlas, holders of preferred shares receive the greater of $1.00 per share plus all declared and unpaid dividends or the amount they would receive in liquidation if the preferred shares had been converted to restricted voting common shares or ordinary voting common shares immediately prior to liquidation.
Preferred shares are convertible into ordinary voting common shares at the option of the holder at any date that is after December 31, 2015, the fifth year after issuance at the rate of 0.1270 ordinary voting common shares for each preferred share. The conversion rate is subject to change if the number of ordinary voting common shares or restricted voting common shares changes. The preferred shares issued to KAI are redeemable at the option of Atlas at a price of $3.00$1.00 per share plus accrued and unpaid dividends commencing at the earlier of December 31, 2012, two years from issuance date, or the date at which Kingsway’sKFSI’s or KAI’s beneficial interest is less than 10%. WeThe preferred shares issued 2 million shares to Hendricks in connection withare redeemable at the acquisitionoption of Gateway.Atlas at a price of $1 plus accrued dividends at January 15, 2015.
The cumulative amount of dividends to which the preferred shareholders are entitled upon liquidation or sooner, if Atlas declares dividends, is $1.41.6 million as of the periodyear ended September 30,December 31, 2012. The accumulation of these dividends has an unfavorable impact onreduced book value per share ofby $0.230.26 as of the periodyear ended September 30,December 31, 2012 and an unfavorable impact to earnings per share ofby $0.030.14 for the three month periodyear ended September 30,December 31, 2012.
Liquidity and Capital Resources
The purpose of liquidity management is to ensure there is sufficient cash to meet all financial commitments and obligations as they become due. The liquidity requirements of Atlas’ business have been met primarily by funds generated from operations, asset maturities and income and other returns received on securities. Cash provided from these sources is used primarily for payment of claims and operating expenses. The timing and amount of catastrophe claims are inherently unpredictable and may create increased liquidity requirements.
The total purchase price for all of Camelot Services’ outstanding shares was $14.3 million, consisting of a combination of cash and Atlas preferred shares. Consideration consisted of a $6.0 million dividend paid by the sellers immediately prior to the closing, $2.0 million of Atlas preferred shares (consisting of a total of 2 million preferred shares) and $6.3 million in cash. This transaction will not harm our near-term liquidity.
As a holding company, Atlas may derive cash from its subsidiaries generally in the form of dividends and in the future may charge management fees to the extent allowed by statute or other regulatory approval requirements to meet its obligations. The insurance subsidiaries fund their obligations primarily through premium and investment income and maturities in their securities portfolio. Refer also to the discussion “Investments Overview and Strategy.”" The insurance subsidiaries require regulatory approval for the return of capital and, in certain circumstances, payment of dividends. In the event that dividends and management fees available to the holding company are inadequate to service its obligations, the holding company would need to raise capital, sell assets or incur debt obligations. As at September 30,December 31, 2012, Atlas did not have any outstanding debt, and therefore, no near term debt service obligations. Atlas currently has no material commitments for capital expenditures.
The following table summarizes consolidated cash flow activities.activities:
| Summary of Cash Flows (in ‘000s) | | | | Nine Month Periods Ended | |
| | September 30, 2012 | | September 30, 2011 | |
| As of the year ended December 31, | | 2012 | | 2011 |
| Cash Used by Operating Activities | $ | (19,344 | ) | | $ | (31,532 | ) | (20,741 | ) | | (47,161 | ) |
| Cash Provided by Financing Activities | | 3 |
| | 73 |
|
| Cash Provided by Investing Activities | 8,243 |
| | 42,603 |
| 17,401 |
| | 51,300 |
|
| Cash Provided by Financing Activities | 3 |
| | 19 |
| |
| Net decrease in cash | $ | (11,098 | ) | | $ | 11,090 |
| (3,337 | ) | | 4,212 |
|
Cash used in operations during the nine month periodyear ended September 30,December 31, 2012 was favorable relative to the nine month periodyear ended September 30,December 31, 2011 primarily as a result of fewer payments for claims ($35.346.0 million versus $54.671.3 million). Cash generatedprovided by investing activities during the nine month periodyear ended September 30,December 31, 2012 was unfavorablelower relative to the nine month periodyear ended September 30,December 31, 2011 primarily as a result of the timing and nature of investment purchases and sales.sales and reduced requirement of claim claim payments.
MANAGEMENT'S DISCUSSION AND ANALYSIS OF FINANCIAL CONDITION AND RESULTS OF OPERATIONS (JUNE 30, 2013)
I. SECOND QUARTER 2013 CONSOLIDATED PERFORMANCE
Second Quarter 2013 Financial Performance Summary (comparisons to Second Quarter 2012 unless noted):
Gross premium written increased by 79.2%, which included an increase of 90.6% in our core commercial auto business
Premium related to core products was written in 39 states during the three month period ended June 30, 2013
The combined ratio improved by 16.5 percentage points to 95.0%
Underwriting results improved by $1.7 million
Operating Income was $1.3 million for the three month period ended June 30, 2013
Net income for the three month period ended June 30, 2013 was $1.7 million compared to income of $130,000 in the prior period
Diluted earnings per ordinary share was $0.16, net of accounting treatment for preferred shares
Book value per common share on June 30, 2013 was $6.07, compared to $6.55 at December 31, 2012 and $6.15 at June 30, 2012
On a pro forma basis, the August 1st, 2013 repurchase of the preferred shares owned by Kingsway would have resulted in diluted earnings per ordinary share for the three month period ended June 30, 2013 of $0.40 and book value per share of $6.29, had the transaction occurred this quarter.
The following financial data is derived from Atlas’ consolidated financial statements for the three and six month periods endedJune 30, 2013 and June 30, 2012.
| Selected financial information (in '000s, except per share values) |
| | | | | | | | | | | | |
| | Three Month Periods Ended | Six Month Periods Ended |
| | June 30, 2013 | June 30, 2012 | June 30, 2013 | June 30, 2012 |
| Gross premium written | $ | 16,562 |
| $ | 9,242 |
| $ | 38,915 |
| $ | 20,996 |
|
| Net premium earned | 16,968 |
| 7,552 |
| 32,856 |
| 15,861 |
|
| Losses on claims | 10,957 |
| 5,408 |
| 21,218 |
| 11,312 |
|
| Acquisition costs | 2,227 |
| 1,395 |
| 4,497 |
| 2,768 |
|
| Other underwriting expenses | 2,956 |
| 1,617 |
| 5,678 |
| 3,267 |
|
| Underwriting expenses related to the integration of Gateway | — |
| — |
| 337 |
| — |
|
| Net underwriting income/(loss) | 828 |
| (868 | ) | 1,126 |
| (1,486 | ) |
| Net investment income | 547 |
| 657 |
| 1,159 |
| 1,265 |
|
| Income (loss) from operating activities, before tax | 1,375 |
| (211 | ) | 2,285 |
| (221 | ) |
| Less: Legal/professional fees incurred related to Gateway acquisition | — |
| — |
| 406 |
| — |
|
| Realized gains and miscellaneous income | 398 |
| 341 |
| 495 |
| 486 |
|
| Net income before tax | 1,773 |
| 130 |
| 2,374 |
| 265 |
|
| Income tax expense | 72 |
| — |
| 72 |
| — |
|
| Net income | $ | 1,701 |
| $ | 130 |
| $ | 2,302 |
| $ | 265 |
|
| | | | | |
| Key Financial Ratios: | | | | |
| Loss ratio | 64.6 | % | 71.6 | % | 64.6 | % | 71.3 | % |
| Acquisition cost ratio | 13.1 | % | 18.5 | % | 13.7 | % | 17.5 | % |
| Other underwriting expense ratio | 17.3 | % | 21.4 | % | 18.2 | % | 20.6 | % |
| Combined ratio | 95.0 | % | 111.5 | % | 96.5 | % | 109.4 | % |
| Return on equity (annualized) | 9.7 | % | 0.9 | % | 7.1 | % | 0.9 | % |
| Return on common equity (annualized) | 11.8 | % | (0.8 | )% | 8.0 | % | (0.7 | )% |
| Operating income/(loss) per common share | $ | 0.12 |
| $ | (0.03 | ) | 0.22 |
| $ | (0.04 | ) |
| Diluted earnings/(loss) per common share | $ | 0.16 |
| $ | (0.01 | ) | $ | 0.22 |
| $ | (0.02 | ) |
| Book value per common share, basic and diluted | $ | 6.07 |
| $ | 6.15 |
| $ | 6.07 |
| $ | 6.15 |
|
Operating income is an internal performance measure used in the management of the Company's operations. It represents after-tax operational results excluding, as applicable, net realized gains or losses, net impairment charges recognized in earnings and other items. These amounts are more heavily influenced by market opportunities and other external factors. Operating income should not be viewed as a substitute for U.S. GAAP net income.
Second Quarter 2013 compared to Second Quarter 2012:
Atlas’ combined ratio for the three month period ended June 30, 2013 was 95.0%, compared to 111.5% for the three month period ended June 30, 2012.
The acquisition of Gateway combined with the planned organic expansion of our core commercial automobile lines allowed us to achieve substantial premium growth. Gross premium written related to core commercial lines increased by 90.6% for the three month period ended June 30, 2013 as compared to the three month period ended June 30, 2012. The increased proportion of commercial auto policies, which historically have had more favorable overall underwriting results, is the primary driver for loss ratio improvement in 2013. The overall loss ratio for the three month period ended June 30, 2013 improved to 64.6% compared to 71.6% in the three month period ended June 30, 2012.
Atlas generated net investment income of $547,000 for the three month period ended June 30, 2013, as well as $395,000 of realized gains. This resulted in a 2.6% annualized yield for the three month period ended June 30, 2013.
Overall, Atlas generated net income of $1.7 million for the three month period ended June 30, 2013. After taking the dilutive impact of the convertible preferred shares, warrants and stock options, diluted earnings per common share in the three month period ended June 30, 2013 was $0.16. This compares to net income of $130,000 or a loss of $0.01 per common share diluted in the three month period ended June 30, 2012. On a pro forma basis, the August 1, 2013 repurchase of the preferred shares owned by Kingsway would have resulted in diluted earnings per ordinary share for the three month period ended June 30, 2013 of $0.40 and book value per share of $6.29, had the transaction occurred during the second quarter.
II. SECOND QUARTER 2013 OPERATING RESULTS
Three month period ended June 30, 2013 compared to three month period ended June 30, 2012:
Gross Premium Written
The following table summarizes gross premium written by line of business.
| Gross premium written by line of business (in '000s) |
| | | | | | | | | | | | | | | | |
| | Three Month Periods Ended | Six Month Periods Ended |
| | June 30, 2013 | June 30, 2012 | % Change | June 30, 2013 | June 30, 2012 | % Change |
| Commercial automobile | $ | 15,645 |
| $ | 8,209 |
| 90.6 | % | $ | 36,284 |
| $ | 18,926 |
| 91.7 | % |
| Surety | 950 |
| 1,165 |
| (18.5 | )% | 2,037 |
| 2,554 |
| (20.2 | )% |
| Other | (33 | ) | (132 | ) | (75.0 | )% | 594 |
| (485 | ) | (222.5 | )% |
| | $ | 16,562 |
| $ | 9,242 |
| 79.2 | % | $ | 38,915 |
| $ | 20,995 |
| 85.4 | % |
Second Quarter 2013
For the three month period ended June 30, 2013, gross premium written was $16.6 million compared to $9.2 million in the three month period ended June 30, 2012 and $22.4 million in the three month period ended March 31, 2013, representing a 79.2%increase and 25.9%decrease, respectively. In the three month period ended June 30, 2013, gross premium written from commercial automobile was $15.6 million, representing a 90.6%increase relative to the three month period ended June 30, 2012 and 24.2%decrease relative to the three month period ended March 31, 2013.
Of the $7.3 million improvement in total gross premium written, approximately $2.6 million is attributable to the Gateway acquisition. The remaining improvement is attributable to Atlas' expansion of core lines of business in several key states, and a continuing positive response from both new and existing agents to Atlas' value proposition. The decline from the three month period ended March 31, 2013 can be attributed to seasonality of renewals in our key markets.
As a percentage of the insurance subsidiaries’ overall book of business, commercial auto gross premium written represented 94.5% of gross premium written in the three month period ended June 30, 2013 compared to 88.8% during the three month period ended June 30, 2012 and 92.3% in the three month period ended March 31, 2013.
Year to Date June 30, 2013
For the six month period ended June 30, 2013, gross premium written was $38.9 million compared to $21.0 million in the six month period ended June 30, 2012, representing a 85.4%increase. Gross premium written from from commercial automobile was $36.3 million, an increase of 91.7% compared to the six month period ended June 30, 2012. Of the $17.9 millionincrease in total gross premium written, approximately $7.3 million is attributable to Gateway.
Commercial automobile insurance has outperformed the overall P&C industry in each of the past ten years based on data compiled by the National Association of Insurance Commissioners (NAIC). Each of the specialty business lines on which Atlas’ strategy is focused is a subset of this industry segment.
Geographic Concentration
| Gross premium written by state (in '000s) |
| | | | | | | | | | | | | | | | | | | | |
| | Three Month Periods Ended | Six Month Periods Ended |
| | June 30, 2013 | June 30, 2012 | June 30, 2013 | June 30, 2012 |
| Michigan | $ | 2,052 |
| 12.4 | % | $ | 1,833 |
| 19.8 | % | $ | 4,112 |
| 10.6 | % | $ | 3,724 |
| 17.7 | % |
| New York | 1,951 |
| 11.8 | % | 817 |
| 8.8 | % | 4,446 |
| 11.4 | % | 2,333 |
| 11.1 | % |
| Minnesota | 1,429 |
| 8.6 | % | 1,139 |
| 12.3 | % | 2,261 |
| 5.8 | % | 1,595 |
| 7.6 | % |
| Illinois | 1,156 |
| 7.0 | % | 1,448 |
| 15.7 | % | 7,978 |
| 20.5 | % | 7,012 |
| 33.4 | % |
| Texas | 1,147 |
| 6.9 | % | 655 |
| 7.1 | % | 1,966 |
| 5.1 | % | 856 |
| 4.1 | % |
| Louisiana | 987 |
| 6.0 | % | 296 |
| 3.2 | % | 1,608 |
| 4.1 | % | 303 |
| 1.4 | % |
| Ohio | 697 |
| 4.2 | % | 237 |
| 2.6 | % | 1,356 |
| 3.5 | % | 337 |
| 1.6 | % |
| South Carolina | 659 |
| 4.0 | % | 186 |
| 2.0 | % | 888 |
| 2.3 | % | 252 |
| 1.2 | % |
| Georgia | 654 |
| 3.9 | % | 107 |
| 1.2 | % | 1,889 |
| 4.9 | % | 602 |
| 2.9 | % |
| California | 562 |
| 3.4 | % | — |
| — | % | 1,585 |
| 4.1 | % | — |
| — | % |
| Nevada | 547 |
| 3.3 | % | 478 |
| 5.2 | % | 543 |
| 1.4 | % | 478 |
| 2.3 | % |
| Other | 4,721 |
| 28.5 | % | 2,046 |
| 22.1 | % | 10,284 |
| 26.3 | % | 3,503 |
| 16.7 | % |
| Total | $ | 16,562 |
| 100.0 | % | $ | 9,242 |
| 100.0 | % | $ | 38,916 |
| 100.0 | % | $ | 20,995 |
| 100.0 | % |
Second Quarter 2013
Michigan had the most gross premium written during the three month period ended June 30, 2013, with 12.4% of Atlas’ gross premium written. 46.7% came from the five states currently producing the most premium volume, as compared to 63.8% in the three month period ended June 30, 2012. This illustrates the geographically balanced growth of our gross premium written this year. Compared to the three month period ended June 30, 2012, we experienced growth in gross premium written in 33 states in the three month period ended June 30, 2013. Of those 33 states, we experienced quarter over quarter growth of greater than 100% in 24. This includes the impact from the Gateway acquisition as well as organic expansion.
Altogether, we had written premium in 39 states in the three month period ended June 30, 2013 compared to 30 in the three month period ended June 30, 2012 and 38 in the three month period ended March 31, 2013.
Year to DateJune 30, 2013
Atlas saw similar geographic diversification in the six month period ended June 30, 2013 compared to the six month period ended June 30, 2012. 53.4% of our premium volume came from the top five states in 2013, compared to 73.9% in 2012.
We had written premium in 39 states in the six month period ended June 30, 2013 compared to 30 states in the six month period ended June 30, 2012.
Ceded Premium Written
Ceded premium written is equal to premium ceded under the terms of Atlas’ in force reinsurance treaties. Ceded premium written increased11.2% to $1.6 million for the three month period ended June 30, 2013 compared with $1.4 million for the three month period ended June 30, 2012 and decreased77.6% compared to $7.1 million for the three month period ended March 31, 2013. The large decrease in ceded premium written from the first quarter is attributable to Gateway's workers' compensation and trucking premium, which ceded $5.3 million of premium in accordance with a new reinsurance agreement established as a condition to close the Gateway acquisition. The majority of these policies began in 2012 and were recognized during the three month period ended March 31, 2013.
In the six month period ended June 30, 2013, ceded premium written increased192.7% to $8.7 million compared to the six month period ended June 30, 2012 primarily due to the reason above.
Net Premium Written
Net premium written is equal to gross premium written less the ceded premium written under the terms of Atlas’ in force reinsurance treaties. Net premium written increased91.6% to $15.0 million for the three month period ended June 30, 2013 compared with $7.8 million for the three month period ended June 30, 2012 and decreased2.0% compared to the three month period ended March 31, 2013. As a percentage of the insurance subsidiaries’ overall book of business, virtually 100% of net premium written related to commercial auto.
In the six month period ended June 30, 2013, net premium written increased67.7% to $30.2 million from $18.0 million in the six month period ended June 30, 2012. These changes are attributed to the combined effects of the issues cited in the ‘Gross Premium Written’ and ‘Ceded Premium Written’ sections above.
Net Premium Earned
Premiums are earned ratably over the term of the underlying policy. Net premium earned was $17.0 million in the three month period ended June 30, 2013, a 124.7%increase compared with $7.6 million in the three month period ended June 30, 2012 and a 6.8%increase relative to the three month period ended March 31, 2013.
Net premiums earned related to core commercial lines increased by 171.0% in the three month period ended June 30, 2013 versus the three month period ended June 30, 2012 and 9.2% against the three month period ended March 31, 2013. Even without the excess taxi program which began in the third quarter 2012, net premiums earned related to core commercial lines increased by 121.1% versus the three month period ended June 30, 2012 and 11.6% against the three month period ended March 31, 2013. As we wound down our personal lines business at the end of 2011, virtually 100% of all 2013 earned premiums now relates to our core lines, whereas only 82.4% were related to core lines in the three month period ended June 30, 2012.
In the six month period ended June 30, 2013, net premium earned increased107.1% to $32.9 million from $15.9 million in the six month period ended June 30, 2012, driven by the recognition of $6.3 million in premium related to the excess taxi program in 2013 and growth resulting from Gateway as well as the planned organic expansion of the commercial automobile line of business.
Claims Incurred
The loss ratio relating to the net claims incurred in the three month period ended June 30, 2013 remained at 64.6% compared to the three month period ended March 31, 2013, but improved against 71.6% in the three month period ended June 30, 2012. In the six month period ended June 30, 2013, the loss ratio was 64.6%, compared to 71.3% for the six month period ended June 30, 2012.
The increased proportion of commercial auto claims throughout 2013, which historically have had more favorable overall underwriting results, is the primary driver for loss ratio improvement in 2013. We believe that our extensive experience and expertise specific to underwriting and claims management in commercial lines will allow continued loss ratio improvement in the remainder of 2013. The Company is committed to retaining this claim handling expertise as a core competency as the volume of business increases. The addition of Gateway had no significant impact to the consolidated loss ratio in the three month period ended June 30, 2013.
Acquisition Costs
Acquisition costs represent commissions and taxes incurred on net premium earned. Acquisition costs were $2.2 million in the three month period ended June 30, 2013 or 13.1% of net premium earned, as compared to 18.5% in the three month period ended June 30, 2012 and 14.3% in the three month period ended March 31, 2013. For the six month period ended June 30, 2013, acquisition costs were $4.5 million, or 13.7% of net premium earned, as compared to 17.5% for the six month period ended June 30, 2012. Approximately 1% of the favorability in the acquisition cost ratio results from the impact of the ceding commissions related to Gateway's worker's compensation and trucking lines of business, where this ceding commission is intended to offset operating expenses related to these run off programs.
The favorable trend in acquisition costs is primarily the result of the shift away from non-standard automobile lines of business which carry higher commission rates. During the three month period ended June 30, 2012, we still had substantial earned premium related to non-standard automobile lines of business.
Other Underwriting Expenses
The other underwriting expense ratio was 17.3% in the three month period ended June 30, 2013 compared to 21.4% in the three month period ended June 30, 2012 and 19.2% for the three month period ended March 31, 2013. For the six month period ended June 30, 2013, the ratio was 18.2% compared to 20.6% in the six month period ended June 30, 2012.
During the first quarter of 2013, we incurred restructuring costs related to the acquisition of Gateway of $337,000, which increased our underwriting expense ratio by 1.0% for the six month period ended June 30, 2013 and by 2.1% for the three month period ended March 31, 2013. The ratio in 2013 excludes $406,000 in transaction costs incurred in conjunction with the acquisition of Gateway.
In addition to the restructuring costs above, we also incurred employment costs of $141,000 in the three month period ended June 30, 2013 related to former Gateway employees who were severed from Atlas during 2013. For the six month period ended June 30, 2013, we incurred $345,000 of such costs. In the second quarter, this had an effect of 0.8% on the underwriting expense ratio. On a year-to-date basis, its impact was approximately 1.3%.
Net Investment Income
| Investment Results (in '000s) |
| | | | | | | | | | | | |
| | Three Month Periods Ended | Six Month Periods Ended |
| | June 30, 2013 | June 30, 2012 | June 30, 2013 | June 30, 2012 |
| Average securities at cost | $ | 144,803 |
| $ | 118,482 |
| $ | 132,387 |
| $ | 123,206 |
|
| Interest income after expenses | 547 |
| 657 |
| 1,159 |
| 1,264 |
|
| Percent earned on average investments (annualized) | 1.5 | % | 2.2 | % | 1.8 | % | 2.1 | % |
| Net realized gains | $ | 395 |
| $ | 291 |
| $ | 488 |
| $ | 319 |
|
| Total investment income | 942 |
| 948 |
| 1,647 |
| 1,583 |
|
| Total realized yield (annualized) | 2.6 | % | 3.2 | % | 2.5 | % | 2.6 | % |
Investment income (excluding net realized gains) decreased by 16.8% to $547,000 in the three month period ended June 30, 2013, compared to $657,000 in the three month period ended June 30, 2012. These amounts are primarily comprised of interest income. The annualized realized yield on invested assets (including net realized gains of $395,000) in the three month period ended June 30, 2013 declined slightly to 2.6% compared to the three month period ended June 30, 2012 but improved against the yield of 2.2% in the three month period ended March 31, 2013. The portfolio acquired from Gateway was similar in nature to ours.
On a year to date basis, investment income decreased by 8.3% to $1.2 million in the six month period ended June 30, 2013 compared to $1.3 million in the six month period ended June 30, 2012, resulting in a slightly smaller yield of 2.5% year-to-date, compared to 2.6% in the six month period ended June 30, 2012.
Net Realized Investment Gains (Losses)
Net realized investment gains in the three month period ended June 30, 2013 were $395,000 compared to $291,000 in the three month period ended June 30, 2012 and $93,000 in the three month period ended March 31, 2013. The difference is the result of management's decision to sell certain equity securities in the second quarter to take advantage of favorable market conditions.
For the six month period ended June 30, 2013, realized investment gains were $488,000 versus $319,000 for the six month period ended June 30, 2012.
In the three month period ended June 30, 2013, Atlas had $3.9 million of unrealized losses as a result of the impact of rising interest rates on the market value of some of the securities we own. The duration of Atlas' portfolio is well matched to our liquidity needs and the Company expects to hold these assets until maturity. Therefore, Atlas does not expect the near term change in market value of these securities to be realized.
Miscellaneous Income (Loss)
Atlas recorded miscellaneous income in the three month period ended June 30, 2013 of $3,000 compared to $50,000 for the three month period ended June 30, 2012.
For the six month period ended June 30, 2013, miscellaneous income was $8,000 compared to $167,000 in the six month period ended June 30, 2012. Miscellaneous income prior to June 30, 2012 was primarily comprised of rental income from our corporate headquarters in Elk Grove Village, Illinois, which has subsequently been sold.
Combined Ratio
Underwriting profitability, as opposed to overall profitability or net earnings, is measured by the combined ratio. The combined ratio is the sum of the loss and loss adjustment expense (LAE) ratios, the acquisition cost ratio and the underwriting expense ratio. Atlas’ combined ratio for the three month periods ended June 30, 2013 and 2012 as well as the six month periods endedJune 30, 2013 and 2012 are summarized in the table below. 2013 combined ratio improvement is attributable to the factors described in the ‘Claims Incurred,’ ‘Acquisition Costs,’ 'Other Underwriting Expenses' and 'Net Premium Earned' sections above.
| Combined Ratios (in '000s) |
| | | | | | | | | |
| Three Month Periods Ended | June 30, 2013 | March 31, 2013 | June 30, 2012 |
| Net premium earned | $ | 16,968 |
| $ | 15,888 |
| $ | 7,552 |
|
Underwriting expenses 1 | 16,140 |
| 15,590 |
| 8,420 |
|
| Combined ratio | 95.0 | % | 98.1 | % | 111.5 | % |
| Combined Ratios (in '000s) |
| | | | | | |
| Six Month Periods Ended | June 30, 2013 | June 30, 2012 |
| Net premium earned | $ | 32,856 |
| $ | 15,861 |
|
Underwriting expenses 1 | 31,730 |
| 17,347 |
|
| Combined ratio | 96.5 | % | 109.4 | % |
1 - Underwriting expenses are the combination of claims incurred, acquisition costs, and other underwriting expenses
Operating Income
Operating income is an internal performance measure used in the management of the Company's operations. It represents after-tax operational results excluding, as applicable, net realized gains or losses, net impairment charges recognized in earnings and other non-recurring items. These amounts are more heavily influenced by market opportunities and other external factors. Operating income should not be viewed as a substitute for U.S. GAAP net income.
Atlas' operating income for the three month period ended June 30, 2013 was $1.4 million, compared to an operating loss of $211,000 in the three month period ended June 30, 2012. In both of these periods, substantially all the difference between net income and operating income was gain realized on the sale of investments.
For the six month period ended June 30, 2013, we generated operating income of $2.2 million compared to an operating loss of $221,000 in the six month period ended June 30, 2012. Operating income in the six month period ended June 30, 2013 was favorable to net income primarily due to the exclusion of certain expenses related to the acquisition of Gateway.
Income/Loss before Income Taxes
Atlas generated pre-tax income of $1.7 million in the three month period ended June 30, 2013, compared to pre-tax income of $130,000 in the three month period ended June 30, 2012 and $602,000 of income in the three month period ended March 31, 2013.
For the six month period ended June 30, 2013, Atlas generated pre-tax income of $2.4 million compared to income of $265,000 in the six month period ended June 30, 2012.
Income Tax Expense
Atlas recognized tax expense of $72,000 in the three month period ended June 30, 2013 and no tax expense in the three month period ended June 30, 2012. The following table reconciles the statutory U.S. Federal tax rate of 34.0% to the actual percentage of pre-tax income provided for the three month periods ended June 30, 2013 and 2012:
| Tax Rate Reconciliation (in '000s) |
| | | | | | | | | | | | | | | | | | | | |
| | Three Month Periods Ended | Six Month Periods Ended |
| | June 30, 2013 | June 30, 2012 | June 30, 2013 | June 30, 2012 |
| | Amount | % | Amount | % | Amount | % | Amount | % |
| Expected income tax benefit at statutory rate | 602 |
| 34.0 | % | 44 |
| 34.0 | % | $ | 807 |
| 34.0 | % | 90 |
| 34.0 | % |
| Valuation allowance | (586 | ) | (33.1 | )% | (44 | ) | (34.0 | )% | (931 | ) | (39.1 | )% | (92 | ) | (34.8 | )% |
| Nondeductible expenses | 9 |
| 0.5 | % | 1 |
| 0.8 | % | 150 |
| 6.3 | % | 5 |
| 1.9 | % |
| Other | 47 |
| 2.7 | % | (1 | ) | (0.8 | )% | 46 |
| 1.9 | % | (3 | ) | (1.1 | )% |
| Total | $ | 72 |
| 4.1 | % | $ | — |
| — | % | $ | 72 |
| 3.1 | % | $ | — |
| — | % |
Net Income and Earnings/Loss per Common Share
Atlas earned$1.7 million during the three month period ended June 30, 2013 versus income of $130,000 during the three month period ended June 30, 2012 and income of $602,000 for the three month period ended March 31, 2013. After taking the impact of the liquidation preference of the preferred shares into consideration, diluted earnings per common share in the three month period ended June 30, 2013 was $0.16 versus a loss per common share of $0.01 in the three month period ended June 30, 2012 and diluted earnings per common share of $0.04 in the three month period ended March 31, 2013.
For the three month period ended June 30, 2013, there were 8,131,450 weighted average common shares outstanding used to compute basic earnings per share and 10,968,405 used for diluted earnings per share. For the three month period ended June 30, 2012, there were 6,144,385 weighted average common shares outstanding used to compute basic and diluted loss per share.
In the six month period ended June 30, 2013, Atlas had net income of $2.3 million, resulting in diluted earnings per common share of $0.22. In the six month period ended June 30, 2012, Atlas earned$265,000 for a diluted loss per common share of $0.02,after the impact of the preferred shares.
For the six month period ended June 30, 2013, there were 7,591,092 weighted average common shares outstanding used to compute basic earnings per share and 10,346,756 for diluted earnings per share. For the six month period ended June 30, 2012, there were 6,145,099 weighted average common shares outstanding used to compute both basic and diluted loss per share.
The following chart illustrates Atlas’ potential dilutive common shares:
|
| | | | | | | | | | | | | |
| | Ordinary shares | Restricted voting common shares | Warrants | Stock options outstanding | Convertible preferred shares | Total |
| Potential common shares at June 30, 2013 | 6,904,420 |
| 1,262,471 |
| 1,256,837 |
| 225,617 |
| 2,540,000 |
| 12,189,345 |
|
| Dilutive common shares, three month period ended June 30, 2013 | 6,868,979 |
| 1,262,471 |
| 252,794 |
| 44,161 |
| 2,540,000 |
| 10,968,405 |
|
| | | | | | | |
Net income attributable to Atlas (in '000s) | | | | | | $ | 1,701 |
|
| Dilutive earnings per common share | | | | | | $ | 0.16 |
|
Book Value per Ordinary Share
Book value per ordinary share was as follows:
|
| | | | | | | |
| (in '000s, except for shares and per share data) | June 30, 2013 | December 31, 2012 |
| Shareholders' Equity | 69,582 |
| 59,864 |
|
| Preferred stock in equity | 20,000 |
| 18,000 |
|
| Accumulated dividends on preferred stock | 45 |
| 1,620 |
|
| Common equity | 49,537 |
| 40,244 |
|
| Shares outstanding | 8,166,891 |
| 6,144,395 |
|
| Book value per common share outstanding | $ | 6.07 |
| $ | 6.55 |
|
Year-to-date in 2013, book value was reduced relative to December 31, 2012 as follows: a reduction of $0.37 related to dilution from our U.S. IPO, a reduction of $0.04 from legal and professional fees related to our acquisition of Gateway, an increase of $0.27 from net income attributable to common shareholders, and a decrease of $0.34 related to the change in unrealized gains and losses. The impact on book value per common share related to the preferred share redemption, which was completed on August 1, 2013, is $0.22 per common share outstanding (the redemption of these shares is expected to result in accretion to book value in this amount in the third quarter).
III. SECOND QUARTER 2013 FINANCIAL CONDITION
Investments
Overview and Strategy
Atlas aligns its securities portfolio to support the liabilities and operating cash needs of the insurance subsidiaries, to preserve capital and to generate investment returns. Atlas invests predominantly in corporate and government bonds with relatively short durations that correlate with the payout patterns of Atlas’ claims liabilities. A third-party investment management firm manages Atlas’ investment portfolio pursuant to the Company’s investment policies and guidelines as approved by its Board of Directors. Atlas monitors the third-party investment manager’s performance and its compliance with both its mandate and Atlas’ investment policies and guidelines.
Atlas’ investment guidelines stress the preservation of capital, market liquidity to support payment of liabilities and the diversification of risk. With respect to fixed income securities, Atlas generally purchases securities with the expectation of holding them to their maturities; however, the securities are available for sale if liquidity needs arise.
Portfolio Composition
Atlas held securities with a fair value of $119.8 million as of June 30, 2013, which was primarily comprised of fixed income securities. This amount includes securities acquired from Gateway. The securities held by the insurance subsidiaries must comply with applicable regulations that prescribe the type, quality and concentration of securities. These regulations in the various jurisdictions in which the insurance subsidiaries are domiciled permit investments in government, state, municipal and corporate bonds, preferred and common equities, and other high quality investments, within specified limits and subject to certain qualifications.
The amortized cost, gross unrealized gains and losses and fair value for Atlas’ investments in fixed maturities and equity investments are as follows (all amounts in '000s):
| Fair value of securities portfolio (in '000s) |
| | | | | | | | | | | | | |
| June 30, 2013 | Amortized Cost | Gross Unrealized Gains | Gross Unrealized Losses | Fair Value |
| Fixed Income: | | | | | |
| U.S. | - Government | $ | 47,109 |
| $ | 207 |
| $ | 878 |
| $ | 46,438 |
|
| | - Corporate | 40,070 |
| 2 |
| 326 |
| 39,746 |
|
| | - Commercial mortgage backed | 22,138 |
| 31 |
| 380 |
| 21,789 |
|
| | - Other asset backed | 10,220 |
| 4 |
| 39 |
| 10,185 |
|
| Total Fixed Income | | $ | 119,537 |
| $ | 244 |
| $ | 1,623 |
| $ | 118,158 |
|
| Equities | | 569 |
| �� |
| 194 |
| 375 |
|
| Totals | | $ | 120,106 |
| $ | 244 |
| $ | 1,817 |
| $ | 118,533 |
|
|
| | | | | | | | | | | | | |
| December 31, 2012 | Amortized Cost | Gross Unrealized Gains | Gross Unrealized Losses | Fair Value |
| Fixed Income: | | | | | |
| U.S. | - Government | $ | 34,993 |
| $ | 879 |
| $ | 9 |
| $ | 35,863 |
|
| | - Corporate | 35,922 |
| 1,253 |
| 16 |
| 37,159 |
|
| | - Commercial mortgage backed | 20,387 |
| 433 |
| 7 |
| 20,813 |
|
| | - Other asset backed | 4,121 |
| 123 |
| — |
| 4,244 |
|
| Total Fixed Income | | $ | 95,423 |
| $ | 2,688 |
| $ | 32 |
| $ | 98,079 |
|
| Equities | | 1,563 |
| 8 |
| — |
| 1,571 |
|
| Totals | | $ | 96,986 |
| $ | 2,696 |
| $ | 32 |
| $ | 99,650 |
|
Gross unrealized gains and losses on fixed income securities by type and sector as of June 30, 2013 are provided in the table below.
|
| | | | | | | | | | | | | | |
| June 30, 2013 | Amortized Cost | Gross Unrealized Gains | Gross Unrealized Losses | Fair Value |
| Fixed Income: | | | | |
| U.S. | Government | $ | 47,109 |
| $ | 207 |
| $ | 878 |
| $ | 46,438 |
|
| | Corporate | | | | |
| | | Banking/Financial Services | 12,610 |
| 2 |
| 103 |
| 12,509 |
|
| | | Consumer Goods | 4,447 |
| | 28 |
| 4,419 |
|
| | | Capital Goods | 10,899 |
| | 104 |
| 10,795 |
|
| | | Energy | 3,882 |
| | 40 |
| 3,842 |
|
| | | Telecommunications/Utilities | 5,001 |
|
|
| 29 |
| 4,972 |
|
| | | Health Care | 3,231 |
| | 22 |
| 3,209 |
|
| | Total Corporate | 40,070 |
| 2 |
| 326 |
| 39,746 |
|
| | Commercial mortgage backed | 22,138 |
| 31 |
| 380 |
| 21,789 |
|
| | Other asset backed | 10,220 |
| 4 |
| 39 |
| 10,185 |
|
| Total Fixed Income | $ | 119,537 |
| $ | 244 |
| $ | 1,623 |
| $ | 118,158 |
|
| Equities | 569 |
| — |
| 194 |
| 375 |
|
| Totals | $ | 120,106 |
| $ | 244 |
| $ | 1,817 |
| $ | 118,533 |
|
Liquidity and Cash Flow Risk
The following table summarizes the fair value by contractual maturities of the fixed income securities portfolio, excluding cash and cash equivalents, at the dates indicated.
| Fair value of fixed income securities by contractual maturity date (in '000s) |
| | | | | | | | | | |
| As of: | June 30, 2013 | December 31, 2012 |
| | Amount | % | Amount | % |
| Due in less than one year | $ | 4,190 |
| 3.5 | % | $ | 9,513 |
| 9.7 | % |
| Due in one through five years | 37,513 |
| 31.7 | % | 23,124 |
| 23.6 | % |
| Due after five through ten years | 28,269 |
| 23.9 | % | 20,524 |
| 20.9 | % |
| Due after ten years | 48,186 |
| 40.9 | % | 44,918 |
| 45.8 | % |
| Total | $ | 118,158 |
| 100.0 | % | $ | 98,079 |
| 100.0 | % |
As of the period ended June 30, 2013, 35.3% of the fixed income securities, including treasury bills, bankers’ acceptances, government bonds and corporate bonds had contractual maturities of five years or less. Actual maturities may differ from contractual maturities because certain issuers have the right to call or prepay obligations with or without call or prepayment penalties. Atlas holds cash and high grade short-term assets which, along with fixed income security maturities, management believes are sufficient for the payment of claims on a timely basis. In the event that additional cash is required to meet obligations to policyholders, Atlas believes that high quality securities portfolio provides us with sufficient liquidity. With a weighted average duration of 3.8 years, changes in interest rates will have a modest market value impact on the Atlas portfolio relative to longer duration portfolios. Atlas can and typically does hold bonds to maturity by matching duration with the anticipated liquidity needs.
Market Risk
Market risk is the risk that Atlas will incur losses due to adverse changes in interest rates, currency exchange rates or equity prices. Having disposed of a majority of its asset backed securities, its primary market risk exposure in the fixed income securities portfolio is to changes in interest rates. Because Atlas’ securities portfolio is comprised of primarily fixed income securities that are usually
held to maturity, periodic changes in interest rate levels generally impact its financial results to the extent that the securities in its available for sale portfolio are recorded at market value. During periods of rising interest rates, the market value of the existing fixed income securities will generally decrease and realized gains on fixed income securities will likely be reduced. The reverse is true during periods of declining interest rates.
Credit Risk
Credit risk is defined as the risk of financial loss due to failure of the other party to a financial instrument to discharge an obligation. Atlas is exposed to credit risk principally through its investments and balances receivable from policyholders and reinsurers. It monitors concentration and credit quality risk through policies designed to limit and monitor its exposure to individual issuers or related groups (with the exception of U.S. government bonds) as well as through ongoing review of the credit ratings of issuers in the securities portfolio. Credit exposure to any one individual policyholder is not material. The Company's policies, however, are distributed by agents who may manage cash collection on its behalf pursuant to the terms of their agency agreement. Atlas has policies to evaluate the financial condition of its reinsurers and monitors concentrations of credit risk arising from similar geographic regions, activities, or economic characteristics of the reinsurers to minimize its exposure to significant losses from reinsurers’ insolvency.
The following table summarizes the composition of the fair value of the fixed income securities portfolio (excluding the bond which has been classified in Level 3 within the fair value hierarchy), excluding cash and cash equivalents, as of the dates indicated, by ratings assigned by Fitch, S&P or Moody’s Investors Service. The fixed income securities portfolio consists of predominantly very high quality securities in corporate and government bonds with 90.6% rated ‘A’ or better as of the period ended June 30, 2013 compared to 88.1%as of the year ended December 31, 2012.
| Credit ratings of fixed income securities portfolio (in '000s) |
| | | | | | | | | | |
| As of: | June 30, 2013 | December 31, 2012 |
| | Amount | % of Total | Amount | % of Total |
| AAA/Aaa | $ | 71,247 |
| 60.6 | % | $ | 58,765 |
| 60.1 | % |
| AA/Aa | 12,128 |
| 10.2 | % | 7,569 |
| 7.7 | % |
| A/A | 23,260 |
| 19.8 | % | 19,894 |
| 20.3 | % |
| BBB/Baa | 11,097 |
| 9.4 | % | 11,617 |
| 11.9 | % |
| Total Securities | $ | 117,732 |
| 100.0 | % | $ | 97,845 |
| 100.0 | % |
Other-than-temporary impairment
Atlas recognizes losses on securities for which a decline in market value was deemed to be other-than-temporary. Management performs a quarterly analysis of the securities holdings to determine if declines in market value are other-than-temporary. Atlas did not recognize charges for securities impairments that were considered other-than-temporary for the six month period ended June 30, 2013 or the six month period ended June 30, 2012.
The length of time securities may be held in an unrealized loss position may vary based on the opinion of the appointed investment manager and their respective analyses related to valuation and to the various credit risks that may prevent us from recapturing the principal investment. In cases of securities with a maturity date where the appointed investment manager determines that there is little or no risk of default prior to the maturity of a holding, Atlas would elect to hold the security in an unrealized loss position until the price recovers or the security matures. In situations where facts emerge that might increase the risk associated with recapture of principal, Atlas may elect to sell securities at a loss.
At June 30, 2013, a portion of Atlas' portfolio was in an unrealized loss position. This was primarily driven by a rise in the 5-year US Treasury interest rate during the second quarter. All securities in an unrealized loss position as of June 30, 2013 and December 31, 2012 have been in said position for less than 12 months. The total fair value of the securities currently in an unrealized loss position is $89.2 million. Atlas has the ability and intent to hold these securities until their fair value is recovered. Therefore, Atlas does not expect the near term change in market value of these securities to be realized.
Estimated impact of changes in interest rates and securities prices
For Atlas’ available-for-sale fixed income securities held as of the period ended June 30, 2013, a 100 basis point increase in interest rates on such held fixed income securities would have increased net investment income and income before taxes by approximately $104,000. Conversely, a 100 basis point decrease in interest rates on such held fixed income securities would have decreased net investment income and income before taxes by $104,000.
A 100 basis point increase would have also decreased other comprehensive income by approximately $4.3 million due to “mark-to-market” requirements; however, holding investments to maturity would mitigate this impact. Conversely, a 100 basis point decrease would have increased other comprehensive income by the same amount. The impacts described here are approximately linear to the change in interest rates.
Due from Reinsurers and Other Insurers
Atlas purchases reinsurance from third parties in order to reduce its liability on individual risks and its exposure to large losses. Reinsurance is coverage purchased by one insurance company from another for part of the risk originally underwritten by the purchasing (ceding) insurance company. The practice of ceding insurance to reinsurers allows an insurance company to reduce its exposure to loss by size, geographic area, and type of risk or on a particular policy. An effect of ceding insurance is to permit an insurance company to write additional insurance for risks in greater number or in larger amounts than it would otherwise insure independently, based on its statutory capital, risk tolerance and other factors.
Atlas generally purchases reinsurance to limit net exposure to a maximum amount on any one loss of $500,000 with respect to commercial automobile liability claims. Atlas also purchases reinsurance to protect against awards in excess of its policy limits. Atlas continually evaluates and adjusts its reinsurance needs based on business volume, mix, and supply levels.
Reinsurance ceded does not relieve Atlas of its ultimate liability to its insured in the event that any reinsurer is unable to meet their obligations under its reinsurance contracts. Therefore, Atlas enters into reinsurance contracts with only those reinsurers deemed to have sufficient financial resources to provide the requested coverage. Reinsurance treaties are generally subject to cancellation by the reinsurers or Atlas on the anniversary date and are subject to renegotiation annually. Atlas regularly evaluates the financial condition of its reinsurers and monitors the concentrations of credit risk to minimize its exposure to significant losses as a result of the insolvency of a reinsurer. Atlas believes that the amounts it has recorded as reinsurance recoverables are appropriately established. Estimating amounts of reinsurance recoverables, however, is subject to various uncertainties and the amounts ultimately recoverable may vary from amounts currently recorded. Atlas had $23.8 million recoverable from third party reinsurers (exclusive of amounts prepaid) and other insurers as of the period ended June 30, 2013 as compared to $6.0 millionas of the year ended December 31, 2012. The increase in the recoverable amount relates to the Gateway acquisition.
Estimating amounts of reinsurance recoverables is also impacted by the uncertainties involved in the establishment of provisions for unpaid claims. As underlying reserves potentially develop, the amounts ultimately recoverable may vary from amounts currently recorded. Atlas’ reinsurance recoverables are generally unsecured, with the exception of the new reinsurance agreement established as a condition to close the Gateway acquisition, which is secured by a letter of credit valued at 150% of the claims reserves. Atlas regularly evaluates its reinsurers, and the respective amounts recoverable, and an allowance for uncollectible reinsurance is provided for, if needed.
Atlas’ largest reinsurance partners are Great American Insurance Company (“Great American”), a subsidiary of American Financial Group, Inc. and Gen Re, a subsidiary of Berkshire Hathaway, Inc. Great American has a financial strength rating of A+ from Standard & Poor’s, while Gen Re has a financial strength rating of Aa1 from Moody’s, and A++ from A.M Best.
Deferred Tax Asset
| Components of Deferred Tax (in '000s) |
| | | | | | |
| As of | June 30, 2013 | December 31, 2012 |
| Deferred tax assets: | | |
| Unpaid claims and unearned premiums | $ | 4,251 |
| $ | 3,144 |
|
| Loss carry-forwards | 16,103 |
| 16,128 |
|
| Bad debts | 251 |
| 164 |
|
| Other | 942 |
| 907 |
|
| Valuation Allowance | (11,318 | ) | (11,242 | ) |
| Total gross deferred tax assets | $ | 10,229 |
| $ | 9,101 |
|
| | | |
| Deferred tax liabilities: | | |
| Investment securities | $ | 585 |
| $ | 910 |
|
| Deferred policy acquisition costs | 1,585 |
| 1,280 |
|
| Other | 14 |
| 306 |
|
| Total gross deferred tax liabilities | 2,184 |
| 2,496 |
|
| Net deferred tax assets | $ | 8,045 |
| $ | 6,605 |
|
Atlas established a valuation allowance of approximately $11.3 million and $11.2 million for its gross future deferred tax assets as of the period ended June 30, 2013 and as of the year ended December 31, 2012, respectively.
In assessing the need for a valuation allowance, Atlas considers both positive and negative evidence related to the likelihood of realization of the deferred tax assets. If, based on the weight of available evidence, it is more likely than not the deferred tax assets will not be realized, a valuation allowance is recorded. The weight given to the positive and negative evidence is commensurate with the extent to which the evidence may be objectively verified. GAAP states that a cumulative loss in recent years is a significant piece of negative evidence that is difficult to overcome in determining that a valuation allowance is not needed against deferred
tax assets. Atlas' assessment also considered the recent spin-off from prior ownership, the nature and extent of cumulative financial losses and trends in recent quarterly earnings.
Atlas has the following total net operating loss carry-forwards as of the period ended June 30, 2013:
| Net operating loss carry-forward by expiry (in '000s) |
| | | | |
| Year of Occurrence | Year of Expiration | Amount |
| 2001 | 2021 | $ | 12,563 |
|
| 2002 | 2022 | 4,317 |
|
| 2004 | 2024 | 125 |
|
| 2005 | 2025 | 183 |
|
| 2006 | 2026 | 7,825 |
|
| 2007 | 2027 | 5,131 |
|
| 2008 | 2028 | 1,949 |
|
| 2009 | 2029 | 1,949 |
|
| 2010 | 2030 | 2,442 |
|
| 2011 | 2031 | 10,558 |
|
| 2012 | 2032 | 322 |
|
| Total | | $ | 47,364 |
|
Claims Liabilities
The table below shows the amounts of total case reserves and incurred but not reported (“IBNR”) claims provision as of the period ended June 30, 2013 and as of the year ended December 31, 2012. The provision for unpaid claims increased by 50.2% to $105.2 millionas of the period ended June 30, 2013 compared to $70.1 millionas of the year ended December 31, 2012. During the six month period ended June 30, 2013, case reserves increased by 44.4% compared to December 31, 2012, and IBNR reserves increased by 70.1%.
The majority of the increase in unpaid claims can be attributed to claims acquired from Gateway at the beginning of 2013. Gateway's unpaid claims balance at the time of acquisition was $36.2 million. In the six month period ended June 30, 2013, Gateway incurred $7.3 million in claims.
| Provision for unpaid claims by type - gross (in '000s) |
| | | | | | | | |
| As of | June 30, 2013 | December 31, 2012 | YTD% Change |
| Case reserves | $ | 78,439 |
| $ | 54,321 |
| 44.4 | % |
| IBNR | 26,782 |
| 15,746 |
| 70.1 | % |
| Total | $ | 105,221 |
| $ | 70,067 |
| 50.2 | % |
| Provision for unpaid claims by line of business – gross (in '000s) |
| | | | | | | | |
| As of | June 30, 2013 | December 31, 2012 | YTD% Change |
| Non-standard auto | $ | 23,297 |
| $ | 10,539 |
| 121.1 | % |
| Commercial auto | 68,560 |
| 54,126 |
| 26.7 | % |
| Other | 13,364 |
| 5,402 |
| 147.4 | % |
| Total | $ | 105,221 |
| $ | 70,067 |
| 50.2 | % |
| Provision for unpaid claims by line of business - net of reinsurance recoverables (in '000s) |
| | | | | | | | |
| As of | June 30, 2013 | December 31, 2012 | YTD% Change |
| Non-standard Auto | $ | 14,268 |
| $ | 8,227 |
| 73.4 | % |
| Commercial Auto | 65,593 |
| 52,538 |
| 24.8 | % |
| Other | 10,880 |
| 3,622 |
| 200.4 | % |
| Total | $ | 90,741 |
| $ | 64,387 |
| 40.9 | % |
Claims liabilities - The changes in the provision for unpaid claims, net of amounts recoverable from reinsurers, for the three and six month periods endedJune 30, 2013 and June 30, 2012 were as follows:
|
| | | | | | | | | | | | |
| | Three Month Periods Ended | Six Month Periods Ended |
| | June 30, 2013 | June 30, 2012 | June 30, 2013 | June 30, 2012 |
| Unpaid claims, beginning of period | 105,891 |
| $ | 83,902 |
| $ | 70,067 |
| $ | 91,643 |
|
| Less: reinsurance recoverable | 14,170 |
| 8,081 |
| 5,680 |
| 7,825 |
|
| Net beginning unpaid claims reserves | 91,721 |
| 75,821 |
| 64,387 |
| 83,818 |
|
| Fair value of net loss reserves acquired from Gateway | | | 29,857 |
| — |
|
| | | | | |
| Incurred related to: | | | | |
| Current year | 10,957 |
| 5,367 |
| 21,199 |
| 11,165 |
|
| Prior years | — |
| 41 |
| 19 |
| 147 |
|
| | 10,957 |
| 5,408 |
| 21,218 |
| 11,312 |
|
| Paid related to: | | | | |
| Current year | 2,877 |
| 2,264 |
| 4,532 |
| 3,921 |
|
| Prior years | 9,060 |
| 9,768 |
| 20,189 |
| 22,012 |
|
| | 11,937 |
| 12,032 |
| 24,721 |
| 25,933 |
|
| | | | | |
| Net unpaid claims, end of period | 90,741 |
| 69,197 |
| 90,741 |
| 69,197 |
|
| Add: reinsurance recoverable | 14,480 |
| 8,153 |
| 14,480 |
| 8,153 |
|
| Unpaid claims, end of period | $ | 105,221 |
| $ | 77,350 |
| $ | 105,221 |
| $ | 77,350 |
|
The process of establishing the estimated provision for unpaid claims is complex and imprecise as it relies on the judgment and opinions of a large number of individuals, on historical precedent and trends, on prevailing legal, economic, social and regulatory trends and on expectations as to future developments. The process of determining the provision necessarily involves risks that the actual results will deviate, perhaps substantially, from the best estimates made.
The reduction of the provision for unpaid claims is consistent with the change in written premium in prior years. However, because the establishment of reserves is an inherently uncertain process involving estimates, current provisions may not be sufficient. Adjustments to reserves, both positive and negative, are reflected quarterly in the statement of income as estimates are updated.
The financial statements are presented on a calendar year basis for all data. Claims payments and changes in reserves, however, may be made on accidents that occurred in prior years, not on business that is currently insured. Calendar year losses consist of payments and reserve changes that have been recorded in the financial statements during the applicable reporting period, without regard to the period in which the accident occurred. Calendar year results do not change after the end of the applicable reporting period, even as new claim information develops. Accident year losses consist of payments and reserve changes that are assigned to the period in which the accident occurred. Accident year results will change over time as the estimates of losses change due to payments and reserve changes for all accidents that occurred during that period.
Due to Reinsurers
The decrease in due to reinsurers is consistent with the payout patterns of the underlying claims liabilities.
Restructuring
We incurred $337,000 in one-time employee termination costs during the three month period ended June 30, 2013, plans for which were formulated in the same period. This expense is included in "Other Underwriting Expenses" on the Statement of Comprehensive Income. The objective of the restructuring is to eliminate managerial and staff positions deemed duplicative subsequent to the acquisition. $337,000 represents the entirety of the expected expense related to this plan. We expect the impact of the restructuring on future results of operations, liquidity and sources and uses of capital resources to be favorable.
Off-balance sheet arrangements
As of June 30, 2013, Atlas has the following cash obligations related to its operating leases.
| Operating Lease Commitments (in '000s) |
| | | | | | | | | | | | | | | | | | |
| Year | 2013 | 2014 | 2015 | 2016 | 2017 & Beyond | Total |
| Amount | $ | 560 |
| $ | 1,019 |
| $ | 1,029 |
| $ | 770 |
| $ | 281 |
| $ | 3,659 |
|
Shareholders’ Equity
The table below identifies changes in shareholders’ equity for the six month periods endedJune 30, 2013 and June 30, 2012:
| Changes in Shareholders' Equity (in '000s) |
| | | | | | | | | | | | | | | | | | | | | | | | | | | |
| | Preferred Shares | | Ordinary shares | | Restricted Voting Common Shares | | Additional Paid-in Capital | | Retained Deficit | | Accumulated Other Comprehensive Income (loss) | | Total |
| Balance December 31, 2012 | $ | 18,000 |
| | $ | 4 |
| | $ | 14 |
| | $ | 152,768 |
| | $ | (112,675 | ) | | $ | 1,753 |
| | $ | 59,864 |
|
Net income
| | | | | | | | | 2,303 |
| | | | 2,303 |
|
| U.S. Initial Public Offering | | | 16 |
| | (10 | ) | | 9,750 |
| | | | | | 9,756 |
|
| Issuance of Preferred Shares | 2,000 |
| | | | | | | | | | | | 2,000 |
|
| Warrants exercised | | | | | | | 409 |
| | | | | | 409 |
|
| Other comprehensive loss | | | | | | | | | | | (2,796 | ) | | (2,796 | ) |
| Share-based compensation | | | | | | | 122 |
| | | | | | 122 |
|
| Preferred dividends declared and paid | | | | | | | (2,076 | ) | |
| | | | (2,076 | ) |
| Balance June 30, 2013 | $ | 20,000 |
| | $ | 20 |
| | $ | 4 |
| | $ | 160,973 |
| | $ | (110,372 | ) | | $ | (1,043 | ) | | $ | 69,582 |
|
| | | | | | | | | | | | | | |
| Balance December 31, 2011 | $ | 18,000 |
| | $ | 4 |
| | $ | 14 |
| | $ | 152,652 |
| | $ | (115,841 | ) | | $ | 1,425 |
| | $ | 56,254 |
|
| Net income | | | | | | | | | 265 |
| | | | 265 |
|
| Other comprehensive income | | | | | | | | | | | 451 |
| | 451 |
|
| Share-based compensation | | | | | | | 57 |
| | | | | | 57 |
|
| Stock options exercised | | | | | | | 4 |
| | | | | | 4 |
|
| Balance June 30, 2012 | $ | 18,000 |
| | $ | 4 |
| | $ | 14 |
| | $ | 152,713 |
| | $ | (115,576 | ) | | $ | 1,876 |
| | $ | 57,031 |
|
As of August 12, 2013, there were 6,970,850 ordinary shares outstanding and 1,262,471 restricted voting shares outstanding, and 2,000,000 preferred shares issued and outstanding.
The holders of restricted voting shares are entitled to vote at all meetings of shareholders, except at meetings of holders of a specific class that are entitled to vote separately as a class. The restricted voting common shares as a class shall not carry more than 30% of the aggregate votes eligible to be voted at a general meeting of common shareholders.
All of the issued and outstanding restricted voting common shares are beneficially owned or controlled by KAI, or its affiliated entities. The restricted voting common shares will convert to ordinary shares in the event that these KAI owned shares are sold to non-affiliates of KAI.
Preferred shares are not entitled to vote. Of the total 20,000,000 preferred shares outstanding as of the three month period ended June 30, 2013, 18,000,000 were beneficially owned or controlled by Kingsway and 2,000,000 are beneficially owned or controlled by Hendricks. Preferred shareholders are entitled to dividends on a cumulative basis whether or not declared by the Board of Directors at the rate of $0.045 per share per year (4.5%) and may be paid in cash or in additional preferred shares at the option of Atlas. In liquidation, dissolution or winding-up of Atlas, preferred shareholders receive the greater of $1.00 per share plus all declared and unpaid dividends or the amount it would receive in liquidation if the preferred shares had been converted to restricted voting common shares or ordinary shares immediately prior to liquidation. Preferred shares are convertible into ordinary shares at the option of the holder at any date after the fifth year of issuance at the rate of 0.1270 ordinary shares for each preferred share. The conversion rate is subject to change if the number of ordinary shares or restricted voting common shares changes. The preferred shares are redeemable at the option of Atlas at a price of $1.00 per share plus accrued and unpaid dividends commencing at the earlier of two years from December 31, 2010 (the issuance date of the preferred shares), or the date the preferred shares are transferred to a party other than Kingsway or its subsidiaries or entities in which Kingsway holds a 10% or greater interest.
Through June 30, 2013, Atlas has paid $2.1 million in dividends to Kingsway, the cumulative amount to which they were entitled. Hendricks accrued $45,000 in dividends during the six month period ended June 30, 2013, all of which are unpaid. The 18,000,000 preferred shares owned by Kingsway were repurchased by the Company on August 1, 2013 pursuant to the Share Repurchase Agreement.
Liquidity and Capital Resources
The purpose of liquidity management is to ensure there is sufficient cash to meet all financial commitments and obligations as they become due. The liquidity requirements of Atlas’ business have been met primarily by funds generated from operations, asset maturities and income and other returns received on securities. Cash provided from these sources is used primarily for payment of claims and operating expenses. The timing and amount of catastrophe claims are inherently unpredictable and may create increased liquidity requirements.
The total purchase price for all of Camelot Services’ outstanding shares was $14.3 million, consisting of a combination of cash and Atlas preferred shares. Consideration consisted of a $6.0 million dividend paid by the sellers immediately prior to the closing, $2.0 million of Atlas preferred shares (consisting of a total of 2 million preferred shares) and $6.3 million in cash. This transaction had no material effect on our near-term liquidity.
As a holding company, Atlas may derive cash from its subsidiaries generally in the form of dividends and in the future may charge management fees to the extent allowed by statute or other regulatory approval requirements to meet its obligations. The insurance subsidiaries fund their obligations primarily through premium and investment income and maturities in their securities portfolio. Refer also to the discussion “Investments Overview and Strategy." The insurance subsidiaries require regulatory approval for the return of capital and, in certain circumstances, payment of dividends. In the event that dividends and management fees available to the holding company are inadequate to service its obligations, the holding company would need to raise capital, sell assets or incur debt obligations. As at June 30, 2013, Atlas did not have any outstanding debt, and therefore, no near term debt service obligations. Atlas currently has no material commitments for capital expenditures, other than the disclosed repurchase of the preferred shares pursuant to the Share Repurchase Agreement, which occurred on August 1, 2013.
The following table summarizes consolidated cash flow activities:
| Summary of Cash Flows (in ‘000s) |
| | | | | | |
| Six Month Periods Ended | June 30, 2013 | June 30, 2012 |
| Cash Used by Operating Activities | $ | (12,439 | ) | $ | (17,875 | ) |
| Cash Provided by Financing Activities | 8,089 |
| 4 |
|
| Cash Provided/(Used) by Investing Activities | 9,696 |
| 12,214 |
|
| Net increase/(decrease) in cash | $ | 5,346 |
| $ | (5,657 | ) |
Cash used in operations during the six month period ended June 30, 2013 was favorable relative to the six month period ended June 30, 2012 primarily due to an increase in net income and a large increase in receivables at June 30, 2012. Cash provided by investing activities during the six month period ended June 30, 2013 was lower relative to the six month period ended June 30, 2012 primarily as a result of the sale of the Elk Grove headquarters building, which had a greater impact than the cash acquired from Gateway. Cash provided by financing activities in 2013 relates to our initial public offering in the United States.
BUSINESS
Overview
We are a financial services holding company incorporated under the laws of the Cayman Islands. Our core business is the underwriting of commercial automobile insurance policies, focusing on the “light” commercial automobile sector, which is carried out through our insurance subsidiaries, American Country Insurance Company, or American Country, and American Service Insurance Company, Inc., or American Service, together with American Country, which we refer to as our “insurance subsidiaries”. This sector includes taxi cabs, non-emergency para-transit, limousine, livery and business auto. Our goal is to be the preferred specialty commercial transportation insurer in any geographic areas where our value proposition delivers benefit to all stakeholders.
We were formed as JJR VI, a Canadian capital pool company, on December 21, 2009 under the laws of Ontario, Canada. On December 31, 2010, we completed a reverse merger wherein American Service and American Country were transferred to us by Kingsway America Inc., or KAI, a wholly owned subsidiary of Kingsway Financial Services Inc., or KFSI, a Canadian public company whose shares are traded on the Toronto and New York Stock Exchanges. Prior to the transaction, each of American Service and American Country were wholly owned subsidiaries of KAI. American Country commenced operations in 1979. With roots dating back to 1925 selling insurance for taxi cabs, American Country is one of the oldest insurers of U.S. taxi and livery business. In 1983, American Service began as a non-standard personal and commercial auto insurer writing business in the Chicago, Illinois area.
In connection with the acquisition of American Service and American Country, we streamlined the operations of the insurance subsidiaries to focus on the “light” commercial automobile lines of business we believe will produce favorable underwriting results. Over the past two years, we have disposed of non-core assets and placed into run-off certain non-core lines of business previously written by the insurance subsidiaries. Our sole focus going forward is the underwriting of commercial automobile insurance in the U.S.
The address of our registered office is Cricket Square, Hutchins Drive, PO Box 2681, Grand Cayman, KY1-1111, Cayman Islands. Our operating headquarters are located at 150 Northwest Point Boulevard, Elk Grove Village, Illinois 60007, USA. We maintain a website at http://www.atlas-fin.com. Information on our website or any other website does not constitute a part of this prospectus.
On December 31, 2010, following the reverse merger transaction described immediately hereafter, we filed a Certificate of Registration by Way of Continuation in the Cayman Islands to re-domesticate as a Cayman Islands company. In addition, on December 30, 2010 we filed a Certificate of Incorporation on Change of Name to change our name to Atlas Financial Holdings, Inc. Our current organization is a result of a reverse merger transaction involving the following companies:
| |
| (a) | JJR VI, sponsored by JJR Capital, a Toronto based merchant bank; |
| |
| (b) | American Insurance Acquisition Inc., or American Acquisition, a corporation formed under the laws of Delaware as a wholly owned subsidiary of Kingsway America Inc., or KAI. KAI is a wholly owned subsidiary of Kingsway Financial Services Inc., or KFSI, a Canadian public company formed under the laws of Ontario and whose shares are traded on the Toronto and New York Stock Exchanges; and |
| |
| (c) | Atlas Acquisition Corp., a Delaware corporation wholly-owned by JJR VI and formed for the purpose of merging with and into American Acquisition. |
Prior to the transaction, each of American Service and American Country were wholly owned subsidiaries of KAI. In connection with the reverse merger transaction, KAI transferred 100% of the capital stock of each of American Service and American Country to American Acquisition (another wholly owedowned subsidiary of KAI) in exchange for C$35.1 million of common and C$18.0 million of preferred shares of American Acquisition and promissory notes worth C$7.7 million, aggregating C$60.8 million. In addition, American Acquisition raised C$8.0 million through a private placement offering of subscription receipts to qualified investors in both the United States and Canada at a price of C$2.00 per subscription receipt.
All references to share counts and per share values in connection with the reverse merger transaction are presented prior to the one-for-three reverse stock split. KAI received 13,804,861 restricted voting common shares of our company, which we refer to as “restricted voting shares”, then valued at $27.8 million, along with 18,000,000 non-voting preferred shares of our company then valued at C$18.0 million and C$8.0 million cash for total consideration of C$60.8 million in exchange for 100% of the outstanding shares of American Acquisition and full payment of certain promissory notes. Investors in the American
Acquisition private placement offering of subscription receipts received 3,983,502 of our ordinary shares, which we refer to as “ordinary shares”, plus warrants to purchase one ordinary share of our company for each subscription receipt at C$2.00 at any time until December 31, 2013. Every 10 common shares of JJR VI held by the shareholders of JJR VI immediately prior to the reverse merger were, upon consummation of the merger, consolidated into one ordinary share of JJR VI. Upon re-domestication in the Cayman Islands, these consolidated shares were then exchanged on a one-for-one basis for our ordinary shares.
Substantially all of our new premiums written are in “light” commercial automobile lines of business. For the three month period ended June 30, 2013, gross premium written was $16.6 million compared to $9.2 million in the three month period ended June 30, 2012, representing a 79.2%increase. In the ninethree month period ended SeptemberJune 30, 20122013, gross premium written from commercial automobile was $41.015.6 million, representing a 183.0%90.6% increase relative to the ninethree month period ended SeptemberJune 30, 20112012.
As a percentage of the insurance subsidiaries’ overall book of business, commercial auto gross premium written represented 92.6%94.5% of gross premium written in the ninethree month period ended SeptemberJune 30, 20122013 compared to 44.0%88.8% during the ninethree month period ended SeptemberJune 30, 20112012 and 92.3% in the three month period ended March 31, 2013.
The following table summarizes gross premium written by line of business.
| Gross Premium Written by Line of Business (in ‘000s) |
| | | | | | | | | | | | | | | | | | | | | |
| | 2012 | 2011 |
| | Q3 | Q2 | Q1 | Q4 | Q3 | Q2 | Q1 |
| Commercial automobile | $ | 22,119 |
| $ | 8,209 |
| $ | 10,718 |
| $ | 4,286 |
| $ | 5,350 |
| $ | 2,545 |
| $ | 6,609 |
|
| Non-standard automobile | (31 | ) | (143 | ) | (366 | ) | 3,401 |
| 4,342 |
| 3,709 |
| 5,960 |
|
| Other | 1,265 |
| 1,176 |
| 1,402 |
| 1,394 |
| 1,236 |
| 1,602 |
| 1,597 |
|
| Total | $ | 23,353 |
| $ | 9,242 |
| $ | 11,754 |
| $ | 9,081 |
| $ | 10,928 |
| $ | 7,856 |
| $ | 14,166 |
|
| Gross premium written by line of business (in '000s) |
| | | | | | | | | | | | | | | | |
| | Three Month Periods Ended | Six Month Periods Ended |
| | June 30, 2013 | June 30, 2012 | % Change | June 30, 2013 | June 30, 2012 | % Change |
| Commercial automobile | $ | 15,645 |
| $ | 8,209 |
| 90.6 | % | $ | 36,284 |
| $ | 18,926 |
| 91.7 | % |
| Surety | 950 |
| 1,165 |
| (18.5 | )% | 2,037 |
| 2,554 |
| (20.2 | )% |
| Other | (33 | ) | (132 | ) | (75.0 | )% | 594 |
| (485 | ) | (222.5 | )% |
| | $ | 16,562 |
| $ | 9,242 |
| 79.2 | % | $ | 38,915 |
| $ | 20,995 |
| 85.4 | % |
We are committed to the “light” commercial automobile lines of business. The insurance subsidiaries distribute their products through a network of independent retail agents,agents. Altogether, we had written premium in 39 states in the three month period ended June 30, 2013 compared to 30 in the three month period ended June 30, 2012 and actively wrote insurance38 in the three month period ended March 31, states as of September 30, 2012.2013. Together, American Country, and American Service and Gateway are licensed to write property and casualty, or P&C, insurance in 4749 states plus the District of Columbia in the United States. American Country and American Service actively wroteWe expect to write commercial automobile insurance in more states during 20122013 than in any prior year. Our acquisition of Gateway expanded our core commercial auto lines to 39 states and the District of Columbia.
Market
Our core business is the underwriting of commercial automobile insurance policies, focusing on the “light” commercial automobile sector. The “light” commercial automobile policies we underwrite provide coverage for light weight commercial vehicles typically with the minimum limits prescribed by statute, municipal or other regulatory requirements. The majority of our policyholders are individual owners or small fleet operators.
The “light” commercial automobile sector is a subset of the historically profitable commercial automobile insurance industry segment. Commercial automobile insurance has outperformed the overall P&C industry in each of the past ten years based on data compiled by A.M. Best. A recent survey by A.M. Best estimates the total market for commercial automobile liability insurance to be approximately $24 billion. The size of the commercial automobile insurance market can be affected significantly by many factors, such as the underwriting capacity and underwriting criteria of automobile insurance carriers and general economic conditions. Historically, the commercial automobile insurance market has been characterized by periods of price competition and excess capacity followed by periods of higher premium rates and shortages of underwriting capacity.
We believe that there is a positive correlation between the economy and commercial automobile insurance in general. Operators of “light” commercial automobiles may be less likely than other business segments within the commercial automobile insurance market to take vehicles out of service as their businesses and business reputations rely heavily on availability. With respect to certain business lines such as the taxi line, there are also other factors such as the cost and limited supply of medallions which may discourage a policyholder from taking vehicles out of service in the face of reduced demand for the use of the vehicle.
Acquisition of Gateway Insurance Company
On January 2, 2013 we acquired Camelot Services, Inc., or Camelot Services, a privately owned insurance holding company, and its sole subsidiary, Gateway Insurance Company, or Gateway, from Hendricks Holding Company, Inc., or Hendricks, an unaffiliated third party. Gateway provides specialized commercial insurance products, including commercial automobile insurance to niche markets such as taxi, black car and sedan service owners and operators.
Gateway is a St. Louis, Missouri-based insurance company that currently underwrites approximately $10.0 million of annual taxi and limousine net written premium. Gateway is an admitted carrier in 46 states plus the District of Columbia. Our acquisition of Gateway expanded our core commercial automobile lines to a total of 39 states and the District of Columbia, including California, Hawaii, Montana, Nebraska, North Dakota, South Dakota, Washington and West Virginia.
Under the terms of the stock purchase agreement, the purchase price equaled the tangible GAAP book value of Camelot Services at December 31, 2012, subject to certain pre and post-closing adjustments, including, among others, claim development between the signing of the stock purchase agreement and December 31, 2012. Additional consideration may be paid to the seller, or returned to us by the seller, depending upon, among other things, the future development of Gateway's actual loss reserves for certain lines of business and the utilization of certain deferred tax assets over time. Gateway also writes workers' compensation insurance, which was terminated as part of the transaction. An indemnity reinsurance agreement was entered into pursuant to which 100% of Gateway's workers' compensation business was ceded to a third party captive reinsurer funded by the seller as part of the transaction.
The total purchase price for all of Camelot Services' outstanding shares was $14.3 million, consisting of a combination of cash and Atlas preferred shares. Consideration consisted of a $6.0 million dividend paid by Gateway immediately prior to the closing, $2.0 million of Atlas preferred shares (consisting of a total of 2 million preferred shares) and $6.3 million in cash. We have contractual protections to offset up to $2.0 million of future adverse reserve development. We have also agreed to provide the sellers up to $2.0 million in additional consideration in the event of favorable reserve development.
Competitive Strengths
Our value proposition is driven by our competitive strengths, which include the following:
Focus on niche commercial insurance business. We target niche markets that support adequate pricing and believe we are able to adapt to changing market needs ahead of our competitors through our strategic commitment and increasing scale. We
develop and deliver superior specialty commercial automobile insurance products priced to meet our customers’ needs and strive to generate consistent underwriting profit for our insurance subsidiaries. We have experienced a favorable trend in loss ratios in 2012 attributable to the increased composition of commercial autoautomobile written premium as a percentage of the total written premium. We expect the loss ratio to continue decreasing as we complete the transition away from non-standard automobile insurance and other non-core lines of business.
There are a limited number of competitors specializing in these lines of business. Management believes a strong value proposition is very important to attract new business and can result in desirable retention levels as policies renew on an annual basis. There are also a relatively limited number of agents who specialize in these lines of business. As a result, strategic agent relationships are important to ensure efficient distribution.
Strong market presence with recognized brands and long-standing distribution relationships. American Country and American Service have a long heritage as insurers of taxi, livery and para-transit businesses. Both of the insurance subsidiaries have strong brand recognition and long-standing distribution relationships in our target markets. Through regular interaction with our retail producers, we strive to thoroughly understand each of the markets we serve in order to deliver strategically priced products to the right market at the right time.
Sophisticated underwriting and claims handling expertise. Atlas has extensive experience and expertise with respect to underwriting and claims management in our specialty area of insurance. Our well-developed underwriting and claims infrastructure includes an extensive data repository, proprietary technologies, deep market knowledge and established market relationships. Analysis of the substantial data available through our operating companies drives our product and pricing decisions. We believe our underwriting and claims handling expertise provides enhanced risk selection, high quality service to our customers and greater control over claims expenses. We are committed to maintaining this underwriting and claims handling expertise as a core competency as our volume of business increases.
Scalable operations positioned for growth. Significant progress has also been made in aligning our cost base to our expected revenue going forward. The core functions of the insurance subsidiaries were integrated into a common operating platform. We
believe that both insurance subsidiaries are well positionedwell-positioned to begin returning to the volume of premium they wrote in the recent past with better than industry level profitability from the efficient operating infrastructure honed in 2011.
Experienced management team. We have a talented and experienced management team led by our President and Chief Executive Officer, Scott Wollney, who has more than 2122 years of experience in the property and casualty insurance industry. Our senior management team has worked in the property and casualty industry for an average of 2122 years and with the insurance subsidiaries, directly or indirectly, for an average of 1213 years.
Strategic Focus
Vision
Our goal is to be the preferred specialty commercial transportation insurer in any geographic areasarea where our value proposition delivers benefit to all stakeholders.
Mission
We develop and deliver superior specialty insurance products priced to meet our customers’ needs and generate consistent underwriting profit for our insurance subsidiaries. These products are distributed to the insured through independent retail agents utilizing our company’s operating platform.
We seek to achieve our vision and mission through the design, sophisticated pricing and efficient delivery of specialty transportation insurance products. Through constant interaction with our retail producers, we strive to thoroughly understand each of the markets we serve in order to deliver strategically priced products to the right market at the right time. Analysis of the substantial data available through our operating companies drives our product and pricing decisions. We focus on our key strengths and seek to expand our geographic footprint and products only to the extent these activities support our vision and mission. We target niche markets that support adequate pricing and believe we are able to adapt to changing market needs ahead of our competitors through our strategic commitment and increasing scale.
Outlook
Over the past two years, through dispositions and by placing certain lines of business into run-off, the insurance subsidiaries have streamlined operations to focus on the lines of business they believe will produce favorable underwriting results.
Significant progress has also been made in aligning the cost base to our expected revenue base going forward. The core functions of the insurance subsidiaries were integrated into a common operating platform. Management believes that both insurance subsidiariesAmerican Country and American Service are well positionedwell-positioned to begin returning to the volume of premium they wrote in the recent past with better than industry level profitability. TheAll three insurance subsidiaries have a long heritage with respect to their continuing lines of business and will benefit from the efficient operating infrastructure honed in 2011.recent years. American Country and American Service actively wrote business in 31 states during 2012, representing more states than in any prior year, utilizing our well developed underwriting and claim methodology. Our 2013 acquisition of Gateway expandedhas allowed us to expand our core commercial auto lines to 3940 states and the District of Columbia.Columbia year to date in 2013.
The following table summarizes historical commercial automobile gross premium written by our insurance subsidiaries American Country and American Service (full year 2012 gross(Gateway premium written is shown).shown in 2013 only)
| Annual Gross Premium Written (in ‘000s) | | | | 2012 | 2011 | 2010 | 2009 | 2008 | 2007 | 2006 | 2005 | 2013 * | 2012 | 2011 | 2010 | 2009 | 2008 | 2007 | 2006 | 2005 |
| Commercial automobile | $ | 50,546 |
| $ | 18,790 |
| $ | 13,729 |
| $ | 67,836 |
| $ | 88,225 |
| $ | 118,894 |
| $ | 111,024 |
| $ | 127,375 |
| $ | 38,916 |
| $ | 50,546 |
| $ | 18,790 |
| $ | 13,729 |
| $ | 52,774 |
| $ | 64,445 |
| $ | 86,558 |
| $ | 78,631 |
| $ | 90,190 |
|
*Through June 30, 2013
We believe that the most significant opportunities going forward are: (i) continued re-energizing of distribution channels with the objective of recapturing business generated prior to 2009, (ii) building business in previously untapped geographic markets where our insurance subsidiaries are licensed, but not recently active, and (iii) opportunistically acquiring books of business or similar insurance companies, provided market conditions support this activity. Primary potential risks related to these activities include: (i) insurance market conditions remaining “soft” for a sustained period of time, (ii) not being able to achieve the expected support from distribution partners, and (iii) the insurance subsidiaries not successfully maintaining their recently improved ratings from A.M. Best.
We seek to deploy our capital to maximize the return for our shareholders, either by investing in growing our operations or by pursuing other capital initiatives, depending upon insurance and capital market conditions. We focus on our key strengths and seek to expand our geographic footprint and products only to the extent these activities support our vision and mission. We will identify and prioritize market expansion opportunities based on the comparative strength of our value proposition relative to competitors, the market opportunity and the legal and regulatory environment.
We intend to continue to grow profitably by undertaking the following:
Re-establish legacy distribution relationships. We are focused on re-establishing relationships with independent agents that have been our insurance subsidiaries’ distribution partners in the past. We seek to develop and maintain strategic distribution relationships with a relatively small number of independent agents with substantial market presence in each state in which we currently operate. We expect to continue to increase the distribution of our core products in the states where we are actively writing insurance and re-capture insurance premium historically written by the insurance subsidiaries.
Expand our market presence. We are committed to continuing to diversify geographically by leveraging our experience, historical data and market research to expand our business in previously untapped geographic markets. Utilizing our established brands and market relationships, we have made significant inroads in new states where we had no active business in 2011. We will continue to expand into additional states where we are licensed, but not currently active, and states where we are not currently licensed to the extent that our market expansion criteria is met in a given state.
Acquire complementary books of business and insurance companies. We plan to opportunistically pursue acquisitions of complementary books of business and insurance companies provided market conditions support this activity. We will evaluate each acquisition opportunity based on its expected economic contribution to our results and support of our market expansion initiatives. Our recent acquisition of Gateway Insurance Company as discussed under “Recent Developments” is consistent with this aspect of our strategy.
Geographic Markets
Currently, we distribute insurance only in the United States. Through our insurance subsidiaries, we are licensed to write P&C insurance in 4749 states plus the District of Columbia in the United States. The following table reflects, in percentages, the principal geographic distribution of premiums written for the ninesix month period ended SeptemberJune 30, 2012.2013. No other jurisdiction accounted for more than 5%.
|
| |
| Distribution of Net Premium Written by Jurisdiction |
| Illinois | 20.5% |
| New York | 34.6% |
Illinois | 19.3%11.4% |
| Michigan | 11.9%10.6% |
LouisianaMinnesota | 6.2%5.8% |
| Texas | 5.1% |
The diagram below outlines the states where we are focused on actively writing new insurance policies and where we believe the comparative strength of our value proposition, the market opportunity, and the legal and regulatory environment are favorable (states darkened in the below diagram). With the completion of the acquisition of Gateway, we have increased the footprint of our current market focus to 40 states and the District of Columbia (we are currently actively writing premium in 39 states and the District of Columbia through the addition of California, Hawaii, Montana, Nebraska, North Dakota, South Dakota, Washington and West Virginia. Columbia).
Gateway historically issued commercial automobile insurance policies in the state of Florida. We do not plan to actively write insurance for new policyholders in Florida going forward and are in the process of satisfying the regulatory requirements to withdraw from that state.
Agency Relationships
Independent agents are recruited by us directly and through marketing efforts targeting the specialty niche upon which we focus. Interested agents are evaluated based on their experience, expertise and ethical dealing. Typically, our company enters into distribution relationships with one out of every ten agents seeking an agency contract. We are generally interested in acting as one of a relatively small number of insurance partners with whom their independent agents place business and are also careful not to oversaturate the distribution channel in any given geographic market. This helps to ensure that we are able to receive the maximum number of submissions for underwriting evaluation without unnecessary downstream pressure from agents to write business that does not fit our underwriting model. Agents receive commission as a percentage of premiums
(generally (generally 10% to 15%12%) as their primary compensation from us. Larger agents are also eligible for profit sharing based on the growth and underwriting profitability related to their book of business with us. The quality of business presented and written by each independent agent is evaluated regularly by our underwriters and is also reviewed quarterly by senior management. Key metrics for evaluation include overall accuracy and adequacy of underwriting information, performance relative to agreed commitments, support with respect to claims presented by their customers (as applicable) and overall underwriting profitability of the agent’s book of business. While we rely on our independent agents for distribution and customer support, underwriting and claim handling responsibilities are retained by us. Many of our agents have had direct relationships with either or both of the subsidiaries for a number of years. Gateway also distributes its taxi and limousine products through independent agents. We believe theirTheir distribution channel and independent agent relationships are complementary to ours.
Seasonality
The P&C insurance business is seasonal in nature. While our net premiums earned generally follow a stable trend from quarter to quarter, our gross premiums written follow certain common renewal dates for the light commercial risks that represent our core lines of business. For example, January 1st and March 1st are common taxi cab renewal dates in Illinois and New York, respectively. Additionally, we implemented our New York “excess taxi program” in the third quarter of 2012, which was renewed in the third quarter 2013. Net underwriting income is driven mainly by the timing and nature of claims, which can vary widely. Our ability to generate written premium is also impacted by the timing of policy periods in the states in which we
operate. As we continue to diversify geographically, we expect seasonality to have a less dramatic impact on quarterly volumes of premium written.
Competition
The insurance industry is price competitive in all markets in which the insurance subsidiaries operate. Our company strives to employ disciplined underwriting practices with the objective of rejecting under pricedunderpriced risks. A recent survey by A.M. Best & Company estimates the total market for commercial automobile liability insurance to be approximately $24 billion. We believe our company requires only 1% market share to achieve our business plan. We believe our current market share as of June 30, 2013is approximately 0.2%.
Our company competes on a number of factors such as distribution strength, pricing, agency relationships, policy support, claim service, and market reputation. In our core commercial automobile lines, the primary offerings are policies at the minimum prescribed limits in each state, as established by statutory, municipal and other regulations. We believe our company differentiates itself from many larger companies competing for this specialty business by exclusively focusing on these lines of insurance. We believe our exclusive focus results in the deployment of underwriting and claims professionals more in tune with issues common in commercial automobile lines, and provides the customer better service.
In the specialty insurance market, American Country, and American Service and Gateway compete against, among others, American Transit Insurance Company (New York only), Canal Insurance Company, CNA Financial Corporation, Carolina Casualty Insurance Company, Empire Fire & Marine Insurance Company (subsidiary of Zurich Financial Services Ltd.), Global Liberty Insurance Company of New York, Granada Insurance Company, Hereford Holding Company, Inc., Hartford Financial Services Group, Lancer Financial Group, MAPFRE USA, Maya Assurance Company, Mercury General Corporation, National Indemnity Company (subsidiary of Berkshire Hathaway, Inc.), National Interstate Corporation, Northland Insurance Company (subsidiary of Travelers Companies, Inc.), Safeco Corporation (subsidiary of Liberty Mutual), and Scottsdale Insurance Company (National Casualty Company) and ULLICO, Inc..
To compete successfully in the specialty commercial insurance industry, we rely on our ability to: identify markets that are most likely to produce an underwriting profit; operate with a disciplined underwriting approach; offer diversified products and geographic platforms; practice prudent claims management; reserve appropriately for unpaid claims; strive for cost containment through economies of scale where deemed appropriate; and provide services and competitive commissions to our independent agents.
Regulation
We are subject to extensive regulation, particularly at the state level. The method, extent and substance of such regulation varies by state, but generally has its source in statutes and regulations which establish standards and requirements for conducting the business of insurance and that delegate regulatory authority to a state insurance regulatory agency.agencies. Insurance companies can also be subject to so-called “desk drawer rules” of state insurance regulators, which are regulatory rules or best practices that have not been codified or formally adopted through regulatory proceedings. In general, such regulation is intended for the protection of those who purchase or use insurance products issued by our insurance subsidiaries, not the holders of securities issued by us. These ruleslaws and regulations have a significant impact on our business and relate to a wide variety of matters including accounting methods, agent and company licensure, claims procedures, corporate governance, examination,examinations, investing practices, policy forms, pricing, trade practices, reserve adequacy and underwriting standards.
In recent years, the state insurance regulatory framework has come under increased federal scrutiny. Most recently, pursuant to the Dodd-Frank Regulatory Reform Act of 2010, the Federal Insurance Office was formed for the purpose of, among other
things, examining and evaluating the effectiveness of the current insurance and reinsurance regulatory framework. In addition, state legislators and insurance regulators continue to examine the appropriate nature and scope of state insurance regulation.
Many state laws require insurers to file insurance policy forms and/or insurance premium rates and underwriting rules with state insurance regulators. In some states, such rates, forms and/or rules must be approved prior to use. While these requirements vary from state to state, generally speaking, regulators review premium rates to ensure they are not excessive, inadequate or unfairly discriminatory.
As a result, the speed with which an insurer can change prices in response to competition or increased costs depends, in part, on whether the premium rate laws and regulations (i) require prior approval of the premium rates to be charged, (ii) permit the insurer to file and use the forms, rates and rules immediately, subject to further review, or (iii) permit the insurer to immediately use the forms, rates and/or rules and to subsequently file them with the regulator. When a state laws and regulations significantly restricts
restrict both underwriting and pricing, it can become more difficult for an insurer to make adjustments quickly in response to changes which could affect profitability.
Insurance companies are required to report their financial condition and results of operationoperations in accordance with statutory accounting principles prescribed or permitted by state insurance regulators in conjunction withlaws and regulations and the National Association of Insurance Commissioners (the “NAIC”). State insurance regulatorslaws and regulations also prescribe the form and content of statutory financial statements, performrequire the performance of periodic financial examinations of insurers, set minimum reserve and loss ratio requirements, establish standards for the types and amounts of investments insurers may hold and require minimum capital and surplus levels. Such statutory capital and surplusAdditional requirements include risk-based capital (“RBC”) rules, promulgated by the NAIC. These RBC standards arethresholds intended to enable state insurance regulators to assess the level of risk inherent in an insurance company’s business and consider items such as asset risk, credit risk, underwriting risk and other business risks relevant to its operations. In accordance with RBC formulas, a company’s RBC requirements are calculated and compared to its total adjusted capital to determine whether regulatory intervention is warranted. At December 31, 2011,2012, the total adjusted capital of each of our insurance subsidiaries exceeded the minimum levels required under RBC rules.requirements.
It is difficult to predict what specific measures at the state or federal level will be adopted or what effect any such measures would have on us.us or our insurance subsidiaries.
Facilities
Our corporate headquarters is located at 150 Northwest Point Boulevard, Elk Grove Village, Illinois 60007, USA. The facility consists of one office building totaling 176,844 net rentable square feet of office space on 7.2 acres. On May 22, 2012, we closed a transaction related to the sale of the headquarters building in Elk Grove Village to Northwest Point, LLC. The total sales price of the property, which was paid in cash, amounted to $14.0 million, less closing costs and related expenses of approximately $633,000. In connection with the sale, our company also wrote down an accrual of approximately $792,000 held for real-estate taxes. Approximately $830,000 of the sales price was held in escrow for real-estatereal estate taxes.
There is no material relationship between the purchaser of the property and us or any of our affiliates, directors or officers. Cash proceeds from the transaction, net of the funds held in escrow for real-estatereal estate taxes, were approximately $12.4 million and will be used to support plans for future growth. Including the benefit of the real-estatereal estate tax escrow write down, combined cash and non-cash proceeds from the transaction was $13.2 million.
We remain in the building as a tenant, occupying approximately 30,600 square feet for a term of 60 months beginning May 22, 2012, unless terminated or extended pursuant to the lease agreement. We are paying an annual rent equal to approximately $642,000 or approximately $53,000 per month, with a nominal annual escalation beginning on the first anniversary date of the lease agreement. We believe the facility is suitable and adequate for our current business needs.
We also own approximately 50 acres of vacant land in Alabama which was transferred to us from Southern United. It is also currently held for sale.
Upon completion of the Gateway acquisition, we assumed a lease for 12,937 square feet of office space in St. Louis, Missouri which is effective through February 2016. We currently pay a monthly rent equal to approximately $28,000. Some of the expense related to the lease will be shared with the sublessor. Expense related to the lease is included in our pro forma post-acquisition financial exhibits.
Employees
As of the date of this prospectus, we had 106 full-time employees. American Country, and American Service and Gateway together have 7797 full-time employees 70and 1 part-time employee, 74 of whom work at the corporate offices in Elk Grove Village, Illinois, 4 of whom work in New York, 17 of whom work in Missouri and 3 of whom work remotely. Our acquisition of Gateway increased head count by 29, the majority of whom work at Gateway offices in Missouri.
Legal Proceedings
In connection with our operations, we are, from time to time, named as defendants in actions for damages and costs allegedly sustained by the plaintiffs. While it is not possible to estimate the outcome of the various proceedings at this time, such actions have generally been resolved with minimal damages or expense in excess of amounts provided and our company does not believe that it will incur any significant additional loss or expense in connection with such actions.
MANAGEMENT
Executive Officers and Directors
Our directors and executive officers as of the date of this prospectus are as follows: |
| | |
| Name | Age | Position |
| Scott D. Wollney | 4344 | President, Chief Executive Officer and Director |
| Gordon G. Pratt | 5051 | Chairman of the Board |
| Jordan M. Kupinsky | 3940 | Director |
| Larry G. Swets, Jr. | 3738 | Director |
| John T. Fitzgerald | 42 | Director |
| Paul A. Romano | 5052 | Vice President and Chief Financial Officer |
| Bruce W. Giles | 5254 | Vice President, Underwriting |
| Joseph A. Shugrue | 4850 | Vice President, Claims |
| Leslie A. DiMaggio | 4345 | Vice President, Operations |
Scott Wollney
Mr. Wollney has been our President and Chief Executive Officer, and a Director, since December 31, 2010. From July 2009 until that time, Mr. Wollney was President and Chief Executive Officer of KAI, prior to which he was the President and Chief Executive Officer of Lincoln General Insurance Company (a subsidiary of KAI) from May 2008 to March 2009. From January 1998 to May 2008, he was President of Avalon Risk Management, Inc. Mr. Wollney’sWollney's education coupled with his significant and varied experience as an executive manager and director qualifies him for his role with Atlas. He has experience building successful businesses as well as re-organizing challenged companies around a focused strategy to address legacy issues and set them on a path for future success. Mr. Wollney has direct experience and expertise with respect to the numerous disciplines which are critical to insurance business.
Gordon Pratt
Mr. Pratt has been our Chairman of the Board since December 31, 2010. Since March 2004, Mr. Pratt has been a Managing Member of Fund Management Group LLC in Connecticut. From June 2004 to April 2006, he was also the Senior Vice-President, Finance of the Willis Group in New York, prior to which he was the Managing Director of Hales Capital Advisors LLC and the Managing Partner of Distribution Partners Investment Capital L.P. Mr. Pratt has also served as Chairman and Vice Chairman of the boards of directors of NASDAQ listed companies, including United Insurance Holdings Corp. He holds a Master of Management degree from Northwestern University as well as a Bachelor of Arts degree from Cornell University. Mr. Pratt’sPratt's education, background and experience qualify him for his role with Atlas. Mr. Pratt has evaluated financial statements for more than 50 insurance companies and/or their holding company parents. Such evaluations include companies’companies' uses of accounting estimates, accruals and provisions. Mr. Pratt has made investment decisions and offered his opinion to company management teams based upon his evaluations concerning financial statements, which cover a wide range of complexity and accounting issues. Additionally, from his service as a member of certain boards of directors, he has an understanding of internal controls and procedures for financial reporting for insurance companies and/or insurance holding company parents.
Jordan Kupinsky
Mr. Kupinsky has been a Director of Atlas since December 31, 2010. Since 2008, Mr. Kupinsky has been a Managing Director with Windsor Private Capital Inc. and its predecessor JJR Capital Corp. Prior to joining Windsor, he was a Vice President at Greenhill & Co., an independent global investment banking firm, listed on the NYSE, focused on mergers & acquisitions, financial restructuring and merchant banking, from March 2006 to May 2008. Prior to joining Greenhill, Mr. Kupinsky held the positions of Vice President of Corporate Development and General Counsel at Minacs Worldwide Inc., a publicly traded company on the Toronto Stock Exchange from July 2002 to February 2005. Mr. Kupinsky began his career practicing corporate and securities law at Torys LLP in Toronto (from 1997 to 1999) and was also an investment banking associate at Houlihan Lokey Howard & Zukin from 1999 to 2002. He holds a joint MBA and LL.B. degree from the Schulich School of Business and Osgoode Hall Law School at York University. Mr. Kupinsky’sKupinsky's education, background and experience qualify him for his role with Atlas. Mr. Kupinsky has experience in financial statement review with both public and private companies. His direct experience includes securities law, financial analysis and corporate governance.
Larry Swets, Jr.
Mr. Swets has been a Director of Atlas since December 31, 2010. Since June 30, 2010, Mr. Swets has been the CEO of Kingsway Financial Services Inc. one of our shareholders, prior to which he was the Executive VP, Corporate Development of Kingsway Financial Services Inc. since January 2010. From June 2007 through March 2010, Mr. Swets was a director of United Insurance Holdings Corp. From June 2007 through September 2008, Mr. Swets was the CFO, Secretary, Treasurer and Executive Vice-President of FMG Acquisition Corp. He was the Managing Director of Itasca Financial LLC from May 2005 until January 2010. Mr. Swets holds a Chartered Financial Analyst designation from the CFA Institute. He received a Masters of Science degree from De Paul University in 1999 and a Bachelors of Business and Finance degree from Valparaiso University in 1997. Mr. Swets’Swets' education, background and experience qualify him for his role with Atlas. He has extensive experience with both private and public insurance businesses at both the executive management and board levels.
John T. Fitzgerald
Mr. Fitzgerald was appointed a Director of Atlas on May 2, 2013. Mr. Fitzgerald co-founded Argo Management Partners in 2002. In that capacity, he has had extensive transactional and operating experience in Argo's acquired companies which include consumer products manufacturing, marketing and distribution operations. Mr. Fitzgerald is currently Chairman and Chief Development Officer of Hunter MFG, LLP. He has significant experience in the development and implementation of management tools, values, and practices which incorporate lean operations and continuous improvement.
Mr. Fitzgerald also serves as the Chairman of Oak Patch Gifts, LLC and is a member of the Board of Progressive Bronze Products, LLC. Prior to Argo Management Partners, Mr. Fitzgerald was managing director of Adirondack Capital, LLC, a financial futures and derivatives trading firm. He was a seat-owner on the Chicago Board of Trade. Mr. Fitzgerald is an MBA graduate of the Kellogg School of Management, Northwestern University with concentrations in Finance, Accounting, and Management Strategy. He holds a BS, finance, from DePaul University with highest honor, Beta Gamma Sigma.
Paul Romano
Mr. Romano has been our Vice President and Chief Financial Officer since December 31, 2010. From March 2010 until that time, he served as Vice President and Treasurer of KAI, prior to which he was the Vice President, Data Management of Lincoln General Insurance Company from October 2008 to March 2009. From 2002 through 2008, he held various Vice President and Director positions with American Country Insurance Company and its affiliates. Mr. Romano holds a Certified Public Accountant designation in the State of Illinois. He received a Master of Business Administration degree from the Northwestern University Kellogg Graduate School of Management in 1996 and a Bachelor of Science, Accounting, from the University of Illinois in 1984.
Bruce Giles
Mr. Giles has been our Vice President, Underwriting since our December 31, 2010. Mr. Giles was previously Assistant Vice President of Commercial Underwriting for Kingsway America Inc., prior to which he held various positions with Kingsway America Inc. from December 2003 to June 2010. From 1981 to 2003, he held various positions with Allstate Insurance Group, CIGNA and other insurance companies..
Joseph Shugrue
Mr. Shugrue has been our Vice President, Claims since December 31, 2010. Mr. Shugrue previously held various senior management positions with American Service and Kingsway America Inc. beginning in March 2004. Prior to that time, he held positions with other specialized insurance businesses beginning in October 1986.
Leslie DiMaggio
Ms. DiMaggio has been our Vice President, operationsOperations since December 31, 2010. Ms. DiMaggio was previously the Vice President, Information Technology for Kingsway Financial Services Inc. from November 2008 to June 2010, prior to which she was the President, CEO and COO of Southern United Fire Insurance Company from April 2007 to November 2008. From 2000 until 2008, she held various other executive positions at Kingsway America Inc. Prior to that, she worked at other specialty insurance companies.
Corporate Governance Practices and Code of Ethics
Board Leadership Structure and Risk Oversight
Currently, Gordon Pratt serves as the Chairman of the Board and Scott Wollney serves as our President & Chief Executive Officer. The Board recognizes that no single leadership structure is right for all companies and, depending on the circumstances, other leadership structures might be appropriate. The Board believes, however, that the current leadership structure is effective and appropriate, allows for a separation of oversight between management and non-management, provides an experienced Chairman with whom the Chief Executive Officer can discuss issues facing us, and gives a significant voice to non-management directors.
Board Meetings
During the fiscal year ended December 31, 2012, there were 10 meetings of the Board and each director attended at least 75% of all meetings of the Board and the Audit Committee (if he was a member). All of the directors attended the 2012 annual meeting of Shareholders.
Determination of Independence of Nominees for Election
The Board assumes overall responsibility for our direction through its delegation to senior management and through the ongoing function of the Board and its committees, as applicable.Directors
Directors are considered independent if they are not an executive officer or employee of the Company and have no direct or indirect material relationship with us. A “material relationship” is a relationship which, could, in the viewopinion of the Board, be reasonably expected towould interfere with the exercise of independent judgment in carrying out the responsibilities of a director’s independent judgment. In determining whether a material relationship exists, the Board consults with our legal counsel to ensure that its determinations are consistent with relevant securities and other laws, rules and regulations and court decisions.
Further, the Board has adopted corporate governance guidelines that are contained in the National Instrument 58-101 Disclosure of Corporate Governance Practices, (“NI 58-101”), which prescribes certain disclosure of our corporate governance practices, and National Policy 58-201 Corporate Governance Guidelines (“NP 58-201”), which provides non-prescriptive guidelines on corporate governance practices for reporting issuers. The Board believes that good corporate governance improves corporate performance and benefits the shareholders. This discussion addresses our compliance with NI 58-101.director.
There are fourfive directors on the Board, of which twothree are independent directors for purposes of NI 58-101 and NP 58-201.NASDAQ Rule 5605(a)(2). Scott Wollney is not independent as he is a member of our management. Larry Swets is not independent as he is a member of management of Kingsway Financial Services, Inc., a company that may have a material relationship with us.
Orientation and Continuing Education
The Board is committed to having appropriate levels of knowledge among members of the Board relative both to us and our industry. New members to the Board are oriented through direct interaction with the balance of the Board and management and will have visibility to past and current corporate records as well as operating results. Committee chairpersons and other members of the Board maintain subject matter expertise through activities relating both to us and other educational resources.
Compensation
The Compensation Committee is responsible for making recommendations to the Board in respect of director and executive officer remuneration matters, with the overall objective of ensuring maximum shareholder benefit from the retention of high quality board and executive team members. For details on the compensation of the Chief Executive Officer, Chief Financial Officer and Directors, please see the section below entitled “Executive Compensation”.
Assessments
The Board, through its Corporate Governance and Nominating Committee, regularly assesses the overall performance of the Board, the committees, and the individual directors through a combination of formal and informal means.
Section 16(a) Beneficial Ownership Reporting Compliance
Section 16(a) requires our officers and directors, and persons who own more than ten percent of a registered class of our equity securities, to file reports of ownership and changes in ownership with the Securities and Exchange Commission. Officers, directors and greater-than-ten-percent shareholders are required by SEC regulation to furnish us with copies of all Section 16(a) forms they file. To date, none of our directors, officers and greater-than-ten-percent shareholders have filed reports in connection with Section 16(a).
Committees of the Board
The Board has three standing committees to assist it in carrying out its duties. The standing committees are:committees: (i) Audit Committee; (ii) Compensation Committee; and (iii) Corporate Governance and Nominating Committee.
(i) Audit Committee
The Audit Committee is elected annually at the first meeting of the Board held after our annual meeting of shareholders. During the fiscal year ended December 31, 2012, the Audit Committee met 8 times. In addition, the Audit Committee meets quarterly with our external auditors.
The Audit Committee is comprised of Jordan Kupinsky (Chairman), Gordon Pratt and Larry Swets. Except for Mr. Swets, eachJohn Fitzgerald. Each member of the Audit Committee is independent. We follow the independence standards set forth in Multilateral Instrument 52-110 Audit Committees (“MI52-110”). We are currently in compliance with the “independent director” requirementsindependent under NASDAQ Rule 5605(c)5605(a)(2) and Rule 10A-3 of the Exchange Act pursuant to the exception in NASDAQ Rule 5615(b)(1) and Rule 10A-3(b)(1) of the Exchange Act which allows companies that are conducting an initial public offering and have an Audit Committee comprised of a majority of independent directors to have a one year phase-in period to comply with the “independent director” requirements.
The Board has determined that Mr. Kupinsky and Mr. Pratt, because of their accounting and financial management expertise discussed above, are both considered an “audit committee financial expert” as that term is defined under the Exchange Act and, accordingly, that at least one audit committee financial expert is serving on the Corporation’s audit committee. MI 52-110 provides that an individual is “financially literate” if he or she has the ability to read and understand a set of financial statements that present a breadth and level of complexity of accounting issues that are generally comparable to the breadth and complexity of the issues that can reasonably be expected to be raised by the Corporation’s financial statements. All of the members of the audit committee are financial iterate as that term is defined.
The Audit Committee assists the board of directors in fulfilling its oversight responsibilities. The principal responsibilities of the Audit Committee include: (i) performing our external audit function including the qualifications, independence, appointment and oversight of the work of the external auditors; (ii) ensuring that we meet our accounting and financial reporting requirements and that we report our financial information to the public; (iii) making certain that we are in compliance with all legal and regulatory requirements relating to our oversight responsibilities; (iv) drafting our risk management policies; and (v) overseeing our system of internal controls and management’s information systems.
NASDAQ Compliance
We also intend to comply with NASDAQ independence and other compliance requirements. Specifically, we intend to have a majority independent board of directors, an audit committee, compensation commitee and nominating committee consisting solely of independent directors and an independent audit committee chaired by an audit committee financial expert. Further, we intend to establish a formal director nomination process and we certify that the independent directors will have regularly scheduled executive sessions in which only they are present.
Relevant Education and Experience
Mr. Kupinsky has been actively involved in our Board as an independent director and member of the Audit Committee since the date of formation of the capital pool company. Prior to the reverse merger, Mr. Kupinsky has considerable experience in corporate finance, mergers and acquisitions, financial restructuring and merchant banking. Mr. Kupinsky has experience in financial statement review with both public and private companies. Mr. Kupinsky holds a Masters of Business Administration degree and a JD from the Schulich School of Business and Osgoode Hall Law School.
Mr. Pratt has more than 25 years experience in insurance company financial statement analysis and assessment. He holds a Master of Management degree in Finance from Northwestern’s Kellogg School of Management. His experience includes service as a director of eight insurance companies and/or such insurance companies’ holding company parents, including service as chairman or vice chairman of the board of directors of two publicly-traded insurance companies and/or such insurance companies’ holding company parents, and service as a member of the Audit Committee for one insurance company’s holding company parent. Mr. Pratt had specialized training in insurance company statutory and GAAP accounting while serving as an officer of The Chase Manhattan Bank, N.A. As a partner in four private equity funds focused on investment in insurance companies and insurance-related businesses, Mr. Pratt has evaluated financial statements for more than 50 insurance companies and/or their holding company parents, including such companies’ use of accounting estimates, accruals, and
provisions. He has made investment decisions and offered his opinion to company managements as a result of his evaluation concerning such financial statements, which covered a wide range of complexity and accounting issues. From his service as a member of certain boards of directors, he has an understanding of internal controls and procedures for financial reporting for insurance companies and/or insurance holding company parents.
Mr. Swets holds a Chartered Financial Analyst designation from the CFA Institute. He received a Masters of Science degree from De Paul University in 1999 and a Bachelors of Business and Finance degree from Valparaiso University in 1997. He has served as executive officer and director of public and private companies.
Audit Committee Oversight
At no time since the commencement of our most recently completed financial year was a recommendation of the Audit Committee to nominate or compensate an external auditor not adopted by the Board.
(ii) Compensation Committee
Act. The Compensation Committee is comprised of Larry Swets, Jr.Jordan Kupinsky (Chairman), Jordan KupinskyJohn Fitzgerlad and Gordon Pratt. Except for Mr. Swets, each member of the Compensation Committee is independent. We are currently in compliance with the “independent director” requirements under the NASDAQ rules pursuant to NASDAQ Rule 5615(b)(1) which allows companies that are conducting an initial public offering and have a Compensation Committee comprised of a majority of independent directors to have a one year phase-in period to comply with the “independent director” requirements. The Compensation Committee met one time during the fiscal year ended December 31, 2012.
The Compensation Committee oversees our remuneration policies and practices. The principal responsibilities of the Compensation Committee include: (i) considering our overall remuneration strategy and, where information is available, verifying the appropriateness of existing remuneration levels using external sources for comparison; (ii) comparing the nature and amount of our directors’ and executive officers’ compensation to performance against goals set for the year while considering relevant comparative information, independent expert advice and our financial position; and (iii) making recommendations to the Board in respect of director and executive officer remuneration matters, with the overall objective of ensuring maximum shareholder benefit from the retention of high quality board and executive team members.
The Compensation Committee reviewed executive compensation with management in the course of the 2012 budgeting process. Authority was extended to management within the approved budget for compensation. Neither we nor the Board engaged a compensation consultant in the years ended December 31, 2011 or 2012.
(iii) Corporate Governance and Nominating Committee
The Corporate Governance and Nominating Committee is comprised of John Fitzgerald and Jordan Kupinsky (Chairman), Larry Swets and Scott Wollney. Jordan Kupinsky is considered the only independent memberKupinsky. All members of the Corporate GovernanceCompensation Committee and Nominating Committee. We are currently in compliance with the “independent director” requirements under the NASDAQ rules pursuant to NASDAQ Rule 5615(b)(1) which allows companies that are conducting an initial public offering and have a Nominating Committee comprised of at least one independent director to have a ninety day phase-in period to ensure that the Nominating Committee has a majority of independent directors and a one year phase-in period to comply with the “independent director” requirements. The Corporate Governance and Nominating Committee met one time during the fiscal year ended December 31, 2011.
The Corporate Governance and Nominating Committee oversees our approach to corporate governance matters. The principal responsibilities of the Corporate Governance and Nominating Committee include: (i) monitoring and overseeing the quality and effectiveness of our corporate governance practices and policies; (ii) considering nominees for ourare independent directors; (iii) adopting and implementing corporate communications policies and ensuring the effectiveness and integrity of communication and reporting to our shareholders and the public generally; (iv) planning for the succession of our directors and executive officers, including appointing, training and monitoring senior management to ensure that the board and management have appropriate skill and experience; and (v) administering the Board’s relationship with our management.
Our company receives suggestions for potential director nominees from many sources, including members of the Board, advisors, and Shareholders. Any such nominations, together with appropriate biographical information, should be submitted to us in accordance with our policies governing submissions of nominees discussed below. Any candidates submitted by a Shareholder or Shareholder group are reviewed and considered in the same manner as all other candidates. Qualifications for consideration as a board nominee may vary according to the particular areas of expertise being sought as a complement to the
existing board composition. However, qualifications include high level leadership experience in business activities, breadth of knowledge about issues affecting us, experience on other boards of directors, preferably public company boards, and time available for meetings and consultation on Corporation matters. The Corporate Governance and Nominating Committee seeks a diverse group of candidates who possess the background, skills and expertise to make a significant contribution to the Board, to us and our Shareholders, though our company does not have a formal policy with regard to the consideration of diversity in identifying director nominees. The independent directors, in addition to any other board members as may be desirable, evaluate potential nominees, whether proposed by Shareholders or otherwise, by reviewing their qualifications, reviewing results of personal and reference interviews and reviewing such other information as may be deemed relevant.
Candidates whose evaluations are favorable are then recommended by the Corporate Governance and Nominating Committee for selection by the full Board. The Board then selects and recommends candidates for nomination as directors for shareholders to consider and vote upon at the annual meeting. In general, our company does not employ executive search firms, or pay a fee to any third party, to locate qualified candidates for director positions.
Code of Business Conduct and Ethics
Our company has a Code of Business Conduct and Ethics that applies to all of our employees, officers and directors. The Code of Ethics is designed to promote honest and ethical conduct, full, fair, accurate, timely and understandable disclosure of financial information in the public filings and our communications and compliance with applicable laws, rules and regulations. The Code of Business Conduct and Ethics is posted on our website at www.atlas-fin.com, under “Investor Relations” and a written copy is available to Shareholders upon written request to us, to the attention of Scott Wollney. Information contained on our website, www.atlas-fin.com, is not deemed part of, nor is it incorporated by reference into, this registration statement.NASDAQ Rule 5605(a)(2).
Limitation on Liability and Indemnification of Officers and Directors
Cayman Islands law does not limit the extent to which a company’scompany's articles of association may provide for indemnification of officers and directors, except to the extent any such provision may be held by the Cayman Islands courts to be contrary to public policy, such as a provision purporting to provide indemnification against civil fraud or the consequences of committing a crime.
Our memorandum and articles of association permit indemnification of officers and directors against all actions, proceedings, costs, charges, expenses, losses, damages or liabilities incurred or sustained in their capacities as such unless such losses or damages arise from breach of trust, breach of duty, dishonesty, fraud or willful default of such directors or officers.
Atlas provides additional indemnification for our directors and senior executive officers separate from that provided in our memorandum and articles of association. These agreements, among other things, require us to indemnify such persons for certain expenses, including attorneys’attorneys' fees, judgments, penalties fines and settlement amounts actually and reasonably incurred by such person in any action or proceeding arising out of their services as one of our directors or executive officers, or any of our subsidiaries or any other company or enterprise to which the person provides services at our request, including liability arising out of negligence or active or passive wrongdoing by the officer or director.
Our company also maintains a directors and officers liability insurance policy for our directors and officers.
Insofar as indemnification for liabilities arising under the Securities Act may be permitted with respect to our directors or officers or persons controlling us under the foregoing provisions, our company has been informed that in the opinion of the SEC such indemnification is against public policy as expressed in the Securities Act and is therefore unenforceable as a matter of United States law.
EXECUTIVE COMPENSATION
Compensation for executives is reviewed annually by the Compensation Committee of the Board. Current compensation was set based on the following criteria: (i) our size and scale; (ii) nature of our strategic objectives; and (iii) each executive’s role and responsibility. Industry data (such as surveys compiled by Towers Watson for the property & casualty insurance industry) as well as the potential for incentive compensation is also taken into consideration in the regular evaluation of base salary.
Employment agreements were executed with our executives in 2011 with an initial effective term of January 1, 2011 through December 31, 2013. These agreements provide for compensation based on a combination of base salary and incentive compensation. Incentive compensation for 2011 and 2012 was based primarily on our achieving certain financial and
operational objectives, such as the successful expansion into new states and the establishment of significant new agent relationships (”cornerstone agents”). Amounts paid in 2011 and 2012 are shown in the Summary Compensation Table under the heading “Bonus.” Incentive compensation in subsequent years will be based on a combination of financial results and the achievement of strategic objectives, as determined by the Compensation Committee of the Board. Under the current plan, incentive compensation can be paid in an amount up to 75% of the executive’s base salary. Final determination of incentive compensation is subject to approval by the Board. See also “Employment Agreements with Named Executive Officers” below.
Subject to the terms and conditions of our stock option plan, the Compensation Committee of the Board is responsible for granting option-based awards to executive officers as an incentive. In determining appropriate grants, the Compensation Committee considers contributions to our operating results as well as expectations relative to near and longer term strategic goals and objectives in support of profitable growth.
The maximum number of ordinary shares reserved for issuance under the stock option plan together with all other security based plans is equal to 10% of issued and outstanding ordinary shares at the date of grant. The exercise price of options granted under the plan cannot be less than the volume weighted average trading price of Atlas’ ordinary shares for the five preceding trading days. Options generally vest over a three year period and expire ten years from grant date.
On January 18, 2011, Atlas granted options to purchase 123,250 ordinary shares of Atlas stock to officers and directors at an exercise price of C$6.00 per share. The options vest 25% at date of grant and 25% on each of the next three anniversary dates and expire on January 18, 2021.
The following table sets forth the securities of the Corporation that are authorized for issuance under the Corporation's equity compensation plans as at the end of the most recently completed financial year, December 31, 2012.
|
| | | |
| Plan Category | Number of securities to be issued upon exercise of outstanding Options, warrants and rights | Weighted-average exercise price of outstanding Options ($) | Number of securities remaining available for future issuance under equity compensation plans |
| Equity compensation plans approved by securityholders | 123,250 Ordinary Shares(1) | $6.00 | 102,442 (3) |
| Equity compensation plans not approved by securityholders | 10,700 Ordinary Shares(2) | $3.00 | Nil |
| Total | 133,950 Ordinary Shares | $5.76 | 102,442 (3) |
Notes:
(1)Issued pursuant to the Stock Option Plan on January 18, 2011.
(2)Issued pursuant to stock option agreements on March 18, 2010, prior to implementation of the Stock Option Plan.
| |
| (3) | Equal to the maximum number of securities remaining issuable under according to the 2011 Stock Option Plan (10% of issued and outstanding ordinary shares as of December 31, 2012) |
On January 11, 2013, Atlas granted options to purchase 91,667 ordinary shares under the Company’s stock option plan, all of which were granted to the Company’s officers. The granted options have an exercise price of C$6.45 and vest equally on the first, second and third anniversary of the grant date. The options expire on January 11, 2023.
In the second quarter of 2013, a new Equity Incentive Plan was approved by Shareholders at the Annual General Meeting. Atlas will cease to grant new stock options under the existing Stock Option Plan. The Equity Incentive Plan is a new securities based compensation plan, pursuant to which Atlas may issue restricted shares, restricted units, stock options and other forms of equity incentives to eligible persons as part of their compensation. The Equity Incentive Plan is considered an amendment and restatement of the Stock Option Plan, although outstanding stock options issued pursuant to the Stock Option Plan will continue to be governed by the terms of the Stock Option Plan.
Under the Equity Incentive Plan, a director who either directly or indirectly purchases up to $100,000 of Atlas stock, including on the open market, warrant exercise, or through the employee stock purchase plan (see note 13) will receive a 3 to 1 matching grant of restricted stock (or for Canadian taxpayers, restricted stock units) based on the aggregate purchase price of shares he or she purchases during the six-month period beginning on June 18, 2013 and ending on December 31, 2013 (the “Purchase Period”). The matching grant will be made as soon as administratively possible after the end of the Purchase Period (the “Grant Date”). The number of shares that will be issued on the Grant Date will be determined by dividing (A) the dollar amount of the Company matching contribution due based on purchases during the Purchase Period by (B) the closing share price of one share of Company common stock at close of market on June 17, 2013 (the “Closing Price”). The restricted stock will vest 20% on each anniversary of the Grant Date, subject to the terms of the Guidelines. The matching grant will subject to all of the terms and conditions of the Equity Incentive Plan and applicable grant agreements.
In connection with completion of the offering of our ordinary shares in February 2013, the Compensation Committee of the Board expects to undertakeperformed a review of our executive and director compensation, including our stock option plan. This review will include,included, among other considerations, comparisons to industry data, including the executive and director compensation programs of other publicly traded property and casualty insurance companies. We expect that following the closing of the offering,As a result, our executive compensation and director compensation will bewas increased to bring us in line with other public companies in our industry. These changes may also include changes to our stock option plan for directors and officers.included the aforementioned Equity Incentive Plan.
Summary Compensation Table
The following table sets forth information concerning the total compensation for the years ended December 31, 2012, December 31, 2011 and December 31, 2010 earned by the Chief Executive Officer, the Chief Financial Officer and our two highest paid executive officers whose total compensation exceeded $100,000, if any (collectively, the “Named Executive Officers”) and our directors. |
| | | | | | | | | | | | | | | | | | | |
| Name and Principal Position | Year | Salary (US$) | Bonus (US$) | Option Awards ($)(1) | Non-Equity Incentive Plan Compensation ($) | Nonqualified Deferred Compensation Earnings | All Other Compensation (US$)(4) | Total Compensation ($) |
Scott Wollney(2) Chief Executive Officer and Director | 2012 | $ | 275,000 |
| $ | 110,000 |
| — |
| — |
| — |
| $ | 9,000 |
| $ | 394,000 |
|
| 2011 | 275,000 |
| — |
| 30,900 |
| — |
| — |
| 8,654 |
| 314,554 |
|
| 2010 | — |
| — |
| — |
| — |
| — |
| — |
| N/A |
|
Paul A. Romano(2) Vice-President and Chief Financial Officer | 2012 | $ | 175,000 |
| $ | 70,000 |
| — |
| — |
| — |
| $ | 7,200 |
| $ | 252,200 |
|
| 2011 | 175,000 |
| — |
| 30,900 |
| — |
| — |
| 6,646 |
| 212,546 |
|
| 2010 | — |
| — |
| — |
| — |
| — |
| — |
| N/A |
|
Leslie DiMaggio(3) VP Operations | 2012 | $ | 175,000 |
| $ | 70,000 |
| — |
| — |
| — |
| — |
| $ | 245,000 |
|
| 2011 | 175,000 |
| — |
| 30,900 |
| — |
| — |
| — |
| 205,900 |
|
| 2010 | — |
| — |
| — |
| — |
| — |
| — |
| N/A |
|
Joseph Shugrue(3) VP Claims | 2012 | $ | 175,000 |
| $ | 70,000 |
| — |
| — |
| — |
| — |
| 245,000 |
|
| 2011 | 175,000 |
| — |
| 30,900 |
| — |
| — |
| — |
| 205,900 |
|
| 2010 | — |
| — |
| — |
| — |
| — |
| — |
| N/A |
|
|
| | | | | | | | | | | | | | | | | | | |
| Name and Principal Position | Year | Salary (US$) | Bonus (US$) | Option Awards ($)(1) | Non-Equity Incentive Plan Compensation ($) | Nonqualified Deferred Compensation Earnings | All Other Compensation (US$)(3) | Total Compensation ($) |
Scott Wollney Chief Executive Officer and Director | 2012 | $ | 275,000 |
| $ | 110,000 |
| — |
| — |
| — |
| $ | 15,452 |
| $ | 400,452 |
|
| 2011 | 275,000 |
| — |
| 30,900 |
| — |
| — |
| 14,129 |
| 320,029 |
|
Paul A. Romano Vice-President and Chief Financial Officer | 2012 | $ | 175,000 |
| $ | 70,000 |
| — |
| — |
| — |
| $ | 13,594 |
| $ | 258,594 |
|
| 2011 | 175,000 |
| — |
| 30,900 |
| — |
| — |
| 11,783 |
| 217,683 |
|
Leslie DiMaggio(2) VP Operations | 2012 | $ | 175,000 |
| $ | 70,000 |
| — |
| — |
| — |
| 5,788 |
| $ | 250,788 |
|
| 2011 | 175,000 |
| — |
| 30,900 |
| — |
| — |
| 4,901 |
| 210,801 |
|
Notes:
|
| | |
| (1) | The amounts shown in this column are valued based on the aggregate grant date fair value computed in accordance Financial Accounting Standards Board Accounting Standards Codification Topic 718, Compensation-Stock Compensation.
Black-Scholes option pricing model was used to estimate the fair value of the 2011 option awards using the following assumptions - risk-free interest rate of 2.27% to 3.13%; dividend yield of 0.0%; expected volatility of 100%; and expected life of 6 to 9 years. Each of the individuals noted in the above Summary Compensation Table received an option to purchase 25,000 ordinary shares during the year ended December 31, 2011, at an exercise price of C$6.00 per ordinary share and expiring January 18, 2021. |
(2)(2 | Scott Wollney and Paul Romano became our Chief Executive Officer and our Chief Financial Officer, respectively, effective at 11:59 p.m. on December 31, 2010, upon the closing of the reverse merger under TSXV Policy 2.4. Pursuant to the reverse merger, American Country and American Service, together with their holding company American Acquisition, merged with and into our wholly-owned subsidiary. For the year ended December 31, 2010, Messrs Wollney and Romano did not receive any compensation from us; however, they did receive compensation from Kingsway Financial Services, Inc., the former parent of American Acquisition, American Country and American Service, for services provided to Kingsway Financial Services Inc. and its subsidiaries in various capacities including but not limited to their capacities as officers of American Acquisition, American Country and American Service. No compensation was paid directly by American Acquisition, American Country or American Service to Messrs. Wollney and Romano. |
(3)) | Leslie DiMaggio and Joseph Shugrue werewas appointed as VP Operations and VP Claims of our insurance subsidiaries respectively on December 31, 2010. |
(4)(3 | ) | Includes company contributions to 401(k), employee stock purchase plan and annual car allowance. |
Employment Agreements with Named Executive Officers
Concurrently with the completion of the Reverse merger, we entered into employment agreements with each of Scott Wollney, Paul Romano, Joseph Shugrue, and Leslie DiMaggio. The key terms of such employment agreements include: |
| |
| (a) | employment being “at-will” and, subject to the severance and post-termination obligations described below, the employment agreement being terminable by either party at any time; |
| (b) | an annual base salary as set out in the table under the heading “Summary Compensation Table”; |
| (c) | the executive being entitled to participate in such employee benefit plans as we shall approve including, retirement plans, paid vacation and sick days/paid time off, disability plans, our stock option plan, or such other plans as may be offered from time to time; and |
| (d) | severance payments and post-termination obligations as further described below under “Termination and Change of Control Benefits”. |
Stock Option Plans
On January 3, 2011, we adopted a 10% rolling stock option plan in order to advance our interests by providing certain “Eligible Persons” (any Employee, Officer, Director, or Consultant who is approved for participation in the Plan by the Compensation Committee) with incentives. In accordance with TSXV Policy 4.4 - Incentive Stock Options, rolling option plans must receive shareholder approval annually at our annual meeting.
The stock option plan provides for the granting of options to purchase ordinary shares to Eligible Persons. Options may be granted at the discretion of the Compensation Committee in such number that may be determined at the time of grant, subject to the limits set out in the stock option plan. The number of ordinary shares issuable under the stock option plan is not more than 10% of the number of ordinary shares that are issued and outstanding as of the date of the grant of an option. Any increase in the issued and outstanding ordinary shares will result in an increase in the available number of ordinary shares issuable under the stock option plan, and any exercises of options or expirations or terminations of options will make new grants available under the stock option plan.
The exercise price of all options is established by the Compensation Committee at the time of grant, provided that the exercise price shall not be less than the market price of the ordinary shares on the date of grant. Under the stock option plan, market price is equal to the volume weighted average trading price of the ordinary shares on the TSXVNASDAQ (the principal stock exchange on which the ordinary shares are then listed for trading) for the five trading days immediately preceding the date on which the option is granted. The expiry of options is also established by the Compensation Committee at the time of the grant, provided that the options have a maximum term of ten years. The Compensation Committee may determine when any option will become exercisable and may determine that the Option will be exercisable in installments or pursuant to a vesting schedule.
As of the date of this prospectus, we had 225,617 outstanding options, at an average exercise price of C$6.04 per ordinary share.
On January 11, 2013, Atlas granted options to purchase 91,667 ordinary shares under the Company’s stock option plan, all of which were granted to the Company’s officers. The granted options have an exercise price of C$6.45 and vest equally on the first, second and third anniversary of the grant date. The options expire on January 11, 2023.
Equity Incentive Plan
In the second quarter of 2013, a new Equity Incentive Plan was approved by Shareholders at the Annual General Meeting. Atlas will cease to grant new stock options under the existing Stock Option Plan, discussed above. The Equity Incentive Plan is a new securities based compensation plan, pursuant to which Atlas may issue restricted shares, restricted units, stock options and other forms of equity incentives to eligible persons as part of their compensation. The Equity Incentive Plan is considered an amendment and restatement of the Stock Option Plan, although outstanding stock options issued pursuant to the Stock Option Plan will continue to be governed by the terms of the Stock Option Plan.
Under the Equity Incentive Plan, a director who either directly or indirectly purchases up to $100,000 of Atlas stock on the open market or through the employee stock purchase plan (see note 13) will receive a 3 to 1 matching grant of restricted stock (or for Canadian taxpayers, restricted stock units) based on the aggregate purchase price of shares he or she purchases during the six-month period beginning on June 18, 2013 and ending on December 31, 2013 (the “Purchase Period”). The matching grant will be made as soon as administratively possible after the end of the Purchase Period (the “Grant Date”). The number of shares that will be issued on the Grant Date will be determined by dividing (A) the dollar amount of the Company matching contribution due
based on purchases during the Purchase Period by (B) the closing share price of one share of Company common stock at close of market on June 17, 2013 (the “Closing Price”). The restricted stock will vest 20% on each anniversary of the Grant Date, subject to the terms of the Guidelines. The matching grant will subject to all of the terms and conditions of the Equity Incentive Plan and applicable grant agreements.
Outstanding Equity Awards at 2012 Fiscal Year End
The following table sets forth all equity awards held by the Named Executive Officers that were outstanding at the end of the most recently completed fiscal year.
| | Outstanding Equity Awards as at December 31, 2012 | | Name | Number of Securities Underlying Unexercised Options (#) Exercisable (1) | Number of Securities Underlying Unexercised Options (#) Unexercisable | Option Exercise Price ($) | Option Expiration Date | Number of Securities Underlying Unexercised Options (#) Exercisable (1) | Number of Securities Underlying Unexercised Options (#) Unexercisable | Option Exercise Price ($) | Option Expiration Date |
Scott Wollney Chief Executive Officer and Director | 4,167 | C$6.00 | January 18, 2021 | 4,167 | C$6.00 | January 18, 2021 |
Paul A. Romano Vice-President and Chief Financial Officer | 4,167 | C$6.00 | January 18, 2021 | 4,167 | C$6.00 | January 18, 2021 |
Leslie DiMaggio VP Operations | 4,167 | C$6.00 | January 18, 2021 | 4,167 | C$6.00 | January 18, 2021 |
Joseph Shugrue VP Claims | 4,167 | C$6.00 | January 18, 2021 | |
| |
| (1) | These options were granted on January 18, 2011 and 25% of the ordinary shares subject to the option vested on the date of grant and the remaining 75% of the ordinary shares subject to the option vest in 25% increments on each of the first through third anniversaries of the date of grant. |
Pension Plan Benefits
Our company does not currently maintain any pension or retirement plans that provide for payments or benefits at, following, or in connection with retirement.
Termination and Change of Control Benefits
We are party to employment agreements with the Named Executive Officers pursuant to which, if we terminate the executive without Cause (as defined in the employment agreement), or the executive’s employment is terminated in connection with a Change of Control (as defined in the employment agreement), the executive will be entitled to certain payments and benefits as set out below.
|
| | | |
| If terminated without Cause: | Continuation of base salary for: (1) | Lump-sum Payment equal to: | Continuation of employee health benefits covered under COBRA for: (1) (2) |
| During Year 1 | 24 months | 100% of base salary | 24 months |
| During Year 2 | 24 months | 50% of base salary | 12 months |
| During Year 3 | 12 months | Most recently awarded bonus | 12 months |
Notes:
|
| |
| (1) | The continuation of base salary and COBRA benefits will cease on the first of the month immediately following the date on which the executive becomes employed by a subsequent employer. |
| (2) | Continuation coverage will continue for the period set forth in this column, or the maximum period of time allowed by law, if shorter. |
If, after a Change of Control (as defined in the employment agreement), the executive maintains employment with us (or our successor) for at least 180 days, the executive may terminate his employment at will and will be entitled to certain severance payments and post-termination benefits. Such payments and benefits shall be determined based upon the length of such
executives employment and shall mirror the payments and benefits that would have been in effect had we terminated the executive’s employment without cause on such date.
2012 Director Compensation
During the fiscal year ended December 31, 2012, we paid cash compensation for services rendered to the non-employee members of our Board, and we reimburse the out-of-pocket expenses of our directors incurred in connection with attendance at or participation in meetings of the Board. The compensation of our Board was set based on the following criteria: (i) our size and scale; (ii) our perceived risk factors; and (iii) each member’s role and responsibility.
The following table shows the compensation paid to directors for the most recently completed fiscal year. Named Executive Officers, who also act as our directors, do not receive any additional compensation for services rendered in such capacity, other than as paid by us to such officers in their capacity as officers. See “Summary Compensation Table” for information regarding the compensation paid to our Named Executive Officers. John Fitzgerald became a director in 2013 so did not receive compensation in 2012.
|
| | | | | | | |
| Name | Fees Earned or Paid in Cash($) | Share-Based Awards($) | Non-Equity Incentive Plan Compensation ($) | All Other Compensation ($) | Total Compensation ($) |
Jordan Kupinsky(1) | $50,000 | Nil | Nil | Nil | $ | 50,000 |
|
Gordon Pratt(2) | $60,000 | Nil | Nil | Nil | $ | 60,000 |
|
Larry Swets, Jr. (2) | $40,000 | Nil | Nil | Nil | $ | 40,000 |
|
Notes:
|
| |
| (1) | As of December 31, 2012, Mr. Kupinsky had an aggregate of 37,895 option awards outstanding and 0 share awards outstanding. |
| (2) | As of December 31, 2012, each of Mr. Pratt and Mr. Swets had an aggregate of 27,195 option awards outstanding and 0 share awards outstanding. |
BENEFICIAL OWNERSHIP OF ORDINARY SHARES AND SELLING SHAREHOLDER
The following table sets forth information concerning the beneficial ownership of the ordinary common shares and restricted voting common shares held as of the date of this prospectus by (i) each person known to us to own beneficially more than 5% of the total issued and outstanding ordinary shares or(including restricted voting common shares,shares), (ii) each of our directors, (iii) each of the executive officers, (iv) all directors and executive officers as a group, and (v) the selling shareholder.
Each of the warrants and options included in this beneficial ownership table are exercisable within 60 days of the date of this prospectus. Each of the warrants and options included in this table are also reflective of the one-for-three reverse stock split.
| | | Name and Address of Beneficial Owner | Amount of Ordinary Shares Owned (1)(2)(8) | Amount of Restricted Voting Shares Owned (1)(8) | Percentage of Class of Shares | Percentage of Total Outstanding Common Shares | Amount of Ordinary Shares Owned (1)(2) | Amount of Restricted Voting Shares Owned (1) | Percentage of Class of Shares | Percentage of Total Outstanding Common Shares |
5% Beneficial Owners | Magnolia Capital Partners, LLC 15 East 5th Street, Suite 3200 Tulsa, OK 74103 (6) | | 1,000,573 |
| — | 14.35% | 8.80% |
| David Capital Partners, LLC 737 N Michigan Ave. Chicago IL 60611 | | 763,011 |
| | 10.67% | 9.07% |
| Perritt Capital Management, Inc. 300 South Wacker Drive, Suite 2880 Chicago IL 60606 | | 518,500 |
| | 7.44% | 6.30% |
Atlas Investors LLC (3) Four Forest Park Farmington, CT 06032 | 776,698 |
| — | 29.29% | 11.87% | 437,046 |
| — | 6.25% | 5.30% |
Kingsway America Inc. 150 Pierce Road, 6th Floor Itasca, Illinois 60143 (5) | — | 3,887,469 |
| 100.00% | 63.27% | — | 1,262,471 |
| 100.00% | 63.27% |
Magnolia Capital Partners, LLC 15 East 5th Street, Suite 3200 Tulsa, OK 74103 (6) | 540,574 |
| — | 23.95% | 8.79% | |
Officers and Directors | | Scott Wollney | 320,353 |
| — | 13.41% | 5.08% | 328,074 |
| — | 4.60% | 3.91% |
| Jordan Kupinsky | 61,297 |
| — | 2.96% | * | 68,096 |
| — | 1.14% | * |
Gordon Pratt (4) | 776,698 |
| — | 29.47% | 11.87% | 437,046 |
| — | 6.25% | 5.30% |
| Larry Swets, Jr. | 13,597 |
| — | * | * | 20,396 |
| — | * | * |
| John T. Fitzgerald | | 11,316 |
| — | * | * |
| Paul Romano | 72,989 |
| — | 3.36% | 1.18% | 78,630 |
| — | 1.12% | * |
| Joseph Shugrue | 88,584 |
| — | 4.02% | 1.43% | |
| Bruce Giles | 72,429 |
| — | 3.34% | 1.17% | |
| Leslie DiMaggio | 82,675 |
| — | 3.77% | 1.34% | 86,704 |
| — | 1.24% | 1.24% |
All Directors and Executive Officers as a Group (8 individuals) (7) | 1,488,622 |
| — | 61.23% | 23.28% | |
All Directors and Executive Officers as a Group (9 individuals) (7) | | 1,030,262 |
| — | 17.18% | 14.57% |
* -- Less than 1% of the outstanding ordinary shares
Notes:
|
| |
| (1) | As of the date of this registration statement, there were 2,256,9216,970,850 Ordinary Shares and 3,887,4691,262,471 Restricted Voting Shares outstanding. Included in the shares above are the following convertible securities, exercisable within 60 days of the date hereof, that are deemed to be beneficially owned by the persons holding them for the purpose of computing that person’s percentage ownership: Scott Wollney holds 157,015 warrants and 6,250 options; Jordan Kupinsky holds 31,096 options; Gordon Pratt (managed through Atlas Investors LLC, see (3) below) holds 381,550 warrants and 20,396 options; Larry Swets, Jr. holds 20,396 options; Paul Romano holds 33,767 warrants and 6,250 options; Joseph Shugrue holds 42,209 warrants and 6,250 options; Bruce Giles holds 33,767 warrants and 6,250 options; and Leslie DiMaggio holds 38,832 warrants and 6,250 options. John Fitzgerald does not hold any warrants or options. David Capital holds 192,000 warrants. These shares are not treated as outstanding for the purpose of computing the percentage beneficial ownership of any other person.
|
|
| |
| (2) | Under Rule 13d-3, a beneficial owner of a security includes any person who, directly or indirectly, through any contract, arrangement, understanding, relationship, or otherwise has or shares: (i) voting power, which includes the power to vote, or to direct the voting of shares; and (ii) investment power, which includes the power to dispose or direct the disposition of shares. Certain shares may be deemed to be beneficially owned by more than one person (if, for example, persons share the power to vote or the power to dispose of the shares). In addition, shares are deemed to be beneficially owned by a person if the person has the right to acquire the shares (for example, upon exercise of a vested option) within 60 days of the date as of which the information is provided. In computing the percentage ownership of any person, the amount of shares outstanding is deemed to include the amount of shares beneficially owned by such person (and only such person) by reason of these acquisition rights. As a result, the percentage of outstanding shares of any person as shown in this table does not necessarily reflect the person’s actual ownership or voting power with respect to the number of Ordinary Shares outstanding on the Record Date.
|
| (3) | Managed by Gordon Pratt, Managing Member, who is our director. |
| (4) | Held through Atlas Investors LLC, of which he is a Managing Member. |
| (5) | Includes 525,981 shares held by Mendota Insurance Company, a 100%and 627,122 held by Universal Casualty Company, both of which are direct or indirect wholly owned subsidiarysubsidiaries of Kingsway America Inc. |
| (6) | Messrs. James Adelson and Stephen Heyman exercise control and direction over 540,574 ordinary shares (which includes 34 shares of Atlas held prior to the October 2, 2012 share purchase agreement). |
| (7) | The aggregate number of shares held by the officers and directors as a group and the corresponding percentage ownership of the officers and directors as a group include convertible securities that are exercisable within 60 days of the date hereof, that are deemed to be beneficially owned by the persons holding them.
|
(8) | Reflects a one-for-three share consolidation, with all fractional shares rounded up to the nearest whole share. |
CERTAIN RELATIONSHIPS AND RELATED PARTY TRANSACTIONS
We were formed as JJR VI, a Canadian capital pool company, on December 21, 2009 under the laws of Ontario, Canada. On December 31, 2010, following the reverse merger transaction described immediately hereafter, we filed a Certificate of Registration by Way of Continuation in the Cayman Islands to re-domesticate as a Cayman Islands company. In addition, on December 30, 2010 we filed a Certificate of Incorporation on Change of Name to change our name to Atlas Financial Holdings, Inc. Our current organization is a result of a reverse merger transaction involving the following companies:
| |
| (a) | JJR VI, sponsored by JJR Capital, a Toronto based merchant bank; |
| |
| (b) | American Insurance Acquisition Inc., or American Acquisition, a corporation formed under the laws of Delaware as a wholly owned subsidiary of Kingsway America Inc., or KAI. KAI is a wholly owned subsidiary of Kingsway Financial Services Inc., or KFSI, a Canadian public company formed under the laws of Ontario and whose shares are traded on the Toronto and New York Stock Exchanges; and |
| |
| (c) | Atlas Acquisition Corp., a Delaware corporation wholly-owned by JJR VI and formed for the purpose of merging with and into American Acquisition. |
Prior to the transaction, each of American Service and American Country were wholly owned subsidiaries of KAI. In connection with the reverse merger transaction, KAI transferred 100% of the capital stock of each of American Service and American Country, to American Acquisition (another wholly owned subsidiary of KAI) in exchange for C$35.1 million of common and C$18.0 million of preferred shares of American Acquisition and promissory notes worth C$7.7 million, aggregating C$60.8 million. In addition, American Acquisition raised C$8.0 million through a private placement offering of subscription receipts to qualified investors at a price of C$2.00 per subscription receipt.
All references to share counts and per share values in connection with the reverse merger transaction are presented prior to the one-for-three reverse stock split. KAI received 13,804,861 restricted voting common shares of our company, which we refer to as “restricted voting shares”, then valued at $27.8 million, along with 18,000,000 non-voting preferred shares of our company then valued at C$18.0 million and C$8.0 million cash in exchange for total consideration of C$60.8 million in the form of 100% of the outstanding shares of American Acquisition and full payment of certain promissory notes. Investors in the American Acquisition private placement offering of subscription receipts received 3,983,502 of our ordinary shares, which we refer to as “ordinary shares”, plus warrants to purchase one ordinary share of our company for each subscription receipt at C$2.00 at any time until December 31, 2013. Every 10 common shares of JJR VI held by the shareholders of JJR VI immediately prior to the reverse merger were, upon consummation of the merger, consolidated into one ordinary share of JJR VI. Upon re-domestication in the Cayman Islands, these consolidated shares were then exchanged on a one-for-one basis for our ordinary shares.
In 2010, Atlas’ insurance subsidiaries remitted management fees monthly to KAI for managerial services. During the first six months of 2010, those management fees included rent for Atlas’ Elk Grove Village headquarters building. That building was contributed to Atlas on June 30, 2010 and rental payments ceased at that time. Management fees paid to KAI totaled approximately $0 and $2.6 million for the year ended December 31, 2011 and 2010, respectively.
Atlas’ insurance subsidiaries received $158,000 in regularly scheduled monthly mortgage payments for the six months ended June 30, 2010 under mortgage loan agreements with KAI which were secured by the Elk Grove Village headquarters building. In June 2010, American Service forgave the $1.7 million remaining balance of its mortgage loan from KAI and American Country was paid the $1.8 million total remaining balance of its mortgage loan from KAI.
The amounts due to Universal Casualty Company, a wholly owned subsidiary of KAI, relate primarily to claim handling services provided to Atlas.
For the year ended December 31, 2011 and 2010, Atlas incurred $2.3 million and $4.5 million, respectively, in commissions to Avalon Risk Management, Inc. (“Avalon”). In the year ended December 31, 2011 and 2010, Atlas also incurred expenses of $137,000 and $125,000 respectively, for marketing services performed by Avalon. Avalon was a KFSI subsidiary through October 2009, and has certain investors and directors in common with Atlas. Avalon acts as a program manager for a surety program primarily consisting of U.S. Customs bonds. In this capacity they are responsible for coordinating marketing, customer service and claim handling for the surety bonds written under this agreement. This program is 100% reinsured by an unrelated third party.
During 2010, dividends of $16.7 million were paid to KAI by the insurance subsidiaries of Atlas.
At the time of the reverse merger, Jordan Kupinsky was a director of JJR VI Acquisition Corp., Scott Wollney was an executive officer of Kingsway America Inc. and American Acquisition, and Larry Swets, Jr. was a director of Kingsway America Inc. The reverse merger was negotiated on an arm’s length basis. Copies of the Annual Report and Filing Statement dated December 16, 2010 are available on SEDAR at www.sedar.com but are not deemed part of or incorporated by reference to this prospectus.
No director or senior officer, and no associate or affiliate of the foregoing persons, no insider and no family member of such persons has or has had any material interest, direct or indirect, in any transactions during the fiscal year ended December 31, 2011, or any transaction, or any proposed transaction, which has materially affected or will materially affect us.
A transition agreement between KAI and American Acquisition is currentlywas put in place whereby the two companies provide certain services to each other. The agreement was designed to enable the uninterrupted operation of the insurance subsidiaries following the reverse merger transaction. Such services include accounting support services, auto claims handling services related to private passenger auto policies and tax return preparation services. The amount of work performed under this agreement is now minimal. In addition, Atlas is provided certain claims handling services by Universal Casualty Company under a similar agreement (aby a wholly owned subsidiary of KAI).KAI.
In connection with Atlas' acquisition of American Country and American Service in the reverse merger, a price protection agreement was executed with KAI. Pursuant to this agreement, financial protection is provided in the event that actual losses
paid at any time in the future for exposures existing on or before September 30, 2010 exceed the claims reserves which were carried on the books of our insurance subsidiaries for these exposures as at September 30, 2010. If such paid development exceeds $1 million, the agreement provides protection in the form of a reimbursement obligation for 90% of up to $10 million of additional claims development.
For a description of the Registration Rights Agreement entered into in connection with Atlas' acquisition of American Country and American Service and the initial issuance of 13,804,861 of our restricted voting shares to KAI in 2010, see “Shares Eligible for Future Sale” section of this prospectus for more information.“Description Securities - Registration Rights.”
There is now a limited amount of support, primarily in the area of IT,information technology, provided by the Company’s insurance subsidiaries to its former owner under such agreements. Costs related to these activities are passed on the former owner and are immaterial relative to the Company’s revenue and expense structure.
As atFor the September 30,year endedDecember 31, 2012 and December 31, 2011, Atlas reported net amounts receivable from (payable to) affiliates as follows which are included within other assetsincurred $2.0 million and accounts payable$2.3 million, respectively, in commissions to Avalon Risk Management, Inc. (“Avalon”). In the six month period ended June 30, 2013, Atlas incurred $859,000 in commissions to Avalon.
In the year endedDecember 31, 2012 and accruedDecember 31, 2011, Atlas also incurred expenses on the balance sheets (all amountsof $0 and $137,000 respectively, for marketing services performed by Avalon, and no such expenses in ‘000s).
|
| | | | | | |
| As at: | September 30, 2012 | December 31, 2011 |
| Kingsway America Inc. | $ | 58 |
| $ | 291 |
|
| Universal Casualty Company | (50 | ) | (500 | ) |
| Kingsway Amigo Insurance Company | 2 |
| (1 | ) |
| Total | $ | 10 |
| $ | (210 | ) |
2013. Avalon was a KFSI subsidiary through October 2009, and had certain investors and directors in common with Atlas. As of September 30,December 31, 2012, Atlas and Avalon no longer have any common directors nor investors. Avalon acts as a program manager for oura surety program primarily consisting of U.S. Customs bonds. In this capacity they are responsible for coordinating marketing, customer service and claim handling for the surety bonds written under this agreement. This program is 100% reinsured by an unrelated third party.
At June 30, 2013 and December 31, 2012, Atlas reported net amounts receivable from (payable to) affiliates as follows which are included within other assets and accounts payable and accrued expenses on the balance sheets (all amounts in '000s):
|
| | | | | | |
| | June 30, 2013 | December 31, 2012 |
| Kingsway America Inc. | $ | 44 |
| $ | 43 |
|
| Kingsway Amigo Insurance Company | 4 |
| 1 |
|
| Total | $ | 48 |
| $ | 44 |
|
DESCRIPTION OF SECURITIES
Ordinary Shares
Upon the closing of this offering, our authorized capital stock will consist of 266,666,667 ordinary shares. As of the date of this prospectus, we have 6,144,390there were [•] shareholders of record of our ordinary shares, of which 6,970,850 were issued and outstanding. Additionally, there were 1,262,471 restricted voting shares outstanding, heldall of recordwhich convert to ordinary shares upon the sale of such shares by 19 stockholders.KAI or its subsidiaries.
Voting Rights
The holders of our ordinary shares are entitled to receive notice of, and to attend, speak and vote at all meetings of shareholders, except those at which holders of a specific class are entitled to vote separately as a class. Ordinary shares will carry one vote per share held.
Dividends
Subject to the rights, privileges, restrictions and conditions attached to any other classes of our shares ranking prior to the ordinary shares, the holders of ordinary shares are entitled to receive any dividends that are declared by our board of directors at the times and for the amounts that the board of directors may, from time to time, determine. The ordinary shares rank equally with the restricted voting shares as to dividends on a share-for-share basis and all dividends declared shall be declared in equal or equivalent amounts per share on all ordinary shares and restricted voting shares, without preference or distinction.
Rights in the Case of Liquidation, Winding-Up or Dissolution
Subject to the rights, privileges, restrictions and conditions attached to the other classes of our shares ranking prior to the ordinary shares, in the case of our liquidation, dissolution or winding-up or other distribution of our assets among our shareholders for the purpose of winding up our affairs, the holders of ordinary shares shall be entitled to receive our remaining property and shall be entitled to share equally with the holders of our restricted voting shares, share-for-share, in all distributions of such assets.
Subdivision or Consolidation
No subdivision or consolidation of the ordinary shares shall occur unless, simultaneously, the restricted voting shares are subdivided or consolidated in the same manner, so as to maintain and preserve the relative rights of the holders of the shares of each of the said classes.
Conversion
In the event that an offer is made to purchase our restricted voting shares and the offer is one which is required, pursuant to applicable securities legislation or the rules of a stock exchange on which the restricted voting shares are then listed, to be made to all or substantially all of the holders of the restricted voting shares, each ordinary voting share shall become convertible at the option of the holder into one restricted voting share at any time while the offer is in effect until one day after the time prescribed by applicable securities legislation for the offeror to take up and pay for such shares as are to be acquired pursuant to the offer. The conversion right may only be exercised in respect of ordinary shares for the purpose of depositing the resulting restricted voting shares pursuant to the offer and for no other reason, including with respect to voting rights attached thereto, which are deemed to remain subject to the provisions concerning the voting rights for ordinary shares notwithstanding their conversion. Our registrar and transfer agent shall deposit the resulting restricted voting shares on behalf of the holder.
Should the restricted voting shares issued upon conversion and tendered in response to the offer be withdrawn by the holders or not taken up by the offeror, or should the offer be abandoned or withdrawn, the restricted voting shares resulting from the conversion shall be automatically reconverted, without further act on the part of us or the holder, to ordinary shares.
The ordinary shares may not be converted into restricted voting shares, or vice versa, other than in accordance with the conversion procedure set out in our articles.
As of the date of this prospectus, there are outstanding warrants to purchase up to 1,327,8341,190,405 ordinary shares and outstanding options to purchase up to 225,617 ordinary shares at exercise prices ranging between $3.00 and $6.45 per share.
Restricted Voting Shares
Upon the closing of this offering, ourOur authorized capital stock will consistconsists of 33,333,334 restricted voting shares. As of the date of this prospectus, we have 3,887,4691,262,471 restricted voting shares outstanding held of record by 1 stockholder.the selling shareholder.
Voting Rights
Each restricted voting share entitles the holder to receive notice of, to attend, speak and vote at all meetings of shareholders, except those at which holders of a specific class are entitled to vote separately as a class. Restricted voting shares will carry one vote per share held, except where the number of outstanding restricted voting shares exceeds 30% of the total number of all issued and outstanding voting shares. If the foregoing threshold is surpassed at any time, the votes attached to each restricted voting share will decrease automatically without further act or formality to equal the maximum permitted vote per restricted voting share such that the restricted voting shares as a class shall not carry more than 30% of the total voting rights attached to the aggregate outstanding voting shares.
Dividends
Subject to the rights, privileges, restrictions and conditions attached to any other class of our shares ranking prior to the restricted voting shares, the holders of restricted voting shares are entitled to receive any dividends that are declared by our board of directors at the times and for the amounts that our board of directors may, from time to time, determine. The restricted voting shares shall rank equally with our ordinary shares as to dividends on a share-for-share basis and all dividends shall be declared in equal or equivalent amounts per share on all ordinary shares and restricted voting shares without preference or distinction.
Rights in the Case of Liquidation, Winding-Up or Dissolution
Subject to the rights, privileges, restrictions and conditions attached to the other classes of our shares ranking prior to the restricted voting shares, in the case of our liquidation, dissolution or winding-up or other distribution of our assets among our shareholders for the purpose of winding up our affairs, the holders of restricted voting shares shall be entitled to receive our remaining property and shall be entitled to share equally with the holders of ordinary shares, share-for-share, in all distributions of such assets.
Subdivision or Consolidation
No subdivision or consolidation of the restricted voting shares shall occur unless, simultaneously, the ordinary shares are subdivided or consolidated in the same manner, so as to maintain and preserve the relative rights of the holders of the shares of each of the said classes.
Conversion
Upon the disposition of any restricted voting share such that the restricted voting share ceases to be beneficially owned or controlled, directly or indirectly, by KFSI or KAI (and, for this purpose, such restricted voting share is also not held, directly or indirectly, by a partnership, corporation or other entity in which KFSI or KAI holds, directly or indirectly, ten percent (10%) or more of the capital, profits, value or voting interests), such restricted voting shares shall be mandatorily converted into fully paid and non-assessable ordinary shares with each restricted voting share converting into one of our ordinary shares.
In the event that an offer is made to purchase ordinary shares and the offer is one which is required, pursuant to applicable securities legislation or the rules of a stock exchange on which the ordinary shares are then listed, to be made to all or substantially all of the holders of ordinary shares, each restricted voting share shall become convertible at the option of the holder into one ordinary voting share at any time while the offer is in effect until one day after the time prescribed by applicable securities legislation for the offeror to take up and pay for such shares as are to be acquired pursuant to the offer. The conversion right may only be exercised in respect of restricted voting shares for the purpose of depositing the ordinary shares pursuant to the offer and for no other reason, including notably with respect to voting rights attached thereto, which are deemed to remain subject to the provisions concerning the voting rights for restricted voting shares notwithstanding their conversion. Our registrar and transfer agent shall deposit the ordinary shares on behalf of the holder.
Should the ordinary shares issued upon conversion and tendered in response to the offer be withdrawn by the holders or not taken up by the offeror, or should the offer be abandoned or withdrawn, the ordinary shares resulting from the conversion shall be automatically reconverted, without further act on the part of us or the holder, into restricted voting shares.
The restricted voting shares may not be converted into ordinary shares, or vice versa, other than in accordance with the conversion procedure set out in our articles.
Preferred Shares
Upon the closing of this offering, our authorizedOur capital stock will consistconsists of 20,000,000 preferred shares. As of the date of this prospectus, we have 20,000,0002,000,000 preferred shares, outstanding,all of which 18,000,000 are beneficially owned by Kingsway and 2,000,000Hendricks.
On July 7, 2013, Atlas entered into a non-binding letter of intent to purchase from KAI all outstanding preferred shares that are beneficially owned by Hendricks.eligible for redemption (18,000,000 shares), for 90% of liquidation value. Definitive agreements in connection with this transaction were executed on August 1, 2013 (collectively, "The Share Repurchase Agreement"). An initial amount of $8.3 million (which includes $800,000 received from the exercise of warrants) of the $16.2 million purchase price was paid upon execution of the Share Repurchase Agreement, with the remaining amount to be paid no later than April 30, 2014, in accordance with the terms of the Share Repurchase Agreement.
Voting Rights
Except as otherwise required under applicable law, the holders of preferred shares will not be entitled to vote at any general meeting of the company, but (for the avoidance of doubt) may vote at a separate class meeting convened in accordance with the company’s articles of association.
Dividends
Dividends on the preferred shares shall accrue on a daily basis at the prorated annual rate of $0.045 per preferred share and shall be cumulative. The holders of preferred shares shall be entitled to receive dividends or distributions, when and as declared by our board of directors. We may elect to pay dividends on the preferred shares to each of preferred shares pro rata in additional preferred shares with a value equal to the amount of the dividends, provided to the extent we do not pay a dividend on the preferred shares in cash or in additional shares, the dividend shall accrue and accumulate compounded yearly whether or not such dividend was declared. No dividends shall be paid on any ordinary shares or restricted voting shares until dividends on the preferred shares shall have been paid or declared and set apart. The holders of the preferred shares will be entitled to the greater of the dividend on the ordinary shares (on an as converted basis) and the preferred shares in that fiscal year.
Liquidation Preference
Upon any liquidation, dissolution, or winding up of our company, whether voluntary or involuntary, before any distribution or payment shall be made to any of the holders of our ordinary shares or restricted voting shares, the holders of preferred shares are entitled to receive out of our assets, an amount in cash or kind for each preferred share equal to the greater of (i) US$1.00 per preferred share (as such amount shall be appropriately adjusted to take into account stock splits, stock dividends and similar events) plus all declared and unpaid dividends thereon and (ii) the amount such holder would receive in liquidation if the preferred share had been converted to restricted voting shares or ordinary shares, as applicable, immediately prior to the liquidation.
If, upon any liquidation, the assets of Atlas are insufficient to pay the liquidation amount, then our net assets will be distributed among the holders of the preferred shares ratably in proportion to the full amounts to which they would otherwise be entitled and such distributions may be made in cash or in property taken at our fair value, or both, at the election of our board of directors.
After payment in full of the liquidation amount, including without limitation all declared and unpaid dividends on the preferred shares, our assets legally available for distribution, if any, will be distributed ratably to the holders of ordinary shares and restricted voting shares.
Conversion
Each preferred share shall be convertible, at the option of the holder thereof, at any time or from time-to-time after the date that is the fifth (5th) anniversary of the issuance date of such share, at our office or any transfer agent for the preferred shares, into such number of fully paid and non-assessable shares of ordinary shares as is determined by multiplying the number of the preferred shares by the “Conversion Factor” at the time in effect for such share. The initial Conversion Factor per share per preferred share shall be equal to 0.1270; provided, however, that such Conversion Factor shall be subject to adjustment as provided in our articles. Notwithstanding the foregoing, uponUpon the disposition of a preferred share, such that the preferred share ceases to be beneficially owned and controlled by KFSI or KAI (and, for this purpose, such preferred share is also not held, directly or indirectly, by a partnership, corporation or other entity in which KFSI or KAI holds, directly or indirectly, ten percent (10%) or more of the capital, profits, value or voting interests) such preferred share shall be convertible into ordinary shares rather than restricted voting shares.
Adjustments
The Conversion Factor of the preferred shares is subject to adjustment as provided in our articles.
Optional Redemption
We may redeem all or any of the outstanding preferred shares at any time or times at a redemption price equal to US$1.00 per share, payable in cash plus all accrued and unpaid dividends calculated to the redemption date, whether or not such dividends have been declared, commencing on the earlier of (i) two years after their date of issuance and (ii) the date the preferred share is transferred to a party such that the preferred share ceases to be beneficially owned or controlled directly or indirectly by KFSI or KAI (and, for this purpose, such preferred share is also not held directly or indirectly by a partnership, corporation or other entity in which KFSI or KAI holds, directly or indirectly, ten percent (10%) or more of the capital, profits, value or voting interests). We must give at least sixty (60) days prior written notice to each holder whose preferred shares are to be so redeemed. In the event that less than all of the outstanding preferred shares are to be redeemed, unless otherwise agreed to by the holders of 100% of the then outstanding preferred shares in writing, we will select those shares to be redeemed from each holder of preferred shares pro rata, in proportion to the number of preferred shares held by such holders.
Reverse Stock Split
On December 7, 2012, we held a shareholder meeting where a one-for-three reverse stock split was unanimously approved. When the reverse stock split takes effect, it will decrease our authorized and outstanding ordinary shares and restricted voting shares at a ratio of one-for-three. The primary objective of the reverse stock split is to increase the per share price of our ordinary shares to meet certain listing requirements of the NASDAQ Capital Market. As a result, the conversion factor for our preferred shares will decrease to 0.1270 ordinary shares for each preferred share.
Registration Rights
The three holders of an aggregate of 4,601,621 ordinary shares and restricted voting shares of the company initially held by KAI, areSelling Shareholder is entitled to certain rights with respect to the registration of suchthe shares owned by it under the Securities Act pursuant to the terms of the company’s registration rights agreement dated as of December 31, 2010 between the company and KAI. These shares are referred to as registrable securities and the related registration rights are described in additional detail below.
Piggyback Registration Rights
If the company registers any of its securities for public sale, the company will have to register all registrable securities that the holders of such securities request in writing be registered within 15 days of mailing of notice by the company to such holders. However, this right does not apply to a registration relating to any of the company’s stock plans, the offer and sale of debt securities, a corporate reorganization or other transaction under Rule 145 of the Securities Act. The managing underwriters of any underwritten offering will have the right to limit, due to marketing reasons, the number of shares so registered. If the number of securities requested to be included in such offering exceeds the number of shares that can be sold in an orderly manner within a price range acceptable to the company, then the company will include in such registration statement: first, the securities the company proposes to sell; second, the registrable securities requested to be included in such registration; and third, any other securities of the company requested to be included in such registration, in such manner as the company may determine.
Demand Registration Rights
Upon written request of a holder or holders of such registrable securities, the company is required to file a registration statement on Form S-3 or any successor form thereto for a public offering of all or any portion of the registrable securities held by the requesting holder or holders, and as long as the reasonably anticipated aggregate price to the public is at least $5,000,000, and the company is entitled to use Form S-3 to register such registrable securities, then the company will be obligated to use our reasonable efforts to register the sale of all registrable securities that holders may request in writing. The company will be obligated to prepare and file a registration statement relating to the registrable securities within 45 days after receiving an initial demand notice from the holders. Thereafter, the company will use commercially reasonable efforts to cause the registration statement to become effective not later than 90 days from the date of filing. Additionally, the company will be required to provide prompt written notice of such registration of the registrable securities to all holders of outstanding registrable securities at least 30 days prior to filing. Such holders then have 15 days following receipt of such notice to demand their registrable securities be included in such registration statement. The company may postpone the filing of a registration statement for up to 120 days once in a 12 month period if in the good faith judgment of the company’s board of directors such
registration would be detrimental to the company. KAI’s shares are being registered pursuant to such demand registration rights.The Company and KAI have agreed that the preparation and filing of this prospectus, and the registration statement on Form S-1 of which this prospectus is a part, will count as a demand registration for purposes of the registration rights agreement.
Registration Expenses
The company will pay all expenses incurred in connection with the piggyback registration rights described above, except for underwriting discounts and selling commissions. The holder or holders or the registrable securities will pay all expenses incurred in connection with the demand registration rights on Form S-3 as described above, except for underwriting discounts and selling commissions. All underwriting discounts and selling commissions in connection with any piggyback registration and demand registration described above will be borne by the participating sellers in proportion to the number of registrable securities sold by each or as they may otherwise agree. Expenses related to this offering, excluding underwriting discounts and selling commissions, shall be shared between the Company and KAI such that each of the Company and the KAI will pay that amount of the aggregate expenses proportionate to the number of shares that such party sells in this offering.
Expiration of Registration Rights
The registration rights described above will terminate as to a given holder of registrable securities, when such holder of registrable securities can sell all of such holder’s registrable securities without restriction pursuant to Rule 144(b)(1) promulgated under the Securities Act.
U.S. TAX CONSIDERATIONS
The following is a discussion of the material U.S. federal income and estate tax considerations relating to the purchase, ownership and disposition of our ordinary shares by holders that purchase our ordinary shares pursuant to this offering and hold such ordinary shares as a capital asset within the meaning of Section 1221 of the U.S. Internal Revenue Code of 1986, as amended (the “Code”). This discussion is based on the Code, the U.S. Treasury regulations promulgated thereunder, and administrative and judicial interpretations thereof, all as in effect on the date hereof and all of which are subject to change, possibly with retroactive effect, or to different interpretation. This discussion does not address all of the U.S. federal tax considerations that may be relevant to specific holders in light of their particular circumstances or to Non-U.S. Holders subject to special treatment under U.S. federal income tax law (such as banks, insurance companies, brokers, dealers or traders in securities, commodities or currencies or other holders that mark their securities to market for U.S. federal income tax purposes, foreign governments, international organizations, controlled foreign corporations, passive foreign investment companies, tax-exempt entities, certain former citizens or residents of the United States, persons deemed to sell our ordinary shares under the constructive sale provisions of the Code, or holders that hold our ordinary shares as part of a straddle, hedge, conversion or other integrated transaction). This discussion does not address any U.S. state or local or non-U.S. tax considerations or any U.S. federal gift or alternative minimum tax considerations. The following discussion also assumes we are treated as a U.S. corporation for U.S. federal income tax purposes. See “Risk Factors - U.S.”
As used in this discussion, the term “U.S. Holder” means a beneficial owner of our ordinary shares that is for U.S. federal income tax purposes:
an individual who is a citizen or a resident of the United States;
a corporation created or organized in or under the laws of the United States, any state thereof, or the District of Columbia;
an estate that is subject to U.S. federal income tax on income regardless of its source; or
a trust if (i) it is subject to the primary supervision of a court within the United States and one or more United States persons have the authority to control all of its substantial decisions or (ii) it has in effect a valid election under applicable U.S. Treasury regulations to be treated as a United States person.
A “Non-U.S. Holder” means a beneficial owner of our ordinary shares (other than a partnership) that is not a U.S. Holder.
If an entity treated as a partnership for U.S. federal income tax purposes invests in our ordinary shares, the U.S. federal income tax considerations relating to such investment will depend in part upon the status and activities of such entity and the particular partner and upon certain determinations made at the partner level. Any such entity should consult its own tax advisor regarding the U.S. federal tax considerations applicable to it and its partners relating to the purchase, ownership and disposition of our ordinary shares.
PERSONS CONSIDERING AN INVESTMENT IN OUR ORDINARY SHARES SHOULD CONSULT THEIR OWN TAX ADVISORS REGARDING THE U.S. FEDERAL, STATE AND LOCAL AND NON-U.S. INCOME, ESTATE, GIFT AND OTHER TAX CONSIDERATIONS RELATING TO THE PURCHASE, OWNERSHIP AND DISPOSITION OF OUR ORDINARY SHARES IN LIGHT OF THEIR PARTICULAR CIRCUMSTANCES.
Treatment as a U.S. Corporation
As described above under “Risk Factors-U.S. Tax Risks,” pursuant to certain “expatriation” provisions of the Code, the reverse merger agreement relating to the reverse merger transaction provides that the parties intend to treat our company as a U.S. corporation for U.S. federal income tax purposes. The expatriation provisions are complex, are largely unsettled and subject to differing interpretations, and are subject to change, perhaps retroactively. If our company were not to be treated as a U.S. corporation for U.S. federal income tax purposes, holders could be subject to materially different consequences than those described below. The remainder of this discussion assumes that we are properly treated as a U.S. corporation.
U.S. Holders
Distributions on Ordinary Shares
As described in the section entitled “Dividend Policy,” we do not currently expect to declare or pay dividends on our ordinary shares for the foreseeable future. A U.S. Holder that receives a distribution with respect to our ordinary shares, including a constructive distribution, of cash or property, generally will be required to include the amount of such distribution in gross income as a dividend to the extent of our current and accumulated “earnings and profits,” as computed for U.S. federal income tax purposes. To the extent that a distribution exceeds our current and accumulated “earnings and profits,” such distribution will
be treated first as a tax-free return of capital to the extent of a U.S. Holder’s tax basis in our ordinary shares and thereafter as gain from the sale or exchange of ordinary shares. (See “Sale or exchange of ordinary shares” below.) Dividends received on ordinary shares generally will be eligible for the “dividends received deduction” available to corporate U.S. Holders. Under current law, for taxable years beginning before January 1, 2013, a dividend paid by us generally will be eligible to be taxed at the preferential tax rates applicable to long-term capital gains if the U.S. Holder receiving such dividend is an individual, estate, or trust. A U.S. Holder generally will be eligible for the reduced rate only if the U.S. Holder has held our ordinary shares for more than 60 days during the 121-day period beginning 60 days before the ex-dividend date. The reduced rate does not apply to individual taxpayers who have made an election to treat the dividends as “investment income” that may be offset against investment expense.
Sale or Exchange of Ordinary Shares
A U.S. Holder will recognize gain or loss on the sale or other taxable disposition of our ordinary shares in an amount equal to the difference, if any, between the amount realized on such sale or exchange and the U.S. Holder’s adjusted tax basis in such ordinary shares. A holder’s adjusted tax basis in our ordinary shares generally will equal the holder’s purchase price for that share. Any such gain or loss generally will be capital gain or loss, which will be long-term capital gain or loss if the ordinary shares is held for more than one year. Preferential tax rates presently apply to long-term capital gains of a U.S. Holder that is an individual, estate, or trust. There are presently no preferential tax rates for long-term capital gains of a U.S. Holder that is a corporation. Deductions for capital losses are subject to significant limitations under the Code.
Backup Withholding Tax and Information Reporting Requirements
Unless a holder of ordinary shares is a corporation or other exempt recipient, payments to holders of ordinary shares of dividends or the proceeds of sales or other dispositions of our ordinary shares that are made within the United States or through certain United States-related financial intermediaries may be subject to information reporting. Such payments may also be subject to U.S. federal backup withholding tax if the holder of our ordinary shares fails to supply a correct taxpayer identification number or otherwise fails to comply with applicable U.S. information reporting or certification requirements. Any amount withheld from a payment to a holder of ordinary shares under the backup withholding rules is allowable as a credit against such holder’s U.S. federal income tax and may entitle such holder to a refund, provided that the required information is furnished to the IRS.
Non-U.S. Holders
Distributions on Ordinary SharesRegistration Rights
AsThe Selling Shareholder is entitled to certain rights with respect to the registration of the shares owned by it under the Securities Act pursuant to the terms of the company’s registration rights agreement dated as of December 31, 2010 between the company and KAI. These shares are referred to as registrable securities and the related registration rights are described in additional detail below.
Piggyback Registration Rights
If the section entitled “Dividend Policy,” we docompany registers any of its securities for public sale, the company will have to register all registrable securities that the holders of such securities request in writing be registered within 15 days of mailing of notice by the company to such holders. However, this right does not currently expectapply to declarea registration relating to any of the company’s stock plans, the offer and sale of debt securities, a corporate reorganization or pay dividends on our ordinaryother transaction under Rule 145 of the Securities Act. The managing underwriters of any underwritten offering will have the right to limit, due to marketing reasons, the number of shares forso registered. If the foreseeable future. Subjectnumber of securities requested to be included in such offering exceeds the number of shares that can be sold in an orderly manner within a price range acceptable to the company, then the company will include in such registration statement: first, the securities the company proposes to sell; second, the registrable securities requested to be included in such registration; and third, any other securities of the company requested to be included in such registration, in such manner as the company may determine.
Demand Registration Rights
Upon written request of a holder or holders of such registrable securities, the company is required to file a registration statement on Form S-3 or any successor form thereto for a public offering of all or any portion of the registrable securities held by the requesting holder or holders, and as long as the reasonably anticipated aggregate price to the public is at least $5,000,000, and the company is entitled to use Form S-3 to register such registrable securities, then the company will be obligated to use our reasonable efforts to register the sale of all registrable securities that holders may request in writing. The company will be obligated to prepare and file a registration statement relating to the registrable securities within 45 days after receiving an initial demand notice from the holders. Thereafter, the company will use commercially reasonable efforts to cause the registration statement to become effective not later than 90 days from the date of filing. Additionally, the company will be required to provide prompt written notice of such registration of the registrable securities to all holders of outstanding registrable securities at least 30 days prior to filing. Such holders then have 15 days following receipt of such notice to demand their registrable securities be included in such registration statement. The company may postpone the filing of a registration statement for up to 120 days once in a 12 month period if in the good faith judgment of the company’s board of directors such registration would be detrimental to the company. KAI’s shares are being registered pursuant to such demand registration rights. The Company and KAI have agreed that the preparation and filing of this prospectus, and the registration statement on Form S-1 of which this prospectus is a part, will count as a demand registration for purposes of the registration rights agreement.
Registration Expenses
The company will pay all expenses incurred in connection with the piggyback registration rights described above, except for underwriting discounts and selling commissions. The holder or holders or the registrable securities will pay all expenses incurred in connection with the demand registration rights as described above, except for underwriting discounts and selling commissions. All underwriting discounts and selling commissions in connection with any piggyback registration and demand registration described above will be borne by the participating sellers in proportion to the number of registrable securities sold by each or as they may otherwise agree.
Expiration of Registration Rights
The registration rights described above will terminate as to a given holder of registrable securities, when such holder of registrable securities can sell all of such holder’s registrable securities without restriction pursuant to Rule 144(b)(1) promulgated under the Securities Act.
U.S. TAX CONSIDERATIONS
The following is a discussion below under “-Paymentsof the material U.S. federal income and estate tax considerations relating to Foreign Financial Institutionsthe purchase, ownership and Non-financial Foreign Entities” and “-Information Reporting and Backup Withholding”, if we make a distribution of cash or other property (other than certain pro rata distributions of our ordinary shares) in respectdisposition of our ordinary shares the distribution will be treatedby holders that purchase our ordinary shares pursuant to this offering and hold such ordinary shares as a dividendcapital asset within the meaning of Section 1221 of the U.S. Internal Revenue Code of 1986, as amended (the “Code”). This discussion is based on the Code, the U.S. Treasury regulations promulgated thereunder, and administrative and judicial interpretations thereof, all as in effect on the date hereof and all of which are subject to change, possibly with retroactive effect, or to different interpretation. This discussion does not address all of the extent it is paid from our currentU.S. federal tax considerations that may be relevant to specific holders in light of their particular circumstances or accumulated earnings and profits (as determinedto Non-U.S. Holders subject to special treatment under U.S. federal income tax principles). Iflaw (such as banks, insurance companies, brokers, dealers or traders in securities, commodities or currencies or other holders that mark their securities to market for U.S. federal income tax purposes, foreign governments, international organizations, controlled foreign corporations, passive foreign investment companies, tax-exempt entities, certain former citizens or residents of the amountUnited States, persons deemed to sell our ordinary shares under the constructive sale provisions of the Code, or holders that hold our ordinary shares as part of a distribution exceeds our current and accumulated earnings and profits, such excess generally will bestraddle, hedge, conversion or other integrated transaction). This discussion does not address any U.S. state or local or non-U.S. tax considerations or any U.S. federal gift or alternative minimum tax considerations. The following discussion also assumes we are treated first as a tax-free returnU.S. corporation for U.S. federal income tax purposes. See “Risk Factors - U.S.”
As used in this discussion, the term “U.S. Holder” means a beneficial owner of capital to the extent of the Non-U.S. Holder’s tax basis in such ordinary shares, and then as gain realized on the sale or other disposition of the ordinary shares and will be treated as described under the section entitled “-Sale, Exchange or Other Disposition of Ordinary Shares” below.
Distributions treated as dividends on our ordinary shares that are paid to oris for the account of a Non-U.S. Holder and are not effectively connected with a U.S. trade or business conducted by such Non-U.S. Holder generally will be subject to U.S. federal withholdingincome tax atpurposes:
an individual who is a rate of 30%,citizen or at a lower rate if provided by an applicable tax treaty and the Non-U.S. Holder provides the documentation (generally, Internal Revenue Service (“IRS”) Form W-8BEN) required to claim benefits under such tax treaty to the applicable withholding agent prior to the paymentresident of the dividends. Non-U.S. Holders that do not timely provideUnited States;
a corporation created or organized in or under the applicable withholding agent with the required certification, but that qualify for a reduced treaty rate, may obtain a refundlaws of any excess amounts withheld by timely filing an appropriate claim for refund with the IRS.
If, however, a dividend is effectively connected with the conduct of a trade or business in the United States, by a Non-U.S. Holder (and, if required by any state thereof, or the District of Columbia;
an applicable tax treatyestate that a Non-U.S. Holder relies upon, is attributable to a permanent establishment maintained by the Non-U.S. Holder in the United States), such dividend generally will not be subject to the 30% U.S. federal withholding tax if such Non-U.S. Holder provides the appropriate documentation (generally, IRS Form W-8ECI) to the applicable withholding agent. Instead, such Non-U.S. Holder generally will be subject to U.S. federal income tax on such dividendincome regardless of its source; or
a trust if (i) it is subject to the primary supervision of a court within the United States and one or more United States persons have the authority to control all of its substantial decisions or (ii) it has in substantially the same mannereffect a valid election under applicable U.S. Treasury regulations to be treated as a U.S. holder (except as provided by an applicable tax treaty). In addition, a Non-
U.S. Holder that is a corporation may be subject to a branch profits tax at the rate of 30% (or a lower rate if provided by an applicable tax treaty) on its effectively connected earnings and profits for the taxable year, subject to certain adjustments.United States person.
Sale, Exchange or Other Disposition of Ordinary Shares
Subject to the discussion below under “-Payments to Foreign Financial Institutions and Non-financial Foreign Entities” and “-Information Reporting and Backup Withholding”,A “Non-U.S. Holder” means a Non-U.S. Holder generally will not be subject to U.S. federal income tax on gain recognized on the sale, exchange or other dispositionbeneficial owner of our ordinary shares unless:(other than a partnership) that is not a U.S. Holder.
we are or have beenIf an entity treated as a “United States real property holding corporation”partnership for U.S. federal income tax purposes at any time during the shorter of (i) the five year period ending on the date of such sale, exchange or disposition and (ii) such Non-U.S. Holder’s holding period with respect toinvests in our ordinary shares, and certain other conditions are met;
such gain is effectively connected with the conduct of a trade or business in the United States by such Non-U.S. Holder, in which event such Non-U.S. Holder generally will be subject to U.S. federal income tax onconsiderations relating to such gaininvestment will depend in substantiallypart upon the same mannerstatus and activities of such entity and the particular partner and upon certain determinations made at the partner level. Any such entity should consult its own tax advisor regarding the U.S. federal tax considerations applicable to it and its partners relating to the purchase, ownership and disposition of our ordinary shares.
PERSONS CONSIDERING AN INVESTMENT IN OUR ORDINARY SHARES SHOULD CONSULT THEIR OWN TAX ADVISORS REGARDING THE U.S. FEDERAL, STATE AND LOCAL AND NON-U.S. INCOME, ESTATE, GIFT AND OTHER TAX CONSIDERATIONS RELATING TO THE PURCHASE, OWNERSHIP AND DISPOSITION OF OUR ORDINARY SHARES IN LIGHT OF THEIR PARTICULAR CIRCUMSTANCES.
Treatment as a U.S. holder (except as provided by an applicable tax treaty) and, if it is a corporation, may also be subject to a branch profits tax at the rate of 30% (or a lower rate if provided by an applicable tax treaty) on all or a portion of its effectively connected earnings and profits for the taxable year, subjectCorporation
As described above under “Risk Factors-U.S. Tax Risks,” pursuant to certain adjustments; or
such Non-U.S. Holder is an individual who is present in the United States for 183 days or more in the taxable year of such sale, exchange or disposition and certain other conditions are met.
Generally, a corporation is a “United States real property holding corporation” if the fair market value of its United States real property interests equals or exceeds 50%“expatriation” provisions of the sum ofCode, the fair market value of its worldwide real property interests and its other assets used or held for use inreverse merger agreement relating to the reverse merger transaction provides that the parties intend to treat our company as a trade or business (all as determinedU.S. corporation for U.S. federal income tax purposes). We do not believe that wepurposes. The expatriation provisions are complex, are largely unsettled and we do not presently anticipate that we will become, a United States real property holding corporation.
Payments to Foreign Financial Institutions and Non-financial Foreign Entities
Payments of any dividend on, or any gross proceeds from the sale, exchange or other disposition of, our ordinary shares to a Non-U.S. Holder that is a “foreign financial institution” or a “non-financial foreign entity” (to the extent such dividend or any gain from such sale, exchange or disposition is not effectively connected with the conduct of a trade or business in the United States by such Non-U.S. Holder) generally will be subject to the U.S. federal withholding tax at the rate of 30% unless such Non-U.S. Holder complies with certain additional U.S. reporting requirements or an exception otherwise applies.
For this purpose, a foreign financial institution includes, among others, a non-U.S. entity that (i) is a bank, (ii) holds,differing interpretations, and are subject to change, perhaps retroactively. If our company were not to be treated as a substantial portion of its business, financial assetsU.S. corporation for the account of others or (iii) is engaged (or holds itself out as being engaged) primarily in the business of investing, reinvesting or trading in securities, partnership interests, commodities or any interest in securities, partnership interests or commodities (as such terms are defined in the Code). A foreign financial institution generally will be subject to this 30% U.S. federal withholding tax unless it (i) enters into an agreement with the IRS pursuant to which such foreign financial institution agrees (x) to comply with certain information, verification, due diligence, reporting, and other procedures established by the IRS with respect to “United States accounts” (generally depository or custodial accounts maintained by a foreign financial institution (as well as non-traded debt or equity interests in such foreign financial institution) held by one or more “specified United States persons” or foreign entities with one or more “substantial United States owners” (as such terms are defined in the Code) and (y) to withhold on (1) its account holders that either fail to comply with reasonable requests for certain information as specified in the Code or fail to provide certain permissible waivers and (2) its account holders that are foreign financial institutions that do not enter into such an agreement with the IRS or (ii) is otherwise exempted by the IRS in future guidance.
A non-financial foreign entity generally will be subject to this 30% U.S. federal withholding tax unless such entity (i) provides the applicable withholding agent with either (x) a certification that such entity does not have any “substantial United States owners” (as defined in the Code) or (y) information regarding the name, address and taxpayer identification number of each “substantial United States owner” of such entity or (ii) is otherwise exempted by the IRS in future guidance. These reporting requirements generally will not apply to certain specified types of entities, including, but not limited to, a corporation the stock of which is regularly traded on an established securities market and certain affiliated corporations, foreign governments and international organizations.
Although this legislation currently applies to applicable payments made after December 31, 2012, the IRS has recently issued proposed Treasury regulations providing that the withholding provisions described above will generally apply to payments of dividends on our ordinary shares made on or after January 1, 2014, and to payments of gross proceeds from a sale or other disposition of such stock on or after January 1, 2015.
Non-U.S. Holders should consult their own tax advisor regarding the application of these withholding and reporting rules.
Information Reporting and Backup Withholding
Generally, the amount of dividends on our ordinary shares paid to a Non-U.S. Holder, the name and address of the recipient and the amount of any tax withheld from such dividends must be reported annually to the IRS and to the Non-U.S. Holder. In addition, separate information reporting and backup withholding rules that apply to payments to certain U.S. persons generally will not apply to payments with respect to our ordinary shares to a Non-U.S. Holder if such Non-U.S. Holder certifies under penalties of perjury that it is not a United States person (generally by providing an IRS Form W-8BEN) or otherwise establishes an exemption.
Proceeds from the sale, exchange or other disposition of our ordinary shares by a Non-U.S. Holder effected through a non-U.S. office of a U.S. broker or of a non-U.S. broker with certain specified U.S. connections generally will be subject to information reporting (but not backup withholding) unless such Non-U.S. Holder certifies under penalties of perjury that it is not a United States person (generally by providing an IRS Form W-8BEN) or otherwise establishes an exemption. Proceeds from the sale, exchange or other disposition of our ordinary shares by a Non-U.S. Holder effected through a U.S. office of a broker generally will be subject to information reporting and backup withholding unless such Non-U.S. Holder certifies under penalties of perjury that it is not a United States person (generally by providing an IRS Form W-8BEN) or otherwise establishes an exemption.
Backup withholding is not an additional tax. Any amounts withheld under the backup withholding rules generally will be allowed as a refund or a credit against a Non-U.S. Holder’s U.S. federal income tax liability if the required information is furnished by such Non-U.S. Holder on a timely basis to the IRS.
U.S. Federal Estate Tax
In the case of an individual Non-U.S. Holder, ordinary shares owned or treated as owned at such time by such individual will be included in his or her gross estate for U.S. federal estate tax purposes, and mayholders could be subject to U.S. federal estate tax unless an applicable estate tax treaty provides otherwise.
UNDERWRITING
We and the selling shareholder are offering the ordinary sharesmaterially different consequences than those described in this prospectus in an underwritten offering in which we, Sandler O’Neill & Partners, L.P., as representative of the underwriters for the offering, and the selling shareholder will enter into an underwriting agreement with respect to the ordinary shares being offered. Subject to the terms and conditions contained in the underwriting agreement, the underwriter named below has severally agreed to purchase the respective number of ordinary shares set forth opposite its name below.
|
| |
Name | Number of Ordinary Shares |
Sandler O’Neill & Partners, L.P. | |
Canaccord Genuity Inc. | |
Total | |
The underwriting agreement provides that the underwriters’ obligations to purchase ordinary shares depends on the satisfaction of the conditions contained in the underwriting agreement, including:
•the representations and warranties made by us are true and agreements have been performed;
•the absence of a material adverse change, in their determination, in the financial markets or in our business; and
•the delivery of customary closing documents.
Subject to these conditions, the underwriters are committed to purchase and pay for all of the ordinary shares offered by this prospectus, if any such shares are purchased. However, the underwriters are not obligated to take or pay for the ordinary shares covered by the underwriters’ over-allotment option described below, unless and until that option is exercised.
Over-Allotment Option
We have granted Sandler O’Neill & Partners, L.P., as representative of the underwriters for the offering, an option, exercisable no later than 30 days after the date of the underwriting agreement, to purchase up to an aggregate of 694,500 additional ordinary shares at the public offering price, less the underwriting discounts and commissions set forth on the cover pageremainder of this prospectus. We will be obligated to sell these ordinary shares to the underwriters to the extent the over-allotment option is exercised. The underwriters may exercise this option only to cover over-allotments, if any, made in connection with the sale of our ordinary shares offered by this prospectus.
Commissions and Expenses
The underwriters propose to offer our ordinary shares directly to the public at the offering price set forth on the cover page of this prospectus and to dealers at the public offering price less a concession not in excess of $ per share. The underwriters may allow, and the dealers may re-allow, a concession not in excess of $ per share on sales to other brokers and dealers. After the public offering of our ordinary shares, the underwriters may change the offering price, concessions and other selling terms.
The following table shows the per share and total underwriting discounts and commissionsdiscussion assumes that we will pay to the underwriters and the proceeds we will receive before expenses. These amounts are shown assuming both no exercise and full exercise of the underwriters’ over-allotment option.
|
| | | |
| Per Share | Total without over-allotment exercise | Total with over-allotment exercise |
Initial public offering price | $ | $ | $ |
Underwriting discount | $ | $ | $ |
Proceeds to us (before expenses) | $ | $ | $ |
Proceeds to the selling shareholder (before expenses) | $ | $ | $ |
In addition to the underwriting discount, we will reimburse the underwriters for their reasonable out-of-pocket non-legal expenses incurred in connection with their engagement as underwriters, regardless of whether this offering is consummated, including, without limitation, marketing, syndication and travel expenses. Further, we will reimburse the underwriters for their legal fees incurred in connection with their engagement as underwriters, regardless of whether this offering is consummated. We will also pay for filing fees incident to, and the fees and disbursements of counsel for the underwriters in connection with,
securing any required review of the terms of this offering. We estimate that the total expenses of this offering, exclusive of the underwriting discounts and commissions, will be approximately $784,000 of which approximately $254,000 are payable by us.
Offering Price Determination
Prior to this offering, there has been no public market in the United States for our ordinary shares. Our ordinary shares have been exclusively listed on the TSXV under the symbol “AFH” since January 6, 2011. The initial public offering price will be determined by negotiations between us, the selling shareholder, and the representative of the underwriters. In determining the initial public offering price of our ordinary shares, the representative will consider:
•the history and prospects for the industry in which we compete;
•our financial information, including our results of operations and current financial condition;
•our earning prospects;
•our management;
•the prevailing securities markets at the time of this offering; and
•the recent market prices of and the demand for publicly traded stock of comparable companies.
Indemnification
We have agreed to indemnify the underwriters, and persons who control the underwriters, against certain liabilities, including liabilities under the Securities Act, and to contribute to payments that the underwriters may be required to make in respect of these liabilities.
Lock-Up Agreement
We, our directors and executive officers and certain of our shareholders, including the selling shareholder, have entered into lock-up agreements with the underwriters. Under these agreements, (i) for a period of 180 days after the date of the underwriting agreement, we and each of our directors and executive officers may not, and (ii) for a period of 180 days after the date of the underwriting agreement the selling shareholder may not, in each case or without the prior written approval of the underwriters, subject to limited exceptions:
offer, pledge, sell, contract to sell, sell any option or contract to purchase, purchase any option or contract to sell, grant any option, right or warrant for the sale of, or otherwise dispose of or transfer any of our ordinary shares or any securities convertible into or exchangeable or exercisable for our ordinary shares, whether now owned or hereafter acquired or with respect to which such person has or hereafter acquires the power of disposition, or file any registration statement under the Securities Act, with respect to any of the foregoing, or
enter into any swap or any other agreement or any transaction that transfers, in whole or in part, directly or indirectly, the economic consequence of ownership of our ordinary shares, whether any such swap or transaction is to be settled by delivery of our ordinary shares or other securities, in cash or otherwise.
Listing
We have applied to list our ordinary shares on the NASDAQ Capital Market under the symbol “AFH.” Atlas ordinary shares have been listed on the TSX Venture Exchange (“TSXV”) under the symbol “AFH” since January 6, 2011.
Stabilization
In connection with this offering, the underwriters may, but are not obligated to, engage in stabilizing transactions, over-allotment transactions, syndicate covering transactions and penalty bids.
Stabilizing transactions permit bids to purchase ordinary shares so long as the stabilizing bids do not exceed a specified maximum, and are engaged in for the purpose of preventing or mitigating a decline in the market price of ordinary shares while the offering is in progress.
Over-allotment transactions involve sales by the underwriters of ordinary shares in excess of the number of shares the underwriters are obligated to purchase. This creates a syndicate short position that may be either a covered short position or a naked short position. In a covered short position, the number of ordinary shares over-allotted by the underwriters is not greater than the number of shares that they may purchase in the over-allotment option. In a naked
short position, the number of shares involved is greater than the number of shares in the over-allotment option. The underwriters may close out any short position by exercising their over-allotment option and/or purchasing shares in the open market.
Syndicate covering transactions involve purchases of ordinary shares in the open market after the distribution has been completed in order to cover syndicate short positions. In determining the source of shares to close out the short position, the underwriters will consider, among other things, the price of shares available for purchase in the open market as compared with the price at which they may purchase shares through exercise of the over-allotment option. If the underwriters sell more shares than could be covered by exercise of the over-allotment option and, therefore, have a naked short position, the position can be closed out only by buying shares in the open market. A naked short position is more likely to be created if the underwriters are concerned that after pricing there could be downward pressure on the price of the shares in the open market that could adversely affect investors who purchase in the offering.
Penalty bids permit the underwriters to reclaim a selling concession from a syndicate member when the ordinary shares originally sold by that syndicate member are purchased in stabilizing or syndicate covering transactions to cover syndicate short positions.
These stabilizing transactions, syndicate covering transactions and penalty bids may have the effect of raising or maintaining the market price of our ordinary shares or preventing or mitigating a decline in the market price of our ordinary shares. As a result, the price of our ordinary shares in the open market may be higher than it would otherwise be in the absence of these transactions. Neither we nor the underwriters make any representation or prediction as to the effect that the transactions described above may have on the price of our ordinary shares. These transactions may be effected on the NASDAQ Capital Market, in the over-the-counter market or otherwise and, if commenced, may be discontinued at any time.
Our Relationship with the Underwriters
Certain of the underwriters and/or their affiliates have engaged, and may in the future engage, in commercial and investment banking transactions with us in the ordinary course of their business. They have received, and expect to receive, customary compensation and expense reimbursement for these commercial and investment banking transactions.
Pricing of the Offering
Prior to our public offering, there has been no public market in the United States for our ordinary shares. Our ordinary shares have been exclusively listed on the TSXV under the symbol “AFH” since January 6, 2011. The public offering price will be determined by negotiations among us and the representative of the underwriters. Among the factors considered in determining the public offering price were our results of operations, our current financial condition or future prospects and those of our industry in general, our sales, earnings and certain other financial and operating information in recent periods, our management, and certain financial and operating information of publicly traded companies engaged in activities similar to ours. The assumed initial public offering price referred to in this prospectus is subject to changeproperly treated as a result of market conditions and other factors. Neither we nor the underwriters can assure investors that an active trading market for the shares will develop, or that after the offering the shares will trade in the public market at or above the initial public offering price.U.S. corporation.
U.S. Holders
SHARES ELIGIBLE FOR FUTURE SALE
Our ordinary shares are listed on the TSXV under the symbol AFH. Prior to this offering, there has not been a public market for our ordinary shares in the United States, and there is no guarantee that a market will develop in the United States. Future sales of substantial amounts of shares of our ordinary shares could cause the prevailing market price for our ordinary shares to fall or impair our ability to raise equity capital in the future.
Following the completion of this offering, we will have outstanding 7,644,385 ordinary shares, based on the number of ordinary shares outstanding as of January [•], 2013. This includes3,130,000 ordinary shares that the selling shareholder is selling in this offering, which shares may be resold in the public market immediately following offering.
Of the 6,144,390 ordinary shares outstanding prior to this offering, 757,469 ordinary shares not offered and sold in this offering as well as shares subject to employee stock options and certain options and warrants will be upon issuance, “restricted securities,” as that term is defined in Rule 144 under the Securities Act. These restricted securities are eligible for public sale only if they are registered under the Securities Act or if they qualify for an exemption from registration under Rule 144 or Rule 701 under the Securities Act, which are summarized below.
As a result of the securities described below and subject to the provisions of Rules 144 and 701 under the Securities Act, these restricted securities will be available for sale in the public market as follows:
72,325 shares subject to currently outstanding options, none of which have been exercised as of the date hereof; and
1,327,834 shares subject to currently outstanding warrants, none of which have been exercised as of the date hereof.
Rule 144
In general, under Rule 144 as currently in effect, once we have been subject to public company reporting requirements for at least 90 days, a person who is not deemed to have been one of our affiliates for purposes of the Securities Act at any time during the 90 days preceding a sale and who has beneficially owned the shares proposed to be sold for at least six months, including the holding period of any prior owner other than our affiliates, is entitled to sell those shares without complying with the manner of sale, volume limitation or notice provisions of Rule 144, subject to compliance with the public information requirements of Rule 144. If such a person has beneficially owned the shares proposed to be sold for at least one year, including the holding period of any prior owner other than our affiliates, then that person is entitled to sell those shares without complying with any of the requirements of Rule 144.
In general, under Rule 144, as currently in effect, our affiliates or persons selling shares on behalf of our affiliates are entitled to sell upon the expiration of the lock-up agreements described below, within any three-month period beginning 90 days after the date of this prospectus, a number of shares that does not exceed the greater of:
1% of the number of ordinary shares then outstanding, which will equal approximately 78,110 shares immediately after our offering; or
the average weekly trading volume of the ordinary shares during the four calendar weeks preceding the filing of a notice on Form 144 with respect to such sale.
Sales under Rule 144 by our affiliates or persons selling shares on behalf of our affiliates are also subject to certain manner of sale provisions and notice requirements and to the availability of current public information about us.
Rule 701
In general, under SEC Rule 701 as currently in effect, any of our employees, consultants or advisors who purchase shares from us in connection with a compensatory stock or option plan or other written agreement in a transaction before the effective date of our offering that was completed in reliance on Rule 701 and complied with the requirements of Rule 701 will, subject to the lock-up restrictions described below, be eligible to resell such shares 90 days after the date of this prospectus in reliance on Rule 144, but without compliance with certain restrictions, including the holding period, contained in Rule 144.
Lock-Up Agreements and Market Standoff Provisions
Prior to the date of this prospectus, the directors and officers of the company have entered into a lock-up agreement whereby (i) the directors and officers will not be able to sell their shares for 180 days, and (ii) the selling shareholder will not be able to sell its remaining shares for 180 days following the date of this prospectus.
Registration Rights
We are party to a certain Registration Rights Agreement with Kingsway America Inc. Upon written request of a holder or holders of registrable securities, the company is required to file a registration statement on Form S-3 or any successor form thereto for a public offering of all or any portion of the registrable securities held by the requesting holder or holders, and as long as the reasonably anticipated aggregate price to the public is at least $5,000,000, and the company
The Selling Shareholder is entitled to use Form S-3certain rights with respect to register such registrable securities, then we will be obligated to use our reasonable efforts to register the sale of all registrable securities that holders may request in writing. We will be obligated to prepare and file a registration statement relating to the registrable securities within 45 days after receiving an initial demand notice from the holders. Thereafter, we will use commercially reasonable efforts to cause the registration statement to become effective not later than 90 days from the date of filing. Additionally, we will be required to provide prompt written notice of such registration of the shares owned by it under the Securities Act pursuant to the terms of the company’s registration rights agreement dated as of December 31, 2010 between the company and KAI. These shares are referred to as registrable securities to all holders of outstanding registrable securities at least 30 days prior to filing. Such holders then have 15 days following receipt of such notice to demand their registrable securities be includedand the related registration rights are described in such registration statement. We may postponeadditional detail below.
Piggyback Registration Rights
If the filing of a registration statement for up to 120 days once in a 12 month period if in the good faith judgment of our board of directors such registration would be detrimental to us. These shares currently held by KAI that form a part of this registration statement are being registered following the demand of KAI that such shares be registered. Further, if we registercompany registers any of ourits securities for public sale, wethe company will have to use all commercially reasonable efforts to register all registrable securities that the holders of such securities request in writing be registered within 15 days of mailing of notice by usthe company to all holders of the proposed registration.such holders. However, this right does not apply to a registration relating to any of ourthe company’s stock plans, the offer and sale of debt securities, a corporate reorganization or other transaction under Rule 145 of the Securities Act, or a registration on any registration form that does not include substantially the same information as would be required to be included in a registration statement covering the sale of the registrable securities.Act. The managing underwriterunderwriters of any underwritten offering will have the right to limit, due to marketing reasons, the number of shares registered by these holders.so registered. If the number of securities requested to be included in such offering exceeds the number of shares that can be sold in an orderly manner within a price range acceptable to the company, then the company will include in such registration statement: first, the securities the company proposes to sell; second, the registrable securities requested to be included in such registration; and third, any other securities of the company requested to be included in such registration, in such manner as the company may determine. See “Description of Capital Stock-Registration Rights” for additional information.
Demand Registration Rights
Upon written request of a holder or holders of such registrable securities, the company is required to file a registration statement on Form S-3 or any successor form thereto for a public offering of all or any portion of the registrable securities held by the requesting holder or holders, and as long as the reasonably anticipated aggregate price to the public is at least $5,000,000, and the company is entitled to use Form S-3 to register such registrable securities, then the company will be obligated to use our reasonable efforts to register the sale of all registrable securities that holders may request in writing. The company will be obligated to prepare and file a registration statement relating to the registrable securities within 45 days after receiving an initial demand notice from the holders. Thereafter, the company will use commercially reasonable efforts to cause the registration statement to become effective not later than 90 days from the date of filing. Additionally, the company will be required to provide prompt written notice of such registration of the registrable securities to all holders of outstanding registrable securities at least 30 days prior to filing. Such holders then have 15 days following receipt of such notice to demand their registrable securities be included in such registration statement. The company may postpone the filing of a registration statement for up to 120 days once in a 12 month period if in the good faith judgment of the company’s board of directors such registration would be detrimental to the company. KAI’s shares are being registered pursuant to such demand registration rights. The Company and KAI have agreed that the preparation and filing of this prospectus, and the registration statement on Form S-1 of which this prospectus is a part, will count as a demand registration for purposes of the registration rights agreement.
Registration Expenses
The company will pay all expenses incurred in connection with the piggyback registration rights described above, except for underwriting discounts and selling commissions. The holder or holders or the registrable securities will pay all expenses incurred in connection with the demand registration rights as described above, except for underwriting discounts and selling commissions. All underwriting discounts and selling commissions in connection with any piggyback registration and demand registration described above will be borne by the participating sellers in proportion to the number of registrable securities sold by each or as they may otherwise agree.
Expiration of Registration Rights
The registration rights described above will terminate as to a given holder of registrable securities, when such holder of registrable securities can sell all of such holder’s registrable securities without restriction pursuant to Rule 144(b)(1) promulgated under the Securities Act.
U.S. TAX CONSIDERATIONS
The following is a discussion of the material U.S. federal income and estate tax considerations relating to the purchase, ownership and disposition of our ordinary shares by holders that purchase our ordinary shares pursuant to this offering and hold such ordinary shares as a capital asset within the meaning of Section 1221 of the U.S. Internal Revenue Code of 1986, as amended (the “Code”). This discussion is based on the Code, the U.S. Treasury regulations promulgated thereunder, and administrative and judicial interpretations thereof, all as in effect on the date hereof and all of which are subject to change, possibly with retroactive effect, or to different interpretation. This discussion does not address all of the U.S. federal tax considerations that may be relevant to specific holders in light of their particular circumstances or to Non-U.S. Holders subject to special treatment under U.S. federal income tax law (such as banks, insurance companies, brokers, dealers or traders in securities, commodities or currencies or other holders that mark their securities to market for U.S. federal income tax purposes, foreign governments, international organizations, controlled foreign corporations, passive foreign investment companies, tax-exempt entities, certain former citizens or residents of the United States, persons deemed to sell our ordinary shares under the constructive sale provisions of the Code, or holders that hold our ordinary shares as part of a straddle, hedge, conversion or other integrated transaction). This discussion does not address any U.S. state or local or non-U.S. tax considerations or any U.S. federal gift or alternative minimum tax considerations. The following discussion also assumes we are treated as a U.S. corporation for U.S. federal income tax purposes. See “Risk Factors - U.S.”
As used in this discussion, the term “U.S. Holder” means a beneficial owner of our ordinary shares that is for U.S. federal income tax purposes:
an individual who is a citizen or a resident of the United States;
a corporation created or organized in or under the laws of the United States, any state thereof, or the District of Columbia;
an estate that is subject to U.S. federal income tax on income regardless of its source; or
a trust if (i) it is subject to the primary supervision of a court within the United States and one or more United States persons have the authority to control all of its substantial decisions or (ii) it has in effect a valid election under applicable U.S. Treasury regulations to be treated as a United States person.
A “Non-U.S. Holder” means a beneficial owner of our ordinary shares (other than a partnership) that is not a U.S. Holder.
If an entity treated as a partnership for U.S. federal income tax purposes invests in our ordinary shares, the U.S. federal income tax considerations relating to such investment will depend in part upon the status and activities of such entity and the particular partner and upon certain determinations made at the partner level. Any such entity should consult its own tax advisor regarding the U.S. federal tax considerations applicable to it and its partners relating to the purchase, ownership and disposition of our ordinary shares.
PERSONS CONSIDERING AN INVESTMENT IN OUR ORDINARY SHARES SHOULD CONSULT THEIR OWN TAX ADVISORS REGARDING THE U.S. FEDERAL, STATE AND LOCAL AND NON-U.S. INCOME, ESTATE, GIFT AND OTHER TAX CONSIDERATIONS RELATING TO THE PURCHASE, OWNERSHIP AND DISPOSITION OF OUR ORDINARY SHARES IN LIGHT OF THEIR PARTICULAR CIRCUMSTANCES.
Treatment as a U.S. Corporation
As described above under “Risk Factors-U.S. Tax Risks,” pursuant to certain “expatriation” provisions of the Code, the reverse merger agreement relating to the reverse merger transaction provides that the parties intend to treat our company as a U.S. corporation for U.S. federal income tax purposes. The expatriation provisions are complex, are largely unsettled and subject to differing interpretations, and are subject to change, perhaps retroactively. If our company were not to be treated as a U.S. corporation for U.S. federal income tax purposes, holders could be subject to materially different consequences than those described below. The remainder of this discussion assumes that we are properly treated as a U.S. corporation.
U.S. Holders
Distributions on Ordinary Shares
As described in the section entitled “Dividend Policy,” we do not currently expect to declare or pay dividends on our ordinary shares for the foreseeable future. A U.S. Holder that receives a distribution with respect to our ordinary shares, including a constructive distribution, of cash or property, generally will be required to include the amount of such distribution in gross income as a dividend to the extent of our current and accumulated “earnings and profits,” as computed for U.S. federal income tax purposes. To the extent that a distribution exceeds our current and accumulated “earnings and profits,” such distribution will
be treated first as a tax-free return of capital to the extent of a U.S. Holder’s tax basis in our ordinary shares and thereafter as gain from the sale or exchange of ordinary shares. (See “Sale or exchange of ordinary shares” below.) Dividends received on ordinary shares generally will be eligible for the “dividends received deduction” available to corporate U.S. Holders. Under current law, for taxable years beginning before January 1, 2013, a dividend paid by us generally will be eligible to be taxed at the preferential tax rates applicable to long-term capital gains if the U.S. Holder receiving such dividend is an individual, estate, or trust. A U.S. Holder generally will be eligible for the reduced rate only if the U.S. Holder has held our ordinary shares for more than 60 days during the 121-day period beginning 60 days before the ex-dividend date. The reduced rate does not apply to individual taxpayers who have made an election to treat the dividends as “investment income” that may be offset against investment expense.
Sale or Exchange of Ordinary Shares
A U.S. Holder will recognize gain or loss on the sale or other taxable disposition of our ordinary shares in an amount equal to the difference, if any, between the amount realized on such sale or exchange and the U.S. Holder’s adjusted tax basis in such ordinary shares. A holder’s adjusted tax basis in our ordinary shares generally will equal the holder’s purchase price for that share. Any such gain or loss generally will be capital gain or loss, which will be long-term capital gain or loss if the ordinary shares is held for more than one year. Preferential tax rates presently apply to long-term capital gains of a U.S. Holder that is an individual, estate, or trust. There are presently no preferential tax rates for long-term capital gains of a U.S. Holder that is a corporation. Deductions for capital losses are subject to significant limitations under the Code.
Backup Withholding Tax and Information Reporting Requirements
Unless a holder of ordinary shares is a corporation or other exempt recipient, payments to holders of ordinary shares of dividends or the proceeds of sales or other dispositions of our ordinary shares that are made within the United States or through certain United States-related financial intermediaries may be subject to information reporting. Such payments may also be subject to U.S. federal backup withholding tax if the holder of our ordinary shares fails to supply a correct taxpayer identification number or otherwise fails to comply with applicable U.S. information reporting or certification requirements. Any amount withheld from a payment to a holder of ordinary shares under the backup withholding rules is allowable as a credit against such holder’s U.S. federal income tax and may entitle such holder to a refund, provided that the required information is furnished to the IRS.
Non-U.S. Holders
Distributions on Ordinary Shares
As described in the section entitled “Dividend Policy,” we do not currently expect to declare or pay dividends on our ordinary shares for the foreseeable future. Subject to the discussion below under “-Payments to Foreign Financial Institutions and Non-financial Foreign Entities” and “-Information Reporting and Backup Withholding”, if we make a distribution of cash or other property (other than certain pro rata distributions of our ordinary shares) in respect of our ordinary shares, the distribution will be treated as a dividend to the extent it is paid from our current or accumulated earnings and profits (as determined under U.S. federal income tax principles). If the amount of a distribution exceeds our current and accumulated earnings and profits, such excess generally will be treated first as a tax-free return of capital to the extent of the Non-U.S. Holder’s tax basis in such ordinary shares, and then as gain realized on the sale or other disposition of the ordinary shares and will be treated as described under the section entitled “-Sale, Exchange or Other Disposition of Ordinary Shares” below.
Distributions treated as dividends on our ordinary shares that are paid to or for the account of a Non-U.S. Holder and are not effectively connected with a U.S. trade or business conducted by such Non-U.S. Holder generally will be subject to U.S. federal withholding tax at a rate of 30%, or at a lower rate if provided by an applicable tax treaty and the Non-U.S. Holder provides the documentation (generally, Internal Revenue Service (“IRS”) Form W-8BEN) required to claim benefits under such tax treaty to the applicable withholding agent prior to the payment of the dividends. Non-U.S. Holders that do not timely provide the applicable withholding agent with the required certification, but that qualify for a reduced treaty rate, may obtain a refund of any excess amounts withheld by timely filing an appropriate claim for refund with the IRS.
If, however, a dividend is effectively connected with the conduct of a trade or business in the United States by a Non-U.S. Holder (and, if required by an applicable tax treaty that a Non-U.S. Holder relies upon, is attributable to a permanent establishment maintained by the Non-U.S. Holder in the United States), such dividend generally will not be subject to the 30% U.S. federal withholding tax if such Non-U.S. Holder provides the appropriate documentation (generally, IRS Form W-8ECI) to the applicable withholding agent. Instead, such Non-U.S. Holder generally will be subject to U.S. federal income tax on such dividend in substantially the same manner as a U.S. holder (except as provided by an applicable tax treaty). In addition, a Non-
U.S. Holder that is a corporation may be subject to a branch profits tax at the rate of 30% (or a lower rate if provided by an applicable tax treaty) on its effectively connected earnings and profits for the taxable year, subject to certain adjustments.
Sale, Exchange or Other Disposition of Ordinary Shares
Subject to the discussion below under “-Payments to Foreign Financial Institutions and Non-financial Foreign Entities” and “-Information Reporting and Backup Withholding”, a Non-U.S. Holder generally will not be subject to U.S. federal income tax on gain recognized on the sale, exchange or other disposition of our ordinary shares unless:
we are or have been a “United States real property holding corporation” for U.S. federal income tax purposes at any time during the shorter of (i) the five year period ending on the date of such sale, exchange or disposition and (ii) such Non-U.S. Holder’s holding period with respect to our ordinary shares, and certain other conditions are met;
such gain is effectively connected with the conduct of a trade or business in the United States by such Non-U.S. Holder, in which event such Non-U.S. Holder generally will be subject to U.S. federal income tax on such gain in substantially the same manner as a U.S. holder (except as provided by an applicable tax treaty) and, if it is a corporation, may also be subject to a branch profits tax at the rate of 30% (or a lower rate if provided by an applicable tax treaty) on all or a portion of its effectively connected earnings and profits for the taxable year, subject to certain adjustments; or
such Non-U.S. Holder is an individual who is present in the United States for 183 days or more in the taxable year of such sale, exchange or disposition and certain other conditions are met.
Generally, a corporation is a “United States real property holding corporation” if the fair market value of its United States real property interests equals or exceeds 50% of the sum of the fair market value of its worldwide real property interests and its other assets used or held for use in a trade or business (all as determined for U.S. federal income tax purposes). We do not believe that we are, and we do not presently anticipate that we will become, a United States real property holding corporation.
Payments to Foreign Financial Institutions and Non-financial Foreign Entities
Payments of any dividend on, or any gross proceeds from the sale, exchange or other disposition of, our ordinary shares to a Non-U.S. Holder that is a “foreign financial institution” or a “non-financial foreign entity” (to the extent such dividend or any gain from such sale, exchange or disposition is not effectively connected with the conduct of a trade or business in the United States by such Non-U.S. Holder) generally will be subject to the U.S. federal withholding tax at the rate of 30% unless such Non-U.S. Holder complies with certain additional U.S. reporting requirements or an exception otherwise applies.
For this purpose, a foreign financial institution includes, among others, a non-U.S. entity that (i) is a bank, (ii) holds, as a substantial portion of its business, financial assets for the account of others or (iii) is engaged (or holds itself out as being engaged) primarily in the business of investing, reinvesting or trading in securities, partnership interests, commodities or any interest in securities, partnership interests or commodities (as such terms are defined in the Code). A foreign financial institution generally will be subject to this 30% U.S. federal withholding tax unless it (i) enters into an agreement with the IRS pursuant to which such foreign financial institution agrees (x) to comply with certain information, verification, due diligence, reporting, and other procedures established by the IRS with respect to “United States accounts” (generally depository or custodial accounts maintained by a foreign financial institution (as well as non-traded debt or equity interests in such foreign financial institution) held by one or more “specified United States persons” or foreign entities with one or more “substantial United States owners” (as such terms are defined in the Code) and (y) to withhold on (1) its account holders that either fail to comply with reasonable requests for certain information as specified in the Code or fail to provide certain permissible waivers and (2) its account holders that are foreign financial institutions that do not enter into such an agreement with the IRS or (ii) is otherwise exempted by the IRS in future guidance.
A non-financial foreign entity generally will be subject to this 30% U.S. federal withholding tax unless such entity (i) provides the applicable withholding agent with either (x) a certification that such entity does not have any “substantial United States owners” (as defined in the Code) or (y) information regarding the name, address and taxpayer identification number of each “substantial United States owner” of such entity or (ii) is otherwise exempted by the IRS in future guidance. These reporting requirements generally will not apply to certain specified types of entities, including, but not limited to, a corporation the stock of which is regularly traded on an established securities market and certain affiliated corporations, foreign governments and international organizations.
Although this legislation currently applies to applicable payments made after December 31, 2012, the IRS has recently issued proposed Treasury regulations providing that the withholding provisions described above will generally apply to payments of dividends on our ordinary shares made on or after January 1, 2014, and to payments of gross proceeds from a sale or other disposition of such stock on or after January 1, 2015.
Non-U.S. Holders should consult their own tax advisor regarding the application of these withholding and reporting rules.
Information Reporting and Backup Withholding
Generally, the amount of dividends on our ordinary shares paid to a Non-U.S. Holder, the name and address of the recipient and the amount of any tax withheld from such dividends must be reported annually to the IRS and to the Non-U.S. Holder. In addition, separate information reporting and backup withholding rules that apply to payments to certain U.S. persons generally will not apply to payments with respect to our ordinary shares to a Non-U.S. Holder if such Non-U.S. Holder certifies under penalties of perjury that it is not a United States person (generally by providing an IRS Form W-8BEN) or otherwise establishes an exemption.
Proceeds from the sale, exchange or other disposition of our ordinary shares by a Non-U.S. Holder effected through a non-U.S. office of a U.S. broker or of a non-U.S. broker with certain specified U.S. connections generally will be subject to information reporting (but not backup withholding) unless such Non-U.S. Holder certifies under penalties of perjury that it is not a United States person (generally by providing an IRS Form W-8BEN) or otherwise establishes an exemption. Proceeds from the sale, exchange or other disposition of our ordinary shares by a Non-U.S. Holder effected through a U.S. office of a broker generally will be subject to information reporting and backup withholding unless such Non-U.S. Holder certifies under penalties of perjury that it is not a United States person (generally by providing an IRS Form W-8BEN) or otherwise establishes an exemption.
Backup withholding is not an additional tax. Any amounts withheld under the backup withholding rules generally will be allowed as a refund or a credit against a Non-U.S. Holder’s U.S. federal income tax liability if the required information is furnished by such Non-U.S. Holder on a timely basis to the IRS.
U.S. Federal Estate Tax
In the case of an individual Non-U.S. Holder, ordinary shares owned or treated as owned at such time by such individual will be included in his or her gross estate for U.S. federal estate tax purposes and may be subject to U.S. federal estate tax unless an applicable estate tax treaty provides otherwise.
PLAN OF DISTRIBUTION
The selling shareholder may from time to time, in one or more transactions, sell all or a portion of the offered ordinary shares, in the over‑the‑counter market, on any other national securities exchange on which the ordinary shares are listed or traded, in negotiated transactions, in underwritten transactions or otherwise, at prices then prevailing or related to the then current market price or at negotiated prices. The offering price of the offered ordinary shares from time to time will be determined by the selling shareholder and, at the time of such determination, may be higher or lower than the market price of the ordinary shares on the NASDAQ. In connection with an underwritten offering, underwriters or agents may receive compensation in the form of discounts, concessions or commissions from the selling shareholder or from purchasers of offered ordinary shares for whom they may act as agents, and underwriters may sell offered ordinary shares to or through dealers, and such dealers may receive compensation in the form of discounts, concessions or commissions from the underwriters and/or commissions from the purchasers for whom they may act as agents. Under agreements that may be entered into by us, underwriters, dealers and agents who participate in the distribution of offered ordinary shares may be entitled to indemnification by us against certain liabilities, including liabilities under the Securities Act, or to contribution with respect to payments which such underwriters, dealers or agents may be required to make in respect thereof. The offered ordinary shares may be sold directly or through broker‑dealers acting as principal or agent, or pursuant to a distribution by one or more underwriters on a firm commitment or best‑efforts basis. The methods by which the offered ordinary shares may be sold include: (a) a block trade in which the broker‑dealer so engaged will attempt to sell the offered ordinary shares as agent but may position and resell a portion of the block as principal to facilitate the transaction; (b) purchases by a broker‑dealer as principal and resale by such broker‑dealer for its account pursuant to this prospectus; (c) ordinary brokerage transactions and transactions in which the broker solicits purchasers; (d) privately negotiated transactions; (e) underwritten transactions; (f) sales in other ways not involving market makers or established trading markets, including direct sales to institutions or individual purchasers; and (g) a combination of the foregoing methods or by any other legally available means. The selling shareholders and any underwriters, dealers or agents participating in the distribution of the offered ordinary shares may be deemed to be “underwriters” within the meaning of the Securities Act, and any profit on the sale of the offered ordinary shares by the selling shareholder and any commissions received by any such broker‑dealers may be deemed to be underwriting commissions under the Securities Act.
When the selling shareholder elects to make a particular offer of ordinary shares, a prospectus supplement, if required, will be distributed which will identify any underwriters, dealers or agents and any discounts, commissions and other terms constituting compensation from the selling shareholder and any other required information will be identified in a prospectus supplement.
LEGAL MATTERS
The validity of the ordinary shares offered hereby will be passed upon for us by Conyers Dill & Pearman Ltd. Ellenoff Grossman & Schole(Cayman) Limited. DLA Piper LLP New York, New York(US) is acting as United States securities counsel to Atlas. Sidley Austin LLP, Chicago, IL is acting as counsel to the underwriters.
EXPERTS
Johnson Lambert LLP, an independent registered public accounting firm, has audited our consolidated financial statements for the yearyears ended December 31, 2012 and December 31, 2011, as set forth in their report. For the year ended December 31, 2010, KPMG LLP audited our consolidated financial statements, as set forth in their report.
KPMG LLP was discharged on June 20, 2011. KPMG LLP had not issued a report in the last two fiscal years containing a disclaimer or adverse opinion, or that was qualified or modified. Our decision to discharge KPMG LLP was approved by our audit committee and board or directors. We had no disagreements with KPMG LLP at any time during their tenure as our independent accountant as to a matter of accounting principles or practices, financial statement disclosures, or auditing scope or procedures, which disagreements if not resolved to their satisfaction would have caused them to make reference to the subject matter of the disagreement in their report, nor have there been any reportable events.
We have included our financial statements in the prospectus and elsewhere in the registration statement in reliance on both Johnson Lambert LLP’s and KPMG LLP’s report, given their authority as experts in accounting and auditing.
Brown Smith Wallace LLC, an independent public accounting firm, has audited, under U.S. Generally Accepted Auditing Standards, the consolidated financial statements of Camelot Services, Inc. and its sole subsidiary Gateway Insurance Company, a non-issuer entity, for the years ended December 31, 20112012 and December 31, 2010,2011, as set forth in their report. We have included the financial statements of Camelot Services in the prospectus in reliance on Brown Smith Wallace LLC’s report, given their authority as experts in accounting and auditing.
WHERE YOU CAN FIND ADDITIONAL INFORMATION
We have filed with the SEC a registration statement on Form S-1 under the Securities Act with respect to the ordinary shares offered hereby. This prospectus, which constitutes a part of the registration statement, does not contain all of the information set forth in the registration statement or the exhibits filed therewith. For further information about us and the ordinary offered hereby, reference is made to the registration statement and the exhibits filed therewith. Statements contained in this prospectus regarding the contents of any contract or any other document that is filed as an exhibit to the registration statement are not necessarily complete, and in each instance we refer you to the copy of such contract or other document filed as an exhibit to the registration statement. We currently file periodic reports, proxy statements and other information with the SEC pursuant to the Exchange Act. A copy of the registration statement and the exhibits filed therewith and such reports, proxy statements and other information may be inspected without charge at the public reference room maintained by the SEC, located at 100 F Street, NE, Washington, DC 20549, and copies of all or any part of the registration statement and such reports, proxy statements and other information may be obtained from that office. Please call the SEC at 1-800-SEC-0330 for further information about the public reference room. The SEC also maintains a website that contains reports, proxy and information statements and other information regarding registrants that file electronically with the SEC. The address of the website is www.sec.gov.
Atlas Financial Holdings, Inc. is also listed on the TSX Venture Exchange (TSXV) under the trading symbol AFH. Additional information relating to Atlas is available on SEDAR at www.sedar.com, which can also be accessed from our website at www.atlas-fin.com. This information is not deemed part of or incorporated by reference to this registration statement.
INDEX TO FINANCIAL STATEMENTS
Atlas Financial Holdings, Inc.
Audited Consolidated Financial Statements
Unaudited Condensed Consolidated Financial Statements
Camelot Services, Inc.
Audited Consolidated Financial Statements
Unaudited Consolidated Financial Statements
REPORT OF INDEPENDENT REGISTERED PUBLIC ACCOUNTING FIRM
The Board of Directors
Atlas Financial Holdings, Inc.:
We have audited the accompanying consolidated statement of financial position of Atlas Financial Holdings, Inc. and subsidiaries (the Company) as of December 31, 2010, and the related consolidated statements of comprehensive income, shareholders’ equity, and cash flows for the year then ended. These consolidated financial statements are the responsibility of the Company’s management. Our responsibility is to express an opinion on these consolidated financial statements based on our audit.
We conducted our audit in accordance with the auditing standards of the Public Company Accounting Oversight Board (United States). Those standards require that we plan and perform the audit to obtain reasonable assurance about whether the financial statements are free of material misstatement. The Company is not required to have, nor were we engaged to perform, an audit of its internal control over financial reporting. Our audit included consideration of internal control over financial reporting as a basis for designing audit procedures that are appropriate in the circumstances, but not for the purpose of expressing an opinion on the effectiveness of the Company’s internal control over financial reporting. Accordingly, we express no such opinion. An audit also includes examining, on a test basis, evidence supporting the amounts and disclosures in the financial statements, assessing the accounting principles used and significant estimates made by management, as well as evaluating the overall financial statement presentation. We believe that our audit provides a reasonable basis for our opinion.
In our opinion, the consolidated financial statements referred to above present fairly, in all material respects, the financial position of Atlas Financial Holdings, Inc. as of December 31, 2010, and the results of its operations and its cash flows for the year then ended in conformity with U.S. generally accepted accounting principles.
/s/ KPMG LLP
Chicago, IL
April 15, 2011
Report of Independent Registered Public Accounting Firm
To The Board of Directors and Shareholders
Atlas Financial Holdings, Inc.
We have audited the accompanying consolidated statementstatements of financial position of Atlas Financial Holdings, Inc. (”("the Company”Company") as of December 31, 2012 and 2011, and the related consolidated statements of income and comprehensive income, shareholders’shareholders' equity and cash flows for the periodyears ended December 31, 2012 and 2011. Our audits also include the financial statement schedules listed in Item 15 of the Company's Form 10-K. These consolidated financial statements and financial statement schedules listed on Item 15 of the Company’s Form 10-K are the responsibility of the Company’sCompany's management. Our responsibility is to express an opinion on these financial statements based on our audit.audits.
We conducted our auditaudits in accordance with the standards of the Public Company Accounting Oversight Board (United States). Those standards require that we plan and perform the audit to obtain reasonable assurance about whether the financial statements are free of material misstatement. The Company is not required to have, nor were we engaged to perform, an audit of its internal control over financial reporting. Our audit included consideration of internal control over financial reporting as a basis for designing audit procedures that are appropriate in the circumstances, but not for the purpose of expressing an opinion on the effectiveness of the company’sCompany's internal control over financial reporting. Accordingly, we express no such opinion. An audit also includes examining, on a test basis, evidence supporting the amounts and disclosures in the financial statements, assessing the accounting principles used and significant estimates made by management, as well as evaluating the overall financial statement presentation. We believe that our audit providesaudits provide a reasonable basis for our opinion.
In our opinion, the consolidated financial statements referred to above present fairly, in all material respects, the consolidated financial position of Atlas Financial Holdings, IncInc. as of December 31, 2012 and 2011, and the results of its operations and its cash flows for the periodyears then ended, December 31, 2011, in conformity with accounting principles generally accepted in the United States of America. Also in our opinion, the related financial statement schedules, when considered in relation to the basic consolidated financial statements taken as a whole, present fairly, in all material respects, the information set forth therein.
/s/ Johnson Lambert & Co. LLP
Arlington Heights, Illinois
March 26, 201218, 2013
(except for Note 18, as to which the date is January 17, 2013)
ATLAS FINANCIAL HOLDINGS, INC.
CONSOLIDATED STATEMENTS OF FINANCIAL POSITION
| | | (in '000s, except for share and per share data) | | | | December 31,
2012 | | December 31,
2011 |
| | December 31, | |
| 2011 | | 2010 | |
| Assets | | | | | | |
| Investments, available for sale | | | | | | |
| Fixed income securities, at fair value (Amortized cost $101,473 and $148,531) | $ | 103,491 |
| | $ | 154,011 |
| |
| Equity securities, at fair value (cost $994 and $0) | 1,141 |
| | — |
| |
| Fixed income securities, at fair value (Amortized cost $95,423 and $101,473) | | $ | 98,079 |
| | $ | 103,491 |
|
| Equity securities, at fair value (cost $1,563 and $994) | | 1,571 |
| | 1,141 |
|
| Other investments | | 1,262 |
| | — |
|
| Total Investments | 104,632 |
| | 154,011 |
| 100,912 |
| | 104,632 |
|
| Cash and cash equivalents | 23,249 |
| | 19,037 |
| 19,912 |
| | 23,249 |
|
| Accrued investment income | 586 |
| | 1,293 |
| 517 |
| | 586 |
|
| Accounts receivable and other assets (Net of allowance of $4,254 and $4,212) | 9,579 |
| | 13,340 |
| |
| Accounts receivable and other assets (Net of allowance of $484 and $4,254) | | 21,923 |
| | 9,579 |
|
| Reinsurance recoverables, net | 8,044 |
| | 4,277 |
| 6,020 |
| | 8,044 |
|
| Prepaid reinsurance premiums | 2,214 |
| | 6,999 |
| 2,111 |
| | 2,214 |
|
| Deferred policy acquisition costs | 3,020 |
| | 3,804 |
| 3,764 |
| | 3,020 |
|
| Deferred tax asset, net | 6,775 |
| | 6,399 |
| 6,605 |
| | 6,775 |
|
| Software and office equipment, net | 440 |
| | 1,274 |
| 1,137 |
| | 440 |
|
| Assets held for sale | 13,634 |
| | 15,004 |
| 166 |
| | 13,634 |
|
| Total Assets | $ | 172,173 |
| | $ | 225,438 |
| $ | 163,067 |
| | $ | 172,173 |
|
| | | | | | | |
| Liabilities | | | | | | |
| Claims liabilities | $ | 91,643 |
| | $ | 132,579 |
| $ | 70,067 |
| | $ | 91,643 |
|
| Unearned premiums | 15,691 |
| | 17,061 |
| 25,457 |
| | 15,691 |
|
| Due to reinsurers and other insurers | 5,701 |
| | 9,614 |
| 3,803 |
| | 5,701 |
|
| Other liabilities and accrued expenses | 2,884 |
| | 6,015 |
| 3,876 |
| | 2,884 |
|
| Total Liabilities | $ | 115,919 |
| | $ | 165,269 |
| $ | 103,203 |
| | $ | 115,919 |
|
| | | | | | | |
| Shareholders’ Equity | | | | | | |
| Preferred shares, par value per share $0.001, 100,000,000 shares authorized, 18,000,000 shares issued and outstanding at December 31, 2011 and December 31, 2010. Liquidation value $1.00 per share | $ | 18,000 |
| | $ | 18,000 |
| |
| Ordinary shares, par value per share $0.003, 266,666,667 shares authorized, 1,541,842 shares issued and outstanding at December 31, 2011 and 1,517,834 at December 31, 2010 | 4 |
| | 4 |
| |
| Restricted voting common shares, par value per share $0.003, 33,333,334 shares authorized, 4,601,621 shares issued and outstanding at December 31, 2011 and December 31, 2010 | 14 |
| | 14 |
| |
| Preferred shares, par value per share $0.001, 100,000,000 shares authorized, 18,000,000 shares issued and outstanding at December 31, 2012 and December 31, 2011. Liquidation value $1.00 per share | | $ | 18,000 |
| | $ | 18,000 |
|
| Ordinary shares, par value per share $0.003, 266,666,667 shares authorized, 2,256,924 shares issued and outstanding at December 31, 2012 and 1,541,842 at December 31, 2011 | | 4 |
| | 4 |
|
| Restricted voting common shares, par value per share $0.003, 33,333,334 shares authorized, 3,887,471 shares issued and outstanding at December 31, 2012 and 4,601,621 at December 31, 2011 | | 14 |
| | 14 |
|
| Additional paid-in capital | 152,652 |
| | 152,464 |
| 152,768 |
| | 152,652 |
|
| Retained deficit | (115,841 | ) | | (113,371 | ) | (112,675 | ) | | (115,841 | ) |
| Accumulated other comprehensive income, net of tax | 1,425 |
| | 3,056 |
| 1,753 |
| | 1,425 |
|
| Total Shareholders’ Equity | $ | 56,254 |
| | $ | 60,167 |
| 59,864 |
| | 56,254 |
|
| Total Liabilities and Shareholders’ Equity | $ | 172,173 |
| | $ | 225,436 |
| $ | 163,067 |
| | $ | 172,173 |
|
| | | | | |
| See accompanying Notes to Consolidated Financial Statements. | | | | |
See accompanying Notes to Consolidated Financial Statements.
ATLAS FINANCIAL HOLDINGS, INC.
CONSOLIDATED STATEMENTS OF INCOME AND COMPREHENSIVE INCOME
(in '000s, except for share and per share data)
|
| | | | | | | | |
| (in ‘000s, except for shares and per share data) | | | | |
| | Year ended December 31, | |
| | 2011 | | 2010 | |
| Net premiums earned | $ | 35,747 |
| | $ | 53,603 |
| |
| Net claims incurred | 28,994 |
| | 48,074 |
| |
| Acquisition costs | 7,294 |
| | 11,115 |
| |
| Other underwriting expenses | 10,697 |
| | 18,398 |
| |
| Underwriting loss | (11,238 | ) | | (23,984 | ) | |
| Net investment income | 3,280 |
| | 4,616 |
| |
| Net investment gains | 4,201 |
| | 888 |
| |
| Other income (expense), net | 124 |
| | (757 | ) | |
| Loss from operations before income tax (benefit)/expense | (3,633 | ) | | (19,237 | ) | |
| Income tax (benefit)/expense | (1,163 | ) | | 2,575 |
| |
| Net loss attributable to Atlas | $ | (2,470 | ) | | $ | (21,812 | ) | |
| | | | | |
| Other comprehensive loss: | | | | |
| Changes in net unrealized gains (losses) | $ | 154 |
| | $ | 3,514 |
| |
| Reclassification to income of net (gains) losses | (3,469 | ) | | (203 | ) | |
| Effect of income tax | — |
| | — |
| |
| Pension Liability | | | | |
| Settlement of pension plan | 2,473 |
| | — |
| |
| Minimum pension liability adjustment | — |
| | (153 | ) | |
| Effect of income tax | (789 | ) | | — |
| |
| Other comprehensive (loss)/income for the period | (1,631 | ) | | 3,158 |
| |
| Total comprehensive loss | (4,101 | ) | | (18,654 | ) | |
| | | | | |
| | | | | |
| Basic weighted average common shares outstanding | 6,124,542 |
| | 6,119,455 |
| |
| Loss per common share, basic | $ | (0.54 | ) | | $ | (3.56 | ) | |
| Diluted weighted average common shares outstanding | 6,124,542 |
| | 6,119,455 |
| |
| Loss per common share, diluted | $ | (0.54 | ) | | $ | (3.56 | ) | |
| | | | | |
| See accompanying Notes to Consolidated Financial Statements | | | | |
| | | | | |
| | | | | |
|
| | | | | | | |
| Consolidated Statements of Income | | | |
| | Year Ended December 31, |
| | 2012 | | 2011 |
| Net premiums earned | $ | 38,709 |
| | $ | 35,747 |
|
| Net investment income | 2,453 |
| | 3,280 |
|
| Net investment gains | 1,435 |
| | 4,147 |
|
| Other income | 194 |
| | 178 |
|
| Total revenue | 42,791 |
| | 43,352 |
|
| Net claims incurred | 26,545 |
| | 28,994 |
|
| Acquisition costs | 6,471 |
| | 7,294 |
|
| Other underwriting expenses | 6,609 |
| | 10,697 |
|
| Total expenses | 39,625 |
| | 46,985 |
|
| Income/(loss) from operations before income tax expense/(benefit) | 3,166 |
| | (3,633 | ) |
| Income tax expense/(benefit) | — |
| | (1,163 | ) |
| Net income/(loss) attributable to Atlas | 3,166 |
| | (2,470 | ) |
| Less: Preferred share dividends | 810 |
| | 810 |
|
| Net income/(loss) attributable to common shareholders | $ | 2,356 |
| | $ | (3,280 | ) |
| | | | |
| Basic weighted average common shares outstanding | 6,144,281 |
| | 6,124,542 |
|
| Earnings/(loss) per common share, basic | $ | 0.38 |
| | $ | (0.54 | ) |
| Diluted weighted average common shares outstanding | 8,434,948 |
| | 6,124,542 |
|
| Earnings/(loss) per common share, diluted | $ | 0.38 |
| | $ | (0.54 | ) |
| | | | |
| Consolidated Statements of Comprehensive Income | | | |
| | | | |
| Net income/(loss) attributable to Atlas | $ | 3,166 |
| | $ | (2,470 | ) |
| Changes in net unrealized gains | 1,446 |
| | 154 |
|
| Reclassification to income of net realized gains | (948 | ) | | (3,469 | ) |
| Settlement of pension plan | — |
| | 2,473 |
|
| Effect of income tax | (170 | ) | | (789 | ) |
| Other comprehensive income/(loss) for the period | 328 |
| | (1,631 | ) |
| Total comprehensive income/(loss) | $ | 3,494 |
| | $ | (4,101 | ) |
| | | | |
See accompanying Notes to Consolidated Financial Statements.
ATLAS FINANCIAL HOLDINGS, INC.
CONSOLIDATED STATEMENTS OF SHAREHOLDERS’ EQUITY
| | | (in ‘000s) | | | | | | | | | | | | | |
| | Preferred Shares | | Ordinary Shares | | Restricted Voting Common Shares | | Additional Paid-in Capital | | Retained Deficit | | Accumulated Other Comprehensive Income (loss) | | Total | |
| Balance December 31, 2009 | $ | 18,000 |
| | $ | 4 |
| | $ | 14 |
| | $ | 82,675 |
| | $ | (47,714 | ) | | $ | (433 | ) | | $ | 52,546 |
| |
| Net loss |
| |
| |
| |
| | (21,812 | ) | |
| | (21,812 | ) | |
| Capital Contribution |
| |
| |
| | 26,994 |
| | | |
| | 26,994 |
| |
| Dividends Paid |
| |
| |
| | (16,700 | ) | | | |
| | (16,700 | ) | |
| Merger of Southern United |
| |
| |
| | 59,944 |
| | (43,845 | ) | | 331 | | 16,430 |
| |
| Forgiveness of debt |
| |
| |
| | (447 | ) | |
| | | | (447 | ) | |
| Other comprehensive income |
| |
| |
| |
| |
| | 3,158 |
| | 3,158 |
| |
| (in '000s) | | Preferred Shares | | Ordinary shares | | Restricted Voting Common Shares | | Additional Paid-in Capital | | Retained Deficit | | Accumulated Other Comprehensive Income | | Total |
| Balance December 31, 2010 | $ | 18,000 |
| | $ | 4 |
| | $ | 14 |
| | $ | 152,466 |
| | $ | (113,371 | ) | | $ | 3,056 |
| | $ | 60,169 |
| $ | 18,000 |
| | $ | 4 |
| | $ | 14 |
| | $ | 152,466 |
| | $ | (113,371 | ) | | $ | 3,056 |
| | $ | 60,169 |
|
| Net loss |
| |
| |
| |
| | (2,470 | ) | |
| | (2,470 | ) | | | | | | | | | (2,470 | ) | | | | (2,470 | ) |
| Other comprehensive loss |
| |
| |
| |
| |
| | (3,315 | ) | | (3,315 | ) | | | | | | | | | | | (3,315 | ) | | (3,315 | ) |
| Share-based compensation |
| |
| |
| | 113 |
| |
| | | | 113 |
| | | | | | | 113 |
| | | | | | 113 |
|
| Stock options exercised |
| |
| |
| | 73 |
| |
| | | | 73 |
| | | | | | | 73 |
| | | | | | 73 |
|
| Settlement of pension plan, net of tax |
| |
| |
| |
| |
| | 1,684 |
| | 1,684 |
| |
| Settlement of Pension Plan | | | | | | | | | | | | 1,684 |
| | $ | 1,684 |
|
| Balance December 31, 2011 | $ | 18,000 |
| | $ | 4 |
| | $ | 14 |
| | $ | 152,652 |
| | $ | (115,841 | ) | | $ | 1,425 |
| | $ | 56,254 |
| $ | 18,000 |
| | $ | 4 |
| | $ | 14 |
| | $ | 152,652 |
| | $ | (115,841 | ) | | $ | 1,425 |
| | $ | 56,254 |
|
Net income
| | | | | | | | | | 3,166 |
| | | | 3,166 |
|
| Other comprehensive income | | | | | | | | | | | | 328 |
| | 328 |
|
| Share-based compensation | | | | | | | | 113 |
| | | | | | 113 |
|
| Stock options exercised | | | | | | | | 3 |
| | | | | | 3 |
|
| Balance December 31, 2012 | | $ | 18,000 |
| | $ | 4 |
| | $ | 14 |
| | $ | 116 |
| | $ | (112,675 | ) | | $ | 1,753 |
| | $ | 59,864 |
|
| | | | | | | | | | | | | | | | | | | | | | | | | | | |
| See accompanying Notes to Consolidated Financial Statements. | See accompanying Notes to Consolidated Financial Statements. | | | | | | | | | See accompanying Notes to Consolidated Financial Statements. |
ATLAS FINANCIAL HOLDINGS, INC.
CONSOLIDATED STATEMENTS OF CASH FLOWS
| | | (in ‘000s) | | | |
| ($ in thousands) | | | | |
| | Year Ended December 31, | Year Ended December 31, |
| | 2011 | | 2010 | 2012 | | 2011 |
| Operating Activities | | | | | | |
| Net loss | $ | (2,470 | ) | | $ | (21,812 | ) | |
| Net income/loss | | $ | 3,166 |
| | $ | (2,470 | ) |
| Adjustments to reconcile net loss to net cash used by operating activities: | | | | | | |
| Forgiveness of mortgage loan | — |
| | 1,695 |
| |
| Amortization of fixed assets | 218 |
| | 3,370 |
| 315 |
| | 218 |
|
| Settlement of pension plan | 2,544 |
| | — |
| |
| Deferred employee benefit costs | | — |
| | 2,657 |
|
| Share-based compensation expense | 113 |
| | — |
| 113 |
| | 113 |
|
| (Gain)/loss on sale of fixed assets | (54 | ) | | 3 |
| — |
| | (54 | ) |
| Amortization of deferred gain on sale of headquarters building | | (26 | ) | | — |
|
| Deferred income taxes | (1,163 | ) | | 2,875 |
| — |
| | (1,163 | ) |
| Net realized gains | (4,147 | ) | | (891 | ) | (1,435 | ) | | (4,147 | ) |
| Amortization of bond premiums and discounts | 953 |
| | 1,431 |
| 921 |
| | 953 |
|
| Net changes in operating assets and liabilities, net of effects of the merger of subsidiary: | | | | |
| Net changes in operating assets and liabilities: | | | | |
| Accounts receivable and other assets, net | 3,762 |
| | 13,074 |
| (12,344 | ) | | 3,762 |
|
| Due from reinsurers and other insurers | 1,018 |
| | (5,255 | ) | 2,127 |
| | 1,018 |
|
| Deferred policy acquisition costs | 784 |
| | 5,750 |
| (744 | ) | | 784 |
|
| Income taxes receivable | — |
| | 271 |
| |
| Other assets and accrued investment income | 707 |
| | 493 |
| 69 |
| | 707 |
|
| Unpaid claims | (40,936 | ) | | (36,936 | ) | (21,576 | ) | | (40,936 | ) |
| Unearned premium | (1,370 | ) | | (16,789 | ) | 9,766 |
| | (1,370 | ) |
| Due to reinsurers and other insurers | (3,913 | ) | | 9,193 |
| (1,898 | ) | | (3,913 | ) |
| Accounts payable and accrued liabilities | (3,207 | ) | | (1,472 | ) | 805 |
| | (3,320 | ) |
| Net change in other balances | — |
| | (7,466 | ) | |
| Net cash used by operating activities | $ | (47,161 | ) | | $ | (52,466 | ) | (20,741 | ) | | (47,161 | ) |
| Financing activities: | | | | |
| Capital contributions | $ | — |
| | $ | — |
| |
| Options exercised | 73 |
| | | |
| Dividends paid | — |
| | (16,700 | ) | |
| Issuance of notes payable | — |
| | — |
| |
| Net cash provided/(used) by financing activities | $ | 73 |
| | $ | (16,700 | ) | |
| Investing activities: | | | | | | |
| Purchase of securities | $ | (64,563 | ) | | $ | (25,826 | ) | (53,470 | ) | | (64,563 | ) |
| Acquisition of other investments | | (1,250 | ) | | — |
|
| Proceeds from sales and maturities of securities | 113,823 |
| | 106,684 |
| 59,452 |
| | 113,823 |
|
| Sale of assets held for sale | 2,436 |
| | — |
| 13,342 |
| | 2,436 |
|
| Cash acquired from merger of subsidiary | — |
| | 3,871 |
| |
| Net (purchases)/additions of software and other equipment | (396 | ) | | (3,221 | ) | |
| Net additions of software and other equipment | | (673 | ) | | (396 | ) |
| Net cash provided by investing activities | $ | 51,300 |
| | $ | 81,508 |
| 17,401 |
| | 51,300 |
|
| Financing activities: | | | | |
| Options exercised | | 3 |
| | 73 |
|
| Net cash provided by financing activities | | 3 |
| | 73 |
|
| Net change in cash and cash equivalents | 4,212 |
| | 12,342 |
| (3,337 | ) | | 4,212 |
|
| Cash and cash equivalents, beginning of year | 19,037 |
| | 6,695 |
| 23,249 |
| | 19,037 |
|
| Cash and cash equivalents, end of year | $ | 23,249 |
| | $ | 19,037 |
| $ | 19,912 |
| | $ | 23,249 |
|
| Supplementary disclosure of cash information: | | | | | | |
| Represented by: | | | | |
| Cash on hand and balances with banks | $ | 23,249 |
| | $ | 2,329 |
| |
| Investments with original maturities less than 30 days | — |
| | 16,708 |
| |
| Cash and cash equivalents, end of year | $ | 23,249 |
| | $ | 19,037 |
| |
| Cash paid for: | | | | | | |
| Interest | — |
| | — |
| — |
| | — |
|
| Income taxes | — |
| | (227 | ) | — |
| | — |
|
| | | | | | | |
See accompanying Notes to Consolidated Financial Statements. | | | | | | | | |
| |
1. | NATURE OF OPERATIONS AND SUMMARYBASIS OF SIGNIFICANT ACCOUNTING POLICIESPRESENTATION |
(All amounts in thousands of US dollars, except for amounts preceded by “C” as thousands of Canadian dollars, share and per share amounts)
Formation and Description of the Business (shares shown in this section reflect pre-split values)
Atlas Financial Holdings, Inc. (“Atlas”, or “The Company”("Atlas") is a financial services holding company formed on December 31, 2010 in a transaction amongst:
| |
(a) | JJR VI Acquisition Corporation (“JJR VI”), a Canadian Capital Pool Company sponsored by JJR Capital, a Toronto based merchant bank, |
| |
(b) | American Insurance Acquisition Inc., (“American Acquisition”), a corporation formed under the laws of Delaware by Kingsway America Inc. (“KAI”), a subsidiary of Kingsway Financial Services Inc. (“KFSI”), a Canadian public company formed under the laws of Ontario and whose shares are traded on the Toronto and New York Stock Exchanges, and |
| |
(c) | Atlas Acquisition Corp, a Delaware corporation formed by JJR VI. |
Prior to the transaction, KAI transferred 100% of the capital stock of American Service Insurance Company (“American Service”) and American Country Insurance Company (“American Country,” together with American Service the “insurance subsidiaries”), to American Acquisition in exchange for common and preferred shares of American Acquisition and promissory notes aggregating C$60,780. In addition, American Acquisition raised C$7,967 through a private placement offering of subscription receipts to qualified investors at a price of C$2.00 per subscription receipt.
All references to share counts and per share values in connection with the reverse merger transaction are presented prior to the one-for-three reverse stock split. KAI received 13,804,861 restricted voting common shares valued at $27,760, along with 18,000,000 non-voting preferred shares valued at $18,000 and C$7,967 cash in exchange for 100% of the outstanding shares of American Acquisition and full payment of the promissory notes. Investors in the American Acquisition subscription receipts received 1,327,834 ordinary shares plus warrants to purchase one ordinary voting common share for each subscription receipt at C$6.00 at any time until December 31, 2013. JJR VI common shares held by former shareholders of JJR VI were consolidated on the basis of one post-consolidation JJR VI common share for every 10 pre-consolidation JJR VI common shares. The post-consolidation JJR VI common shares were then exchanged on a one-for-one basis for ordinary shares of Atlas.
Atlas commenced operations on December 31, 2010. Atlas ordinary shares have been listed on the TSX Venture Exchange (“TSXV”) under the symbol “AFH” since January 6, 2011.
The primary business of Atlas is underwriting commercial automobile insurance in the United States, with a niche market orientation and focus on insurance for the “light” commercial automobile sector. This sector includingincludes taxi cabs, non-emergency paratransit,para-transit, limousine, livery and business auto. autos. Automobile insurance products provide insurance coverage in three major areas: liability, accident benefits and physical damage. Liability insurance provides coverage subject to policy terms and conditions where the insured is determined to be responsible and/or liable for an automobile accident, for the payment for injuries and property damage to third parties. Accident benefit policies or personal injury protection policies provide coverage for loss of income, medical and rehabilitation expenses for insured persons who are injured in an automobile accident, regardless of fault. Physical damage coverage subject to policy terms and conditions provides for the payment of damages to an insured automobile arising from a collision with another object or from other risks such as fire or theft. In the short run, automobile physical damage and liability coverage generally provides more predictable results than automobile accident benefit or personal injury insurance.
TheAtlas' business of the Company is carried onout through its insurance subsidiaries.subsidiaries: American Country Insurance Company (“American Country”), American Service Insurance Company, Inc. (“American Service”) and, as of January 1st, 2013, Gateway Insurance Company ("Gateway"). The insurance subsidiaries distribute their insurance products through a network of retail independent agents. Together, American Country and American Servicethe insurance subsidiaries are licensed to write property and casualty insurance in 47 states in the United States. The insurance subsidiaries share common management and operating infrastructure .
Atlas Ordinary shares have been listed on the TSX Venture Exchange (“TSXV”) under the symbol “AFH” since January 6, 2011. Atlas ordinary shares became listed on the NASDAQ stock exchange on February 11, 2013.
Basis of American Country is integratedpresentation - These statements have been prepared in conformity with thataccounting principles generally accepted in the United States of American Service.America ("U.S. GAAP"). All significant intercompany accounts and transactions have been eliminated. To conform to the current year presentation, certain amounts in the prior years’ consolidated financial statements and notes have been reclassified.
On February 25, 2010, while under KAI ownership, Southern United Fire Insurance Company (Southern United) merged into American Service. The transaction was accounted for as a merger of companies under common controlBeginning with the Southern United assets and liabilities included at their carrying values andyear ended December 31, 2012, Atlas has changed where certain items appear on its resultsStatement of operations included in the financial statements from the dateComprehensive Income according to Rule 7-04 of the merger.Regulation S-X.
SummaryCONSOLIDATED STATEMENTS OF FINANCIAL POSITION
|
| | | | | | | |
| (in '000s, except for share and per share data) | December 31,
2012 | | December 31,
2011 |
| Assets | | | |
| Investments, available for sale | | | |
| Fixed income securities, at fair value (Amortized cost $95,423 and $101,473) | $ | 98,079 |
| | $ | 103,491 |
|
| Equity securities, at fair value (cost $1,563 and $994) | 1,571 |
| | 1,141 |
|
| Other investments | 1,262 |
| | — |
|
| Total Investments | 100,912 |
| | 104,632 |
|
| Cash and cash equivalents | 19,912 |
| | 23,249 |
|
| Accrued investment income | 517 |
| | 586 |
|
| Accounts receivable and other assets (Net of allowance of $484 and $4,254) | 21,923 |
| | 9,579 |
|
| Reinsurance recoverables, net | 6,020 |
| | 8,044 |
|
| Prepaid reinsurance premiums | 2,111 |
| | 2,214 |
|
| Deferred policy acquisition costs | 3,764 |
| | 3,020 |
|
| Deferred tax asset, net | 6,605 |
| | 6,775 |
|
| Software and office equipment, net | 1,137 |
| | 440 |
|
| Assets held for sale | 166 |
| | 13,634 |
|
| Total Assets | $ | 163,067 |
| | $ | 172,173 |
|
| | | | |
| Liabilities | | | |
| Claims liabilities | $ | 70,067 |
| | $ | 91,643 |
|
| Unearned premiums | 25,457 |
| | 15,691 |
|
| Due to reinsurers and other insurers | 3,803 |
| | 5,701 |
|
| Other liabilities and accrued expenses | 3,876 |
| | 2,884 |
|
| Total Liabilities | $ | 103,203 |
| | $ | 115,919 |
|
| | | | |
| Shareholders’ Equity | | | |
| Preferred shares, par value per share $0.001, 100,000,000 shares authorized, 18,000,000 shares issued and outstanding at December 31, 2012 and December 31, 2011. Liquidation value $1.00 per share | $ | 18,000 |
| | $ | 18,000 |
|
| Ordinary shares, par value per share $0.003, 266,666,667 shares authorized, 2,256,924 shares issued and outstanding at December 31, 2012 and 1,541,842 at December 31, 2011 | 4 |
| | 4 |
|
| Restricted voting common shares, par value per share $0.003, 33,333,334 shares authorized, 3,887,471 shares issued and outstanding at December 31, 2012 and 4,601,621 at December 31, 2011 | 14 |
| | 14 |
|
| Additional paid-in capital | 152,768 |
| | 152,652 |
|
| Retained deficit | (112,675 | ) | | (115,841 | ) |
| Accumulated other comprehensive income, net of tax | 1,753 |
| | 1,425 |
|
| Total Shareholders’ Equity | 59,864 |
| | 56,254 |
|
| Total Liabilities and Shareholders’ Equity | $ | 163,067 |
| | $ | 172,173 |
|
See accompanying Notes to Consolidated Financial Statements.
ATLAS FINANCIAL HOLDINGS, INC.
CONSOLIDATED STATEMENTS OF INCOME AND COMPREHENSIVE INCOME
(in '000s, except for share and per share data)
|
| | | | | | | |
| Consolidated Statements of Income | | | |
| | Year Ended December 31, |
| | 2012 | | 2011 |
| Net premiums earned | $ | 38,709 |
| | $ | 35,747 |
|
| Net investment income | 2,453 |
| | 3,280 |
|
| Net investment gains | 1,435 |
| | 4,147 |
|
| Other income | 194 |
| | 178 |
|
| Total revenue | 42,791 |
| | 43,352 |
|
| Net claims incurred | 26,545 |
| | 28,994 |
|
| Acquisition costs | 6,471 |
| | 7,294 |
|
| Other underwriting expenses | 6,609 |
| | 10,697 |
|
| Total expenses | 39,625 |
| | 46,985 |
|
| Income/(loss) from operations before income tax expense/(benefit) | 3,166 |
| | (3,633 | ) |
| Income tax expense/(benefit) | — |
| | (1,163 | ) |
| Net income/(loss) attributable to Atlas | 3,166 |
| | (2,470 | ) |
| Less: Preferred share dividends | 810 |
| | 810 |
|
| Net income/(loss) attributable to common shareholders | $ | 2,356 |
| | $ | (3,280 | ) |
| | | | |
| Basic weighted average common shares outstanding | 6,144,281 |
| | 6,124,542 |
|
| Earnings/(loss) per common share, basic | $ | 0.38 |
| | $ | (0.54 | ) |
| Diluted weighted average common shares outstanding | 8,434,948 |
| | 6,124,542 |
|
| Earnings/(loss) per common share, diluted | $ | 0.38 |
| | $ | (0.54 | ) |
| | | | |
| Consolidated Statements of Comprehensive Income | | | |
| | | | |
| Net income/(loss) attributable to Atlas | $ | 3,166 |
| | $ | (2,470 | ) |
| Changes in net unrealized gains | 1,446 |
| | 154 |
|
| Reclassification to income of net realized gains | (948 | ) | | (3,469 | ) |
| Settlement of pension plan | — |
| | 2,473 |
|
| Effect of income tax | (170 | ) | | (789 | ) |
| Other comprehensive income/(loss) for the period | 328 |
| | (1,631 | ) |
| Total comprehensive income/(loss) | $ | 3,494 |
| | $ | (4,101 | ) |
| | | | |
See accompanying Notes to Consolidated Financial Statements.
ATLAS FINANCIAL HOLDINGS, INC.
CONSOLIDATED STATEMENTS OF SHAREHOLDERS’ EQUITY
|
| | | | | | | | | | | | | | | | | | | | | | | | | | | |
| (in '000s) | Preferred Shares | | Ordinary shares | | Restricted Voting Common Shares | | Additional Paid-in Capital | | Retained Deficit | | Accumulated Other Comprehensive Income | | Total |
| Balance December 31, 2010 | $ | 18,000 |
| | $ | 4 |
| | $ | 14 |
| | $ | 152,466 |
| | $ | (113,371 | ) | | $ | 3,056 |
| | $ | 60,169 |
|
| Net loss | | | | | | | | | (2,470 | ) | | | | (2,470 | ) |
| Other comprehensive loss | | | | | | | | | | | (3,315 | ) | | (3,315 | ) |
| Share-based compensation | | | | | | | 113 |
| | | | | | 113 |
|
| Stock options exercised | | | | | | | 73 |
| | | | | | 73 |
|
| Settlement of Pension Plan | | | | | | | | | | | 1,684 |
| | $ | 1,684 |
|
| Balance December 31, 2011 | $ | 18,000 |
| | $ | 4 |
| | $ | 14 |
| | $ | 152,652 |
| | $ | (115,841 | ) | | $ | 1,425 |
| | $ | 56,254 |
|
Net income
| | | | | | | | | 3,166 |
| | | | 3,166 |
|
| Other comprehensive income | | | | | | | | | | | 328 |
| | 328 |
|
| Share-based compensation | | | | | | | 113 |
| | | | | | 113 |
|
| Stock options exercised | | | | | | | 3 |
| | | | | | 3 |
|
| Balance December 31, 2012 | $ | 18,000 |
| | $ | 4 |
| | $ | 14 |
| | $ | 116 |
| | $ | (112,675 | ) | | $ | 1,753 |
| | $ | 59,864 |
|
| | | | | | | | | | | | | | |
| See accompanying Notes to Consolidated Financial Statements. |
ATLAS FINANCIAL HOLDINGS, INC.
CONSOLIDATED STATEMENTS OF CASH FLOWS
|
| | | | | | | |
| ($ in thousands) | | | |
| | Year Ended December 31, |
| | 2012 | | 2011 |
| Operating Activities | | | |
| Net income/loss | $ | 3,166 |
| | $ | (2,470 | ) |
| Adjustments to reconcile net loss to net cash used by operating activities: | | | |
| Amortization of fixed assets | 315 |
| | 218 |
|
| Deferred employee benefit costs | — |
| | 2,657 |
|
| Share-based compensation expense | 113 |
| | 113 |
|
| (Gain)/loss on sale of fixed assets | — |
| | (54 | ) |
| Amortization of deferred gain on sale of headquarters building | (26 | ) | | — |
|
| Deferred income taxes | — |
| | (1,163 | ) |
| Net realized gains | (1,435 | ) | | (4,147 | ) |
| Amortization of bond premiums and discounts | 921 |
| | 953 |
|
| Net changes in operating assets and liabilities: | | | |
| Accounts receivable and other assets, net | (12,344 | ) | | 3,762 |
|
| Due from reinsurers and other insurers | 2,127 |
| | 1,018 |
|
| Deferred policy acquisition costs | (744 | ) | | 784 |
|
| Other assets and accrued investment income | 69 |
| | 707 |
|
| Unpaid claims | (21,576 | ) | | (40,936 | ) |
| Unearned premium | 9,766 |
| | (1,370 | ) |
| Due to reinsurers and other insurers | (1,898 | ) | | (3,913 | ) |
| Accounts payable and accrued liabilities | 805 |
| | (3,320 | ) |
| Net cash used by operating activities | (20,741 | ) | | (47,161 | ) |
| Investing activities: | | | |
| Purchase of securities | (53,470 | ) | | (64,563 | ) |
| Acquisition of other investments | (1,250 | ) | | — |
|
| Proceeds from sales and maturities of securities | 59,452 |
| | 113,823 |
|
| Sale of assets held for sale | 13,342 |
| | 2,436 |
|
| Net additions of software and other equipment | (673 | ) | | (396 | ) |
| Net cash provided by investing activities | 17,401 |
| | 51,300 |
|
| Financing activities: | | | |
| Options exercised | 3 |
| | 73 |
|
| Net cash provided by financing activities | 3 |
| | 73 |
|
| Net change in cash and cash equivalents | (3,337 | ) | | 4,212 |
|
| Cash and cash equivalents, beginning of year | 23,249 |
| | 19,037 |
|
| Cash and cash equivalents, end of year | $ | 19,912 |
| | $ | 23,249 |
|
| Supplementary disclosure of cash information: | | | |
| Cash paid for: | | | |
| Interest | — |
| | — |
|
| Income taxes | — |
| | — |
|
| | | | |
| See accompanying Notes to Consolidated Financial Statements. |
| | | | |
| |
1. | NATURE OF OPERATIONS AND BASIS OF PRESENTATION |
Atlas Financial Holdings, Inc. ("Atlas") commenced operations on December 31, 2010. The primary business of Significant Accounting PoliciesAtlas is underwriting commercial automobile insurance in the United States, with a niche market orientation and focus on insurance for the “light” commercial automobile sector. This sector includes taxi cabs, non-emergency para-transit, limousine, livery and business autos. Automobile insurance products provide insurance coverage in three major areas: liability, accident benefits and physical damage. Liability insurance provides coverage subject to policy terms and conditions where the insured is determined to be responsible and/or liable for an automobile accident, for the payment for injuries and property damage to third parties. Accident benefit policies or personal injury protection policies provide coverage for loss of income, medical and rehabilitation expenses for insured persons who are injured in an automobile accident, regardless of fault. Physical damage coverage subject to policy terms and conditions provides for the payment of damages to an insured automobile arising from a collision with another object or from other risks such as fire or theft. In the short run, automobile physical damage and liability coverage generally provides more predictable results than automobile accident benefit or personal injury insurance.
Atlas' business is carried out through its insurance subsidiaries: American Country Insurance Company (“American Country”), American Service Insurance Company, Inc. (“American Service”) and, as of January 1st, 2013, Gateway Insurance Company ("Gateway"). The insurance subsidiaries distribute their insurance products through a network of retail independent agents. Together, the insurance subsidiaries are licensed to write property and casualty insurance in 47 states in the United States. The insurance subsidiaries share common management and operating infrastructure .
Atlas Ordinary shares have been listed on the TSX Venture Exchange (“TSXV”) under the symbol “AFH” since January 6, 2011. Atlas ordinary shares became listed on the NASDAQ stock exchange on February 11, 2013.
Basis of presentation - These statements have been prepared in conformity with accounting principles generally accepted in the United States of America (”("U.S. GAAP”GAAP"). All significant intercompany accounts and transactions have been eliminated. To conform to the current year presentation, certain amounts in the prior years’ consolidated financial statements and notes have been reclassified.
Classification of assets and liabilities - It is not customary in the insurance and financial services industries to classify assets and liabilities as current (settled in 1 year or less) and non-current (settled beyond 1 year). Assets and liabilities that could otherwise be classified as current include cash and cash equivalents, accrued investment income, accounts receivable and other assets, due from reinsurers and other insurers, income tax receivable, deferred policy acquisition costs, assets held for sale, accounts payable and accrued expenses, due to reinsurers and other insurers. Balances that would otherwise be classified as non-current include deferred tax assets and office equipment. All other assets and liabilities include balances that are both current and non-current.
Reverse acquisition continuation accounting - Atlas was formed through a reverse triangular merger and these consolidated financial statements are those of Atlas and subsidiaries and have been prepared in accordance with Accounting Standard Codification (”ASC”) 805 Business Combinations. Financial statements prepared following the reverse merger are presented in the name of the legal parent acquirer, Atlas, but are a continuation of the financial statements of the accounting acquirer, American Acquisition, with an adjustment for the capital structure (that is the number and type of equity interests, including equity instruments issued to effect the merger) of Atlas, as the legal parent acquirer and accounting acquiree. Accordingly, and as a result of the December 31, 2010 merger date, shareholders’ equity at December 31, 2010 reflects the common shares outstanding at the date of the merger togetherBeginning with the ordinary shares, restricted voting common shares and preferred shares that were issued to effect the merger, and also reflect the historical retained earnings (retained deficit) balances of American Acquisition, as the accounting acquirer.
Estimates and assumptions - The preparation of financial statements requires management to make estimates and assumptions that affect the reported amounts of assets and liabilities and the disclosure of contingent assets and liabilities at the date of the financial statements and reported amounts of revenues and expenses during the reporting period. Actual results could differ from these estimates and changes in estimates are recorded in the accounting period in which they are determined. The liability for unpaid loss and loss adjustment expenses and related amounts recoverable from reinsurers represents the most significant estimate in the accompanying financial statements. Significant estimates in the accompanying financial statements also include the fair values of investments in bonds, deferred tax asset valuation, premium receivable bad debt allowance and deferred policy acquisition cost recoverability.
Business combinations - The reverse merger was consummated and Atlas commenced operations on December 31, 2010. In accordance with ASC 805 Business Combinations, American Acquisition is considered the accounting acquirer and Atlas (formerly JJR VI), the legal acquirer, is considered to be the accounting acquiree. Accordingly, the consolidated financial statements for all periods presented herein are a continuation of the financial statements of American Acquisition adjusted for the legal capital of Atlas.
Principles of consolidation - The consolidated financial statements include the accounts of Atlas and the entities it controls, its subsidiaries. Subsidiaries are entities over which Atlas, directly or indirectly, has the power to govern the financial and operating policies in order to obtain the benefits from their activities, generally accompanying an equity shareholding of more than one half of the voting rights. Subsidiaries are fully consolidated from the date on which control is transferred to Atlas and would be de-consolidated from the date that control ceases. The operating results of subsidiaries acquired or disposed of during the year will be included in the consolidated statement of operations from the effective date of acquisition and up to the effective date of disposal, as appropriate. All significant intercompany transactions and balances are eliminated in consolidation. Accounting policies of subsidiaries have been changed where necessary to ensure consistency with the policies adopted by Atlas.
The following are Atlas’ subsidiaries, all of which are 100% owned, either directly or indirectly, together with the jurisdiction of incorporation that are included in consolidated financial statements:
American Insurance Acquisition Inc. (Delaware)
American Country Insurance Company (Illinois)
American Service Insurance Company, Inc. (Illinois)
Financial Instruments - Financial instruments are recognized and derecognized using trade date accounting, since that is the date Atlas contractually commits to the purchase or sale with the counterparty.
Effective interest method - Atlas utilizes the effective interest method for calculating the amortized cost of a financial asset and to allocate interest income or interest expense over the relevant period. The effective interest rate is the rate that exactly discounts the estimated future cash flows through the expected life of the financial instrument. Interest income is reported net of amortization of premium and accretion of discount. Realized gains and losses on disposition of available-for-sale securities are based on the net proceeds and the adjusted cost of the securities sold, using the specific identification method.
Financial assets - Atlas classifies financial assets as described below. Management determines the classification at initial recognition based on the purpose of the financial asset.
Cash and cash equivalents -Cash and cash equivalents include cash and highly liquid securities with original maturities of 90 days or less.
Available-for-sale (“AFS”) - Investments in fixed income securities are classified as available-for-sale. Securities are classified as available-for-sale when Atlas may decide to sell those securities due to changes in market interest rates, liquidity needs, changes in yields or alternative investments, and for other reasons. Available-for-sale securities are carried at fair value, with unrealized gains and losses, net of income tax, included as a separate component of accumulated other comprehensive income (loss) in shareholder’s equity.
Accounts receivable and other assets - Receivables are financial assets with fixed or determinable payments that are not quoted in an active market. These assets are recognized initially at fair value, together with directly attributable transaction costs and subsequently measured at amortized cost. Accounts receivable include premium balances due and uncollected and installment premiums not yet due from agents and insureds.
Atlas evaluates the collectibility of accounts receivable based on a combination of factors. When aware of a specific customer’s inability to meet its financial obligations, such as in the case of bankruptcy or deterioration in the customer’s operating results or financial position, Atlas records a specific reserve for bad debt to reduce the related receivable to the amount Atlas reasonably believes is collectible. Atlas also records reserves for bad debt for all other customers based on a variety of factors, including the length of time the receivables are past due and historical collection experience. Accounts are reviewed for potential write-off on a case-by-case basis. Accounts deemed uncollectible are written off, net of expected recoveries. If circumstances related to specific customers change, the Company’s estimates of the recoverability of receivables could be further adjusted.
Premiums receivable are shown net of bad debt allowance of $4,254 and $4,212 at December 31, 2011 and December 31, 2010, respectively. Bad debt expense of $248 and $2,766 was incurred in the years ended December 31, 2011 and December 31, 2010, respectively. Atlas’ allowance for bad debt primarily relates to a single agent. Settlement proceedings with this agent were ongoing as of December 31, 2011. The entire receivable balance from this agency was fully reserved as of December 31, 2011. A settlement executed in April 2012, which resulted in a minor recovery of previously reserved amounts, will be reflected in Atlas’ financial statements for the six month period ended June 30, 2012.
Impairment of financial assets - Atlas assesses, on a quarterly basis, whether there is evidence that a financial asset or group of financial assets is impaired. An investment is considered impaired when the fair value of the investment is less than its cost or amortized cost. When an investment is impaired, the Company must make a determination as to whether the impairment is other-than-temporary.
Under ASC guidance, with respect to an investment in an impaired debt security, other-than temporary impairment (OTTI) occurs if (a) there is intent to sell the debt security, (b) it is more likely than not it will be required to sell the debt security before its anticipated recovery, or (c) it is probable that all amounts due will be unable to be collected such that the entire cost basis of the security will not be recovered. If Atlas intends to sell the debt security, or will more likely than not be required to sell the debt security before the anticipated recovery, a loss in the entire amount of the impairment is reflected in net realized gains (losses) on investments in the consolidated statements of income. If Atlas determines that it is probable it will be unable to collect all amounts and Atlas has no intent to sell the debt security, a credit loss is recognized in net realized gains (losses) on investments in the consolidated statements of income to the extent that the present value of expected cash flows is less than the amortized cost basis; any difference between fair value and the new amortized cost basis (net of the credit loss) is reflected in other comprehensive income (losses), net of applicable income taxes.
There were no other-than-temporary impairments recognized in 2011.
Fair values of financial instruments - Atlas has used the following methods and assumptions in estimating its fair value disclosures:
Fair values for bonds are based on quoted market prices, when available. If quoted market prices are not available, fair values are based on quoted market prices of comparable instruments or values obtained from independent pricing services.
Atlas’ fixed income portfolio is managed by Asset Allocation Management (“AAM”), an SEC registered investment advisor specializing in the management of insurance company portfolios. Management works directly with AAM to ensure that Atlas benefits from their expertise and also evaluates investments as well as specific positions independently using internal resources. AAM has a team of credit analysts for all investment grade fixed income sectors. The investment process begins with an independent analyst review of each security’s credit worthiness using both quantitative tools and qualitative review. At the issuer level, this includes reviews of past financial data, trends in financial stability, projections for the future, reliability of the management team in place, market data (credit spread, equity prices, trends in this data for the issuer and the issuer’s industry). Reviews also consider industry trends and the macro-economic environment. This analysis is continuous, integrating new information as it becomes available. In short, Atlas does not rely on rating agency ratings to make investment decisions, but instead with the support of its independent investment advisors, do independent fundamental credit analysis to find the best securities possible. AAM has found that over time this process creates an ability to sell securities prior to rating agency downgrades or to buy securities before upgrades. As of December 31, 2011, this process did not generate any significant difference in the rating assessment between Atlas’ review and the rating agencies.
Atlas employs specific control processes to determine the reasonableness of the fair value of its financial assets. These processes are designed to supplement those performed by AMM to ensure that the values received from them are accurately recorded and that the data inputs and the valuation techniques utilized are appropriate, consistently applied, and that the assumptions are reasonable and consistent with the objective of determining fair value. For example, on a continuing basis, Atlas assesses the reasonableness of individual security values which have stale prices or whose changes exceed certain thresholds as compared to previous values received from those AMM or to expected prices. The portfolio is reviewed routinely for transaction volumes, new issuances, any changes in spreads, as well as the overall movement of interest rates along the yield curve to determine if sufficient activity and liquidity exists to provide a credible source for market valuations. When fair value determinations are expected to be more variable, they are validated through reviews by members of management or the Board of Directors who have relevant expertise and who are independent of those charged with executing investment transactions.
Deferred policy acquisition costs (DAC) - Atlas defers producers’ commissions, premium taxes and other underwriting and marketing costs directly relating to the acquisition of premiums written to the extent they are considered recoverable. These costs are then expensed as the related premiums are earned. The method followed in determining the deferred policy acquisition costs limits the deferral to its realizable value by giving consideration to estimated future claims and expenses to be incurred as premiums are earned. Changes in estimates, if any, are recorded in the accounting period in which they are determined. Anticipated investment income is included in determining the realizable value of the deferred policy acquisition costs. Atlas’ deferred policy acquisition costs are reported net of ceding commissions.
Deferred policy acquisition costs for the years ended December 31 follows:
|
| | | | | | | | |
| | | 2011 | | 2010 |
| Balance, beginning of year | | $ | 3,804 |
| | $ | 9,399 |
|
| Acquisition costs deferred | | 6,510 |
| | 5,520 |
|
| Amortization charged to income | | 7,294 |
| | 11,115 |
|
| Balance, end of year | | $ | 3,020 |
| | $ | 3,804 |
|
When anticipated losses, loss adjustment expenses, commissions and other acquisition costs exceed recorded unearned premium, and any future installment premiums on existing policies, a premium deficiency reserve is recognized by recording an additional liability for the deficiency, with a corresponding charge to operations. Atlas utilizes anticipated investment income as a factor in its premium deficiency calculation. In 2011 and 2010, Atlas concluded that no premium deficiency adjustments were necessary.
Income taxes - Income taxes expense (benefit) includes all taxes based on taxable income (loss) of Atlas and its subsidiaries and are recognized in the statement of operations except to the extent that they relate to items recognized directly in other comprehensive income, in which case the income tax effect is also recognized in other comprehensive income.
Deferred taxes are recognized using the asset and liability method of accounting. Under this method the future tax consequences attributable to temporary differences in the tax basis of assets, liabilities and items recognized directly in equity and the financial reporting basis of such items are recognized in the financial statements by recording deferred tax liabilities or deferred tax assets.
Deferred tax assets related to the carry-forward of unused tax losses and credits and those arising from temporary differences are recognized only to the extent that it is probable that future taxable income will be available against which they can be utilized. Deferred tax assets and liabilities are measured using enacted tax rates expected to apply to taxable income in the years in which those temporary differences are expected to be recovered or settled. The effect on future tax assets and liabilities of a change in tax rates is recognized in income in the period of enactment.
When considering the extent of the valuation allowance on Atlas’ deferred tax asset, the weight given by management to the positive and negative evidence is commensurate with the extent to which the evidence may be objectively verified. GAAP states that a cumulative loss in recent years is a significant piece of negative evidence that is difficult to overcome in determining that a valuation allowance is not needed against deferred tax assets. However, the strength and trend of earnings, as well as other relevant factors are considered.
Office equipment and software – Office equipment is stated at historical cost less deprecation. Subsequent costs are included in the asset’s carrying amount or capitalized as a separate asset only when it is probable that future economic benefits will be realized. Repairs and maintenance are recognized as an expense during the period incurred. Depreciation on equipment is provided on a straight-line basis over the estimated useful lives which range from 5 years for vehicles, 7 years for furniture and the term of the lease for leased equipment.
Insurance contracts – Contracts under which Atlas’ insurance subsidiaries accept risk at the inception of the contract from another party (the insured holder of the policy) by agreeing to compensate the policyholder or other insured beneficiary if a specified future event (the insured event) adversely affects the holder of the policy are classified as insurance contracts. All policies are short-duration contracts.
Revenue Recognition - Premium income is recognized on a pro rata basis over the terms of the respective insurance contracts. Unearned premiums represent the portion of premiums written that are related to the unexpired terms of the policies in force.
Claims liabilities - The provision for unpaid claims represent the estimated liabilities for reported claims, plus those incurred but not yet reported and the related estimated loss adjustment expenses. Unpaid claims expenses are determined using case-basis evaluations and statistical analyses, including insurance industry loss data, and represent estimates of the ultimate cost of all claims
incurred. Although considerable variability is inherent in such estimates, management believes that the liability for unpaid claims is adequate. The estimates are continually reviewed and adjusted as necessary; such adjustments are included in current operations and are accounted for as changes in estimates.
Reinsurance - As part of Atlas’ insurance risk management policies, portions of its insurance risk is ceded to reinsurers. Reinsurance premiums and claims expenses are accounted for on a basis consistent with those used in accounting for the original policies issued and the terms of the reinsurance contracts. Premiums and claims ceded to other companies have been reported as a reduction of premium revenue and claims incurred expense. Commissions paid to Atlas by reinsurers on business ceded have been accounted for as a reduction of the related policy acquisition costs. Reinsurance receivables are recorded for that portion of paid and unpaid losses and loss adjustment expenses that are ceded to other companies. Prepaid reinsurance premiums are recorded for unearned premiums that have been ceded to other companies.
Share-based payments - Atlashas a stock-based compensation plan which is described fully in Note 10. Under ASC 718 Compensation-Stock Compensation (“ASC 718”), the fair-value method of accounting is used to determine and account for equity settled transactions and to determine stock-based compensation awards granted to employees and non-employees using the Black-Scholes option pricing model. Compensation expense is recognized over the period that the stock options vest, with a corresponding increase to additional paid in capital.
For option awards with graded vesting, ASC 718 provides two options: on a straight-line basis over the service period for each separately vesting portion of the award (as if the award were in effect multiple awards), or on a straight line basis over the service period for the entire award. Atlas has chosen the latter policy. Atlas recognized $113 in stock compensation expense in 2011 and none in 2010.
Post-employment benefits - Prior to December 31, 1997, substantially all salaried employees of American Country were covered by a defined benefit pension plan known as the American Country Pension Plan (the “pension plan”). The pension plan was dissolved in the fourth quarter 2011 and the plan assets were distributed. The dissolution resulted in the immediate recognition of $2,544 in prior service costspreviouslyrecorded in Accumulated Other Comprehensive Income, which are shown within Other Underwriting Expenses.
Until its dissolution, periodic net pension expense was based on the cost of incremental benefits for employee service during the period, interest on projected benefit obligation, actual return on plan assets and amortization of actuarial gains and losses.
Operating segments - Atlas is in a single operating segment – property and casualty insurance.
Presentation of equity and cash flows: Ordinary and restricted voting common shares are reflected as par value amounts with any remaining consideration upon issuance recorded in additional paid in capital. In 2010, the Company reported the total consideration within the common share equity amounts in the consolidated statement of financial position. The Company has adjusted the prior period common share and additional paid in capital amounts to conform to the presentation in 2011.
In the consolidated statements of cash flows, adjustments to reconcile net income (loss) to cash used in operating activities includes a non cash expense for forgiveness of mortgage loan and net realized investment gains and losses. In 2010, the amount of the expense for forgiveness of mortgage loan was reported as an increase to the net loss amount rather than a reduction. The Company has adjusted the prior period cash flows for the immaterial error in presentation.
Emerging Growth Company: The Company is an “emerging growth company” under the JOBS Act and, except as set forth below, will take advantage of certain exemptions from various reporting requirements that are applicable to other public companies that are not emerging growth companies. Section 107 of the JOBS Act provides that an emerging growth company can take advantage of the extended transition period in Section 7(a)(2)(B) of the Securities Act of 1933, as amended, for complying with new or revised accounting standards. In other words, an emerging growth company can delay the adoption of certain accounting standards until those standards would otherwise apply to private companies. However, we are choosing to opt out of such extended transition period, and as a result, we will comply with new or revised accounting standards on the relevant dates on which adoption of such standards is required for non-emerging growth companies. Section 107 of the JOBS Act provides that our decision to opt out of the extended transition period for complying with new or revised accounting standards is irrevocable.
2. PENDING ACCOUNTING STANDARDS
Accounting for Costs Associated with Acquiring or Renewing Insurance Contracts - In October 2010, the Financial Accounting Standards Board (”FASB”) issued guidance modifying the definition of the types of costs incurred by insurance entities that can be capitalized in the acquisition of new and renewal insurance contracts. The guidance specifies that the costs must be directly related to the successful acquisition of insurance contracts. The guidance also specifies that advertising costs should be included as deferred acquisition costs only when the direct−response advertising accounting criteria are met. The new guidance is effective for reporting periods beginning after December 15, 2011. Atlas’ current policy for accounting for acquisition costs is already materially consistent with this guidance. Therefore the adoption of this guidance will not have an impact of on our financial statements.
Amendments to Fair Value Measurement and Disclosure Requirements - In May 2011, the FASB issued guidance that clarifies the application of existing fair value measurement and disclosure requirements and amends certain fair value measurement principles, requirements and disclosures. Changes were made to improve consistency in global application. The guidance is to be applied prospectively for reporting periods beginning after December 15, 2011. Early adoption is not permitted. The impact of adoption is not expected to be material to the Company’s results of operations or financial position.
Presentation of Comprehensive Income - In June and December 2011, the FASB issued guidance amending the presentation of comprehensive income and its components. Under the new guidance, a reporting entity has the option to present comprehensive income in a single continuous statement or in two separate but consecutive statements. The guidance is effective for reporting periods beginning after December 15, 2011 and is to be applied retrospectively. The new guidance affects presentation only and will have no material impact on the Company’s results of operations or financial position.
3. INVESTMENTS
The amortized cost, gross unrealized gains and losses and fair value for Atlas’ investments are as follows:
|
| | | | | | | | | | | | | |
| December 31, 2011 | Amortized Cost | Gross Unrealized Gains | Gross Unrealized Losses | Fair Value |
| Term Deposits | | $ | — |
| $ | — |
| $ | — |
| $ | — |
|
| Bonds: | | | | | |
| U.S. | - Government | 44,835 |
| 911 |
| — |
| 45,746 |
|
| | - Corporate | 35,572 |
| 825 |
| 24 |
| 36,373 |
|
| | - Commercial mortgage backed | 17,493 |
| 208 |
| — |
| 17,701 |
|
| | - Other asset backed | 3,573 |
| 99 |
| 1 |
| 3,671 |
|
| Total Fixed Income | | $ | 101,473 |
| $ | 2,043 |
| $ | 25 |
| $ | 103,491 |
|
| Equities | | 994 |
| 147 |
| — |
| 1,141 |
|
| Totals | | $ | 102,467 |
| $ | 2,190 |
| $ | 25 |
| $ | 104,632 |
|
|
| | | | | | | | | | | | | |
| December 31, 2010 | Amortized Cost | Gross Unrealized Gains | Gross Unrealized Losses | Fair Value |
| Term Deposits | | $ | 7,898 |
| $ | 3 |
| $ | — |
| $ | 7,901 |
|
| Fixed Income: | | | | | |
| U.S. | - Government | 67,388 |
| 2,117 |
| — |
| 69,505 |
|
| | - Corporate | 62,429 |
| 3,011 |
| — |
| 65,440 |
|
| | - Commercial mortgage backed | 8,445 |
| 270 |
| — |
| 8,715 |
|
| | - Other asset backed | 2,371 |
| 79 |
| — |
| 2,450 |
|
| Total Fixed Income | | $ | 148,531 |
| $ | 5,480 |
| $ | — |
| $ | 154,011 |
|
| Equities | | — |
| — |
| — |
| — |
|
| Totals | | $ | 148,531 |
| $ | 5,480 |
| $ | — |
| $ | 154,011 |
|
The following tables summarize carrying amounts of fixed income securities by contractual maturity. As certain securities and debentures have the right to call or prepay obligations, the actual settlement dates may differ from contractual maturity.
|
| | | | | | | | | | | | | | | |
| As at December 31, 2011 | One year or less | One to five years | Five to ten years | More than ten years | Total |
| Fixed Income Securities | $ | 29,407 |
| $ | 27,317 |
| $ | 10,242 |
| $ | 36,525 |
| $ | 103,491 |
|
| Percentage of total | 28.4 | % | 26.4 | % | 9.9 | % | 35.3 | % | 100.0 | % |
|
| | | | | | | | | | | | | | | |
| As at December 31, 2010 | One year or less | One to five years | Five to ten years | More than ten years | Total |
| Fixed Income Securities | $ | 21,556 |
| $ | 88,564 |
| $ | 24,026 |
| $ | 19,865 |
| $ | 154,011 |
|
| Percentage of total | 14.0 | % | 57.5 | % | 15.6 | % | 12.9 | % | 100.0 | % |
The following table summarizes the change in unrealized gains and losses for the years ended December 31: |
| | | | | | | |
| | | 2011 | 2010 |
| Term Deposits | | $ | (3 | ) | $ | 3 |
|
| Fixed Income: | | | |
| U.S. | -Government | (1,206 | ) | 852 |
|
| | - Corporate | (2,210 | ) | 386 |
|
| | - Commercial mortgage backed | (62 | ) | 33 |
|
| | - Other asset backed | 19 |
| 2,037 |
|
| Equities | | 147 |
| |
| Totals | | $ | (3,315 | ) | $ | 3,311 |
|
The following table summarizes the components of net investment income for the years ended December 31:
|
| | | | | | | | |
| | | 2011 | 2010 |
| Total investment income | | | |
| | Interest (from fixed income securities) | $ | 3,791 |
| $ | 4,915 |
|
| | Dividends | 12 |
| — |
|
| | Other | — |
| — |
|
| Investment expenses | | (523 | ) | (299 | ) |
| Net investment income | | $ | 3,280 |
| $ | 4,616 |
|
The following table summarizes the components of net investment gains for the years ended December 31:
|
| | | | | | | | |
| | | 2011 | 2010 |
| Fixed income securities | | $ | 4,149 |
| $ | 888 |
|
| Equities | — |
| — |
|
| Other | 52 |
| — |
|
| Net investment gains (losses) | | $ | 4,201 |
| $ | 888 |
|
Management performs a quarterly analysis of Atlas’ investment holdings to determine if declines in fair value are other than temporary. The analysis includes some or all of the following procedures as deemed appropriate by management:
identifying all security holdings in unrealized loss positions that have existed for at least six months or other circumstances that management believes may impact the recoverability of the security;
obtaining a valuation analysis from third party investment managers regarding these holdings based on their knowledge, experience and other market based valuation techniques;
reviewing the trading range of certain securities over the preceding calendar period;
assessing if declines in market value are other than temporary for debt security holdings based on their investment grade credit ratings from third party security rating agencies;
assessing if declines in market value are other than temporary for any debt security holding with a non-investment grade credit rating based on the continuity of its debt service record; and
determining the necessary provision for declines in market value that are considered other than temporary based on the analyses performed.
The risks and uncertainties inherent in the assessment methodology utilized to determine declines in market value that are other than temporary include, but may not be limited to, the following:
the opinion of professional investment managers could be incorrect;
the past trading patterns of individual securities may not reflect future valuation trends;
the credit ratings assigned by independent credit rating agencies may be incorrect due to unforeseen or unknown facts related to a company’s financial situation; and
the debt service pattern of non-investment grade securities may not reflect future debt service capabilities and may not reflect a company’s unknown underlying financial problems.
There were no impairments recorded in the years ended December 31, 2011 or December 31, 2010 as a result of the above analysis performed by management to determine declines in market value that may be other than temporary. All securities as of December 31, 2011 and 2010 in an unrealized loss position have been in said position for less than 12 months.
4. FINANCIAL AND CREDIT RISK MANAGEMENT
By virtue of the nature of Atlas’ business activities, financial instruments make up the majority of the balance sheet. The risks which arise from transacting financial instruments include credit risk, market risk, liquidity risk and cash flow risk. These risks may be caused by factors specific to an individual instrument or factors affecting all instruments traded in the market. Atlas has a risk management framework in place to monitor, evaluate and manage the risks assumed in conducting its business. Atlas’ risk management policies and practices are as follows:
Credit risk - Atlas is exposed to credit risk principally through its fixed income securities and balances receivable from policyholders and reinsurers. Atlas controls and monitors concentration and credit quality risk through policies to limit and monitor its exposure to individual issuers or related groups (with the exception of U.S. Government bonds) as well as through ongoing review of the credit ratings of issuers held in the securities portfolio. Atlas’ credit exposure to any one individual policyholder is not material. Atlas has policies requiring evaluation of the financial condition of its reinsurers and monitors concentrations of credit risk arising from similar geographic regions, activities, or economic characteristics of the reinsurers to minimize its exposure to significant losses from reinsurer insolvency.
The following table summarizes the credit exposure of Atlas from its investments in fixed income securities and term deposits by rating as assigned by Fitch, Standard & Poor’s or Moody’s Investor Services, using the higher of these ratings for any security where there is a split rating:
|
| | | | | | | | | | |
| | 2011 | 2010 |
| | Amount | % of Total | Amount | % of Total |
| AAA/Aaa | $ | 54,717 |
| 52.9 | % | $ | 88,684 |
| 57.6 | % |
| AA/Aa | 21,567 |
| 20.8 | % | 26,388 |
| 17.1 | % |
| A/A | 22,380 |
| 21.6 | % | 35,027 |
| 22.7 | % |
| BBB/Baa | 4,827 |
| 4.7 | % | 3,851 |
| 2.5 | % |
| CCC/Caa or lower or not rated | — |
| — |
| 61 |
| 0.1 | % |
| Total Securities | $ | 103,491 |
| 100.0 | % | $ | 154,011 |
| 100.0 | % |
Equity price risk - This is the risk of loss due to adverse movements in equity prices. Atlas’ investment in equity securities comprises a small percentage of its total portfolio, and as a result, the exposure to this type of risk is minimal.
Foreign currency risk - Atlas is not currently exposed to material changes in the U.S. dollar currency exchange rates with any other foreign currency.
Liquidity and cash flow risk - Liquidity risk is the risk of having insufficient cash resources to meet current financial obligations without raising funds at unfavorable rates or selling assets on a forced basis. Liquidity risk arises from general business activities and in the course of managing the assets and liabilities of Atlas. There is the risk of loss to the extent that the sale of a security prior to its maturity is required to provide liquidity to satisfy policyholder and other cash outflows. Cash flow risk arises from risk that future inflation of policyholder cash flow exceeds returns on long-term investment securities. The purpose of liquidity and cash flow management is to ensure that there is sufficient cash to meet all financial commitments and obligations as they fall due. The liquidity and cash flow requirements of Atlas’ business have been met primarily by funds generated from operations, asset maturities and income and other returns received on securities. Cash provided from these sources is used primarily for claims and claim adjustment expense payments and operating expenses. The timing and amount of catastrophe claims are inherently unpredictable and may create increased liquidity requirements.
Fair value - Fair value amounts represent estimates of the consideration that would currently be agreed upon between knowledgeable, willing parties who are under no compulsion to act.
Fair value is best evidenced by quoted bid or ask price, as appropriate, in an active market. Where bid or ask prices are not available, such as in an illiquid or inactive market, the closing price of the most recent transaction of that instrument subject to appropriate adjustments as required is used. Where quoted market prices are not available, the quoted prices of similar financial instruments or valuation models with observable market based inputs are used to estimate the fair value. These valuation models may use multiple observable market inputs, including observable interest rates, foreign exchange rates, index levels, credit spreads, equity prices, counterparty credit quality, corresponding market volatility levels and option volatilities. Minimal management judgment is required for fair values calculated using quoted market prices or observable market inputs for models. The calculation of estimated fair value is based on market conditions at a specific point in time and may not be reflective of future fair values.
Atlas records the available for sale securities held in its securities portfolio at their fair value. Atlas primarily uses the services of external securities pricing vendors to obtain these values. The securities are valued using quoted market prices or prices established using observable market inputs. In volatile market conditions, these quoted market prices or observable market inputs can change rapidly causing a significant impact on fair value and financial results recorded.
Atlas employs a fair value hierarchy to categorize the inputs it uses in valuation techniques to measure the fair value. The hierarchy is comprised of quoted market prices (Level 1), third party models using observable market information (Level 2) and internal models without observable market information (Level 3). The following table summarizes Atlas’ investments at fair value as at the years ended December 31, 2011 and December 31, 2010:
|
| | | | | | | | | | | | |
| December 31, 2011 | Level 1 | Level 2 | Level 3 | Total |
| Fixed Income Securities | $ | 13,363 |
| $ | 90,128 |
| $ | — |
| $ | 103,491 |
|
| Equities | 1,141 |
| — |
| — |
| 1,141 |
|
| Totals | $ | 14,504 |
| $ | 90,128 |
| $ | — |
| $ | 104,632 |
|
|
| | | | | | | | | | | | |
| December 31, 2010 | Level 1 | Level 2 | Level 3 | Total |
| Fixed Income Securities | $ | 27,561 |
| $ | 126,450 |
| $ | — |
| $ | 154,011 |
|
| Equities | — |
| — |
| — |
| — |
|
| Totals | $ | 27,561 |
| $ | 126,450 |
| $ | — |
| $ | 154,011 |
|
There were no transfers in or out of Level 2 during either period.
Capital Management - The Company manages capital using both regulatory capital measures and internal metrics. The company’s capital is primarily derived from common shareholders’ equity, retained deficit and accumulated other comprehensive income (loss).
As a holding company, Atlas derives cash from its insurance subsidiaries generally in the form of dividends to meet its obligations, which will primarily consist of operating expense payments. Atlas’ insurance subsidiaries fund their obligations primarily through premium and investment income and maturities in the securities portfolio. The insurance subsidiaries require regulatory approval for the return of capital and, in certain circumstances, prior to the payment of dividends. In the event that dividends available to the holding company are inadequate to cover its operating expenses, the holding company would need to raise capital, sell assets or incur future debt.
The insurance subsidiaries must each maintain a minimum statutory capital and surplus of $1,500 under the provisions of the Illinois Insurance Code. Dividends may only be paid from statutory unassigned surplus, and payments may not be made if such surplus is less than a stipulated amount. The dividend restriction is the greater of statutory net income or 10% of total statutory capital and surplus.
Net loss computed under statutory-basis accounting for American Country and American Service were $(2,328) and $(497) respectively for the year ended December 31, 2011 (unaudited)2012, versus $(1,451) and $(5,351) for the year ended December 31, 2010 (unaudited). Statutory capital and surplus of the insurance subsidiaries was $49,954 (unaudited) and $45,560 at December 31, 2011 and 2010, respectively.
Atlas did not pay any dividends to its common shareholders during 2011 and has no current plans to pay dividends to its common shareholders.
A risk based capital formula is used by the National Association of Insurance Commissioners (”NAIC”) to identify property and casualty insurance companies that may not be adequately capitalized. The NAIC requires that capital and surplus not fall below 200% of the authorized control level. As of December 31, 2011, based on the unaudited statutory basis financial statements, both the insurance subsidiaries are above the required risk based capital levels, with risk based capital ratio estimates for American Country and American Service of 592.5% and 803.4%. The insurance subsidiaries had approximately $36,402 of capital in excess of the 200% minimum described above. As of December 31, 2010, the comparable risk based capital ratio estimates for American Country and American Service were 322% and 536%, and estimated capital in excess of the 200% level was approximately $26,100.
5. INCOME TAXES
The effective tax rate was (32.0)% and 13.4% for the years ended December 30, 2011 and 2010, respectively, compared to the U.S. statutory income tax rate of 34% as shown below:
|
| | | | | | | | | | | | | |
| Year ended December 31, | 2011 | | 2010 |
| | Amount | | % | | Amount | | % |
| Expected income tax benefit at statutory rate | $ | (1,235 | ) | | (34.0 | )% | | $ | (6,541 | ) | | (34.0 | )% |
| Valuation allowance | — |
| | — | % | | (9,476 | ) | | (49.3 | )% |
| Nondeductible expenses | 5 |
| | 0.1 | % | | 183 |
| | 1.0 | % |
| Tax implications of qualifying transaction | 75 |
| | 2.1 | % | | 18,412 |
| | 95.7 | % |
| Other | (8 | ) | | (0.2 | )% | | (3 | ) | | — | % |
| Total | $ | (1,163 | ) | | (32.0 | )% | | $ | 2,575 |
| | 13.4 | % |
Atlas carried deferred tax assetschanged where certain items appear on its balance sheet that were generated by its subsidiaries, primarily relatedStatement of Comprehensive Income according to net operating loss carry-forwards. The qualifying transaction caused a change in control for tax purposes which triggered Internal Revenue Code Section 382. Section 382 created a yearly limit on its deferred tax assets such that a portionRule 7-04 of the operating loss deferred tax assets would never be able to be utilized. In addition, as a result of the structure of the transaction, the seller, Kingsway, retains a portion of those deferred tax assets as dictated by the Internal Revenue Code. Kingsway, in general, retained those portions of the net operating loss deferred tax assets that Atlas would have otherwise not been able to use due to the Section 382 limit mentioned
above. Since the removal of the deferred tax asset from the balance sheet without an off-setting cash recoverable from the U.S. Government, this removal created a reconciling item from Atlas’ statutory income tax rate.
Income tax expense consists of the following for the years ended December 31: |
| | | | | | |
| | 2011 | 2010 |
| Current tax expense/(benefit) | $ | — |
| $ | (300 | ) |
| Deferred tax (benefit)/expense | (1,163 | ) | 2,875 |
|
| Total | $ | (1,163 | ) | $ | 2,575 |
|
The components of deferred income tax assets and liabilities as of December 31 are as follows:
|
| | | | | | |
| | 2011 | 2010 |
| Deferred tax assets: | | |
| Unpaid claims and unearned premiums | $ | 3,004 |
| $ | 4,218 |
|
| Loss carry-forwards | 15,558 |
| 13,252 |
|
| Pension expense | — |
| 841 |
|
| Bad debts | 1,297 |
| 1,356 |
|
| Other | 1,338 |
| 1,394 |
|
| Valuation Allowance | (12,361 | ) | (11,288 | ) |
| Total gross deferred tax assets | $ | 8,836 |
| $ | 9,773 |
|
| | | |
| Deferred tax liabilities: | | |
| Investment securities | 740 |
| 1,863 |
|
| Deferred policy acquisition costs | 1,027 |
| 1,293 |
|
| Other | 294 |
| 218 |
|
| Total gross deferred tax liabilities | $ | 2,061 |
| $ | 3,374 |
|
| Net deferred tax assets | $ | 6,775 |
| $ | 6,399 |
|
Amounts and expiration dates of the operating loss carry forwards as of December 31, 2011 are as follows:
|
| | | | |
| Year of Occurrence | Year of Expiration | Amount |
| 2001 | 2021 | $ | 14,750 |
|
| 2002 | 2022 | 4,317 |
|
| 2006 | 2026 | 7,825 |
|
| 2007 | 2027 | 5,131 |
|
| 2008 | 2028 | 1,949 |
|
| 2009 | 2029 | 1,949 |
|
| 2010 | 2030 | 1,949 |
|
| 2011 | 2031 | 7,762 |
|
| Total | | $ | 45,632 |
|
Atlas established a valuation allowance of approximately $12,361 and $11,288 for its gross deferred tax assets at December 31, 2011 and December 31, 2010 respectively.Regulation S-X.
In assessing the need for a valuation allowance, Atlas considers both positive and negative evidence related to the likelihood of realization of the deferred tax assets. If, based on the weight of available evidence, it is more likely than not the deferred tax assets will not be realized or if it is deemed premature to conclude that these assets will be realized in the near future, a valuation allowance is recorded. The weight given to the positive and negative evidence is commensurate with the extent to which the evidence may be objectively verified. As such, it is generally difficult for positive evidence regarding projected future taxable income exclusive of reversing taxable temporary differences to outweigh objective negative evidence of recent financial reporting losses. GAAP states that a cumulative loss in recent years is a significant piece of negative evidence that is difficult to overcome in determining that a valuation allowance is not needed against deferred tax assets.
Atlas’ assessment also accounted for the following evidence:
| |
◦ | Recent spin-off from prior ownership - Atlas was formed on December 31, 2010 in a reverse merger transaction. Consideration was made as to the impact of this transaction on future earnings.
|
| |
◦ | Nature, frequency, and severity of current and cumulative financial reporting losses - A pattern of objectively-measured recent financial reporting losses is heavily weighted as a source of negative evidence. Cumulative pre-tax losses in the three-year period ending with the current quarter are generally considered to be significant negative evidence regarding future profitability. However, the strength and trend of earnings are also considered, as well as other relevant factors. Atlas did not consider historical information as relevant due to the significant changes in business operations beginning on January 1, 2011;
|
| |
◦ | Trends in quarterly earnings from operating activities during the period - When performing the assessment, Atlas excluded certain non-operating items which impacted 2011 results: (1) a $2,544 charge upon settlement of the American Country Pension Plan (see Note 10 below); (2) a $1,800 reserve strengthening adjustment related to claims incurred under prior ownership (See Note 8 below); (3) $627 in non-recurring costs relating to the transactions that created Atlas.
|
| |
◦ | Sources of future taxable income - Future reversals of existing temporary differences are heavily-weighted sources of objectively verifiable positive evidence. Projections of future taxable income exclusive of reversing temporary differences are a source of positive evidence only when the projections are combined with a history of recent profits and can be reasonably estimated. Otherwise, these projections are considered inherently subjective and generally will not be sufficient to overcome negative evidence that includes relevant cumulative losses in recent years, particularly if the projected future taxable income is dependent on an anticipated turnaround to profitability that has not yet been achieved. In such cases, future taxable income is generally given no weight for the purposes of assessing the valuation allowance pursuant to GAAP; and
|
| |
◦ | Tax planning strategies - If necessary and available, tax planning strategies could be implemented to accelerate taxable amounts to utilize expiring carry-forwards. These strategies would be a source of additional positive evidence and, depending on their nature, could be heavily weighted.
|
At the end of 2011, Atlas’ operations (excluding the aforementioned non-operating items) had returned to a position of cumulative profits for the most recent one-year period. Further, operations showed three consecutive quarters of pre-tax operating profits (before non-operating items). Management concluded that the successful repositioning of Atlas during 2011 combined with the business plan showing continued profitability into future periods, provide assurance that future tax benefits more likely than not will be realized. Accordingly, at year-end 2011, a tax benefit was realized and the valuation was reduced against net deferred tax assets.
Atlas accounts for uncertain tax positions in accordance with the income taxes accounting guidance. Atlas has analyzed filing positions in the federal and state jurisdiction where it is required to file tax returns, as well as the open tax years in these jurisdictions. Atlas believes that its federal and state income tax filing positions and deductions will be sustained on audit and does not anticipate any adjustments that will result in a material change to its financial position. Therefore, no reserves for uncertain federal and state income tax positions have been recorded. Atlas would recognize interest and penalties related to unrecognized tax benefits as a component of the provision for federal income taxes. Atlas did not incur any federal income tax related interest income, interest expense or penalties for the years ended December 31, 2011 or 2010. Tax years 2006 through 2010 are subject to examination by the Internal Revenue Service.
6. ASSETS HELD FOR SALE
As at December 31, 2011, Atlas had three properties held for sale with an aggregate carrying value of $13,634, including its headquarters building in Elk Grove Village, Illinois. All of the properties’ individual carrying values were less than their respective appraised values net of reasonably estimated selling costs at the time those appraisals were received and at the time properties were deemed to be held for sale. All properties were listed for sale through brokers at the appraised values and above carrying values as of December 31, 2011. Atlas expects to re-invest the proceeds from the sale of real estate in its investment portfolio which will support strategic growth initiatives.
The Elk Grove Village building and property were previously owned by KAI and were contributed to Atlas as a capital contribution in June 2010. The other two properties, all located in Alabama, were assets of Southern United Fire Insurance Company which was merged into American Service in February 2010.
7. UNDERWRITING POLICY AND REINSURANCE CEDED
Underwriting Risk - Underwriting risk is the risk that the total cost of claims and acquisition expenses will exceed premiums received and can arise from numerous factors, including pricing risk, reserving risk, catastrophic loss risk, reinsurance coverage risk and that loss and loss adjustment expense reserves are not sufficient.
Reinsurance Ceded - As is customary in the insurance industry, Atlas reinsures portions of certain insurance policies it writes, thereby providing a greater diversification of risk and minimizing exposure on larger risks. Atlas remains contingently at risk with respect to any reinsurance ceded and would incur an additional loss if an assuming company were unable to meet its obligation under the reinsurance treaty.
Atlas monitors the financial condition of its reinsurers to minimize its exposure to significant losses from reinsurer insolvencies. Letters of credit are maintained for any unauthorized reinsurer to cover ceded unearned premium, ceded loss reserve balances and ceded paid losses. These policies mitigate the risk of credit quality or dispute from becoming a danger to financial strength. To date, the Company has not experienced any material difficulties in collecting reinsurance recoverables.
Gross premiums written and ceded premiums, losses and commissions as of and for the year ended December 31 are as follows:
|
| | | | | | |
| | 2011 | 2010 |
| Gross premiums written | $ | 42,031 |
| $ | 46,679 |
|
| Ceded premiums written | 6,173 |
| 14,201 |
|
| Net premiums written | 35,858 |
| 32,478 |
|
| | | |
| Ceded premiums earned | $ | 7,653 |
| $ | 7,434 |
|
| Ceded losses and loss adjustment expenses | 2,767 |
| 3,628 |
|
| Ceded unpaid losses and loss adjustment expenses | 7,825 |
| 5,192 |
|
| Ceded unearned premiums | 2,214 |
| 3,694 |
|
| Other amounts due from reinsurers | 219 |
| 2,390 |
|
| Ceded commissions | 2,412 |
| 5,441 |
|
8. UNPAID CLAIMS
Claims liabilities - The changes in the provision for unpaid claims, net of amounts recoverable from reinsurers, for the year ended December 31, 2011 and 2010 were as follows:
|
| | | | | | | |
| | 2011 | | 2010 |
| Unpaid claims, beginning of period | $ | 132,579 |
| | $ | 169,520 |
|
| Less: reinsurance recoverable | 6,477 |
| | 5,197 |
|
| Net beginning unpaid claims reserves | 126,102 |
| | 164,323 |
|
| Incurred related to: | | | |
| Current year | 27,303 |
| | 42,739 |
|
| Prior years | 1,691 |
| | 5,335 |
|
| | 28,994 |
| | 48,074 |
|
| Paid related to: | | | |
| Current year | 12,715 |
| | 18,994 |
|
| Prior years | 58,563 |
| | 76,835 |
|
| | 71,278 |
| | 95,829 |
|
| | | | |
| Net unpaid claims of subsidiary acquired | — |
| | 9,534 |
|
| Net unpaid claims, end of period | $ | 83,818 |
| | $ | 126,102 |
|
| Add: reinsurance recoverable | 7,825 |
| | 6,477 |
|
| Unpaid claims, end of period | $ | 91,643 |
| | $ | 132,579 |
|
At the end of 2010, a detailed review of claim payment and reserving practices was performed, which led to significant changes in both practices, increasing ultimate loss estimates and accelerating claim payments. Reserves were adjusted at that time to account for these changes, primarily during the second and third quarters of 2010. This review continued into 2011 and Atlas recorded a $1,800 adjustment to further strengthen its reserves for claims related to policies issued while the insurance subsidiaries were under previous ownership in years preceding 2010. The establishment of the estimated provision for unpaid claims is based on known facts and interpretation of circumstances and is therefore a complex and dynamic process influenced by a large variety of factors. These factors include the Atlas’ experience with similar cases and historical trends involving claim payment patterns, loss payments, pending levels of unpaid claims, product mix or concentration, claims severity and claim frequency patterns.
Other factors include the continually evolving and changing regulatory and legal environment, actuarial studies, professional experience and expertise of the Atlas’ claims department personnel and independent adjusters retained to handle individual claims, the quality of the data used for projection purposes, existing claims management practices including claims handling and settlement practices, the effect of inflationary trends on future claims settlement costs, court decisions, economic conditions and public attitudes. In addition, time can be a critical part of the provision determination, since the longer the span between the incidence of a loss and the payment or settlement of the claims, the more variable the ultimate settlement amount can be. Accordingly, short tail claims such as property claims, tend to be more reasonably predictable than long tail claims, such as general liability and automobile accident benefit claims that are less predictable.
Consequently, the process of establishing the estimated provision for unpaid claims is complex and imprecise as it relies on the judgment and opinions of a large number of individuals, on historical precedent and trends, on prevailing legal, economic, social and regulatory trends and on expectations as to future developments. The process of determining the provision necessarily involves risks that the actual results will deviate, perhaps substantially, from the best estimates made.
As the processes of management and the independent appointed actuary are undertaken independently, the provision for unpaid claims recorded by management can differ from the independent appointed actuary’s central estimate.
Comparing management’s selected reserve estimate to the actuarial central estimate and range of reasonable reserves independently determined by the independent appointed actuary continues to be an important step in the reserving process of the Company, however; where differences exist and the Company believes the internally developed reserve estimate to be more accurate, management’s estimate will not change. We believe this to be consistent with industry practice for companies with a robust reserving process in place. As of December 31, 2011, the Company’s carried reserves were within the range of reasonable reserves of its independent appointed actuary. As of December 31, 2011, the carrying value of unpaid claims was $91,643. There is no active market for policy liabilities; hence market value is not determinable. The carrying value of unpaid claims does not take into consideration the time value of money or make explicit provisions for adverse deviation. Fair value of unpaid claims would include such considerations.
9. STOCK OPTIONS AND WARRANTS
Stock options - Stock option activity for years ended December 31, 2011 and December 31, 2010 is as follows:
|
| | | | | | |
| | 2011 | 2010 |
| | Number | Avg. Price | Number | Avg. Price |
| Outstanding, beginning of period | 36,867 |
| C$3.00 | -- |
| -- |
| Granted | 123,250 |
| C$6.00 | 44,000 |
| C$3.00 |
| Exercised | (24,008 | ) | C$3.00 | -- |
| -- |
| Expired | -- |
| -- | (7,134 | ) | C$3.00 |
| Outstanding, end of period | 136,109 |
| C$5.70 | 36,866 |
| C$3.00 |
Information about options outstanding at December 31, 2011 is as follows: |
| | | | | | | |
| Grant Date | Expiration Date | Exercise Price | Remaining Contractual Life (Years) | Number Outstanding | Number Exercisable |
| January 18, 2011 | January 18, 2021 | C$6.00 | 9.1 | 123,250 |
| 30,813 |
|
| March 18, 2010 | March 31, 2012 | C$3.00 | 0.3 | 2,159 |
| 2,159 |
|
| March 18, 2010 | March 18, 2020 | C$3.00 | 8.2 | 10,700 |
| 10,700 |
|
| Total | | | 8.8 wtd. average | 136,109 |
| 43,672 |
|
On March 18, 2010, JJR VI issued options to purchase 83,334 common shares to the agent that assisted JJR VI in raising capital (the “IPO agent”) and options to purchase 356,667 shares to directors. All of the options were vested at the date of grant. Options to purchase 71,334 shares held by directors expired before the merger as a result of a director resignation. All outstanding JJR VI options were exchanged for Atlas options without modification on the basis of 1 Atlas option for each 10 JJR VI options and the exercise price was changed from C$0.30 to C$3.00, which was on the same basis as the JJR VI exchange ratio for shares, and thus did not represent any additional value or related expense. This resulted in 8,334 and 28,534 Atlas options for the agent and former JJR VI directors, respectively, outstanding after the merger. In total, 24,008 of these options were exercised in 2011. The options granted on March 18, 2010 have an aggregate intrinsic value of $39, as of December 31, 2011.
On January 6, 2011, Atlas adopted a stock option plan in order to advance the interests of Atlas by providing incentives to eligible persons defined in the plan. The maximum number of ordinary shares reserved for issuance under the plan together with all other security based plans is equal to 10% of issued and outstanding ordinary shares at the date of grant. The exercise price of options granted under the plan cannot be less than the volume weighted average trading price of Atlas’ ordinary shares for the five preceding trading days. Options generally vest over a three year period and expire ten years from grant date.
On January 18, 2011, Atlas granted options to purchase 123,250 ordinary shares of Atlas stock to officers and directors at an exercise price of C$6.00 per share. The options vest 25% at date of grant and 25% on each of the next three anniversary dates and expire on January 18, 2021. The weighted average grant date fair value of the options is $3.72 per share. As of December 31, 2011 the options had no aggregate intrinsic value.
The Black-Scholes option pricing model was used to estimate the fair value of compensation expense using the following assumptions – risk-free interest rate 2.27% to 3.13%; dividend yield 0.0%; expected volatility 100%; expected life of 6 to 9 years.
In accordance with ASC 718, Atlas has recognized stock compensation expense on a straight-line basis over the requisite service period of the last separately vesting portion of the award. In 2011, Atlas recognized $113 in expense, which is a component of other underwriting expenses on the income statement. Total unrecognized stock compensation expense associated with the January 18, 2011 grant is $337 as of December 31, 2011 which will be recognized ratably over the next three years.
The weighted average exercise price of all the shares exercisable at December 31, 2011 is $5.13.
Warrants - On November 1, 2010, American Acquisition closed a private placement and issued 1,327,834 subscription receipts for ordinary shares of Atlas and warrants to purchase 1,327,834 ordinary shares of Atlas for C$6.00 per share in connection with
the merger. The subscription receipts were converted to Atlas ordinary shares in connection with the merger. All the warrants were still outstanding at December 31, 2011 and expire on December 31, 2013.
Atlas ordinary shares were trading on the TSXV for C$4.80 on December 30, 2011 (the last trading day of the 2011 calendar year).
10. OTHER EMPLOYEE BENEFIT PLANS
Defined Contribution Plan
In January 2011, Atlas formed a defined contribution 401(k) plan covering all qualified employees of Atlas and its subsidiaries. Employees can choose to contribute up to 60% of their annual earnings but not more than $16,500 for 2011 to the plan. Qualifying employees age 50 and older can contribute an additional $5,500 in 2011. Atlas matches 50% of the employee contribution up to 5% of annual earnings for a total maximum expense of 2.5% of annual earnings per participant. Atlas contributions are discretionary. Employees are 100% vested in their own contributions and vest in Atlas contributions based on years of service with 100% vested after five years. Atlas’ contributions were $105 in 2011.
Prior to 2011, eligible employees participated in a defined contribution 401(k) plan maintained by KAI (“the Kingsway Plan”) with features identical to Atlas’ current plan (the “Atlas Plan”). Employer contributions to the Kingsway Plan attributable to the Atlas insurance subsidiaries were $144in 2011 and $130 in 2010, and are included in Other Underwriting Expenses. Assets of the Kingsway Plan attributable to Atlas’ employees, were transferred to the Atlas Plan in March 2011.
Defined Benefit Plan – Prior to December 31, 1997, substantially all salaried employees of American Country were covered by a defined benefit pension plan known as the American Country Pension Plan (the “pension plan”). Benefits were based on the employee’s length of service and wages and benefits, as defined by the pension plan. The funding policy of the pension plan was generally to contribute amounts required to maintain minimum funding standards in accordance with the Employee Retirement Income Security Act. Effective December 31, 1997, upon resolution by the board of directors, the pension plan was frozen. During 2010, American Country made an application to the U.S. Internal Revenue Service to dissolve the pension plan and distribute the net plan assets to the beneficiaries. In the fourth quarter of 2011, the plan assets were fully distributed. As a result of the plan liquidation, the Company recognized a settlement charge of $2,544 within other underwriting expenses in the fourth quarter of 2011. The settlement impact was previously reflected as an unrecognized adjustment to other comprehensive income and therefore, has created a nil impact to shareholders’ equity.
|
| | | | | | | | | |
| | | 2011 | 2010 |
| Change in Benefit Obligation | | | |
| | Benefit Obligation, beginning of year | $ | 5,110 |
| $ | 4,913 |
|
| | Interest cost | 228 |
| 263 |
|
| | Actuarial losses | (28 | ) | 192 |
|
| | Benefits paid | (229 | ) | (258 | ) |
| | Settlement of obligation | (5,081 | ) | — |
|
| | Benefit Obligation, end of year | $ | — |
| $ | 5,110 |
|
| | | | |
| Change in Plan Assets | | |
| | Fair value of plan assets, beginning of year | $ | 3,993 |
| $ | 3,869 |
|
| | Actual return on plan assets | 17 |
| 244 |
|
| | Employer contributions | 1,300 |
| 138 |
|
| | Benefits Paid | (229 | ) | (258 | ) |
| | Settlement of obligation | (5,081 | ) | — |
|
| | Fair value of plan assets, end of year | $ | — |
| $ | 3,993 |
|
| | | |
| Funded Status, end of year | $ | — |
| $ | 1,117 |
|
| | | |
| Items unrecognized as component of net pension cost, end of year (pre-tax) | — |
| 2,473 |
|
| Deferred income tax | — |
| (789 | ) |
| Items unrecognized as component of net pension cost, end of year | — |
| 1,684 |
|
| | | |
| Components of net pension cost | | |
| | Interest cost | $ | 229 |
| $ | 263 |
|
| | Expected return on plan assets | (177 | ) | (268 | ) |
| | Amortization of: | | |
| | | Prior Service Cost | — |
| — |
|
| | | Actuarial Losses | 61 |
| 64 |
|
| Subtotal | | | $ | 113 |
| $ | 59 |
|
| Expense resulting from settlement of plan | 2,544 |
| — |
|
| Net periodic pension cost | $ | 2,657 |
| $ | 59 |
|
Weighted average assumptions used to determine net pension cost for the years ended December 31:
|
| | | | |
| | | 2011 | 2010 | 2009 |
| Weighted average discount rate | | 5.25% | 5.5% | 6.0% |
| Rate of increase in compensation | | n/a | n/a | n/a |
| Expected long-term rate of return | | 5.0% | 7.0% | 7.0% |
| Weighted average discount rate used to determine end of year benefit obligation | n/a | 5.25% | 5.5% |
Employee Stock Purchase Plan - In the second quarter of 2011, Atlas initiated the Atlas Employee Stock Purchase Plan (the “ESPP”) to encourage continued employee interest in the operation, growth and development of Atlas and to provide an additional investment opportunity to employees. Beginning in June 2011, full time and permanent part time employees working more than 30 hours per week are allowed to invest up to 5% of adjusted salary in Atlas ordinary shares. Atlas matches 50% of the employee contribution up to 5% of annual earnings for a total maximum expense of 2.5% of annual earnings per participant.. Employees who signed up for the ESPP by May 30, 2011 each received an additional 100 ordinary shares as an initial participation incentive. Atlas will also pay administrative costs related to this plan. In 2011, Atlas’ incurred total expenses of $38 related to the plan.
11. COMMITMENTS AND CONTINGENCIES
Legal proceedings:
In connection with its operations, the Company and its subsidiaries are, from time to time, named as defendants in actions for damages and costs allegedly sustained by the plaintiffs. While it is not possible to estimate the outcome of the various proceedings
at this time, such actions have generally been resolved with minimal damages or expense in excess of amounts provided and the Company does not believe that it will incur any significant additional loss or expense in connection with such actions.
Collateral pledged:
As of December 31, 2011, bonds and term deposits with an estimated fair value of $11,843 were on deposit with state and provincial regulatory authorities, versus $9,294 as of December 31, 2010. Also, from time to time, the Company pledges securities to third parties to collateralize liabilities incurred under its policies of insurance. At December 31, 2011, the amount of such pledged securities was $10,396 versus $1,629 at December 31, 2010. Collateral pledging transactions are conducted under terms that are common and customary to standard collateral pledging and are subject to the Company’s standard risk management controls. These assets and investment income related thereto remain the property of the Company while pledged. Neither the state and/or provincial regulatory authorities nor any other third party has the right to re-pledge or sell said securities held on deposit.
Collateral held:
In the normal course of business, the Company receives collateral on certain business transactions to reduce its exposure to credit risk. As of December 31, 2011, the amount of such pledged securities was $240. The Company is normally permitted to sell or re-pledge the collateral it receives under terms that are common and customary to standard collateral holding and are subject to the Company’s standard risk management controls.
12. SHARE CAPITAL
The share capital for the common shares:
|
| | | | | | | | | | | | |
| As at December 31, | | 2011 | 2010 |
| | Shares Authorized | Shares Issued and Outstanding | Amount | Shares Issued and Outstanding (1) | Amount |
| Ordinary | 266,666,667 |
| 1,541,842 |
| $ | 4 |
| 1,517,834 |
| $ | 4 |
|
| Restricted | 33,333,334 |
| 4,601,621 |
| 14 |
| 4,601,621 |
| 14 |
|
| Total common shares | 300,000,001 |
| 6,143,463 |
| $ | 18 |
| 6,119,455 |
| $ | 18 |
|
(1) Summation of 1,327,834 ordinary shares (refer above) and 190,000 shares issued to former JJR VI shareholders (no cash paid).
The restricted voting common shares are convertible to ordinary shares at the option of the holder in the event that an offer is made to purchase all or substantially all of the restricted voting common shares.
All of the issued and outstanding restricted voting common shares are beneficially owned or controlled by Kingsway. In the event that such shares are disposed of such that Kingsway’s beneficial interest is less than 10% of the issued and outstanding restricted voting common shares, the restricted voting common shares shall be converted into fully paid and non-assessable ordinary shares.
The restricted voting common shares are entitled to vote at all meetings of shareholders, except at meetings of holders of a specific class that are entitled to vote separately as a class. The restricted voting common shares as a class shall not carry more than 30% of the aggregate votes eligible to be voted at a general meeting of common shareholders.
Preferred shares are not entitled to vote. Preferred shareholders are entitled to dividends on a cumulative basis whether or not declared by the Board of Directors at the rate of U.S. $0.045 per share per year (4.5%) and may be paid in cash or in additional preferred shares at the option of Atlas. In liquidation, dissolution or winding-up of Atlas, preferred shareholders receive the greater of US$1.00 per share plus all declared and unpaid dividends or the amount it would receive in liquidation if the preferred shares had been converted to restricted voting common shares or ordinary shares immediately prior to liquidation. Preferred shares are convertible into ordinary shares at the option of the holder at any date after the fifth year of issuance at the rate of 0.1270 ordinary shares for each preferred share. The conversion rate is subject to change if the number of ordinary shares or restricted voting common shares changes. The preferred shares are redeemable at the option of Atlas at a price of US$1.00 per share plus accrued and unpaid dividends commencing at the earlier of two years from issuance date of the preferred shares or the date the preferred shares are transferred to a party other than Kingsway or its subsidiaries or entities in which KAI holds a 10% or greater interest.
The cumulative amount of dividends to which the preferred shareholders are entitled upon liquidation or sooner, if Atlas declares dividends, is $810 as at December 31, 2011.
13. EARNINGS PER SHARE
Earnings per ordinary and restricted voting common for the year ended December 31, 2011 and 2010 is as follows:
|
| | | | | | | |
| | 2011 | 2010 |
| Net loss attributable to Atlas | $ | (2,470 | ) | $ | (21,812 | ) |
| Less: Preferred share dividends | (810 | ) | — |
|
| Net loss attributable to common shareholders | (3,280 | ) | (21,812 | ) |
| Basic: | | |
| | Weighted average common shares outstanding | 6,124,542 |
| 6,119,455 |
|
| Basic loss per common share | $ | (0.54 | ) | $ | (3.56 | ) |
| Diluted: | | |
| | Weighted average common shares outstanding | 6,124,542 |
| 6,119,455 |
|
| | Dilutive potential ordinary shares | — |
| — |
|
| Dilutive average common shares outstanding | 6,124,542 |
| 6,119,455 |
|
| Dilutive loss per common share | $ | (0.54 | ) | $ | (3.56 | ) |
For 2011 and 2010, basic loss per common share has been computed by dividing net loss for the period by the weighted average number of common shares outstanding during the period. As required by continuation accounting, Atlas assumed the same number of common shares outstanding for all of 2010.
Diluted loss per share is computed by dividing net loss attributable to common shareholders by the weighted average number of common shares outstanding each period plus the incremental number of shares added as a result of converting dilutive potential ordinary shares, calculated using the treasury stock method. Atlas’ dilutive potential common shares consist of outstanding stock options and warrants to purchase ordinary shares. The effects of options and warrants to issue ordinary shares are excluded from the computation of diluted loss per share in periods in which the effect would be anti-dilutive. For the year ended December 31, 2011, potential ordinary shares were anti-dilutive due to the net loss attributable to common shareholders.
14. RELATED PARTY TRANSACTIONS
The business of Atlas is carried on through its insurance subsidiaries. Atlas’ insurance subsidiaries have been a party to various transactions with affiliates in the past, although activity in this regard has diminished over time. Related party transactions, including services provided to or received by Atlas’ insurance subsidiaries, are carried out in the normal course of operations and
are measured at the amount of consideration paid or received as established and agreed upon by the parties. Management believes that consideration paid for such services approximates fair value.
At December 31, 2011 and December 31, 2010, Atlas reported net amounts receivable from (payable to) affiliates as follows which are included within other assets and accounts payable and accrued expenses on the balance sheets:
|
| | | | | | |
| As at year ended December 31, | 2011 | 2010 |
| Kingsway America Inc. | $ | 291 |
| $ | 2,058 |
|
| Universal Casualty Company | (500 | ) | — |
|
| Kingsway Amigo Insurance Company | (1 | ) | (13 | ) |
| Hamilton Risk Management Inc. | — |
| (1 | ) |
| Total | $ | (210 | ) | $ | 2,044 |
|
In 2010, Atlas’ insurance subsidiaries remitted management fees monthly to KAI for managerial services. During the first six months of 2010, those management fees included rent for Atlas’ Elk Grove Village headquarters building. That building was contributed to Atlas on June 30, 2010 and rental payments ceased at that time. Management fees paid to KAI totaled approximately $0 and$2,643 for the year ended December 31, 2011 and 2010, respectively.
Atlas’ insurance subsidiaries received $158 in regularly scheduled monthly mortgage payments for the six months ended June 30, 2010 under mortgage loan agreements with KAI which were secured by the Elk Grove Village headquarters building. In June 2010, American Service forgave the $1,695 remaining balance of its mortgage loan from KAI and American Country was paid the $1,767 total remaining balance of its mortgage loan from KAI.
The amounts due to Universal Casualty Company relate primarily to claim handling services provided to Atlas.
For the year ended December 31, 2011 and 2010, Atlas incurred $2,279 and $4,463, respectively, in commissions to Avalon Risk Management, Inc. (“Avalon”). In the year ended December 31, 2011 and 2010, Atlas also incurred expenses of $137 and $125 respectively, for marketing services performed by Avalon. Avalon was a KFSI subsidiary through October 2009, and has certain investors and directors in common with Atlas. Avalon acts as a program manager for a surety program primarily consisting of U.S. Customs bonds. In this capacity they are responsible for coordinating marketing, customer service and claim handling for the surety bonds written under this agreement. This program is 100% reinsured by an unrelated third party.
During 2010, dividends of $16,700 were paid to KAI by the insurance subsidiaries of Atlas.
15. ACCUMULATED OTHER COMPREHENSIVE INCOME
Accumulated other comprehensive income is comprised of the following:
|
| | | | | | | | | | | | | | | | | | |
| As at December 31, | 2011 | 2010 |
| | Pre-tax | Tax | Post-tax | Pre-tax | Tax | Post-tax |
| Available-for-sale securities | $ | 2,165 |
| $ | (740 | ) | $ | 1,425 |
| $ | 5,478 |
| $ | (737 | ) | $ | 4,741 |
|
| Pension liability | — |
| — |
| — |
| (2,474 | ) | 789 | (1,685 | ) |
| Total | $ | 2,165 |
| $ | (740 | ) | $ | 1,425 |
| $ | 3,004 |
| $ | 52 |
| $ | 3,056 |
|
16. SELECTED QUARTERLY FINANCIAL DATA (UNAUDITED)
|
| | | | | | | | | | | | | | | | | | | | | | | | |
| | 1st Quarter | 2nd Quarter | 3rd Quarter | 4th Quarter |
| | 2011 | 2010 | 2011 | 2010 | 2011 | 2010 | 2011 | 2010 |
| Gross Premium Written | $ | 14,166 |
| $ | 18,704 |
| $ | 7,856 |
| $ | 8,558 |
| $ | 10,928 |
| $ | 10,163 |
| $ | 9,081 |
| $ | 9,273 |
|
| Net Premium Earned | 8,809 |
| 19,301 |
| 9,062 |
| 12,515 |
| 8,797 |
| 10,192 |
| 9,079 |
| 11,595 |
|
| Underwriting loss | (1,906 | ) | (4,061 | ) | (1,278 | ) | (12,805 | ) | (1,729 | ) | (2,393 | ) | (6,325 | ) | (4,723 | ) |
| Net (loss)/income attributable to Atlas | (705 | ) | (1,583 | ) | 193 |
| (8,135 | ) | 1,066 |
| (664 | ) | (3,024 | ) | (11,430 | ) |
| Net (loss)/income attributable to common shareholders | (905 | ) | (1,583 | ) | (9 | ) | (8,135 | ) | 862 |
| (664 | ) | (3,228 | ) | (11,430 | ) |
| Basic earnings (loss) per share | $ | (0.15 | ) | $ | (0.27 | ) | $ | — |
| $ | (1.32 | ) | $ | 0.14 |
| $ | (0.12 | ) | $ | (0.53 | ) | $ | (1.86 | ) |
| Diluted earnings (loss) per share | (0.15 | ) | (0.27 | ) | — |
| (1.32 | ) | 0.14 |
| (0.12 | ) | (0.53 | ) | (1.86 | ) |
17. SUBSEQUENT EVENTS
As of March 26, 2012, there were no subsequent events which had a material impact on the 2011 consolidated financial statements.
18. CHANGE IN CAPITAL STRUCTURE
On December 7, 2012, we held a shareholder meeting where a one-for-three reverse stock split was unanimously approved. When the reverse stock split takes effect, it will decrease our authorized and outstanding ordinary shares and restricted voting shares at a ratio of one-for-three. The primary objective of the reverse stock split is to increase the per share price of our ordinary shares to meet certain listing requirements of the NASDAQ Capital Market. All consolidated financial statements and per share amounts have been retroactively adjusted for the above reverse stock split.
ATLAS FINANCIAL HOLDINGS, INC.
CONSOLIDATED STATEMENTS OF FINANCIAL POSITION
|
| | | | | | | |
| (in '000s, except for share and per share data) | December 31,
2012 | | December 31,
2011 |
| Assets | | | |
| Investments, available for sale | | | |
| Fixed income securities, at fair value (Amortized cost $95,423 and $101,473) | $ | 98,079 |
| | $ | 103,491 |
|
| Equity securities, at fair value (cost $1,563 and $994) | 1,571 |
| | 1,141 |
|
| Other investments | 1,262 |
| | — |
|
| Total Investments | 100,912 |
| | 104,632 |
|
| Cash and cash equivalents | 19,912 |
| | 23,249 |
|
| Accrued investment income | 517 |
| | 586 |
|
| Accounts receivable and other assets (Net of allowance of $484 and $4,254) | 21,923 |
| | 9,579 |
|
| Reinsurance recoverables, net | 6,020 |
| | 8,044 |
|
| Prepaid reinsurance premiums | 2,111 |
| | 2,214 |
|
| Deferred policy acquisition costs | 3,764 |
| | 3,020 |
|
| Deferred tax asset, net | 6,605 |
| | 6,775 |
|
| Software and office equipment, net | 1,137 |
| | 440 |
|
| Assets held for sale | 166 |
| | 13,634 |
|
| Total Assets | $ | 163,067 |
| | $ | 172,173 |
|
| | | | |
| Liabilities | | | |
| Claims liabilities | $ | 70,067 |
| | $ | 91,643 |
|
| Unearned premiums | 25,457 |
| | 15,691 |
|
| Due to reinsurers and other insurers | 3,803 |
| | 5,701 |
|
| Other liabilities and accrued expenses | 3,876 |
| | 2,884 |
|
| Total Liabilities | $ | 103,203 |
| | $ | 115,919 |
|
| | | | |
| Shareholders’ Equity | | | |
| Preferred shares, par value per share $0.001, 100,000,000 shares authorized, 18,000,000 shares issued and outstanding at December 31, 2012 and December 31, 2011. Liquidation value $1.00 per share | $ | 18,000 |
| | $ | 18,000 |
|
| Ordinary shares, par value per share $0.003, 266,666,667 shares authorized, 2,256,924 shares issued and outstanding at December 31, 2012 and 1,541,842 at December 31, 2011 | 4 |
| | 4 |
|
| Restricted voting common shares, par value per share $0.003, 33,333,334 shares authorized, 3,887,471 shares issued and outstanding at December 31, 2012 and 4,601,621 at December 31, 2011 | 14 |
| | 14 |
|
| Additional paid-in capital | 152,768 |
| | 152,652 |
|
| Retained deficit | (112,675 | ) | | (115,841 | ) |
| Accumulated other comprehensive income, net of tax | 1,753 |
| | 1,425 |
|
| Total Shareholders’ Equity | 59,864 |
| | 56,254 |
|
| Total Liabilities and Shareholders’ Equity | $ | 163,067 |
| | $ | 172,173 |
|
See accompanying Notes to Consolidated Financial Statements.
ATLAS FINANCIAL HOLDINGS, INC.
CONSOLIDATED STATEMENTS OF INCOME AND COMPREHENSIVE INCOME
(in '000s, except for share and per share data)
|
| | | | | | | |
| September 30, 2012
(unaudited) | | December 31,
2011 |
| Assets | | | |
| Investments, available for sale | | | |
| Fixed income securities, at fair value (Amortized cost $106,122 and $101,473) | $ | 109,555 |
| | $ | 103,491 |
|
| Equity securities, at fair value (cost $0 and $994) | — |
| | 1,141 |
|
| Total Investments | 109,555 |
| | 104,632 |
|
| Cash and cash equivalents | 12,151 |
| | 23,249 |
|
| Accrued investment income | 807 |
| | 586 |
|
| Accounts receivable and other assets (Net of allowance of $385 and $4,254) | 24,811 |
| | 9,579 |
|
| Reinsurance recoverables, net | 6,983 |
| | 8,044 |
|
| Prepaid reinsurance premiums | 2,219 |
| | 2,214 |
|
| Deferred policy acquisition costs | 4,501 |
| | 3,020 |
|
| Deferred tax asset, net | 6,343 |
| | 6,775 |
|
| Software and office equipment, net | 1,157 |
| | 440 |
|
| Assets held for sale | 166 |
| | 13,634 |
|
| Investment in investees | 1,250 |
| | — |
|
| Total Assets | $ | 169,943 |
| | $ | 172,173 |
|
| | | | |
| Liabilities | | | |
| Claims liabilities | $ | 73,574 |
| | $ | 91,643 |
|
| Unearned premiums | 28,325 |
| | 15,691 |
|
| Due to reinsurers and other insurers | 4,658 |
| | 5,701 |
|
| Other liabilities and accrued expenses | 4,283 |
| | 2,884 |
|
| Total Liabilities | $ | 110,840 |
| | $ | 115,919 |
|
| | | | |
| Shareholders’ Equity | | | |
| Preferred shares, par value per share $0.001, 100,000,000 shares authorized, 18,000,000 shares issued and outstanding at September 30, 2012 and December 31, 2011. Liquidation value $1.00 per share | $ | 18,000 |
| | $ | 18,000 |
|
| Ordinary voting common shares, par value per share $0.003, 266,666,667 shares authorized, 1,542,764 shares issued and outstanding at September 30, 2012 and 1,541,842 at December 31, 2011 | 4 |
| | 4 |
|
| Restricted voting common shares, par value per share $0.003, 33,333,334 shares authorized, 4,601,621 shares issued and outstanding at September 30, 2012 and December 31, 2011 | 14 |
| | 14 |
|
| Additional paid-in capital | 152,739 |
| | 152,652 |
|
| Retained deficit | (113,919 | ) | | (115,841 | ) |
| Accumulated other comprehensive income, net of tax | 2,265 |
| | 1,425 |
|
| Total Shareholders’ Equity | $ | 59,103 |
| | $ | 56,254 |
|
| Total Liabilities and Shareholders’ Equity | $ | 169,943 |
| | $ | 172,173 |
|
|
| | | | | | | |
| Consolidated Statements of Income | | | |
| | Year Ended December 31, |
| | 2012 | | 2011 |
| Net premiums earned | $ | 38,709 |
| | $ | 35,747 |
|
| Net investment income | 2,453 |
| | 3,280 |
|
| Net investment gains | 1,435 |
| | 4,147 |
|
| Other income | 194 |
| | 178 |
|
| Total revenue | 42,791 |
| | 43,352 |
|
| Net claims incurred | 26,545 |
| | 28,994 |
|
| Acquisition costs | 6,471 |
| | 7,294 |
|
| Other underwriting expenses | 6,609 |
| | 10,697 |
|
| Total expenses | 39,625 |
| | 46,985 |
|
| Income/(loss) from operations before income tax expense/(benefit) | 3,166 |
| | (3,633 | ) |
| Income tax expense/(benefit) | — |
| | (1,163 | ) |
| Net income/(loss) attributable to Atlas | 3,166 |
| | (2,470 | ) |
| Less: Preferred share dividends | 810 |
| | 810 |
|
| Net income/(loss) attributable to common shareholders | $ | 2,356 |
| | $ | (3,280 | ) |
| | | | |
| Basic weighted average common shares outstanding | 6,144,281 |
| | 6,124,542 |
|
| Earnings/(loss) per common share, basic | $ | 0.38 |
| | $ | (0.54 | ) |
| Diluted weighted average common shares outstanding | 8,434,948 |
| | 6,124,542 |
|
| Earnings/(loss) per common share, diluted | $ | 0.38 |
| | $ | (0.54 | ) |
| | | | |
| Consolidated Statements of Comprehensive Income | | | |
| | | | |
| Net income/(loss) attributable to Atlas | $ | 3,166 |
| | $ | (2,470 | ) |
| Changes in net unrealized gains | 1,446 |
| | 154 |
|
| Reclassification to income of net realized gains | (948 | ) | | (3,469 | ) |
| Settlement of pension plan | — |
| | 2,473 |
|
| Effect of income tax | (170 | ) | | (789 | ) |
| Other comprehensive income/(loss) for the period | 328 |
| | (1,631 | ) |
| Total comprehensive income/(loss) | $ | 3,494 |
| | $ | (4,101 | ) |
| | | | |
See accompanying Notes to Condensed Consolidated Financial Statements.
ATLAS FINANCIAL HOLDINGS, INC.
CONDENSED CONSOLIDATED STATEMENTS OF COMPREHENSIVE INCOME (Unaudited)
(in '000s, except for share and per share data)SHAREHOLDERS’ EQUITY
|
| | | | | | | | | | | | | | |
| | Three Months Ended | Nine Months Ended |
| | September 30, 2012 | | September 30, 2011 | September 30, 2012 | | September 30, 2011 |
| Net premiums earned | $ | 10,934 |
| | $ | 8,797 |
| $ | 26,795 |
| | $ | 26,668 |
|
| Net investment income | 613 |
| | 719 |
| 1,878 |
| | 2,652 |
|
| Net investment gains | 779 |
| | 1,962 |
| 1,098 |
| | 2,813 |
|
| Other income | 1 |
| | 113 |
| 169 |
| | 3 |
|
| Total revenue | 12,327 |
| | 11,591 |
| 29,940 |
| | 32,136 |
|
| Net claims incurred | 7,165 |
| | 6,984 |
| 18,477 |
| | 20,596 |
|
| Acquisition costs | 1,813 |
| | 1,720 |
| 4,582 |
| | 5,343 |
|
| Other underwriting expenses | 1,692 |
| | 1,822 |
| 4,959 |
| | 5,642 |
|
| Total expenses | $ | 10,670 |
| | $ | 10,526 |
| $ | 28,018 |
| | $ | 31,581 |
|
| Income from operations before income tax (benefit)/expense | $ | 1,657 |
| | $ | 1,066 |
| $ | 1,922 |
| | $ | 555 |
|
| Income tax expense | — |
| | — |
| — |
| | — |
|
| Net income attributable to Atlas | $ | 1,657 |
| | $ | 1,066 |
| $ | 1,922 |
| | $ | 555 |
|
| Less: Preferred share dividends | 202 |
| | 202 |
| 606 |
| | 606 |
|
| Net income/(loss) attributable to common shareholders | 1,455 |
| | 864 |
| 1,316 |
| | (51 | ) |
| | | | | | | |
| Other comprehensive income/(loss): | | | | | |
| Changes in net unrealized (losses)/gains | $ | 942 |
| | $ | (96 | ) | $ | 1,899 |
| | $ | 43 |
|
| Reclassification to income of net gains | (353 | ) | | (1,185 | ) | (632 | ) | | (2,089 | ) |
| Effect of income tax | (200 | ) | | — |
| (427 | ) | | — |
|
| Other comprehensive income/(loss) for the period | 389 |
| | (1,281 | ) | 840 |
| | (2,046 | ) |
| Total comprehensive income/(loss) | $ | 2,046 |
| | $ | (215 | ) | $ | 2,762 |
| | $ | (1,491 | ) |
| | | | | | | |
| | | | | | | |
| Basic weighted average common shares outstanding | 6,144,384 |
| | 6,124,990 |
| 6,146,179 |
| | 6,124,175 |
|
| Earnings/(loss) per common share, basic | $ | 0.24 |
| | $ | 0.14 |
| $ | 0.21 |
| | $ | (0.01 | ) |
| Diluted weighted average common shares outstanding | 6,149,301 |
| | 6,138,496 |
| 6,150,585 |
| | 6,124,175 |
|
| Earnings/(loss) per common share, diluted | $ | 0.24 |
| | $ | 0.14 |
| $ | 0.21 |
| | $ | (0.01 | ) |
See accompanying Notes to Condensed Consolidated Financial Statements. |
| | | | | | | | | | | | | | | | | | | | | | | | | | | |
| (in '000s) | Preferred Shares | | Ordinary shares | | Restricted Voting Common Shares | | Additional Paid-in Capital | | Retained Deficit | | Accumulated Other Comprehensive Income | | Total |
| Balance December 31, 2010 | $ | 18,000 |
| | $ | 4 |
| | $ | 14 |
| | $ | 152,466 |
| | $ | (113,371 | ) | | $ | 3,056 |
| | $ | 60,169 |
|
| Net loss | | | | | | | | | (2,470 | ) | | | | (2,470 | ) |
| Other comprehensive loss | | | | | | | | | | | (3,315 | ) | | (3,315 | ) |
| Share-based compensation | | | | | | | 113 |
| | | | | | 113 |
|
| Stock options exercised | | | | | | | 73 |
| | | | | | 73 |
|
| Settlement of Pension Plan | | | | | | | | | | | 1,684 |
| | $ | 1,684 |
|
| Balance December 31, 2011 | $ | 18,000 |
| | $ | 4 |
| | $ | 14 |
| | $ | 152,652 |
| | $ | (115,841 | ) | | $ | 1,425 |
| | $ | 56,254 |
|
Net income
| | | | | | | | | 3,166 |
| | | | 3,166 |
|
| Other comprehensive income | | | | | | | | | | | 328 |
| | 328 |
|
| Share-based compensation | | | | | | | 113 |
| | | | | | 113 |
|
| Stock options exercised | | | | | | | 3 |
| | | | | | 3 |
|
| Balance December 31, 2012 | $ | 18,000 |
| | $ | 4 |
| | $ | 14 |
| | $ | 116 |
| | $ | (112,675 | ) | | $ | 1,753 |
| | $ | 59,864 |
|
| | | | | | | | | | | | | | |
| See accompanying Notes to Consolidated Financial Statements. |
ATLAS FINANCIAL HOLDINGS, INC.
CONSOLIDATED STATEMENTS OF SHAREHOLDERS’ EQUITY (Unaudited)CASH FLOWS
|
| | | | | | | | | | | | | | | | | | | | | | | | | | | |
| (in ‘000s) | Preferred Shares | | Ordinary Voting Common Shares | | Restricted Voting Common Shares | | Additional Paid-in Capital | | Retained Deficit | | Accumulated Other Comprehensive Income (loss) | | Total |
| Balance December 31, 2010 | $ | 18,000 |
| | $ | 4 |
| | $ | 14 |
| | $ | 152,466 |
| | $ | (113,371 | ) | | $ | 3,056 |
| | $ | 60,169 |
|
| Net loss | | | | | | | | | 555 |
| | | | 555 |
|
| Other comprehensive loss | | | | | | | | | | | (2,046 | ) | | (2,046 | ) |
| Share-based compensation | | | | | | | 84 |
| | | | | | 84 |
|
| Stock options exercised | | | | | | | 19 |
| | | | | | 19 |
|
| Balance September 30, 2011 | $ | 18,000 |
| | $ | 4 |
| | $ | 14 |
| | $ | 152,569 |
| | $ | (112,816 | ) | | $ | 1,010 |
| | $ | 58,781 |
|
| | | | | | | | | | | | | | |
| Balance December 31, 2011 | $ | 18,000 |
| | $ | 4 |
| | $ | 14 |
| | $ | 152,652 |
| | $ | (115,841 | ) | | $ | 1,425 |
| | $ | 56,254 |
|
Net income
| | | | | | | | | 1,922 |
| | | | 1,922 |
|
| Other comprehensive income | | | | | | | | | | | 840 |
| | 840 |
|
| Share-based compensation | | | | | | | 84 |
| | | | | | 84 |
|
| Stock options exercised | | | | | | | 3 |
| | | | | | 3 |
|
| Balance September 30, 2012 | $ | 18,000 |
| | $ | 4 |
| | $ | 14 |
| | $ | 152,739 |
| | $ | (113,919 | ) | | $ | 2,265 |
| | $ | 59,103 |
|
| | | | | | | | | | | | | | |
| See accompanying Notes to Condensed Consolidated Financial Statements. |
|
| | | | | | | |
| ($ in thousands) | | | |
| | Year Ended December 31, |
| | 2012 | | 2011 |
| Operating Activities | | | |
| Net income/loss | $ | 3,166 |
| | $ | (2,470 | ) |
| Adjustments to reconcile net loss to net cash used by operating activities: | | | |
| Amortization of fixed assets | 315 |
| | 218 |
|
| Deferred employee benefit costs | — |
| | 2,657 |
|
| Share-based compensation expense | 113 |
| | 113 |
|
| (Gain)/loss on sale of fixed assets | — |
| | (54 | ) |
| Amortization of deferred gain on sale of headquarters building | (26 | ) | | — |
|
| Deferred income taxes | — |
| | (1,163 | ) |
| Net realized gains | (1,435 | ) | | (4,147 | ) |
| Amortization of bond premiums and discounts | 921 |
| | 953 |
|
| Net changes in operating assets and liabilities: | | | |
| Accounts receivable and other assets, net | (12,344 | ) | | 3,762 |
|
| Due from reinsurers and other insurers | 2,127 |
| | 1,018 |
|
| Deferred policy acquisition costs | (744 | ) | | 784 |
|
| Other assets and accrued investment income | 69 |
| | 707 |
|
| Unpaid claims | (21,576 | ) | | (40,936 | ) |
| Unearned premium | 9,766 |
| | (1,370 | ) |
| Due to reinsurers and other insurers | (1,898 | ) | | (3,913 | ) |
| Accounts payable and accrued liabilities | 805 |
| | (3,320 | ) |
| Net cash used by operating activities | (20,741 | ) | | (47,161 | ) |
| Investing activities: | | | |
| Purchase of securities | (53,470 | ) | | (64,563 | ) |
| Acquisition of other investments | (1,250 | ) | | — |
|
| Proceeds from sales and maturities of securities | 59,452 |
| | 113,823 |
|
| Sale of assets held for sale | 13,342 |
| | 2,436 |
|
| Net additions of software and other equipment | (673 | ) | | (396 | ) |
| Net cash provided by investing activities | 17,401 |
| | 51,300 |
|
| Financing activities: | | | |
| Options exercised | 3 |
| | 73 |
|
| Net cash provided by financing activities | 3 |
| | 73 |
|
| Net change in cash and cash equivalents | (3,337 | ) | | 4,212 |
|
| Cash and cash equivalents, beginning of year | 23,249 |
| | 19,037 |
|
| Cash and cash equivalents, end of year | $ | 19,912 |
| | $ | 23,249 |
|
| Supplementary disclosure of cash information: | | | |
| Cash paid for: | | | |
| Interest | — |
| | — |
|
| Income taxes | — |
| | — |
|
| | | | |
| See accompanying Notes to Consolidated Financial Statements. |
| | | | |
ATLAS FINANCIAL HOLDINGS, INC.
CONDENSED CONSOLIDATED STATEMENTS OF CASH FLOWS (Unaudited)
|
| | | | | | | |
| (in ‘000s) | Nine Month Periods Ended |
| | September 30, 2012 | | September 30, 2011 |
| Operating Activities | | | |
| Net income | $ | 1,922 |
| | $ | 555 |
|
| Adjustments to reconcile net income to net cash used by operating activities: | | | |
| Adjustments for non-cash items | (113 | ) | | (1,804 | ) |
| Changes in other operating assets and liabilities | (3,084 | ) | | 839 |
|
| Changes in net claims liabilities | (18,069 | ) | | (31,122 | ) |
| Net cash flows used in operating activities | (19,344 | ) | | (31,532 | ) |
| | | | |
| Investing activities | | | |
| Proceeds from sale and maturity of investments | 42,820 |
| | 71,085 |
|
| Purchases of investments | (47,333 | ) | | (30,282 | ) |
| Purchases of property and equipment and other | (586 | ) | | (183 | ) |
| Proceeds from sale of property and equipment | 13,342 |
| | 1,983 |
|
| Net cash flows provided by investing activities | 8,243 |
| | 42,603 |
|
| | | | |
| Financing activities | | | |
| Options exercised | 3 |
| | 19 |
|
| Net cash flows provided by financing activities | 3 |
| | 19 |
|
Net (decrease)/increase in cash and cash equivalents
| (11,098 | ) | | 11,090 |
|
| Cash and cash equivalents, beginning of period | 23,249 |
| | 19,037 |
|
| Cash and cash equivalents, end of period | $ | 12,151 |
| | $ | 30,127 |
|
| | | | |
| |
| | |
| See accompanying Notes to Condensed Consolidated Financial Statements. |
| | | | |
| |
1. | NATURE OF OPERATIONS AND BASIS OF PRESENTATION |
The accompanying unaudited condensed consolidated financial statements of Atlas Financial Holdings, Inc. (”Atlas”, or “The Company”("Atlas") and its insurance subsidiaries, American Country Insurance Company (“American Country”) and American Service Insurance Company, Inc. (“American Service”), have been prepared pursuant to the rules and regulations of the Securities and Exchange Commission (“SEC”) and do not include all the information and footnotes required by U.S. generally accepted accounting principles (“U.S. GAAP”) for complete financial statements. In the opinion of management, the unaudited condensed consolidated financial statements include all adjustments (consisting of normal recurring accruals) considered necessary for a fair presentation of the financial position and the results of operations. It is recommended that these unaudited condensed consolidated financial statements be read in conjunction with the audited financial statements and the footnotes thereto included in the Company’s latest Annual Reportcommenced operations on Form 10-K (as amended).
Beginning with the three month period ended September 30, 2012, Atlas has changed where certain items appear on its Statement of Comprehensive Income according to rule 7-04 of Regulation S-X.
December 31, 2010. The primary business of Atlas which is carried out through its insurance subsidiaries, is the underwriting of commercial automobile insurance policies in the United States, with a niche market orientation and focus on insurance infor the “light” commercial automobile sector. This sector includes taxi cabs, non-emergency para-transit, limousine, livery and business autos. Automobile insurance products provide insurance coverage in three major areas: liability, accident benefits and physical damage. Liability insurance provides coverage subject to policy terms and conditions where the insured is determined to be responsible and/or liable for an automobile accident, for the payment for injuries and property damage to third parties. Accident benefit policies or personal injury protection policies provide coverage for loss of income, medical and rehabilitation expenses for insured persons who are injured in an automobile accident, regardless of fault. Physical damage coverage subject to policy terms and conditions provides for the payment of damages to an insured automobile arising from a collision with another object or from other risks such as fire or theft. In the short run, automobile physical damage and liability coverage generally provides more predictable results than automobile accident benefit or personal injury insurance.
Atlas’Atlas' business is carried out through its insurance subsidiaries: American Country Insurance Company (“American Country”), American Service Insurance Company, Inc. (“American Service”) and, as of January 1st, 2013, Gateway Insurance Company ("Gateway"). The insurance subsidiaries distribute their insurance products through a network of retail independent retail agents. Together, American Country and American Servicethe insurance subsidiaries are licensed to write property and casualty (“P&C”) insurance in 47 states in the United States. The insurance subsidiaries share common management and operating infrastructure of.
Atlas Ordinary shares have been listed on the insurance subsidiaries are fully integrated.TSX Venture Exchange (“TSXV”) under the symbol “AFH” since January 6, 2011. Atlas ordinary shares became listed on the NASDAQ stock exchange on February 11, 2013.
Seasonality -Basis of presentation The P&C insurance business is seasonal- These statements have been prepared in nature. While Atlas’ net premiums earned areconformity with accounting principles generally stable from quarter to quarter, Atlas’ gross premiums written follow the common renewal dates for the “light” commercial risks that represent its core lines of business. For example, January 1 and March 1 are common taxi cab renewal dates in Illinois and New York, respectively. Net underwriting income is driven mainly by the timing and nature of claims, which can vary widely. Atlas’ ability to generate written premium is also impacted by the timing of policy periodsaccepted in the statesUnited States of America ("U.S. GAAP"). All significant intercompany accounts and transactions have been eliminated. To conform to the current year presentation, certain amounts in which Atlas operates.
The accounting policies followed in these unaudited condensedthe prior years’ consolidated financial statements are comparable as those applied in Atlas’ audited annualand notes have been reclassified.
Beginning with the year ended December 31, 2012, Atlas has changed where certain items appear on its Statement of Comprehensive Income according to Rule 7-04 of Regulation S-X.
Summary of Significant Accounting Policies
Principles of consolidation - The consolidated financial statements include the accounts of Atlas and the entities it controls. Subsidiaries are entities over which Atlas, directly or indirectly, has the power to govern the financial and operating policies in order to obtain the benefits from their activities, generally accompanying an equity shareholding of more than one half of the voting rights. Subsidiaries are fully consolidated from the date on Form 10-Kwhich control is transferred to Atlas and would be de-consolidated from the date that control ceases. The operating results of subsidiaries acquired or disposed of during the year will be included in the consolidated statement of operations from the effective date of acquisition and up to the effective date of disposal, as appropriate. All significant intercompany transactions and balances are eliminated in consolidation. Accounting policies of subsidiaries have been changed where necessary to ensure consistency with the policies adopted by Atlas.
The following are Atlas’ subsidiaries, all of which are 100% owned, either directly or indirectly, together with the jurisdiction of incorporation that are included in consolidated financial statements:
American Insurance Acquisition Inc. (Delaware)
American Country Insurance Company (Illinois)
American Service Insurance Company, Inc. (Illinois)
Gateway Insurance Company (Missouri) (beginning January 2, 2013) - See Note 3
Classification of assets and liabilities - It is not customary in the insurance and financial services industries to classify assets and liabilities as current (settled in 1 year or less) and non-current (settled beyond 1 year). Assets and liabilities that could otherwise be classified as current include cash and cash equivalents, accrued investment income, accounts receivable and other assets, due from reinsurers and other insurers, income tax receivable, deferred policy acquisition costs, assets held for sale, accounts payable and accrued expenses, due to reinsurers and other insurers. Balances that would otherwise be classified as non-current include deferred tax assets and office equipment. All other assets and liabilities include balances that are both current and non-current.
Estimates and assumptions - The preparation of financial statements requires management to make estimates and assumptions that affect the reported amounts of assets and liabilities and the disclosure of contingent assets and liabilities at the date of the financial statements and reported amounts of revenues and expenses during the reporting period. Actual results could differ from these estimates and changes in estimates are recorded in the accounting period in which they are determined. The liability for unpaid loss and loss adjustment expenses and related amounts recoverable from reinsurers represents the most significant estimate in the accompanying financial statements. Significant estimates in the accompanying financial statements also include the fair
values of investments in bonds, deferred tax asset valuation, premium receivable bad debt allowance and deferred policy acquisition cost recoverability.
Financial instruments - Financial instruments are recognized and derecognized using trade date accounting, since that is the date Atlas contractually commits to the purchase or sale with the counterparty.
Effective interest method - Atlas utilizes the effective interest method for calculating the amortized cost of a financial asset and to allocate interest income or interest expense over the relevant period. The effective interest rate is the rate that exactly discounts the estimated future cash flows through the expected life of the financial instrument. Interest income is reported net of amortization of premium and accretion of discount. Realized gains and losses on disposition of available-for-sale securities are based on the net proceeds and the adjusted cost of the securities sold, using the specific identification method.
Financial assets - Atlas classifies financial assets as described below. Management determines the classification at initial recognition based on the purpose of the financial asset.
Cash and cash equivalents - Cash and cash equivalents include cash and highly liquid securities with original maturities of 90 days or less.
Available for sale (“AFS”) - Investments in fixed income securities are classified as available for sale. Securities are classified as available-for-sale when Atlas may decide to sell those securities due to changes in market interest rates, liquidity needs, changes in yields or alternative investments, and for other reasons. Available-for-sale securities are carried at fair value, with unrealized gains and losses, net of income tax, included as a separate component of accumulated other comprehensive income (loss) in shareholder’s equity.
Impairment of financial assets - Atlas assesses, on a quarterly basis, whether there is evidence that a financial asset or group of financial assets is impaired. An investment is considered impaired when the fair value of the investment is less than its cost or amortized cost. When an investment is impaired, the Company must make a determination as to whether the impairment is other-than-temporary.
Under ASC guidance, with respect to an investment in an impaired debt security, other-than temporary impairment ("OTTI") occurs if (a) there is intent to sell the debt security, (b) it is more likely than not it will be required to sell the debt security before its anticipated recovery, or (c) it is probable that all amounts due will be unable to be collected such that the entire cost basis of the security will not be recovered. If Atlas intends to sell the debt security, or will more likely than not be required to sell the debt security before the anticipated recovery, a loss in the entire amount of the impairment is reflected in net investment gains (losses) on investments in the consolidated statements of income. If Atlas determines that it is probable it will be unable to collect all amounts and Atlas has no intent to sell the debt security, a credit loss is recognized in net investment gains (losses) on investments in the consolidated statements of income to the extent that the present value of expected cash flows is less than the amortized cost basis; any difference between fair value and the new amortized cost basis (net of the credit loss) is reflected in other comprehensive income (losses), net of applicable income taxes.
Fair values of financial instruments - Atlas has used the following methods and assumptions in estimating its fair value disclosures:
Fair values for investments are based on quoted market prices, when available. If quoted market prices are not available, fair values are based on quoted market prices of comparable instruments or values obtained from independent pricing services.
Atlas' fixed income portfolio is managed by a SEC registered investment advisor specializing in the management of insurance company portfolios. Management works directly with them to ensure that Atlas benefits from their expertise and also evaluates investments as well as specific positions independently using internal resources. Atlas' investment advisor has a team of credit analysts for all investment grade fixed income sectors. The investment process begins with an independent analyst review of each security's credit worthiness using both quantitative tools and qualitative review. At the issuer level, this includes reviews of past financial data, trends in financial stability, projections for the period ended future, reliability of the management team in place, market data (credit spread, equity prices, trends in this data for the issuer and the issuer's industry). Reviews also consider industry trends and the macro-economic environment. This analysis is continuous, integrating new information as it becomes available. In short, Atlas does not rely on rating agency ratings to make investment decisions, but instead with the support of its independent investment advisors, performs independent fundamental credit analysis to find the best securities possible. Together with its investment advisor, Atlas found that over time this process creates an ability to sell securities prior to rating agency downgrades or to buy securities before upgrades. As of December 31, 2011. 2012, this process did not generate any significant difference in the rating assessment between Atlas' review and the rating agencies.
Atlas hasemploys specific control processes to determine the reasonableness of the fair value of its financial assets. These processes are designed to supplement those performed by Atlas' investment advisor to ensure that the values received from them are accurately recorded and that the data inputs and the valuation techniques utilized are appropriate, consistently applied, and that the sameassumptions are reasonable and consistent with the objective of determining fair value. For example, on a continuing basis, Atlas assesses the reasonableness of individual security values which have stale prices or whose changes exceed certain thresholds as compared to previous values received from Atlas' investment advisor or to expected prices. The portfolio is reviewed routinely for transaction
volumes, new issuances, any changes in spreads, as well as the overall movement of interest rates along the yield curve to determine if sufficient activity and liquidity exists to provide a credible source for market valuations. When fair value determinations are expected to be more variable, they are validated through reviews by members of management or the Board of Directors who have relevant expertise and who are independent of those charged with executing investment transactions.
Accounts receivable and other assets - Accounts receivable include premium balances due and uncollected and installment premiums not yet due from agents and insureds.
Atlas evaluates the collectibility of accounts receivable based on a combination of factors. When aware of a specific customer's inability to meet its financial obligations, such as in the case of bankruptcy or deterioration in the customer's operating results or financial position, Atlas records a specific reserve for bad debt to reduce the related receivable to the amount Atlas reasonably believes is collectible. Atlas also records reserves for bad debt for all other customers based on a variety of factors, including the length of time the receivables are past due and historical collection experience. Accounts are reviewed for potential write-off on a case-by-case basis. Accounts deemed uncollectible are written off, net of expected recoveries. If circumstances related to specific customers change, estimates of the recoverability of receivables could be further adjusted.
Deferred policy acquisition costs ("DPAC") - Atlas defers producers’ commissions, premium taxes and other underwriting and marketing costs directly relating to the successful acquisition of premiums written to the extent they are considered recoverable. These costs are then expensed as the related premiums are earned. The method followed in determining the deferred policy acquisition costs limits the deferral to its realizable value by giving consideration to estimated future claims and expenses to be incurred as premiums are earned. Changes in estimates, if any, are recorded in the accounting period in which they are determined. Anticipated investment income is included in determining the realizable value of the deferred policy acquisition costs. Atlas’ deferred policy acquisition costs are reported net of deferred ceding commissions.
When anticipated losses, loss adjustment expenses, commissions and other acquisition costs exceed recorded unearned premium and any future installment premiums on existing policies, throughouta premium deficiency reserve is recognized by recording a reduction to DPAC with a corresponding charge to operations. Atlas utilizes anticipated investment income as a factor in its premium deficiency calculation. Atlas concluded that no premium deficiency adjustments were necessary in either of the years endedDecember 31, 2012 and December 31, 2011.
Income taxes - Income taxes expense (benefit) includes all periods presented,taxes based on taxable income (loss) of Atlas and its subsidiaries, and are recognized in the statement of income and comprehensive income except to the extent that they relate to items recognized directly in other comprehensive income, in which case the income tax effect is also recognized in other comprehensive income.
Deferred taxes are recognized using the asset and liability method of accounting. Under this method the future tax consequences attributable to temporary differences in the tax basis of assets, liabilities and items recognized directly in equity and the financial reporting basis of such items are recognized in the financial statements by recording deferred tax liabilities or deferred tax assets.
Deferred tax assets are recognized only to the extent that it is probable that future taxable income will be available against which they can be utilized. Deferred tax assets and liabilities are measured using enacted tax rates expected to apply to taxable income in the years in which those temporary differences are expected to be recovered or settled. The effect on future tax assets and liabilities of a change in tax rates is recognized in income in the period of enactment.
When considering the extent of the valuation allowance on Atlas' deferred tax asset, weight is given by management to both positive and negative evidence. GAAP states that a cumulative loss in recent years is a significant piece of negative evidence that is difficult to overcome in determining that a valuation allowance is not needed against deferred tax assets. However, the strength and trend of earnings, as well as other relevant factors are considered.
Office equipment and software – Office equipment is stated at historical cost less deprecation. Subsequent costs are included in the asset’s carrying amount or capitalized as a separate asset only when it is probable that future economic benefits will be realized. Repairs and maintenance are recognized as an expense during the period incurred. Depreciation on equipment is provided on a straight-line basis over the estimated useful lives which range from 5 years for vehicles, 7 years for furniture and the term of the lease for leased equipment.
Rent expense for the lease on Atlas' headquarters is recognized on a straight-line basis over the life of the lease.
Insurance contracts – Contracts under which Atlas’ insurance subsidiaries accept risk at the inception of the contract from another party (the insured holder of the policy) by agreeing to compensate the policyholder or other insured beneficiary if thesea specified future event (the insured event) adversely affects the holder of the policy are classified as insurance contracts. All policies had alwaysare short-duration contracts.
Revenue recognition - Premium income is recognized on a pro rata basis over the terms of the respective insurance contracts. Unearned premiums represent the portion of premiums written that are related to the unexpired terms of the policies in force.
Claims liabilities - The provision for unpaid claims represent the estimated liabilities for reported claims, plus those incurred but not yet reported and the related estimated loss adjustment expenses, such as legal fees. Unpaid claims expenses are determined
using case-basis evaluations and statistical analyses, including insurance industry loss data, and represent estimates of the ultimate cost of all claims incurred. Although considerable variability is inherent in such estimates, management believes that the liability for unpaid claims is adequate. The estimates are continually reviewed and adjusted as necessary; such adjustments are included in current operations and are accounted for as changes in estimates.
Reinsurance - As part of Atlas’ insurance risk management policies, portions of its insurance risk is ceded to reinsurers. Reinsurance premiums and claims expenses are accounted for on a basis consistent with those used in accounting for the original policies issued and the terms of the reinsurance contracts. Premiums and claims ceded to other companies have been reported as a reduction of premium revenue and claims incurred expense. Commissions paid to Atlas by reinsurers on business ceded have been accounted for as a reduction of the related policy acquisition costs. Reinsurance receivables are recorded for that portion of paid and unpaid losses and loss adjustment expenses that are ceded to other companies. Prepaid reinsurance premiums are recorded for unearned premiums that have been ceded to other companies.
Share-based payments - Atlashas a stock-based compensation plan which is described fully in effect.Note 10. Under ASC 718 Compensation-Stock Compensation (“ASC 718”), the fair-value method of accounting is used to determine and account for equity settled transactions and to determine stock-based compensation awards granted to employees and non-employees using the Black-Scholes option pricing model. Compensation expense is recognized over the period that the stock options vest, with a corresponding increase to additional paid in capital.
For option awards with graded vesting, expense is recognized on a straight line basis over the service period for the entire award.
Operating segments - Atlas is in a single operating segment – property and casualty insurance.
2. NEW ACCOUNTING STANDARDS
Accounting for Costs Associated with Acquiring or Renewing Insurance Contracts - In October 2010, the Financial Accounting Standards Board (”FASB”("FASB") issued guidance modifying the definition of the types of costs incurred by insurance entities that can be capitalized in the acquisition of new and renewal insurance contracts. The guidance specifies that the costs must be directly related to the successful acquisition of insurance contracts. The guidance also specifies that advertising costs should be included as deferred acquisition costs only when the direct−response advertising accounting criteria are met. The new guidance became effective for reporting periods beginning after December 15, 2011. Atlas’Atlas' previous policy for accounting for acquisition costs was already consistent with this guidance. Therefore the adoption of this guidance in the three and nine month periods endedSeptember 30,during 2012 did not have an impact on our financial statements.
Amendments to Fair Value Measurement and Disclosure Requirements - In May 2011, the FASB issued guidance that clarifies the application of existing fair value measurement and disclosure requirements and amends certain fair value measurement principles, requirements and disclosures. Changes were made to improve consistency in global application. The guidance is to be applied prospectively for reporting periods beginning after December 15, 2011. Early adoption was not permitted. The impact of adoption was not material to the Company’s results of operations or financial position.
Presentation of Comprehensive Income - In June and December 2011, the FASB issued guidance amending the presentation of comprehensive income and its components. Under the new guidance, a reporting entity has the option to present comprehensive income in a single continuous statement or in two separate but consecutive statements. The guidance is effective for reporting periods beginning after December 15, 2011 and is to be applied retrospectively. The new guidance affected presentation only and had no material impact on the Company’sCompany's results of operations or financial position.
3. ACQUISITION OF GATEWAY INSURANCE COMPANY
On January 2, 2013 we acquired Camelot Services, Inc., ("Camelot Services"), a privately owned insurance holding company, and its sole subsidiary, Gateway Insurance Company, or Gateway, from Hendricks Holding Company, Inc., or Hendricks, an unaffiliated third party. Gateway provides specialized commercial insurance products, including commercial automobile insurance to niche markets such as taxi, black car and sedan service owners and operators.
Under the terms of the stock purchase agreement, the purchase price equaled the tangible GAAP book value of Camelot Services at December 31, 2012, subject to certain pre and post-closing adjustments, including, among others, claim development between the signing of the stock purchase agreement and December 31, 2012. Additional consideration may be paid to the seller, or returned to us by the seller, depending upon, among other things, the future development of Gateway’s actual loss reserves for certain lines of business and the utilization of certain deferred tax assets over time. Gateway also writes workers’ compensation insurance. However, an indemnity reinsurance agreement was entered into pursuant to which 100% of Gateway’s workers’ compensation business was ceded to a third party captive reinsurer funded by the seller as part of the transaction.
The total purchase price for all of Camelot Services’ outstanding shares was $14.3 million, consisting of a combination of cash and Atlas preferred shares. Consideration consisted of a $6.0 million dividend paid by Gateway immediately prior to the closing, $2.0 million of Atlas preferred shares (consisting of a total of 2 million preferred shares) and $6.3 million in cash. The agreement includes contractual protections to offset up to $2.0 million of future reserve development. We have also agreed to provide the sellers up to $2.0 million in additional consideration in the event of favorable reserve development.
We began consolidating Gateway on January 1, 2013, therefore their financial results have not been included in Atlas' financial results for the year ended December 31, 2012. However, the following unaudited pro forma summary presents Atlas' consolidated
3.financial information as if Gateway had been acquired on January 1, 2012 and 2011. These amounts have been calculated after applying the Company's accounting policies had the acquisition been completed on January 1, 2012 and 2011. These results were prepared for comparative purposes only and do not purport to be indicative of the results of operations which may have actually resulted had the acquisitions occurred on the indicated dates, nor are they indicative of potential future operating results of the company.
|
| | | | | | | |
| (in '000s) | | | |
| Year Ended December 31, | 2012 | | 2011 |
| Revenue | $ | 53,708 |
| | $ | 56,361 |
|
| Net income | $ | (1,346 | ) | | $ | (4,392 | ) |
The value of certain assets and liabilities acquired are preliminary and are subject to adjustment as additional information is obtained, including, but not limited to, valuation of separately identifiable intangibles and deferred taxes. The valuations must be finalized within 12 months of the close of the acquisition. Any changes upon finalization to the preliminary valuation of assets and liabilities may result in the creation of identifiable intangible assets and goodwill. Changes to the purchase price allocation will be adjusted prospectively in future consolidated financial results. The following table presents assets acquired and liabilities assumed for the Gateway acquisition based on its estimated fair value on January 1, 2013.
|
| | | |
| (in '000s) | |
| Purchase Consideration | |
| Cash | $ | 12,282 |
|
| Preferred stock | 2,000 |
|
| Total | $ | 14,282 |
|
| | |
| Allocation of Purchase Price | |
| | |
| Cash and investments | $ | 45,421 |
|
| Other current assets | 17,273 |
|
| Property and equipment | 195 |
|
| Deferred policy acquisition costs | 685 |
|
| Total Assets | $ | 63,574 |
|
| | |
| Claims liabilities | $ | 36,209 |
|
| Unearned premiums | 9,601 |
|
| Accounts payable and other liabilities | 3,482 |
|
| Total Liabilities | $ | 49,292 |
|
| | |
| Net assets acquired | $ | 14,282 |
|
4. EARNINGS PER SHARE
Earnings per ordinary and restricted voting common share (collectively, the “common shares”"common shares") for the three and nine month periodsyears ended September 30,December 31, 2012 and, September 30,December 31, 2011 is as follows:
|
| | | | | | | | | | | | | | |
| in ‘000s, except share and per share amounts | Three Month Periods Ended | | Nine Month Periods Ended |
| | September 30, 2012 | September 30, 2011 | | September 30, 2012 | September 30, 2011 |
| Net income attributable to Atlas | $ | 1,657 |
| $ | 1,066 |
| | $ | 1,922 |
| $ | 555 |
|
| Less: Preferred share dividends | 202 |
| 202 |
| | 606 |
| 606 |
|
| Net income/(loss) attributable to common shareholders | 1,455 |
| 864 |
| | 1,316 |
| (51 | ) |
| Basic: | | | | | |
| | Weighted average common shares outstanding | 6,144,384 |
| 6,124,990 |
| | 6,146,179 |
| 6,124,175 |
|
| Basic earnings/(loss) per common share | $ | 0.24 |
| $ | 0.14 |
| | $ | 0.21 |
| $ | (0.01 | ) |
| Diluted: | | | | | |
| | Weighted average common shares outstanding | 6,144,384 |
| 6,124,990 |
| | 6,146,179 |
| 6,124,175 |
|
| | Dilutive potential ordinary shares | 4,917 |
| 13,507 |
| | 4,406 |
| — |
|
| Dilutive average common shares outstanding | 6,149,301 |
| 6,138,497 |
| | 6,150,585 |
| 6,124,175 |
|
| Dilutive earnings/(loss) per common share | $ | 0.24 |
| $ | 0.14 |
| | $ | 0.21 |
| $ | (0.01 | ) |
For 2012 and 2011, basic earnings/(loss) per common share has been computed by dividing net income(loss) attributable to common shareholders for the period by the weighted average number of common shares outstanding during the period. |
| | | | | | | | |
| | 2012 | | 2011 |
| Basic: | | | |
| Net income/(loss) attributable to Atlas | $ | 3,166 |
| | $ | (2,470 | ) |
| Less: Preferred share dividends | 810 |
| | 810 |
|
| Net income/(loss) attributable to common shareholders | 2,356 |
| | (3,280 | ) |
| | Weighted average common shares outstanding | 6,144,281 |
| | 6,124,542 |
|
| Basic earnings/(loss) per common share | $ | 0.38 |
| | $ | (0.54 | ) |
| Diluted: | | | |
| Net income/(loss) attributable to Atlas | $ | 3,166 |
| | $ | (2,470 | ) |
| | Weighted average common shares outstanding | 6,144,281 |
| | 6,124,542 |
|
| | Dilutive potential ordinary shares | 2,290,667 |
| | — |
|
| Dilutive average common shares outstanding | 8,434,948 |
| | 6,124,542 |
|
| Dilutive earnings/(loss) per common share | $ | 0.38 |
| | $ | (0.54 | ) |
Diluted earnings/(loss) per share is computed by dividing net income/(loss) attributable to common shareholders by the weighted average number of common shares outstanding each period plus the incremental number of shares added as a result of converting dilutive potential ordinary shares, calculated using the treasury stock method. Atlas’ dilutive potential ordinary shares consist of outstanding stock options andto purchase Ordinary shares, warrants to purchase 1,327,834 Ordinary shares of Atlas for C$6.00 per share, preferred shares potentially convertible to ordinary voting common shares.shares at the option of the holder at any date after December 31, 2015 at the rate of 0.1270 ordinary shares for each preferred share. The effects of options and warrants to issue ordinary voting common sharesthese convertible instruments are excluded from the computation of diluted loss per share in periods in which the effect would be anti-dilutive. For both the three and nine month periodsyear endedSeptember 30, December 31, 2012 and September 30, 2011, potential ordinary voting commonOrdinary shares were dilutive due to the achievement of net income attributable to common shareholders.
4.
5. INVESTMENTS
The amortized cost, gross unrealized gains and losses and fair value for Atlas’ investments in fixed maturities and equity investments are as follows (all amounts in ‘000s)'000s):
|
| | | | | | | | | | | | | |
| September 30, 2012 | Amortized Cost | Gross Unrealized Gains | Gross Unrealized Losses | Fair Value |
| | | | | | |
| Fixed Income: | | | | | |
| U.S. | - Government | $ | 37,357 |
| $ | 1,099 |
| $ | — |
| $ | 38,456 |
|
| | - Corporate | 44,100 |
| 1,709 |
| — |
| 45,809 |
|
| | - Commercial mortgage backed | 20,372 |
| 490 |
| — |
| 20,862 |
|
| | - Other asset backed | 4,293 |
| 135 |
| — |
| 4,428 |
|
| Total Fixed Income | | $ | 106,122 |
| $ | 3,433 |
| $ | — |
| $ | 109,555 |
|
|
| | | | | | | | | | | | | |
| December 31, 2012 | Amortized Cost | Gross Unrealized Gains | Gross Unrealized Losses | Fair Value |
| | | | | | |
| Fixed income: | | | | |
| U.S. | - Government | $ | 34,993 |
| $ | 879 |
| $ | 9 |
| $ | 35,863 |
|
| | - Corporate | 35,922 |
| 1,253 |
| 16 |
| 37,159 |
|
| | - Commercial mortgage backed | 20,387 |
| 433 |
| 7 |
| 20,813 |
|
| | - Other asset backed | 4,121 |
| 123 |
| — |
| 4,244 |
|
| Total fixed income | $ | 95,423 |
| $ | 2,688 |
| $ | 32 |
| $ | 98,079 |
|
| Equities | $ | 1,563 |
| $ | 8 |
| $ | — |
| $ | 1,571 |
|
| Totals | $ | 96,986 |
| $ | 2,696 |
| $ | 32 |
| $ | 99,650 |
|
| | | December 31, 2011 | December 31, 2011 | Amortized Cost | Gross Unrealized Gains | Gross Unrealized Losses | Fair Value | December 31, 2011 | Amortized Cost | Gross Unrealized Gains | Gross Unrealized Losses | Fair Value |
| | | | | |
| Fixed Income: | | | |
| Fixed income: | | Fixed income: | |
| U.S. | - Government | $ | 44,835 |
| $ | 911 |
| $ | — |
| $ | 45,746 |
| - Government | $ | 44,835 |
| $ | 911 |
| $ | — |
| $ | 45,746 |
|
| | - Corporate | 35,572 |
| 825 |
| 24 |
| 36,373 |
| - Corporate | 35,572 |
| 825 |
| 24 |
| 36,373 |
|
| | - Commercial mortgage backed | 17,493 |
| 208 |
| — |
| 17,701 |
| - Commercial mortgage backed | 17,493 |
| 208 |
| — |
| 17,701 |
|
| | - Other asset backed | 3,573 |
| 99 |
| 1 |
| 3,671 |
| - Other asset backed | 3,573 |
| 99 |
| 1 |
| 3,671 |
|
| Total Fixed Income | | $ | 101,473 |
| $ | 2,043 |
| $ | 25 |
| $ | 103,491 |
| |
| Total fixed income | | Total fixed income | $ | 101,473 |
| $ | 2,043 |
| $ | 25 |
| $ | 103,491 |
|
| Equities | | 994 |
| 147 |
| — |
| 1,141 |
| Equities | 994 |
| 147 |
| — |
| 1,141 |
|
| Totals | | $ | 102,467 |
| $ | 2,190 |
| $ | 25 |
| $ | 104,632 |
| Totals | $ | 102,467 |
| $ | 2,190 |
| $ | 25 |
| $ | 104,632 |
|
The following tables summarize carrying amounts of fixed income securities by contractual maturity (all amounts in ‘000s)'000s). As certain securities and debentures have the right to call or prepay obligations, the actual settlement dates may differ from contractual maturity.
|
| | | | | | | | | | | | | | | |
| As of the period ended September 30, 2012 | One year or less | One to five years | Five to ten years | More than ten years | Total |
| Fixed Income Securities | $ | 18,085 |
| $ | 21,803 |
| $ | 21,806 |
| $ | 47,861 |
| $ | 109,555 |
|
| Percentage of total | 16.5 | % | 19.9 | % | 19.9 | % | 43.6 | % | 100.0 | % |
|
| | | | | | | | | | | | | | | |
| As of the year ended December 31, 2012 | One year or less | One to five years | Five to ten years | More than ten years | Total |
| Fixed income securities | $ | 9,513 |
| $ | 23,124 |
| $ | 20,524 |
| $ | 44,918 |
| $ | 98,079 |
|
| Percentage of total | 9.7 | % | 23.6 | % | 20.9 | % | 45.7 | % | 100.0 | % |
| | | As of the year ended December 31, 2011 | One year or less | One to five years | Five to ten years | More than ten years | Total | One year or less | One to five years | Five to ten years | More than ten years | Total |
| Fixed Income Securities | $ | 29,407 |
| $ | 27,317 |
| $ | 10,242 |
| $ | 36,525 |
| $ | 103,491 |
| |
| Fixed income securities | | $ | 29,407 |
| $ | 27,317 |
| $ | 10,242 |
| $ | 36,525 |
| $ | 103,491 |
|
| Percentage of total | 28.4 | % | 26.4 | % | 9.9 | % | 35.3 | % | 100.0 | % | 28.4 | % | 26.4 | % | 9.9 | % | 35.3 | % | 100.0 | % |
Management performs a quarterly analysis of Atlas’ investment holdings to determine if declines in fair value are other than temporary. The analysis includes some or all of the following procedures as deemed appropriate by management:
| |
| ◦ | identifying all security holdings in unrealized loss positions that have existed for at least six months or other circumstances that management believes may impact the recoverability of the security; |
| |
| ◦ | obtaining a valuation analysis from third party investment managers regarding these holdings based on their knowledge, experience and other market based valuation techniques; |
| |
| ◦ | reviewing the trading range of certain securities over the preceding calendar period; |
| |
| ◦ | assessing if declines in market value are other than temporary for debt security holdings based on credit ratings from third party security rating agencies; and |
| |
| ◦ | determining the necessary provision for declines in market value that are considered other than temporary based on the analyses performed. |
The risks and uncertainties inherent in the assessment methodology utilized to determine declines in market value that are other than temporary include, but may not be limited to, the following:
| |
| ◦ | the opinion of professional investment managers could be incorrect; |
| |
| ◦ | the past trading patterns of individual securities may not reflect future valuation trends; |
| |
| ◦ | the credit ratings assigned by independent credit rating agencies may be incorrect due to unforeseen or unknown facts related to a company’s financial situation; and |
| |
| ◦ | the debt service pattern of non-investment grade securities may not reflect future debt service capabilities and may not reflect a company’s unknown underlying financial problems. |
There were no impairments recorded in the three month period ended September 30, 2012 or the yearyears ended December 31, 2012 and 2011 as a result of the above analysis performed by management to determine declines in fair value that may be other than temporary. All securities in an unrealized loss position as of the period ended September 30, 2012 and as of the yearyears ended December 31, 2012 and 2011 have been in said position for less than 12 months.
The following table summarizes the components of net investment income for the three month periodsyears ended September 30,December 31, 2012 and 2011(all amounts in ‘000s)'000s):
| | | | | | September 30, 2012 | September 30, 2011 | | | 2012 | 2011 |
| Total investment income | Total investment income | | | Total investment income | | |
| | Interest (from fixed income securities) | $ | 680 |
| $ | 905 |
| Interest income | $ | 2,757 |
| $ | 3,791 |
|
| | Income from equity method investment | 18 |
| — |
| Dividends | 19 |
| 12 |
|
| | | Income from other investments | 55 |
| — |
|
| Investment expenses | Investment expenses | | (85 | ) | (186 | ) | Investment expenses | | (378 | ) | (523 | ) |
| Net investment income | Net investment income | | $ | 613 |
| $ | 719 |
| Net investment income | | $ | 2,453 |
| $ | 3,280 |
|
The following table summarizes the components of net investment gains for the years ended December 31:
|
| | | | | | | | |
| | | 2012 | 2011 |
| Fixed income securities | | $ | 799 |
| $ | 4,147 |
|
| Equities | 636 |
| — |
|
| Net investment gains (losses) | | $ | 1,435 |
| $ | 4,147 |
|
Atlas' other investment is in a limited partnership that primarily invests in income-producing real estate. Atlas' interests are not deemed minor and it is accounted for under the equity method of accounting. As of the year ended December 31, 2012, the
carrying value was $1.3 million versus $0as of the year ended December 31, 2011. The estimated fair value approximates due to the investees not being publicly traded.
Collateral pledged:
As of the period ended September 30,At December 31, 2012, bonds and term deposits with a fair value of $9.8 million were on deposit with state and provincial regulatory authorities, versus $11.8 millionas of the year ended at December 31, 2011. Also, from time to time, the Company pledges securities to third parties to collateralize liabilities incurred under its policies of insurance. At the As of the period
year ended September 30,December 31, 2012, the amount of such pledged securities was $11.68.3 million versus $10.4 million at December 31, 2011. Collateral pledging transactions are conducted under terms that are common and customary to standard collateral pledging and are subject to the Company’s standard risk management controls. These assets and investment income related thereto remain the property of the Company while pledged. Neither the state and/or provincial regulatory authorities nor any other third party has the right to re-pledge or sell said securities held on deposit.
5. INVESTMENT IN INVESTEES
Investment in investees represents Atlas’ investment in the member’s capital of Oak Street Real Estate Capital ATCO SMA LLC (”Oak Street”). Atlas holds a non-controlling interest in Oak Street, a limited liability company that owns and manages a commercial office building in Wisconsin. Therefore, Atlas has accounted for the investment under the equity method. The carrying values, estimated fair values and economic interest at September 30, 2012 are below.
The estimated fair value of our investment in Oak Street approximates carrying value due to the investees not being actively traded at September 30, 2012.
|
| | | | | | | | |
| Investment in: | Economic Interest | Carrying Value (in ‘000s) | Est Fair Value (in ‘000s) |
| Oak Street | 6.39 | % | $ | 1,250 |
| $ | 1,250 |
|
Atlas received distributions from Oak Street of $18,000 during the three month period ended September 30, 2012. As well, Atlas’ equity in the net income of Oak Street was $18,000 during the three month period ended September 30, 2012, which is reflected as investment income for the three and nine month periods endedSeptember 30, 2012.
6. FINANCIAL AND CREDIT RISK MANAGEMENT
By virtue of the nature of Atlas’ business activities, financial instruments make up the majority of the balance sheet. The risks which arise from transacting financial instruments include credit risk, market risk, liquidity risk and cash flow risk. These risks may be caused by factors specific to an individual instrument or factors affecting all instruments traded in the market. Atlas has a risk management framework in place to monitor, evaluate and manage the risks assumed in conducting its business. Atlas’ risk management policies and practices are as follows:
Credit risk - Atlas is exposed to credit risk principally through its fixed income securities and balances receivable from policyholders and reinsurers. Atlas controls and monitors concentration and credit quality risk through policies to limit and monitor its exposure to individual issuers or related groups (with the exception of U.S. Government bonds) as well as through ongoing review of the credit ratings of issuers held in the securities portfolio. Atlas’ credit exposure to any one individual policyholder is not material. Atlas has policies requiring evaluation of the financial condition of its reinsurers and monitors concentrations of credit risk arising from similar geographic regions, activities, or economic characteristics of the reinsurers to minimize its exposure to significant losses from reinsurer insolvency.
Atlas’Atlas' allowance for bad debt of $4.3 millionas of the year ended December 31, 2011 primarily related to a single agent. Settlement proceedings with this agent were executed in April 2012, and resulted in a minor recovery of previously fully reserved amounts. InAt the three month periodyear ended September 30,December 31, 2012 there was additional favorable activity related to the, Atlas' allowance for bad debt which resulted in incomedeclined to $484,000 and bad debt expense of $15952,000 for the quarter and $105,000 for the nine month period ended September 30, 2012.was recognized. In the three month periodyear ended September 30,December 31, 2011, Atlas recognized $33248,000 in bad debt expense and $147,000 for the nine month period ended September 30, 2011.expense.
Equity price risk - This is the risk of loss due to adverse movements in equity prices. Atlas’Atlas' investment in equity securities comprises a small percentage of its total portfolio, and as a result, the exposure to this type of risk is minimal.
Foreign currency risk - Atlas is not currently exposed to material changes in the U.S. dollar currency exchange rates with any other foreign currency.
Liquidity and cash flow risk - Liquidity risk is the risk of having insufficient cash resources to meet current financial obligations without raising funds at unfavorable rates or selling assets on a forced basis. Liquidity risk arises from general business activities and in the course of managing the assets and liabilities of Atlas. There is the risk of loss to the extent that the sale of a security prior to its maturity is required to provide liquidity to satisfy policyholder and other cash outflows. Cash flow risk arises from risk that future inflation of policyholder cash flow exceeds returns on long-term investment securities. The purpose of liquidity and cash flow management is to ensure that there is sufficient cash to meet all financial commitments and obligations as they fall due. The liquidity and cash flow requirements of Atlas’ business have been met primarily by funds generated from operations, asset maturities and income and other returns received on securities. Cash provided from these sources is used primarily for claims and claim adjustment expense payments and operating expenses. The timing and amount of catastrophe claims are inherently unpredictable and may create increased liquidity requirements.
Fair value - Fair value amounts represent estimates of the consideration that would currently be agreed upon between knowledgeable, willing parties who are under no compulsion to act.
Fair value is best evidenced by quoted bid or ask price, as appropriate, in an active market. Where bid or ask prices are not available, such as in an illiquid or inactive market, the closing price of the most recent transaction of that instrument subject to appropriate adjustments as required is used. Where quoted market prices are not available, the quoted prices of similar financial instruments or valuation models with observable market based inputs are used to estimate the fair value. These valuation models may use multiple observable market inputs, including observable interest rates, foreign exchange rates, index levels, credit spreads, equity prices, counterparty credit quality, corresponding market volatility levels and option volatilities. Minimal management judgment is required for fair values calculated using quoted market prices or observable market inputs for models. The calculation of estimated fair value is based on market conditions at a specific point in time and may not be reflective of future fair values.
Atlas records the available for sale securities held in its securities portfolio at their fair value. Atlas primarily uses the services of external securities pricing vendors to obtain these values. The securities are valued using quoted market prices or prices established using observable market inputs. In volatile market conditions, these quoted market prices or observable market inputs can change rapidly causing a significant impact on fair value and financial results recorded.
Atlas employs a fair value hierarchy to categorize the inputs it uses in valuation techniques to measure the fair value. The hierarchy is comprised of quoted market prices (Level 1), third party models using observable market information (Level 2) and internal models without observable market information (Level 3). The following table summarizes Atlas’Atlas' investments at fair value as at the three month periodyear ended September 30,December 31, 2012 and as of the year ended December 31, 2011(all amounts in ‘000s)'000s):
| | | September 30, 2012 | Level 1 | Level 2 | Level 3 | Total | |
| Fixed Income Securities | $ | 19,013 |
| $ | 90,542 |
| $ | — |
| $ | 109,555 |
| |
| December 31, 2012 | | Level 1 | Level 2 | Level 3 | Total |
| Fixed income securities | | $ | 9,843 |
| $ | 88,002 |
| $ | 234 |
| $ | 98,079 |
|
| Equities | — |
| — |
| — |
| — |
| 1,571 |
| — |
| — |
| 1,571 |
|
| Other investments | | — |
| — |
| 1,262 |
| $ | 1,262 |
|
| Totals | $ | 19,013 |
| $ | 90,542 |
| $ | — |
| $ | 109,555 |
| $ | 11,414 |
| $ | 88,002 |
| $ | 1,496 |
| $ | 100,912 |
|
|
| | | | | | | | | | | | |
| December 31, 2011 | Level 1 | Level 2 | Level 3 | Total |
| Fixed Income Securities | $ | 13,363 |
| $ | 90,128 |
| $ | — |
| $ | 103,491 |
|
| Equities | 1,141 |
| — |
| — |
| 1,141 |
|
| Totals | $ | 14,504 |
| $ | 90,128 |
| $ | — |
| $ | 104,632 |
|
Of the total portfolio of fixed income securities, only holdings of U.S. Treasury Securities are classified within Level 1. There were no transfers in or out of Level 2 during either period.
The fair value of the fixed income security in Level 3 was calculated using risk-adjusted value ranges and estimates. Refer to Note 5 for a description of the other investment in Level 3, whose fair value approximates its carrying value. There have been no unrealized or realized gains recorded related to the other investment during the year ended December 31, 2012. Both securities received Level 3 classification due to the absence of fair value quotes from Atlas' third party valuation service provider.
Though Atlas believes its valuation methods are appropriate, the use of different methodologies or assumptions to determine its fair value could result in a different fair value at the year ended December 31, 2012. Management does not believe that reasonable changes to the inputs to its valuation methodology would result in a significantly higher or lower fair value measurement.
Capital Managementmanagement - The Company manages capital using both regulatory capital measures and internal metrics. The Company’s capital is primarily derived from common shareholders’ equity, retained deficit and accumulated other comprehensive income (loss).
As a holding company, Atlas could derive cash from its insurance subsidiaries generally in the form of dividends to meet its obligations, which will primarily consist of operating expense payments. Atlas’ insurance subsidiaries fund their obligations primarily through premium and investment income and maturities in the securities portfolio. The insurance subsidiaries require regulatory approval for the return of capital and, in certain circumstances, prior to the payment of dividends. In the event that dividends available to the holding company are inadequate to cover its operating expenses, the holding company would need to raise capital, sell assets or incur future debt.
The insurance subsidiaries must each maintain a minimum statutory capital and surplus of $1.5 million under the provisions of the Illinois Insurance Code. Dividends may only be paid from statutory unassigned surplus, and payments may not be made if such surplus is less than a stipulated amount. The dividend restriction is the greater of statutory net income or 10% of total statutory capital and surplus.
Net lossesincome computed under statutory-basis accounting for American Country andwas $457,000 versus a loss of $1.6 million for American Service wereService. Losses for the year ended December 31, 2011were $2.3 million and $497,000 respectively for the year ended December 31, 2011, versus $1.5 millionAmerican Country and $5.4 million for the year ended December 31, 2010.American Service, respectively. Statutory capital and surplus of the insurance subsidiaries was $$50.052.2 million and $45.650.0 million at December 31, 20112012 and 2010,2011, respectively.
Atlas did not declare or pay any dividends to its common shareholders during the three month periodyear ended September 30,December 31, 2012 or in the year ended December 31, 2011, and has no current plans to pay dividends to its common shareholders.2011.
7. INCOME TAXES
The effective tax rate was 0.0% and (32.0)%for both of the three month periodsyears ended September 30,December 31, 2012 and 2011, respectively, compared to the U.S. statutory income tax rate of 34% as shown below (allbelow(all amounts in ‘000s)'000s):
|
| | | | | | | | | | | | | |
| | 2012 | | 2011 |
| | Amount | | % | | Amount | | % |
| Expected income tax expense/(benefit) at statutory rate | $ | 1,076 |
| | 34.0 | % | | $ | (1,235 | ) | | (34.0 | )% |
| Change in valuation allowance | (1,119 | ) | | (35.3 | )% | | — |
| | — | % |
| Nondeductible expenses | 48 |
| | 1.5 | % | | 5 |
| | 0.1 | % |
| Tax implications of qualifying transaction | — |
| | — | % | | 75 |
| | 2.1 | % |
| Other | (5 | ) | | (0.2 | )% | | (8 | ) | | (0.2 | )% |
| Total | $ | — |
| | — | % | | $ | (1,163 | ) | | (32.0 | )% |
|
| | | | | | | | | | | | | | | | | | | | | | | | | | | |
| | Three Month Periods Ended | | Nine Month Periods Ended |
| | September 30, 2012 | September 30, 2011 | | September 30, 2012 | | September 30, 2011 |
| | Amount | | % | | Amount | | % | | Amount | | % | | Amount | | % |
| Expected income tax benefit at statutory rate | $ | 563 |
| | 34.0 | % | | $ | 362 |
| | 34.0 | % | | $ | 653 |
| | 34.0 | % | | $ | (174 | ) | | 34.0 | % |
| Valuation allowance | (566 | ) | | (34.2 | )% | | (384 | ) | | (56.0 | )% | | (658 | ) | | (34.2 | )% | | 131 |
| | (25.6 | )% |
| Nondeductible expenses | 5 |
| | 0.3 | % | | 22 |
| | 22.0 | % | | 10 |
| | 0.5 | % | | 43 |
| | (8.4 | )% |
| Other | (2 | ) | | (0.1 | )% | |
| | — | % | | (5 | ) | | (0.3 | )% | |
| | — | % |
| Total | $ | — |
| | — | % | | $ | — |
| | — | % | | $ | — |
| | — | % | | $ | — |
| | — | % |
Income tax expense consists of the following for the nine month periodsyear ended September 30,December 31, 2012 and September 30,December 31, 2011: | | | | 2012 | 2011 | 2012 | 2011 |
| Current tax expense/(benefit) | $ | — |
| $ | — |
| $ | — |
| $ | — |
|
| Deferred tax (benefit)/expense | — |
| — |
| |
| Deferred tax (benefit)/expense, net of change in valuation allowance | | — |
| (1,163 | ) |
| Total | $ | — |
| $ | — |
| $ | — |
| $ | (1,163 | ) |
Upon the transaction forming Atlas on December 31, 2010, a yearly limitation as required by U.S. tax law Section 382 that applies to changes in ownership on the future utilization of Atlas’ net operating loss carry-forwards was calculated. The insurance subsidiaries’ prior parent retained those tax assets previously attributed to the insurance subsidiaries which could not be utilized by Atlas as a result of this limitation. As a result, Atlas’ ability to recognize future tax benefits associated with a portion of its deferred tax assets generated during prior years and the current year have been permanently limited to the amount determined under U.S. tax law Section 382. The result is a maximum expected net deferred tax asset which Atlas has available after the merger which is believed more-likely-than-not to be utilized in the future, after consideration of valuation allowance.
The components of deferred income tax assets and liabilities as of September 30,December 31, 2012 and December 31, 2011 are as follows (all amounts in ‘000s)'000s):
| | | | September 30, 2012 | December 31, 2011 | December 31, 2012 | December 31, 2011 |
| Deferred tax assets: | | |
| Unpaid claims and unearned premiums | $ | 3,471 |
| $ | 3,004 |
| $ | 3,144 |
| $ | 3,004 |
|
| Loss carry-forwards | 15,880 |
| 15,558 |
| |
| Taxable loss carry-forwards | | 16,128 |
| 15,558 |
|
| Bad debts | 131 |
| 1,297 |
| 164 |
| 1,297 |
|
| Other | 1,456 |
| 1,338 |
| 907 |
| 1,338 |
|
| Valuation allowance | (11,703 | ) | (12,361 | ) | (11,242 | ) | (12,361 | ) |
| Total deferred tax assets, net of allowance | $ | 9,235 |
| $ | 8,836 |
| 9,101 |
| 8,836 |
|
| | | |
| Deferred tax liabilities: | | |
| Investment securities | 1,167 |
| 740 |
| 910 |
| 740 |
|
| Deferred policy acquisition costs | 1,530 |
| 1,027 |
| 1,280 |
| 1,027 |
|
| Other | 195 |
| 294 |
| 306 |
| 294 |
|
| Total gross deferred tax liabilities | $ | 2,892 |
| $ | 2,061 |
| 2,496 |
| 2,061 |
|
| Net deferred tax assets | $ | 6,343 |
| $ | 6,775 |
| $ | 6,605 |
| $ | 6,775 |
|
Amounts and expiration dates of the operating loss carry forwards as of September 30,December 31, 2012 are as follows (all amounts in ‘000s)'000s):
| | | Year of Occurrence | Year of Expiration | Amount | Year of Expiration | Amount |
| 2001 | 2021 | $ | 14,750 |
| 2021 | $ | 14,750 |
|
| 2002 | 2022 | 4,317 |
| 2022 | 4,317 |
|
| 2006 | 2026 | 7,825 |
| 2026 | 7,825 |
|
| 2007 | 2027 | 5,131 |
| 2027 | 5,131 |
|
| 2008 | 2028 | 1,949 |
| 2028 | 1,949 |
|
| 2009 | 2029 | 1,949 |
| 2029 | 1,949 |
|
| 2010 | 2030 | 1,949 |
| 2030 | 1,949 |
|
| 2011 | 2031 | 7,762 |
| 2031 | 9,349 |
|
| 2012 | 2032 | 1,074 |
| 2032 | 216 |
|
| Total | | $ | 46,706 |
| | $ | 47,435 |
|
Atlas established a valuation allowance of $11.711.2 million and $12.4 million for its gross deferred tax assets as of the periodyear ended September 30,December 31, 2012 and as of the year ended December 31, 2011, respectively.
In assessing the need for a valuation allowance, Atlas considers both positive and negative evidence related to the likelihood of realization of the deferred tax assets. If, based on the weight of available evidence, it is more likely than not the deferred tax assets will not be realized or if it is deemed premature to conclude that these assets will be realized in the near future, a valuation allowance is recorded. The weight given to the positive and negative evidence is commensurate with the extent to which the evidence may be objectively verified. GAAP states that a cumulative loss in recent years is a significant piece of negative evidence that is difficult to overcome in determining that a valuation allowance is not needed against deferred tax assets. Atlas' assessment also considered the recent spin-off from prior ownership, the nature and extent of cumulative financial losses and trends in recent quarterly earnings.
Atlas accounts for uncertain tax positions in accordance with the income taxes accounting guidance. Atlas has analyzed filing positions in the federal and state jurisdiction where it is required to file tax returns, as well as the open tax years in these jurisdictions. Atlas believes that its federal and state income tax filing positions and deductions will be sustained on audit and does not anticipate any adjustments that will result in a material change to its financial position. Therefore, no reserves for uncertain federal and state income tax positions have been recorded. Atlas would recognize interest and penalties related to unrecognized tax benefits as a component of the provision for federal income taxes. Atlas did not incur any federal income tax related interest income, interest expense or penalties for the three month periodsyears ended September 30,December 31, 2012 and 2011.or 2011. Tax years 20062008 through 20112012 are subject to examination by the Internal Revenue Service.
8. ASSETS HELD FOR SALE
On May 22, 2012, Atlas closed the sale of the headquarters building to 150 Northwest Point, LLC, a Delaware limited liability company. Atlas also leased back one floor of the building after the sale for a 5 year term. As of the year ended December 31, 2011, the property was recorded as a component of assets held for sale on Atlas’Atlas' statement of financial position.
The total sales price of the property, which was paid in cash, amounted to $14.0 million, less closing costs and related expenses of approximately $633,000. In connection with the sale, the Company also wrote down an accrual of approximately $792,000 held for real-estate taxes. Approximately $830,000 of the sales price was held in escrow for real estatereal-estate taxes.
Atlas recognized a gain on the sale of the property of $213,000, which will be deferred and recognized over the 5 year lease term. In the three month periodyear ended September 30,December 31, 2012, Atlas recognized $526,000 as income.an offset to rent expense. Total rental expense recognized on the headquarters building in the year ended December 31, 2012 was $357,000.
There are two properties located in Alabama which remain for sale. These properties are listed for amounts greater than carried values. Both were assets of Southern United Fire Insurance Company, which was merged into American Service in February 2010.
As of December 31, 2012, Atlas has the following cash obligations related to its lease of its headquarters building.
| Lease Commitments Related to Headquarters Building (in '000s) |
| | | | | | | | | | | | | | | | | | |
| Year | 2013 | 2014 | 2015 | 2016 | 2017 & Beyond | Total |
| Amount | $ | 653 |
| $ | 673 |
| $ | 693 |
| $ | 714 |
| $ | 281 |
| $ | 3,014 |
|
Atlas assumed a lease for Gateway's headquarters in St. Louis, Missouri as part of the acquisition which took place on January 2, 2013. Atlas has cash obligations of $336,000 per year through February 2017 which are not included in the above table.
9. INTERNAL USE SOFTWARE AND CAPITAL ASSETS
Atlas held the following internal-use software and capital assets at December 31 (excluding assets held for sale):
|
| | | | | | | |
| | 2012 | | 2011 |
| Leasehold improvements | $ | 501 |
| | $ | — |
|
| Internal use software | 4,560 |
| | 4,131 |
|
| Computer equipment | 1,505 |
| | 1,463 |
|
| Furniture and other office equipment | 306 |
| | 1,142 |
|
| Total | 6,872 |
| | 6,736 |
|
| Accumulated Depreciation | 5,735 |
| | 6,296 |
|
| Balance, end of period | $ | 1,137 |
| | $ | 440 |
|
10. UNDERWRITING POLICY AND REINSURANCE CEDED
Underwriting Risk - Underwriting risk is the risk that the total cost of claims and acquisition expenses will exceed premiums received and can arise from numerous factors, including pricing risk, reserving risk, catastrophic loss risk, reinsurance coverage risk and that loss and loss adjustment expense reserves are not sufficient.
Reinsurance Ceded - As is customary in the insurance industry, Atlas reinsures portions of certain insurance policies it writes, thereby providing a greater diversification of risk and minimizing exposure on larger risks. Atlas remains contingently at risk with respect to any reinsurance ceded and would incur an additional loss if an assuming company were unable to meet its obligation under the reinsurance treaty.
Atlas monitors the financial condition of its reinsurers to minimize its exposure to significant losses from reinsurer insolvencies. Letters of credit are maintained for any unauthorized reinsurer to cover ceded unearned premium, ceded loss reserve balances and
ceded paid losses. These policies mitigate the risk of credit quality or dispute from becoming a danger to financial strength. To date, the Company has not experienced any material difficulties in collecting reinsurance recoverables.
Gross premiums written and ceded premiums, losses and commissions as of and for the three and nine month periodsyears ended September 30,December 31, 2012 and September 30,December 31, 2011 are as follows (all amounts in ‘000s)'000s):
| | | | Three Month Periods Ended | | Nine Month Periods Ended | | | | | |
| | September 30, 2012 | September 30, 2011 | | September 30, 2012 | September 30, 2011 | 2012 | 2011 |
| Gross premiums written | $ | 23,353 |
| $ | 10,928 |
| | $ | 44,349 |
| $ | 32,950 |
| $ | 55,050 |
| $ | 42,031 |
|
| Ceded premiums written | 1,965 |
| 1,418 |
| | 4,925 |
| 4,624 |
| 6,472 |
| 6,173 |
|
| Net premiums written | 21,388 |
| 9,510 |
| | 39,424 |
| 28,326 |
| 48,578 |
| 35,858 |
|
| | | | |
| Ceded premiums earned | $ | 1,707 |
| $ | 1,733 |
| | $ | 4,920 |
| $ | 5,899 |
| 6,575 |
| 7,654 |
|
| Ceded losses and loss adjustment expenses | (749 | ) | 1,760 |
| | 662 |
| 3,862 |
| 3,628 |
| 2,767 |
|
| Ceded commissions | 526 |
| 496 |
| | 1,578 |
| 1,856 |
| |
| Ceding commissions | | 5,441 |
| 2,412 |
|
| | | | | |
| Ceded unpaid losses and loss adjustment expenses | 6,595 |
| 9,374 |
| | | 5,680 |
| 7,825 |
|
| Ceded unearned premiums | 2,219 |
| 2,419 |
| | | |
| Prepaid reinsurance premiums | | 2,111 |
| 2,214 |
|
| Other amounts due from reinsurers | 388 |
| 475 |
| | | 340 |
| 219 |
|
| | | | | |
10.11. UNPAID CLAIMS
Claims liabilities - The changes in the provision for unpaid claims, net of amounts recoverable from reinsurers, for the three and nine month periodsyears ended September 30,December 31, 2012 and September 30,December 31, 2011 were as follows (all amounts in ‘000s)'000s):
| | | | Three Month Periods Ended | Nine Month Periods Ended | | | | | |
| | September 30, 2012 | | September 30, 2011 | September 30, 2012 | | September 30, 2011 | 2012 | | 2011 |
| Unpaid claims, beginning of period | $ | 77,350 |
| | $ | 112,011 |
| $ | 91,643 |
| | $ | 132,579 |
| $ | 91,643 |
| | $ | 132,579 |
|
| Less: reinsurance recoverable | 8,153 |
| | 1,968 |
| 7,825 |
| | 6,477 |
| 7,825 |
| | 6,477 |
|
| Net beginning unpaid claims reserves | 69,197 |
| | 104,043 |
| 83,818 |
| | 126,102 |
| 83,818 |
| | 126,102 |
|
| Incurred related to: | | | | | | | | |
| Current year | 6,976 |
| | 6,962 |
| 18,141 |
| | 20,600 |
| 26,329 |
| | 27,303 |
|
| Prior years | 190 |
| | 17 |
| 337 |
| | (4 | ) | 216 |
| | 1,691 |
|
| | 7,166 |
| | 6,979 |
| 18,478 |
| | 20,596 |
| 26,545 |
| | 28,994 |
|
| Paid related to: | | | | | | | | |
| Current year | 2,302 |
| | 4,279 |
| 6,224 |
| | 8,455 |
| 8,925 |
| | 12,715 |
|
| Prior years | 7,082 |
| | 14,660 |
| 29,093 |
| | 46,160 |
| 37,051 |
| | 58,563 |
|
| | 9,384 |
| | 18,939 |
| 35,317 |
| | 54,615 |
| 45,976 |
| | 71,278 |
|
| | | | | | | | | |
| Net unpaid claims, end of period | $ | 66,979 |
| | $ | 92,083 |
| $ | 66,979 |
| | $ | 92,083 |
| 64,387 |
| | 83,818 |
|
| Add: reinsurance recoverable | 6,595 |
| | 9,374 |
| 6,595 |
| | 9,374 |
| 5,680 |
| | 7,825 |
|
| Unpaid claims, end of period | $ | 73,574 |
| | $ | 101,457 |
| $ | 73,574 |
| | $ | 101,457 |
| $ | 70,067 |
| | $ | 91,643 |
|
The process of establishing the estimated provision for unpaid claims is complex and imprecise as it relies on the judgment and opinions of a large number of individuals, on historical precedent and trends, on prevailing legal, economic, social and regulatory trends and on expectations as to future developments. The process of determining the provision necessarily involves risks that the actual results will deviate, perhaps substantially, from the best estimates made. Atlas experienced minimal unfavorable prior year development in 2012, reflected as incurred related to prior years in the table above. The unfavorable prior year development relates to various non-core lines and accident years.
11.12. STOCK OPTIONS AND WARRANTS
Stock options - Stock option activity for the nine month periodsyear ended September 30,December 31, 2012 and September 30,December 31, 2011 are as follows (all prices in Canadian dollars): | | | | September 30, 2012 | September 30, 2011 | 2012 | 2011 |
| | Number | Avg. Price | Number | Avg. Price | Number | Avg. Price | Number | Avg. Price |
| Outstanding, beginning of period | 136,109 |
| $ | 5.70 |
| 36,867 |
| $ | 3.00 |
| 136,109 |
| $ | 5.70 |
| 36,867 |
| $ | 3.00 |
|
| Granted | | — |
| 123,250 |
| 6.00 |
| — |
| — |
| 123,250 |
| 6.00 |
|
| Exercised | (922 | ) | 3.00 |
| (6,175 | ) | 3.00 |
| (922 | ) | 3.00 |
| (24,008 | ) | 3.00 |
|
| Expired | (1,237 | ) | 3.00 |
| | — |
| (1,237 | ) | 3.00 |
| — |
| — |
|
| Outstanding, end of period | 133,950 |
| $ | 5.76 |
| 153,942 |
| $ | 5.40 |
| 133,950 |
| $ | 5.76 |
| 136,109 |
| $ | 5.70 |
|
Information about options outstanding at September 30,December 31, 2012 is as follows:
|
| | | | | |
| Grant Date | Expiration Date | Number Outstanding | Number Exercisable |
| January 18, 2011 | January 18, 2021 | 123,250 |
| 61,625 |
|
| March 18, 2010 | March 18, 2020 | 10,700 |
| 10,700 |
|
| Total | | 133,950 |
| 72,325 |
|
On January 18, 2011, Atlas granted options to purchase 123,250 ordinary shares of Atlas stock to officers and directors at an exercise price of C$C$6.00 per share. The options vest 25% at date of grant and 25% on each of the next three anniversary dates and expire on January 18, 2021. The weighted average grant date fair value of the options granted on January 18, 2011 is C$C$3.72 per share.
The Black-Scholes option pricing model was used to estimate the fair value of compensation expense using the following assumptions – risk-free interest rate 2.27% to 3.13%; dividend yield 0.0%; expected volatility 100%; expected life of 6 to 9 years.
In accordance with Accounting Standard Codification 718 (Stock-Based Compensation), Atlas has recognized stock compensation expense on a straight-line basis over the requisite service period of the last separately vesting portion of the award. In both of the nine month periodsyears endedSeptember 30, December 31, 2012 andSeptember 30, 2011 respectively,, Atlas recognized $84,000 and $84113,000 in expense, which is a component of other underwriting expenses on the income statement. Total unrecognized stock compensation expense associated with the January 18, 2011 grant is $253225,000 as of the periodyear ended September 30,December 31, 2012 which will be recognized ratably through the next 2.22 years.
The weighted average exercise price of all the shares exercisable at September 30,December 31, 2012 and December 31, 2011 was C$5.55C$5.56 and the grants have a weighted average remaining life of 8.28 years years.. The stock options granted on January 18, 2011 have an intrinsic value of $040,000 as of the periodyear ended September 30,December 31, 2012.
Warrants - On November 1, 2010, American Acquisition closed a private placement where it issued 3,983,5021,327,834 subscription receipts for ordinary voting common shares of Atlas and warrants to purchase 1,327,834 ordinary voting common shares of Atlas for C$C$6.00 per share in connection with the merger. The subscription receipts were converted to Atlas ordinary voting shares in connection with the merger. All the warrants were still outstanding at September 30,December 31, 2012 and expire on December 31, 2013.
Atlas’Atlas' closing stock price on September 28,December 31, 2012 (the last trading day of the quarter) was C$5.25.6.30.
12.13. OTHER EMPLOYEE BENEFIT PLANS
Defined Benefit Plan – Prior to December 31, 1997, substantially all salaried employees of American Country were covered by a defined benefit pension plan known as the American Country Pension Plan (the “pension plan”). Benefits were based on the employee’s length of service and wages and benefits, as defined by the pension plan. The funding policy of the pension plan was generally to contribute amounts required to maintain minimum funding standards in accordance with the Employee Retirement Income Security Act. Effective December 31, 1997, upon resolution by the board of directors, the pension plan was frozen. During 2010, American Country made an application to the U.S. Internal Revenue Service to dissolve the pension plan and distribute the net plan assets to the beneficiaries. In the fourth quarter of 2011, the plan assets were fully distributed. As a result of the plan liquidation, the Company recognized a settlement charge of $2.5 million within other underwriting expenses in the fourth quarter of 2011. The settlement impact was previously reflected as an unrecognized adjustment to other comprehensive income and therefore, had created a nil impact to shareholders’shareholders' equity.
|
| | | | | | | | | |
| | | 2012 | 2011 |
| Change in Benefit Obligation | | | |
| | Benefit Obligation, beginning of year | $ | — |
| $ | 5,110 |
|
| | Interest cost | — |
| 229 |
|
| | Actuarial losses | — |
| (29 | ) |
| | Benefits paid | — |
| (229 | ) |
| | Settlement of obligation | — |
| (5,081 | ) |
| | Benefit Obligation, end of year | $ | — |
| $ | — |
|
| | | | |
| Change in Plan Assets | | |
| | Fair value of plan assets, beginning of year | $ | — |
| $ | 3,993 |
|
| | Actual return on plan assets | — |
| 17 |
|
| | Employer contributions | — |
| 1,300 |
|
| | Benefits Paid | — |
| (229 | ) |
| | Settlement of obligation | — |
| (5,081 | ) |
| | Fair value of plan assets, end of year | $ | — |
| $ | — |
|
| | | |
| Funded Status, end of year | $ | — |
| $ | — |
|
| | | |
| Items unrecognized as component of net pension cost, end of year (pre-tax) | — |
| — |
|
| Items unrecognized as component of net pension cost, end of year | — |
| — |
|
| | | |
| Components of net pension cost | | |
| | Interest cost | $ | — |
| $ | 229 |
|
| | Expected return on plan assets | — |
| (177 | ) |
| | Amortization of prior service cost | | — |
| — |
|
| | Amortization of actuarial losses | | — |
| 61 |
|
| Expense resulting from settlement of plan | — |
| 2,544 |
|
| Net periodic pension cost | $ | — |
| $ | 2,657 |
|
Defined Contribution Plan - In January 2011, Atlas formed a defined contribution 401(k) plan covering all qualified employees of Atlas and its subsidiaries. Employees can choose to contribute up to 60% of their annual earnings but not more than $17,000 for 2011 to the plan. Qualifying employees age 50 and older can contribute an additional $5,500 in 2012. Atlas matches 50% of the employee contribution up to 5% of annual earnings for a total maximum expense of 2.5% of annual earnings per participant. Atlas contributions are discretionary. Employees are 100% vested in their own contributions and vest in Atlas contributions based on years of service with 100% vested after five years. Company contributions were $82110,000 and $78105,000 for the three and nine month periodsyears ended September 30,December 31, 2012 and September 30,December 31, 2011, respectively.
Employee Stock Purchase Plan - In the second quarter of 2011, Atlas initiated the Atlas Employee Stock Purchase Plan (the “ESPP”) to encourage continued employee interest in the operation, growth and development of Atlas and to provide an additional investment opportunity to employees. Beginning in June 2011, full time and permanent part time employees working more than 30 hours per week are allowed to invest up to 5% of adjusted salary in Atlas ordinary voting common shares. Atlas matches 50% of the employee contribution up to 5% of annual earnings for a total maximum expense of 2.5% of annual earnings per participant. Employees who signed up for the ESPP by May 30, 2011 each received an additional 100 ordinary voting common shares as an initial participation incentive. Atlas will also pay administrative costs related to this plan. InDuring the nine month periodsyears ended September 30,December 31, 2012 and September 30,December 31, 2011, Atlas incurred costs related to the plan of $3751,000 and $2438,000 respectively.
14. SHARE CAPITAL
Upon completionOn December 7, 2012, a shareholder meeting was held where a one-for-three reverse stock split was unanimously approved. When the reverse stock split took effect on January 29, 2013, it decreased the authorized and outstanding ordinary shares and restricted voting shares at a ratio of one-for-three. The primary objective of the Gateway acquisition, all Gateway employees were transferredreverse stock split was to bothincrease the Atlas 401(k) plan andper share price of Atlas' ordinary shares to meet certain listing requirements of the Employee Stock Purchase Plan.
13. SHARE CAPITAL
NASDAQ Capital Market. The share capital for the common shares:shares is as follows:
| | | As of: | | September 30, 2012 | December 31, 2011 | |
| As of December 31, | | | 2012 | 2011 |
| | Shares Authorized | Shares Issued and Outstanding | Amount (in ‘000s) | Shares Issued and Outstanding | | Amount (in ‘000s) | Shares Authorized | Shares Issued and Outstanding | Amount (in '000s) | Shares Issued and Outstanding | | Amount (in '000s) |
| Ordinary | 266,666,667 |
| 1,542,764 |
| $ | 4 |
| 1,541,842 |
| 1 | $ | 4 |
| 266,666,667 |
| 2,256,924 |
| $ | 4 |
| 1,541,842 |
| | $ | 4 |
|
| Restricted | 33,333,334 |
| 4,601,621 |
| 14 |
| 4,601,621 |
| 5 |
| 14 | 33,333,334 |
| 3,887,471 |
| 14 | 4,601,621 |
| | 14 |
| Total common shares | 300,000,001 |
| 6,144,385 |
| $ | 18 |
| 6,143,463 |
| 6 |
| $ | 18 |
| 300,000,001 |
| 6,144,395 |
| $ | 18 |
| 6,143,463 |
| | $ | 18 |
|
All of the issued and outstanding restricted voting common shares are beneficially owned or controlled by Kingsway America Inc., (”Kingsway”) a wholly owned subsidiary of Kingsway Financial Services Inc. or other Kingsway subsidiaries. In the event that such shares are disposed of such that Kingsway’s beneficial interest is less than 10% of the issued and outstanding restricted voting common shares, the restricted voting common shares shall be converted into fully paid and non-assessable ordinary voting common shares.
The restricted voting common shares are entitled to vote at all meetings of shareholders, except at meetings of holders of a specific class that are entitled to vote separately as a class. The restricted voting common shares as a class shall not carry more than 30% of the aggregate votes eligible to be voted at a general meeting of common shareholders.
The restricted voting common shares will convert to ordinary voting common shares in the event that these Kingsway owned shares are sold to non-affiliates of the Company.Kingsway.
Preferred shares are not entitled to vote and are beneficially owned or controlled by Kingsway.Kingsway as of the year ended December 31, 2012. Preferred shareholders are entitled to dividends on a cumulative basis whether or not declared by the Board of Directors at the rate of U.S. $0.045 per share per year (4.5%) and may be paid in cash or in additional preferred shares at the option of Atlas. In liquidation, dissolution or winding-up of Atlas, preferred shareholders receive the greater of US$1.00 per share plus all declared and unpaid dividends or the amount it would receive in liquidation if the preferred shares had been converted to restricted voting common shares or ordinary voting common shares immediately prior to liquidation. Preferred shares are convertible into ordinary voting shares at the option of the holder at any date after the fifth year of issuance at the rate of 0.1270 ordinary voting common shares for each preferred share. The conversion rate is subject to change if the number of ordinary voting common shares or restricted voting common shares changes. The preferred shares are redeemable at the option of Atlas at a price of US$1.00 per share plus accrued and unpaid dividends commencing at the earlier of two years from December 31, 2010 (the issuance date (December 31, 2012) of the preferred sharesshares), or the date the preferred shares are transferred to a party other than Kingsway or its subsidiaries or entities in which Kingsway holds a 10% or greater interest.
The cumulative amount of dividends to which the preferred shareholders are entitled upon liquidation or sooner, if Atlas declares dividends, is $1.41.6 million as of the periodyear ended September 30,December 31, 2012., or $0.26 per common share.
14.15. DEFERRED POLICY ACQUISITION COSTS
Deferred policy acquisition costs for the nine month periodsyear ended September 30,December 31, 2012 and September 30,December 31, 2011 (in ‘000s)'000s):
| | | | | September 30, 2012 | September 30, 2011 | 2012 | | 2011 |
| Balance, beginning of period | | $ | 3,020 |
| | $ | 3,804 |
| $ | 3,020 |
| | $ | 3,804 |
|
| Acquisition costs deferred | | 6,063 |
| | 5,111 |
| 7,215 |
| | 6,510 |
|
| Amortization charged to income | | 4,582 |
| | 5,343 |
| 6,471 |
| | 7,294 |
|
| Balance, end of period | | $ | 4,501 |
| | $ | 3,572 |
| $ | 3,764 |
| | $ | 3,020 |
|
15.16. RELATED PARTY TRANSACTIONS
The business of Atlas is carried on through its insurance subsidiaries. Atlas’ insurance subsidiaries have been a party to various transactions with affiliates in the past, although activity in this regard has diminished over time. Related party transactions, including services provided to or received by Atlas’ insurance subsidiaries, are carried out in the normal course of operations and are measured at the amount of consideration paid or received as established and agreed upon by the parties. Such transactions typically include claims handling services, marketing services and commission payments. Management believes that consideration paid for such services approximates fair value.
For the nine month periodsyear ended September 30,December 31, 2012 and September 30,December 31, 2011, Atlas incurred $1.52.0 million and $1.72.3 million, respectively, in commissions to Avalon Risk Management, Inc. (“Avalon”). In the nine month periodsyear ended September 30,December 31, 2012 and September 30,December 31, 2011, Atlas also incurred expenses of $0 and $105137,000 respectively, for marketing services performed by Avalon. Avalon was a KFSI subsidiary through October 2009, and had certain investors and directors in common with Atlas. As of September 30,December 31, 2012, Atlas and Avalon no longer have any common directors nor investors. Avalon acts as a program manager for a surety program primarily consisting of U.S. Customs bonds. In this capacity they are responsible for coordinating marketing, customer service and claim handling for the surety bonds written under this agreement. This program is 100% reinsured by an unrelated third party.
As at September 30,December 31, 2012 and December 31, 2011, Atlas reported net amounts receivable from (payable to) affiliates as follows which are included within other assets and accounts payable and accrued expenses on the balance sheets (all amounts in ‘000s)'000s):
| | | As at: | September 30, 2012 | December 31, 2011 | |
| As of December 31, | | 2012 | 2011 |
| Kingsway America Inc. | $ | 58 |
| $ | 291 |
| $ | 43 |
| $ | 291 |
|
| Universal Casualty Company | (50 | ) | (500 | ) | — |
| (500 | ) |
| Kingsway Amigo Insurance Company | 2 |
| (1 | ) | 1 |
| (1 | ) |
| Total | $ | 10 |
| $ | (210 | ) | $ | 44 |
| $ | (210 | ) |
16.17. SELECTED QUARTERLY FINANCIAL DATA (UNAUDITED)
|
| | | | | | | | | | | | |
| (in ‘000s, except per share data) |
| | 2012 |
| | Q4 | Q3 | Q2 | Q1 |
| Gross premium written | $ | 10,701 |
| $ | 23,353 |
| $ | 9,242 |
| $ | 11,754 |
|
| Net premium earned | 11,914 |
| 10,934 |
| 7,552 |
| 8,310 |
|
| Underwriting income/(loss) | 305 |
| 264 |
| (868 | ) | (617 | ) |
| Net income/(loss) attributable to Atlas | 1,244 |
| 1,657 |
| 130 |
| 135 |
|
| Net income/(loss) attributable to common shareholders | 1,037 |
| 1,455 |
| (72 | ) | (64 | ) |
| Basic earnings/(loss) per common share | $ | 0.17 |
| $ | 0.24 |
| $ | (0.01 | ) | $ | — |
|
| Diluted earnings/(loss) per common share | $ | 0.15 |
| $ | 0.24 |
| $ | (0.01 | ) | $ | — |
|
|
| | | | | | | | | | | | |
| (in ‘000s, except per share data) | | | | |
| | 2011 |
| | Q4 | Q3 | Q2 | Q1 |
| Gross premium written | $ | 9,081 |
| $ | 10,928 |
| $ | 7,856 |
| $ | 14,166 |
|
| Net premium earned | 9,079 |
| 8,797 |
| 9,062 |
| 8,809 |
|
| Underwriting income/(loss) | (6,325 | ) | (1,729 | ) | (1,278 | ) | (1,906 | ) |
| Net income/(loss) attributable to Atlas | (3,024 | ) | 1,066 |
| 193 |
| (705 | ) |
| Net income/(loss) attributable to common shareholders | (3,228 | ) | 862 |
| (9 | ) | (905 | ) |
| Basic earnings/(loss) per common share | $ | (0.53 | ) | $ | 0.14 |
| $ | — |
| $ | (0.15 | ) |
| Diluted earnings/(loss) per common share | $ | (0.53 | ) | $ | 0.14 |
| $ | — |
| $ | (0.15 | ) |
18. SUBSEQUENT EVENTS
Kingsway Sale of Atlas Shares
On September 28th, 2012, Kingsway entered into a stock purchase agreement to sell 540,541 shares of Atlas to a third party, which received regulatory approval in the fourth quarter. On October 4th, 2012, Kingsway entered into a separate agreement to sell 173,611 shares to a third party. This transaction settled in the fourth quarter. None of these shares are included in the shares registered hereunder on behalf of the selling shareholders.
Acquisition of Gateway Insurance Company
On January 2, 2013 we acquired Camelot Services, Inc., or Camelot Services, a privately owned insurance holding company, and its sole subsidiary, Gateway Insurance Company, or Gateway, from Hendricks Holding Company, Inc., or Hendricks, an unaffiliated third party. Gateway provides specialized commercial insurance products, including commercial automobile insurance to niche markets such as taxi, black car and sedan service owners and operators.
Gateway isRefer to Note 3 for a St. Louis, Missouri-based insurance company that currently underwrites approximately $10.0 millioncomplete description of annual taxi and limousine net written premium. Gateway is an admitted carrier in 46 states plus the District of Columbia. Our acquisition of Gateway expanded our core commercial automobile lines to 39 states and the District of Columbia, including California, Hawaii, Montana, Nebraska, North Dakota, South Dakota, Washington and West Virginia.
Under the terms of the stock purchase agreement, the purchase price equaled the tangible GAAP book value of Camelot Services at December 31, 2012, subject to certain pre and post-closing adjustments, including, among others, development between the signing of the stock purchase agreement and December 31, 2012. Additional consideration may be paid to or received from the seller depending upon, among other things, the development of Gateway’s actual loss reserves for certain lines of business and the utilization of certain deferred tax assets over time. Gateway also writes workers’ compensation insurance, which will be terminated as part of the transaction. An indemnity reinsurance agreement was entered into pursuant to which 100% of Gateway’s workers’ compensation business was ceded to a third party captive reinsurer funded by the seller as part of the transaction.
The total purchase price for all of Camelot’s outstanding shares was $14.9 million, consisting of a combination of cash and Atlas preferred shares. Consideration consisted of a $6.0 million dividend paid by Gateway immediately prior to the closing, $2.0 million of Atlas preferred shares (a total of 2 million shares issued to Hendricks) and $6.9 million in cash. Under the terms of the stock purchase agreement, the closing price was reduced due to reserve strengthening of approximately $8.0 million that Camelot Services recognized prior to closing. Approximately $4.3 million of this reserve strengthening was related to commercial automobile reserves, a portion of which was related to the long-haul truck program that is in run off. The amount of pre-closing reserve strengthening was consistent with the conclusions of an independent actuarial analysis of the reserves of Gateway. In addition to this pre-closing reserve strengthening, Atlas has contractual protections to offset up to $2.0 million of future adverse reserve development. Atlas also agreed to provide the sellers up to $2.0 million in contractual protection in the event of favorable reserve development.Services.
Reverse Stock SplitSplit/Change in Capital Structure
On December 7, 2012, we held a shareholder meeting was held where a one-for-three reverse stock split was unanimously approved. When the reverse stock split takestook effect on January 29, 2013, it will decrease ourdecreased the authorized and outstanding ordinary shares and restricted voting shares at a ratio of one-for-three. The primary objective of the reverse stock split iswas to increase the per share price of ourAtlas' ordinary shares to meet certain listing requirements of the NASDAQ Capital Market. Unless otherwise noted, all historical share and per share values in this prospectusthese financial statements reflect the one-for-three reverse stock split.
Stock Option Grant
On January 11, 2013, Atlas granted options to purchase 91,667 ordinary shares under the Company’s stock option plan, all of which were granted to the Company’s officers. The granted options have an exercise price of C$C$6.45 and vest equally on the first, second and third anniversary of the grant date. The options expire on January 11, 2023.2023.
Initial Public Offering in the United States
On February 11, 2013, an aggregate of 4,125,000 Atlas ordinary shares were offered in Atlas' initial public offering in the United States. 1,500,000 ordinary shares were offered by Atlas and 2,625,000 ordinary shares were sold by KAI at a price of $5.85 per share, less underwriting discounts and expenses. Atlas also granted the underwriters an option to purchase up to an aggregate of 618,750 additional shares at the public offering price of $5.85 per share to cover over-allotments, if any. On March 11, 2013, the underwriters exercised this option and purchased an additional 451,500 shares. After underwriting and other expenses, Atlas realized combined proceeds of $10.3 million.
The principal purposes of the initial offering in the United States are to create a public market for Atlas' ordinary shares and thereby enable future access to the public equity markets by Atlas and its shareholders, and to obtain additional capital. The intended usage of the net proceeds from the offering are for working capital, to acquire complementary businesses or other assets, to repurchase preferred shares, which accrue dividends on a cumulative basis at a rate of $0.045 per share per year (4.5%), or for other general corporate purposes; however there are no specific planned uses of the net proceeds.
Camelot Services, Inc.ATLAS FINANCIAL HOLDINGS, INC.
and SubsidiaryCONDENSED CONSOLIDATED STATEMENTS OF FINANCIAL POSITION
|
| | | | | | |
| (in '000s of US dollars, except for share and per share data) | June 30, 2013 (unaudited) | December 31,
2012 |
| Assets | | |
| Investments, available for sale | | |
| Fixed income securities, at fair value (Amortized cost $119,537 and $95,423) | $ | 118,158 |
| $ | 98,079 |
|
| Equity securities, at fair value (cost $569 and $1,563) | 375 |
| 1,571 |
|
| Other investments | 1,249 |
| 1,262 |
|
| Total Investments | 119,782 |
| 100,912 |
|
| Cash and cash equivalents | 25,258 |
| 19,912 |
|
| Accrued investment income | 666 |
| 517 |
|
| Accounts receivable and other assets (Net of allowance of $740 and $484) | 29,459 |
| 21,923 |
|
| Reinsurance recoverables, net | 23,826 |
| 6,020 |
|
| Prepaid reinsurance premiums | 2,970 |
| 2,111 |
|
| Deferred policy acquisition costs | 4,661 |
| 3,764 |
|
| Deferred tax asset, net | 8,045 |
| 6,605 |
|
| Intangible assets | 740 |
| — |
|
| Software and office equipment, net | 1,980 |
| 1,137 |
|
| Assets held for sale | 166 |
| 166 |
|
| Total Assets | $ | 217,553 |
| $ | 163,067 |
|
| | | |
| Liabilities | | |
| Claims liabilities | $ | 105,221 |
| $ | 70,067 |
|
| Unearned premiums | 33,253 |
| 25,457 |
|
| Due to reinsurers and other insurers | 2,554 |
| 3,803 |
|
| Other liabilities and accrued expenses | 6,943 |
| 3,876 |
|
| Total Liabilities | 147,971 |
| 103,203 |
|
| | | |
| Shareholders’ Equity | | |
| Preferred shares, par value per share $0.001, 100,000,000 shares authorized, 20,000,000 shares issued and outstanding at June 30, 2013, 18,000,000 shares issued and outstanding at December 31, 2012. Liquidation value $1.00 per share | 20,000 |
| 18,000 |
|
| Ordinary shares, par value per share $0.003, 266,666,667 shares authorized, 6,904,420 shares issued and outstanding at June 30, 2013, 2,256,924 shares issued and outstanding at December 31, 2012 | 20 |
| 4 |
|
| Restricted voting common shares, par value per share $0.003, 33,333,334 shares authorized, 1,262,471 shares issued and outstanding at June 30, 2013 and 3,887,471 shares issued and outstanding at December 31, 2012 | 4 |
| 14 |
|
| Additional paid-in capital | 160,973 |
| 152,768 |
|
| Retained deficit | (110,372 | ) | (112,675 | ) |
| Accumulated other comprehensive (loss)/income, net of tax | (1,043 | ) | 1,753 |
|
| Total Shareholders’ Equity | 69,582 |
| 59,864 |
|
| Total Liabilities and Shareholders’ Equity | $ | 217,553 |
| $ | 163,067 |
|
See accompanying Notes to Condensed Consolidated Financial StatementsStatements.
With
Independent Auditors’ Report
ATLAS FINANCIAL HOLDINGS, INC.
CONDENSED CONSOLIDATED STATEMENTS OF INCOME AND COMPREHENSIVE INCOME (Unaudited)
(in '000s of US dollars, except for share and per share data)
|
| | | | | | | | | | | | |
| Consolidated Statements of Income | | | | |
| | Three Month Periods Ended | Six Month Periods Ended |
| | June 30, 2013 (unaudited) | June 30, 2012 (unaudited) | June 30, 2013 (unaudited) | June 30, 2012 (unaudited) |
| Net premiums earned | $ | 16,968 |
| $ | 7,552 |
| $ | 32,856 |
| $ | 15,861 |
|
| Net investment income | 547 |
| 657 |
| 1,159 |
| 1,265 |
|
| Net investment gains | 395 |
| 291 |
| 488 |
| 319 |
|
| Other income | 3 |
| 50 |
| 8 |
| 167 |
|
| Total revenue | 17,913 |
| 8,550 |
| 34,511 |
| 17,612 |
|
| Net claims incurred | 10,957 |
| 5,408 |
| 21,218 |
| 11,312 |
|
| Acquisition costs | 2,227 |
| 1,395 |
| 4,497 |
| 2,768 |
|
| Other underwriting expenses | 2,956 |
| 1,617 |
| 6,015 |
| 3,267 |
|
| Expenses incurred related to Gateway acquisition | — |
| — |
| 406 |
| — |
|
| Total expenses | 16,140 |
| 8,420 |
| 32,136 |
| 17,347 |
|
| Income from operations before income tax expense | 1,773 |
| 130 |
| 2,375 |
| 265 |
|
| Income tax expense | 72 |
| — |
| 72 |
| — |
|
| Net income attributable to Atlas | 1,701 |
| 130 |
| 2,303 |
| 265 |
|
| Less: Preferred share dividends | 225 |
| 202 |
| 501 |
| 402 |
|
| Net income/(loss) attributable to common shareholders | $ | 1,476 |
| $ | (72 | ) | $ | 1,802 |
| $ | (137 | ) |
| | | | | |
| Basic weighted average common shares outstanding | 8,131,450 |
| 6,144,385 |
| 7,591,092 |
| 6,145,099 |
|
| Earnings/(loss) per common share, basic | 0.18 |
| (0.01 | ) | 0.24 |
| $ | (0.02 | ) |
| Diluted weighted average common shares outstanding | 10,968,405 |
| 6,144,385 |
| 10,346,756 |
| 6,145,099 |
|
| Earnings/(loss) per common share, diluted | 0.16 |
| (0.01 | ) | 0.22 |
| $ | (0.02 | ) |
| | | | | |
| Consolidated Statements of Comprehensive Income | | | |
| | | | | |
| Net income attributable to Atlas | $ | 1,701 |
| $ | 130 |
| $ | 2,303 |
| $ | 265 |
|
| | | | | |
| Other comprehensive (loss)/income: | | | | |
| Changes in net unrealized (losses)/gains | (3,890 | ) | 798 |
| (4,026 | ) | 1,024 |
|
| Reclassification to income of net realized gains | (25 | ) | (174 | ) | (210 | ) | (344 | ) |
| Effect of income tax | 1,331 |
| (210 | ) | 1,440 |
| (229 | ) |
| Other comprehensive (loss)/income for the period | (2,584 | ) | 414 |
| (2,796 | ) | 451 |
|
| Total comprehensive (loss)/income | $ | (883 | ) | $ | 544 |
| $ | (493 | ) | $ | 716 |
|
| | | | | |
December 31, 2011See accompanying Notes to Condensed Consolidated Financial Statements.
ATLAS FINANCIAL HOLDINGS, INC.
CONSOLIDATED STATEMENTS OF SHAREHOLDERS’ EQUITY
(in '000s of US dollars, except for share and per share data)
|
| | | | | | | | | | | | | | | | | | | | | | | | | | | |
| | Preferred Shares | | Ordinary shares | | Restricted Voting Common Shares | | Additional Paid-in Capital | | Retained Deficit | | Accumulated Other Comprehensive Income | | Total |
| Balance December 31, 2011 | $ | 18,000 |
| | $ | 4 |
| | $ | 14 |
| | $ | 152,652 |
| | $ | (115,841 | ) | | $ | 1,425 |
| | $ | 56,254 |
|
| Net income | | | | | | | | | 265 |
| | | | 265 |
|
| Other comprehensive income | | | | | | | | | | | 451 |
| | 451 |
|
| Share-based compensation | | | | | | | 57 |
| | | | | | 57 |
|
| Stock options exercised | | | | | | | 4 |
| | | | | | 4 |
|
| Balance June 30, 2012 (unaudited) | $ | 18,000 |
| | $ | 4 |
| | $ | 14 |
| | $ | 152,713 |
| | $ | (115,576 | ) | | $ | 1,876 |
| | $ | 57,031 |
|
| | | | | | | | | | | | | | |
| Balance December 31, 2012 | $ | 18,000 |
| | $ | 4 |
| | $ | 14 |
| | $ | 152,768 |
| | $ | (112,675 | ) | | $ | 1,753 |
| | $ | 59,864 |
|
Net income
| | | | | | | | | 2,303 |
| | | | 2,303 |
|
| U.S. Initial Public Offering | | | 16 |
| | (10 | ) | | 9,750 |
| | | | | | 9,756 |
|
| Issuance of Preferred Shares | 2,000 |
| | | | | |
| |
| | | | 2,000 |
|
| Warrants exercised | | | | | | | 409 |
| | | | | | 409 |
|
| Other comprehensive loss | | | | | | | | | | | (2,796 | ) | | (2,796 | ) |
| Share-based compensation | | | | | | | 122 |
| | | | | | 122 |
|
| Preferred dividends declared and paid | | | | | | | (2,076 | ) | |
| | | | (2,076 | ) |
| Balance June 30, 2013 (unaudited) | $ | 20,000 |
| | $ | 20 |
| | $ | 4 |
| | $ | 160,973 |
| | $ | (110,372 | ) | | $ | (1,043 | ) | | $ | 69,582 |
|
| | | | | | | | | | | | | | |
| See accompanying Notes to Condensed Consolidated Financial Statements. |
ATLAS FINANCIAL HOLDINGS, INC.
CONDENSED CONSOLIDATED STATEMENTS OF CASH FLOWS
(in '000s of US dollars, except for share and per share data)
|
| | | | | | | |
| | | | |
| | Six Month Periods Ended |
| | June 30, 2013 (unaudited) | | June 30, 2012 (unaudited) |
| Operating activities | | | |
| Net income attributable to Atlas | $ | 2,303 |
| | $ | 265 |
|
| Adjustments to reconcile net income to net cash used by operating activities: | | | |
| Adjustments for non-cash items | 521 |
| | 315 |
|
| Changes in other operating assets and liabilities | (14,208 | ) | | (4,162 | ) |
| Changes in net claims liabilities | (1,055 | ) | | (14,293 | ) |
| Net cash flows used in operating activities | (12,439 | ) | | (17,875 | ) |
| | | | |
| Investing activities | | | |
| Purchase of Gateway (net of cash acquired) | 11,083 |
| | — |
|
| Proceeds from sale and maturity of investments | 46,304 |
| | 31,031 |
|
| Purchases of investments | (47,426 | ) | | (31,814 | ) |
| Purchases of property and equipment and other | (265 | ) | | (345 | ) |
| Proceeds from sale of property and equipment | — |
| | 13,342 |
|
| Net cash flows provided/(used) by investing activities | 9,696 |
| | 12,214 |
|
| | | | |
| Financing activities | | | |
| Proceeds from initial public offering | 9,756 |
| | — |
|
| Warrants exercised | 409 |
| | — |
|
| Dividends paid | (2,076 | ) | | — |
|
| Options exercised | — |
| | 4 |
|
| Net cash flows provided by financing activities | 8,089 |
| | 4 |
|
| | | | |
Net (decrease)/increase in cash and cash equivalents
| 5,346 |
| | (5,657 | ) |
| Cash and cash equivalents, beginning of period | 19,912 |
| | 23,249 |
|
| Cash and cash equivalents, end of period | $ | 25,258 |
| | $ | 8,712 |
|
| | | | |
| See accompanying Notes to Condensed Consolidated Financial Statements. |
| |
1. | NATURE OF OPERATIONS AND BASIS OF PRESENTATION |
Atlas Financial Holdings, Inc. ("Atlas" or the "Company") commenced operations on December 31, 2010. The primary business of Atlas is underwriting commercial automobile insurance in the United States, with a niche market orientation and focus on insurance for the “light” commercial automobile sector. This sector includes taxi cabs, non-emergency para-transit, limousine, livery and business autos. Automobile insurance products provide insurance coverage in three major areas: liability, accident benefits and physical damage. Liability insurance provides coverage subject to policy terms and conditions where the insured is determined to be responsible and/or liable for an automobile accident, for the payment for injuries and property damage to third parties. Accident benefit policies or personal injury protection policies provide coverage for loss of income, medical and rehabilitation expenses for insured persons who are injured in an automobile accident, regardless of fault. Physical damage coverage subject to policy terms and conditions provides for the payment of damages to an insured automobile arising from a collision with another object or from other risks such as fire or theft. In the short run, automobile physical damage and liability coverage generally provides more predictable results than automobile accident benefit or personal injury insurance.
Atlas' business is carried out through its insurance subsidiaries: American Country Insurance Company (“American Country”), American Service Insurance Company, Inc. (“American Service”) and, as of January 1, 2013, Gateway Insurance Company ("Gateway"). The insurance subsidiaries distribute their insurance products through a network of retail independent agents. Together, the insurance subsidiaries are licensed to write property and casualty insurance in 49 states and the District of Columbia in the United States. Atlas' core products are actively distributed in 40 of those states plus Washington, D.C. The insurance subsidiaries share common management and operating infrastructure.
Atlas' Ordinary shares were previously listed on the TSX Venture Exchange (“TSXV”) under the symbol “AFH” from January 6, 2011 to June 4, 2013, when Atlas' application for the voluntary delisting of its ordinary shares from the TSXV was approved.
Atlas ordinary shares became listed on the NASDAQ stock exchange on February 11, 2013, under the same symbol.
On December 7, 2012, a shareholder meeting was held where a one-for-three reverse stock split was unanimously approved. When the reverse stock split took effect on January 29, 2013, it decreased the authorized and outstanding ordinary shares and restricted voting shares at a ratio of one-for-three. The primary objective of the reverse stock split was to increase the per share price of Atlas' common shares to meet certain listing requirements of the NASDAQ Capital Market. Unless otherwise noted, all historical share and per share values in this Form 10-Q reflect the one-for-three reverse stock split.
Basis of presentation - These statements have been prepared in conformity with accounting principles generally accepted in the United States of America ("U.S. GAAP"). All significant intercompany accounts and transactions have been eliminated. It is the opinion of management that these financial statements reflect all adjustments necessary for a fair statement of the interim results.
The accompanying unaudited condensed consolidated financial statements, in accordance with Securities and Exchange Commission (“SEC”) rules for interim periods, do not include all of the information and notes required by accounting principles generally accepted in the United States of America for complete financial statements and should be read in conjunction with the Atlas' Annual Report on Form 10-K for the year ended December 31, 2012, which provides a more complete understanding of the Company’s accounting policies, financial position, operating results, business properties, and other matters.
Seasonality - The property and casualty (P&C) insurance business is seasonal in nature. While Atlas' net premiums earned are generally stable from quarter to quarter, Atlas' gross premiums written follow the common renewal dates for the "light" commercial risks that represent its core lines of business. For example, January 1 and March 1 are common taxi cab renewal dates in Illinois and New York, respectively. Net underwriting income is driven mainly by the timing and nature of claims, which can vary widely. Atlas' ability to generate written premium is also impacted by the timing of policy periods in the states in which Atlas operates.
The accounting policies followed in these unaudited condensed consolidated financial statements are comparable to those applied in Atlas' audited annual consolidated financial statements on Form 10-K for the period ended December 31, 2012. Atlas has consistently applied the same accounting policies throughout all periods presented, as if these policies had always been in effect.
2. NEW ACCOUNTING STANDARDS
Presentation of Comprehensive Income - In February 2013, the FASB issued ASU 2013-02 which requires additional disclosures regarding the reporting of reclassifications out of accumulated other comprehensive income. ASU 2013-02 requires an entity to present, either on the face of the statement where net income is presented or in the notes, significant amounts reclassified out of accumulated other comprehensive income by the respective line items of net income but only if the amount reclassified is required under U.S. GAAP to be reclassified to net income in its entirety in the same reporting period. This guidance is effective for reporting periods beginning after December 15, 2012. Atlas adopted this guidance effective January 1, 2013. Atlas' adoption of this standard did not have a significant impact on its unaudited condensed consolidated financial statements.
3. ACQUISITION OF GATEWAY INSURANCE COMPANY
On January 2, 2013 Atlas acquired Camelot Services, Inc., ("Camelot Services"), a privately owned insurance holding company, and its sole subsidiary, Gateway Insurance Company, ("Gateway"), from Hendricks Holding Company, Inc., ("Hendricks"), an unaffiliated third party. Gateway provides specialized commercial insurance products, including commercial automobile insurance to niche markets such as taxi, black car and sedan service owners and operators.
Under the terms of the stock purchase agreement, the purchase price equaled the tangible GAAP book value of Camelot Services at December 31, 2012, subject to certain pre and post-closing adjustments, including, among others, claim development between the signing of the stock purchase agreement and December 31, 2012. Additional consideration may be paid to the seller, or returned to Atlas by the seller, depending upon, among other things, the future development of Gateway's actual loss reserves for certain lines of business and the utilization of certain deferred tax assets over time. Gateway also wrote a workers' compensation insurance program which is being run-off. However, an indemnity reinsurance agreement was entered into pursuant to which 100% of Gateway's workers' compensation business was ceded to a third party captive reinsurer funded and collateralized by the seller as part of the transaction.
The total purchase price for all of Camelot Services’ outstanding shares was $14.3 million, consisting of a combination of cash and Atlas preferred shares. Consideration consisted of a $6.0 million dividend paid by Gateway immediately prior to the closing, $2.0 million of Atlas preferred shares (consisting of a total of 2 million preferred shares) and $6.3 million in cash. The agreement includes contractual protections to offset up to $2.0 million of future reserve development. Atlas has also agreed to provide the sellers up to $2.0 million in additional consideration in the event of favorable reserve development.
The Gateway acquisition was accounted for using the purchase method. Atlas began consolidating Gateway on January 1, 2013, therefore their financial results are included in Atlas' consolidated financial results for the three and six month periods endedJune 30, 2013. However, the following unaudited pro forma summary presents Atlas' consolidated financial information for the three and six month periods endedJune 30, 2012 as if Gateway had been acquired on January 1, 2012. These amounts have been calculated after applying the Company's accounting policies had the acquisition been completed on January 1, 2012. These results were prepared for comparative purposes only and do not purport to be indicative of the results of operations which may have actually resulted had the acquisitions occurred on the indicated dates, nor are they indicative of potential future operating results of the Company.
|
| | | | | | |
| (in '000s, except per share information) | Three Months Ended | Six Months Ended |
| | June 30, 2012 | June 30, 2012 |
| Revenue | $ | 11,287 |
| $ | 23,189 |
|
| Net income/(loss) | $ | 77 |
| $ | (12 | ) |
Basic earnings per share (1) | $ | (0.02 | ) | $ | (0.05 | ) |
Diluted earnings per share (1) | $ | (0.02 | ) | $ | (0.05 | ) |
(1) - shown net of accounting treatment for preferred shares
The value of certain assets and liabilities acquired are preliminary and are subject to adjustment as additional information is obtained, including, but not limited to, valuation of separately identifiable intangibles, the preferred stock issued to the seller, and deferred taxes. The valuations must be finalized within 12 months of the close of the acquisition. Any changes upon finalization to the preliminary valuation of assets and liabilities may result in adjustment to identifiable intangible assets and goodwill. Changes to the purchase price allocation, if any, will be adjusted retrospectively in future consolidated financial results. The following table presents assets acquired and liabilities assumed for the Gateway acquisition based on its estimated fair value on January 2, 2013.
|
| | | |
| (in '000s) | |
| Purchase Consideration | |
| Cash | $ | 12,282 |
|
| Preferred stock | 2,000 |
|
| Total | $ | 14,282 |
|
| | |
| Allocation of Purchase Price | |
| | |
| Cash and investments | $ | 45,421 |
|
| Accounts receivable and other assets | 8,694 |
|
| Reinsurance recoverables | 6,352 |
|
| Intangible assets | 740 |
|
| Property and equipment | 923 |
|
| Value of business acquired | 1,233 |
|
| Total Assets | $ | 63,363 |
|
| | |
| Claims liabilities | $ | 36,209 |
|
| Unearned premiums | 9,601 |
|
| Due to reinsurers and other insurers | 286 |
|
| Accounts payable and other liabilities | 2,985 |
|
| Total Liabilities | $ | 49,081 |
|
| | |
| Net assets acquired | $ | 14,282 |
|
The acquisition of Gateway resulted in the recognition of intangible assets, comprised entirely of state insurance licenses valued at $740,000. The state insurance licenses are considered to have an infinite life and will not be amortized, but will be evaluated for impairment at least annually. Thus, Atlas recognized no amortization expense during the six month period ended June 30, 2013 related to intangible assets acquired in the Gateway transaction.
Atlas incurred $406,000 in legal and professional fee expenses related to the transaction during the six month period ended June 30, 2013, all in the first quarter. Atlas also incurred $337,000 in one-time employee termination costs during the six month period ended June 30, 2013, plans for which were formulated in the same period. This expense is included in "Other Underwriting Expenses" on the Statement of Income and Comprehensive Income. The objective of the restructuring is to eliminate managerial and staff positions deemed duplicative subsequent to the acquisition. Activity related to this plan in the six month period ended June 30, 2013 follows (in '000s):
|
| | | | |
| | Employee Termination Costs |
| Balance - beginning of period | $ | — |
|
| Recognized in earnings | 337 |
|
| Spending | (211 | ) |
| Balance - end of period | $ | 126 |
|
4. EARNINGS PER SHARE
Earnings per ordinary and restricted voting common share (collectively, the "common shares") for the three and six month periods endedJune 30, 2013 and June 30, 2012 are as follows:
|
| | | | | | | | | | | | | |
| | | Three Month Periods Ended | Six Month Periods Ended |
| | June 30, 2013 | June 30, 2012 | June 30, 2013 | June 30, 2012 |
| Basic: | | | | |
| Net income attributable to Atlas | $ | 1,701 |
| $ | 130 |
| $ | 2,303 |
| $ | 265 |
|
| Less: Preferred share dividends | 225 |
| 202 |
| 501 |
| 402 |
|
| Net income (loss) attributable to common shareholders | 1,476 |
| (72 | ) | 1,802 |
| (137 | ) |
| | Weighted average basic common shares outstanding | 8,131,450 |
| 6,144,385 |
| 7,591,092 |
| 6,145,099 |
|
| Basic earnings (loss) per common share | $ | 0.18 |
| $ | (0.01 | ) | $ | 0.24 |
| $ | (0.02 | ) |
| Diluted: | | | | |
| | Weighted average basic common shares outstanding | 8,131,450 |
| 6,144,385 |
| 7,591,092 |
| 6,145,099 |
|
| Add: | | | | |
| | Dilutive stock options outstanding | 44,161 |
| — |
| 31,719 |
| — |
|
| | Dilutive warrants | 252,794 |
| — |
| 183,945 |
| — |
|
| | Preferred shares | 2,540,000 |
| — |
| 2,540,000 |
| — |
|
| Dilutive average common shares outstanding | 10,968,405 |
| 6,144,385 |
| 10,346,756 |
| 6,145,099 |
|
| Dilutive earnings per common share | $ | 0.16 |
| $ | (0.01 | ) | $ | 0.22 |
| $ | (0.02 | ) |
Diluted earnings per share is computed by dividing net income attributable to Atlas by the weighted average number of common shares outstanding each period plus the incremental number of shares added as a result of converting dilutive potential ordinary shares, calculated using the treasury stock method (or, in the case of the convertible preferred shares, the "if-converted" method).
Atlas’ dilutive potential ordinary shares consist of outstanding stock options to purchase ordinary shares, warrants to purchase 1,256,837 ordinary shares of Atlas for C$6.00 per share, and 20,000,000 preferred shares potentially convertible to ordinary shares at the option of the holders at any date after December 31, 2015 at the rate of 0.1270 ordinary shares for each preferred share. The effects of these convertible instruments are excluded from the computation of diluted earnings per share in periods in which the effect would be anti-dilutive. Convertible preferred shares are anti-dilutive when the amount of dividend declared or accumulated in the current period per common share obtainable upon conversion exceeds basic earnings per share. In the three and six month periods endedJune 30, 2013, the convertible preferred shares were deemed to be dilutive. Further, for the three month period ended June 30, 2013, Atlas' warrants and all of its stock options outstanding were considered to be dilutive.
On July 7, 2013, Atlas entered into a non-binding letter of intent to purchase all outstanding preferred shares that are eligible for redemption (18 million shares), for 90% of liquidation value. Definitive agreements in connection with this transaction were executed on August 1, 2013 (collectively, "The Share Repurchase Agreement"). An initial amount of $8.3 million (which includes $800,000 received from the exercise of warrants) of the $16.2 million purchase price was paid upon execution of the Share Repurchase Agreement, with the remaining amount to be paid no later than April 30, 2014, in accordance with the terms of the Share Repurchase Agreement.
5. INVESTMENTS
The amortized cost, gross unrealized gains and losses and fair value for Atlas’ investments in fixed maturities and equity investments are as follows. Atlas' other investment is in a limited partnership that primarily invests in income-producing real estate. Atlas' interests are not deemed minor and it is accounted for under the equity method of accounting. As of the period ended June 30, 2013, the carrying value was approximately $1.2 million versus approximately $1.3 millionas of the year ended December 31, 2012. The estimated fair value approximates carrying value due to the investments of the partnership not being publicly traded. Atlas receives dividends on a routine basis which approximate the income earned on the investment. This other investment is not included in the tables below (all amounts in '000s):
|
| | | | | | | | | | | | | |
| June 30, 2013 | Amortized Cost | Gross Unrealized Gains | Gross Unrealized Losses | Fair Value |
| Fixed income: | | | | |
| U.S. | - Government | $ | 47,109 |
| $ | 207 |
| $ | 878 |
| $ | 46,438 |
|
| | - Corporate | 40,070 |
| 2 |
| 326 |
| 39,746 |
|
| | - Commercial mortgage backed | 22,138 |
| 31 |
| 380 |
| 21,789 |
|
| | - Other asset backed | 10,220 |
| 4 |
| 39 |
| 10,185 |
|
| Total fixed income | 119,537 |
| 244 |
| 1,623 |
| 118,158 |
|
| Equities | 569 |
| — |
| 194 |
| 375 |
|
| Totals | $ | 120,106 |
| $ | 244 |
| $ | 1,817 |
| $ | 118,533 |
|
|
| | | | | | | | | | | | | |
| December 31, 2012 | Amortized Cost | Gross Unrealized Gains | Gross Unrealized Losses | Fair Value |
| Fixed income: | | | | |
| U.S. | - Government | $ | 34,993 |
| $ | 879 |
| $ | 9 |
| $ | 35,863 |
|
| | - Corporate | 35,922 |
| 1,253 |
| 16 |
| 37,159 |
|
| | - Commercial mortgage backed | 20,387 |
| 433 |
| 7 |
| 20,813 |
|
| | - Other asset backed | 4,121 |
| 123 |
| — |
| 4,244 |
|
| Total fixed income | 95,423 |
| 2,688 |
| 32 |
| 98,079 |
|
| Equities | 1,563 |
| 8 |
| — |
| 1,571 |
|
| Totals | $ | 96,986 |
| $ | 2,696 |
| $ | 32 |
| $ | 99,650 |
|
The following tables summarize carrying amounts of fixed income securities by contractual maturity. As certain securities and debentures have the right to call or prepay obligations, the actual settlement dates may differ from contractual maturity.
|
| | | | | | | | | | | | | | | |
| As of the period ended June 30, 2013 | One year or less | One to five years | Five to ten years | More than ten years | Total |
| Fixed income securities | $ | 4,190 |
| $ | 37,513 |
| $ | 28,269 |
| $ | 48,186 |
| $ | 118,158 |
|
| Percentage of total | 3.5 | % | 31.7 | % | 23.9 | % | 40.8 | % | 100.0 | % |
|
| | | | | | | | | | | | | | | |
| As of the year ended December 31, 2012 | One year or less | One to five years | Five to ten years | More than ten years | Total |
| Fixed income securities | $ | 9,513 |
| $ | 23,124 |
| $ | 20,524 |
| $ | 44,918 |
| $ | 98,079 |
|
| Percentage of total | 9.7 | % | 23.6 | % | 20.9 | % | 45.7 | % | 100.0 | % |
Management performs a quarterly analysis of Atlas’ investment holdings to determine if declines in fair value are other than temporary. The analysis includes some or all of the following procedures as deemed appropriate by management:
| |
| ◦ | identifying all security holdings in unrealized loss positions that have existed for at least six months or other circumstances that management believes may impact the recoverability of the security; |
| |
| ◦ | obtaining a valuation analysis from third party investment managers regarding these holdings based on their knowledge, experience and other market-based valuation techniques; |
| |
| ◦ | reviewing the trading range of certain securities over the preceding calendar period; |
| |
| ◦ | assessing whether declines in market value are other than temporary for debt security holdings based on credit ratings from third party security rating agencies; and |
| |
| ◦ | determining the necessary provision for declines in market value that are considered other than temporary based on the analyses performed. |
The risks and uncertainties inherent in the assessment methodology utilized to determine declines in market value that are other than temporary include, but may not be limited to, the following:
| |
| ◦ | the opinion of professional investment managers could be incorrect; |
| |
| ◦ | the past trading patterns of individual securities may not reflect future valuation trends; |
| |
| ◦ | the credit ratings assigned by independent credit rating agencies may be incorrect due to unforeseen or unknown facts related to a company’s financial situation; and |
| |
| ◦ | the debt service pattern of non-investment grade securities may not reflect future debt service capabilities and may not reflect a company’s unknown underlying financial problems. |
There were no impairments other than temporary impairments recorded in the three and six month periods endedJune 30, 2013 as a result of the above analysis performed by management. As of the period ended June 30, 2013, a portion of Atlas' portfolio was in an unrealized loss position. This was primarily driven by a rise in the 5-year US Treasury interest rate during the second quarter. All securities in an unrealized loss position as of June 30, 2013 and December 31, 2012 have been in said position for less than 12 months. The total fair value of the securities currently in an unrealized loss position were $89.2 million at June 30, 2013 with a total temporary impairment relating to unrealized losses of $1.6 million. Atlas has the ability and intent to hold these securities until their fair value is recovered. Therefore, Atlas does not expect the near term change in market value of these securities to be realized.
The following table summarizes the components of net investment income for the three month periods ended June 30, 2013 and 2012 (all amounts in '000s):
|
| | | | | | | | |
| | | 2013 | 2012 |
| Total investment income | | | |
| | Interest income | 624 |
| 729 |
|
| | Dividends | 5 |
| 15 |
|
| | Income from other investments | 62 |
| — |
|
| Investment expenses | | (144 | ) | (87 | ) |
| Net investment income | | $ | 547 |
| $ | 657 |
|
The following table summarizes the components of net investment gains for the three month periods ended June 30, 2013 and 2012:
|
| | | | | | | | |
| | | 2013 | 2012 |
| Fixed income securities | | $ | 1 |
| $ | 291 |
|
| Equities | 394 |
| — |
|
| Net investment gains | | $ | 395 |
| $ | 291 |
|
Collateral pledged:
At June 30, 2013, bonds and term deposits with a fair value of $14.7 million were on deposit with state and provincial regulatory authorities, versus $9.8 million at December 31, 2012. This increase is the result of the acquisition of Gateway. Also, from time to time, the Company pledges securities to third parties to collateralize liabilities incurred under its policies of insurance. At June 30, 2013 and December 31, 2012, the amount of such pledged securities was $8.3 million. Collateral pledging transactions are conducted under terms that are common and customary to standard collateral pledging and are subject to the Company’s standard risk management controls. These assets and investment income related thereto remain the property of the Company while pledged. Neither the state and/or provincial regulatory authorities nor any other third party has the right to re-pledge or sell said securities held on deposit.
6. FINANCIAL AND CREDIT RISK MANAGEMENT
At June 30, 2013, Atlas' allowance for bad debt increased to $740,000. Atlas recognized bad debt expense of $64,000 in the three month period ended June 30, 2013 compared to income of $79,000 during three month period ended June 30, 2012.
Fair value - Fair value amounts represent estimates of the consideration that would currently be agreed upon between knowledgeable, willing parties who are under no compulsion to act.
Atlas records the available for sale securities held in its securities portfolio at their fair value. Atlas primarily uses the services of external securities pricing vendors to obtain these values. The securities are valued using quoted market prices or prices established using observable market inputs. In volatile market conditions, these quoted market prices or observable market inputs can change rapidly causing a significant impact on fair value and financial results recorded.
Atlas employs a fair value hierarchy to categorize the inputs it uses in valuation techniques to measure the fair value. The hierarchy is comprised of quoted market prices (Level 1), third party models using observable market information (Level 2) and internal models without observable market information (Level 3). The following table summarizes Atlas' investments at fair value as of the three month period ended June 30, 2013 and as of the year ended December 31, 2012 (all amounts in '000s):
|
| | | | | | | | | | | | |
| June 30, 2013 | Level 1 | Level 2 | Level 3 | Total |
| Fixed income securities | $ | 12,938 |
| $ | 104,794 |
| $ | 426 |
| $ | 118,158 |
|
| Equities | 375 |
| — |
| — |
| 375 |
|
| Other investments | — |
| — |
| 1,249 |
| $ | 1,249 |
|
| Totals | $ | 13,313 |
| $ | 104,794 |
| $ | 1,675 |
| $ | 119,782 |
|
|
| | | | | | | | | | | | |
| December 31, 2012 | Level 1 | Level 2 | Level 3 | Total |
| Fixed income securities | $ | 9,843 |
| $ | 88,002 |
| $ | 234 |
| $ | 98,079 |
|
| Equities | 1,571 |
| — |
| — |
| 1,571 |
|
| Other investments | — |
| — |
| 1,262 |
| 1,262 |
|
| Totals | $ | 11,414 |
| $ | 88,002 |
| $ | 1,496 |
| $ | 100,912 |
|
Of the total portfolio of fixed income securities, only holdings of U.S. Treasury Securities are classified within Level 1. There were no transfers in or out of Level 2 or Level 3 during either period.
The fair value of the fixed income security in Level 3 was calculated using risk-adjusted value ranges and estimates, and the asset is the same at June 30, 2013 as at December 31, 2012. In the three month period ended June 30, 2013, approximately $95,000 was recognized in investment income from this investment. The other investment in Level 3 at June 30, 2013 is also the same as at December 31, 2012. Its effect on income has been immaterial in 2013. Both securities received Level 3 classification due to the absence of fair value quotes from Atlas' third party valuation service provider.
Though Atlas believes its valuation methods are appropriate, the use of different methodologies or assumptions to determine its fair value could result in a different fair value as of June 30, 2013. Management does not believe that reasonable changes to the inputs to its valuation methodology would result in a significantly higher or lower fair value measurement.
Capital management - The Company manages capital using both regulatory capital measures and internal metrics. The Company’s capital is primarily derived from common shareholders’ equity, retained deficit and accumulated other comprehensive income (loss).
As a holding company, Atlas could derive cash from its insurance subsidiaries generally in the form of dividends to meet its obligations, which will primarily consist of operating expense payments. Atlas’ insurance subsidiaries fund their obligations primarily through premium and investment income and maturities in the securities portfolio. The insurance subsidiaries require regulatory approval for the return of capital and, in certain circumstances, prior to the payment of dividends. In the event that dividends available to the holding company are inadequate to cover its operating expenses, the holding company would need to raise capital, sell assets or incur future debt.
The insurance subsidiaries must each maintain a minimum statutory capital and surplus of $1.5 million and $2.4 million under the provisions of the Illinois Insurance Code and the Missouri Insurance Code, respectively. Dividends may only be paid from statutory unassigned surplus, and payments may not be made if such surplus is less than a stipulated amount. The dividend restriction is the greater of statutory net income or 10% of total statutory capital and surplus.
At June 30, 2013 our insurance subsidiaries had a combined statutory surplus of $52.9 million and had combined net written premiums and combined net income for the six months ended June 30, 2013 of $30.3 million and $4.2 million, respectively.
Atlas did not declare or pay any dividends to its common shareholders during the six month period ended June 30, 2013 or in the year ended December 31, 2012.
7. INCOME TAXES
As a result of Atlas' deferred tax assets, the effective tax rate was 4.1% for the three month period ended June 30, 2013, and 3.1% for the six month period ended June 30, 2013, compared to the U.S. statutory income tax rate of 34% as shown below (all amounts in '000s):
|
| | | | | | | | | | | | | | | | | | | | |
| | Three Month Periods Ended | Six Month Periods Ended |
| | June 30, 2013 | June 30, 2012 | June 30, 2013 | June 30, 2012 |
| | Amount | % | Amount | % | Amount | % | Amount | % |
| Expected income tax expense/(benefit) at statutory rate | $ | 602 |
| 34.0 | % | $ | 44 |
| 34.0 | % | $ | 807 |
| 34.0 | % | $ | 90 |
| 34.0 | % |
| Change in valuation allowance | (586 | ) | (33.1 | )% | (44 | ) | (34.0 | )% | (931 | ) | (39.1 | )% | (92 | ) | (34.8 | )% |
| Nondeductible expenses | 9 |
| 0.5 | % | 1 |
| 0.8 | % | 150 |
| 6.3 | % | 5 |
| 1.9 | % |
| Other | 47 |
| 2.7 | % | (1 | ) | (0.8 | )% | 46 |
| 1.9 | % | (3 | ) | (1.1 | )% |
| Total | $ | 72 |
| 4.1 | % | $ | — |
| — | % | $ | 72 |
| 3.1 | % | $ | — |
| — | % |
Income tax expense consists of the following for the six month periods endedJune 30, 2013 and June 30, 2012: |
| | | | | | |
| | 2013 | 2012 |
| Current tax expense/(benefit) | $ | 72 |
| $ | — |
|
| Deferred tax (benefit)/expense, net of change in valuation allowance | — |
| — |
|
| Total | $ | 72 |
| $ | — |
|
Upon the transaction forming Atlas on December 31, 2010, a yearly limitation as required by Section 382 of the Internal Revenue Code of 1986 (“IRC Section 382”) that applies to changes in ownership on the future utilization of Atlas’ net operating loss carry-forwards was calculated. The insurance subsidiaries’ prior parent retained those tax assets previously attributed to the insurance subsidiaries which could not be utilized by Atlas as a result of this limitation. As a result, Atlas’ ability to recognize future tax benefits associated with a portion of its deferred tax assets generated during prior years and the current year have been permanently limited to the amount determined under IRC Section 382. The result is a maximum expected net deferred tax asset which Atlas has available after the merger which is believed more likely than not to be utilized in the future, after consideration of the valuation allowance.
On July 22, 2013, as a result of shareholder activity, a "triggering event" as determined under IRC Section 382 was reached. As a result, under IRC Section 382, the use of the Company's net operating loss and other carryforwards will be limited as a result of this "ownership change” for tax purposes, which is defined as a cumulative change of more than 50% during any three-year period by shareholders of the Company's shares.
Following this triggering event, the Company estimates that it will retain total tax effected federal net operating loss carryforwards of approximately $15.0 million versus $16.1 million as of June 30, 2013. Book value per common share is expected to be unaffected by this event as the amount of lost deferred tax assets are anticipated to be well within the allowance which was already held against the majority of these assets.
The components of deferred income tax assets and liabilities as of June 30, 2013 and December 31, 2012 are as follows (all amounts in '000s):
|
| | | | | | |
| | June 30, 2013 | December 31, 2012 |
| Deferred tax assets: | | |
| Unpaid claims and unearned premiums | $ | 4,251 |
| $ | 3,144 |
|
| Taxable loss carry-forwards | 16,103 |
| 16,128 |
|
| Bad debts | 251 |
| 164 |
|
| Other | 942 |
| 907 |
|
| Valuation allowance | (11,318 | ) | (11,242 | ) |
| Total deferred tax assets, net of allowance | 10,229 |
| 9,101 |
|
| | | |
| Deferred tax liabilities: | | |
| Investment securities | 585 |
| 910 |
|
| Deferred policy acquisition costs | 1,585 |
| 1,280 |
|
| Other | 14 |
| 306 |
|
| Total gross deferred tax liabilities | 2,184 |
| 2,496 |
|
| Net deferred tax assets | $ | 8,045 |
| $ | 6,605 |
|
Amounts and expiration dates of the operating loss carry forwards as of June 30, 2013 are as follows (all amounts in '000s):
|
| | | | |
| Year of Occurrence | Year of Expiration | Amount |
| 2001 | 2021 | $ | 12,563 |
|
| 2002 | 2022 | 4,317 |
|
| 2004 | 2024 | 125 |
|
| 2005 | 2025 | 183 |
|
| 2006 | 2026 | 7,825 |
|
| 2007 | 2027 | 5,131 |
|
| 2008 | 2028 | 1,949 |
|
| 2009 | 2029 | 1,949 |
|
| 2010 | 2030 | 2,442 |
|
| 2011 | 2031 | 10,558 |
|
| 2012 | 2032 | 322 |
|
| Total | | $ | 47,364 |
|
Atlas established a valuation allowance of $11.3 million and $11.2 million for its gross deferred tax assets as of the period ended June 30, 2013 and as of the year ended December 31, 2012, respectively.
In assessing the need for a valuation allowance, Atlas considers both positive and negative evidence related to the likelihood of realization of the deferred tax assets. If, based on the weight of available evidence, it is more likely than not the deferred tax assets will not be realized, a valuation allowance is recorded. The weight given to the positive and negative evidence is commensurate
with the extent to which the evidence may be objectively verified. GAAP states that a cumulative loss in recent years is a significant piece of negative evidence that is difficult to overcome in determining that a valuation allowance is not needed against deferred tax assets. Atlas' assessment also considered the recent spin-off from prior ownership, the nature and extent of cumulative financial losses and trends in recent quarterly earnings.
Atlas accounts for uncertain tax positions in accordance with the income taxes accounting guidance. Atlas has analyzed filing positions in the federal and state jurisdiction where it is required to file tax returns, as well as the open tax years in these jurisdictions. Atlas believes that its federal and state income tax filing positions and deductions will be sustained on audit and does not anticipate any adjustments that will result in a material change to its financial position. Therefore, no reserves for uncertain federal and state income tax positions have been recorded. Atlas would recognize interest and penalties related to unrecognized tax benefits as a component of the provision for federal income taxes. Atlas did not incur any federal income tax related interest income, interest expense or penalties for the three month period ended June 30, 2013 or the year ended December 31, 2012. Tax years 2008 through 2012 are subject to examination by the Internal Revenue Service.
8. OPERATING LEASE COMMITMENTS
As of June 30, 2013, Atlas has the following cash obligations related to its operating leases (all amounts in '000s):
|
| | | | | | | | | | | | | | | | | | |
| Year | 2013 | 2014 | 2015 | 2016 | 2017 & Beyond | Total |
| Amount | $ | 560 |
| $ | 1,019 |
| $ | 1,029 |
| $ | 770 |
| $ | 281 |
| $ | 3,659 |
|
9. INTERNAL USE SOFTWARE AND CAPITAL ASSETS
Atlas held the following internal use software and capital assets at June 30, 2013 and December 31, 2012, excluding assets held for sale (all amounts in '000s):
|
| | | | | | |
| | June 30, 2013 | December 31, 2012 |
| Leasehold improvements | $ | 501 |
| $ | 501 |
|
| Internal use software | 5,499 |
| 4,560 |
|
| Computer equipment | 1,657 |
| 1,505 |
|
| Furniture and other office equipment | 365 |
| 306 |
|
| Total | 8,022 |
| 6,872 |
|
| Accumulated depreciation | (6,042 | ) | (5,735 | ) |
| Balance, end of period | $ | 1,980 |
| $ | 1,137 |
|
10. UNDERWRITING POLICY AND REINSURANCE CEDED
Underwriting Risk - Underwriting risk is the risk that the total cost of claims and acquisition expenses will exceed premiums received and can arise from numerous factors, including pricing risk, reserving risk, catastrophic loss risk, reinsurance coverage risk and that loss and loss adjustment expense reserves are not sufficient.
Reinsurance Ceded - As is customary in the insurance industry, Atlas reinsures portions of certain insurance policies it writes, thereby providing a greater diversification of risk and minimizing exposure on larger risks. Atlas remains contingently at risk with respect to any reinsurance ceded and would incur an additional loss if an assuming company were unable to meet its obligation under the reinsurance treaty.
Atlas monitors the financial condition of its reinsurers to minimize its exposure to significant losses from reinsurer insolvencies. Letters of credit are maintained for any unauthorized reinsurer to cover ceded unearned premium, ceded loss reserve balances and ceded paid losses. These policies mitigate the risk of credit quality or dispute from becoming a danger to financial strength. To date, the Company has not experienced any material difficulties in collecting reinsurance recoverables.
Gross premiums written and ceded premiums, losses and commissions as of and for the three and six month periods endedJune 30, 2013 and June 30, 2012 are as follows (all amounts in '000s):
|
| | | | | | | | | | | | |
| | Three Month Periods Ended | Six Month Periods Ended |
| | June 30, 2013 | June 30, 2012 | June 30, 2013 | June 30, 2012 |
| Gross premiums written | $ | 16,562 |
| $ | 9,242 |
| $ | 38,915 |
| $ | 20,996 |
|
| Ceded premiums written | 1,587 |
| 1,427 |
| 8,666 |
| 2,960 |
|
| Net premiums written | $ | 14,974 |
| $ | 7,815 |
| $ | 30,250 |
| $ | 18,036 |
|
| | | | |
| Ceded premiums earned | $ | 3,357 |
| $ | 1,570 |
| $ | 7,864 |
| $ | 3,213 |
|
| Ceded losses and loss adjustment expenses | 1,917 |
| 605 |
| 4,986 |
| 1,410 |
|
| Ceding commissions | 528 |
| 484 |
| 1,108 |
| 1,053 |
|
| | | | | |
| Ceded unpaid losses and loss adjustment expenses | $ | 14,480 |
| $ | 8,153 |
| | |
| Prepaid reinsurance premiums | 2,970 |
| 1,961 |
| | |
| Other amounts due from reinsurers | 9,346 |
| 393 |
| | |
| | | | | |
11. UNPAID CLAIMS
Claims liabilities - The changes in the provision for unpaid claims, net of amounts recoverable from reinsurers, for the three and six month periods endedJune 30, 2013 and June 30, 2012 were as follows (all amounts in '000s):
|
| | | | | | | | | | | | |
| | Three Month Periods Ended | Six Month Periods Ended |
| | June 30, 2013 | June 30, 2012 | June 30, 2013 | June 30, 2012 |
| Unpaid claims, beginning of period | $ | 105,891 |
| $ | 83,902 |
| $ | 70,067 |
| $ | 91,643 |
|
| Less: reinsurance recoverable | 14,170 |
| 8,081 |
| 5,680 |
| 7,825 |
|
| Net beginning unpaid claims reserves | 91,721 |
| 75,821 |
| 64,387 |
| 83,818 |
|
| Fair value of net loss reserves acquired from Gateway | | | 29,857 |
| — |
|
| | | | | |
| Incurred related to: | | | | |
| Current year | 10,957 |
| 5,367 |
| 21,199 |
| 11,165 |
|
| Prior years | — |
| 41 |
| 19 |
| 147 |
|
| | 10,957 |
| 5,408 |
| 21,218 |
| 11,312 |
|
| Paid related to: | | | | |
| Current year | 2,877 |
| 2,264 |
| 4,532 |
| 3,921 |
|
| Prior years | 9,060 |
| 9,768 |
| 20,189 |
| 22,012 |
|
| | 11,937 |
| 12,032 |
| 24,721 |
| 25,933 |
|
| | | | | |
| Net unpaid claims, end of period | 90,741 |
| 69,197 |
| 90,741 |
| 69,197 |
|
| Add: reinsurance recoverable | 14,480 |
| 8,153 |
| 14,480 |
| 8,153 |
|
| Unpaid claims, end of period | $ | 105,221 |
| $ | 77,350 |
| $ | 105,221 |
| $ | 77,350 |
|
The process of establishing the estimated provision for unpaid claims is complex and imprecise as it relies on the judgment and opinions of a large number of individuals, on historical precedent and trends, on prevailing legal, economic, social and regulatory trends and on expectations as to future developments. The process of determining the provision necessarily involves risks that the actual results will deviate, perhaps substantially, from the best estimates made.
12. STOCK OPTIONS AND WARRANTS
Stock options - Stock option activity for the six month periods endedJune 30, 2013 and June 30, 2012 follows (all prices in Canadian dollars): |
| | | | | | | | | | |
| | Six Month Periods Ended |
| | June 30, 2013 | June 30, 2012 |
| | Number | Avg. Price | Number | Avg. Price |
| Outstanding, beginning of period | 133,950 |
| $ | 5.76 |
| 136,109 |
| $ | 5.70 |
|
| Granted | 91,667 |
| 6.45 |
| — |
| — |
|
| Exercised | — |
| — |
| (922 | ) | 3.00 |
|
| Expired | — |
| — |
| (1,237 | ) | 3.00 |
|
| Outstanding, end of period | 225,617 |
| $ | 6.04 |
| 133,950 |
| $ | 5.76 |
|
Information about options outstanding at June 30, 2013 is as follows: |
| | | | | |
| Grant Date | Expiration Date | Number Outstanding | Number Exercisable |
| March 18, 2010 | March 18, 2020 | 10,700 |
| 10,700 |
|
| January 18, 2011 | January 18, 2021 | 123,250 |
| 92,438 |
|
| January 11, 2013 | January 11, 2023 | 91,667 |
| — |
|
| Total | | 225,617 |
| 103,138 |
|
The options granted on March 18, 2010 have an exercise price of C$3.00 per share. These options were granted to directors of Atlas' predecessor company, JJR VI.
On January 18, 2011, Atlas granted options to purchase 123,250 ordinary shares of Atlas stock to officers and directors at an exercise price of C$6.00 per share. The options vest 25% at date of grant and 25% on each of the next three anniversary dates and expire on January 18, 2021. Using the Black-Scholes option pricing model, the weighted average grant date fair value of these options is C$3.72 per share.
On January 11, 2013, Atlas granted options to purchase 91,667 ordinary shares under the Company’s stock option plan, all of which were granted to the Company’s officers. The granted options have an exercise price of C$6.45 and vest equally on the first, second and third anniversaries of the grant date. The options expire on January 11, 2023. Using the Black-Scholes option pricing model, the weighted average grant date fair value of these options is C$4.54 per share.
The Black-Scholes option pricing model was used to estimate the fair value of compensation expense using the following assumptions – risk-free interest rate 1.88% to 3.13%; dividend yield 0.0%; expected volatility 65% to 100%; expected life of 6 to 10 years.
In accordance with Accounting Standard Codification 718 (Stock-Based Compensation), Atlas has recognized stock compensation expense on a straight-line basis over the requisite service period of the last separately vesting portion of the award. In the three month period ended June 30, 2013, Atlas recognized $63,000 in expense compared to $28,000 in the three month period ended June 30, 2012. Stock compensation expense is a component of other underwriting expenses on the income statement. Total unrecognized stock compensation expense related to the 2011 and 2013 grants is $520,000 as of the period ended June 30, 2013 which will be recognized over the next 4 years.
The weighted average exercise price of all the shares exercisable at June 30, 2013 is C$5.69 versus C$5.56 at December 31, 2012 and the grants have a weighted average remaining life of 8.6 years. The stock options outstanding have an intrinsic value as of the period ended June 30, 2013 of $724,000.
In the second quarter of 2013, a new Equity Incentive Plan was approved by Shareholders at the Annual General Meeting. Atlas will cease to grant new stock options under the existing Stock Option Plan. The Equity Incentive Plan is a new securities based compensation plan, pursuant to which Atlas may issue restricted shares, restricted units, stock options and other forms of equity incentives to eligible persons as part of their compensation. The Equity Incentive Plan is considered an amendment and restatement of the Stock Option Plan, although outstanding stock options issued pursuant to the Stock Option Plan will continue to be governed by the terms of the Stock Option Plan.
Under the Equity Incentive Plan, a director who either directly or indirectly purchases up to $100,000 of Atlas stock on the open market or through the employee stock purchase plan (see note 13) will receive a 3 to 1 matching grant of restricted stock (or for Canadian taxpayers, restricted stock units) based on the aggregate purchase price of shares he or she purchases during the six-month period beginning on June 18, 2013 and ending on December 31, 2013 (the “Purchase Period”). The matching grant will be made as soon as administratively possible after the end of the Purchase Period (the “Grant Date”). The number of shares that will
be issued on the Grant Date will be determined by dividing (A) the dollar amount of the Company matching contribution due based on purchases during the Purchase Period by (B) the closing share price of one share of Company common stock at close of market on June 17, 2013 (the “Closing Price”). The restricted stock will vest 20% on each anniversary of the Grant Date, subject to the terms of the Guidelines. The matching grant will subject to all of the terms and conditions of the Equity Incentive Plan and applicable grant agreements.
Warrants - On November 1, 2010, 1,327,834 subscription receipts were issued in a private placement for ordinary shares of Atlas as well as warrants to purchase 1,327,834 ordinary shares of Atlas for C$6.00 per share. The subscription receipts were converted to Atlas ordinary shares at Atlas' formation.
During the three month period ended June 30, 2013, 70,997 warrants were exercised in exchange for common shares, leaving 1,256,837 warrants outstanding as of June 30, 2013. Subsequent to June 30, 2013, 66,432 additional warrants were exercised in exchange for common shares.
Atlas' closing stock price on June 28, 2013 (the last trading day of the quarter) on the NASDAQ was $8.95.
13. OTHER EMPLOYEE BENEFIT PLANS
Defined Contribution Plan - In January 2011, Atlas formed a defined contribution 401(k) plan covering all qualified employees of Atlas and its subsidiaries. Employees can choose to contribute up to 60% of their annual earnings but not more than $17,000 for 2013 to the plan. Qualifying employees age 50 and older can contribute an additional $5,500 in 2013. Atlas matches 50% of the employee contribution up to 5% of annual earnings for a total maximum expense of 2.5% of annual earnings per participant. Atlas contributions are discretionary. Employees are 100% vested in their own contributions and vest in Atlas contributions based on years of service with 100% vested after five years. Company contributions were $37,000 and $34,000 for the three month periods ended June 30, 2013 and 2012, respectively.
Employee Stock Purchase Plan - In the second quarter of 2011, Atlas initiated the Atlas Employee Stock Purchase Plan (the “ESPP”) to encourage continued employee interest in the operation, growth and development of Atlas and to provide an additional investment opportunity to employees. Beginning in June 2011, full time and permanent part time employees working more than 30 hours per week are allowed to invest up to 5% of adjusted salary in Atlas ordinary shares. Atlas matches 50% of the employee contribution up to 5% of annual earnings for a total maximum expense of 2.5% of annual earnings per participant. Atlas will also pay administrative costs related to this plan. Costs incurred related to this plan were $15,000 and $14,000 for the three month periods ended June 30, 2013 and 2012, respectively.
14. SHARE CAPITAL
On December 7, 2012, a shareholder meeting was held where a one-for-three reverse stock split was unanimously approved. When the reverse stock split took effect on January 29, 2013, it decreased the authorized and outstanding ordinary shares and restricted voting shares at a ratio of one-for-three. The primary objective of the reverse stock split was to increase the per share price of Atlas' ordinary shares to meet certain listing requirements of the NASDAQ Capital Market. The share capital for the common shares is as follows:
|
| | | | | | | | | | | | | |
| | | June 30, 2013 | December 31, 2012 |
| | Shares Authorized | Shares Issued and Outstanding | Amount (in '000s) | Shares Issued and Outstanding | | Amount (in '000s) |
| Ordinary | 266,666,667 |
| 6,904,420 |
| $ | 20 |
| 2,256,924 |
| | $ | 4 |
|
| Restricted | 33,333,334 |
| 1,262,471 |
| 4 |
| 3,887,471 |
| | 14 |
| Total common shares | 300,000,001 |
| 8,166,891 |
| $ | 24 |
| 6,144,395 |
| | $ | 18 |
|
On February 11, 2013, an aggregate of 4,125,000 Atlas ordinary shares were offered in Atlas' initial public offering in the United States. 1,500,000 ordinary shares were offered by Atlas and 2,625,000 ordinary shares were sold by Kingsway America Inc. ("KAI"), a wholly-owned subsidiary of Kingsway Financial Services Inc., or other Kingsway subsidiaries (collectively ”Kingsway”) at a price of $5.85 per share, less underwriting discounts and expenses. Atlas also granted the underwriters an option to purchase up to an aggregate of 618,750 additional shares at the public offering price of $5.85 per share to cover over-allotments, if any. On March 11, 2013, the underwriters exercised this option and purchased an additional 451,500 shares. After underwriting and other expenses, Atlas realized combined proceeds of $9.8 million.
During the three month period ended June 30, 2013, 70,997 warrants were exercised, which resulted in the issuance of 70,997 common shares.
All of the issued and outstanding restricted voting common shares are beneficially owned or controlled by Kingsway. In the event that such shares are disposed of such that Kingsway's beneficial interest is less than 10% of the issued and outstanding restricted voting common shares, the restricted voting common shares shall be converted into fully paid and non-assessable ordinary shares.
The restricted voting common shares are entitled to vote at all meetings of shareholders, except at meetings of holders of a specific class that are entitled to vote separately as a class. The restricted voting common shares as a class shall not carry more than 30% of the aggregate votes eligible to be voted at a general meeting of common shareholders.
The restricted voting common shares will convert to ordinary shares in the event that these Kingsway-owned shares are sold to non-affiliates of Kingsway.
Preferred shares are not entitled to vote. Of the total 20,000,000 preferred shares outstanding as of the three month period ended June 30, 2013, 18,000,000 are beneficially owned or controlled by Kingsway and 2,000,000 are beneficially owned or controlled by Hendricks. Preferred shareholders are entitled to dividends on a cumulative basis whether or not declared by the Board of Directors at the rate of $0.045 per share per year (4.5%) and may be paid in cash or in additional preferred shares at the option of Atlas. In liquidation, dissolution or winding-up of Atlas, preferred shareholders receive the greater of $1.00 per share plus all declared and unpaid dividends or the amount it would receive in liquidation if the preferred shares had been converted to restricted voting common shares or ordinary shares immediately prior to liquidation. Preferred shares are convertible into ordinary shares at the option of the holder at any date after the fifth year of issuance at the rate of 0.1270 ordinary shares for each preferred share. The conversion rate is subject to change if the number of ordinary shares or restricted voting common shares changes. The preferred shares are redeemable at the option of Atlas at a price of $1.00 per share plus accrued and unpaid dividends commencing at the earlier of two years from December 31, 2010 (the issuance date of the preferred shares), or the date the preferred shares are transferred to a party other than Kingsway or its subsidiaries or entities in which Kingsway holds a 10% or greater interest.
During the six month period ended June 30, 2013, Atlas declared and paid $2.1 million in dividends earned through the preferred shares to Kingsway, the cumulative amount to which they were entitled through the end of June 30, 2013. Hendricks earned $23,000 in dividends during the three month period ended June 30, 2013, which are unpaid as of June 30, 2013. The 18,000,000 preferred shares owned by Kingsway were repurchased by the Company on August 1, 2013 pursuant to the Share Repurchase Agreement.
15. DEFERRED POLICY ACQUISITION COSTS
Deferred policy acquisition costs for the six month periods endedJune 30, 2013 and June 30, 2012 (in '000s):
|
| | | | | | |
| | Six Month Periods Ended |
| | June 30, 2013 | June 30, 2012 |
| Balance, beginning of period | $ | 3,764 |
| $ | 3,020 |
|
| Acquired in business combination | 1,233 |
| — |
|
| Acquisition costs deferred | 4,161 |
| 2,529 |
|
| Amortization charged to income | 4,497 |
| 2,768 |
|
| Balance, end of period | $ | 4,661 |
| $ | 2,781 |
|
16. RELATED PARTY TRANSACTIONS
The business of Atlas is carried on through its insurance subsidiaries. Atlas’ insurance subsidiaries have been parties to various transactions with affiliates in the past, although activity in this regard has diminished over time. Related party transactions, including services provided to or received by Atlas’ insurance subsidiaries, are carried out in the normal course of operations and are measured at the amount of consideration paid or received as established and agreed upon by the parties. Such transactions typically include claims handling services, marketing services and commission payments. Management believes that consideration paid for such services approximates fair value.
At June 30, 2013 and December 31, 2012, Atlas reported net amounts receivable from (payable to) affiliates as follows which are included within other assets and accounts payable and accrued expenses on the balance sheets (all amounts in '000s):
|
| | | | | | |
| | June 30, 2013 | December 31, 2012 |
| Kingsway America Inc. | $ | 44 |
| $ | 43 |
|
| Kingsway Amigo Insurance Company | 4 |
| 1 |
|
| Total | $ | 48 |
| $ | 44 |
|
17. SUBSEQUENT EVENTS
Refer above to Notes 4 and 14 for a discussion of subsequent events regarding the Share Repurchase Agreement executed during the third quarter of 2013.
Refer above to Note 7 for a discussion of subsequent events regarding the utilization of Atlas' deferred tax assets.
Table of Contents
Page
Independent Auditors’ Report F-47
Consolidated Financial Statements
Consolidated Balance Sheets F-48
Consolidated Statements of Operations and Comprehensive Income (Loss) F-50
Consolidated Statements of Changes in Shareholder's Equity F-51
Consolidated Statements of Cash Flows F-52
Notes to Consolidated Financial Statements F-53
Independent Auditors’ Report
Board of Directors and Shareholder
Camelot Services, Inc.
St. Louis, Missouri
We have audited the accompanying consolidated balance sheets of Camelot Services, Inc. and subsidiary (Missouri corporations) as of December 31, 2011 and 2010, and the related consolidated statements of operations and comprehensive income (loss), changes in shareholder’s equity and cash flows for the years then ended. These consolidated financial statements are the responsibility of the Company’s management. Our responsibility is to express an opinion on these consolidated financial statements based on our audits.
We conducted our audits in accordance with auditing standards generally accepted in the United States of America. Those standards require that we plan and perform the audit to obtain reasonable assurance about whether the consolidated financial statements are free of material misstatement. An audit includes consideration of internal control over financial reporting as a basis for designing audit procedures that are appropriate in the circumstances, but not for the purpose of expressing an opinion on the effectiveness of the Company’s internal control over financial reporting. Accordingly, we express no such opinion. An audit also includes examining, on a test basis, evidence supporting the amounts and disclosures in the consolidated financial statements. An audit also includes assessing the accounting principles used and significant estimates made by management, as well as evaluating the overall financial statement presentation. We believe that our audits provide a reasonable basis for our opinion.
In our opinion, the consolidated financial statements referred to above present fairly, in all material respects, the financial position of Camelot Services, Inc. and subsidiary as of December 31, 2011 and 2010, and the results of their operations and their cash flows for the years then ended in conformity with accounting principles generally accepted in the United States of America.
Due to significant adverse claim development, the Company has recorded $5 million of additional claims loss expense during the nine months ended September 30, 2012 relating to the 2011 accident years and prior. Additionally, the Company has changed its estimate for a deferred tax valuation allowance during 2012. These items are further discussed in Note Q to the financial statements.
/s/ Brown Smith Wallace LLC
St. Louis, Missouri
March 20, 2012
**All amounts in whole dollars
|
| | | | | | |
| CAMELOT SERVICES, INC. AND SUBSIDIARY | |
| | | |
| Consolidated Balance Sheets | | |
| December 31, 2011 and 2010 | | |
| | | |
| | | |
| | 2011 | 2010 |
| ASSETS | | |
| Investments and Cash | | |
| Cash and cash equivalents | $ | 1,402,296 |
| $ | 3,215,860 |
|
| Fixed maturities available-for-sale at fair | | |
| value (amortized cost $37,414,408 at 2011 | | |
| and $32,144,598 at 2010) | 39,765,830 |
| 33,112,720 |
|
| Equity securities available-for-sale at fair value | | |
| (cost of $3,295,664 at 2011 and $3,244,002 | | |
| at 2010) | 2,734,738 |
| 2,743,202 |
|
| | | |
| Total Investments and Cash | 43,902,864 |
| 39,071,782 |
|
| | | |
| Receivables | | |
| Premium and agent balances receivable, net of | | |
| allowance of $187,225 at 2011 and $341,652 at 2010 | 9,594,321 |
| 9,082,165 |
|
| Reinsurance recoverable on loss and loss | | |
| adjustment expense | 3,734,381 |
| 1,799,232 |
|
| Federal income taxes recoverable | — |
| 554,841 |
|
| State income taxes recoverable | 128,756 |
| — |
|
| Receivable for securities | 306,938 |
| — |
|
| Interest and dividends accrued | 298,568 |
| 288,815 |
|
| | | |
| Total Receivables | 14,062,964 |
| 11,725,053 |
|
| | | |
| Other Assets | | |
| Deferred income taxes | 2,940,659 |
| 1,793,798 |
|
| Deferred policy acquisition costs | 1,883,881 |
| 1,560,334 |
|
| Property and equipment, net | 1,130,360 |
| 554,891 |
|
| Other assets | 288,466 |
| 495,412 |
|
| | | |
| Total Other Assets | 6,243,366 |
| 4,404,435 |
|
| | | |
| TOTAL ASSETS | $ | 64,209,194 |
| $ | 55,201,270 |
|
| | | |
| The accompanying notes are an integral part of these consolidated financial statements. |
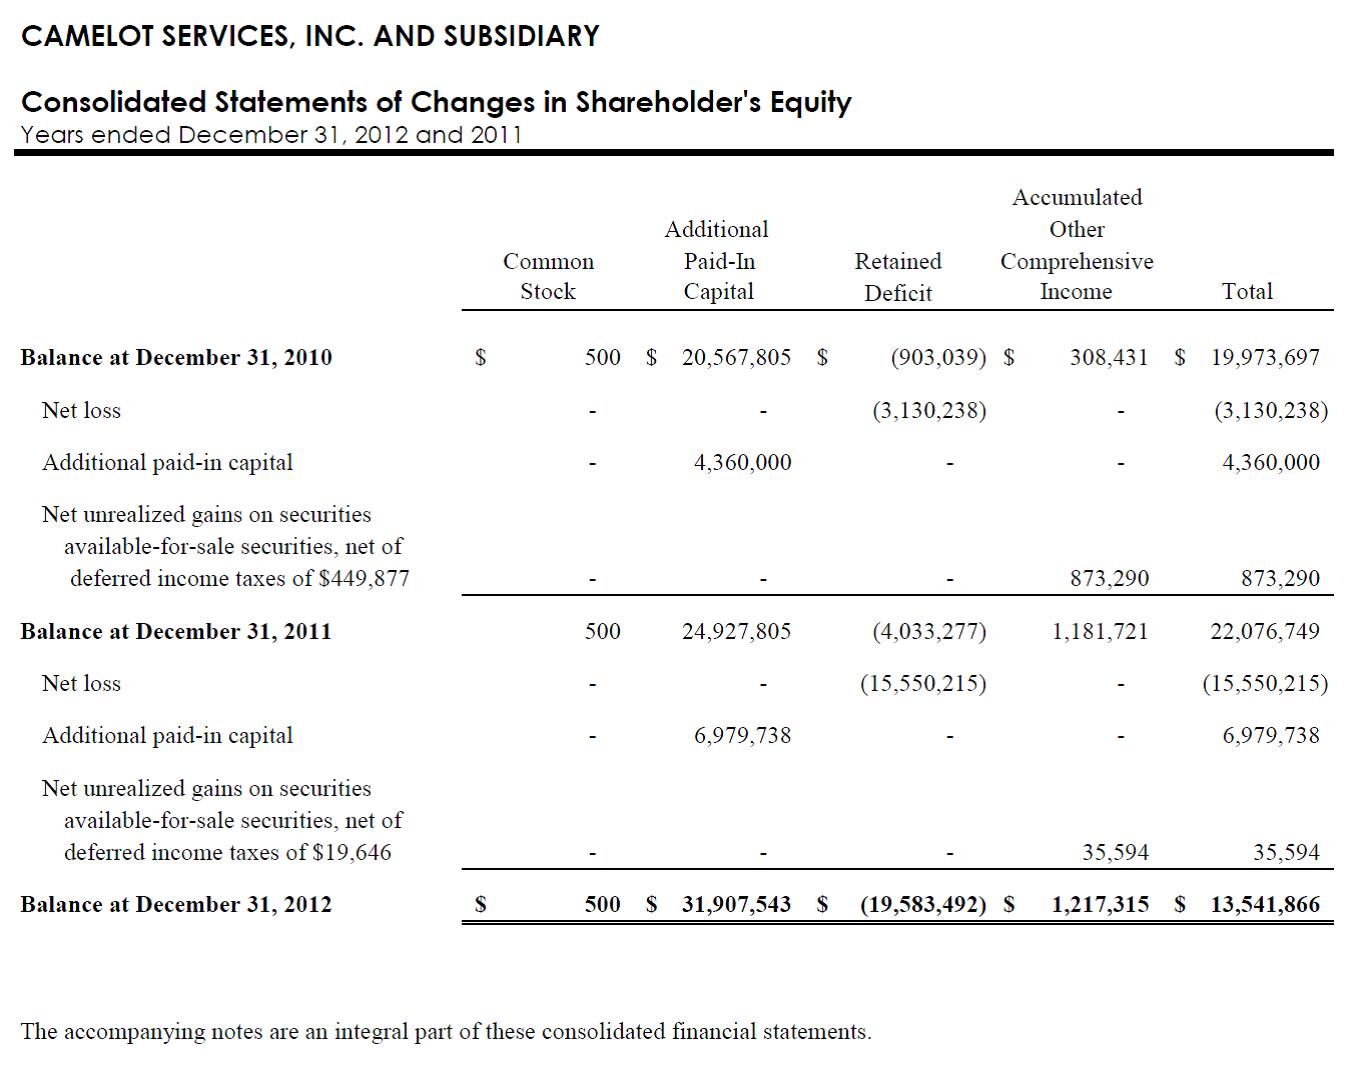
|
| | | | | | |
| | 2011 | 2010 |
| LIABILITIES AND SHAREHOLDER’S EQUITY | | |
| LIABILITIES | | |
| Reserve for losses and loss | | |
| adjustment expenses | $ | 23,815,196 |
| $ | 19,223,591 |
|
| Unearned premiums | 13,733,578 |
| 12,009,017 |
|
| Accounts payable and accrued expenses | 3,334,276 |
| 2,489,556 |
|
| Note payable | 1,249,395 |
| 1,505,409 |
|
| | | |
| Total Liabilities | 42,132,445 |
| 35,227,573 |
|
| | | |
| | | |
| | | |
| SHAREHOLDER’S EQUITY | | |
| Common stock, $1 stated value; | | |
| 40,000 shares authorized; 500 shares | | |
| issued and outstanding | 500 |
| 500 |
|
| Additional paid-in capital | 24,927,805 |
| 20,567,805 |
|
| Retained earnings (deficit) | (4,033,277 | ) | (903,039 | ) |
| Accumulated other comprehensive income | 1,181,721 |
| 308,431 |
|
| | | |
| Total Shareholder’s Equity | 22,076,749 |
| 19,973,697 |
|
| | | |
| TOTAL LIABILITIES AND SHAREHOLDER’S | | |
| EQUITY | $ | 64,209,194 |
| $ | 55,201,270 |
|
1,262,471 Ordinary Shares
_______________
PROSPECTUS
_______________
_________ 2013
|
| | | | | | |
| CAMELOT SERVICES, INC. AND SUBSIDIARY | | |
| | | |
| Consolidated Statements of Operations and Comprehensive | | |
| Income (Loss) | | |
| Years ended December 31, 2011 and 2010 | | |
| | | |
| | | |
| | 2011 | 2010 |
| Revenues | | |
| Premiums earned, net | $ | 23,989,257 |
| $ | 19,961,702 |
|
| Investment income, net of expenses | 1,231,205 |
| 1,184,716 |
|
| Realized gains on sale of investments | 226,892 |
| 389,202 |
|
| | | |
| Total revenues | 25,447,354 |
| 21,535,620 |
|
| | | |
| Expenses | | |
| Losses and loss adjustment expenses | 20,439,922 |
| 17,402,623 |
|
| Other underwriting expenses | 9,520,008 |
| 8,125,991 |
|
| | | |
| Total expenses | 29,959,930 |
| 25,528,614 |
|
| | | |
| Other expense | 187,504 |
| 32,509 |
|
| | | |
| Total other expense | 187,504 |
| 32,509 |
|
| | | |
| Loss before provision for | | |
| income taxes | (4,700,080 | ) | (4,025,503 | ) |
| | | |
| Income Taxes | | |
| Current expense (benefit) | 26,897 |
| (538,666 | ) |
| Deferred income tax benefit | (1,596,739 | ) | (813,045 | ) |
| | | |
| Total income tax benefit | (1,569,842 | ) | (1,351,711 | ) |
| | | |
| NET LOSS | (3,130,238 | ) | (2,673,792 | ) |
| | | |
| OTHER COMPREHENSIVE INCOME (LOSS) | | |
| | | |
| Unrealized holding gains arising | | |
| during the period, net of tax | 1,100,182 |
| 699,768 |
|
| | | |
| Less: reclassification adjustment for gains | | |
| included in net income | (226,892 | ) | (389,202 | ) |
| | | |
| Other comprehensive income, net of tax | 873,290 |
| 310,566 |
|
| | | |
| COMPREHENSIVE INCOME (LOSS) | $ | (2,256,948 | ) | $ | (2,363,226 | ) |
| | | |
| The accompanying notes are an integral part of these consolidated financial statements. | |
|
| | | | | | | | | | | | | | | |
| CAMELOT SERVICES, INC. AND SUBSIDIARY | |
| | | | | | |
| Consolidated Statements of Changes in Shareholder’s Equity | |
| Years ended December 31, 2011 and 2010 | | | | |
| | | | | | |
| | | | | Accumulated | |
| | | Additional | Retained | Other | |
| | Common | Paid-In | Earnings | Comprehensive | |
| | Stock | Capital | (Deficit) | Income | Total |
| | | | | | |
| Balance at December 31, 2009 | $ | 500 |
| $ | 17,567,805 |
| $ | 1,770,753 |
| $ | (2,135 | ) | $ | 19,336,923 |
|
| | | | | | |
| Net loss | — |
| — |
| (2,673,792 | ) | — |
| (2,673,792 | ) |
| | | | | | |
| Additional paid-in capital | — |
| 3,000,000 |
| — |
| — |
| 3,000,000 |
|
| | | | | | |
| Net unrealized gains on securities | | | | | |
| available-for-sale securities, net of | | | | | |
| deferred income taxes of $159,988 | — |
| — |
| — |
| 310,566 |
| 310,566 |
|
| | | | | | |
| Balance at December 31, 2010 | 500 |
| 20,567,805 |
| (903,039 | ) | 308,431 |
| 19,973,697 |
|
| | | | | | |
| Net loss | — |
| — |
| (3,130,238 | ) | — |
| (3,130,238 | ) |
| | | | | | |
| Additional paid-in capital | — |
| 4,360,000 |
| — |
| — |
| 4,360,000 |
|
| | | | | | |
| Net unrealized gains on securities | | | | | |
| available-for-sale securities, net of | | | | | |
| deferred income taxes of $449,877 | — |
| — |
| — |
| 873,290 |
| 873,290 |
|
| | | | | | |
| Balance at December 31, 2011 | $ | 500 |
| $ | 24,927,805 |
| $ | (4,033,277 | ) | $ | 1,181,721 |
| $ | 22,076,749 |
|
| | | | | | |
| | | | | | |
| | | | | | |
| The accompanying notes are an integral part of these consolidated financial statements. | |
|
| | | | | | |
| CAMELOT SERVICES, INC. AND SUBSIDIARY | |
| | | |
| Consolidated Statements of Cash Flows | | |
| Years ended December 31, 2011 and 2010 | | |
| | | |
| | 2011 | 2010 |
| Cash flows from operating activities | | |
| Net loss | $ | (3,130,238 | ) | $ | (2,673,792 | ) |
| Adjustments to reconcile net income to net cash | | |
| provided by operating activities: | | |
| Realized gains on sale of investments | (226,892 | ) | (389,202 | ) |
| Depreciation | 125,034 |
| 38,814 |
|
| Net amortization of investment premiums and discounts | 157,209 |
| 46,310 |
|
| Deferred income taxes | (1,596,739 | ) | (812,704 | ) |
| (Increase) decrease in operating assets: | | |
| Premiums and agent balances receivable | (512,156 | ) | (725,255 | ) |
| Reinsurance recoverable on loss and loss adjustment expense | (1,935,149 | ) | (974,418 | ) |
| Interest and dividends accrued | (9,753 | ) | (46,968 | ) |
| Federal income taxes recoverable | 554,841 |
| (429,694 | ) |
| State income taxes recoverable | (128,756 | ) | — |
|
| Receivable for securities | (306,938 | ) | — |
|
| Policy acquisition costs deferred | (323,547 | ) | (158,561 | ) |
| Other assets | 206,946 |
| (128,562 | ) |
| Increase in operating liabilities: | | |
| Reserve for losses and loss adjustment expenses | 4,591,605 |
| 6,928,562 |
|
| Unearned premiums | 1,724,561 |
| 1,163,126 |
|
| Accounts payable and accrued expenses | 844,720 |
| 345,802 |
|
| | | |
| Net cash provided by operating activities | 34,748 |
| 2,183,458 |
|
| | | |
| Cash flows from investing activities | | |
| Purchases of property and equipment | (700,503 | ) | (504,259 | ) |
| Proceeds from sales of investments | 10,188,787 |
| 10,887,074 |
|
| Purchases of investments | (15,440,582 | ) | (19,796,593 | ) |
| | | |
| Net cash used in investing activities | (5,952,298 | ) | (9,413,778 | ) |
| | | |
| Cash flows from financing activities | | |
| Additional paid-in capital | 4,360,000 |
| 3,000,000 |
|
| Proceeds from long-term debt | — |
| 1,500,000 |
|
| Payments on long-term debt | (256,014 | ) | — |
|
| | | |
| Net cash provided by financing activities | 4,103,986 |
| 4,500,000 |
|
| | | |
| DECREASE IN CASH AND CASH EQUIVALENTS | (1,813,564 | ) | (2,730,320 | ) |
| | | |
| Cash and cash equivalents, beginning of year | 3,215,860 |
| 5,946,180 |
|
| | | |
| Cash and cash equivalents, end of year | $ | 1,402,296 |
| $ | 3,215,860 |
|
| | | |
| The accompanying notes are an integral part of these consolidated financial statements. | |
CAMELOT SERVICES, INC.
Notes to Consolidated Financial Statements
December 31, 2011
**All amounts in whole dollars
| |
Note A - | Nature of Business |
Camelot Services, Inc. (“Camelot”) is a wholly-owned subsidiary of Hendricks Holding Company, Inc. (“Hendricks”) and is the parent company of Gateway Insurance Company (“Gateway”). The Company specializes in Commercial Lines of business by offering three niche programs. The Public Auto Program has many years of experience in writing the Commercial Auto line of business for small to mid-size taxi and limousine drivers. In 2007, Gateway began writing business in the Contractors Program that specializes in the General Liability, Commercial Auto and Workers Compensation lines of business for roofing contractors. In 2008, Gateway began writing business in the Long-Haul Truck Program that specializes in the Commercial Auto, Cargo, and General Liability lines of business for small to mid-size truckers. Gateway maintains insurance licenses in 47 states, including the District of Columbia.
| |
Note B - | Summary of Significant Accounting Policies |
Described below are the significant accounting policies followed by the Company in the preparation of the accompanying consolidated financial statements in accordance with accounting principles generally accepted in the United States of America.
Principles of Consolidation
The consolidated financial statements include the accounts of Camelot and its wholly-owned subsidiary, Gateway, collectively referred to as the “Company.” All intercompany accounts and transactions have been eliminated.
Use of Estimates
The preparation of financial statements in conformity with accounting practices generally accepted in the United States requires management to make estimates and assumptions that affect the reported amounts of assets and liabilities and disclosure of contingent assets and liabilities at the date of the financial statements and the reported amounts of revenues and expenses during the reporting period. Actual results could differ from those estimates.
Risks and Uncertainties
Investment securities are exposed to various risks, such as interest rate, market and credit. Due to the level of risk associated with investment securities and the level of uncertainty related to changes in the value of investment securities, it is at least reasonably possible that changes in risk in the near term could materially affect the amounts reported in the consolidated financial statements.
Premium Revenues
Gateway writes premiums for commercial vehicle business, general liability, and workers compensation calling for insureds' to pay premiums on a periodic basis. Gateway records written premiums and uncollected premiums and agents' balances deferred on these monthly writings equal to the annual amount at inception of the policy.
Premiums are recognized as income over the terms of the related insurance policies. Unearned premium reserves represent the portion of the premiums written that relate to the unexpired terms of policies in force. Such reserves are computed on a pro rata method.
Unpaid Losses and Loss Adjustment Expense
The reserves for unpaid losses and loss adjustment expenses include amounts determined on the basis of individual claims and actuarially determined estimates of losses incurred but not reported. Such liabilities are necessarily based on estimates and, while management believes the amount is adequate, the ultimate liability may be in excess of or less than the amounts provided. The methods of making such estimates and for establishing the resulting liabilities are continually reviewed and updated based upon current circumstances and any adjustments resulting there from are reflected in operations.
The reserves for unpaid losses and loss adjustment expenses are reported net of receivables for salvage and subrogation
of approximately $686,000 and $494,000 at December 31, 2011 and 2010, respectively.
Cash Maintained for Deductibles
The Company maintains cash balances on behalf of certain insureds' in order to pay claims up to their deductible. These amounts are included in the Company's cash balance and the corresponding liability is included in accounts payable and accrued expenses. Cash balances maintained on behalf of others amounted to $0 at December 31, 2011 and 2010, respectively.
Investments
The Company accounts for its investments in accordance with Financial Accounting Standards Board (“FASB”) ASC 320, Investments - Debt and Equity Securities. Management determines the appropriate classification of its investments at the time of purchase and re-evaluates such determination at each balance sheet date (Note D).
Fixed maturity securities are classified as available-for-sale and are stated at market value, with unrealized gains and losses, net of tax, reported as a separate component of shareholder's equity.
Equity securities are classified as available-for-sale and are stated at market value, with unrealized gains and losses, net of tax, reported as a separate component of shareholder's equity. Market value is based on third-party quoted market prices or, when unavailable, on similar assets.
Realized gains and losses are reported as a separate component of income based upon the first-in, first-out method.
Deferred Policy Acquisition Costs
Policy acquisition costs include commissions and premium taxes. These costs are deferred and amortized over the terms of the related policies to which they relate to the extent recoverable from future revenues and gross profits.
Property and Equipment
Property and equipment are recorded at cost and depreciated using the straight-line method over useful lives of three to five years. Expenditures for maintenance, repairs and minor additions are charged to operations as incurred.
When property and equipment are retired or otherwise disposed of, the cost is removed from the asset account, and the corresponding accumulated depreciation is removed from the related allowance account. Any resulting gain or loss is included in results of operations.
Income Taxes
The Company employs the provisions of FASB ASC 740, Income Taxes. FASB ASC 740 requires recognition of deferred tax assets and liabilities for the expected future tax consequences of events that have been included in the consolidated financial statements or tax returns. Under this method, deferred tax assets and liabilities are determined based upon the differences between the financial statement and tax bases of assets and liabilities using enacted tax rates in effect.
The Company has implemented the accounting guidance for uncertainty in income taxes using the provisions of FASB ASC 740. Using that guidance, tax positions initially need to be recognized in the consolidated financial statements when it is more-likely-than-not the position will be sustained upon examination by the tax authorities. Such tax positions initially and subsequently need to be measured as the largest amount of tax benefit that has a greater than 50% likelihood of being realized upon ultimate settlement with the tax authority assuming full knowledge of the position and relevant facts. The Company believes that it has appropriate support for the income tax positions taken and to be taken on its tax returns and that its accruals for tax liabilities are adequate for all open tax years (after 2008 for federal and state) based on an assessment of many factors including experience and interpretations of tax laws applied to the facts of each matter.
The Company has concluded that there are no significant uncertain tax positions requiring disclosure, and there are no material amounts of unrecognized tax benefits.
Cash, Cash Equivalents and Short-Term Investments
Cash and cash equivalents includes short-term investments which consist of investments with original maturities within one year of acquisition. Cash consists of all cash on hand and on deposit with financial institutions.
Premium Receivable
Premium receivable are stated at the amount management expects to collect from outstanding balances. Management provides for probable uncollectible amounts through a charge to earnings and a credit to a valuation allowance based on its assessment of the current status of individual accounts. Balances that are still outstanding after management has used reasonable collection efforts are written off through a charge to the valuation allowance and a credit to premium receivable. The valuation allowance increased (decreased) by ($154,427) and $197,257 for the years ended December 31, 2011 and 2010, respectively.
Impairment of Long Lived Assets
The Company evaluates whether events and circumstances have occurred that indicate the remaining estimated useful life of long lived assets may warrant revision or that the remaining balance of an asset may not be recoverable. The measurement of possible impairment is based on the ability to recover the balance of assets from expected future operating cash flows on an undiscounted basis. In the opinion of management, no such impairment existed at December 31, 2011 and 2010, respectively.
Subsequent Events
The Company has evaluated all subsequent events through March 20, 2012, the date the financial statements were available to be issued.
Note C -Investments
The following information summarizes the difference between amortized cost and fair value of fixed maturity investments as of December 31, 2011 and 2010:
|
| | | | | | | | | | | | |
| December 31, 2011 | Amortized Cost | Gross Unrealized Gains | Gross Unrealized Losses | Fair Value |
| US Government Securities | $ | 4,078,503 |
| $ | 441,473 |
| $ | — |
| $ | 4,519,976 |
|
| US States, territories, possessions | 1,130,215 |
| 67,574 |
| — |
| 1,197,789 |
|
| US Political subdivisions of states | 1,063,698 |
| 29,469 |
| — |
| 1,093,167 |
|
| Special revenue and assessment | 1,223,255 |
| 96,095 |
| — |
| 1,319,350 |
|
| Industrial and miscellaneous | 11,289,604 |
| 783,111 |
| 37,677 |
| 12,035,038 |
|
| Mortgage backed | 18,629,133 |
| 984,742 |
| 13,365 |
| 19,600,510 |
|
| | $ | 37,414,408 |
| $ | 2,402,464 |
| $ | 51,042 |
| $ | 39,765,830 |
|
|
| | | | | | | | | | | | |
| December 31, 2010 | Amortized Cost | Gross Unrealized Gains | Gross Unrealized Losses | Fair Value |
| US Government Securities | $ | 4,752,737 |
| $ | 175,252 |
| $ | 9,462 |
| $ | 4,918,527 |
|
| US States, territories, possessions | 483,599 |
| — |
| 26,274 |
| 457,325 |
|
| US Political subdivisions of states | 694,327 |
| — |
| 17,330 |
| 676,997 |
|
| Special revenue and assessment | 2,031,135 |
| 9,468 |
| 37,088 |
| 2,003,515 |
|
| Industrial and miscellaneous | 12,025,586 |
| 735,780 |
| 1,962 |
| 12,759,404 |
|
| Mortgage backed | 12,157,214 |
| 267,527 |
| 127,789 |
| 12,296,952 |
|
| | $ | 32,144,598 |
| $ | 1,188,027 |
| $ | 219,905 |
| $ | 33,112,720 |
|
The amortized cost and fair market value of debt securities by contractual maturity are shown below. Expected maturities will differ from contractual maturity because borrowers may have the right to call or prepay obligations with or without call or prepayment penalties:
|
| | | | | | |
| | Amortized Cost | Fair Value |
| Within one year | $ | 1,065,287 |
| $ | 1,084,075 |
|
| After one year through five years | 6,582,819 |
| 6,910,570 |
|
| After five years through ten years | 10,955,448 |
| 11,982,569 |
|
| After ten years | 181,721 |
| 188,106 |
|
| Mortgage Backed | 18,629,133 |
| 19,600,510 |
|
| | $ | 37,414,408 |
| $ | 39,765,830 |
|
The cost and estimated fair value of investments in equity securities at December 31, 2011 and 2010 as follows:
|
| | | | | | | | | | | | |
| December 31, 2011 | Cost | Gross Unrealized Gains | Gross Unrealized Losses | Fair Value |
| Preferred Stock | $ | 6,800 |
| $ | 19,800 |
| $ | — |
| $ | 26,600 |
|
| Common stock | 3,288,864 |
| 3,935 |
| 584,661 |
| 2,708,138 |
|
| Total equity securities | $ | 3,295,664 |
| $ | 23,735 |
| $ | 584,661 |
| $ | 2,734,738 |
|
|
| | | | | | | | | | | | |
| December 31, 2010 | Cost | Gross Unrealized Gains | Gross Unrealized Losses | Fair Value |
| Preferred Stock | $ | 6,800 |
| $ | 5,781 |
| $ | — |
| $ | 12,581 |
|
| Common stock | 3,237,202 |
| 58,819 |
| 565,400 |
| 2,730,621 |
|
| Total equity securities | 3,244,002 |
| 64,600 |
| 565,400 |
| $ | 2,743,202 |
|
At December 31, 2011 and 2010, the Company held 40 and 56 fixed maturity and equity securities, respectively, where the estimated fair value had declined and remained below amortized cost by the amount indicated in the tables below.
|
| | | | | | | | | | | | |
| | 2011 | 2010 |
| | Fair Value | Unrealized Losses | Fair Value | Unrealized Losses |
| Bonds, not backed by other loans | | | |
|
| Less than 12 months | $ | 822,488 |
| $ | 37,677 |
| $ | 3,377,921 |
| $ | 92,116 |
|
| | | | | |
| Loan-backed and structured securities | | | |
|
| Less than 12 months | 226,625 |
| 391 |
| 6,169,385 |
| 120,831 |
|
| 12 months or more | 429,557 |
| 12,974 |
| 417,897 |
| 6,958 |
|
| | 1,478,670 |
| 51,042 |
| 9,965,203 |
| 219,905 |
|
| Common Stock | | | |
|
| Less than 12 months | 1,773,071 |
| 162,371 |
| — |
| — |
|
| 12 months or more | 631,532 |
| 422,290 |
| 1,121,192 |
| 565,400 |
|
| | $ | 2,404,603 |
| $ | 584,661 |
| $ | 1,121,192 |
| $ | 565,400 |
|
The Company regularly reviews its investment portfolio for factors that may indicate that a decline in fair value of an investment is other-than-temporary. Based on the evaluation of the issues, including, but not limited to, intentions to sell or ability to hold the fixed maturity and equity investments with unrealized losses for a period of time sufficient for them to recover; the length of time and amount of the unrealized loss; and the credit ratings of the issuers of the investments, the Company does not consider these investments to be other-than-temporarily impaired at December 31, 2011 and 2010.
The Company monitors its investment securities to identify impairments in value. The Company evaluates factors such as financial condition of the issuer, payment performance, the length of time and the extent to which the estimated fair value has been below amortized cost, general market conditions, intent and ability to hold securities, and various other subjective factors. Based on management’s judgment, securities with other-than-temporary impairment in value are written down to management’s estimate of fair value. Included in investment related losses are other-than-temporary write-downs of equity securities of $0 and $1,000 in 2011 and 2010, respectively.
Accrued investment income at December 31, is as follows:
|
| | | | | | |
| | 2011 | 2010 |
| US Government Securities | $ | 41,461 |
| $ | 46,990 |
|
| US States, territories, possessions | 10,843 |
| 4,373 |
|
| US Political subdivisions of states | 9,402 |
| 7,905 |
|
| Special revenue and assessment | 20,649 |
| 32,931 |
|
| Industrial and miscellaneous | 148,704 |
| 152,980 |
|
| Mortgage backed | 66,346 |
| 43,110 |
|
| Common Stock | 1,163 |
| 490 |
|
| Short Term Investments | — |
| 36 |
|
| | $ | 298,568 |
| $ | 288,815 |
|
Bonds, notes and other short-term investments with fair value of approximately $5,123,000 and $4,483,000 at December 31, 2011 and 2010, respectively, were on deposit with various state departments of insurance to comply with requirements of the various states to maintain deposits for the protection of those states’ policyholders.
Net investment income by source was as follows for the year ended December 31:
|
| | | | | | | | |
| | | | 2011 | 2010 |
| Investment Income | | |
| | Fixed maturity investments | $ | 1,290,120 |
| $ | 1,214,495 |
|
| | Short-term investments | 3,707 |
| 3,302 |
|
| | Dividends | 58,495 |
| 63,525 |
|
| | | Total investment income | 1,352,322 |
| 1,281,322 |
|
| Less investment expenses | 121,117 |
| 96,606 |
|
| | Net investment income | $ | 1,231,205 |
| $ | 1,184,716 |
|
Net realized gains (losses) on investments included in results of operations for the years ended December 31, 2011 and 2010 are as follows:
|
| | | | | | | | |
| | | | December 31, |
| | | | 2011 | 2010 |
| | Fixed maturity investments | $ | 229,380 |
| $ | 345,591 |
|
| | Marketable equity securities | (2,488 | ) | 43,611 |
|
| | | $ | 226,892 |
| $ | 389,202 |
|
During 2010, the Company acquired a bond which was subsequently converted for two new bonds. The conversion was an exchange of similar bonds of the same issuer. The book value and consideration at the time of the conversion was $113,701. The conversion was accounted for as a non-cash transaction and excluded from the Company’s statement of cash flows.
Note D -Fair Value Measurements
Certain financial assets and liabilities are valued using market prices from active markets (level 1). Level 1 instrument valuations are obtained from real-time quotes for transactions in active exchange markets involving identical assets. Level 2 instrument valuations are obtained from readily-observable inputs of the instrument. Level 3 instrument valuations are unobservable inputs which are significant to fair value measurement. As of December 31, 2011, the Company did not have any assets with valuations without observable market values or other inputs that would require a high level of judgment to determine fair value (level 3 instruments).
The asset or liability’s fair value measurement level within the fair value hierarchy is based on the lowest level of any input that is significant to the fair value measurement. Valuation techniques used need to maximize the use of observable inputs and minimize the use of unobservable inputs. Following is a description of the valuation methodologies used for assets measured at fair value. There have been no changes in the methodologies used at December 31, 2011 and 2010, respectively.
Bonds: Valued at quoted market prices in less active markets; quoted market prices for similar instruments, and pricing models, such as a discounted cash flow model, with all significant inputs derived from or corroborated with observable market data.
Preferred and Common stocks:Valued at quoted market prices at year end.
Mutual funds:Valued at the net asset value (“NAV”) of shares held by the Company at year end.
The methods described above may produce a fair value calculation that may not be indicative of net realizable value or reflective of future fair values. Furthermore, while the Company believes its valuation methods are appropriate and consistent with other market participants, the use of different methodologies or assumptions to determine the fair value of certain financial instruments could result in a different fair value measurement at the reporting date.
|
| | | | | | | | | | | | |
| December 31, 2011 | Level 1 | Level 2 | Level 3 | Total |
| US Government Securities | $ | — |
| $ | 4,519,976 |
| $ | — |
| $ | 4,519,976 |
|
| US States, territories, possessions | — |
| 1,197,789 |
| — |
| 1,197,789 |
|
| US Political subdivisions of states | — |
| 1,093,167 |
| — |
| 1,093,167 |
|
| Special revenue and assessment | — |
| 1,319,350 |
| — |
| 1,319,350 |
|
| Industrial and miscellaneous | — |
| 12,035,038 |
| — |
| 12,035,038 |
|
| Mortgage backed | — |
| 19,600,510 |
| — |
| 19,600,510 |
|
| Total bonds | $ | — |
| $ | 39,765,830 |
| $ | — |
| $ | 39,765,830 |
|
|
| | | | | | | | | | | | | |
| | | Level 1 | Level 2 | Level 3 | Total |
| Preferred Stock | | | |
|
| | Industrial and miscellaneous | $ | 26,600 |
| $ | — |
| $ | — |
| $ | 26,600 |
|
| Common Stocks | | | | — |
|
| | Industrial and miscellaneous | 631,532 |
| — |
| — |
| 631,532 |
|
| | Mutual funds | 2,076,606 |
| — |
| — |
| 2,076,606 |
|
| | | $ | 2,734,738 |
| $ | — |
| $ | — |
| $ | 2,734,738 |
|
|
| | | | | | | | | | | | |
| December 31, 2010 | Level 1 | Level 2 | Level 3 | Total |
| US Government Securities | $ | — |
| $ | 4,918,527 |
| $ | — |
| $ | 4,918,527 |
|
| US States, territories, possessions | — |
| 457,325 |
| — |
| 457,325 |
|
| US Political subdivisions of states | — |
| 676,997 |
| — |
| 676,997 |
|
| Special revenue and assessment | — |
| 2,003,515 |
| — |
| 2,003,515 |
|
| Industrial and miscellaneous | — |
| 12,759,404 |
| — |
| 12,759,404 |
|
| Mortgage backed | — |
| 12,296,952 |
| — |
| 12,296,952 |
|
| Total bonds | $ | — |
| $ | 33,112,720 |
| $ | — |
| $ | 33,112,720 |
|
|
| | | | | | | | | | | | | |
| | | Level 1 | Level 2 | Level 3 | Total |
| Preferred Stock | | | |
|
| | Industrial and miscellaneous | $ | 12,581 |
| $ | — |
| $ | — |
| $ | 12,581 |
|
| Common Stocks | | | | — |
|
| | Industrial and miscellaneous | 1,121,191 |
| — |
| — |
| 1,121,191 |
|
| | Mutual funds | 1,609,430 |
| — |
| — |
| 1,609,430 |
|
| Total preferred and common stocks | $ | 2,743,202 |
| $ | — |
| $ | — |
| $ | 2,743,202 |
|
| |
Note E - | Property and Equipment |
Property and equipment at December 31, 2011 and 2010 consisted of the following:
|
| | | | | | | | |
| | | | December 31, |
| | | | 2011 | 2010 |
| | Electronic data processing equipment | $ | 1,438,924 |
| $ | 740,632 |
|
| | Furniture and equipment | 93,365 |
| 91,154 |
|
| | Autos | 25,600 |
| 25,600 |
|
| | | 1,557,889 |
| 857,386 |
|
| | Less: Accumulated Depreciation | 427,529 |
| 302,495 |
|
| | | | $ | 1,130,360 |
| $ | 554,891 |
|
Depreciation expense for years ended December 31, 2011 and 2010 was $125,034 and $38,814, respectively.
Note F -Liability for Unpaid Losses and Loss Expenses
Activity in the liabilities for unpaid losses and loss expenses is summarized as follows for:
|
| | | | | | | | |
| | | | December 31, |
| | | | 2011 | 2010 |
| Balance at January 1 | $ | 19,224,000 |
| $ | 12,295,000 |
|
| Less reinsurance recoverable - net | 2,148,000 |
| 1,209,000 |
|
| Net balance at January 1 | 17,076,000 |
| 11,086,000 |
|
| | |
|
|
| Incurred related to | | |
| | Current year | 18,697,000 |
| 15,002,000 |
|
| | Prior years | 1,703,000 |
| 2,401,000 |
|
| | | Total incurred | 20,400,000 |
| 17,403,000 |
|
| | | | | |
| Paid related to | | |
| | Current year | 8,152,000 |
| 5,430,000 |
|
| | Prior year | 9,700,000 |
| 5,983,000 |
|
| | | Total paid | 17,852,000 |
| 11,413,000 |
|
| | | | | |
| Net balance at December 31 | 19,624,000 |
| 17,076,000 |
|
| Plus reinsurance recoverable - net | 4,191,000 |
| 2,148,000 |
|
| Balance at December 31 | $ | 23,815,000 |
| $ | 19,224,000 |
|
As a result of changes in estimated losses incurred with respect to insured events in prior years, during 2011 and 2010, the provision for losses and loss adjustment expenses net of reinsurance recoveries increased by approximately $1,703,000 and $2,401,000, respectively. Changes in estimates of prior year losses incurred were the result of re-estimation of unpaid losses and loss adjustment expenses principally on the commercial auto and trucking lines of business.
The Company follows a procedure of reinsuring a portion of its insurance risks by obtaining reinsurance for areas of exposure beyond specific amounts. As a result, the accompanying statements of operations reflect premiums, losses and loss expense net of related reinsurance.
Contingent liabilities exist with respect to reinsurance ceded which would become an actual liability in the event that the reinsurer is unable to meet their obligations to Gateway under existing reinsurance agreements.
The Company reinsures its commercial auto liability, general liability, and worker’s compensation coverage under excess of loss reinsurance treaties. Additional facultative reinsurance is maintained for certain commercial automobile risks exceeding the maximum policy limits under the excess of loss treaties. For both 2011 and 2010, ceded premiums are based on a percentage of premiums for the excess of loss reinsurance treaties and a fixed amount per unit for the facultative reinsurance.
Effective July 1, 2011 and 2010 the Company’s net aggregate amount insured in any one risk, including worker’s compensation, was $500,000.
The following identifies the ceded components of written and earned premiums for the years ended December 31, 2011 and 2010:
|
| | | | | | | | | | | | |
| | December 31, 2011 | December 31, 2010 |
| | Written | Earned | Written | Earned |
| Direct | $ | 30,369,357 |
| $ | 28,656,702 |
| $ | 24,396,697 |
| $ | 23,238,888 |
|
| Assumed | 137,102 |
| 125,199 |
| 125,302 |
| 119,984 |
|
| Ceded | (4,833,523 | ) | (4,792,644 | ) | (3,367,207 | ) | (3,397,170 | ) |
| Net | $ | 25,672,936 |
| $ | 23,989,257 |
| $ | 21,154,792 |
| $ | 19,961,702 |
|
During the years ended December 31, 2011 and 2010 total liabilities for direct unpaid losses and unpaid loss adjustment expenses were reduced by approximately $4,191,000 and $2,148,000, respectively for insurance reserves ceded to other companies. Reinsurance recoveries on paid and unpaid losses were approximately $3,026,000 and $938,000 during 2011 and 2010, respectively, which are reflected as a decrease in losses and loss adjustment expenses incurred in the consolidated statements of operations and comprehensive income (loss).
Net balances recoverable from reinsurers (comprised of unearned premiums and losses and loss adjustment expenses paid and unpaid, including incurred but not reported amounts) having unsecured portions exceeding 3% of the Company’s total capital and surplus was $3,453,000and $821,000 for the years ended December 31, 2011 and 2010, respectively.
Note H - Income Taxes
Components of Deferred Tax Assets (DTAs) and Deferred Tax Liabilities (DTLs)
|
| | | | | | | | |
| | | | December 31, |
| Description | 2011 | 2010 |
| Gross deferred tax assets | $ | 4,591,863 |
| $ | 2,681,864 |
|
| Gross deferred tax liabilities | (1,651,204 | ) | (888,066 | ) |
| Net deferred tax asset | $ | 2,940,659 |
| $ | 1,793,798 |
|
|
| | | | | | |
| DTAs Resulting From Book/Tax Differences In: | 2011 | 2010 |
| Unpaid losses and LAE | $ | 475,285 |
| $ | 447,746 |
|
| Unearned premiums | 929,376 |
| 814,887 |
|
| AMT credit carry-forwards | 60,195 |
| 30,855 |
|
| NOL carry-forward | 2,870,522 |
| 1,079,574 |
|
| Impaired investments | 169,000 |
| 169,000 |
|
| Bad debt accrual | 63,658 |
| 116,164 |
|
| State income taxes | 20,367 |
| 20,367 |
|
| Contribution carry-forward | 2,999 |
| 2,982 |
|
| Foreign tax credit carry-forward | 460 |
| 289 |
|
| Gross DTAs | $ | 4,591,862 |
| $ | 2,681,864 |
|
| | | |
| DTLs Resulting From Book/Tax Differences In: | | |
| Bond market discount | $ | 25,100 |
| $ | 23,670 |
|
| Accrued dividends | 395 |
| 868 |
|
| Depreciable assets | 245,577 |
| 38,759 |
|
| Unrealized capital gains | 608,765 |
| 158,888 |
|
| Other | 130,846 |
| 135,367 |
|
| Deferred acquisition costs | 640,520 |
| 530,514 |
|
| Gross DTLs | $ | 1,651,203 |
| $ | 888,066 |
|
Reconciliation of Federal Income Tax Rate to Actual Effective Rate
The provision for federal income taxes incurred is different from that which would be obtained by applying the statutory federal income rate to income before income taxes. The significant items causing this difference are as follows:
|
| | | | | | | | |
| | | Tax Effect at | Effective |
| Description | Amount | 34% | Tax Rate |
| Loss before taxes | $ | (4,700,080 | ) | $ | (1,598,027 | ) | 34.00 | % |
| Non-deductible expenses | 38,522 |
| 13,097 |
| (0.28 | )% |
| Tax exempt interest and DRD, net of proration | (46,130 | ) | (15,684 | ) | 0.33 | % |
| Other | 90,506 |
| 30,772 |
| (0.65 | )% |
| Total | $ | (4,617,182 | ) | $ | (1,569,842 | ) | 33.40 | % |
Operating Loss and Tax Credit Carry-forwards
At December 31, 2011, the Company had approximately $8,400,000 million in net operating loss carry-forwards available to offset against future taxable income. These losses expire through the year 2031.
Consolidated Federal Income Tax Return
Camelot Services, Inc. is the parent company of an affiliated group of companies and files a consolidated federal income tax return with the following entity:
Gateway Insurance Company
The method of allocation among companies is subject to a written agreement, approved by the Board of Directors, whereby allocation is made primarily on a separate return basis with current credit for any net operating losses or other items utilized in the consolidated tax return.
Note I -Transactions with Related Party and Affiliates
On June 29, 2011, Hendricks contributed $4,360,000 of paid-in capital to Camelot. On June 30, 2011, Camelot contributed the $4,360,000 to Gateway as additional paid-in capital.
On January 29, 2010, Hendricks contributed $3,000,000 of additional paid-in capital to Camelot. On February 1, 2010, Camelot contributed the $3,000,000 to Gateway as additional paid-in capital.
On December 15, 2010, Camelot entered into a long-term note agreement with Hendricks. The principal amount borrowed under the note agreement is $1,500,000 and bears interest at an annual rate of 8.66%. Principal and interest payments commenced on January 15, 2011 and are due in sixty monthly installments of $30,887. During 2011 the Company paid $120,039 in interest expense to Hendricks.
Gateway has marketing and sales agreements with two companies affiliated by common ownerships; Insential Inc. (Insential) and American Westbrook Insurance Services (AWIS). AWIS acquired all of the assets of American Patriot Insurance Agency (APIA), effective January 1, 2010. Agreements with Insential and AWIS (formerly APIA) were entered into for the purpose of producing premium in the workers compensation and general liability lines of business associated with the contractor industry.
During 2011, commissions earned on written premium produced by Insential and AWIS was $237,811 and $177,508, respectively. During 2010, commissions earned on written premium by Insential and AWIS was $200,920 and $108,630, respectively.
At December 31, 2011, there were no amounts due from Insential and AWIS. At December 31, 2010, amounts due from Insential and AWIS were $24,483 and $29,530, respectively.
| |
Note J - | Gateway Statutory Dividend Restriction |
The maximum amount of dividends which can be paid by Gateway to its shareholder without prior approval of the Department of Insurance of the State of Missouri is limited to the greater of 10% of surplus (as of the preceding December 31) or the Company’s
net income from the previous year. All dividends must be paid from earned surplus.
There were no dividends paid during the years ended December 31, 2011 and 2010.
Gateway sponsors a 401(k) Retirement Savings Plan (RSP) for employees. All active full-time employees who are age twenty-one or over and have completed six months of service are eligible for the RSP. In addition to employee contributions to the RSP, Gateway also makes contributions to individuals’ accounts.
Gateway matched 50% up to the first 6% of the employee’s contribution, a maximum of 3% per employee during 2011 and 2010. Gateway contributed $83,540 and $71,697 to the RSP during 2011 and 2010, respectively.
| |
Note L - | Statutory Disclosures |
Gateway is subject to regulation by the Missouri Department of Insurance, Financial Institutions and Professional Registration (the “Department”). Those regulations, in part, prescribe certain accounting methods for statutory purposes. As of December 31, 2011 and 2010, Gateway’s statutory assets, statutory surplus, and statutory net income (loss), as filed with the Department, were as follows:
|
| | | | | | |
| | 2011 | 2010 |
| Statutory assets | $ | 53,519,238 |
| $ | 48,739,608 |
|
| Statutory surplus | 16,326,527 |
| 16,843,106 |
|
| Statutory net income (loss) | (4,886,671 | ) | (3,436,973 | ) |
| |
Note M- | Commitments and Contingencies |
The Company is subject to guaranty funds and other assessments by the states in which it writes business. Guaranty fund assessments are accrued at the time of insolvencies. At December 31, 2011 and 2010, the Company has accrued a liability for guaranty funds and other assessments of $8,246 and $8,656, respectively, and a liability for worker’s compensation assessments of $99,603 and $48,013, respectively. This represents management’s best estimate based on information received from states in which the Company writes business and may change due to factors including the company’s share of the ultimate cost of current insolvencies. During 2011 and 2010, there were no material insolvencies to report.
Various lawsuits against the Company have arisen in the course of business. Contingent liabilities arising from litigation, income taxes and other matters are not considered material in relation to the financial position of the Company.
The Company leases office equipment, furniture and property under various non-cancelable operating lease agreements that expire through February 2016. Rental expense for 2011 and 2010 was approximately $567,365 and $417,842, respectively.
At December 31, 2011, the minimum aggregate rental commitments are as follows:
|
| | | | | | | | | |
| Year ending December 31 | Rental Space | Equipment | Total |
| 2012 | $ | 334,201 |
| $ | 536,253 |
| $ | 870,454 |
|
| 2013 | 341,808 |
| 536,253 |
| 878,061 |
|
| 2014 | 337,412 |
| 490,912 |
| 828,324 |
|
| 2015 | 341,752 |
| 418,274 |
| 760,026 |
|
| 2016 | 57,138 |
| 253,218 |
| 310,356 |
|
| |
Note N - | Concentration of Credit Risk |
The Company maintains cash balances with several lending institutions in excess of the Federal Deposit Insurance limits.
At December 31, 2011, the Company did not have any bonds with a carrying value exceeding 10% of statutory surplus.
| |
Note O - | Supplemental Disclosure of Cash Flow Information |
Cash paid (recovered) during the years ended December 31:
|
| | | | | | |
| | 2011 | 2010 |
| Interest | $ | 120,039 |
| $ | — |
|
| Income taxes recovered, net | (527,944 | ) | (108,972 | ) |
| |
Note P - | Discontinued Operations |
Effective November 6, 2006, Gateway discontinued its Private Passenger Automobile line of business. Previously, in July 2003, Gateway discontinued the Truck Liability and Hospitality/General Liability Programs. Results of the discontinued operations of these programs are included in the Company’s consolidated statement of operations until all open claims have been closed. The income (loss) related to discontinued operations included in the Company’s consolidated statement of operations and comprehensive income (loss) for the years ended December 31, 2011 and 2010 are $4,256 and $(27,826), respectively.
Note Q- Change in Estimates and Sale of Company (Unaudited)
The Company experienced significant claim loss development in 2012 primarily related to the 2011 accident year. Accordingly, the Company recorded additional claim reserves of $5 million during the third calendar quarter related to 2011 and prior accident years.
In October 2012, the Company signed a stock purchase agreement to sell 100% of its outstanding shares to a strategic buyer. The transaction is estimated to close January 1, 2013 subject to regulatory approval and other closing conditions. The Company’s income tax net operating loss carry-forwards will be limited in the transaction. Accordingly, the Company has recorded a full valuation allowance of approximately $3 million on its net deferred tax assets as of September 30, 2012.
The table below summarizes these changes in estimates as if they were reflected in 2011 (in millions).
|
| | | | | | | | |
| | 2011 Balances | Adjustments for | Pro Forma 2011 |
| Description | (audited) | Changes in Estimates | Balances |
| Total Assets | $ | 64 |
| $ | (3 | ) | 61 |
|
| Total Liabilities | 42 |
| 5 |
| 47 |
|
| Shareholder’s Equity | 22 |
| (8 | ) | 14 |
|
| Net Loss | (3 | ) | (8 | ) | (11 | ) |
Camelot Services, Inc.
and Subsidiary
Condensed Consolidated Financial Statements
(Unaudited)
September 30, 2012
Table of Contents
Page
Condensed Consolidated Financial Statements (Unaudited)
Condensed Consolidated Balance Sheet F-38
Condensed Consolidated Statements of Operations and Comprehensive Income (Loss) F-40
Condensed Consolidated Statements of Changes in Shareholder's Equity F-41
Condensed Consolidated Statements of Cash Flows F-42
Notes to Condensed Consolidated Financial Statements F-43
**All amounts in whole dollars
|
| | | |
| CAMELOT SERVICES, INC. AND SUBSIDIARY | |
| | |
| Condensed Consolidated Balance Sheets (Unaudited) | |
| September 30, 2012 | |
| | |
| | |
| | 2012 |
| ASSETS | |
| Investments and Cash | |
| Cash and cash equivalents | $ | 8,931,207 |
|
| Fixed maturities available-for-sale at fair | |
| value (amortized cost $32,712,947) | 35,608,298 |
|
| Equity securities available-for-sale at fair value | |
| (cost of $3,096,353 at 2012) | 3,075,945 |
|
| | |
| Total Investments and Cash | 47,615,450 |
|
| | |
| Receivables | |
| Premium and agent balances receivable, net of | |
| allowance of $451,395 at 2012 and $309,672 at 2011 | 10,226,302 |
|
| Reinsurance recoverable on loss and loss | |
| adjustment expense | 5,741,291 |
|
| Premium taxes recoverable | 121,047 |
|
| Interest and dividends accrued | 228,185 |
|
| | |
| Total Receivables | 16,316,825 |
|
| | |
| Other Assets | |
| Deferred policy acquisition costs | 1,676,298 |
|
| Property and equipment, net | 978,876 |
|
| Other assets | 241,679 |
|
| | |
| Total Other Assets | 2,896,853 |
|
| | |
| TOTAL ASSETS | $ | 66,829,128 |
|
| | |
| | |
| | |
| | |
| The accompanying notes are an integral part of these | |
| condensed consolidated financial statements. | |
|
| | | |
| | |
| | |
| | 2012 |
| LIABILITIES AND SHAREHOLDER’S EQUITY | |
| LIABILITIES | |
| Reserve for losses and loss | |
| adjustment expenses | $ | 30,870,605 |
|
| Unearned premiums | 11,946,177 |
|
| Accounts payable and accrued expenses | 3,558,155 |
|
| Note payable, related party | 1,050,511 |
|
| | |
| Total Liabilities | 47,425,448 |
|
| | |
| | |
| | |
| | |
| SHAREHOLDER’S EQUITY | |
| Common stock, $1 stated value; | |
| 40,000 shares authorized; 500 shares | |
| issued and outstanding | 500 |
|
| Additional paid-in capital | 30,927,805 |
|
| Retained deficit | (13,491,442 | ) |
| Accumulated other comprehensive income | 1,966,817 |
|
| | |
| Total Shareholder’s Equity | 19,403,680 |
|
| | |
| TOTAL LIABILITIES AND SHAREHOLDER’S | |
| EQUITY | $ | 66,829,128 |
|
| | |
|
| | | | | | |
| CAMELOT SERVICES, INC. AND SUBSIDIARY | | |
| | | |
| Condensed Consolidated Statements of Operations and Comprehensive Loss (Unaudited) |
| Nine months ended September 30, 2012 and 2011 | |
| | | |
| | | |
| | 2012 | 2011 |
| Revenues | | |
| Premiums earned, net | $ | 19,148,097 |
| $ | 17,798,619 |
|
| Investment income, net of expenses | 929,991 |
| 907,398 |
|
| Realized gains (losses) on investments | (89,919 | ) | 225,706 |
|
| | | |
| Total revenues | 19,988,169 |
| 18,931,723 |
|
| | | |
| Expenses | | |
| Losses and loss adjustment expenses | 19,108,813 |
| 12,925,232 |
|
| Other underwriting expenses | 7,495,676 |
| 6,806,081 |
|
| | | |
| Total expenses | 26,604,489 |
| 19,731,313 |
|
| | | |
| | | |
| Other expense | 200,541 |
| 31,380 |
|
| | | |
| Total other expense | 200,541 |
| 31,380 |
|
| | | |
| Loss before provision for | | |
| income taxes | (6,816,861 | ) | (830,970 | ) |
| | | |
| Income Taxes | | |
| Deferred income tax expense (benefit) | 2,641,304 |
| (93,414 | ) |
| | | |
| Total income tax expense (benefit) | 2,641,304 |
| (93,414 | ) |
| | | |
| NET LOSS | (9,458,165 | ) | (737,556 | ) |
| | | |
| OTHER COMPREHENSIVE INCOME (LOSS) | | |
| | | |
| Unrealized holding gains (losses) arising | | |
| during the period, net of tax | 725,749 |
| 803,111 |
|
| | | |
| Less: reclassification adjustment for (gains)/losses | | |
| included in net income, net of tax | 59,347 |
| (148,966 | ) |
| | | |
| Other comprehensive income (loss), net of tax | 785,096 |
| 654,145 |
|
| | | |
| COMPREHENSIVE LOSS | $ | (8,673,069 | ) | $ | (83,411 | ) |
| | | |
| The accompanying notes are an integral part of these | | |
| condensed consolidated financial statements. | | |
|
| | | | | | | | | | | | | | | |
| CAMELOT SERVICES, INC. AND SUBSIDIARY | | | |
| | | | | | |
| Consolidated Statements of Changes in Shareholder’s Equity | |
| Nine Months ended September 30, 2012 and 2011 | | | | |
| | | | | | |
| | | | | Accumulated | |
| | | Additional | Retained | Other | |
| | Common | Paid-In | Earnings | Comprehensive | |
| | Stock | Capital | (Deficit) | Income | Total |
| | | | | | |
| Balance at December 31, 2010 | $ | 500 |
| $ | 20,567,805 |
| $ | (903,039 | ) | $ | 308,431 |
| $ | 19,973,697 |
|
| | | | | | |
| Net loss | — |
| — |
| (737,556 | ) | — |
| (737,556 | ) |
| | | | | | |
| Additional paid-in capital | — |
| 4,360,000 |
| — |
| — |
| 4,360,000 |
|
| | | | | | |
| Net unrealized gains on securities | | | | | |
| available-for-sale securities, net of | | | | | |
| deferred income taxes of $336,984 | — |
| — |
| — |
| 654,145 |
| 654,145 |
|
| | | | | | |
| Balance at September 30, 2011 | 500 |
| 24,927,805 |
| (1,640,595 | ) | 962,576 |
| 24,250,286 |
|
| | | | | | |
| Balance at December 31, 2011 | 500 |
| 24,927,805 |
| (4,033,277 | ) | 1,181,721 |
| 22,076,749 |
|
| | | | | | |
| Net loss | — |
| — |
| (9,458,165 | ) | — |
| (9,458,165 | ) |
| | | | | | |
| Additional paid-in capital | — |
| 6,000,000 |
| — |
| — |
| 6,000,000 |
|
| | | | | | |
| Net unrealized gains on securities | | | | | |
| available-for-sale securities, net of | | | | | |
| deferred income taxes of $299,355 | — |
| — |
| — |
| 785,096 |
| 785,096 |
|
| | | | | | |
| Balance at September 30, 2012 | $ | 500 |
| $ | 30,927,805 |
| $ | (13,491,442 | ) | $ | 1,966,817 |
| $ | 19,403,680 |
|
| | | | | | |
| | | | | | |
| | | | | | |
| The accompanying notes are an integral part of these consolidated financial statements. | | |
|
| | | | | | |
| CAMELOT SERVICES, INC. AND SUBSIDIARY | | |
| | | |
| Condensed Consolidated Statements of Cash Flows (Unaudited) |
| Nine months ended September 30, 2012 and 2011 | | |
| | | |
| | 2012 | 2011 |
| Cash flows from operating activities | | |
| Net loss | $ | (9,458,165 | ) | $ | (737,556 | ) |
| Adjustments to reconcile net loss to net cash provided (used) by operating activities | | |
| Realized (gains) losses on sale of investments | 89,919 |
| (225,707 | ) |
| Depreciation | 163,987 |
| 29,518 |
|
| Net amortization of investment premiums and discounts | 118,517 |
| 106,882 |
|
| Deferred income taxes | 2,641,304 |
| (93,414 | ) |
| (Increase) decrease in operating assets: | | |
| Premiums and agent balances receivable | (631,981 | ) | (1,557,030 | ) |
| Reinsurance recoverable on loss and loss adjustment expense | (2,006,910 | ) | (570,602 | ) |
| Interest and dividends accrued | 70,383 |
| 53,530 |
|
| Taxes recoverable | 7,709 |
| 525,501 |
|
| Receivable for securities | 306,938 |
| — |
|
| Policy acquisition costs deferred | 207,583 |
| (515,467 | ) |
| Other assets | 46,787 |
| 85,307 |
|
| Increase in operating liabilities: | | |
| Reserve for losses and loss adjustment expenses | 7,055,409 |
| 877,053 |
|
| Unearned premiums | (1,787,401 | ) | 3,072,563 |
|
| Accounts payable and accrued expenses | 223,879 |
| 135,007 |
|
| | | |
| Net cash provided by (used in) operating activities | (2,952,042 | ) | 1,185,585 |
|
| | | |
| Cash flows from investing activities | | |
| Purchases of property and equipment | (12,497 | ) | (658,801 | ) |
| Proceeds from sales of investments | 6,330,153 |
| 8,401,536 |
|
| Purchases of investments | (1,637,819 | ) | (13,376,818 | ) |
| | | |
| Net cash provided by (used in) investing activities | 4,679,837 |
| (5,634,083 | ) |
| | | |
| Cash flows from financing activities | | |
| Additional paid-in capital | 6,000,000 |
| 4,360,000 |
|
| Payments on long-term debt | (198,884 | ) | (180,504 | ) |
| | | |
| Net cash provided by financing activities | 5,801,116 |
| 4,179,496 |
|
| | | |
| INCREASE (DECREASE) IN CASH AND CASH EQUIVALENTS | 7,528,911 |
| (269,002 | ) |
| | | |
| Cash and cash equivalents, beginning of year | 1,402,296 |
| 3,215,860 |
|
| | | |
| Cash and cash equivalents, end of year | $ | 8,931,207 |
| $ | 2,946,858 |
|
| | | |
| Supplemental Cash Flow Information | | |
| Cash paid for interest | $ | 73,689 |
| $ | 92,069 |
|
| | | |
| The accompanying notes are an integral part of these condensed consolidated financial statements. | |
CAMELOT SERVICES, INC.
Notes to Condensed Consolidated Financial Statements
September 30, 2012 (Unaudited)
**All amounts in whole dollars
| |
Note A - | Nature of Business |
Camelot Services, Inc. (“Camelot” or the “Company”) is a wholly-owned subsidiary of Hendricks Holding Company, Inc. (“Hendricks”) and is the parent company of Gateway Insurance Company (“Gateway”). The Company specializes in Commercial Lines of business by offering three niche programs. The Public Auto Program has many years of experience in writing the Commercial Auto line of business for small to mid-size taxi and limousine drivers. In 2007, Gateway began writing business in the Contractors Program that specializes in the General Liability, Commercial Auto and Workers Compensation lines of business for roofing contractors. In 2008, Gateway began writing business in the Long-Haul Truck Program that specializes in the Commercial Auto, Cargo, and General Liability lines of business for small to mid-size truckers. Gateway maintains insurance licenses in 47 states, including the District of Columbia.
| |
Note B - | Summary of Significant Accounting Policies |
The Company's significant accounting policies have remained unchanged from December 31, 2011 and 2010, respectively. Refer to the audited consolidated financial statements as of December 31, 2011 and 2010 for a complete summary of the Company's significant accounting policies.
Subsequent Events
On October 25, 2012, Hendricks announced that it had entered into a stock purchase agreement to sell Camelot and its sole insurance subsidiary, Gateway to Atlas Financial Holdings, Inc. Completion of the transaction is subject to customary closing conditions, including regulatory approval of the change of control of Gateway, and is expected to be completed during the first quarter of 2013.
Note C -Investments
The following information summarizes the difference between amortized cost and fair value of invested assets as of September 30, 2012:
|
| | | | | | | | | | | | |
| September 30, 2012 | Amortized Cost | Gross Unrealized Gains | Gross Unrealized Losses | Fair Value |
| US Government Securities | $ | 4,073,053 |
| $ | 467,721 |
| $ | — |
| $ | 4,540,774 |
|
| US States, territories, possessions | 1,558,079 |
| 122,462 |
| — |
| 1,680,541 |
|
| US Political subdivisions of states | 1,055,616 |
| 49,614 |
| — |
| 1,105,230 |
|
| Special revenue and assessment | 1,886,110 |
| 146,219 |
| — |
| 2,032,329 |
|
| Industrial and miscellaneous | 8,481,568 |
| 971,874 |
| — |
| 9,453,442 |
|
| Mortgage backed | 15,658,521 |
| 1,146,437 |
| 8,976 |
| 16,795,982 |
|
| Total fixed income investments | $ | 32,712,947 |
| $ | 2,904,327 |
| $ | 8,976 |
| $ | 35,608,298 |
|
| | | | | |
|
| | | | | | | | |
| Preferred stock | 6,800 |
| 10,200 |
| — |
| 17,000 |
|
| Common stock | 3,089,553 |
| 148,638 |
| 179,246 |
| 3,058,945 |
|
| Total equity securities | 3,096,353 |
| 158,838 |
| 179,246 |
| 3,075,945 |
|
| Total invested assets | 35,809,300 |
| 3,063,165 |
| 188,222 |
| 38,684,243 |
|
The Company monitors its investment securities to identify impairments in value. The Company evaluates factors such as financial condition of the issuer, payment performance, the length of time and the extent to which the estimated fair value has been below amortized cost, general market conditions, intent and ability to hold securities, and various other subjective factors. Based on management’s judgment, securities with other-than-temporary impairment in value are written down to management’s estimate of fair value. Included in investment related losses are other-than-temporary write-downs of equity securities of $204,000 at September 30, 2012.
Note D -Fair Value Measurements
There have been no significant changes to fair value measurements since December 31, 2011 and 2010.
| |
Note E - | Liability for Unpaid Losses and Loss Expenses |
As a result of changes in estimated losses incurred with respect to insured events in prior years, during the nine months ended September 30, 2012 and 2011, the provision for losses and loss adjustment expenses, net of reinsurance recoveries, increased by approximately $4,959,000 and $1,173,000, respectively. Changes in estimates of prior year losses incurred were the result of re-estimation of unpaid losses and loss adjustment expenses principally on the commercial auto and trucking lines of business.
Activity in the liabilities for unpaid losses and loss expenses for September 30 is summarized as follows:
|
| | | | | | |
| | 2012 | 2011 |
| Balance at January 1 | $ | 23,815,000 |
| $ | 19,224,000 |
|
| Less reinsurance recoverable - net | 4,191,000 |
| 2,148,000 |
|
| | $ | 19,624,000 |
| $ | 17,076,000 |
|
| Incurred related to: | | |
| Current Year | 14,150,000 |
| 11,752,000 |
|
| Prior Year | 4,959,000 |
| 1,173,000 |
|
| | 19,109,000 |
| 12,925,000 |
|
| Paid related to: | | |
| Current Year | 3,628,000 |
| 4,582,000 |
|
| Prior Year | 9,975,000 |
| 8,117,000 |
|
| | 13,603,000 |
| 12,699,000 |
|
| Net balance at September 30 | $ | 25,130,000 |
| $ | 17,302,000 |
|
| Plus reinsurance recoverable - net | 5,741,000 |
| 2,799,000 |
|
| Balance at September 30 | $ | 30,871,000 |
| $ | 20,101,000 |
|
The Company has no significant changes to its reinsurance arrangements since December 31, 2011.
|
| | | | |
| September 30, 2012 | | |
| Expected income tax benefit at statutory rate | (2,317,732 | ) | 34.00 | % |
| Valuation allowance | 4,961,107 |
| (72.78 | )% |
| Nondeductible expenses | 9,822 |
| (0.14 | )% |
| Other | (11,893 | ) | 0.17 | % |
| Total | 2,641,304 |
| (38.75 | )% |
|
| | | | |
| September 30, 2011 | | |
| Expected income tax benefit at statutory rate | (282,530 | ) | 34.00 | % |
| Valuation allowance | — |
| — | % |
| Nondeductible expenses | — |
| — | % |
| Other | 186,116 |
| (22.76 | )% |
| Total | (96,414 | ) | 11.24 | % |
Income tax expense consists of the following for the period ending September 30:
|
| | | | |
| | 2012 | 2011 |
| Deferred tax expense (benefit) | 2,641,304 |
| (93,414 | ) |
The components of the Company’s deferred tax assets and liabilities as of September 30 are as follows:
|
| | | | |
| | 2012 | 2011 |
| Deferred tax assets: | | |
| Unpaid claims and unearned premiums | 1,476,929 |
| 1,449,693 |
|
| Loss carry-forwards | 4,856,636 |
| 1,175,045 |
|
| Bad debts | 153,476 |
| 105,288 |
|
| Other | 322,511 |
| 220,511 |
|
| Valuation allowance | (4,961,107 | ) | — |
|
| Total deferred tax assets, net of allowance | 1,848,445 |
| 2,950,537 |
|
| | |
| Deferred tax liabilities: | | |
| Investment securities | 934,320 |
| 519,544 |
|
| Deferred policy acquisition costs | 569,942 |
| 705,772 |
|
| Other | 344,183 |
| 174,994 |
|
| Total gross deferred tax liabilities | 1,848,445 |
| 1,400,310 |
|
| Net deferred tax assets | — |
| 1,550,227 |
|
Note H - Transactions with Related Party and Affiliates
On July 16, 2012, Hendricks contributed $6,000,000 of paid-in capital to Camelot. On July 17, 2012, Camelot contributed the $6,000,000 to Gateway as additional paid-in capital.
On June 29, 2011, Hendricks contributed $4,360,000 of paid-in capital to Camelot. On June 30, 2011, Camelot contributed the $4,360,000 to Gateway as additional paid-in capital.
On December 15, 2010, Camelot entered into a long-term note agreement with Hendricks. The principal amount borrowed under the note agreement is $1,500,000 and bears interest at an annual rate of 8.66%. Principal and interest payments commenced on January 15, 2011 and are due in sixty monthly installments of $30,887. The Company paid $73,689 and $92,069 in interest expense to Hendricks during the nine month periods September 30, 2012 and 2011, respectively.
Gateway has marketing and sales agreements with two companies affiliated by common ownerships; Insential Inc. (Insential) and
American Westbrook Insurance Services (AWIS). AWIS acquired all of the assets of American Patriot Insurance Agency (APIA), effective January 1, 2010. Agreements with Insential and AWIS (formerly APIA) were entered into for the purpose of producing premium in the workers compensation and general liability lines of business associated with the contractor industry.
During the nine months ended September 30, 2012, commissions earned on written premium produced by Insential and AWIS was $234,198 and $149,839, respectively.
There were no amounts due from Insential and AWIS at September 30, 2012.
Part II
INFORMATION NOT REQUIRED IN PROSPECTUS
|
| |
| Item 13. | Expenses Relating to this Offering |
The following table sets forth the costs and expenses, other than underwriting discounts and commissions, if any, payable by our company relating to the sale of ordinary shares being registered. All amounts are estimates except the SEC registration fee.
| | | SEC registration fee | $ | 4,467 |
| $ | 1,691 |
|
| Printing and engraving expenses | 10,000 |
| 5,000 |
|
| Legal fees and expenses | 650,000 |
| 40,000 |
|
| Accounting fees and expenses | 100,000 |
| 10,000 |
|
| Miscellaneous expenses | 20,000 |
| 10,000 |
|
| | $ | 784,467 |
| $ | 66,691 |
|
Expenses related to this offering excluding underwriting discounts and selling commissions, shall be shared between the Company andpaid by the selling shareholder such that each of the Company and the selling shareholder will pay that amount of the aggregate expenses proportionateeither directly or by reimbursement to the number of shares that such party sells in this offering.
Company.
|
| |
| Item 14. | Indemnification of Directors and Officers |
Cayman Islands law does not limit the extent to which a company’scompany's articles of association may provide for indemnification of officers and directors, except to the extent any such provision may be held by the Cayman Islands courts to be contrary to public policy, such as a provision purporting to provide indemnification against civil fraud or the consequences of committing a crime.
Our memorandum and articles of association permit indemnification of officers and directors against all actions, proceedings, costs, charges, expenses, losses, damages or liabilities incurred or sustained in their capacities as such unless such losses or damages arise from breach of trust, breach of duty, dishonesty, fraud or willful default of such directors or officers.
We have entered into indemnification agreements with our directors and senior executive officers that provide such persons with additional indemnification beyond that provided in our memorandum and articles of association.
Our company also maintains a directors and officers liability insurance policy for our directors and officers.
Insofar as indemnification for liabilities arising under the Securities Act may be permitted with respect to our directors or officers or persons controlling us under the foregoing provisions, our company has been informed that in the opinion of the SEC such indemnification is against public policy as expressed in the Securities Act and is therefore unenforceable as a matter of United States law.
|
| |
| Item 15. | Recent Sales of Unregistered Securities |
We were formed as JJR VI, a Canadian capital pool company, on December 21, 2009 under the laws of Ontario, Canada. On December 31, 2010, following the reverse merger transaction described immediately hereafter, we filed a Certificate of Registration by Way of Continuation in the Cayman Islands to redomesticate as a Cayman Islands company. In addition, on December 30, 2010 we filed a Certificate of Incorporation on Change of Name to change our name to Atlas Financial Holdings, Inc. All references to share counts and per share values in connection with the reverse merger transaction are presented prior to the one-for-three reverse split. Our current organization is a result of a reverse merger transaction involving the following companies:
|
| | |
| (a) | JJR VI, sponsored by JJR Capital, a Toronto based merchant bank; |
| |
| (b) | American Insurance Acquisition Inc., or American Acquisition, a corporation formed under the laws of Delaware as a wholly owned subsidiary of Kingsway America Inc., or KAI. KAI is a wholly owned subsidiary of Kingsway Financial Services Inc., or KFSI, a Canadian public company formed under the laws of Ontario and whose shares are traded on the Toronto and New York Stock Exchanges; and |
| |
| (c) | Atlas Acquisition Corp., a Delaware corporation wholly-owned by JJR VI and formed for the purpose of merging with and into American Acquisition. |
Prior to the transaction, each of American Service and American Country were wholly owned subsidiaries of KAI. In connection with the reverse merger transaction, KAI transferred 100% of the capital stock of each of American Service and American Country, to American Acquisition (another wholly owedowned subsidiary of KAI) in exchange for C$35.1 million of common and C$18.0 million of preferred shares of American Acquisition and promissory notes worth C$7.7 million, aggregating C$60.8 million. In addition, American Acquisition raised C$8.0 million through a private placement offering of subscription receipts to qualified investors at a price of C$2.00 per subscription receipt.
All references to share counts and per share values in connection with the reverse merger transaction are presented prior to the one-for-three reverse stock split. KAI received 13,804,861 restricted voting common shares of our company, which we refer to as “restricted voting shares”, then valued at $27.8 million, along with 18,000,000 non-voting preferred shares of our company then valued at C$18.0 million and C$8.0 million cash in exchange for total consideration of C$60.8 million in the form of 100% of the outstanding shares of American Acquisition and full payment of certain promissory notes. Investors in the American Acquisition private placement offering of subscription receipts received 3,983,502 of our ordinary shares, which we refer to as “ordinary shares”, plus warrants to purchase one ordinary share of our company for each subscription receipt at C$2.00 at any time until December 31, 2013. Every 10 common shares of JJR VI held by the shareholders of JJR VI immediately prior to the reverse merger were, upon consummation of the merger, consolidated into one ordinary share of JJR VI. Upon redomestication in the Cayman Islands, these consolidated shares were then exchanged on a one-for-one basis for our ordinary shares.
Options
All references to share counts and per share values in connection with options granted prior to the reverse merger transaction are presented prior to the one-for-three reverse stock split. On March 18, 2010, JJR VI issued options to purchase 83,333250,000 ordinary shares to the agent that assisted JJR VI in raising capital (the “IPO agent”) and options to purchase 356,6671,070,000 shares to directors. All of the options were vested at the date of grant. Options to purchase 71,333214,000 shares held by directors expired before the merger as a result of a director resignation. All outstanding JJR VI options were exchanged for Atlas options without modification on the basis of 1 Atlas option for each 10 JJR VI options and the exercise price was changed from C$0.300.10 to C$3.00,1.00, which was on the same basis as the JJR VI exchange ratio for shares, and thus did not represent any additional value or related expense. This resulted in 8,33325,000 and 28,53485,600 Atlas options for the agent and former JJR VI directors, respectively, outstanding after the merger. In total, 24,00872,024 of these options were exercised in 2011. The options granted on March 18, 2010 have an aggregate intrinsic value of $39,000 as of December 31, 2011. On January 6, 2011, we adopted a stock option plan in order to advance our interests by providing incentives to eligible persons defined in the plan. The maximum number of ordinary shares reserved for issuance under the plan together with all other security based plans is equal to 10% of issued and outstanding ordinary shares at the date of grant.
The exercise price of options granted under the plan cannot be less than the volume weighted average trading price of our ordinary shares for the five preceding trading days. Options generally vest over a three year period and expire ten years from grant date. On January 18, 2011, we granted options to purchase 123,250 ordinary shares to officers and directors at an exercise price of C$6.00 per share. The options vest 25% at date of grant and 25% on each of the next three anniversary dates and expire on January 18, 2021. The weighted average grant date fair value of the options is $1.24 per share. As of September 30, 2012 the options had no aggregate intrinsic value.
On January 11, 2013, Atlas granted options to purchase 91,667 ordinary shares under the Company’sCompany's stock option plan, all of which were granted to the Company’sCompany's officers. The granted options have an exercise price of C$6.45 and vest equally on the first, second and third anniversary of the grant date. The options expire on January 11, 2023.
Warrants
Pursuant to the private placement, 1,327,8343,983,502 warrants to purchase one ordinary voting share per warrant. All theThere are 1,190,405 warrants were still outstanding at September 30, 2012 andthe date of this prospectus, all of which expire on December 31, 2013.
|
| |
| Item 16. | Exhibits and Financial Statement Schedules |
Item 16.Exhibits and Financial Statement Schedules
(a) Exhibits.
|
| |
| |
| Exhibit | Description |
1.014.11 | Specimen Ordinary Share Certificate |
4.21 | Specimen Warrant Agreement |
| 5.1 | Opinion of Conyers Dill & Pearman (Cayman) Limited |
10.11 | Atlas Financial Holdings, Inc. Stock Option Plan dated January 6, 2011 |
10.21 | Form of Atlas Employment Agreement for Executive Management, updated January 1, 2012 |
10.31 | Employee Share Purchase Plan Agreement, as adopted June 1, 2011 |
10.41 | Defined Contribution Plan Document dated August 11, 2011 |
| 10.5 | Transition Services Agreement between Kingsway Financial Services, Inc. and American Insurance Acquisition, Inc., dated December 31, 2010 (incorporated by reference from our annual report on Form 10-K/A for the year ended December 31, 2011 (amendment no. 1), filed on May 5, 2012) |
10.62 | 150 Northwest Point - Sale Agreement |
10.72 | 150 Northwest Point - Sale Agreement, Amendment 1 |
10.82 | 150 Northwest Point - Sale Agreement, Amendment 2 |
10.92 | 150 Northwest Point - Lease Agreement |
| 10.10 | Stock Purchase Agreement among Atlas Financial Holdings, Inc., and Hendricks Holding Company, Inc. dated as of October 24, 2012
(incorporated by reference from our current report on Form 8-K filed October 31, 2012) |
1.02* | Form of Underwriting Agreement |
3.1 | Memorandum of Association of Atlas Financial Holdings, dated December 24, 2010. |
3.1 | Restated Certificate of Incorporation of American Country Insurance Company, Inc., as amended as of February 13, 2004 |
3.1 | Restated Certificate of Incorporation of American Service Insurance, Inc., as amended as of June 15, 2009 |
3.1 | Restated Certificate of Incorporation of American Insurance Acquisition, Inc., as amended December 31, 2010 |
4.1 | Memorandum of Association of Atlas Financial Holdings, dated December 24, 2010, included in item 3.1a |
4.1 | By-laws of American Country Insurance Company, Inc., as amended September 14, 2005 |
4.1 | By-laws of American Service Insurance, Inc., as amended September 20, 2005 |
4.1 | By-laws of American Insurance Acquisition, Inc., as amended July 9, 2010 |
4.2 | Specimen Ordinary Share Certificate |
4.3 | Specimen Warrant Agreement |
5.1+
| Opinion of Conyers Dill & Pearman Ltd. |
10.110.11 | Atlas Financial Holdings, Inc. Stock Option2013 Equity Incentive Plan dated January 6, 2011(incorporated by reference from our proxy statement relating to our 2013 annual meeting of shareholders, filed May 7, 2013) |
10.210.12 | Form of Atlas Employment Agreement for Executive Management, updated January 1, 2012 |
10.3
| Employee Share Purchase Plan Agreement, as adopted June 1, 2011 |
10.4 | Defined Contribution Plan Document dated August 11, 2011 |
10.5 | Transition ServicesSale Agreement between KingswayAtlas Financial Services, Inc and American Insurance Acquisition,Holdings, Inc., dated December 31, 2010 |
10.6 | Program Manager Agreement between American Service Insurance Company and both Universal Casualty Company and Kingsway America, Inc., dated JanuaryAugust 1, 20112013 (incorporated by reference from our current report on Form 8-K filed August 1, 2013) |
10.710.13 | 150 Northwest Point - Sale AgreementDirector Compensation and Stock Ownership Guidelines (incorporated by reference from our current report on Form 8-K filed June 20, 2013) |
10.810.14 | 150 Northwest Point - Sale Agreement, Amendment 1 |
10.9 | 150 Northwest Point - Sale Agreement, Amendment 2 |
10.10 | 150 Northwest Point - Lease Agreement |
10.11* | Form of Lock-Up Agreement entered into with our directors, executive officersto Director Compensation and the selling shareholder |
14 | Atlas Financial Holdings, Inc. Code of Business Conduct and Ethics, dated January 1, 2011 |
16 | Letter from KPMG LLP regarding its concurrence with the statements made by Atlas in the current report concerning the dismissal as the registrant’s principal accountant.Stock Ownership Guidelines |
| 21 | List of Subsidiaries |
| 23.1 | Consent of Johnson Lambert LLP |
| 23.2 | Consent of KPMG LLP |
23.3 | Consent of Brown Smith Wallace LLC |
24.1+ | Power of Attorney (included on signature page to the registration statement) |
|
99.1 | Audit Committee Charter |
99.2*Item 101 - Interactive Data Files |
| 101.INS | Corporate Governance and Nominating Committee Charter
XBRL Instance Document
|
| 101.SCH | XBRL Taxonomy Extension Schema Document |
| 101.CAL | XBRL Taxonomy Extension Calculation Linkbase Document |
| 101.DEF | XBRL Taxonomy Extension Definition Linkbase Document. |
| 101.LAB | XBRL Taxonomy Extension Label Linkbase Document. |
| 101.PRE | XBRL Taxonomy Extension Presentation Linkbase Document. |
1 Incorporated by reference from our annual report on Form 10-K for the year ended December 31, 2011, filed on March 26, 2012.
| |
(*)2 | To be filed.Incorporated by reference from our quarterly report on Form 10-Q for the quarter ended June 30, 2012, filed on August 13, 2012 |
| |
| (b) | Financial Statement Schedules. All financial statement schedules are omitted because they are not applicable or the information is included in the Registrant’sRegistrant's consolidated financial statements or related notes. |
The undersigned Registrant hereby undertakesundertakes:
(1) To file, during any period in which offers or sales are being made, a post-effective amendment to providethis registration statement:
(i) To include any prospectus required by section 10(a)(3) of the Securities Act of 1933;
(ii) To reflect in the prospectus any facts or events arising after the effective date of the registration statement (or the most recent post-effective amendment thereof) which, individually or in the aggregate, represent a fundamental change in the information set forth in this registration statement. Notwithstanding the foregoing, any increase or decrease in volume of Securities (if the total dollar value of Securities would not exceed that which was registered) and a deviation from the low or high end of the estimated maximum offering range may be reflected in the form of prospectus filed with the Commission pursuant to Rule 424(b) if, in the aggregate, the changes in volume and price represent no more than a 20 percent change in the maximum aggregate offering price set forth in the "Calculation of Registration Fee" table in the effective registration statement;
(iii) To include any material information with respect to the underwritersplan of distribution not previously disclosed in the registration statement or any material change to such information in this registration statement;
(2) That, for the purpose of determining any liability under the Securities Act of 1933, each such post-effective amendment shall be deemed to be a new registration statement relating to the Securities offered herein, and the offering of such Securities at that time shall be deemed to be the initial bona fide offering thereof.
(3) To remove from registration by means of a post-effective amendment any of the Securities being registered which remain unsold at the closing specifiedtermination of the offering.
(4) That, for the purpose of determining liability under the Securities Act of 1933 to any purchaser:
(i) (A) Each prospectus filed by the registrant pursuant to Rule 424(b)(3) shall be deemed to be part of the registration statement as of the date the filed prospectus was deemed part of and included in the underwriting agreement, certificatesregistration statement; and (B) each prospectus required to be filed pursuant to Rule 424(b)(2), (b)(5), or (b)(7) as part of a registration statement in such denominations and registered in such names asreliance on Rule 430B relating to an offering made pursuant to Rule 415(a)(l)(i), (vii), or (x) for the purpose of providing the information required by section 10(a) of the underwritersSecurities Act of 1933 shall be deemed to permit prompt deliverybe part of and included in the registration statement as of the earlier of the date such form of prospectus is first used after effectiveness or the date of the first contract of sale of securities in the offering described in the prospectus. As provided in Rule 430B, for liability purposes of the issuer and any person that is at that date an underwriter, such date shall be deemed to each purchaser.be a new effective date of the registration statement relating to the securities in the registration statement to which that prospectus relates, and the offering of such securities at that time shall be deemed to be the initial bona fide offering thereof. Provided, however, that no statement made in a registration statement or prospectus that is part of the registration statement or made in a document incorporated or deemed incorporated by reference into the registration statement or prospectus that is part of the registration statement will, as to a purchaser with a time of contract of sale prior to such effective date, supersede or modify any statement that was made in the registration statement or prospectus that was part of the registration statement or made in any such document immediately prior to such effective date; or
(ii) Each prospectus filed pursuant to Rule 424(b) as part of a registration statement relating to an offering, other than registration statements relying on Rule 430B or other than prospectuses filed in reliance on Rule 430A, shall be deemed to be part of and included in the registration statement as of the date it is first used after effectiveness. Provided, however, that no statement made in a registration statement or prospectus that is part of the registration statement or made in a document incorporated or deemed incorporated by reference into the registration statement or prospectus that is part of the registration statement will, as to a purchaser with a time of contract of sale prior to such first use, supersede or modify any statement that was made in the registration statement or prospectus that was part of the registration statement or made in any such document immediately prior to such date of first use.
(5) Insofar as indemnification for liabilities arising under the Securities Act of 1933 may be permitted to directors, officers and controlling persons of the Registrantregistrant pursuant to existing provisions or arrangements whereby the foregoing provisions,registrant may indemnify a trustee, officer or controlling person of the registrant against liabilities arising under the Securities Act, or otherwise, the Registrantregistrant has been advised that in the opinion of the SECSecurities and Exchange Commission such indemnification is against public policy as expressed in the Securities Act and is, therefore, unenforceable. In the event that a claim for indemnification against such liabilities (other than the payment by the Registrantregistrant of expenses incurred or paid by a director,trustee, officer or controlling person of the Registrantregistrant in the successful defense of any action, suit or proceeding) is asserted by such director,trustee, officer or controlling person in connection with the securities being registered, the Registrantregistrant will, unless in the opinion of its counsel the matter has been settled by controlling precedent, submit to a court of appropriate jurisdiction the question whether such indemnification by it is against public policy as expressed in the Securities Act and will be governed by the final adjudication of such issue.
The undersigned Registrant hereby undertakes that:
| |
(1) | For purposes of determining any liability under the Securities Act, the information omitted from the form of prospectus filed as part of this registration statement in reliance upon Rule 430A and contained in a form of prospectus filed by the Registrant pursuant to Rule 424(b)(1) or (4) or 497(h) under the Securities Act shall be deemed to be part of this registration statement as of the time it was declared effective. |
| |
(2) | For the purpose of determining any liability under the Securities Act, each post-effective amendment that contains a form of prospectus shall be deemed to be a new registration statement relating to the securities offered therein, and the offering of such securities at that time shall be deemed to be the initial bona fide offering thereof. |
SIGNATURES
Pursuant to the requirements of the Securities Act of 1933, the registrant has duly caused this registration statement to be signed on its behalf by the undersigned, thereunto duly authorized, in the City of Elk Grove Village, State of Illinois, on this 17th18th day of January,September 2013.
|
|
| |
| ATLAS FINANCIAL HOLDINGS, INC. |
| |
/S/ Scott D. Wollney
__________________________ |
| Scott D. Wollney |
| President, Chief Executive Officer and Director |
(Principal Executive Officer)
|
POWER OF ATTORNEY
KNOW ALL PERSONS BY THESE PRESENTS, that each person whose signature appears below hereby constitutes Scott D. Wollney and Paul A. Romano, and each of them, as his true and lawful attorney-in-fact and agent with full power of substitution, for him in any and all capacities, to sign any and all amendments to this registration statement (including post-effective amendments) and any registration statement related thereto filed pursuant to Rule 462(b) increasing the number of securities for which registration is sought, and to file the same, with all exhibits thereto and other documents in connection therewith, with the SEC, granting unto said attorney-in-fact and agent full power and authority to do and perform each and every act and thing requisite and necessary to be done in connection therewith, as fully for all intents and purposes as he might or could do in person, hereby ratifying and confirming all that said attorney-in-fact and agent, or his substitute, may lawfully do or cause to be done by virtue hereof.
Pursuant to the requirements of the Securities Act of 1933, this registration statement has been signed by the following persons in the capacities and on the dates indicated.
|
| | | | |
| Signature | | Title | | Date |
| | |
/S/ Scott D. Wollney__________________________
Scott D. Wollney | | President, Chief Executive Officer and Director (Principal Executive Officer) | | January 17,September 18, 2013 |
| | |
/S/ Paul A. Romano__________________________
Paul A. Romano | | Vice President, Chief Financial Officer (Principal Financial and Accounting Officer) | | January 17,September 18, 2013 |
| | |
*__________________________
Gordon G. Pratt | | Director, Chairman of the Board | | January 17,September 18, 2013 |
| | |
*__________________________
Jordan M. Kupinsky | | Director | | January 17,September 18, 2013 |
| | |
*__________________________
Larry G. Swets, Jr. | | Director | | January 17,September 18, 2013 |
| | |
__________________________ John T. Fitzgerald | | Director | | September 18, 2013 |
* /s/ Scott D. Wollney
Scott D. Wollney
Attorney-in-fact
EXHIBIT INDEX
|
| |
Exhibit | Description |
1.01 | Stock Purchase Agreement among Atlas Financial Holdings, Inc., and Hendricks Holding Company, Inc. dated as of October 24, 2012
|
1.02* | Form of Underwriting Agreement |
3.1 | Memorandum of Association of Atlas Financial Holdings, dated December 24, 2010. |
3.1 | Restated Certificate of Incorporation of American Country Insurance Company, Inc., as amended as of February 13, 2004 |
3.1 | Restated Certificate of Incorporation of American Service Insurance, Inc., as amended as of June 15, 2009 |
3.1 | Restated Certificate of Incorporation of American Insurance Acquisition, Inc., as amended December 31, 2010 |
4.1 | Memorandum of Association of Atlas Financial Holdings, dated December 24, 2010, included in item 3.1a |
4.1 | By-laws of American Country Insurance Company, Inc., as amended September 14, 2005 |
4.1 | By-laws of American Service Insurance, Inc., as amended September 20, 2005 |
4.1 | By-laws of American Insurance Acquisition, Inc., as amended July 9, 2010 |
4.2 | Specimen Ordinary Share Certificate |
4.3 | Specimen Warrant Agreement |
5.1+
| Opinion of Conyers Dill & Pearman Ltd. |
10.1 | Atlas Financial Holdings, Inc. Stock Option Plan dated January 6, 2011 |
10.2 | Form of Atlas Employment Agreement for Executive Management, updated January 1, 2012 |
10.3
| Employee Share Purchase Plan Agreement, as adopted June 1, 2011 |
10.4 | Defined Contribution Plan Document dated August 11, 2011 |
10.5 | Transition Services Agreement between Kingsway Financial Services, Inc and American Insurance Acquisition, Inc., dated December 31, 2010 |
10.6 | Program Manager Agreement between American Service Insurance Company and both Universal Casualty Company and Kingsway America Inc., dated January 1, 2011 |
10.7 | 150 Northwest Point - Sale Agreement |
10.8 | 150 Northwest Point - Sale Agreement, Amendment 1 |
10.9 | 150 Northwest Point - Sale Agreement, Amendment 2 |
10.10 | 150 Northwest Point - Lease Agreement |
10.11* | Form of Lock-Up Agreement entered into with our directors, executive officers and the selling shareholder |
14 | Atlas Financial Holdings, Inc. Code of Business Conduct and Ethics, dated January 1, 2011 |
16 | Letter from KPMG LLP regarding its concurrence with the statements made by Atlas in the current report concerning the dismissal as the registrant’s principal accountant. |
21 | List of Subsidiaries |
23.1 | Consent of Johnson Lambert LLP |
23.2 | Consent of KPMG LLP |
23.3 | Consent of Brown Smith Wallace LLC |
24.1+
| Power of Attorney |
99.1 | Audit Committee Charter |
99.2* | Corporate Governance and Nominating Committee Charter
|
| |
(b) | Financial Statement Schedules. All financial statement schedules are omitted because they are not applicable or the information is included in the Registrant’s consolidated financial statements or related notes.
|