UNITED STATES
SECURITIES AND EXCHANGE COMMISSION
Washington, D.C. 20549
FORM N-CSR
CERTIFIED SHAREHOLDER REPORT OF REGISTERED
MANAGEMENT INVESTMENT COMPANIES
Investment Company Act File Number: 811-07381
| T. Rowe Price Health Sciences Fund, Inc. |
| (Exact name of registrant as specified in charter) |
| 100 East Pratt Street, Baltimore, MD 21202 |
| (Address of principal executive offices) |
| David Oestreicher |
| 100 East Pratt Street, Baltimore, MD 21202 |
| (Name and address of agent for service) |
Registrant’s telephone number, including area code: (410) 345-2000
Date of fiscal year end: December 31
Date of reporting period: December 31, 2012
Item 1. Report to Shareholders
 |
| Health Sciences Fund | December 31, 2012 |
The views and opinions in this report were current as of December 31, 2012. They are not guarantees of performance or investment results and should not be taken as investment advice. Investment decisions reflect a variety of factors, and the managers reserve the right to change their views about individual stocks, sectors, and the markets at any time. As a result, the views expressed should not be relied upon as a forecast of the fund’s future investment intent. The report is certified under the Sarbanes-Oxley Act, which requires mutual funds and other public companies to affirm that, to the best of their knowledge, the information in their financial reports is fairly and accurately stated in all material respects.
REPORTS ON THE WEB
Sign up for our E-mail Program, and you can begin to receive updated fund reports and prospectuses online rather than through the mail. Log in to your account at troweprice.com for more information.
Manager’s Letter
Fellow Shareholders
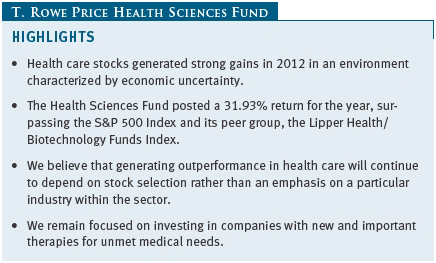
Against a backdrop of solid earnings, improving balance sheets, and low interest rates, health care stocks rose strongly in the 12 months ended December 31, 2012, capping a fourth consecutive year of gains. The fund and its peer group easily outperformed the broad market, as measured by the S&P 500 Index. Results in the first half of the year were significantly greater than the gains in the second half. For the 12-month period, stock selection was a strong contributor to results versus the Lipper peer group, while industry allocation decisions were a modest contributor.
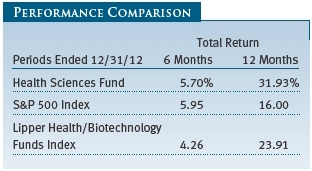
PERFORMANCE COMPARISON
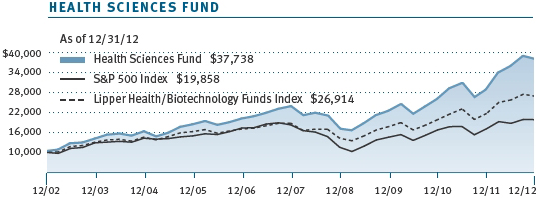
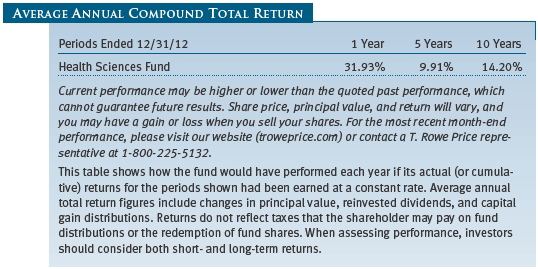
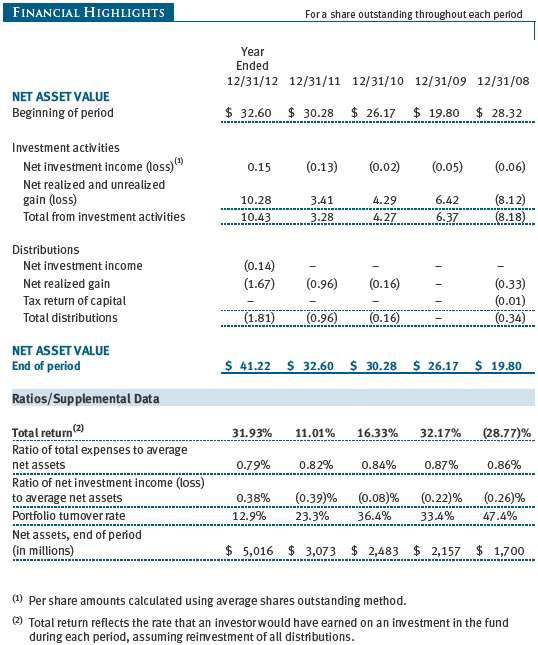
In the 12 months ended December 31, 2012, the Health Sciences Fund posted a 31.93% gain that significantly outperformed the 16.00% return for the S&P 500 Index and the 23.91% result for the Lipper Health/Biotechnology Funds Index. Our comparison with the Lipper peer group benefited from stock selection across all industries but was strongest in biotechnology, services, and pharmaceuticals. Our modestly overweight allocation to services was a detractor from relative results, although our holdings in the group posted an impressive 27% return for the year.
The Health Sciences Fund has delivered consistently strong longer-term performance. Lipper ranked the portfolio in the top 15% of its universe of health/biotechnology funds for 10 years ended December 31, 2012. (Based on cumulative total return, Lipper ranked the Health Sciences Fund 15 of 83, 8 of 72, 20 of 71, and 7 of 51 funds in the health/biotechnology funds universe for the 1-, 3-, 5-, and 10-year periods ended December 31, 2012, respectively. Past performance cannot guarantee future results.)
MARKET ENVIRONMENT
Health care stocks generated strong returns in 2012 despite muted U.S. economic growth, a eurozone recession and sovereign debt crisis, and slower growth in emerging economies. Domestic equities were supported by solid U.S. corporate earnings—though year-over-year earnings growth has weakened somewhat—and accommodative policy actions by central banks around the world. However, stocks in the health care space surrendered some of their gains in the year’s closing months due to uncertainty about the November elections, U.S. fiscal policies, and the fate of the health care legislation. As the year ended, Congress was close to reaching an agreement to lessen the impact of federal tax increases and spending cuts scheduled to take effect in January. Legislation that delayed deep spending cuts for two months and prevented broad-based tax increases was passed by Congress on January 1, 2013.
Mid- and small-cap shares narrowly outpaced their large-cap counterparts, and value stocks outperformed growth stocks across all market capitalizations. All S&P 500 sectors produced positive returns, led by the financials and consumer discretionary sectors. Telecommunication services and health care shares also performed well, while information technology, materials, and industrials and business services stocks trailed the broad market. Consumer staples and energy stocks lagged.
The Lipper Health/Biotechnology Funds Index handily outperformed the S&P 500 Index for the year. Within the Lipper index, the top-performing segments were the tiny life sciences segment (+48%); biotechnology (+37%), which accounts for more than a third of the health care sector; and the products and devices and pharmaceuticals segments, which both rallied about 18%.
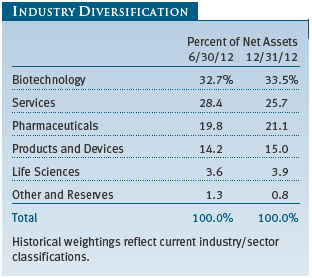
As we have written in previous shareholder reports, your portfolio is constructed one stock at a time based on its individual merit, commonly referred to as bottom-up stock selection. We keep an eye on our overall industry allocations and maintain broad diversification. However, we believe stock selection will have far more bearing on our performance than allocation decisions.
STRATEGY REVIEW
The portfolio’s large allocation to the biotechnology and pharmaceuticals segments stems from our belief that the drug industry’s business model—the discovery, development, manufacture, and commercialization of medicines—is the primary driver of long-term performance. Typically, large pharmaceutical companies have a broad base of revenues and income, and one drug—even if it is extremely successful—may not be enough to affect the bottom line significantly. Biotechnology companies, however, tend to be smaller, and the successful introduction of one important new medicine can materially affect a company’s revenues and earnings. We are especially focused on those companies with medicines or treatments for unmet medical needs.
PORTFOLIO REVIEW
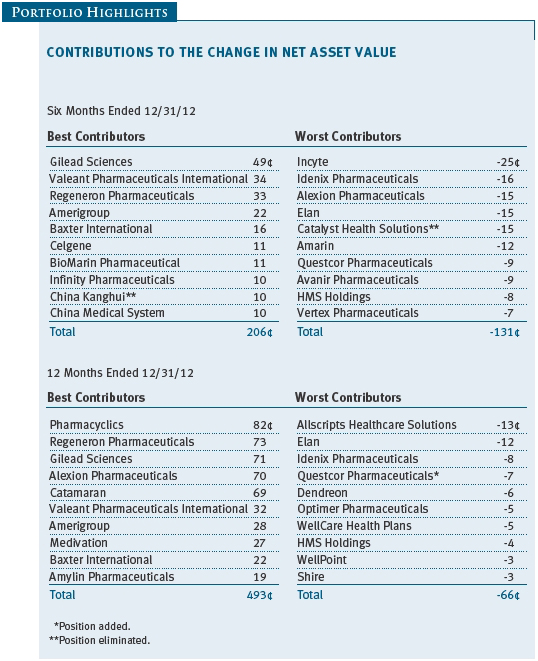
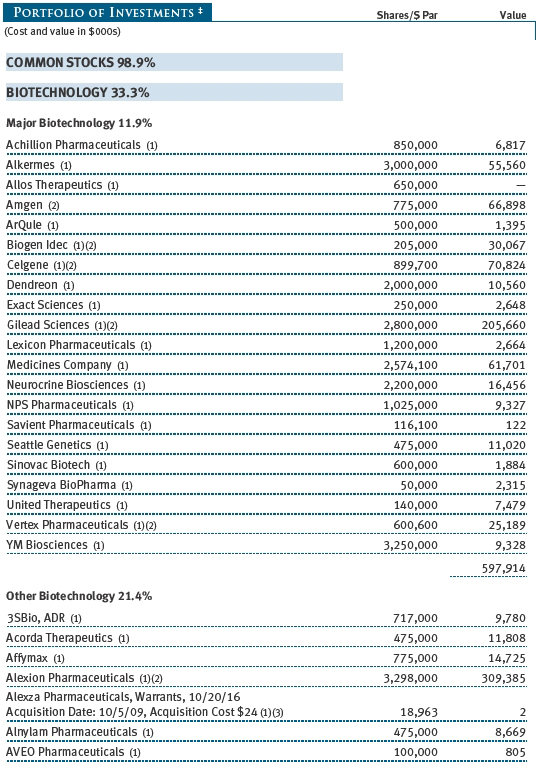
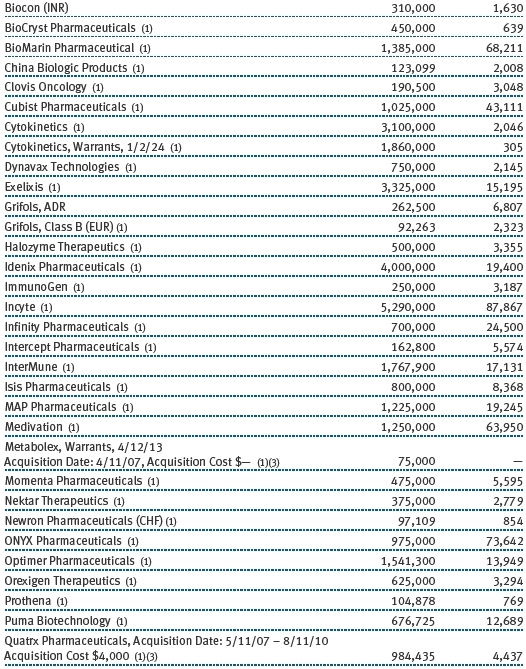
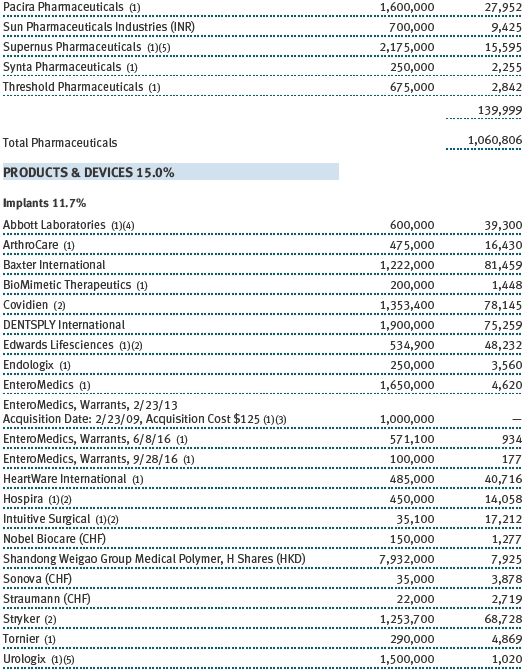
The portfolio’s best contributors for the year were Pharmacyclics, Regeneron Pharmaceuticals, and Gilead Sciences. (Please refer to the portfolio of investments for a complete list of holdings and the amount each represents in the portfolio.)
Pharmacyclics is a small-cap clinical-stage biopharmaceutical company whose success depends on its drug ibrutinib, which has mega-blockbuster potential for treating multiple lymphomas and leukemias (blood cancer). Ibrutinib is extremely unusual because it is potentially a single-agent treatment, and, due to its low toxicity, can be easily combined with certain existing therapeutic regimens. Johnson & Johnson is convinced that ibrutinib can be a huge winner, and, based on its commercial assessment of the drug, signed an extremely rich partnership with Pharmacyclics. We believe that if this early-stage company can generate meaningful revenue from ibrutinib, it can grow into a large-cap.
Like Pharmacyclics, Amylin Pharmaceuticals (recently acquired by Bristol-Myers Squibb) and Medivation were top contributors for the year in the small-/mid-cap biotech space. Owning small-cap companies encompasses more risk than investing in large-caps that have a larger product base because a firm that is highly dependent on the success of a single drug can decline significantly on bad news. We manage this risk in part by owning a diversified basket of stocks and by controlling our position sizes.
Regeneron Pharmaceuticals has been a top portfolio contributor for several years. When we first added Regeneron to the portfolio, it was a small-cap. Today, the company’s market cap is about $11 billion. Its most advanced product is Eylea, a recently FDA-approved biologic for the treatment of wet age-related macular degeneration or “wet AMD,” a highly prevalent disease of the retina—the leading cause of blindness in the elderly if left untreated. Regeneron is marketing Eylea as a more convenient alternative to Roche’s Lucentis, by virtue of its less-frequent intra-ocular injection schedule. The AMD market is large. With 500,000 to 1 million U.S. patients, it is expanding rapidly (year-over-year growth is in the 10% to 15% range), and annual sales in the U.S. of the only other branded product, Lucentis, are about $1.5 billion. After only a year on the market, Eylea has about a 20% market share of the U.S. AMD market and generated sales of $838 million
The company’s management has steadily increased its revenue and earnings guidance, and we remain positive on the firm’s intermediate- and long-term prospects. We believe that it has the potential to become a fully integrated mega-cap pharmaceutical company thanks to its prolific pipeline.
Gilead Sciences has been a top portfolio holding for more than a decade. The company is dominant in the $16 billion worldwide HIV antiviral market. Gilead was a private start-up biotech company, before becoming a small public biotech company, and is now a $55 billion market leader. The majority of Gilead’s revenues come from the sale of its HIV medicines Atripla, Truvada, and Viread. The company’s late-stage pipeline includes a new HIV medicine, called Quad, which is key to lengthening the duration of its HIV treatment-related revenues. To achieve highly effective medicines for hepatitis C and in an effort to replicate its commercial dominance in HIV in this burgeoning market, Gilead acquired Pharmasset in 2012.
Gilead is firing on all cylinders and beat consensus revenues and earnings forecasts in the third quarter and raised its topline guidance for the second time in the past 12 months. We think that the management team is executing well, and its optimism leads us to believe that there is meaningful potential for profits to accelerate over the intermediate term. Gilead remains among the “best idea” large-cap growth stocks in the sector.
Although we had our share of detractors, a review of the portfolio’s best and worst contributors, which is shown in the tables on page 10, is lopsided in favor of the winners. Our largest detractor for the year was Chicago-based Allscripts Healthcare Solutions, a software and services provider for physicians (primarily), hospitals, and extended-care providers. The company reported disastrous first-quarter results in conjunction with a failed management coup that ended with the departure of the CFO and four board members. The shares tumbled on the news and on the sharply lower annual earnings estimates. Although we subsequently reduced our position significantly, the damage had already been done.
Elan and Questcor Pharmaceuticals were our two largest detractors in the major pharmaceuticals segment, while Idenix Pharmaceuticals was the largest decliner in the biotech industry. In August, Elan (in partnership with Pfizer and Johnson & Johnson) announced that its Alzheimer’s drug, bapineuzumab, had failed in a second clinical trial, which led to an approximately 20% share price decline. Because of this study failure, as well as the failure of a related study a few weeks earlier, all ongoing studies with the intravenous formulation of bapineuzumab have been stopped.
Questcor fell about 50% in late September due to concerns relating to the company’s marketing practices and a change in a large health insurer’s reimbursement policy for Acthar, a treatment for a number of diseases including infantile spasms, also known as West syndrome. Idenix, which completed an initial public offering in August, stumbled later in the month as the company’s hepatitis C development programs ran into regulatory delays.
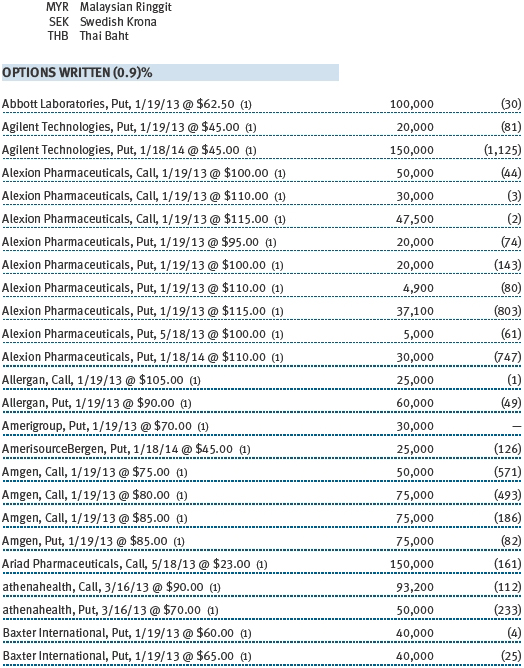
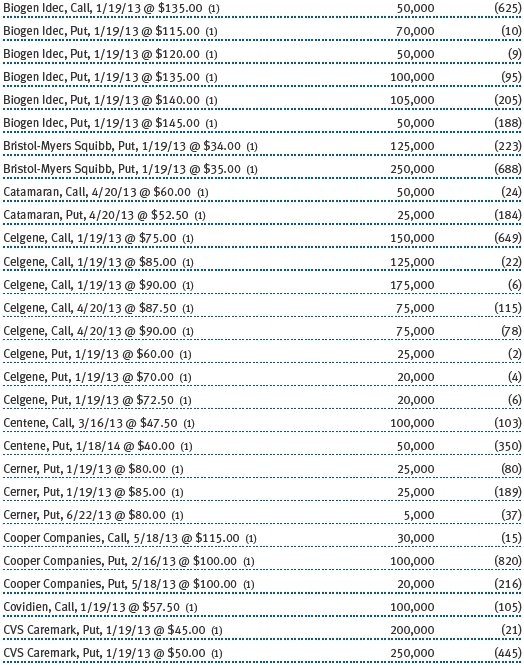
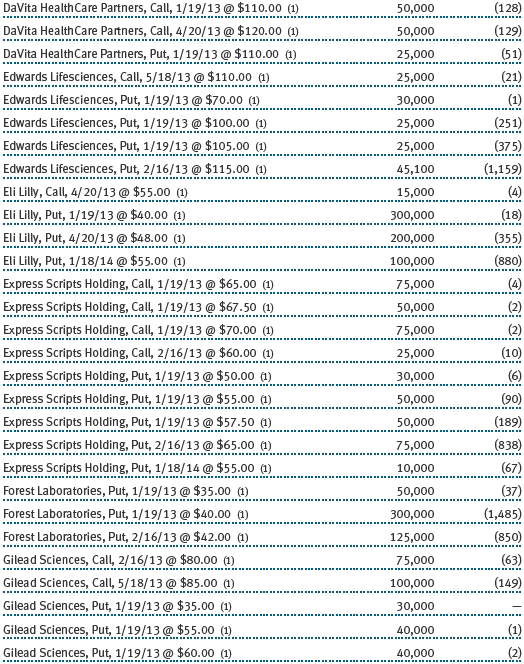
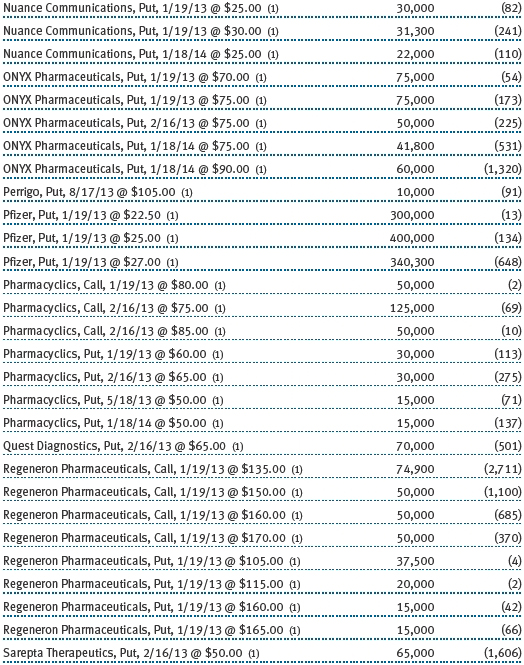
While most of the portfolio’s investments are in U.S. common stocks, the fund will selectively invest in non-U.S. companies. Over the past 12 months, the portfolio’s holdings in overseas investments generated positive absolute and relative performance contributions. Additionally, the fund writes call and put options primarily as a means of augmenting income. Normally, the portfolio will own the securities on which it writes these options. The premium income recovered by writing covered options can help reduce, but not eliminate, portfolio volatility. For the year, the options strategy contributed positively to the portfolio’s results.
OUTLOOK
Our outlook for the health care sector has changed very little over the last six months. We still believe that health care can remain a strong performer given the economic uncertainties. There are no indications that the economy is going to enjoy a sudden resurgence, and in the slow economic growth scenario that we expect, health care should continue to perform well. Although it was a top performer for the past 12 months, valuations appear reasonable, and the asset class is still underrepresented in many investors’ portfolios.
It is still a defensive sector because people get sick and need to go to the doctor and get medicine regardless of the economy’s condition. However, pharmaceutical consumption, laboratory tests, doctor visits, and surgical procedures are lower since the 2008 financial crisis. For the sector to sustain its multiyear outperformance, we think that the leading large-cap companies need to generate new products and innovative medicines. While the market has rewarded large-cap pharmaceuticals for being more thoughtful and disciplined about their capital allocation, we would be more optimistic about their long-term prospects if we saw more innovative products poised to exit their pipelines.
Because health care is a highly regulated industry, there are risks associated with regulatory actions. The implementation of new policies will undoubtedly favor certain sectors and disadvantage others. The government is drafting thousands of new regulations for the legislation that goes into effect in 2014. While the market perceives that little has happened in 2012, the fact is that a tremendous amount of administration and rulemaking is going on behind the scenes, which could be viewed as the lull before the storm.
It is likely that we will see pockets of exciting performance within the two areas that the portfolio continues to emphasize—the introduction of highly innovative, important new medical products and health care services that provide quality, cost-effective outcomes. Other positive long-term dynamics include demographics (the rising number of baby boomers reaching retirement age); the pace of scientific advances and prospects for safer and better medicines; and, finally, demand for a higher quality of life and society’s willingness to spend on health care. As long as society continues to demand new therapies to soften the impact of disease and government price controls are not imposed, health care should remain an area of significant long-term growth.
We appreciate your continued confidence and support.
Respectfully submitted,

Kris H. Jenner
President of the fund and chairman of its Investment Advisory Committee
January 24, 2013
The committee chairman has day-to-day responsibility for managing the portfolio and works with committee members in developing and executing the fund’s investment program.
RISK OF GROWTH INVESTING
Growth stocks can be volatile for several reasons. Since these companies usually invest a high portion of earnings in their businesses, they may lack the dividends of value stocks that can cushion stock prices in a falling market. Also, earnings disappointments often lead to sharply falling prices because investors buy growth stocks in anticipation of superior earnings growth.
RISK OF HEALTH SCIENCES FUND INVESTING
Funds that invest only in specific industries will experience greater volatility than funds investing in a broad range of industries. Companies in the health sciences field are subject to special risks such as increased competition within the health care industry, changes in legislation or government regulations, reductions in government funding, product liability or other litigation, and the obsolescence of popular products.
GLOSSARY
Lipper index: Fund benchmarks that consist of a small number of the largest mutual funds in a particular category as tracked by Lipper Inc.
S&P 500 Index: An index consisting of 500 stocks chosen for market size, liquidity, and industry group representation. It is a market-value weighted index, with each stock’s weight in the index proportionate to its market value.
Performance and Expenses
| Growth of $10,000 |
This chart shows the value of a hypothetical $10,000 investment in the fund over the past 10 fiscal year periods or since inception (for funds lacking 10-year records). The result is compared with benchmarks, which may include a broad-based market index and a peer group average or index. Market indexes do not include expenses, which are deducted from fund returns as well as mutual fund averages and indexes.
| Fund Expense Example |
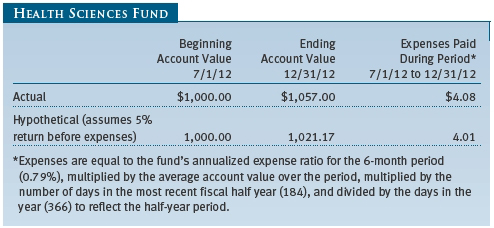
As a mutual fund shareholder, you may incur two types of costs: (1) transaction costs, such as redemption fees or sales loads, and (2) ongoing costs, including management fees, distribution and service (12b-1) fees, and other fund expenses. The following example is intended to help you understand your ongoing costs (in dollars) of investing in the fund and to compare these costs with the ongoing costs of investing in other mutual funds. The example is based on an investment of $1,000 invested at the beginning of the most recent six-month period and held for the entire period.
Actual Expenses
The first line of the following table (Actual) provides information about actual account values and expenses based on the fund’s actual returns. You may use the information on this line, together with your account balance, to estimate the expenses that you paid over the period. Simply divide your account value by $1,000 (for example, an $8,600 account value divided by $1,000 = 8.6), then multiply the result by the number on the first line under the heading “Expenses Paid During Period” to estimate the expenses you paid on your account during this period.
Hypothetical Example for Comparison Purposes
The information on the second line of the table (Hypothetical) is based on hypothetical account values and expenses derived from the fund’s actual expense ratio and an assumed 5% per year rate of return before expenses (not the fund’s actual return). You may compare the ongoing costs of investing in the fund with other funds by contrasting this 5% hypothetical example and the 5% hypothetical examples that appear in the shareholder reports of the other funds. The hypothetical account values and expenses may not be used to estimate the actual ending account balance or expenses you paid for the period.
Note: T. Rowe Price charges an annual account service fee of $20, generally for accounts with less than $10,000. The fee is waived for any investor whose T. Rowe Price mutual fund accounts total $50,000 or more; accounts electing to receive electronic delivery of account statements, transaction confirmations, prospectuses, and shareholder reports; or accounts of an investor who is a T. Rowe Price Preferred Services, Personal Services, or Enhanced Personal Services client (enrollment in these programs generally requires T. Rowe Price assets of at least $100,000). This fee is not included in the accompanying table. If you are subject to the fee, keep it in mind when you are estimating the ongoing expenses of investing in the fund and when comparing the expenses of this fund with other funds.
You should also be aware that the expenses shown in the table highlight only your ongoing costs and do not reflect any transaction costs, such as redemption fees or sales loads. Therefore, the second line of the table is useful in comparing ongoing costs only and will not help you determine the relative total costs of owning different funds. To the extent a fund charges transaction costs, however, the total cost of owning that fund is higher.
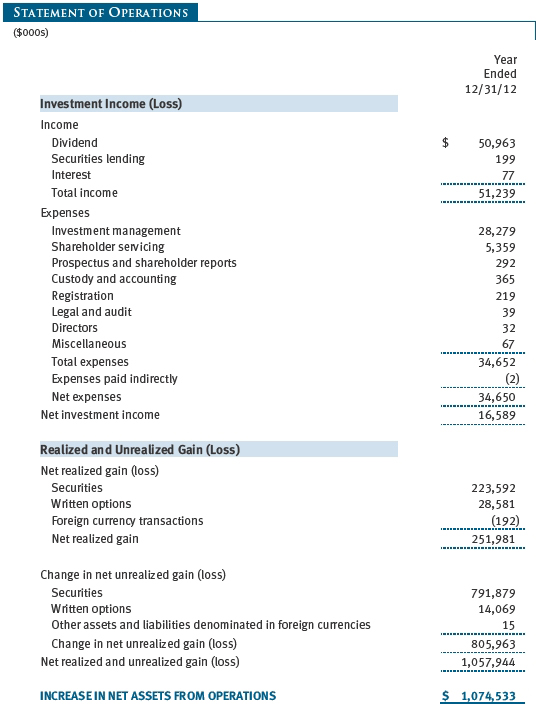
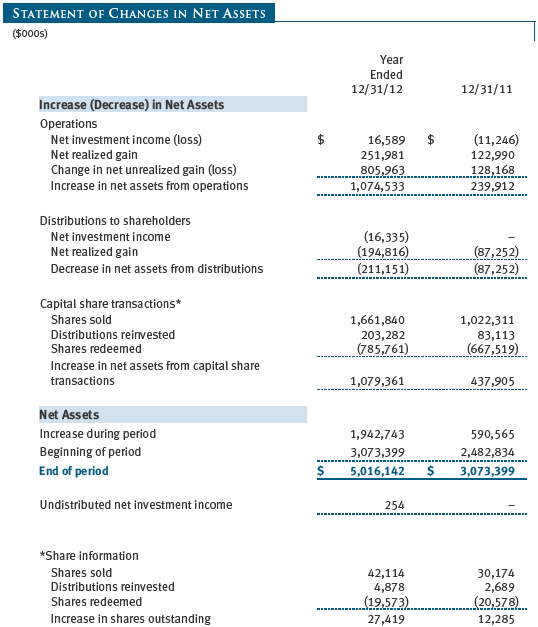
The accompanying notes are an integral part of these financial statements.


The accompanying notes are an integral part of these financial statements.
The accompanying notes are an integral part of these financial statements.
The accompanying notes are an integral part of these financial statements.
The accompanying notes are an integral part of these financial statements.
| Notes to Financial Statements |
T. Rowe Price Health Sciences Fund, Inc. (the fund), is registered under the Investment Company Act of 1940 (the 1940 Act) as a diversified, open-end management investment company. The fund commenced operations on December 29, 1995. The fund seeks long-term capital appreciation.
NOTE 1 - SIGNIFICANT ACCOUNTING POLICIES
Basis of Preparation The accompanying financial statements were prepared in accordance with accounting principles generally accepted in the United States of America (GAAP), which require the use of estimates made by management. Management believes that estimates and valuations are appropriate; however, actual results may differ from those estimates, and the valuations reflected in the accompanying financial statements may differ from the value ultimately realized upon sale or maturity.
Investment Transactions, Investment Income, and Distributions Income and expenses are recorded on the accrual basis. Premiums and discounts on debt securities are amortized for financial reporting purposes. Dividends received from mutual fund investments are reflected as dividend income; capital gain distributions are reflected as realized gain/loss. Dividend income and capital gain distributions are recorded on the ex-dividend date. Income tax-related interest and penalties, if incurred, would be recorded as income tax expense. Investment transactions are accounted for on the trade date. Realized gains and losses are reported on the identified cost basis. Distributions to shareholders are recorded on the ex-dividend date. Income distributions are declared and paid annually. Capital gain distributions, if any, are generally declared and paid by the fund annually.
Currency Translation Assets, including investments, and liabilities denominated in foreign currencies are translated into U.S. dollar values each day at the prevailing exchange rate, using the mean of the bid and asked prices of such currencies against U.S. dollars as quoted by a major bank. Purchases and sales of securities, income, and expenses are translated into U.S. dollars at the prevailing exchange rate on the date of the transaction. The effect of changes in foreign currency exchange rates on realized and unrealized security gains and losses is reflected as a component of security gains and losses.
Rebates and Credits Subject to best execution, the fund may direct certain security trades to brokers who have agreed to rebate a portion of the related brokerage commission to the fund in cash. Commission rebates are reflected as realized gain on securities in the accompanying financial statements and totaled $37,000 for the year ended December 31, 2012. Additionally, the fund earns credits on temporarily uninvested cash balances held at the custodian, which reduce the fund’s custody charges. Custody expense in the accompanying financial statements is presented before reduction for credits, which are reflected as expenses paid indirectly.
New Accounting Pronouncements In December 2011, the FASB issued amended guidance to enhance disclosure for offsetting assets and liabilities. The guidance is effective for fiscal years and interim periods beginning on or after January 1, 2013. Adoption will have no effect on the fund’s net assets or results of operations.
NOTE 2 - VALUATION
The fund’s financial instruments are reported at fair value as defined by GAAP. The fund determines the values of its assets and liabilities and computes its net asset value per share at the close of the New York Stock Exchange (NYSE), normally 4 p.m. ET, each day that the NYSE is open for business.
Valuation Methods Equity securities listed or regularly traded on a securities exchange or in the over-the-counter (OTC) market are valued at the last quoted sale price or, for certain markets, the official closing price at the time the valuations are made, except for OTC Bulletin Board securities, which are valued at the mean of the latest bid and asked prices. A security that is listed or traded on more than one exchange is valued at the quotation on the exchange determined to be the primary market for such security. Listed securities not traded on a particular day are valued at the mean of the latest bid and asked prices for domestic securities and the last quoted sale price for international securities.
Debt securities are generally traded in the OTC market. Securities with remaining maturities of one year or more at the time of acquisition are valued at prices furnished by dealers who make markets in such securities or by an independent pricing service, which considers the yield or price of bonds of comparable quality, coupon, maturity, and type, as well as prices quoted by dealers who make markets in such securities. Securities with remaining maturities of less than one year at the time of acquisition generally use amortized cost in local currency to approximate fair value. However, if amortized cost is deemed not to reflect fair value or the fund holds a significant amount of such securities with remaining maturities of more than 60 days, the securities are valued at prices furnished by dealers who make markets in such securities or by an independent pricing service.
Investments in mutual funds are valued at the mutual fund’s closing net asset value per share on the day of valuation. Purchased and written options, and OTC options with a listed equivalent, are valued at the mean of the closing bid and asked prices.
Other investments, including restricted securities and private placements, and those financial instruments for which the above valuation procedures are inappropriate or are deemed not to reflect fair value, are stated at fair value as determined in good faith by the T. Rowe Price Valuation Committee, established by the fund’s Board of Directors (the Board). Subject to oversight by the Board, the Valuation Committee develops pricing-related policies and procedures and approves all fair-value determinations. The Valuation Committee regularly makes good faith judgments, using a wide variety of sources and information, to establish and adjust valuations of certain securities as events occur and circumstances warrant. For instance, in determining the fair value of private-equity instruments, the Valuation Committee considers a variety of factors, including the company’s business prospects, its financial performance, strategic events impacting the company, relevant valuations of similar companies, new rounds of financing, and any negotiated transactions of significant size between other investors in the company. Because any fair-value determination involves a significant amount of judgment, there is a degree of subjectivity inherent in such pricing decisions.
For valuation purposes, the last quoted prices of non-U.S. equity securities may be adjusted under the circumstances described below. If the fund determines that developments between the close of a foreign market and the close of the NYSE will, in its judgment, materially affect the value of some or all of its portfolio securities, the fund will adjust the previous closing prices to reflect what it believes to be the fair value of the securities as of the close of the NYSE. In deciding whether it is necessary to adjust closing prices to reflect fair value, the fund reviews a variety of factors, including developments in foreign markets, the performance of U.S. securities markets, and the performance of instruments trading in U.S. markets that represent foreign securities and baskets of foreign securities. A fund may also fair value securities in other situations, such as when a particular foreign market is closed but the fund is open. The fund uses outside pricing services to provide it with closing prices and information to evaluate and/or adjust those prices. The fund cannot predict how often it will use closing prices and how often it will determine it necessary to adjust those prices to reflect fair value. As a means of evaluating its security valuation process, the fund routinely compares closing prices, the next day’s opening prices in the same markets, and adjusted prices. Additionally, trading in the underlying securities of the fund may take place in various foreign markets on certain days when the fund is not open for business and does not calculate a net asset value. As a result, net asset values may be significantly affected on days when shareholders cannot make transactions.
Valuation Inputs Various inputs are used to determine the value of the fund’s financial instruments. These inputs are summarized in the three broad levels listed below:
Level 1 – quoted prices in active markets for identical financial instruments
Level 2 – observable inputs other than Level 1 quoted prices (including, but not limited to, quoted prices for similar financial instruments, interest rates, prepayment speeds, and credit risk)
Level 3 – unobservable inputs
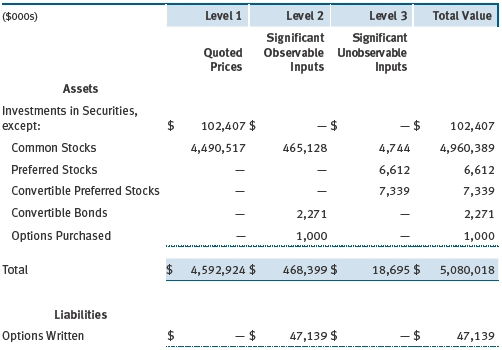
Observable inputs are those based on market data obtained from sources independent of the fund, and unobservable inputs reflect the fund’s own assumptions based on the best information available. The input levels are not necessarily an indication of the risk or liquidity associated with financial instruments at that level. For example, non-U.S. equity securities actively traded in foreign markets generally are reflected in Level 2 despite the availability of closing prices because the fund evaluates and determines whether those closing prices reflect fair value at the close of the NYSE or require adjustment, as described above. The following table summarizes the fund’s financial instruments, based on the inputs used to determine their values on December 31, 2012:
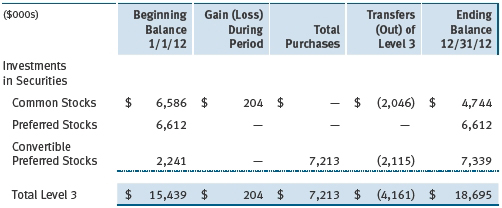
Following is a reconciliation of the fund’s Level 3 holdings for the year ended December 31, 2012. Transfers into and out of Level 3 are reflected at the value of the financial instrument at the beginning of the period. Gain (loss) reflects both realized and change in unrealized gain (loss) on Level 3 holdings during the period, if any, and is included on the accompanying Statement of Operations. The change in unrealized gain (loss) on Level 3 instruments held at December 31, 2012, totaled $204,000 for the year ended December 31, 2012.
NOTE 3 - DERIVATIVE INSTRUMENTS
During the year ended December 31, 2012, the fund invested in derivative instruments. As defined by GAAP, a derivative is a financial instrument whose value is derived from an underlying security price, foreign exchange rate, interest rate, index of prices or rates, or other variable; it requires little or no initial investment and permits or requires net settlement. The fund invests in derivatives only if the expected risks and rewards are consistent with its investment objectives, policies, and overall risk profile, as described in its prospectus and Statement of Additional Information. The fund may use derivatives for a variety of purposes, such as seeking to hedge against declines in principal value, increase yield, invest in an asset with greater efficiency and at a lower cost than is possible through direct investment, or to adjust credit exposure. The risks associated with the use of derivatives are different from, and potentially much greater than, the risks associated with investing directly in the instruments on which the derivatives are based. Investments in derivatives can magnify returns positively or negatively; however, the fund at all times maintains sufficient cash reserves, liquid assets, or other SEC-permitted asset types to cover the settlement obligations under its open derivative contracts.
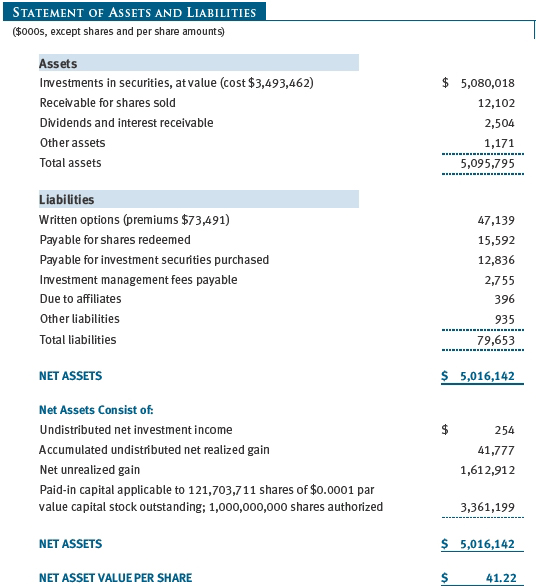
The fund values its derivatives at fair value, as described below and in Note 2, and recognizes changes in fair value currently in its results of operations. Accordingly, the fund does not follow hedge accounting, even for derivatives employed as economic hedges. The fund does not offset the fair value of derivative instruments against the right to reclaim or obligation to return collateral. As of December 31, 2012, the fund held equity derivatives with a fair value of $1,000,000, included in Investments in Securities, and $47,139,000, included in Written Options, on the accompanying Statement of Assets and Liabilities.
Additionally, the amount of gains and losses on derivative instruments recognized in fund earnings during the year ended December 31, 2012, and the related location on the accompanying Statement of Operations is summarized in the following table by primary underlying risk exposure:
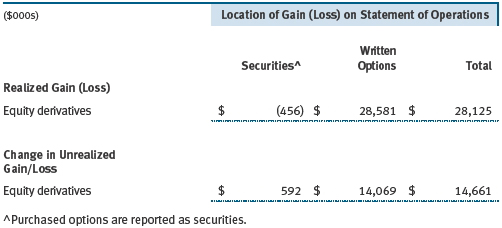
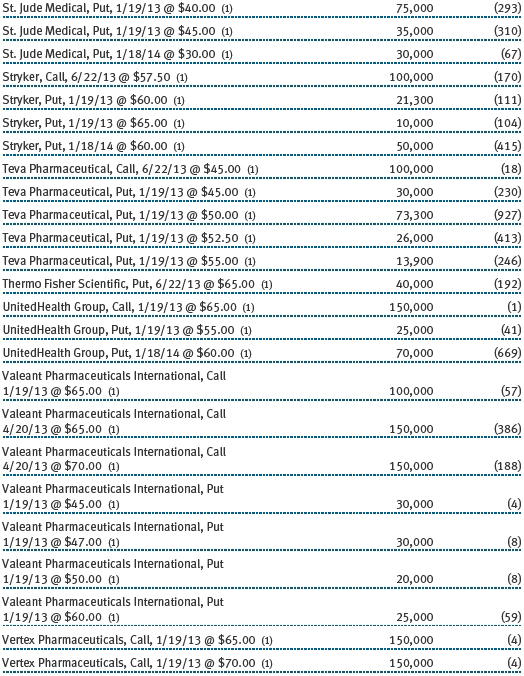
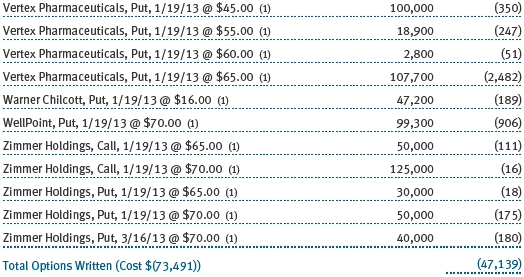
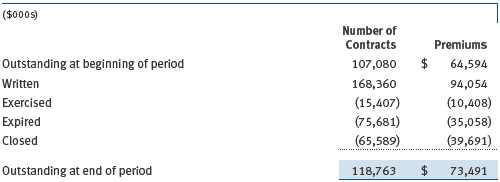
Options The fund is subject to equity price risk in the normal course of pursuing its investment objectives and uses options to help manage such risk. The fund may use call and put options to manage exposure to interest rates, security prices, foreign currencies, and credit quality; as an efficient means of adjusting exposure to all or a part of a target market; to enhance income; as a cash management tool; and/or to adjust credit exposure. In return for a premium paid, call and put options give the holder the right, but not the obligation, to purchase or sell, respectively, a security at a specified exercise price at any time during the period of the option. Options are included in net assets at fair value; purchased options are included in Investments in Securities; and written options are separately reflected as a liability on the accompanying Statement of Assets and Liabilities. Premiums on unexercised, expired options are recorded as realized gains or losses; premiums on exercised options are recorded as an adjustment to the proceeds from the sale or cost of the purchase. The difference between the premium and the amount received or paid in a closing transaction is also treated as realized gain or loss. Risks related to the use of options include possible illiquidity of the options markets; trading restrictions imposed by an exchange; movements in underlying security values; and, for written options, potential losses in excess of the fund’s initial investment. During the year ended December 31, 2012, the fund’s exposure to options, based on underlying notional amounts, was generally less than 1% of net assets. Transactions in written options and related premiums received during the year ended December 31, 2012, were as follows:
NOTE 4 - OTHER INVESTMENT TRANSACTIONS
Consistent with its investment objective, the fund engages in the following practices to manage exposure to certain risks and/or to enhance performance. The investment objective, policies, program, and risk factors of the fund are described more fully in the fund’s prospectus and Statement of Additional Information.
Restricted Securities The fund may invest in securities that are subject to legal or contractual restrictions on resale. Prompt sale of such securities at an acceptable price may be difficult and may involve substantial delays and additional costs.
Securities Lending The fund lends its securities to approved brokers to earn additional income. It receives as collateral cash and U.S. government securities valued at 102% to 105% of the value of the securities on loan. Collateral is maintained over the life of the loan in an amount not less than the value of loaned securities as determined at the close of fund business each day; any additional collateral required due to changes in security values is delivered to the fund the next business day. Cash collateral is invested by the fund’s lending agent(s) in accordance with investment guidelines approved by management. Although risk is mitigated by the collateral, the fund could experience a delay in recovering its securities and a possible loss of income or value if the borrower fails to return the securities or if collateral investments decline in value. Securities lending revenue recognized by the fund consists of earnings on invested collateral and borrowing fees, net of any rebates to the borrower and compensation to the lending agent. In accordance with GAAP, investments made with cash collateral are reflected in the accompanying financial statements, but collateral received in the form of securities is not. At December 31, 2012, there were no securities on loan.
When-Issued Securities The fund may enter into when-issued purchases and/or sales commitments, pursuant to which it agrees to purchase or sell, respectively, the underlying security for a fixed unit price, with payment and delivery at a scheduled future date generally beyond the customary settlement period for such securities. When-issued refers to securities that have not yet been issued but will be issued in the future and may include new securities or securities obtained through a corporate action on a current holding. The fund normally purchases when-issued securities with the intention of taking possession but may enter into a separate agreement to sell the securities before the settlement date. Until settlement, the fund maintains cash reserves and liquid assets sufficient to settle its when-issued commitments. Amounts realized on when-issued transactions are included with realized gain/loss on securities in the accompanying financial statements.
Counterparty Risk and Collateral Counterparty risk related to exchange-traded futures and options contracts is minimal because the exchange’s clearing-house provides protection against counterparty defaults. Generally, for exchange-traded derivatives such as futures and options, each broker, in its sole discretion, may change margin requirements applicable to the fund. Cash posted by the fund to meet margin requirements is reflected as restricted cash in the accompanying financial statements and securities posted by the fund are so noted in the accompanying Portfolio of Investments; both remain in the fund’s assets. As of December 31, 2012, no margin had been posted by the fund to the broker for exchange-traded derivatives.
Other Purchases and sales of portfolio securities other than short-term securities aggregated $1,407,252,000 and $548,490,000, respectively, for the year ended December 31, 2012.
NOTE 5 - FEDERAL INCOME TAXES
No provision for federal income taxes is required since the fund intends to continue to qualify as a regulated investment company under Subchapter M of the Internal Revenue Code and distribute to shareholders all of its taxable income and gains. Distributions determined in accordance with federal income tax regulations may differ in amount or character from net investment income and realized gains for financial reporting purposes. Financial reporting records are adjusted for permanent book/tax differences to reflect tax character but are not adjusted for temporary differences.
The fund files U.S. federal, state, and local tax returns as required. The fund’s tax returns are subject to examination by the relevant tax authorities until expiration of the applicable statute of limitations, which is generally three years after the filing of the tax return but which can be extended to six years in certain circumstances. Tax returns for open years have incorporated no uncertain tax positions that require a provision for income taxes.
Reclassifications to paid-in capital relate primarily to a tax practice that treats a portion of the proceeds from each redemption of capital shares as a distribution of taxable net investment income and/or realized capital gain. For the year ended December 31, 2012, the following reclassifications were recorded to reflect tax character (there was no impact on results of operations or net assets):

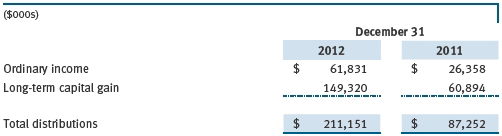
Distributions during the years ended December 31, 2012 and December 31, 2011, were characterized for tax purposes as follows:
At December 31, 2012, the tax-basis cost of investments and components of net assets were as follows:
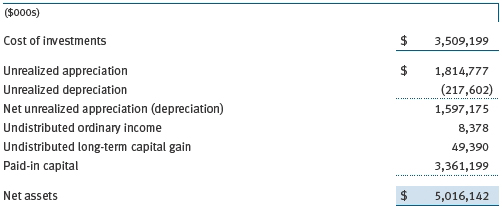
The difference between book-basis and tax-basis net unrealized appreciation (depreciation) is attributable to the deferral of losses from wash sales for tax purposes.
NOTE 6 - RELATED PARTY TRANSACTIONS
The fund is managed by T. Rowe Price Associates, Inc. (Price Associates), a wholly owned subsidiary of T. Rowe Price Group, Inc. (Price Group). The investment management agreement between the fund and Price Associates provides for an annual investment management fee, which is computed daily and paid monthly. The fee consists of an individual fund fee, equal to 0.35% of the fund’s average daily net assets, and a group fee. The group fee rate is calculated based on the combined net assets of certain mutual funds sponsored by Price Associates (the group) applied to a graduated fee schedule, with rates ranging from 0.48% for the first $1 billion of assets to 0.28% for assets in excess of $300 billion. The fund’s group fee is determined by applying the group fee rate to the fund’s average daily net assets. At December 31, 2012, the effective annual group fee rate was 0.30%.
In addition, the fund has entered into service agreements with Price Associates and two wholly owned subsidiaries of Price Associates (collectively, Price). Price Associates computes the daily share price and provides certain other administrative services to the fund. T. Rowe Price Services, Inc., provides shareholder and administrative services in its capacity as the fund’s transfer and dividend disbursing agent. T. Rowe Price Retirement Plan Services, Inc., provides subaccounting and recordkeeping services for certain retirement accounts invested in the fund. For the year ended December 31, 2012, expenses incurred pursuant to these service agreements were $181,000 for Price Associates; $1,985,000 for T. Rowe Price Services, Inc.; and $502,000 for T. Rowe Price Retirement Plan Services, Inc. The total amount payable at period-end pursuant to these service agreements is reflected as Due to Affiliates in the accompanying financial statements.
Additionally, the fund is one of several mutual funds in which certain college savings plans managed by Price Associates may invest. As approved by the fund’s Board of Directors, shareholder servicing costs associated with each college savings plan are borne by the fund in proportion to the average daily value of its shares owned by the college savings plan. For the year ended December 31, 2012, the fund was charged $46,000 for shareholder servicing costs related to the college savings plans, of which $32,000 was for services provided by Price. The amount payable at period-end pursuant to this agreement is reflected as Due to Affiliates in the accompanying financial statements. At December 31, 2012, less than 1% of the outstanding shares of the fund were held by college savings plans.
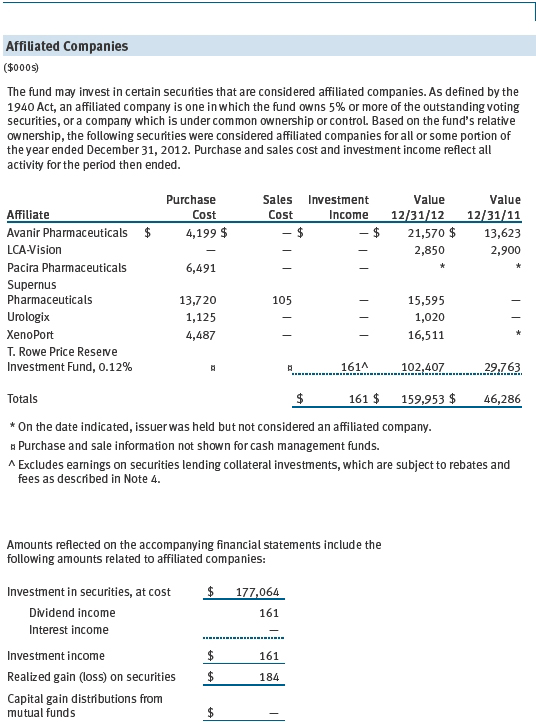
The fund may invest in the T. Rowe Price Reserve Investment Fund and the T. Rowe Price Government Reserve Investment Fund (collectively, the T. Rowe Price Reserve Investment Funds), open-end management investment companies managed by Price Associates and considered affiliates of the fund. The T. Rowe Price Reserve Investment Funds are offered as cash management options to mutual funds, trusts, and other accounts managed by Price Associates and/or its affiliates and are not available for direct purchase by members of the public. The T. Rowe Price Reserve Investment Funds pay no investment management fees.
As of December 31, 2012, T. Rowe Price Group, Inc., and/or its wholly owned subsidiaries owned 380,491 shares of the fund, representing less than 1% of the fund’s net assets.
| Report of Independent Registered Public Accounting Firm |
To the Board of Directors and Shareholders of
T. Rowe Price Health Sciences Fund, Inc.
In our opinion, the accompanying statement of assets and liabilities, including the portfolio of investments, and the related statements of operations and of changes in net assets and the financial highlights present fairly, in all material respects, the financial position of T. Rowe Price Health Sciences Fund, Inc. (the “Fund”) at December 31, 2012, and the results of its operations, the changes in its net assets and the financial highlights for each of the periods indicated therein, in conformity with accounting principles generally accepted in the United States of America. These financial statements and financial highlights (hereafter referred to as “financial statements”) are the responsibility of the Fund’s management; our responsibility is to express an opinion on these financial statements based on our audits. We conducted our audits of these financial statements in accordance with the standards of the Public Company Accounting Oversight Board (United States). Those standards require that we plan and perform the audit to obtain reasonable assurance about whether the financial statements are free of material misstatement. An audit includes examining, on a test basis, evidence supporting the amounts and disclosures in the financial statements, assessing the accounting principles used and significant estimates made by management, and evaluating the overall financial statement presentation. We believe that our audits, which included confirmation of securities at December 31, 2012 by correspondence with the custodian and brokers, and confirmation of the underlying funds by correspondence with the transfer agent, provide a reasonable basis for our opinion.
PricewaterhouseCoopers LLP
Baltimore, Maryland
February 15, 2013
| Tax Information (Unaudited) for the Tax Year Ended 12/31/12 |
We are providing this information as required by the Internal Revenue Code. The amounts shown may differ from those elsewhere in this report because of differences between tax and financial reporting requirements.
The fund’s distributions to shareholders included:
- $51,207,000 from short-term capital gains,
- $163,808,000 from long-term capital gains, subject to the 15% rate gains category.
For taxable non-corporate shareholders, $50,181,000 of the fund’s income represents qualified dividend income subject to the 15% rate category.
For corporate shareholders, $22,869,000 of the fund’s income qualifies for the dividends-received deduction.
| Information on Proxy Voting Policies, Procedures, and Records |
A description of the policies and procedures used by T. Rowe Price funds and portfolios to determine how to vote proxies relating to portfolio securities is available in each fund’s Statement of Additional Information, which you may request by calling 1-800-225-5132 or by accessing the SEC’s website, sec.gov. The description of our proxy voting policies and procedures is also available on our website, troweprice.com. To access it, click on the words “Our Company” at the top of our corporate homepage. Then, when the next page appears, click on the words “Proxy Voting Policies” on the left side of the page.
Each fund’s most recent annual proxy voting record is available on our website and through the SEC’s website. To access it through our website, follow the directions above, then click on the words “Proxy Voting Records” on the right side of the Proxy Voting Policies page.
| How to Obtain Quarterly Portfolio Holdings |
The fund files a complete schedule of portfolio holdings with the Securities and Exchange Commission for the first and third quarters of each fiscal year on Form N-Q. The fund’s Form N-Q is available electronically on the SEC’s website (sec.gov); hard copies may be reviewed and copied at the SEC’s Public Reference Room, 100 F St. N.E., Washington, DC 20549. For more information on the Public Reference Room, call 1-800-SEC-0330.
| About the Fund’s Directors and Officers |
Your fund is overseen by a Board of Directors (Board) that meets regularly to review a wide variety of matters affecting the fund, including performance, investment programs, compliance matters, advisory fees and expenses, service providers, and other business affairs. The Board elects the fund’s officers, who are listed in the final table. At least 75% of the Board’s members are independent of T. Rowe Price Associates, Inc. (T. Rowe Price), and its affiliates; “inside” or “interested” directors are employees or officers of T. Rowe Price. The business address of each director and officer is 100 East Pratt Street, Baltimore, Maryland 21202. The Statement of Additional Information includes additional information about the fund directors and is available without charge by calling a T. Rowe Price representative at 1-800-638-5660.
| Independent Directors | ||
| Name | ||
| (Year of Birth) | ||
| Year Elected* | ||
| [Number of T. Rowe Price | Principal Occupation(s) and Directorships of Public Companies and | |
| Portfolios Overseen] | Other Investment Companies During the Past Five Years | |
| William R. Brody, M.D., Ph.D. | President and Trustee, Salk Institute for Biological Studies (2009 | |
| (1944) | to present); Director, Novartis, Inc. (2009 to present); Director, IBM | |
| 2009 | (2007 to present); President and Trustee, Johns Hopkins University | |
| [142] | (1996 to 2009); Chairman of Executive Committee and Trustee, | |
| Johns Hopkins Health System (1996 to 2009) | ||
| Anthony W. Deering | Chairman, Exeter Capital, LLC, a private investment firm (2004 | |
| (1945) | to present); Director, Under Armour (2008 to present); Director, | |
| 2001 | Vornado Real Estate Investment Trust (2004 to present); Director | |
| [142] | and Member of the Advisory Board, Deutsche Bank North America | |
| (2004 to present); Director, Mercantile Bankshares (2002 to 2007) | ||
| Donald W. Dick, Jr. | Principal, EuroCapital Partners, LLC, an acquisition and management | |
| (1943) | advisory firm (1995 to present) | |
| 1995 | ||
| [142] | ||
| Robert J. Gerrard, Jr. | Chairman of Compensation Committee, Syniverse Holdings, Inc. | |
| (1952) | (2008 to 2011); Executive Vice President and General Counsel, | |
| 2012 | Scripps Networks, LLC (1997 to 2009); and Advisory Board member, | |
| [90] | Pipeline Crisis/Winning Strategies (1997 to present); Director, | |
| Syniverse Holdings, Inc. (2008 to 2011) | ||
| Karen N. Horn | Senior Managing Director, Brock Capital Group, an advisory and | |
| (1943) | investment banking firm (2004 to present); Director, Eli Lilly and | |
| 2003 | Company (1987 to present); Director, Simon Property Group (2004 | |
| [142] | to present); Director, Norfolk Southern (2008 to present); Director, | |
| Fannie Mae (2006 to 2008) | ||
| Theo C. Rodgers | President, A&R Development Corporation (1977 to present) | |
| (1941) | ||
| 2005 | ||
| [142] | ||
| Cecilia E. Rouse, Ph.D. | Professor and Researcher, Princeton University (1992 to present); | |
| (1963) | Director, MDRC (2011 to present); Member, National Academy of | |
| 2012 | Education (2010 to present); Research Associate, National Bureau | |
| [90] | of Economic Research’s Labor Studies Program (1998 to 2009 | |
| and 2011 to present); Member, President’s Council of Economic | ||
| Advisors (2009 to 2011); Member, The MacArthur Foundation | ||
| Network on the Transition to Adulthood and Public Policy (2000 to | ||
| 2008); Member, National Advisory Committee for the Robert Wood | ||
| Johnson Foundation’s Scholars in Health Policy Research Program | ||
| (2008); Director and Member, National Economic Association | ||
| (2006 to 2008); Member, Association of Public Policy Analysis and | ||
| Management Policy Council (2006 to 2008); Member, Hamilton | ||
| Project’s Advisory Board at The Brookings Institute (2006 to | ||
| 2008); and Chair of Committee on the Status of Minority Groups | ||
| in the Economic Profession, American Economic Association | ||
| (2006 to 2008) | ||
| John G. Schreiber | Owner/President, Centaur Capital Partners, Inc., a real estate | |
| (1946) | investment company (1991 to present); Cofounder and Partner, | |
| 2001 | Blackstone Real Estate Advisors, L.P. (1992 to present); Director, | |
| [142] | General Growth Properties, Inc. (2010 to present) | |
| Mark R. Tercek | President and Chief Executive Officer, The Nature Conservancy | |
| (1957) | (2008 to present); Managing Director, The Goldman Sachs Group, | |
| 2009 | Inc. (1984 to 2008) | |
| [142] | ||
| *Each independent director serves until retirement, resignation, or election of a successor. | ||
| Inside Directors | ||
| Name | ||
| (Year of Birth) | ||
| Year Elected* | ||
| [Number of T. Rowe Price | Principal Occupation(s) and Directorships of Public Companies and | |
| Portfolios Overseen] | Other Investment Companies During the Past Five Years | |
| Edward C. Bernard | Director and Vice President, T. Rowe Price; Vice Chairman of the | |
| (1956) | Board, Director, and Vice President, T. Rowe Price Group, Inc.; | |
| 2006 | Chairman of the Board, Director, and President, T. Rowe Price | |
| [142] | Investment Services, Inc.; Chairman of the Board and Director, | |
| T. Rowe Price Retirement Plan Services, Inc., T. Rowe Price Savings | ||
| Bank, and T. Rowe Price Services, Inc.; Chairman of the Board, Chief | ||
| Executive Officer, and Director, T. Rowe Price International; Chief | ||
| Executive Officer, Chairman of the Board, Director, and President, | ||
| T. Rowe Price Trust Company; Chairman of the Board, all funds | ||
| John H. Laporte, CFA | Vice President, T. Rowe Price, T. Rowe Price Group, Inc., and | |
| (1945) | T. Rowe Price Trust Company | |
| 1995 | ||
| [16] | ||
| *Each inside director serves until retirement, resignation, or election of a successor. | ||
| Officers | ||
| Name (Year of Birth) | ||
| Position Held With Health Sciences Fund | Principal Occupation(s) | |
| Ziad Bakri, M.D. CFA (1980) | Vice President, T. Rowe Price; formerly Vice | |
| Vice President | President, Cowen and Company (to 2012) | |
| G. Mark Bussard (1972) | Vice President, T. Rowe Price and T. Rowe Price | |
| Vice President | Group, Inc. | |
| Roger L. Fiery III, CPA (1959) | Vice President, Price Hong Kong, Price | |
| Vice President | Singapore, T. Rowe Price, T. Rowe Price Group, | |
| Inc., T. Rowe Price International, and T. Rowe | ||
| Price Trust Company | ||
| Melissa C. Gallagher (1974) | Vice President, T. Rowe Price Group, Inc., and | |
| Vice President | T. Rowe Price International; formerly European | |
| Pharmaceuticals and Biotech Analyst, Bear | ||
| Stearns International Ltd. (to 2008) | ||
| John R. Gilner (1961) | Chief Compliance Officer and Vice President, | |
| Chief Compliance Officer | T. Rowe Price; Vice President, T. Rowe Price | |
| Group, Inc., and T. Rowe Price Investment | ||
| Services, Inc. | ||
| Gregory S. Golczewski (1966) | Vice President, T. Rowe Price and T. Rowe Price | |
| Vice President | Trust Company | |
| Gregory K. Hinkle, CPA (1958) | Vice President, T. Rowe Price, T. Rowe Price | |
| Treasurer | Group, Inc., and T. Rowe Price Trust Company | |
| Kris H. Jenner, M.D., D.Phil. (1962) | Vice President, T. Rowe Price, T. Rowe Price | |
| President | Group, Inc., and T. Rowe Price International | |
| Patricia B. Lippert (1953) | Assistant Vice President, T. Rowe Price and | |
| Secretary | T. Rowe Price Investment Services, Inc. | |
| Graham M. McPhail (1975) | Vice President, T. Rowe Price and T. Rowe | |
| Vice President | Price Group, Inc.; formerly Analyst, The Boston | |
| Company Asset Management (to 2008) | ||
| Jason Nogueira, CFA (1974) | Vice President, T. Rowe Price and T. Rowe Price | |
| Vice President | Group, Inc. | |
| David Oestreicher (1967) | Director, Vice President, and Secretary, T. Rowe | |
| Vice President | Price Investment Services, Inc., T. Rowe | |
| Price Retirement Plan Services, Inc., T. Rowe | ||
| Price Services, Inc., and T. Rowe Price Trust | ||
| Company; Vice President and Secretary, | ||
| T. Rowe Price, T. Rowe Price Group, Inc., and | ||
| T. Rowe Price International; Vice President, | ||
| Price Hong Kong and Price Singapore | ||
| Charles G. Pepin (1966) | Director, T. Rowe Price Trust Company; Vice | |
| Vice President | President, T. Rowe Price and T. Rowe Price | |
| Group, Inc. | ||
| Deborah D. Seidel (1962) | Vice President, T. Rowe Price, T. Rowe Price | |
| Vice President | Group, Inc., T. Rowe Price Investment Services, | |
| Inc., and T. Rowe Price Services, Inc. | ||
| John C.A. Sherman (1969) | Vice President, T. Rowe Price Group, Inc., and | |
| Vice President | T. Rowe Price International | |
| Taymour R. Tamaddon, CFA (1976) | Vice President, T. Rowe Price and T. Rowe Price | |
| Vice President | Group, Inc. | |
| Julie L. Waples (1970) | Vice President, T. Rowe Price | |
| Vice President | ||
| Rouven J. Wool-Lewis, Ph.D. (1973) | Vice President, T. Rowe Price and T. Rowe | |
| Vice President | Price Group, Inc.; formerly Vice President | |
| of Corporate Strategy, UnitedHealth Group | ||
| (to 2011); Associate Analyst, Oppenheimer | ||
| & Company (to 2009); Senior Associate, | ||
| Friedman, Billings, Ramsey & Co. (to 2008) | ||
| Unless otherwise noted, officers have been employees of T. Rowe Price or T. Rowe Price International for at least 5 years. | ||
Item 2. Code of Ethics.
The registrant has adopted a code of ethics, as defined in Item 2 of Form N-CSR, applicable to its principal executive officer, principal financial officer, principal accounting officer or controller, or persons performing similar functions. A copy of this code of ethics is filed as an exhibit to this Form N-CSR. No substantive amendments were approved or waivers were granted to this code of ethics during the period covered by this report.
Item 3. Audit Committee Financial Expert.
The registrant’s Board of Directors/Trustees has determined that Mr. Anthony W. Deering qualifies as an audit committee financial expert, as defined in Item 3 of Form N-CSR. Mr. Deering is considered independent for purposes of Item 3 of Form N-CSR.
Item 4. Principal Accountant Fees and Services.
(a) – (d) Aggregate fees billed for the last two fiscal years for professional services rendered to, or on behalf of, the registrant by the registrant’s principal accountant were as follows:
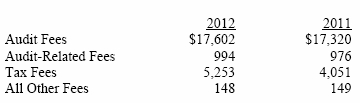
Audit fees include amounts related to the audit of the registrant’s annual financial statements and services normally provided by the accountant in connection with statutory and regulatory filings. Audit-related fees include amounts reasonably related to the performance of the audit of the registrant’s financial statements and specifically include the issuance of a report on internal controls and, if applicable, agreed-upon procedures related to fund acquisitions. Tax fees include amounts related to services for tax compliance, tax planning, and tax advice. The nature of these services specifically includes the review of distribution calculations and the preparation of Federal, state, and excise tax returns. All other fees include the registrant’s pro-rata share of amounts for agreed-upon procedures in conjunction with service contract approvals by the registrant’s Board of Directors/Trustees.
(e)(1) The registrant’s audit committee has adopted a policy whereby audit and non-audit services performed by the registrant’s principal accountant for the registrant, its investment adviser, and any entity controlling, controlled by, or under common control with the investment adviser that provides ongoing services to the registrant require pre-approval in advance at regularly scheduled audit committee meetings. If such a service is required between regularly scheduled audit committee meetings, pre-approval may be authorized by one audit committee member with ratification at the next scheduled audit committee meeting. Waiver of pre-approval for audit or non-audit services requiring fees of a de minimis amount is not permitted.
(2) No services included in (b) – (d) above were approved pursuant to paragraph (c)(7)(i)(C) of Rule 2-01 of Regulation S-X.
(f) Less than 50 percent of the hours expended on the principal accountant’s engagement to audit the registrant’s financial statements for the most recent fiscal year were attributed to work performed by persons other than the principal accountant’s full-time, permanent employees.
(g) The aggregate fees billed for the most recent fiscal year and the preceding fiscal year by the registrant’s principal accountant for non-audit services rendered to the registrant, its investment adviser, and any entity controlling, controlled by, or under common control with the investment adviser that provides ongoing services to the registrant were $1,802,000 and $1,764,000, respectively.
(h) All non-audit services rendered in (g) above were pre-approved by the registrant’s audit committee. Accordingly, these services were considered by the registrant’s audit committee in maintaining the principal accountant’s independence.
Item 5. Audit Committee of Listed Registrants.
Not applicable.
Item 6. Investments.
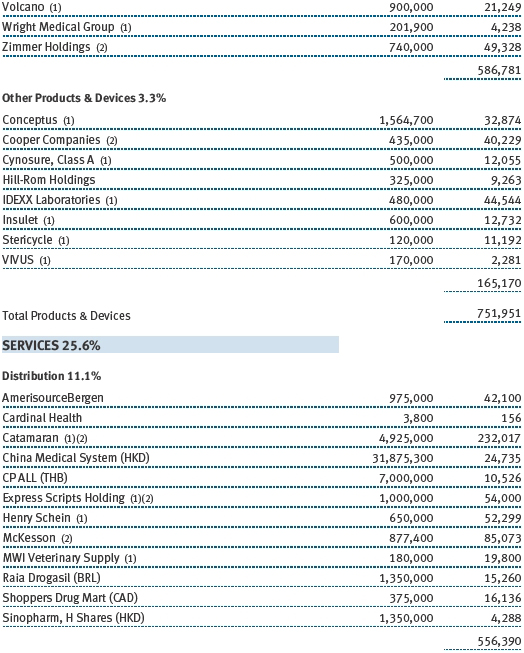
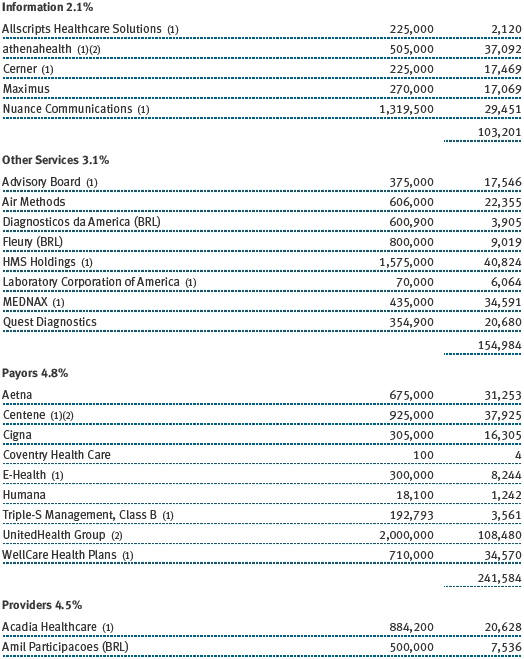
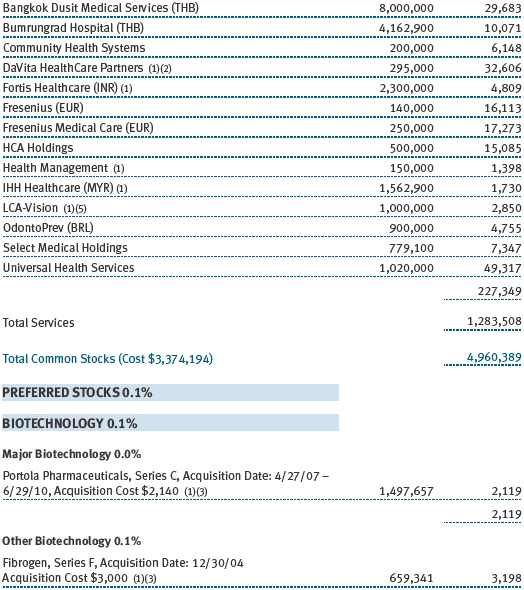
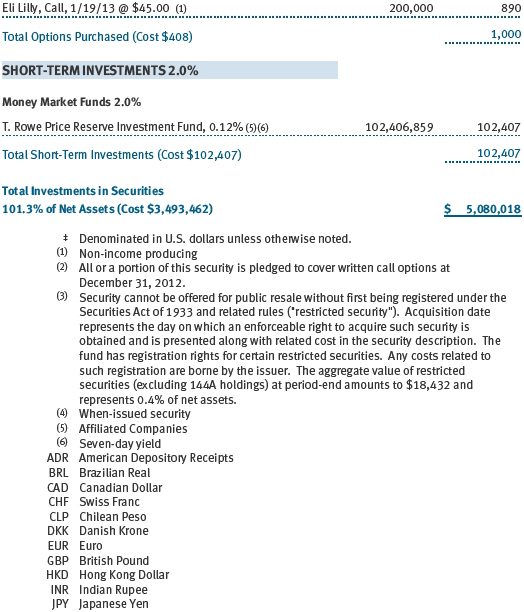
(a) Not applicable. The complete schedule of investments is included in Item 1 of this Form N-CSR.
(b) Not applicable.
Item 7. Disclosure of Proxy Voting Policies and Procedures for Closed-End Management Investment Companies.
Not applicable.
Item 8. Portfolio Managers of Closed-End Management Investment Companies.
Not applicable.
Item 9. Purchases of Equity Securities by Closed-End Management Investment Company and Affiliated Purchasers.
Not applicable.
Item 10. Submission of Matters to a Vote of Security Holders.
Not applicable.
Item 11. Controls and Procedures.
(a) The registrant’s principal executive officer and principal financial officer have evaluated the registrant’s disclosure controls and procedures within 90 days of this filing and have concluded that the registrant’s disclosure controls and procedures were effective, as of that date, in ensuring that information required to be disclosed by the registrant in this Form N-CSR was recorded, processed, summarized, and reported timely.
(b) The registrant’s principal executive officer and principal financial officer are aware of no change in the registrant’s internal control over financial reporting that occurred during the registrant’s second fiscal quarter covered by this report that has materially affected, or is reasonably likely to materially affect, the registrant’s internal control over financial reporting.
Item 12. Exhibits.
(a)(1) The registrant’s code of ethics pursuant to Item 2 of Form N-CSR is attached.
(2) Separate certifications by the registrant's principal executive officer and principal financial officer, pursuant to Section 302 of the Sarbanes-Oxley Act of 2002 and required by Rule 30a-2(a) under the Investment Company Act of 1940, are attached.
(3) Written solicitation to repurchase securities issued by closed-end companies: not applicable.
(b) A certification by the registrant's principal executive officer and principal financial officer, pursuant to Section 906 of the Sarbanes-Oxley Act of 2002 and required by Rule 30a-2(b) under the Investment Company Act of 1940, is attached.
SIGNATURES
Pursuant to the requirements of the Securities Exchange Act of 1934 and the Investment Company Act of 1940, the registrant has duly caused this report to be signed on its behalf by the undersigned, thereunto duly authorized.
T. Rowe Price Health Sciences Fund, Inc.
| By | /s/ Edward C. Bernard | |
| Edward C. Bernard | ||
| Principal Executive Officer | ||
| Date February 15, 2013 | ||
Pursuant to the requirements of the Securities Exchange Act of 1934 and the Investment Company Act of 1940, this report has been signed below by the following persons on behalf of the registrant and in the capacities and on the dates indicated.
| By | /s/ Edward C. Bernard | |
| Edward C. Bernard | ||
| Principal Executive Officer | ||
| Date February 15, 2013 | ||
| By | /s/ Gregory K. Hinkle | |
| Gregory K. Hinkle | ||
| Principal Financial Officer | ||
| Date February 15, 2013 | ||