QuickLinks -- Click here to rapidly navigate through this document
SECURITIES AND EXCHANGE COMMISSION
Washington, DC 20549
FORM 6-K
REPORT OF FOREIGN ISSUER
PURSUANT TO RULE 13a-16 or 15d-16 OF
THE SECURITIES EXCHANGE ACT OF 1934
For the month of October, 2004
Commission File Number:1-14118
THE THIRD QUARTER 2004 FINANCIAL RESULTS
QUEBECOR WORLD INC.
(Translation of Registrant's Name into English)
612 Saint-Jacques Street, Montreal, Quebec H3C 4M8
(Address of Principal Executive Office)
Indicate by check mark whether the registrant files or will file annual reports under cover of Form 20-F or Form 40-F
Form 20-F o Form 40-F ý
Indicate by check mark if the registrant is submitting the Form 6-K in paper as permitted by Regulation S-T Rule 101(b)(1):
Note: Regulation S-T Rule 101(b)(1) only permits the submission in paper of a Form 6-K if submitted solely to provide an attached annual report to security holders.
Indicate by check mark if the registrant is submitting the Fork 6-K in paper as permitted by Regulation S-T Rule 101(b)(7):
Note: Regulation S-T Rule 101(b)(7) only permits the submission in paper of a Form 6-K if submitted to furnish a report or other document that the registrant foreign private issuer must furnish and make public under the laws of the jurisdiction in which the registrant is incorporated, domiciled or legally organized (the registrant's "home country"), or under the rules of the home country exchange on which the registrant's securities are traded, as long as the report or other document is not a press release, is not required to be and has not been distributed to the registrant's security holders, and, if discussing a material event, has already been the subject of a Form 6-K submission or other filing on EDGAR.
Indicate by check mark whether the registrant by furnishing the information contained in this form is also thereby furnishing the information to the Commission pursuant to Rule 12g3-2(b) under the Securities Exchange Act of 1934.
Yes o No ý
If "Yes" is marked, indicate below the file number assigned to the registrant in connection with Rule 12g3-2(b): 82- .
QUEBECOR WORLD INC.
Filed in this Form 6-K
Documents index
- Press Release dated October 27, 2004; Financial Highlights
- Management's Discussion and Analysis of Financial Condition and Results of Operations
- Consolidated Financial Statements
- Certifications pursuant to Multilateral Instrument 52-109 Certification of Disclosure in Issuers' Annual and Interim Filings
![]()
October 27, 2004 21/04
For immediate release Page 1 of 6
QUEBECOR WORLD ANNOUNCES THIRD QUARTER RESULTS
Montréal, Canada - Quebecor World (NYSE:IQW, TSX:IQW.SV) announces that for the third quarter 2004 the Company reported net income of $59 million or $0.37 per share, before impairment of assets, restructuring and other charges. This compares to $55 million or $0.34 per share in the third quarter of last year. On the same basis, operating income was $115 million compared to $117 million during the same period last year. Consolidated revenues for the quarter were $1.63 billion compared to $1.60 billion last year and were essentially flat when adjusted for currency translation. Reported net income for the third quarter of 2004 was $48 million compared to a $60 million in 2003.
For the first nine months of 2004 net income was $148 million or $0.91 per share, before impairment of assets, restructuring and other charges. This compares to $78 million or $0.37 per share for the first nine months of 2003. Consolidated revenues for the first three quarters of 2004 were $4.7 billion compared to $4.6 billion during the same period last year. Year-to-date reported net income was $99 million compared to $23 million for the first nine months of 2003.
"We have made significant progress this year in improving our results in a challenging market environment," said Pierre Karl Péladeau, President and CEO, Quebecor World Inc. "In the third quarter we continued to demonstrate year over year improvement in many areas, albeit not in the same order of magnitude as our earlier results. This is largely attributed to our third quarter restructuring initiatives that included the closing and downsizing of certain facilities and the redeployment of equipment within the platform. This situation was not helped by negative pricing pressures. The installation of new presses, beginning in the third and fourth quarters of 2005, will help to counterbalance the pricing impact on our results."
For immediate release Page 2 of 6
In the third quarter, the Company recorded impairment of assets, restructuring and other charges of $12.9 million. The largest portion of this charge is associated with the Company's decision to close its printing facility in Stockholm, Sweden. The Company expects to incur an additional $10 million in restructuring in the fourth quarter and 2005 related to this closure. The remainder of the third quarter charge includes costs involving earlier decisions to reorganize Quebecor World's U.S. magazine and book platforms, and other workforce reductions across the Company. The third quarter initiatives affected 282 employees in total, however the Company estimates that 29 new jobs will be created in other facilities. As a result of these new initiatives 95 positions have been eliminated and 187 will be eliminated before December 31, 2004.
Quebecor World recorded specific charges of $6 million in the third quarter for various items including workers' compensation claims related to plant closures and downsizing in North America and provisions for leases.
In the third quarter 2004, selling, general and administrative expenses were $118 million compared to $119 million in the third quarter of 2003. Excluding the unfavourable impact of currency translation selling, general and administrative expenses were lower by $3 million compared to the same period last year. In the third quarter, increases in pension expense and higher healthcare costs partially offset the impact of cost reductions. On a year-to-date basis, excluding the positive effects of currency translation and specific charges, SG&A expenses were lower by $42 million compared to the first nine months of last year. Financial expenses for the third quarter were $32 million, a $10 million decrease compared to the same quarter in 2003. On a year-to-date basis financial expense was $102 million compared to $126 million for the first three quarters of 2003.
North America
In North America operating income increased to $113 million in the third quarter 2004, before impairment of assets, restructuring and other charges, compared to $109 million last year. On the same basis, operating margin increased to 8.7% from 8.5%. Revenues increased to $1.29 billion compared to $1.28 billion in 2003. Magazine revenues in the quarter were essentially flat compared to 2003. Volumes were flat for the quarter and up 3% year-to-date. Year-to-date operating income and margins have improved compared to the same period in 2003 because of cost containment and headcount reductions. However in the third quarter magazine operations were adversely affected by the transfer of presses and certain work to other facilities related to the implementation of restructuring initiatives that resulted in reduced efficiencies. In catalogs, volume for the quarter was up 1% but revenues were down due to reduced prices, certain operational inefficiencies and overall product m ix. In the retail group revenues and volume increased for the quarter and year-to-date partially offsetting a lower price environment. Operating income and margin improved compared to last year as a result of cost containment initiatives. In book and directory revenues were
For immediate release Page 3 of 6
flat compared to the third quarter of 2003. In the book group volume was up in the third quarter as a result of strong demand in the adult trade and educational sectors. In directory, volume was up for the quarter and year to date which is explained by more volume from independent directory publishers replacing one major contract terminated in 2003. In the commercial/direct group revenues were down for the quarter and year-to-date due to intense competition in the sector. In Canada revenues and volume increased. Excluding the favourable impact of currency, revenues were flat in the quarter and down year-to-date compared to last year.
Europe
In Europe revenues in the third quarter increased 8% to $296 million compared to $273 million in the same period last year. Excluding the positive effect of currency translation revenues were down slightly for the quarter but up 3% year-to-date compared to the same period in 2003. European volume increased 2% in the third quarter and 5% year-to-date due to strong performance in the magazine and retail sectors. In France, operating margin was negative in the third quarter but improved over last year due to the benefits of restructuring. European operations outside France showed improvements in operating income and margin in the third quarter and year-to-date compared to last year.
Latin America
In Latin America revenues in the third quarter were $45 million compared to $41 million during the same period last year. Year-to-date revenues increased 5% to $136 million compared to $129 million last year. Volume was up 25% in the quarter and 9% for the first nine months of 2004. Operating margins for the third quarter and year-to-date also increased compared to last year as the result of improved efficiencies and the benefits of cost containment.
Dividend
The Board of Directors declared a dividend of $0.13 per share on Multiple Voting Shares and Subordinate Voting Shares. The Board also declared a dividend of CDN$0.3845 per share on Series 3 Preferred Shares, CDN$0.421875 per share on Series 4 Preferred Shares and CDN$0.43125 per share on Series 5 Preferred Shares. The dividends are payable on December 1, 2004 to shareholders of record at the close of business November 12, 2004.
Management Discussion and Analysis
Please refer to the MD&A for the reconciliation to Canadian generally accepted accounting principles of certain figures used to explain these results. The MD&A can be found on the Company's website atwww.quebecorworld.com and through the SEDAR and SEC filings.
For immediate release Page 4 of 6
Financial statements are available on the Company's website and through the SEDAR and SEC filings.
Sedar web address:www.sedar.com
SEC web address:www.sec.gov
Quebecor World To Webcast Investor Conference Call on Oct. 27, 2004
Quebecor World Inc. will broadcast its Third Quarter conference call live over the Internet on October 27, 2004 at 4:00 PM (Eastern Time).
The conference call, which will last approximately one hour, will be webcast live and can be accessed on the Quebecor World web site:
http://www.quebecorworld.com/en/investors/webcasts/Q304
Prior to the call please ensure that you have the appropriate software. The Quebecor World web address listed above has instructions and a direct link to download the necessary software, free of charge.
Anyone unable to attend this conference call may listen to the replay tape by phoning (416) 695-5275 or (866) 518-1010, available from October 27, 2004 to November 4, 2004.
Except for historical information contained herein, the statements in this release are forward-looking and made pursuant to the safe harbor provisions of the Private Securities Litigation Reform Act of 1995. Forward-looking statements involve known and unknown risks and uncertainties that may cause the Company's actual results in future periods to differ materially from forecasted results. Those risks include, among others, changes in customers' demand for the Company's products, changes in raw material and equipment costs and availability, seasonal changes in customer orders, pricing actions by the Company's competitors, and general changes in economic conditions.
Quebecor World Inc. (NYSE:IQW; TSX:IQW.SV) is one of the largest commercial printers in the world. It is a market leader in most of its major product categories which include Magazines, inserts and circulars, books, catalogs, specialty printing and direct mail, directories, digital pre-media, logistics, mail list technologies and other value added services. The Company has approximately 37,000 employees working in more than 160 printing and related facilities in the United States, Canada, Brazil, France, the United Kingdom, Belgium, Spain, Austria, Sweden, Switzerland, Finland, Chile, Argentina, Peru, Colombia, Mexico and India.
- 30 -
For immediate release Page 5 of 6
Web address:www.quebecorworld.com
For further Information contact:
Jeremy Roberts
Vice-President,
Corporate Finance and Treasurer
Quebecor World Inc.
(514) 877-5118
(800) 567-7070
Tony Ross
Director, Communications
Quebecor World Inc.
(514) 877-5317
(800) 567-7070
QUEBECOR WORLD INC.
FINANCIAL HIGHLIGHTS
Periods ended September 30
(In millions of US dollars, except per share data)
(Unaudited)
| | Three months | Nine months | ||||||||||||
|---|---|---|---|---|---|---|---|---|---|---|---|---|---|---|
| | 2004 | 2003 | 2004 | 2003 | ||||||||||
| Consolidated Results | ||||||||||||||
| Revenues | $ | 1,633.0 | $ | 1,596.8 | $ | 4,727.4 | $ | 4,649.9 | ||||||
| Operating income before depreciation and amortization and before IAROC | 202.2 | 205.0 | 588.7 | 496.2 | ||||||||||
| Operating income before IAROC | 114.6 | 116.5 | 320.6 | 229.5 | ||||||||||
| IAROC | 12.9 | (5.0 | ) | 68.9 | 76.8 | |||||||||
| Operating income | 101.7 | 121.5 | 251.7 | 152.7 | ||||||||||
| Net income | 48.1 | 59.7 | 99.2 | 22.5 | ||||||||||
| Cash provided by operating activities | 41.4 | 59.8 | 106.9 | 65.5 | ||||||||||
| Free cash flow (outflow) from operations* | (0.1 | ) | 14.0 | (18.3 | ) | (163.8 | ) | |||||||
| Operating margin before depreciation and amortization and before IAROC ** | 12.4 | % | 12.8 | % | 12.5 | % | 10.7 | % | ||||||
| Operating margin before IAROC ** | 7.0 | % | 7.3 | % | 6.8 | % | 4.9 | % | ||||||
| Operating margin** | 6.2 | % | 7.6 | % | 5.3 | % | 3.3 | % | ||||||
| Segmented Information | ||||||||||||||
| Revenues | ||||||||||||||
| North America | $ | 1,291.6 | $ | 1,282.2 | $ | 3,672.1 | $ | 3,707.8 | ||||||
| Europe | 295.7 | 273.2 | 920.8 | 811.1 | ||||||||||
| Latin America | 45.0 | 40.6 | 136.2 | 129.4 | ||||||||||
Operating income (loss) before IAROC | ||||||||||||||
| North America | $ | 112.7 | $ | 108.5 | $ | 295.2 | $ | 233.1 | ||||||
| Europe | 9.3 | 6.2 | 33.6 | 6.2 | ||||||||||
| Latin America | 1.1 | 0.8 | 3.1 | (4.6 | ) | |||||||||
Operating margins before IAROC** | ||||||||||||||
| North America | 8.7 | % | 8.5 | % | 8.0 | % | 6.3 | % | ||||||
| Europe | 3.1 | % | 2.3 | % | 3.6 | % | 0.8 | % | ||||||
| Latin America | 2.5 | % | 2.1 | % | 2.3 | % | (3.5 | )% | ||||||
Financial Position | ||||||||||||||
| Working capital | $ | 92.8 | $ | 23.6 | ||||||||||
| Total assets | $ | 6,281.0 | $ | 6,370.9 | ||||||||||
| Long-term debt (including convertible notes) | $ | 2,162.2 | $ | 2,268.4 | ||||||||||
| Shareholders' equity | $ | 2,529.9 | $ | 2,548.3 | ||||||||||
| Debt-to-capitalization | 46:54 | 47:53 | ||||||||||||
Per Share Data | ||||||||||||||
| Earnings (loss) | ||||||||||||||
| Diluted | $ | 0.29 | $ | 0.38 | $ | 0.55 | $ | (0.03 | ) | |||||
| Diluted before IAROC | $ | 0.37 | $ | 0.34 | $ | 0.91 | $ | 0.37 | ||||||
| Dividends on equity shares | $ | 0.13 | $ | 0.13 | $ | 0.39 | $ | 0.39 | ||||||
| Book value | $ | 15.65 | $ | 15.87 | ||||||||||
IAROC: Impairment of assets, restructuring and other charges.
- *
- Cash provided by operating activities, less capital expenditures net of proceeds from disposals, and preferred share dividends.
- **
- Margins calculated on revenues.
MANAGEMENT'S DISCUSSION AND ANALYSIS OF
FINANCIAL CONDITION AND RESULTS OF OPERATIONS
OVERVIEW
Quebecor World Inc. is one of the largest commercial print media services companies in the world. Quebecor World is the market leader in most of its product categories and geographies. This market-leading position has been built through a combination of integrating acquisitions, investing in key strategic technologies and a commitment to building long-term partnerships with the world's leading print media customers.
Quebecor World has facilities in the United States, Canada, France, the United Kingdom, Spain, Switzerland, Sweden, Finland, Austria, Belgium, Brazil, Chile, Argentina, Peru, Colombia, Mexico and India.
The Company offers its customers a broad range of printed products and related communication services, such as magazines, retail inserts, catalogs, specialty printing and direct mail, books, directories, pre-media, logistics and other value-added services.
The Company operates in the commercial print media segment of the printing industry and its business groups are located in three geographical regions: North America, which historically represents approximately 80% of the Company's revenues, Europe and Latin America. This industry has experienced difficult economic conditions in the last three years. Weaker demand and overcapacity have given rise to increased competition and a significant erosion in prices.
The primary drivers affecting the Company are consumer confidence and economic growth rates. These key drivers of demand for commercial print media affect the level of advertising and merchandising activity. The Company uses magazine advertising pages as a key indicator of demand for printing products and services. This indicator, as measured in the United States by the Publishers Information Bureau, showed some positive signs in the last few months, but it may be too soon to conclude that a sustainable recovery is in place.
U.S. Magazine Advertising Pages 2000-2004 (Monthly)
Percentage Year-Over-Year Change
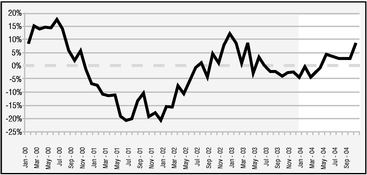
Source: Publishers Information Bureau (PIB)
Figure 1
The third quarter of 2004 saw overall volume increases in most of the Company's business groups, in line with the year-over-year increase in the U.S. magazine advertising pages indicator (figure 1). However, pricing pressures caused by global printing overcapacity continued to adversely impact revenues, offsetting gains obtained from volume increases.
In this challenging environment, the Company's approach has been to secure and increase new and existing volume and to adopt an uncompromising focus on cost containment. The Company's cost reduction initiatives, undertaken during the last 18 months, involved workforce reductions, closure or downsizing of facilities, decommissioning of under-performing assets, cutting overhead expenses, consolidating corporate functions and relocating sales and administrative offices into plants. This uncompromising focus on cost containment has reduced the long-term cost structure and improved efficiency and will be maintained throughout the Company.
During the third quarter of 2004, the Company announced the reorganization of its Nordic gravure platform, which will involve the closing of the Stockholm plant by the end of the year and the relocation of some equipment to facilities in Finland and Belgium. During the second quarter of 2004, the Company announced a long-term strategic plan which resulted in additional restructuring measures. The Company recorded impairment of assets and restructuring charges for the closing of one facility and the downsizing of another in its North American platform.
In July 2004, the Company announced a major capital investment as part of the strategic plan, to purchase 22 new presses for its U.S. manufacturing platform. The investment in this new equipment and technology will improve efficiency and through-put as well as enhance customer service by providing publishers and retailers with a more complete integrated and flexible multi-plant manufacturing network.
Financial data has been prepared in conformity with Canadian Generally Accepted Accounting Principles ("GAAP"). However, certain measures used in this discussion and analysis do not have any standardized meaning under Canadian GAAP. When used, these measures are defined in such terms to allow the reconciliation to the closest GAAP measure. Numerical reconciliations are provided in figure 6. It is unlikely that these measures could be compared to similar measures presented by other companies.
The Company's functional currency is the Canadian dollar and its reporting currency is the U.S. dollar.
REVIEW OF THIRD QUARTER AND YEAR-TO-DATE
The Company's consolidated revenues for the quarter were $1,633 million, a 2% increase when compared to $1,597 million for the same period in 2003. On a year-to-date basis, revenues were $4,727 million, up 2% from $4,650 million in 2003. Excluding the favorable impact of currency translation (see figure 3), revenues were flat for the quarter and down 1% year-to-date due to continued pressure on prices. However, the overall volume for the quarter and year-to-date was up compared to last year. Revenue by product is shown in figure 2.
Revenue by Product — Worldwide($ millions)
Nine-month periods ended September 30
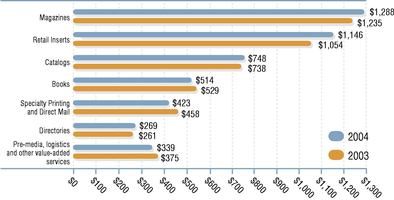
Figure 2
The Company assesses performance based on operating income before impairment of assets, restructuring and other charges. The following operating analyses are before impairment of assets, restructuring and other charges.
For the third quarter of 2004, operating income, before impairment of assets, restructuring and other charges, slightly decreased to $115 million, from $117 million in 2003. On a year-to-date basis, operating income, before impairment of assets, restructuring and other charges was $321 million, up 40% from $230 million in 2003. On the same basis, operating margin for the quarter decreased to 7.0% from 7.3% in 2003. On a year-to-date basis, operating margin improved to 6.8% in 2004 from 4.9% in 2003.
Impact of Foreign Currency ($ millions)
| | Three months ended September 30, 2004 | Nine months ended September 30, 2004 | ||||
|---|---|---|---|---|---|---|
| Foreign currency favorable impact on revenues | $ | 36.2 | $ | 136.9 | ||
| Foreign currency favorable impact on operating income | $ | 1.2 | $ | 3.8 | ||
Figure 3
In 2004, operating income was affected by recording net specific charges of $6 million in the third quarter and $10 million year-to-date for various items including provisions for leases, depreciation of assets, favorable legal claim settlements, and workers' compensation claims related to plant closures and downsizings, mainly in North America. In 2003, the Company incurred specific charges of $2 million for the third quarter and $56 million for the first nine months. This included a $15 million adjustment related to rapid growth and system issues in the North American Logistics business and a $15 million provision for doubtful accounts. The remaining balance was for write-downs of other assets, inventories and other items.
Cost of sales for the quarter increased 3% and 1% on a year-to-date basis compared to last year. Gross profit margin was 19.2% in the third quarter of 2004 from 19.9% in 2003. On a year-to-date basis, gross profit margin increased to 19.5% in 2004 from 18.8% in 2003. The 2004 and 2003 cost of sales included specific charges of $6 million and $2 million for the third quarter, respectively and $3 million and $36 million year-to-date. Excluding these specific items as well as the unfavorable impact of currency translation, gross profit margin for the quarter was 19.7% from 20.1% last year. On the same basis, year-to-date gross profit margin was 19.6% same as last year. Savings from headcount reductions were partly offset by increases in fringe benefits, including healthcare and pension, and operational inefficiencies in certain plants, mainly those involved with installation and transfer of equipment. Increase in freight cost, mainly due to higher fuel prices and new government hours of service regulation, also contributed in reducing the gross margin.
Selling, general and administrative expenses for the third quarter of 2004 were $118 million compared to $119 million in 2003, a decrease of $1 million. On a year-to-date basis, selling, general and administrative expenses were $350 million in 2004, compared to $395 million in 2003. Excluding the unfavorable impact of currency translation of $2 million, selling, general and administrative expenses were lower by $3 million for the third quarter compared to last year. On a year-to-date basis, excluding specific charges of $5 million in 2004 and $19 million in 2003, as well as the impact of currency translation of $11 million, selling, general and administrative expenses improved by $42 million. On a year-to-date basis, the savings were mostly explained by the workforce reduction: decreases in salaries and benefits and travel and entertainment expenses explained approximately 90% of the drop from 2003. For the third quarter of 2004, increases in fringe benefits, including pension, stock options and health care costs, partly offset the favorable impact of the workforce reduction.
Depreciation and amortization were $81 million in the third quarter of 2004 and $83 million in 2003. On a year-to-date basis, depreciation and amortization were $249 million in 2004, compared to $250 million in 2003. Excluding the impact of currency movement, depreciation and amortization decreased by 4% for the third quarter and 3% year-to-date, compared to 2003.
During the third quarter, the Company undertook additional restructuring initiatives and recorded a net impairment of assets and restructuring charges of $13 million,which included the closing of a facility in its Nordic gravure platform and a workforce reduction in North America. These measures are described in the section "Impairment of Assets and Restructuring Initiatives".
Financial expenses were $32 million in the third quarter of 2004, compared to $42 million in 2003. On a year-to-date basis, financial expenses were $102 million in 2004, compared to $126 million in 2003. Excluding a $2 million charge on extinguishment of long-term debt recorded in the first quarter of 2004, financial expenses decreased by $26 million on a year-to-date basis compared to last year. The lower expenses were mainly due to the favorable impact of the 2003 fourth quarter refinancing of long-term debt, combined with a lower average volume of debt, the increase in the proportion of US dollar denominated floating rate debt and reduced foreign exchange losses compared to the previous year. During the first quarter of 2004, the Company reclassified its trade receivables securitization fees from financial expenses to selling, general and administrative expenses. The purpose of this reclassification was to harmonize with the practice normally used by companies in the United States for the sale of accounts receivable. For comparative purposes, prior years' figures have been restated.
For the third quarter of 2004, income taxes were $21 million compared to $19 million in 2003. On a year-to-date basis, income taxes were $46 million in 2004, compared to $2 million in 2003. Before impairment of assets, restructuring and other charges, income taxes were $23 million for the third quarter of 2004 compared to $18 million for the same period last year. On the same basis, the year-to-date income taxes were $66 million in 2004 for an effective tax rate of 30.3% and $24 million in 2003 for an effective tax rate of 22.9%. The increase in income taxes was due to an increase in profits before taxes in countries with a higher overall tax rate and the impact of the debt refinancing and the higher tax rate in the United States, both of which occurred in the fourth quarter of 2003.
Net income for the third quarter was $48 million compared to $60 million in 2003. For the nine-month period, net income was $99 million, a significant increase from $23 million for the same period last year.
For the third quarter ended September 30, 2004, the Company reported diluted earnings per share of $0.29 compared to $0.38 in 2003. These results incorporated impairment of assets, restructuring and other charges of $13 million ($11 million net of taxes) or $ 0.08 per share compared with $(5) million ($(5) million net of taxes) or $(0.04) per share in 2003. Excluding the effect of impairment of assets, restructuring and other charges, the third quarter of 2004 resulted in diluted earnings per share of $0.37 compared with $0.34 in the same period of 2003. The specific charges of $6 million ($4 million net of taxes) in 2004 and $2 million ($1 million net of taxes) in 2003 also negatively impacted earnings per share by $0.03 and $0.01, respectively.
For the first nine months of 2004, the Company reported a diluted earnings per share of $0.55 compared to a loss per share of $0.03 in 2003. These results incorporated impairment of assets, restructuring and other charges of $69 million ($48 million net of taxes) or $0.36 per share compared with $77 million ($56 million net of taxes) or $0.40 per share in 2003. Excluding the effect of impairment of assets, restructuring and other charges, 2004 resulted in diluted earnings per share of $0.91 compared with $0.37 in 2003. The specific charges of $10 million ($7 million net of taxes) in 2004 and $56 million ($38 million net of taxes) in 2003 also negatively impacted earnings per share by $0.05 and $0.28, respectively.
SEGMENT REVIEW
The following review of operating activity by business group (figure 4) is before impairment of assets, restructuring and other charges.
North America
North American revenues for the third quarter of 2004 were $1,292 million, up 1% from $1,282 million in 2003. On a year-to-date basis, revenues were $3,672 million in 2004, down 1% from $3,708 million in 2003. Excluding the effect of currency translation, revenues were flat in the third quarter and decreased by 2% year-to-date. The following is a review of the North American activities by business group. The North American segment is made up of the following business groups: Magazine, Catalog, Retail, Book & Directory, Commercial & Direct, Canada and Other Domestic Revenues.
Revenue by Business Group($ millions)
Nine-month periods ended September 30
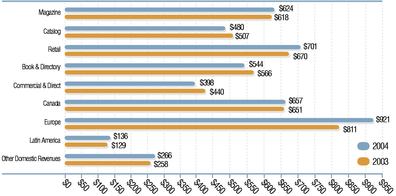
Figure 4
Segmented Results of Operations($ millions)
Selected Performance Indicators
| | North America | Europe | Latin America | Inter-Segment and Others | Total | ||||||||||||||||||||||||||
|---|---|---|---|---|---|---|---|---|---|---|---|---|---|---|---|---|---|---|---|---|---|---|---|---|---|---|---|---|---|---|---|
| | 2004 | 2003 | 2004 | 2003 | 2004 | 2003 | 2004 | 2003 | 2004 | 2003 | |||||||||||||||||||||
| Three months ended September 30, | |||||||||||||||||||||||||||||||
| Revenues | $ | 1,291.6 | $ | 1,282.2 | $ | 295.7 | $ | 273.2 | $ | 45.0 | $ | 40.6 | $ | 0.7 | $ | 0.8 | $ | 1,633.0 | $ | 1,596.8 | |||||||||||
| Operating income (loss) before depreciation and amortization and before IAROC | 179.8 | 178.7 | 26.7 | 21.5 | 3.9 | 3.5 | (8.2 | ) | 1.3 | 202.2 | 205.0 | ||||||||||||||||||||
| Operating income (loss) before IAROC | 112.7 | 108.5 | 9.3 | 6.2 | 1.1 | 0.8 | (8.5 | ) | 1.0 | 114.6 | 116.5 | ||||||||||||||||||||
| IAROC | 6.1 | 2.5 | 6.1 | (7.6 | ) | 0.5 | — | 0.2 | 0.1 | 12.9 | (5.0 | ) | |||||||||||||||||||
| Operating income (loss) | 106.6 | 106.0 | 3.2 | 13.8 | 0.6 | 0.8 | (8.7 | ) | 0.9 | 101.7 | 121.5 | ||||||||||||||||||||
| Operating margin before depreciation and amortization and before IAROC | 13.9 | % | 13.9 | % | 9.0 | % | 7.9 | % | 8.7 | % | 8.6 | % | 12.4 | % | 12.8 | % | |||||||||||||||
| Operating margin before IAROC | 8.7 | % | 8.5 | % | 3.1 | % | 2.3 | % | 2.5 | % | 2.1 | % | 7.0 | % | 7.3 | % | |||||||||||||||
| Operating margin | 8.3 | % | 8.3 | % | 1.1 | % | 5.1 | % | 1.5 | % | 2.0 | % | 6.2 | % | 7.6 | % | |||||||||||||||
Capital expenditures | $ | 26.7 | $ | 28.5 | $ | 8.9 | $ | 4.2 | $ | 0.2 | $ | 2.8 | $ | 0.1 | $ | 0.1 | $ | 35.9 | $ | 35.6 | |||||||||||
Changes in non-cash balances related to operations, cash flow (outflow) | (129.8 | ) | (99.4 | ) | (13.6 | ) | (19.0 | ) | (0.3 | ) | (1.1 | ) | 24.8 | 16.0 | (118.9 | ) | (103.5 | ) | |||||||||||||
Nine months ended September 30, | |||||||||||||||||||||||||||||||
| Revenues | $ | 3,672.1 | $ | 3,707.8 | $ | 920.8 | $ | 811.1 | $ | 136.2 | $ | 129.4 | $ | (1.7 | ) | $ | 1.6 | $ | 4,727.4 | $ | 4,649.9 | ||||||||||
| Operating income (loss) before depreciation and amortization and before IAROC | 502.7 | 444.2 | 85.0 | 52.5 | 11.4 | 3.5 | (10.4 | ) | (4.0 | ) | 588.7 | 496.2 | |||||||||||||||||||
| Operating income (loss) before IAROC | 295.2 | 233.1 | 33.6 | 6.2 | 3.1 | (4.6 | ) | (11.3 | ) | (5.2 | ) | 320.6 | 229.5 | ||||||||||||||||||
| IAROC | 58.3 | 60.6 | 9.0 | 5.6 | 1.1 | 9.6 | 0.5 | 1.0 | 68.9 | 76.8 | |||||||||||||||||||||
| Operating income (loss) | 236.9 | 172.5 | 24.6 | 0.6 | 2.0 | (14.2 | ) | (11.8 | ) | (6.2 | ) | 251.7 | 152.7 | ||||||||||||||||||
| Operating margin before depreciation and amortization and before IAROC | 13.7 | % | 12.0 | % | 9.2 | % | 6.5 | % | 8.4 | % | 2.7 | % | 12.5 | % | 10.7 | % | |||||||||||||||
| Operating margin before IAROC | 8.0 | % | 6.3 | % | 3.6 | % | 0.8 | % | 2.3 | % | (3.5 | )% | 6.8 | % | 4.9 | % | |||||||||||||||
| Operating margin | 6.5 | % | 4.7 | % | 2.7 | % | 0.1 | % | 1.5 | % | (11.0 | )% | 5.3 | % | 3.3 | % | |||||||||||||||
Capital expenditures | $ | 82.4 | $ | 159.6 | $ | 15.0 | $ | 37.6 | $ | 3.3 | $ | 7.9 | $ | 0.1 | $ | 0.5 | $ | 100.8 | $ | 205.6 | |||||||||||
Changes in non-cash balances related to operations, cash flow (outflow) | (323.4 | ) | (261.4 | ) | (41.3 | ) | (18.9 | ) | 5.4 | (4.8 | ) | 26.9 | 20.7 | (332.4 | ) | (264.4 | ) | ||||||||||||||
IAROC: Impairment of assets, restructuring and other charges.
Figure 5
Magazine
Magazine revenues for the third quarter of 2004 were $214 million, flat compared to 2003. On a year-to-date basis, revenues were $624 million in 2004 up 1% from $618 million in 2003. Volume was flat in the third quarter and increased by 3% year-to-date compared to last year. Prices were down for both the third quarter and the year-to-date due to the continued price erosion. During the second quarter of 2004, the Company announced restructuring initiatives that included the closing of the Effingham, Illinois facility, which resulted in a net reduction of approximately 425 employee positions. For the first nine months, operating margin increased and selling, general and administrative expenses decreased compared to 2003, due to savings from cost containment initiatives and headcount reductions. However, operating income and margin decreased in the third quarter due to operational inefficiencies at two facilities as well as at Effingham, all in connection with this closure. Year-over-year head-count was reduced by 862 employees or approximately 13%.
Catalog
Catalog revenues for the third quarter of 2004 were $177 million, down 5% from $187 million in 2003. On a year-to-date basis, revenues were $480 million in 2004 down 5% from $507 million in 2003. Volume was up 1% for the quarter and down 1% year-to-date. Prices were down for both the quarter and the year-to-date. The price reduction is mostly explained by the loss in the third quarter of a customer with higher price work, and a change to the overall product mix compared to last year. The decrease in revenues was further affected by increases in customer-furnished paper. Operating margins for both the third quarter and the year-to-date decreased compared to last year, due to operational inefficiencies in certain facilities, mainly due to start-up issues with new equipment. These issues are being addressed and improvements are starting to show as the operating margin in the third quarter significantly increased compared to the second quarter of 2004. Year-over-year headcount was reduced by 149 employees, or approximately 4%.
Retail
Retail revenues for the third quarter of 2004 were $252 million, up 5% from $239 million in 2003. On a year-to-date basis, revenues were $701 million in 2004, up 5% from $670 million in 2003.The increase in revenues was driven by an increase in volume of 4% for the quarter and 5% year-to-date, partly offset by the negative impact of lower price work and price pressures. Operating income and margin improved compared to last year as a result of savings from cost control initiatives and operational efficiency gains. Year-over-year headcount decreased by 228 employees, or approximately 7%.
Book & Directory
Book & Directory revenues for the third quarter of 2004 were $190 million, flat compared to 2003. On a year-to-date basis, revenues were $544 million in 2004, down 4% from $566 million in 2003. The year-to-date decrease was directly related to negative price pressures and a change to the overall product mix. Volume for the Book group was up 3% for the third quarter of 2004,as a result of strong demand in the adult trade and educational book market. However, on a year-to-date basis, volume remained flat compared to 2003. For the Directory group, volume was up 18% for the quarter and 17% for the year-to-date.The price erosion in Directory is explained by more volume from independent directory publishers replacing one major contract terminated in 2003, as well as less demand for 4-color work. For the Book group, prices decreased due to a heavier mix of one and two color work and a loss of higher value hardcover work. Operating income and margin increased in the third quarter of 2004 and for the year-to-date compared to 2003 due to productivity gains, headcount reductions and other cost containment initiatives from 2003. During the second quarter of 2004, the Company announced restructuring initiatives which included the downsizing of the Kingsport, Tennessee facility in the Book group which will result in a net reduction of approximately 160 employee positions. Year-over-year headcount for the group was reduced by 446 employees, or approximately 8%.
Commercial & Direct
Commercial & Direct revenues for the third quarter of 2004 were $135 million, down 7% from $146 million in 2003. On a year-to-date basis, revenues were $398 million in 2004, down 10% from $440 million in 2003. The decrease in revenues was mainly due to a drop in volume and prices in Commercial in both the third quarter and year-to-date, due to intense competition. In Direct, volume increased 1% and pricing was positive in the third quarter compared to last year, as a result of a favorable work mix. However, on a year-to-date basis both volume and prices were down compared to last year. Selling, general and administrative expenses for the third quarter and year-to-date were down from last year, due to volume decline and to the favorable impact of cost containment efforts. During the second quarter of 2004, the Company announced further downsizing that will include workforce reductions in Commercial for 76 employee positions. Year-over-year headcount reductions were 295 employees, or approximately 10% for this group.
Canada
Canadian revenues for the third quarter of 2004 were $226 million, up 5% compared to $215 million in 2003. On a year-to-date basis, revenues were $657 million in 2004, up 1% from $651 million in 2003. Excluding the favorable impact of currency translation, revenues were flat for the quarter and down 6% year-to-date compared to the same periods last year. Compared to last year, volume increased 7% in the third quarter and 4% in the first nine months mainly due to major gains in the retail segment from current and new customers. Despite a volume increase, market conditions remained extremely competitive as reflected in the pricing. Year-over-year headcount was reduced by 402 employees, or approximately 7%, and this improvement was reflected in the reduction of selling, general and administrative costs.
Other Revenues
Other sources of revenues in North America include Quebecor World Premedia and Logistics. Premedia revenues for the third quarter of 2004 were $17 million, down 14% from $20 million last year. On a year-to-date basis, revenues were $52 million in 2004, down 10% from $58 million in 2003. Volume increased by 53% in the third quarter of 2004 and 28% for the year-to-date, mostly explained by renewals and new gains for low margin services type of work. Prices were also negatively impacted by the economic environment where customers continue to look for ways to reduce their costs, mainly by taking more of the higher margin services in-house.
Logistics revenues for the third quarter were $80 million, up 13% from $71 million in 2003. On a year-to-date basis, revenues were $220 million in 2004, up 11% from $198 million in 2003. The revenue increase was due mainly to higher retail commodity shipments and higher fuel prices. However, margins decreased slightly due to a larger proportion of truck shipments compared to air freight for time-sensitive products. Higher margin air freight in the United States continued to grow slowly with pricing pressure from fuel surcharge and security fees.
Europe
European revenues for the third quarter of 2004 were $296 million, up 8% from $273 million in 2003. On a year-to-date basis, revenues were $921 million in 2004 up 14% from $811 million in 2003. Excluding the positive impact of currency translation, revenues were slightly down for the third quarter at $271 million, and up 3% for the year-to-date at $832 million, compared to the same periods last year. Overall volume increased by 2% for the third quarter, with strong performances in the Magazine and Retail markets. On a year-to-date basis, the volume increase was 5%, explained by the Retail and Magazine markets, in part due to additional capacity provided by two new presses in Spain and Sweden. However, price erosion continued to have a negative impact in virtually all countries. Magazine revenues represented more than 50% of total European revenues and the balance was mainly composed of Retail, Catalog and Book. France's operating income and margin for the third quarter and year-to-date were still negative, but showed an improvement from last year, an indication of the positive impact of the 2003 restructuring initiatives. Outside France, Europe increased its operating income and margin, for the third quarter of 2004 and year-to-date, compared to last year. During the second quarter of 2004, the Company was informed that an important printing contract expiring in 2005 would not be renewed. As a result, management is currently evaluating and developing a sales strategy to replace the expected lost volume.Year-over-year headcount in Europe was reduced by 113 employees, or approximately 2%.
Reconciliation of non GAAP measures
($ millions)
| | Three months | Nine months | ||||||||||||
|---|---|---|---|---|---|---|---|---|---|---|---|---|---|---|
| | 2004 | 2003 | 2004 | 2003 | ||||||||||
| Operating Income | ||||||||||||||
| Operating income | $ | 101.7 | $ | 121.5 | $ | 251.7 | $ | 152.7 | ||||||
| Impairment of assets, restructuring and other charges (IAROC) | 12.9 | (5.0 | ) | 68.9 | 76.8 | |||||||||
| Operating income before IAROC | $ | 114.6 | $ | 116.5 | $ | 320.6 | $ | 229.5 | ||||||
| Operating income | $ | 101.7 | $ | 121.5 | $ | 251.7 | $ | 152.7 | ||||||
| Depreciation of property, plant and equipment | 81.0 | 82.1 | 248.7 | 247.9 | ||||||||||
| Amortization of deferred charges | 6.6 | 6.4 | 19.4 | 18.8 | ||||||||||
| Operating income before depreciation and amortization | $ | 189.3 | $ | 210.0 | $ | 519.8 | $ | 419.4 | ||||||
| IAROC | 12.9 | (5.0 | ) | 68.9 | 76.8 | |||||||||
| Operating income before depreciation and amortization and before IAROC | $ | 202.2 | $ | 205.0 | $ | 588.7 | $ | 496.2 | ||||||
Earnings per share | ||||||||||||||
| Net income | $ | 48.1 | $ | 59.7 | $ | 99.2 | $ | 22.5 | ||||||
| IAROC (net of income taxes of $2.2 million for the third quarter of 2004 ($20.6 million year-to-date) and $0.1 million for the third quarter of 2003 ($21.2 million year-to-date)) | 10.7 | (4.9 | ) | 48.3 | 55.6 | |||||||||
| Net income before IAROC | $ | 58.8 | $ | 54.8 | $ | 147.5 | $ | 78.1 | ||||||
| Net income available to holders of preferred shares | 9.0 | 9.8 | 26.9 | 26.8 | ||||||||||
| Net income available to holders of equity shares before IAROC | $ | 49.8 | $ | 45.0 | $ | 120.6 | $ | 51.3 | ||||||
Diluted average number of equity shares outstanding (in millions) | 132.7 | 135.7 | 132.5 | 137.4 | ||||||||||
Earnings (loss) per share | ||||||||||||||
| Diluted | $ | 0.29 | $ | 0.38 | $ | 0.55 | $ | (0.03 | ) | |||||
| Diluted before IAROC | $ | 0.37 | $ | 0.34 | $ | 0.91 | $ | 0.37 | ||||||
| Free Cash Flow | ||||||||||||||
| Cash provided by operating activities | $ | 41.4 | $ | 59.8 | $ | 106.9 | $ | 65.5 | ||||||
| Dividends on preferred shares | (5.9 | ) | (11.1 | ) | (26.1 | ) | (25.9 | ) | ||||||
| Additions to property, plant and equipment | (35.9 | ) | (35.6 | ) | (100.8 | ) | (205.6 | ) | ||||||
| Net proceeds from disposal of assets | 0.3 | 0.9 | 1.7 | 2.2 | ||||||||||
| Free cash flow (outflow) from operations | $ | (0.1 | ) | $ | 14.0 | $ | (18.3 | ) | $ | (163.8 | ) | |||
| Debt-to-capitalization as at September 30, | ||||||||||||||
| Bank indebtedness | $ | 1.5 | $ | 1.2 | ||||||||||
| Current portion of long-term debt and convertible notes | 11.7 | 22.4 | ||||||||||||
| Long-term debt | 2,038.3 | 2,135.8 | ||||||||||||
| Convertible notes | 112.2 | 110.2 | ||||||||||||
| Total debt | $ | 2,163.7 | $ | 2,269.6 | ||||||||||
Minority interest | 27.8 | 22.0 | ||||||||||||
| Shareholders' equity | 2,529.9 | 2,548.3 | ||||||||||||
| Capitalization | $ | 4,721.4 | $ | 4,839.9 | ||||||||||
| Debt-to-capitalization | 46:54 | 47:53 | ||||||||||||
| Book value per share as at September 30, | ||||||||||||||
| Shareholders' equity | $ | 2,529.9 | $ | 2,548.3 | ||||||||||
| Preferred shares | (456.6 | ) | (456.6 | ) | ||||||||||
| $ | 2,073.3 | $ | 2,091.7 | |||||||||||
| Ending number of equity shares (in millions) | 132.5 | 131.8 | ||||||||||||
| Book value per share | $ | 15.65 | $ | 15.87 | ||||||||||
Figure 6
Latin America
Latin America's revenues for the third quarter of 2004 were $45 million, up 11% from $41 million in 2003. On a year-to-date basis, revenues were $136 million in 2004, up 5% from $129 million in 2003. In general, prices were down for the third quarter and year-to-date in Latin America as compared to last year. Overall volume increased by 25% for the third quarter and 9% year-to-date from last year. Volume increased in the Book market in Argentina and Mexico, but was partially offset by shortfalls in Brazil and Colombia. Volume also generally increased in the Directory market in Peru, Recife and Mexico, as well as in the Commercial market in Colombia. Book revenues represented approximately 35% of total revenues in Latin America and the balance was composed mainly of Directory, Magazine, Retail, Catalog and Commercial & Direct. Strong results were obtained in Argentina in the third quarter of 2004 due to book orders received from the Ministry of Education and the Ministry of Labor. Overall, selling, general and administrative expenses were below last year's amounts, as the positive impact of the cost containment initiatives continued to bear fruit. Year-over-year headcount was reduced by 252 employees, or approximately 10%.
SELECTED ANNUAL INFORMATION
The following table (figure 7) provides selected annual information as derived from the Company's consolidated financial statements, for each of the three most recently completed fiscal years.
CRITICAL ACCOUNTING ESTIMATES
The preparation of financial statements in conformity with Canadian GAAP requires the Company to make estimates and assumptions which affect the reported amounts of assets and liabilities, the disclosure on contingent assets and liabilities at the date of the financial statements and reported amounts of revenues and expenses during the reporting period. The Ontario Securities Commission defines critical accounting estimates as those requiring assumptions made about matters that are highly uncertain at the time the estimate is made, and when the use of different reasonable estimates or changes to the accounting estimates would have a material impact on a company's financial condition or results of operations.
Selected Annual Information($ millions, except per share data)
| | Years ended December 31, | |||||||||
|---|---|---|---|---|---|---|---|---|---|---|
| | 2003 | 2002 | 2001 | |||||||
| Consolidated Results(1) | ||||||||||
| Revenues(2) | $ | 6,391.5 | $ | 6,271.7 | $ | 6,442.7 | ||||
| Operating income before depreciation and amortization and before IAROC | 675.3 | 882.7 | 926.7 | |||||||
| Operating income before IAROC(3) | 315.9 | 547.2 | 588.9 | |||||||
| IAROC(4) | 98.3 | 19.6 | 270.0 | |||||||
| Operating income | 217.6 | 527.6 | 318.9 | |||||||
| Net income (loss) | (31.4 | ) | 279.3 | 22.4 | ||||||
Financial Position(1) | ||||||||||
| Total assets | 6,256.9 | 6,207.4 | 6,186.5 | |||||||
| Total long-term debt and convertible notes(5) | 2,009.0 | 1,822.1 | 2,132.2 | |||||||
Per Share Data | ||||||||||
| Earnings (loss) | ||||||||||
| Basic | (0.50 | ) | 1.78 | — | ||||||
| Diluted | (0.50 | ) | 1.76 | — | ||||||
| Diluted before IAROC | 0.03 | 1.92 | 1.58 | |||||||
| Dividends on preferred shares | 1.17 | 0.96 | 0.68 | |||||||
| Dividends on equity shares | 0.52 | 0.49 | 0.46 | |||||||
IAROC: Impairment of assets, restructuring and other charges.
Figure 7
- (1)
- Certain reclassifications have been made to prior years' amounts to conform with the basis of presentation adopted in the current period.
- (2)
- Revenues have been consistently declining over the last three years due to weak advertising spending and global overcapacity in the industry resulting in significant price erosions. In 2003, although volume increased, pressures on prices continued to push revenues down. However, the favorable impact of currency translation more than offset the decrease, pushing overall revenues up.
- (3)
- Operating income before IAROC has decreased over the years due to reduced capacity utilization and pricing pressures. In addition, significant increases in pension, utilities and medical expenses are also negatively impacting operating income. In 2003, the Company incurred specific charges that further reduced the operating income by $79 million, mainly due to system issues in the North American logistics business, provisions for doubtful accounts, lease provisions and various other items.
- (4)
- In 2001, in response to the significant drop in volume, the Company announced a restructuring plan to shut down under-performing business units, redeploy assets and reduce the workforce. Most of the 2001 restructuring plan was completed in 2002. In 2003, although overall volume had increased, pricing continued to drop. To mitigate eroding prices, the Company's new management team performed a detailed review and additional restructuring initiatives were adopted. These intiatives involved a general workforce reduction across the platform, the closure of four smaller facilities in North America, the decommissioning of under-performing assets, the consolidation of corporate functions and the relocation of certain sales offices into plants.
- (5)
- Long-term debt and convertible notes decreased in 2002 from 2001 due mainly to a decrease in capital expenditures and business acquisitions in 2002. Long-term debt and convertible notes increased in 2003 compared to 2002 due to the repurchase for cancellation of 10,000,000 Subordinate Voting Shares and an increase in capital expenditures in 2003.
Based on this definition, the Company has identified the following critical accounting estimates:
Revenue Recognition
The Company recognizes revenue either when the production process is completed or when services are performed, or on the basis of production and service activity at the pro rata billing value of the work completed. When progress needs to be measured, the method used always reflects the output achieved. For example, one method is based on the number of units produced for each of the significant production processes, where each of these units is attributed a certain profit based on the stage of the production. Other methods may be based on the hours of labor recorded or the costs incurred, but this is only allowed when it reflects the true output of the project. The underlying work in process is valued at the pro rata billing value of the work completed. Usually, the time lag is short between revenue recognition and the billing process.
Goodwill
Goodwill is not amortized but tested for impairment annually, or more frequently if events or changes in circumstances indicate a possible impairment. The Company compares the reporting unit's carrying value to its market value determined through a discounted cash flow analysis. In preparing discounted cash flows, the Company uses its judgment in estimating future profitability, growth, capital spending and discount rate. As an additional overall check on the reasonableness of the fair value attributed to reporting units, the Company performs a market comparable companies analysis, which takes into consideration 1) valuation multiples of comparable public companies to which a control premium is applied and 2) publicly-known acquisition multiples of recent transactions in the industry. If the carrying value of the reporting unit exceeds the market value, the Company would then evaluate the impairment loss by comparing the fair value of the goodwill to its carrying amount.
Based on the results of the latest impairment test performed, the Company concluded that no impairment existed. However, if the assumptions and estimates used by the Company were different, an impairment could be necessary in the future.
Impairment of Long-Lived Assets
The Company tests periodically or more frequently the recoverability of long-lived assets, including property, machinery and equipment and other long-term assets, when events or changes in circumstances indicate that their carrying amounts may not be recoverable. Examples of such events and changes include: a significant decrease in the market price of an asset, the decommissioning of an asset, assets rendered idle after plant shutdown, costs that significantly exceed the amount initially estimated for the acquisition or construction of an asset and operating or cash flow losses constantly associated with the use of an asset.
An impairment loss is recognized when the carrying amount of a long-lived asset is not recoverable and exceeds its fair value. A long-lived asset, or group of assets is considered unrecoverable when its carrying value exceeds the estimated undiscounted future cash flows directly associated with it. The Company estimates future cash flows based on historical and budgeted performance as well as assumptions on future economic environment, pricing and volume. The fair value measurement is determined based on market prices when available, or on the expected present value of future cash flows approach.
During the second quarter of 2004, the Company approved a long-term strategic plan, which involved the closing and downsizing of certain facilities and the decommissioning of presses in North America. As a result of initiatives undertaken in the second and third quarters of 2004, recoverability tests were performed for downsized plants and plants receiving transferred assets. For assets that became idle following the application of the initiatives, an impairment loss was recorded to reduce their carrying amounts to the residual value. An impairment loss of $3 million was recorded in the third quarter of 2004 for a total impairment loss for the year-to-date of $35 million.
With the exception of the above mentioned items, the Company believes that no other impairment loss should be taken on its long-lived assets. If the assumptions and estimates should prove to be inappropriate, an additional impairment loss would have to be charged to future results.
Pension and Postretirement Benefits
The Company maintains defined benefit plans and postretirement benefits for its employees and ensures that contributions are sustained at a level sufficient to cover benefits. Actuarial valuations of the Company's various pension plans were performed during the last three years. Plan assets are measured at fair value and consist of equity securities and corporate and government fixed income securities. Pension and other postretirement costs and obligations are based on various economic and demographic assumptions determined with the help of actuaries and are reviewed each year. Key assumptions include the discount rate, the expected long-term rate of return on plan assets, the rate of compensation increase and the health care cost trend rate.
The discount rate assumption used to calculate the present value of the plans' projected benefit payments was determined using a measurement date of September 30, 2003 and based on yields of long-term high-quality fixed income investments.
The expected long-term rate of return on pension plan assets was obtained by calculating a weighted average rate based on targeted asset allocations of the plans. The expected returns of each asset class are based on a combination of rigorous historical performance analyses and forward looking views of the financial markets. The targeted asset allocation of the plans is generally 65% for equity and 35% for fixed income securities.
The rate of compensation increase is used to project current plan earnings in order to estimate pension benefits at future dates. This assumption was determined based on historical pay increases, forecast of salary budgets, collective bargaining influence and competitive factors.
For postretirement benefits, the assumptions related to the health care cost trend rate are based on increases experienced by plan participants in recent years and national average cost increases.
The Company believes that the assumptions are reasonable based on information currently available, but changes to these assumptions could impact pension and postretirement benefit expenses and obligations recognized in future periods.
Health Care Costs
The Company provides health care benefits to employees in North America and covers approximately 75% of the costs under these employee health care plans. The Company actively manages its health care spendings with its vendors to maximize discounts in an attempt to limit the cost escalation experienced over the past years. Health care costs and liabilities are estimated with the help of actuaries. On a year-to-date basis for 2004, health care costs per capita has increased by over 10% from the same period in 2003. Trend assumption is the most important factor in estimating future costs. The Company uses the most recent twelve months of claims trended forward to estimate the next year's liability.
Allowance for Doubtful Accounts
The Company maintains an allowance for doubtful accounts for expected losses from customers who are unable to pay their debts. The allowance is reviewed periodically and is based on an analysis of specific significant accounts outstanding, the age of the receivable, customer creditworthiness, and historical collection experience. In addition, the Company maintains an allowance to cover a fixed percentage of all accounts for customers under Chapter 11 and other critical accounts. These accounts may take several years before a settlement is reached. However, the allowance is periodically reassessed based on new developments.
Income Taxes
The Company uses its best judgment in determining its effective tax rate. There are many factors in the normal course of business that affect the effective tax rate, since the ultimate tax outcome of some transactions and calculations is uncertain until assessed by the taxation authorities.
Future income tax assets are recognized and a corresponding provision is recorded if such assets are unlikely to be realized. The provision is based on management's estimates of taxable income for each jurisdiction in which the Company operates, and the period over which the future tax assets are expected to be recoverable. In the event that the tax outcome differs from management's estimates, the provision may be adjusted.
The Company is at all times under audit by various tax authorities in each of the jurisdictions in which it operates. A number of years may elapse before a particular matter for which management has established a reserve, is audited and resolved. The number of years with open tax audits varies depending on the tax jurisdiction.
Management believes that its estimates are reasonable and reflect the probable outcome of known tax contingencies, although the final outcome and its timing are difficult to predict. In addition, the Company has not recognized a future tax liability for the undistributed earnings of its subsidiaries in the current and prior years because the Company does not expect those unremitted earnings to reverse and become taxable in the foreseeable future.
Insurance
The Company is exposed in the normal course of business to a variety of operational risks, some of which are transferred to third parties by way of insurance agreements. The Company has a policy of self-insurance when the foreseeable losses from self-insurance are low relative to the cost of purchasing third-party insurance.
U.S. workers' compensation claims tend to be relatively low in value on a case-by-case basis, and the Company self-insures against the majority of such claims. The Company maintains third-party insurance coverage against workers' compensation claims which are unusually large in nature. In addition, the third-party insurance provides a cap on total exposure to workers' compensation claims.
With respect to the workers' compensation self-insurance, the Company maintains a provision to cover liabilities for all open claims related to both current and past policies and relies on claims experience and the advice of its actuaries and plan administrators in determining an adequate liability for all open claims. The workers' compensation liability is estimated based on reserves for claims that are established by an independent administrator and the reserves are increased to reflect the estimated future development of the claims based on Company specific factors provided by its actuaries. The liability for workers' compensation claims is the estimated total cost of the claims on a fully-developed basis. Certain claims may take several years to be settled. Each year, the status of open claims is reviewed and the liability is reassessed. The difference is recorded to income or expense.
While the Company believes that the assumptions used are appropriate, significant changes in any of the assumptions could materially affect the workers' compensation costs.
The Company maintains insurance for exposure related to property and casualty losses. It has also chosen to retain a portion of such losses in the form of a deductible, in order to reduce the cost of protecting its assets. The Company manages the self-insured portion of its property insurance program through its captive insurance subsidiary. As at September 30, 2004, the Company's potential exposure under its self-insured property program was capped at $5 million, subject to ongoing deductibles and other factors related to the nature of each specific claim.
The Company believes that it has in place a combination of third-party insurance and self-insurance that provides adequate protection against unexpected losses while minimizing cost.
LIQUIDITY AND FINANCIAL POSITION
The Company measures its liquidity performance using the calculation of free cash flow as described in figure 6. Free cash flow reflects liquidity available for business acquisitions, equity dividends and repayments of long-term debt.
Free cash flow for the third quarter of 2004 amounted to an outflow of $0.1 million, compared to a cash flow of $14 million for the same quarter last year. On a year-to-date basis, free cash flow for 2004 amounted to an outflow of $18 million, a significant improvement compared to an outflow of $164 million for the same period of 2003.
Working capital was $93 million as at September 30, 2004, compared to a working capital of $24 million as at September 30, 2003. This increase in working capital of $69 million was due to an increase in inventory, mostly explained by higher levels of work in process caused by timing differences in delivery, and higher levels of paper materials. This was partly offset by a lower level of trade receivables in September 2004 when compared to last year. The higher level of cash and cash equivalents also explained the increase in working capital, as the Company is required to maintain a minimum level of funds in its captive insurance subsidiary. The Company manages its trade payables in order to take advantage of prompt payment discounts. Also, the Company maximizes the use of its accounts receivable securitization program, since the cost of these programs is relatively low compared to that of the credit facility. The amount of trade receivables under securitization varies from month to month, based on the previous month's volume (September securitization is based on outstanding receivables at the end of August).
As at September 30, 2004, the debt level was at $2,164 million, a $106 million decrease compared to the end of September 2003. The debt-to-capitalization ratio was 46:54 compared to 47:53 in September 2003 (see non-GAAP measures at figure 6). The same ratio was 44:56 as at December 31, 2003. Including accounts receivable securitization, total debt would be $2,747 million, $102 million lower than last year. The debt-to-capitalization ratio, including accounts receivable securitization, was 52:48 as at September 30, 2004, compared to 53:47 in September 2003 (see figure 8).
Total Debt and Accounts Receivable Securitization($ millions)
| | September 30, 2004 | September 30, 2003 | ||||
|---|---|---|---|---|---|---|
| Bank indebtedness | $ | 1.5 | $ | 1.2 | ||
| Current portion of long-term debt and convertible notes | 11.7 | 22.4 | ||||
| Long-term debt | 2,038.3 | 2,135.8 | ||||
| Convertible notes | 112.2 | 110.2 | ||||
| Total debt | $ | 2,163.7 | $ | 2,269.6 | ||
| Accounts receivable securitization | 583.2 | 579.4 | ||||
| Total debt and accounts receivable securitization | $ | 2,746.9 | $ | 2,849.0 | ||
Minority interest | 27.8 | 22.0 | ||||
| Shareholders' equity | 2,529.9 | 2,548.3 | ||||
| Capitalization, including securitization | $ | 5,304.6 | $ | 5,419.3 | ||
| Debt-to-Capitalization, including securitization | 52:48 | 53:47 | ||||
These ratios are non-GAAP measures.
Figure 8
The Company is subject to certain financial covenants in some of its major financing agreements. The key financial ratios are the earnings before interest, tax and depreciation and amortization (EBITDA) coverage ratio and the debt-to-capitalization ratio. As at September 30, 2004, the Company is in compliance with all significant debt covenants.
Contractual Cash Obligations($ millions)
| | Remainder of 2004 | 2005 | 2006 | 2007 | 2008 | 2009 and thereafter | ||||||||||||
|---|---|---|---|---|---|---|---|---|---|---|---|---|---|---|---|---|---|---|
| Long-term debt and convertible notes | $ | 1 | $ | — | $ | 257 | $ | 891 | $ | 202 | $ | 775 | ||||||
| Capital lease | 5 | 11 | 8 | 4 | 3 | 17 | ||||||||||||
| Operating lease | 5 | 83 | 67 | 51 | 42 | 107 | ||||||||||||
| Capital asset purchase commitments | 7 | 84 | 23 | — | — | — | ||||||||||||
| Minority interest acquisition | 43 | — | — | — | — | — | ||||||||||||
| Total contractual cash obligations | $ | 61 | $ | 178 | $ | 355 | $ | 946 | $ | 247 | $ | 899 | ||||||
Figure 9
The Company has a binding agreement to purchase the remaining 50% of Helio Charleroi in Belgium, a subsidiary of European Graphic Group, SA. The purchase price, estimated based on financial performance achieved during the last three fiscal years, should amount to 35 million Euros ($43 million). The transaction is expected to be completed during the fourth quarter of 2004.
The Company maintains a $1 billion revolving bank facility for general corporate purposes. In October 2004, the Company received approval from the bank syndicate to extend for an additional year the two tranches totalling $750 million maturing in November 2006 and to renew for three years the $250 million tranche maturing in November 2004. Therefore, all tranches will mature in November 2007. The execution of final documentation giving effect to such amendment is expected to occur on November 5, 2004. A total of $750 million is available to both the Company and its U.S. subsidiary and $250 million is available to the U.S. subsidiary only.All tranches are cross-guaranteed by the Company and the U.S. subsidiary and can be extended annually.
The 6.50% senior debentures due on August 1, 2027 were redeemable at the option of the holders at par value on August 1, 2004. Out of a total principal amount of $150 million, $147 million senior debentures have been tendered.The Company repaid the senior debentures by using its long-term revolving bank facility.
In February 2004, the Company redeemed all of the 7.75% senior notes callable on or after February 15, 2004 that were not tendered in November 2003, for a total cash consideration of $33 million.
During the first quarter, the Company discontinued its Canadian Commercial paper program. At December 31, 2003, Cdn $0.4 million ($0.3 million) was outstanding under the program.
The Company has no major operating leases expiring in 2004. For major leases terminating in 2005, the terminal value that the Company would pay to acquire the equipment under leases (mainly presses and binders) is approximately $60 million, of which $36 million is guaranteed by the Company. Historically, the Company has acquired most of the equipment under leases when it is used for production. The total terminal value of these leases expiring after 2005 is approximately $120 million, of which $52 million is guaranteed.
The Company is monitoring the funding of the pension plans very closely and is making contributions above the minimum legal requirements. As at September 30, 2004, the Company made total contributions of $69 million, including an excess volontary contribution of $14 million (total annual contribution in 2003 was $68 million).
As at September 30, 2004, the following investment grade ratings applied to the long-term unsecured debt of the Company:
| Rating Agency | Rating | |
|---|---|---|
| Moody's Investors Service | Baa3 | |
| Standard & Poor's | BBB- | |
| Dominion Bond Rating Service Limited | BBB (low) | |
The Company believes that its liquidity, capital resources and cash flow from operations are sufficient to fund planned capital expenditures, working capital requirements, interest and principal payments for the foreseeable future.
CAPITAL RESOURCES
The Company invested $36 million in capital projects during the third quarter of 2004, same as for the third quarter last year. On a year-to-date basis, $101 million has been invested in capital projects in 2004 compared to $206 million in 2003, when the Company purchased 19 presses that were previously under an operating lease in North America. In 2004, approximately 80% of investments were for organic growth, including expenditures for new capacity requirements and productivity improvement, and 20% was for maintenance of the Company's structure. Key expenditures during the quarter included the continuation of phase 2 of the educational book market expansion in the Dubuque, Iowa facility, the purchase of a 48 page-press in Sormlands, Sweden and capital investment related to the relocation of selected Effingham equipment.
In July 2004, the Company announced its intention to purchase 22 new presses targeted for the magazine, catalog, retail and book platforms of its U.S. operations. This will allow the Company to further improve efficiency and to meet the current and future needs of publishers. As at September 30, 2004, the Company has placed firm orders for 9 new presses for a total cost of approximately $115 million. The plan represents new investments of approximately $330 million to be disbursed over the next three years.
For the remainder of the year 2004, the Company projects $50 million of capital expenditures of which a portion is related to the strategic plan. Expected sources of funds to meet these expenditures are cash flow from operations and drawings under the Company's revolving bank facility.
IMPAIRMENT OF ASSETS AND RESTRUCTURING INITIATIVES
During the third quarter of 2004, the Company recorded an impairment of assets and restructuring charges of $12.9 million. Non-cash items amounted to $3.5 million and cash items to $9.4 million. The cash portion was made up of an $11.1 million charge related to current year initiatives and a $1.7 million net reversal of prior years' and current year initiatives. For the nine-month period ended September 30, 2004, the Company recorded impairment of assets and restructuring charges of $68.9 million, composed of non-cash items of $44.4 million and cash items of $24.5 million.
Impairment of assets
The execution of the 2004 restructuring initiatives resulted in certain assets becoming permanently idle. In addition, the initiatives triggered impairment tests on other groups of assets. For the nine-month period ended September 30, 2004, the Company recorded impairment of assets of $36.4 million, including $35.4 million for long-lived assets and $1.0 million for other assets.
During the third quarter of 2004, the Company recorded $3.5 million of impairment of long-lived assets, including $2.9 million for Europe and $0.6 million for Latin America. In the second quarter, the Company recorded $40.9 million, including $40.7 million for North America and $0.2 million for Europe.
Restructuring charges
During the third quarter, the Company continued its restructuring initiatives and approved the closure of the Stockholm facility in Sweden, the consolidation of a small facility in North America and other workforce reduction across the Company. The cash cost of these initiatives was estimated at $17.5 million, of which $6.9 million, mostly related to work-force reduction, was recorded in the third quarter and $10.6 million remains to be booked over the remainder of fiscal year 2004 and fiscal year 2005, when the liability related to the initiatives will have been contracted. The third quarter initiatives affected 282 employees in total, however the Company estimated that 29 new jobs will be created in other facilities. In summary, 95 employee positions have been eliminated and 187 will be eliminated before December 31, 2004. The Company also recorded $1.5 million resulting from the implementation of the second quarter initiatives and $2.7 million for the pension obligation related to the Effingham multi-employer benefit plan. Further information should become available over the next months, which will allow the Company to measure and recognize other liabilities related to this pension obligation. The $11.1 million cash portion recorded in the third quarter, included $6.3 million for North America and $4.4 million for Europe.
In the second quarter of 2004, the Company initiated restructuring initiatives to improve asset utilization and enhance efficiency. The restructuring initiatives included the closure of the Effingham, Illinois facility in the Magazine platform, an important downsizing at the Kingsport, Tennessee facility in the Book platform and other work-force reductions across the Company. The cash cost of these initiatives was estimated at $18.3 million, of which, $11.2 million was recorded in the second quarter of 2004. With the $1.5 million recorded in the third quarter, $5.6 million remains to be booked in the fourth quarter of 2004 and fiscal year 2005, when the liability related to the initiatives will be contracted. These costs excluded a pension obligation related to the Effingham multi-employer benefit plan that could not be reasonably estimated at that time. The $12.7 million cash portion, mostly related to workforce reduction, included $11.7 million for North America, $0.5 million for Europe and $0.5 million for Latin America. The non-cash cost of these initiatives included $8.0 million for a curtailment of an American pension plan's. The number of employees affected by the second quarter restructuring initiatives has been revised at 1,331 employees in total, however the Company estimated that 457 new jobs will be created in other facilities. In summary, 934 employee positions have been eliminated and 397 will be eliminated before December 31, 2004.
In the first quarter of 2004, the Company initiated restructuring initiatives and recorded $5.0 million for workforce reduction, of which $3.9 million was for North America, $0.6 million for Europe and $0.3 million for Latin America. Under these initiatives, 354 employee positions have been eliminated and 1 remains to come.
During the third quarter, the execution of the prior 2004 initiatives resulted in a net reversal of $0.1 million comprised of cash overspending of $0.6 million and a $0.7 million reversal of prior years' restructuring and other charges.
During the third quarter, the execution of the prior years' initiatives resulted in a net reversal of $1.6 million comprised of a cash overspending of $1.2 million and a $2.8 million reversal of prior years' restructuring and other charges. The net reversal was mainly related to the cancellation of the termination of 19 employee positions. In the second quarter, the net reversal of $0.4 million resulting from a cash overspending of $2.6 million and a $3.0 million reversal of prior year restructuring charges was essentially explained by the cancellation of the termination of 8 employee positions. In the first quarter, the net reversal of $0.7 million was mainly related to the cancellation of the termination of 48 employee positions and was made up of a cash overspending of $1.3 million and a $2.0 million reversal of prior years' restructuring charges. Under these initiatives, 6,172 employee positions were eliminated as at September 30, 2004 and 9 will be eliminated in the fourth quarter of 2004.
As at January 1, 2004, the balance of the restructuring reserve was $45.8 million. This amount related mostly to the workforce reduction across the platform and lease and facility carrying costs. The Company utilized $38.3 million of the current and prior years' restructuring and other charges reserves during the nine-month period ended September 30, 2004.
Restructuring charges related to the initiatives undertaken in June and September 2004 that are expected to be incurred in the following periods are as follows:
Expected restructuring charges($ millions)
| | Q4 2004 | 2005 | Total | ||||||
|---|---|---|---|---|---|---|---|---|---|
| Workforce reduction costs | $ | 1.5 | $ | — | $ | 1.5 | |||
| Leases, closed facilities carrying costs and other | 11.1 | 3.6 | 14.7 | ||||||
| $ | 12.6 | $ | 3.6 | $ | 16.2 | ||||
Figure 10
FINANCIAL INSTRUMENTS
The Company uses a number of financial instruments: cash and cash equivalents, trade receivables, receivables from related parties, bank indebtedness, trade payables, accrued liabilities, payables to related parties, long-term debt and convertible notes. The carrying amounts of these financial instruments, except for long-term debt and convertible notes, approximate their fair values due to their short-term nature. The fair values of long-term debt and convertible notes are estimated based on discounted cash flows using period-end market yields of similar instruments with the same maturity.
The Company uses various derivative financial instruments to manage its exposure to fluctuations in foreign currency exchange rates, interest rates and commodity prices. The Company does not hold or use any derivative instruments for speculative trading purposes and adheres to a financial risk management policy.
The Company manages interest rate exposure by having a balanced schedule of debt maturities, as well as a combination of fixed and floating interest rate obligations. In addition, the Company has entered into interest rate swap agreements to manage this exposure. Contracts outstanding at September 30, 2004 had a notional value of $233 million. Interest expense is adjusted to include amounts payable or receivable under the swap agreements. The total adjustment recorded to interest expense was a revenue of $1.3 million for the first nine months of 2004 (a charge of $3.7 million for the same period of 2003).
The Company enters into foreign-exchange forward contracts to hedge foreign denominated sales and related receivables, raw materials and equipment purchases. The contracts outstanding at September 30, 2004 had a notional value of $267.3 million and expire between 2004 and 2007. The foreign exchange translation gains and losses and the deferred premiums and discounts are recognized as an adjustment to the corresponding revenues and exchange gain or losses when the transaction is recorded. The total amounts recorded to these accounts for the first nine months of 2004 for these contracts were a revenue of $10.9 million, and a gain of $1.3 million (a revenue of $6.5 million, and a gain of $0.7 million for the same period of 2003). For Canada and Europe, the foreign-denominated revenues as a percentage of their total revenues were approximately 30% and 10%, respectively in 2003.
The Company has entered into foreign-exchange forward contracts to hedge its net investment in a foreign subsidiary. The contracts outstanding at September 30, 2004 had a notional value of $294.1 million and expire in 2006 and 2007. The foreign exchange translation gains and losses, as well as any realized and unrealized gains and losses on the derivative instruments, are recorded to the cumulative translation adjustment account. The total amount recorded to the cumulative translation adjustment account for these contracts was a credit of $44.2 million, net of income taxes, as at September 30, 2004.
The Company enters into foreign-exchange forward contracts and cross currency swaps to hedge foreign denominated asset exposures. The contracts outstanding at September 30, 2004 had a notional value of $207.0 million and $131.4 million, respectively and expire between 2004 and 2006. The foreign exchange gains and losses on such foreign denominated assets are recorded to income. The changes in the fair value of the derivative instruments are also recorded to income, to compensate the foreign exchange gains and loss on the translation of the foreign denominated assets. The total adjustment recorded to foreign exchange gain or loss related to these contracts for the first nine months of 2004 was a gain of $28.1 million (a loss of $10.2 million for the same period of 2003).
MANAGEMENT'S DISCUSSION AND ANALYSIS OF
FINANCIAL CONDITION AND RESULTS OF OPERATIONS
Selected Quarterly Financial Data
(in millions of dollars, except per share data)
| | 2004 | 2003 | 2002 | |||||||||||||||||||||||||||||||||||||||||
|---|---|---|---|---|---|---|---|---|---|---|---|---|---|---|---|---|---|---|---|---|---|---|---|---|---|---|---|---|---|---|---|---|---|---|---|---|---|---|---|---|---|---|---|---|
| | First | Second | Third | Year- to-date | First | Second | Third | Fourth | Year | First | Second | Third | Fourth | Year | ||||||||||||||||||||||||||||||
| Consolidated Results | ||||||||||||||||||||||||||||||||||||||||||||
| Revenues | $ | 1,553.0 | $ | 1,541.4 | $ | 1,633.0 | $ | 4,727.4 | $ | 1,539.6 | $ | 1,513.5 | $ | 1,596.8 | $ | 1,741.6 | $ | 6,391.5 | $ | 1,475.8 | $ | 1,469.7 | $ | 1,624.7 | $ | 1,701.5 | $ | 6,271.7 | ||||||||||||||||
| Operating income before depreciation and amortization and before IAROC | 187.2 | 199.3 | 202.2 | 588.7 | 161.7 | 129.5 | 205.0 | 179.1 | 675.3 | 186.1 | 207.2 | 247.5 | 241.9 | 882.7 | ||||||||||||||||||||||||||||||
| Operating income before IAROC | 98.0 | 108.0 | 114.6 | 320.6 | 74.3 | 38.7 | 116.5 | 86.4 | 315.9 | 103.2 | 123.8 | 164.1 | 156.1 | 547.2 | ||||||||||||||||||||||||||||||
| IAROC | 4.3 | 51.7 | 12.9 | 68.9 | — | 81.8 | (5.0 | ) | 21.5 | 98.3 | — | — | — | 19.6 | 19.6 | |||||||||||||||||||||||||||||
| Operating income (loss) | 93.7 | 56.3 | 101.7 | 251.7 | 74.3 | (43.1 | ) | 121.5 | 64.9 | 217.6 | 103.2 | 123.8 | 164.1 | 136.5 | 527.6 | |||||||||||||||||||||||||||||
| Net income (loss) | 35.8 | 15.3 | 48.1 | 99.2 | 24.5 | (61.7 | ) | 59.7 | (53.9 | ) | (31.4 | ) | 46.0 | 64.2 | 98.5 | 70.6 | 279.3 | |||||||||||||||||||||||||||
| Cash provided (used) by operating activities | (46.8 | ) | 112.3 | 41.4 | 106.9 | (172.1 | ) | 177.8 | 59.8 | 395.8 | 461.3 | (27.0 | ) | 109.4 | 130.2 | 300.8 | 513.4 | |||||||||||||||||||||||||||
| Free cash flow (outflow) from operations* | (89.5 | ) | 71.3 | (0.1 | ) | (18.3 | ) | (250.1 | ) | 72.3 | 14.0 | 347.1 | 183.3 | (80.1 | ) | 40.1 | 97.4 | 262.4 | 319.8 | |||||||||||||||||||||||||
| Operating margin before depreciation and amortization and before IAROC** | 12.1 | % | 12.9 | % | 12.4 | % | 12.5 | % | 10.5 | % | 8.6 | % | 12.8 | % | 10.3 | % | 10.6 | % | 12.6 | % | 14.1 | % | 15.2 | % | 14.2 | % | 14.1 | % | ||||||||||||||||
| Operating margin before IAROC** | 6.3 | % | 7.0 | % | 7.0 | % | 6.8 | % | 4.8 | % | 2.6 | % | 7.3 | % | 5.0 | % | 4.9 | % | 7.0 | % | 8.4 | % | 10.1 | % | 9.2 | % | 8.7 | % | ||||||||||||||||
| Operating margin** | 6.0 | % | 3.7 | % | 6.2 | % | 5.3 | % | 4.8 | % | (2.8 | )% | 7.6 | % | 3.7 | % | 3.4 | % | 7.0 | % | 8.4 | % | 10.1 | % | 8.0 | % | 8.4 | % | ||||||||||||||||
| Segmented Information | ||||||||||||||||||||||||||||||||||||||||||||
| Revenues | ||||||||||||||||||||||||||||||||||||||||||||
| North America | $ | 1,192.4 | $ | 1,188.1 | $ | 1,291.6 | $ | 3,672.1 | $ | 1,230.4 | $ | 1,195.2 | $ | 1,282.2 | $ | 1,354.9 | $ | 5,062.7 | $ | 1,212.8 | $ | 1,182.4 | $ | 1,325.8 | $ | 1,366.2 | $ | 5,087.2 | ||||||||||||||||
| Europe | 315.4 | 309.7 | 295.7 | 920.8 | 263.6 | 274.3 | 273.2 | 340.3 | 1,151.4 | 216.3 | 244.1 | 253.6 | 288.5 | 1,002.5 | ||||||||||||||||||||||||||||||
| Latin America | 46.8 | 44.4 | 45.0 | 136.2 | 45.1 | 43.7 | 40.6 | 47.9 | 177.3 | 46.9 | 43.4 | 45.3 | 47.9 | 183.5 | ||||||||||||||||||||||||||||||
Operating income (loss) before IAROC | ||||||||||||||||||||||||||||||||||||||||||||
| North America | 87.0 | 95.5 | 112.7 | 295.2 | 81.3 | 43.3 | 108.5 | 71.0 | 304.1 | 105.3 | 121.7 | 155.7 | 135.9 | 518.6 | ||||||||||||||||||||||||||||||
| Europe | 11.9 | 12.4 | 9.3 | 33.6 | (1.9 | ) | 1.9 | 6.2 | 18.1 | 24.3 | 3.5 | 6.8 | 11.3 | 10.5 | 32.1 | |||||||||||||||||||||||||||||
| Latin America | 0.2 | 1.8 | 1.1 | 3.1 | (1.9 | ) | (3.5 | ) | 0.8 | 0.9 | (3.7 | ) | 2.3 | 2.7 | 5.2 | 4.0 | 14.2 | |||||||||||||||||||||||||||
Operating margins before IAROC** | ||||||||||||||||||||||||||||||||||||||||||||
| North America | 7.3 | % | 8.0 | % | 8.7 | % | 8.0 | % | 6.6 | % | 3.6 | % | 8.5 | % | 5.2 | % | 6.0 | % | 8.7 | % | 10.3 | % | 11.7 | % | 10.0 | % | 10.2 | % | ||||||||||||||||
| Europe | 3.8 | % | 4.0 | % | 3.1 | % | 3.6 | % | (0.7 | )% | 0.7 | % | 2.3 | % | 5.3 | % | 2.1 | % | 1.6 | % | 2.8 | % | 4.5 | % | 3.6 | % | 3.2 | % | ||||||||||||||||
| Latin America | 0.4 | % | 4.0 | % | 2.5 | % | 2.3 | % | (4.2 | )% | (8.0 | )% | 2.1 | % | 1.9 | % | (2.1 | )% | 4.9 | % | 6.1 | % | 11.6 | % | 8.4 | % | 7.8 | % | ||||||||||||||||
| Per Share Data | ||||||||||||||||||||||||||||||||||||||||||||
| Earnings (loss) | ||||||||||||||||||||||||||||||||||||||||||||
| Diluted | $ | 0.20 | $ | 0.05 | $ | 0.29 | $ | 0.55 | $ | 0.12 | $ | (0.51 | ) | $ | 0.38 | $ | (0.48 | ) | $ | (0.50 | ) | $ | 0.28 | $ | 0.40 | $ | 0.64 | $ | 0.44 | $ | 1.76 | |||||||||||||
| Diluted before IAROC | $ | 0.23 | $ | 0.31 | $ | 0.37 | $ | 0.91 | $ | 0.12 | $ | (0.07 | ) | $ | 0.34 | $ | (0.36 | ) | $ | 0.03 | $ | 0.28 | $ | 0.40 | $ | 0.64 | $ | 0.61 | $ | 1.92 | ||||||||||||||
| Dividends on equity shares | $ | 0.13 | $ | 0.13 | $ | 0.13 | $ | 0.39 | $ | 0.13 | $ | 0.13 | $ | 0.13 | $ | 0.13 | $ | 0.52 | $ | 0.12 | $ | 0.12 | $ | 0.12 | $ | 0.13 | $ | 0.49 | ||||||||||||||||
IAROC: Impairment of assets, restructuring and other charges
- *
- Cash provided from operating activities, less capital expenditures net of proceeds from disposals, and preferred share dividends.
- **
- Margins calculated on revenues.
Figure 11
The Company also enters into natural gas swap contracts to manage its exposure to the price of this commodity. Contracts outstanding at September 30, 2004 cover a notional quantity of 42,000 gigajoules in Canada and 1,154.000 MMBTU in the United States. These contracts expire between October 2004 and October 2005. Natural gas cost is adjusted to include amounts payable or receivable under the commodity hedge agreements. The total adjustment to gas cost for the first nine months of 2004 was a gain of $1.0 million (a loss of $0.1 million for the same period of 2003).
While the counterparties of these agreements expose the Company to credit loss in the event of non-performance, the Company believes that the possibility of incurring such a loss is remote due to the creditworthiness of the counterparties.
Realized and unrealized gains or losses associated with derivative instruments, which have been terminated or have ceased to be effective prior to maturity, are deferred on the balance sheet and recognized in income during the period in which the underlying hedged transaction is recognized. For the first nine months of 2004, the total amount deferred as a liability in relation to terminated derivative instruments was $11.8 million ($12.2 million for the same period of 2003) and the total amount recognized in income was $2.9 million ($2.7 million for the same period of 2003).
The fair values of the derivative financial instruments are estimated using period-end market rates and reflect the amount that the Company would receive or pay if the instruments were closed out at these dates (see figure 12).
OFF-BALANCE SHEET ARRANGEMENTS
Guarantees
In the normal course of business, the Company enters into numerous agreements that contingently require it to make payments to a third party based on changes in an underlying that is related to an asset, a liability or an equity of the guaranteed party, or failure of another party to perform under an obligating agreement.
Significant guarantees the Company has provided to third parties include the following:
Operating leases
The Company has guaranteed a portion of the residual values of certain of its assets under operating leases with expiry dates between 2005 and 2009, for the benefit of the lessor. If the fair value of the assets, at the end of their respective lease term, is less than the residual value guaranteed, then the Company must, under certain conditions compensate the lessor for a portion of the shortfall. The maximum exposure in respect of these guarantees is $103 million. Of this amount, none will expire in 2004 and $36 million will expire in 2005. As at September 30, 2004, the Company has recorded a liability of $7.3 million associated with these guarantees.
Sub-lease agreements
The Company has, for some of its assets under operating leases, entered into sub-lease agreements with expiry dates between 2005 and 2008. If the sub-lessee defaults under the agreement, the Company must, under certain conditions, compensate the lessor for the default. The maximum exposure in respect of these guarantees is $7 million. As at September 30, 2004, the Company has not recorded a liability associated with these guarantees, since it is not probable that the sub-lessee will default under the agreement. Recourse against the sub-lessee is also available, up to the total amount due.
Business and real estate disposals
In the sale of all or a part of a business or real estate, in addition to possible indemnifications relating to failure to perform covenants and breach of representations and warranties, the Company may agree to indemnify against claims from its past conduct of the business. Typically, the term and amount of such indemnification will be limited by the agreement. The nature of these indemnification agreements precludes the Company from estimating the maximum potential liability that could be required to be paid to guaranteed parties. The Company has not accrued any amount in the consolidated balance sheet with respect to this item.
Debt agreements
Under the terms of certain debt agreements, the Company has guaranteed the obligation of its US subsidiaries. In this context, the Company would have to indemnify the other parties against changes in regulations relative to withholding taxes, which would occur only if the Company was to perform the payments on behalf of its US subsidiaries. These indemnifications extend for the term of the related financings and do not provide any limit on the maximum potential liabilities. The nature of the indemnification agreements precludes the Company from estimating the maximum potential liability it could be required to pay. However, the majority of the obligations to which such guarantees apply, contain make-whole provisions which effectively limit the exposure associated with such an occurrence. Moreover, within the current structure of the transactions, the Company is not exposed to such liabilities. As such, the Company has not accrued any amount in the consolidated balance sheet with respect to this item.
Asset securitization
The Company is a party to securitization agreements to sell with limited recourse, and on a revolving basis, a portion of its Canadian, US, French and Spanish trade receivables, to unrelated trusts. The program limits under each of the Canadian, US and European securitization programs are Cdn$135 million, $510 million and 153 million Euros, respectively. The amounts outstanding under each program as at September 30, 2004 were Cdn$80 million, $388 million and 108 million Euros, respectively (Cdn$95 million, $377 million and 115 million Euros, respectively as at September 30, 2003).
As at September 30, 2004, the Company had a retained interest in the trade receivables sold of $127 million, which is recorded in the Company's trade receivables. As at September 30, 2004, an aggregate amount of $710 million ($667 million as at September 2003) of accounts receivable has been sold under the three programs, and securitization fees, recorded in selling, general and administrative expenses totalled $3 million for the third quarter of 2004 ($4 million for the third quarter of 2003) and $9 million for the first nine months of 2004 ($11 million for the same period of 2003). Servicing revenues and expenses did not have a material impact on the Company's results.
Fair Value of Derivative Financial Instruments($ millions)
| | September 30, 2004 | December 31, 2003 | ||||||||||||
|---|---|---|---|---|---|---|---|---|---|---|---|---|---|---|
| | Book Value | Fair Value | Book Value | Fair Value | ||||||||||
| Derivative financial instruments (gain (loss)) | ||||||||||||||
| Interest rate swap agreements | $ | — | $ | (3.3 | ) | $ | — | $ | (3.2 | ) | ||||
| Foreign exchange forward contracts | 54.2 | 82.0 | 42.6 | 73.3 | ||||||||||
| Cross currency interest rate swaps | (19.0 | ) | (19.0 | ) | (47.2 | ) | (54.2 | ) | ||||||
| Commodity swaps | 0.1 | 1.3 | — | 1.0 | ||||||||||
Figure 12
In September 2004, the Company renewed and amended its U.S. trade receivables securitization program. The $510.0 million program continues to be renewable annually and has been extended through September 2005. An amendment to the program gives the Company the option to extend the term of the program for an additional year. This increases the Company's liquidity horizon to 24 months.
The Company is subject to certain requirements under the securitization programs. In addition to financial covenants that mirror those contained in the bank facility, the Company is subject to other covenants typically found in investment grade securitization agreements. If such other covenants fail to be maintained, one or more of the securitization agreements could be terminated. If a termination event were to occur based on failure to meet one of these other covenants, the Company believes that it would be able to meet its cash obligations from other financing sources, such as its revolving bank facility, the issuance of debt or the issuance of equity. The Company believes that it would remain in compliance with the bank financial covenants if it refinanced the securitization programs with debt.
Leases
The Company rents premises and machinery and equipment under operating leases with third parties, which expire at various dates up to 2016 and for which undiscounted minimum lease payments total $355 million as at September 30, 2004. The minimum lease payments for the year 2004 are estimated to be $95 million. Of the total minimum lease payments, approximately 40% is for machinery and equipment. The Company has guaranteed a portion of the total residual values for a maximum exposure of $103 million.
RELATED PARTY TRANSACTIONS
The Company entered into transactions with the parent company and its other subsidiaries, which were accounted for at prices and conditions prevailing in the market. Intercompany revenues from the parent company's media subsidiaries involved mostly printing of magazines.
During the year 2003, the Company transferred the benefit of a deduction for Part VI.I tax to subsidiaries of its parent company for a consideration of Cdn$11 million ($9 million), recorded in receivables from related parties. This reduced the Company's available future income tax assets by Cdn$11 million ($8 million), and increased the additional paid-in capital by Cdn$0.6 million ($0.4 million). The transaction was recorded at the carrying amount.As at September 30, 2004, the entire amount has been collected.
The Company is in the process of concluding an agreement with one of the parent company's subsidiaries, Videotron Telecom Ltd. (VTL), to outsource its information technology (IT) infrastructure in North America for a duration of 7 years. As part of this agreement, VTL will purchase some of the Company's IT infrastructure equipment. All transactions will be done at the fair market value or at arm's length. The transfer of equipment is expected to be completed in the fourth quarter of 2004.
Related Party Transactions($ millions)
| | 2004 | 2003 | ||||
|---|---|---|---|---|---|---|
| Three months ended September 30, | ||||||
| Revenues | $ | 12.1 | $ | 9.7 | ||
| Management fees billed by Quebecor Inc. | 1.0 | 1.0 | ||||
| IT services billed by VTL | 3.4 | — | ||||
Nine months ended September 30, | ||||||
| Revenues | $ | 35.4 | $ | 30.8 | ||
| Management fees billed by Quebecor Inc. | 3.1 | 2.9 | ||||
| IT services billed by VTL | 3.4 | — | ||||
Figure 13
OUTSTANDING SHARE DATA
The following figure discloses the Company's outstanding share data as at the latest practicable date:
Outstanding Share Data($ millions and thousands of shares)
| | October 15, 2004 | ||||
|---|---|---|---|---|---|
| | Issued and outstanding shares | Book value | |||
| Equity Multiple Voting Shares | 46,987 | $ | 93.5 | ||
| Equity Subordinate Voting Shares | 85,567 | 1,154.4 | |||
| First Preferred Shares, Series 3 | 12,000 | 212.5 | |||
| First Preferred Shares, Series 4 | 8,000 | 130.2 | |||
| First Preferred Shares, Series 5 | 7,000 | 113.9 | |||
Figure 14
RISKS AND UNCERTAINTIES
The Company operates in the printing industry, which has a variety of risk factors and uncertainties. Due to the risks and uncertainties outlined below, the Company's operating environment and financial results may be materially affected.
Seasonality
The Company's business is sensitive to general economic cycles and may be adversely affected by the cyclical nature of the markets the Company serves, as well as by local, regional, national and global economic conditions. The operations of the Company's business are seasonal, with approximately two-thirds of historical operating income recognized in the third and fourth quarters of the fiscal year, primarily as a result of the higher number of magazine pages, new product launches and back-to-school, retail and holiday catalog promotions. Within any year, this seasonality could adversely affect the Company's cash flows and results of operations.
Operational Risk
The industry that the Company operates in is highly competitive in most product categories and geographic regions. Competition is largely based on price, quality, range of services offered, distribution capabilities, customer service, availability of printing time on appropriate equipment and state-of-the-art technology. The Company competes for commercial business not only with large national printers, but also with smaller regional printers. Over the past three years, the printing industry has experienced a reduction in demand for printed materials and it is currently experiencing excess capacity. Furthermore, some of the industries that the Company services have been subject to consolidation efforts, leading to a smaller number of potential customers. Primarily as a result of this excess capacity and customer consolidation, there has been, and may continue to be, downward pricing pressure and increased competition in the printing industry. Any failure by the Company to compete effectively in the markets it serves could have an adverse, material effect on the results of operations, financial condition and cash flows.
The Company is unable to predict market conditions and only has a limited ability to effect changes in market conditions for printing services. The Company cannot be certain that prices and demand for printing services will not decline from current levels. Changes to the level of supply and demand could cause prices to continue to decline, and prolonged periods of low prices, weak demand and/or excess supply could have a material adverse effect on the Company's business growth, results of operations and liquidity.
Risks associated with Capital Investments
Because production technologies continue to evolve, the Company must make capital expenditures to maintain its facilities and may be required to make significant capital expenditures to remain technologically and economically competitive. The Company may therefore be required to invest significant capital in improving production technologies. If the Company cannot obtain adequate capital, the operating results and financial condition may be adversely affected.
The Company is also subject to certain risks associated with the installation of new technology and equipment which may cause temporary disruption of operations and losses from operational inefficiencies. These disruptions are closely monitored in order to bring them under control within a short period of time. The impact on operational efficiency is affected by the length of the period of remediation.
Environmental Risk
The Company is subject to various laws, regulations and government policies relating to the generation, storage, transportation and disposal of solid waste, to air and water releases into the environment of various substances, and to environmental protection in general. The Company believes it is in compliance with applicable laws and requirements in all material respects.
The Company is also subject to various laws and regulations, which allow regulatory authorities to compel (or seek reimbursement for) cleanup of environmental contamination at the Company's own sites and at off-site facilities where its waste is or has been disposed of. The Company has established a provision for expenses associated with environmental remediation obligations when such amounts can be reasonably estimated. The amount of the provision is adjusted as new information is known. The Company believes the provision is adequate to cover the potential costs associated with those contamination issues.
The Company expects to incur ongoing capital and operating costs to maintain compliance with existing and future applicable environmental laws and requirements. Furthermore, the Company does not anticipate that maintaining compliance with such environmental statutes will have a material adverse effect upon the Company's competitive or consolidated financial position.
The Company believes that it has internal controls and personnel dedicated to compliance with all applicable environment laws and that it provides for adequate monitoring and management of the environmental risk related to its operations.
For the third quarter of 2004, the Company believes that there are no new environmental matters (environmental incident, promulgation of new environmental laws and regulations, soil and underground contamination discovery, etc.) to be reported that could have a material impact on the Company's consolidated financial statements.
Labor Agreements
While relations with employees have been stable to date and there has not been any material disruption in operations resulting from labor disputes, the Company cannot be certain that it will be able to maintain a productive and efficient labor environment. The Company cannot predict the outcome of any future negotiations relating to the renewal of the collective bargaining agreements, nor can it assure with certainty that work stoppages, strikes or other forms of labor protests pending the outcome of any future negotiations would not occur. Any strikes or other forms of labor protests in the future could disrupt the Company's operations and may have a material impact on business, financial condition or operating results.
As at September 30, 2004, the Company had 69 collective bargaining agreements in North America. Of this total, 4 agreements expired during the first nine months of 2004 and 3 are still under negotiation. In addition, 11 collective bargaining agreements, covering 778 employees, will expire in the last quarter of 2004. The Company has approximately 27,500 employees in North America. From this number, approximately 9,400 are unionized. Also, 87 of the plants and related facilities in North America are non-unionized.
Commodity Risk
The Company uses paper and ink as its primary raw materials. The price of paper is volatile over time and may cause significant fluctuations in the Company's net sales and cost of sales. The Company uses its purchasing power as one of the major buyers in the printing industry to obtain the best prices, terms, quality control and service. To maximize its purchasing power, the Company also negotiates with a limited number of suppliers. In addition, most of the Company's long-term contracts with its customers include price-adjustment clauses based on the cost of materials. The Company believes that it has adequate allocations with paper and ink suppliers to meet the needs of its customers.
Credit Risk
The Company estimates that concentrations of credit risk with respect to trade receivables are limited due to its diverse operations and large customer base. The total sales related to the Company's top 100 customers represented approximately 55% of total revenues in 2003.
As of September 30, 2004, the Company has no significant concentrations of credit risk and believes that the product and geographic diversity of its customer base reduces credit risk, as well as having a positive impact on local markets or product-line demand.
Financial Risk
The Company is exposed to a number of risks associated with fluctuations in foreign currency exchange rates, interest rates and commodity prices. The Company uses a number of derivative financial instruments to mitigate these risks such as foreign exchange forward contracts and cross currency swaps, interest rate swap agreements and commodity swap agreements. For more information, refer to section: Financial Instruments. The Company has established operating policies and processes, which prohibit the speculative use of financial instruments, document critical transactions and demonstrate the effectiveness of the financial instruments.
ACCOUNTING POLICIES
The consolidated financial statements have been prepared using the same accounting policies as described in the Company's latest Annual Report with the exception of the following items:
In March 2003, the Canadian Institute of Chartered Accountants ("CICA") issued Section 3110, Asset Retirement Obligations, which addresses financial accounting and reporting for legal obligations associated with the retirement of tangible long-lived assets that result from the acquisition, construction, development or normal use of the assets. The standard requires an entity to record the fair value of a liability for an asset retirement obligation in the period in which it is incurred and when a reasonable estimate of fair value can be made. The standard defines the fair value as the amount at which the liability could be settled in a current transaction between willing parties, other than in a forced or liquidation transaction. An entity is subsequently required to allocate the asset retirement cost and amortize it over its useful life. The Company adopted these new recommendations, as of January 1, 2004. The effect of adopting the new recommendations did not have a significant impact on the consolidated financial statements at the initial adoption date.
In April 2003, the CICA issued Section 3063, Impairment of Long-lived Assets, which establishes standards for the recognition, measurement and disclosure of the impairment of long-lived assets held for use. Accounting for the potential impairment of long-lived assets held for use is a two-step process with the first step determining when impairment should be recognized, and the second step measuring the amount of the impairment. An impairment loss is recognized when the carrying amount of an asset held for use exceeds the sum of the undiscounted cash flows expected from its use and eventual disposition. The impairment loss is measured as the amount by which the asset's carrying amount exceeds its fair value. In accordance with the CICA guideline, the Company adopted the new recommendations as of January 1, 2004. The effect of adopting the new recommendations did not have an impact on the consolidated financial statements at the initial adoption date.
In June 2003, the CICA issued amendments to Accounting Guideline 13, Hedging Relationships. The amendments clarify certain of the requirements and provide additional implementation guidance related to the identification, designation and documentation of the hedging relationships, and an assessment of their effectiveness. The requirements of the guideline are applicable to all hedging relationships in effect for fiscal years beginning on or after July 1, 2003. Retroactive application is not permitted. All hedging relationships must be assessed as of the beginning of the first year of application to determine whether the hedging criteria in the guideline are met. Hedge accounting is to be discontinued for any hedging relationships that do not meet the requirements of the guideline. The Company adopted the new recommendations effective January 1, 2004. The effect of adopting the new recommendations did not have a significant impact on the consolidated financial statements at the initial adoption date.
In July 2003, the CICA issued Section 1100, Generally Accepted Accounting Principles ("Canadian GAAP"), and Section 1400, General Standards of Financial Statement Presentation. These sections establish standards for financial reporting and fair presentation in accordance with Canadian GAAP, and provide guidance on sources to consult when a matter is not dealt with explicitly in the primary sources of Canadian GAAP. The Company adopted these new recommendations as of January 1, 2004. The effect of adopting the new recommendations did not have an impact on the consolidated financial statements at the initial adoption date.
In June 2003, the CICA issued Accounting Guideline No 15 ("AcG-15"), Consolidation of Variable Interest Entities, which presents the views of the Accounting Standards Board ("AcSB") on the application of consolidation principles on variable interest entities ("VIEs"). An entity is a VIE when its total equity investment is not sufficient to permit the entity to finance its activities without financial support from other parties or when the equity investors lack either voting control, an obligation to absorb expected losses or the right to receive expected residual returns. AcG-15 provides guidance in identifying VIEs and in determining whether consolidation is required. The guideline is expected to be effective for annual and interim periods beginning on or after November 1, 2004. The Company does not anticipate early adoption and is currently evaluating the impact of applying this guideline on its consolidated financial statements.
In November 2003, the AcSB approved a revision to Section 3860, Financial Instruments — Disclosure and Presentation that would require for certain obligations that must, or could be settled through delivery of an entity's own equity instruments to be presented as liabilities. This revision is effective for fiscal years beginning on or after November 1, 2004. The Company will implement this in its 2005 fiscal year and does not expect any impact on its consolidated financial statements.
In January 2004, the Emerging Issues Committee released Abstracts ("EIC-144"), Accounting by a Customer for Certain Consideration Received from a Vendor. This abstract addresses how a customer or reseller of a vendor's products should account for consideration received from a vendor. It requires that any cash consideration received from the vendor be considered as an adjustment of the prices of a vendor's products and services unless certain conditions are met, in which case it might be either an adjustment to the costs incurred by the reseller or payment for assets or services delivered to the vendor. The abstract also addresses the accounting for consideration received by a reseller from a vendor for honoring the vendor's sales incentives offered directly to consumers and whether that consideration should be recorded as a reduction of the cost of the reseller's purchases from the vendor. The Company adopted these new recommendations as of July 1, 2004. The effect of adopting the new recommendations did not have a significant impact on the consolidated financial statements at the initial adoption date.
In March 2004, the CICA revised Section 1751, Interim Financial Statements, to include a new requirement to disclose the total defined benefit cost of employee future benefits for the current interim period and fiscal year-to-date. The Company has adopted this requirement and the pension benefit cost is disclosed in note 13 of the consolidated financial statements.
FORWARD LOOKING STATEMENTS
Except for historical information contained herein, the statements in this document are forward-looking and made pursuant to the safe harbor provisions of the Private Securities Litigation Reform Act of 1995. Forward-looking statements involve known and unknown risks and uncertainties, which may cause actual results in future periods to differ materially from forecasted results. Those risks include, among others, changes in customer demand for products, changes in raw material and equipment costs and availability, seasonal changes in customer orders, pricing actions by competitors and general changes in economic conditions.
On behalf of Management,
 |
| Claude Hélie Executive Vice President Chief Financial Officer |
 |
| Carl Gauvreau Senior Vice President Chief Accounting Officer |
Montreal, Canada
October 27, 2004
The Company is a reporting issuer under the securities legislation of all the provinces of Canada and is registered in the United States and it is therefore required to file continuous disclosure documents such as interim and annual financial statements, a proxy circular, an annual information form, material change reports and press releases with such securities regulatory authorities. Copies of these documents may be obtained free of charge on request from the office of the Secretary of the Company or through the Internet at the following addresses: http://www.sedar.com and http://www.sec.gov/edgar.shtml.
CONSOLIDATED STATEMENTS OF INCOME AND RETAINED EARNINGS
Periods ended September 30,
(In millions of US dollars, except per share amounts)
(Unaudited)
| | | Three months | Nine months | ||||||||||||||
|---|---|---|---|---|---|---|---|---|---|---|---|---|---|---|---|---|---|
| | Notes | 2004 | 2003 | 2004 | 2003 | ||||||||||||
| Revenues | $ | 1,633.0 | $ | 1,596.8 | $ | 4,727.4 | $ | 4,649.9 | |||||||||
| Operating expenses: | |||||||||||||||||
| Cost of sales | 1,319.1 | 1,278.8 | 3,807.5 | 3,775.4 | |||||||||||||
| Selling, general and administrative | 118.2 | 118.6 | 350.1 | 395.2 | |||||||||||||
| Depreciation and amortization | 81.1 | 82.9 | 249.2 | 249.8 | |||||||||||||
| Impairment of assets, restructuring and other charges | 3 | 12.9 | (5.0 | ) | 68.9 | 76.8 | |||||||||||
| 1,531.3 | 1,475.3 | 4,475.7 | 4,497.2 | ||||||||||||||
| Operating income | 101.7 | 121.5 | 251.7 | 152.7 | |||||||||||||
| Financial expenses | 4 | 31.5 | 42.4 | 101.6 | 126.4 | ||||||||||||
| Income before income taxes | 70.2 | 79.1 | 150.1 | 26.3 | |||||||||||||
| Income taxes | 20.8 | 18.5 | 45.7 | 2.4 | |||||||||||||
| Income before minority interest | 49.4 | 60.6 | 104.4 | 23.9 | |||||||||||||
| Minority interest | 1.3 | 0.9 | 5.2 | 1.4 | |||||||||||||
| Net income | $ | 48.1 | $ | 59.7 | $ | 99.2 | $ | 22.5 | |||||||||
| Net income available to holders of preferred shares | 9.0 | 9.8 | 26.9 | 26.8 | |||||||||||||
| Net income (loss) available to holders of equity shares | $ | 39.1 | $ | 49.9 | $ | 72.3 | $ | (4.3 | ) | ||||||||
| Earnings (loss) per share: | 12 | ||||||||||||||||
| Basic | $ | 0.30 | $ | 0.38 | $ | 0.55 | $ | (0.03 | ) | ||||||||
| Diluted | $ | 0.29 | $ | 0.38 | $ | 0.55 | $ | (0.03 | ) | ||||||||
| Average number of equity shares outstanding | |||||||||||||||||
| (in millions) | 12 | ||||||||||||||||
| Basic | 132.5 | 131.8 | 132.3 | 137.4 | |||||||||||||
| Diluted | 132.7 | 135.7 | 132.5 | 137.4 | |||||||||||||
| Retained earnings: | |||||||||||||||||
| Balance, beginning of period | $ | 722.3 | $ | 771.8 | $ | 723.6 | $ | 901.9 | |||||||||
| Net income | 48.1 | 59.7 | 99.2 | 22.5 | |||||||||||||
| Shares repurchased | — | (0.2 | ) | — | (39.2 | ) | |||||||||||
| Dividends: | |||||||||||||||||
| Equity shares | (17.2 | ) | (17.1 | ) | (51.6 | ) | (53.9 | ) | |||||||||
| Preferred shares | (9.2 | ) | (9.8 | ) | (27.2 | ) | (26.9 | ) | |||||||||
| Balance, end of period | $ | 744.0 | $ | 804.4 | $ | 744.0 | $ | 804.4 | |||||||||
See Notes to Consolidated Financial Statements.
CONSOLIDATED STATEMENTS OF CASH FLOWS
Periods ended September 30,
(In millions of US dollars)
(Unaudited)
| | | Three months | Nine months | ||||||||||||||
|---|---|---|---|---|---|---|---|---|---|---|---|---|---|---|---|---|---|
| | Notes | 2004 | 2003 | 2004 | 2003 | ||||||||||||
| Operating activities: | |||||||||||||||||
| Net income | $ | 48.1 | $ | 59.7 | $ | 99.2 | $ | 22.5 | |||||||||
| Non-cash items in net income: | |||||||||||||||||
| Depreciation of property, plant and equipment | 81.0 | 82.1 | 248.7 | 247.9 | |||||||||||||
| Impairment of assets and non-cash portion of restructuring and other charges | 3 | 3.5 | — | 44.4 | 53.4 | ||||||||||||
| Future income taxes | 17.0 | 13.0 | 14.2 | (18.5 | ) | ||||||||||||
| Amortization of deferred charges | 6.6 | 6.4 | 19.4 | 18.8 | |||||||||||||
| Loss on extinguishment of long-term debt | 8 | — | — | 2.0 | — | ||||||||||||
| Other | 4.1 | 2.1 | 11.4 | 5.8 | |||||||||||||
Changes in non-cash balances related to operations: | |||||||||||||||||
| Trade receivables | (145.3 | ) | (182.3 | ) | (163.5 | ) | (49.6 | ) | |||||||||
| Inventories | (71.8 | ) | (39.2 | ) | (74.4 | ) | (3.4 | ) | |||||||||
| Trade payables and accrued liabilities | 105.7 | 118.4 | (66.9 | ) | (155.9 | ) | |||||||||||
| Other current assets and liabilities | 40.8 | 7.3 | 76.0 | 2.4 | |||||||||||||
| Other non-current assets and liabilities | (48.3 | ) | (7.7 | ) | (103.6 | ) | (57.9 | ) | |||||||||
| (118.9 | ) | (103.5 | ) | (332.4 | ) | (264.4 | ) | ||||||||||
| Cash provided by operating activities | 41.4 | 59.8 | 106.9 | 65.5 | |||||||||||||
Financing activities: | |||||||||||||||||
| Net change in bank indebtedness | 0.5 | 0.1 | 0.2 | 0.9 | |||||||||||||
| Net proceeds from issuance of equity shares | 2.6 | 3.2 | 9.3 | 10.6 | |||||||||||||
| Repurchases of shares for cancellation | — | (0.2 | ) | — | (173.6 | ) | |||||||||||
| Repayments of long-term debt | 8 | (150.0 | ) | (6.3 | ) | (198.0 | ) | (19.7 | ) | ||||||||
| Net (repayments) borrowings under revolving bank facility and commercial paper | 207.3 | 20.9 | 336.0 | 448.3 | |||||||||||||
| Dividends on equity shares | (17.2 | ) | (17.1 | ) | (51.6 | ) | (53.9 | ) | |||||||||
| Dividends on preferred shares | (5.9 | ) | (11.1 | ) | (26.1 | ) | (25.9 | ) | |||||||||
| Dividends to minority shareholders | — | — | (0.8 | ) | (0.4 | ) | |||||||||||
| Cash provided by (used in) financing activities | 37.3 | (10.5 | ) | 69.0 | 186.3 | ||||||||||||
Investing activities: | |||||||||||||||||
| Business acquisitions, net of cash and cash equivalents | 6 | (2.4 | ) | — | (4.7 | ) | (7.5 | ) | |||||||||
| Additions to property, plant and equipment | (35.9 | ) | (35.6 | ) | (100.8 | ) | (205.6 | ) | |||||||||
| Net proceeds from disposal of other assets | 0.3 | 0.9 | 1.7 | 2.2 | |||||||||||||
| Other | — | — | — | (0.8 | ) | ||||||||||||
| Cash used in investing activities | (38.0 | ) | (34.7 | ) | (103.8 | ) | (211.7 | ) | |||||||||
Effect of exchange rate changes on cash and cash equivalents | (31.6 | ) | (4.3 | ) | (32.4 | ) | (25.5 | ) | |||||||||
| Net increase in cash and cash equivalents | 9.1 | 10.3 | 39.7 | 14.6 | |||||||||||||
| Cash and cash equivalents, beginning of period | 45.7 | 7.0 | 15.1 | 2.7 | |||||||||||||
| Cash and cash equivalents, end of period | $ | 54.8 | $ | 17.3 | $ | 54.8 | $ | 17.3 | |||||||||
| Supplemental cash flow information: | |||||||||||||||||
| Interest paid | $ | 40.0 | $ | 54.9 | $ | 105.5 | $ | 131.9 | |||||||||
| Income taxes paid | 7.0 | 6.5 | 57.3 | 38.8 | |||||||||||||
See Notes to Consolidated Financial Statements.
CONSOLIDATED BALANCE SHEETS
(In millions of US dollars)
| | Notes | September 30, 2004 | December 31, 2003 | September 30, 2003 | |||||||||
|---|---|---|---|---|---|---|---|---|---|---|---|---|---|
| | | (Unaudited) | (Audited) | (Unaudited) | |||||||||
| Assets | |||||||||||||
| Current assets: | |||||||||||||
| Cash and cash equivalents | $ | 54.8 | $ | 15.1 | $ | 17.3 | |||||||
| Trade receivables | 5 | 511.9 | 346.9 | 540.0 | |||||||||
| Receivables from related parties | 9.8 | 16.5 | 7.5 | ||||||||||
| Inventories | 474.8 | 400.1 | 426.4 | ||||||||||
| Income taxes receivable | 10.3 | 6.2 | 22.1 | ||||||||||
| Future income taxes | 24.4 | 105.8 | 27.8 | ||||||||||
| Prepaid expenses | 18.8 | 17.4 | 21.2 | ||||||||||
| Total current assets | 1,104.8 | 908.0 | 1,062.3 | ||||||||||
Property, plant and equipment, net | 2,388.3 | 2,581.0 | 2,586.1 | ||||||||||
| Goodwill | 7 | 2,590.6 | 2,591.0 | 2,562.3 | |||||||||
| Other assets | 197.3 | 176.9 | 160.2 | ||||||||||
| Total assets | $ | 6,281.0 | $ | 6,256.9 | $ | 6,370.9 | |||||||
| Liabilities and Shareholders' Equity | |||||||||||||
| Current liabilities: | |||||||||||||
| Bank indebtedness | $ | 1.5 | $ | 1.3 | $ | 1.2 | |||||||
| Trade payables | 465.3 | 455.7 | 463.9 | ||||||||||
| Accrued liabilities | 465.9 | 552.5 | 483.6 | ||||||||||
| Payables to related parties | 0.3 | 0.1 | 0.1 | ||||||||||
| Income and other taxes payable | 52.1 | 61.3 | 67.5 | ||||||||||
| Future income taxes | 15.2 | 6.2 | — | ||||||||||
| Current portion of long-term debt and convertible notes | 11.7 | 23.9 | 22.4 | ||||||||||
| Total current liabilities | 1,012.0 | 1,101.0 | 1,038.7 | ||||||||||
Long-term debt | 8 | 2,038.3 | 1,874.4 | 2,135.8 | |||||||||
| Other liabilities | 220.4 | 237.6 | 237.1 | ||||||||||
| Future income taxes | 340.4 | 405.1 | 278.8 | ||||||||||
| Convertible notes | 9 | 112.2 | 110.7 | 110.2 | |||||||||
| Minority interest | 27.8 | 24.7 | 22.0 | ||||||||||
Shareholders' equity: | |||||||||||||
| Capital stock | 11 | 1,702.4 | 1,693.1 | 1,690.1 | |||||||||
| Additional paid-in capital | 108.0 | 105.9 | 103.5 | ||||||||||
| Retained earnings | 744.0 | 723.6 | 804.4 | ||||||||||
| Translation adjustment | (24.5 | ) | (19.2 | ) | (49.7 | ) | |||||||
| 2,529.9 | 2,503.4 | 2,548.3 | |||||||||||
| Total liabilities and shareholders' equity | $ | 6,281.0 | $ | 6,256.9 | $ | 6,370.9 | |||||||
See Notes to Consolidated Financial Statements.
NOTES TO CONSOLIDATED FINANCIAL STATEMENTS
Periods ended September 30, 2004 and 2003
(Tabular amounts are expressed in millions of US dollars, except for
earnings per share amounts and number of shares and options)
(Unaudited)
1. BASIS OF PRESENTATION
The consolidated financial statements included in this report are unaudited and reflect normal and recurring adjustments which are, in the opinion of the Company, considered necessary for a fair presentation. These consolidated financial statements have been prepared in conformity with Canadian generally accepted accounting principles ("Canadian GAAP"). The same accounting policies as described in the Company's latest Annual Report have been used, with the exception of the new accounting changes described in note 2. However, these consolidated financial statements do not include all disclosures required under Canadian GAAP and, accordingly, should be read in conjunction with the consolidated financial statements and the notes thereto included in the Company's latest Annual Report.
Seasonality
The operations of the Company's business are seasonal, with approximately two-thirds of operating income historically recognized in the second half of the fiscal year, primarily due to the higher number of magazine pages, new product launches and back-to-school, retail and holiday catalog promotions. The results of operations for the interim periods should not be considered indicative of full year results.
Reclassification
Certain reclassifications have been made to prior period's amounts in order to conform with the basis of presentation adopted in the current period.
2. NEW ACCOUNTING STANDARDS
Asset retirement obligations
In March 2003, the Canadian Institute of Chartered Accountants ("CICA") issued Section 3110, Asset Retirement Obligations, which addresses financial accounting and reporting for legal obligations associated with the retirement of tangible long-lived assets that result from the acquisition, construction, development or normal use of the assets. The standard requires an entity to record the fair value of a liability for an asset retirement obligation in the period in which it is incurred and when a reasonable estimate of fair value can be made. The standard defines the fair value as the amount at which the liability could be settled in a current transaction between willing parties, other than in a forced or liquidation transaction. An entity is subsequently required to allocate the asset retirement cost and amortize it over its useful life. The Company adopted these new recommendations, as of January 1, 2004. The effect of adopting the new recommendations did not have a significant impact on the consolidated financial statements at the initial adoption date.
Impairment of long-lived assets
In April 2003, the CICA issued Section 3063, Impairment of Long-lived Assets, which establishes standards for the recognition, measurement and disclosure of the impairment of long-lived assets held for use. Accounting for the potential impairment of long-lived assets held for use is a two-step process with the first step determining when impairment should be recognized and the second step measuring the amount of the impairment. An impairment loss is recognized when the carrying amount of an asset held for use exceeds the sum of the undiscounted cash flows expected from its use and eventual disposition. The impairment loss is measured as the amount by which the asset's carrying amount exceeds its fair value. In accordance with the CICA guideline, the Company adopted the new recommendations as of January 1, 2004. The effect of adopting the new recommendations did not have an impact on the consolidated financial statements at the initial adoption date.
Hedging relationships
In June 2003, the CICA issued amendments to Accounting Guideline 13, Hedging relationships. The amendments clarify certain of the requirements and provide additional implementation guidance related to the identification, designation and documentation of the hedging relationships and an assessment of their effectiveness. The requirements of the guideline are applicable to all hedging relationships in effect for fiscal years beginning on or after July 1, 2003. Retroactive application is not permitted. All hedging relationships must be assessed as of the beginning of the first year of application to determine whether the hedging criteria in the guideline are met. Hedge accounting is to be discontinued for any hedging relationships that do not meet the requirements of the guideline. The Company adopted the new recommendations effective January 1, 2004. The effect of adopting the new recommendations did not have a significant impact on the consolidated financial statements at the initial adoption date.
Generally accepted accounting principles and general standards of financial statement presentation
In July 2003, the CICA issued Section 1100, Generally Accepted Accounting Principles, and Section 1400, General Standards of Financial Statement Presentation. These sections establish standards for financial reporting and fair presentation in accordance with Canadian GAAP and provide guidance on sources to consult when a matter is not dealt with explicitly in the primary sources of Canadian GAAP. The Company adopted these new recommendations as of January 1, 2004. The effect of adopting the new recommendations did not have an impact on the consolidated financial statements at the initial adoption date.
Accounting by a customer for certain consideration received from a vendor
In January 2004, the Emerging Issues Committee released Abstracts ("EIC-144"), Accounting by a Customer for Certain Consideration Received from a Vendor. This abstract addresses how a customer or reseller of a vendor's products should account for consideration received from a vendor. It requires that any cash consideration received from the vendor be considered as an adjustment of the prices of a vendor's products and services unless certain conditions are met, in which case it might be either an adjustment to the costs incurred by the reseller or payment for assets or services delivered to the vendor. The abstract also addresses the accounting for consideration received by a reseller from a vendor for honoring the vendor's sales incentives offered directly to consumers and whether that consideration should be recorded as a reduction of the cost of the reseller's purchases from the vendor. The Company adopted these new recommendations as of July 1, 2004. The effect of adopting the new recommendations did not have a significant impact on the consolidated financial statements at the initial adoption date.
3. IMPAIRMENT OF ASSETS, RESTRUCTURING AND OTHER CHARGES
During the third quarter of 2004, the Company recorded an impairment of assets and restructuring charges of $12.9 million. Non-cash items amounted to $3.5 million and cash items to $9.4 million. The cash portion was made up of an $11.1 million charge related to current year initiatives and up $1.7 million net reversal of prior years' and current year initiatives. For the nine-month period ended September 30, 2004, the Company recorded impairment of assets and restructuring charges of $68.9 million, composed of non-cash items of $44.4 million and cash items of $24.5 million.
Impairment of assets
The execution of the 2004 restructuring initiatives resulted in certain assets becoming permanently idle. In addition, the initiatives triggered impairment tests on other groups of assets. For the nine-month period ended September 30, 2004, the Company recorded impairment of assets of $36.4 million, including $35.4 million for long-lived assets and $1.0 million for other assets.
During the third quarter of 2004, the Company recorded $3.5 million of impairment of long-lived assets, including $2.9 million for Europe and $0.6 million for Latin America. In the second quarter, the Company recorded $40.9 million, including $40.7 million for North America and $0.2 million for Europe.
The impairment of long-lived assets has been calculated as the excess of the carrying amount of an asset over its fair value, based on market prices when available, or on the expected present value of future cash flows approach.
2004 Restructuring charges
During the third quarter the Company continued its restructuring initiatives and approved the closure of the Stockholm facility in Sweden, the consolidation of a small facility in North America and other workforce reduction across the Company. The cash cost of these initiatives was estimated at $17.5 million, of which $6.9 million, mostly related to workforce reduction, was recorded in the third quarter and $10.6 million remains to be booked over the remainder of fiscal year 2004 and fiscal year 2005, when the liability related to the initiatives will have been contracted. The third quarter initiatives affected 282 employees in total, however the Company estimated that 29 new jobs will be created in other facilities. In summary, 95 employee positions have been eliminated and 187 will be eliminated before December 31, 2004. The Company also recorded $1.5 million resulting from the implementation of the second quarter initiatives and $2.7 million for the pension obligation related to the Effingham multi-employer benefit plan. Further information should become available over the next months, which will allow the Company to measure and recognize other liabilities related to this pension obligation. The $11.1 million cash portion recorded in the third quarter, included $6.3 million for North America and $4.4 million for Europe.
In the second quarter of 2004, the Company initiated restructuring initiatives to improve asset utilization and enhance efficiency. The restructuring initiatives included the closure of the Effingham, Illinois facility in the Magazine platform, an important downsizing at the Kingsport, Tennessee facility in the Book platform and other workforce reductions across the Company. The cash cost of these initiatives was estimated at $18.3 million, of which, $11.2 million was recorded in the second quarter of 2004. With the $1.5 million recorded in the third quarter, $5.6 million remains to be booked in the fourth quarter of 2004 and fiscal year 2005, when the liability related to the initiatives will be contracted. These costs excluded a pension obligation related to the Effingham multi-employer benefit plan that could not be reasonably estimated at that time. The $12.7 million cash portion, mostly related to workforce reduction, included $11.7 million for North America, $0.5 million for Europe and $0.5 million for Latin America. The non-cash cost of these initiatives included $8.0 million for a curtailment of an American pension plan's. The number of employees affected by the second quarter restructuring initiatives has been revised at 1,331 employees in total, however the Company estimated that 457 new jobs will be created in other facilities. In summary, 934 employee positions have been eliminated and 397 will be eliminated before December 31, 2004.
In the first quarter of 2004, the Company initiated restructuring initiatives and recorded $5.0 million for workforce reduction, of which $3.9 million was for North America, $0.6 million for Europe and $0.3 million for Latin America. Under these initiatives, 354 employee positions have been eliminated and 1 remains to come.
During the third quarter, the execution of the prior 2004 initiatives resulted in a net reversal of $0.1 million comprised of cash overspending of $0.6 million and a $0.7 million reversal of prior years' restructuring and other charges.
Prior years' restructuring and other charges
During the third quarter, the execution of the prior years' initiatives resulted in a net reversal of $1.6 million comprised of a cash overspending of $1.2 million and a $2.8 million reversal of prior years' restructuring and other charges. The net reversal was mainly related to the cancellation of the termination of 19 employee positions. In the second quarter, the net reversal of $0.4 million resulting from a cash overspending of $2.6 million and a $3.0 million reversal of prior year restructuring charges was essentially explained by the cancellation of the termination of 8 employee positions. In the first quarter, the net reversal of $0.7 million was mainly related to the cancellation of the termination of 48 employee positions and was made up of a cash overspending of $1.3 million and a $2.0 million reversal of prior years' restructuring charges. Under these initiatives, 6,172 employee positions were eliminated as at September 30, 2004 and 9 will be eliminated in the fourth quarter of 2004.
Continuity of the reserve for restructuring and other charges
As at January 1, 2004, the balance of the restructuring reserve was $45.8 million. This amount related mostly to the workforce reduction across the platform and lease and facility carrying costs. The Company utilized $38.3 million of the current and prior years' restructuring and other charges reserves during the nine-month period ended September 30, 2004.
The following table sets forth the Company's 2004 restructuring reserve and activities against the reserves carried forward from 2003:
| | Restructuring charges | Other charges | Total | ||||||||
|---|---|---|---|---|---|---|---|---|---|---|---|
| Balance as at December 31, 2003 | $ | 44.6 | $ | 1.2 | $ | 45.8 | |||||
| Overspending of 2001-2003 initiatives | 5.1 | — | 5.1 | ||||||||
| Reversal of previous years' reserves | (7.8 | ) | — | (7.8 | ) | ||||||
| New initiatives in 2004 | |||||||||||
| March 31 | 5.0 | — | 5.0 | ||||||||
| June 30 | 11.2 | — | 11.2 | ||||||||
| September 30 | 11.1 | — | 11.1 | ||||||||
| Net reversal of March 31 and June 30 initiatives | (0.1 | ) | — | (0.1 | ) | ||||||
| Reserve utilized in 2004 | (37.6 | ) | (0.7 | ) | (38.3 | ) | |||||
| Foreign currency changes | (0.2 | ) | — | (0.2 | ) | ||||||
| Balance as at September 30, 2004 | $ | 31.3 | $ | 0.5 | $ | 31.8 | |||||
The utilization of the reserve is estimated to be as follows:
| | Workforce reduction costs | Leases, closed facilities carrying costs and other | Total | ||||||
|---|---|---|---|---|---|---|---|---|---|
| Remainder of 2004 | $ | 9.4 | $ | 2.6 | $ | 12.0 | |||
| 2005 | 8.3 | 5.0 | 13.3 | ||||||
| 2006 | — | 2.7 | 2.7 | ||||||
| 2007 | — | 2.0 | 2.0 | ||||||
| 2008 | — | 1.2 | 1.2 | ||||||
| 2009 and thereafter | — | 0.6 | 0.6 | ||||||
| $ | 17.7 | $ | 14.1 | $ | 31.8 | ||||
4. FINANCIAL EXPENSES
| | | Three months | Nine months | ||||||||||||
|---|---|---|---|---|---|---|---|---|---|---|---|---|---|---|---|
| | Note | 2004 | 2003 | 2004 | 2003 | ||||||||||
| Interest on long-term debt and convertible notes | $ | 30.1 | $ | 38.0 | $ | 93.7 | $ | 112.8 | |||||||
| Interest on short-term debt | 0.4 | 2.7 | 3.7 | 7.5 | |||||||||||
| Amortization of deferred financing costs | 0.4 | 0.8 | 2.2 | 2.6 | |||||||||||
| Exchange losses | 0.7 | 1.6 | 0.9 | 5.5 | |||||||||||
| Loss on extinguishment of long-term debt | 8 | — | — | 2.0 | — | ||||||||||
| 31.6 | 43.1 | 102.5 | 128.4 | ||||||||||||
| Interest capitalized to the cost of equipment | (0.1 | ) | (0.7 | ) | (0.9 | ) | (2.0 | ) | |||||||
| $ | 31.5 | $ | 42.4 | $ | 101.6 | $ | 126.4 | ||||||||
5. TRADE RECEIVABLES
In September 2004, the Company renewed and amended its U.S. trade receivables securitization program. The $510.0 million program continues to be renewable annually and has been extended through September 2005. An amendment to the program provides the Company the option to extend the term of the program for an additional year.
6. BUSINESS ACQUISITIONS
In September 2004, the Company acquired a minority interest in its North American operations for a cash consideration of $2.4 million, of which $1.7 million has been recorded in goodwill.
In April 2004, the Company acquired a minority interest in its Spanish operations for a cash consideration of $1.7 million, of which $1.5 million has been recorded in goodwill.
In March 2004, the Company acquired a minority interest in its North American operations for a cash consideration of $0.6 million, of which $0.4 million has been recorded in goodwill.
7. GOODWILL
The changes in the carrying amount of goodwill for the nine-month period ended September 30, 2004 are as follows:
| | North America | Europe | Latin America | Total | |||||||||
|---|---|---|---|---|---|---|---|---|---|---|---|---|---|
| Balance as at December 31, 2003 | $ | 2,192.2 | $ | 391.1 | $ | 7.7 | $ | 2,591.0 | |||||
| Goodwill acquired during the period | 2.1 | 1.5 | — | 3.6 | |||||||||
| Foreign currency changes | 1.0 | (5.3 | ) | 0.3 | (4.0 | ) | |||||||
| Balance as at September 30, 2004 | $ | 2,195.3 | $ | 387.3 | $ | 8.0 | $ | 2,590.6 | |||||
8. LONG-TERM DEBT
The 6.50% senior debentures due on August 1, 2027 were redeemable at the option of the holders at par value on August 1, 2004. Out of a total principal amount of $150.0 million, $146.8 million senior debentures have been tendered during the third quarter.
During the first quarter, the Company discontinued its Canadian Commercial paper program. As at December 31, 2003, Cdn$0.4 million ($0.3 million) was outstanding under the program.
In February 2004, the Company redeemed all of the 7.75% senior notes callable on or after February 15, 2004 that were not tendered in November 2003, for a total cash consideration of $32.5 million. This extinguishment of long-term debt resulted in a loss of $2.0 million, consisting of premium paid and write-off of discounts and deferred costs.
9. CONVERTIBLE NOTES
In May 2004, the Company repaid the $6.0 million of 7.00% convertible subordinate debentures at maturity.
10. STOCK-BASED COMPENSATION
The Company uses the fair value based method of accounting for stock options granted to employees on or after January 1, 2003, and compensation cost is charged against income. However, prior to January 1, 2003, the Company used the settlement based method for its stock-based compensation plans. Had compensation cost been determined using the fair value based method at the date of grant for awards granted in 2002 under all plans, the Company's pro forma net income, earnings per share and diluted earnings per share would have been as presented in the table below.
| | Three months | Nine months | ||||||||||||
|---|---|---|---|---|---|---|---|---|---|---|---|---|---|---|
| | 2004 | 2003 | 2004 | 2003 | ||||||||||
| Pro forma net income | $ | 48.0 | $ | 59.8 | $ | 98.9 | $ | 22.2 | ||||||
| Pro forma earnings (loss) per share: | ||||||||||||||
| Basic | $ | 0.29 | $ | 0.38 | $ | 0.54 | $ | (0.03 | ) | |||||
| Diluted | $ | 0.29 | $ | 0.37 | $ | 0.54 | $ | (0.03 | ) | |||||
The pro forma disclosure omits the effect of awards granted before January 1, 2002. These pro forma amounts include a compensation cost calculated using the Black-Scholes option pricing model with the following assumptions:
| Weighted-average grant date fair value of options | $4.83 | ||
| Assumptions: | |||
| Risk-free interest rate | 4.48% - 5.07% | ||
| Dividend yield | 2% | ||
| Expected volatility | 25% | ||
| Expected life | 7 years | ||
The following table summarizes information about stock options:
| | September 30, 2004 | December 31, 2003 | |||
|---|---|---|---|---|---|
| Number of stock options at the end of the period (in thousands): | |||||
| Outstanding | 4,519.9 | 3,699.1 | |||
| Exercisable | 2,341.7 | 1,939.5 | |||
During the nine-month period of 2004, the Company issued 1,110,700 stock options including a special grant of 1,000,000 stock options. The special grant includes 500,000 stock options that will time vest over four years, 300,000 stock options vesting at a rate of 25% per year based on targeted earnings per share and 200,000 stock options vesting at a rate of 25% per year based on targeted share prices. The total compensation expense recorded for the third quarter and the year-to-date of 2004 was $1.3 million and $2.3 million, respectively.
11. CAPITAL STOCK
| | September 30, 2004 | December 31, 2003 | | ||||||||||
|---|---|---|---|---|---|---|---|---|---|---|---|---|---|
| | Number | Amount | Number | Amount | Convertible into | ||||||||
| (Thousands of shares) | |||||||||||||
| Multiple voting shares | 46,987 | $ | 93.5 | 46,987 | $ | 93.5 | Subordinate shares | ||||||
| Subordinate voting shares | 85,471 | 1,152.3 | 84,964 | 1,143.0 | n/a | ||||||||
| Redeemable first preferred shares: | |||||||||||||
| Series 3 | 12,000 | 212.5 | 12,000 | 212.5 | Series 2 preferred shares(1) | ||||||||
| Series 4 | 8,000 | 130.2 | 8,000 | 130.2 | Subordinate share(1) | ||||||||
| Series 5 | 7,000 | 113.9 | 7,000 | 113.9 | Subordinate share(1) | ||||||||
| 27,000 | 456.6 | 27,000 | 456.6 | ||||||||||
| Total capital stock | $ | 1,702.4 | $ | 1,693.1 | |||||||||
- (1)
- Under certain conditions
12. EARNINGS PER SHARE
The following table sets forth the computation of basic and diluted earnings per share:
| | Three months | Nine months | ||||||||||||
|---|---|---|---|---|---|---|---|---|---|---|---|---|---|---|
| | 2004 | 2003 | 2004 | 2003 | ||||||||||
| Net income (loss) available to holders of equity shares | $ | 39.1 | $ | 49.9 | $ | 72.3 | $ | (4.3 | ) | |||||
| (In millions) | ||||||||||||||
| Weighted-average number of equity shares outstanding | 132.5 | 131.8 | 132.3 | 137.4 | ||||||||||
| Effect of dilutive stock options | 0.2 | 3.9 | 0.2 | — | ||||||||||
| Weighted-average number of diluted equity shares outstanding | 132.7 | 135.7 | 132.5 | 137.4 | ||||||||||
| Earnings (loss) per share: | ||||||||||||||
| Basic | $ | 0.30 | $ | 0.38 | $ | 0.55 | $ | (0.03 | ) | |||||
| Diluted | $ | 0.29 | $ | 0.38 | $ | 0.55 | $ | (0.03 | ) | |||||
For the three-month and nine-month periods ended September 30, 2004, diluted earnings per share do not include the effects of the convertible notes, as the effect of their inclusion is anti-dilutive. For the nine-month period ended September 30, 2003, loss per share did not include the effects of the convertible notes and the stock options outstanding, as the effect of their inclusion is anti-dilutive.
13. PENSION AND OTHER POSTRETIREMENT BENEFITS
The following table presents the Company's pension and other postretirement benefit costs:
| | Three months | Nine months | ||||||||||
|---|---|---|---|---|---|---|---|---|---|---|---|---|
| | 2004 | 2003 | 2004 | 2003 | ||||||||
| Pension benefits | $ | 18.7 | $ | 15.2 | $ | 51.7 | $ | 42.4 | ||||
| Postretirement benefits | 4.2 | 2.2 | 8.7 | 6.0 | ||||||||
| Total periodic benefit cost | $ | 22.9 | $ | 17.4 | $ | 60.4 | $ | 48.4 | ||||
The 2004 pension benefit costs included $10.7 million pension obligation related to restructuring, as described in note 3.
14. COMMITMENTS
Machinery and equipment
During the third quarter of 2004, the Company signed agreements to purchase 9 new presses for its U.S. magazine, catalog, retail and book platforms. Future payments related to these commitments will amount to $81.6 million for 2005 and $23.3 million for 2006.
Business acquisition
The Company has a binding agreement to purchase the remaining 50% of Helio Charleroi in Belgium, a subsidiary of European Graphic Group, SA. The purchase price, estimated based on the financial performance achieved during the last three fiscal years, should amount to 35.4 million Euros ($43.4 million). The transaction is expected to be completed during the fourth quarter of 2004.
15. SEGMENT DISCLOSURE
The Company operates in the printing industry. Its business groups are located in three main segments: North America, Europe and Latin America. The Company assesses the performance of each segment based on operating income before restructuring and other charges. These segments are managed separately, since they all require specific market strategies. The following is a summary of the segmented information:
| | North America | Europe | Latin America | Other | Inter- Segment | Total | |||||||||||||
|---|---|---|---|---|---|---|---|---|---|---|---|---|---|---|---|---|---|---|---|
| Three months ended June 30, | |||||||||||||||||||
2004 | |||||||||||||||||||
| Revenues | $ | 1,291.6 | $ | 295.7 | $ | 45.0 | $ | 0.1 | $ | 0.6 | $ | 1,633.0 | |||||||
| Impairment of assets, restructuring and other charges | 6.1 | 6.1 | 0.5 | 0.2 | — | 12.9 | |||||||||||||
| Operating income (loss) | 106.6 | 3.2 | 0.6 | (8.7 | ) | — | 101.7 | ||||||||||||
2003 | |||||||||||||||||||
| Revenues | $ | 1,282.2 | $ | 273.2 | $ | 40.6 | $ | 0.2 | $ | 0.6 | $ | 1,596.8 | |||||||
| Impairment of assets restructuring and other charges | 2.5 | (7.6 | ) | — | 0.1 | — | (5.0 | ) | |||||||||||
| Operating income | 106.0 | 13.8 | 0.8 | 0.9 | — | 121.5 | |||||||||||||
Nine months ended September 30, | |||||||||||||||||||
2004 | |||||||||||||||||||
| Revenues | $ | 3,672.1 | $ | 920.8 | $ | 136.2 | $ | 0.3 | $ | (2.0 | ) | $ | 4,727.4 | ||||||
| Impairment of assets, restructuring and other charges | 58.3 | 9.0 | 1.1 | 0.5 | — | 68.9 | |||||||||||||
| Operating income (loss) | 236.9 | 24.6 | 2.0 | (11.8 | ) | — | 251.7 | ||||||||||||
2003 | |||||||||||||||||||
| Revenues | $ | 3,707.8 | $ | 811.1 | $ | 129.4 | $ | 0.3 | $ | 1.3 | $ | 4,649.9 | |||||||
| Impairment of assets, restructuring and other charges | 60.6 | 5.6 | 9.6 | 1.0 | — | 76.8 | |||||||||||||
| Operating income (loss) | 172.5 | 0.6 | (14.2 | ) | (6.2 | ) | — | 152.7 | |||||||||||
FORM 52-109FT2
CERTIFICATION OF INTERIM FILINGS
DURING TRANSITION PERIOD
I, Pierre Karl Péladeau, President and Chief Executive Officer of Quebecor World Inc., certify that:
- I have reviewed the interim filings (as this term is defined in Multilateral Instrument 52-109Certification of Disclosure in Issuers' Annual and Interim Filings) ofQuebecor World Inc., (the issuer) for the interim period ending September 30, 2004;
- Based on my knowledge, the interim filings do not contain any untrue statement of a material fact or omit to state a material fact required to be stated or that is necessary to make a statement not misleading in light of the circumstances under which it was made, with respect to the period covered by the interim filings; and
- Based on my knowledge, the interim financial statements together with the other financial information included in the interim filings fairly present in all material aspects the financial condition, results of operations and cash flows of the issuer, as of the date and for the periods presented in the interim filings.
Date: October 27, 2004
/s/Pierre Karl Péladeau
Pierre Karl Péladeau
President and Chief Executive Officer
FORM 52-109FT2
CERTIFICATION OF INTERIM FILINGS
DURING TRANSITION PERIOD
I, Claude Hélie, Executive Vice President and Chief Financial Officer of Quebecor World Inc., certify that:
Date: October 27, 2004
/s/Claude Hélie
Claude Hélie
Executive Vice President and
Chief Financial Officer
SIGNATURES
Pursuant to the requirements of the Securities Exchange Act of 1934, the registrant has duly caused this report to be signed on its behalf by the undersigned, thereunto duly authorized.
QUEBECOR WORLD INC.
By:/s/ Louis Saint-Arnaud
Name: Louis Saint-Arnaud
Title: Senior Vice President, Legal Affairs and Corporate Secretary
Date: October 27, 2004
Financial Highlights
MANAGEMENT'S DISCUSSION AND ANALYSIS OF FINANCIAL CONDITION AND RESULTS OF OPERATIONS
Consolidated Statements of Income and Retained Earnings
Consolidated Statements of Cash Flows
Consolidated Balance Sheets
Notes to Consolidated Financial Statements