QuickLinks -- Click here to rapidly navigate through this document
SECURITIES AND EXCHANGE COMMISSION
Washington, DC 20549
FORM 6-K
REPORT OF FOREIGN ISSUER
PURSUANT TO RULE 13a-16 or 15d-16 OF
THE SECURITIES EXCHANGE ACT OF 1934
For the month of May 2005
Commission File Number:1-14118
2005 FIRST QUARTER RESULTS
QUEBECOR WORLD INC.
(Translation of Registrant's Name into English)
612 Saint-Jacques Street, Montreal, Quebec H3C 4M8
(Address of Principal Executive Office)
Indicate by check mark whether the registrant files or will file annual reports under cover of Form 20-F or Form 40-F
Form 20-F o Form 40-F ý
Indicate by check mark if the registrant is submitting the Form 6-K in paper as permitted by Regulation S-T Rule 101(b)(1):
Note: Regulation S-T Rule 101(b)(1) only permits the submission in paper of a Form 6-K if submitted solely to provide an attached annual report to security holders.
Indicate by check mark if the registrant is submitting the Fork 6-K in paper as permitted by Regulation S-T Rule 101(b)(7):
Note: Regulation S-T Rule 101(b)(7) only permits the submission in paper of a Form 6-K if submitted to furnish a report or other document that the registrant foreign private issuer must furnish and make public under the laws of the jurisdiction in which the registrant is incorporated, domiciled or legally organized (the registrant's "home country"), or under the rules of the home country exchange on which the registrant's securities are traded, as long as the report or other document is not a press release, is not required to be and has not been distributed to the registrant's security holders, and, if discussing a material event, has already been the subject of a Form 6-K submission or other filing on EDGAR.
Indicate by check mark whether the registrant by furnishing the information contained in this form is also thereby furnishing the information to the Commission pursuant to Rule 12g3-2(b) under the Securities Exchange Act of 1934.
Yes o No ý
If "Yes" is marked, indicate below the file number assigned to the registrant in connection with Rule 12g3-2(b): 82- .
QUEBECOR WORLD INC.
Filed in this Form 6-K
Documents index
- Press Release dated May 10, 2005; Financial Highlights
- Management's Discussion and Analysis of Financial Condition and Results of Operations
- Consolidated Financial Statements
- Certifications of Interim Filings
![]()
May 10, 2005 05/05
For immediate release Page 1 of 5
QUEBECOR WORLD ANNOUNCES 2005 FIRST QUARTER RESULTS
Montréal, Canada - Quebecor World Inc. (NYSE:IQW, TSX:IQW.SV) announced that for the first quarter 2005 the Company recorded net income of $16.3 million or $0.05 per diluted share, after the impairment of assets restructuring and other charges. This compares to net income of $35.8 million or $0.20 per share in the first quarter of 2004. Before impairment of assets, restructuring and other charges, net income in the first quarter was $46.6 million or $0.28 per share compared to $38.9 million or $0.23 per share in the first quarter last year. Operating income, before impairment of assets, restructuring and other charges was $89.4 million in the first quarter, compared to $98.0 million in the same period last year. Operating margin on the same basis was 5.5% compared to 6.3% in the first quarter of 2004.
Consolidated revenues for the quarter were $1.62 billion compared to $1.55 billion in the same quarter last year. Excluding the favourable impact of currency translation and paper sales revenues were essentially flat with the first quarter of 2004.
"Our cost containment and cost reduction efforts have helped offset the negative impact of lower prices. We are continuing with those efforts in addition to securing additional volume," said Pierre Karl Peladeau, President and CEO, Quebecor World Inc. "In the first quarter several of our business groups delivered results ahead of last year but our overall performance was hampered by our commercial group in the U.S. We have determined this business to be non-core and are currently pursuing exclusive negotiations to sell this business and similar facilities in Canada. Our first quarter results were also negatively impacted by our French operations and the loss of a major customer in our UK facility that necessitated additional restructuring efforts."
In the quarter Quebecor World recorded impairment of assets, restructuring and other charges of $33 million. The non-cash portion of this charge of $25 million is related to the impairment of assets in the UK, Europe and North America. The cash portion of this charge is related to work-force reduction initiatives in the UK, Canada and to other costs associated with previous restructuring initiatives in 2004. The first quarter 2005 restructuring initiatives, including the closing of a Canadian facility, affected 284 employee positions and will result in the creation of 66 new jobs in other facilities.
1
For immediate release Page 2 of 5
Quebecor World continues to maintain a strict discipline over costs. SG&A in the quarter was $111 million, a $5 million decrease compared to the same period last year. The decrease is related to savings from cost containment and work-force reductions. In the first quarter the Company recorded specific charges of $3 million mainly related to lease provisions. This compares to a net gain of $2.3 million in the first quarter of 2004 due to a favourable legal settlement. Free cash outflow in the quarter improved by $10 million compared to the first quarter in 2004.
North America
In North America revenues for the quarter increased 3% to $1.2 billion but were down 1% excluding the favourable impact of currency translation and paper sales. Operating income was $81 million in the first quarter, before impairment of assets, restructuring and other charges, compared to $87 million in the first quarter of 2004. On the same basis, operating margin in the quarter was 6.6% compared to 7.3%. The decreases in operating income and margin are due to lower prices in several business groups. While some groups experienced volume increases it was not enough to mitigate price erosion.
Europe
In Europe, revenues increased 5% in the first quarter to $332 million compared to $315 million in the first quarter last year. Excluding the favourable impact of currency translation revenue were flat compared to the first quarter of 2004. Price erosion continued throughout our European operations and was only partially offset by a 2% increase in volume. Operating income in Europe for the quarter, before the impairment of assets, restructuring and other charges, was $6.3 million compared to $11.9 in the first quarter last year. This is largely due to lower results in Corby and the Company's French operations that were negative compared to last year partially due to unscheduled labour disruptions. During the quarter the Company completed the divestiture of two under-performing facilities in France. While these transactions did not affect the first quarter they are expected to have a positive impact on future results.
Latin America
In Latin America revenue, operating income and margins increased in the quarter compared to the same period last year. Revenue increased 21% to $57 million compared to $47 million in the first quarter of 2004. Despite continued price erosion operating income and margins increased in the quarter due to higher volume and the positive impact of previous cost reduction initiatives. The Company has recently launched an initiative to position its Latin American platform as a low cost alternative to publishers who are outsourcing work to Asia. A large part of the volume increase in Latin America was in the book and directory at facilities in Brazil, Mexico and Argentina.
2
For immediate release Page 3 of 5
Outlook
Quebecor World expects results in the second quarter of 2005 will continue to be affected by pricing pressures, the negative impact of the loss of a major customer in the U.S., one in the UK and , the under-performing U.S. Commercial segment. While the Company does not issue specific guidance it believes these factors will result in lower operating income before impairment of assets, restructuring and other charges in the second quarter of 2005 compared to the first quarter of 2005.
Dividend
The Board of Directors declared a dividend of $0.14 per share on Multiple Voting Shares and Subordinate Voting Shares. The Board also declared a dividend of CDN$0.3845 per share on Series 3 Preferred Shares, CDN$0.421875 per share on Series 4 Preferred Shares and CDN$0.43125 on Series 5 Preferred Shares. The dividends are payable on June 1st, 2005 to shareholders of record at the close of business May 24th, 2005.
Management Discussion and Analysis
Please refer to the MD&A for the reconciliation to Canadian generally accepted accounting principles of certain figures used to explain these results. The MD&A can be found on the Company's website atwww.quebecorworld.com and through the SEDAR and SEC filings.
Financial statements are available on the Company's website and through the SEDAR and SEC filings.
Sedar web address:www.sedar.com
SEC web address:www.sec.gov
Quebecor World To Webcast Investor Conference Call on May 10, 2005
Quebecor World Inc. will broadcast its First Quarter results conference call live over the Internet on May 10, 2005 at 4:00 PM (Eastern Time).
The conference call, which will last approximately one hour, will be webcast live and can be accessed on the Quebecor World web site:
http://www.quebecorworld.com/en/investors/webcasts/Q105
3
For immediate release Page 4 of 5
Prior to the call please ensure that you have the appropriate software. The Quebecor World web address listed above has instructions and a direct link to download the necessary software, free of charge.
Anyone unable to attend this conference call may listen to the replay tape by phoning (416) 695-5275 or (888) 509-0082, available from May 10th, 2005 to May 17th, 2005.
Except for historical information contained herein, the statements in this release are forward-looking and made pursuant to the safe harbor provisions of the Private Securities Litigation Reform Act of 1995. Forward-looking statements involve known and unknown risks and uncertainties that may cause the Company's actual results in future periods to differ materially from forecasted results. Those risks include, among others, changes in customers' demand for the Company's products, changes in raw material and equipment costs and availability, seasonal changes in customer orders, pricing actions by the Company's competitors, and general changes in economic conditions.
Quebecor World Inc. (NYSE:IQW; TSX:IQW.SV) is one of the largest commercial printers in the world. It is a market leader in most of its major product categories which include Magazines, inserts and circulars, books, catalogs, specialty printing and direct mail, directories, digital pre-media, logistics, mail list technologies and other value added services. The Company has approximately 35,000 employees working in more than 160 printing and related facilities in the United States, Canada, Brazil, France, the United Kingdom, Belgium, Spain, Austria, Sweden, Switzerland, Finland, Chile, Argentina, Peru, Colombia, Mexico and India.
Web address:www.quebecorworld.com
- 30 -
For further Information contact:
Tony Ross | Philippe Cloutier |
|
4
QUEBECOR WORLD INC.
FINANCIAL HIGHLIGHTS
Periods ended March 31
(In millions of US dollars, except per share data)
(Unaudited)
| | Three months | |||||||
|---|---|---|---|---|---|---|---|---|
| | 2005 | 2004 | ||||||
| Consolidated Results | ||||||||
| Revenues | $ | 1,621.2 | $ | 1,553.0 | ||||
| Operating income before depreciation and amortization and before IAROC | 177.9 | 187.2 | ||||||
| Operating income before IAROC | 89.4 | 98.0 | ||||||
| IAROC | 33.3 | 4.3 | ||||||
| Operating income | 56.1 | 93.7 | ||||||
| Net income | 16.3 | 35.8 | ||||||
| Cash used in operating activities | (16.5 | ) | (46.8 | ) | ||||
| Free cash flow (outflow) from operations* | (79.9 | ) | (89.5 | ) | ||||
| Operating margin before depreciation and amortization and before IAROC** | 11.0 | % | 12.1 | % | ||||
| Operating margin before IAROC** | 5.5 | % | 6.3 | % | ||||
| Operating margin** | 3.5 | % | 6.0 | % | ||||
| Segmented Information | ||||||||
| Revenues | ||||||||
| North America | $ | 1,232.7 | $ | 1,192.4 | ||||
| Europe | 331.6 | 315.4 | ||||||
| Latin America | 56.6 | 46.8 | ||||||
Operating income before IAROC | ||||||||
| North America | $ | 81.0 | $ | 87.0 | ||||
| Europe | 6.3 | 11.9 | ||||||
| Latin America | 3.0 | 0.2 | ||||||
Operating margins before IAROC** | ||||||||
| North America | 6.6 | % | 7.3 | % | ||||
| Europe | 1.9 | % | 3.8 | % | ||||
| Latin America | 5.3 | % | 0.4 | % | ||||
Financial Position | ||||||||
| Working capital | $ | 129.5 | $ | 33.4 | ||||
| Total assets | $ | 6,153.4 | $ | 6,275.9 | ||||
| Long-term debt (including convertible notes) | $ | 1,965.6 | $ | 2,120.7 | ||||
| Shareholders' equity | $ | 2,588.6 | $ | 2,510.1 | ||||
| Debt-to-capitalization | 43:57 | 46:54 | ||||||
Per Share Data | ||||||||
| Earnings | ||||||||
| Diluted | $ | 0.05 | $ | 0.20 | ||||
| Diluted before IAROC | $ | 0.28 | $ | 0.23 | ||||
| Dividends on equity shares | $ | 0.14 | $ | 0.13 | ||||
| Book value | $ | 16.02 | $ | 15.54 | ||||
IAROC: Impairment of assets, restructuring and other charges.
- *
- Cash provided by operating activities, less capital expenditures net of proceeds from disposals, and preferred share dividends.
- **
- Margins calculated on revenues.
5
MANAGEMENT'S DISCUSSION AND ANALYSIS OF
FINANCIAL CONDITION AND RESULTS OF OPERATIONS
The following is a discussion of the consolidated financial condition and results of operations of Quebecor World Inc. for the three-month periods ended March 31, 2005 and 2004, and should be read together with the Company's interim consolidated financial statements and the annual "Management's Discussion and Analysis" included in the 2004 Annual Report. The interim consolidated financial statements and Management's Discussion and Analysis have been reviewed by the Company's Audit Committee and approved by its Board of Directors. This discussion contains forward-looking information that is qualified by reference to, and should be read together with, the discussion regarding forward-looking statements that is part of this document. Management determines whether or not information is "material" based on whether it believes a reasonable investor's decision to buy, sell or hold securities in the Company would likely be influenced or changed if the information were omitted or misstated.
Financial data has been prepared in conformity with Canadian Generally Accepted Accounting Principles ("GAAP"). However, certain measures used in this discussion and analysis do not have any standardized meaning under Canadian GAAP. When used, these measures are defined in such terms as to allow the reconciliation to the closest GAAP measure. Numerical reconciliations are provided in figure 6. It is unlikely that these measures could be compared to similar measures presented by other companies.
The Company's functional currency is the Canadian dollar and its reporting currency is the U.S. dollar.
FORWARD-LOOKING STATEMENTS
Except for historical information contained herein, the statements in this document are forward-looking and made pursuant to the safe harbor provisions of the Private Securities Litigation Reform Act of 1995. Forward-looking statements involve known and unknown risks and uncertainties, which may cause actual results in future periods to differ materially from forecasted results. Those risks include, among others, changes in customer demand for products, changes in raw material and equipment costs and availability, seasonal changes in customer orders, pricing actions by competitors and general changes in economic conditions.
OVERVIEW
Quebecor World Inc. is one of the largest commercial print media services companies in the world. Quebecor World is the market leader in most of its product categories and geographies. This market-leading position has been built through a combination of integrating acquisitions, investing in key strategic technologies and a commitment to building long-term partnerships with the world's leading print media customers.
Quebecor World has facilities in the United States, Canada, France, the United Kingdom, Spain, Switzerland, Sweden, Finland, Austria, Belgium, Brazil, Chile, Argentina, Peru, Colombia, Mexico and India.
The Company offers its customers a broad range of printed products and related communication services, such as magazines, retail inserts, catalogs, specialty printing and direct mail, books, directories, pre-media, logistics and other value-added services.
The Company operates in the commercial print media segment of the printing industry and its business groups are located in three geographical regions: North America, which historically represents approximately 80% of the Company's revenues, Europe and Latin America.
Operations in this segment of the print industry are seasonal with a majority of volume being realized in the second half of the fiscal year, primarily due to the higher number of magazine pages, new product launches and back-to-school, retail and holiday catalog promotions. The interim results of operations analyzed hereafter are not necessarily indicative of full year results.
The primary drivers affecting the Company are consumer confidence and economic growth rates. These key drivers of demand for commercial print media affect the level of advertising and merchandising activity. The Company uses magazine advertising pages as a key indicator of demand for printing products and services. This indicator, as measured in the United States by the Publishers Information Bureau, showed some positive signs throughout 2004, but was volatile in the first quarter of 2005.
U.S. Magazine Advertising Pages 2001-2005 (Monthly)
Percentage Year-Over-Year Change
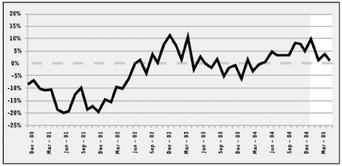
Source: Publishers Information Bureau (PIB)
Figure 1
In the first quarter of 2005, volume increased in several of the Company's business groups, a trend similar to the year-over-year increase in the U.S. magazine advertising pages indicator (figure 1). However, continued pricing pressures across the platform adversely affected revenues in the quarter, significantly offsetting volume increases. Price erosion is particularly felt when long-term contracts are renewed or when new customers replace previous ones at lower pricing levels.
In the current challenging environment, the positive effects of the 2004 restructuring initiatives were not evident in operating income because of the continuing price reductions. The Company's strategy is to reduce its fixed cost base and increase its efficiency by consolidating smaller facilities into larger groups of operations, grouping similar types of assets into larger facilities using available space and optimizing all aspects of pressroom efficiencies. In addition, the Company divested itself of certain smaller operations in France and North America.
The current charge for impairment of assets, restructuring and other charges reflects both smaller initiatives undertaken in the quarter and definite plans to eliminate inefficient and idle equipment. As such, a detailed review of activities took place at the facility in Corby, England. This resulted in the implementation of the first part of a workforce reduction plan and an impairment of long-lived assets. The Company anticipates additional restructuring charges in the upcoming quarters related to the restructuring of this facility, as discussed in the "Impairment of Assets and Restructuring Initiatives" section.
Furthermore, management expects to incur additional restructuring charges in the upcoming quarters of 2005 as plans that have been announced are being executed, including the closing of a facility in Quebec, Canada.
6
REVIEW OF FIRST QUARTER
The Company's consolidated revenues for the quarter were $1,621 million, a 4% increase when compared to $1,553 million for the same period in 2004. Excluding the favorable impact of currency translation (see figure 3) and higher sales of paper to our customers, revenues were essentially flat compared to the same period last year. The increase in volume in the Retail and Canadian Groups in North America as well as in France and Latin America was offset by price erosion. Revenue by product is shown in figure 2.
Revenue by Product — Worldwide ($ millions)
Three months ended March 31
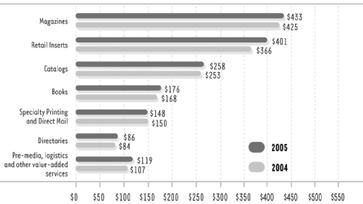
Figure 2
The Company assesses performance based on operating income before impairment of assets, restructuring and other charges. The following operating analyses are before impairment of assets, restructuring and other charges.
For the first quarter of 2005, operating income decreased 9% to $89 million, from $98 million in 2004. Operating margin for the quarter decreased to 5.5% from 6.3% in 2004.
In the first quarter of 2005, operating income was affected by recording specific charges of $3 million mainly for provisions for leases in North America. In 2004, the Company recorded specific items resulting in a $2 million gain for the quarter. These items included a favorable legal claim settlement and other specific items.
Impact of Foreign Currency ($ millions)
| | Three-month period ended March 31, 2005 | ||
|---|---|---|---|
| Foreign currency favorable impact on revenues | $ | 34.4 | |
| Foreign currency favorable impact on operating income | 0.9 | ||
Figure 3
Cost of sales for the quarter increased 6% at $1,334 million compared to $1,253 million last year. Gross profit margin was 17.7% in the first quarter of 2005, down from 19.3% in 2004. The cost of sales for the quarter included specific charges of $3 million mainly due to lease provisions. In the same period for 2004, the cost of sales included a favorable legal claim settlement and other specific items for a net gain of $5 million. Excluding these specific items as well as the unfavorable impact of currency translation, gross profit margin for the quarter was 18.0%, down from 19.0% last year. The decrease compared to 2004 is explained by continued pressure on prices. The effect of the price reductions was partly offset by a $8 million decrease in labor costs compared to the same period in 2004, despite a slight increase in sales volume. This reflects the effect of the ongoing restructuring initiatives undertaken by the Company and described in the "Impairment of assets and restructuring initiatives" section hereafter.
Selling, general and administrative expenses for the quarter were $111 million compared to $116 million in 2004, a decrease of $5 million. This decrease remained unchanged even though there was an impact of currency translation offset by specific charges incurred in 2004. The decrease was mainly explained by savings from cost-containment initiatives and headcount reductions.
Depreciation and amortization were $83 million in the first quarter of 2005 and flat compared to 2004. Excluding the impact of currency movement, depreciation and amortization decreased by 3% compared to last year.
Securitization fees totalled $5 million for the first quarter of 2005 ($3 million for the same period in 2004). The increase was mainly due to higher market interest rates underlying the program fees. Servicing expenses did not have a material impact on the Company's results.
During the first quarter of 2005, the Company undertook additional restructuring initiatives and recorded a net impairment of assets and restructuring and other charges of $33 million ($4 million for the same period in 2004) which included the first part of the downsizing of the Corby (England) facility, the closure of two facilities in North America (one of which was announced at December 31, 2004) and reduction in force across the network. These measures and the impairment charge are detailed in the "Impairment of Assets and Restructuring initiatives" section hereafter.
Financial expenses were $29 million in the first quarter of 2005, compared to $38 million in 2004. The lower expenses were mainly due to a lower average volume of debt, a $2 million non-recurring charge on extinguishment of long-term debt in 2004 and foreign exchange gains compared to losses in the previous year.
In the first quarter of 2005, income taxes were $11 million compared to $19 million for the first quarter of 2004, or an effective tax rate of 40.2% compared to 33.4% in 2004. The rate is significantly higher in 2005 mainly due to valuation allowances recorded on tax assets related to the impairment of long-lived assets. Before impairment of assets, restructuring and other charges, income taxes were $14 million, or an effective tax rate of 22.9% compared to 33.0% for the first quarter of 2004. The decrease in income tax rate was mainly due to a decrease in profits before taxes in jurisdictions with higher tax rates.
Net income for the quarter was $16 million compared to $36 million in 2004, and the Company reported diluted earnings per share of $0.05 compared to $0.20 in 2004. These results incorporated impairment of assets, restructuring and other charges of $33 million ($30 million net of taxes) or $0.23 per share compared with $4 million ($3 million net of taxes) or $0.03 per share in 2004. Excluding the effect of impairment of assets, restructuring and other charges, the first quarter of 2005 resulted in diluted earnings per share of $0.28 compared with $0.23 in the same period of 2004. The net impact of the specific charges was $0.02 when comparing the first quarters of both years.
SEGMENT REVIEW
The following review of operating activities by business group (figure 4) is before impairment of assets, restructuring and other charges.
North America
North American revenues for the first quarter of 2005 were $1,233 million, up 3% from $1,192 million in 2004. Excluding the effect of currency translation and the favorable impact of paper sales, revenues decreased by 1% in the first quarter mainly due to pricing. Selling, general and administrative expenses decreased across the North American platform in the first quarter of 2005 compared to 2004 due to savings from facility closures, cost-containment initiatives and corporate headcount reductions, mostly in 2004. Year-over-year headcount was reduced in North America by 2,453 employees, or approximately 9%.
7
Revenue by Business Group ($ millions)
Three-month periods ended March 31
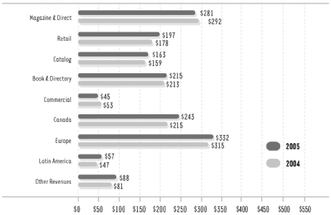
Figure 4
The following is a review of the North American activities by business group. The North American segment is made up of the following business groups: Magazine & Direct, Retail, Catalog, Book & Directory, Commercial, Canada and Other Revenues.
Magazine & Direct
Magazine & Direct revenues for the first quarter of 2005 were $281 million, down 4% from $292 million in 2004. The decrease in revenue was due to volume shortfalls of 6% in Magazine and 7% in Direct and the continued price erosion in the Direct group. Operating income and margin decreased in the first quarter due mainly to the volume decreases and price erosion offset by a decrease in labor costs from the reduction in headcount.
Retail
Retail revenues for the first quarter of 2005 were $197 million, up 11% from $178 million in 2004. Excluding the favorable impact of paper sales, revenues increased 3% compared to 2004. The increase in revenues was driven by a 9% increase in volume, partly offset by the negative impact of lower priced work. Competition was fierce but the group reported significant volume increases with customers such as Big 5 Sporting Goods, Circuit City, CVS, The Sports Authority and Walgreens. Operating income increased in the first quarter due mainly to savings from restructuring initiatives and operational efficiency gains.
Catalog
Catalog revenues for the first quarter of 2005 were $163 million, up 2% from $159 million in 2004. Excluding the favorable impact of paper sales, revenues slightly decreased compared to 2004. The decrease in revenues was due to price erosion while volume remained flat as compared to last year. Operating income and margin decreased in the first quarter due mainly to the negative impact of lower pricing which was partly offset by cost containment initiatives and headcount reduction.
Book & Directory
Book & Directory revenues for the first quarter of 2005 were $215 million, up 1% from $213 million in 2004. The increase was mainly due to increased paper sales, partly offset by a decrease in price in the Directory group and a decrease in volume in Book. Operating income and margin remained flat in the first quarter of 2005 compared to 2004.
Commercial
Commercial revenues for the first quarter of 2005 were $45 million, down 15% from $53 million in 2004. The decrease in revenues was due to a decrease in volume and price erosion in specific markets. Pricing pressure continued to significantly push the average price down as compared to the first quarter of last year. Operating income and margin decreased in the first quarter compared to 2004 due mainly to the decrease in volume and the price erosion.
Management is presently considering the possibility of selling the Company's Commercial facilities in the United States as well as similar facilities in Canada in the upcoming months. After exploring several options, the Company is currently pursuing exclusive negotiations with a potential buyer.
Segmented Results of Operations($ millions)
Selected Performance Indicators
| | North America | Europe | Latin America | Inter-Segment and Others | Total | ||||||||||||||||||||||||||
|---|---|---|---|---|---|---|---|---|---|---|---|---|---|---|---|---|---|---|---|---|---|---|---|---|---|---|---|---|---|---|---|
| | 2005 | 2004 | 2005 | 2004 | 2005 | 2004 | 2005 | 2004 | 2005 | 2004 | |||||||||||||||||||||
| Three months ended March 31, | |||||||||||||||||||||||||||||||
| Revenues | $ | 1,232.7 | $ | 1,192.4 | $ | 331.6 | $ | 315.4 | $ | 56.6 | $ | 46.8 | $ | 0.3 | $ | (1.6 | ) | $ | 1,621.2 | $ | 1,553.0 | ||||||||||
| Operating income (loss) before depreciation and amortization and before IAROC | 150.4 | 156.0 | 22.5 | 29.1 | 5.6 | 2.9 | (0.6 | ) | (0.8 | ) | 177.9 | 187.2 | |||||||||||||||||||
| Operating income (loss) before IAROC | 81.0 | 87.0 | 6.3 | 11.9 | 3.0 | 0.2 | (0.9 | ) | (1.1 | ) | 89.4 | 98.0 | |||||||||||||||||||
| IAROC | 8.1 | 3.3 | 25.1 | 0.6 | 0.1 | 0.2 | — | 0.2 | 33.3 | 4.3 | |||||||||||||||||||||
| Operating income (loss) | 72.9 | 83.7 | (18.8 | ) | 11.3 | 2.9 | — | (0.9 | ) | (1.3 | ) | 56.1 | 93.7 | ||||||||||||||||||
| Operating margin before depreciation and amortization and before IAROC | 12.2 | % | 13.1 | % | 6.8 | % | 9.2 | % | 9.9 | % | 6.2 | % | 11.0 | % | 12.1 | % | |||||||||||||||
| Operating margin before IAROC | 6.6 | % | 7.3 | % | 1.9 | % | 3.8 | % | 5.3 | % | 0.4 | % | 5.5 | % | 6.3 | % | |||||||||||||||
| Operating margin | 5.9 | % | 7.0 | % | (5.7 | )% | 3.6 | % | 5.2 | % | — | % | 3.5 | % | 6.0 | % | |||||||||||||||
Capital expenditures | $ | 46.4 | $ | 26.1 | $ | 8.0 | $ | 3.5 | $ | 0.3 | $ | 2.4 | $ | — | $ | — | $ | 54.7 | $ | 32.0 | |||||||||||
Changes in non-cash balances related to operations, cash flow (outflow) | (86.3 | ) | (173.4 | ) | (44.0 | ) | (29.1 | ) | (6.2 | ) | (1.4 | ) | (11.9 | ) | 17.0 | (148.4 | ) | (186.9 | ) | ||||||||||||
IAROC: Impairment of assets, restructuring and other charges.
Figure 5
8
Reconciliation of non-GAAP measures
($ millions)
| | Three-month periods ended March 31, | ||||||||
|---|---|---|---|---|---|---|---|---|---|
| | 2005 | 2004 | |||||||
| Operating Income | |||||||||
| Operating income | $ | 56.1 | $ | 93.7 | |||||
| IAROC | 33.3 | 4.3 | |||||||
| Operating income before IAROC | $ | 89.4 | $ | 98.0 | |||||
| Operating income | $ | 56.1 | $ | 93.7 | |||||
| Depreciation of property, plant and equipment | 82.4 | 82.9 | |||||||
| Amortization of deferred charges | 6.1 | 6.3 | |||||||
| Operating income before depreciation and amortization | $ | 144.6 | $ | 182.9 | |||||
| IAROC | 33.3 | 4.3 | |||||||
| Operating income before depreciation and amortization and before IAROC | $ | 177.9 | $ | 187.2 | |||||
Earnings per share | |||||||||
| Net income | $ | 16.3 | $ | 35.8 | |||||
| IAROC (net of income taxes for the first quarter of 2005 and 2004 of $3.0 million and $1.2 million respectively) | 30.3 | 3.1 | |||||||
| Net income before IAROC | $ | 46.6 | $ | 38.9 | |||||
Net income available to holders of preferred shares | 9.9 | 9.1 | |||||||
| Net income available to holders of equity shares before IAROC | 36.7 | 29.8 | |||||||
Diluted average number of equity shares outstanding (in millions) | 132.9 | 132.2 | |||||||
Earnings per share | |||||||||
| Diluted | $ | 0.05 | $ | 0.20 | |||||
| Diluted before IAROC | $ | 0.28 | $ | 0.23 | |||||
Free Cash Flow | |||||||||
| Cash used in operating activities | $ | (16.5 | ) | $ | (46.8 | ) | |||
| Dividends on preferred shares | (12.4 | ) | (11.7 | ) | |||||
| Additions to property, plant and equipment | (54.7 | ) | (32.0 | ) | |||||
| Net proceeds from disposal of assets | 3.7 | 1.0 | |||||||
| Free cash flow (outflow) from operations | $ | (79.9 | ) | $ | (89.5 | ) | |||
Debt-to-capitalization | |||||||||
| Bank indebtedness | $ | 0.5 | $ | 1.0 | |||||
| Current portion of long-term debt and convertible notes | 10.3 | 21.0 | |||||||
| Long-term debt | 1,842.1 | 1,988.5 | |||||||
| Convertible notes | 113.2 | 111.2 | |||||||
| Total debt | $ | 1,966.1 | $ | 2,121.7 | |||||
Minority interest | 1.1 | 25.2 | |||||||
| Shareholders' equity | 2,588.6 | 2,510.1 | |||||||
| Capitalization | $ | 4,555.8 | $ | 4,657.0 | |||||
| Debt-to-capitalization | 43:57 | 46:54 | |||||||
Book value per share | |||||||||
| Shareholders' equity | $ | 2,588.6 | $ | 2,510.1 | |||||
| Preferred shares | (456.6 | ) | (456.6 | ) | |||||
| $ | 2,132.0 | $ | 2,053.5 | ||||||
Ending number of equity shares (in millions) | 133.1 | 132.1 | |||||||
| Book value per share | $ | 16.02 | $ | 15.54 | |||||
IAROC: Impairment of assets, restructuring and other charges.
Figure 6
9
Canada
The Canadian business group operates mainly in the Retail, Magazine, Catalog, Directory, Book and Specialty Printing markets. Canadian revenues for the first quarter of 2005 were $243 million, up 13% from $215 million in 2004. Excluding the favorable impact of currency translation, revenues increased by 5% as compared to 2004. Overall volume increased 3% in the first quarter of 2005 compared to 2004, mainly due to volume growth in the Directory and Retail markets. Despite a volume increase, market conditions remained extremely competitive as reflected in the pricing. Operating income and margin improved compared to last year as a result of the increased volume, savings from cost control initiatives and operational efficiency gains.
In April 2005 the Company announced a plan to reorganize a portion of its East Group printing operations to better position itself to compete in a challenging market environment. The plan includes the consolidation of prepress and sales operations at its Laval facility with other plants in Quebec and the cessation of printing operations in Laval. Approximately 50 employees will be offered transfers and approximately 150 positions will be eliminated as a result of this reorganization.
Other Revenues
Other sources of revenues in North America include Quebecor World Premedia and Logistics.
The Quebecor World Premedia revenues for the first quarter of 2005 were $15 million, down 14% from $17 million in 2004. Although volume increased in 2005, changes in the type of prepress work and the continued price erosion caused a negative effect on revenue in the first quarter of 2005. The economic environment led customers to continue looking for ways to reduce their costs by putting pressure on reducing prices, re-using previously captured images and taking more of the prepress production in-house. Operating income and margin for the first quarter of 2005 decreased compared to last year due mainly to the loss of the higher margin services.
Logistics revenues for the first quarter of 2005 were $75 million, up 6% from $71 million in 2004. The revenue increase was due mainly to higher retail commodity shipments. However, margins decreased slightly due to more truck shipments for time-sensitive products. Higher margin airfreight in the United States continued to grow slowly with pricing pressure from fuel surcharge and security fees. Operating income and margin for the first quarter of 2005 decreased compared to last year due mainly to the continuing rise in fuel charges and a shift in the sales mix to increased retail freight with lower margins.
Europe
The European business group operates mainly in the Magazine, Retail, Catalog and Book markets. European revenues for the first quarter of 2005 were $332 million, up 5% from $315 million in 2004. Excluding the positive impact of currency translation, revenues were essentially flat compared to last year. Overall volume increased by 2% in most European countries, but particularly in the magazine market in France. However, price erosion continued to have a negative impact on the European results. The operating income and margin for the European segment decreased in the first quarter compared to 2004. France's operating margin was negative compared to last year. However, in the first quarter of 2005, the Company completed divestitures of two under-performing facilities in France. The completion of these transactions did not have a significant impact on the results for this quarter; however, management anticipates they will have a positive impact on future results in Europe. Outside France, operating income and margin decreased compared to 2004. This is mostly attributable to the Corby (England) facility. In 2004, the Company was informed that an important printing contract at this facility would not be renewed. Volumes related to this contract have begun to decrease in the first quarter of 2005. The facility has been able to replace some of the lost volume, but at a lower margin.
Selling, general and administrative expenses decreased in the first quarter of 2005 compared to 2004 as a result of savings from cost containment initiatives and headcount reductions. Year-over-year headcount decreased by 350 employees or approximately 6%.
Latin America
Latin America operates mainly in the Book, Directory, Magazine, and Retail markets. Latin America's revenues for the first quarter of 2005 were $57 million, up 21% from $47 million in 2004. The increase was mainly due to the positive impact of currency translation along with an increase in paper sales and the volume increase of cross selling with the North American group. During the third quarter of 2004, the Company had embarked on an initiative to more closely link the Latin American Book and Directory facilities with its North American counterparts to expand the capacity and capabilities to its overall customer base. This initiative has continued through the first quarter of 2005. Prices were lower in the first quarter of 2005 compared to last year due to the continued competitive market conditions. Operating income and margin have increased in the first quarter of 2005 compared to last year due mainly to the increased volume and the efficiency cost saving initiatives. Overall volume increased by 14% for the quarter compared to last year, mainly in the Book and the Directory markets in Recife, Brazil and Mexico, as well as in the Book market in Argentina.
Selling, general and administrative expenses for the first quarter 2005 decreased from last year due mainly to savings from cost containment initiatives and headcount reductions. Year-over-year headcount was reduced by 320 employees, or approximately 14%.
CRITICAL ACCOUNTING ESTIMATES
The Company's critical accounting estimates are discussed in the Company's annual "Management's Discussion and Analysis" included in the 2004 Annual Report. The preparation of financial statements in conformity with Canadian GAAP requires management to make estimates and assumptions that affect the reported amounts of assets and liabilities and disclosure of contingent assets and liabilities at the date of the financial statements and the reported amounts of revenues and expenses during the reporting period. Management has not made any significant changes to the estimates and assumptions on the quarter ended March 31, 2005. Actual results could differ from those estimates.
FINANCIAL CONDITION, LIQUIDITY AND CAPITAL RESOURCES
The Company measures its liquidity performance using the calculation of free cash flow as described in figure 6. Free cash flow reflects liquidity available for business acquisitions, equity dividends and repayments of long-term debt. Free cash flow for the first quarter of 2005 amounted to an outflow of $80 million, compared to $90 million for the corresponding quarter of last year.
Operating Activities
Working capital was $130 million as at March 31, 2005, compared to a working capital of $33 million as at March 31, 2004. This increase in working capital of $97 million was partly due to a higher level of trade receivables attributable to a lower level of accounts receivable under securitization as shown in figure 7. The higher level of cash and cash equivalents also explained the increase in working capital, as the Company is required to maintain a minimum level of funds in its captive insurance subsidiary. The Company manages its trade payables in order to take advantage of prompt payment discounts. Also, the Company maximizes the use of its accounts receivable securitization program, since the cost of these programs is relatively low compared to that of the credit facility. The amount of trade receivables under securitization varies from month to month, based on the previous month's volume (March securitization is based on outstanding receivables at the end of February). Other significant items resulting in an increase in working capital are the usage of the restructuring reserve and the timing of other payments.
10
As at March 31, 2005, the debt level was at $1,966 million, a $156 million decrease compared to the end of March 2004. The debt-to-capitalization ratio was 43:57 compared to 46:54 in March 2004 (see figure 6). The same ratio was 43:57 as at December 31, 2004. Including accounts receivable securitization, total debt would be $2,569 million, $190 million lower than last year. The debt-to-capitalization ratio, including accounts receivable securitization, was 50:50 as at March 31, 2005, compared to 52:48 in March 2004 (see figure 7).
Total Debt and Accounts Receivable Securitization($ millions)
| | March 31, 2005 | March 31, 2004 | ||||
|---|---|---|---|---|---|---|
| Bank indebtedness | $ | 0.5 | $ | 1.0 | ||
| Current portion of long-term debt and convertible notes | 10.3 | 21.0 | ||||
| Long-term debt | 1,842.1 | 1,988.5 | ||||
| Convertible notes | 113.2 | 111.2 | ||||
| Total debt | $ | 1,966.1 | $ | 2,121.7 | ||
| Accounts receivable securitization | 603.2 | 637.1 | ||||
Total debt and accounts receivable securitization | $ | 2,569.3 | $ | 2,758.8 | ||
| Minority interest | 1.1 | 25.2 | ||||
| Shareholders' equity | 2,588.6 | 2,510.1 | ||||
Capitalization, including securitization | $ | 5,159.0 | $ | 5,294.1 | ||
Debt-to-capitalization, including securitization | 50:50 | 52:48 | ||||
These ratios are non-GAAP measures.
Figure 7
The Company is subject to certain financial covenants in some of its major financing agreements. The key financial ratios are the earnings before interest, tax and depreciation and amortization (EBITDA) coverage ratio and the debt-to-capitalization ratio. As at March 31, 2005, the Company is in compliance with all significant debt covenants.
The 7.20% Senior Notes for a principal amount of $250 million will mature in March 2006. The Company intends to repay the Senior Notes by using its long-term revolving bank facility and, as such, these Notes have not been included in the current portion of long-term debt.
The minimum legal requirement for pension contributions is $57 million in 2005 of which $2 million has been paid as of March 31, 2005 (total annual contributions in 2004 were $77 million).
As at March 31, 2005, the following investment grade ratings applied to the long-term unsecured debt of the Company:
| Rating Agency | Rating | |
|---|---|---|
| Moody's Investors Service | Baa3 | |
| Standard & Poor's | BBB- | |
| Dominion Bond Rating Service Limited | BBB (low) | |
The Company believes that its liquidity, capital resources and cash flow from operations are sufficient to fund planned capital expenditures, working capital requirements, interest and principal payments for the foreseeable future.
Investing Activities
For the first quarter of 2005, the Company invested $55 million in capital projects compared to $32 million in 2004. Of that amount, 90% (75% in 2004) was for organic growth, including expenditures for new capacity requirements and productivity improvement, and 10% (25% in 2004) was for the maintenance of the Company's structure.
Contractual Cash Obligations($ millions)
| | Remainder of 2005 | 2006 | 2007 | 2008 | 2009 | 2010 and thereafter | ||||||||||||
|---|---|---|---|---|---|---|---|---|---|---|---|---|---|---|---|---|---|---|
| Long-term debt and convertible notes | $ | — | $ | 250 | $ | 701 | $ | 202 | $ | — | $ | 772 | ||||||
| Capital lease | 8 | 8 | 4 | 3 | 8 | 10 | ||||||||||||
| Operating lease | 84 | 77 | 58 | 36 | 27 | 100 | ||||||||||||
| Capital asset purchase commitments | 109 | 66 | 4 | — | — | — | ||||||||||||
| Total contactual cash obligations | $ | 201 | $ | 401 | $ | 767 | $ | 241 | $ | 35 | $ | 882 | ||||||
Figure 8
Key expenditures for the quarter of 2005 included the upgrade of gravure presses at the Atglen (Pennsylvania) facility, installation of gravure pre-press equipment at Helio-Corbeil (France) and relocation of equipment from Interprint (Sweden) to Helprint (Finland). As part of the strategic plan announced in 2004, the Company placed 6 additional orders for new presses in the quarter ended March 31, 2005. The Company has now placed a total of 15 firm orders for new presses representing a total cost of approximately $200 million.
For the remainder of 2005, the Company projects capital expenditures of $245 million of which a portion is related to the strategic plan. Expected sources of funds to meet these expenditures are cash flows from operations and drawings under the Company's revolving bank facility.
Furthermore, in April 2005, the Company purchased assets of a web offset printing facility in Pittsburg, California for $8 million. This facility will complement and strengthen the Company's retail insert platform and add capacity for customers in the West coast market.
During the quarter, the Company acquired minority interests in its North American operations for a cash consideration of $6 million. The Company also sold investments in facilities in France for a total cash consideration of $0.3 million. The Company realized no gain or loss on these transactions.
IMPAIRMENT OF ASSETS AND RESTRUCTURING INITIATIVES
The Company recorded an impairment of assets, restructuring and other charges of $33.3 million for the first quarter of 2005. Cash items amounted to $8.3 million, of which $3.8 million were related to the implementation of new 2005 initiatives and non-cash items amounted to $25.0 million.
During the quarter ended March 31, 2005, management performed impairment tests on various groups of assets. Firstly, the Company modified its plan of action for the facility in Corby, England and engaged in restructuring activities. The Company had concluded at December 31, 2004 that no impairment was required. However, based on the revised plan of action, the Company re-evaluated the situation at Corby and recorded an impairment of assets. Furthermore, the announcement, in April 2005, of the closing of a facility in Canada and other events triggered an impairment test on other groups of assets. Accordingly, for the first quarter of 2005, the Company recorded an impairment of long-lived assets of $24.6 million. The impairment has been calculated as the excess of the carrying amount of the asset or group of assets over its fair value, based on quoted market prices when available, or using a discounted cash flow method.
11
In the first quarter of 2005, the Company continued its restructuring initiatives and approved the first phase of the downsizing of operations in Corby and other workforce reduction across the Company. The cash costs of these initiatives, estimated at $3.8 million, were recorded in the first quarter. The non-cash cost of these initiatives included $0.4 million for the curtailment of one of the Company's Canadian pension plans. The 2005 restructuring initiatives, including the announcement in April 2005 of the closure of a Canadian facility, affected 284 employees in total with 41 jobs that had been eliminated at March 31, 2005 and 243 still to come in 2005. However, the Company estimated that 66 new jobs would be created in other facilities.
During the first quarter of 2005, the Company has recorded $4.7 million resulting from the continuation of the 2004 initiatives and $2.2 million for the pension obligation related to Effingham (Illinois) multiemployer benefit plan. The Company has also recorded a net reversal of $2.4 million resulting from the execution of the prior years initiatives. In summary, 229 jobs were eliminated in the first quarter of 2005 as a result of the execution of prior years initiatives and 167 are still to come in 2005.
For the remaining quarters of 2005 and the year 2006, the Company estimates it will incur additional restructuring charges of $14.6 million for initiatives announced and approved prior to March 31, 2005. Furthermore, an additional estimated amount of $15.3 million will be incurred for initiatives approved subsequently to the first quarter of 2005.
As at January 1, 2005, the balance of the restructuring reserve was $35.2 million. This amount related mostly to workforce reduction across the platform and lease and facility carrying costs. The Company utilized $12.9 million of the current and prior years' restructuring and other charges reserves during the three-month period ended March 31, 2005 such that the balance of the reserve, including new initiatives in 2005, was $29.8 million at period-end.
FINANCIAL INSTRUMENTS
The Company uses a number of financial instruments. For a complete description of these instruments, please refer to the Company's annual "Management's Discussion and Analysis" included in the 2004 Annual Report. The following is an analysis of the Company's financial instruments as at March 31, 2005.
- •
- Interest rate swap agreements outstanding at quarter-end had a notional value of $233 million. The total adjustment recorded to interest expense was a revenue of $0.1 million for the quarter and nil for the same period in 2004.
- •
- The Company enters into foreign exchange forward contracts to hedge foreign denominated sales and related receivables, raw materials and equipment purchases. The contracts outstanding as at March 31, 2005 had a notional value of $231 million and expire between 2005 and 2007. The foreign exchange translation gains and losses and the deferred premiums and discounts are recognized as an adjustment to the corresponding revenues and exchange gain or losses when the transaction is recorded. The total amounts recorded to these accounts for the first three months of 2005 for these contracts were revenues of $6 million, and a loss of $1 million (revenues of $4 million, and a gain of less than $1 million for the same period of 2004).
- •
- In February 2005, the Company sold foreign exchange forward contracts that was used to hedge its net investment in a foreign subsidiary for a cash consideration of $69 million. These foreign exchange forward contracts were already recorded at the fair market value and all resulting gains were previously recorded in cumulative translation adjustment.
- •
- Foreign exchange forward contracts and cross currency swaps outstanding at quarter-end, used to hedge foreign denominated asset exposures, had a notional value of $252 and $102 respectively, and expire between 2005 and 2006. The total adjustment recorded to foreign exchange gain or loss related to these contracts was a gain of $20 million for the quarter (a gain of $10 million for 2004) which compensated the foreign exchange gains and losses on the translation of foreign denominated assets.
- •
- Natural gas swap contracts outstanding at quarter-end had a notional quantity of 322,000 gigajoules in Canada and 1,898,000 MMBTU in the U.S. and expire between April and December 2005. The total adjustment to gas cost for the quarter was a gain of $0.3 million ($0.4 million in 2004).
- •
- For the first quarter, the total amount deferred as a liability in relation to terminated derivative instruments or those that have ceased to be effective was $8 million ($14 million for the same period of 2004) and the total amount recognized in income was $1 million ($1 million for the same period of 2004).
The estimated fair value of derivative financial instruments is detailed in figure 9.
OFF-BALANCE SHEET ARRANGEMENTS
The Company is party to various off-balance sheet arrangements. For a complete description of these arrangements, please refer to the Company's annual "Management's Discussion and Analysis" included in the 2004 Annual Report.
As at March 31, 2005, the amounts outstanding under the US, Canadian, and European securitization programs were $388 million, Cdn$81 million and 115 million Euros, respectively ($413 million, Cdn$96 million, and 125 million Euros as at March 31, 2004). The Company had a retained interest in the trade receivables sold of $141 million, which is recorded in the Company's trade receivables. As at March 31, 2005, an aggregate amount of $603 million ($637 million as at March 31, 2004) of accounts receivable has been sold under the three programs. The Company is in compliance with all its covenants under the agreements governing its securitization programs.
Fair Value of Derivative Financial Instruments($ millions)
| | March 31, 2005 | December 31, 2004 | ||||||||||||
|---|---|---|---|---|---|---|---|---|---|---|---|---|---|---|
| | Book Value | Fair Value | Book Value | Fair Value | ||||||||||
| Derivative financial instruments | ||||||||||||||
| Interest rate swap agreements | $ | — | $ | (8.0 | ) | $ | — | $ | (5.1 | ) | ||||
| Foreign exchange forward contracts | 6.4 | 33.8 | 72.8 | 109.8 | ||||||||||
| Cross currency interest rate swaps | (1.6 | ) | (1.6 | ) | (16.7 | ) | (16.7 | ) | ||||||
| Commodity swaps | 0.4 | 2.8 | (0.1 | ) | (1.4 | ) | ||||||||
Figure 9
12
Selected Quarterly Financial Data
(in millions of dollars, except per share data)
| | 2005 | 2004 | 2003 | |||||||||||||||||||||||
|---|---|---|---|---|---|---|---|---|---|---|---|---|---|---|---|---|---|---|---|---|---|---|---|---|---|---|
| | Q1 | Q4 | Q3 | Q2 | Q1 | Q4 | Q3 | Q2 | ||||||||||||||||||
| Consolidated Results | ||||||||||||||||||||||||||
| Revenues | $ | 1,621.2 | $ | 1,894.7 | $ | 1,633.0 | $ | 1,541.4 | $ | 1,553.0 | $ | 1,741.6 | $ | 1,596.8 | $ | 1,513.5 | ||||||||||
| Operating income before depreciation and amortization and before IAROC | 177.9 | 256.2 | 202.2 | 199.3 | 187.2 | 179.1 | 205.0 | 129.5 | ||||||||||||||||||
| Operating income before IAROC | 89.4 | 162.8 | 114.6 | 108.0 | 98.0 | 86.4 | 116.5 | 38.7 | ||||||||||||||||||
| IAROC | 33.3 | 53.2 | 12.9 | 51.7 | 4.3 | 21.5 | (5.0 | ) | 81.8 | |||||||||||||||||
| Operating income (loss) | 56.1 | 109.6 | 101.7 | 56.3 | 93.7 | 64.9 | 121.5 | (43.1 | ) | |||||||||||||||||
| Net income (loss) | 16.3 | 44.5 | 48.1 | 15.3 | 35.8 | (53.9 | ) | 59.7 | (61.7 | ) | ||||||||||||||||
Per Share Data | ||||||||||||||||||||||||||
| Earnings (losses) | ||||||||||||||||||||||||||
| Diluted | $ | 0.05 | $ | 0.26 | $ | 0.29 | $ | 0.05 | $ | 0.20 | $ | (0.48 | ) | $ | 0.38 | $ | (0.51 | ) | ||||||||
| Diluted before IAROC | $ | 0.28 | $ | 0.60 | $ | 0.37 | $ | 0.31 | $ | 0.23 | $ | (0.36 | ) | $ | 0.34 | $ | (0.07 | ) | ||||||||
| Dividends on equity shares | $ | 0.14 | $ | 0.13 | $ | 0.13 | $ | 0.13 | $ | 0.13 | $ | 0.13 | $ | 0.13 | $ | 0.13 | ||||||||||
IAROC: Impairment of assets, restructuring and other charges.
Figure 10
QUARTERLY TRENDS:
Revenue
Due to the seasonality of the printing business (higher volumes in the third and fourth quarters), an analysis in consecutive quarters is not a true measurement of the revenue trend. The comparison of the same quarter for different years showed an increase in the revenue in each of the subsequent quarters.
In 2003, quarterly revenues were negatively affected by significant pricing pressures in a difficult economic environment. The volume was higher in most segments due to the Company's initiative to aggressively secure an increased market share but the continued pricing pressures and overcapacity in the printing industry negatively affected revenues in all business segments. Currency translation had a positive impact on each of the quarters in 2003. In the first quarter of 2004, there was an increase in volume but there was a continuing overcapacity in the printing industry and pricing pressures which negatively affected revenue. This trend continued through the remaining three quarters of 2004, while currency translation continued to have a positive impact on revenue in each of the quarters in 2004. Revenue increased in the first quarter of 2005 due mainly to increased volume in several of the Company's business groups along with a favorable impact on currency translation and a higher volume of paper sold to customers. However, continued pricing pressures across the platform adversely affected revenues in the first quarter of 2005, significantly offsetting volume increases.
Operating income before impairment of assets, restructuring and other charges
In 2003, a detailed review of the Company's operations was undertaken to further reduce the fixed cost base and improve efficiencies. This resulted in a series of restructuring initiatives throughout the year. There were also specific charges of $79 million during 2003 mainly for an adjustment related to the rapid growth and system issues for the North American Logistics business, a provision for doubtful accounts and a provision for leases. This was partially offset by the savings from the reduction in force and cost containment initiatives. The first quarter of 2004 showed improved results attributed to the positive impact of the cost reduction efforts initiated in 2003 and the reduction in force. This positive trend continued through the next three quarters of 2004 but was partly offset by increased fringe benefits (including healthcare and pension), $19 million of specific charges, increased freight costs due to higher fuel prices and new government hours of service regulations. Moreover, the third quarter of 2004 was negatively impacted by operational inefficiencies mainly at plants involved in the installation and transfer of equipment.
For the years 2004 and 2003, the comparison of the same quarter for different years showed continued increase in operating income before impairment of assets, restructuring and other charges with the exception of the third quarter of 2004 compared to 2003, which resulted in a slight decrease. Operating income before impairment of assets, restructuring and other charges decreased in the first quarter of 2005 compared to the same period in 2004 due mainly to the negative effect of price erosion partially offset by the savings from cost containment and headcount reduction.
Impairment of assets, restructuring and other charges
Impairment of assets, restructuring and other charges have been a major focus of the Company's cost reduction initiatives undertaken during the last two years that involved a reduction in force, closure or downsizing of facilities, decommissioning of under-performing assets, lowering of overhead expenses, consolidating corporate functions and relocating sales and administrative offices into plants. This determined focus on cost containment has reduced the Company's long-term cost structure and improved efficiency across the platform.
In the second quarter of 2003, four small facilities were closed, there was a write-down of under-performing assets resulting from the overcapacity in the printing industry and a decision not to re-deploy these assets. In the third quarter of 2003, there was a net reversal of $5 million in relation to the second quarter charges. In the fourth quarter of 2003, there was an additional $22 million charge for new impairment of assets, restructuring and other charges. In the first quarter of 2004, the Company continued this initiative with a $4 million charge for restructuring and other charges. In the second quarter of 2004, the Company recorded a $52 million charge for impairment of assets and restructuring charge, which reflected the closing of a facility, the downsizing of another facility in North America, and the continued workforce reduction across all platforms. In the third quarter of 2004, the Company announced the reorganization of its Nordic Gravure platform and closing the Stockholm facility by the end of 2004. The Company also recorded an additional impairment of assets, restructuring and other charges of $13 million. In the fourth quarter of 2004, the Company recorded $38 million of impairment of assets, $13 million in restructuring and $2 million of other charges. In the first quarter of 2005 the Company took a $33 million charge mainly related to the impairment of long-term assets.
Net income
Net income was primarily affected by the negative impact of the difficult economic environment and the benefit from restructuring and cost containment initiatives mentioned above. In addition, unusual items impacting either financial expenses or income taxes also affected the net income for specific quarters. In the fourth quarter of 2003, net income included a $30 million charge ($18 million, net of income taxes) for the extinguishment of long-term debt related to the redemption of the 8.375% Senior Notes and the repurchase of 89.6% of the 7.75% Senior Notes, as well as a $5 million charge for currency translation loss related to the reduction of a net investment in Latin America. In the same quarter, there was also a $28 million charge of additional tax expense for a change in the average tax rate applied on cumulative temporary differences within different states in the United States and a $18 million charge for a reassessment of the expectation of tax asset recovery and liabilities from prior years. Through the year 2004, financial expenses decreased mainly due to the favorable impact of the 2003 fourth quarter refinancing of long-term debt combined with a lower average volume of debt, as well as a favorable impact of the mix of the debt portfolio compared to the previous year.
13
RELATED PARTY TRANSACTIONS
The Company entered into transactions with the parent company and its other subsidiaries, which were accounted for at prices and conditions prevailing in the market, except as otherwise specified for transactions that occurred outside the normal course of operations. Intercompany revenues from the parent company's media subsidiaries involved mostly printing of magazines.
In March 2005, the Company sold certain operating assets to Quebecor Media Inc, one of the parent company's subsidiaries, for a consideration of Cdn $3.3 million ($2.7 million). The transaction has been realized at the carrying amount and no gain or loss was recorded. As of March 31, 2005, Cdn $1.9 million ($1.5 million) was still outstanding.
Related Party Transactions($ millions)
| | 2005 | 2004 | ||||
|---|---|---|---|---|---|---|
| Three-month periods ended March 31, | ||||||
Revenues | $ | 14.3 | $ | 11.2 | ||
| Purchases | 1.1 | 0.5 | ||||
| Management fees billed by Quebecor Inc. | 1.1 | 1.1 | ||||
| IT services billed by VTL (net of incurred expenses billed to VTL of $1.0) | 2.5 | — | ||||
Figure 11
OUTSTANDING SHARE DATA
The following figure discloses the Company's outstanding share data as at April 15, 2005:
Outstanding Share Data($ millions and thousands of shares)
| | April 15, 2005 | ||||
|---|---|---|---|---|---|
| | Issued and outstanding shares | Book value | |||
| Equity Multiple Voting Shares | 46,987 | $ | 93.5 | ||
| Equity Subordinate Voting Shares | 86,128 | 1,166.3 | |||
| First Preferred Shares, Series 3 | 12,000 | 212.5 | |||
| First Preferred Shares, Series 4 | 8,000 | 130.2 | |||
| First Preferred Shares, Series 5 | 7,000 | 113.9 | |||
Figure 12
RISKS AND UNCERTAINTIES
The Company operates in the printing industry, which has a variety of risk factors as discussed in the 2004 annual "Management's Discussion and Analysis" included in the Company's annual report. Due to the risks and uncertainties outlined therein, the Company's operating environment and financial results may be materially affected. No material changes occurred in Management's evaluation of these risks and uncertainties for the quarter ended March 31, 2005.
ACCOUNTING POLICIES
The consolidated financial statements have been prepared using the same accounting policies as described in the Company's latest Annual Report with the exception of the following items:
In June 2003, the CICA issued Accounting Guideline No. 15 ("AcG-15"),Consolidation of Variable Interest Entities, which presents the views of the Accounting Standards Board ("AcSB") on the application of consolidation principles on variable interest entities ("VIEs"). An entity is a VIE when its total equity investment is not sufficient to permit the entity to finance its activities without financial support from other parties or when the equity investors lack either voting control, an obligation to absorb expected losses or the right to receive expected residual returns. AcG-15 provides guidance in identifying VIEs and in determining whether consolidation is required. The guideline is effective for annual and interim periods beginning on or after November 1, 2004. The Company adopted this guideline on January 1, 2005 and its adoption had no significant impact on its consolidated financial statements.
In January 2005, the CICA published Section 3855,Financial Instruments — Recognition and Measurement, Section 3865,Hedges, and Section 1530,Comprehensive Income. Section 3855 stipulates standards governing when and in what amount a financial instrument is to be recorded on the balance sheet. Financial instruments are to be recognized at fair value in some cases, at cost-based value in others. The section also stipulates standards for reporting gains and losses on financial instruments. Section 3865 is an optional application that allows entities to apply treatments other than those provided under Section 3855 to eligible operations they choose to designate, for accounting purposes, as being part of a hedging relationship. It expands on the guidance in Accounting Guideline 13,Hedging Relationships, and Section 1650,Foreign Currency Translation, specifying the application of hedge accounting and the information that is to be reported by the entity. Section 1530 stipulates a new requirement that certain gains and losses be temporarily accumulated outside net income and recognized in other comprehensive income. Application of these sections to interim and annual financial statements for financial periods beginning on or after October 1, 2006 will be mandatory. The Company is currently evaluating the impact of the new standards.
On behalf of Management,
 |
| Claude Hélie Executive Vice President Chief Financial Officer |
 |
| Carl Gauvreau Senior Vice President Chief Accounting Officer |
Montreal, Canada
May 10, 2005
14
CONSOLIDATED STATEMENTS OF INCOME AND RETAINED EARNINGS
Three-month periods ended March 31
(In millions of US dollars, except per share amounts)
(Unaudited)
| | Notes | 2005 | 2004 | ||||||||
|---|---|---|---|---|---|---|---|---|---|---|---|
| Revenues | $ | 1,621.2 | $ | 1,553.0 | |||||||
| Operating expenses: | |||||||||||
| Cost of sales | 1,334.0 | 1,253.1 | |||||||||
| Selling, general and administrative | 110.5 | 115.8 | |||||||||
| Securitization fees | 4.8 | 3.0 | |||||||||
| Depreciation and amortization | 82.5 | 83.1 | |||||||||
| Impairment of assets, restructuring and other charges | 3 | 33.3 | 4.3 | ||||||||
| 1,565.1 | 1,459.3 | ||||||||||
| Operating income | 56.1 | 93.7 | |||||||||
| Financial expenses | 4 | 29.2 | 37.9 | ||||||||
| Income before income taxes | 26.9 | 55.8 | |||||||||
| Income taxes | 10.8 | 18.6 | |||||||||
| Income before minority interest | 16.1 | 37.2 | |||||||||
| Minority interest | (0.2 | ) | 1.4 | ||||||||
| Net income | $ | 16.3 | $ | 35.8 | |||||||
| Net income available to holders of preferred shares | 9.9 | 9.1 | |||||||||
| Net income available to holders of equity shares | $ | 6.4 | $ | 26.7 | |||||||
| Earnings per share | 10 | ||||||||||
| Basic | $ | 0.05 | $ | 0.20 | |||||||
| Diluted | $ | 0.05 | $ | 0.20 | |||||||
Weighted average number of equity shares outstanding: | |||||||||||
| (in millions) | 10 | ||||||||||
| Basic | 132.8 | 132.1 | |||||||||
| Diluted | 132.9 | 132.2 | |||||||||
Retained earnings: | |||||||||||
| Balance, beginning of period | $ | 761.0 | $ | 723.6 | |||||||
| Net income | 16.3 | 35.8 | |||||||||
| Dividends: | |||||||||||
| Equity shares | (18.6 | ) | (17.2 | ) | |||||||
| Preferred shares | (9.8 | ) | (9.3 | ) | |||||||
| Balance, end of period | $ | 748.9 | $ | 732.9 | |||||||
See Notes to Consolidated Financial Statements.
15
CONSOLIDATED STATEMENTS OF CASH FLOWS
Three-month periods ended March 31
(In millions of US dollars)
(Unaudited)
| | Notes | 2005 | 2004 | |||||||||
|---|---|---|---|---|---|---|---|---|---|---|---|---|
| Operating activities: | ||||||||||||
| Net income | $ | 16.3 | $ | 35.8 | ||||||||
| Non-cash items in net income: | ||||||||||||
| Depreciation of property, plant and equipment | 82.4 | 82.9 | ||||||||||
| Impairment of assets and non-cash portion of restructuring | ||||||||||||
| and other charges | 3 | 25.0 | — | |||||||||
| Future income taxes | 0.4 | 9.9 | ||||||||||
| Amortization of deferred charges | 6.1 | 6.3 | ||||||||||
| Other | 1.7 | 5.2 | ||||||||||
Changes in non-cash balances related to operations: | ||||||||||||
| Trade receivables | (80.6 | ) | (64.1 | ) | ||||||||
| Inventories | (2.8 | ) | (5.3 | ) | ||||||||
| Trade payables and accrued liabilities | (70.3 | ) | (107.0 | ) | ||||||||
| Other current assets and liabilities | (0.8 | ) | 5.7 | |||||||||
| Other non-current assets and liabilities | 6.1 | (16.2 | ) | |||||||||
| (148.4 | ) | (186.9 | ) | |||||||||
| Cash used in operating activites | (16.5 | ) | (46.8 | ) | ||||||||
Financing activities: | ||||||||||||
| Net change in bank indebtedness | 0.5 | (0.3 | ) | |||||||||
| Net proceeds from issuance of equity shares | 10.0 | 3.5 | ||||||||||
| Repayment of long-term debt | (2.4 | ) | (36.4 | ) | ||||||||
| Net borrowings under revolving bank facility and commercial paper | 23.2 | 150.2 | ||||||||||
| Dividends on equity shares | (18.6 | ) | (17.2 | ) | ||||||||
| Dividends on preferred shares | (12.4 | ) | (11.7 | ) | ||||||||
| Dividends to minority shareholders | — | (0.1 | ) | |||||||||
| Cash provided by financing activities | 0.3 | 88.0 | ||||||||||
Investing activities: | ||||||||||||
| Business acquisitions and disposals, net of cash and cash equivalents | 5 | (6.1 | ) | (0.6 | ) | |||||||
| Additions to property, plant and equipment | (54.7 | ) | (32.0 | ) | ||||||||
| Net proceeds from disposal of assets | 3.7 | 1.0 | ||||||||||
| Net proceeds on disposal of derivative financial instruments | 7 | 69.2 | — | |||||||||
| Cash provided by (used in) investing activities | 12.1 | (31.6 | ) | |||||||||
Effect of foreign currency | 7.0 | 13.8 | ||||||||||
| Net increase in cash and cash equivalents | 2.9 | 23.4 | ||||||||||
| Cash and cash equivalents, beginning of period | 58.8 | 15.1 | ||||||||||
| Cash and cash equivalents, end of period | $ | 61.7 | $ | 38.5 | ||||||||
| Supplemental cash flow information: | ||||||||||||
| Interest paid | $ | 37.5 | $ | 42.1 | ||||||||
| Income taxes paid | 22.2 | 7.8 | ||||||||||
See Notes to Consolidated Financial Statements.
16
CONSOLIDATED BALANCE SHEETS
(In millions of US dollars)
| | Notes | March 31, 2005 | December 31, 2004 | March 31, 2004 | |||||||||
|---|---|---|---|---|---|---|---|---|---|---|---|---|---|
| | | (Unaudited) | (Audited) | (Unaudited) | |||||||||
| Assets | |||||||||||||
| Current assets: | |||||||||||||
| Cash and cash equivalents | $ | 61.7 | $ | 58.8 | $ | 38.5 | |||||||
| Trade receivables | 474.3 | 400.4 | 408.5 | ||||||||||
| Receivables from related parties | 11 | 19.4 | 19.7 | 15.9 | |||||||||
| Inventories | 417.9 | 419.5 | 403.1 | ||||||||||
| Income taxes receivable | 46.6 | 33.0 | 10.7 | ||||||||||
| Future income taxes | 43.2 | 43.2 | 105.8 | ||||||||||
| Prepaid expenses | 21.8 | 24.5 | 24.1 | ||||||||||
| Total current assets | 1,084.9 | 999.1 | 1,006.6 | ||||||||||
Property, plant and equipment, net | 2,289.9 | 2,373.6 | 2,510.0 | ||||||||||
| Goodwill | 6 | 2,627.9 | 2,651.9 | 2,576.8 | |||||||||
| Other assets | 150.7 | 219.8 | 182.5 | ||||||||||
| Total assets | $ | 6,153.4 | $ | 6,244.4 | $ | 6,275.9 | |||||||
Liabilities and Shareholders' Equity | |||||||||||||
| Current liabilities: | |||||||||||||
| Bank indebtedness | $ | 0.5 | $ | — | $ | 1.0 | |||||||
| Trade payables and accrued liabilities | 841.2 | 931.9 | 867.1 | ||||||||||
| Payables to related parties | 5.5 | 2.7 | 0.1 | ||||||||||
| Income and other taxes payable | 93.5 | 83.7 | 77.8 | ||||||||||
| Future income taxes | 4.4 | 4.4 | 6.2 | ||||||||||
| Current portion of long-term debt and convertible notes | 10.3 | 11.7 | 21.0 | ||||||||||
| Total current liabilities | 955.4 | 1,034.4 | 973.2 | ||||||||||
Long-term debt | 1,842.1 | 1,825.8 | 1,988.5 | ||||||||||
| Other liabilities | 250.4 | 248.1 | 252.4 | ||||||||||
| Future income taxes | 402.6 | 402.6 | 415.3 | ||||||||||
| Convertible notes | 113.2 | 112.6 | 111.2 | ||||||||||
| Minority interest | 1.1 | 8.3 | 25.2 | ||||||||||
Shareholders' equity: | |||||||||||||
| Capital stock | 9 | 1,715.3 | 1,705.3 | 1,696.6 | |||||||||
| Additional paid-in capital | 110.6 | 109.7 | 106.2 | ||||||||||
| Retained earnings | 748.9 | 761.0 | 732.9 | ||||||||||
| Translation adjustment | 13.8 | 36.6 | (25.6 | ) | |||||||||
| 2,588.6 | 2,612.6 | 2,510.1 | |||||||||||
| Total liabilities and shareholders' equity | $ | 6,153.4 | $ | 6,244.4 | $ | 6,275.9 | |||||||
See Notes to Consolidated Financial Statements.
17
NOTES TO CONSOLIDATED FINANCIAL STATEMENTS
Periods ended March 31, 2005 and 2004
(Tabular amounts are expressed in millions of US dollars, except for
earnings per share amounts and number of shares and options)
(Unaudited)
1. BASIS OF PRESENTATION
The Consolidated Financial Statements included in this report are unaudited and reflect normal and recurring adjustments which are, in the opinion of the Company, considered necessary for a fair presentation. These Consolidated Financial Statements have been prepared in conformity with Canadian generally accepted accounting principles ("Canadian GAAP"). The same accounting policies as described in the Company's latest Annual Report have been used, with the exception of the new accounting changes described in note 2. However, these Consolidated Financial Statements do not include all disclosures required under Canadian GAAP and, accordingly, should be read in conjunction with the Consolidated Financial Statements and the notes thereto included in the Company's latest Annual Report.
Seasonality
The operations of the Company's business are seasonal, with approximately 60% of operating income historically recognized in the second half of the fiscal year, primarily due to the higher number of magazine pages, new product launches and back-to-school, retail and holiday catalog promotions. The results of operations for the interim periods should not be considered indicative of full year results.
Reclassification
Certain reclassifications have been made to prior period's amounts in order to conform with the basis of presentation adopted in the current period.
2. NEW ACCOUNTING STANDARD
In June 2003, the CICA issued Accounting Guideline No 15 ("AcG-15"), Consolidation of Variable Interest Entities, which presents the views of the Accounting Standards Board ("AcSB") on the application of consolidation principles on variable interest entities ("VIEs"). An entity is a VIE when its total equity investment is not sufficient to permit the entity to finance its activities without financial support from other parties or when the equity investors lack either voting control, an obligation to absorb expected losses or the right to receive expected residual returns. AcG-15 provides guidance in identifying VIEs and in determining whether consolidation is required. The guideline is effective for annual and interim periods beginning on or after November 1, 2004. The Company adopted this guideline as of January 1, 2005. The effect of adopting the new recommendation did not have a significant impact on the consolidated financial statements as at March 31, 2005.
3. IMPAIRMENT OF ASSETS, RESTRUCTURING AND OTHER CHARGES
During the first quarter of 2005, the Company recorded an impairment of assets, restructuring and other charges of $33.3 million. Cash items amounted to $8.3 million, of which $3.8 million were related to the implementation of new initiatives in 2005 and non-cash items amounted to $25.0 million. The following table sets forth the segmented information and the category of charges:
| 2005 First Quarter | Workforce reduction costs | Leases, closed facilities carrying costs and other | Total restructuring charges | Impairment of assets and pension curtailment | Total impairment of assets, restructuring and other charges | ||||||||||
|---|---|---|---|---|---|---|---|---|---|---|---|---|---|---|---|
| North America | $ | 4.2 | $ | 1.7 | $ | 5.9 | $ | 2.2 | $ | 8.1 | |||||
| Europe | 0.4 | 1.9 | 2.3 | 22.8 | 25.1 | ||||||||||
| Latin America | — | 0.1 | 0.1 | — | 0.1 | ||||||||||
| $ | 4.6 | $ | 3.7 | $ | 8.3 | $ | 25.0 | $ | 33.3 | ||||||
| 2004 First Quarter | Workforce reduction costs | Leases, closed facilities carrying costs and other | Total restructuring charges | Impairment of assets and pension curtailment | Total impairment of assets, restructuring and other charges | ||||||||||
|---|---|---|---|---|---|---|---|---|---|---|---|---|---|---|---|
| North America | $ | 3.3 | $ | — | $ | 3.3 | $ | — | $ | 3.3 | |||||
| Europe | 0.6 | — | 0.6 | — | 0.6 | ||||||||||
| Latin America | 0.2 | — | 0.2 | — | 0.2 | ||||||||||
| Other | 0.2 | — | 0.2 | — | 0.2 | ||||||||||
| $ | 4.3 | $ | — | $ | 4.3 | $ | — | $ | 4.3 | ||||||
Impairment of Assets
Firstly, the Company modified its plan of action for the facility in Corby, England and engaged in restructuring activities. The Company concluded at December 31, 2004 that no impairment was required. However, based on the revised plan of action, the Company re-evaluated the situation at Corby and recorded an impairment. Also, the closure of the Laval, Quebec facility, in the Canadian platform, and other events triggered an impairment test on other groups of assets in North America and Europe. Accordingly, for the first quarter of 2005, the Company recorded an impairment of long-lived assets of $24.6 million.
The impairment of long-lived assets has been calculated as the excess of the carrying amount of the asset or group of assets over its fair value, based on quoted market prices when available, or using a discounted cash flow method.
18
2005 Restructuring charges
During the first quarter of 2005, the Company continued its restructuring initiatives and approved the first phase of the downsizing of its operations in Corby and other workforce reduction across the Company. The cash costs of these initiatives, estimated at $3.8 million, were recorded in the first quarter. The non-cash cost of these initiatives included $0.4 million for the curtailment of one of the Company's Canadian pension plans.
Prior Year Restructuring Initiatives
During the first quarter of 2005, the Company has recorded $4.7 million resulting from the continuation of the 2004 initiatives and $2.2 million for the pension obligation related to the Effingham (Illinois) multiemployer benefit plan. The Company has also recorded a net reversal of $2.4 million resulting from the execution of the prior years initiatives.
Continuity of the reserve for restructuring and other charges
As at January 1, 2005, the balance of the restructuring reserve was $35.2 million. This amount related mostly to the workforce reduction across the platform and lease and facility carrying costs. The Company utilized $12.9 million of the current and prior years' restructuring and other charges reserves during the three-month period ended March 31, 2005.
For the remaining quarters of 2005 and the year 2006, the Company estimates it will incur additional restructuring charges of $14.6 million for initiatives announced and approved prior to March 31, 2005. Furthermore, an additional estimated amount of $15.3 million will be incurred for initatives approved subsequently to the first quarter of 2005.
The following table sets forth the Company's 2005 restructuring reserve and activities against the reserve carried forward from 2004:
| | Workforce reduction costs | Leases, closed facilities carrying costs and other | 2005 | 2004 | |||||||||
|---|---|---|---|---|---|---|---|---|---|---|---|---|---|
| Beginning of the year | $ | 21.3 | $ | 13.9 | $ | 35.2 | $ | 45.8 | |||||
Overspending on prior years' initiatives | 0.2 | 0.8 | 1.0 | 1.3 | |||||||||
| Reversal of previous years' reserves | (2.6 | ) | (0.8 | ) | (3.4 | ) | (2.0 | ) | |||||
| 2004 initiatives | 3.6 | 3.3 | 6.9 | 5.0 | |||||||||
| 2005 initiatives | 3.4 | 0.4 | 3.8 | — | |||||||||
| 4.6 | 3.7 | 8.3 | 4.3 | ||||||||||
| Reserve utilized during the three-month periods ended March 31 | (6.7 | ) | (6.2 | ) | (12.9 | ) | (13.2 | ) | |||||
| Foreign currency changes | (0.5 | ) | (0.3 | ) | (0.8 | ) | (0.4 | ) | |||||
| Balance as at March 31 | $ | 18.7 | $ | 11.1 | $ | 29.8 | $ | 36.5 | |||||
Cash disbursement related to this reserve is expected to be as follows:
| | Workforce reduction costs | Leases, closed facilities carrying costs and other | Total | ||||||
|---|---|---|---|---|---|---|---|---|---|
| Remainder of 2005 | $ | 18.7 | $ | 4.0 | $ | 22.7 | |||
| 2006 | — | 3.0 | 3.0 | ||||||
| 2007 | — | 2.5 | 2.5 | ||||||
| 2008 | — | 1.1 | 1.1 | ||||||
| 2009 and thereafter | — | 0.5 | 0.5 | ||||||
| $ | 18.7 | $ | 11.1 | $ | 29.8 | ||||
4. FINANCIAL EXPENSES
| | Three-month periods ended March 31, | ||||||
|---|---|---|---|---|---|---|---|
| | 2005 | 2004 | |||||
| Interest on long-term debt and convertible notes | $ | 28.8 | $ | 33.1 | |||
| Interest on short-term debt | 0.9 | 1.9 | |||||
| Amortization of deferred financing costs | 0.5 | 0.8 | |||||
| Exchange (gains) losses | (0.4 | ) | 0.4 | ||||
| Loss on extinguishment of long-term debt | — | 2.0 | |||||
| 29.8 | 38.2 | ||||||
| Interest capitalized to the cost of equipment | (0.6 | ) | (0.3 | ) | |||
| $ | 29.2 | $ | 37.9 | ||||
19
5. BUSINESS ACQUISITIONS AND DISPOSALS
In March 2005, the Company acquired minority interests in its North American operations for a cash consideration of Cdn$7.9 million ($6.4 million).
In March 2005, the Company sold its investment in a facility in Torcy, France for a cash consideration of a symbolic amount of 1 Euro. The Company also sold the operating assets of a division of a subsidiary in France for a total cash consideration of 0.2 million Euros ($0.3 million). The Company realized no gain or loss further to those transactions.
6. GOODWILL
The changes in the carrying amount of goodwill for the three-month period ended March 31, 2005 are as follows:
| | North America | Europe | Latin America | Total | |||||||||
|---|---|---|---|---|---|---|---|---|---|---|---|---|---|
| Balance as at December 31, 2004 | $ | 2,198.3 | $ | 445.4 | $ | 8.2 | $ | 2,651.9 | |||||
| Foreign currency changes | (0.5 | ) | (23.7 | ) | 0.2 | (24.0 | ) | ||||||
| Balance as at March 31, 2005 | $ | 2,197.8 | $ | 421.7 | $ | 8.4 | $ | 2,627.9 | |||||
7. FINANCIAL INSTRUMENTS
In February 2005, the Company sold foreign exchange forward contracts that was used to hedge its net investment in a foreign subsidiary for a cash consideration of $69.2 million. These foreign exchange forward contracts were already recorded at the fair market value and all resulting gains were previously recorded in cumulative translation adjustment.
8. STOCK-BASED COMPENSATION
The Company uses the fair value based method of accounting for stock options granted to employees on or after January 1, 2003, and compensation cost is charged against income. However, prior to January 1, 2003, the Company used the settlement based method for its stock-based compensation plans. Had compensation cost been determined using the fair value based method at the date of grant for awards granted in 2002 under all plans, the Company's pro forma net income, earnings per share and diluted earnings per share would not significantly differ from those presented in the consolidated income statements.
The following table summarizes information about stock options:
| | March 31, 2005 | December 31, 2004 | |||
|---|---|---|---|---|---|
| Number of stock options at the end of the period (in thousands): | |||||
| Outstanding | 4,240.3 | 4,542.0 | |||
| Exercisable | 2,551.7 | 2,306.9 | |||
9. CAPITAL STOCK
| | March 31, 2005 | December 31, 2004 | | ||||||||||
|---|---|---|---|---|---|---|---|---|---|---|---|---|---|
| | Number | Amount | Number | Amount | Convertible into | ||||||||
| (thousands of shares) | |||||||||||||
| Multiple voting shares | 46,987 | $ | 93.5 | 46,987 | $ | 93.5 | Subordinate shares | ||||||
| Subordinate voting shares | 86,079 | 1,165.2 | 85,604 | 1,155.2 | n/a | ||||||||
| Redeemable first preferred shares: | |||||||||||||
| Series 3 | 12,000 | 212.5 | 12,000 | 212.5 | Series 2 preferred shares(1) | ||||||||
| Series 4 | 8,000 | 130.2 | 8,000 | 130.2 | Equity share(1) | ||||||||
| Series 5 | 7,000 | 113.9 | 7,000 | 113.9 | Equity share(1) | ||||||||
| 27,000 | 456.6 | 27,000 | 456.6 | ||||||||||
| Total capital stock | $ | 1,715.3 | $ | 1,705,3 | |||||||||
- (1)
- Under certain conditions
During the quarter, 285,253 subordinate voting shares were issued under the Company's stock option plan (34,614 in the first quarter of 2004) and 189,587 subordinate voting shares were issued under the Company's employee stock purchase plans (159,226 in the first quarter of 2004) for a total cash consideration of $10.0 million ($3.5 million in the first quarter of 2004).
20
10. EARNINGS PER SHARE
The following table sets forth the computation of basic and diluted earnings per share:
| | Three-month periods ended March 31, | ||||||
|---|---|---|---|---|---|---|---|
| | 2005 | 2004 | |||||
| Net income available to holders of equity shares | $ | 6.4 | $ | 26.7 | |||
| (in millions) | |||||||
| Weighted average number of equity shares outstanding | 132.8 | 132.1 | |||||
| Effect of dilutive stock options | 0.1 | 0.1 | |||||
| Weighted average number of diluted equity shares outstanding | 132.9 | 132.2 | |||||
| Earnings per share: | |||||||
| Basic | $ | 0.05 | $ | 0.20 | |||
| Diluted | $ | 0.05 | $ | 0.20 | |||
Diluted earnings per share for 2005 and 2004 do not include the effects of the convertible notes as the effect of their inclusion is anti-dilutive.
11. RELATED PARTY TRANSACTIONS
In March 2005, the Company sold certain operating assets to Quebecor Media Inc, one of the parent company's subsidiaries, for a consideration of Cdn $3.3 million ($2.7 million). The transaction has been realized at the carrying amount and no gain or loss was recorded. As of March 31, 2005, Cdn $1.9 million ($1.5 million) was still outstanding.
12. PENSION AND OTHER POSTRETIREMENT BENEFITS
The following table presents the Company's pension and other postretirement benefit costs:
| | Three-month periods ended March 31, | |||||
|---|---|---|---|---|---|---|
| | 2005 | 2004 | ||||
| Pension benefits | $ | 17.9 | $ | 18.5 | ||
| Postretirement benefits | 0.8 | 2.3 | ||||
| Total periodic benefit cost | $ | 18.7 | $ | 20.8 | ||
13. COMMITMENTS
During the quarter, the Company concluded agreements to purchase 6 new presses for its North American segment. Future payments related to these commitments will amount to $42.2 million in 2005, $34.6 million in 2006 and $3.8 million in 2007.
14. SEGMENT DISCLOSURE
The Company operates in the printing industry. Its business groups are located in three main segments: North America, Europe and Latin America. These segments are managed separately since they all require specific market strategies. The Company assesses the performance of each segment based on operating income before impairment of assets, restructuring and other charges. The following is a summary of the segmented information:
| | North America | Europe | Latin America | Other | Inter- Segment | Total | ||||||||||||
|---|---|---|---|---|---|---|---|---|---|---|---|---|---|---|---|---|---|---|
| Three-month periods ended March 31, | ||||||||||||||||||
2005 | ||||||||||||||||||
| Revenues | $ | 1,232.7 | $ | 331.6 | $ | 56.6 | $ | 0.3 | $ | — | $ | 1,621.2 | ||||||
Impairment of assets, restructuring and other charges | 8.1 | 25.1 | 0.1 | — | — | 33.3 | ||||||||||||
| Operating income (loss) | 72.9 | (18.8 | ) | 2.9 | (0.9 | ) | — | 56.1 | ||||||||||
2004 | ||||||||||||||||||
| Revenues | $ | 1,192.4 | $ | 315.4 | $ | 46.8 | $ | — | $ | (1.6 | ) | $ | 1,553.0 | |||||
| Impairment of assets, restructuring and other charges | 3.3 | 0.6 | 0.2 | 0.2 | — | 4.3 | ||||||||||||
| Operating income (loss) | 83.7 | 11.3 | — | (1.3 | ) | — | 93.7 | |||||||||||
21
FORM 52-109FT2
CERTIFICATION OF INTERIM FILINGS
DURING TRANSITION PERIOD
I, Pierre Karl Péladeau, President and Chief Executive Officer of Quebecor World Inc., certify that:
- I have reviewed the interim filings (as this term is defined in Multilateral Instrument 52-109Certification of Disclosure in Issuers' Annual and Interim Filings) ofQuebecor World Inc., (the issuer) for the interim period ending March 31, 2005;
- Based on my knowledge, the interim filings do not contain any untrue statement of a material fact or omit to state a material fact required to be stated or that is necessary to make a statement not misleading in light of the circumstances under which it was made, with respect to the period covered by the interim filings; and
- Based on my knowledge, the interim financial statements together with the other financial information included in the interim filings fairly present in all material aspects the financial condition, results of operations and cash flows of the issuer, as of the date and for the periods presented in the interim filings.
Date: May 10, 2005
/s/Pierre Karl Péladeau
Pierre Karl Péladeau
President and Chief Executive Officer
FORM 52-109FT2
CERTIFICATION OF INTERIM FILINGS
DURING TRANSITION PERIOD
I, Claude Hélie, Executive Vice President and Chief Financial Officer of Quebecor World Inc., certify that:
- I have reviewed the interim filings (as this term is defined in Multilateral Instrument 52-109Certification of Disclosure in Issuers' Annual and Interim Filings) ofQuebecor World Inc., (the issuer) for the interim period ending March 31, 2005;
- Based on my knowledge, the interim filings do not contain any untrue statement of a material fact or omit to state a material fact required to be stated or that is necessary to make a statement not misleading in light of the circumstances under which it was made, with respect to the period covered by the interim filings; and
- Based on my knowledge, the interim financial statements together with the other financial information included in the interim filings fairly present in all material aspects the financial condition, results of operations and cash flows of the issuer, as of the date and for the periods presented in the interim filings.
Date: May 10, 2005
/s/Claude Hélie
Claude Hélie
Executive Vice President and
Chief Financial Officer
SIGNATURES
Pursuant to the requirements of the Securities Exchange Act of 1934, the registrant has duly caused this report to be signed on its behalf by the undersigned, thereunto duly authorized.
QUEBECOR WORLD INC.
By:/s/ Marie-É. Chlumecky
Name: Marie-É. Chlumecky
Title: Assistant Secretary
Date: May 10, 2005
Financial Highlights
MANAGEMENT'S DISCUSSION AND ANALYSIS OF FINANCIAL CONDITION AND RESULTS OF OPERATIONS
Consolidated Statements of Income and Retained Earnings
Consolidated Statements of Cash Flows
Consolidated Balance Sheets
Notes to Consolidated Financial Statements