QuickLinks -- Click here to rapidly navigate through this document
SECURITIES AND EXCHANGE COMMISSION
Washington, DC 20549
FORM 6-K
REPORT OF FOREIGN ISSUER
PURSUANT TO RULE 13a-16 or 15d-16 OF
THE SECURITIES EXCHANGE ACT OF 1934
For the month of August 2005
Commission File Number:1-14118
2005 SECOND QUARTER RESULTS
QUEBECOR WORLD INC.
(Translation of Registrant's Name into English)
612 Saint-Jacques Street, Montreal, Quebec H3C 4M8
(Address of Principal Executive Office)
Indicate by check mark whether the registrant files or will file annual reports under cover of Form 20-F or Form 40-F
Form 20-F o Form 40-F ý
Indicate by check mark if the registrant is submitting the Form 6-K in paper as permitted by Regulation S-T Rule 101(b)(1):
Note: Regulation S-T Rule 101(b)(1) only permits the submission in paper of a Form 6-K if submitted solely to provide an attached annual report to security holders.
Indicate by check mark if the registrant is submitting the Fork 6-K in paper as permitted by Regulation S-T Rule 101(b)(7):
Note: Regulation S-T Rule 101(b)(7) only permits the submission in paper of a Form 6-K if submitted to furnish a report or other document that the registrant foreign private issuer must furnish and make public under the laws of the jurisdiction in which the registrant is incorporated, domiciled or legally organized (the registrant's "home country"), or under the rules of the home country exchange on which the registrant's securities are traded, as long as the report or other document is not a press release, is not required to be and has not been distributed to the registrant's security holders, and, if discussing a material event, has already been the subject of a Form 6-K submission or other filing on EDGAR.
Indicate by check mark whether the registrant by furnishing the information contained in this form is also thereby furnishing the information to the Commission pursuant to Rule 12g3-2(b) under the Securities Exchange Act of 1934.
Yes o No ý
If "Yes" is marked, indicate below the file number assigned to the registrant in connection with Rule 12g3-2(b): 82- .
QUEBECOR WORLD INC.
Filed in this Form 6-K
Documents index
- Press Release dated August 2, 2005; Financial Highlights
- Management's Discussion and Analysis of Financial Condition and Results of Operations
- Consolidated Financial Statements
- Certifications of Interim Filings
- Code of Business
![]()
August 2, 2005 07/05
For immediate release Page 1 of 6
QUEBECOR WORLD ANNOUNCES 2005 SECOND QUARTER RESULTS
Montréal, Canada - Quebecor World Inc. (NYSE:IQW, TSX:IQW.SV) announces that for the second quarter 2005 the Company reported net income of $10 million from continuing operations compared to $16 million in the second quarter of last year. The continuing operations do not include a previously identified non-core group of assets slated for sale and the second quarter results for 2004 have been restated to reflect this fact. On the same basis, earnings per share in the quarter were nil compared to $0.05 in the second quarter of 2004. Operating income was $53.4 million compared to $55.1 million during the same period last year. Before impairment of assets, restructuring and other charges, earnings per share were $0.22 compared to $0.30 in the second quarter of 2004. Consolidated revenues for the quarter were $1.49 billion compared to $1.47 billion last year.
For the first six months of 2005 net income was $26.7 million or $0.05 per share compared to $48.4 million or $0.23 per share last year. Before the impairment of assets, restructuring and other charges, earnings per share for the first half of 2005 were $0.50 compared to $0.51 last year. Consolidated revenue for the first six months of 2005 was $3.05 billion compared to $2.95 billion in 2004.
"These results are in line with what we communicated in our first quarter press release. As we indicated at that time, they reflect the loss of an important customer in the UK, the underperfomance of our French operations and our U.S. magazine platform as well as continuing global price pressures. We are implementing our plan to address these issues by investing in new, more efficient technologies, aggressively seeking additional volume and reducing costs," said Pierre Karl Péladeau, President and CEO, Quebecor World Inc. "While we still face a challenging market environment we have registered some important customer wins and renewals in our U.S. retail and directory business and in our Canadian and Latin American platforms. We continue to generate significant free cash flow. In the second quarter free cash flow was $117 million, an increase of $46 million from the same period last year."
1
For immediate release Page 2 of 6
In the quarter the Company recorded impairment of assets, restructuring and other charges of $31.8 million. The cash portion of this charge is $15.8 million and is related to workforce reductions in the UK, Sweden and North America. The second quarter restructuring initiatives will affect 886 employee positions however it is estimated that 63 new jobs will be created at other facilities. Impairment of long-lived assets of $16 million were recorded in the quarter, mostly in the Company's French operations.
In the second quarter 2005, selling, general and administrative expenses were $99 million compared to $103 million in the second quarter of 2004, a decrease of 4%. For the first six months of 2005, SG&A expenses were $200 million compared to $211 in the same period last year. Excluding the negative impact of currency translation SG&A expenses were lower by $17 million in the first six months of 2005. The decrease is mainly due to workforce reductions and cost containment initiatives.
North America
In North America revenues were $1.15 billion compared to $1.12 billion in the second quarter last year. For the first six months of 2005 revenues were $2.31 billion compared to $2.24 billion in the first six months of last year. Operating income in the second quarter before impairment of assets restructuring and other charges was $84.9 million compared to $92.7 million and operating margin on the same basis was 7.4% compared to 8.3%. The Magazine and Direct group continued to experience negative price pressures, and an unfavourable product mix resulting in lower operating income and margins. Volume for the quarter declined 3% in the Magazine group. This was partially offset by lower labor costs resulting from workforce reductions. In the Retail group revenues and volume increased. This is attributable to the addition of new customers and increased volume form existing customers. In the Book and Directory group despite a challenging price environment operating income and margins were relati vely flat in the second quarter due to cost containment and increased efficiencies. In Catalogs revenue decreased on flat volume as a result of lower prices. In Canada excluding the favourable impact of currency translation revenues decreased by 3% in the quarter but operating income and margins increased due to savings from cost containment initiatives and operational efficiencies. Volume was flat in the second quarter and increased 2% in the first six months of 2005 compared to last year.
2
For immediate release Page 3 of 6
Europe
In Europe revenues in the second quarter were $284 million compared to $310 million in the second quarter of 2004. Excluding the positive impact of currency translation revenues for the quarter were down 12%. Volume in Europe decreased 13% in the second quarter and is largely due to the catalog and magazine segments in France and the loss of a significant customer in the UK. Price erosion also had a significant impact on results. Operating margin in France was negative in the quarter and for the first six months of 2005. The challenging market environment was exacerbated by work stoppages in the first quarter that resulted in additional inefficiencies that affected results in the second quarter. In European operations outside of France operating income and margins were lower compared to the second quarter last year. This is mostly attributable to the Company's UK facility which has been able to replace some of the lost volume but at lower margins.
Latin America
In Latin America revenues were $66 million up 49% compared to the second quarter last year. Volume for the quarter increased 17% compared to the same period last year. Much of this increase is attributable to the positioning of the Company's Latin American book and directory facilities as a low-cost alternative to publishers who were having their work produced in China. This has resulted in increased cross-selling from North America and Europe. The positive impact of currency translation and increased paper sales also contributed to increased revenue. Operating income and margin increased in the quarter and for the first six months compared to the same periods last year.
Discontinued Operations
Quebecor World's core printing activities involve the printing of magazines, catalogs, retail inserts, books, directories and direct mail for the world's largest publishers and retailers. As the Company has grown by acquisition certain facilities were included in those transactions that do not relate to these core businesses. Approximately a dozen facilities in North America are involved in the printing of short-run contractual work such as marketing materials, annual reports, travel and fashion brochures. These activities are different from Quebecor World's core businesses and do not benefit from the advantages and synergies of the Company's global platform. The Company has announced its intention to sell this non-core group. Consequently the operating results related to these activities have been presented separately in the Company's consolidated financial results as discontinued operations and comparative figures have been restated to conform to the presentation adopted during the quart er ended June 30, 2005.
3
For immediate release Page 4 of 6
Dividend
The Board of Directors declared a dividend of $0.14 per share on Multiple Voting Shares and Subordinate Voting Shares. The Board also declared a dividend of CDN$0.3845 per share on Series 3 Preferred Shares, CDN$0.421875 per share on Series 4 Preferred Shares and CDN$0.43125 on Series 5 Preferred Shares. The dividends are payable on September 1st, 2005 to shareholders of record at the close of business August 16th, 2005.
Management Discussion and Analysis
Please refer to the MD&A for the reconciliation to Canadian generally accepted accounting principles of certain figures used to explain these results. The MD&A can be found on the Company's website atwww.quebecorworld.com and through the SEDAR and SEC filings.
Financial statements are available on the Company's website and through the SEDAR and SEC filings.
Sedar web address:www.sedar.com
SEC web address:www.sec.gov
Quebecor World To Webcast Investor Conference Call on August 2, 2005
Quebecor World Inc. will broadcast its Second Quarter conference call live over the Internet on August 2, 2005 at 4:00 PM (Eastern Time).
The conference call, which will last approximately one hour, will be webcast live and can be accessed on the Quebecor World web site:
http://www.quebecorworld.com/en/investors/webcasts/Q205
Prior to the call please ensure that you have the appropriate software. The Quebecor World web address listed above has instructions and a direct link to download the necessary software, free of charge.
Anyone unable to attend this conference call may listen to the replay tape by phoning (877) 293-8133 or (403) 266-2079 &150 passcode 287589#, available from August 2, 2005 to September 3, 2005.
4
For immediate release Page 5 of 6
Except for historical information contained herein, the statements in this release are forward-looking and made pursuant to the safe harbor provisions of the Private Securities Litigation Reform Act of 1995. Forward-looking statements involve known and unknown risks and uncertainties that may cause the Company's actual results in future periods to differ materially from forecasted results. Those risks include, among others, changes in customers' demand for the Company's products, changes in raw material and equipment costs and availability, seasonal changes in customer orders, pricing actions by the Company's competitors, and general changes in economic conditions.
Quebecor World Inc. (NYSE:IQW; TSX:IQW.SV) is one of the largest commercial printers in the world. It is a market leader in most of its major product categories which include magazines, inserts and circulars, books, catalogs, direct mail, directories, digital pre-media, logistics, mail list technologies and other value added services. The Company has approximately 35,000 employees working in more than 160 printing and related facilities in the United States, Canada, Brazil, France, the United Kingdom, Belgium, Spain, Austria, Sweden, Switzerland, Finland, Chile, Argentina, Peru, Colombia, Mexico and India.
Web address:www.quebecorworld.com
- 30 -
For further Information contact:
Tony Ross | Philippe Cloutier |
|
5
QUEBECOR WORLD INC.
FINANCIAL HIGHLIGHTS
Periods ended June 30
(In millions of US dollars, except per share data)
(Unaudited)
| | Three months | Six months | ||||||||||||
|---|---|---|---|---|---|---|---|---|---|---|---|---|---|---|
| | 2005 | 2004 | 2005 | 2004 | ||||||||||
| Consolidated Results from Continuing Operations | ||||||||||||||
| Revenues | $ | 1,494.2 | $ | 1,473.8 | $ | 3,047.1 | $ | 2,950.5 | ||||||
| Operating income before depreciation and amortization and before IAROC | 168.3 | 194.0 | 344.2 | 373.8 | ||||||||||
| Operating income before IAROC | 85.2 | 105.2 | 175.0 | 198.3 | ||||||||||
| IAROC | 31.8 | 50.1 | 65.1 | 54.3 | ||||||||||
| Operating income | 53.4 | 55.1 | 109.9 | 144.0 | ||||||||||
| Net income from continuing operations | 10.1 | 15.6 | 26.7 | 48.4 | ||||||||||
| Operating margin before depreciation and amortization and before IAROC** | 11.3 | % | 13.2 | % | 11.3 | % | 12.7 | % | ||||||
| Operating margin before IAROC** | 5.7 | % | 7.1 | % | 5.7 | % | 6.7 | % | ||||||
| Operating margin ** | 3.6 | % | 3.7 | % | 3.6 | % | 4.9 | % | ||||||
Segmented Information from Continuing Operations | ||||||||||||||
| Revenues | ||||||||||||||
| North America | $ | 1,145.6 | $ | 1,121.9 | $ | 2,311.3 | $ | 2,238.9 | ||||||
| Europe | 283.9 | 309.7 | 615.5 | 625.1 | ||||||||||
| Latin America | 66.2 | 44.4 | 122.8 | 91.2 | ||||||||||
Operating income (loss) before IAROC | ||||||||||||||
| North America | $ | 84.9 | $ | 92.7 | $ | 166.3 | $ | 174.8 | ||||||
| Europe | (2.3 | ) | 12.4 | 4.0 | 24.3 | |||||||||
| Latin America | 3.5 | 1.8 | 6.5 | 2.0 | ||||||||||
Operating margins before IAROC** | ||||||||||||||
| North America | 7.4 | % | 8.3 | % | 7.2 | % | 7.8 | % | ||||||
| Europe | (0.8 | )% | 4.0 | % | 0.6 | % | 3.9 | % | ||||||
| Latin America | 5.3 | % | 4.0 | % | 5.3 | % | 2.1 | % | ||||||
Financial Position | ||||||||||||||
| Cash provided by operating activities | $ | 201.2 | $ | 112.3 | $ | 184.7 | $ | 65.5 | ||||||
| Free cash flow from operations* | $ | 116.8 | $ | 71.3 | $ | 36.9 | $ | (18.2 | ) | |||||
| Working capital | $ | 44.9 | $ | 9.0 | ||||||||||
| Total assets | $ | 5,978.6 | $ | 6,076.7 | ||||||||||
| Long-term debt (including convertible notes) | $ | 1,897.4 | $ | 2,077.5 | ||||||||||
| Shareholders' equity | $ | 2,499.6 | $ | 2,492.8 | ||||||||||
| Debt-to-capitalization | 43:57 | 45:55 | ||||||||||||
Per Share Data | ||||||||||||||
| Earnings from continuing operations | ||||||||||||||
| Diluted | $ | — | $ | 0.05 | $ | 0.05 | $ | 0.23 | ||||||
| Diluted before IAROC | $ | 0.22 | $ | 0.30 | $ | 0.50 | $ | 0.51 | ||||||
| Dividends on equity shares | $ | 0.14 | $ | 0.13 | $ | 0.28 | $ | 0.26 | ||||||
| Book value | $ | 15.62 | $ | 15.39 | ||||||||||
IAROC: Impairment of assets, restructuring and other charges.
- *
- Cash provided by operating activities, less capital expenditures net of proceeds from disposals, and preferred share dividends.
- **
- Margins calculated on revenues.
6
MANAGEMENT'S DISCUSSION AND ANALYSIS
The following is a discussion of the consolidated financial condition and results of operations of Quebecor World Inc. for the three-month and six-month periods ended June 30, 2005 and 2004, and should be read together with the Company's interim consolidated financial statements and the annual "Management's Discussion and Analysis" included in the 2004 Annual Report. The interim consolidated financial statements and Management's Discussion and Analysis have been reviewed by the Company's Audit Committee and approved by its Board of Directors. This discussion contains forward-looking information that is qualified by reference to, and should be read together with, the discussion regarding forward-looking statements that is part of this document. Management determines whether or not information is "material" based on whether it believes a reasonable investor's decision to buy, sell or hold securities in the Company would likely be influenced or changed if the information were omitted or misstated.
Financial data has been prepared in conformity with Canadian Generally Accepted Accounting Principles ("GAAP"). However, certain measures used in this discussion and analysis do not have any standardized meaning under Canadian GAAP. When used, these measures are defined in such terms as to allow the reconciliation to the closest GAAP measure. Numerical reconciliations are provided in figure 6. It is unlikely that these measures could be compared to similar measures presented by other companies.
The Company's functional currency is the Canadian dollar and its reporting currency is the U.S. dollar.
FORWARD-LOOKING STATEMENTS
Except for historical information contained herein, the statements in this document are forward-looking and made pursuant to the safe harbor provisions of the Private Securities Litigation Reform Act of 1995. Forward-looking statements involve known and unknown risks and uncertainties, which may cause actual results in future periods to differ materially from forecasted results. Those risks include, among others, changes in customer demand for products, changes in raw material and equipment costs and availability, seasonal changes in customer orders, pricing actions by competitors and general changes in economic conditions.
OVERVIEW
Quebecor World Inc. is one of the largest commercial print media services companies in the world. Quebecor World is a market leader in the product categories and geographies it serves. This market-leading position has been built through a combination of integrating acquisitions, investing in key strategic technologies and a commitment to building long-term partnerships with the world's leading print media customers.
Quebecor World has facilities in the United States, Canada, France, the United Kingdom, Spain, Switzerland, Sweden, Finland, Austria, Belgium, Brazil, Chile, Argentina, Peru, Colombia, Mexico and India.
The Company offers its customers a broad range of printed products and related communication services, such as magazines, retail inserts, catalogs, direct mail, books, directories, pre-media, logistics and other value-added services.
The Company operates in the commercial print media segment of the printing industry and its business groups are located in three geographical regions: North America, which historically represents approximately 80% of the Company's revenues, Europe and Latin America.
Operations in this segment of the print industry are seasonal with a greater part of volume being realized in the second half of the fiscal year, primarily due to the higher number of magazine pages, new product launches and back-to-school, retail and holiday catalog promotions. The interim results of operations analyzed hereafter are not necessarily indicative of full year results.
Consolidation of the printing industry is ongoing because of global overcapacity which has led to negative price pressures. As smaller plants disappear, larger plants continue to grow and deploy more efficient equipment. Consequently global overcapacity will remain an issue and will likely impact prices in certain segments.
The primary drivers affecting the Company are consumer confidence and economic growth rates. These are key drivers of demand for commercial print media because they affect the level of advertising and merchandising activity. The Company uses magazine advertising pages as an important indicator of demand for printing products and services. This indicator, as measured in the United States by the Publishers Information Bureau, showed some positive signs throughout 2004, but was volatile in the first half of 2005. (Figure 1)
U.S. Magazine Advertising Pages 2001-2005 (Monthly)
Percentage Year-Over-Year Change
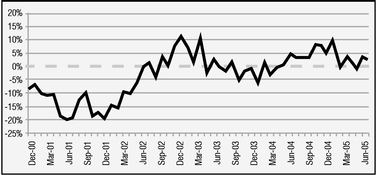
Source: Publishers Information Bureau (PIB)
Figure 1
The Company also emphasizes two additional key success factors — administrative and manufacturing efficiency — and addresses them on a continual basis. In recent years, the Company has undertaken restructuring initiatives that resulted in downsizing across the platform and several plant closures. These measures are ongoing and are expected to continue through the rest of 2005. In the current challenging environment, the positive effects of the 2004 restructuring initiatives were not evident in operating income because of the continuing price reductions.
Furthermore, technology will continue to play an important role in improving Quebecor World's manufacturing efficiency. The Company is focussed on improving speeds, reducing manning, lowering downtime and paper waste as well as shorter make-ready times. As part of these efforts the Company approved a three year investment plan in 2004 that calls for over $300 million in investments in newer, more efficient presses across the platform. The Company's strategy is to reduce its fixed cost base and increase its efficiency by consolidating smaller facilities into larger groups of operations, grouping similar types of assets into larger facilities using available space and optimizing all aspects of pressroom efficiencies. In addition, the Company divested itself of certain smaller operations in France and North America.
7
At the annual shareholders meeting held on May 10, 2005, management announced that the Company's results for the second quarter of 2005 would be lower than those of the first quarter of 2005. The actual results for the quarter are, as anticipated, below those of the first quarter and the first six months of 2005 have been particularly difficult for the Company. They reflect the loss of an important customer in the UK, the underperformance of French operations, the U.S. magazine platform and non-core operations in North America. The French operations suffered in the first quarter from labor strikes that led to various inefficiencies coupled with continued price pressure. These elements continued to affect the French operations in the second quarter and its financial results continued to suffer. The Company is presently assessing the situation in France in order to determine what actions are necessary to help bring results back on track. Britain's results for the second quarter reflect the volume lost because an important contract was not renewed and was terminated. Management is developing a strategic plan to help the British operations replace lost volume. Magazine operations are suffering in North America as volumes are down in general and particularly due to the loss of certain important contracts. The Company will retool this platform, along with the majority of North American operations, to render them more competitive and help replace lost volumes. Finally, the non-core printing activities continued to perform below par in the second quarter of 2005. In order to address this situation, the Company is actively negotiating the disposal of these activities as explained in the "Discontinued operations" section hereafter.
The current charge for impairment of assets, restructuring and other charges reflects both smaller initiatives undertaken in the first half and definite plans to eliminate inefficient and idle equipment. As such, a detailed review of activities took place at the facility in Corby, England. This resulted in the implementation of a workforce reduction plan and an impairment of long-lived assets. The Company anticipates additional restructuring charges in the upcoming quarters related to the restructuring of this facility, as discussed in the "Impairment of Assets and Restructuring Initiatives" section.
DISCONTINUED OPERATIONS
Over the years, Quebecor World has strived to build a global printing platform that allows publishers and retailers to print in multiple plants, in various countries, reducing lead-time and distribution costs. The Company's core printing activities, mainly the printing of magazines, catalogs, retail inserts, books and directories benefit from this platform. However, as the Company grew by acquisitions, certain facilities were included in these transactions that do not concentrate on Quebecor World's core printing activities. As a result, there are approximately a dozen facilities in North America whose primary activities are non-core general commercial printing. These activities consist primarily of short-run, non-contractual work such as annual reports, marketing materials, travel, fashion and automobile brochures and packaging. This market is highly competitive and fragmented with many small local and regional players. Different from Quebecor World's previously described core business, these activities do not benefit from the advantages and synergies of the Company's global platform. As a result, on May 10, 2005, the Company announced a plan to sell its group of non-core printing facilities in North America (the "non-core Group").
At the end of the second quarter, the Company had completed the sale of a facility in Los Angeles, California and was in the process of concluding the disposal of the remaining facilities included in the non-core Group. Consequently, the operating results related to these activities have been presented separately in the Company's consolidated financial statements as discontinued operations and comparative figures have been restated to conform to the presentation adopted during the quarter ended June 30, 2005. The assets related to the Los Angeles facility have been excluded from the Company's consolidated balance sheet and the assets and liabilities related to the remaining plants are presented as held for sale in Note 5 to the consolidated financial statements as at June 30, 2005.
The results of the non-core Group have been significantly impacted by the loss on disposal of the Los Angeles facility as well as specific charges related to this facility. Also, this facility incurred decreased revenues and operating income. The Company is continuing to negotiate the disposal of other facilities in this non-core Group.
Revenue by Product-Worldwide($ millions)
For the quarter and the six-month periods ended June 30
(Continuing Operations)
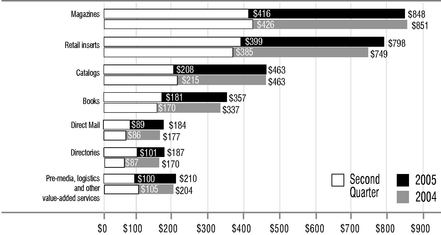
Figure 2
REVIEW OF SECOND QUARTER AND YEAR-TO-DATE
The Company assesses performance based on operating income before impairment of assets, restructuring and other charges. The following operating analyses are before impairment of assets, restructuring and other charges. The review focussed only on continuing operations.
The Company's consolidated revenues for the quarter were $1,494 million, a 1% increase when compared to $1,474 million for the same period in 2004. On a year-to-date basis, revenues were $3,047 million, up 3% from $2,951 million in 2004. Excluding the favorable impact of currency translation (see figure 3), revenues were $1,460 for the quarter, down 1% compared to 2004 and $2,980 for the first six months of 2005, up 1% compared to 2004. This situation is mainly due to continued pressure on prices, and an overall volume decrease for the quarter and year-to-date. Revenue by product is shown in figure 2.
Impact of Foreign Currency($ millions)
(Continuing Operations)
| | Three months ended June 30, 2005 | Six months ended June 30, 2005 | ||||
|---|---|---|---|---|---|---|
| Foreign currency favorable impact on revenues | $ | 33.9 | $ | 66.7 | ||
| Foreign currency favorable impact on operating income | $ | 0.8 | $ | 1.6 | ||
Figure 3
8
For the second quarter of 2005, operating income decreased 19% to $85 million, from $105 million in 2004. On a year-to-date basis, operating income was $175 million, down 12% from $198 million in 2004. Operating margin for the quarter was 5.7% compared to 7.1% for the same period in 2004. For the year 2005 to date, operating margin was 5.7% down from 6.7% in 2004.
Paper sales, excluding the effect of currency translation, increased by 8% in the second quarter of 2005 compared to the same period in 2004. On the same basis, for the first six months of 2005, paper sales increased by 9% compared to the same period in 2004. The increase for both the quarter and year-to-date was mainly due to the increase in paper sales to customers and the increase in paper prices compared to 2004. Although the increase in paper sales has a positive impact on revenues, it has little or no impact on operating income because the cost is generally passed on to the customer and, as a result, it contributes to the lower operating margin. Most of the Company's long-term contracts with its customers include price-adjustment clauses based on the cost of materials in order to minimize the effects of fluctuation in the price of paper.
In the second quarter of 2005 and 2004, operating income was affected by recording specific charges of $7 million mainly for provisions for leases in North America. For the first six months of 2005, the Company recorded specific charges of $10 million compared to $3 million in 2004. The 2005 charges related mainly to provisions for leases in North America, whereas the 2004 charges related to various items including provisions for leases, depreciation of assets and favorable legal claim settlements in North America.
Cost of sales for the second quarter 2005 increased 4% at $1,228 million compared to $1,180 million last year. For the year 2005 to date, cost of sales was $2,505 million, a 6% increase compared to $2,372 million for the same period in 2004. Gross profit margin was 17.8% in the second quarter of 2005, down from 19.9% in 2004. On a year-to-date basis, gross profit margin was 17.8% compared to 19.6% in 2004. The cost of sales for the second quarter included specific charges of $5 million and $8 million for the first six months of 2005 mainly due to lease provisions. In the second quarter of 2004, the cost of sales included specific charges of $2 million for the second quarter and net recovery of $4 million on a year-to-date basis. Excluding these specific items as well as the unfavorable impact of currency translation, gross profit margin for the quarter was 19.3%, down from 20.0% for the same quarter last year. On a year-to-date basis in 2005, gross profit margin, excluding specific items as well as the unfavorable impact of currency translation, was 17.4% compared to 19.5% for 2004. The decrease compared to 2004 is explained by continued pressure on prices, an increase in freight costs due to higher fuel prices and a higher level of paper sales. These were partly offset by a $30 million decrease in labor costs compared to the same period in 2004. This reflects the effect of the ongoing restructuring initiatives undertaken by the Company and described in the "Impairment of Assets and Restructuring Initiatives" section hereafter.
Segmented Results of Continuing Operations($ millions)
Selected Performance Indicators
| | North America | Europe | Latin America | Inter-Segment and Others | Total | ||||||||||||||||||||||||||
|---|---|---|---|---|---|---|---|---|---|---|---|---|---|---|---|---|---|---|---|---|---|---|---|---|---|---|---|---|---|---|---|
| | 2005 | 2004 | 2005 | 2004 | 2005 | 2004 | 2005 | 2004 | 2005 | 2004 | |||||||||||||||||||||
| Three months ended June 30, | |||||||||||||||||||||||||||||||
| Revenues | $ | 1,145.6 | $ | 1,121.9 | $ | 283.9 | $ | 309.7 | $ | 66.2 | $ | 44.4 | $ | (1.5 | ) | $ | (2.2 | ) | $ | 1,494.2 | $ | 1,473.8 | |||||||||
| Operating income (loss) before depreciation and amortization and before IAROC | 150.6 | 161.7 | 12.2 | 29.2 | 6.2 | 4.6 | (0.7 | ) | (1.5 | ) | 168.3 | 194.0 | |||||||||||||||||||
| Operating income (loss) before IAROC | 84.9 | 92.7 | (2.3 | ) | 12.4 | 3.5 | 1.8 | (0.9 | ) | (1.7 | ) | 85.2 | 105.2 | ||||||||||||||||||
| IAROC | 8.3 | 47.3 | 23.1 | 2.3 | 0.4 | 0.4 | — | 0.1 | 31.8 | 50.1 | |||||||||||||||||||||
| Operating income (loss) | 76.6 | 45.4 | (25.4 | ) | 10.1 | 3.1 | 1.4 | (0.9 | ) | (1.8 | ) | 53.4 | 55.1 | ||||||||||||||||||
| Operating margin before depreciation and amortization and before IAROC | 13.2 | % | 14.4 | % | 4.3 | % | 9.4 | % | 9.4 | % | 10.2 | % | 11.3 | % | 13.2 | % | |||||||||||||||
| Operating margin before IAROC | 7.4 | % | 8.3 | % | (0.8) | % | 4.0 | % | 5.3 | % | 4.0 | % | 5.7 | % | 7.1 | % | |||||||||||||||
| Operating margin | 6.7 | % | 4.1 | % | (9.0) | % | 3.3 | % | 4.7 | % | 3.0 | % | 3.6 | % | 3.7 | % | |||||||||||||||
| Capital expenditures(1) | $ | 64.2 | $ | 29.6 | $ | 8.7 | $ | 2.6 | $ | 0.8 | $ | 0.7 | $ | — | $ | — | $ | 73.7 | $ | 32.9 | |||||||||||
| Changes in non-cash balances related to operations, cash flow (outflow)(1) | 88.8 | (20.3 | ) | 12.5 | 1.4 | 1.3 | 7.1 | (10.8 | ) | (14.8 | ) | 91.8 | (26.6 | ) | |||||||||||||||||
Six months ended June 30, | |||||||||||||||||||||||||||||||
| Revenues | $ | 2,311.3 | $ | 2,238.9 | $ | 615.5 | $ | 625.1 | $ | 122.8 | $ | 91.2 | $ | (2.5 | ) | $ | (4.7 | ) | $ | 3,047.1 | $ | 2,950.5 | |||||||||
| Operating income (loss) before depreciation and amortization and before IAROC | 299.0 | 310.3 | 34.7 | 58.3 | 11.8 | 7.5 | (1.3 | ) | (2.3 | ) | 344.2 | 373.8 | |||||||||||||||||||
| Operating income (loss) before IAROC | 166.3 | 174.8 | 4.0 | 24.3 | 6.5 | 2.0 | (1.8 | ) | (2.8 | ) | 175.0 | 198.3 | |||||||||||||||||||
| IAROC | 16.4 | 50.5 | 48.2 | 2.9 | 0.5 | 0.6 | — | 0.3 | 65.1 | 54.3 | |||||||||||||||||||||
| Operating income (loss) | 149.9 | 124.3 | (44.2 | ) | 21.4 | 6.0 | 1.4 | (1.8 | ) | (3.1 | ) | 109.9 | 144.0 | ||||||||||||||||||
| Operating margin before depreciation and amortization and before IAROC | 12.9 | % | 13.9 | % | 5.6 | % | 9.3 | % | 9.6 | % | 8.2 | % | 11.3 | % | 12.7 | % | |||||||||||||||
| Operating margin before IAROC | 7.2 | % | 7.8 | % | 0.6 | % | 3.9 | % | 5.3 | % | 2.1 | % | 5.7 | % | 6.7 | % | |||||||||||||||
| Operating margin | 6.5 | % | 5.6 | % | (7.2) | % | 3.4 | % | 4.9 | % | 1.5 | % | 3.6 | % | 4.9 | % | |||||||||||||||
| Capital expenditures(1) | $ | 110.6 | $ | 55.7 | $ | 16.7 | $ | 6.1 | $ | 1.1 | $ | 3.1 | $ | — | $ | — | $ | 128.4 | $ | 64.9 | |||||||||||
| Changes in non-cash balances related to operations, cash flow (outflow)(1) | 2.5 | (193.6 | ) | (31.5 | ) | (27.7 | ) | (4.9 | ) | 5.7 | (22.7 | ) | 2.1 | (56.6 | ) | (213.5 | ) | ||||||||||||||
IAROC: Impairment of assets, restructuring and other charges.
- (1)
- Including both continued and discontinued operations
Figure 4
9
Selling, general and administrative expenses for the second quarter of 2005 were $99 million compared to $103 million in 2004, a decrease of 4%. On a year-to-date basis, selling, general and administrative expenses were $200 million in 2005, compared to $211 million in 2004 or a decrease of 5%. Excluding the unfavorable impact of currency translation of $3 million, selling, general and administrative expenses were lower by $7 million for the second quarter compared to last year. On a year-to-date basis, excluding the negative impact of currency translation of $6 million, selling, general and administrative expenses improved by $17 million. The savings were mostly explained by cost-containment initiatives and headcount reductions.
Depreciation and amortization were $77 million in the second quarter of 2005 compared to $83 million in the same period of 2004. On a year-to-date basis, depreciation and amortization were $157 million in 2005, compared to $163 million in 2004. Excluding the impact of currency movement, depreciation and amortization decreased by 9% for the second quarter and 6% year-to-date in 2005 compared to last year. The decrease is mostly due to impairment charges taken during the last twelve months.
Securitization fees totalled $6 million for the second quarter of 2005 ($3 million for the second quarter of 2004) and $10 million for the first six months of 2005 ($6 million for the same period in 2004). The increase for the first six months of 2005 was mainly due to higher market interest rates underlying the program fees. Servicing revenues and expenses did not have a significant impact on the Company's results.
During the first half of 2005, the Company continued its restructuring initiatives and recorded a net impairment of assets and restructuring charges of $65 million, which reflected further workforce reductions across the Company. These measures are described in the section "Impairment of Assets and Restructuring Initiatives".
Financial expenses were $31 million in the second quarter of 2005, compared to $32 million in 2004. On a year-to-date basis, financial expenses were $60 million in 2005, compared to $70 million in 2004. The lower expenses were mainly due to a lower average volume of debt in 2005 and a $2 million non-recurring charge on extinguishment of long-term debt in 2004.
In the second quarter of 2005, income taxes were $12 million compared to $5 million for the same period in 2004 or an effective tax rate of 54.9% compared to 20.6% in 2004. On a year-to-date basis, income taxes were $23 million in 2005, compared to $21 million in 2004, or an effective tax rate of 46.7% compared to 29.0% in 2004. The rates were significantly higher in 2005 due to valuation allowances recorded on tax benefit related to the impairment of long-lived assets, restructuring and other charges. Before impairment of assets, restructuring and other charges, income taxes were $15 million for the second quarter of 2005 compared to $22 million for the same period last year or an effective tax rate of 28.4% for 2005 compared to 29.1% in 2004. On the same basis, the year-to-date income taxes were $29 million compared to $39 million in 2004, or an effective tax rate of 25.5% compared to 30.6% for 2004. The decrease in income tax rate was mainly due to a decrease in profits before taxes in jurisdictions with higher tax rates.
Net income for the second quarter was $10 million compared to $16 million in 2004. For the six-month period, net income was $27 million, compared to $48 million for the same period last year. Diluted earnings per share were nil for the second quarter of 2005 down from $0.05 compared to 2004. These results incorporated impairment of assets, restructuring and other charges of $32 million ($29 million net of taxes) or $0.22 per share compared with $50 million ($34 million net of taxes) or $0.25 per share in 2004. Excluding the effect of impairment of assets, restructuring and other charges, the second quarter of 2005 resulted in diluted earnings per share of $0.22 compared with $0.30 in the same period of 2004. Diluted earnings per share were $0.05 for the first six months of 2005 compared to $0.23 for the same period in 2004. These results incorporated impairment of assets, restructuring and other charges of $65 million ($59 million net of taxes) or $0.45 per share compared with $54 million ($37 million net of taxes) or $0.28 per share in 2004. Excluding the effect of impairment of assets, restructuring and other charges, the first half of 2005 resulted in diluted earnings per share of $0.50 compared with $0.51 in the same period of 2004.
SEGMENT REVIEW
The following review of operating activities by business group (figure 5) is before impairment of assets, restructuring and other charges. Also, the review focusses only on continuing operations.
Revenue by Business Group($ millions)
For the quarter and the six-month periods ended June 30
(Continuing Operations)
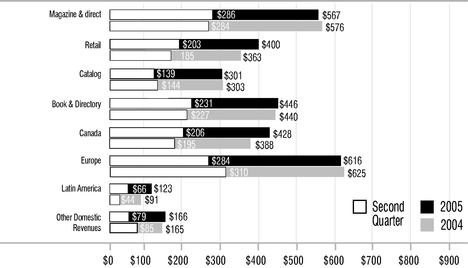
Figure 5
North America
North American revenues for the second quarter of 2005 were $1,146 million, up 2% from $1,122 million in 2004. On a year-to-date basis, revenues were $2,311 in 2005 up 3% from $2,239 in 2004. Excluding the effect of currency translation and the favorable impact of paper sales, revenues decreased by 2% in the second quarter and 1% on a year-to-date basis mainly due to shortfalls in volume and price erosion. Selling, general and administrative expenses decreased across the North American platform in the second quarter and on a year-to-date basis in 2005 compared to 2004, due to savings from facility closures, cost-containment initiatives and corporate headcount reductions, mostly in 2004. Year-over-year headcount was reduced in North America by 1,314 employees, or approximately 5%.
The following is a review of the North American activities by business group. The North American segment is made up of the following business groups: Magazine & Direct, Retail, Catalog, Book & Directory, Canada and Other Revenues.
10
Reconciliation of non GAAP measures
($ millions)
| | Three months ended June 30, | Six months ended June 30, | |||||||||||||
|---|---|---|---|---|---|---|---|---|---|---|---|---|---|---|---|
| | 2005 | 2004 | 2005 | 2004 | |||||||||||
| Operating Income from Continuing Operations | |||||||||||||||
| Operating income | $ | 53.4 | $ | 55.1 | $ | 109.9 | $ | 144.0 | |||||||
| IAROC | 31.8 | 50.1 | 65.1 | 54.3 | |||||||||||
| Operating income before IAROC | $ | 85.2 | 105.2 | $ | 175.0 | $ | 198.3 | ||||||||
| Operating income | $ | 53.4 | $ | 55.1 | $ | 109.9 | $ | 144.0 | |||||||
| Depreciation of property, plant and equipment(1) | 78.2 | 84.8 | 160.6 | 167.7 | |||||||||||
| Amortization of deferred charges(1) | 6.6 | 6.5 | 12.7 | 12.8 | |||||||||||
| Less depreciation and amortization from discontinued operations(2) | (1.7 | ) | (2.5 | ) | (4.1 | ) | (5.0 | ) | |||||||
| Operating income before depreciation and amortization | $ | 136.5 | $ | 143.9 | $ | 279.1 | $ | 319.5 | |||||||
| IAROC | 31.8 | 50.1 | 65.1 | 54.3 | |||||||||||
| Operating income before depreciation and amortization and before IAROC | $ | 168.3 | $ | 194.0 | $ | 344.2 | $ | 373.8 | |||||||
Earnings per share from Continuing Operations | |||||||||||||||
| Net income from Continuing Operations | $ | 10.1 | $ | 15.6 | $ | 26.7 | $ | 48.4 | |||||||
| IAROC (net of income taxes of $3 million for the second quarter of 2005 ($6 million year-to-date) and $17 million for the second quarter of 2004 ($18 million year-to-date)) | 28.8 | 33.6 | 59.1 | 36.6 | |||||||||||
| Net income before IAROC | $ | 38.9 | 49.2 | $ | 85.8 | $ | 85.0 | ||||||||
| Net income available to holders of preferred shares | 9.8 | 8.7 | 19.7 | 17.8 | |||||||||||
| Net income available to holders of equity shares before IAROC | $ | 29.1 | $ | 40.5 | $ | 66.1 | $ | 67.2 | |||||||
| Diluted average number of equity shares outstanding (in millions) | 132.5 | 132.4 | 132.7 | 132.3 | |||||||||||
| Earnings per share | |||||||||||||||
| Diluted | $ | — | $ | 0.05 | $ | 0.05 | $ | 0.23 | |||||||
| Diluted before IAROC | $ | 0.22 | $ | 0.30 | $ | 0.50 | $ | 0.51 | |||||||
Free Cash Flow (outflow) | |||||||||||||||
| Cash provided by operating activities | $ | 201.2 | $ | 112.3 | $ | 184.7 | $ | 65.5 | |||||||
| Dividends on preferred shares | (12.2 | ) | (8.5 | ) | (24.6 | ) | (20.2 | ) | |||||||
| Additions to property, plant and equipment | (73.7 | ) | (32.9 | ) | (128.4 | ) | (64.9 | ) | |||||||
| Net proceeds from disposal of assets | 1.5 | 0.4 | 5.2 | 1.4 | |||||||||||
| Free cash flow (outflow) from operations | $ | 116.8 | $ | 71.3 | $ | 36.9 | $ | (18.2 | ) | ||||||
Debt-to-capitalization | |||||||||||||||
| Bank indebtedness | $ | 0.2 | $ | 0.9 | |||||||||||
| Current portion of long-term debt | 9.3 | 12.8 | |||||||||||||
| Long-term debt | 1,774.4 | 1,953.0 | |||||||||||||
| Convertible notes | 113.7 | 111.7 | |||||||||||||
| Total debt | $ | 1,897.6 | $ | 2,078.4 | |||||||||||
| Minority interest | 1.1 | 26.9 | |||||||||||||
| Shareholders' equity | 2,499.6 | 2,492.8 | |||||||||||||
| Capitalization | $ | 4,398.3 | $ | 4,598.1 | |||||||||||
| Debt-to-capitalization | 43:57 | 45:55 | |||||||||||||
Book value per share | |||||||||||||||
| Shareholders' equity | $ | 2,499.6 | $ | 2,492.8 | |||||||||||
| Preferred shares | (456.6 | ) | (456.6 | ) | |||||||||||
| $ | 2,043.0 | $ | 2,036.2 | ||||||||||||
| Ending number of equity shares (in millions) | 130.8 | 132.3 | |||||||||||||
| Book value per share | $ | 15.62 | $ | 15.39 | |||||||||||
IAROC: Impairment of assets, restructuring and other charges.
- (1)
- As reported in the Consolidated Statements of cash flows
- (2)
- As reported in Note 5 "Discontinued Operations"
Figure 6
11
Magazine & Direct
Magazine & Direct revenues for the second quarter of 2005 were $286 million, up 1% from $284 million in 2004. On a year-to-date basis, revenues were $567 million in 2005, down 2% from $576 million in 2004. Revenue increased in the second quarter due mainly to increased paper sales in both groups offset by a 3% volume shortfall in the Magazine group and continued price erosion in both groups. Revenue decreased on a year-to-date basis due to the volume shortfalls of 5% in Magazine and 3% in Direct and continued price erosion in both groups. Volume in the magazine group was negatively impacted due to the non-renewal of certain important contracts. Operating income and margin decreased in the second quarter and on a year-to-date basis due mainly to the volume decreases and price erosion, but was partly offset by a decrease in labor costs from head-count reduction.
Retail
Retail revenues for the second quarter of 2005 were $203 million, up 10% from $185 million in 2004. On a year-to-date basis, revenues were $400 million in 2005, up 10% from $363 million in 2004. Excluding the favorable impact of paper sales, revenues increased by 2% and 3% in the second quarter and year-to-date, respectively, compared to 2004. The increase in revenue was due mainly to an 8% increase in volume in both the second quarter and year-to-date partly offset by the negative impact of lower priced work. The volume increase is explained by both new gains as well as additional volume from existing customers. Operating income was flat in the second quarter of 2005 compared to the same period in 2004, but on a year-to-date basis, operating income increased due mainly to the savings from restructuring initiatives and operational efficiency gains.
Catalog
Catalog revenues for the second quarter of 2005 were $139 million, down 4% from $144 million in 2004. On a year-to-date basis, revenues were $301 million in 2005, down 1% from $303 million in 2004. The decrease in revenue for the second quarter and year-to-date basis was due mainly to the negative impact of lower priced work while volume remained relatively flat. The price erosion was a result of the overall competitive catalog market. Operating income and margin decreased in the second quarter and year-to-date basis due mainly to the negative impact of lower pricing that was partly offset by cost containment initiatives and headcount reduction.
Book & Directory
Book & Directory revenues for the second quarter of 2005 were $231 million, up 2% from $227 million in 2004. On a year-to-date basis, revenues were $446 million in 2005, up 1% from $440 million in 2004. Excluding the favorable impact of paper sales, revenues were flat in the second quarter and decreased 2% year-to-date compared to the same periods in 2004. The decrease in revenue was due mainly to the negative impact of price with volume remaining relatively flat on a year-to-date basis. Operating income and margin were flat in the second quarter and year-to-date basis compared to 2004. The Book and Directory group has continued to enhance its position by maintaining competitive efficiencies and by adding a significant ten-year contract with Dex Media.
Canada
The Canadian business group operates mainly in the Retail, Magazine, Direct, Catalog, and Directory markets. Canadian revenues for the second quarter of 2005 were $206 million, up 6% from $195 million in 2004. On a year-to-date basis, revenues were $428 million in 2005, up 10% from $388 million in 2004. Excluding the favorable impact of currency translation, revenues decreased by 3% for the quarter and increased 2% year-to-date compared to the same periods in 2004. Volume was relatively flat in the second quarter of 2005 but increased 2% year-to-date compared to the same periods last year, mainly due to volume growth in the Directory and Retail markets. Despite a volume increase, market conditions remained extremely competitive as reflected in the pricing. However, operating income and margin increased in both the second quarter and year-to-date compared to the same periods last year mainly due to savings from cost control initiatives and operational efficiency gains.
In April 2005, the Company announced a plan to reorganize a portion of its East Group printing operations to better position itself to compete in a challenging market environment. The plan included the consolidation of prepress and sales operations at its Laval facility with other plants in Quebec and the cessation of printing operations in Laval. Approximately 50 employees were transferred to other facilities and approximately 140 positions were eliminated as a result of this reorganization.
Other Revenues
Other sources of revenues in North America include Quebecor World Premedia and Logistics.
The Quebecor World Premedia revenues for the second quarter of 2005 were $14 million, down 15% from $16 million in 2004. On a year-to-date basis, revenues were $28 million in 2005, down 17% from $33 million in 2004. The decrease in revenue for the second quarter compared to 2004 was due to a 17% decrease in volume offset by a slight increase in price, essentially due to product mix. On a year-to-date basis, volume was relatively flat year over year, but changes in the type of prepress work and the continued price erosion caused a negative impact on revenue. The economic environment has led customers to continue looking for ways to reduce their costs by putting pressure on reducing prices, re-using previously captured images and taking more of the prepress production in-house. Operating income and margin for the second quarter and year-to-date 2005 compared to the same periods last year decreased due mainly to price reductions and the loss of the higher margin services.
Logistics revenues for the second quarter of 2005 and 2004 were $69 million. On a year-to-date basis, revenues were $144 million in 2005, up 3% from $140 million in 2004. The revenue increase for the six-month period was due mainly to higher retail commodity shipments. However, margins decreased in both the second quarter and year-to-date due to more truck shipments for time-sensitive products. Higher margin airfreight in the United States continued to grow slowly with pricing pressure from fuel surcharge and security fees. Operating income and margin decreased in both the second quarter and year-to-date of 2005 compared to the same periods last year due mainly to the continuing rise in fuel charges and a shift in the sales mix to increased retail freight with lower margins.
Europe
The European business group operates mainly in the Magazine, Retail, Catalog and Book markets. European revenues for the second quarter of 2005 were $284 million, down 8% from $310 million in 2004. On a year-to-date basis, revenues were $616 million in 2005 down 2% from $625 million in 2004. Excluding the positive impact of currency translation, revenues were down 12% for the second quarter and down 6% year-to-date compared to the same periods last year. Overall volume decreased by 13% in the second quarter and 6% year-to-date mainly explained by the Catalog and Magazine markets in France and the wind down of an important contract not renewed at the Corby (England) facility. Price erosion continued to have a negative impact on the European results.
The operating income and margin for the European segment decreased significantly in the second quarter and year-to-date compared to the same periods in 2004. France's operating margin was negative for both the second quarter and six-months of 2005 compared to the same periods last year. The decrease in volume combined with labor troubles that led to various inefficiencies and the continued price pressure negatively affected the French results in the first half of 2005. Management is currently assessing the situation in order to implement a comprehensive investment program that will provide this platform with the right mix of technology to perform in this market. In the first quarter of 2005, the Company completed divestitures of two under-performing facilities in France. Outside France, operating income and margin decreased in the second quarter and year-to-date of 2005 compared to the same periods in 2004. This is mostly attributable to the Corby (England) facility. In 2004, the Company was informed that an important printing contract at this facility would not be renewed. Volumes related to this contract began to decrease in the first half of 2005 and the contract was terminated at June 30, 2005. The facility has been able to replace some of the lost volume, but at a lower margin.
12
Selling, general and administrative expenses decreased in the second quarter and six-months of 2005 compared to the same periods in 2004 as a result of savings from cost containment initiatives and head-count reductions. Year-over-year headcount decreased by 763 employees or approximately 13%.
Latin America
Latin America operates mainly in the Book, Directory, Magazine, and Retail markets. Latin America's revenues for the second quarter of 2005 were $66 million, up 49% from $44 million in 2004. On a year-to-date basis, revenues were $123 million in 2005, up 35% from $91 million in 2004. Overall volume increased by 17% for the quarter and 16% year-to-date compared to the same periods as last year, mainly in the Book and the Directory markets in Peru, Recife, Brazil and Mexico, as well as in the Book market in Argentina. The increase was mainly due to the positive impact of currency translation along with an increase in paper sales and the volume increase of cross selling with the North American and European groups. During the third quarter of 2004, the Company had embarked on an initiative to link more closely the Latin American Book and Directory facilities with its North American counterparts to expand the capacity and capabilities to its overall customer base. This initiative has continued through the second quarter of 2005. Prices were lower in the second quarter and year-to-date 2005 compared to the same periods last year due to the continued competitive market conditions. Operating income and margin have increased in both the second quarter and six-months of 2005 compared to the same periods last year mainly due to the increased volume and the efficiency cost saving initiatives.
Selling, general and administrative expenses for the second quarter and year-to-date 2005, when excluding the effect of currency translation, decreased from last year due mainly to savings from cost containment initiatives and headcount reductions. Year-over-year headcount was reduced by 310 employees, or approximately 14%.
CRITICAL ACCOUNTING ESTIMATES
The Company's critical accounting estimates are discussed in the Company's annual "Management's Discussion and Analysis" included in the 2004 Annual Report. The preparation of financial statements in conformity with Canadian GAAP requires management to make estimates and assumptions that affect the reported amounts of assets and liabilities and disclosure of contingent assets and liabilities at the date of the financial statements and the reported amounts of revenues and expenses during the reporting period. Management has not made any significant changes to the estimates and assumptions on the quarter ended June 30, 2005. Actual results could differ from those estimates.
FINANCIAL CONDITION, LIQUIDITY AND CAPITAL RESOURCES
The Company measures its liquidity performance using the calculation of free cash flow as described in figure 6. Free cash flow reflects liquidity available for business acquisitions, equity dividends and repayments of long-term debt. Free cash flow for the second quarter of 2005 amounted to $117 million, compared to $71 million for the same quarter last year. On a year-to-date basis, free cash flow for 2005 amounted to $37 million, compared to an outflow of $18 million for the same period of 2004. The Company typically generates most of its free cash flow in the second half of the year.
Operating Activities
Working capital was $45 million as at June 30, 2005, compared to $9 million as at June 30, 2004. This increase in working capital of $36 million was largely due to higher levels of cash and cash equivalents, as the Company is required to maintain a minimum level of funds in its captive insurance subsidiary, and a decrease of future income tax assets. The Company manages its trade payables in order to take advantage of prompt payment discounts. Also, the Company maximizes the use of its accounts receivable securitization program, since the cost of these programs is relatively low compared to that of the credit facility. The amount of trade receivables under securitization varies from month to month, based on the previous month's volume (June securitization is based on outstanding receivables at the end of May).
Financing Activities
As at June 30, 2005, the debt level was at $1,898 million, a $181 million decrease compared to the end of June 2004. The debt-to-capitalization ratio was 43:57 compared to 45:55 in June 2004 (see figure 6). The same ratio was 44:56 as at December 31, 2004. Including accounts receivable securitization, total debt would be $2,514 million, $216 million lower than last year. The debt-to-capitalization ratio, including accounts receivable securitization, was 50:50 as at June 30, 2005, compared to 52:48 in June 2004 (see figure 7).
Total Debt and Accounts Receivable Securitization($ millions)
| | June 30, 2005 | June 30, 2004 | ||||
|---|---|---|---|---|---|---|
| Bank indebtedness | $ | 0.2 | $ | 0.9 | ||
| Current portion of long-term debt | 9.3 | 12.8 | ||||
| Long-term debt | 1,774.4 | 1,953.0 | ||||
| Convertible notes | 113.7 | 111.7 | ||||
| Total debt | $ | 1,897.6 | $ | 2,078.4 | ||
| Accounts receivable securitization | 616.6 | 652.0 | ||||
| Total debt and accounts receivable securitization | $ | 2,514.2 | $ | 2,730.4 | ||
| Minority interest | 1.1 | 26.9 | ||||
| Shareholders' equity | 2,499.6 | 2,492.8 | ||||
| Capitalization, including securitization | $ | 5,014.9 | $ | 5,250.1 | ||
| Debt-to-Capitalization, including securitization | 50:50 | 52:48 | ||||
These ratios are non-GAAP measures.
Figure 7
The Company is subject to certain financial covenants in some of its major financing agreements. The key financial ratios are the earnings before interest, tax and depreciation and amortization (EBITDA) coverage ratio and the debt-to-capitalization ratio. As at June 30, 2005, the Company was in compliance with all significant debt covenants.
The 7.20% Senior Notes for a principal amount of $250 million will mature in March 2006. The Company intends to repay the Senior Notes by using its long-term revolving bank facility and, as such, these Notes have not been included in the current portion of long-term debt.
On May 10, 2005, the Company announced that the Board of Directors had approved a normal course issuer bid for a maximum of 7,300,000 Subordinate Voting Shares, which represented approximately 10% of the public float for the Subordinate Voting Shares at the time of the announcement. The purchases will be made at prevailing market prices, on the open market through the facilities of the Toronto Stock Exchange during a twelve month period from May 13, 2005 to May 12, 2006. In the second quarter of 2005, the Company repurchased 2,332,500 shares at an average price of Cdn$23.85 for a net cash consideration of Cdn$56 million ($44 million). The excess of the price paid over the book value of the shares repurchased amounting to $9 million was charged to retained earnings. The issuer bid is funded using the Company's revolving bank facility. As at June 30, 2005, the unused portion of the bank facility was $670 million.
13
Contractual Cash Obligations($ millions)
(Continuing Operations)
| | Remainder of 2005 | 2006 | 2007 | 2008 | 2009 | 2010 and thereafter | ||||||||||||
|---|---|---|---|---|---|---|---|---|---|---|---|---|---|---|---|---|---|---|
| Long-term debt and convertible notes | $ | — | $ | 250 | $ | 637 | $ | 202 | $ | — | $ | 772 | ||||||
| Capital lease | 5 | 8 | 4 | 3 | 8 | 9 | ||||||||||||
| Operating lease | 58 | 77 | 58 | 36 | 27 | 100 | ||||||||||||
| Capital asset purchase commitments | 67 | 68 | 6 | — | — | — | ||||||||||||
| Total contractual cash obligations | $ | 130 | $ | 403 | $ | 705 | $ | 241 | $ | 35 | $ | 881 | ||||||
Figure 8
The minimum legal requirement for pension contributions is $50 million in 2005 of which $11 million has been paid as of June 30, 2005 (total annual contribution in 2004 was $77 million).
As at June 30, 2005, the following investment grade ratings applied to the long-term unsecured debt of the Company:
| Rating Agency | Rating | |
|---|---|---|
| Moody's Investors Service | Baa3 | |
| Standard & Poor's | BBB– | |
| Dominion Bond Rating Service Limited | BBB (low) |
The Company believes that its liquidity, capital resources and cash flow from operations are sufficient to fund planned capital expenditures, working capital requirements, interest and principal payments for the foreseeable future.
Investing Activities
In the second quarter of 2005, the Company invested $74 million in capital projects compared to $33 million in 2004. On a year-to-date basis, $128 million has been invested in capital projects in 2005 compared to $65 million in 2004. Of that amount, 90% (80% in 2004) was for organic growth, including expenditures for new capacity requirements and productivity improvement, and 10% (20% in 2004) was for the maintenance of the Company's structure.
Key expenditures for the second quarter of 2005 included the replacement of a bindery line in Islington (Canada), an efficiency improvement program in Cayfosa (Spain) and relocation of equipment from Interprint (Sweden) to Helprint (Finland) and Hélio-Charleroi (Belgium). As part of the strategic plan announced in 2004, the Company placed 3 additional orders for new presses in the quarter ended June 30, 2005. The Company has now placed a total of 18 firm orders for new presses representing a total cost of approximately $200 million.
For the remainder of 2005, the Company projects capital expenditures of $175 million of which a portion is related to the strategic plan and a significant lease buyout. Expected sources of funds to meet these expenditures are cash flows from operations and drawings on the Company's revolving bank facility.
Furthermore, in April 2005, the Company purchased assets of a web offset printing facility in Pittsburg, California for $9 million. This facility will complement and strengthen the Company's retail insert platform and add capacity for customers in the West coast market.
During the first six months of 2005, the Company acquired minority interests in its North American operations for a cash consideration of $6 million. The Company also sold investments in facilities in France for a total cash consideration of $0.3 million. The Company realized no gain or loss on these transactions.
In June 2005, the Company disposed of its facility in Los Angeles, California for a total cash consideration of $0.5 million resulting in a loss on disposal of $5.9 million ($3.7 million net of income tax recovery).
IMPAIRMENT OF ASSETS AND RESTRUCTURING INITIATIVES
The following analysis takes into account impairments and measures pertaining to continuing operations.
During the second quarter of 2005, the Company recorded impairments of assets and restructuring charges of $31.8 million, which were composed of cash items amounting to $15.8 million and non-cash items of $16.0 million. The cash items included $3.7 million for the implementation of initiatives from the second quarter of 2005 and $8.5 million for initiatives from the first quarter of 2005. For the six-month period ended June 30, 2005, the Company recorded impairments of assets and restructuring charges of $65.1 million, composed of non-cash items of $41.0 million and cash items of $24.1 million.
During the first two quarters of 2005, the Company performed a review of its assets following impairment tests on specific units. For the second quarter, the Company concluded that some assets, mainly in France, were impaired. Accordingly, impairments of long-lived-assets assets of $16.0 million were recorded for the quarter then ended. Furthermore, in the first quarter, the Company modified its plan of action for the facility in Corby, England and engaged in restructuring activities. The Company had concluded at December 31, 2004 that no impairment was required. However, based on the revised plan of action, the Company re-evaluated the situation at Corby and recorded an impairment of assets. Furthermore, the announcement, in April 2005, of the closing of a facility in Canada and other events triggered an impairment test on other groups of assets. Accordingly, for the first quarter of 2005, the Company recorded an impairment of long-lived assets of $24.6 million. The impairments have been calculated as the excess of the carrying amount of the asset or group of assets over its fair value, based on quoted market prices when available, or using a discounted cash flow method.
In the first half of 2005, the Company continued its restructuring initiatives. In the second quarter of 2005, the Company approved further downsizing operations in Corby, the closure of a Canadian facility and other workforce reductions across the Company. The cash costs of these initiatives were estimated at $18.2 million, of which $12.3 million were recorded during the second quarter. In the first quarter of 2005, the Company had approved the first phase of the downsizing of operations in Corby and other workforce reductions across the Company. The cash costs of these initiatives, estimated at $3.8 million, were recorded in the first quarter. The non-cash cost of these initiatives included $0.4 million for the curtailment of one of the Company's Canadian pension plans. The 2005 restructuring initiatives affected 886 employees in total with 800 jobs that had been eliminated at June 30, 2005 and 86 still to come in 2005. However, the Company estimated that 63 new jobs would be created in other facilities.
During the second quarter of 2005, the Company recorded $3.7 million resulting from the continuation of the 2004 initiatives. The Company also recorded a net reversal of $0.2 million resulting from the execution of the prior year initiatives. During the first quarter of 2005, the Company recorded $4.7 million resulting from the continuation of the 2004 initiatives and $2.2 million for the pension obligation related to the Effingham multiemployer benefit plan. The Company has also recorded a net reversal of $2.4 million resulting from the execution of the prior year initiatives. In summary, 289 jobs were eliminated in the first half of 2005 as a result of the execution of prior years initiatives and 77 are still to come in 2005.
14
For the remaining quarters of 2005 and the year 2006, the Company estimates it will incur additional restructuring charges of $14.7 million for initiatives related to continuing operations which were announced and approved prior to June 30, 2005.
As at January 1, 2005, the balance of the restructuring reserve was $35.2 million. This amount related mostly to the workforce reduction across the platform and lease and facility carrying costs. The Company utilized $30.8 million of the current and prior years' restructuring and other charges reserves during the six-month period ended June 30, 2005 such that the balance of the reserve, including new initiatives in 2005, was $31.2 million at period-end.
FINANCIAL INSTRUMENTS
The Company uses a number of financial instruments for which a complete description of these instruments is contained in the Company's annual "Management's Discussion and Analysis" included in the 2004 Annual Report. The following is an analysis of the Company's financial instruments as at June 30, 2005.
- •
- Interest rate swap agreements outstanding at quarter-end had a notional value of $233 million. The total adjustment recorded to interest expense was nil for the first six months of 2005 and a revenue of $0.7 million for the same period in 2004.
- •
- The Company enters into foreign exchange forward contracts to hedge foreign denominated sales and related receivables, raw materials and equipment purchases. The contracts outstanding as at June 30, 2005 had a notional value of $306 million and expire between 2005 and 2007. The foreign exchange translation gains and losses and the deferred premiums and discounts are recognized as an adjustment to the corresponding revenues and exchange gain or losses when the transaction is recorded. The total amounts recorded in these accounts for the first six months of 2005 for these contracts were revenues of $10.5 million, and a gain of $0.4 million (revenues of $6.9 million, and a loss of $0.6 million for the same period in 2004).
- •
- In February 2005, the Company sold foreign exchange forward contracts that were used to hedge its net investment in a foreign subsidiary for a cash consideration of $69 million. These foreign exchange forward contracts were already recorded at the fair market value and all resulting gains were previously recorded in cumulative translation adjustment.
- •
- Foreign exchange forward contracts and cross currency swaps outstanding at quarter-end, used to hedge foreign denominated asset exposures, had a notional value of $247 million and $100 million respectively, and expire between 2005 and 2006. The total adjustment recorded in foreign exchange gain or loss related to these contracts was a gain of $42 million for the first six months of 2005 (a gain of $10 million for 2004) which compensated the foreign exchange gains and losses on the translation of foreign denominated assets.
- •
- Natural gas swap contracts outstanding at quarter-end had a notional quantity of 223,000 gigajoules in Canada and 1,938,000 MMBTU in the U.S. and expire between July and December 2005. The total adjustment to gas cost for the first six months of 2005 was a gain of $0.3 million ($1.8 million in 2004).
- •
- The total amount deferred as a liability in relation to terminated derivative instruments or those that have ceased to be effective as at June 30, 2005 was $7.8 million ($12.6 million for the same period in 2004) and the total amount recognized in income was $1.1 million ($2.1 million for the same period of 2004).
Fair Value of Derivative Financial Instruments($ millions)
(Continuing Operations)
| | June 30, 2005 | December 31, 2004 | ||||||||||||
|---|---|---|---|---|---|---|---|---|---|---|---|---|---|---|
| | Book Value | Fair Value | Book Value | Fair Value | ||||||||||
| Derivative financial instruments | ||||||||||||||
| Interest rate swap agreements | $ | — | $ | (6.6 | ) | $ | — | $ | (5.1 | ) | ||||
| Foreign exchange forward contracts | 7.5 | 25.0 | 72.8 | 109.8 | ||||||||||
| Cross currency interest rate swaps | 5.2 | 5.2 | (16.7 | ) | (16.7 | ) | ||||||||
| Commodity swaps | 0.2 | 1.7 | (0.1 | ) | (1.0 | ) | ||||||||
Figure 9
OFF-BALANCE SHEET ARRANGEMENTS
The Company is party to various off-balance sheet arrangements. For a complete description of these arrangements, please refer to the Company's annual "Management's Discussion and Analysis" included in the 2004 Annual Report.
As at June 30, 2005, the amounts outstanding under the Canadian, US and European securitization programs were Cdn$89 million, $400 million and 119 million Euros, respectively. (Cdn$108 million, $405 million and 138 million Euros as at June 30, 2004). The Company had a retained interest in the trade receivables sold of $129 million, which is recorded in the Company's trade receivables. As at June 30, 2005, an aggregate amount of $746 million ($772 million as at June 30, 2004) of accounts receivable has been sold under the three programs. The Company is in compliance with all its covenants under the agreements governing its securitization programs.
RELATED PARTY TRANSACTIONS
The Company entered into transactions with the parent company and its other subsidiaries, which were accounted for at prices and conditions prevailing in the market, except as otherwise specified for transactions that occurred outside the normal course of operations. Intercompany revenues from the parent company's media subsidiaries involved mostly printing of magazines.
Related Party Transactions($ millions)
| | 2005 | 2004 | ||||
|---|---|---|---|---|---|---|
| Three-month periods ended June 30, | ||||||
| Revenues | $ | 13.5 | $ | 12.1 | ||
| Purchases | 1.1 | 1.0 | ||||
| Management fees billed by Quebecor Inc. | 1.1 | 1.1 | ||||
| IT services billed by VTL (net of incurred expenses billed to VTL of $0.8) | 2.9 | — | ||||
Six-month periods ended June 30, | ||||||
| Revenues | $ | 27.8 | $ | 23.3 | ||
| Purchases | 2.2 | 1.5 | ||||
| Management fees billed by Quebecor Inc. | 2.2 | 2.1 | ||||
| IT services billed by VTL (net of incurred expenses billed to VTL of $1.8) | 5.4 | — | ||||
Figure 10
In March 2005, the Company sold certain operating assets to Quebecor Media Inc., one of the parent company's subsidiaries, for a consideration of Cdn$3.3 million ($2.7 million). The transaction has been realized at the carrying amount and no gain or loss was recorded. The amount has been received in full as at June 30, 2005.
15
Selected Quarterly Financial Data(Continuing Operations)
(in millions of dollars, except per share data)
| | 2005 | 2004 | 2003 | |||||||||||||||||||||||
|---|---|---|---|---|---|---|---|---|---|---|---|---|---|---|---|---|---|---|---|---|---|---|---|---|---|---|
| | Q2 | Q1 | Q4 | Q3 | Q2 | Q1 | Q4 | Q3 | ||||||||||||||||||
| Consolidated Results | ||||||||||||||||||||||||||
| Revenues | $ | 1,494.2 | $ | 1,552.9 | $ | 1,825.0 | $ | 1,572.0 | $ | 1,473.8 | $ | 1,476.7 | $ | 1,658.2 | $ | 1,516.0 | ||||||||||
| Operating income before depreciation and amortization and before IAROC | 168.3 | 175.9 | 252.8 | 197.8 | 194.0 | 179.8 | 175.7 | 200.0 | ||||||||||||||||||
| Operating income before IAROC | 85.2 | 89.8 | 162.2 | 112.8 | 105.2 | 93.1 | 85.9 | 114.1 | ||||||||||||||||||
| IAROC | 31.8 | 33.3 | 48.4 | 12.8 | 50.1 | 4.2 | 19.8 | (5.6 | ) | |||||||||||||||||
| Operating income | 53.4 | 56.5 | 113.7 | 100.0 | 55.1 | 88.9 | 66.1 | 119.7 | ||||||||||||||||||
| Net income (loss) from continuing operations | 10.1 | 16.6 | 46.8 | 46.3 | 15.6 | 32.8 | (50.5 | ) | 60.4 | |||||||||||||||||
Per Share Data | ||||||||||||||||||||||||||
| Earnings (losses) | ||||||||||||||||||||||||||
| Diluted | $ | — | $ | 0.05 | $ | 0.27 | $ | 0.28 | $ | 0.05 | $ | 0.18 | $ | (0.46 | ) | $ | 0.38 | |||||||||
| Diluted before IAROC | $ | 0.22 | $ | 0.28 | $ | 0.59 | $ | 0.36 | $ | 0.30 | $ | 0.20 | $ | (0.35 | ) | $ | 0.34 | |||||||||
| Dividends on equity shares | $ | 0.14 | $ | 0.14 | $ | 0.13 | $ | 0.13 | $ | 0.13 | $ | 0.13 | $ | 0.13 | $ | 0.13 | ||||||||||
IAROC: Impairment of assets, restructuring and other charges
Figure 11
QUARTERLY TRENDS:
Revenue
Due to the seasonality of the printing business (higher volumes in the third and fourth quarters), an analysis of the consecutive quarters is not a true measurement of the revenue trend. In 2003, quarterly revenues were negatively affected by significant pricing pressures in a difficult environment in the printing industry. The volume was higher in most segments due to the Company's initiative to aggressively secure an increased market share, but the continued pricing pressures and overcapacity in the printing industry negatively affected revenues in all business segments. Currency translation had a positive impact on each of the quarters in 2003. In the first quarter of 2004, there was an increase in volume, but there was a continuing overcapacity in the printing industry and pricing pressures which negatively affected revenue. This trend continued through the remaining three quarters of 2004, while currency translation continued to have a positive impact on revenue in each of the quarters in 2004. Revenue increased in the first two quarters of 2005 due mainly to a favorable impact on currency translation and a higher volume of paper sold to customers. Continued pricing pressures across the platform adversely affected revenues in the first two quarters of 2005, offsetting most volume increases. Volume decreases were particularly felt in the North American Magazine platform, the English and French operations.
Operating income before impairment of assets, restructuring and other charges
In 2003, a detailed review of the Company's operations was undertaken to further reduce the fixed cost base and improve efficiencies. This resulted in a series of restructuring initiatives throughout the year. There were also specific charges of $25 million during the second half of 2003 mainly for provision for leases and various other adjustments. This was partially offset by the savings from the reduction in force and cost containment initiatives. The first quarter of 2004 showed improved results attributed to the positive impact of the cost reduction efforts initiated in 2003 and the reduction in force. This positive trend continued through the next three quarters of 2004 but was partly offset by increased fringe benefits (including healthcare and pension), $19 million of specific charges, increased freight costs due to higher fuel prices and new government hours of service regulations. Moreover, the third quarter of 2004 was negatively impacted by operational inefficiencies mainly at plants involved in the installation and transfer of equipment.
For the years 2004 and 2003, the comparison of the same quarter for different years showed a continued increase in operating income before impairment of assets, restructuring and other charges with the exception of the third quarter of 2004 compared to 2003, which resulted in a slight decrease. Operating income before impairment of assets, restructuring and other charges decreased in the first and second quarters of 2005 compared to the same periods in 2004 due mainly to the negative effect of price erosion partially offset by the savings from cost containment and headcount reduction.
Impairment of assets, restructuring and other charges
Impairment of assets, restructuring and other charges have been a major focus of the Company's cost reduction initiatives undertaken during the last two years that involved a reduction in force, closure or downsizing of facilities, decommissioning of under-performing assets, lowering of overhead expenses, consolidating corporate functions and relocating sales and administrative offices into plants. This determined focus on cost containment has reduced the Company's long-term cost structure and improved efficiency across the platform.
In the third quarter of 2003, there was a net reversal of $6 million in relation to the second quarter charges. In the fourth quarter of 2003, there was an additional $20 million charge for new impairment of assets, restructuring and other charges. In the first quarter of 2004, the Company continued this initiative with a $4 million charge for restructuring and other charges. In the second quarter of 2004, the Company recorded a $50 million charge for impairment of assets and restructuring charge, which reflected the closing of a facility, the downsizing of another facility in North America, and the continued workforce reduction across all platforms. In the third quarter of 2004, the Company announced the reorganization of its Nordic Gravure platform and closing the Stockholm facility by the end of 2004. The Company also recorded an additional impairment of assets, restructuring and other charges of $13 million. In the fourth quarter of 2004, the Company recorded $35 million of impairment of assets, $11 million in restructuring and $2 million of other charges. In the first quarter of 2005 the Company took a $33 million charge mainly related to the impairment of long-term assets. For the second quarter of 2005, the Company booked a $32 million charge, approximately half of which was for impairment of assets and the other half related to restructuring initiatives.
Net income
Net income was primarily affected by the negative impact of the difficult economic environment and the benefit from restructuring and cost containment initiatives mentioned above. In addition, unusual items impacting either financial expenses or income taxes also affected the net income for specific quarters. In the fourth quarter of 2003, net income included a $30 million charge ($18 million, net of income taxes) for the extinguishment of long-term debt related to the redemption of the 8.375% Senior Notes and the repurchase of 89.6% of the 7.75% Senior Notes, as well as a $5 million charge for currency translation loss related to the reduction of a net investment in Latin America. In the same quarter, there was also a $28 million charge of additional tax expense for a change in the average tax rate applied on cumulative temporary differences within different states in the United States and a $18 million charge for a reassessment of the expectation of tax asset recovery and liabilities from prior years. Through the year 2004, financial expenses decreased mainly due to the favorable impact of the 2003 fourth quarter refinancing of long-term debt combined with a lower average volume of debt, as well as a favorable impact of the mix of the debt portfolio compared to the previous year. Net income in the second quarter of 2005 was negatively affected by the underperforming French operations as well as volume reductions in the England and the North American Magazine platform.
16
OUTSTANDING SHARE DATA
The following figure discloses the Company's outstanding share data as at July 15, 2005:
Outstanding Share Data($ millions and thousands of shares)
| | July 15, 2005 | ||||
|---|---|---|---|---|---|
| | Issued and outstanding shares | Book value | |||
| Equity Multiple Voting Shares | 46,987 | $ | 93.5 | ||
| Equity Subordinate Voting Shares | 83,917 | 1,136.9 | |||
| First Preferred Shares, Series 3 | 12,000 | 212.5 | |||
| First Preferred Shares, Series 4 | 8,000 | 130.2 | |||
| First Preferred Shares, Series 5 | 7,000 | 113.9 | |||
Figure 12
RISKS AND UNCERTAINTIES
The Company operates in the printing industry, which has a variety of risk factors as discussed in the 2004 annual "Management's Discussion and Analysis" included in the Company's annual report. Due to the risks and uncertainties outlined therein, the Company's operating environment and financial results may be materially affected. No material changes occurred in Management's evaluation of these risks and uncertainties for the quarter ended June 30, 2005.
ACCOUNTING POLICIES
The consolidated financial statements have been prepared using the same accounting policies as described in the Company's latest Annual Report with the exception of the following items:
In January 2005, the CICA published Section 3855,Financial Instruments — Recognition and Measurement, Section 3865,Hedges, and Section 1530,Comprehensive Income. Section 3855 stipulates standards governing when and in what amount a financial instrument is to be recorded on the balance sheet. Financial instruments are to be recognized at fair value in some cases, at cost-based value in others. The section also stipulates standards for reporting gains and losses on financial instruments. Section 3865 is an optional application that allows entities to apply treatments other than those provided under Section 3855 to eligible operations they choose to designate, for accounting purposes, as being part of a hedging relationship. It expands on the guidance in Accounting Guideline 13,Hedging Relationships, and Section 1650,Foreign Currency Translation, specifying the application of hedge accounting and the information that is to be reported by the entity. Section 1530 stipulates a new requirement that certain gains and losses be temporarily accumulated outside net income and recognized in other comprehensive income. Application of these sections to interim and annual financial statements for financial periods beginning on or after October 1, 2006 will be mandatory. The Company is currently evaluating the impact of the new standards.
On behalf of Management,
 |
| Claude Hélie Executive Vice President Chief Financial Officer |
 |
| Carl Gauvreau Senior Vice President Chief Accounting Officer |
Montreal, Canada
August 2, 2005
17
CONSOLIDATED STATEMENTS OF INCOME AND RETAINED EARNINGS
Periods ended June 30,
(In millions of US dollars, except per share amounts)
(Unaudited)
| | | Three months | Six months | ||||||||||||||
|---|---|---|---|---|---|---|---|---|---|---|---|---|---|---|---|---|---|
| | Notes | 2005 | 2004 | 2005 | 2004 | ||||||||||||
| Revenues | $ | 1,494.2 | $ | 1,473.8 | $ | 3,047.1 | $ | 2,950.5 | |||||||||
| Operating expenses: | |||||||||||||||||
| Cost of sales | 1,227.8 | 1,180.2 | 2,505.0 | 2,372.0 | |||||||||||||
| Selling, general and administrative | 99.0 | 102.7 | 200.1 | 211.1 | |||||||||||||
| Securitization fees | 5.7 | 3.2 | 10.4 | 6.0 | |||||||||||||
| Depreciation and amortization | 76.5 | 82.5 | 156.6 | 163.1 | |||||||||||||
| Impairment of assets, restructuring and other charges | 2 | 31.8 | 50.1 | 65.1 | 54.3 | ||||||||||||
| 1,440.8 | 1,418.7 | 2,937.2 | 2,806.5 | ||||||||||||||
| Operating income | 53.4 | 55.1 | 109.9 | 144.0 | |||||||||||||
| Financial expenses | 3 | 31.0 | 32.3 | 60.2 | 70.3 | ||||||||||||
| Income from continuing operations before income taxes | 22.4 | 22.8 | 49.7 | 73.7 | |||||||||||||
| Income taxes | 12.3 | 4.7 | 23.2 | 21.4 | |||||||||||||
| Income from continuing operations before minority interest | 10.1 | 18.1 | 26.5 | 52.3 | |||||||||||||
| Minority interest | — | 2.5 | (0.2 | ) | 3.9 | ||||||||||||
| Net income from continuing operations | 10.1 | 15.6 | 26.7 | 48.4 | |||||||||||||
| Net income (loss) from discontinued operations (net of tax) | 5 | (8.1 | ) | (0.3 | ) | (8.4 | ) | 2.7 | |||||||||
| Net income | $ | 2.0 | $ | 15.3 | $ | 18.3 | $ | 51.1 | |||||||||
| Net income available to holders of preferred shares | 9.8 | 8.7 | 19.7 | 17.8 | |||||||||||||
| Net income (loss) available to holders of equity shares | $ | (7.8 | ) | $ | 6.6 | $ | (1.4 | ) | $ | 33.3 | |||||||
| Earnings (loss) per share: | 10 | ||||||||||||||||
| Basic and Diluted: | |||||||||||||||||
| Continuing operations | $ | — | $ | 0.05 | $ | 0.05 | $ | 0.23 | |||||||||
| Discontinued operations | (0.06 | ) | — | (0.06 | ) | 0.02 | |||||||||||
| (0.06 | ) | 0.05 | (0.01 | ) | 0.25 | ||||||||||||
Weighted average number of equity shares outstanding (in millions) | 10 | ||||||||||||||||
| Basic | 132.5 | 132.3 | 132.7 | 132.2 | |||||||||||||
| Diluted | 132.5 | 132.4 | 132.7 | 132.3 | |||||||||||||
Retained earnings: | |||||||||||||||||
| Balance, beginning of period | $ | 748.9 | $ | 732.9 | $ | 761.0 | $ | 723.6 | |||||||||
| Net income | 2.0 | 15.3 | 18.3 | 51.1 | |||||||||||||
| Shares repurchased | 9 | (9.4 | ) | — | (9.4 | ) | — | ||||||||||
| Dividends: | |||||||||||||||||
| Equity shares | (18.5 | ) | (17.2 | ) | (37.1 | ) | (34.4 | ) | |||||||||
| Preferred shares | (9.6 | ) | (8.7 | ) | (19.4 | ) | (18.0 | ) | |||||||||
| Balance, end of period | $ | 713.4 | $ | 722.3 | $ | 713.4 | $ | 722.3 | |||||||||
See Notes to Consolidated Financial Statements.
18
CONSOLIDATED STATEMENTS OF CASH FLOWS
Periods ended June 30,
(In millions of US dollars)
(Unaudited)
| | | Three months | Six months | |||||||||||||
|---|---|---|---|---|---|---|---|---|---|---|---|---|---|---|---|---|
| | Notes | 2005 | 2004 | 2005 | 2004 | |||||||||||
| Operating activities: | ||||||||||||||||
| Net income | $ | 2.0 | $ | 15.3 | $ | 18.3 | $ | 51.1 | ||||||||
| Non-cash items in net income: | ||||||||||||||||
| Depreciation of property, plant and equipment | 78.2 | 84.8 | 160.6 | 167.7 | ||||||||||||
| Impairment of assets and non-cash portion of restructuring and other charges | 2 | 16.0 | 40.9 | 41.0 | 40.9 | |||||||||||
| Future income taxes | (1.5 | ) | (12.7 | ) | (1.1 | ) | (2.8 | ) | ||||||||
| Amortization of deferred charges | 6.6 | 6.5 | 12.7 | 12.8 | ||||||||||||
| Other | 8.1 | 4.1 | 9.8 | 9.3 | ||||||||||||
Changes in non-cash balances related to operations: | ||||||||||||||||
| Trade receivables | 91.4 | 45.9 | 10.8 | (18.2 | ) | |||||||||||
| Inventories | 15.0 | 2.7 | 12.2 | (2.6 | ) | |||||||||||
| Trade payables and accrued liabilities | 7.8 | (45.1 | ) | (62.5 | ) | (172.6 | ) | |||||||||
| Other current assets and liabilities | (20.2 | ) | 29.5 | (21.0 | ) | 35.2 | ||||||||||
| Other non-current assets and liabilities | (2.2 | ) | (59.6 | ) | 3.9 | (55.3 | ) | |||||||||
| 91.8 | (26.6 | ) | (56.6 | ) | (213.5 | ) | ||||||||||
| Cash provided by operating activities | 201.2 | 112.3 | 184.7 | 65.5 | ||||||||||||
Financing activities: | ||||||||||||||||
| Net change in bank indebtedness | (0.3 | ) | — | 0.2 | (0.3 | ) | ||||||||||
| Net proceeds from issuance of equity shares | 1.8 | 3.2 | 11.8 | 6.7 | ||||||||||||
| Repurchases of shares for cancellation | (44.5 | ) | — | (44.5 | ) | — | ||||||||||
| Repayments of long-term debt | (3.7 | ) | (11.6 | ) | (6.1 | ) | (48.0 | ) | ||||||||
| Net (repayments) borrowings under revolving bank facility and commercial paper | (61.5 | ) | (21.5 | ) | (38.3 | ) | 128.7 | |||||||||
| Dividends on equity shares | (18.5 | ) | (17.2 | ) | (37.1 | ) | (34.4 | ) | ||||||||
| Dividends on preferred shares | (12.2 | ) | (8.5 | ) | (24.6 | ) | (20.2 | ) | ||||||||
| Dividends to minority shareholders | — | (0.7 | ) | — | (0.8 | ) | ||||||||||
| Cash provided by (used in) financing activities | (138.9 | ) | (56.3 | ) | (138.6 | ) | 31.7 | |||||||||
Investing activities: | ||||||||||||||||
| Business acquisitions and disposals, net of cash and cash equivalents | 4,5 | 0.5 | (1.7 | ) | (5.6 | ) | (2.3 | ) | ||||||||
| Additions to property, plant and equipment | (73.7 | ) | (32.9 | ) | (128.4 | ) | (64.9 | ) | ||||||||
| Net proceeds from disposal of assets | 1.5 | 0.4 | 5.2 | 1.4 | ||||||||||||
| Net proceeds from disposal of derivative financial instruments | 7 | — | — | 69.2 | — | |||||||||||
| Cash used in investing activities | (71.7 | ) | (34.2 | ) | (59.6 | ) | (65.8 | ) | ||||||||
| Effect of foreign currency | 18.4 | (14.6 | ) | 25.4 | (0.8 | ) | ||||||||||
| Net increase in cash and cash equivalents | 9.0 | 7.2 | 11.9 | 30.6 | ||||||||||||
| Cash and cash equivalents, beginning of period | 61.7 | 38.5 | 58.8 | 15.1 | ||||||||||||
| Cash and cash equivalents, end of period | $ | 70.7 | $ | 45.7 | $ | 70.7 | $ | 45.7 | ||||||||
| Supplemental cash flow information: | ||||||||||||||||
| Interest paid | $ | 19.3 | $ | 23.4 | $ | 56.8 | $ | 65.5 | ||||||||
| Income taxes paid | 19.7 | 42.5 | 41.9 | 50.3 | ||||||||||||
See Notes to Consolidated Financial Statements.
19
CONSOLIDATED BALANCE SHEETS
(In millions of US dollars)
| | Notes | June 30, 2005 | December 31, 2004 | June 30, 2004 | |||||||||
|---|---|---|---|---|---|---|---|---|---|---|---|---|---|
| | | (Unaudited) | (Audited) | (Unaudited) | |||||||||
| Assets | |||||||||||||
| Current assets: | |||||||||||||
| Cash and cash equivalents | $ | 70.7 | $ | 58.8 | $ | 45.7 | |||||||
| Trade receivables | 375.9 | 400.4 | 360.0 | ||||||||||
| Receivables from related parties | 18.1 | 19.7 | 13.9 | ||||||||||
| Inventories | 398.8 | 419.5 | 398.0 | ||||||||||
| Income taxes receivable | 59.4 | 33.0 | 7.6 | ||||||||||
| Future income taxes | 43.2 | 43.2 | 52.0 | ||||||||||
| Prepaid expenses | 20.8 | 24.5 | 25.1 | ||||||||||
| Total current assets | 986.9 | 999.1 | 902.3 | ||||||||||
Property, plant and equipment, net | 2,241.6 | 2,373.6 | 2,421.5 | ||||||||||
| Goodwill | 6 | 2,597.0 | 2,651.9 | 2,580.8 | |||||||||
| Other assets | 153.1 | 219.8 | 172.1 | ||||||||||
| Total assets | $ | 5,978.6 | $ | 6,244.4 | $ | 6,076.7 | |||||||
Liabilities and Shareholders' Equity | |||||||||||||
| Current liabilities: | |||||||||||||
| Bank indebtedness | $ | 0.2 | $ | — | $ | 0.9 | |||||||
| Trade payables and accrued liabilities | 842.6 | 931.9 | 821.6 | ||||||||||
| Payables to related parties | 0.7 | 2.7 | 0.1 | ||||||||||
| Income and other taxes payable | 83.4 | 83.7 | 51.7 | ||||||||||
| Future income taxes | 5.8 | 4.4 | 6.2 | ||||||||||
| Current portion of long-term debt | 9.3 | 11.7 | 12.8 | ||||||||||
| Total current liabilities | 942.0 | 1,034.4 | 893.3 | ||||||||||
Long-term debt | 1,774.4 | 1,825.8 | 1,953.0 | ||||||||||
| Other liabilities | 253.6 | 248.1 | 243.9 | ||||||||||
| Future income taxes | 394.2 | 402.6 | 355.1 | ||||||||||
| Convertible notes | 113.7 | 112.6 | 111.7 | ||||||||||
| Minority interest | 1.1 | 8.3 | 26.9 | ||||||||||
Shareholders' equity: | |||||||||||||
| Capital stock | 9 | 1,685.5 | 1,705.3 | 1,699.8 | |||||||||
| Additional paid-in capital | 111.5 | 109.7 | 106.7 | ||||||||||
| Retained earnings | 713.4 | 761.0 | 722.3 | ||||||||||
| Translation adjustment | (10.8 | ) | 36.6 | (36.0 | ) | ||||||||
| 2,499.6 | 2,612.6 | 2,492.8 | |||||||||||
| Total liabilities and shareholders' equity | $ | 5,978.6 | $ | 6,244.4 | $ | 6,076.7 | |||||||
See Notes to Consolidated Financial Statements.
20
NOTES TO CONSOLIDATED FINANCIAL STATEMENTS
Periods ended June 30, 2005 and 2004
(Tabular amounts are expressed in millions of US dollars, except for earnings per share amounts and number of shares and options)
(Unaudited)
- BASIS OF PRESENTATION
The consolidated financial statements included in this report are unaudited and reflect normal and recurring adjustments which are, in the opinion of the Company, considered necessary for a fair presentation. These consolidated financial statements have been prepared in conformity with Canadian generally accepted accounting principles ("Canadian GAAP"). The same accounting policies as described in the Company's latest Annual Report have been used, with the exception of the new accounting changes described in note 2. However, these consolidated financial statements do not include all disclosures required under Canadian GAAP and, accordingly, should be read in conjunction with the consolidated financial statements and the notes thereto included in the Company's latest Annual Report.
Seasonality
The operations of the Company's business are seasonal, with approximately 60% of operating income historically recognized in the second half of the fiscal year, primarily due to the higher number of magazine pages, new product launches and back-to-school, retail and holiday catalog promotions.
Reclassification
Certain reclassifications have been made to prior period amounts in order to conform with the basis of presentation adopted in the current period.
During the second quarter of 2005, the Company recorded impairments of assets and restructuring charges of $35.7 million, which were composed of cash items of $19.7 million and non-cash items of $16.0 million. The cash items included $3.9 million which were related to discontinued operations, $3.7 million for the implementation of initiatives from the second quarter of 2005 and $8.5 million for initiatives from the first quarter of 2005. For the six-month period ended June 30, 2005, the Company recorded impairments of assets and restructuring charges of $69.0 million, composed of non-cash items of $41.0 million and cash items of $28.0 million, of which $3.9 million was related to discontinued operations.
The following table sets forth the segmented information and the category of charges.
| 2005 Second Quarter | Workforce reduction costs | Leases, closed facilities carrying costs and other | Total restructuring charges | Impairment of assets and pension curtailment | Total impairment of assets, restructuring and other charges | ||||||||||
|---|---|---|---|---|---|---|---|---|---|---|---|---|---|---|---|
| North America | $ | 7.9 | $ | 1.0 | $ | 8.9 | $ | 3.3 | $ | 12.2 | |||||
| Europe | 6.9 | 3.8 | 10.7 | 12.4 | 23.1 | ||||||||||
| Latin America | 0.1 | — | 0.1 | 0.3 | 0.4 | ||||||||||
| $ | 14.9 | $ | 4.8 | $ | 19.7 | $ | 16.0 | $ | 35.7 | ||||||
| Discontinued Operations | $ | 3.8 | $ | 0.1 | $ | 3.9 | $ | — | $ | 3.9 | |||||
| Continued Operations | 11.1 | 4.7 | 15.8 | 16.0 | 31.8 | ||||||||||
| $ | 14.9 | $ | 4.8 | $ | 19.7 | $ | 16.0 | $ | 35.7 | ||||||
| 2004 Second Quarter | Workforce reduction costs | Leases, closed facilities carrying costs and other | Total restructuring charges | Impairment of assets and pension curtailment | Total impairment of assets, restructuring and other charges | ||||||||||
|---|---|---|---|---|---|---|---|---|---|---|---|---|---|---|---|
| North America | $ | 8.9 | $ | (0.7 | ) | $ | 8.2 | $ | 40.7 | $ | 48.9 | ||||
| Europe | 1.6 | 0.5 | 2.1 | 0.2 | 2.3 | ||||||||||
| Latin America | 0.4 | — | 0.4 | — | 0.4 | ||||||||||
| Other | 0.1 | — | 0.1 | — | 0.1 | ||||||||||
| $ | 11.0 | $ | (0.2 | ) | $ | 10.8 | $ | 40.9 | $ | 51.7 | |||||
| Discontinued Operations | $ | 1.6 | $ | — | $ | 1.6 | $ | — | $ | 1.6 | |||||
| Continued Operations | 9.4 | (0.2 | ) | 9.2 | 40.9 | 50.1 | |||||||||
| $ | 11.0 | $ | (0.2 | ) | $ | 10.8 | $ | 40.9 | $ | 51.7 | |||||
21
| 2005 YTD | Workforce reduction costs | Leases, closed facilities carrying costs and other | Total restructuring charges | Impairment of assets and pension curtailment | Total impairment of assets, restructuring and other charges | ||||||||||
|---|---|---|---|---|---|---|---|---|---|---|---|---|---|---|---|
| North America | $ | 12.1 | $ | 2.7 | $ | 14.8 | $ | 5.5 | $ | 20.3 | |||||
| Europe | 7.3 | 5.7 | 13.0 | 35.2 | 48.2 | ||||||||||
| Latin America | 0.1 | 0.1 | 0.2 | 0.3 | 0.5 | ||||||||||
| $ | 19.5 | $ | 8.5 | $ | 28.0 | $ | 41.0 | $ | 69.0 | ||||||
| Discontinued Operations | $ | 3.8 | $ | 0.1 | $ | 3.9 | $ | — | $ | 3.9 | |||||
| Continued Operations | 15.7 | 8.4 | 24.1 | 41.0 | 65.1 | ||||||||||
| $ | 19.5 | $ | 8.5 | $ | 28.0 | $ | 41.0 | $ | 69.0 | ||||||
| 2004 YTD | Workforce reduction costs | Leases, closed facilities carrying costs and other | Total restructuring charges | Impairment of assets and pension curtailment | Total impairment of assets, restructuring and other charges | ||||||||||
|---|---|---|---|---|---|---|---|---|---|---|---|---|---|---|---|
| North America | $ | 12.2 | $ | (0.7 | ) | $ | 11.5 | $ | 40.7 | $ | 52.2 | ||||
| Europe | 2.2 | 0.5 | 2.7 | 0.2 | 2.9 | ||||||||||
| Latin America | 0.6 | — | 0.6 | — | 0.6 | ||||||||||
| Other | 0.3 | — | 0.3 | — | 0.3 | ||||||||||
| $ | 15.3 | $ | (0.2 | ) | $ | 15.1 | $ | 40.9 | 56.0 | ||||||
| Discontinued Operations | $ | 1.7 | $ | — | $ | 1.7 | $ | — | $ | 1.7 | |||||
| Continued Operations | 13.6 | (0.2 | ) | 13.4 | 40.9 | 54.3 | |||||||||
| $ | 15.3 | $ | (0.2 | ) | $ | 15.1 | $ | 40.9 | $ | 56.0 | |||||
Impairment of assets
During the quarter ended June 30, 2005, the Company performed a review of its assets. Following impairment tests on specific units, the Company had concluded that some assets, mainly in France, were impaired. Accordingly, for the second quarter of 2005, the Company recorded an impairment of long lived assets of $16.0 million. In the first quarter of 2005, the Company recorded impairments of long lived assets, mainly in Europe, totalling $24.6 million.
The impairment of long-lived assets has been calculated as the excess of the carrying amount of an asset over its fair value, based on quoted market prices when available, or on the expected present value of future cash flow approach.
2005 Restructuring charges
During the second quarter of 2005, the Company continued its restructuring initiatives among which the further downsizing of operations in Corby (England), the closure of a Canadian facility and other workforce reductions across the Company. The cash costs of these initiatives were estimated at $18.2 million, of which $12.3 million were recorded during the second quarter. The Company had also recorded cash restructuring charges of $3.9 million mainly for severance in connection with the disposal of a non-core facility.
During the first quarter of 2005, the Company approved the downsizing operations in Corby and other workforce reductions across the Company. The cash costs of these initiatives was estimated and recorded at $3.8 million, while the non-cash cost of these initiatives included $0.4 million for the curtailment of one of the Company's Canadian pension plans.
Prior year restructuring initiatives
During the second quarter of 2005, the Company recorded $3.7 million resulting from the continuation of the 2004 initiatives. The Company also recorded a net reversal of $0.2 million resulting from the execution of the prior year initiatives.
During the first quarter of 2005, the Company recorded $4.7 million resulting from the continuation of the 2004 initiatives and $2.2 million for the pension obligation related to the Effingham multiemployer benefit plan. The Company also recorded a net reversal of $2.4 million resulting from the execution of the prior year initiatives.
Continuity of the reserve for restructuring and other charges
As at January 1, 2005, the balance of the restructuring reserve was $35.2 million. This amount related mostly to the workforce reduction across the platform and lease and facility carrying costs. The Company utilized $30.8 million of the current and prior years' restructuring and other charges reserves during the six-month period ended June 30, 2005.
22
The following table sets forth the Company's 2005 restructuring reserve and activities against the reserves carried forward from 2004:
| | Workforce reduction costs | Leases, closed facilities carrying costs and other | 2005 | 2004 | |||||||||
|---|---|---|---|---|---|---|---|---|---|---|---|---|---|
| Beginning of the year | $ | 21.3 | $ | 13.9 | $ | 35.2 | $ | 45.8 | |||||
| |||||||||||||
| Overspending on prior years' initiatives | 0.5 | 1.3 | 1.8 | 3.9 | |||||||||
| Reversal of previous years' reserves | (3.6 | ) | (0.8 | ) | (4.4 | ) | (5.0 | ) | |||||
| 2004 initiatives | 3.7 | 6.9 | 10.6 | 16.2 | |||||||||
| 2005 initiatives | 18.9 | 1.1 | 20.0 | — | |||||||||
| 19.5 | 8.5 | 28.0 | 15.1 | ||||||||||
| Reserve utilized during the six-month periods ended June 30 | (21.3 | ) | (9.5 | ) | (30.8 | ) | (24.7 | ) | |||||
| Foreign currency changes | (0.7 | ) | (0.5 | ) | (1.2 | ) | (0.4 | ) | |||||
| Balance as at June 30 | $ | 18.8 | $ | 12.4 | $ | 31.2 | $ | 35.8 | |||||
| | Workforce reduction costs | Leases, closed facilities carrying costs and other | Total | ||||||
|---|---|---|---|---|---|---|---|---|---|
| Remainder of 2005 | $ | 18.8 | $ | 3.9 | $ | 22.7 | |||
| 2006 | — | 4.0 | 4.0 | ||||||
| 2007 | — | 2.6 | 2.6 | ||||||
| 2008 | — | 1.2 | 1.2 | ||||||
| 2009 and thereafter | — | 0.7 | 0.7 | ||||||
| $ | 18.8 | $ | 12.4 | $ | 31.2 | ||||
- FINANCIAL EXPENSES
| | Three months | Six months | |||||||||||
|---|---|---|---|---|---|---|---|---|---|---|---|---|---|
| | 2005 | 2004 | 2005 | 2004 | |||||||||
| Interest on long-term debt and convertible notes | $ | 29.2 | $ | 30.5 | $ | 58.0 | $ | 63.6 | |||||
| Interest on short-term debt | 0.5 | 0.8 | 1.5 | 2.7 | |||||||||
| Amortization of deferred financing costs | 0.5 | 1.0 | 1.0 | 1.8 | |||||||||
| Exchange (gain) loss | 0.6 | (0.2 | ) | 2.2 | 0.2 | ||||||||
| Derivative financial instruments | 1.2 | 0.6 | (0.9 | ) | 0.6 | ||||||||
| Loss on extinguishment of long-term debt | — | — | — | 2.0 | |||||||||
| 32.0 | 32.7 | 61.8 | 70.9 | ||||||||||
| Interest capitalized to the cost of equipment | (1.0 | ) | (0.5 | ) | (1.6 | ) | (0.8 | ) | |||||
| $ | 31.0 | $ | 32.2 | $ | 60.2 | $ | 70.1 | ||||||
| Portion included in discontinued operations | — | (0.1 | ) | — | (0.2 | ) | |||||||
| $ | 31.0 | $ | 32.3 | $ | 60.2 | $ | 70.3 | ||||||
- BUSINESS ACQUISITIONS AND DISPOSALS
- DISCONTINUED OPERATIONS
In March 2005, the Company acquired minority interests in its North American operations for a cash consideration of Cdn$7.9 million ($6.4 million).
In March 2005, the Company sold its investment in a facility in Torcy, France for a cash consideration of 1 Euro. The Company also sold the operating assets of a division of a subsidiary in France for a total cash consideration of 0.2 million Euros ($0.3 million). No gain or loss was realized on those transactions.
23
On May 10, 2005, the Company announced its intention to divest its North American non-core Commercial Printing Group, one of the largest providers of general, financial, packaging and commercial specialty printing services throughout the United States, Canada, and Mexico, in order to focus on its core long-run print business. The Company has classified all units of this group as discontinued operations in the consolidated financial statements during the second quarter of 2005.
On June 30, 2005, the Company concluded the sale of certain assets related to its Los Angeles, California facility, one of the business units in the North American non-core Commercial Printing Group, for a cash consideration of $0.5 million resulting in a loss on disposal of $5.9 million ($3.7 million, net of income tax recovery). Under the terms of the agreement, the Company has assumed obligations for termination benefits relating to this business that have been recorded as part of restructuring and other charges, and has retained certain operating leases. A reduction of $0.2 million relating to goodwill of this business was recorded during the second quarter within discontinued operations.
The Company is actively negotiating with potential purchasers for the remaining units and anticipates the disposal to be completed in various transactions by the end of 2005.
Summarized financial information for the discontinued operations is as follows:
Operations summary of discontinued operations
| | | Three months | Six months | ||||||||||||
|---|---|---|---|---|---|---|---|---|---|---|---|---|---|---|---|
| | Note | 2005 | 2004 | 2005 | 2004 | ||||||||||
| Revenues | $ | 59.9 | $ | 67.6 | $ | 128.2 | $ | 143.9 | |||||||
| Cost of sales and selling, general and administrative expenses | 61.5 | 62.2 | 127.8 | 131.1 | |||||||||||
| Depreciation and amortization | 1.7 | 2.5 | 4.1 | 5.0 | |||||||||||
| Restructuring and other charges | 2 | 3.9 | 1.6 | 3.9 | 1.7 | ||||||||||
| Loss on disposal of business units | 5.9 | — | 5.9 | — | |||||||||||
| Operating income (loss) | (13.1 | ) | 1.3 | (13.5 | ) | 6.1 | |||||||||
| Financial expenses (income) | 3 | — | (0.1 | ) | — | (0.2 | ) | ||||||||
| Income (loss) before income taxes | (13.1 | ) | 1.4 | (13.5 | ) | 6.3 | |||||||||
| Income taxes (recovery) | (5.0 | ) | 1.7 | (5.1 | ) | 3.6 | |||||||||
| Net income (loss) from discontinued operations | $ | (8.1 | ) | $ | (0.3 | ) | $ | (8.4 | ) | $ | 2.7 | ||||
Net assets held for sale
| | June 30 2005 | December 31 2004 | June 30 2004 | ||||||
|---|---|---|---|---|---|---|---|---|---|
| Trade receivables(1) | $ | 17.2 | $ | 19.9 | $ | 24.3 | |||
| Inventories | 14.2 | 15.2 | 12.9 | ||||||
| Property, plant and equipment, net | 42.8 | 50.6 | 58.4 | ||||||
| Goodwill | 42.6 | 42.8 | 42.8 | ||||||
| Other assets | 1.1 | 0.9 | 0.9 | ||||||
| Total assets | 117.9 | 129.4 | 139.3 | ||||||
| Trade payables and accrued liabilities | 20.3 | 20.0 | 17.7 | ||||||
| Net assets | $ | 97.6 | $ | 109.4 | $ | 121.6 | |||
- (1)
- Trade receivables are net of securitization of $14.0 million, $18.7 million and $15.9 million as at June 30, 2005, December 31, 2004 and June 30 2004, respectively.
24
- GOODWILL
The changes in the carrying amount of goodwill for the six-month period ended June 30, 2005 are as follows:
| | Note | North America | Europe | Latin America | Total | ||||||||||
|---|---|---|---|---|---|---|---|---|---|---|---|---|---|---|---|
| Balance as at December 31, 2004 | $ | 2,198.3 | $ | 445.4 | $ | 8.2 | $ | 2,651.9 | |||||||
| Business disposal | 5 | (0.2 | ) | — | — | (0.2 | ) | ||||||||
| Foreign currency changes | (0.9 | ) | (54.4 | ) | 0.6 | (54.7 | ) | ||||||||
| Balance as at June 30, 2005 | $ | 2,197.2 | $ | 391.0 | $ | 8.8 | $ | 2,597 | |||||||
- FINANCIAL INSTRUMENTS
- STOCK-BASED COMPENSATION
The Company will complete its annual impairment test of the goodwill in the third quarter.
In February 2005, the Company sold foreign exchange forward contracts that were used to hedge its net investment in a foreign subsidiary for a cash consideration of $69.2 million. These foreign exchange forward contracts were already recorded at the fair market value and all resulting gains were previously recorded in cumulative translation adjustment.
The Company uses the fair value based method of accounting for stock options granted to employees on or after January 1, 2003, and compensation cost is charged against income. However, prior to January 1, 2003, the Company used the settlement based method for its stock-based compensation plans. Had compensation cost been determined using the fair value based method at the date of grant for awards granted in 2002 under all plans, the Company's pro forma net income, earnings per share and diluted earnings per share would not significantly differ from those presented in the consolidated income statement.
The following table summarizes information about stock options:
| | June 30, 2005 | December 31, 2004 | |||
|---|---|---|---|---|---|
| Number of stock options at the end of the period (in thousands): | |||||
| Outstanding | 4,208.5 | 4,542.0 | |||
| Exercisable | 2,642.4 | 2,306.9 | |||
- CAPITAL STOCK
- a)
- Authorized capital stock
- (1)
- Under certain conditions
- b)
- Share repurchase
- EARNINGS PER SHARE
| | June 30, 2005 | December 31, 2004 | | ||||||||||
|---|---|---|---|---|---|---|---|---|---|---|---|---|---|
| | Number | Amount | Number | Amount | Convertible into | ||||||||
| (Thousands of shares) | |||||||||||||
| Multiple voting shares | 46,987 | $ | 93.5 | 46,987 | $ | 93.5 | Subordinate shares | ||||||
| Subordinate voting shares | 83,839 | 1,135.4 | 85,604 | 1,155.2 | n/a | ||||||||
| Redeemable first preferred shares: | |||||||||||||
| Series 3 | 12,000 | 212.5 | 12,000 | 212.5 | Series 2 preferred shares(1) | ||||||||
| Series 4 | 8,000 | 130.2 | 8,000 | 130.2 | Subordinate shares(1) | ||||||||
| Series 5 | 7,000 | 113.9 | 7,000 | 113.9 | Subordinate shares(1) | ||||||||
| 27,000 | 456.6 | 27,000 | 456.6 | ||||||||||
| Total capital stock | $ | 1,685.5 | $ | 1,705.3 | |||||||||
During the first six months of 2005, there were 314,764 Subordinate Voting Shares issued under the Company 's stock option plan (38,231 in the first six months of 2004)and 241,205 Subordinate Voting Shares issued under the Company 's employee stock purchase plans (330,435 in the first six months of 2004)for a total cash consideration of $11.8 million ($6.7 million in the first six months of 2004).
On May 10, 2005 the Company announced a Normal Course Issuer Bid Program (the "Program") under which a maximum of 7,300,000 Subordinate Voting Shares can be repurchased. The purchases will be made during a twelve-month period from May 13, 2005 to May 12, 2006.
During the period ended June 30, 2005, the Company repurchased for cancellation under the Program, a total of 2,332,500 Subordinate Voting Shares for a net cash consideration of Cdn $55.7 million ($44.5 million). The excess of the price paid over the book value of the shares repurchased amounting to $9.4 million was charged to retained earnings.
25
The following table sets forth the computation of basic and diluted earnings per share for continuing operations:
| | Three months | Six months | ||||||||||||
|---|---|---|---|---|---|---|---|---|---|---|---|---|---|---|
| | 2005 | 2004 | 2005 | 2004 | ||||||||||
| Net income from continuing operations | $ | 10.1 | $ | 15.6 | $ | 26.7 | $ | 48.4 | ||||||
| Net income available to holders of preferred shares | (9.8 | ) | (8.7 | ) | (19.7 | ) | (17.8 | ) | ||||||
| $ | 0.3 | $ | 6.9 | $ | 7.0 | $ | 30.6 | |||||||
| (In millions) | ||||||||||||||
| Weighted-average number of equity shares outstanding | 132.5 | 132.3 | 132.7 | 132.2 | ||||||||||
| Effect of dilutive stock options | — | 0.1 | — | 0.1 | ||||||||||
| Weighted-average number of diluted equity shares outstanding | 132.5 | 132.4 | 132.7 | 132.3 | ||||||||||
| Earnings per share: | ||||||||||||||
| Basic and Diluted | $ | — | $ | 0.05 | $ | 0.05 | $ | 0.23 | ||||||
- RELATED PARTY TRANSACTIONS
- PENSION AND OTHER POSTRETIREMENT BENEFITS
For the three months and six months of 2005 and 2004, diluted earnings per share do not include the effects of the convertible notes which were anti-dilutive.
Earnings per share for discontinued operations is calculated by dividing the net income (loss) from discontinued operations (net of tax) by the weighted average number of equity shares outstanding during the period.
The computation of diluted earnings per share excluded the outstanding options to purchase equity shares that have an exercise price greater than the average market price of shares of the same category. During the second quarter of 2005, 3,685,083 such options were outstanding (3,948,875 for the same period in 2004) and 3,544,446 were outstanding during the first six months of 2005 (3,948,875 in 2004). These options will expire between 2006 and 2014.
In March 2005, the Company sold certain operating assets to Quebecor Media Inc., one of the parent company's subsidiaries, for a consideration of Cdn $3.3 million ($2.7 million). The transaction has been realized at the carrying amount and no gain or loss was recorded.
The following table presents the Company's pension and other postretirement benefit costs:
| | Three months | Six months | ||||||||||
|---|---|---|---|---|---|---|---|---|---|---|---|---|
| | 2005 | 2004 | 2005 | 2004 | ||||||||
| Pension benefits | $ | 18.3 | $ | 23.8 | $ | 36.2 | $ | 42.3 | ||||
| Postretirement benefits | 1.0 | 2.2 | 1.8 | 4.5 | ||||||||
| Total periodic benefit cost | $ | 19.3 | $ | 26.0 | $ | 38.0 | $ | 46.8 | ||||
| Portion included in discontinued operations | 0.3 | 0.2 | 0.7 | 0.6 | ||||||||
| Total periodic benefit cost from continuing operations | $ | 19.0 | $ | 25.8 | $ | 37.3 | $ | 46.2 | ||||
- COMMITMENTS
- SEGMENT DISCLOSURE
The 2004 pension benefit costs included an $8 million pension obligation related to a plant restructuring.
During the first six months of 2005, the Company concluded agreements to purchase nine new presses for its North American segment. Future payments related to these commitments will amount to $30.1 million in 2005, $38.0 million in 2006, and $5.5 million in 2007.
26
The Company operates in the printing industry. Its business groups are located in three main segments: North America, Europe and Latin America. These segments are managed separately since they all require specific market strategies. The Company assesses the performance of each segment based on operating income before restructuring and other charges. The following is a summary of the segmented information for the Company's Continuing Operations:
| | North America | Europe | Latin America | Other | Inter-Segment | Total | ||||||||||||
|---|---|---|---|---|---|---|---|---|---|---|---|---|---|---|---|---|---|---|
| Three months ended June 30, | ||||||||||||||||||
| 2005 Revenues | $ | 1,145.6 | $ | 283.9 | $ | 66.2 | $ | — | $ | (1.5 | ) | $ | 1,494.2 | |||||
| Impairment of assets, restructuring and other charges | 8.3 | 23.1 | 0.4 | — | — | 31.8 | ||||||||||||
| Operating income (loss) | 76.6 | (25.4 | ) | 3.1 | (0.9 | ) | — | 53.4 | ||||||||||
2004 Revenues | $ | 1,121.9 | $ | 309.7 | $ | 44.4 | $ | 0.2 | $ | (2.4 | ) | $ | 1,473.8 | |||||
| Impairment of assets, restructuring and other charges | 47.3 | 2.3 | 0.4 | 0.1 | — | 50.1 | ||||||||||||
| Operating income (loss) | 45.4 | 10.1 | 1.4 | (1.8 | ) | — | 55.1 | |||||||||||
Six months ended June 30, | ||||||||||||||||||
| 2005 Revenues | $ | 2,311.3 | $ | 615.5 | $ | 122.8 | $ | 0.2 | $ | (2.7 | ) | $ | 3,047.1 | |||||
| Impairment of assets, restructuring and other charges | 16.4 | 48.2 | 0.5 | — | — | 65.1 | ||||||||||||
| Operating income (loss) | 149.9 | (44.2 | ) | 6.0 | (1.8 | ) | — | 109.9 | ||||||||||
2004 Revenues | $ | 2,238.9 | $ | 625.1 | $ | 91.2 | $ | 0.2 | $ | (4.9 | ) | $ | 2,950.5 | |||||
| Impairment of assets, restructuring and other charges | 50.5 | 2.9 | 0.6 | 0.3 | — | 54.3 | ||||||||||||
| Operating income (loss) | 124.3 | 21.4 | 1.4 | (3.1 | ) | — | 144.0 | |||||||||||
27
FORM 52-109FT2
CERTIFICATION OF INTERIM FILINGS
DURING TRANSITION PERIOD
I, Pierre Karl Péladeau, President and Chief Executive Officer of Quebecor World Inc., certify that:
- I have reviewed the interim filings (as this term is defined in Multilateral Instrument 52-109Certification of Disclosure in Issuers' Annual and Interim Filings) ofQuebecor World Inc., (the issuer) for the interim period ending June 30, 2005;
- Based on my knowledge, the interim filings do not contain any untrue statement of a material fact or omit to state a material fact required to be stated or that is necessary to make a statement not misleading in light of the circumstances under which it was made, with respect to the period covered by the interim filings; and
- Based on my knowledge, the interim financial statements together with the other financial information included in the interim filings fairly present in all material aspects the financial condition, results of operations and cash flows of the issuer, as of the date and for the periods presented in the interim filings.
Date: August 2, 2005
/s/Pierre Karl Péladeau
Pierre Karl Péladeau
President and Chief Executive Officer
FORM 52-109FT2
CERTIFICATION OF INTERIM FILINGS
DURING TRANSITION PERIOD
I, Claude Hélie, Executive Vice President and Chief Financial Officer of Quebecor World Inc., certify that:
- I have reviewed the interim filings (as this term is defined in Multilateral Instrument 52-109Certification of Disclosure in Issuers' Annual and Interim Filings) ofQuebecor World Inc., (the issuer) for the interim period ending June 30, 2005;
- Based on my knowledge, the interim filings do not contain any untrue statement of a material fact or omit to state a material fact required to be stated or that is necessary to make a statement not misleading in light of the circumstances under which it was made, with respect to the period covered by the interim filings; and
- Based on my knowledge, the interim financial statements together with the other financial information included in the interim filings fairly present in all material aspects the financial condition, results of operations and cash flows of the issuer, as of the date and for the periods presented in the interim filings.
Date: August 2, 2005
/s/Claude Hélie
Claude Hélie
Executive Vice President and
Chief Financial Officer

Table of Contents
| 1 | Purpose | |
| 2 | Scope | |
| 3 | Responsibility | |
| 4 | Working Environment | |
| 6 | Customer Relations | |
| 7 | Conflict of Interests | |
| 10 | Company Property | |
| 11 | Company Funds | |
| 12 | Confidential Information | |
| 15 | Insider Trading | |
| 16 | Business Records | |
| 17 | Interactions with the Public | |
| 19 | Fair Dealing and Antitrust Legislation | |
| 20 | Legal Compliance | |
| 21 | Questions and Reporting of Violations | |
| 23 | Violation | |
| 25 | Make the right call | |
| 26 | Questions and Answers | |
| 28 | Employee Declaration |
The Corporation's reputation and the trust and confidence of those with whom we deal, are among our most vital corporate resources. Quebecor World Inc. ("QWI" or the "Corporation") is committed to managing its business in accordance with a set of values that adhere to the highest standards of integrity and excellence.
Now, more than ever, public corporations such as QWI must adopt certain guidelines to ensure that all employees know and understand the expectations of the Corporation with respect to their conduct.
With this purpose in mind, QWI is introducing this revised Code of Business Conduct (the "Code").
1
Scope
This Code applies to all employees, directors and officers of QWI, including the Corporation's principal executive officer, its principal financial officer, its principal accounting officer or controller, as well as persons performing similar functions. The term "employee" used throughout this Code includes all of these persons.
2
Each and every employee is responsible for becoming generally familiar with and following this Code, other company policies, as well as all laws, rules and regulations that apply to their position with the Corporation and their level of responsibility.
This Code does not describe all of the Corporation's policies. Every employee must also fully comply with other policies applicable to them that are set forth elsewhere.
The Vice President, Human Resources of QWI is responsible for ensuring that every employee of QWI receives a copy of the Code and that each new employee of QWI, when receiving a copy of the Code, execute the declaration form at the commencement of his or her employment.
3
Working Environment
QWI respects and welcomes diversity in its employees, customers, suppliers, and others in the global marketplace. QWI is committed to equal employment opportunity without regard to race, color, religion, gender, national or ethnic origin, age, disability, sexual orientation, veteran status, or other legally protected status. It is QWI's policy to make decisions on hiring, job assignment, training as well as other human resources management functions, on the basis of qualifications, ability and performance.
It is a principle of QWI that all its employees are equal and, as such, they must treat each other with mutual respect. QWI is committed and will strive to eliminate bias, prejudice, discrimination and harassment in all forms. Discriminating against any employee or person with whom we do business on the basis of race, color, religion, gender, national or ethnic origin, disability, age, sexual orientation, veteran status or other legally protected status is strictly prohibited and will not be tolerated.
Conduct that creates an unwelcome or uncomfortable situation or hostile work environment, such as unwelcome advances or requests for sexual favors, inappropriate comments, jokes, intimidation, bullying or physical contact, may be forms of workplace harassment. QWI will not tolerate harassment or violence in the workplace.
4
Working Environment (Cont'd)
QWI seeks to provide each employee with a clean, safe, and healthy place to work. To achieve that goal, all employees must understand the shared responsibilities of abiding by all safety rules and practices, taking the necessary precautions to protect oneself and one's co-workers, and immediately reporting any unsafe conditions, practices or accidents.
A drug and alcohol-free workplace is important to maintaining the trust and confidence of our customers, as well as the health and safety of our employees. The use, possession or distribution of unauthorized drugs or alcohol on company time or on the Corporation's premises is strictly prohibited and will be dealt with appropriately.
5
Customer Relations
QWI is a customer-driven company committed to optimizing the contribution of its people, technology and other resources to meet or exceed customer expectations.
Employees who have direct contact with customers should always conduct themselves in a professional and courteous manner, recognizing that each customer's contribution to revenues, however small, also contributes to the success of the Corporation. No employee must ever make false representations, and any misunderstanding should be corrected as soon as possible.
Employees who are indirectly involved with customers and customer accounts also share the responsibility of satisfying customer needs by maintaining a high degree of accuracy, understanding and conscientious effort.
It is the responsibility of each employee to treat with the utmost care any personal or business information about customers that may come to his or her attention through the performance of his or her job or otherwise within QWI. This applies to both oral and written information belonging to the customer. Examples are customer documentation, specifications, the content of their publications or information on the customer's company obtained in the course of doing business. In all cases, this information is strictly confidential and is of a proprietary nature belonging to the customer.
6
QWI expects and requires its employees to advance the Corporation's legitimate business interests when the opportunity to do so arises. It also expects and requires its employees to be and to remain free of any conflicting interests or relationships and to refrain from acting in any way that appears to be or is in conflict with the Corporation's best interests.
A conflict of interests arises whenever the private interests of an employee interfere or conflict in any way (or appear to interfere or conflict) with the Corporation's interests.
For instance, a conflict of interest would exist when an employee:
- 1.
- Has an outside interest that materially intrude on time and attention that should be devoted to the Corporation's affairs, or affects his or her energies in such a way as to prevent him or her from devoting his or her full attention to the performance of his or her duties.
- 2.
- Holds a position within the Corporation whereby the employee is in a position of authority towards his or her relatives that could be implied or construed to render the employee partial towards that person or otherwise inhibit the impartiality of the employee's decision-making.
- 3.
- Has a direct or indirect interest in or a relationship with an outsider or with a person in a position to influence the actions of such outsiders that could be implied or construed to:
7
Conflict of Interests (Cont'd)
- a)
- make possible personal gain or favor to the employee involved or to any of his or her relatives or friends due to the employee's actual or potential power to influence dealings between the Corporation and an outsider;
- b)
- render the employee partial toward the outsider for personal reasons, or otherwise inhibit the impartiality of the employee's business judgement or desire to serve only the Corporation's best interests;
- c)
- place the employee or the Corporation in an equivocal, embarrassing or ethically questionable position in the eyes of the public or any external monitoring body;
- d)
- reflect unfavorably on the integrity of the employee of the Corporation.
- 4.
- Takes for himself or herself opportunities that belong to the Corporation or are discovered through the use of the Corporation's resources, property, information or the employee's position with the Corporation.
- 5.
- Makes use of the Corporation's property, information or position for personal gain, including to further his or her interests or the interests of his or her relatives or friends.
8
Conflict of Interests (Cont'd)
- 6.
- Accepts gifts other than of a nominal or promotional nature from a supplier or any other person which has or may have dealings with the Corporation.
- 7.
- Directly or indirectly competes with the Corporation or has a direct or indirect interest or relationship that is actually harmful or detrimental to the Corporation's best interests.
- 8.
- Holds other gainful employment that might be detrimental to the best interests of the Corporation. The term "gainful employment" includes personal work effort, supervision or training of other persons, or consultation or advice, for any form of remuneration.
It is impossible to provide an exhaustive list of all conceivable situations that could give rise to potential conflicts of interests, or the appearance of such conflicts. Since our objective is not only to help prevent any wrongdoing, but also to preclude the possibility of any transgression, every employee who may be or may become involved in any possible conflict of interests or the appearance of such conflict, should make full disclosure of these circumstances to his or her manager or the Human Resources Representative or the Corporate General Counsel of QWI in writing. The manager or the Human Resource Representative or the Corporate General Counsel of QWI will then advise the employee of the Corporation's position.
9
Company Property
Employees have a responsibility to help protect the Corporation's property and assets and to ensure their efficient use.
Such property includes tangible assets such as buildings, equipment, cash, inventories, documents, computers, etc. Intangible assets such as inventions, ideas, patents and other forms of intellectual property, as they relate to the Corporation's actual or anticipated business which are made or conceived during or after working hours, are also the property of QWI.
All possible safeguards must be taken to prevent theft, misuse, damage, loss or sabotage, carelessness and waste of the Corporation's property.
Company property is for use by employees on the job, for legitimate business purposes and not for personal purposes. Employees should be aware that the Corporation may monitor the use of its property at all times.
10
Employees who have access to company funds in any form are expected to be familiar with and follow the Corporation's prescribed practices and procedures. Company funds are any monies, documents or records that have or represent financial value. Company funds include, but are not limited to, currency, checks, vouchers, credit, receivables, payables, money orders, expenses, reimbursements and paychecks.
When an employee's job involves the use of company funds, it is the responsibility of the employee to exercise his or her good judgement on the Corporation's behalf to ensure that the Corporation gets good value for every dollar spent.
It is clearly understood that company funds are not for personal use or for corporate business that is not approved.
Employees who incur expenses while on company business can only seek reimbursement for expenses that are reasonable, actual and authorized and, in doing so, they are required to provide a full and true accounting of such expenditures, supported by appropriate receipts.
No expenditure of company money will be approved unless the manager responsible for approving the expenditure is satisfied that the expenditure and the amount are correct; such approval will be granted in accordance with the Corporation's authorization policy.
11
Confidential Information
In the course of their employment, employees may have access to confidential information concerning the Corporation, its affiliates, customers, suppliers and other employees. Confidential information is information, both oral and written, which is not generally known to the public and this includes, but is not limited to, information concerning the Corporation's technologies, business or financial data pertaining to sales, earnings, balance sheet items, market forecasts, business plans, acquisition strategies and intellectual property.
Efforts must be made to limit access to such confidential information to only those persons who need to know the information and such persons must be advised that the information is to be kept confidential.
Outside parties privy to undisclosed material information concerning the Corporation should be told that they must not divulge such information to anyone else without the Corporation's consent, and that they may not trade in the Corporation's securities until the information is publicly disclosed. Such outside parties may be asked to confirm their commitment to nondisclosure in the form of a written confidentiality and non-disclosure agreement.<
It is the responsibility of each employee to exercise a high degree of trustworthiness and to treat with the utmost care any confidential information. In order to prevent the misuse or inadvertent disclosure of material information, the procedures set forth below should generally be observed at all times:
12
Confidential Information (Cont'd)
- •
- documents and files containing confidential information should be kept in a safe place to which access is restricted to individuals who "need to know" that information in the necessary course of business;
- •
- confidential matters should not be discussed in places where the discussion may be overheard, such as elevators, hallways, restaurants, airplanes or taxis;
- •
- confidential documents should not be read or displayed in public places and should not be discarded where others can retrieve them;
- •
- employees must ensure that they maintain the confidentiality of information in their possession outside of the office as well as inside the office;
- •
- transmission of documents by electronic means, such as by fax or directly from one computer to another, should be made only where it is reasonable to believe that the transmission can be made and received under secure and confidential conditions; and
- •
- unnecessary copying of confidential documents should be avoided and documents containing confidential information should be promptly removed from conference rooms and work areas after meetings have concluded; extra copies of confidential documents should be shredded or otherwise destroyed.
13
Confidential Information (Cont'd)
The rules set out above apply not only to QWI's information, but also to information that belongs to a third party such as a supplier, customer or competitor that has a relationship with QWI. Moreover, a new employee may not disclose the confidential information of his or her previous employer. Likewise, an employee leaving QWI still remains bound by the obligation to safeguard QWI's confidential information.
If there is any uncertainty as to what information may be released and to who it may be directed, employees are expected to ask their manager or the Human Resources Representative or the Corporate General Counsel for clarification.
14
Insider Trading
It is illegal for anyone to purchase or sell securities of any public company with knowledge of material information affecting that company that has not been publicly disclosed. Except in the necessary course of business, it is also illegal for anyone to inform or "tip" any other person of material non-public information. Therefore, insiders and employees having knowledge of confidential or material information about the Corporation or counterparties in negotiations of potential material transactions are prohibited from trading in shares or other securities of the Corporation or any counterparty until the information has been fully disclosed and a reasonable period of time has passed for the information to be widely disseminated.
In addition, directors and officers of the Corporation are prohibited from trading in its equity securities during certain periods pursuant to the Corporation's Blackout Policy.
15
Accurate, reliable records of many types are required in order to meet QWI's legal and financial obligations and to manage its business affairs.
Employees should maintain the Corporation's business records, including its books, accounts and financial statements in reasonable detail and in compliance with legal and regulatory requirements, including generally accepted accounting principles, and in accordance with the Corporation's internal controls and other policies.
Work reports, vouchers, bills, payroll records and other similar data must be factual, complete and maintained according to company practice. Employees should not remove or destroy any integral record without the authorization of their manager. Such authorization will only be granted in accordance with government legislation and company policy.
Deliberate entering of wrong data on any report, record or memorandum, performance measurement or quality control plans constitutes an act of dishonesty which may have a serious effect on company operations and is therefore unacceptable.
16
Interactions with the Public
It is QWI's policy to provide open, accurate and consistent communication with the public. To be sure that the Corporation complies with the law while still protecting its confidentiality and interests, only those who are designated by QWI as authorized spokespersons are authorized to represent and speak on behalf of QWI to the public or the media.
Employees who are not authorized spokespersons must not respond, under any circumstances, to inquiries from the investment community, the media or others unless specifically asked to do so by an authorized spokesperson.
If an employee receives such an inquiry, whether verbal or written, from an outside person, the employee should direct the inquiry to his or her Manager. The Manager is responsible to refer the inquiry to either the Vice President, Corporate Finance and Treasury or the Director, Communications of QWI.
An employee may not claim to represent, or imply representation of the Corporation to the public or in any public process or forum, unless specifically requested to do so by management. When an employee expresses a personal view in a public forum, he or she may not use QWI's letterhead or its e-mail or any reference to his or her business address or title. In order to ensure that no material undisclosed information is inadvertently disclosed, employees are prohibited from participating in Internet chat rooms or newsgroup discussions on matters pertaining to the Corporation's activities or its securities.
17
Interactions with the Public (Cont'd)
When an employee is asked to make a presentation that involves his or her work at QWI, he or she must have management approval and appropriate review and approval of the content of the presentation. In situations like this, one must be sensitive to issues related to security, the protection of confidential information and other potentially sensitive issues.
QWI's employees must pursue community activities or political activities on their own time, with their own resources and as individual private citizens and not as representatives of QWI.
18
Fair Dealing and Antitrust Legislation
QWI seeks to outperform its competitors fairly and honestly and to achieve competitive advantages through superior performance. Employees should always endeavor to deal fairly with the Corporation's customers, suppliers, competitors and other employees. No employee should take unfair advantage of anyone through manipulation, concealment, abuse of privileged information, misrepresentation of material acts, or any other unfair dealing practice.
All employees must also respect the antitrust legislation of the countries in which the Corporation operates. The subject of agreements and discussions with competitors is particularly sensitive. For example, no employee may participate in discussions, agreements, projects, arrangements, whether formal or informal, with competitors or eventual competitors, dealing with prices, pricing levels, territories or customers to be served. The criminal courts impose prohibitive fines or severe prison terms in cases of violation of antitrust legislation, penalties which at the same time can apply to both employee and employer.
19
As a general rule of conduct, all employees of QWI should, at all times, comply fully with all laws, rules and regulations applicable to the Corporation.
In order to become familiar with and comply with the laws, rules and regulations that affect or govern their area of responsibility, employees are expected to consult with and be guided by their manager and the Corporation's Legal Department. Decisions regarding the application of various laws should not be made without the advice of the Legal Department, nor may an employee take any action that the Legal Department has advised would constitute a violation of the law.
20
Questions and
Reporting of Violations
If, at any time, you are unsure about whether some action would be inconsistent with this Code or if you have any questions about this Code, you should ask your manager or the Human Resources Representative or the Corporate General Counsel of QWI. Similarly, if there is any doubt as to how a specific ethical situation ought to be handled, the matter should be brought to the attention of your manager or the Human Resources Representative or the Corporate General Counsel of QWI for clarification.
Employees who become aware of any behaviour in violation of this Code, other company policies or any law, rule or regulation applicable to the Corporation, must promptly report such violation to their manager. If you do not believe that reporting to your manager is appropriate or if it does not result in a response with which you are comfortable, then you should contact the Human Resources Representative or the Corporate General Counsel or the Vice President, Internal Audit of QWI.
Employees should not accept any direction by their manager that contradicts this Code, other company policies or any applicable law, rule or regulation and should immediately report any such direction to the Human Resources Representative or the Corporate General Counsel or the Vice President, Internal Audit for QWI.
21
Questions and Reporting of Violations (Cont'd)
Any reporting will be dealt with confidentially, except as required by applicable law and the Corporation will not tolerate any kind of retaliation against any person who in good faith reports to the Corporation potential issues relating to violations of this Code other company policies or any applicable law, rule or regulation.
Because QWI recognizes that employees may be uncomfortable in reporting certain kinds of violations, it has set up a confidential toll-free theft and fraud hotline operated by an independent third party. This will allow employees to report anonymously all complaints or all forms of suspicious acts pertaining to accounting, internal controls, auditing matters, fraud, theft and illegal use of company property.
22
Violation of this Code, other company policies or applicable rules or regulations may result in disciplinary measures, ranging from a simple warning or reprimand to the termination of employment.
Disciplinary measures may be taken against any employee for directly violating or directing others to violate this Code, other company policies or applicable law, rule or regulation. An employee will also be the subject of disciplinary actions if he or she fails to cooperate with an investigation of such violation, knowingly falsely accuses another employee of a violation or retaliates against a person who reports a violation or suspected or potential violation.
Disciplinary action will also apply to managers who, with respect to those employees reporting to them, know that prohibited conduct is contemplated by such employees and do nothing to prevent such conduct, or who know that prohibited conduct has been engaged in by such employees and fail to take appropriate corrective action. Managers may also be subject to disciplinary action for their failure to effectively monitor the actions of their subordinates.
In addition, violations of legal and regulatory requirements may carry their own civil and criminal penalties, including fines and imprisonment.
23
Violation (Cont'd)
Any waivers of this Code for the benefit of employees must be authorized in writing by QWI's Corporate General Counsel. Any waivers of this Code for the benefit of a director or officer of the Corporation, including the principal executive officer, the principal financial officer, the principal accounting officer or controller, or other persons performing similar functions for the Corporation, may be authorized only by the Board of Directors of the Corporation and must be publicly disclosed in accordance with applicable Canadian and US securities legislation and applicable stock exchange rules.
Being honest and respecting high standards of integrity and fairness are obligations that are no different than those of individual citizens in their dealings with their governments, their families, their friends and their neighbours.
The guidelines included in this Code serve only as a supplement to good judgement and common sense.
It is the Corporation's firm conviction that compliance with this Code is so important that all new employees are required to sign the following declaration. In the event that QWI modifies the Code, you may be required to execute a new declaration.
24
Make the
Right Call.
Quebecor World Inc. is one of the largest print media services Company in the world and one of the top performers in its industry. QWI currently employs approximately 37,000 people and recognizes that it's employees are the key to ensuring that the Company maintains its solid credibility and trust with its customers and its shareholders in order to remain the industry leader.
As a result QWI attaches a great deal of importance to the values of honesty and integrity. For this reason, the Company is proud to offer a confidential toll-free theft and fraud hotline operated by an independent third party ("The Network"). All employees are encouraged to report all complaints or all forms of suspicious acts pertaining to accounting, internal controls, auditing matters, fraud, theft, illegal use of Company property and insider trading. If you are uncomfortable reporting this type of information to your management, then you are able to report it anonymously, without fear of retribution.
The toll-free telephone lines are available to all employees World Wide, in all languages spoken in the Company and the service operates 24 hours a day, 7 days a week. You can Make the Right Call by dialling 1-877-703-5281 from the United States and Canada. If you are calling from outside these areas, you can call collect at 770-582-5238. This telephone line is a confidential reporting service in full compliance with the requirements of the Sarbanes-Oxley Act. The Sarbanes-Oxley Act is recently adopted U.S. legislation designed to protect investors by improving the accuracy and reliability of corporate disclosures.
Make the Right Call.
Working together we can make our company even stronger.
Pierre Karl Péladeau
President and Chief Executive Officer
Quebecor World Inc.
25
Who operates the line?
The telephone line is operated by an independent third party called "The Network". This company pioneered this type of third party service more than 20 years ago, and it is still its core business.
Why should I Make the Right Call?
It is in the best interest of the Company and all employees to report acts of fraud, theft, financial information manipulation, etc. If the employee is uncomfortable with reporting their allegation through the normal chain of command, then they have the opportunity to report it anonymously to the toll-free telephone line.
Who can call the line?
Any and all employees including executives, contractual employees, part-time and full-time employees.
When should I contact the line?
You should call when you first notice a suspicious behaviour. For example:
- •
- Accounting/Audit Irregularities;
- •
- Falsification of Company Records
- •
- Fraud
- •
- Misuse of Confidential Information (Insider Trading);
- •
- Irregularity in the Handling or Reporting of Financial Transactions;
- •
- Significant Breach of Internal Controls;
- •
- Theft
Keep in mind the more time that elapses from the incident to when it is reported, the more difficult it becomes to investigate.
How are callers protected?
You will never be asked to provide your name when you call. If you identify yourself, there can be no retaliation or retribution. The main goal of the service is to resolve situations of wrongdoing, not to identify the employee who reported it.
When is the service available?
It is available 24 hours a day, 7 days a week.
26
What happens when I Make the Right Call?
When you call, an Interview Specialist with the necessary skills to take the call, such as language, is automatically assigned. Once all information is reported, the Interview Specialist will assign a report number to the caller. After the initial call, you will be instructed to call back in two weeks or whenever you feel the need to add additional details about the reported issue. You should have the following information available when you call: circumstances of the incident, the subjects involved, any evidence available including, dates, times, names, places, credible witnesses if possible.
Who can investigate cases?
As the Corporate policy on "Fraud and Other Similar Irregularities" dictates, the Internal Audit Department, or another person named by the Board, has the exclusive authority to perform an investigation, to the exclusion of any employee, supervisor, manager or department of the Corporation. The Internal Audit Department is governed by the Board of Directors of the Company thus the service is independent from any employee involved in operations.
How to Make the Right Call?
The telephone line can be accessed directly by dialling 1-877-703-5281 when you are located in United States and Canada. If you are calling from outside these areas, you can call collect at 770-582-5238.
English and Spanish speaking Interview Specialists are always available at "The Network". Interview Specialists have access to translation services in more than 150 languages 24 hours a day which includes Finnish, French, German, Hindi, Portuguese and Swedish.
Will callers be informed of what action, if any, results from their call?
No, not directly. It will be up to the Board to decide what actions to take and to decide upon the appropriate form of communication of those actions.
27
Employee Declaration
I, the undersigned, hereby acknowledge that I have read and understood the Code of Business Conduct of Quebecor World Inc. and that I agree to comply with its provisions.
Name (please print)
Department / Location
Signature
Date
28
SIGNATURES
Pursuant to the requirements of the Securities Exchange Act of 1934, the registrant has duly caused this report to be signed on its behalf by the undersigned, thereunto duly authorized.
QUEBECOR WORLD INC.
By:/s/ Marie-É. Chlumecky
Name: Marie-É. Chlumecky
Title: Assistant Secretary
Date: August 3, 2005
Financial Highlights
MANAGEMENT'S DISCUSSION AND ANALYSIS
Consolidated Statements of Income and Retained Earnings
Consolidated Statements of Cash Flows
Consolidated Balance Sheets
Notes to Consolidated Financial Statements
Code of Business Conduct